Fulton County, IL Map & Demographics
Fulton County Map
Fulton County Overview
$32,378
PER CAPITA INCOME
$73,125
AVG FAMILY INCOME
$57,223
AVG HOUSEHOLD INCOME
24.7%
WAGE / INCOME GAP [ % ]
75.3¢/ $1
WAGE / INCOME GAP [ $ ]
$11,267
FAMILY INCOME DEFICIT
0.44
INEQUALITY / GINI INDEX
33,691
TOTAL POPULATION
17,528
MALE POPULATION
16,163
FEMALE POPULATION
108.45
MALES / 100 FEMALES
92.21
FEMALES / 100 MALES
43.6
MEDIAN AGE
2.8
AVG FAMILY SIZE
2.3
AVG HOUSEHOLD SIZE
15,576
LABOR FORCE [ PEOPLE ]
56.0%
PERCENT IN LABOR FORCE
6.8%
UNEMPLOYMENT RATE
Fulton County Area Codes
Income in Fulton County
Income Overview in Fulton County
Per Capita Income in Fulton County is $32,378, while median incomes of families and households are $73,125 and $57,223 respectively.
| Characteristic | Number | Measure |
| Per Capita Income | 33,691 | $32,378 |
| Median Family Income | 8,653 | $73,125 |
| Mean Family Income | 8,653 | $93,475 |
| Median Household Income | 13,955 | $57,223 |
| Mean Household Income | 13,955 | $76,880 |
| Income Deficit | 8,653 | $11,267 |
| Wage / Income Gap (%) | 33,691 | 24.66% |
| Wage / Income Gap ($) | 33,691 | 75.34¢ per $1 |
| Gini / Inequality Index | 33,691 | 0.44 |
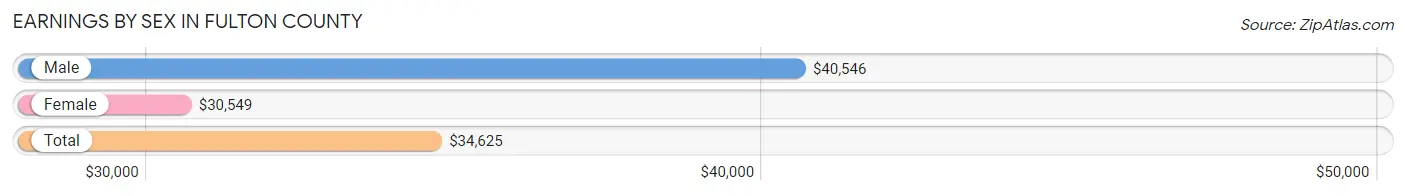
Earnings by Sex in Fulton County
Average Earnings in Fulton County are $34,625, $40,546 for men and $30,549 for women, a difference of 24.7%.
| Sex | Number | Average Earnings |
| Male | 8,776 (53.4%) | $40,546 |
| Female | 7,659 (46.6%) | $30,549 |
| Total | 16,435 (100.0%) | $34,625 |
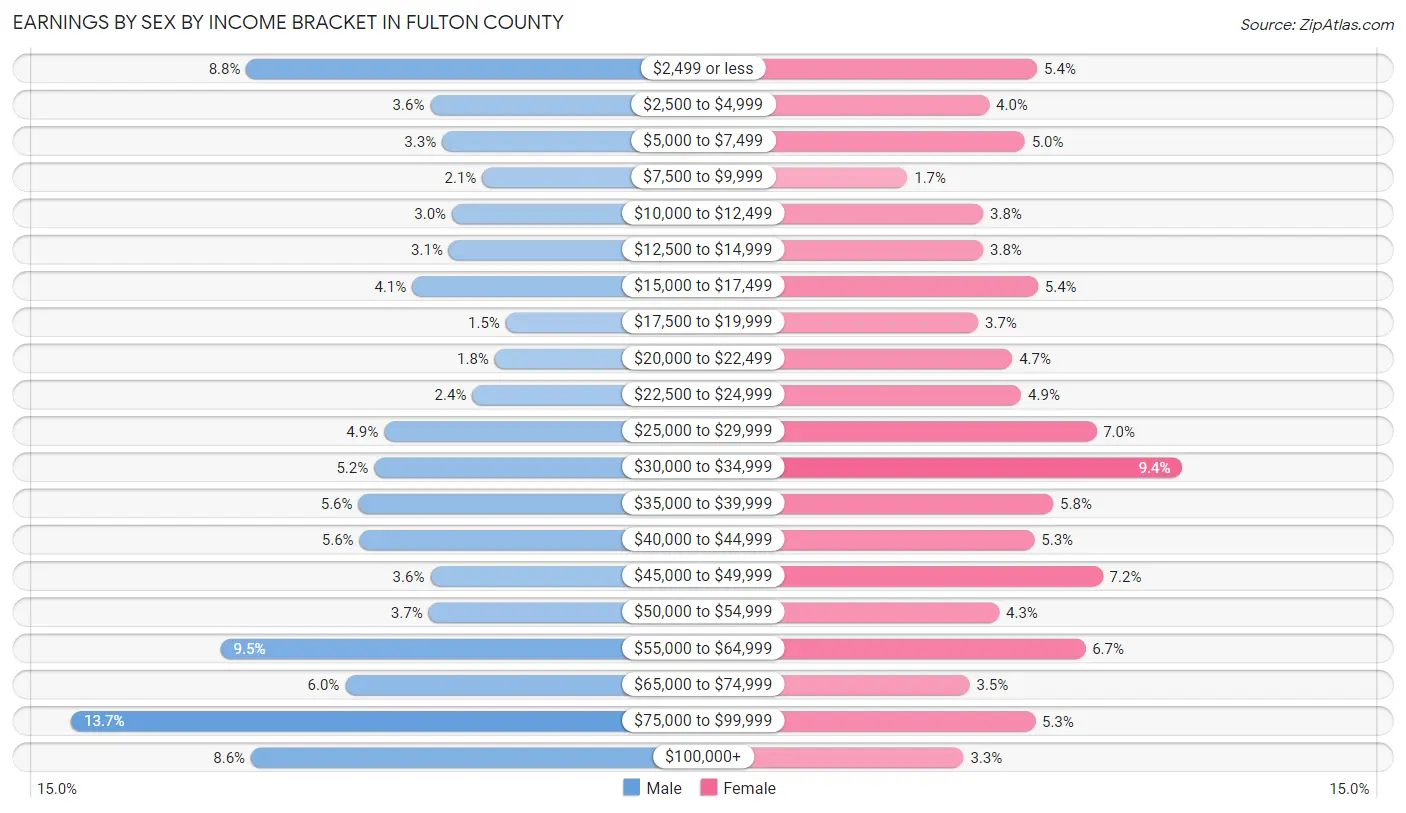
Earnings by Sex by Income Bracket in Fulton County
The most common earnings brackets in Fulton County are $75,000 to $99,999 for men (1,201 | 13.7%) and $30,000 to $34,999 for women (722 | 9.4%).
| Income | Male | Female |
| $2,499 or less | 770 (8.8%) | 410 (5.3%) |
| $2,500 to $4,999 | 316 (3.6%) | 306 (4.0%) |
| $5,000 to $7,499 | 287 (3.3%) | 383 (5.0%) |
| $7,500 to $9,999 | 188 (2.1%) | 130 (1.7%) |
| $10,000 to $12,499 | 262 (3.0%) | 293 (3.8%) |
| $12,500 to $14,999 | 270 (3.1%) | 293 (3.8%) |
| $15,000 to $17,499 | 361 (4.1%) | 411 (5.4%) |
| $17,500 to $19,999 | 130 (1.5%) | 283 (3.7%) |
| $20,000 to $22,499 | 157 (1.8%) | 356 (4.6%) |
| $22,500 to $24,999 | 212 (2.4%) | 375 (4.9%) |
| $25,000 to $29,999 | 430 (4.9%) | 537 (7.0%) |
| $30,000 to $34,999 | 455 (5.2%) | 722 (9.4%) |
| $35,000 to $39,999 | 493 (5.6%) | 444 (5.8%) |
| $40,000 to $44,999 | 491 (5.6%) | 404 (5.3%) |
| $45,000 to $49,999 | 316 (3.6%) | 551 (7.2%) |
| $50,000 to $54,999 | 320 (3.6%) | 328 (4.3%) |
| $55,000 to $64,999 | 833 (9.5%) | 513 (6.7%) |
| $65,000 to $74,999 | 526 (6.0%) | 264 (3.5%) |
| $75,000 to $99,999 | 1,201 (13.7%) | 405 (5.3%) |
| $100,000+ | 758 (8.6%) | 251 (3.3%) |
| Total | 8,776 (100.0%) | 7,659 (100.0%) |
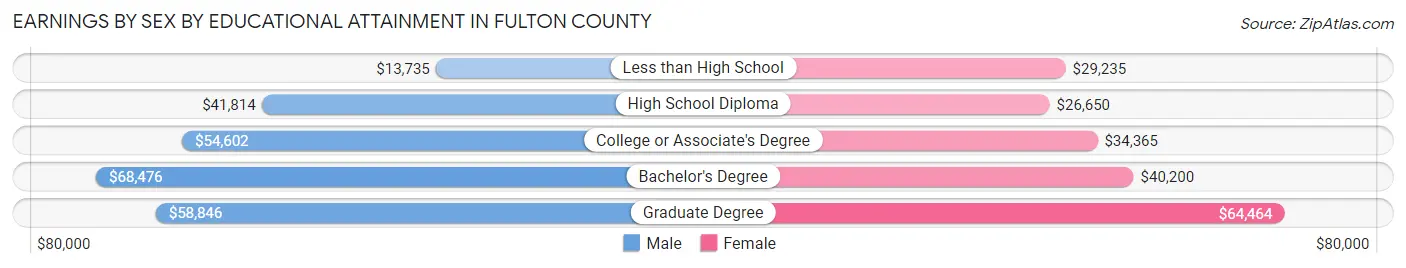
Earnings by Sex by Educational Attainment in Fulton County
Average earnings in Fulton County are $45,261 for men and $33,947 for women, a difference of 25.0%. Men with an educational attainment of bachelor's degree enjoy the highest average annual earnings of $68,476, while those with less than high school education earn the least with $13,735. Women with an educational attainment of graduate degree earn the most with the average annual earnings of $64,464, while those with high school diploma education have the smallest earnings of $26,650.
| Educational Attainment | Male Income | Female Income |
| Less than High School | $13,735 | $29,235 |
| High School Diploma | $41,814 | $26,650 |
| College or Associate's Degree | $54,602 | $34,365 |
| Bachelor's Degree | $68,476 | $40,200 |
| Graduate Degree | $58,846 | $64,464 |
| Total | $45,261 | $33,947 |
Family Income in Fulton County
Family Income Brackets in Fulton County
According to the Fulton County family income data, there are 1,843 families falling into the $50,000 to $74,999 income range, which is the most common income bracket and makes up 21.3% of all families. Conversely, the $10,000 to $14,999 income bracket is the least frequent group with only 156 families (1.8%) belonging to this category.
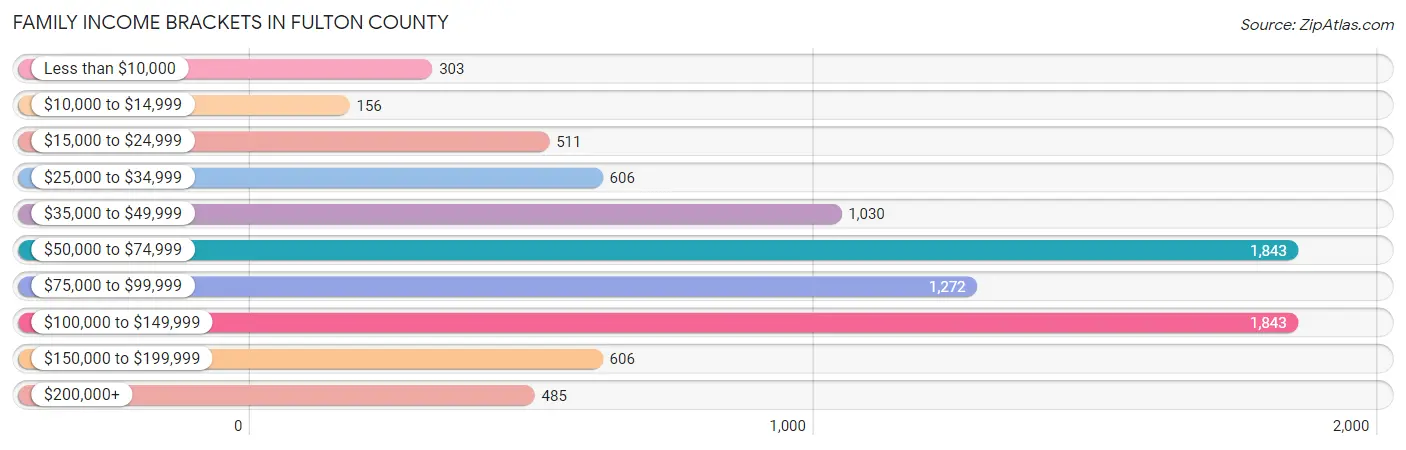
| Income Bracket | # Families | % Families |
| Less than $10,000 | 303 | 3.5% |
| $10,000 to $14,999 | 156 | 1.8% |
| $15,000 to $24,999 | 511 | 5.9% |
| $25,000 to $34,999 | 606 | 7.0% |
| $35,000 to $49,999 | 1,030 | 11.9% |
| $50,000 to $74,999 | 1,843 | 21.3% |
| $75,000 to $99,999 | 1,272 | 14.7% |
| $100,000 to $149,999 | 1,843 | 21.3% |
| $150,000 to $199,999 | 606 | 7.0% |
| $200,000+ | 485 | 5.6% |
Family Income by Famaliy Size in Fulton County
5-person families (721 | 8.3%) account for the highest median family income in Fulton County with $117,917 per family, while 2-person families (4,962 | 57.3%) have the highest median income of $32,500 per family member.
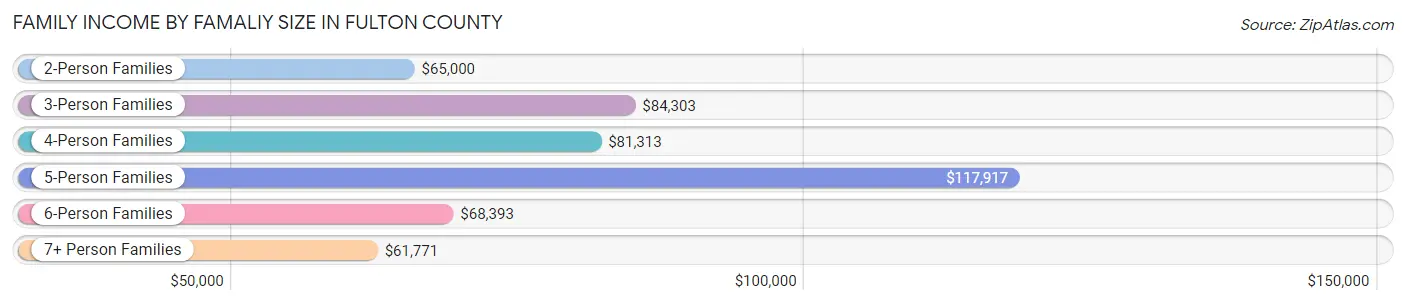
| Income Bracket | # Families | Median Income |
| 2-Person Families | 4,962 (57.3%) | $65,000 |
| 3-Person Families | 1,607 (18.6%) | $84,303 |
| 4-Person Families | 1,178 (13.6%) | $81,313 |
| 5-Person Families | 721 (8.3%) | $117,917 |
| 6-Person Families | 140 (1.6%) | $68,393 |
| 7+ Person Families | 45 (0.5%) | $61,771 |
| Total | 8,653 (100.0%) | $73,125 |
Family Income by Number of Earners in Fulton County
The median family income in Fulton County is $73,125, with families comprising 3+ earners (698) having the highest median family income of $118,821, while families with no earners (1,830) have the lowest median family income of $53,636, accounting for 8.1% and 21.1% of families, respectively.
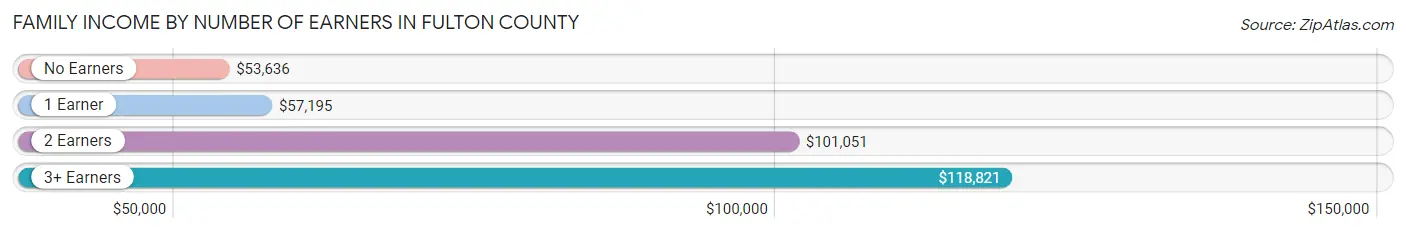
| Number of Earners | # Families | Median Income |
| No Earners | 1,830 (21.1%) | $53,636 |
| 1 Earner | 3,092 (35.7%) | $57,195 |
| 2 Earners | 3,033 (35.0%) | $101,051 |
| 3+ Earners | 698 (8.1%) | $118,821 |
| Total | 8,653 (100.0%) | $73,125 |
Household Income in Fulton County
Household Income Brackets in Fulton County
With 2,679 households falling in the category, the $50,000 to $74,999 income range is the most frequent in Fulton County, accounting for 19.2% of all households. In contrast, only 474 households (3.4%) fall into the $10,000 to $14,999 income bracket, making it the least populous group.
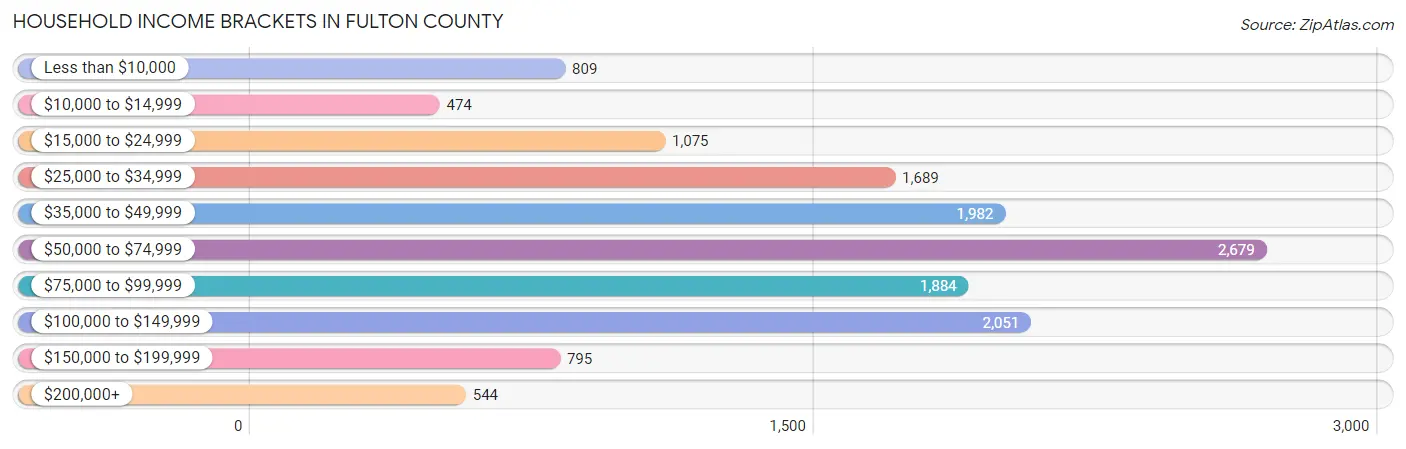
| Income Bracket | # Households | % Households |
| Less than $10,000 | 809 | 5.8% |
| $10,000 to $14,999 | 474 | 3.4% |
| $15,000 to $24,999 | 1,075 | 7.7% |
| $25,000 to $34,999 | 1,689 | 12.1% |
| $35,000 to $49,999 | 1,982 | 14.2% |
| $50,000 to $74,999 | 2,679 | 19.2% |
| $75,000 to $99,999 | 1,884 | 13.5% |
| $100,000 to $149,999 | 2,051 | 14.7% |
| $150,000 to $199,999 | 795 | 5.7% |
| $200,000+ | 544 | 3.9% |
Household Income by Householder Age in Fulton County
The median household income in Fulton County is $57,223, with the highest median household income of $70,180 found in the 25 to 44 years age bracket for the primary householder. A total of 3,657 households (26.2%) fall into this category. Meanwhile, the 15 to 24 years age bracket for the primary householder has the lowest median household income of $36,250, with 541 households (3.9%) in this group.
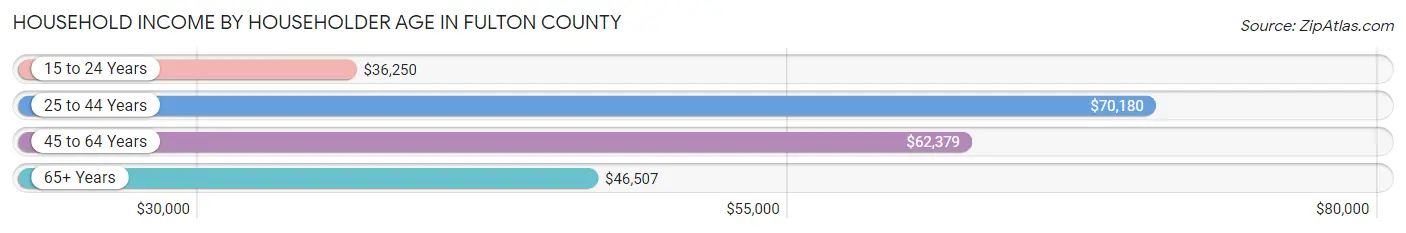
| Income Bracket | # Households | Median Income |
| 15 to 24 Years | 541 (3.9%) | $36,250 |
| 25 to 44 Years | 3,657 (26.2%) | $70,180 |
| 45 to 64 Years | 5,324 (38.2%) | $62,379 |
| 65+ Years | 4,433 (31.8%) | $46,507 |
| Total | 13,955 (100.0%) | $57,223 |
Poverty in Fulton County
Income Below Poverty by Sex and Age in Fulton County
With 12.9% poverty level for males and 13.9% for females among the residents of Fulton County, 16 and 17 year old males and 12 to 14 year old females are the most vulnerable to poverty, with 155 males (36.1%) and 193 females (28.3%) in their respective age groups living below the poverty level.
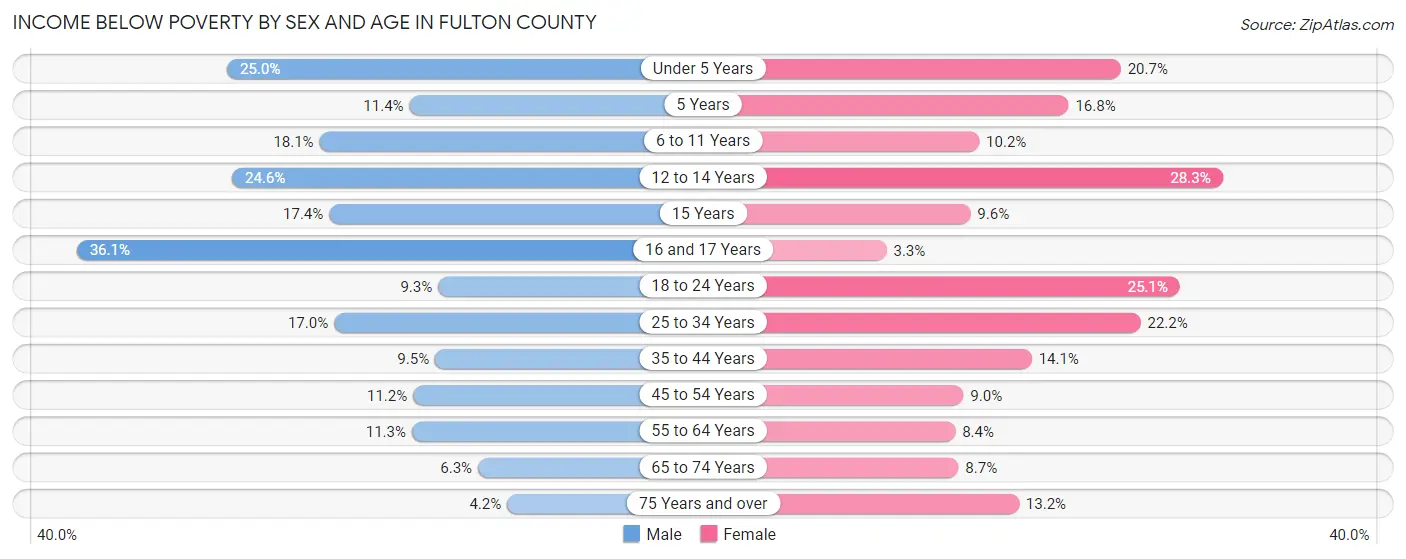
| Age Bracket | Male | Female |
| Under 5 Years | 213 (25.0%) | 170 (20.7%) |
| 5 Years | 12 (11.4%) | 17 (16.8%) |
| 6 to 11 Years | 216 (18.1%) | 106 (10.2%) |
| 12 to 14 Years | 136 (24.6%) | 193 (28.3%) |
| 15 Years | 36 (17.4%) | 19 (9.6%) |
| 16 and 17 Years | 155 (36.1%) | 13 (3.3%) |
| 18 to 24 Years | 115 (9.3%) | 278 (25.1%) |
| 25 to 34 Years | 304 (17.0%) | 381 (22.2%) |
| 35 to 44 Years | 182 (9.5%) | 261 (14.1%) |
| 45 to 54 Years | 236 (11.2%) | 178 (9.0%) |
| 55 to 64 Years | 256 (11.3%) | 201 (8.4%) |
| 65 to 74 Years | 120 (6.3%) | 179 (8.7%) |
| 75 Years and over | 49 (4.2%) | 197 (13.2%) |
| Total | 2,030 (12.9%) | 2,193 (13.9%) |
Income Above Poverty by Sex and Age in Fulton County
According to the poverty statistics in Fulton County, males aged 75 years and over and females aged 16 and 17 years are the age groups that are most secure financially, with 95.8% of males and 96.7% of females in these age groups living above the poverty line.
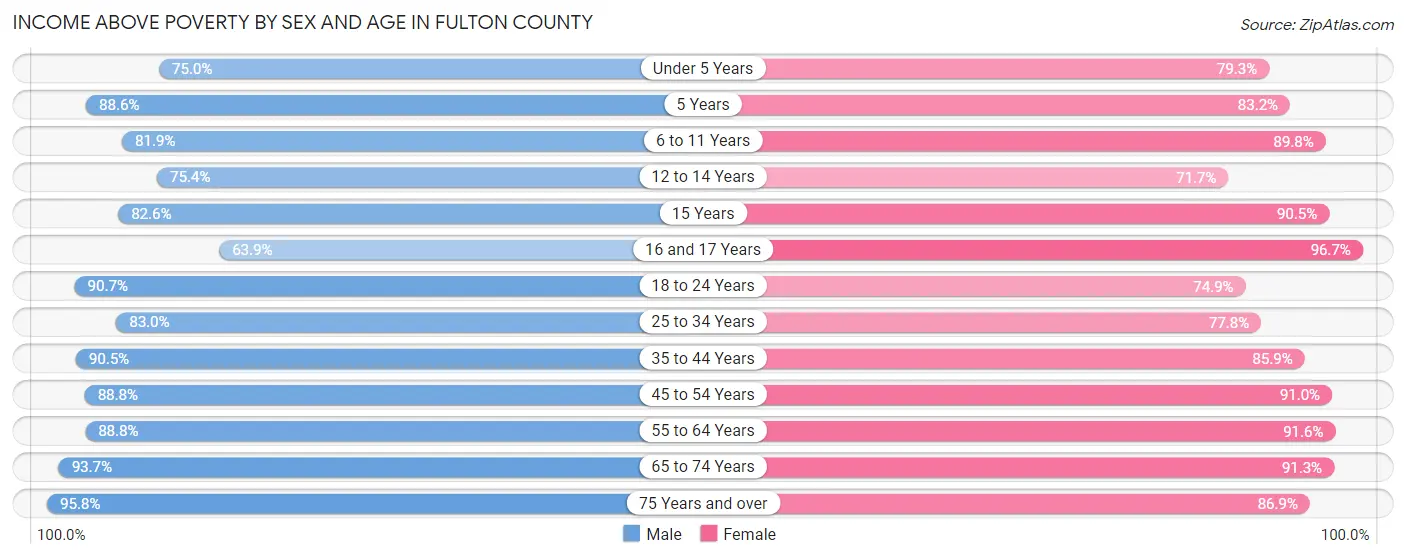
| Age Bracket | Male | Female |
| Under 5 Years | 640 (75.0%) | 651 (79.3%) |
| 5 Years | 93 (88.6%) | 84 (83.2%) |
| 6 to 11 Years | 977 (81.9%) | 933 (89.8%) |
| 12 to 14 Years | 417 (75.4%) | 490 (71.7%) |
| 15 Years | 171 (82.6%) | 180 (90.4%) |
| 16 and 17 Years | 274 (63.9%) | 378 (96.7%) |
| 18 to 24 Years | 1,121 (90.7%) | 830 (74.9%) |
| 25 to 34 Years | 1,481 (83.0%) | 1,337 (77.8%) |
| 35 to 44 Years | 1,727 (90.5%) | 1,590 (85.9%) |
| 45 to 54 Years | 1,879 (88.8%) | 1,794 (91.0%) |
| 55 to 64 Years | 2,020 (88.7%) | 2,186 (91.6%) |
| 65 to 74 Years | 1,772 (93.7%) | 1,889 (91.3%) |
| 75 Years and over | 1,122 (95.8%) | 1,301 (86.9%) |
| Total | 13,694 (87.1%) | 13,643 (86.2%) |
Income Below Poverty Among Married-Couple Families in Fulton County
The poverty statistics for married-couple families in Fulton County show that 4.1% or 261 of the total 6,445 families live below the poverty line. Families with 5 or more children have the highest poverty rate of 66.7%, comprising of 4 families. On the other hand, families with no children have the lowest poverty rate of 3.0%, which includes 128 families.
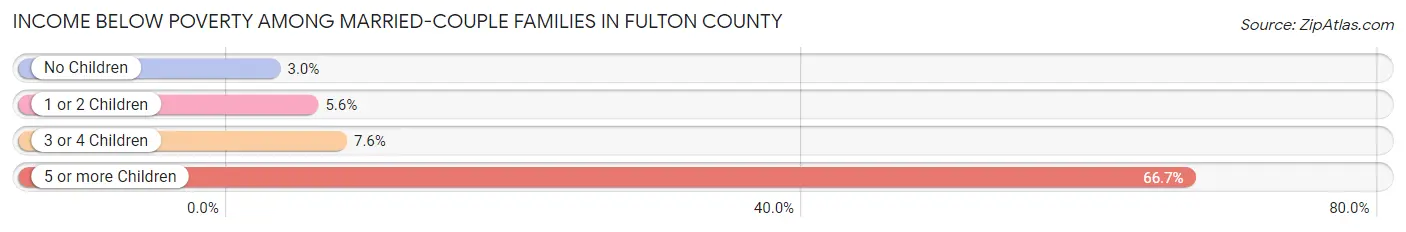
| Children | Above Poverty | Below Poverty |
| No Children | 4,194 (97.0%) | 128 (3.0%) |
| 1 or 2 Children | 1,501 (94.4%) | 89 (5.6%) |
| 3 or 4 Children | 487 (92.4%) | 40 (7.6%) |
| 5 or more Children | 2 (33.3%) | 4 (66.7%) |
| Total | 6,184 (96.0%) | 261 (4.1%) |
Income Below Poverty Among Single-Parent Households in Fulton County
According to the poverty data in Fulton County, 12.6% or 112 single-father households and 32.4% or 428 single-mother households are living below the poverty line. Among single-father households, those with 3 or 4 children have the highest poverty rate, with 36 households (38.7%) experiencing poverty. Likewise, among single-mother households, those with 5 or more children have the highest poverty rate, with 8 households (100.0%) falling below the poverty line.
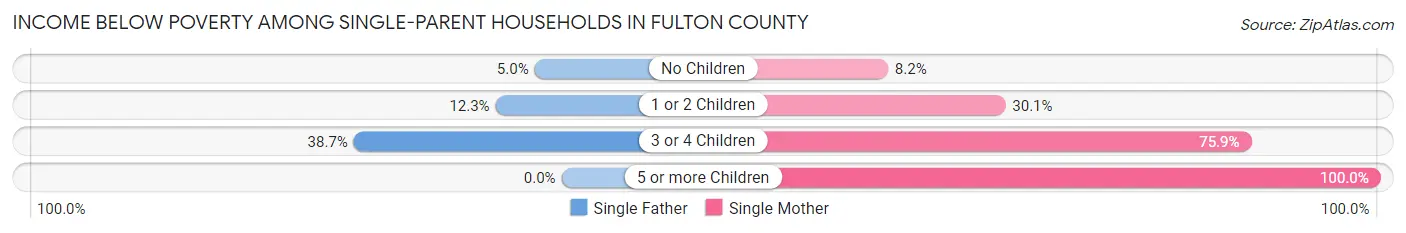
| Children | Single Father | Single Mother |
| No Children | 15 (5.0%) | 28 (8.2%) |
| 1 or 2 Children | 61 (12.3%) | 228 (30.1%) |
| 3 or 4 Children | 36 (38.7%) | 164 (75.9%) |
| 5 or more Children | 0 (0.0%) | 8 (100.0%) |
| Total | 112 (12.6%) | 428 (32.4%) |
Income Below Poverty Among Married-Couple vs Single-Parent Households in Fulton County
The poverty data for Fulton County shows that 261 of the married-couple family households (4.1%) and 540 of the single-parent households (24.5%) are living below the poverty level. Within the married-couple family households, those with 5 or more children have the highest poverty rate, with 4 households (66.7%) falling below the poverty line. Among the single-parent households, those with 5 or more children have the highest poverty rate, with 8 household (100.0%) living below poverty.
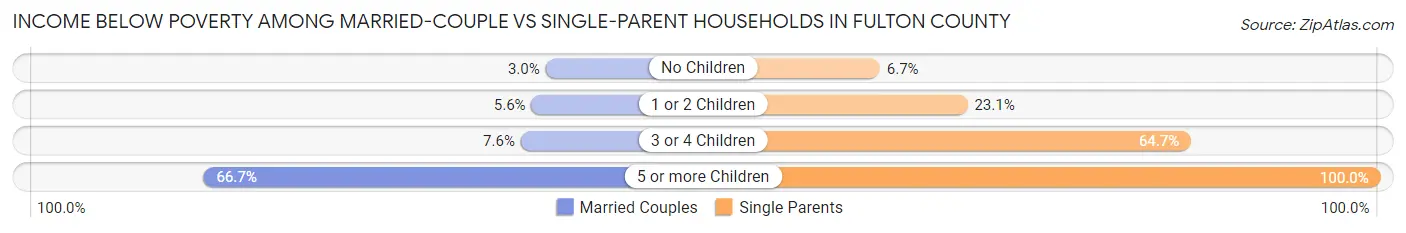
| Children | Married-Couple Families | Single-Parent Households |
| No Children | 128 (3.0%) | 43 (6.7%) |
| 1 or 2 Children | 89 (5.6%) | 289 (23.1%) |
| 3 or 4 Children | 40 (7.6%) | 200 (64.7%) |
| 5 or more Children | 4 (66.7%) | 8 (100.0%) |
| Total | 261 (4.1%) | 540 (24.5%) |
Race in Fulton County
The most populous races in Fulton County are White / Caucasian (31,409 | 93.2%), Hispanic or Latino (966 | 2.9%), and Black / African American (902 | 2.7%).
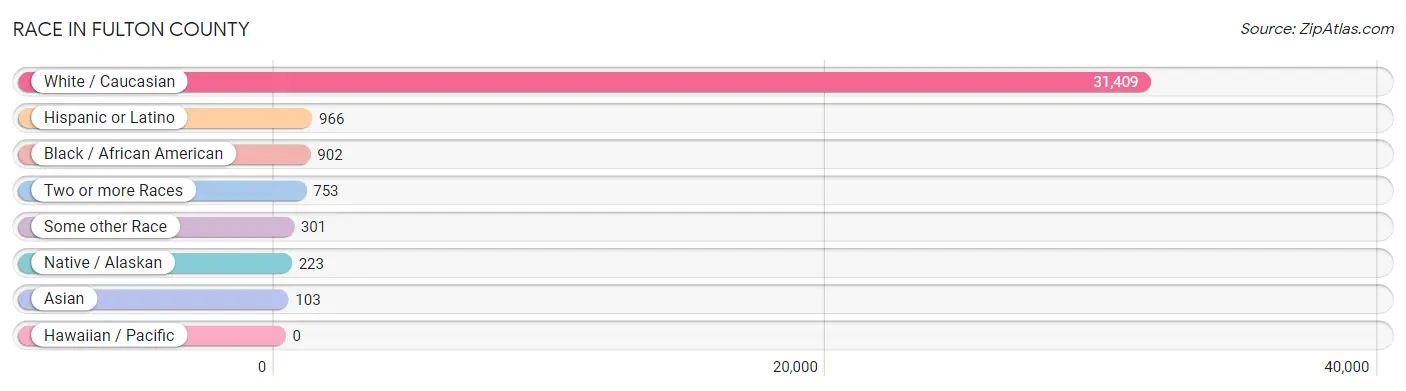
| Race | # Population | % Population |
| Asian | 103 | 0.3% |
| Black / African American | 902 | 2.7% |
| Hawaiian / Pacific | 0 | 0.0% |
| Hispanic or Latino | 966 | 2.9% |
| Native / Alaskan | 223 | 0.7% |
| White / Caucasian | 31,409 | 93.2% |
| Two or more Races | 753 | 2.2% |
| Some other Race | 301 | 0.9% |
| Total | 33,691 | 100.0% |
Ancestry in Fulton County
The most populous ancestries reported in Fulton County are German (7,135 | 21.2%), English (4,942 | 14.7%), Irish (3,664 | 10.9%), American (2,445 | 7.3%), and Italian (1,307 | 3.9%), together accounting for 57.9% of all Fulton County residents.
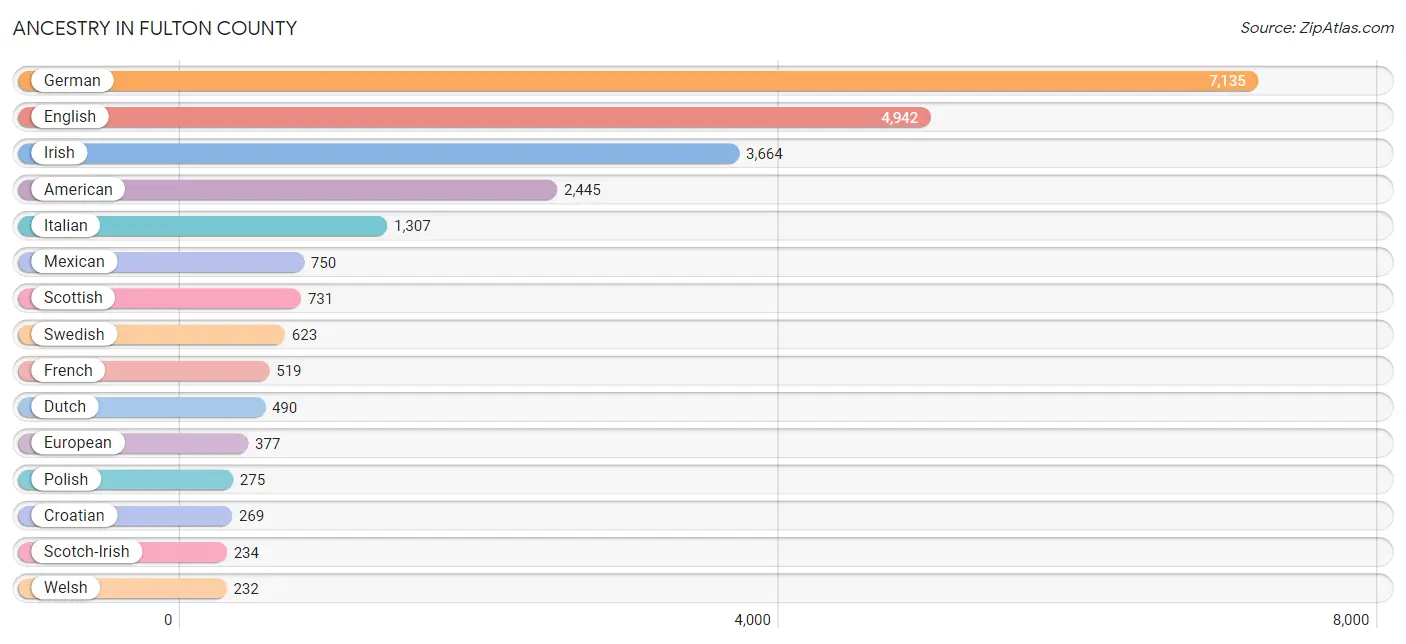
| Ancestry | # Population | % Population |
| African | 143 | 0.4% |
| American | 2,445 | 7.3% |
| Arab | 22 | 0.1% |
| Armenian | 7 | 0.0% |
| Austrian | 47 | 0.1% |
| Belgian | 14 | 0.0% |
| Belizean | 15 | 0.0% |
| Bhutanese | 15 | 0.0% |
| Blackfeet | 17 | 0.1% |
| Brazilian | 5 | 0.0% |
| British | 91 | 0.3% |
| Burmese | 36 | 0.1% |
| Central American | 13 | 0.0% |
| Cherokee | 74 | 0.2% |
| Chinese | 2 | 0.0% |
| Chippewa | 16 | 0.1% |
| Choctaw | 8 | 0.0% |
| Colombian | 3 | 0.0% |
| Croatian | 269 | 0.8% |
| Cuban | 23 | 0.1% |
| Czech | 96 | 0.3% |
| Danish | 58 | 0.2% |
| Dominican | 8 | 0.0% |
| Dutch | 490 | 1.5% |
| Eastern European | 69 | 0.2% |
| Ecuadorian | 15 | 0.0% |
| English | 4,942 | 14.7% |
| European | 377 | 1.1% |
| Finnish | 65 | 0.2% |
| French | 519 | 1.5% |
| French Canadian | 106 | 0.3% |
| German | 7,135 | 21.2% |
| Greek | 24 | 0.1% |
| Guatemalan | 13 | 0.0% |
| Haitian | 24 | 0.1% |
| Hungarian | 26 | 0.1% |
| Icelander | 6 | 0.0% |
| Indian (Asian) | 81 | 0.2% |
| Irish | 3,664 | 10.9% |
| Italian | 1,307 | 3.9% |
| Jamaican | 15 | 0.0% |
| Korean | 36 | 0.1% |
| Lithuanian | 178 | 0.5% |
| Luxembourger | 2 | 0.0% |
| Malaysian | 8 | 0.0% |
| Mexican | 750 | 2.2% |
| Mexican American Indian | 26 | 0.1% |
| Moroccan | 19 | 0.1% |
| Navajo | 12 | 0.0% |
| Nigerian | 10 | 0.0% |
| Northern European | 1 | 0.0% |
| Norwegian | 174 | 0.5% |
| Ottawa | 7 | 0.0% |
| Paraguayan | 5 | 0.0% |
| Pennsylvania German | 10 | 0.0% |
| Polish | 275 | 0.8% |
| Portuguese | 19 | 0.1% |
| Pueblo | 9 | 0.0% |
| Puerto Rican | 100 | 0.3% |
| Romanian | 11 | 0.0% |
| Russian | 32 | 0.1% |
| Scandinavian | 117 | 0.4% |
| Scotch-Irish | 234 | 0.7% |
| Scottish | 731 | 2.2% |
| Slavic | 5 | 0.0% |
| Slovak | 4 | 0.0% |
| South African | 5 | 0.0% |
| South American | 30 | 0.1% |
| Spaniard | 21 | 0.1% |
| Spanish | 7 | 0.0% |
| Sri Lankan | 16 | 0.1% |
| Subsaharan African | 163 | 0.5% |
| Swedish | 623 | 1.8% |
| Swiss | 123 | 0.4% |
| Syrian | 3 | 0.0% |
| Thai | 4 | 0.0% |
| Ukrainian | 23 | 0.1% |
| Venezuelan | 7 | 0.0% |
| Welsh | 232 | 0.7% |
| Yugoslavian | 77 | 0.2% | View All 80 Rows |
Immigrants in Fulton County
The most numerous immigrant groups reported in Fulton County came from Latin America (239 | 0.7%), Central America (231 | 0.7%), Mexico (218 | 0.6%), Asia (62 | 0.2%), and Europe (51 | 0.2%), together accounting for 2.4% of all Fulton County residents.
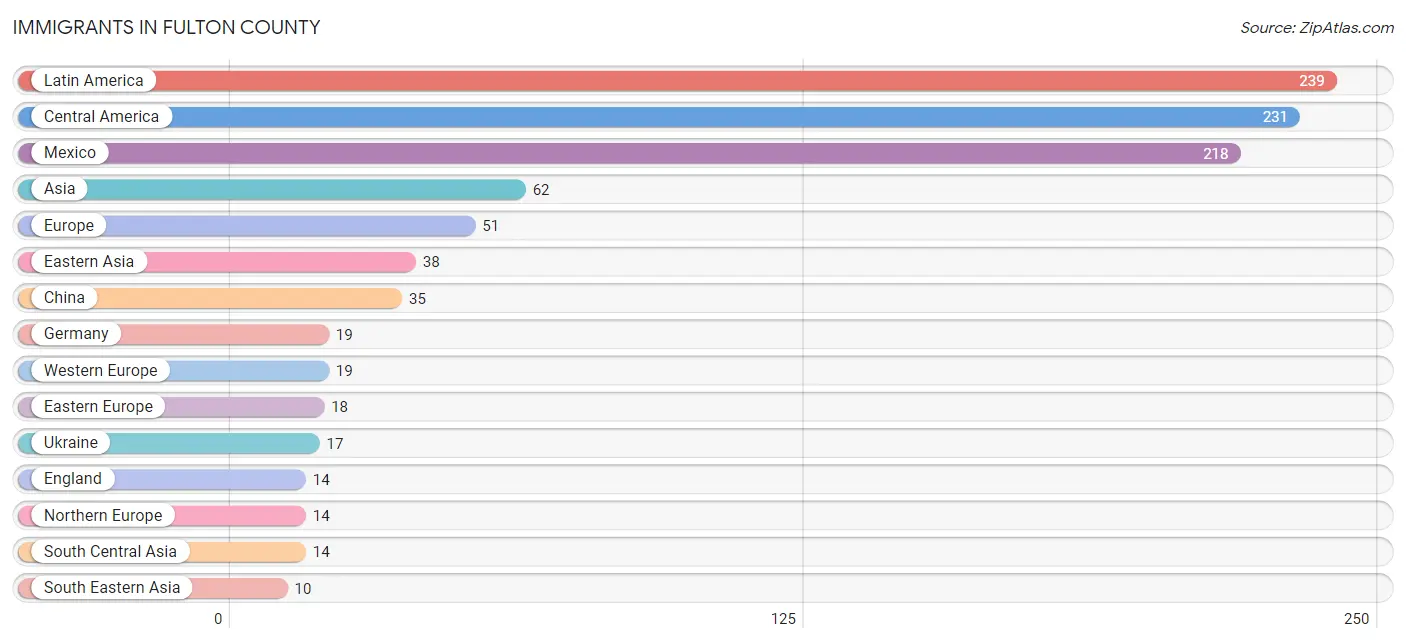
| Immigration Origin | # Population | % Population |
| Asia | 62 | 0.2% |
| Belize | 8 | 0.0% |
| Brazil | 5 | 0.0% |
| Canada | 4 | 0.0% |
| Central America | 231 | 0.7% |
| China | 35 | 0.1% |
| Eastern Asia | 38 | 0.1% |
| Eastern Europe | 18 | 0.1% |
| England | 14 | 0.0% |
| Europe | 51 | 0.2% |
| Germany | 19 | 0.1% |
| Guatemala | 5 | 0.0% |
| India | 7 | 0.0% |
| Japan | 3 | 0.0% |
| Latin America | 239 | 0.7% |
| Mexico | 218 | 0.6% |
| Northern Europe | 14 | 0.0% |
| Philippines | 3 | 0.0% |
| Russia | 1 | 0.0% |
| South America | 8 | 0.0% |
| South Central Asia | 14 | 0.0% |
| South Eastern Asia | 10 | 0.0% |
| Ukraine | 17 | 0.1% |
| Vietnam | 1 | 0.0% |
| Western Europe | 19 | 0.1% | View All 25 Rows |
Sex and Age in Fulton County
Sex and Age in Fulton County
The most populous age groups in Fulton County are 25 to 29 Years (1,332 | 7.6%) for men and 65 to 69 Years (1,306 | 8.1%) for women.
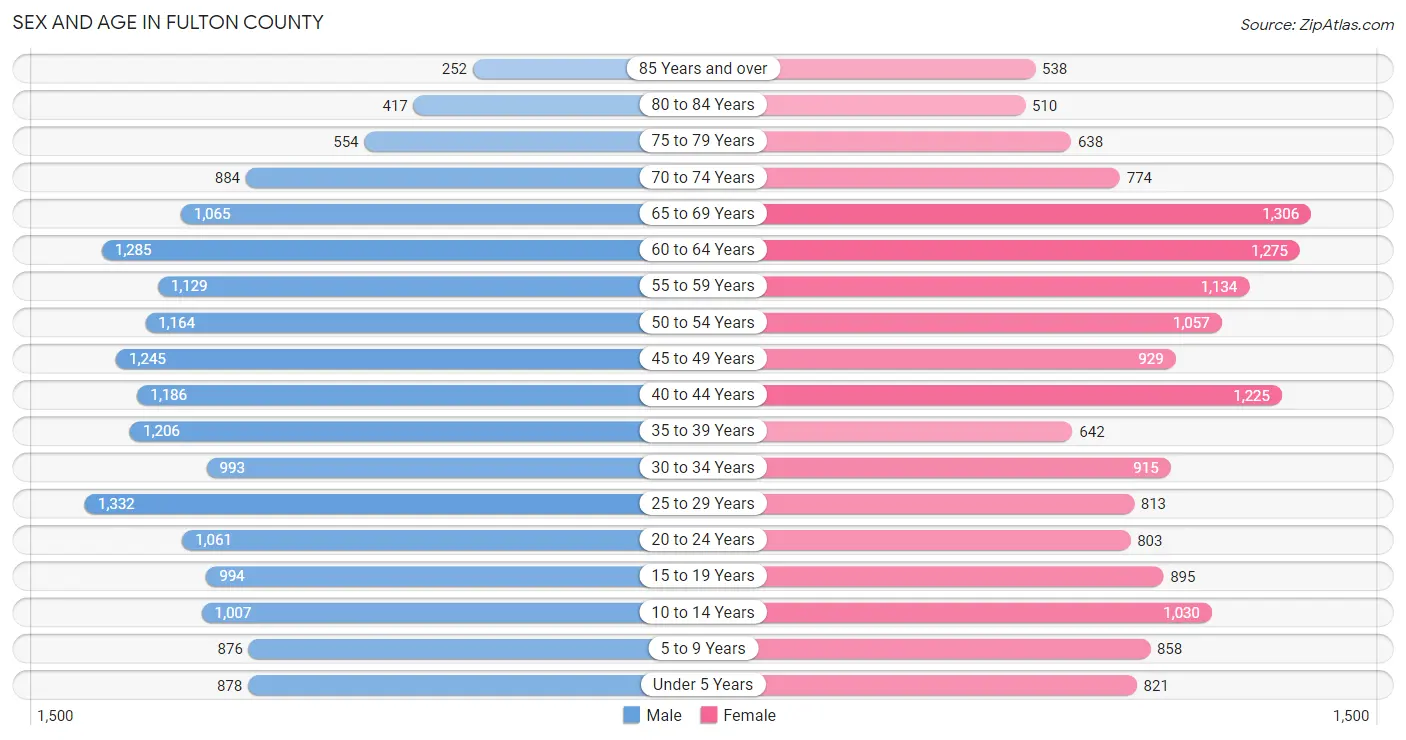
| Age Bracket | Male | Female |
| Under 5 Years | 878 (5.0%) | 821 (5.1%) |
| 5 to 9 Years | 876 (5.0%) | 858 (5.3%) |
| 10 to 14 Years | 1,007 (5.8%) | 1,030 (6.4%) |
| 15 to 19 Years | 994 (5.7%) | 895 (5.5%) |
| 20 to 24 Years | 1,061 (6.0%) | 803 (5.0%) |
| 25 to 29 Years | 1,332 (7.6%) | 813 (5.0%) |
| 30 to 34 Years | 993 (5.7%) | 915 (5.7%) |
| 35 to 39 Years | 1,206 (6.9%) | 642 (4.0%) |
| 40 to 44 Years | 1,186 (6.8%) | 1,225 (7.6%) |
| 45 to 49 Years | 1,245 (7.1%) | 929 (5.8%) |
| 50 to 54 Years | 1,164 (6.6%) | 1,057 (6.5%) |
| 55 to 59 Years | 1,129 (6.4%) | 1,134 (7.0%) |
| 60 to 64 Years | 1,285 (7.3%) | 1,275 (7.9%) |
| 65 to 69 Years | 1,065 (6.1%) | 1,306 (8.1%) |
| 70 to 74 Years | 884 (5.0%) | 774 (4.8%) |
| 75 to 79 Years | 554 (3.2%) | 638 (4.0%) |
| 80 to 84 Years | 417 (2.4%) | 510 (3.2%) |
| 85 Years and over | 252 (1.4%) | 538 (3.3%) |
| Total | 17,528 (100.0%) | 16,163 (100.0%) |
Families and Households in Fulton County
Median Family Size in Fulton County
The median family size in Fulton County is 2.80 persons per family, with married-couple families (6,445 | 74.5%) accounting for the largest median family size of 2.86 persons per family. On the other hand, single male/father families (887 | 10.2%) represent the smallest median family size with 2.51 persons per family.
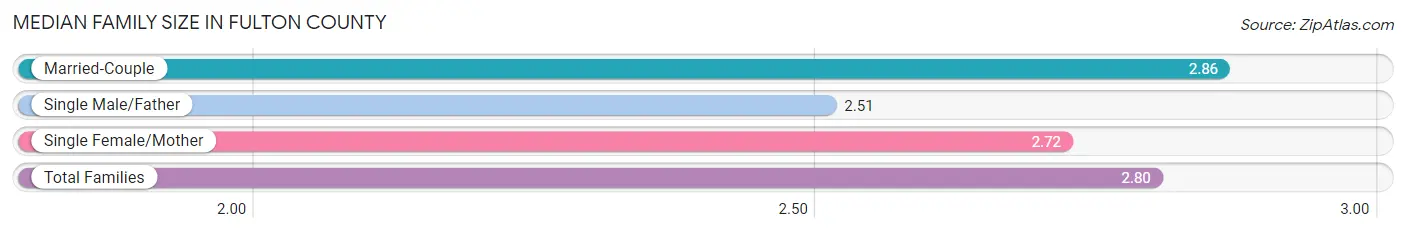
| Family Type | # Families | Family Size |
| Married-Couple | 6,445 (74.5%) | 2.86 |
| Single Male/Father | 887 (10.2%) | 2.51 |
| Single Female/Mother | 1,321 (15.3%) | 2.72 |
| Total Families | 8,653 (100.0%) | 2.80 |
Median Household Size in Fulton County
The median household size in Fulton County is 2.27 persons per household, with single female/mother households (1,321 | 9.5%) accounting for the largest median household size of 3.15 persons per household. non-family households (5,302 | 38.0%) represent the smallest median household size with 1.18 persons per household.
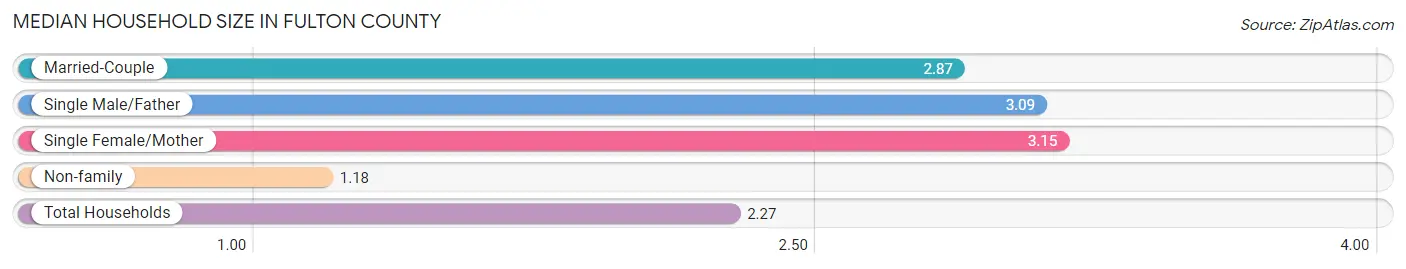
| Household Type | # Households | Household Size |
| Married-Couple | 6,445 (46.2%) | 2.87 |
| Single Male/Father | 887 (6.4%) | 3.09 |
| Single Female/Mother | 1,321 (9.5%) | 3.15 |
| Non-family | 5,302 (38.0%) | 1.18 |
| Total Households | 13,955 (100.0%) | 2.27 |
Household Size by Marriage Status in Fulton County
Out of a total of 13,955 households in Fulton County, 8,653 (62.0%) are family households, while 5,302 (38.0%) are nonfamily households. The most numerous type of family households are 2-person households, comprising 4,440, and the most common type of nonfamily households are 1-person households, comprising 4,516.
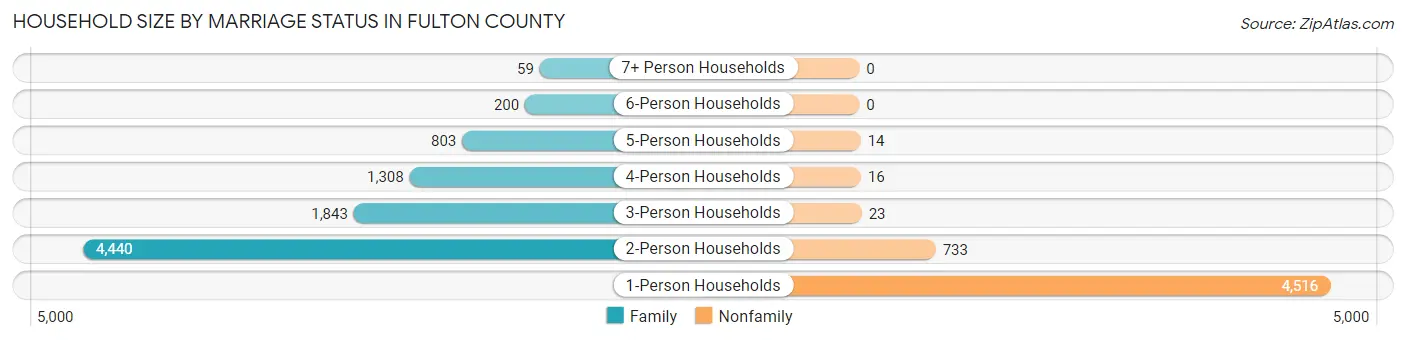
| Household Size | Family Households | Nonfamily Households |
| 1-Person Households | - | 4,516 (32.4%) |
| 2-Person Households | 4,440 (31.8%) | 733 (5.2%) |
| 3-Person Households | 1,843 (13.2%) | 23 (0.2%) |
| 4-Person Households | 1,308 (9.4%) | 16 (0.1%) |
| 5-Person Households | 803 (5.8%) | 14 (0.1%) |
| 6-Person Households | 200 (1.4%) | 0 (0.0%) |
| 7+ Person Households | 59 (0.4%) | 0 (0.0%) |
| Total | 8,653 (62.0%) | 5,302 (38.0%) |
Female Fertility in Fulton County
Fertility by Age in Fulton County
Average fertility rate in Fulton County is 35.0 births per 1,000 women. Women in the age bracket of 20 to 34 years have the highest fertility rate with 78.0 births per 1,000 women. Women in the age bracket of 20 to 34 years acount for 88.0% of all women with births.
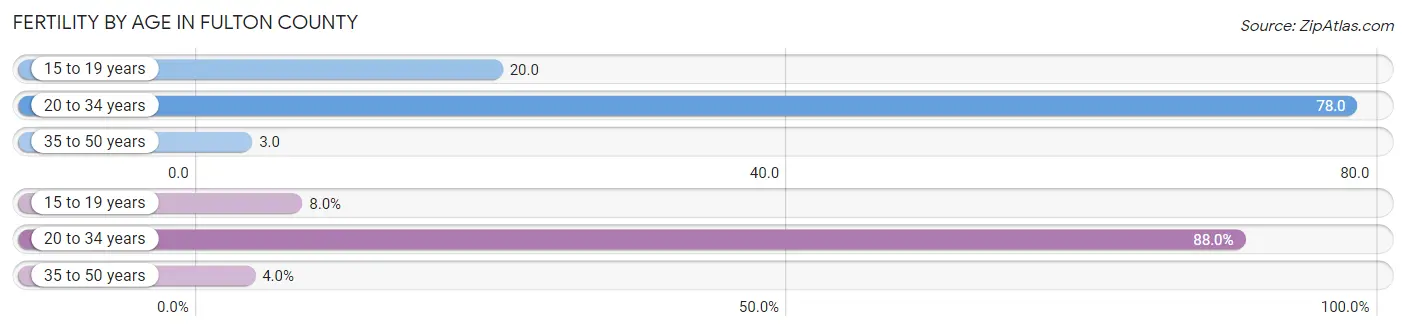
| Age Bracket | Women with Births | Births / 1,000 Women |
| 15 to 19 years | 18 (8.0%) | 20.0 |
| 20 to 34 years | 198 (88.0%) | 78.0 |
| 35 to 50 years | 9 (4.0%) | 3.0 |
| Total | 225 (100.0%) | 35.0 |
Fertility by Age by Marriage Status in Fulton County
41.8% of women with births (225) in Fulton County are married. The highest percentage of unmarried women with births falls into 15 to 19 years age bracket with 100.0% of them unmarried at the time of birth, while the lowest percentage of unmarried women with births belong to 35 to 50 years age bracket with 0.0% of them unmarried.
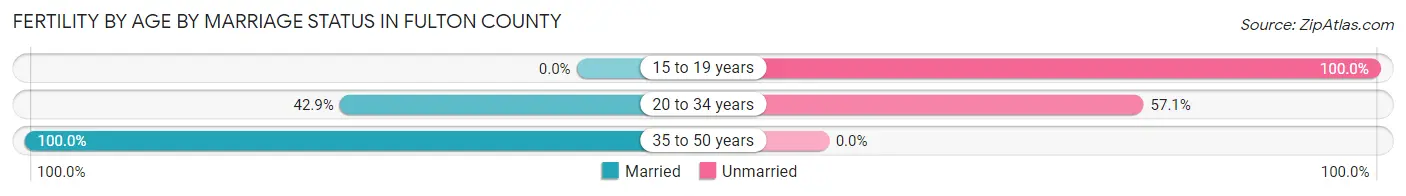
| Age Bracket | Married | Unmarried |
| 15 to 19 years | 0 (0.0%) | 18 (100.0%) |
| 20 to 34 years | 85 (42.9%) | 113 (57.1%) |
| 35 to 50 years | 9 (100.0%) | 0 (0.0%) |
| Total | 94 (41.8%) | 131 (58.2%) |
Fertility by Education in Fulton County
Average fertility rate in Fulton County is 35.0 births per 1,000 women. Women with the education attainment of high school diploma have the highest fertility rate of 63.0 births per 1,000 women, while women with the education attainment of graduate degree have the lowest fertility at 7.0 births per 1,000 women. Women with the education attainment of high school diploma represent 45.8% of all women with births.
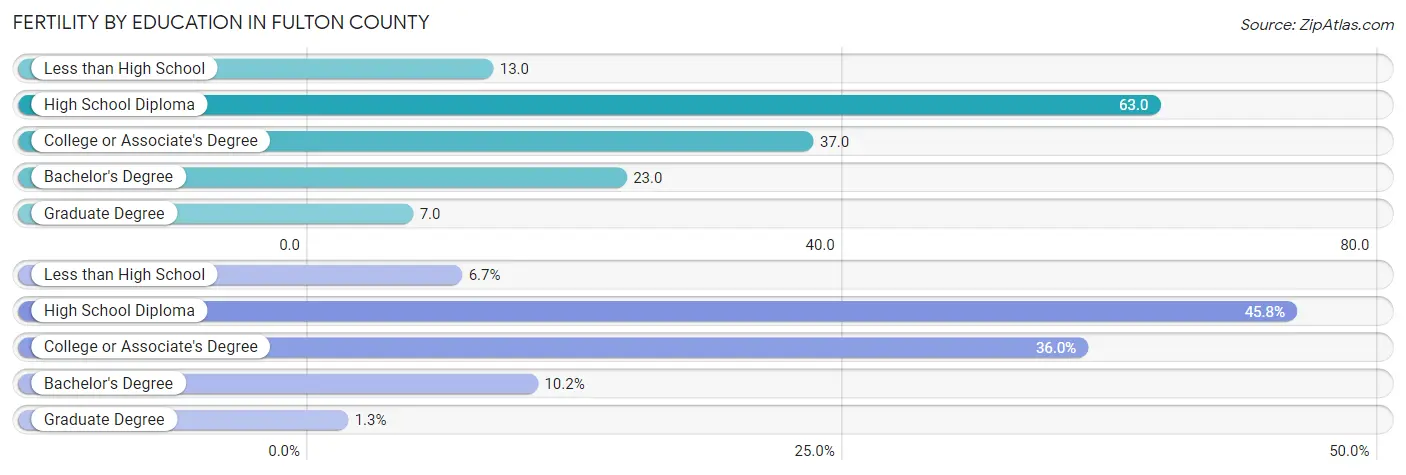
| Educational Attainment | Women with Births | Births / 1,000 Women |
| Less than High School | 15 (6.7%) | 13.0 |
| High School Diploma | 103 (45.8%) | 63.0 |
| College or Associate's Degree | 81 (36.0%) | 37.0 |
| Bachelor's Degree | 23 (10.2%) | 23.0 |
| Graduate Degree | 3 (1.3%) | 7.0 |
| Total | 225 (100.0%) | 35.0 |
Fertility by Education by Marriage Status in Fulton County
58.2% of women with births in Fulton County are unmarried. Women with the educational attainment of bachelor's degree are most likely to be married with 100.0% of them married at childbirth, while women with the educational attainment of high school diploma are least likely to be married with 99.0% of them unmarried at childbirth.
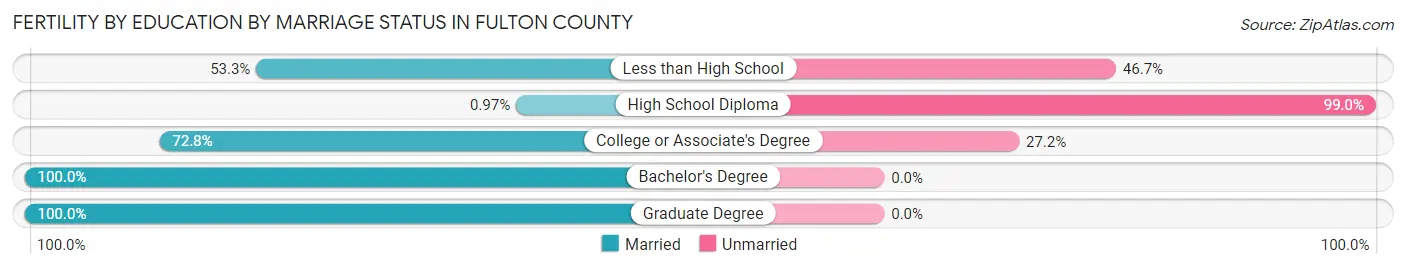
| Educational Attainment | Married | Unmarried |
| Less than High School | 8 (53.3%) | 7 (46.7%) |
| High School Diploma | 1 (1.0%) | 102 (99.0%) |
| College or Associate's Degree | 59 (72.8%) | 22 (27.2%) |
| Bachelor's Degree | 23 (100.0%) | 0 (0.0%) |
| Graduate Degree | 3 (100.0%) | 0 (0.0%) |
| Total | 94 (41.8%) | 131 (58.2%) |
Employment Characteristics in Fulton County
Employment by Class of Employer in Fulton County
Among the 14,264 employed individuals in Fulton County, private company employees (9,279 | 65.0%), local government employees (1,369 | 9.6%), and not-for-profit organizations (1,223 | 8.6%) make up the most common classes of employment.
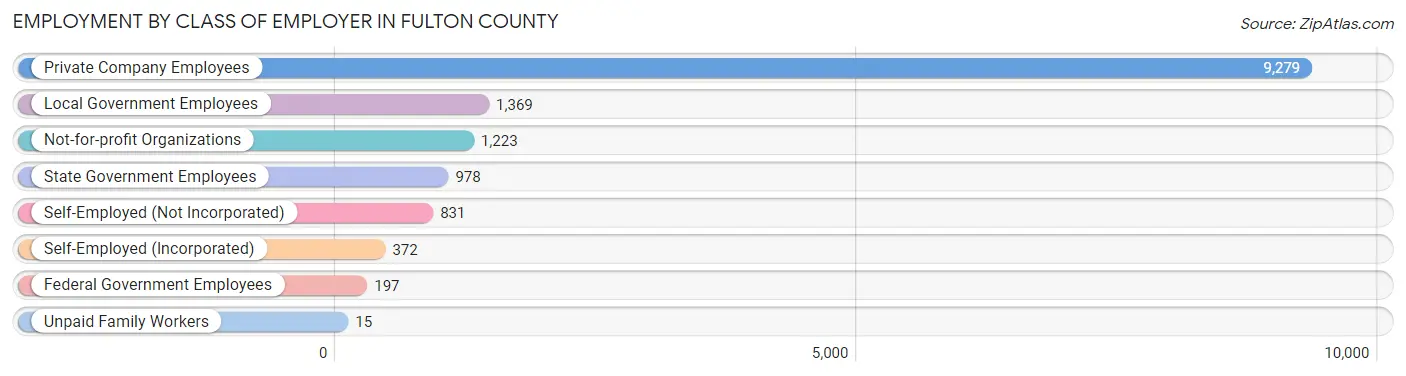
| Employer Class | # Employees | % Employees |
| Private Company Employees | 9,279 | 65.0% |
| Self-Employed (Incorporated) | 372 | 2.6% |
| Self-Employed (Not Incorporated) | 831 | 5.8% |
| Not-for-profit Organizations | 1,223 | 8.6% |
| Local Government Employees | 1,369 | 9.6% |
| State Government Employees | 978 | 6.9% |
| Federal Government Employees | 197 | 1.4% |
| Unpaid Family Workers | 15 | 0.1% |
| Total | 14,264 | 100.0% |
Employment Status by Age in Fulton County
According to the labor force statistics for Fulton County, out of the total population over 16 years of age (27,815), 56.0% or 15,576 individuals are in the labor force, with 6.8% or 1,059 of them unemployed. The age group with the highest labor force participation rate is 45 to 54 years, with 76.6% or 3,367 individuals in the labor force. Within the labor force, the 16 to 19 years age range has the highest percentage of unemployed individuals, with 41.0% or 299 of them being unemployed.
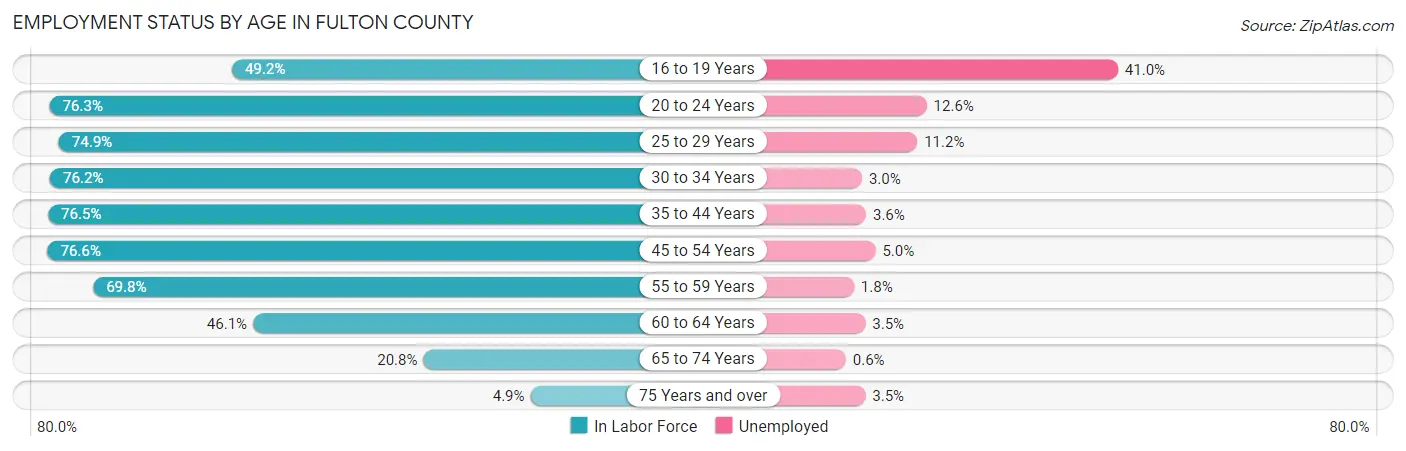
| Age Bracket | In Labor Force | Unemployed |
| 16 to 19 Years | 730 (49.2%) | 299 (41.0%) |
| 20 to 24 Years | 1,422 (76.3%) | 179 (12.6%) |
| 25 to 29 Years | 1,607 (74.9%) | 180 (11.2%) |
| 30 to 34 Years | 1,454 (76.2%) | 44 (3.0%) |
| 35 to 44 Years | 3,258 (76.5%) | 117 (3.6%) |
| 45 to 54 Years | 3,367 (76.6%) | 168 (5.0%) |
| 55 to 59 Years | 1,580 (69.8%) | 28 (1.8%) |
| 60 to 64 Years | 1,180 (46.1%) | 41 (3.5%) |
| 65 to 74 Years | 838 (20.8%) | 5 (0.6%) |
| 75 Years and over | 143 (4.9%) | 5 (3.5%) |
| Total | 15,576 (56.0%) | 1,059 (6.8%) |
Employment Status by Educational Attainment in Fulton County
According to labor force statistics for Fulton County, 71.0% of individuals (12,446) out of the total population between 25 and 64 years of age (17,530) are in the labor force, with 4.6% or 573 of them being unemployed. The group with the highest labor force participation rate are those with the educational attainment of bachelor's degree or higher, with 81.5% or 2,731 individuals in the labor force. Within the labor force, individuals with less than high school education have the highest percentage of unemployment, with 8.4% or 57 of them being unemployed.
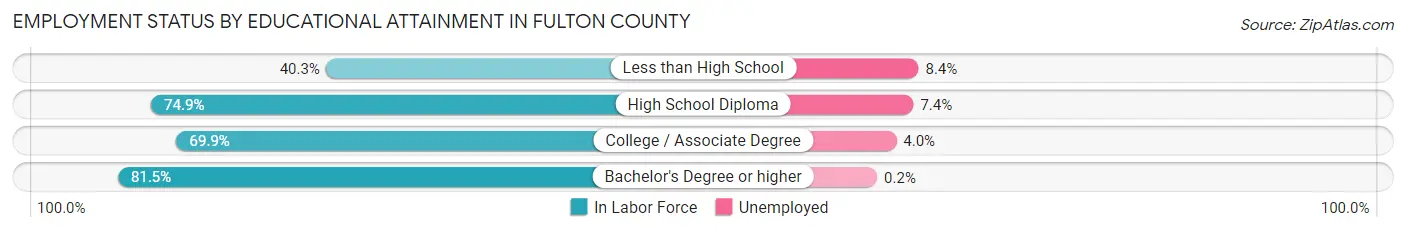
| Educational Attainment | In Labor Force | Unemployed |
| Less than High School | 679 (40.3%) | 141 (8.4%) |
| High School Diploma | 4,593 (74.9%) | 454 (7.4%) |
| College / Associate Degree | 4,448 (69.9%) | 255 (4.0%) |
| Bachelor's Degree or higher | 2,731 (81.5%) | 7 (0.2%) |
| Total | 12,446 (71.0%) | 806 (4.6%) |
Employment Occupations by Sex in Fulton County
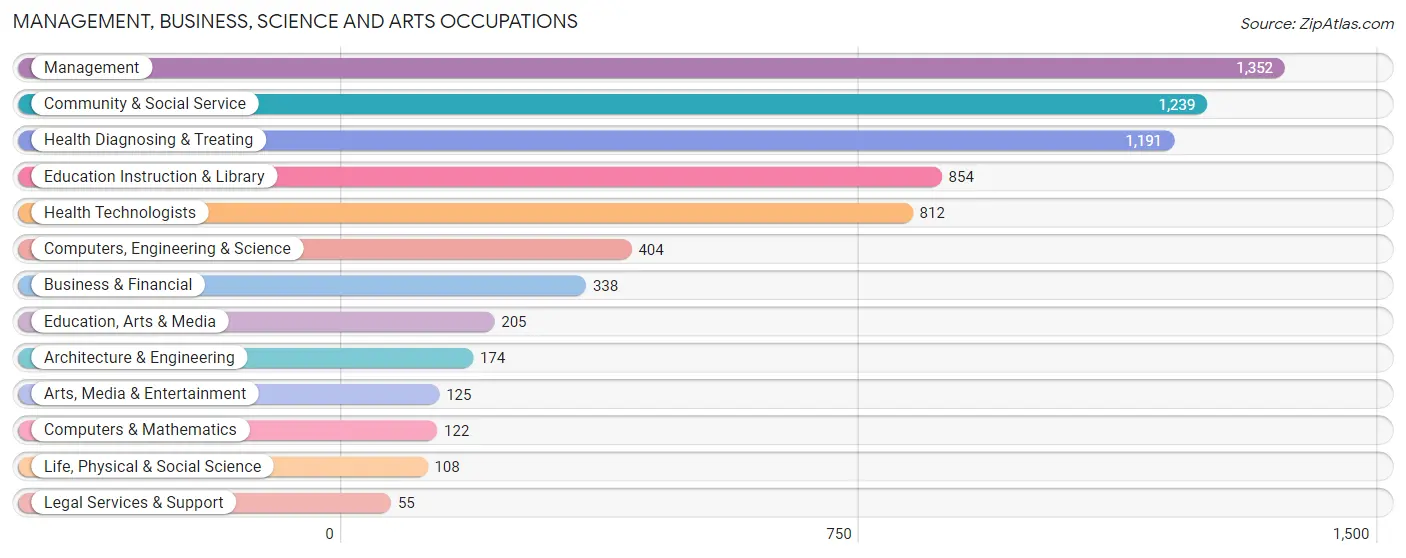
Management, Business, Science and Arts Occupations
The most common Management, Business, Science and Arts occupations in Fulton County are Management (1,352 | 9.3%), Community & Social Service (1,239 | 8.6%), Health Diagnosing & Treating (1,191 | 8.2%), Education Instruction & Library (854 | 5.9%), and Health Technologists (812 | 5.6%).
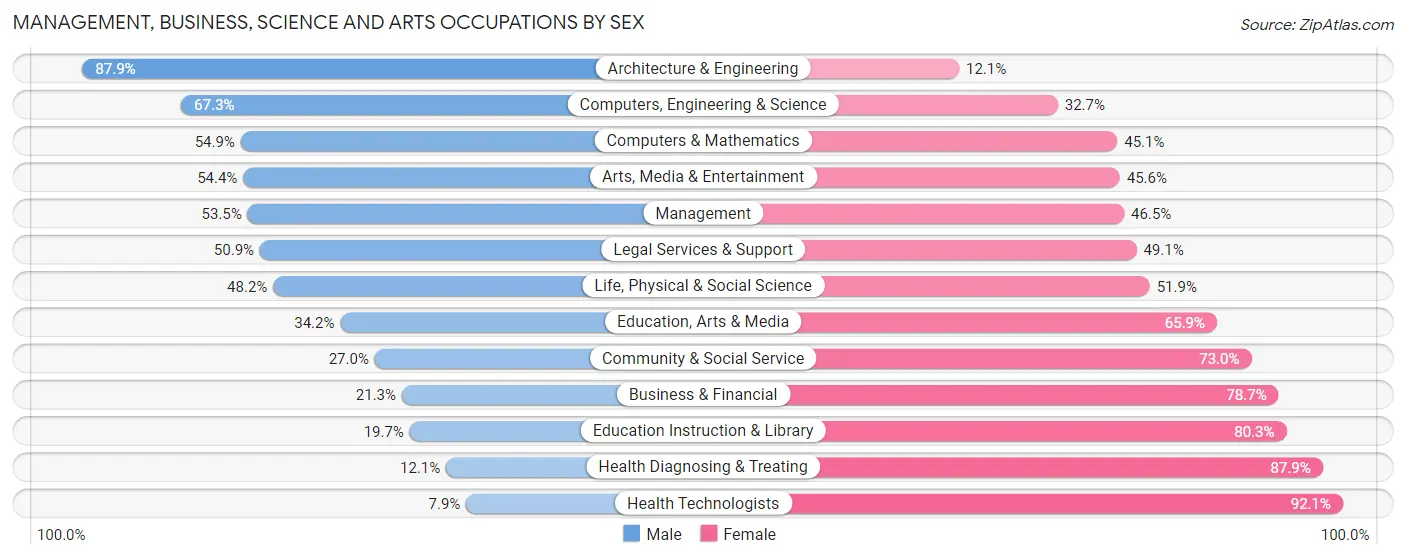
Management, Business, Science and Arts Occupations by Sex
Within the Management, Business, Science and Arts occupations in Fulton County, the most male-oriented occupations are Architecture & Engineering (87.9%), Computers, Engineering & Science (67.3%), and Computers & Mathematics (54.9%), while the most female-oriented occupations are Health Technologists (92.1%), Health Diagnosing & Treating (87.9%), and Education Instruction & Library (80.3%).
| Occupation | Male | Female |
| Management | 723 (53.5%) | 629 (46.5%) |
| Business & Financial | 72 (21.3%) | 266 (78.7%) |
| Computers, Engineering & Science | 272 (67.3%) | 132 (32.7%) |
| Computers & Mathematics | 67 (54.9%) | 55 (45.1%) |
| Architecture & Engineering | 153 (87.9%) | 21 (12.1%) |
| Life, Physical & Social Science | 52 (48.1%) | 56 (51.8%) |
| Community & Social Service | 334 (27.0%) | 905 (73.0%) |
| Education, Arts & Media | 70 (34.2%) | 135 (65.8%) |
| Legal Services & Support | 28 (50.9%) | 27 (49.1%) |
| Education Instruction & Library | 168 (19.7%) | 686 (80.3%) |
| Arts, Media & Entertainment | 68 (54.4%) | 57 (45.6%) |
| Health Diagnosing & Treating | 144 (12.1%) | 1,047 (87.9%) |
| Health Technologists | 64 (7.9%) | 748 (92.1%) |
| Total (Category) | 1,545 (34.2%) | 2,979 (65.8%) |
| Total (Overall) | 7,424 (51.2%) | 7,072 (48.8%) |
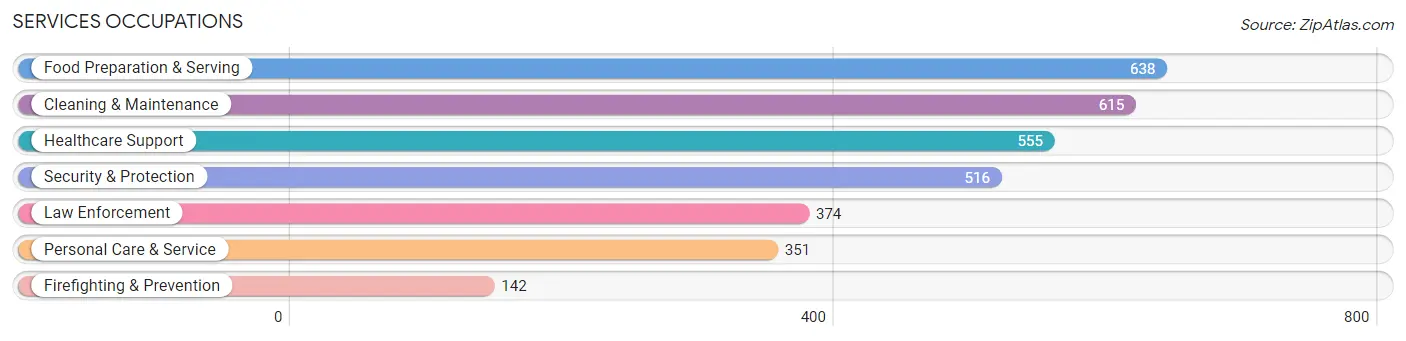
Services Occupations
The most common Services occupations in Fulton County are Food Preparation & Serving (638 | 4.4%), Cleaning & Maintenance (615 | 4.2%), Healthcare Support (555 | 3.8%), Security & Protection (516 | 3.6%), and Law Enforcement (374 | 2.6%).
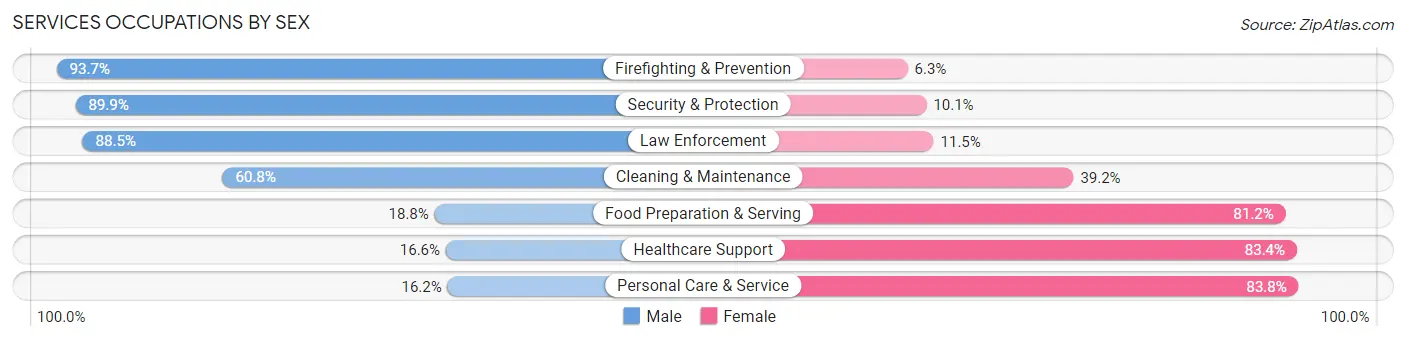
Services Occupations by Sex
Within the Services occupations in Fulton County, the most male-oriented occupations are Firefighting & Prevention (93.7%), Security & Protection (89.9%), and Law Enforcement (88.5%), while the most female-oriented occupations are Personal Care & Service (83.8%), Healthcare Support (83.4%), and Food Preparation & Serving (81.2%).
| Occupation | Male | Female |
| Healthcare Support | 92 (16.6%) | 463 (83.4%) |
| Security & Protection | 464 (89.9%) | 52 (10.1%) |
| Firefighting & Prevention | 133 (93.7%) | 9 (6.3%) |
| Law Enforcement | 331 (88.5%) | 43 (11.5%) |
| Food Preparation & Serving | 120 (18.8%) | 518 (81.2%) |
| Cleaning & Maintenance | 374 (60.8%) | 241 (39.2%) |
| Personal Care & Service | 57 (16.2%) | 294 (83.8%) |
| Total (Category) | 1,107 (41.4%) | 1,568 (58.6%) |
| Total (Overall) | 7,424 (51.2%) | 7,072 (48.8%) |
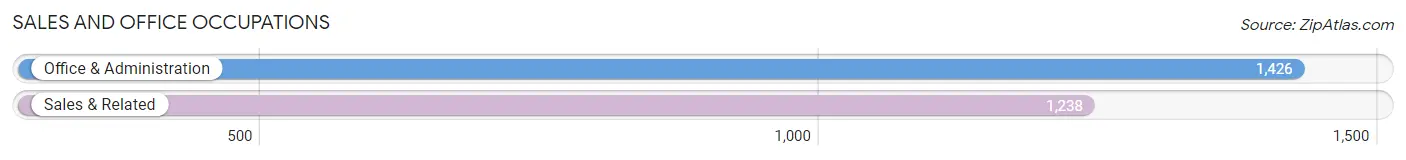
Sales and Office Occupations
The most common Sales and Office occupations in Fulton County are Office & Administration (1,426 | 9.8%), and Sales & Related (1,238 | 8.5%).
Sales and Office Occupations by Sex
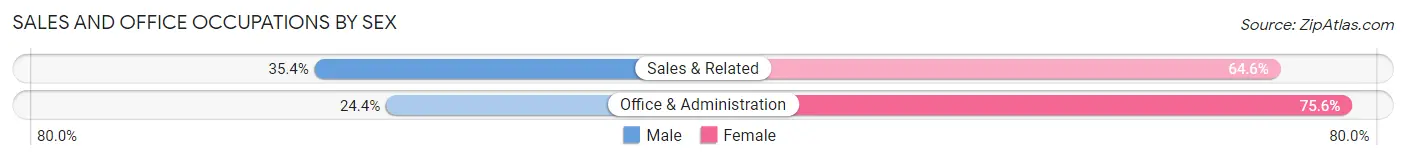
| Occupation | Male | Female |
| Sales & Related | 438 (35.4%) | 800 (64.6%) |
| Office & Administration | 348 (24.4%) | 1,078 (75.6%) |
| Total (Category) | 786 (29.5%) | 1,878 (70.5%) |
| Total (Overall) | 7,424 (51.2%) | 7,072 (48.8%) |
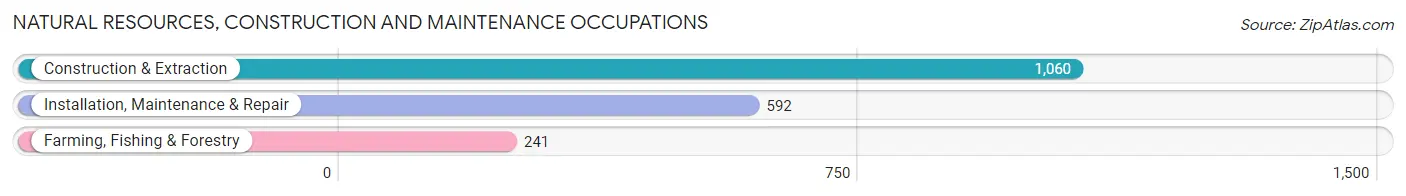
Natural Resources, Construction and Maintenance Occupations
The most common Natural Resources, Construction and Maintenance occupations in Fulton County are Construction & Extraction (1,060 | 7.3%), Installation, Maintenance & Repair (592 | 4.1%), and Farming, Fishing & Forestry (241 | 1.7%).
Natural Resources, Construction and Maintenance Occupations by Sex
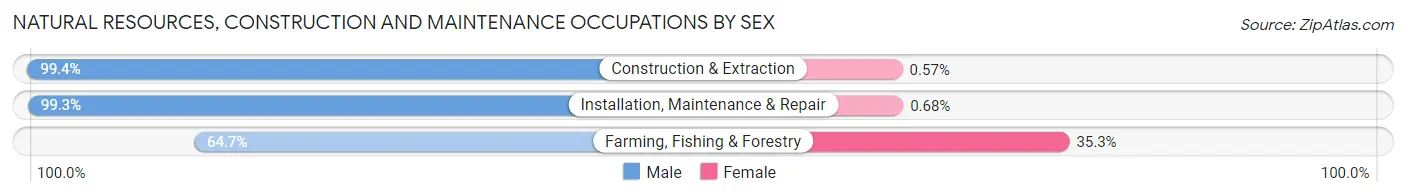
| Occupation | Male | Female |
| Farming, Fishing & Forestry | 156 (64.7%) | 85 (35.3%) |
| Construction & Extraction | 1,054 (99.4%) | 6 (0.6%) |
| Installation, Maintenance & Repair | 588 (99.3%) | 4 (0.7%) |
| Total (Category) | 1,798 (95.0%) | 95 (5.0%) |
| Total (Overall) | 7,424 (51.2%) | 7,072 (48.8%) |
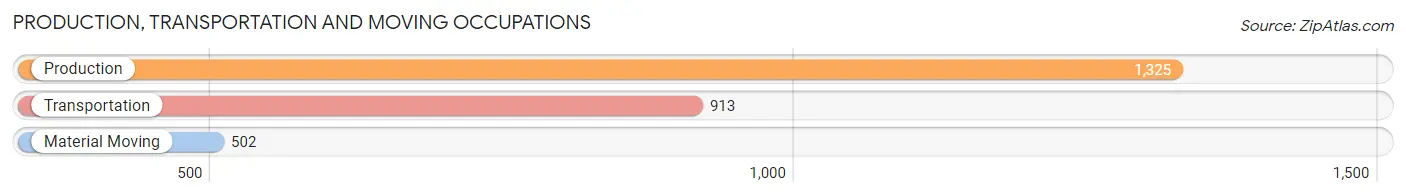
Production, Transportation and Moving Occupations
The most common Production, Transportation and Moving occupations in Fulton County are Production (1,325 | 9.1%), Transportation (913 | 6.3%), and Material Moving (502 | 3.5%).
Production, Transportation and Moving Occupations by Sex
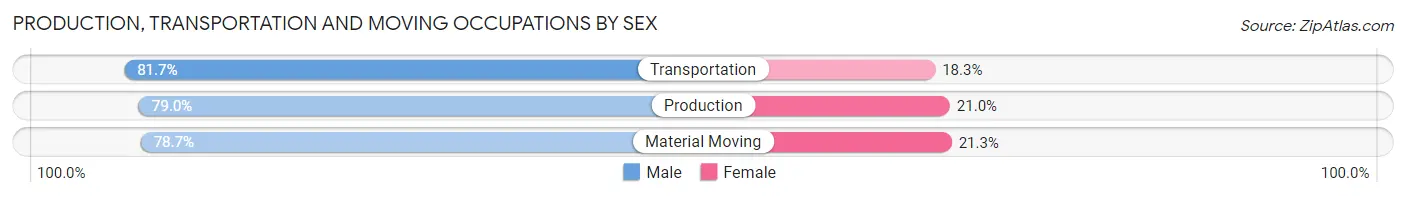
| Occupation | Male | Female |
| Production | 1,047 (79.0%) | 278 (21.0%) |
| Transportation | 746 (81.7%) | 167 (18.3%) |
| Material Moving | 395 (78.7%) | 107 (21.3%) |
| Total (Category) | 2,188 (79.8%) | 552 (20.2%) |
| Total (Overall) | 7,424 (51.2%) | 7,072 (48.8%) |
Employment Industries by Sex in Fulton County
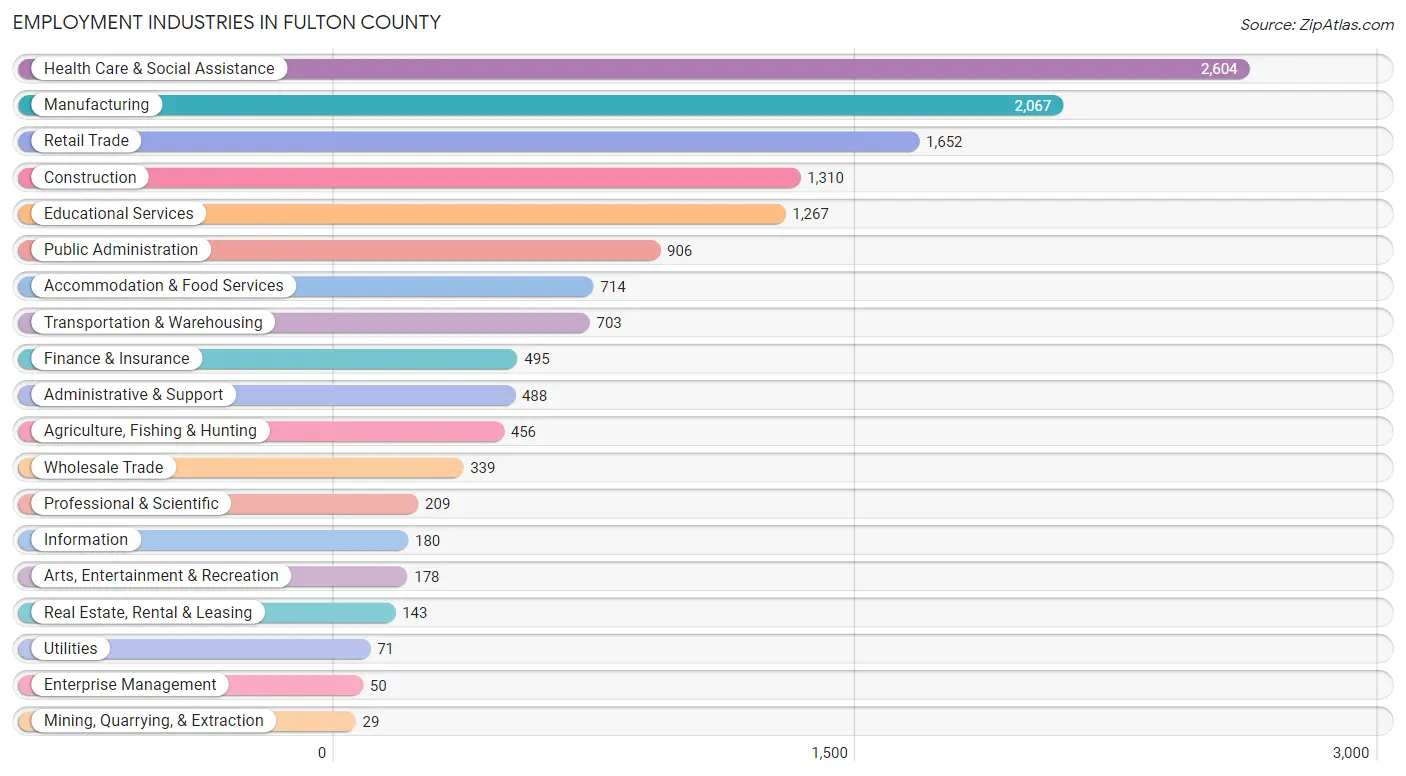
Employment Industries in Fulton County
The major employment industries in Fulton County include Health Care & Social Assistance (2,604 | 18.0%), Manufacturing (2,067 | 14.3%), Retail Trade (1,652 | 11.4%), Construction (1,310 | 9.0%), and Educational Services (1,267 | 8.7%).
Employment Industries by Sex in Fulton County
The Fulton County industries that see more men than women are Mining, Quarrying, & Extraction (100.0%), Construction (95.5%), and Agriculture, Fishing & Hunting (88.4%), whereas the industries that tend to have a higher number of women are Health Care & Social Assistance (82.8%), Finance & Insurance (74.1%), and Educational Services (72.1%).
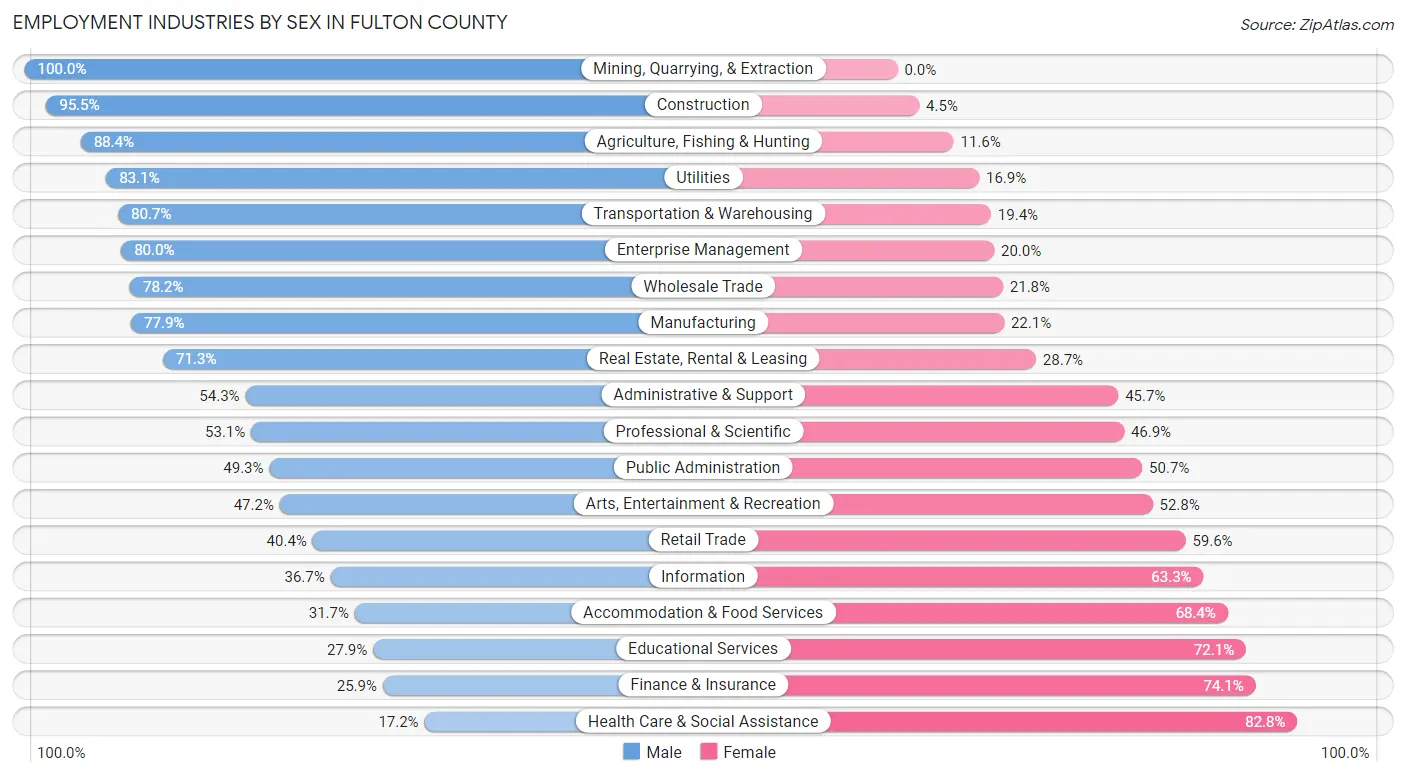
| Industry | Male | Female |
| Agriculture, Fishing & Hunting | 403 (88.4%) | 53 (11.6%) |
| Mining, Quarrying, & Extraction | 29 (100.0%) | 0 (0.0%) |
| Construction | 1,251 (95.5%) | 59 (4.5%) |
| Manufacturing | 1,611 (77.9%) | 456 (22.1%) |
| Wholesale Trade | 265 (78.2%) | 74 (21.8%) |
| Retail Trade | 667 (40.4%) | 985 (59.6%) |
| Transportation & Warehousing | 567 (80.6%) | 136 (19.4%) |
| Utilities | 59 (83.1%) | 12 (16.9%) |
| Information | 66 (36.7%) | 114 (63.3%) |
| Finance & Insurance | 128 (25.9%) | 367 (74.1%) |
| Real Estate, Rental & Leasing | 102 (71.3%) | 41 (28.7%) |
| Professional & Scientific | 111 (53.1%) | 98 (46.9%) |
| Enterprise Management | 40 (80.0%) | 10 (20.0%) |
| Administrative & Support | 265 (54.3%) | 223 (45.7%) |
| Educational Services | 353 (27.9%) | 914 (72.1%) |
| Health Care & Social Assistance | 449 (17.2%) | 2,155 (82.8%) |
| Arts, Entertainment & Recreation | 84 (47.2%) | 94 (52.8%) |
| Accommodation & Food Services | 226 (31.7%) | 488 (68.3%) |
| Public Administration | 447 (49.3%) | 459 (50.7%) |
| Total | 7,424 (51.2%) | 7,072 (48.8%) |
Education in Fulton County
School Enrollment in Fulton County
The most common levels of schooling among the 7,011 students in Fulton County are high school (1,764 | 25.2%), middle school (1,625 | 23.2%), and elementary school (1,407 | 20.1%).
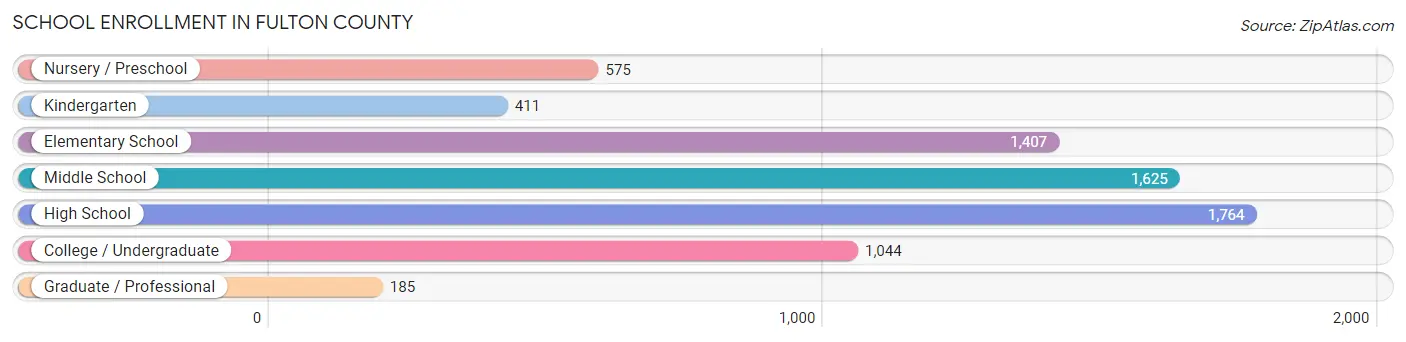
| School Level | # Students | % Students |
| Nursery / Preschool | 575 | 8.2% |
| Kindergarten | 411 | 5.9% |
| Elementary School | 1,407 | 20.1% |
| Middle School | 1,625 | 23.2% |
| High School | 1,764 | 25.2% |
| College / Undergraduate | 1,044 | 14.9% |
| Graduate / Professional | 185 | 2.6% |
| Total | 7,011 | 100.0% |
School Enrollment by Age by Funding Source in Fulton County
Out of a total of 7,011 students who are enrolled in schools in Fulton County, 463 (6.6%) attend a private institution, while the remaining 6,548 (93.4%) are enrolled in public schools. The age group of 20 to 24 year olds has the highest likelihood of being enrolled in private schools, with 83 (20.5% in the age bracket) enrolled. Conversely, the age group of 15 to 17 year olds has the lowest likelihood of being enrolled in a private school, with 1,149 (98.0% in the age bracket) attending a public institution.
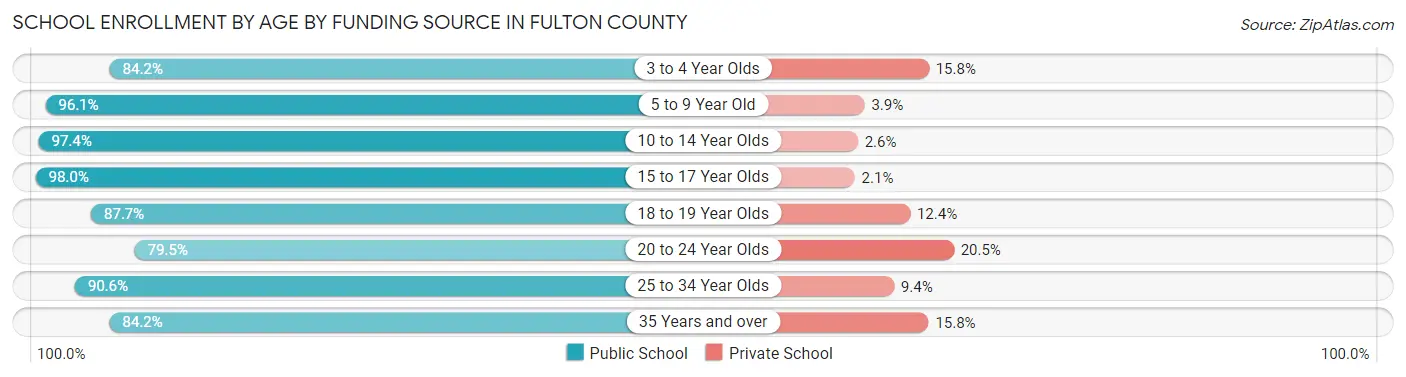
| Age Bracket | Public School | Private School |
| 3 to 4 Year Olds | 441 (84.2%) | 83 (15.8%) |
| 5 to 9 Year Old | 1,563 (96.1%) | 63 (3.9%) |
| 10 to 14 Year Olds | 1,976 (97.4%) | 53 (2.6%) |
| 15 to 17 Year Olds | 1,149 (98.0%) | 24 (2.1%) |
| 18 to 19 Year Olds | 355 (87.6%) | 50 (12.3%) |
| 20 to 24 Year Olds | 322 (79.5%) | 83 (20.5%) |
| 25 to 34 Year Olds | 339 (90.6%) | 35 (9.4%) |
| 35 Years and over | 400 (84.2%) | 75 (15.8%) |
| Total | 6,548 (93.4%) | 463 (6.6%) |
Educational Attainment by Field of Study in Fulton County
Education (1,035 | 22.4%), business (790 | 17.1%), science & technology (632 | 13.7%), arts & humanities (411 | 8.9%), and bio, nature & agricultural (321 | 7.0%) are the most common fields of study among 4,620 individuals in Fulton County who have obtained a bachelor's degree or higher.
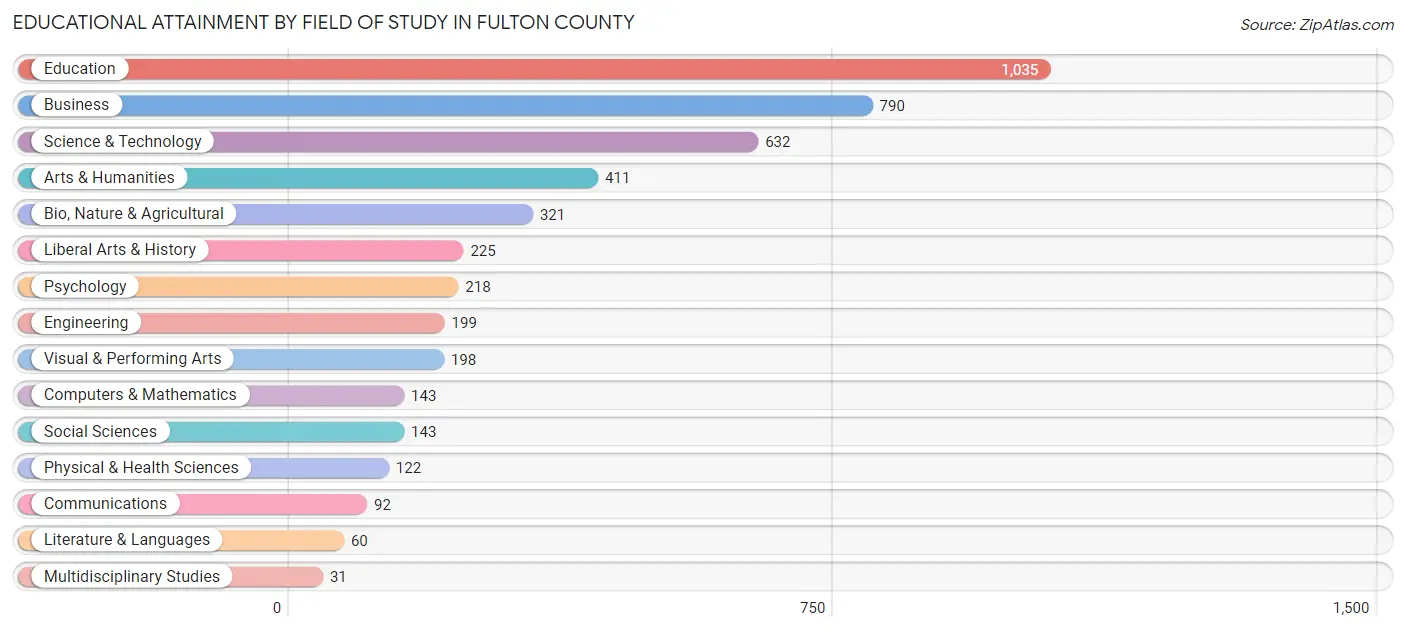
| Field of Study | # Graduates | % Graduates |
| Computers & Mathematics | 143 | 3.1% |
| Bio, Nature & Agricultural | 321 | 7.0% |
| Physical & Health Sciences | 122 | 2.6% |
| Psychology | 218 | 4.7% |
| Social Sciences | 143 | 3.1% |
| Engineering | 199 | 4.3% |
| Multidisciplinary Studies | 31 | 0.7% |
| Science & Technology | 632 | 13.7% |
| Business | 790 | 17.1% |
| Education | 1,035 | 22.4% |
| Literature & Languages | 60 | 1.3% |
| Liberal Arts & History | 225 | 4.9% |
| Visual & Performing Arts | 198 | 4.3% |
| Communications | 92 | 2.0% |
| Arts & Humanities | 411 | 8.9% |
| Total | 4,620 | 100.0% |
Transportation & Commute in Fulton County
Vehicle Availability by Sex in Fulton County
The most prevalent vehicle ownership categories in Fulton County are males with 2 vehicles (3,247, accounting for 44.0%) and females with 2 vehicles (2,801, making up 47.2%).
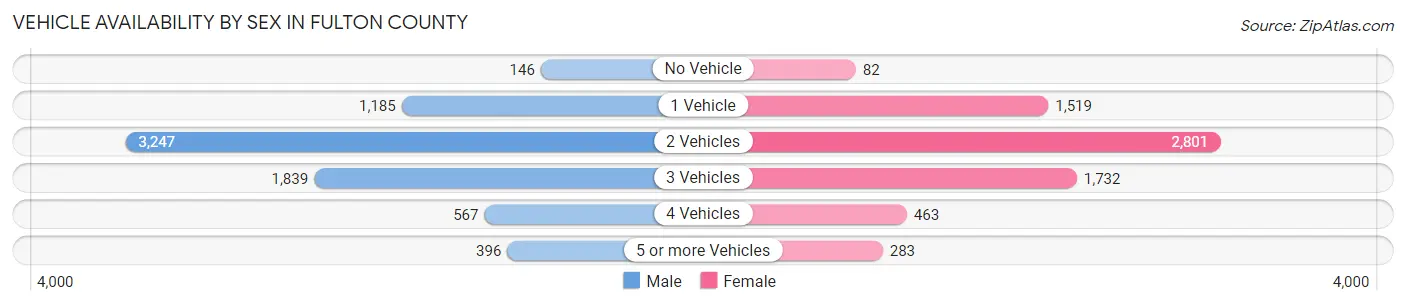
| Vehicles Available | Male | Female |
| No Vehicle | 146 (2.0%) | 82 (1.2%) |
| 1 Vehicle | 1,185 (16.1%) | 1,519 (22.1%) |
| 2 Vehicles | 3,247 (44.0%) | 2,801 (40.7%) |
| 3 Vehicles | 1,839 (24.9%) | 1,732 (25.2%) |
| 4 Vehicles | 567 (7.7%) | 463 (6.7%) |
| 5 or more Vehicles | 396 (5.4%) | 283 (4.1%) |
| Total | 7,380 (100.0%) | 6,880 (100.0%) |
Commute Time in Fulton County
The most frequently occuring commute durations in Fulton County are 5 to 9 minutes (3,030 commuters, 22.1%), 10 to 14 minutes (1,581 commuters, 11.5%), and 45 to 59 minutes (1,544 commuters, 11.3%).
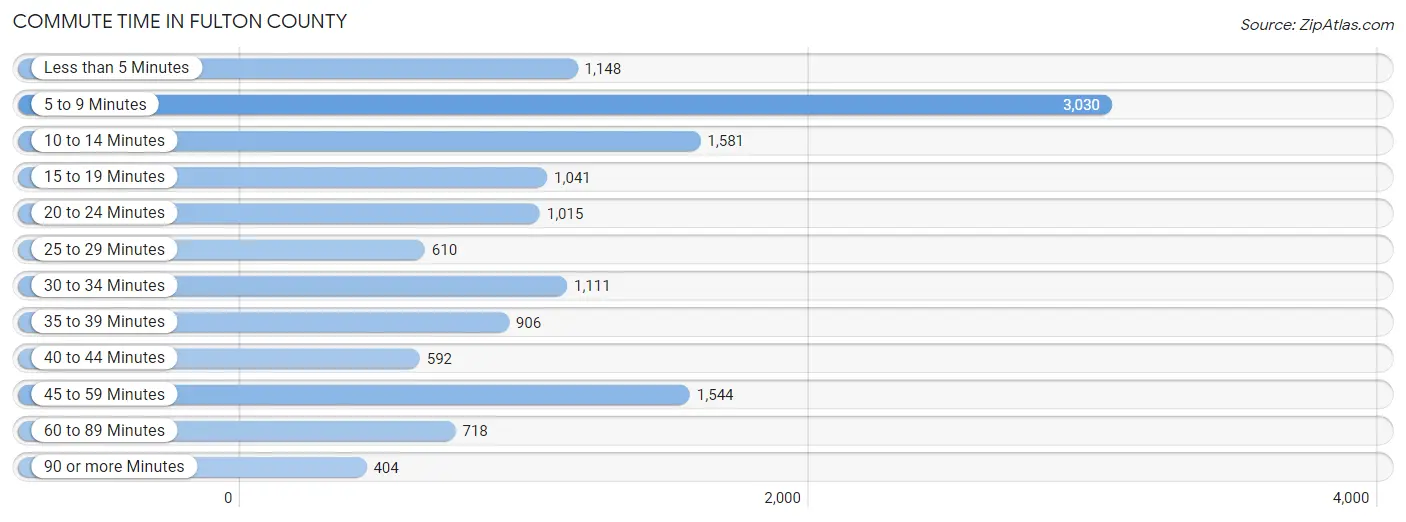
| Commute Time | # Commuters | % Commuters |
| Less than 5 Minutes | 1,148 | 8.4% |
| 5 to 9 Minutes | 3,030 | 22.1% |
| 10 to 14 Minutes | 1,581 | 11.5% |
| 15 to 19 Minutes | 1,041 | 7.6% |
| 20 to 24 Minutes | 1,015 | 7.4% |
| 25 to 29 Minutes | 610 | 4.4% |
| 30 to 34 Minutes | 1,111 | 8.1% |
| 35 to 39 Minutes | 906 | 6.6% |
| 40 to 44 Minutes | 592 | 4.3% |
| 45 to 59 Minutes | 1,544 | 11.3% |
| 60 to 89 Minutes | 718 | 5.2% |
| 90 or more Minutes | 404 | 2.9% |
Commute Time by Sex in Fulton County
The most common commute times in Fulton County are 5 to 9 minutes (1,249 commuters, 17.7%) for males and 5 to 9 minutes (1,781 commuters, 26.9%) for females.
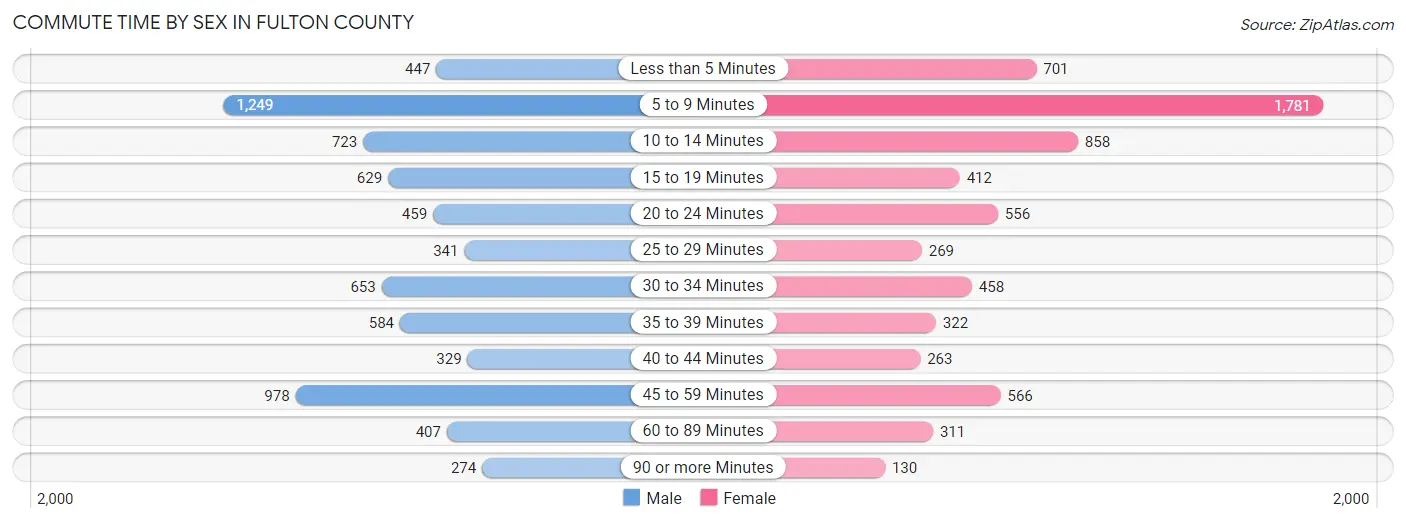
| Commute Time | Male | Female |
| Less than 5 Minutes | 447 (6.3%) | 701 (10.6%) |
| 5 to 9 Minutes | 1,249 (17.7%) | 1,781 (26.9%) |
| 10 to 14 Minutes | 723 (10.2%) | 858 (13.0%) |
| 15 to 19 Minutes | 629 (8.9%) | 412 (6.2%) |
| 20 to 24 Minutes | 459 (6.5%) | 556 (8.4%) |
| 25 to 29 Minutes | 341 (4.8%) | 269 (4.1%) |
| 30 to 34 Minutes | 653 (9.2%) | 458 (6.9%) |
| 35 to 39 Minutes | 584 (8.3%) | 322 (4.9%) |
| 40 to 44 Minutes | 329 (4.6%) | 263 (4.0%) |
| 45 to 59 Minutes | 978 (13.8%) | 566 (8.5%) |
| 60 to 89 Minutes | 407 (5.8%) | 311 (4.7%) |
| 90 or more Minutes | 274 (3.9%) | 130 (2.0%) |
Time of Departure to Work by Sex in Fulton County
The most frequent times of departure to work in Fulton County are 6:00 AM to 6:29 AM (1,180, 16.7%) for males and 7:30 AM to 7:59 AM (1,079, 16.3%) for females.
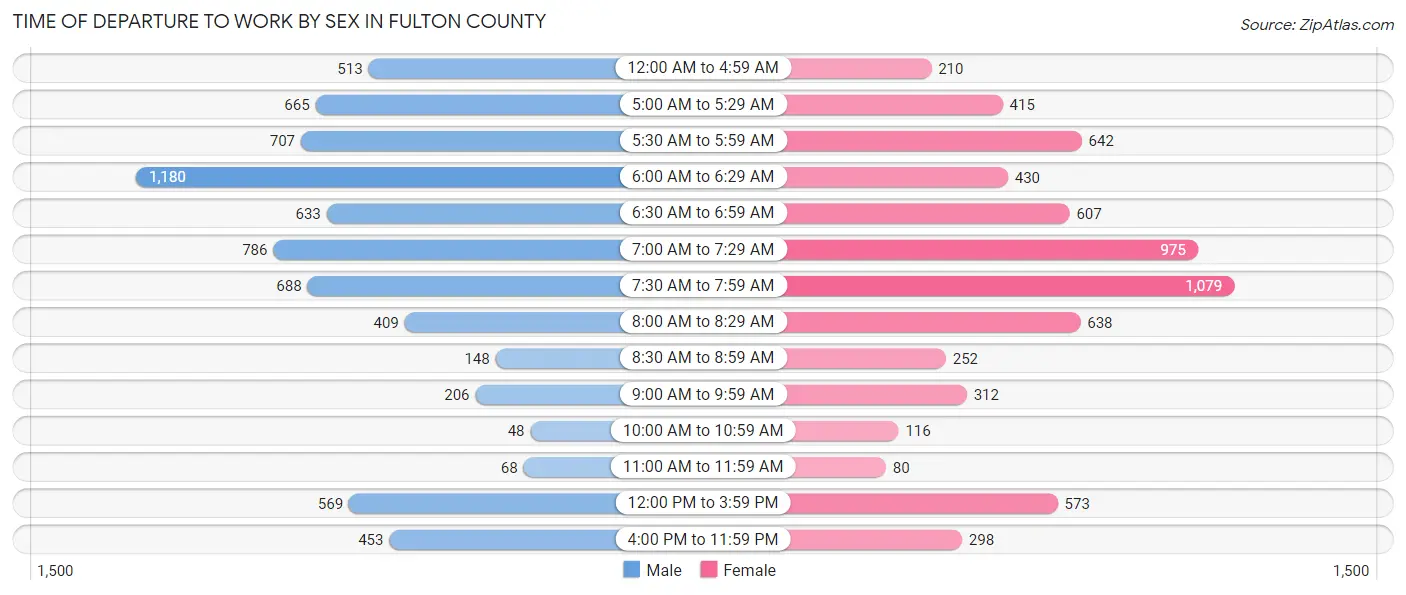
| Time of Departure | Male | Female |
| 12:00 AM to 4:59 AM | 513 (7.2%) | 210 (3.2%) |
| 5:00 AM to 5:29 AM | 665 (9.4%) | 415 (6.3%) |
| 5:30 AM to 5:59 AM | 707 (10.0%) | 642 (9.7%) |
| 6:00 AM to 6:29 AM | 1,180 (16.7%) | 430 (6.5%) |
| 6:30 AM to 6:59 AM | 633 (8.9%) | 607 (9.2%) |
| 7:00 AM to 7:29 AM | 786 (11.1%) | 975 (14.7%) |
| 7:30 AM to 7:59 AM | 688 (9.7%) | 1,079 (16.3%) |
| 8:00 AM to 8:29 AM | 409 (5.8%) | 638 (9.6%) |
| 8:30 AM to 8:59 AM | 148 (2.1%) | 252 (3.8%) |
| 9:00 AM to 9:59 AM | 206 (2.9%) | 312 (4.7%) |
| 10:00 AM to 10:59 AM | 48 (0.7%) | 116 (1.8%) |
| 11:00 AM to 11:59 AM | 68 (1.0%) | 80 (1.2%) |
| 12:00 PM to 3:59 PM | 569 (8.0%) | 573 (8.6%) |
| 4:00 PM to 11:59 PM | 453 (6.4%) | 298 (4.5%) |
| Total | 7,073 (100.0%) | 6,627 (100.0%) |
Housing Occupancy in Fulton County
Occupancy by Ownership in Fulton County
Of the total 13,955 dwellings in Fulton County, owner-occupied units account for 10,862 (77.8%), while renter-occupied units make up 3,093 (22.2%).
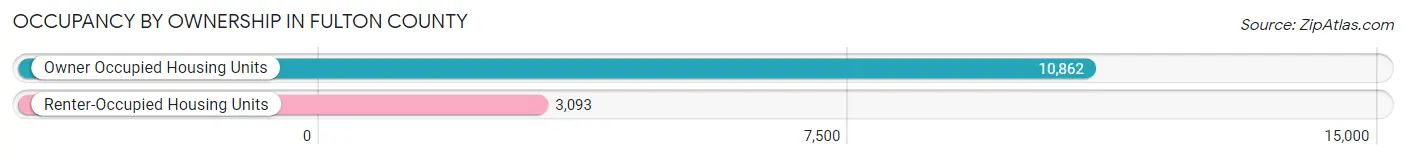
| Occupancy | # Housing Units | % Housing Units |
| Owner Occupied Housing Units | 10,862 | 77.8% |
| Renter-Occupied Housing Units | 3,093 | 22.2% |
| Total Occupied Housing Units | 13,955 | 100.0% |
Occupancy by Household Size in Fulton County
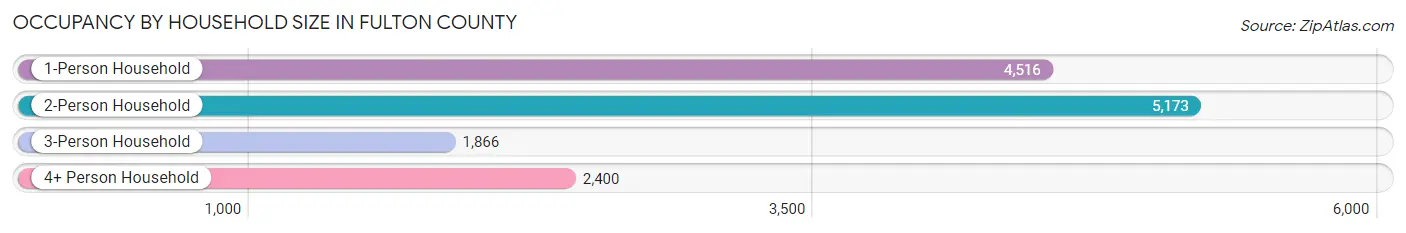
| Household Size | # Housing Units | % Housing Units |
| 1-Person Household | 4,516 | 32.4% |
| 2-Person Household | 5,173 | 37.1% |
| 3-Person Household | 1,866 | 13.4% |
| 4+ Person Household | 2,400 | 17.2% |
| Total Housing Units | 13,955 | 100.0% |
Occupancy by Ownership by Household Size in Fulton County
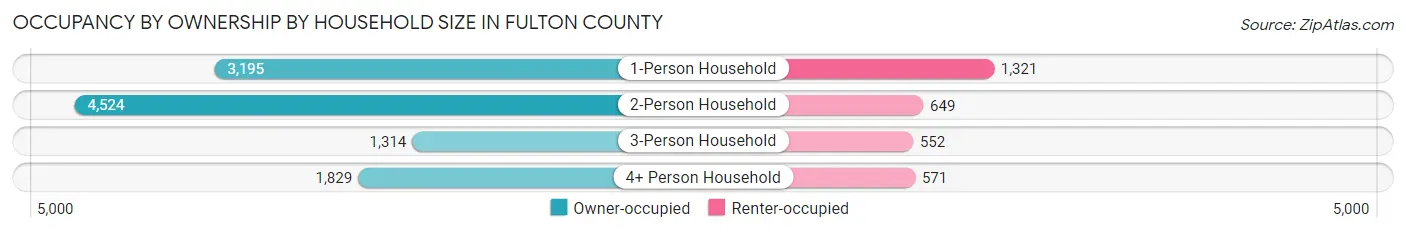
| Household Size | Owner-occupied | Renter-occupied |
| 1-Person Household | 3,195 (70.8%) | 1,321 (29.2%) |
| 2-Person Household | 4,524 (87.5%) | 649 (12.6%) |
| 3-Person Household | 1,314 (70.4%) | 552 (29.6%) |
| 4+ Person Household | 1,829 (76.2%) | 571 (23.8%) |
| Total Housing Units | 10,862 (77.8%) | 3,093 (22.2%) |
Occupancy by Educational Attainment in Fulton County
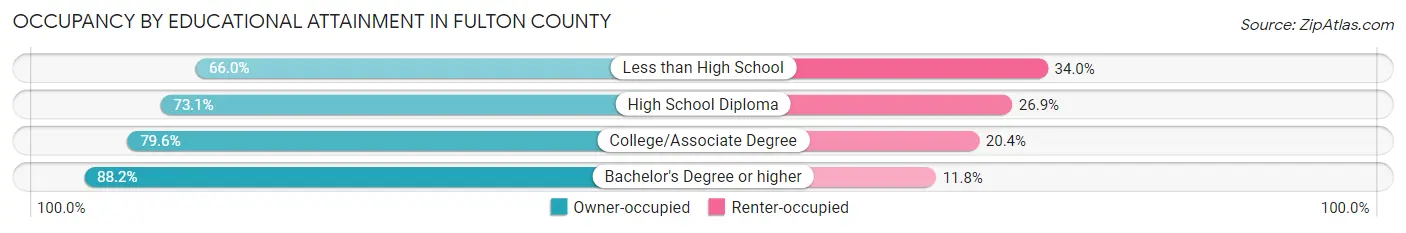
| Household Size | Owner-occupied | Renter-occupied |
| Less than High School | 707 (66.0%) | 364 (34.0%) |
| High School Diploma | 3,811 (73.1%) | 1,403 (26.9%) |
| College/Associate Degree | 3,915 (79.6%) | 1,001 (20.4%) |
| Bachelor's Degree or higher | 2,429 (88.2%) | 325 (11.8%) |
Occupancy by Age of Householder in Fulton County
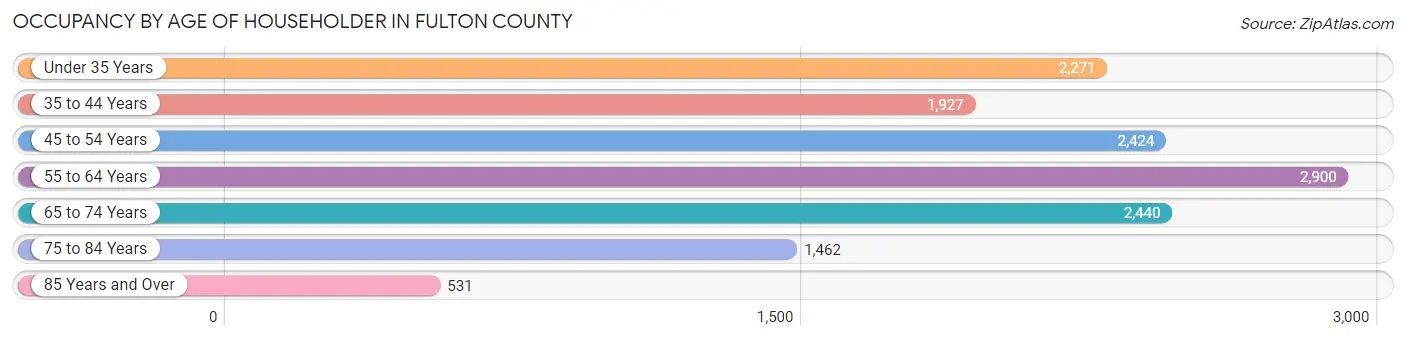
| Age Bracket | # Households | % Households |
| Under 35 Years | 2,271 | 16.3% |
| 35 to 44 Years | 1,927 | 13.8% |
| 45 to 54 Years | 2,424 | 17.4% |
| 55 to 64 Years | 2,900 | 20.8% |
| 65 to 74 Years | 2,440 | 17.5% |
| 75 to 84 Years | 1,462 | 10.5% |
| 85 Years and Over | 531 | 3.8% |
| Total | 13,955 | 100.0% |
Housing Finances in Fulton County
Median Income by Occupancy in Fulton County
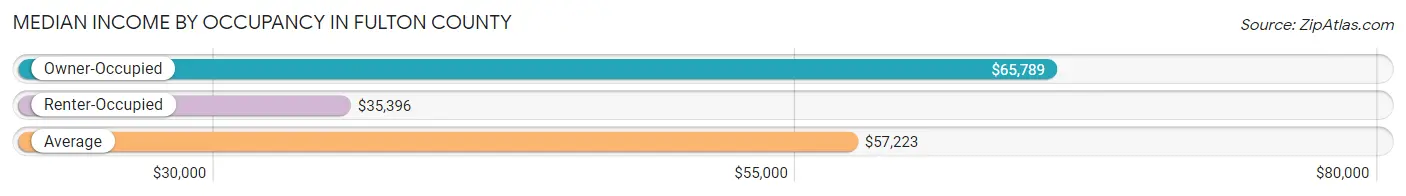
| Occupancy Type | # Households | Median Income |
| Owner-Occupied | 10,862 (77.8%) | $65,789 |
| Renter-Occupied | 3,093 (22.2%) | $35,396 |
| Average | 13,955 (100.0%) | $57,223 |
Occupancy by Householder Income Bracket in Fulton County
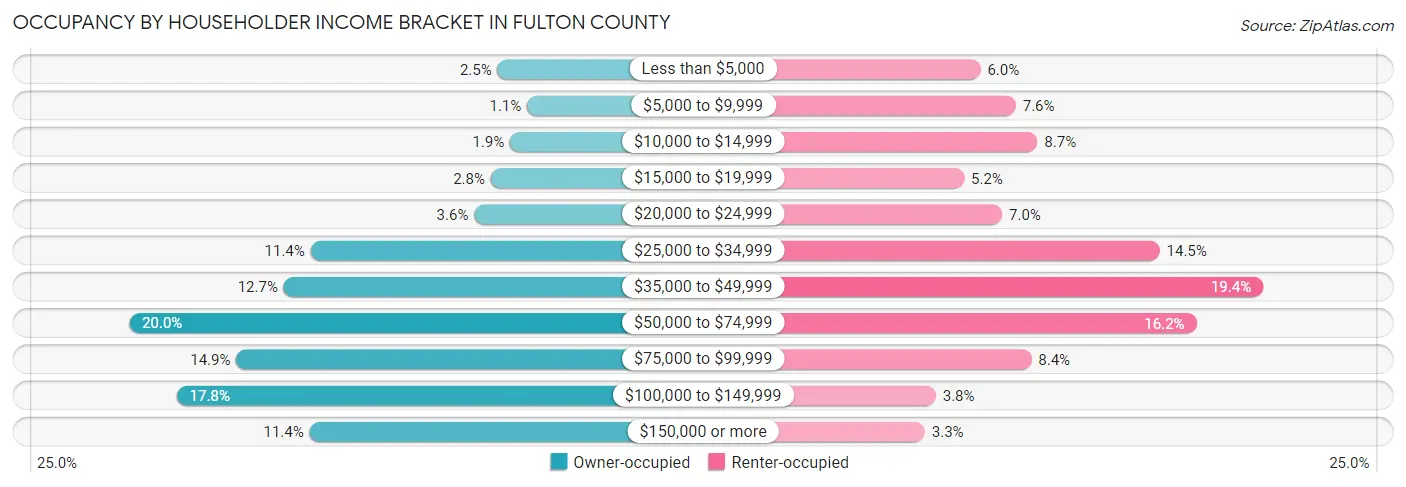
| Income Bracket | Owner-occupied | Renter-occupied |
| Less than $5,000 | 269 (2.5%) | 184 (5.9%) |
| $5,000 to $9,999 | 116 (1.1%) | 236 (7.6%) |
| $10,000 to $14,999 | 204 (1.9%) | 268 (8.7%) |
| $15,000 to $19,999 | 304 (2.8%) | 160 (5.2%) |
| $20,000 to $24,999 | 390 (3.6%) | 216 (7.0%) |
| $25,000 to $34,999 | 1,236 (11.4%) | 448 (14.5%) |
| $35,000 to $49,999 | 1,375 (12.7%) | 600 (19.4%) |
| $50,000 to $74,999 | 2,176 (20.0%) | 502 (16.2%) |
| $75,000 to $99,999 | 1,621 (14.9%) | 259 (8.4%) |
| $100,000 to $149,999 | 1,929 (17.8%) | 118 (3.8%) |
| $150,000 or more | 1,242 (11.4%) | 102 (3.3%) |
| Total | 10,862 (100.0%) | 3,093 (100.0%) |
Monthly Housing Cost Tiers in Fulton County
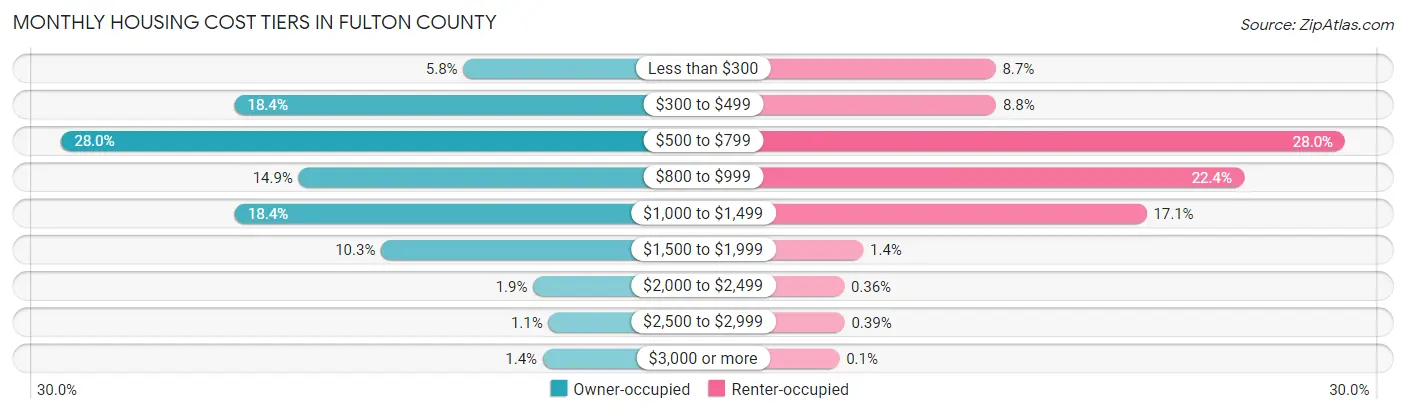
| Monthly Cost | Owner-occupied | Renter-occupied |
| Less than $300 | 626 (5.8%) | 270 (8.7%) |
| $300 to $499 | 1,999 (18.4%) | 271 (8.8%) |
| $500 to $799 | 3,038 (28.0%) | 867 (28.0%) |
| $800 to $999 | 1,614 (14.9%) | 694 (22.4%) |
| $1,000 to $1,499 | 1,996 (18.4%) | 528 (17.1%) |
| $1,500 to $1,999 | 1,119 (10.3%) | 44 (1.4%) |
| $2,000 to $2,499 | 206 (1.9%) | 11 (0.4%) |
| $2,500 to $2,999 | 115 (1.1%) | 12 (0.4%) |
| $3,000 or more | 149 (1.4%) | 3 (0.1%) |
| Total | 10,862 (100.0%) | 3,093 (100.0%) |
Physical Housing Characteristics in Fulton County
Housing Structures in Fulton County
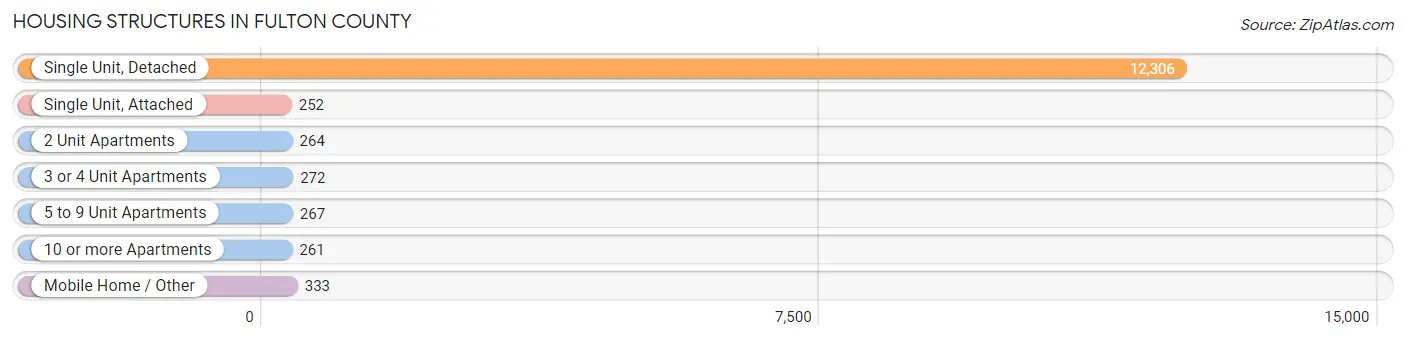
| Structure Type | # Housing Units | % Housing Units |
| Single Unit, Detached | 12,306 | 88.2% |
| Single Unit, Attached | 252 | 1.8% |
| 2 Unit Apartments | 264 | 1.9% |
| 3 or 4 Unit Apartments | 272 | 1.9% |
| 5 to 9 Unit Apartments | 267 | 1.9% |
| 10 or more Apartments | 261 | 1.9% |
| Mobile Home / Other | 333 | 2.4% |
| Total | 13,955 | 100.0% |
Housing Structures by Occupancy in Fulton County
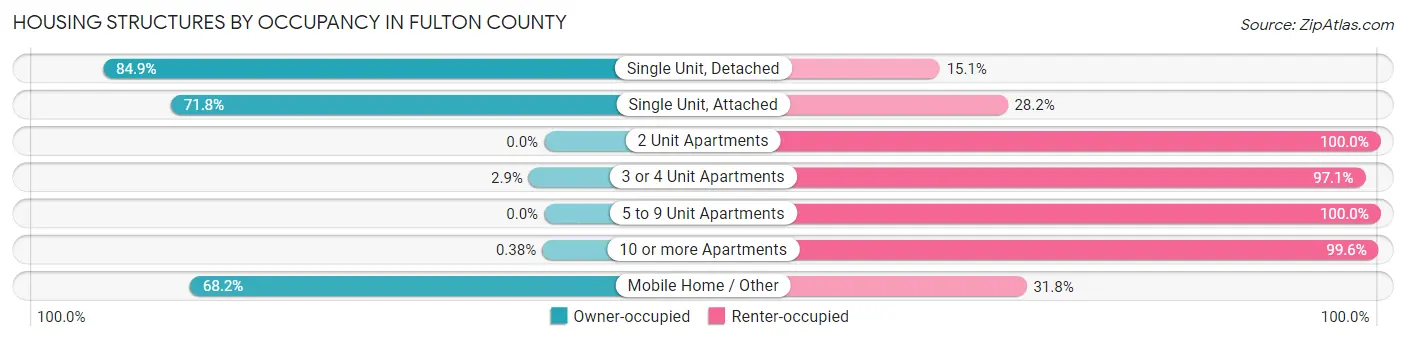
| Structure Type | Owner-occupied | Renter-occupied |
| Single Unit, Detached | 10,445 (84.9%) | 1,861 (15.1%) |
| Single Unit, Attached | 181 (71.8%) | 71 (28.2%) |
| 2 Unit Apartments | 0 (0.0%) | 264 (100.0%) |
| 3 or 4 Unit Apartments | 8 (2.9%) | 264 (97.1%) |
| 5 to 9 Unit Apartments | 0 (0.0%) | 267 (100.0%) |
| 10 or more Apartments | 1 (0.4%) | 260 (99.6%) |
| Mobile Home / Other | 227 (68.2%) | 106 (31.8%) |
| Total | 10,862 (77.8%) | 3,093 (22.2%) |
Housing Structures by Number of Rooms in Fulton County
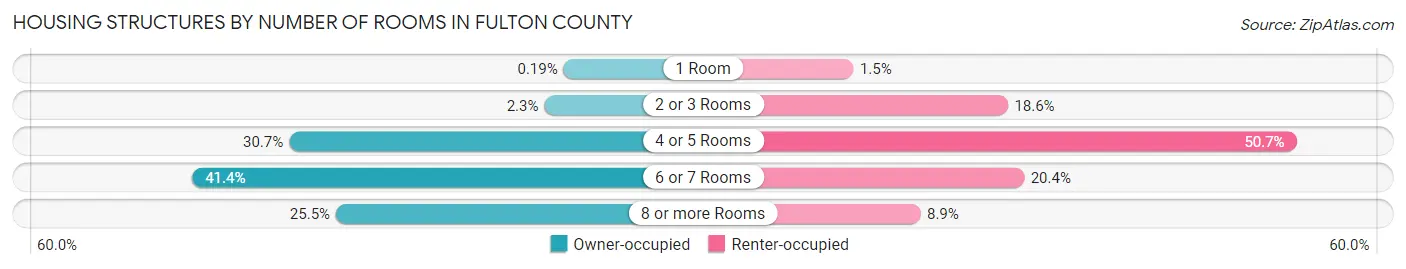
| Number of Rooms | Owner-occupied | Renter-occupied |
| 1 Room | 21 (0.2%) | 45 (1.5%) |
| 2 or 3 Rooms | 252 (2.3%) | 575 (18.6%) |
| 4 or 5 Rooms | 3,329 (30.6%) | 1,567 (50.7%) |
| 6 or 7 Rooms | 4,496 (41.4%) | 631 (20.4%) |
| 8 or more Rooms | 2,764 (25.5%) | 275 (8.9%) |
| Total | 10,862 (100.0%) | 3,093 (100.0%) |
Housing Structure by Heating Type in Fulton County
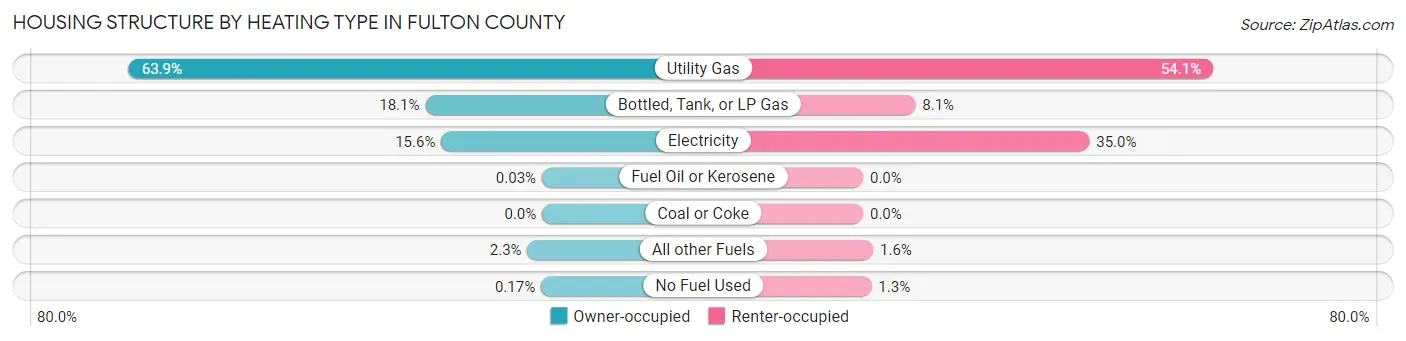
| Heating Type | Owner-occupied | Renter-occupied |
| Utility Gas | 6,940 (63.9%) | 1,673 (54.1%) |
| Bottled, Tank, or LP Gas | 1,961 (18.0%) | 250 (8.1%) |
| Electricity | 1,693 (15.6%) | 1,082 (35.0%) |
| Fuel Oil or Kerosene | 3 (0.0%) | 0 (0.0%) |
| Coal or Coke | 0 (0.0%) | 0 (0.0%) |
| All other Fuels | 247 (2.3%) | 48 (1.5%) |
| No Fuel Used | 18 (0.2%) | 40 (1.3%) |
| Total | 10,862 (100.0%) | 3,093 (100.0%) |
Household Vehicle Usage in Fulton County
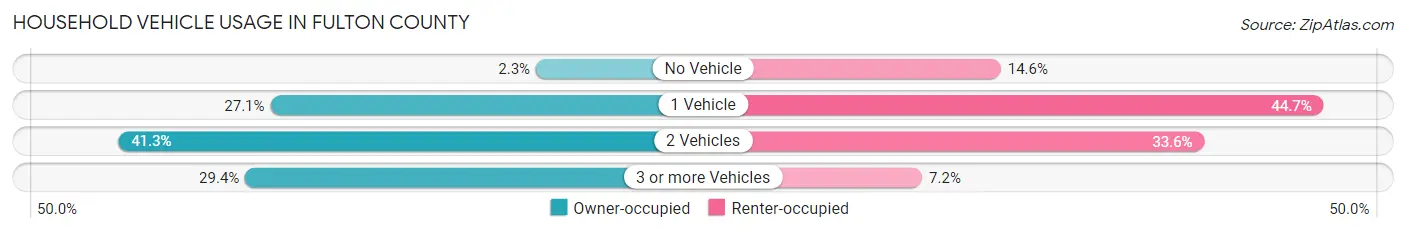
| Vehicles per Household | Owner-occupied | Renter-occupied |
| No Vehicle | 247 (2.3%) | 450 (14.5%) |
| 1 Vehicle | 2,939 (27.1%) | 1,382 (44.7%) |
| 2 Vehicles | 4,482 (41.3%) | 1,038 (33.6%) |
| 3 or more Vehicles | 3,194 (29.4%) | 223 (7.2%) |
| Total | 10,862 (100.0%) | 3,093 (100.0%) |
Real Estate & Mortgages in Fulton County
Real Estate and Mortgage Overview in Fulton County
| Characteristic | Without Mortgage | With Mortgage |
| Housing Units | 5,383 | 5,479 |
| Median Property Value | $97,200 | $104,500 |
| Median Household Income | $51,886 | $822 |
| Monthly Housing Costs | $517 | $149 |
| Real Estate Taxes | $1,917 | $81 |
Property Value by Mortgage Status in Fulton County
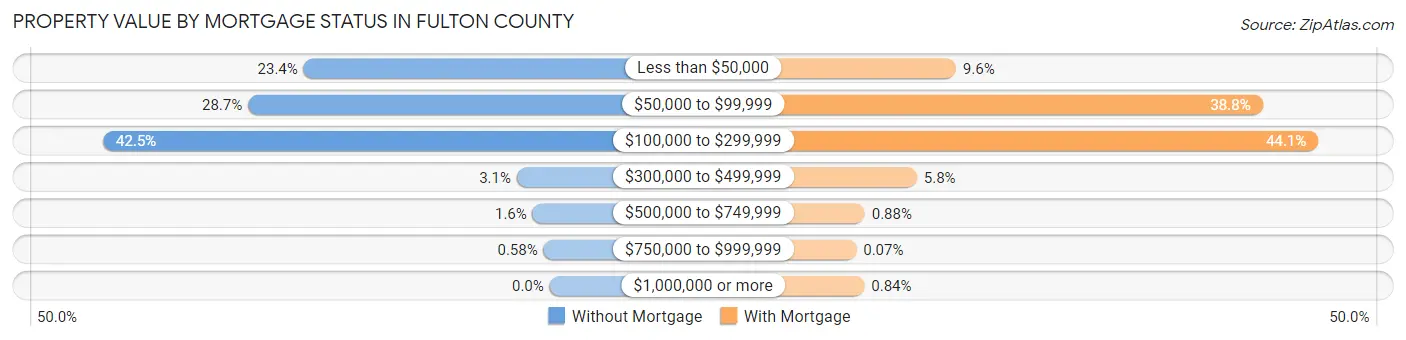
| Property Value | Without Mortgage | With Mortgage |
| Less than $50,000 | 1,261 (23.4%) | 524 (9.6%) |
| $50,000 to $99,999 | 1,546 (28.7%) | 2,123 (38.8%) |
| $100,000 to $299,999 | 2,290 (42.5%) | 2,414 (44.1%) |
| $300,000 to $499,999 | 168 (3.1%) | 320 (5.8%) |
| $500,000 to $749,999 | 87 (1.6%) | 48 (0.9%) |
| $750,000 to $999,999 | 31 (0.6%) | 4 (0.1%) |
| $1,000,000 or more | 0 (0.0%) | 46 (0.8%) |
| Total | 5,383 (100.0%) | 5,479 (100.0%) |
Household Income by Mortgage Status in Fulton County
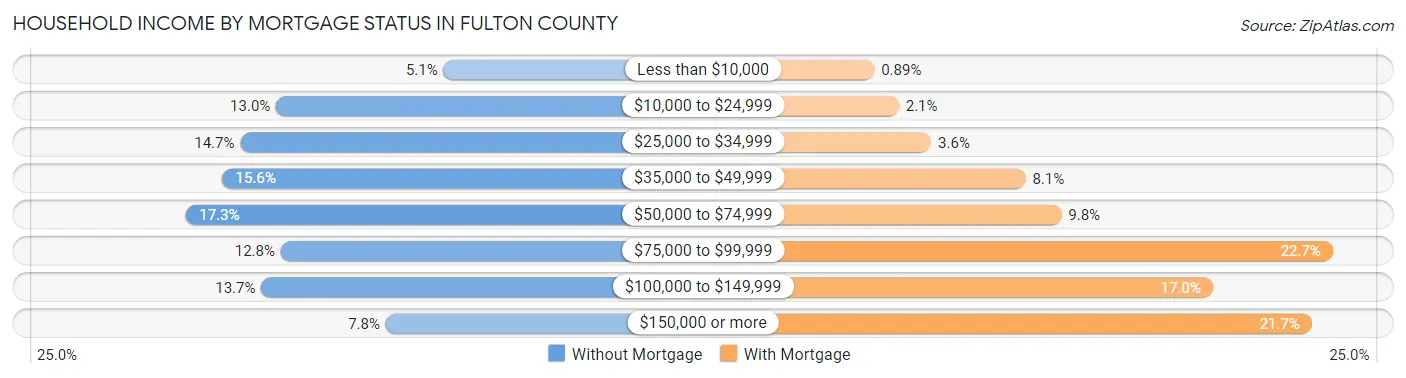
| Household Income | Without Mortgage | With Mortgage |
| Less than $10,000 | 272 (5.1%) | 49 (0.9%) |
| $10,000 to $24,999 | 701 (13.0%) | 113 (2.1%) |
| $25,000 to $34,999 | 793 (14.7%) | 197 (3.6%) |
| $35,000 to $49,999 | 838 (15.6%) | 443 (8.1%) |
| $50,000 to $74,999 | 931 (17.3%) | 537 (9.8%) |
| $75,000 to $99,999 | 689 (12.8%) | 1,245 (22.7%) |
| $100,000 to $149,999 | 739 (13.7%) | 932 (17.0%) |
| $150,000 or more | 420 (7.8%) | 1,190 (21.7%) |
| Total | 5,383 (100.0%) | 5,479 (100.0%) |
Property Value to Household Income Ratio in Fulton County
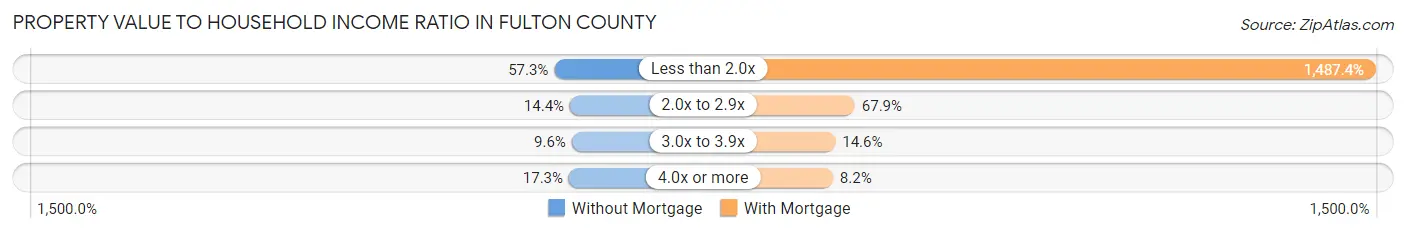
| Value-to-Income Ratio | Without Mortgage | With Mortgage |
| Less than 2.0x | 3,085 (57.3%) | 81,493 (1,487.4%) |
| 2.0x to 2.9x | 777 (14.4%) | 3,720 (67.9%) |
| 3.0x to 3.9x | 517 (9.6%) | 800 (14.6%) |
| 4.0x or more | 931 (17.3%) | 447 (8.2%) |
| Total | 5,383 (100.0%) | 5,479 (100.0%) |
Real Estate Taxes by Mortgage Status in Fulton County
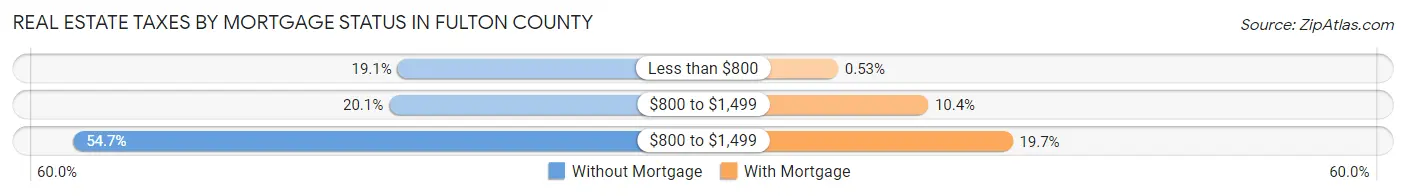
| Property Taxes | Without Mortgage | With Mortgage |
| Less than $800 | 1,030 (19.1%) | 29 (0.5%) |
| $800 to $1,499 | 1,080 (20.1%) | 570 (10.4%) |
| $800 to $1,499 | 2,943 (54.7%) | 1,077 (19.7%) |
| Total | 5,383 (100.0%) | 5,479 (100.0%) |
Health & Disability in Fulton County
Health Insurance Coverage by Age in Fulton County
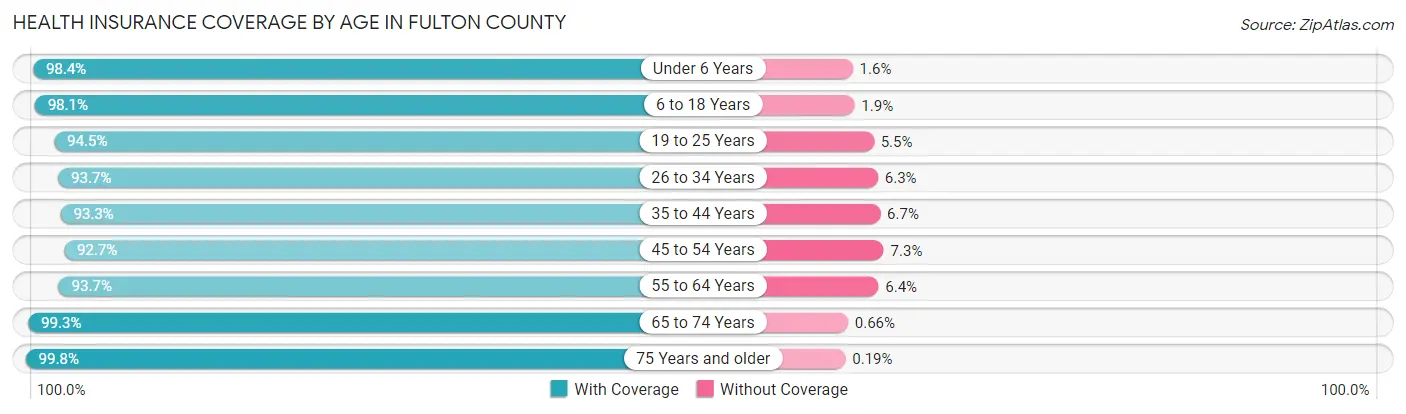
| Age Bracket | With Coverage | Without Coverage |
| Under 6 Years | 1,894 (98.4%) | 30 (1.6%) |
| 6 to 18 Years | 5,098 (98.1%) | 98 (1.9%) |
| 19 to 25 Years | 2,236 (94.5%) | 130 (5.5%) |
| 26 to 34 Years | 2,859 (93.7%) | 191 (6.3%) |
| 35 to 44 Years | 3,499 (93.3%) | 251 (6.7%) |
| 45 to 54 Years | 3,787 (92.7%) | 300 (7.3%) |
| 55 to 64 Years | 4,367 (93.6%) | 296 (6.4%) |
| 65 to 74 Years | 3,934 (99.3%) | 26 (0.7%) |
| 75 Years and older | 2,664 (99.8%) | 5 (0.2%) |
| Total | 30,338 (95.8%) | 1,327 (4.2%) |
Health Insurance Coverage by Citizenship Status in Fulton County
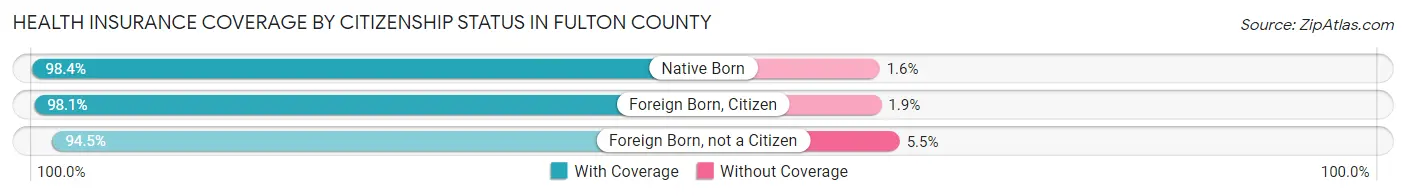
| Citizenship Status | With Coverage | Without Coverage |
| Native Born | 1,894 (98.4%) | 30 (1.6%) |
| Foreign Born, Citizen | 5,098 (98.1%) | 98 (1.9%) |
| Foreign Born, not a Citizen | 2,236 (94.5%) | 130 (5.5%) |
Health Insurance Coverage by Household Income in Fulton County
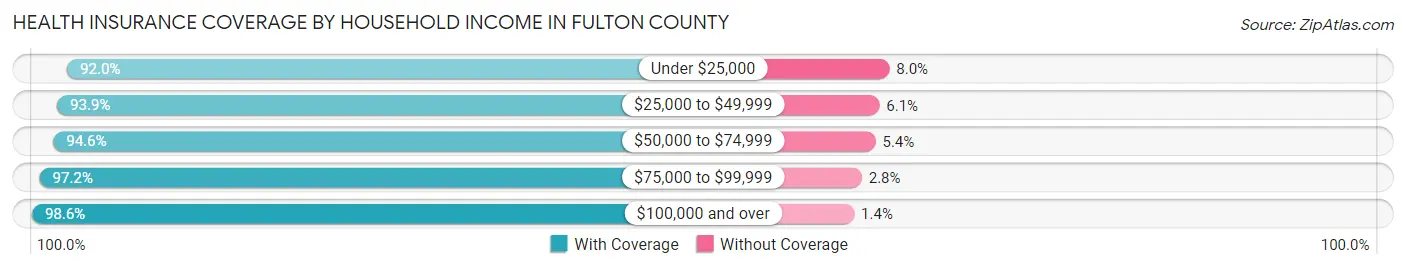
| Household Income | With Coverage | Without Coverage |
| Under $25,000 | 3,227 (92.0%) | 280 (8.0%) |
| $25,000 to $49,999 | 6,880 (93.9%) | 447 (6.1%) |
| $50,000 to $74,999 | 5,749 (94.6%) | 327 (5.4%) |
| $75,000 to $99,999 | 4,730 (97.2%) | 137 (2.8%) |
| $100,000 and over | 9,732 (98.6%) | 136 (1.4%) |
Public vs Private Health Insurance Coverage by Age in Fulton County
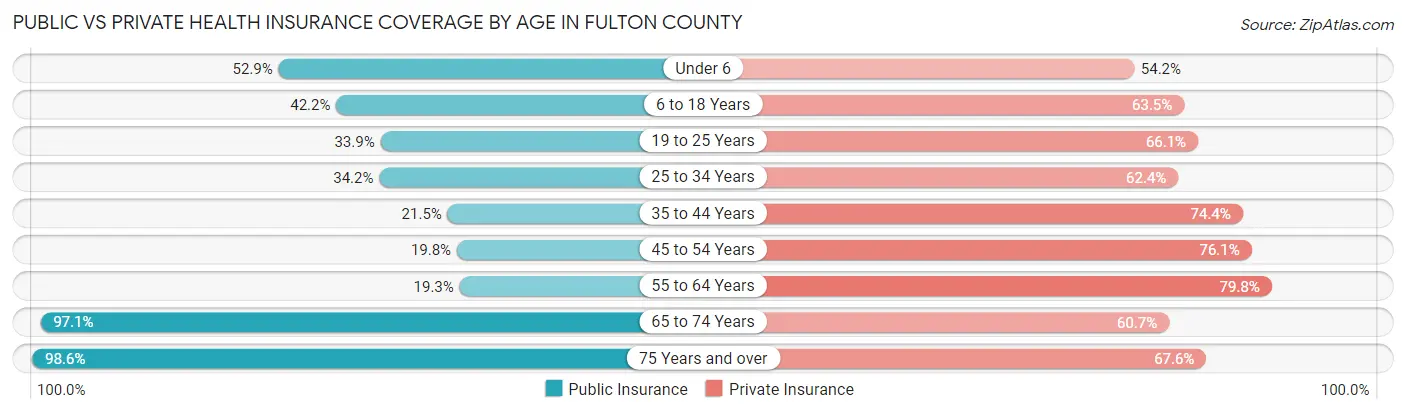
| Age Bracket | Public Insurance | Private Insurance |
| Under 6 | 1,017 (52.9%) | 1,043 (54.2%) |
| 6 to 18 Years | 2,190 (42.1%) | 3,301 (63.5%) |
| 19 to 25 Years | 803 (33.9%) | 1,564 (66.1%) |
| 25 to 34 Years | 1,042 (34.2%) | 1,904 (62.4%) |
| 35 to 44 Years | 805 (21.5%) | 2,790 (74.4%) |
| 45 to 54 Years | 807 (19.8%) | 3,108 (76.0%) |
| 55 to 64 Years | 898 (19.3%) | 3,720 (79.8%) |
| 65 to 74 Years | 3,845 (97.1%) | 2,405 (60.7%) |
| 75 Years and over | 2,632 (98.6%) | 1,805 (67.6%) |
| Total | 14,039 (44.3%) | 21,640 (68.3%) |
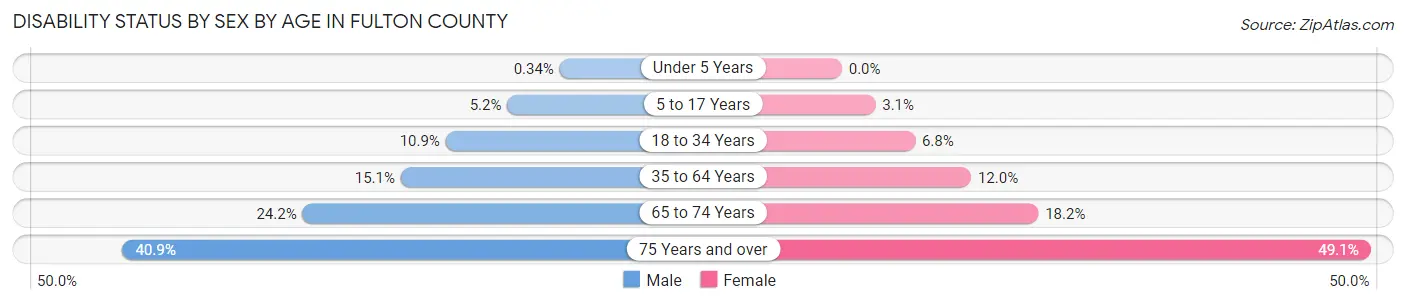
Disability Status by Sex by Age in Fulton County
| Age Bracket | Male | Female |
| Under 5 Years | 3 (0.3%) | 0 (0.0%) |
| 5 to 17 Years | 131 (5.2%) | 77 (3.1%) |
| 18 to 34 Years | 329 (10.9%) | 192 (6.8%) |
| 35 to 64 Years | 950 (15.1%) | 744 (12.0%) |
| 65 to 74 Years | 458 (24.2%) | 377 (18.2%) |
| 75 Years and over | 479 (40.9%) | 735 (49.1%) |
Disability Class by Sex by Age in Fulton County
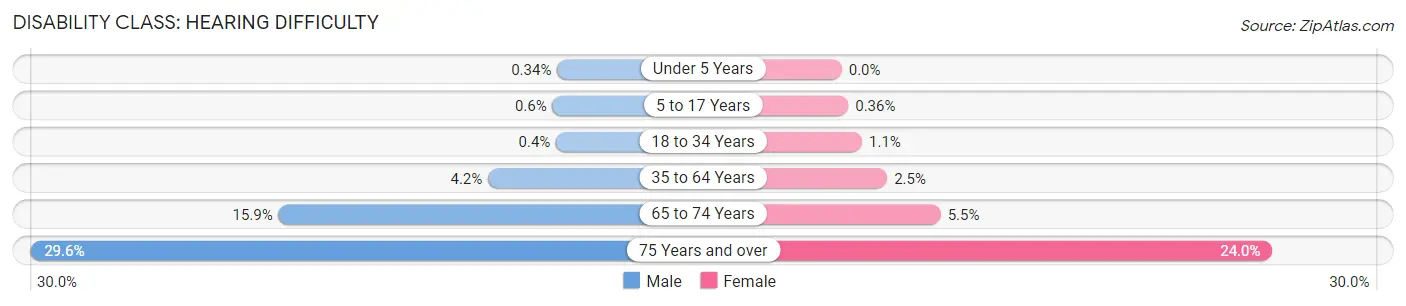
Disability Class: Hearing Difficulty
| Age Bracket | Male | Female |
| Under 5 Years | 3 (0.3%) | 0 (0.0%) |
| 5 to 17 Years | 15 (0.6%) | 9 (0.4%) |
| 18 to 34 Years | 12 (0.4%) | 32 (1.1%) |
| 35 to 64 Years | 264 (4.2%) | 157 (2.5%) |
| 65 to 74 Years | 300 (15.9%) | 114 (5.5%) |
| 75 Years and over | 347 (29.6%) | 359 (24.0%) |
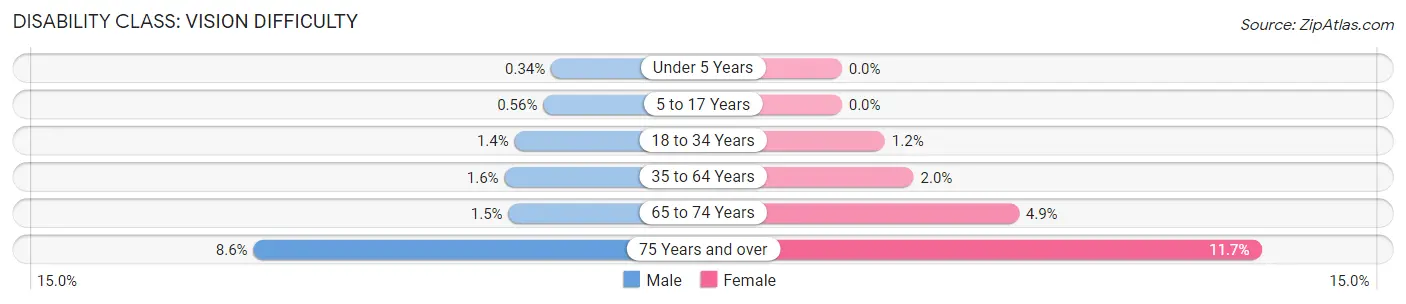
Disability Class: Vision Difficulty
| Age Bracket | Male | Female |
| Under 5 Years | 3 (0.3%) | 0 (0.0%) |
| 5 to 17 Years | 14 (0.6%) | 0 (0.0%) |
| 18 to 34 Years | 41 (1.4%) | 34 (1.2%) |
| 35 to 64 Years | 103 (1.6%) | 124 (2.0%) |
| 65 to 74 Years | 29 (1.5%) | 102 (4.9%) |
| 75 Years and over | 101 (8.6%) | 175 (11.7%) |
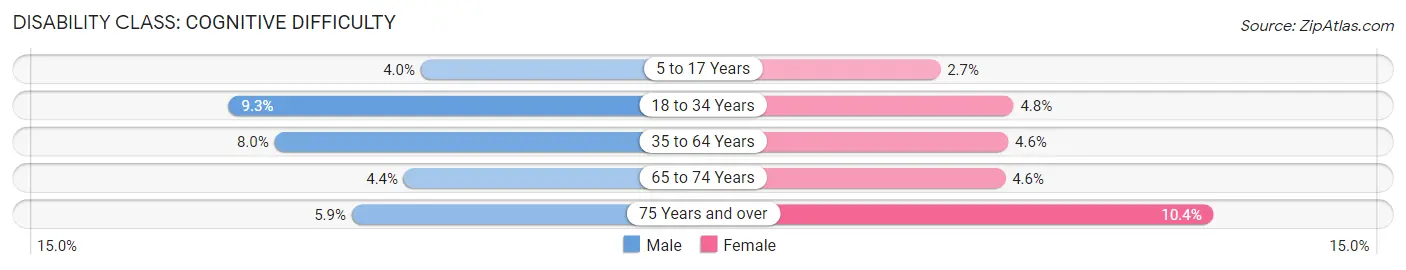
Disability Class: Cognitive Difficulty
| Age Bracket | Male | Female |
| 5 to 17 Years | 100 (4.0%) | 68 (2.7%) |
| 18 to 34 Years | 281 (9.3%) | 135 (4.8%) |
| 35 to 64 Years | 506 (8.0%) | 287 (4.6%) |
| 65 to 74 Years | 84 (4.4%) | 94 (4.5%) |
| 75 Years and over | 69 (5.9%) | 155 (10.3%) |
Disability Class: Ambulatory Difficulty
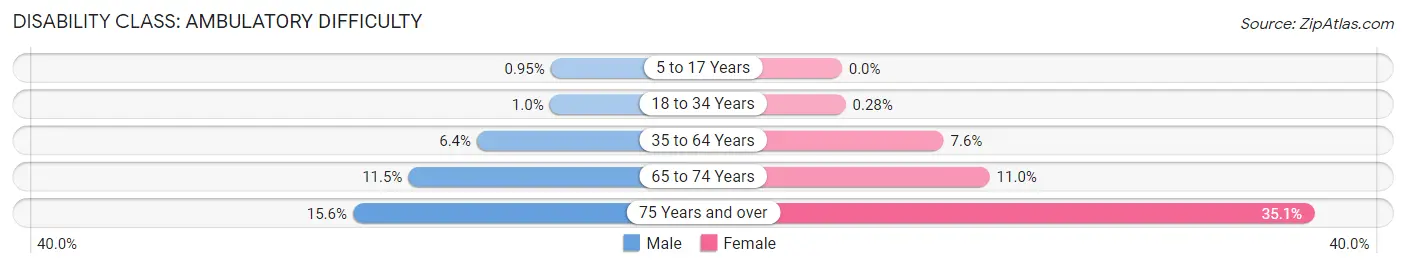
| Age Bracket | Male | Female |
| 5 to 17 Years | 24 (0.9%) | 0 (0.0%) |
| 18 to 34 Years | 31 (1.0%) | 8 (0.3%) |
| 35 to 64 Years | 404 (6.4%) | 469 (7.6%) |
| 65 to 74 Years | 218 (11.5%) | 227 (11.0%) |
| 75 Years and over | 183 (15.6%) | 525 (35.0%) |
Disability Class: Self-Care Difficulty
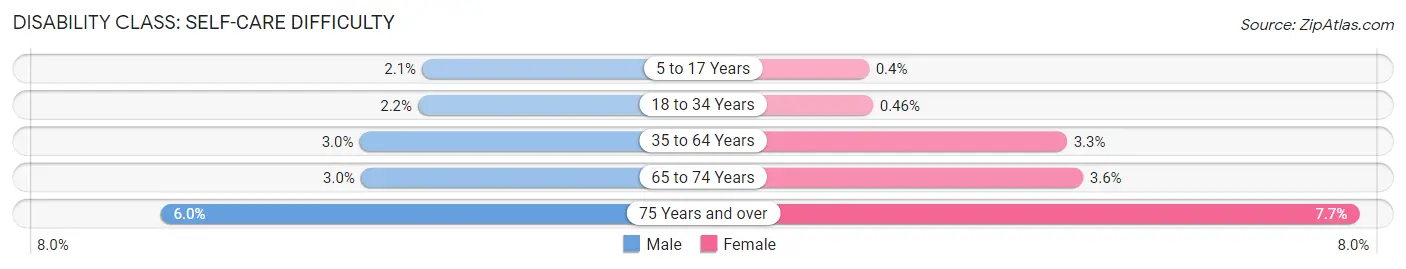
| Age Bracket | Male | Female |
| 5 to 17 Years | 53 (2.1%) | 10 (0.4%) |
| 18 to 34 Years | 65 (2.2%) | 13 (0.5%) |
| 35 to 64 Years | 191 (3.0%) | 207 (3.3%) |
| 65 to 74 Years | 57 (3.0%) | 74 (3.6%) |
| 75 Years and over | 70 (6.0%) | 115 (7.7%) |
Technology Access in Fulton County
Computing Device Access in Fulton County
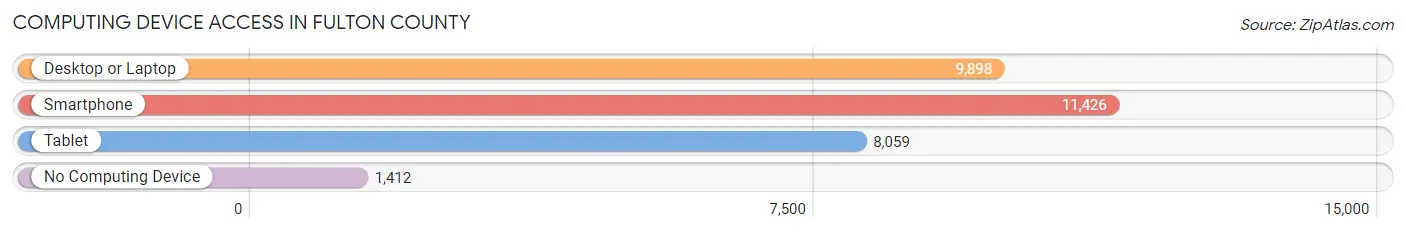
| Device Type | # Households | % Households |
| Desktop or Laptop | 9,898 | 70.9% |
| Smartphone | 11,426 | 81.9% |
| Tablet | 8,059 | 57.8% |
| No Computing Device | 1,412 | 10.1% |
| Total | 13,955 | 100.0% |
Internet Access in Fulton County
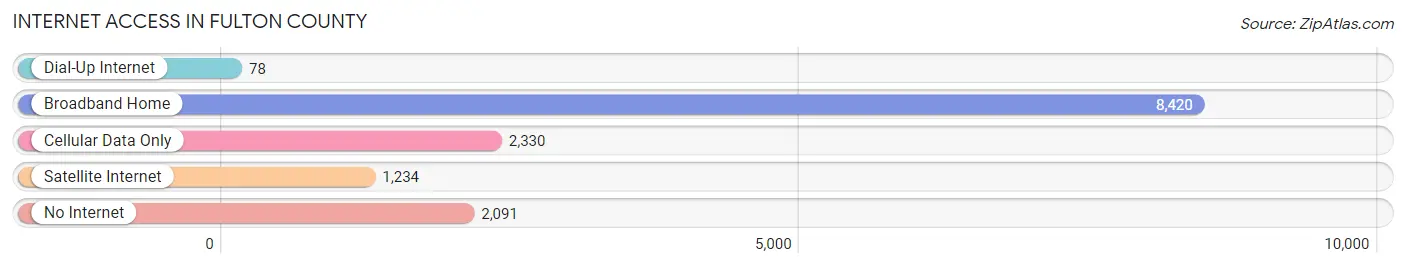
| Internet Type | # Households | % Households |
| Dial-Up Internet | 78 | 0.6% |
| Broadband Home | 8,420 | 60.3% |
| Cellular Data Only | 2,330 | 16.7% |
| Satellite Internet | 1,234 | 8.8% |
| No Internet | 2,091 | 15.0% |
| Total | 13,955 | 100.0% |
Fulton County Summary
Fulton County, Illinois is located in the western part of the state, and is bordered by the Illinois River to the west and the Mississippi River to the east. It is part of the Peoria, IL Metropolitan Statistical Area. The county seat is Lewistown. As of the 2010 census, the population was 37,069.
History
Fulton County was formed in 1823 from Pike County. It was named after Robert Fulton, the inventor of the steamboat. The first settlers in the area were French fur traders, who established trading posts along the Illinois and Mississippi Rivers. The first permanent settlers were mostly of English and German descent.
The county was an agricultural area, with corn, wheat, oats, and hay being the main crops. The county also had a thriving lumber industry, with sawmills located along the Illinois and Mississippi Rivers.
Geography
Fulton County is located in the western part of the state, and is bordered by the Illinois River to the west and the Mississippi River to the east. It is part of the Peoria, IL Metropolitan Statistical Area. The county has a total area of 576 square miles, of which 573 square miles is land and 3 square miles (0.5%) is water.
The terrain of Fulton County is mostly flat, with some rolling hills in the northern part of the county. The highest point in the county is located in the northwest corner, at an elevation of 830 feet.
Economy
Fulton County has a diverse economy, with agriculture, manufacturing, and tourism being the main industries. The county is home to several large companies, including Caterpillar, Inc., and the John Deere Company.
Agriculture is the main industry in the county, with corn, soybeans, wheat, and hay being the main crops. Livestock production is also important, with beef cattle, dairy cattle, and hogs being the main animals raised.
Manufacturing is also an important part of the economy, with Caterpillar, Inc., and the John Deere Company being the two largest employers in the county. Other major employers include the Fulton County Medical Center, the Fulton County Courthouse, and the Fulton County Jail.
Tourism is also an important part of the economy, with the county being home to several state parks, including the Emiquon National Wildlife Refuge, the White Pigeon State Park, and the Spoon River State Park.
Demographics
As of the 2010 census, there were 37,069 people, 14,845 households, and 10,072 families residing in the county. The population density was 64.3 people per square mile. There were 16,845 housing units at an average density of 29.3 per square mile. The racial makeup of the county was 97.2% White, 0.7% African American, 0.2% Native American, 0.3% Asian, 0.1% Pacific Islander, 0.6% from other races, and 0.9% from two or more races. Hispanic or Latino of any race were 1.7% of the population.
There were 14,845 households, out of which 30.2% had children under the age of 18 living with them, 54.2% were married couples living together, 10.2% had a female householder with no husband present, and 30.7% were non-families. 25.7% of all households were made up of individuals, and 11.3% had someone living alone who was 65 years of age or older. The average household size was 2.48 and the average family size was 2.97.
In the county, the population was spread out, with 24.7% under the age of 18, 7.7% from 18 to 24, 25.7% from 25 to 44, 25.2% from 45 to 64, and 16.7% who were 65 years of age or older. The median age was 39 years. For every 100 females, there were 97.2 males. For every 100 females age 18 and over, there were 94.2 males.
The median income for a household in the county was $41,945, and the median income for a family was $50,845. Males had a median income of $37,945 versus $25,845 for females. The per capita income for the county was $20,945. About 8.2% of families and 11.2% of the population were below the poverty line, including 15.2% of those under age 18 and 8.2% of those age 65 or over.
Common Questions
What is Per Capita Income in Fulton County?
Per Capita income in Fulton County is $32,378.
What is the Median Family Income in Fulton County?
Median Family Income in Fulton County is $73,125.
What is the Median Household income in Fulton County?
Median Household Income in Fulton County is $57,223.
What is Income or Wage Gap in Fulton County?
Income or Wage Gap in Fulton County is 24.7%.
Women in Fulton County earn 75.3 cents for every dollar earned by a man.
What is Family Income Deficit in Fulton County?
Family Income Deficit in Fulton County is $11,267.
Families that are below poverty line in Fulton County earn $11,267 less on average than the poverty threshold level.
What is Inequality or Gini Index in Fulton County?
Inequality or Gini Index in Fulton County is 0.44.
What is the Total Population of Fulton County?
Total Population of Fulton County is 33,691.
What is the Total Male Population of Fulton County?
Total Male Population of Fulton County is 17,528.
What is the Total Female Population of Fulton County?
Total Female Population of Fulton County is 16,163.
What is the Ratio of Males per 100 Females in Fulton County?
There are 108.45 Males per 100 Females in Fulton County.
What is the Ratio of Females per 100 Males in Fulton County?
There are 92.21 Females per 100 Males in Fulton County.
What is the Median Population Age in Fulton County?
Median Population Age in Fulton County is 43.6 Years.
What is the Average Family Size in Fulton County
Average Family Size in Fulton County is 2.8 People.
What is the Average Household Size in Fulton County
Average Household Size in Fulton County is 2.3 People.
How Large is the Labor Force in Fulton County?
There are 15,576 People in the Labor Forcein in Fulton County.
What is the Percentage of People in the Labor Force in Fulton County?
56.0% of People are in the Labor Force in Fulton County.
What is the Unemployment Rate in Fulton County?
Unemployment Rate in Fulton County is 6.8%.