Franklin County, IL Map & Demographics
Franklin County Map
Franklin County Overview
$28,310
PER CAPITA INCOME
$63,869
AVG FAMILY INCOME
$51,031
AVG HOUSEHOLD INCOME
38.6%
WAGE / INCOME GAP [ % ]
61.4¢/ $1
WAGE / INCOME GAP [ $ ]
$9,934
FAMILY INCOME DEFICIT
0.45
INEQUALITY / GINI INDEX
37,810
TOTAL POPULATION
18,902
MALE POPULATION
18,908
FEMALE POPULATION
99.97
MALES / 100 FEMALES
100.03
FEMALES / 100 MALES
43.2
MEDIAN AGE
2.9
AVG FAMILY SIZE
2.3
AVG HOUSEHOLD SIZE
17,013
LABOR FORCE [ PEOPLE ]
55.9%
PERCENT IN LABOR FORCE
6.7%
UNEMPLOYMENT RATE
Franklin County Area Codes
Income in Franklin County
Income Overview in Franklin County
Per Capita Income in Franklin County is $28,310, while median incomes of families and households are $63,869 and $51,031 respectively.
| Characteristic | Number | Measure |
| Per Capita Income | 37,810 | $28,310 |
| Median Family Income | 9,983 | $63,869 |
| Mean Family Income | 9,983 | $80,570 |
| Median Household Income | 16,095 | $51,031 |
| Mean Household Income | 16,095 | $66,309 |
| Income Deficit | 9,983 | $9,934 |
| Wage / Income Gap (%) | 37,810 | 38.65% |
| Wage / Income Gap ($) | 37,810 | 61.35¢ per $1 |
| Gini / Inequality Index | 37,810 | 0.45 |
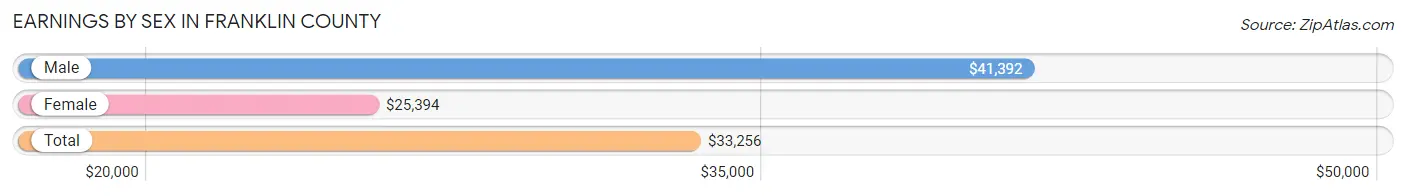
Earnings by Sex in Franklin County
Average Earnings in Franklin County are $33,256, $41,392 for men and $25,394 for women, a difference of 38.7%.
| Sex | Number | Average Earnings |
| Male | 9,342 (52.5%) | $41,392 |
| Female | 8,464 (47.5%) | $25,394 |
| Total | 17,806 (100.0%) | $33,256 |
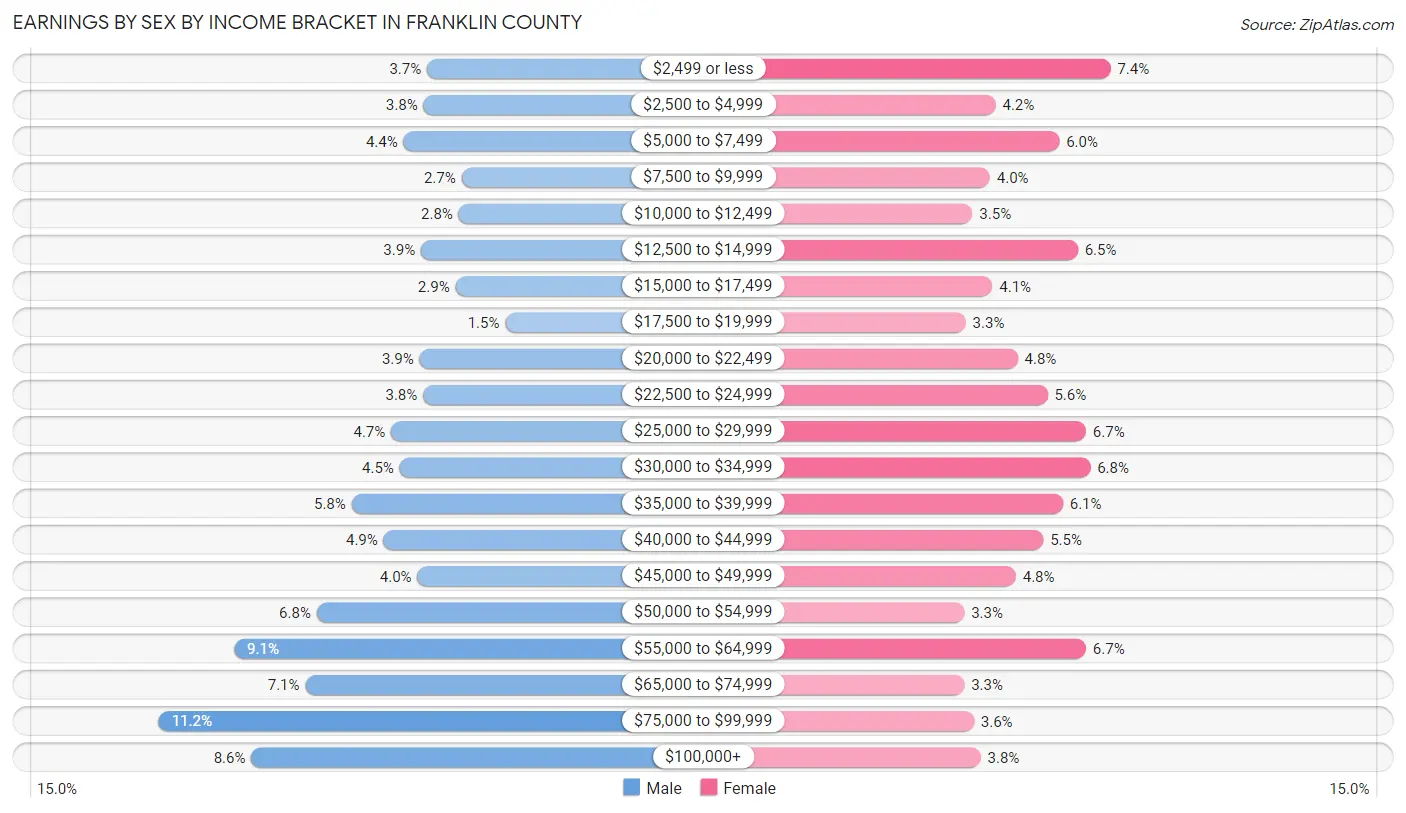
Earnings by Sex by Income Bracket in Franklin County
The most common earnings brackets in Franklin County are $75,000 to $99,999 for men (1,049 | 11.2%) and $2,499 or less for women (627 | 7.4%).
| Income | Male | Female |
| $2,499 or less | 345 (3.7%) | 627 (7.4%) |
| $2,500 to $4,999 | 354 (3.8%) | 354 (4.2%) |
| $5,000 to $7,499 | 406 (4.3%) | 505 (6.0%) |
| $7,500 to $9,999 | 254 (2.7%) | 340 (4.0%) |
| $10,000 to $12,499 | 262 (2.8%) | 299 (3.5%) |
| $12,500 to $14,999 | 361 (3.9%) | 549 (6.5%) |
| $15,000 to $17,499 | 270 (2.9%) | 346 (4.1%) |
| $17,500 to $19,999 | 139 (1.5%) | 283 (3.3%) |
| $20,000 to $22,499 | 364 (3.9%) | 406 (4.8%) |
| $22,500 to $24,999 | 355 (3.8%) | 477 (5.6%) |
| $25,000 to $29,999 | 439 (4.7%) | 569 (6.7%) |
| $30,000 to $34,999 | 417 (4.5%) | 579 (6.8%) |
| $35,000 to $39,999 | 543 (5.8%) | 514 (6.1%) |
| $40,000 to $44,999 | 459 (4.9%) | 467 (5.5%) |
| $45,000 to $49,999 | 370 (4.0%) | 402 (4.8%) |
| $50,000 to $54,999 | 634 (6.8%) | 279 (3.3%) |
| $55,000 to $64,999 | 851 (9.1%) | 569 (6.7%) |
| $65,000 to $74,999 | 664 (7.1%) | 279 (3.3%) |
| $75,000 to $99,999 | 1,049 (11.2%) | 302 (3.6%) |
| $100,000+ | 806 (8.6%) | 318 (3.8%) |
| Total | 9,342 (100.0%) | 8,464 (100.0%) |
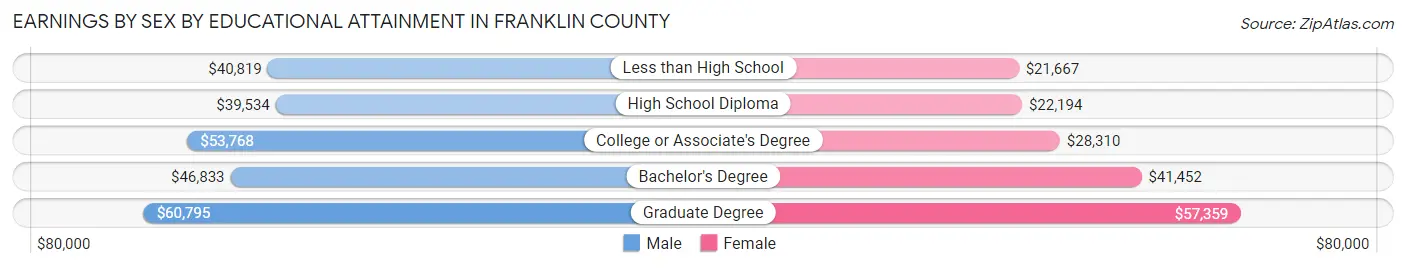
Earnings by Sex by Educational Attainment in Franklin County
Average earnings in Franklin County are $47,123 for men and $29,824 for women, a difference of 36.7%. Men with an educational attainment of graduate degree enjoy the highest average annual earnings of $60,795, while those with high school diploma education earn the least with $39,534. Women with an educational attainment of graduate degree earn the most with the average annual earnings of $57,359, while those with less than high school education have the smallest earnings of $21,667.
| Educational Attainment | Male Income | Female Income |
| Less than High School | $40,819 | $21,667 |
| High School Diploma | $39,534 | $22,194 |
| College or Associate's Degree | $53,768 | $28,310 |
| Bachelor's Degree | $46,833 | $41,452 |
| Graduate Degree | $60,795 | $57,359 |
| Total | $47,123 | $29,824 |
Family Income in Franklin County
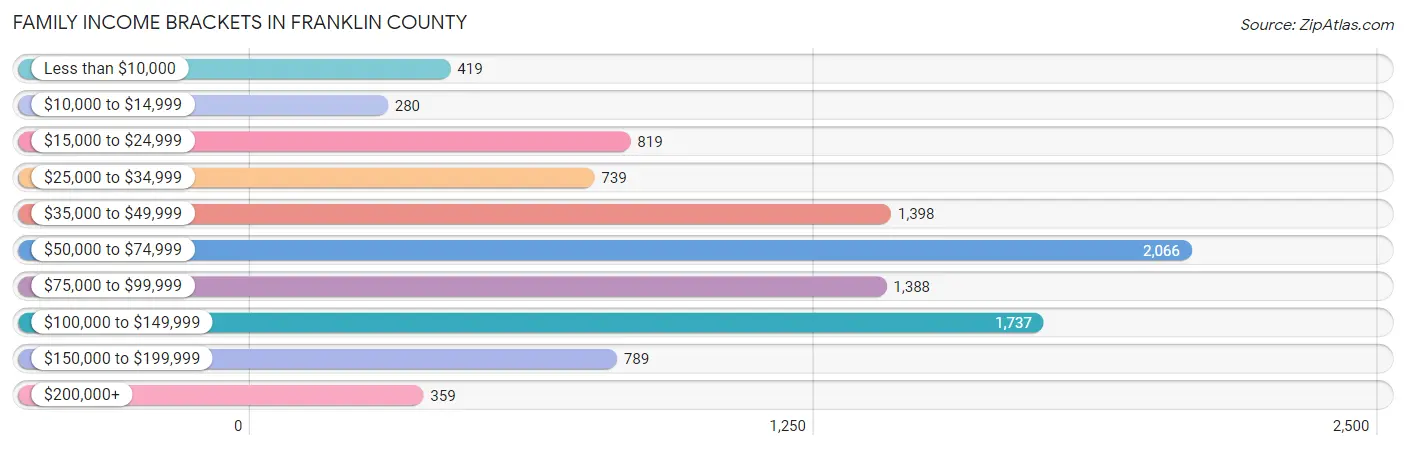
Family Income Brackets in Franklin County
According to the Franklin County family income data, there are 2,066 families falling into the $50,000 to $74,999 income range, which is the most common income bracket and makes up 20.7% of all families. Conversely, the $10,000 to $14,999 income bracket is the least frequent group with only 280 families (2.8%) belonging to this category.
| Income Bracket | # Families | % Families |
| Less than $10,000 | 419 | 4.2% |
| $10,000 to $14,999 | 280 | 2.8% |
| $15,000 to $24,999 | 819 | 8.2% |
| $25,000 to $34,999 | 739 | 7.4% |
| $35,000 to $49,999 | 1,398 | 14.0% |
| $50,000 to $74,999 | 2,066 | 20.7% |
| $75,000 to $99,999 | 1,388 | 13.9% |
| $100,000 to $149,999 | 1,737 | 17.4% |
| $150,000 to $199,999 | 789 | 7.9% |
| $200,000+ | 359 | 3.6% |
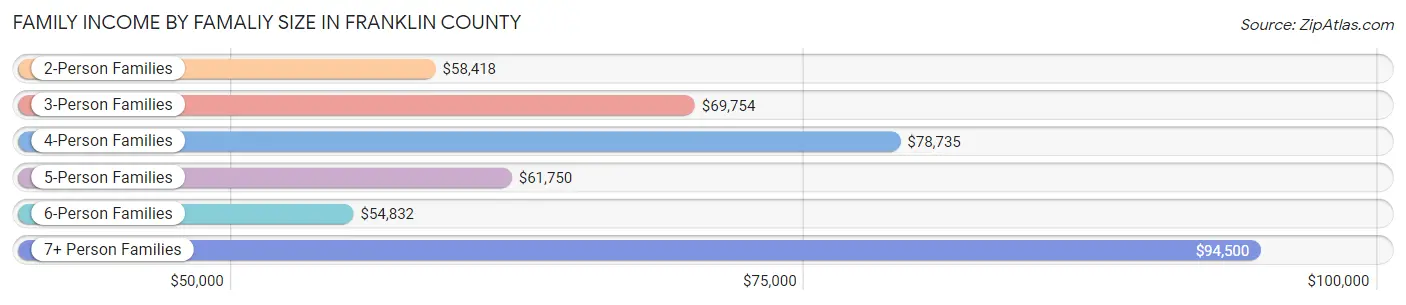
Family Income by Famaliy Size in Franklin County
7+ person families (82 | 0.8%) account for the highest median family income in Franklin County with $94,500 per family, while 2-person families (5,068 | 50.8%) have the highest median income of $29,209 per family member.
| Income Bracket | # Families | Median Income |
| 2-Person Families | 5,068 (50.8%) | $58,418 |
| 3-Person Families | 2,327 (23.3%) | $69,754 |
| 4-Person Families | 1,490 (14.9%) | $78,735 |
| 5-Person Families | 679 (6.8%) | $61,750 |
| 6-Person Families | 337 (3.4%) | $54,832 |
| 7+ Person Families | 82 (0.8%) | $94,500 |
| Total | 9,983 (100.0%) | $63,869 |
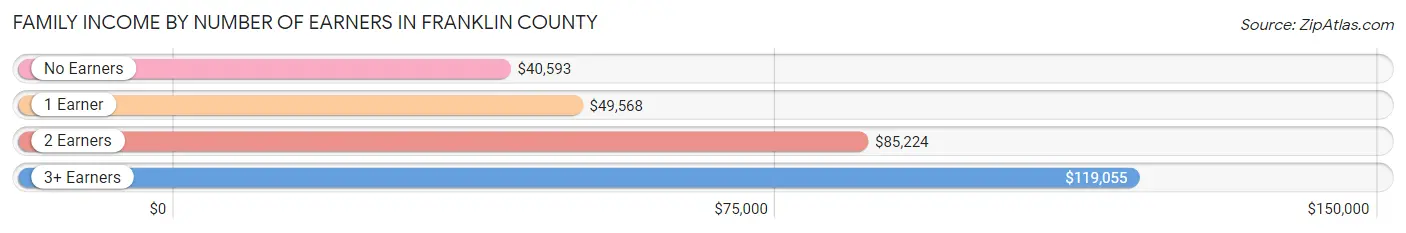
Family Income by Number of Earners in Franklin County
The median family income in Franklin County is $63,869, with families comprising 3+ earners (1,091) having the highest median family income of $119,055, while families with no earners (1,882) have the lowest median family income of $40,593, accounting for 10.9% and 18.9% of families, respectively.
| Number of Earners | # Families | Median Income |
| No Earners | 1,882 (18.9%) | $40,593 |
| 1 Earner | 3,569 (35.7%) | $49,568 |
| 2 Earners | 3,441 (34.5%) | $85,224 |
| 3+ Earners | 1,091 (10.9%) | $119,055 |
| Total | 9,983 (100.0%) | $63,869 |
Household Income in Franklin County
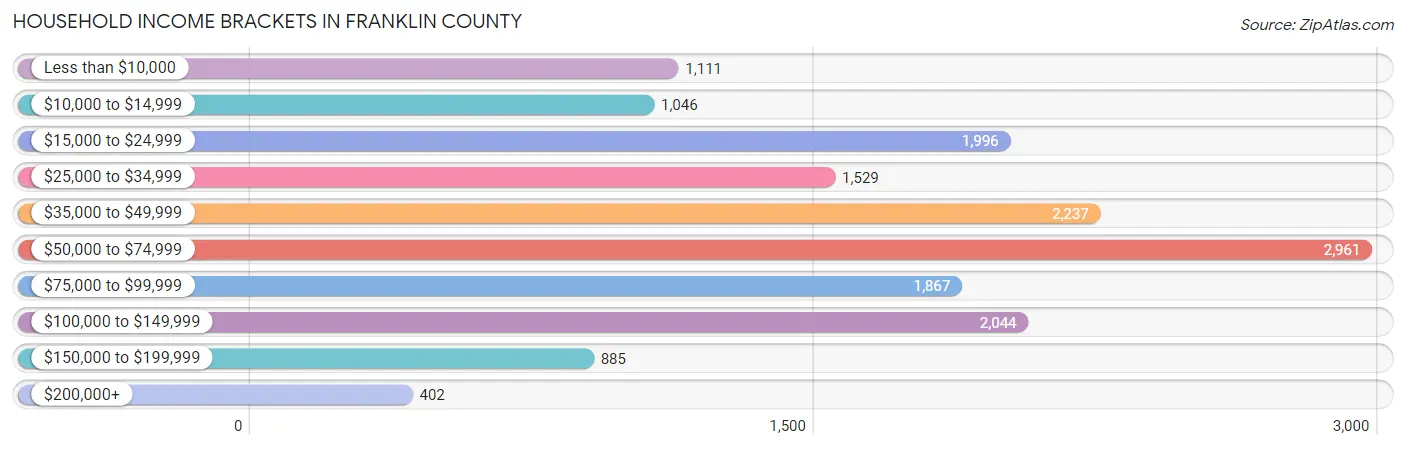
Household Income Brackets in Franklin County
With 2,961 households falling in the category, the $50,000 to $74,999 income range is the most frequent in Franklin County, accounting for 18.4% of all households. In contrast, only 402 households (2.5%) fall into the $200,000+ income bracket, making it the least populous group.
| Income Bracket | # Households | % Households |
| Less than $10,000 | 1,111 | 6.9% |
| $10,000 to $14,999 | 1,046 | 6.5% |
| $15,000 to $24,999 | 1,996 | 12.4% |
| $25,000 to $34,999 | 1,529 | 9.5% |
| $35,000 to $49,999 | 2,237 | 13.9% |
| $50,000 to $74,999 | 2,961 | 18.4% |
| $75,000 to $99,999 | 1,867 | 11.6% |
| $100,000 to $149,999 | 2,044 | 12.7% |
| $150,000 to $199,999 | 885 | 5.5% |
| $200,000+ | 402 | 2.5% |
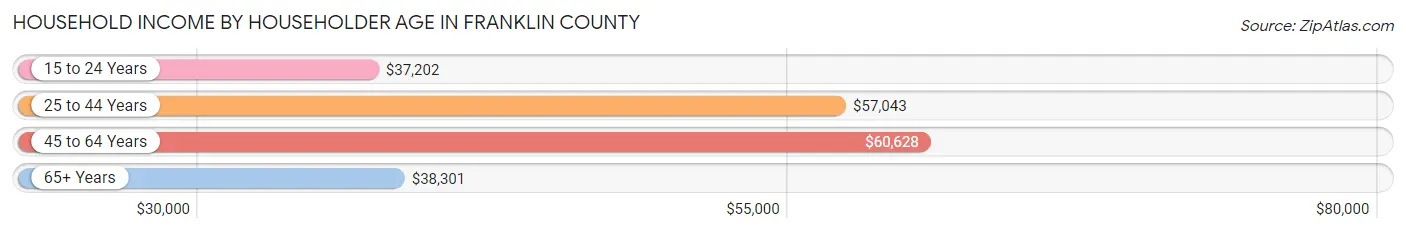
Household Income by Householder Age in Franklin County
The median household income in Franklin County is $51,031, with the highest median household income of $60,628 found in the 45 to 64 years age bracket for the primary householder. A total of 5,958 households (37.0%) fall into this category. Meanwhile, the 15 to 24 years age bracket for the primary householder has the lowest median household income of $37,202, with 556 households (3.5%) in this group.
| Income Bracket | # Households | Median Income |
| 15 to 24 Years | 556 (3.5%) | $37,202 |
| 25 to 44 Years | 4,213 (26.2%) | $57,043 |
| 45 to 64 Years | 5,958 (37.0%) | $60,628 |
| 65+ Years | 5,368 (33.4%) | $38,301 |
| Total | 16,095 (100.0%) | $51,031 |
Poverty in Franklin County
Income Below Poverty by Sex and Age in Franklin County
With 16.3% poverty level for males and 19.3% for females among the residents of Franklin County, 15 year old males and 15 year old females are the most vulnerable to poverty, with 100 males (31.1%) and 120 females (51.5%) in their respective age groups living below the poverty level.
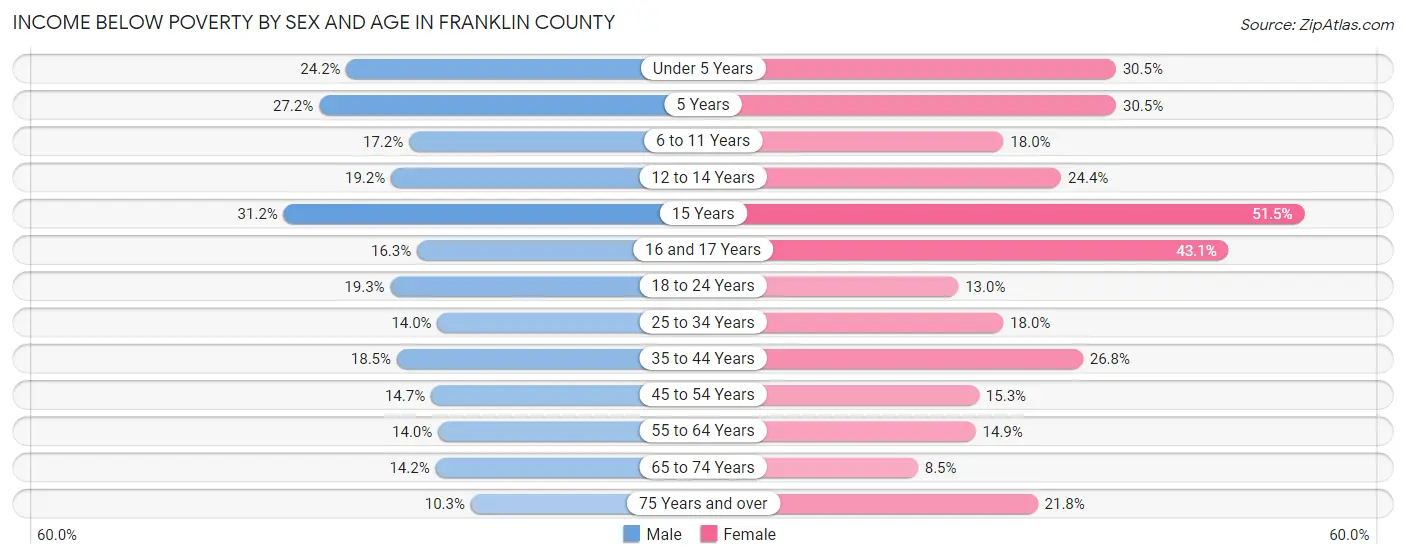
| Age Bracket | Male | Female |
| Under 5 Years | 251 (24.2%) | 310 (30.5%) |
| 5 Years | 37 (27.2%) | 51 (30.5%) |
| 6 to 11 Years | 249 (17.2%) | 205 (18.0%) |
| 12 to 14 Years | 170 (19.2%) | 202 (24.4%) |
| 15 Years | 100 (31.1%) | 120 (51.5%) |
| 16 and 17 Years | 72 (16.3%) | 230 (43.1%) |
| 18 to 24 Years | 275 (19.3%) | 169 (13.0%) |
| 25 to 34 Years | 304 (14.0%) | 371 (18.0%) |
| 35 to 44 Years | 396 (18.5%) | 592 (26.8%) |
| 45 to 54 Years | 366 (14.7%) | 373 (15.3%) |
| 55 to 64 Years | 366 (14.0%) | 394 (14.9%) |
| 65 to 74 Years | 293 (14.2%) | 190 (8.5%) |
| 75 Years and over | 142 (10.3%) | 398 (21.8%) |
| Total | 3,021 (16.3%) | 3,605 (19.3%) |
Income Above Poverty by Sex and Age in Franklin County
According to the poverty statistics in Franklin County, males aged 75 years and over and females aged 65 to 74 years are the age groups that are most secure financially, with 89.7% of males and 91.5% of females in these age groups living above the poverty line.
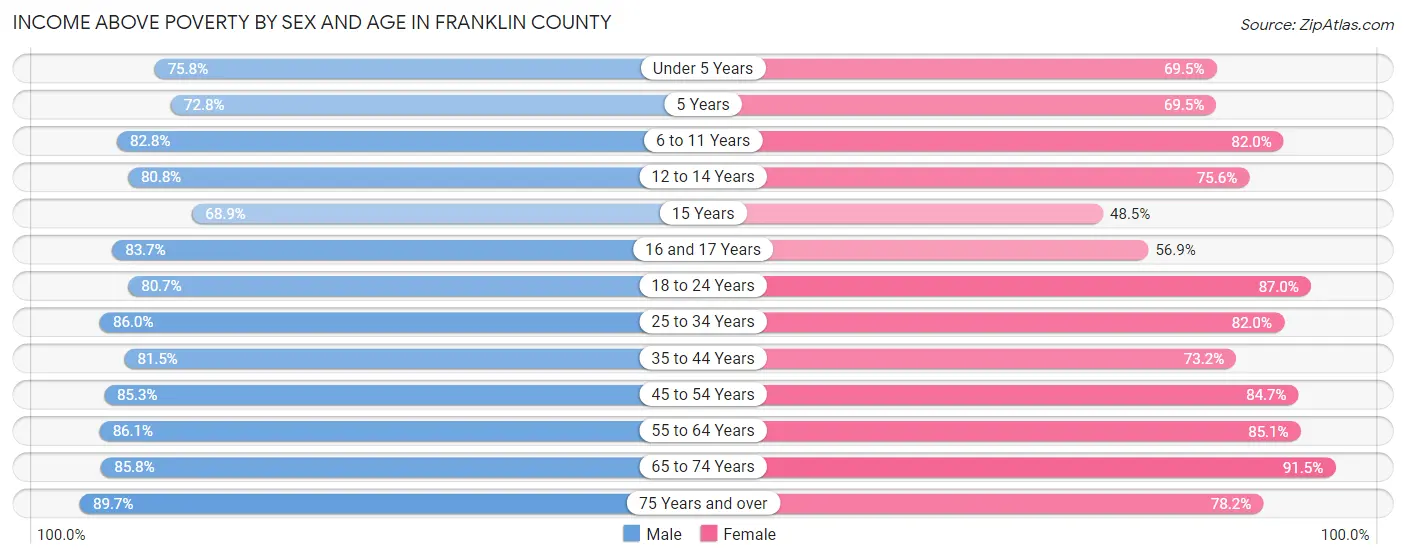
| Age Bracket | Male | Female |
| Under 5 Years | 788 (75.8%) | 706 (69.5%) |
| 5 Years | 99 (72.8%) | 116 (69.5%) |
| 6 to 11 Years | 1,200 (82.8%) | 934 (82.0%) |
| 12 to 14 Years | 716 (80.8%) | 625 (75.6%) |
| 15 Years | 221 (68.9%) | 113 (48.5%) |
| 16 and 17 Years | 370 (83.7%) | 304 (56.9%) |
| 18 to 24 Years | 1,153 (80.7%) | 1,134 (87.0%) |
| 25 to 34 Years | 1,865 (86.0%) | 1,693 (82.0%) |
| 35 to 44 Years | 1,740 (81.5%) | 1,614 (73.2%) |
| 45 to 54 Years | 2,117 (85.3%) | 2,069 (84.7%) |
| 55 to 64 Years | 2,257 (86.1%) | 2,251 (85.1%) |
| 65 to 74 Years | 1,764 (85.8%) | 2,056 (91.5%) |
| 75 Years and over | 1,235 (89.7%) | 1,427 (78.2%) |
| Total | 15,525 (83.7%) | 15,042 (80.7%) |
Income Below Poverty Among Married-Couple Families in Franklin County
The poverty statistics for married-couple families in Franklin County show that 8.3% or 619 of the total 7,465 families live below the poverty line. Families with 5 or more children have the highest poverty rate of 40.9%, comprising of 9 families. On the other hand, families with no children have the lowest poverty rate of 4.0%, which includes 184 families.
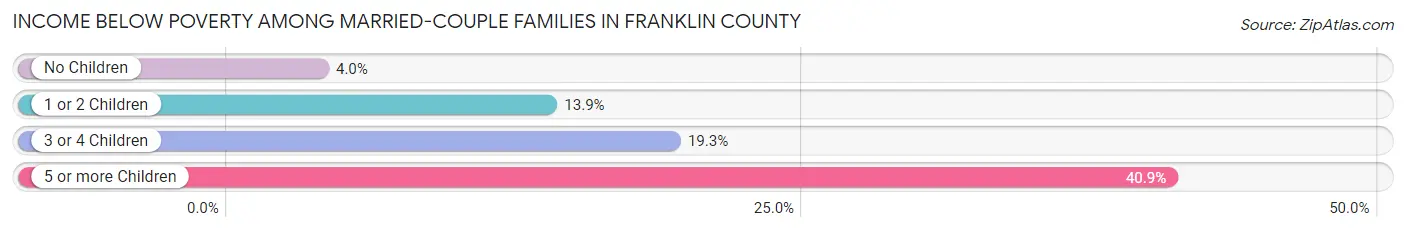
| Children | Above Poverty | Below Poverty |
| No Children | 4,463 (96.0%) | 184 (4.0%) |
| 1 or 2 Children | 1,809 (86.1%) | 292 (13.9%) |
| 3 or 4 Children | 561 (80.7%) | 134 (19.3%) |
| 5 or more Children | 13 (59.1%) | 9 (40.9%) |
| Total | 6,846 (91.7%) | 619 (8.3%) |
Income Below Poverty Among Single-Parent Households in Franklin County
According to the poverty data in Franklin County, 25.1% or 177 single-father households and 30.4% or 552 single-mother households are living below the poverty line. Among single-father households, those with 3 or 4 children have the highest poverty rate, with 4 households (36.4%) experiencing poverty. Likewise, among single-mother households, those with 5 or more children have the highest poverty rate, with 7 households (100.0%) falling below the poverty line.
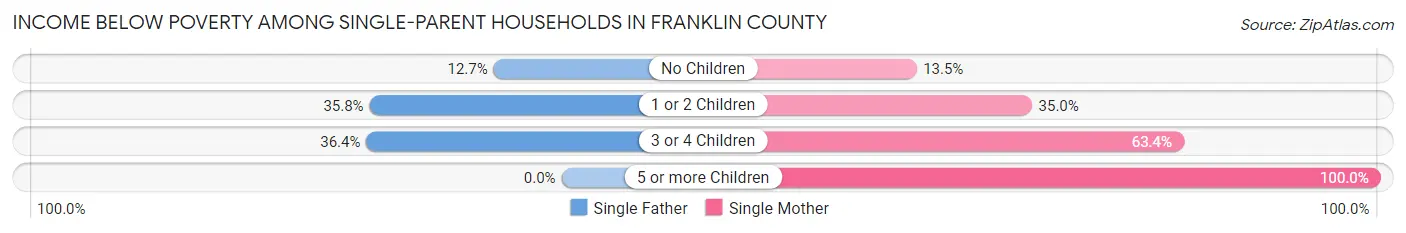
| Children | Single Father | Single Mother |
| No Children | 41 (12.7%) | 89 (13.5%) |
| 1 or 2 Children | 132 (35.8%) | 335 (35.0%) |
| 3 or 4 Children | 4 (36.4%) | 121 (63.3%) |
| 5 or more Children | 0 (0.0%) | 7 (100.0%) |
| Total | 177 (25.1%) | 552 (30.4%) |
Income Below Poverty Among Married-Couple vs Single-Parent Households in Franklin County
The poverty data for Franklin County shows that 619 of the married-couple family households (8.3%) and 729 of the single-parent households (28.9%) are living below the poverty level. Within the married-couple family households, those with 5 or more children have the highest poverty rate, with 9 households (40.9%) falling below the poverty line. Among the single-parent households, those with 5 or more children have the highest poverty rate, with 7 household (100.0%) living below poverty.
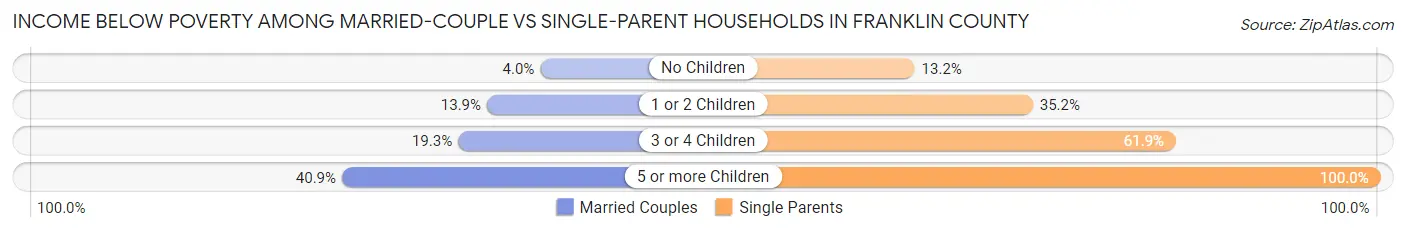
| Children | Married-Couple Families | Single-Parent Households |
| No Children | 184 (4.0%) | 130 (13.2%) |
| 1 or 2 Children | 292 (13.9%) | 467 (35.2%) |
| 3 or 4 Children | 134 (19.3%) | 125 (61.9%) |
| 5 or more Children | 9 (40.9%) | 7 (100.0%) |
| Total | 619 (8.3%) | 729 (28.9%) |
Race in Franklin County
The most populous races in Franklin County are White / Caucasian (36,128 | 95.6%), Two or more Races (1,328 | 3.5%), and Hispanic or Latino (730 | 1.9%).
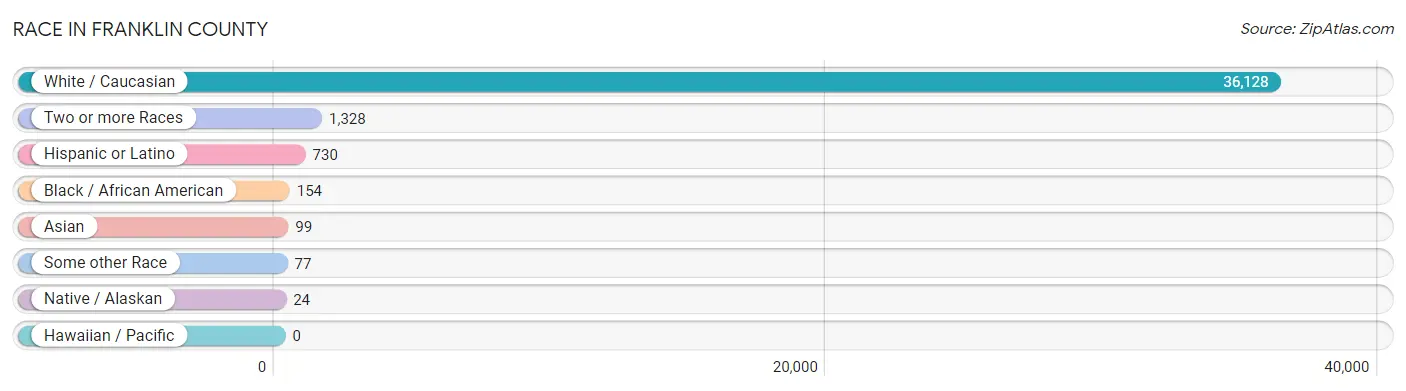
| Race | # Population | % Population |
| Asian | 99 | 0.3% |
| Black / African American | 154 | 0.4% |
| Hawaiian / Pacific | 0 | 0.0% |
| Hispanic or Latino | 730 | 1.9% |
| Native / Alaskan | 24 | 0.1% |
| White / Caucasian | 36,128 | 95.6% |
| Two or more Races | 1,328 | 3.5% |
| Some other Race | 77 | 0.2% |
| Total | 37,810 | 100.0% |
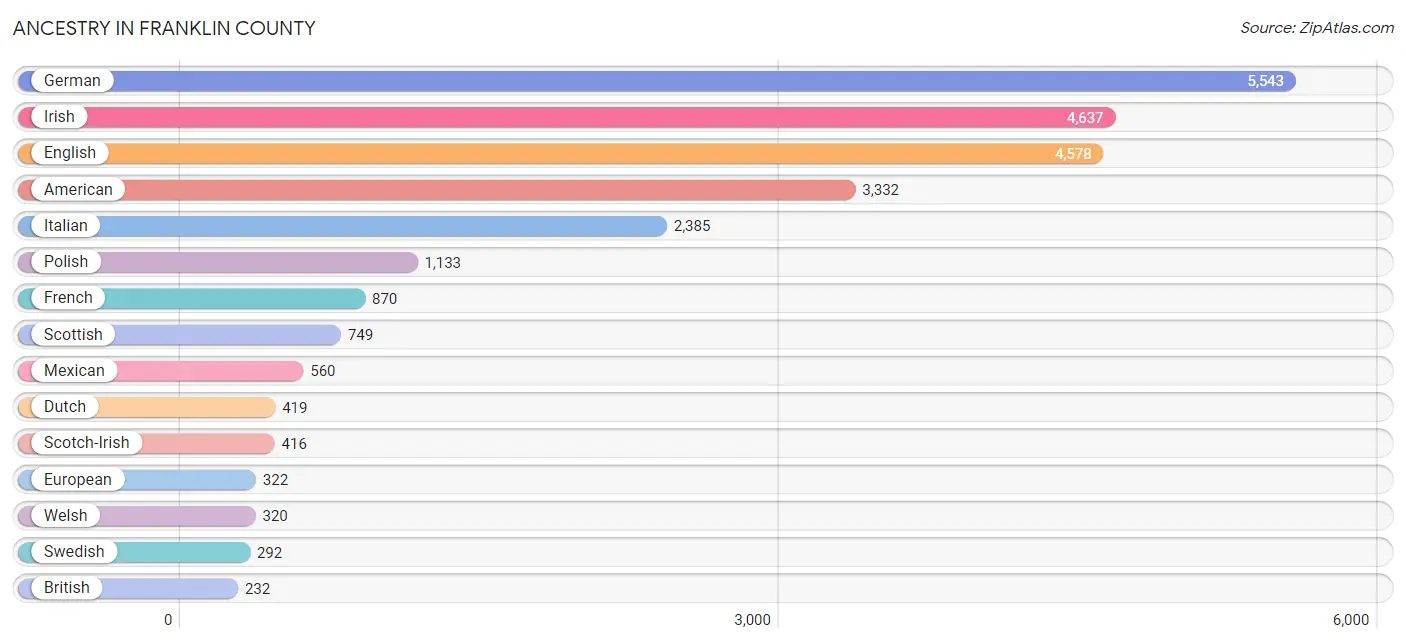
Ancestry in Franklin County
The most populous ancestries reported in Franklin County are German (5,543 | 14.7%), Irish (4,637 | 12.3%), English (4,578 | 12.1%), American (3,332 | 8.8%), and Italian (2,385 | 6.3%), together accounting for 54.1% of all Franklin County residents.
| Ancestry | # Population | % Population |
| African | 34 | 0.1% |
| American | 3,332 | 8.8% |
| Apache | 8 | 0.0% |
| Arab | 30 | 0.1% |
| Austrian | 11 | 0.0% |
| Belgian | 40 | 0.1% |
| Bermudan | 3 | 0.0% |
| Blackfeet | 56 | 0.2% |
| British | 232 | 0.6% |
| British West Indian | 1 | 0.0% |
| Burmese | 30 | 0.1% |
| Canadian | 2 | 0.0% |
| Central American | 5 | 0.0% |
| Cherokee | 137 | 0.4% |
| Cheyenne | 6 | 0.0% |
| Choctaw | 40 | 0.1% |
| Colombian | 4 | 0.0% |
| Croatian | 111 | 0.3% |
| Czech | 39 | 0.1% |
| Czechoslovakian | 23 | 0.1% |
| Danish | 35 | 0.1% |
| Dutch | 419 | 1.1% |
| Eastern European | 53 | 0.1% |
| Ecuadorian | 7 | 0.0% |
| English | 4,578 | 12.1% |
| European | 322 | 0.9% |
| Finnish | 17 | 0.0% |
| French | 870 | 2.3% |
| French Canadian | 108 | 0.3% |
| German | 5,543 | 14.7% |
| Greek | 17 | 0.0% |
| Honduran | 5 | 0.0% |
| Hungarian | 162 | 0.4% |
| Irish | 4,637 | 12.3% |
| Israeli | 11 | 0.0% |
| Italian | 2,385 | 6.3% |
| Jamaican | 1 | 0.0% |
| Korean | 212 | 0.6% |
| Latvian | 8 | 0.0% |
| Lebanese | 8 | 0.0% |
| Lithuanian | 161 | 0.4% |
| Mexican | 560 | 1.5% |
| Moroccan | 5 | 0.0% |
| Navajo | 6 | 0.0% |
| Northern European | 17 | 0.0% |
| Norwegian | 145 | 0.4% |
| Palestinian | 17 | 0.0% |
| Pennsylvania German | 7 | 0.0% |
| Polish | 1,133 | 3.0% |
| Portuguese | 7 | 0.0% |
| Puerto Rican | 46 | 0.1% |
| Russian | 116 | 0.3% |
| Scandinavian | 81 | 0.2% |
| Scotch-Irish | 416 | 1.1% |
| Scottish | 749 | 2.0% |
| Seminole | 3 | 0.0% |
| Serbian | 12 | 0.0% |
| Sioux | 4 | 0.0% |
| Slovak | 22 | 0.1% |
| South African | 13 | 0.0% |
| South American | 11 | 0.0% |
| Spanish | 34 | 0.1% |
| Subsaharan African | 53 | 0.1% |
| Swedish | 292 | 0.8% |
| Swiss | 51 | 0.1% |
| Thai | 10 | 0.0% |
| Ukrainian | 17 | 0.0% |
| Welsh | 320 | 0.9% |
| West Indian | 1 | 0.0% |
| Yugoslavian | 87 | 0.2% | View All 70 Rows |
Immigrants in Franklin County
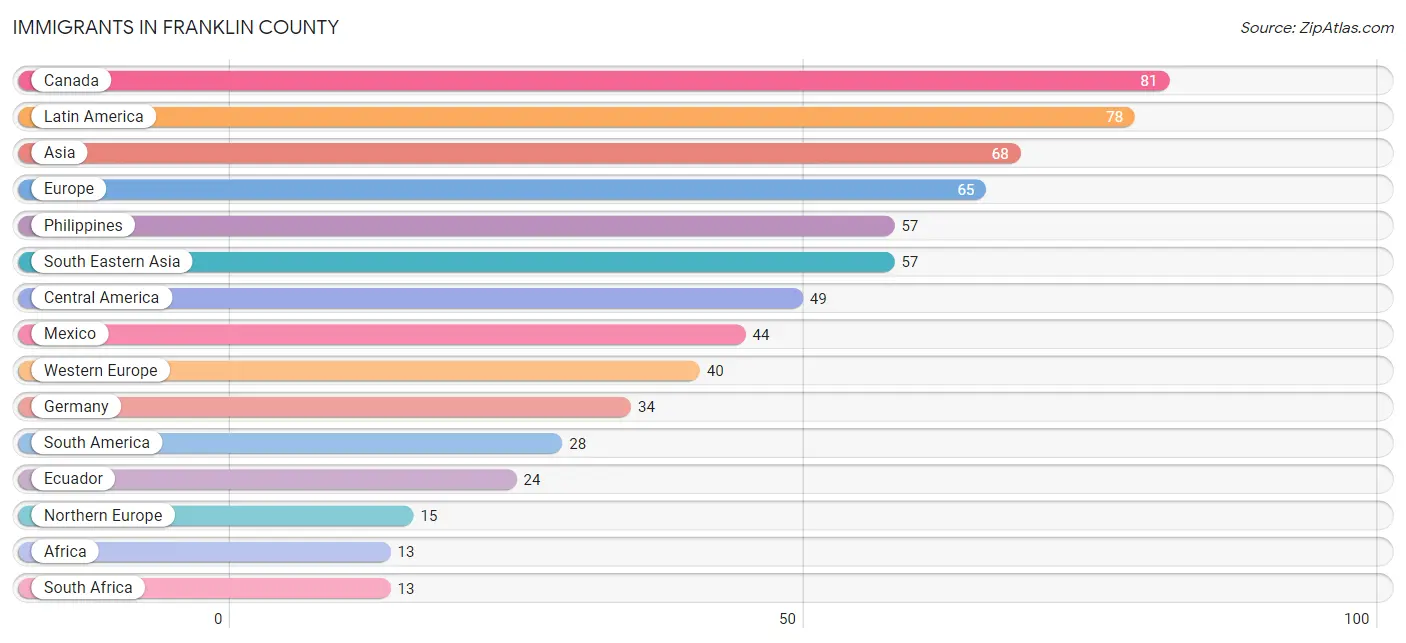
The most numerous immigrant groups reported in Franklin County came from Canada (81 | 0.2%), Latin America (78 | 0.2%), Asia (68 | 0.2%), Europe (65 | 0.2%), and Philippines (57 | 0.2%), together accounting for 0.9% of all Franklin County residents.
| Immigration Origin | # Population | % Population |
| Africa | 13 | 0.0% |
| Asia | 68 | 0.2% |
| Belgium | 6 | 0.0% |
| Canada | 81 | 0.2% |
| Caribbean | 1 | 0.0% |
| Central America | 49 | 0.1% |
| Colombia | 4 | 0.0% |
| Eastern Europe | 10 | 0.0% |
| Ecuador | 24 | 0.1% |
| England | 10 | 0.0% |
| Europe | 65 | 0.2% |
| Germany | 34 | 0.1% |
| Honduras | 5 | 0.0% |
| Israel | 5 | 0.0% |
| Kuwait | 3 | 0.0% |
| Latin America | 78 | 0.2% |
| Latvia | 8 | 0.0% |
| Mexico | 44 | 0.1% |
| Northern Europe | 15 | 0.0% |
| Philippines | 57 | 0.2% |
| Russia | 2 | 0.0% |
| South Africa | 13 | 0.0% |
| South America | 28 | 0.1% |
| South Eastern Asia | 57 | 0.2% |
| Western Asia | 8 | 0.0% |
| Western Europe | 40 | 0.1% | View All 26 Rows |
Sex and Age in Franklin County
Sex and Age in Franklin County
The most populous age groups in Franklin County are 55 to 59 Years (1,436 | 7.6%) for men and 55 to 59 Years (1,438 | 7.6%) for women.

| Age Bracket | Male | Female |
| Under 5 Years | 1,121 (5.9%) | 1,041 (5.5%) |
| 5 to 9 Years | 1,149 (6.1%) | 969 (5.1%) |
| 10 to 14 Years | 1,356 (7.2%) | 1,183 (6.3%) |
| 15 to 19 Years | 1,159 (6.1%) | 1,128 (6.0%) |
| 20 to 24 Years | 1,052 (5.6%) | 960 (5.1%) |
| 25 to 29 Years | 1,084 (5.7%) | 1,053 (5.6%) |
| 30 to 34 Years | 1,108 (5.9%) | 1,014 (5.4%) |
| 35 to 39 Years | 1,101 (5.8%) | 895 (4.7%) |
| 40 to 44 Years | 1,081 (5.7%) | 1,320 (7.0%) |
| 45 to 49 Years | 1,177 (6.2%) | 1,217 (6.4%) |
| 50 to 54 Years | 1,329 (7.0%) | 1,255 (6.6%) |
| 55 to 59 Years | 1,436 (7.6%) | 1,438 (7.6%) |
| 60 to 64 Years | 1,225 (6.5%) | 1,218 (6.4%) |
| 65 to 69 Years | 1,229 (6.5%) | 1,431 (7.6%) |
| 70 to 74 Years | 898 (4.8%) | 858 (4.5%) |
| 75 to 79 Years | 702 (3.7%) | 840 (4.4%) |
| 80 to 84 Years | 358 (1.9%) | 563 (3.0%) |
| 85 Years and over | 337 (1.8%) | 525 (2.8%) |
| Total | 18,902 (100.0%) | 18,908 (100.0%) |
Families and Households in Franklin County
Median Family Size in Franklin County
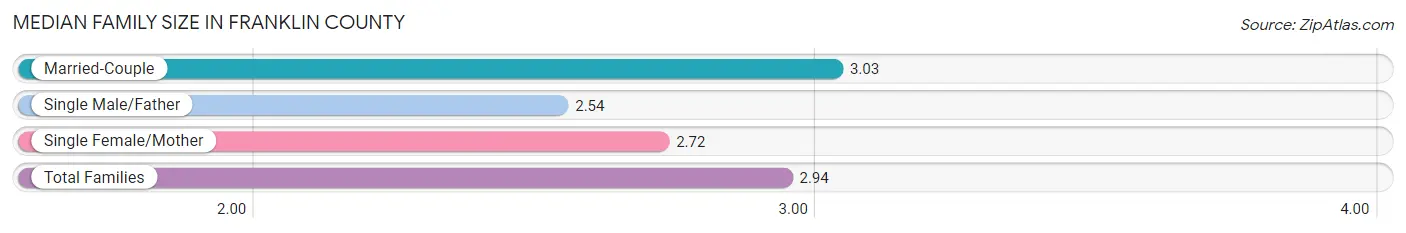
The median family size in Franklin County is 2.94 persons per family, with married-couple families (7,465 | 74.8%) accounting for the largest median family size of 3.03 persons per family. On the other hand, single male/father families (704 | 7.0%) represent the smallest median family size with 2.54 persons per family.
| Family Type | # Families | Family Size |
| Married-Couple | 7,465 (74.8%) | 3.03 |
| Single Male/Father | 704 (7.0%) | 2.54 |
| Single Female/Mother | 1,814 (18.2%) | 2.72 |
| Total Families | 9,983 (100.0%) | 2.94 |
Median Household Size in Franklin County
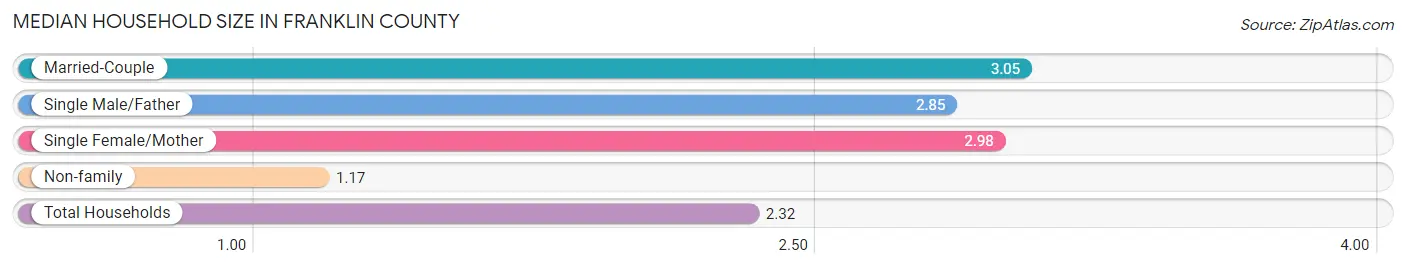
The median household size in Franklin County is 2.32 persons per household, with married-couple households (7,465 | 46.4%) accounting for the largest median household size of 3.05 persons per household. non-family households (6,112 | 38.0%) represent the smallest median household size with 1.17 persons per household.
| Household Type | # Households | Household Size |
| Married-Couple | 7,465 (46.4%) | 3.05 |
| Single Male/Father | 704 (4.4%) | 2.85 |
| Single Female/Mother | 1,814 (11.3%) | 2.98 |
| Non-family | 6,112 (38.0%) | 1.17 |
| Total Households | 16,095 (100.0%) | 2.32 |
Household Size by Marriage Status in Franklin County
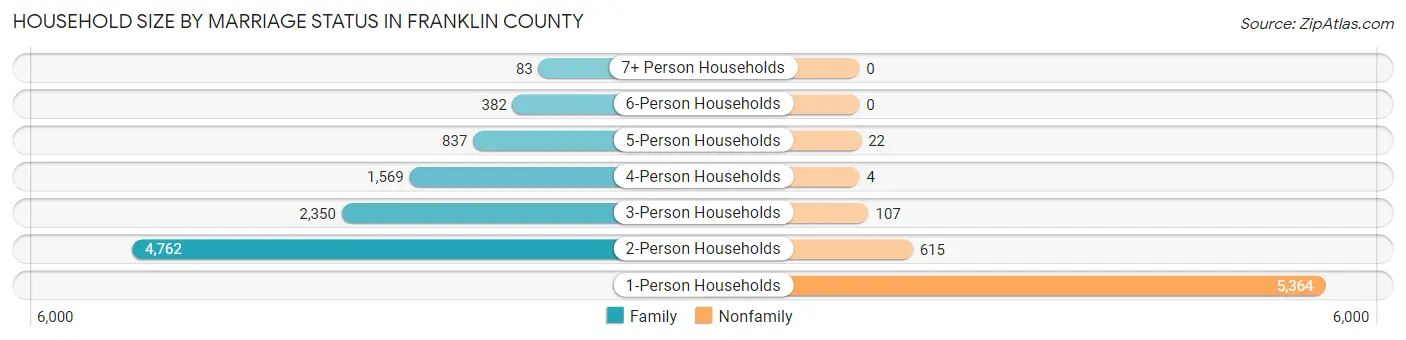
Out of a total of 16,095 households in Franklin County, 9,983 (62.0%) are family households, while 6,112 (38.0%) are nonfamily households. The most numerous type of family households are 2-person households, comprising 4,762, and the most common type of nonfamily households are 1-person households, comprising 5,364.
| Household Size | Family Households | Nonfamily Households |
| 1-Person Households | - | 5,364 (33.3%) |
| 2-Person Households | 4,762 (29.6%) | 615 (3.8%) |
| 3-Person Households | 2,350 (14.6%) | 107 (0.7%) |
| 4-Person Households | 1,569 (9.8%) | 4 (0.0%) |
| 5-Person Households | 837 (5.2%) | 22 (0.1%) |
| 6-Person Households | 382 (2.4%) | 0 (0.0%) |
| 7+ Person Households | 83 (0.5%) | 0 (0.0%) |
| Total | 9,983 (62.0%) | 6,112 (38.0%) |
Female Fertility in Franklin County
Fertility by Age in Franklin County
Average fertility rate in Franklin County is 65.0 births per 1,000 women. Women in the age bracket of 20 to 34 years have the highest fertility rate with 147.0 births per 1,000 women. Women in the age bracket of 20 to 34 years acount for 86.1% of all women with births.
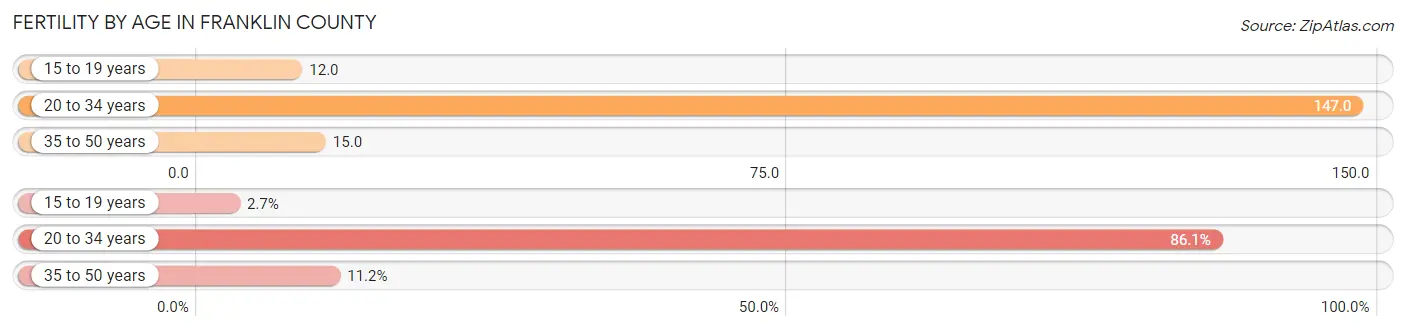
| Age Bracket | Women with Births | Births / 1,000 Women |
| 15 to 19 years | 14 (2.7%) | 12.0 |
| 20 to 34 years | 445 (86.1%) | 147.0 |
| 35 to 50 years | 58 (11.2%) | 15.0 |
| Total | 517 (100.0%) | 65.0 |
Fertility by Age by Marriage Status in Franklin County
68.5% of women with births (517) in Franklin County are married. The highest percentage of unmarried women with births falls into 15 to 19 years age bracket with 100.0% of them unmarried at the time of birth, while the lowest percentage of unmarried women with births belong to 35 to 50 years age bracket with 27.6% of them unmarried.
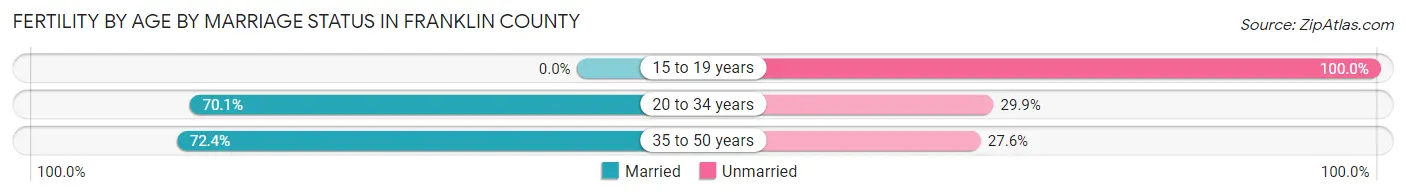
| Age Bracket | Married | Unmarried |
| 15 to 19 years | 0 (0.0%) | 14 (100.0%) |
| 20 to 34 years | 312 (70.1%) | 133 (29.9%) |
| 35 to 50 years | 42 (72.4%) | 16 (27.6%) |
| Total | 354 (68.5%) | 163 (31.5%) |
Fertility by Education in Franklin County
Average fertility rate in Franklin County is 65.0 births per 1,000 women. Women with the education attainment of high school diploma have the highest fertility rate of 87.0 births per 1,000 women, while women with the education attainment of bachelor's degree have the lowest fertility at 32.0 births per 1,000 women. Women with the education attainment of college or associate's degree represent 40.2% of all women with births.
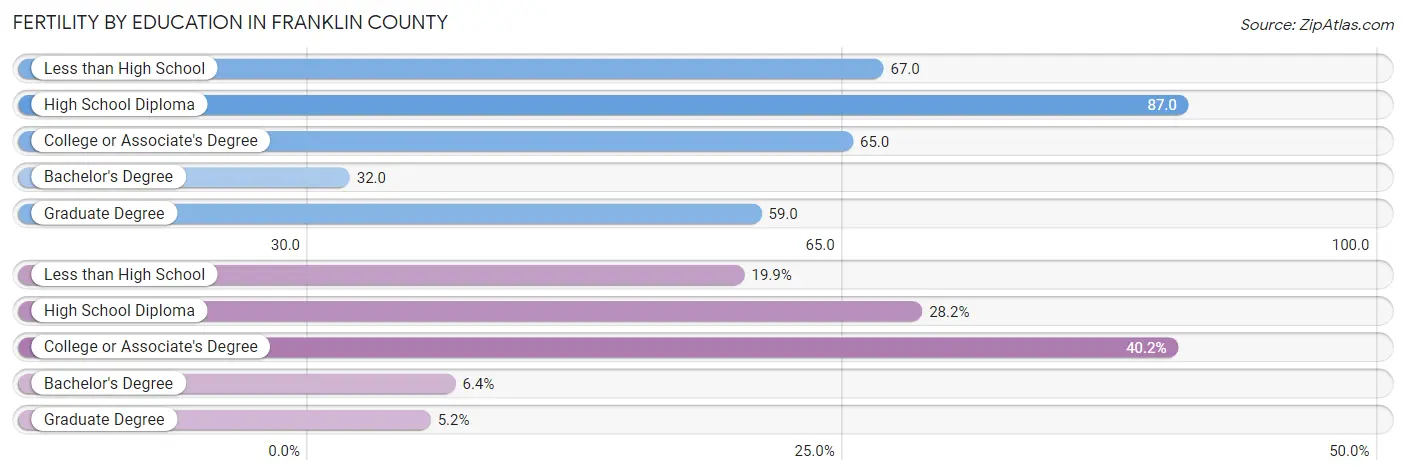
| Educational Attainment | Women with Births | Births / 1,000 Women |
| Less than High School | 103 (19.9%) | 67.0 |
| High School Diploma | 146 (28.2%) | 87.0 |
| College or Associate's Degree | 208 (40.2%) | 65.0 |
| Bachelor's Degree | 33 (6.4%) | 32.0 |
| Graduate Degree | 27 (5.2%) | 59.0 |
| Total | 517 (100.0%) | 65.0 |
Fertility by Education by Marriage Status in Franklin County
31.5% of women with births in Franklin County are unmarried. Women with the educational attainment of graduate degree are most likely to be married with 100.0% of them married at childbirth, while women with the educational attainment of high school diploma are least likely to be married with 70.6% of them unmarried at childbirth.
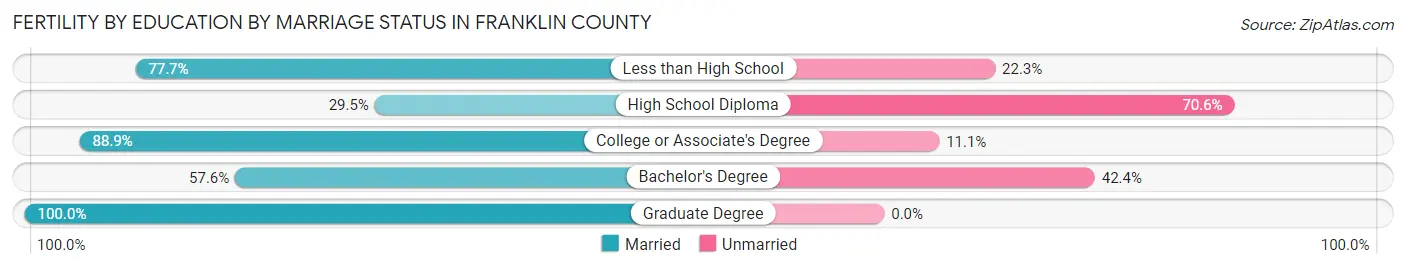
| Educational Attainment | Married | Unmarried |
| Less than High School | 80 (77.7%) | 23 (22.3%) |
| High School Diploma | 43 (29.4%) | 103 (70.6%) |
| College or Associate's Degree | 185 (88.9%) | 23 (11.1%) |
| Bachelor's Degree | 19 (57.6%) | 14 (42.4%) |
| Graduate Degree | 27 (100.0%) | 0 (0.0%) |
| Total | 354 (68.5%) | 163 (31.5%) |
Employment Characteristics in Franklin County
Employment by Class of Employer in Franklin County
Among the 15,486 employed individuals in Franklin County, private company employees (10,285 | 66.4%), not-for-profit organizations (1,493 | 9.6%), and local government employees (1,254 | 8.1%) make up the most common classes of employment.
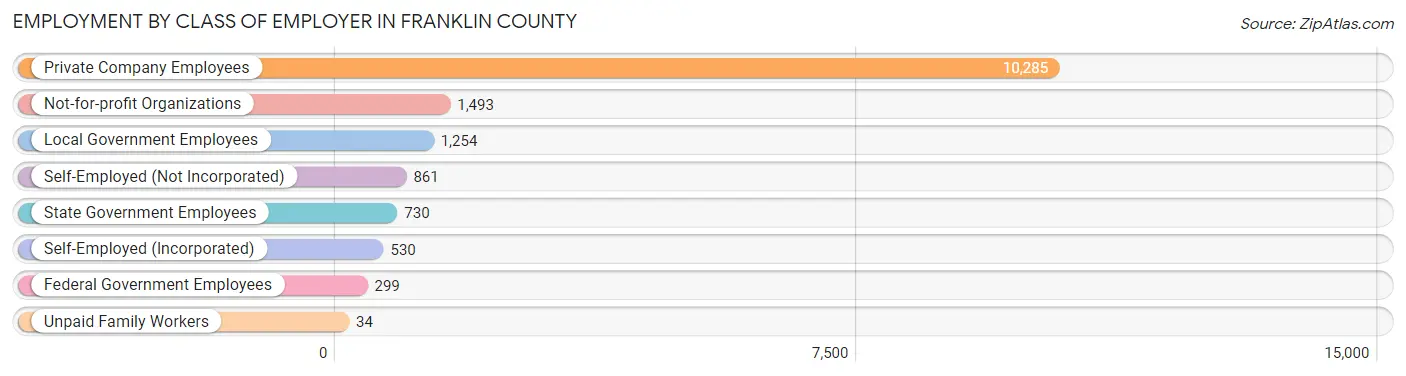
| Employer Class | # Employees | % Employees |
| Private Company Employees | 10,285 | 66.4% |
| Self-Employed (Incorporated) | 530 | 3.4% |
| Self-Employed (Not Incorporated) | 861 | 5.6% |
| Not-for-profit Organizations | 1,493 | 9.6% |
| Local Government Employees | 1,254 | 8.1% |
| State Government Employees | 730 | 4.7% |
| Federal Government Employees | 299 | 1.9% |
| Unpaid Family Workers | 34 | 0.2% |
| Total | 15,486 | 100.0% |
Employment Status by Age in Franklin County
According to the labor force statistics for Franklin County, out of the total population over 16 years of age (30,435), 55.9% or 17,013 individuals are in the labor force, with 6.7% or 1,140 of them unemployed. The age group with the highest labor force participation rate is 25 to 29 years, with 79.6% or 1,701 individuals in the labor force. Within the labor force, the 16 to 19 years age range has the highest percentage of unemployed individuals, with 21.5% or 190 of them being unemployed.
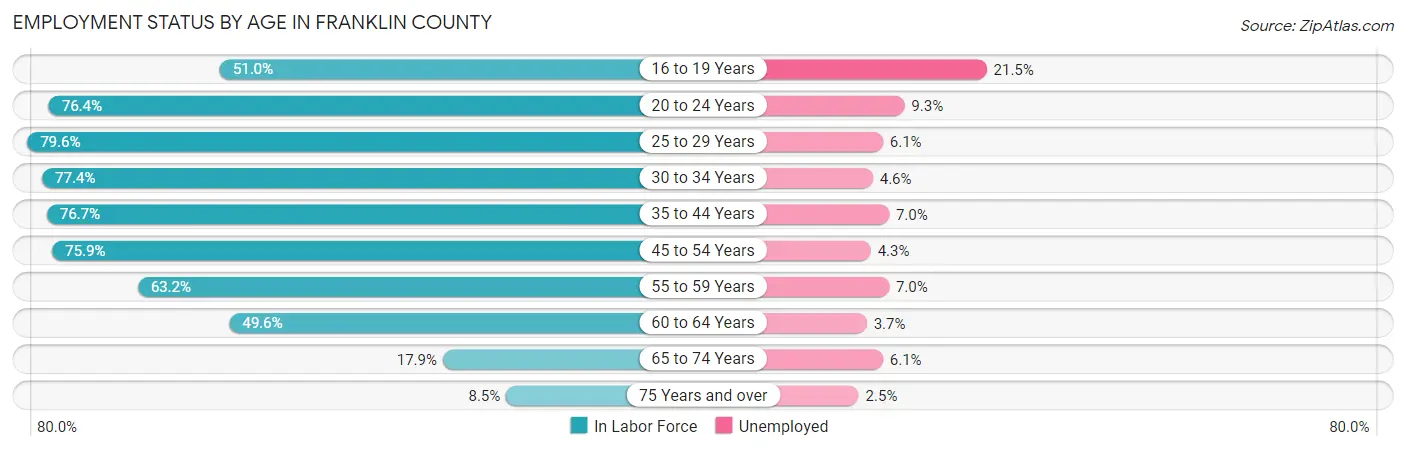
| Age Bracket | In Labor Force | Unemployed |
| 16 to 19 Years | 883 (51.0%) | 190 (21.5%) |
| 20 to 24 Years | 1,537 (76.4%) | 143 (9.3%) |
| 25 to 29 Years | 1,701 (79.6%) | 104 (6.1%) |
| 30 to 34 Years | 1,642 (77.4%) | 76 (4.6%) |
| 35 to 44 Years | 3,372 (76.7%) | 236 (7.0%) |
| 45 to 54 Years | 3,778 (75.9%) | 162 (4.3%) |
| 55 to 59 Years | 1,816 (63.2%) | 127 (7.0%) |
| 60 to 64 Years | 1,212 (49.6%) | 45 (3.7%) |
| 65 to 74 Years | 790 (17.9%) | 48 (6.1%) |
| 75 Years and over | 283 (8.5%) | 7 (2.5%) |
| Total | 17,013 (55.9%) | 1,140 (6.7%) |
Employment Status by Educational Attainment in Franklin County
According to labor force statistics for Franklin County, 71.4% of individuals (13,531) out of the total population between 25 and 64 years of age (18,951) are in the labor force, with 5.5% or 744 of them being unemployed. The group with the highest labor force participation rate are those with the educational attainment of bachelor's degree or higher, with 85.2% or 2,940 individuals in the labor force. Within the labor force, individuals with less than high school education have the highest percentage of unemployment, with 18.5% or 139 of them being unemployed.
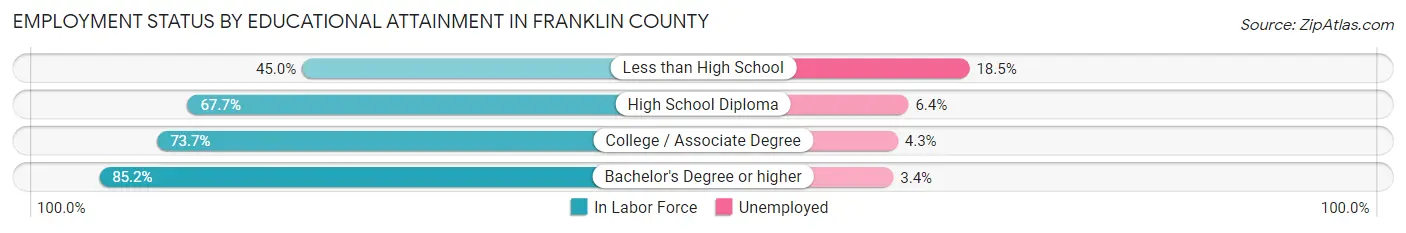
| Educational Attainment | In Labor Force | Unemployed |
| Less than High School | 752 (45.0%) | 309 (18.5%) |
| High School Diploma | 4,050 (67.7%) | 383 (6.4%) |
| College / Associate Degree | 5,784 (73.7%) | 337 (4.3%) |
| Bachelor's Degree or higher | 2,940 (85.2%) | 117 (3.4%) |
| Total | 13,531 (71.4%) | 1,042 (5.5%) |
Employment Occupations by Sex in Franklin County
Management, Business, Science and Arts Occupations
The most common Management, Business, Science and Arts occupations in Franklin County are Community & Social Service (1,346 | 8.5%), Management (1,231 | 7.7%), Health Diagnosing & Treating (1,188 | 7.5%), Education Instruction & Library (960 | 6.0%), and Health Technologists (701 | 4.4%).
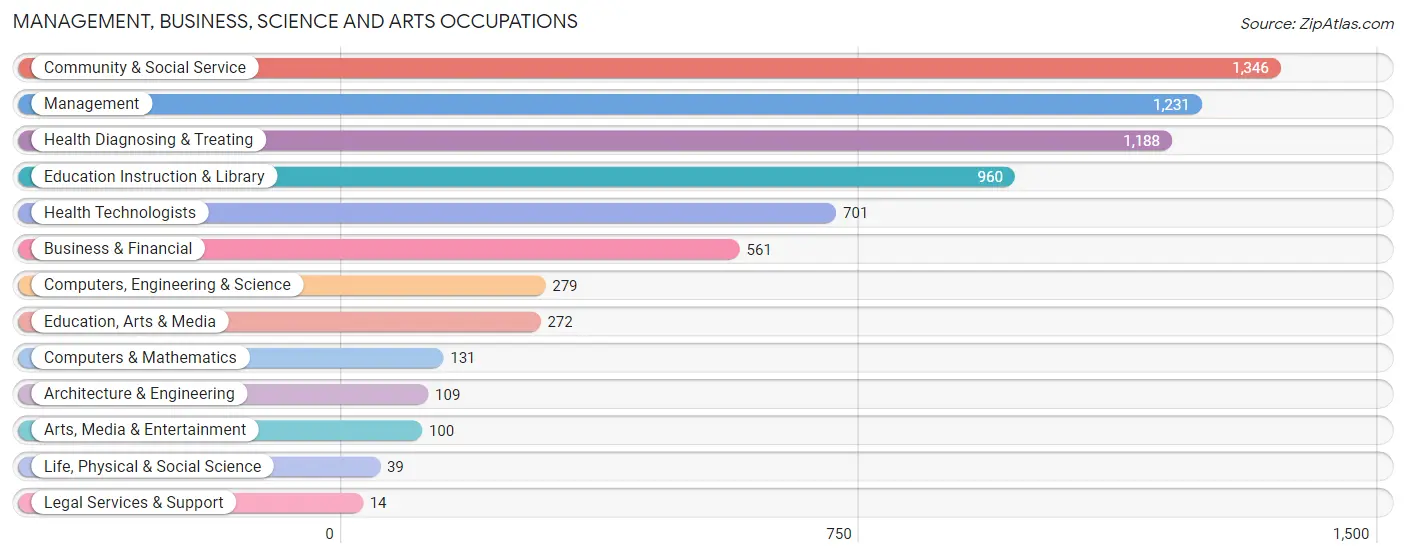
Management, Business, Science and Arts Occupations by Sex
Within the Management, Business, Science and Arts occupations in Franklin County, the most male-oriented occupations are Architecture & Engineering (98.2%), Life, Physical & Social Science (89.7%), and Computers, Engineering & Science (85.3%), while the most female-oriented occupations are Health Diagnosing & Treating (84.3%), Health Technologists (82.9%), and Education Instruction & Library (77.0%).
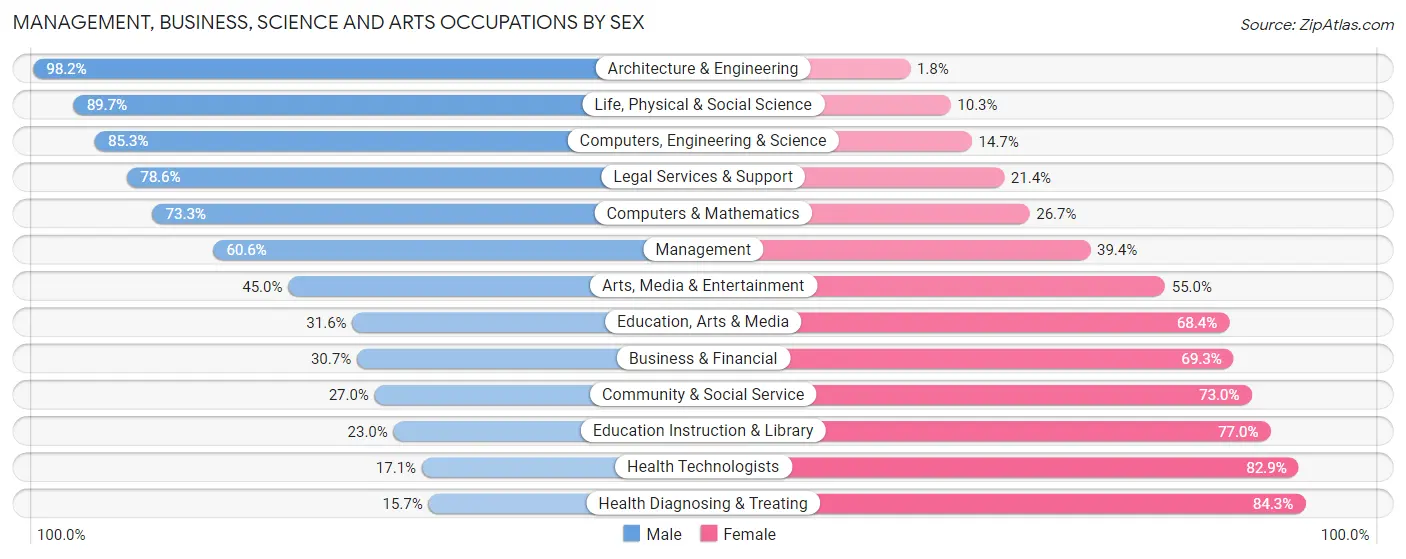
| Occupation | Male | Female |
| Management | 746 (60.6%) | 485 (39.4%) |
| Business & Financial | 172 (30.7%) | 389 (69.3%) |
| Computers, Engineering & Science | 238 (85.3%) | 41 (14.7%) |
| Computers & Mathematics | 96 (73.3%) | 35 (26.7%) |
| Architecture & Engineering | 107 (98.2%) | 2 (1.8%) |
| Life, Physical & Social Science | 35 (89.7%) | 4 (10.3%) |
| Community & Social Service | 363 (27.0%) | 983 (73.0%) |
| Education, Arts & Media | 86 (31.6%) | 186 (68.4%) |
| Legal Services & Support | 11 (78.6%) | 3 (21.4%) |
| Education Instruction & Library | 221 (23.0%) | 739 (77.0%) |
| Arts, Media & Entertainment | 45 (45.0%) | 55 (55.0%) |
| Health Diagnosing & Treating | 187 (15.7%) | 1,001 (84.3%) |
| Health Technologists | 120 (17.1%) | 581 (82.9%) |
| Total (Category) | 1,706 (37.0%) | 2,899 (62.9%) |
| Total (Overall) | 8,181 (51.5%) | 7,694 (48.5%) |
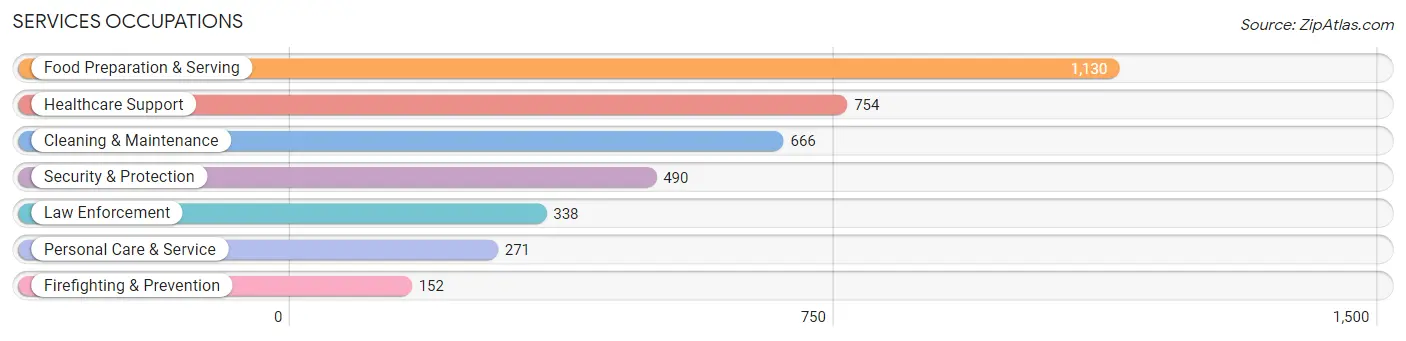
Services Occupations
The most common Services occupations in Franklin County are Food Preparation & Serving (1,130 | 7.1%), Healthcare Support (754 | 4.8%), Cleaning & Maintenance (666 | 4.2%), Security & Protection (490 | 3.1%), and Law Enforcement (338 | 2.1%).
Services Occupations by Sex
Within the Services occupations in Franklin County, the most male-oriented occupations are Law Enforcement (83.4%), Security & Protection (74.1%), and Cleaning & Maintenance (55.9%), while the most female-oriented occupations are Healthcare Support (92.3%), Personal Care & Service (81.6%), and Food Preparation & Serving (68.9%).
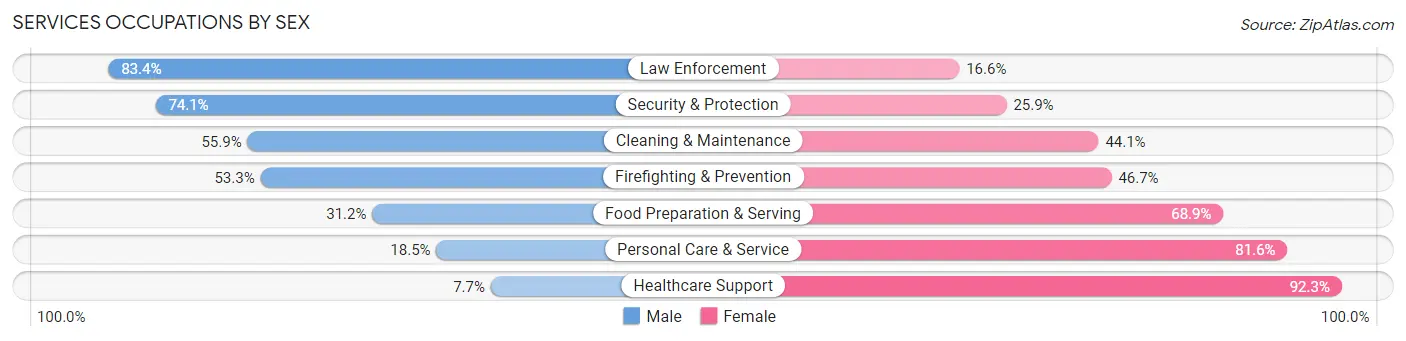
| Occupation | Male | Female |
| Healthcare Support | 58 (7.7%) | 696 (92.3%) |
| Security & Protection | 363 (74.1%) | 127 (25.9%) |
| Firefighting & Prevention | 81 (53.3%) | 71 (46.7%) |
| Law Enforcement | 282 (83.4%) | 56 (16.6%) |
| Food Preparation & Serving | 352 (31.1%) | 778 (68.9%) |
| Cleaning & Maintenance | 372 (55.9%) | 294 (44.1%) |
| Personal Care & Service | 50 (18.4%) | 221 (81.6%) |
| Total (Category) | 1,195 (36.1%) | 2,116 (63.9%) |
| Total (Overall) | 8,181 (51.5%) | 7,694 (48.5%) |
Sales and Office Occupations
The most common Sales and Office occupations in Franklin County are Office & Administration (1,576 | 9.9%), and Sales & Related (1,568 | 9.9%).
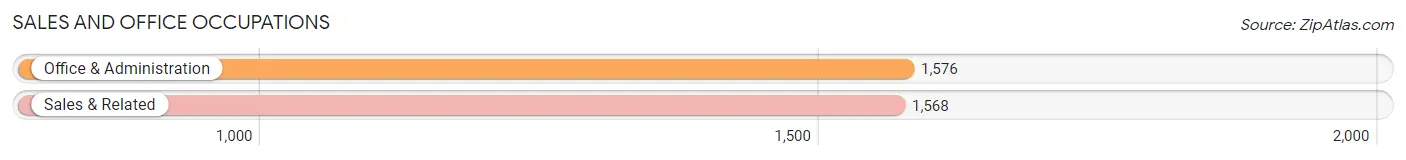
Sales and Office Occupations by Sex

| Occupation | Male | Female |
| Sales & Related | 725 (46.2%) | 843 (53.8%) |
| Office & Administration | 243 (15.4%) | 1,333 (84.6%) |
| Total (Category) | 968 (30.8%) | 2,176 (69.2%) |
| Total (Overall) | 8,181 (51.5%) | 7,694 (48.5%) |
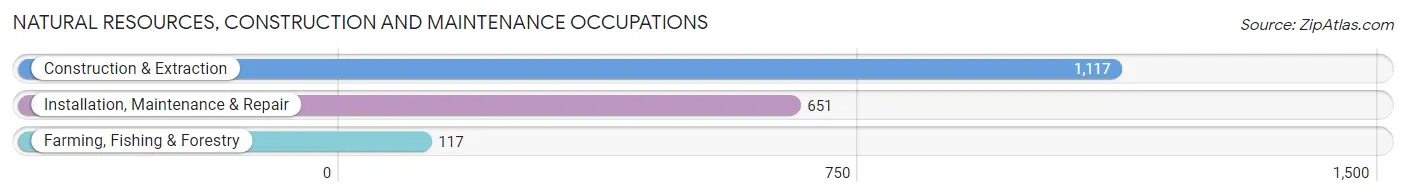
Natural Resources, Construction and Maintenance Occupations
The most common Natural Resources, Construction and Maintenance occupations in Franklin County are Construction & Extraction (1,117 | 7.0%), Installation, Maintenance & Repair (651 | 4.1%), and Farming, Fishing & Forestry (117 | 0.7%).
Natural Resources, Construction and Maintenance Occupations by Sex
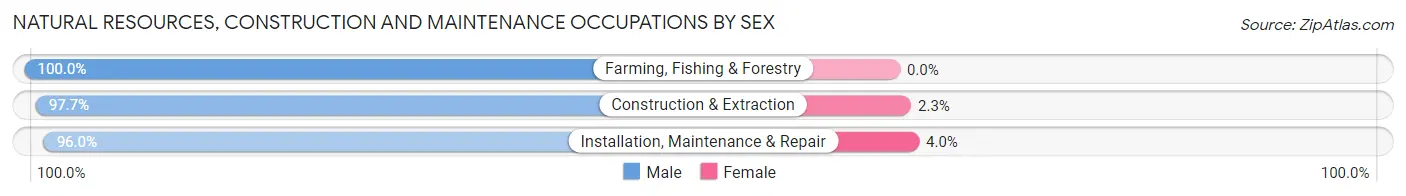
| Occupation | Male | Female |
| Farming, Fishing & Forestry | 117 (100.0%) | 0 (0.0%) |
| Construction & Extraction | 1,091 (97.7%) | 26 (2.3%) |
| Installation, Maintenance & Repair | 625 (96.0%) | 26 (4.0%) |
| Total (Category) | 1,833 (97.2%) | 52 (2.8%) |
| Total (Overall) | 8,181 (51.5%) | 7,694 (48.5%) |
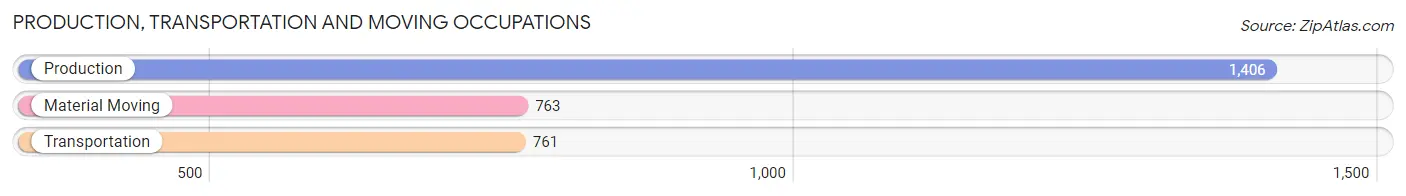
Production, Transportation and Moving Occupations
The most common Production, Transportation and Moving occupations in Franklin County are Production (1,406 | 8.9%), Material Moving (763 | 4.8%), and Transportation (761 | 4.8%).
Production, Transportation and Moving Occupations by Sex
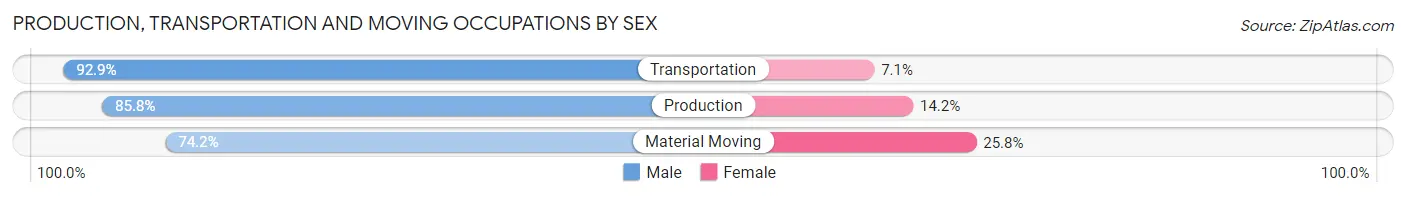
| Occupation | Male | Female |
| Production | 1,206 (85.8%) | 200 (14.2%) |
| Transportation | 707 (92.9%) | 54 (7.1%) |
| Material Moving | 566 (74.2%) | 197 (25.8%) |
| Total (Category) | 2,479 (84.6%) | 451 (15.4%) |
| Total (Overall) | 8,181 (51.5%) | 7,694 (48.5%) |
Employment Industries by Sex in Franklin County
Employment Industries in Franklin County
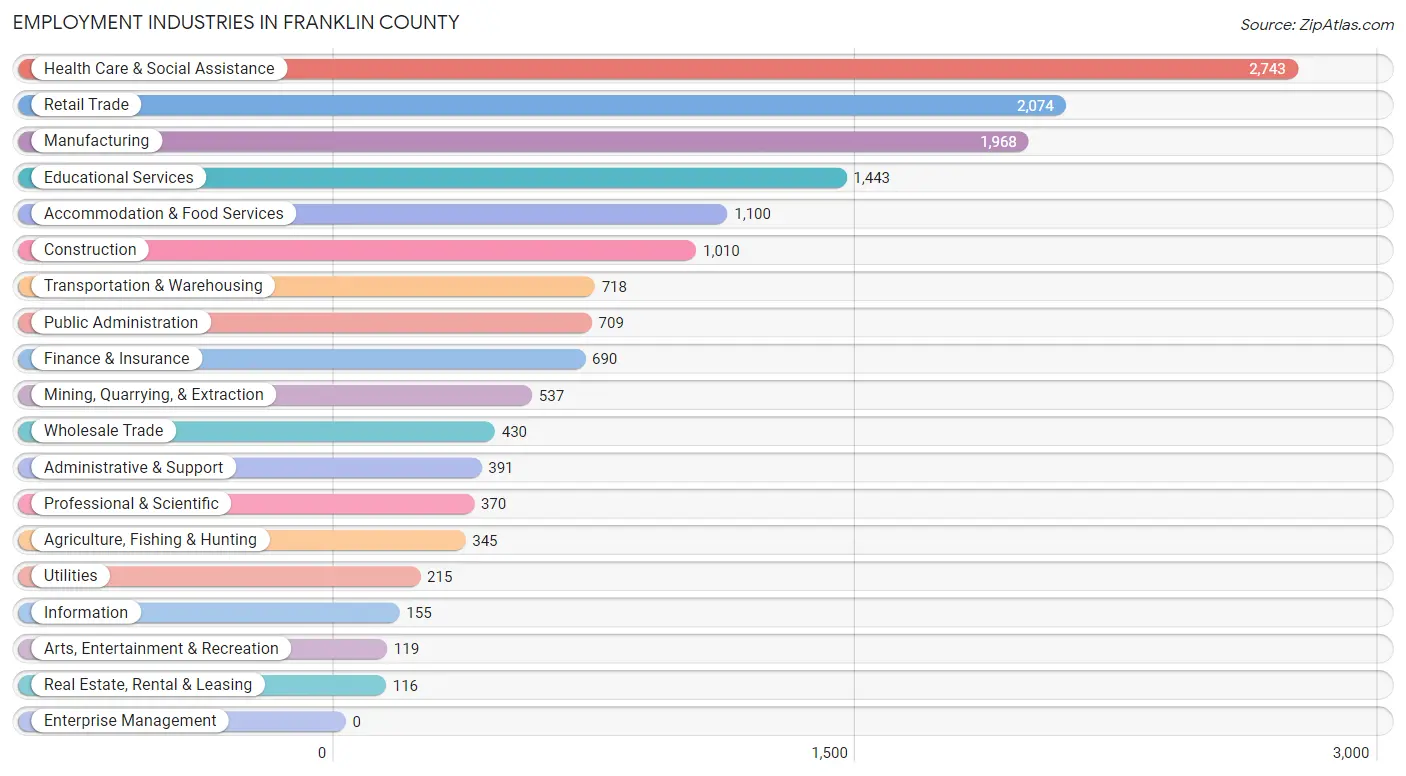
The major employment industries in Franklin County include Health Care & Social Assistance (2,743 | 17.3%), Retail Trade (2,074 | 13.1%), Manufacturing (1,968 | 12.4%), Educational Services (1,443 | 9.1%), and Accommodation & Food Services (1,100 | 6.9%).
Employment Industries by Sex in Franklin County
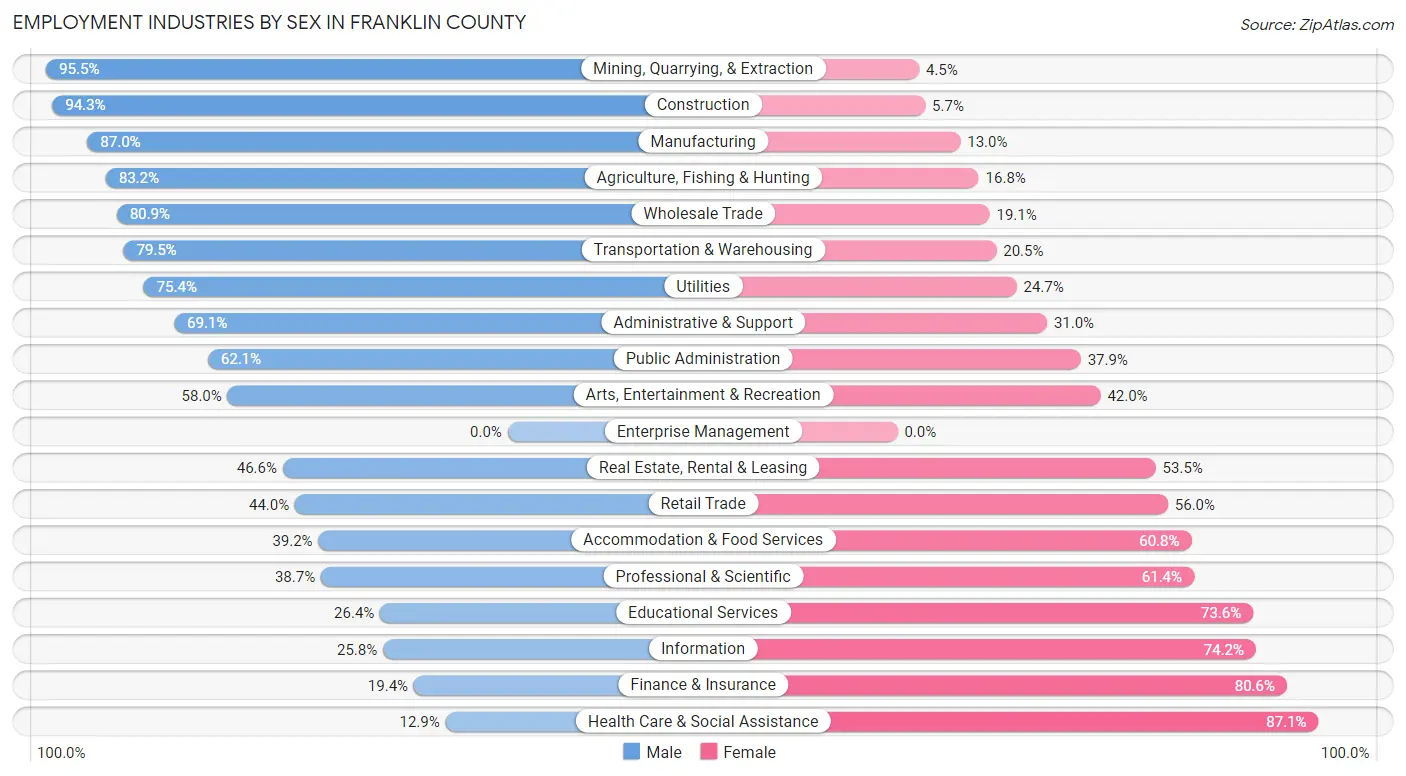
The Franklin County industries that see more men than women are Mining, Quarrying, & Extraction (95.5%), Construction (94.3%), and Manufacturing (87.0%), whereas the industries that tend to have a higher number of women are Health Care & Social Assistance (87.1%), Finance & Insurance (80.6%), and Information (74.2%).
| Industry | Male | Female |
| Agriculture, Fishing & Hunting | 287 (83.2%) | 58 (16.8%) |
| Mining, Quarrying, & Extraction | 513 (95.5%) | 24 (4.5%) |
| Construction | 952 (94.3%) | 58 (5.7%) |
| Manufacturing | 1,712 (87.0%) | 256 (13.0%) |
| Wholesale Trade | 348 (80.9%) | 82 (19.1%) |
| Retail Trade | 913 (44.0%) | 1,161 (56.0%) |
| Transportation & Warehousing | 571 (79.5%) | 147 (20.5%) |
| Utilities | 162 (75.3%) | 53 (24.6%) |
| Information | 40 (25.8%) | 115 (74.2%) |
| Finance & Insurance | 134 (19.4%) | 556 (80.6%) |
| Real Estate, Rental & Leasing | 54 (46.6%) | 62 (53.4%) |
| Professional & Scientific | 143 (38.7%) | 227 (61.4%) |
| Enterprise Management | 0 (0.0%) | 0 (0.0%) |
| Administrative & Support | 270 (69.1%) | 121 (30.9%) |
| Educational Services | 381 (26.4%) | 1,062 (73.6%) |
| Health Care & Social Assistance | 353 (12.9%) | 2,390 (87.1%) |
| Arts, Entertainment & Recreation | 69 (58.0%) | 50 (42.0%) |
| Accommodation & Food Services | 431 (39.2%) | 669 (60.8%) |
| Public Administration | 440 (62.1%) | 269 (37.9%) |
| Total | 8,181 (51.5%) | 7,694 (48.5%) |
Education in Franklin County
School Enrollment in Franklin County
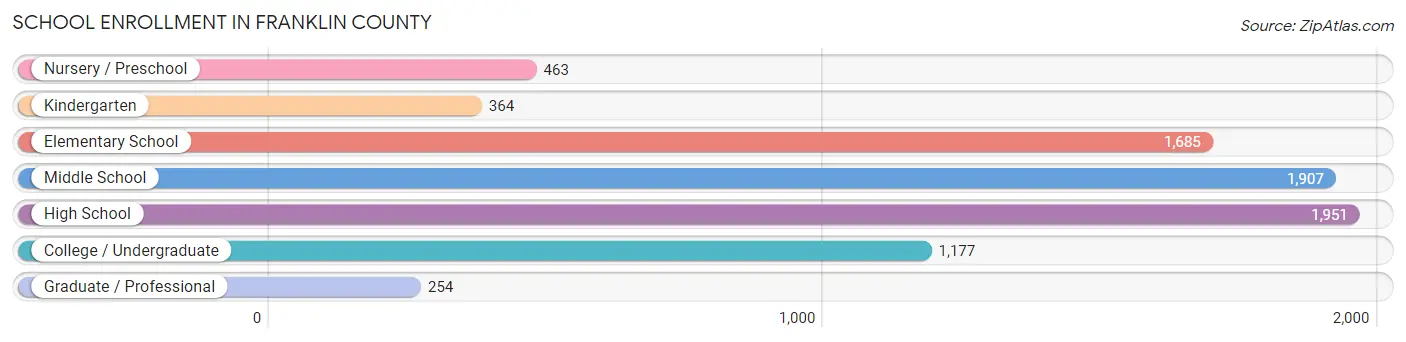
The most common levels of schooling among the 7,801 students in Franklin County are high school (1,951 | 25.0%), middle school (1,907 | 24.4%), and elementary school (1,685 | 21.6%).
| School Level | # Students | % Students |
| Nursery / Preschool | 463 | 5.9% |
| Kindergarten | 364 | 4.7% |
| Elementary School | 1,685 | 21.6% |
| Middle School | 1,907 | 24.4% |
| High School | 1,951 | 25.0% |
| College / Undergraduate | 1,177 | 15.1% |
| Graduate / Professional | 254 | 3.3% |
| Total | 7,801 | 100.0% |
School Enrollment by Age by Funding Source in Franklin County
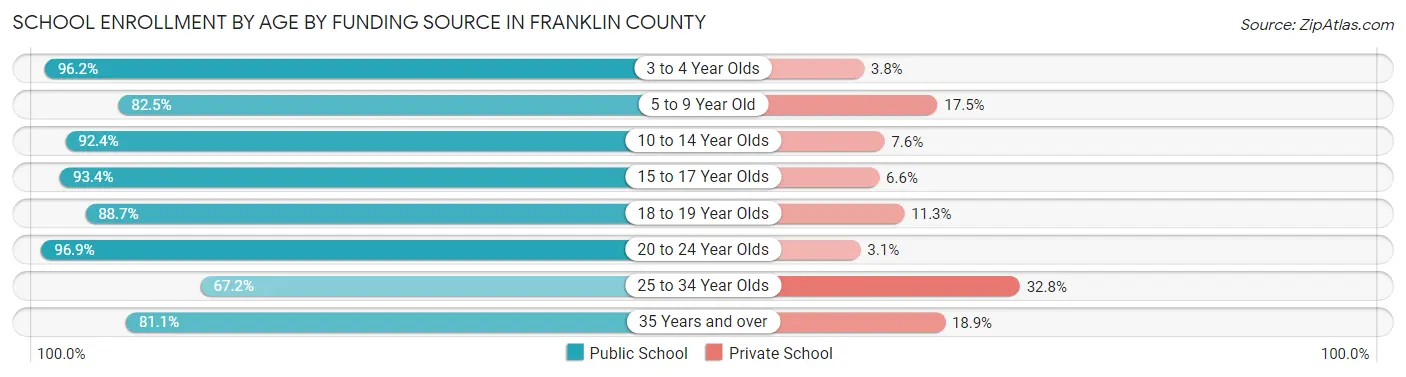
Out of a total of 7,801 students who are enrolled in schools in Franklin County, 866 (11.1%) attend a private institution, while the remaining 6,935 (88.9%) are enrolled in public schools. The age group of 25 to 34 year olds has the highest likelihood of being enrolled in private schools, with 100 (32.8% in the age bracket) enrolled. Conversely, the age group of 20 to 24 year olds has the lowest likelihood of being enrolled in a private school, with 620 (96.9% in the age bracket) attending a public institution.
| Age Bracket | Public School | Private School |
| 3 to 4 Year Olds | 307 (96.2%) | 12 (3.8%) |
| 5 to 9 Year Old | 1,669 (82.5%) | 353 (17.5%) |
| 10 to 14 Year Olds | 2,143 (92.4%) | 176 (7.6%) |
| 15 to 17 Year Olds | 1,286 (93.4%) | 91 (6.6%) |
| 18 to 19 Year Olds | 463 (88.7%) | 59 (11.3%) |
| 20 to 24 Year Olds | 620 (96.9%) | 20 (3.1%) |
| 25 to 34 Year Olds | 205 (67.2%) | 100 (32.8%) |
| 35 Years and over | 241 (81.1%) | 56 (18.9%) |
| Total | 6,935 (88.9%) | 866 (11.1%) |
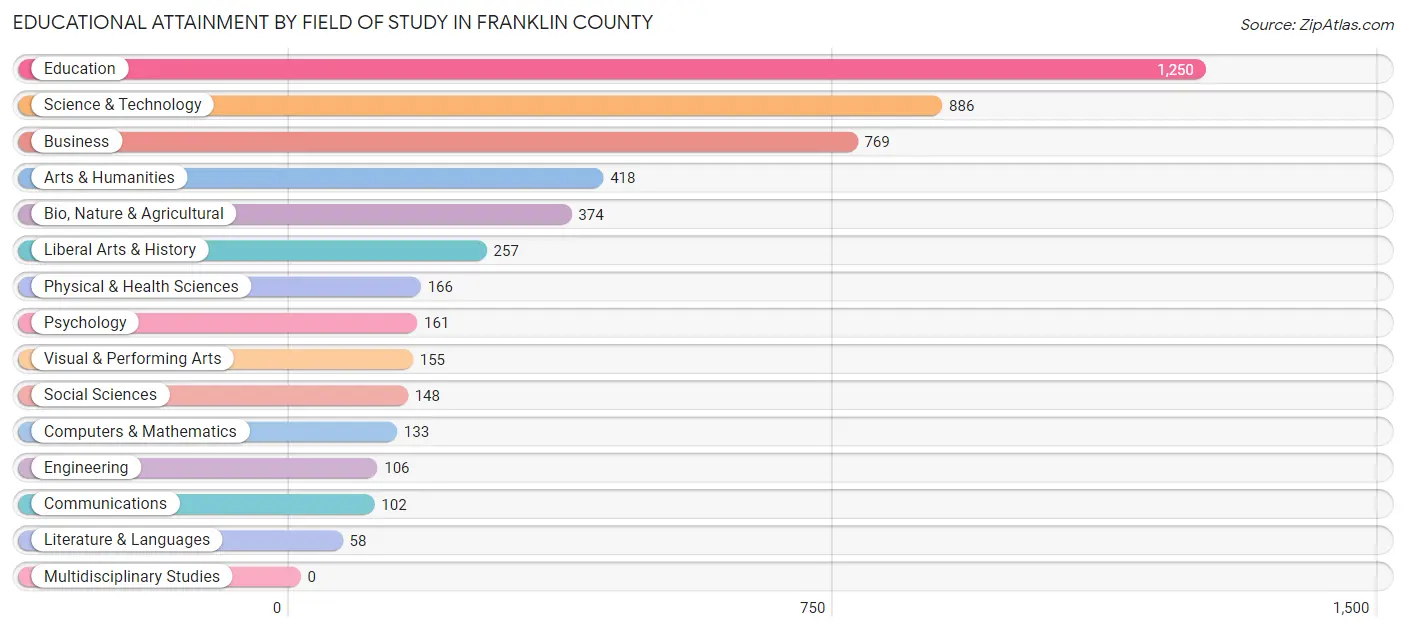
Educational Attainment by Field of Study in Franklin County
Education (1,250 | 25.1%), science & technology (886 | 17.8%), business (769 | 15.4%), arts & humanities (418 | 8.4%), and bio, nature & agricultural (374 | 7.5%) are the most common fields of study among 4,983 individuals in Franklin County who have obtained a bachelor's degree or higher.
| Field of Study | # Graduates | % Graduates |
| Computers & Mathematics | 133 | 2.7% |
| Bio, Nature & Agricultural | 374 | 7.5% |
| Physical & Health Sciences | 166 | 3.3% |
| Psychology | 161 | 3.2% |
| Social Sciences | 148 | 3.0% |
| Engineering | 106 | 2.1% |
| Multidisciplinary Studies | 0 | 0.0% |
| Science & Technology | 886 | 17.8% |
| Business | 769 | 15.4% |
| Education | 1,250 | 25.1% |
| Literature & Languages | 58 | 1.2% |
| Liberal Arts & History | 257 | 5.2% |
| Visual & Performing Arts | 155 | 3.1% |
| Communications | 102 | 2.1% |
| Arts & Humanities | 418 | 8.4% |
| Total | 4,983 | 100.0% |
Transportation & Commute in Franklin County
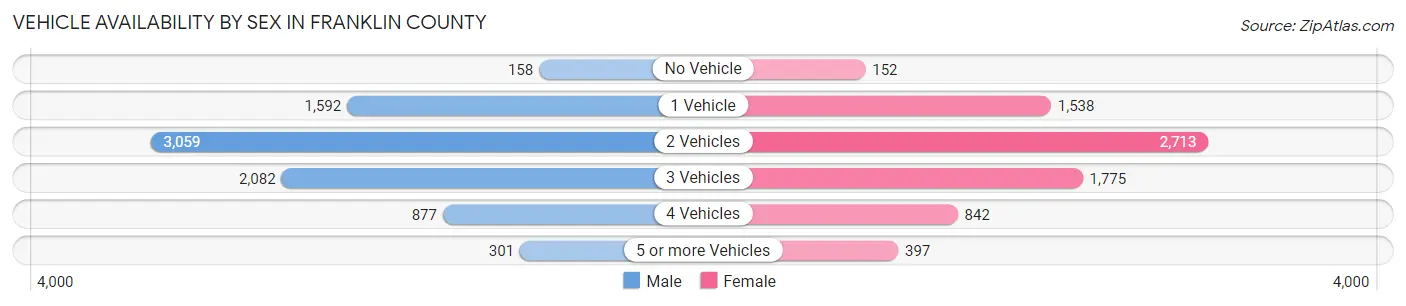
Vehicle Availability by Sex in Franklin County
The most prevalent vehicle ownership categories in Franklin County are males with 2 vehicles (3,059, accounting for 37.9%) and females with 2 vehicles (2,713, making up 41.2%).
| Vehicles Available | Male | Female |
| No Vehicle | 158 (2.0%) | 152 (2.1%) |
| 1 Vehicle | 1,592 (19.7%) | 1,538 (20.7%) |
| 2 Vehicles | 3,059 (37.9%) | 2,713 (36.6%) |
| 3 Vehicles | 2,082 (25.8%) | 1,775 (23.9%) |
| 4 Vehicles | 877 (10.9%) | 842 (11.4%) |
| 5 or more Vehicles | 301 (3.7%) | 397 (5.3%) |
| Total | 8,069 (100.0%) | 7,417 (100.0%) |
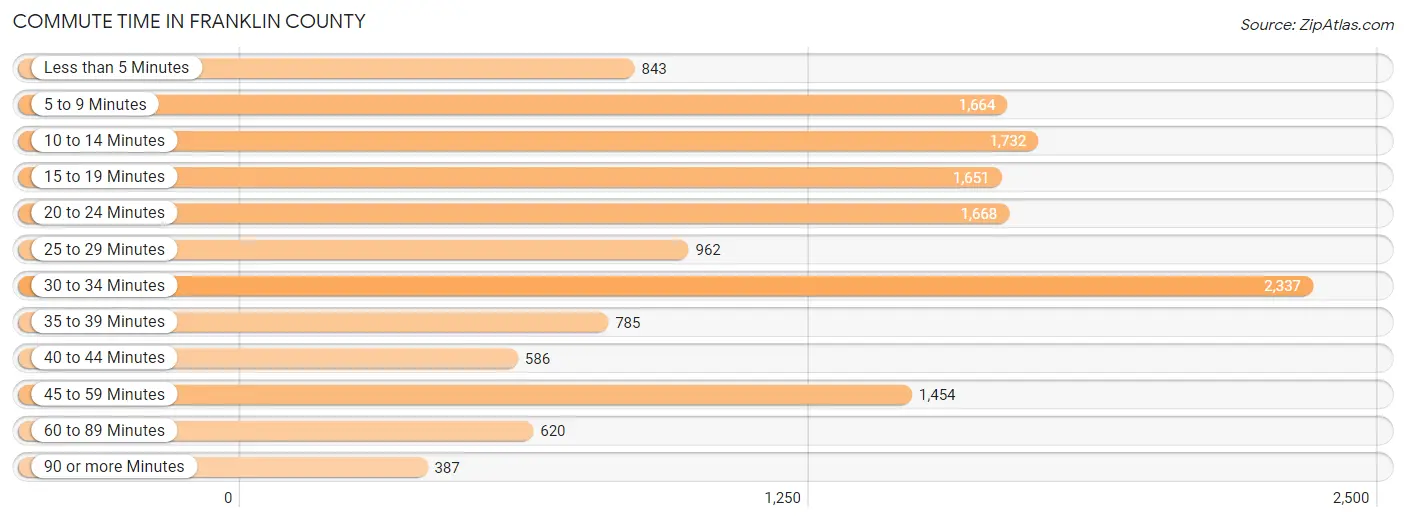
Commute Time in Franklin County
The most frequently occuring commute durations in Franklin County are 30 to 34 minutes (2,337 commuters, 15.9%), 10 to 14 minutes (1,732 commuters, 11.8%), and 20 to 24 minutes (1,668 commuters, 11.4%).
| Commute Time | # Commuters | % Commuters |
| Less than 5 Minutes | 843 | 5.7% |
| 5 to 9 Minutes | 1,664 | 11.3% |
| 10 to 14 Minutes | 1,732 | 11.8% |
| 15 to 19 Minutes | 1,651 | 11.2% |
| 20 to 24 Minutes | 1,668 | 11.4% |
| 25 to 29 Minutes | 962 | 6.6% |
| 30 to 34 Minutes | 2,337 | 15.9% |
| 35 to 39 Minutes | 785 | 5.3% |
| 40 to 44 Minutes | 586 | 4.0% |
| 45 to 59 Minutes | 1,454 | 9.9% |
| 60 to 89 Minutes | 620 | 4.2% |
| 90 or more Minutes | 387 | 2.6% |
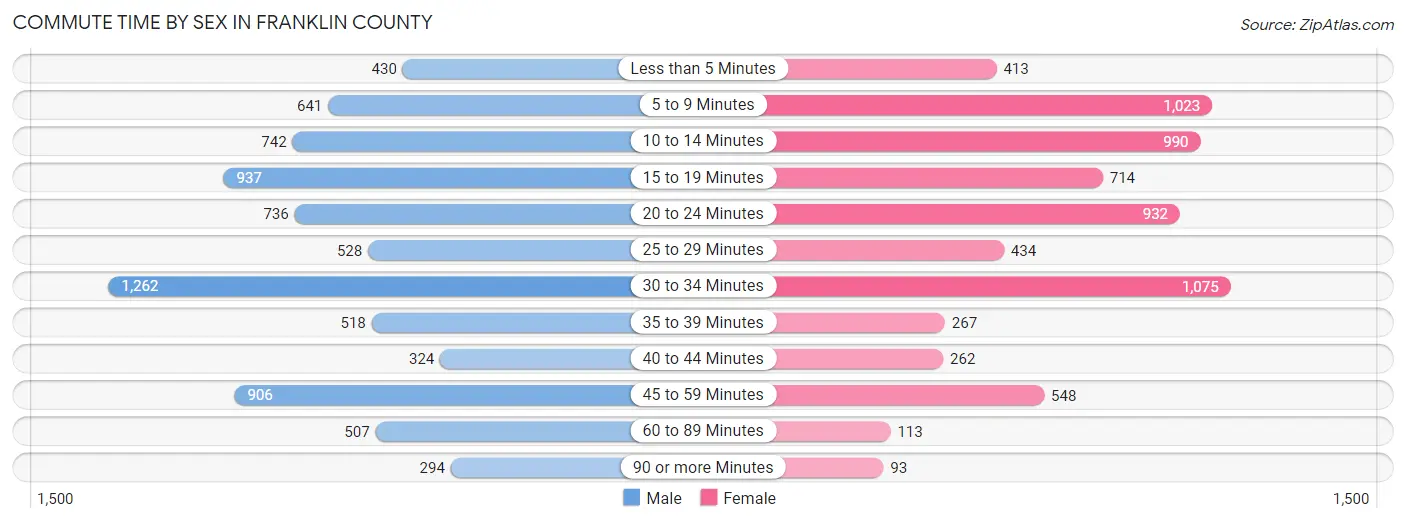
Commute Time by Sex in Franklin County
The most common commute times in Franklin County are 30 to 34 minutes (1,262 commuters, 16.1%) for males and 30 to 34 minutes (1,075 commuters, 15.7%) for females.
| Commute Time | Male | Female |
| Less than 5 Minutes | 430 (5.5%) | 413 (6.0%) |
| 5 to 9 Minutes | 641 (8.2%) | 1,023 (14.9%) |
| 10 to 14 Minutes | 742 (9.5%) | 990 (14.4%) |
| 15 to 19 Minutes | 937 (12.0%) | 714 (10.4%) |
| 20 to 24 Minutes | 736 (9.4%) | 932 (13.6%) |
| 25 to 29 Minutes | 528 (6.8%) | 434 (6.3%) |
| 30 to 34 Minutes | 1,262 (16.1%) | 1,075 (15.7%) |
| 35 to 39 Minutes | 518 (6.6%) | 267 (3.9%) |
| 40 to 44 Minutes | 324 (4.1%) | 262 (3.8%) |
| 45 to 59 Minutes | 906 (11.6%) | 548 (8.0%) |
| 60 to 89 Minutes | 507 (6.5%) | 113 (1.7%) |
| 90 or more Minutes | 294 (3.8%) | 93 (1.3%) |
Time of Departure to Work by Sex in Franklin County
The most frequent times of departure to work in Franklin County are 12:00 PM to 3:59 PM (1,030, 13.2%) for males and 7:30 AM to 7:59 AM (1,402, 20.4%) for females.
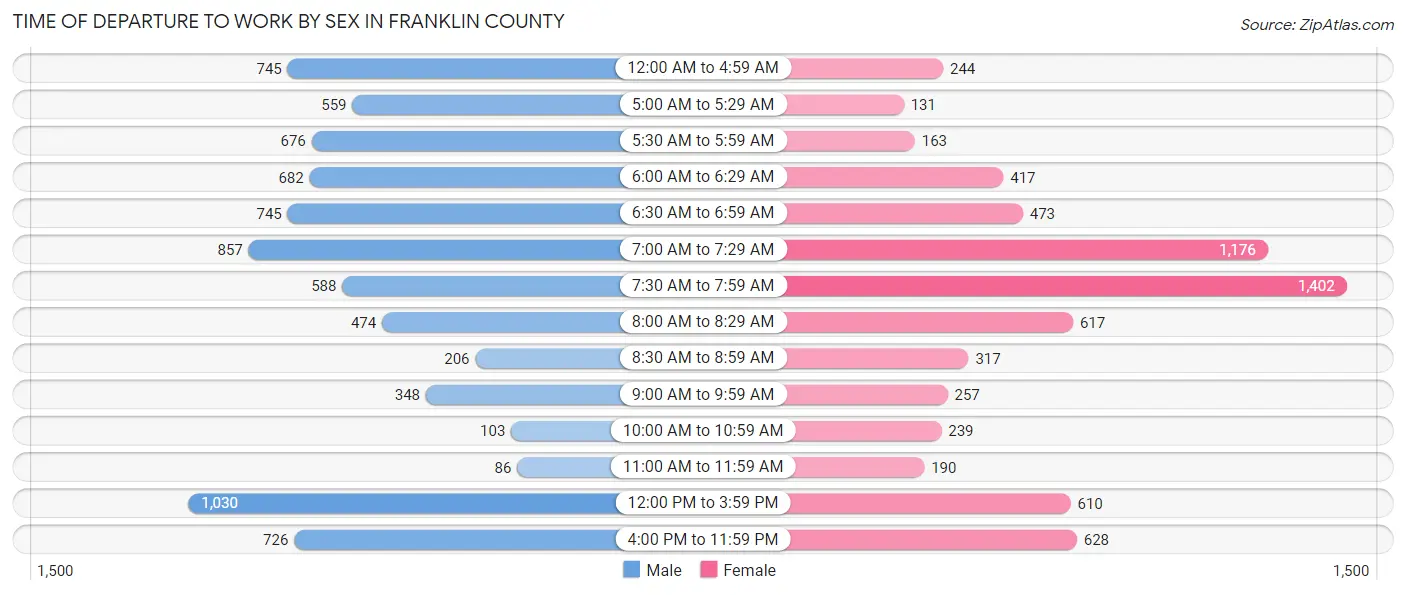
| Time of Departure | Male | Female |
| 12:00 AM to 4:59 AM | 745 (9.5%) | 244 (3.5%) |
| 5:00 AM to 5:29 AM | 559 (7.1%) | 131 (1.9%) |
| 5:30 AM to 5:59 AM | 676 (8.6%) | 163 (2.4%) |
| 6:00 AM to 6:29 AM | 682 (8.7%) | 417 (6.1%) |
| 6:30 AM to 6:59 AM | 745 (9.5%) | 473 (6.9%) |
| 7:00 AM to 7:29 AM | 857 (11.0%) | 1,176 (17.1%) |
| 7:30 AM to 7:59 AM | 588 (7.5%) | 1,402 (20.4%) |
| 8:00 AM to 8:29 AM | 474 (6.1%) | 617 (9.0%) |
| 8:30 AM to 8:59 AM | 206 (2.6%) | 317 (4.6%) |
| 9:00 AM to 9:59 AM | 348 (4.4%) | 257 (3.7%) |
| 10:00 AM to 10:59 AM | 103 (1.3%) | 239 (3.5%) |
| 11:00 AM to 11:59 AM | 86 (1.1%) | 190 (2.8%) |
| 12:00 PM to 3:59 PM | 1,030 (13.2%) | 610 (8.9%) |
| 4:00 PM to 11:59 PM | 726 (9.3%) | 628 (9.1%) |
| Total | 7,825 (100.0%) | 6,864 (100.0%) |
Housing Occupancy in Franklin County
Occupancy by Ownership in Franklin County
Of the total 16,095 dwellings in Franklin County, owner-occupied units account for 12,083 (75.1%), while renter-occupied units make up 4,012 (24.9%).
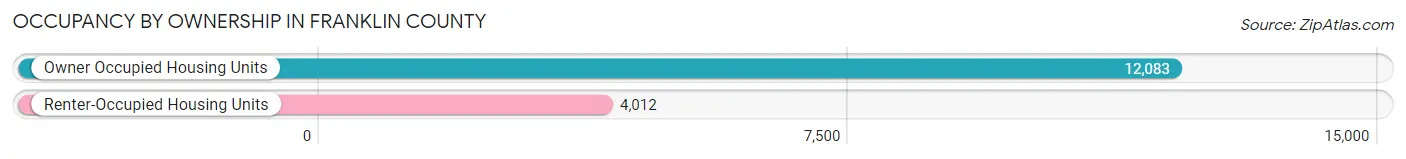
| Occupancy | # Housing Units | % Housing Units |
| Owner Occupied Housing Units | 12,083 | 75.1% |
| Renter-Occupied Housing Units | 4,012 | 24.9% |
| Total Occupied Housing Units | 16,095 | 100.0% |
Occupancy by Household Size in Franklin County
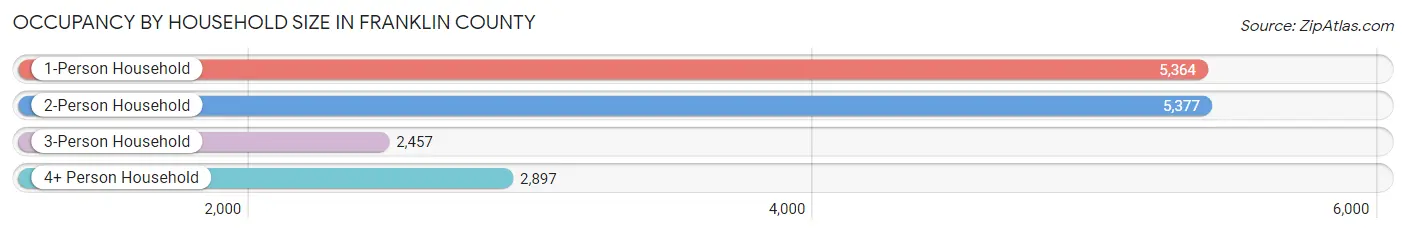
| Household Size | # Housing Units | % Housing Units |
| 1-Person Household | 5,364 | 33.3% |
| 2-Person Household | 5,377 | 33.4% |
| 3-Person Household | 2,457 | 15.3% |
| 4+ Person Household | 2,897 | 18.0% |
| Total Housing Units | 16,095 | 100.0% |
Occupancy by Ownership by Household Size in Franklin County
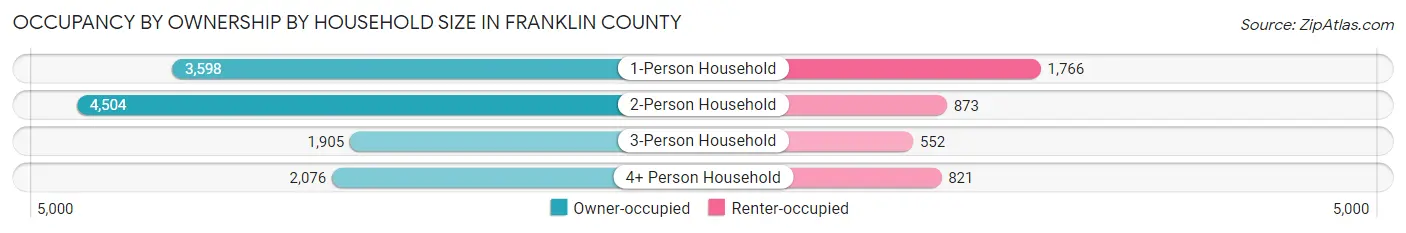
| Household Size | Owner-occupied | Renter-occupied |
| 1-Person Household | 3,598 (67.1%) | 1,766 (32.9%) |
| 2-Person Household | 4,504 (83.8%) | 873 (16.2%) |
| 3-Person Household | 1,905 (77.5%) | 552 (22.5%) |
| 4+ Person Household | 2,076 (71.7%) | 821 (28.3%) |
| Total Housing Units | 12,083 (75.1%) | 4,012 (24.9%) |
Occupancy by Educational Attainment in Franklin County
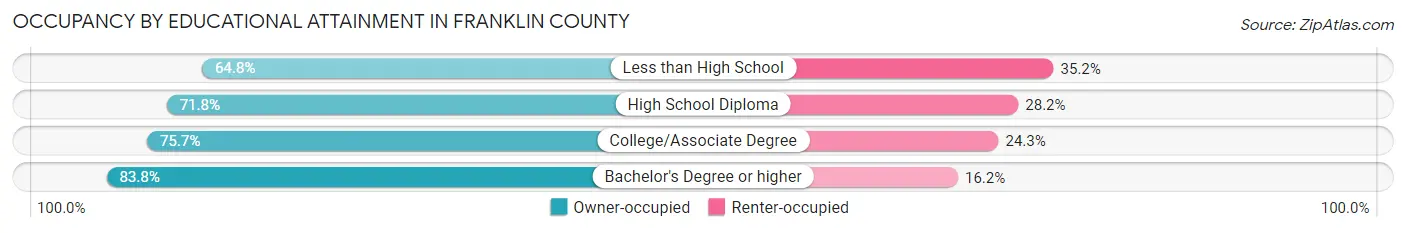
| Household Size | Owner-occupied | Renter-occupied |
| Less than High School | 934 (64.8%) | 507 (35.2%) |
| High School Diploma | 3,531 (71.8%) | 1,386 (28.2%) |
| College/Associate Degree | 5,070 (75.7%) | 1,625 (24.3%) |
| Bachelor's Degree or higher | 2,548 (83.8%) | 494 (16.2%) |
Occupancy by Age of Householder in Franklin County
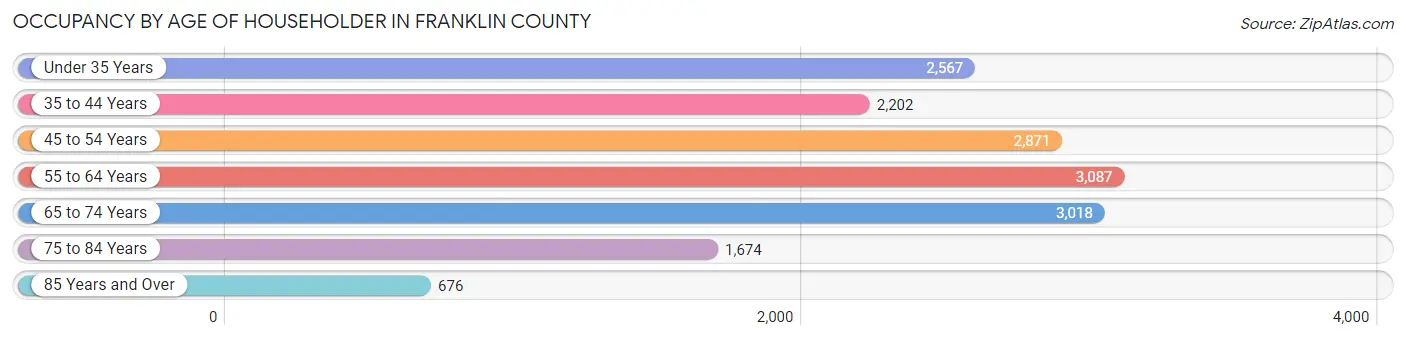
| Age Bracket | # Households | % Households |
| Under 35 Years | 2,567 | 16.0% |
| 35 to 44 Years | 2,202 | 13.7% |
| 45 to 54 Years | 2,871 | 17.8% |
| 55 to 64 Years | 3,087 | 19.2% |
| 65 to 74 Years | 3,018 | 18.8% |
| 75 to 84 Years | 1,674 | 10.4% |
| 85 Years and Over | 676 | 4.2% |
| Total | 16,095 | 100.0% |
Housing Finances in Franklin County
Median Income by Occupancy in Franklin County
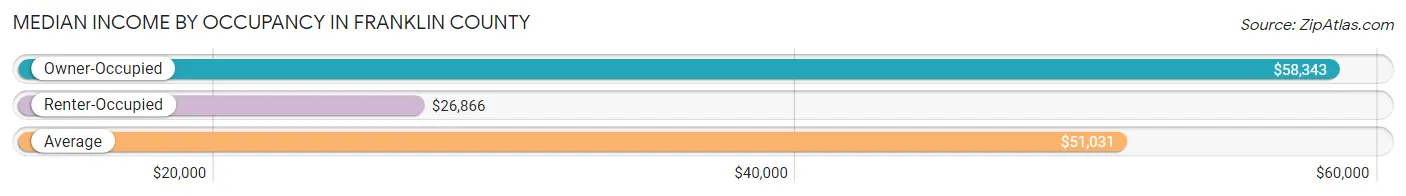
| Occupancy Type | # Households | Median Income |
| Owner-Occupied | 12,083 (75.1%) | $58,343 |
| Renter-Occupied | 4,012 (24.9%) | $26,866 |
| Average | 16,095 (100.0%) | $51,031 |
Occupancy by Householder Income Bracket in Franklin County
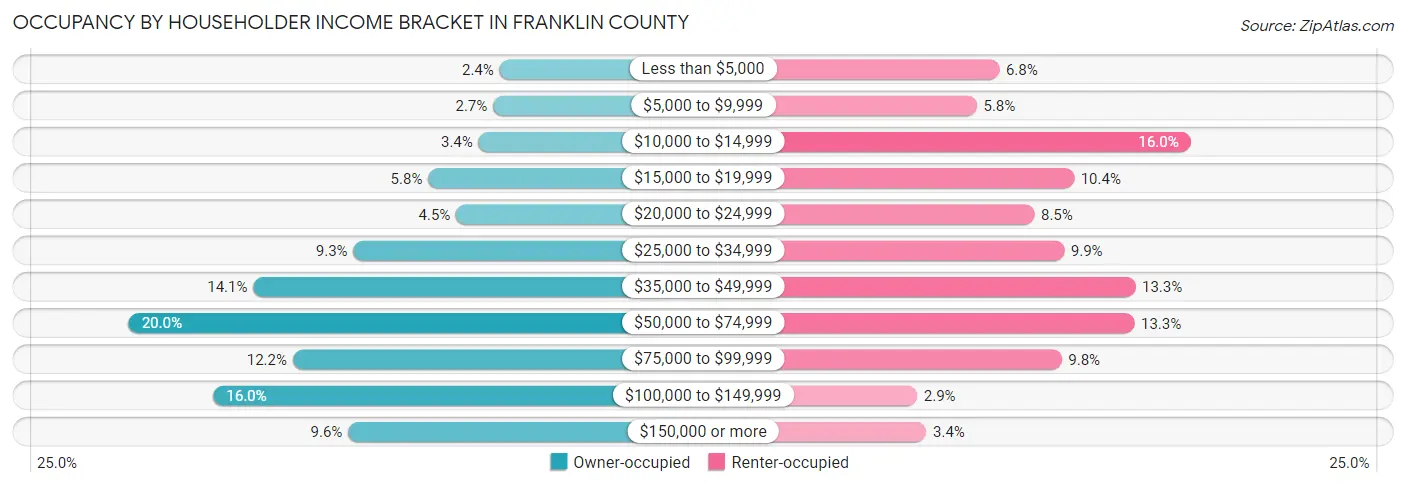
| Income Bracket | Owner-occupied | Renter-occupied |
| Less than $5,000 | 287 (2.4%) | 274 (6.8%) |
| $5,000 to $9,999 | 325 (2.7%) | 231 (5.8%) |
| $10,000 to $14,999 | 409 (3.4%) | 640 (16.0%) |
| $15,000 to $19,999 | 698 (5.8%) | 417 (10.4%) |
| $20,000 to $24,999 | 538 (4.4%) | 341 (8.5%) |
| $25,000 to $34,999 | 1,128 (9.3%) | 398 (9.9%) |
| $35,000 to $49,999 | 1,705 (14.1%) | 534 (13.3%) |
| $50,000 to $74,999 | 2,422 (20.0%) | 532 (13.3%) |
| $75,000 to $99,999 | 1,478 (12.2%) | 393 (9.8%) |
| $100,000 to $149,999 | 1,934 (16.0%) | 117 (2.9%) |
| $150,000 or more | 1,159 (9.6%) | 135 (3.4%) |
| Total | 12,083 (100.0%) | 4,012 (100.0%) |
Monthly Housing Cost Tiers in Franklin County
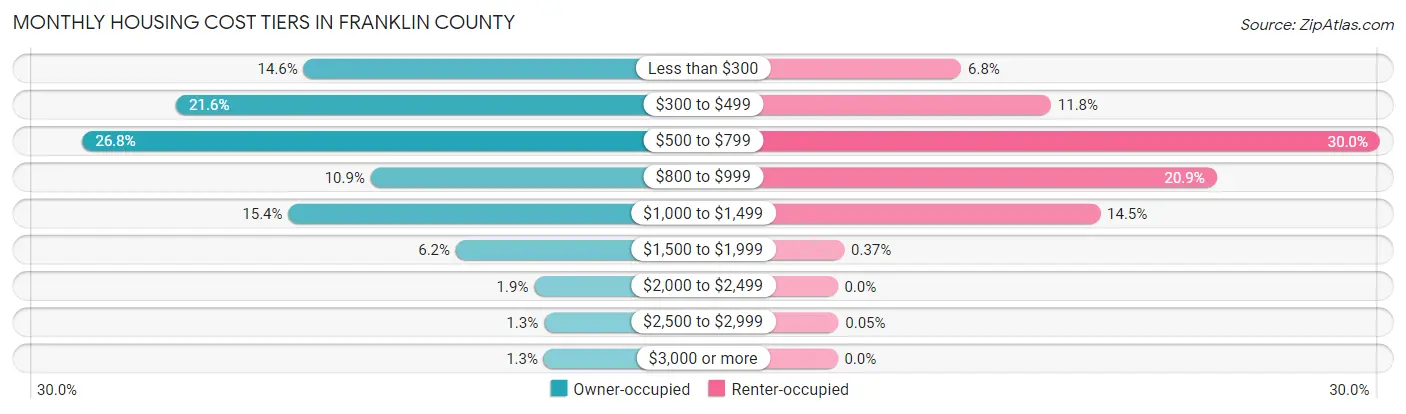
| Monthly Cost | Owner-occupied | Renter-occupied |
| Less than $300 | 1,763 (14.6%) | 274 (6.8%) |
| $300 to $499 | 2,613 (21.6%) | 473 (11.8%) |
| $500 to $799 | 3,239 (26.8%) | 1,202 (30.0%) |
| $800 to $999 | 1,315 (10.9%) | 840 (20.9%) |
| $1,000 to $1,499 | 1,864 (15.4%) | 582 (14.5%) |
| $1,500 to $1,999 | 747 (6.2%) | 15 (0.4%) |
| $2,000 to $2,499 | 224 (1.8%) | 0 (0.0%) |
| $2,500 to $2,999 | 158 (1.3%) | 2 (0.1%) |
| $3,000 or more | 160 (1.3%) | 0 (0.0%) |
| Total | 12,083 (100.0%) | 4,012 (100.0%) |
Physical Housing Characteristics in Franklin County
Housing Structures in Franklin County
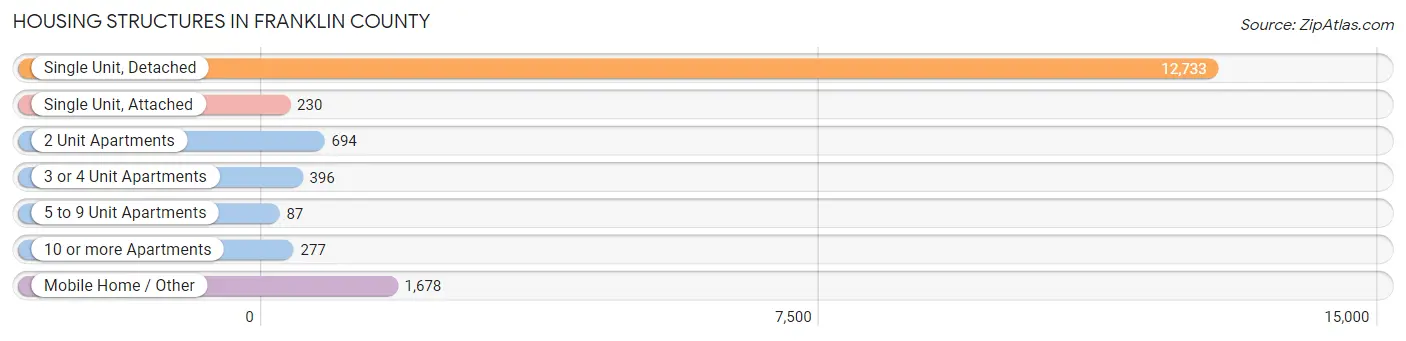
| Structure Type | # Housing Units | % Housing Units |
| Single Unit, Detached | 12,733 | 79.1% |
| Single Unit, Attached | 230 | 1.4% |
| 2 Unit Apartments | 694 | 4.3% |
| 3 or 4 Unit Apartments | 396 | 2.5% |
| 5 to 9 Unit Apartments | 87 | 0.5% |
| 10 or more Apartments | 277 | 1.7% |
| Mobile Home / Other | 1,678 | 10.4% |
| Total | 16,095 | 100.0% |
Housing Structures by Occupancy in Franklin County
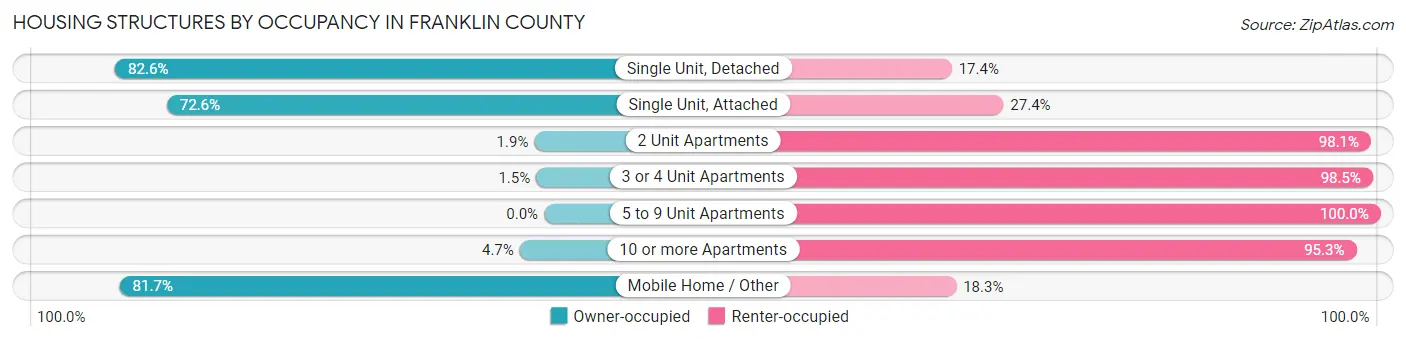
| Structure Type | Owner-occupied | Renter-occupied |
| Single Unit, Detached | 10,513 (82.6%) | 2,220 (17.4%) |
| Single Unit, Attached | 167 (72.6%) | 63 (27.4%) |
| 2 Unit Apartments | 13 (1.9%) | 681 (98.1%) |
| 3 or 4 Unit Apartments | 6 (1.5%) | 390 (98.5%) |
| 5 to 9 Unit Apartments | 0 (0.0%) | 87 (100.0%) |
| 10 or more Apartments | 13 (4.7%) | 264 (95.3%) |
| Mobile Home / Other | 1,371 (81.7%) | 307 (18.3%) |
| Total | 12,083 (75.1%) | 4,012 (24.9%) |
Housing Structures by Number of Rooms in Franklin County
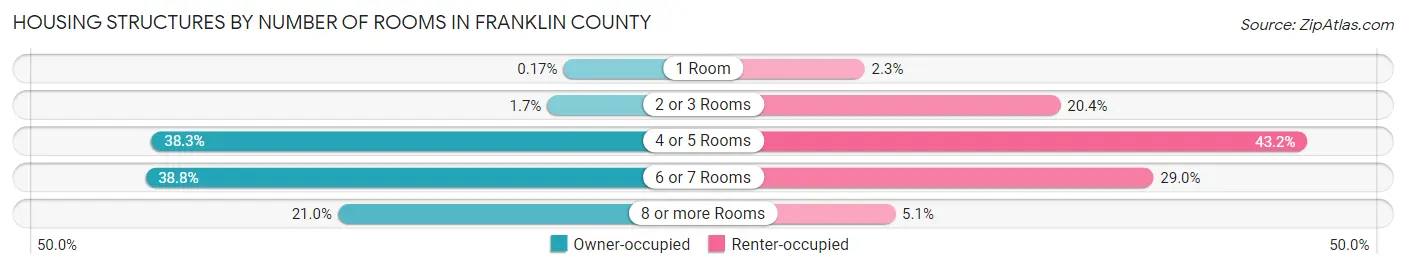
| Number of Rooms | Owner-occupied | Renter-occupied |
| 1 Room | 21 (0.2%) | 92 (2.3%) |
| 2 or 3 Rooms | 202 (1.7%) | 818 (20.4%) |
| 4 or 5 Rooms | 4,625 (38.3%) | 1,734 (43.2%) |
| 6 or 7 Rooms | 4,693 (38.8%) | 1,163 (29.0%) |
| 8 or more Rooms | 2,542 (21.0%) | 205 (5.1%) |
| Total | 12,083 (100.0%) | 4,012 (100.0%) |
Housing Structure by Heating Type in Franklin County
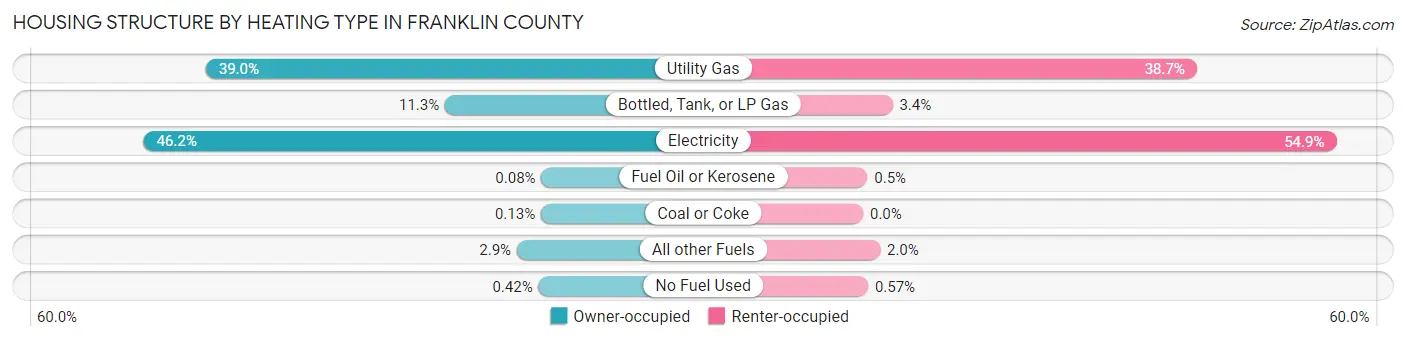
| Heating Type | Owner-occupied | Renter-occupied |
| Utility Gas | 4,711 (39.0%) | 1,552 (38.7%) |
| Bottled, Tank, or LP Gas | 1,359 (11.3%) | 137 (3.4%) |
| Electricity | 5,583 (46.2%) | 2,201 (54.9%) |
| Fuel Oil or Kerosene | 10 (0.1%) | 20 (0.5%) |
| Coal or Coke | 16 (0.1%) | 0 (0.0%) |
| All other Fuels | 353 (2.9%) | 79 (2.0%) |
| No Fuel Used | 51 (0.4%) | 23 (0.6%) |
| Total | 12,083 (100.0%) | 4,012 (100.0%) |
Household Vehicle Usage in Franklin County
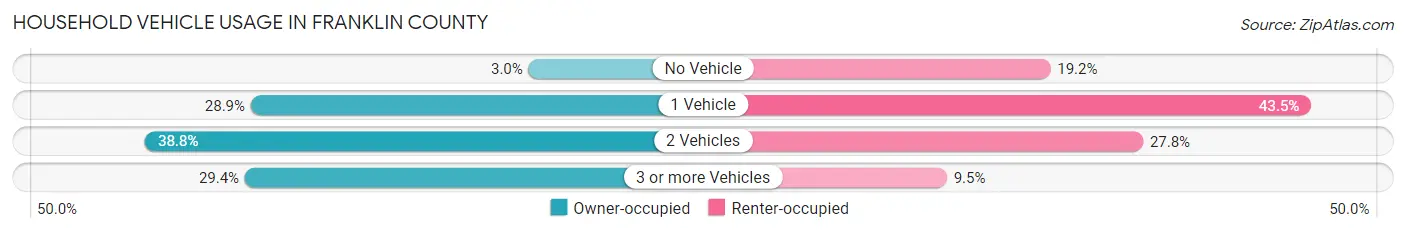
| Vehicles per Household | Owner-occupied | Renter-occupied |
| No Vehicle | 356 (2.9%) | 769 (19.2%) |
| 1 Vehicle | 3,489 (28.9%) | 1,746 (43.5%) |
| 2 Vehicles | 4,682 (38.8%) | 1,116 (27.8%) |
| 3 or more Vehicles | 3,556 (29.4%) | 381 (9.5%) |
| Total | 12,083 (100.0%) | 4,012 (100.0%) |
Real Estate & Mortgages in Franklin County
Real Estate and Mortgage Overview in Franklin County
| Characteristic | Without Mortgage | With Mortgage |
| Housing Units | 7,190 | 4,893 |
| Median Property Value | $74,800 | $105,800 |
| Median Household Income | $50,252 | $559 |
| Monthly Housing Costs | $445 | $94 |
| Real Estate Taxes | $1,166 | $170 |
Property Value by Mortgage Status in Franklin County
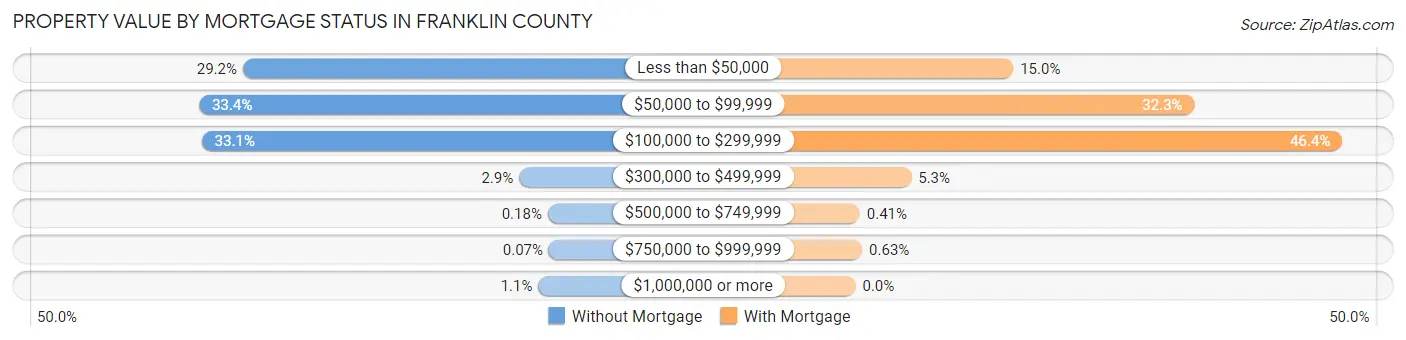
| Property Value | Without Mortgage | With Mortgage |
| Less than $50,000 | 2,101 (29.2%) | 735 (15.0%) |
| $50,000 to $99,999 | 2,401 (33.4%) | 1,579 (32.3%) |
| $100,000 to $299,999 | 2,383 (33.1%) | 2,268 (46.4%) |
| $300,000 to $499,999 | 209 (2.9%) | 260 (5.3%) |
| $500,000 to $749,999 | 13 (0.2%) | 20 (0.4%) |
| $750,000 to $999,999 | 5 (0.1%) | 31 (0.6%) |
| $1,000,000 or more | 78 (1.1%) | 0 (0.0%) |
| Total | 7,190 (100.0%) | 4,893 (100.0%) |
Household Income by Mortgage Status in Franklin County
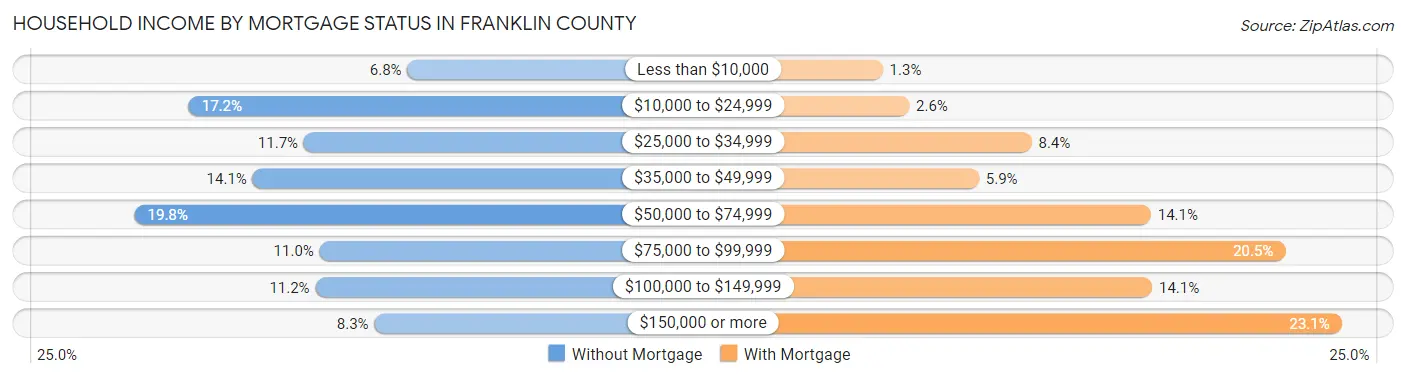
| Household Income | Without Mortgage | With Mortgage |
| Less than $10,000 | 487 (6.8%) | 63 (1.3%) |
| $10,000 to $24,999 | 1,235 (17.2%) | 125 (2.5%) |
| $25,000 to $34,999 | 841 (11.7%) | 410 (8.4%) |
| $35,000 to $49,999 | 1,017 (14.1%) | 287 (5.9%) |
| $50,000 to $74,999 | 1,421 (19.8%) | 688 (14.1%) |
| $75,000 to $99,999 | 787 (11.0%) | 1,001 (20.5%) |
| $100,000 to $149,999 | 802 (11.2%) | 691 (14.1%) |
| $150,000 or more | 600 (8.3%) | 1,132 (23.1%) |
| Total | 7,190 (100.0%) | 4,893 (100.0%) |
Property Value to Household Income Ratio in Franklin County
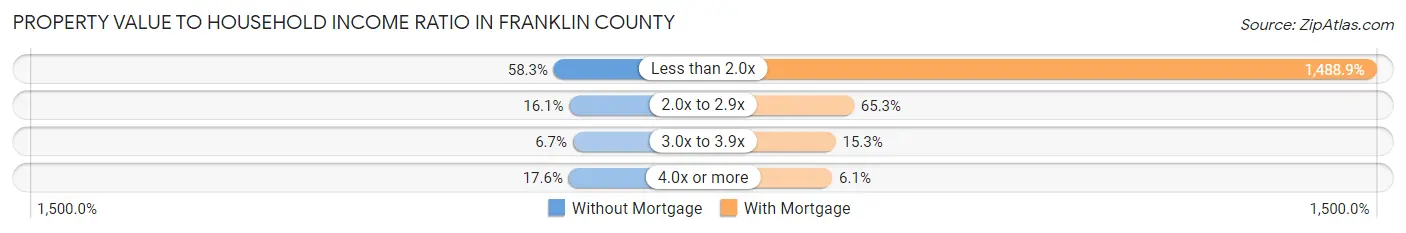
| Value-to-Income Ratio | Without Mortgage | With Mortgage |
| Less than 2.0x | 4,195 (58.3%) | 72,850 (1,488.9%) |
| 2.0x to 2.9x | 1,159 (16.1%) | 3,193 (65.3%) |
| 3.0x to 3.9x | 481 (6.7%) | 747 (15.3%) |
| 4.0x or more | 1,268 (17.6%) | 296 (6.0%) |
| Total | 7,190 (100.0%) | 4,893 (100.0%) |
Real Estate Taxes by Mortgage Status in Franklin County
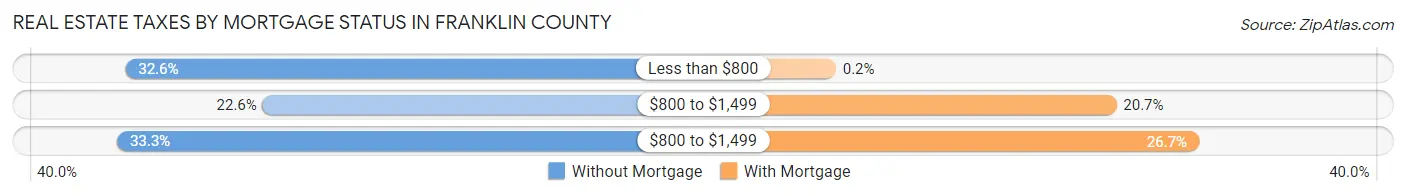
| Property Taxes | Without Mortgage | With Mortgage |
| Less than $800 | 2,347 (32.6%) | 10 (0.2%) |
| $800 to $1,499 | 1,626 (22.6%) | 1,013 (20.7%) |
| $800 to $1,499 | 2,391 (33.3%) | 1,308 (26.7%) |
| Total | 7,190 (100.0%) | 4,893 (100.0%) |
Health & Disability in Franklin County
Health Insurance Coverage by Age in Franklin County
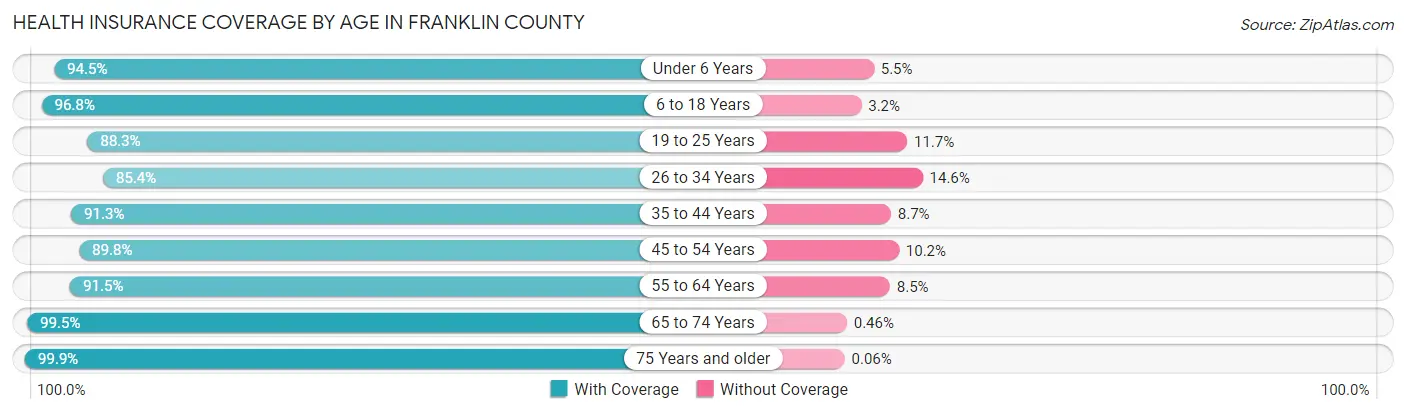
| Age Bracket | With Coverage | Without Coverage |
| Under 6 Years | 2,354 (94.5%) | 137 (5.5%) |
| 6 to 18 Years | 6,049 (96.8%) | 198 (3.2%) |
| 19 to 25 Years | 2,415 (88.3%) | 320 (11.7%) |
| 26 to 34 Years | 3,270 (85.4%) | 559 (14.6%) |
| 35 to 44 Years | 3,965 (91.3%) | 377 (8.7%) |
| 45 to 54 Years | 4,424 (89.8%) | 501 (10.2%) |
| 55 to 64 Years | 4,821 (91.5%) | 447 (8.5%) |
| 65 to 74 Years | 4,283 (99.5%) | 20 (0.5%) |
| 75 Years and older | 3,200 (99.9%) | 2 (0.1%) |
| Total | 34,781 (93.1%) | 2,561 (6.9%) |
Health Insurance Coverage by Citizenship Status in Franklin County
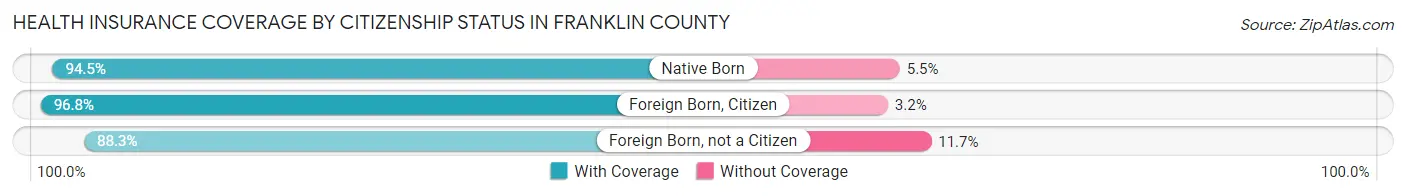
| Citizenship Status | With Coverage | Without Coverage |
| Native Born | 2,354 (94.5%) | 137 (5.5%) |
| Foreign Born, Citizen | 6,049 (96.8%) | 198 (3.2%) |
| Foreign Born, not a Citizen | 2,415 (88.3%) | 320 (11.7%) |
Health Insurance Coverage by Household Income in Franklin County
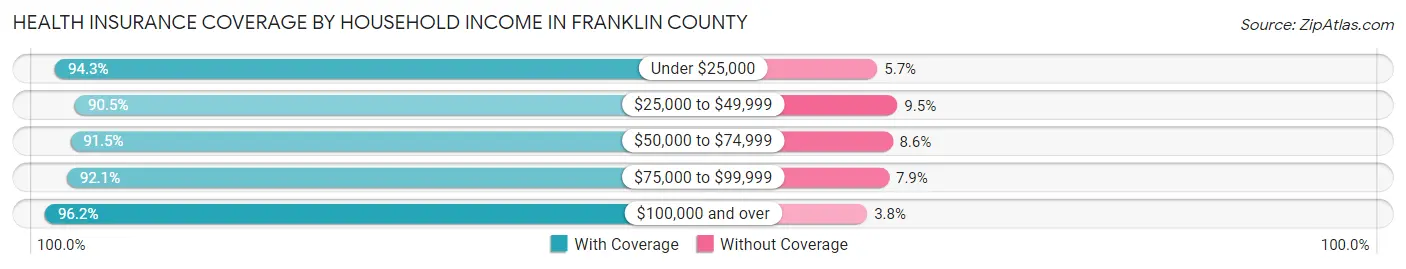
| Household Income | With Coverage | Without Coverage |
| Under $25,000 | 6,550 (94.3%) | 398 (5.7%) |
| $25,000 to $49,999 | 7,074 (90.5%) | 741 (9.5%) |
| $50,000 to $74,999 | 6,719 (91.4%) | 628 (8.6%) |
| $75,000 to $99,999 | 4,750 (92.1%) | 408 (7.9%) |
| $100,000 and over | 9,684 (96.2%) | 386 (3.8%) |
Public vs Private Health Insurance Coverage by Age in Franklin County
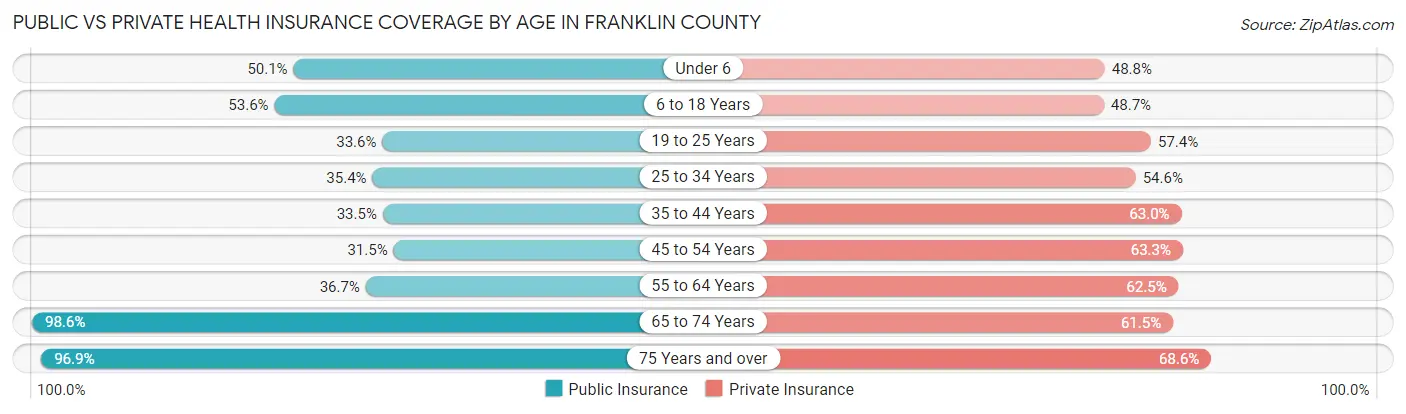
| Age Bracket | Public Insurance | Private Insurance |
| Under 6 | 1,248 (50.1%) | 1,216 (48.8%) |
| 6 to 18 Years | 3,350 (53.6%) | 3,039 (48.6%) |
| 19 to 25 Years | 919 (33.6%) | 1,570 (57.4%) |
| 25 to 34 Years | 1,357 (35.4%) | 2,089 (54.6%) |
| 35 to 44 Years | 1,456 (33.5%) | 2,737 (63.0%) |
| 45 to 54 Years | 1,553 (31.5%) | 3,117 (63.3%) |
| 55 to 64 Years | 1,933 (36.7%) | 3,293 (62.5%) |
| 65 to 74 Years | 4,243 (98.6%) | 2,645 (61.5%) |
| 75 Years and over | 3,103 (96.9%) | 2,195 (68.5%) |
| Total | 19,162 (51.3%) | 21,901 (58.7%) |
Disability Status by Sex by Age in Franklin County
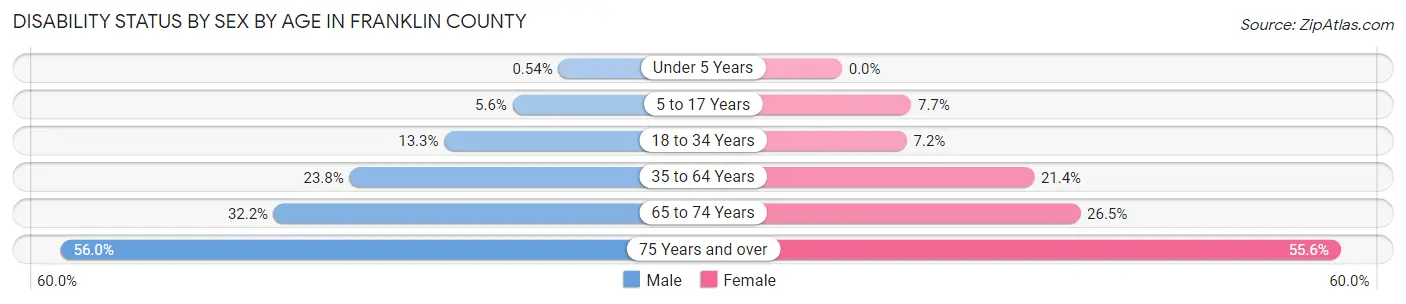
| Age Bracket | Male | Female |
| Under 5 Years | 6 (0.5%) | 0 (0.0%) |
| 5 to 17 Years | 184 (5.6%) | 225 (7.7%) |
| 18 to 34 Years | 476 (13.3%) | 243 (7.2%) |
| 35 to 64 Years | 1,724 (23.8%) | 1,561 (21.4%) |
| 65 to 74 Years | 663 (32.2%) | 596 (26.5%) |
| 75 Years and over | 771 (56.0%) | 1,014 (55.6%) |
Disability Class by Sex by Age in Franklin County
Disability Class: Hearing Difficulty
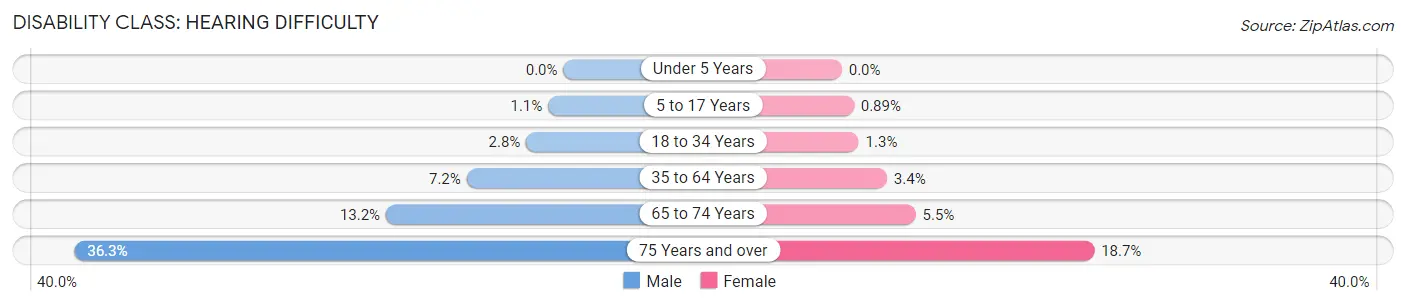
| Age Bracket | Male | Female |
| Under 5 Years | 0 (0.0%) | 0 (0.0%) |
| 5 to 17 Years | 37 (1.1%) | 26 (0.9%) |
| 18 to 34 Years | 99 (2.8%) | 42 (1.3%) |
| 35 to 64 Years | 520 (7.2%) | 244 (3.4%) |
| 65 to 74 Years | 271 (13.2%) | 123 (5.5%) |
| 75 Years and over | 500 (36.3%) | 342 (18.7%) |
Disability Class: Vision Difficulty
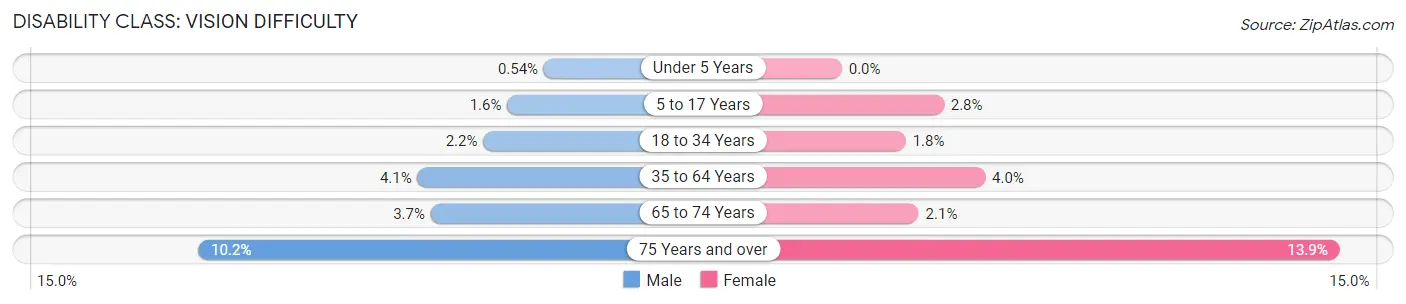
| Age Bracket | Male | Female |
| Under 5 Years | 6 (0.5%) | 0 (0.0%) |
| 5 to 17 Years | 51 (1.6%) | 83 (2.8%) |
| 18 to 34 Years | 80 (2.2%) | 60 (1.8%) |
| 35 to 64 Years | 294 (4.1%) | 291 (4.0%) |
| 65 to 74 Years | 76 (3.7%) | 48 (2.1%) |
| 75 Years and over | 140 (10.2%) | 253 (13.9%) |
Disability Class: Cognitive Difficulty
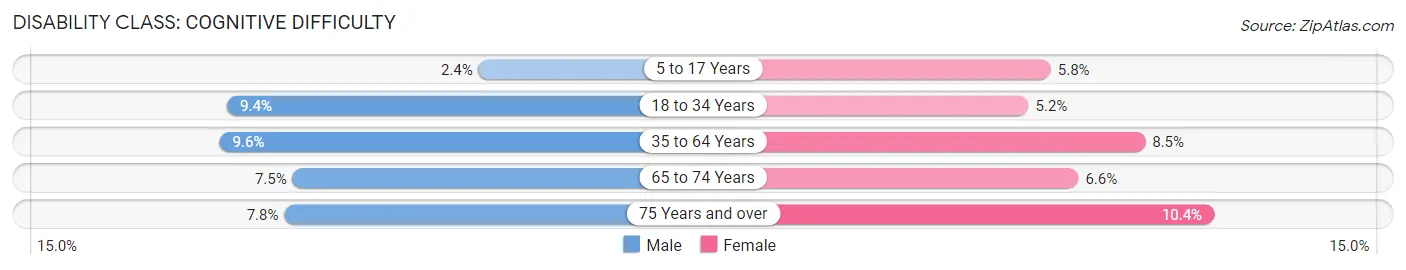
| Age Bracket | Male | Female |
| 5 to 17 Years | 77 (2.4%) | 170 (5.8%) |
| 18 to 34 Years | 336 (9.4%) | 175 (5.2%) |
| 35 to 64 Years | 693 (9.6%) | 616 (8.5%) |
| 65 to 74 Years | 155 (7.5%) | 148 (6.6%) |
| 75 Years and over | 107 (7.8%) | 189 (10.4%) |
Disability Class: Ambulatory Difficulty
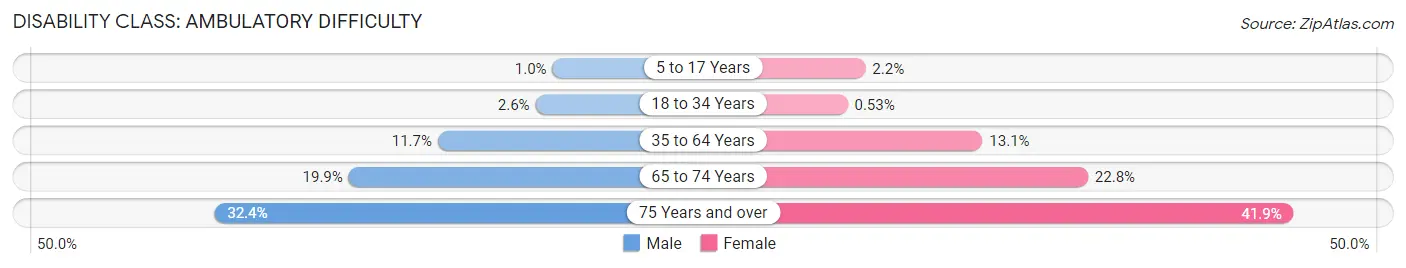
| Age Bracket | Male | Female |
| 5 to 17 Years | 33 (1.0%) | 64 (2.2%) |
| 18 to 34 Years | 93 (2.6%) | 18 (0.5%) |
| 35 to 64 Years | 844 (11.7%) | 952 (13.1%) |
| 65 to 74 Years | 410 (19.9%) | 513 (22.8%) |
| 75 Years and over | 446 (32.4%) | 765 (41.9%) |
Disability Class: Self-Care Difficulty
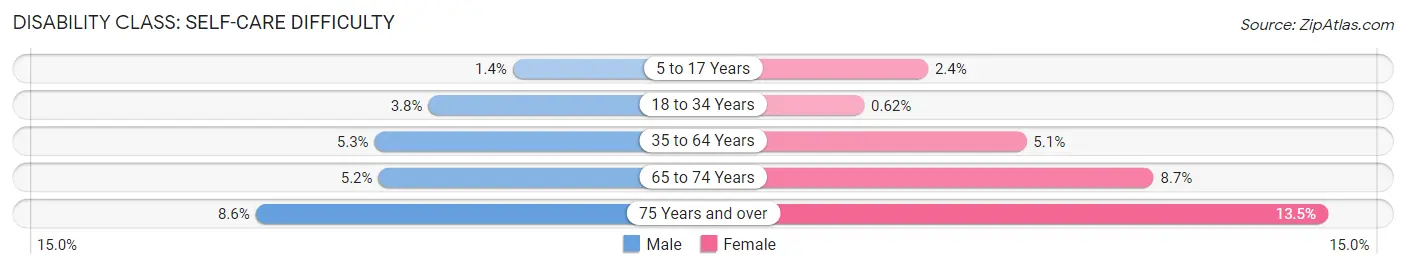
| Age Bracket | Male | Female |
| 5 to 17 Years | 46 (1.4%) | 70 (2.4%) |
| 18 to 34 Years | 135 (3.8%) | 21 (0.6%) |
| 35 to 64 Years | 381 (5.3%) | 375 (5.1%) |
| 65 to 74 Years | 106 (5.1%) | 195 (8.7%) |
| 75 Years and over | 118 (8.6%) | 247 (13.5%) |
Technology Access in Franklin County
Computing Device Access in Franklin County
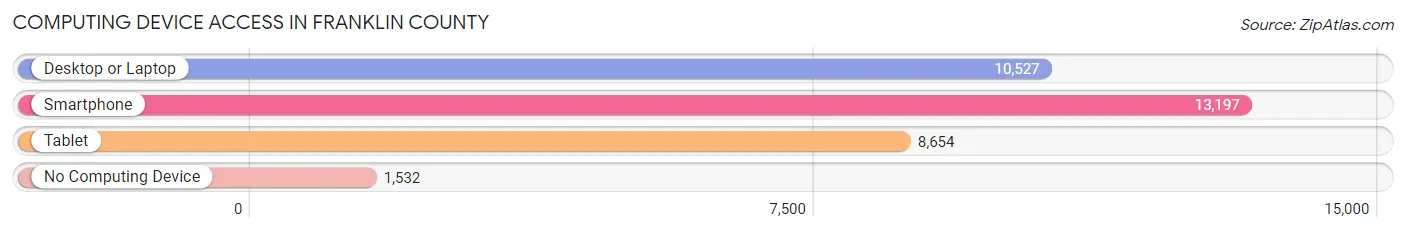
| Device Type | # Households | % Households |
| Desktop or Laptop | 10,527 | 65.4% |
| Smartphone | 13,197 | 82.0% |
| Tablet | 8,654 | 53.8% |
| No Computing Device | 1,532 | 9.5% |
| Total | 16,095 | 100.0% |
Internet Access in Franklin County
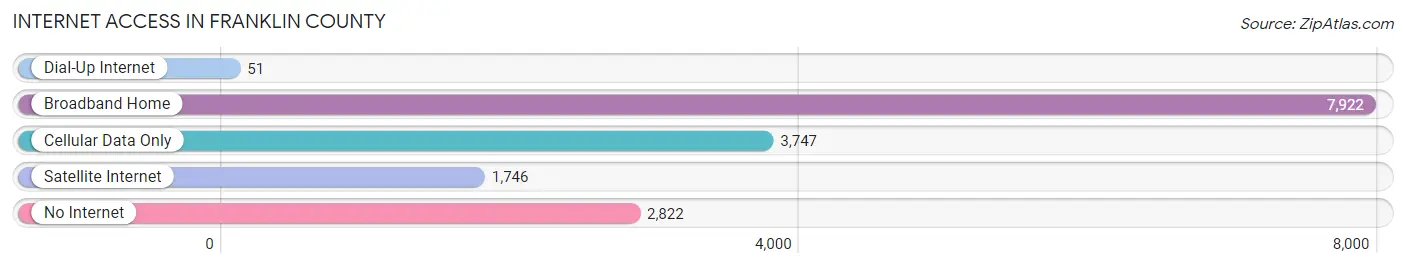
| Internet Type | # Households | % Households |
| Dial-Up Internet | 51 | 0.3% |
| Broadband Home | 7,922 | 49.2% |
| Cellular Data Only | 3,747 | 23.3% |
| Satellite Internet | 1,746 | 10.8% |
| No Internet | 2,822 | 17.5% |
| Total | 16,095 | 100.0% |
Franklin County Summary
Franklin County, Illinois is located in the south-central part of the state, and is bordered by Jefferson County to the north, Williamson County to the east, Jackson County to the south, and Perry County to the west. The county seat is Benton, and the county is named after Benjamin Franklin. The county has a total area of 576 square miles, and a population of 39,561 as of the 2010 census.
History
Franklin County was formed in 1818 from parts of Gallatin and White counties. The county was named after Benjamin Franklin, one of the Founding Fathers of the United States. The first settlers in the area were French traders and trappers, who were followed by American settlers in the early 1800s. The county was officially organized in 1821, and the first county seat was located in the town of Frankfort. The county seat was moved to Benton in 1824, and the county has remained there ever since.
Geography
Franklin County is located in the south-central part of Illinois, and is bordered by Jefferson County to the north, Williamson County to the east, Jackson County to the south, and Perry County to the west. The county has a total area of 576 square miles, and is mostly flat with some rolling hills. The county is drained by the Big Muddy River, which flows through the county from north to south. The county is also home to several small lakes, including Lake Benton, Lake of Egypt, and Rend Lake.
Economy
Franklin County has a diverse economy, with a mix of agriculture, manufacturing, and services. The county is home to several large employers, including the Franklin County Hospital, Franklin County Schools, and the Franklin County Sheriff's Office. Agriculture is a major part of the county's economy, with corn, soybeans, and wheat being the main crops. Manufacturing is also an important part of the economy, with several factories located in the county. The county is also home to several small businesses, including restaurants, retail stores, and service providers.
Demographics
As of the 2010 census, there were 39,561 people, 15,845 households, and 11,072 families living in Franklin County. The population density was 68.3 people per square mile. The racial makeup of the county was 97.2% White, 0.7% African American, 0.3% Native American, 0.3% Asian, 0.2% from other races, and 1.3% from two or more races. Hispanic or Latino of any race were 1.2% of the population.
The median income for a household in the county was $41,945, and the median income for a family was $50,945. The per capita income for the county was $20,945. About 11.2% of families and 14.2% of the population were below the poverty line, including 19.2% of those under age 18 and 8.2% of those age 65 or over.
Overall, Franklin County is a rural county with a diverse economy and a population that is mostly white. The county has a strong agricultural base, and is home to several large employers. The county also has a low poverty rate and a median income that is higher than the state average.
Common Questions
What is Per Capita Income in Franklin County?
Per Capita income in Franklin County is $28,310.
What is the Median Family Income in Franklin County?
Median Family Income in Franklin County is $63,869.
What is the Median Household income in Franklin County?
Median Household Income in Franklin County is $51,031.
What is Income or Wage Gap in Franklin County?
Income or Wage Gap in Franklin County is 38.6%.
Women in Franklin County earn 61.4 cents for every dollar earned by a man.
What is Family Income Deficit in Franklin County?
Family Income Deficit in Franklin County is $9,934.
Families that are below poverty line in Franklin County earn $9,934 less on average than the poverty threshold level.
What is Inequality or Gini Index in Franklin County?
Inequality or Gini Index in Franklin County is 0.45.
What is the Total Population of Franklin County?
Total Population of Franklin County is 37,810.
What is the Total Male Population of Franklin County?
Total Male Population of Franklin County is 18,902.
What is the Total Female Population of Franklin County?
Total Female Population of Franklin County is 18,908.
What is the Ratio of Males per 100 Females in Franklin County?
There are 99.97 Males per 100 Females in Franklin County.
What is the Ratio of Females per 100 Males in Franklin County?
There are 100.03 Females per 100 Males in Franklin County.
What is the Median Population Age in Franklin County?
Median Population Age in Franklin County is 43.2 Years.
What is the Average Family Size in Franklin County
Average Family Size in Franklin County is 2.9 People.
What is the Average Household Size in Franklin County
Average Household Size in Franklin County is 2.3 People.
How Large is the Labor Force in Franklin County?
There are 17,013 People in the Labor Forcein in Franklin County.
What is the Percentage of People in the Labor Force in Franklin County?
55.9% of People are in the Labor Force in Franklin County.
What is the Unemployment Rate in Franklin County?
Unemployment Rate in Franklin County is 6.7%.