Edwards County, IL Map & Demographics
Edwards County Overview
$31,081
PER CAPITA INCOME
$74,297
AVG FAMILY INCOME
$60,784
AVG HOUSEHOLD INCOME
44.8%
WAGE / INCOME GAP [ % ]
55.2¢/ $1
WAGE / INCOME GAP [ $ ]
$10,123
FAMILY INCOME DEFICIT
0.41
INEQUALITY / GINI INDEX
6,182
TOTAL POPULATION
3,064
MALE POPULATION
3,118
FEMALE POPULATION
98.27
MALES / 100 FEMALES
101.76
FEMALES / 100 MALES
44.2
MEDIAN AGE
2.9
AVG FAMILY SIZE
2.3
AVG HOUSEHOLD SIZE
2,889
LABOR FORCE [ PEOPLE ]
58.1%
PERCENT IN LABOR FORCE
6.7%
UNEMPLOYMENT RATE
Edwards County Area Codes
Income in Edwards County
Income Overview in Edwards County
Per Capita Income in Edwards County is $31,081, while median incomes of families and households are $74,297 and $60,784 respectively.
| Characteristic | Number | Measure |
| Per Capita Income | 6,182 | $31,081 |
| Median Family Income | 1,753 | $74,297 |
| Mean Family Income | 1,753 | $88,343 |
| Median Household Income | 2,625 | $60,784 |
| Mean Household Income | 2,625 | $73,519 |
| Income Deficit | 1,753 | $10,123 |
| Wage / Income Gap (%) | 6,182 | 44.77% |
| Wage / Income Gap ($) | 6,182 | 55.23¢ per $1 |
| Gini / Inequality Index | 6,182 | 0.41 |
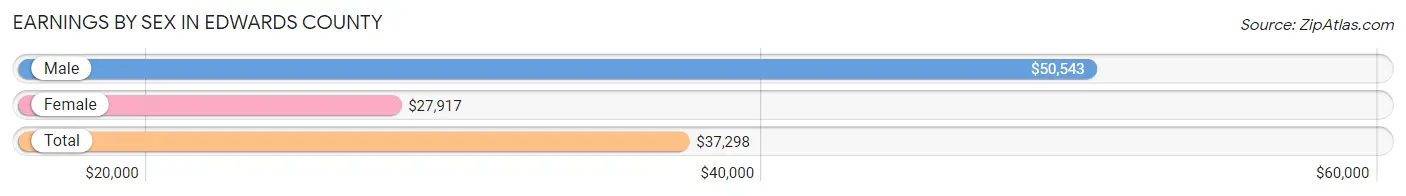
Earnings by Sex in Edwards County
Average Earnings in Edwards County are $37,298, $50,543 for men and $27,917 for women, a difference of 44.8%.
| Sex | Number | Average Earnings |
| Male | 1,678 (56.2%) | $50,543 |
| Female | 1,310 (43.8%) | $27,917 |
| Total | 2,988 (100.0%) | $37,298 |
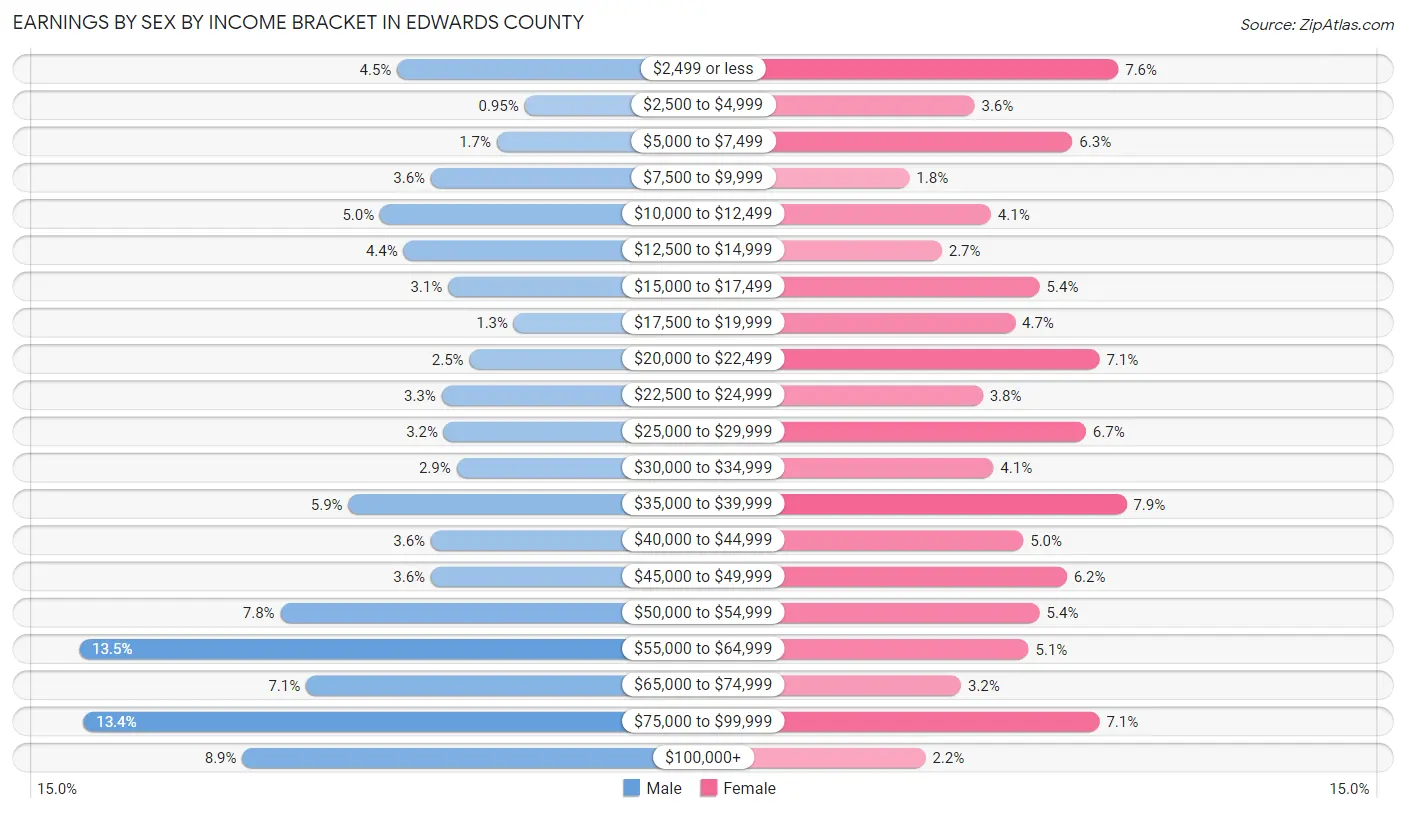
Earnings by Sex by Income Bracket in Edwards County
The most common earnings brackets in Edwards County are $55,000 to $64,999 for men (226 | 13.5%) and $35,000 to $39,999 for women (103 | 7.9%).
| Income | Male | Female |
| $2,499 or less | 76 (4.5%) | 100 (7.6%) |
| $2,500 to $4,999 | 16 (0.9%) | 47 (3.6%) |
| $5,000 to $7,499 | 29 (1.7%) | 83 (6.3%) |
| $7,500 to $9,999 | 60 (3.6%) | 23 (1.8%) |
| $10,000 to $12,499 | 84 (5.0%) | 53 (4.1%) |
| $12,500 to $14,999 | 73 (4.3%) | 35 (2.7%) |
| $15,000 to $17,499 | 52 (3.1%) | 71 (5.4%) |
| $17,500 to $19,999 | 21 (1.3%) | 62 (4.7%) |
| $20,000 to $22,499 | 42 (2.5%) | 93 (7.1%) |
| $22,500 to $24,999 | 55 (3.3%) | 50 (3.8%) |
| $25,000 to $29,999 | 54 (3.2%) | 88 (6.7%) |
| $30,000 to $34,999 | 48 (2.9%) | 54 (4.1%) |
| $35,000 to $39,999 | 99 (5.9%) | 103 (7.9%) |
| $40,000 to $44,999 | 60 (3.6%) | 65 (5.0%) |
| $45,000 to $49,999 | 60 (3.6%) | 81 (6.2%) |
| $50,000 to $54,999 | 131 (7.8%) | 71 (5.4%) |
| $55,000 to $64,999 | 226 (13.5%) | 67 (5.1%) |
| $65,000 to $74,999 | 119 (7.1%) | 42 (3.2%) |
| $75,000 to $99,999 | 224 (13.4%) | 93 (7.1%) |
| $100,000+ | 149 (8.9%) | 29 (2.2%) |
| Total | 1,678 (100.0%) | 1,310 (100.0%) |
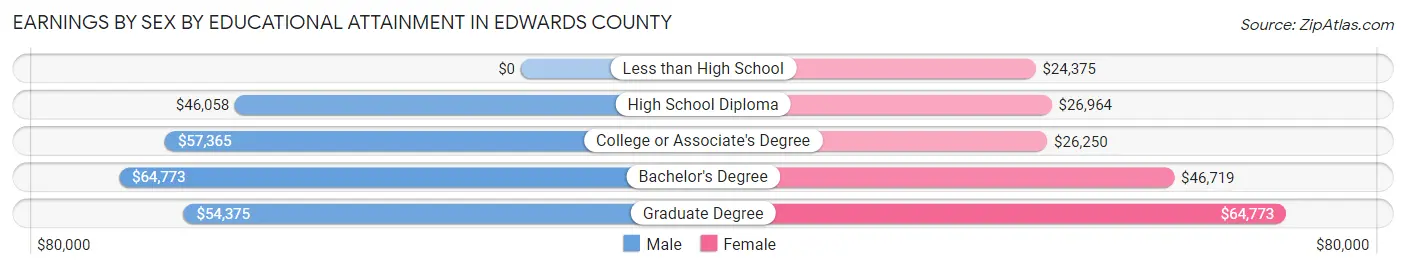
Earnings by Sex by Educational Attainment in Edwards County
Average earnings in Edwards County are $53,441 for men and $31,944 for women, a difference of 40.2%. Men with an educational attainment of bachelor's degree enjoy the highest average annual earnings of $64,773, while those with high school diploma education earn the least with $46,058. Women with an educational attainment of graduate degree earn the most with the average annual earnings of $64,773, while those with less than high school education have the smallest earnings of $24,375.
| Educational Attainment | Male Income | Female Income |
| Less than High School | - | - |
| High School Diploma | $46,058 | $26,964 |
| College or Associate's Degree | $57,365 | $26,250 |
| Bachelor's Degree | $64,773 | $46,719 |
| Graduate Degree | $54,375 | $64,773 |
| Total | $53,441 | $31,944 |
Family Income in Edwards County
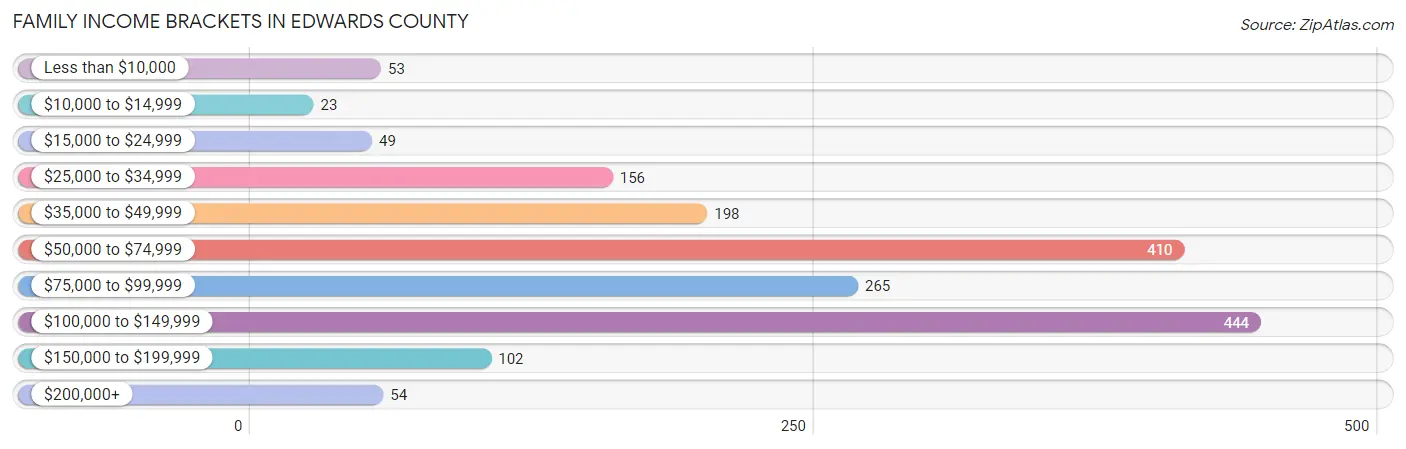
Family Income Brackets in Edwards County
According to the Edwards County family income data, there are 444 families falling into the $100,000 to $149,999 income range, which is the most common income bracket and makes up 25.3% of all families. Conversely, the $10,000 to $14,999 income bracket is the least frequent group with only 23 families (1.3%) belonging to this category.
| Income Bracket | # Families | % Families |
| Less than $10,000 | 53 | 3.0% |
| $10,000 to $14,999 | 23 | 1.3% |
| $15,000 to $24,999 | 49 | 2.8% |
| $25,000 to $34,999 | 156 | 8.9% |
| $35,000 to $49,999 | 198 | 11.3% |
| $50,000 to $74,999 | 410 | 23.4% |
| $75,000 to $99,999 | 265 | 15.1% |
| $100,000 to $149,999 | 444 | 25.3% |
| $150,000 to $199,999 | 102 | 5.8% |
| $200,000+ | 54 | 3.1% |
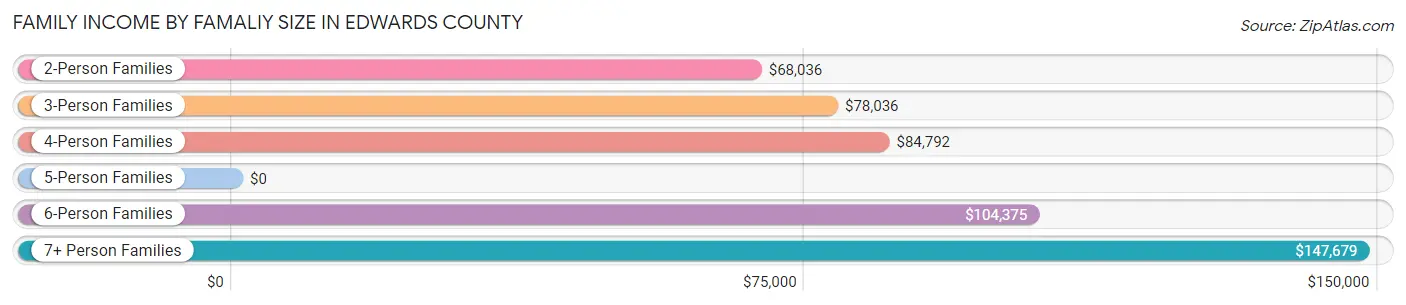
Family Income by Famaliy Size in Edwards County
7+ person families (13 | 0.7%) account for the highest median family income in Edwards County with $147,679 per family, while 2-person families (952 | 54.3%) have the highest median income of $34,018 per family member.
| Income Bracket | # Families | Median Income |
| 2-Person Families | 952 (54.3%) | $68,036 |
| 3-Person Families | 343 (19.6%) | $78,036 |
| 4-Person Families | 269 (15.3%) | $84,792 |
| 5-Person Families | 134 (7.6%) | $0 |
| 6-Person Families | 42 (2.4%) | $104,375 |
| 7+ Person Families | 13 (0.7%) | $147,679 |
| Total | 1,753 (100.0%) | $74,297 |
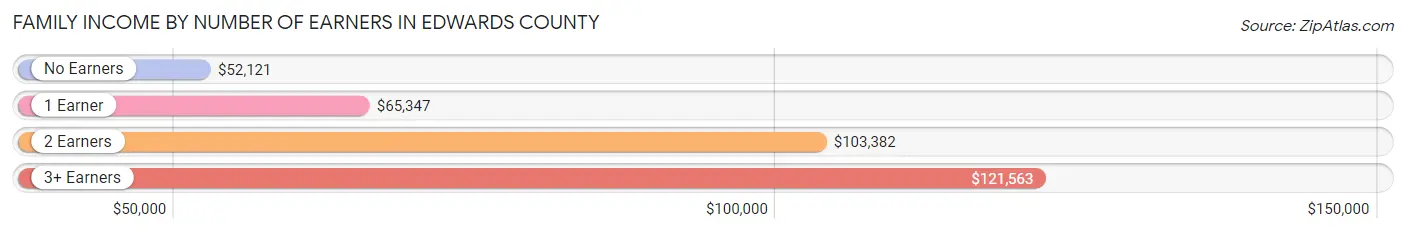
Family Income by Number of Earners in Edwards County
The median family income in Edwards County is $74,297, with families comprising 3+ earners (162) having the highest median family income of $121,563, while families with no earners (296) have the lowest median family income of $52,121, accounting for 9.2% and 16.9% of families, respectively.
| Number of Earners | # Families | Median Income |
| No Earners | 296 (16.9%) | $52,121 |
| 1 Earner | 697 (39.8%) | $65,347 |
| 2 Earners | 598 (34.1%) | $103,382 |
| 3+ Earners | 162 (9.2%) | $121,563 |
| Total | 1,753 (100.0%) | $74,297 |
Household Income in Edwards County
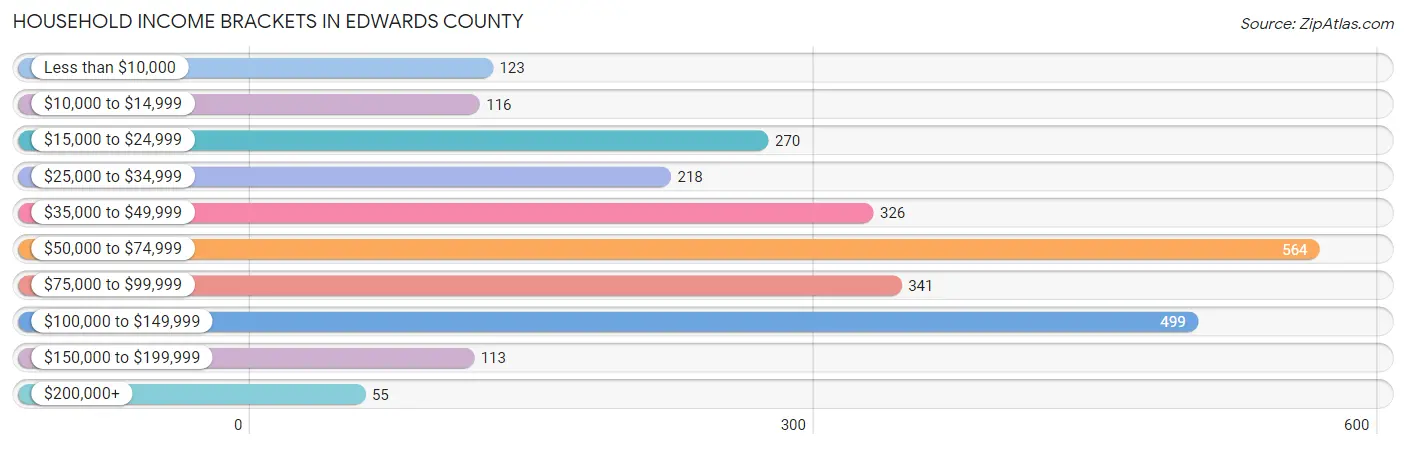
Household Income Brackets in Edwards County
With 564 households falling in the category, the $50,000 to $74,999 income range is the most frequent in Edwards County, accounting for 21.5% of all households. In contrast, only 55 households (2.1%) fall into the $200,000+ income bracket, making it the least populous group.
| Income Bracket | # Households | % Households |
| Less than $10,000 | 123 | 4.7% |
| $10,000 to $14,999 | 116 | 4.4% |
| $15,000 to $24,999 | 270 | 10.3% |
| $25,000 to $34,999 | 218 | 8.3% |
| $35,000 to $49,999 | 326 | 12.4% |
| $50,000 to $74,999 | 564 | 21.5% |
| $75,000 to $99,999 | 341 | 13.0% |
| $100,000 to $149,999 | 499 | 19.0% |
| $150,000 to $199,999 | 113 | 4.3% |
| $200,000+ | 55 | 2.1% |
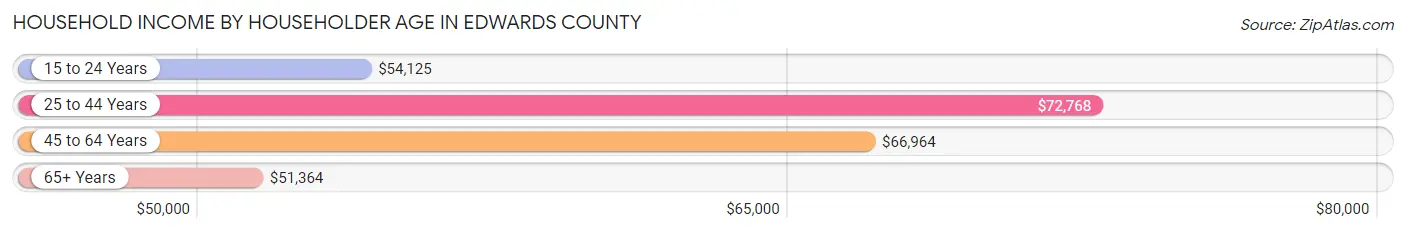
Household Income by Householder Age in Edwards County
The median household income in Edwards County is $60,784, with the highest median household income of $72,768 found in the 25 to 44 years age bracket for the primary householder. A total of 719 households (27.4%) fall into this category. Meanwhile, the 65+ years age bracket for the primary householder has the lowest median household income of $51,364, with 844 households (32.2%) in this group.
| Income Bracket | # Households | Median Income |
| 15 to 24 Years | 103 (3.9%) | $54,125 |
| 25 to 44 Years | 719 (27.4%) | $72,768 |
| 45 to 64 Years | 959 (36.5%) | $66,964 |
| 65+ Years | 844 (32.2%) | $51,364 |
| Total | 2,625 (100.0%) | $60,784 |
Poverty in Edwards County
Income Below Poverty by Sex and Age in Edwards County
With 10.4% poverty level for males and 17.9% for females among the residents of Edwards County, 15 year old males and under 5 year old females are the most vulnerable to poverty, with 18 males (40.0%) and 66 females (35.7%) in their respective age groups living below the poverty level.
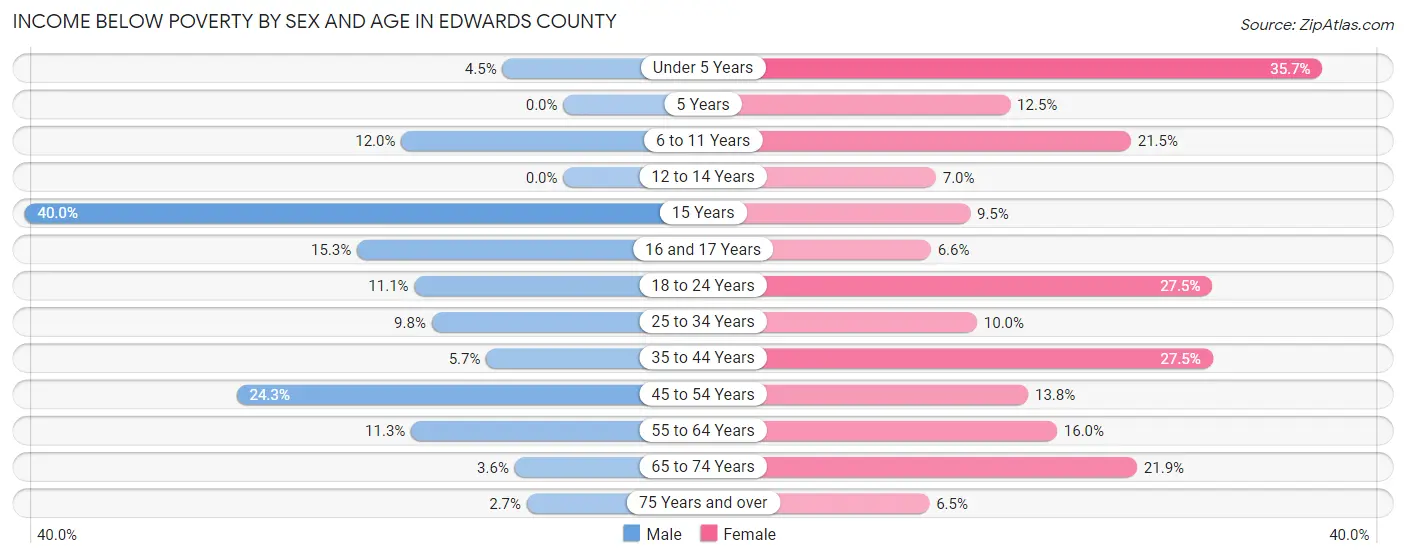
| Age Bracket | Male | Female |
| Under 5 Years | 8 (4.5%) | 66 (35.7%) |
| 5 Years | 0 (0.0%) | 7 (12.5%) |
| 6 to 11 Years | 29 (12.0%) | 53 (21.5%) |
| 12 to 14 Years | 0 (0.0%) | 6 (7.0%) |
| 15 Years | 18 (40.0%) | 2 (9.5%) |
| 16 and 17 Years | 17 (15.3%) | 7 (6.6%) |
| 18 to 24 Years | 24 (11.1%) | 55 (27.5%) |
| 25 to 34 Years | 30 (9.8%) | 29 (10.0%) |
| 35 to 44 Years | 21 (5.7%) | 98 (27.5%) |
| 45 to 54 Years | 98 (24.3%) | 52 (13.8%) |
| 55 to 64 Years | 53 (11.3%) | 69 (16.0%) |
| 65 to 74 Years | 13 (3.6%) | 87 (21.9%) |
| 75 Years and over | 6 (2.7%) | 22 (6.5%) |
| Total | 317 (10.4%) | 553 (17.9%) |
Income Above Poverty by Sex and Age in Edwards County
According to the poverty statistics in Edwards County, males aged 5 years and females aged 75 years and over are the age groups that are most secure financially, with 100.0% of males and 93.5% of females in these age groups living above the poverty line.
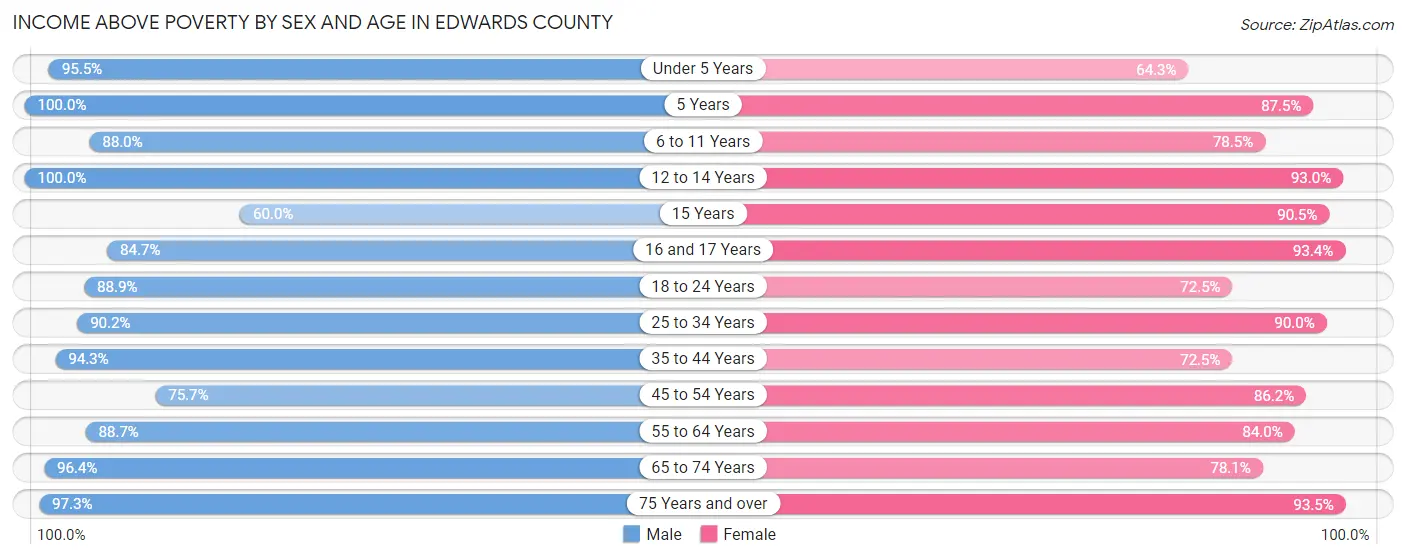
| Age Bracket | Male | Female |
| Under 5 Years | 169 (95.5%) | 119 (64.3%) |
| 5 Years | 77 (100.0%) | 49 (87.5%) |
| 6 to 11 Years | 212 (88.0%) | 194 (78.5%) |
| 12 to 14 Years | 52 (100.0%) | 80 (93.0%) |
| 15 Years | 27 (60.0%) | 19 (90.5%) |
| 16 and 17 Years | 94 (84.7%) | 99 (93.4%) |
| 18 to 24 Years | 193 (88.9%) | 145 (72.5%) |
| 25 to 34 Years | 277 (90.2%) | 260 (90.0%) |
| 35 to 44 Years | 346 (94.3%) | 258 (72.5%) |
| 45 to 54 Years | 306 (75.7%) | 324 (86.2%) |
| 55 to 64 Years | 416 (88.7%) | 363 (84.0%) |
| 65 to 74 Years | 347 (96.4%) | 310 (78.1%) |
| 75 Years and over | 215 (97.3%) | 317 (93.5%) |
| Total | 2,731 (89.6%) | 2,537 (82.1%) |
Income Below Poverty Among Married-Couple Families in Edwards County
The poverty statistics for married-couple families in Edwards County show that 3.1% or 43 of the total 1,388 families live below the poverty line. Families with 1 or 2 children have the highest poverty rate of 6.6%, comprising of 28 families. On the other hand, families with 5 or more children have the lowest poverty rate of 0.0%, which includes 0 families.
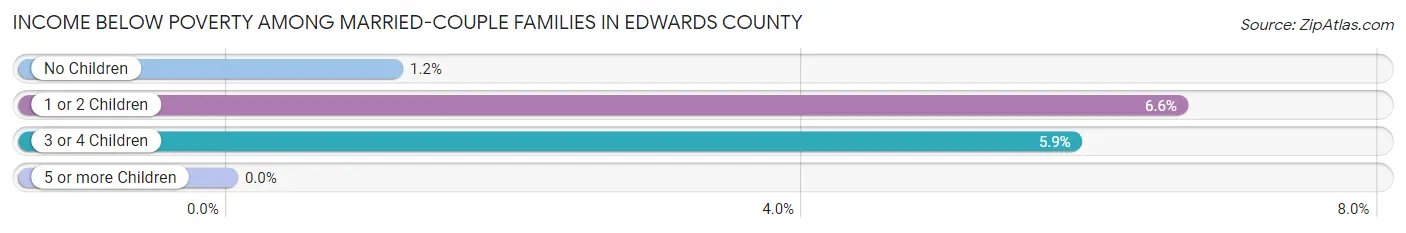
| Children | Above Poverty | Below Poverty |
| No Children | 863 (98.9%) | 10 (1.1%) |
| 1 or 2 Children | 395 (93.4%) | 28 (6.6%) |
| 3 or 4 Children | 80 (94.1%) | 5 (5.9%) |
| 5 or more Children | 7 (100.0%) | 0 (0.0%) |
| Total | 1,345 (96.9%) | 43 (3.1%) |
Income Below Poverty Among Single-Parent Households in Edwards County
According to the poverty data in Edwards County, 20.5% or 24 single-father households and 33.1% or 82 single-mother households are living below the poverty line. Among single-father households, those with no children have the highest poverty rate, with 16 households (35.6%) experiencing poverty. Likewise, among single-mother households, those with 1 or 2 children have the highest poverty rate, with 69 households (44.5%) falling below the poverty line.
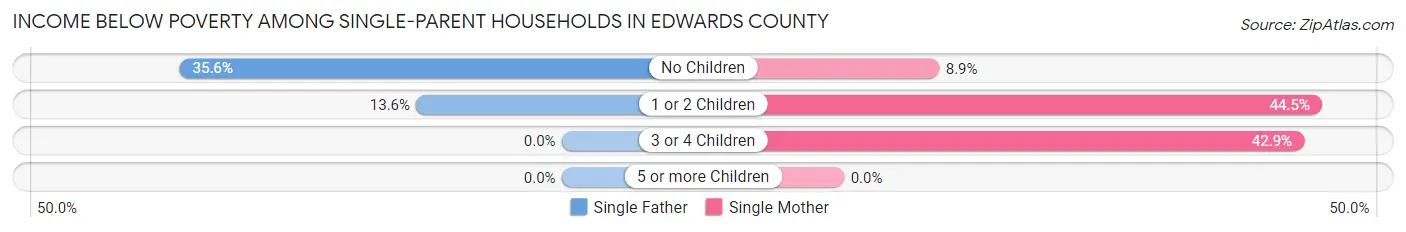
| Children | Single Father | Single Mother |
| No Children | 16 (35.6%) | 7 (8.9%) |
| 1 or 2 Children | 8 (13.6%) | 69 (44.5%) |
| 3 or 4 Children | 0 (0.0%) | 6 (42.9%) |
| 5 or more Children | 0 (0.0%) | 0 (0.0%) |
| Total | 24 (20.5%) | 82 (33.1%) |
Income Below Poverty Among Married-Couple vs Single-Parent Households in Edwards County
The poverty data for Edwards County shows that 43 of the married-couple family households (3.1%) and 106 of the single-parent households (29.0%) are living below the poverty level. Within the married-couple family households, those with 1 or 2 children have the highest poverty rate, with 28 households (6.6%) falling below the poverty line. Among the single-parent households, those with 1 or 2 children have the highest poverty rate, with 77 household (36.0%) living below poverty.
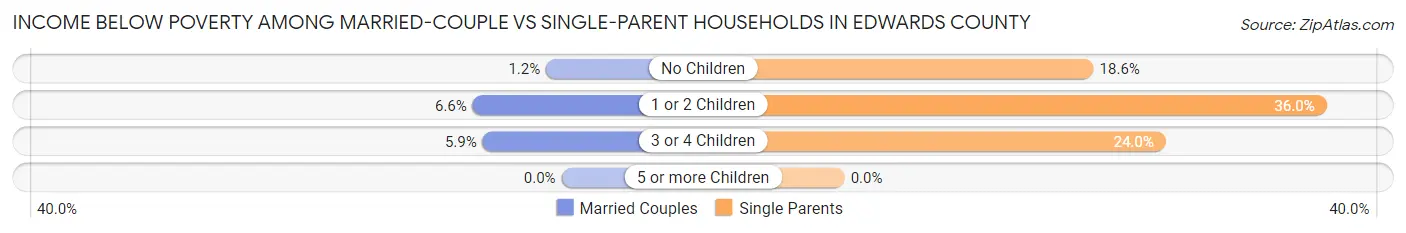
| Children | Married-Couple Families | Single-Parent Households |
| No Children | 10 (1.1%) | 23 (18.5%) |
| 1 or 2 Children | 28 (6.6%) | 77 (36.0%) |
| 3 or 4 Children | 5 (5.9%) | 6 (24.0%) |
| 5 or more Children | 0 (0.0%) | 0 (0.0%) |
| Total | 43 (3.1%) | 106 (29.0%) |
Race in Edwards County
The most populous races in Edwards County are White / Caucasian (5,944 | 96.2%), Two or more Races (153 | 2.5%), and Hispanic or Latino (86 | 1.4%).
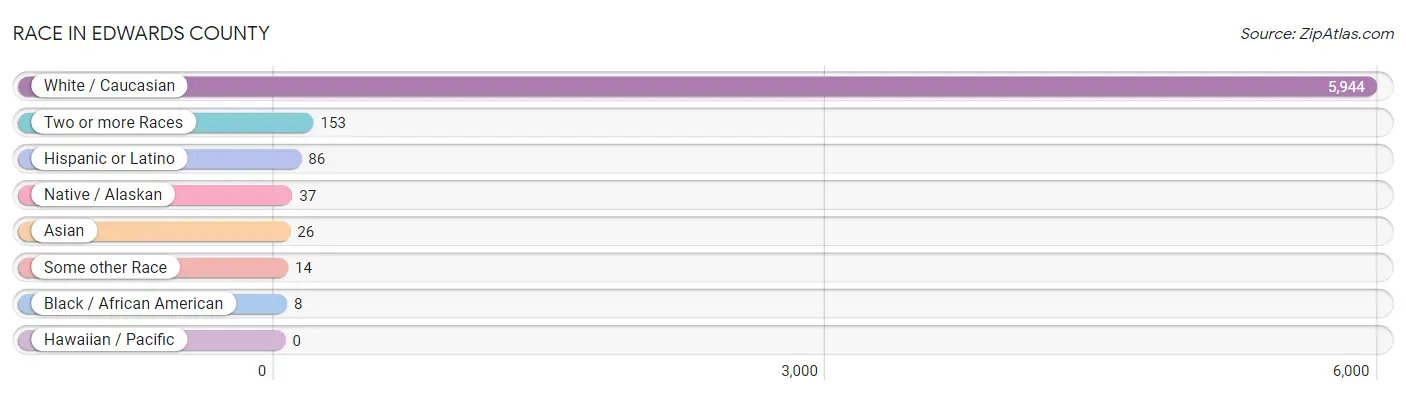
| Race | # Population | % Population |
| Asian | 26 | 0.4% |
| Black / African American | 8 | 0.1% |
| Hawaiian / Pacific | 0 | 0.0% |
| Hispanic or Latino | 86 | 1.4% |
| Native / Alaskan | 37 | 0.6% |
| White / Caucasian | 5,944 | 96.2% |
| Two or more Races | 153 | 2.5% |
| Some other Race | 14 | 0.2% |
| Total | 6,182 | 100.0% |
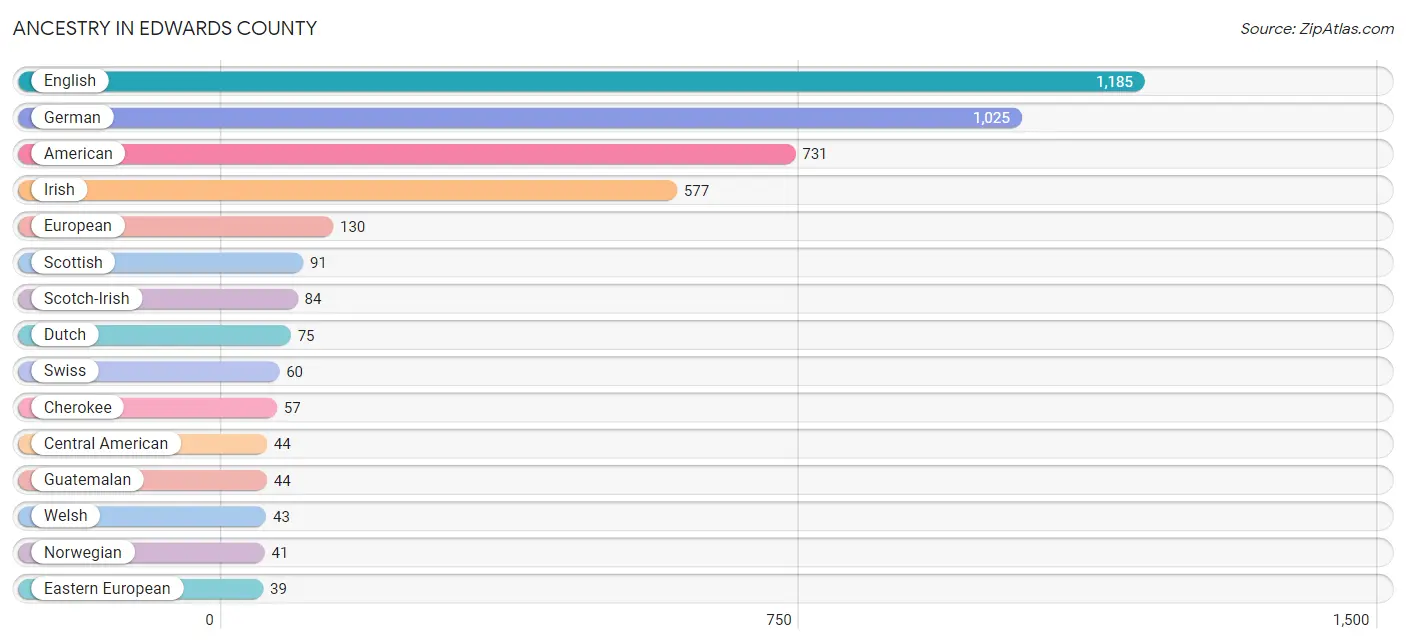
Ancestry in Edwards County
The most populous ancestries reported in Edwards County are English (1,185 | 19.2%), German (1,025 | 16.6%), American (731 | 11.8%), Irish (577 | 9.3%), and European (130 | 2.1%), together accounting for 59.0% of all Edwards County residents.
| Ancestry | # Population | % Population |
| American | 731 | 11.8% |
| Belgian | 9 | 0.2% |
| Blackfeet | 12 | 0.2% |
| British | 18 | 0.3% |
| Burmese | 13 | 0.2% |
| Canadian | 21 | 0.3% |
| Central American | 44 | 0.7% |
| Central American Indian | 36 | 0.6% |
| Cherokee | 57 | 0.9% |
| Cheyenne | 6 | 0.1% |
| Cuban | 4 | 0.1% |
| Czech | 8 | 0.1% |
| Danish | 14 | 0.2% |
| Dominican | 11 | 0.2% |
| Dutch | 75 | 1.2% |
| Eastern European | 39 | 0.6% |
| English | 1,185 | 19.2% |
| European | 130 | 2.1% |
| French | 36 | 0.6% |
| French Canadian | 4 | 0.1% |
| German | 1,025 | 16.6% |
| Greek | 2 | 0.0% |
| Guatemalan | 44 | 0.7% |
| Indian (Asian) | 3 | 0.1% |
| Iranian | 10 | 0.2% |
| Irish | 577 | 9.3% |
| Iroquois | 2 | 0.0% |
| Italian | 23 | 0.4% |
| Korean | 19 | 0.3% |
| Lithuanian | 3 | 0.1% |
| Menominee | 1 | 0.0% |
| Mexican | 10 | 0.2% |
| Norwegian | 41 | 0.7% |
| Pennsylvania German | 7 | 0.1% |
| Polish | 38 | 0.6% |
| Puerto Rican | 10 | 0.2% |
| Russian | 6 | 0.1% |
| Scotch-Irish | 84 | 1.4% |
| Scottish | 91 | 1.5% |
| Sri Lankan | 19 | 0.3% |
| Swedish | 17 | 0.3% |
| Swiss | 60 | 1.0% |
| Welsh | 43 | 0.7% |
| Yugoslavian | 8 | 0.1% | View All 44 Rows |
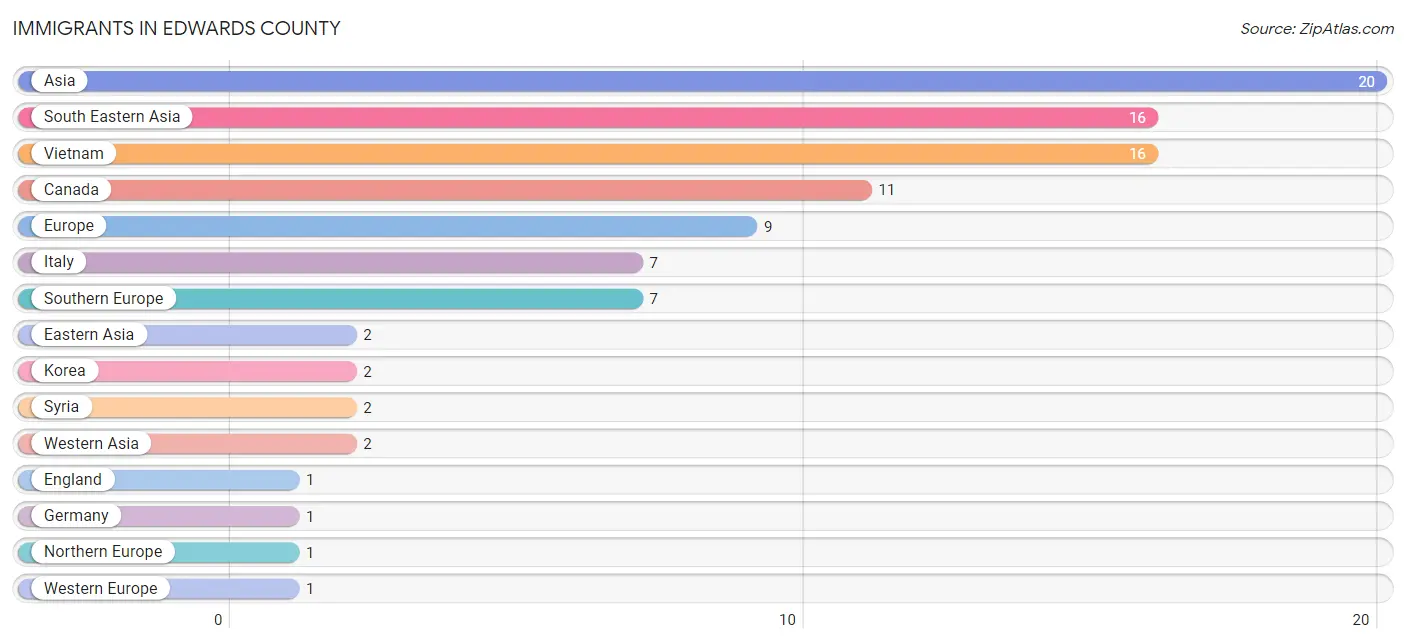
Immigrants in Edwards County
The most numerous immigrant groups reported in Edwards County came from Asia (20 | 0.3%), South Eastern Asia (16 | 0.3%), Vietnam (16 | 0.3%), Canada (11 | 0.2%), and Europe (9 | 0.2%), together accounting for 1.2% of all Edwards County residents.
| Immigration Origin | # Population | % Population |
| Asia | 20 | 0.3% |
| Canada | 11 | 0.2% |
| Eastern Asia | 2 | 0.0% |
| England | 1 | 0.0% |
| Europe | 9 | 0.2% |
| Germany | 1 | 0.0% |
| Italy | 7 | 0.1% |
| Korea | 2 | 0.0% |
| Northern Europe | 1 | 0.0% |
| South Eastern Asia | 16 | 0.3% |
| Southern Europe | 7 | 0.1% |
| Syria | 2 | 0.0% |
| Vietnam | 16 | 0.3% |
| Western Asia | 2 | 0.0% |
| Western Europe | 1 | 0.0% | View All 15 Rows |
Sex and Age in Edwards County
Sex and Age in Edwards County
The most populous age groups in Edwards County are 5 to 9 Years (248 | 8.1%) for men and 60 to 64 Years (241 | 7.7%) for women.
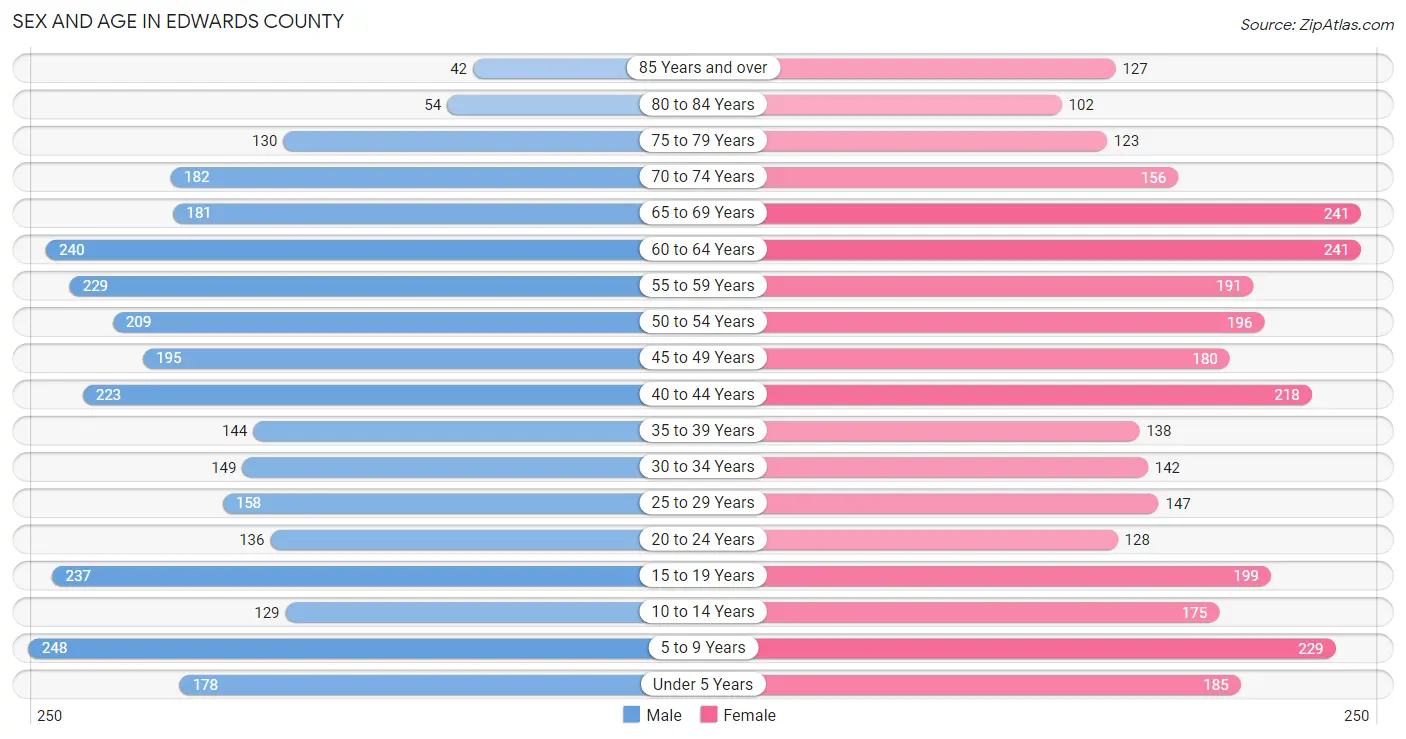
| Age Bracket | Male | Female |
| Under 5 Years | 178 (5.8%) | 185 (5.9%) |
| 5 to 9 Years | 248 (8.1%) | 229 (7.3%) |
| 10 to 14 Years | 129 (4.2%) | 175 (5.6%) |
| 15 to 19 Years | 237 (7.7%) | 199 (6.4%) |
| 20 to 24 Years | 136 (4.4%) | 128 (4.1%) |
| 25 to 29 Years | 158 (5.2%) | 147 (4.7%) |
| 30 to 34 Years | 149 (4.9%) | 142 (4.5%) |
| 35 to 39 Years | 144 (4.7%) | 138 (4.4%) |
| 40 to 44 Years | 223 (7.3%) | 218 (7.0%) |
| 45 to 49 Years | 195 (6.4%) | 180 (5.8%) |
| 50 to 54 Years | 209 (6.8%) | 196 (6.3%) |
| 55 to 59 Years | 229 (7.5%) | 191 (6.1%) |
| 60 to 64 Years | 240 (7.8%) | 241 (7.7%) |
| 65 to 69 Years | 181 (5.9%) | 241 (7.7%) |
| 70 to 74 Years | 182 (5.9%) | 156 (5.0%) |
| 75 to 79 Years | 130 (4.2%) | 123 (3.9%) |
| 80 to 84 Years | 54 (1.8%) | 102 (3.3%) |
| 85 Years and over | 42 (1.4%) | 127 (4.1%) |
| Total | 3,064 (100.0%) | 3,118 (100.0%) |
Families and Households in Edwards County
Median Family Size in Edwards County
The median family size in Edwards County is 2.86 persons per family, with married-couple families (1,388 | 79.2%) accounting for the largest median family size of 2.87 persons per family. On the other hand, single female/mother families (248 | 14.1%) represent the smallest median family size with 2.78 persons per family.
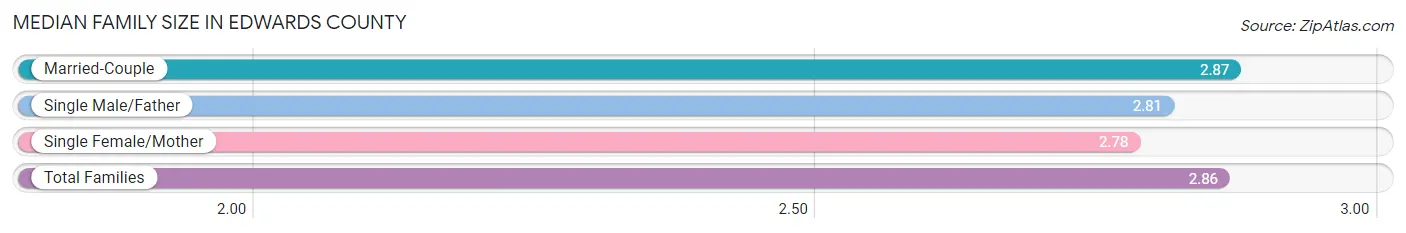
| Family Type | # Families | Family Size |
| Married-Couple | 1,388 (79.2%) | 2.87 |
| Single Male/Father | 117 (6.7%) | 2.81 |
| Single Female/Mother | 248 (14.1%) | 2.78 |
| Total Families | 1,753 (100.0%) | 2.86 |
Median Household Size in Edwards County
The median household size in Edwards County is 2.34 persons per household, with single male/father households (117 | 4.5%) accounting for the largest median household size of 3.16 persons per household. non-family households (872 | 33.2%) represent the smallest median household size with 1.17 persons per household.
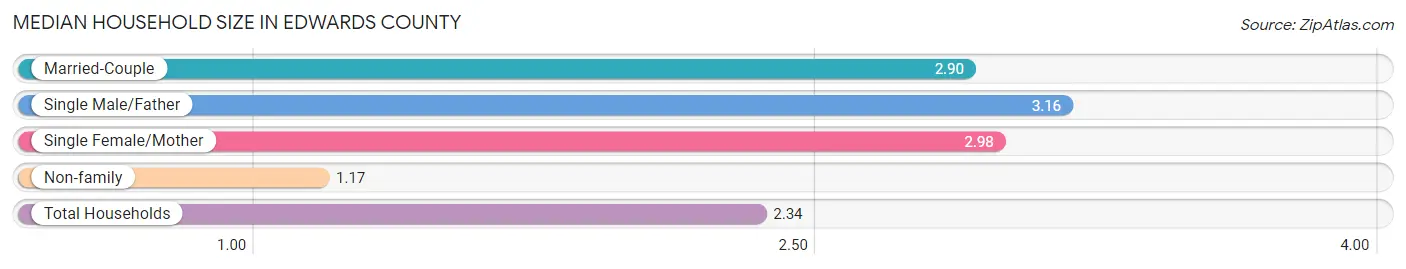
| Household Type | # Households | Household Size |
| Married-Couple | 1,388 (52.9%) | 2.90 |
| Single Male/Father | 117 (4.5%) | 3.16 |
| Single Female/Mother | 248 (9.5%) | 2.98 |
| Non-family | 872 (33.2%) | 1.17 |
| Total Households | 2,625 (100.0%) | 2.34 |
Household Size by Marriage Status in Edwards County
Out of a total of 2,625 households in Edwards County, 1,753 (66.8%) are family households, while 872 (33.2%) are nonfamily households. The most numerous type of family households are 2-person households, comprising 911, and the most common type of nonfamily households are 1-person households, comprising 724.
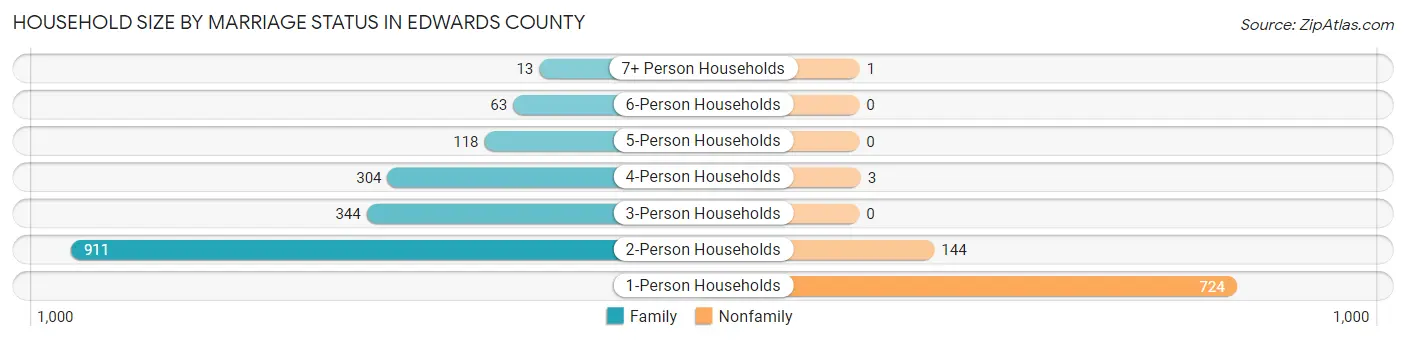
| Household Size | Family Households | Nonfamily Households |
| 1-Person Households | - | 724 (27.6%) |
| 2-Person Households | 911 (34.7%) | 144 (5.5%) |
| 3-Person Households | 344 (13.1%) | 0 (0.0%) |
| 4-Person Households | 304 (11.6%) | 3 (0.1%) |
| 5-Person Households | 118 (4.5%) | 0 (0.0%) |
| 6-Person Households | 63 (2.4%) | 0 (0.0%) |
| 7+ Person Households | 13 (0.5%) | 1 (0.0%) |
| Total | 1,753 (66.8%) | 872 (33.2%) |
Female Fertility in Edwards County
Fertility by Age in Edwards County
Average fertility rate in Edwards County is 75.0 births per 1,000 women. Women in the age bracket of 15 to 19 years have the highest fertility rate with 251.0 births per 1,000 women. Women in the age bracket of 15 to 19 years acount for 54.9% of all women with births.
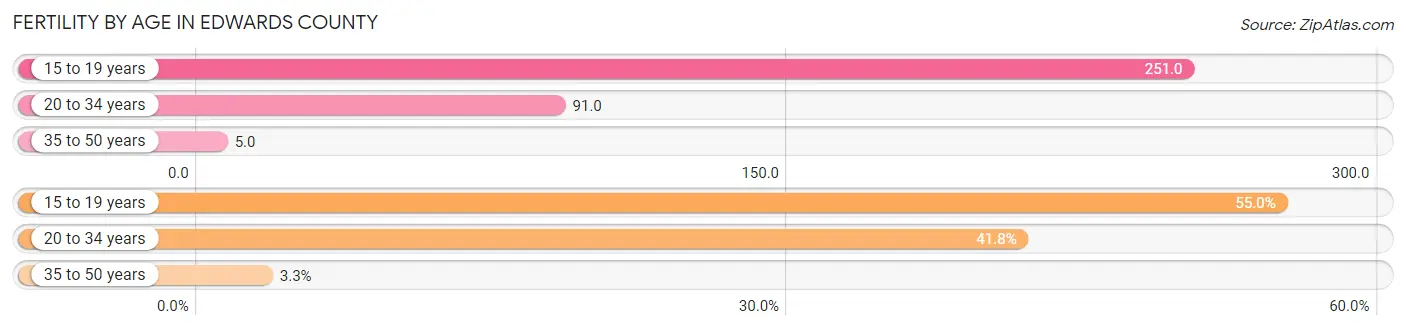
| Age Bracket | Women with Births | Births / 1,000 Women |
| 15 to 19 years | 50 (54.9%) | 251.0 |
| 20 to 34 years | 38 (41.8%) | 91.0 |
| 35 to 50 years | 3 (3.3%) | 5.0 |
| Total | 91 (100.0%) | 75.0 |
Fertility by Age by Marriage Status in Edwards County
38.5% of women with births (91) in Edwards County are married. The highest percentage of unmarried women with births falls into 15 to 19 years age bracket with 100.0% of them unmarried at the time of birth, while the lowest percentage of unmarried women with births belong to 20 to 34 years age bracket with 7.9% of them unmarried.
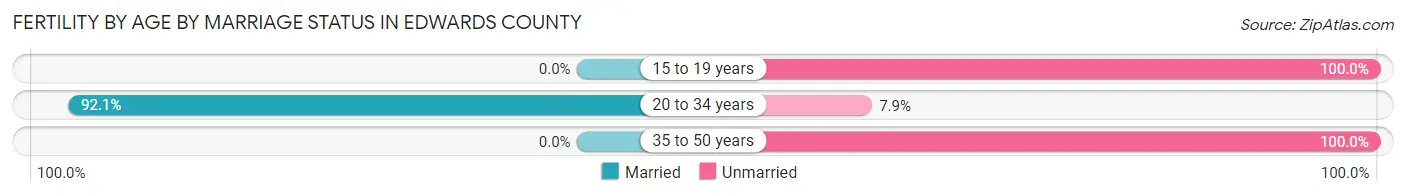
| Age Bracket | Married | Unmarried |
| 15 to 19 years | 0 (0.0%) | 50 (100.0%) |
| 20 to 34 years | 35 (92.1%) | 3 (7.9%) |
| 35 to 50 years | 0 (0.0%) | 3 (100.0%) |
| Total | 35 (38.5%) | 56 (61.5%) |
Fertility by Education in Edwards County
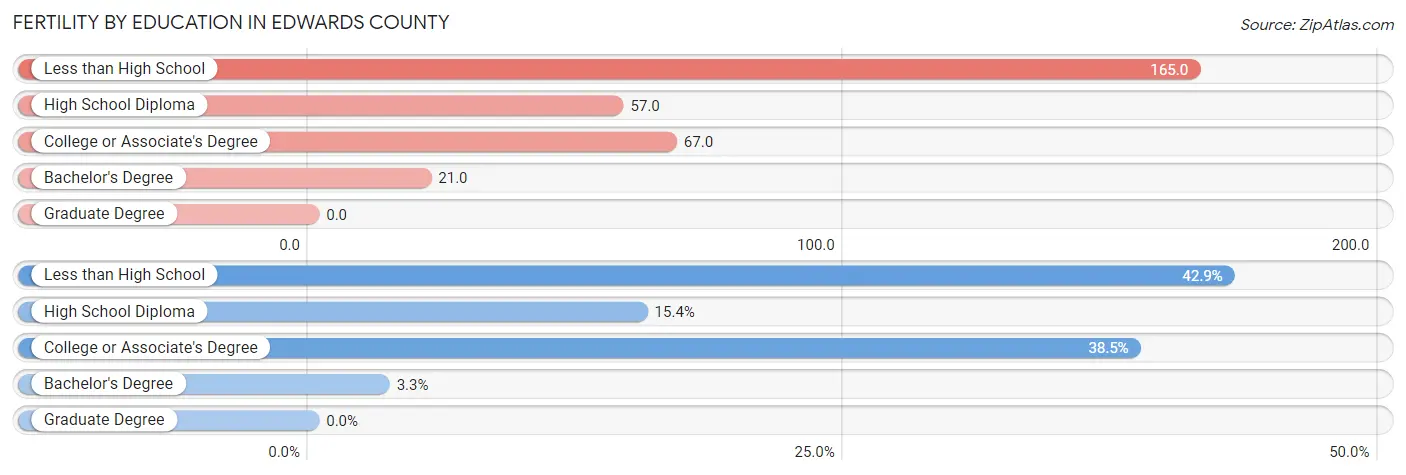
| Educational Attainment | Women with Births | Births / 1,000 Women |
| Less than High School | 39 (42.9%) | 165.0 |
| High School Diploma | 14 (15.4%) | 57.0 |
| College or Associate's Degree | 35 (38.5%) | 67.0 |
| Bachelor's Degree | 3 (3.3%) | 21.0 |
| Graduate Degree | 0 (0.0%) | 0.0 |
| Total | 91 (100.0%) | 75.0 |
Fertility by Education by Marriage Status in Edwards County
61.5% of women with births in Edwards County are unmarried. Women with the educational attainment of college or associate's degree are most likely to be married with 100.0% of them married at childbirth, while women with the educational attainment of less than high school are least likely to be married with 100.0% of them unmarried at childbirth.
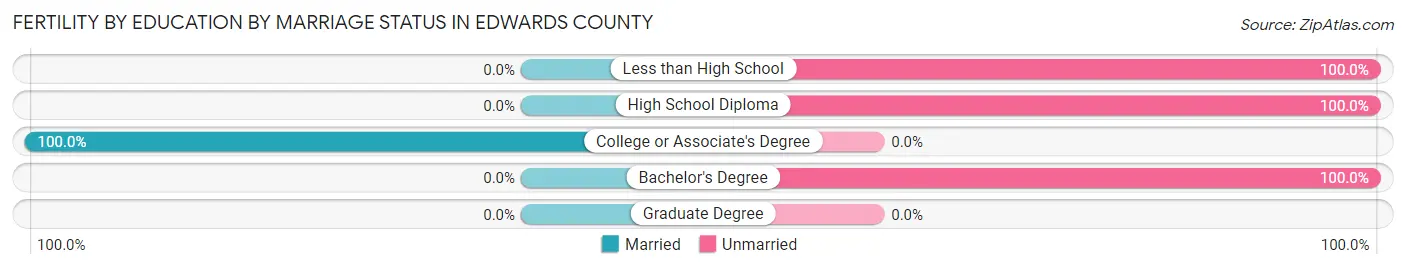
| Educational Attainment | Married | Unmarried |
| Less than High School | 0 (0.0%) | 39 (100.0%) |
| High School Diploma | 0 (0.0%) | 14 (100.0%) |
| College or Associate's Degree | 35 (100.0%) | 0 (0.0%) |
| Bachelor's Degree | 0 (0.0%) | 3 (100.0%) |
| Graduate Degree | 0 (0.0%) | 0 (0.0%) |
| Total | 35 (38.5%) | 56 (61.5%) |
Employment Characteristics in Edwards County
Employment by Class of Employer in Edwards County
Among the 2,655 employed individuals in Edwards County, private company employees (1,970 | 74.2%), self-employed (not incorporated) (236 | 8.9%), and local government employees (137 | 5.2%) make up the most common classes of employment.
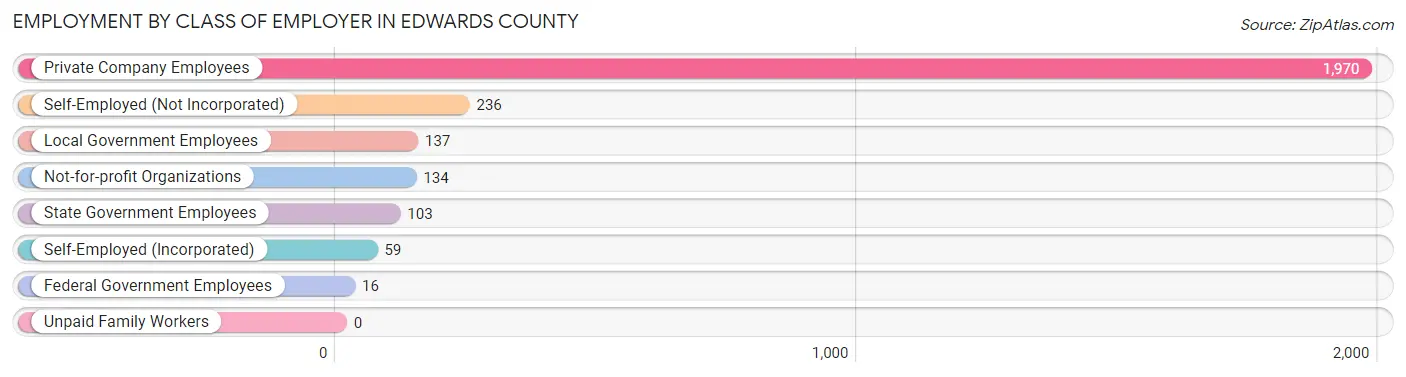
| Employer Class | # Employees | % Employees |
| Private Company Employees | 1,970 | 74.2% |
| Self-Employed (Incorporated) | 59 | 2.2% |
| Self-Employed (Not Incorporated) | 236 | 8.9% |
| Not-for-profit Organizations | 134 | 5.1% |
| Local Government Employees | 137 | 5.2% |
| State Government Employees | 103 | 3.9% |
| Federal Government Employees | 16 | 0.6% |
| Unpaid Family Workers | 0 | 0.0% |
| Total | 2,655 | 100.0% |
Employment Status by Age in Edwards County
According to the labor force statistics for Edwards County, out of the total population over 16 years of age (4,972), 58.1% or 2,889 individuals are in the labor force, with 6.7% or 194 of them unemployed. The age group with the highest labor force participation rate is 35 to 44 years, with 90.7% or 656 individuals in the labor force. Within the labor force, the 16 to 19 years age range has the highest percentage of unemployed individuals, with 37.2% or 67 of them being unemployed.
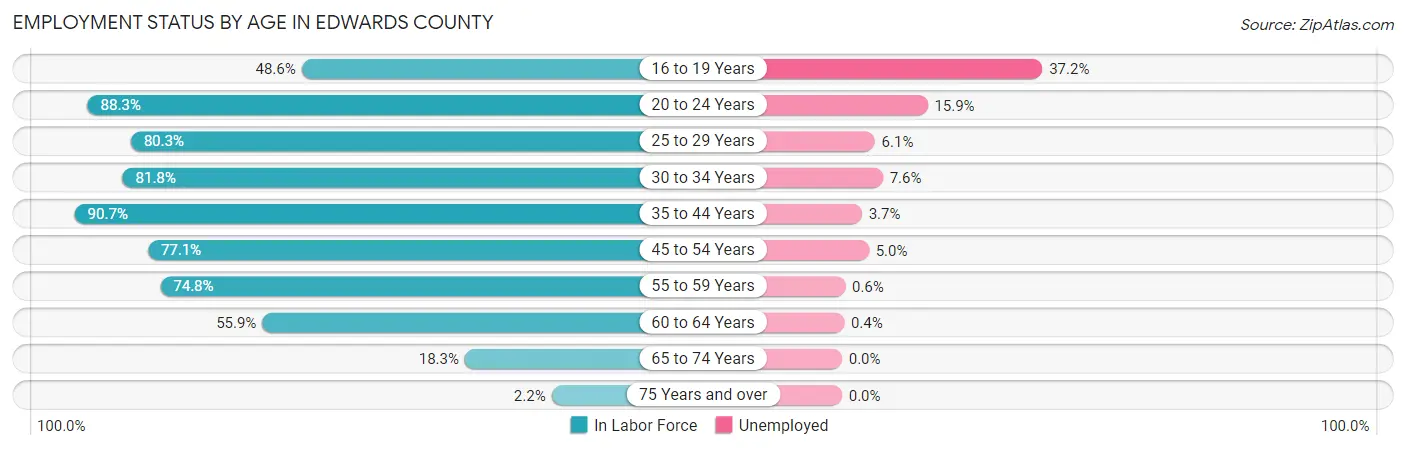
| Age Bracket | In Labor Force | Unemployed |
| 16 to 19 Years | 180 (48.6%) | 67 (37.2%) |
| 20 to 24 Years | 233 (88.3%) | 37 (15.9%) |
| 25 to 29 Years | 245 (80.3%) | 15 (6.1%) |
| 30 to 34 Years | 238 (81.8%) | 18 (7.6%) |
| 35 to 44 Years | 656 (90.7%) | 24 (3.7%) |
| 45 to 54 Years | 601 (77.1%) | 30 (5.0%) |
| 55 to 59 Years | 314 (74.8%) | 2 (0.6%) |
| 60 to 64 Years | 269 (55.9%) | 1 (0.4%) |
| 65 to 74 Years | 139 (18.3%) | 0 (0.0%) |
| 75 Years and over | 13 (2.2%) | 0 (0.0%) |
| Total | 2,889 (58.1%) | 194 (6.7%) |
Employment Status by Educational Attainment in Edwards County
According to labor force statistics for Edwards County, 77.4% of individuals (2,322) out of the total population between 25 and 64 years of age (3,000) are in the labor force, with 3.9% or 91 of them being unemployed. The group with the highest labor force participation rate are those with the educational attainment of bachelor's degree or higher, with 87.2% or 414 individuals in the labor force. Within the labor force, individuals with less than high school education have the highest percentage of unemployment, with 26.6% or 41 of them being unemployed.
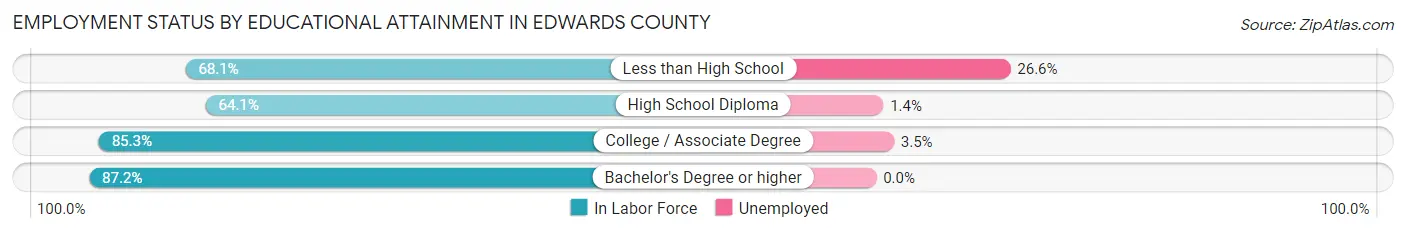
| Educational Attainment | In Labor Force | Unemployed |
| Less than High School | 154 (68.1%) | 60 (26.6%) |
| High School Diploma | 622 (64.1%) | 14 (1.4%) |
| College / Associate Degree | 1,134 (85.3%) | 47 (3.5%) |
| Bachelor's Degree or higher | 414 (87.2%) | 0 (0.0%) |
| Total | 2,322 (77.4%) | 117 (3.9%) |
Employment Occupations by Sex in Edwards County
Management, Business, Science and Arts Occupations
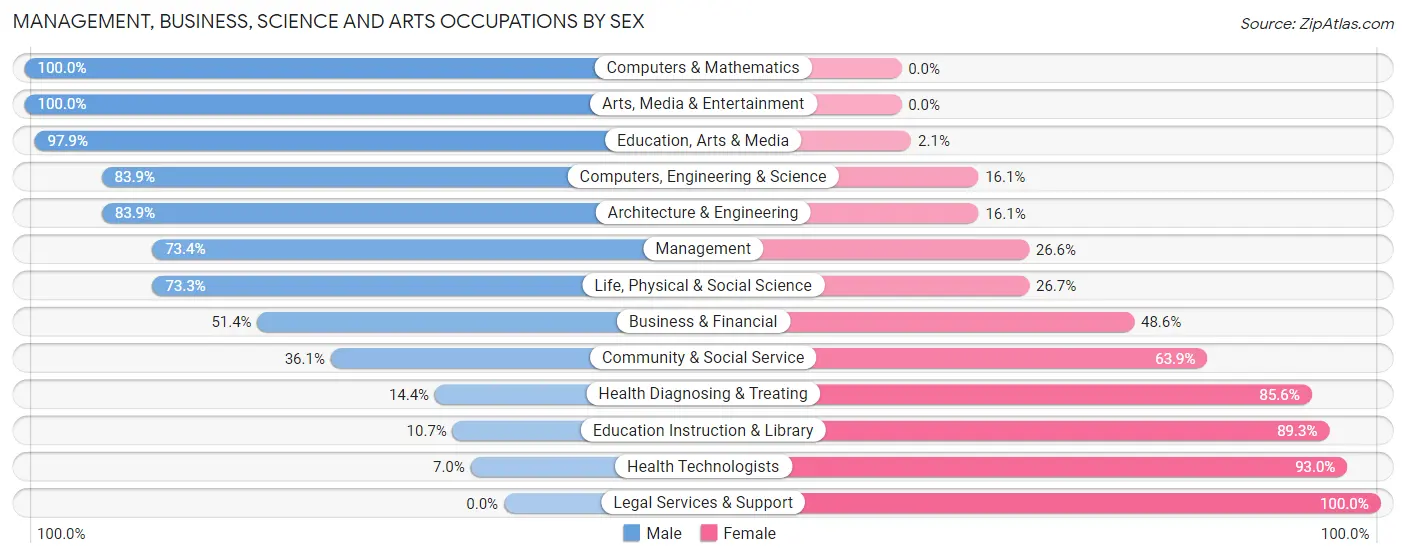
The most common Management, Business, Science and Arts occupations in Edwards County are Health Diagnosing & Treating (257 | 9.5%), Community & Social Service (202 | 7.5%), Management (184 | 6.8%), Health Technologists (158 | 5.9%), and Education Instruction & Library (140 | 5.2%).
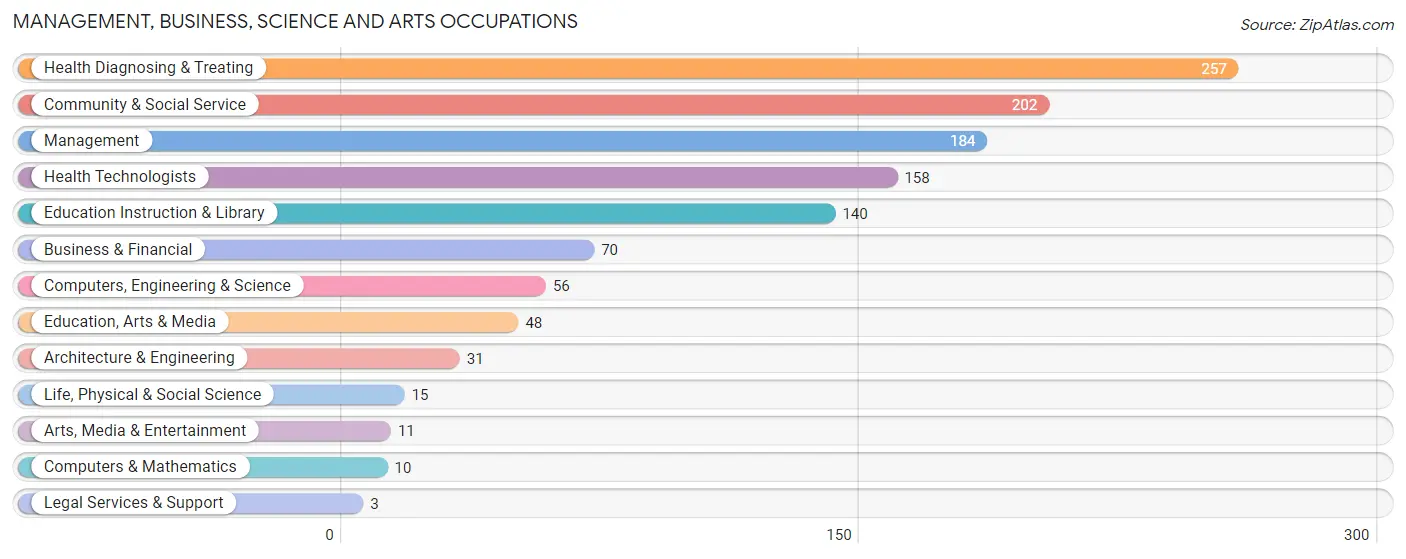
Management, Business, Science and Arts Occupations by Sex
Within the Management, Business, Science and Arts occupations in Edwards County, the most male-oriented occupations are Computers & Mathematics (100.0%), Arts, Media & Entertainment (100.0%), and Education, Arts & Media (97.9%), while the most female-oriented occupations are Legal Services & Support (100.0%), Health Technologists (93.0%), and Education Instruction & Library (89.3%).
| Occupation | Male | Female |
| Management | 135 (73.4%) | 49 (26.6%) |
| Business & Financial | 36 (51.4%) | 34 (48.6%) |
| Computers, Engineering & Science | 47 (83.9%) | 9 (16.1%) |
| Computers & Mathematics | 10 (100.0%) | 0 (0.0%) |
| Architecture & Engineering | 26 (83.9%) | 5 (16.1%) |
| Life, Physical & Social Science | 11 (73.3%) | 4 (26.7%) |
| Community & Social Service | 73 (36.1%) | 129 (63.9%) |
| Education, Arts & Media | 47 (97.9%) | 1 (2.1%) |
| Legal Services & Support | 0 (0.0%) | 3 (100.0%) |
| Education Instruction & Library | 15 (10.7%) | 125 (89.3%) |
| Arts, Media & Entertainment | 11 (100.0%) | 0 (0.0%) |
| Health Diagnosing & Treating | 37 (14.4%) | 220 (85.6%) |
| Health Technologists | 11 (7.0%) | 147 (93.0%) |
| Total (Category) | 328 (42.6%) | 441 (57.4%) |
| Total (Overall) | 1,505 (55.9%) | 1,189 (44.1%) |
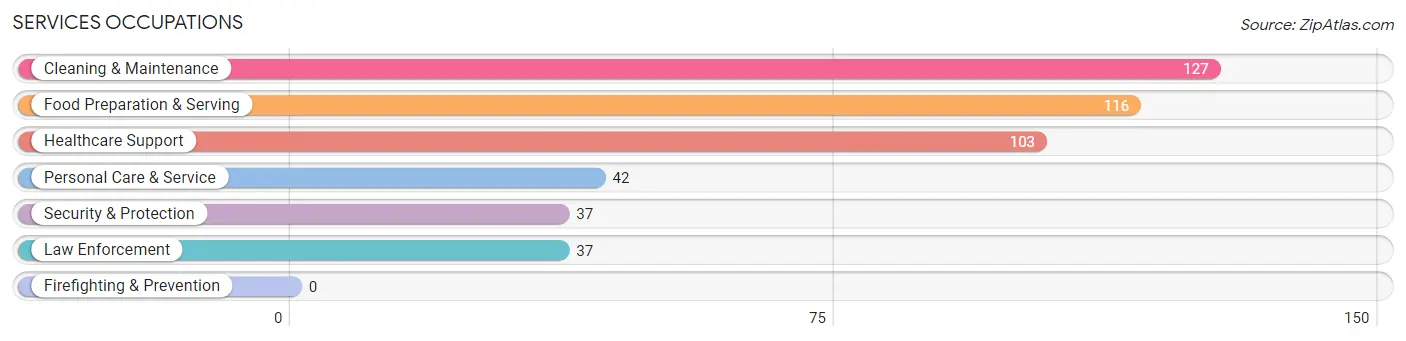
Services Occupations
The most common Services occupations in Edwards County are Cleaning & Maintenance (127 | 4.7%), Food Preparation & Serving (116 | 4.3%), Healthcare Support (103 | 3.8%), Personal Care & Service (42 | 1.6%), and Security & Protection (37 | 1.4%).
Services Occupations by Sex
Within the Services occupations in Edwards County, the most male-oriented occupations are Security & Protection (81.1%), Law Enforcement (81.1%), and Cleaning & Maintenance (59.8%), while the most female-oriented occupations are Personal Care & Service (100.0%), Healthcare Support (88.3%), and Food Preparation & Serving (58.6%).
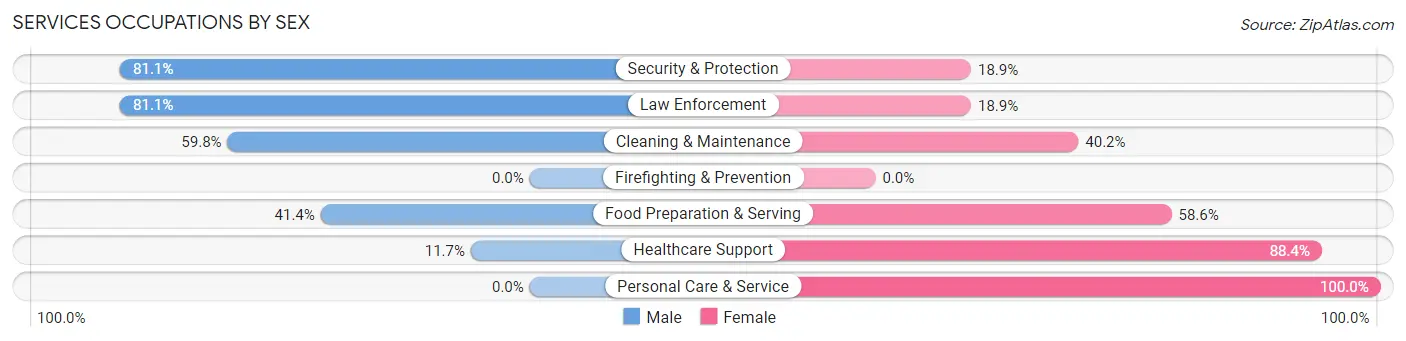
| Occupation | Male | Female |
| Healthcare Support | 12 (11.7%) | 91 (88.3%) |
| Security & Protection | 30 (81.1%) | 7 (18.9%) |
| Firefighting & Prevention | 0 (0.0%) | 0 (0.0%) |
| Law Enforcement | 30 (81.1%) | 7 (18.9%) |
| Food Preparation & Serving | 48 (41.4%) | 68 (58.6%) |
| Cleaning & Maintenance | 76 (59.8%) | 51 (40.2%) |
| Personal Care & Service | 0 (0.0%) | 42 (100.0%) |
| Total (Category) | 166 (39.1%) | 259 (60.9%) |
| Total (Overall) | 1,505 (55.9%) | 1,189 (44.1%) |
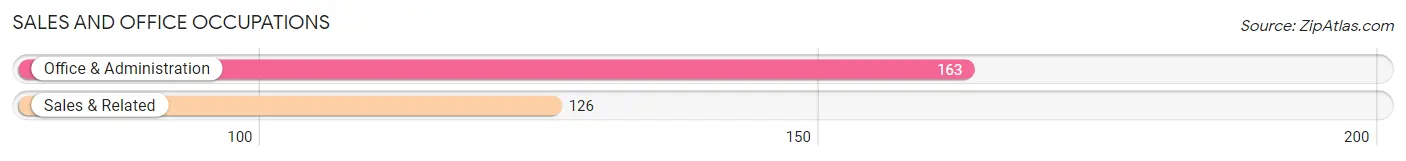
Sales and Office Occupations
The most common Sales and Office occupations in Edwards County are Office & Administration (163 | 6.0%), and Sales & Related (126 | 4.7%).
Sales and Office Occupations by Sex
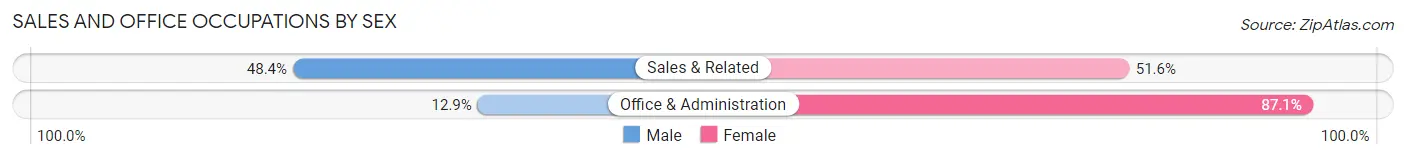
| Occupation | Male | Female |
| Sales & Related | 61 (48.4%) | 65 (51.6%) |
| Office & Administration | 21 (12.9%) | 142 (87.1%) |
| Total (Category) | 82 (28.4%) | 207 (71.6%) |
| Total (Overall) | 1,505 (55.9%) | 1,189 (44.1%) |
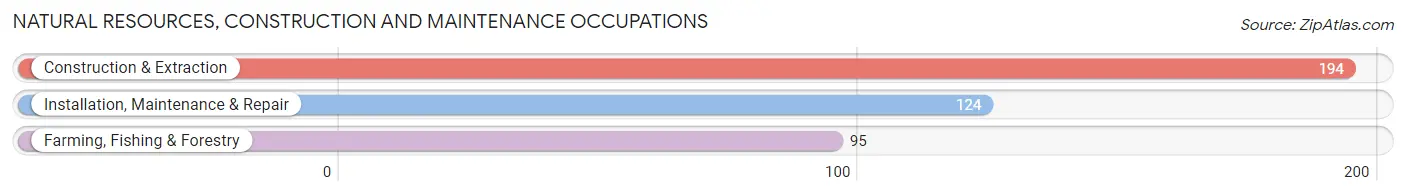
Natural Resources, Construction and Maintenance Occupations
The most common Natural Resources, Construction and Maintenance occupations in Edwards County are Construction & Extraction (194 | 7.2%), Installation, Maintenance & Repair (124 | 4.6%), and Farming, Fishing & Forestry (95 | 3.5%).
Natural Resources, Construction and Maintenance Occupations by Sex
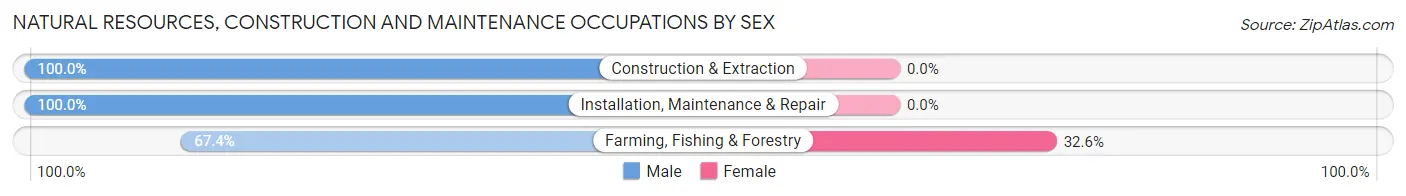
| Occupation | Male | Female |
| Farming, Fishing & Forestry | 64 (67.4%) | 31 (32.6%) |
| Construction & Extraction | 194 (100.0%) | 0 (0.0%) |
| Installation, Maintenance & Repair | 124 (100.0%) | 0 (0.0%) |
| Total (Category) | 382 (92.5%) | 31 (7.5%) |
| Total (Overall) | 1,505 (55.9%) | 1,189 (44.1%) |
Production, Transportation and Moving Occupations
The most common Production, Transportation and Moving occupations in Edwards County are Production (516 | 19.2%), Material Moving (170 | 6.3%), and Transportation (112 | 4.2%).
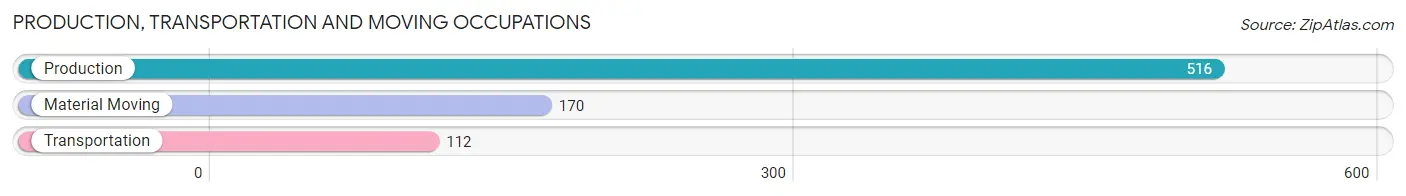
Production, Transportation and Moving Occupations by Sex
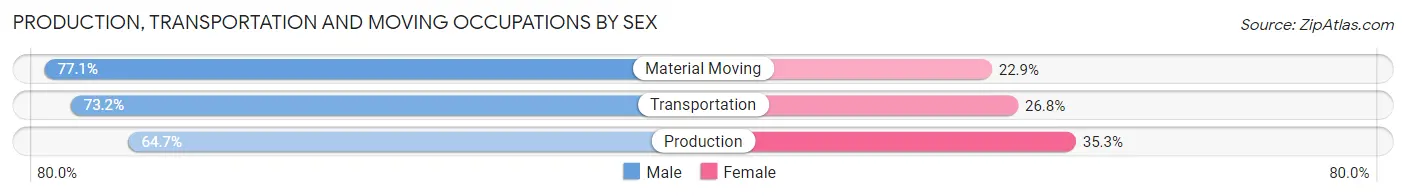
| Occupation | Male | Female |
| Production | 334 (64.7%) | 182 (35.3%) |
| Transportation | 82 (73.2%) | 30 (26.8%) |
| Material Moving | 131 (77.1%) | 39 (22.9%) |
| Total (Category) | 547 (68.5%) | 251 (31.5%) |
| Total (Overall) | 1,505 (55.9%) | 1,189 (44.1%) |
Employment Industries by Sex in Edwards County
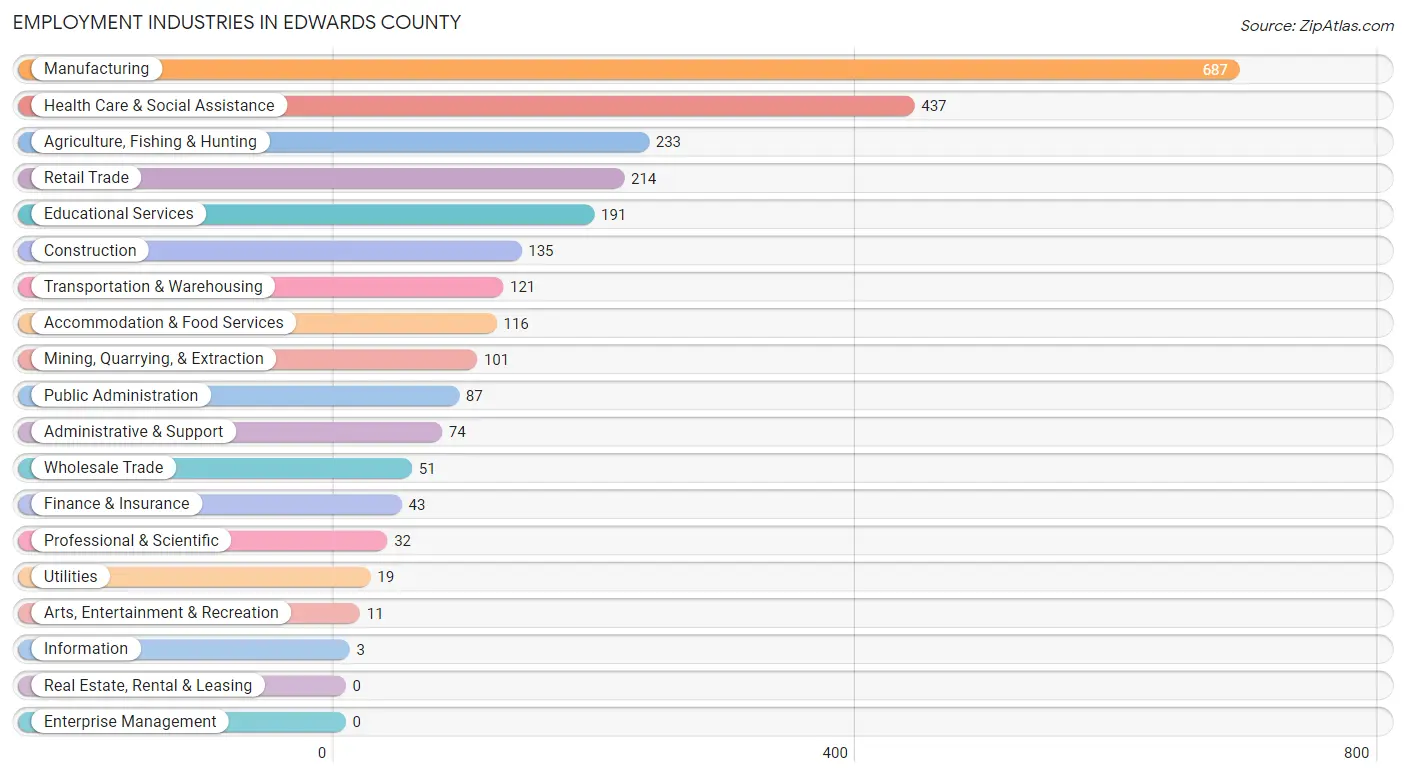
Employment Industries in Edwards County
The major employment industries in Edwards County include Manufacturing (687 | 25.5%), Health Care & Social Assistance (437 | 16.2%), Agriculture, Fishing & Hunting (233 | 8.6%), Retail Trade (214 | 7.9%), and Educational Services (191 | 7.1%).
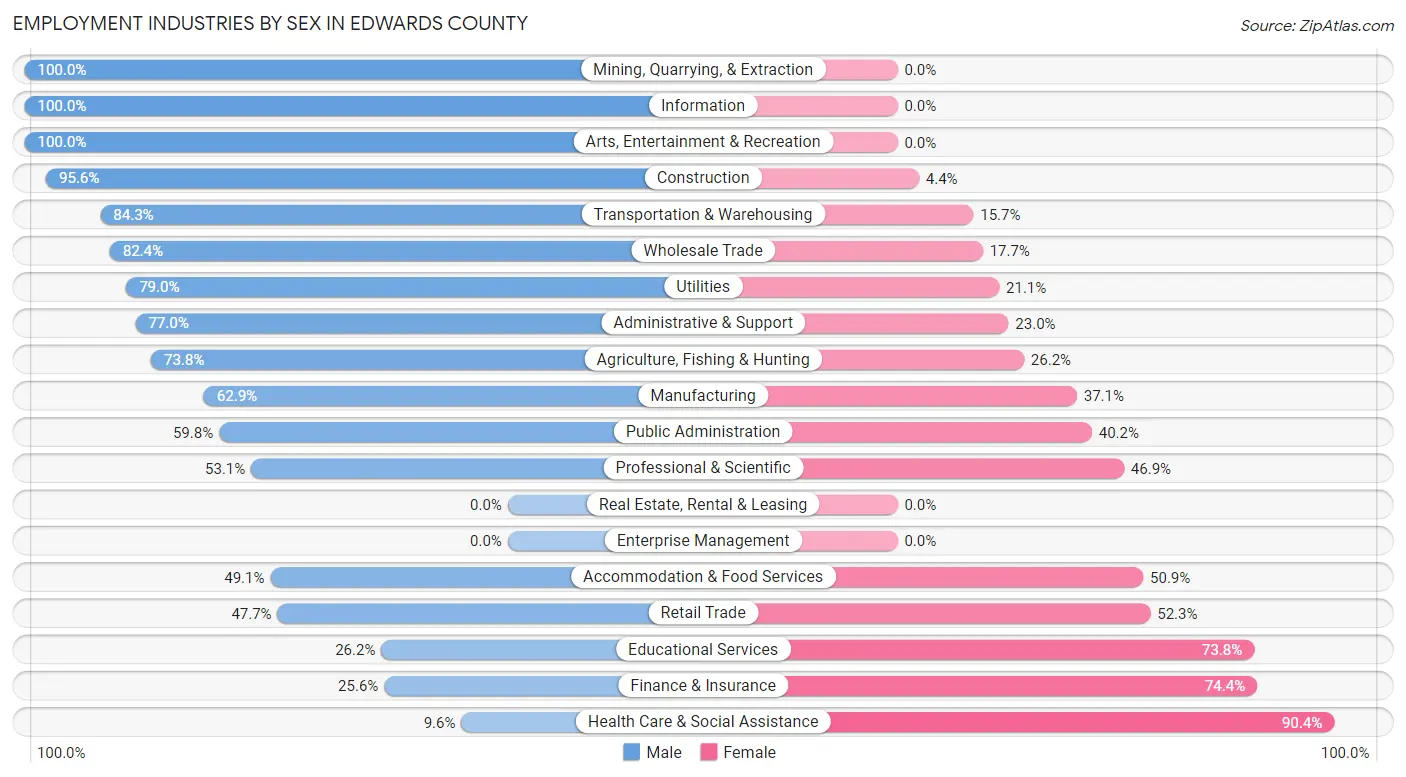
Employment Industries by Sex in Edwards County
The Edwards County industries that see more men than women are Mining, Quarrying, & Extraction (100.0%), Information (100.0%), and Arts, Entertainment & Recreation (100.0%), whereas the industries that tend to have a higher number of women are Health Care & Social Assistance (90.4%), Finance & Insurance (74.4%), and Educational Services (73.8%).
| Industry | Male | Female |
| Agriculture, Fishing & Hunting | 172 (73.8%) | 61 (26.2%) |
| Mining, Quarrying, & Extraction | 101 (100.0%) | 0 (0.0%) |
| Construction | 129 (95.6%) | 6 (4.4%) |
| Manufacturing | 432 (62.9%) | 255 (37.1%) |
| Wholesale Trade | 42 (82.4%) | 9 (17.6%) |
| Retail Trade | 102 (47.7%) | 112 (52.3%) |
| Transportation & Warehousing | 102 (84.3%) | 19 (15.7%) |
| Utilities | 15 (78.9%) | 4 (21.0%) |
| Information | 3 (100.0%) | 0 (0.0%) |
| Finance & Insurance | 11 (25.6%) | 32 (74.4%) |
| Real Estate, Rental & Leasing | 0 (0.0%) | 0 (0.0%) |
| Professional & Scientific | 17 (53.1%) | 15 (46.9%) |
| Enterprise Management | 0 (0.0%) | 0 (0.0%) |
| Administrative & Support | 57 (77.0%) | 17 (23.0%) |
| Educational Services | 50 (26.2%) | 141 (73.8%) |
| Health Care & Social Assistance | 42 (9.6%) | 395 (90.4%) |
| Arts, Entertainment & Recreation | 11 (100.0%) | 0 (0.0%) |
| Accommodation & Food Services | 57 (49.1%) | 59 (50.9%) |
| Public Administration | 52 (59.8%) | 35 (40.2%) |
| Total | 1,505 (55.9%) | 1,189 (44.1%) |
Education in Edwards County
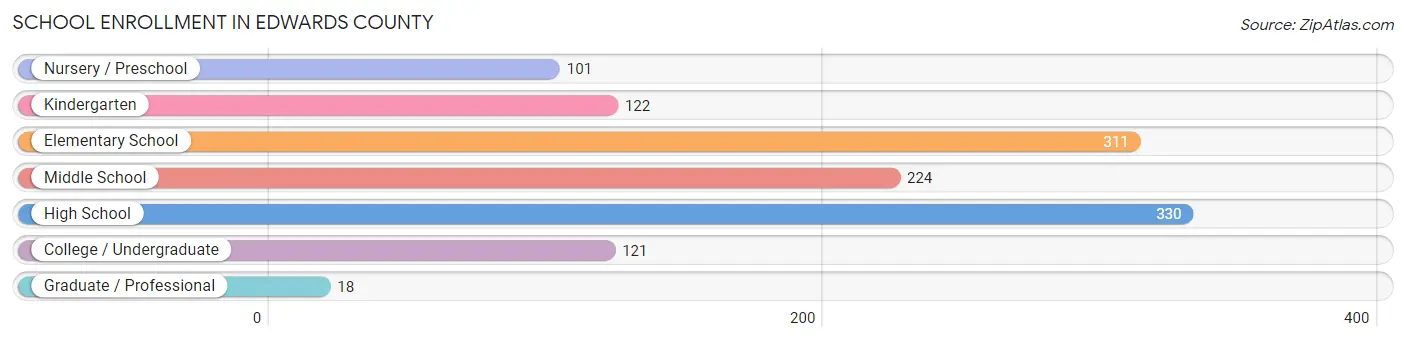
School Enrollment in Edwards County
The most common levels of schooling among the 1,227 students in Edwards County are high school (330 | 26.9%), elementary school (311 | 25.4%), and middle school (224 | 18.3%).
| School Level | # Students | % Students |
| Nursery / Preschool | 101 | 8.2% |
| Kindergarten | 122 | 9.9% |
| Elementary School | 311 | 25.4% |
| Middle School | 224 | 18.3% |
| High School | 330 | 26.9% |
| College / Undergraduate | 121 | 9.9% |
| Graduate / Professional | 18 | 1.5% |
| Total | 1,227 | 100.0% |
School Enrollment by Age by Funding Source in Edwards County
Out of a total of 1,227 students who are enrolled in schools in Edwards County, 69 (5.6%) attend a private institution, while the remaining 1,158 (94.4%) are enrolled in public schools. The age group of 35 years and over has the highest likelihood of being enrolled in private schools, with 9 (24.3% in the age bracket) enrolled. Conversely, the age group of 10 to 14 year olds has the lowest likelihood of being enrolled in a private school, with 285 (100.0% in the age bracket) attending a public institution.
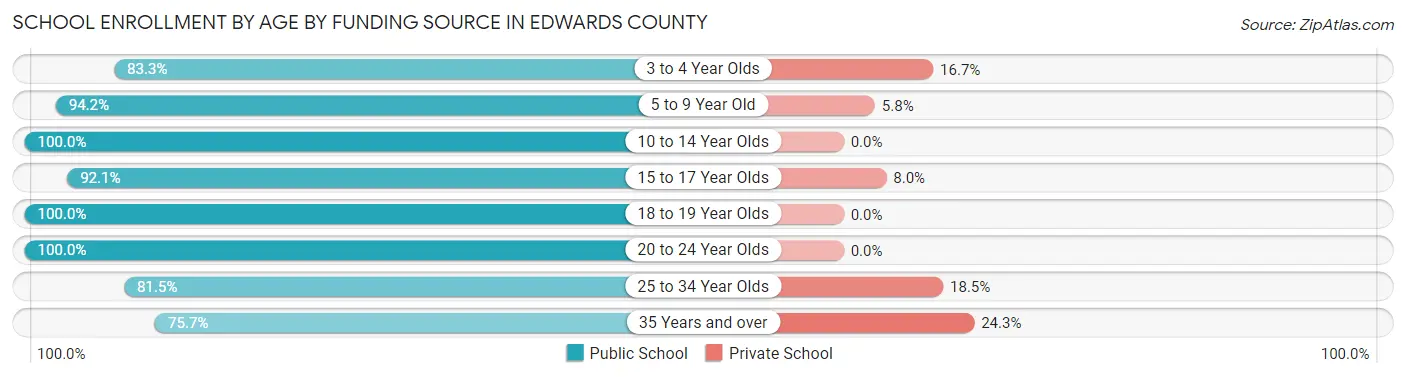
| Age Bracket | Public School | Private School |
| 3 to 4 Year Olds | 35 (83.3%) | 7 (16.7%) |
| 5 to 9 Year Old | 437 (94.2%) | 27 (5.8%) |
| 10 to 14 Year Olds | 285 (100.0%) | 0 (0.0%) |
| 15 to 17 Year Olds | 243 (92.0%) | 21 (8.0%) |
| 18 to 19 Year Olds | 48 (100.0%) | 0 (0.0%) |
| 20 to 24 Year Olds | 60 (100.0%) | 0 (0.0%) |
| 25 to 34 Year Olds | 22 (81.5%) | 5 (18.5%) |
| 35 Years and over | 28 (75.7%) | 9 (24.3%) |
| Total | 1,158 (94.4%) | 69 (5.6%) |
Educational Attainment by Field of Study in Edwards County
Education (214 | 32.7%), business (107 | 16.3%), science & technology (74 | 11.3%), liberal arts & history (59 | 9.0%), and bio, nature & agricultural (51 | 7.8%) are the most common fields of study among 655 individuals in Edwards County who have obtained a bachelor's degree or higher.
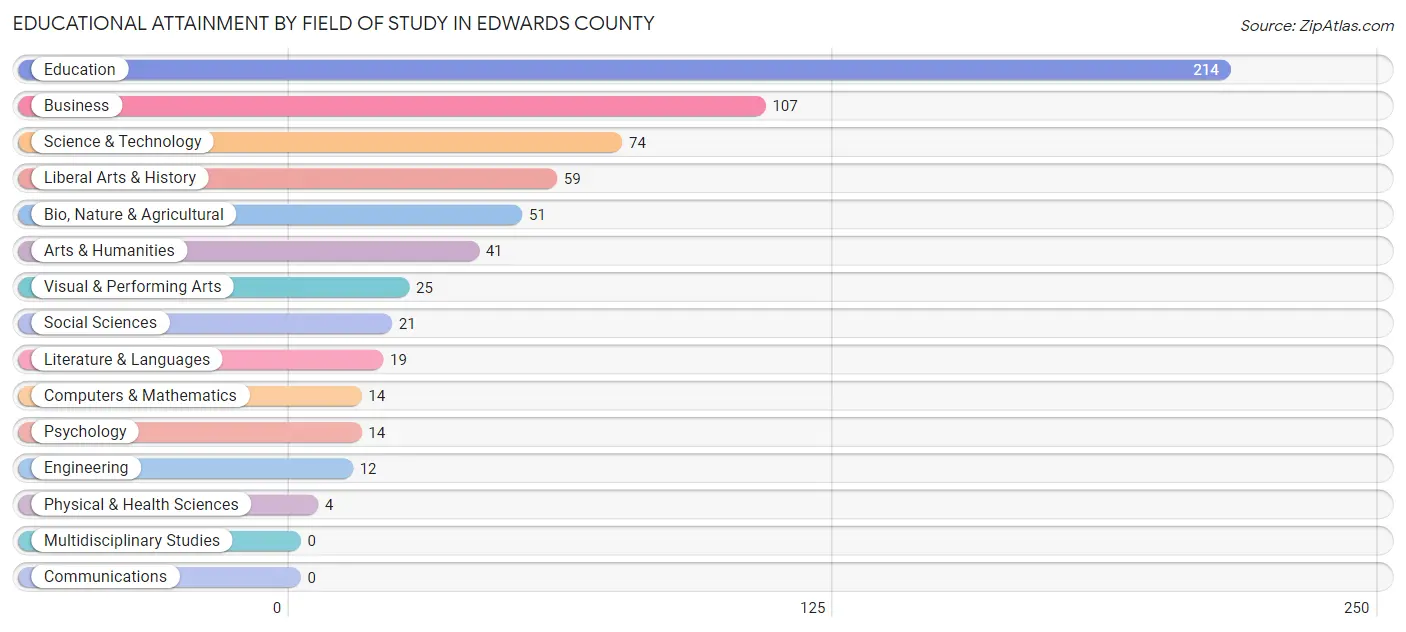
| Field of Study | # Graduates | % Graduates |
| Computers & Mathematics | 14 | 2.1% |
| Bio, Nature & Agricultural | 51 | 7.8% |
| Physical & Health Sciences | 4 | 0.6% |
| Psychology | 14 | 2.1% |
| Social Sciences | 21 | 3.2% |
| Engineering | 12 | 1.8% |
| Multidisciplinary Studies | 0 | 0.0% |
| Science & Technology | 74 | 11.3% |
| Business | 107 | 16.3% |
| Education | 214 | 32.7% |
| Literature & Languages | 19 | 2.9% |
| Liberal Arts & History | 59 | 9.0% |
| Visual & Performing Arts | 25 | 3.8% |
| Communications | 0 | 0.0% |
| Arts & Humanities | 41 | 6.3% |
| Total | 655 | 100.0% |
Transportation & Commute in Edwards County
Vehicle Availability by Sex in Edwards County
The most prevalent vehicle ownership categories in Edwards County are males with 3 vehicles (581, accounting for 39.1%) and females with 3 vehicles (412, making up 49.7%).
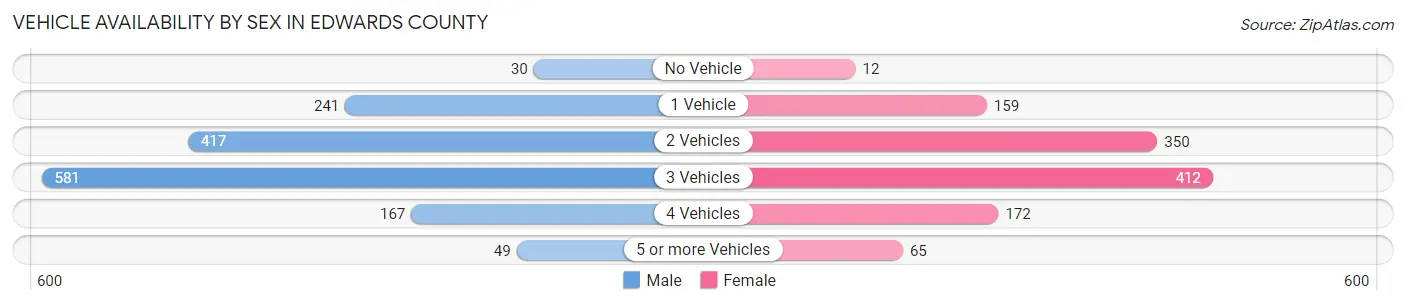
| Vehicles Available | Male | Female |
| No Vehicle | 30 (2.0%) | 12 (1.0%) |
| 1 Vehicle | 241 (16.2%) | 159 (13.6%) |
| 2 Vehicles | 417 (28.1%) | 350 (29.9%) |
| 3 Vehicles | 581 (39.1%) | 412 (35.2%) |
| 4 Vehicles | 167 (11.3%) | 172 (14.7%) |
| 5 or more Vehicles | 49 (3.3%) | 65 (5.6%) |
| Total | 1,485 (100.0%) | 1,170 (100.0%) |
Commute Time in Edwards County
The most frequently occuring commute durations in Edwards County are 45 to 59 minutes (392 commuters, 15.5%), 5 to 9 minutes (382 commuters, 15.1%), and 10 to 14 minutes (343 commuters, 13.6%).
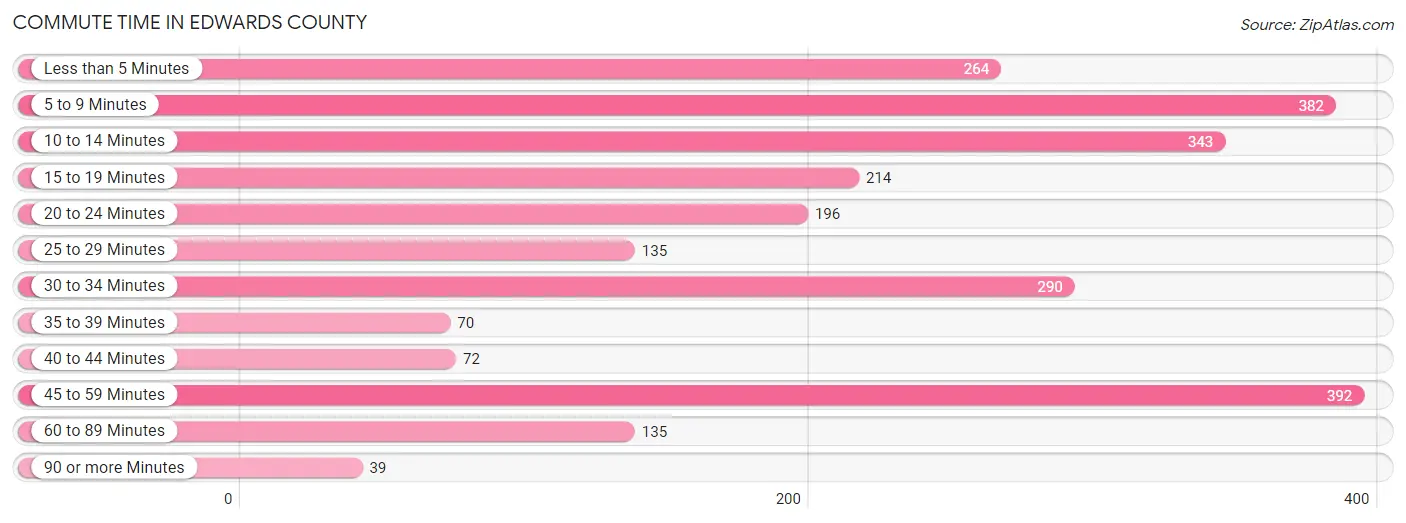
| Commute Time | # Commuters | % Commuters |
| Less than 5 Minutes | 264 | 10.4% |
| 5 to 9 Minutes | 382 | 15.1% |
| 10 to 14 Minutes | 343 | 13.6% |
| 15 to 19 Minutes | 214 | 8.5% |
| 20 to 24 Minutes | 196 | 7.7% |
| 25 to 29 Minutes | 135 | 5.3% |
| 30 to 34 Minutes | 290 | 11.5% |
| 35 to 39 Minutes | 70 | 2.8% |
| 40 to 44 Minutes | 72 | 2.8% |
| 45 to 59 Minutes | 392 | 15.5% |
| 60 to 89 Minutes | 135 | 5.3% |
| 90 or more Minutes | 39 | 1.5% |
Commute Time by Sex in Edwards County
The most common commute times in Edwards County are 45 to 59 minutes (261 commuters, 18.5%) for males and 10 to 14 minutes (200 commuters, 17.8%) for females.
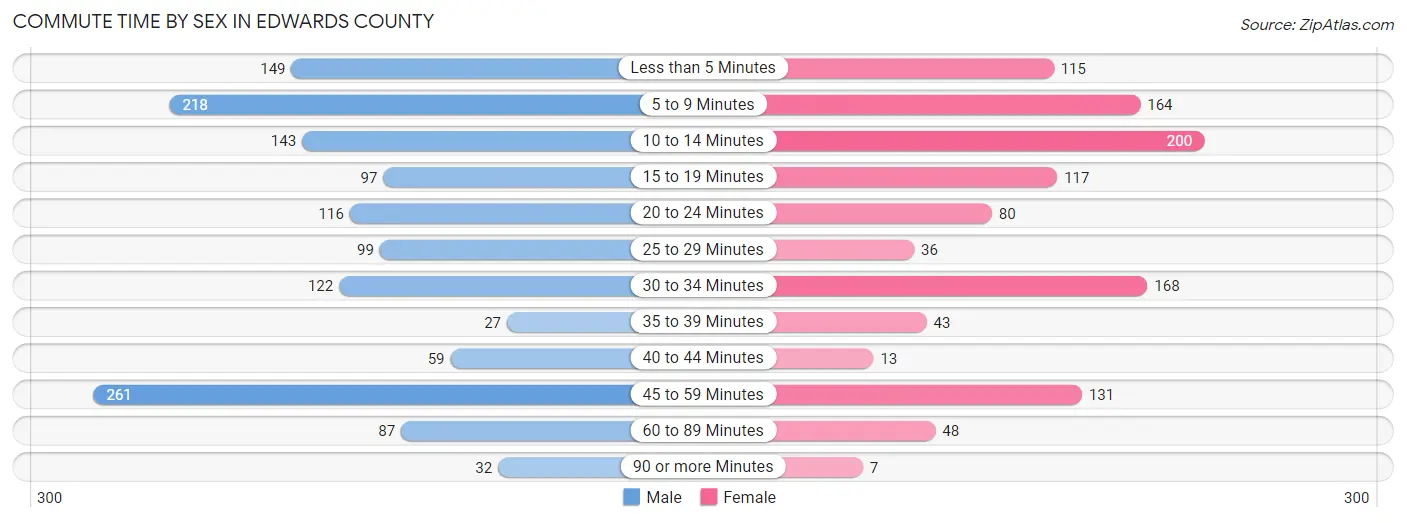
| Commute Time | Male | Female |
| Less than 5 Minutes | 149 (10.6%) | 115 (10.2%) |
| 5 to 9 Minutes | 218 (15.5%) | 164 (14.6%) |
| 10 to 14 Minutes | 143 (10.1%) | 200 (17.8%) |
| 15 to 19 Minutes | 97 (6.9%) | 117 (10.4%) |
| 20 to 24 Minutes | 116 (8.2%) | 80 (7.1%) |
| 25 to 29 Minutes | 99 (7.0%) | 36 (3.2%) |
| 30 to 34 Minutes | 122 (8.6%) | 168 (15.0%) |
| 35 to 39 Minutes | 27 (1.9%) | 43 (3.8%) |
| 40 to 44 Minutes | 59 (4.2%) | 13 (1.2%) |
| 45 to 59 Minutes | 261 (18.5%) | 131 (11.7%) |
| 60 to 89 Minutes | 87 (6.2%) | 48 (4.3%) |
| 90 or more Minutes | 32 (2.3%) | 7 (0.6%) |
Time of Departure to Work by Sex in Edwards County
The most frequent times of departure to work in Edwards County are 6:30 AM to 6:59 AM (224, 15.9%) for males and 7:30 AM to 7:59 AM (177, 15.8%) for females.
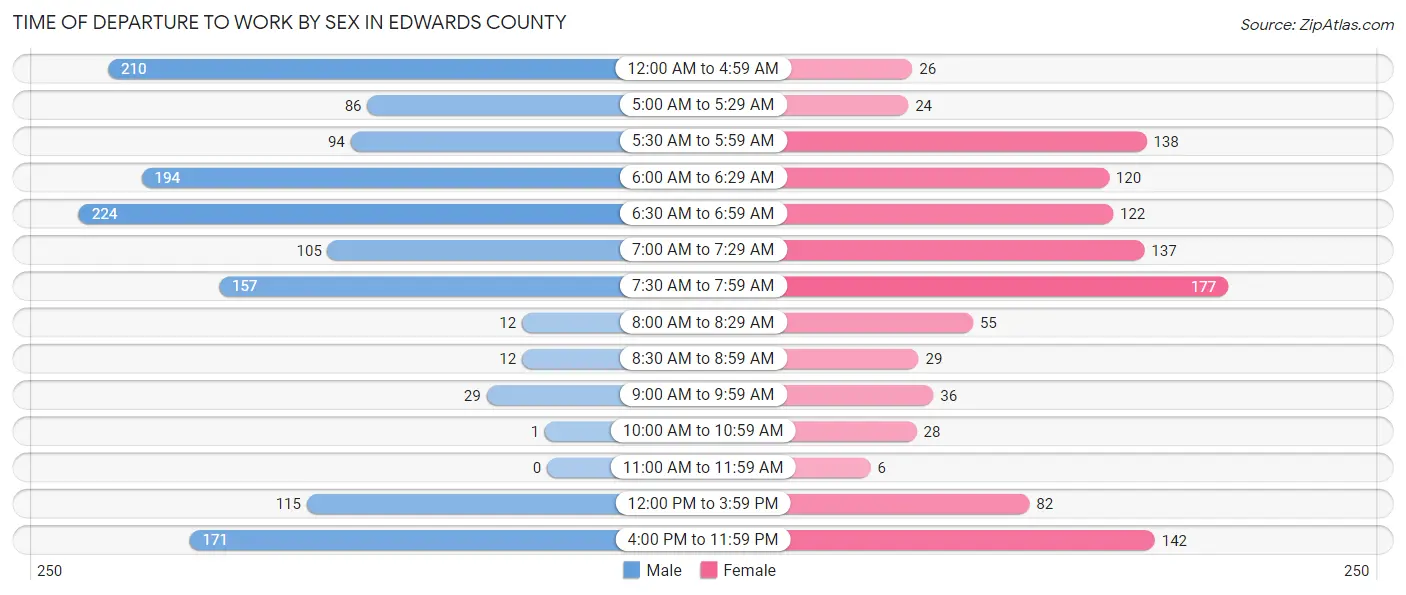
| Time of Departure | Male | Female |
| 12:00 AM to 4:59 AM | 210 (14.9%) | 26 (2.3%) |
| 5:00 AM to 5:29 AM | 86 (6.1%) | 24 (2.1%) |
| 5:30 AM to 5:59 AM | 94 (6.7%) | 138 (12.3%) |
| 6:00 AM to 6:29 AM | 194 (13.8%) | 120 (10.7%) |
| 6:30 AM to 6:59 AM | 224 (15.9%) | 122 (10.9%) |
| 7:00 AM to 7:29 AM | 105 (7.4%) | 137 (12.2%) |
| 7:30 AM to 7:59 AM | 157 (11.1%) | 177 (15.8%) |
| 8:00 AM to 8:29 AM | 12 (0.9%) | 55 (4.9%) |
| 8:30 AM to 8:59 AM | 12 (0.9%) | 29 (2.6%) |
| 9:00 AM to 9:59 AM | 29 (2.1%) | 36 (3.2%) |
| 10:00 AM to 10:59 AM | 1 (0.1%) | 28 (2.5%) |
| 11:00 AM to 11:59 AM | 0 (0.0%) | 6 (0.5%) |
| 12:00 PM to 3:59 PM | 115 (8.2%) | 82 (7.3%) |
| 4:00 PM to 11:59 PM | 171 (12.1%) | 142 (12.7%) |
| Total | 1,410 (100.0%) | 1,122 (100.0%) |
Housing Occupancy in Edwards County
Occupancy by Ownership in Edwards County
Of the total 2,625 dwellings in Edwards County, owner-occupied units account for 2,078 (79.2%), while renter-occupied units make up 547 (20.8%).
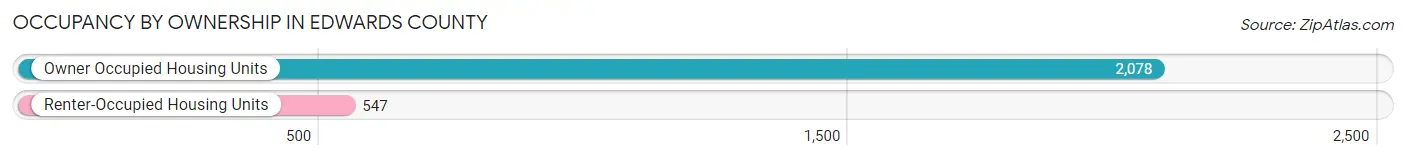
| Occupancy | # Housing Units | % Housing Units |
| Owner Occupied Housing Units | 2,078 | 79.2% |
| Renter-Occupied Housing Units | 547 | 20.8% |
| Total Occupied Housing Units | 2,625 | 100.0% |
Occupancy by Household Size in Edwards County
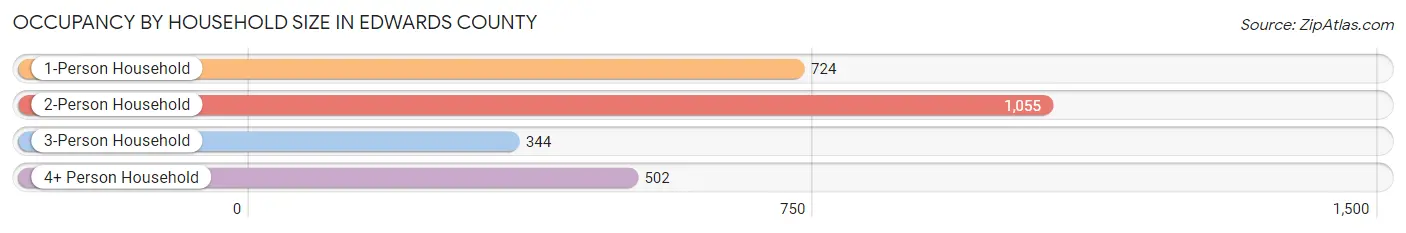
| Household Size | # Housing Units | % Housing Units |
| 1-Person Household | 724 | 27.6% |
| 2-Person Household | 1,055 | 40.2% |
| 3-Person Household | 344 | 13.1% |
| 4+ Person Household | 502 | 19.1% |
| Total Housing Units | 2,625 | 100.0% |
Occupancy by Ownership by Household Size in Edwards County
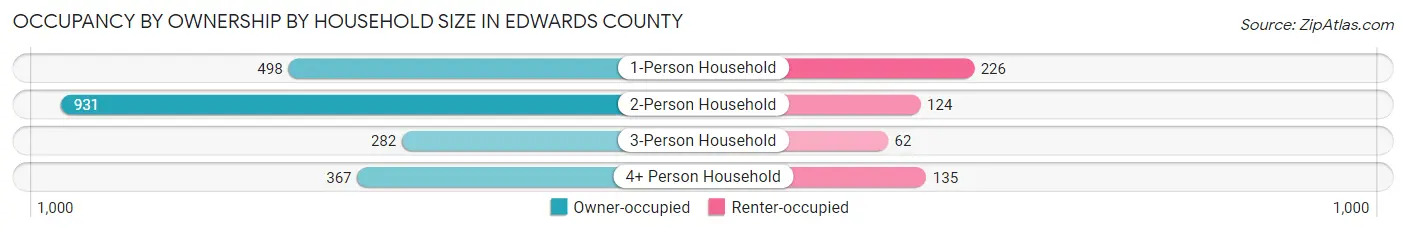
| Household Size | Owner-occupied | Renter-occupied |
| 1-Person Household | 498 (68.8%) | 226 (31.2%) |
| 2-Person Household | 931 (88.2%) | 124 (11.7%) |
| 3-Person Household | 282 (82.0%) | 62 (18.0%) |
| 4+ Person Household | 367 (73.1%) | 135 (26.9%) |
| Total Housing Units | 2,078 (79.2%) | 547 (20.8%) |
Occupancy by Educational Attainment in Edwards County
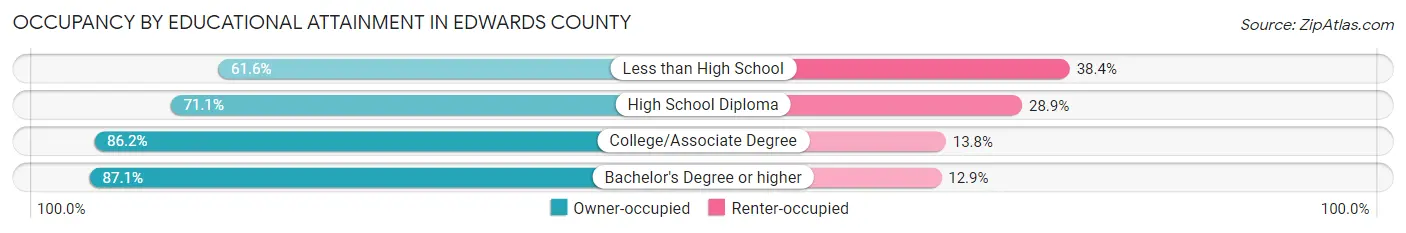
| Household Size | Owner-occupied | Renter-occupied |
| Less than High School | 122 (61.6%) | 76 (38.4%) |
| High School Diploma | 656 (71.1%) | 267 (28.9%) |
| College/Associate Degree | 956 (86.2%) | 153 (13.8%) |
| Bachelor's Degree or higher | 344 (87.1%) | 51 (12.9%) |
Occupancy by Age of Householder in Edwards County
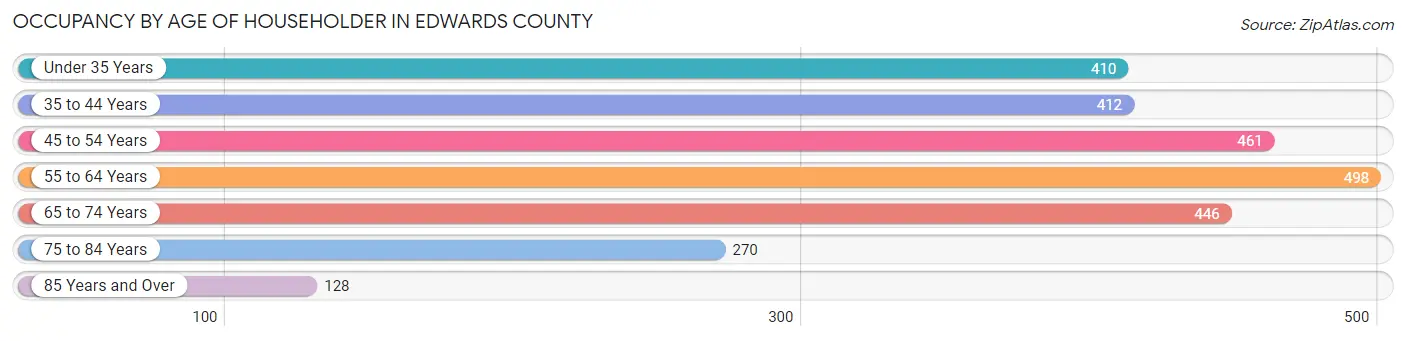
| Age Bracket | # Households | % Households |
| Under 35 Years | 410 | 15.6% |
| 35 to 44 Years | 412 | 15.7% |
| 45 to 54 Years | 461 | 17.6% |
| 55 to 64 Years | 498 | 19.0% |
| 65 to 74 Years | 446 | 17.0% |
| 75 to 84 Years | 270 | 10.3% |
| 85 Years and Over | 128 | 4.9% |
| Total | 2,625 | 100.0% |
Housing Finances in Edwards County
Median Income by Occupancy in Edwards County
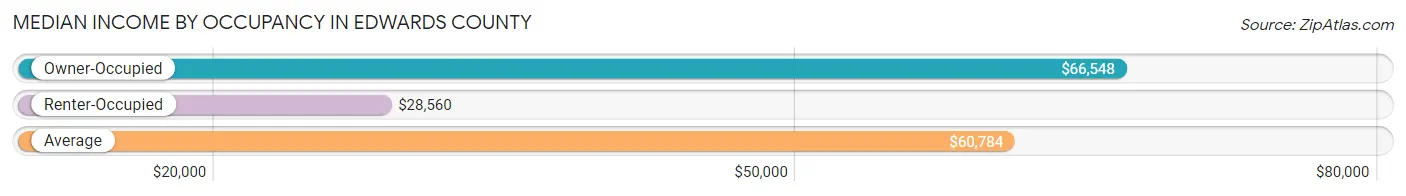
| Occupancy Type | # Households | Median Income |
| Owner-Occupied | 2,078 (79.2%) | $66,548 |
| Renter-Occupied | 547 (20.8%) | $28,560 |
| Average | 2,625 (100.0%) | $60,784 |
Occupancy by Householder Income Bracket in Edwards County
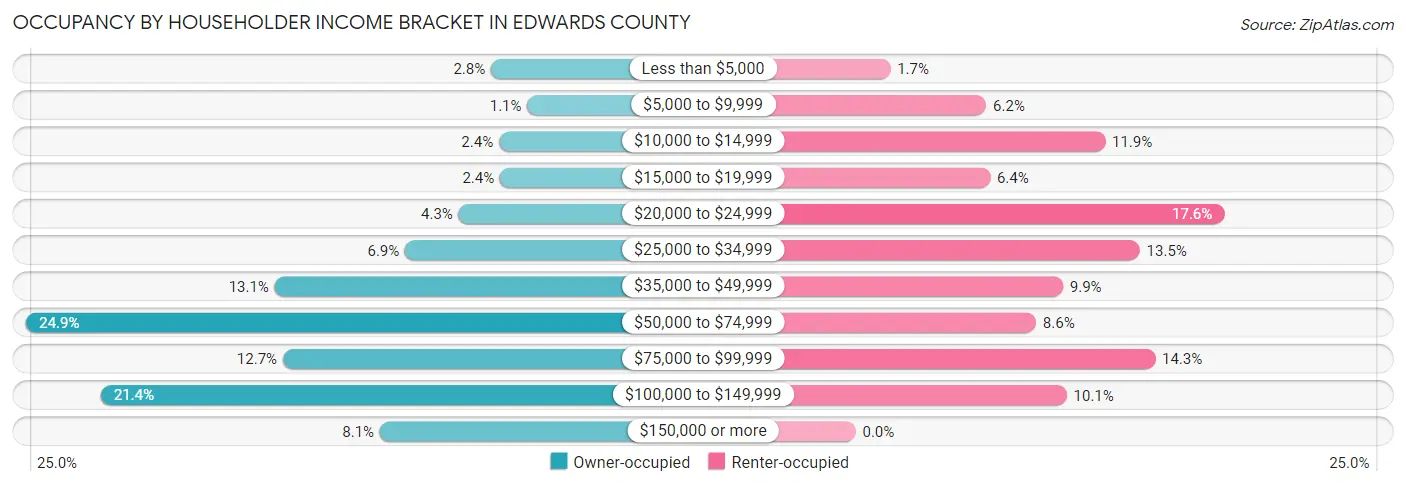
| Income Bracket | Owner-occupied | Renter-occupied |
| Less than $5,000 | 58 (2.8%) | 9 (1.7%) |
| $5,000 to $9,999 | 22 (1.1%) | 34 (6.2%) |
| $10,000 to $14,999 | 50 (2.4%) | 65 (11.9%) |
| $15,000 to $19,999 | 49 (2.4%) | 35 (6.4%) |
| $20,000 to $24,999 | 90 (4.3%) | 96 (17.5%) |
| $25,000 to $34,999 | 143 (6.9%) | 74 (13.5%) |
| $35,000 to $49,999 | 272 (13.1%) | 54 (9.9%) |
| $50,000 to $74,999 | 518 (24.9%) | 47 (8.6%) |
| $75,000 to $99,999 | 264 (12.7%) | 78 (14.3%) |
| $100,000 to $149,999 | 444 (21.4%) | 55 (10.1%) |
| $150,000 or more | 168 (8.1%) | 0 (0.0%) |
| Total | 2,078 (100.0%) | 547 (100.0%) |
Monthly Housing Cost Tiers in Edwards County
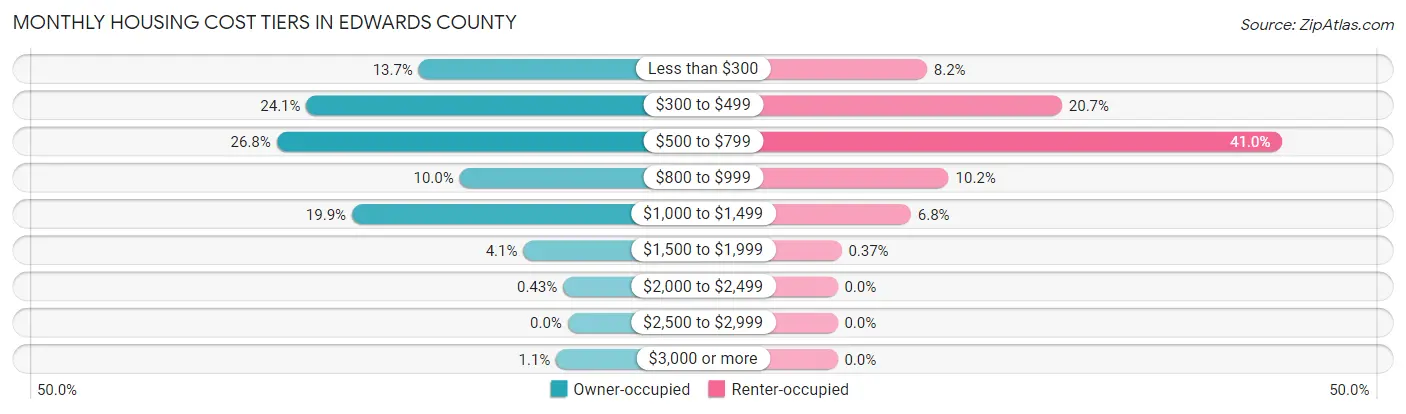
| Monthly Cost | Owner-occupied | Renter-occupied |
| Less than $300 | 285 (13.7%) | 45 (8.2%) |
| $300 to $499 | 500 (24.1%) | 113 (20.7%) |
| $500 to $799 | 557 (26.8%) | 224 (40.9%) |
| $800 to $999 | 207 (10.0%) | 56 (10.2%) |
| $1,000 to $1,499 | 413 (19.9%) | 37 (6.8%) |
| $1,500 to $1,999 | 85 (4.1%) | 2 (0.4%) |
| $2,000 to $2,499 | 9 (0.4%) | 0 (0.0%) |
| $2,500 to $2,999 | 0 (0.0%) | 0 (0.0%) |
| $3,000 or more | 22 (1.1%) | 0 (0.0%) |
| Total | 2,078 (100.0%) | 547 (100.0%) |
Physical Housing Characteristics in Edwards County
Housing Structures in Edwards County
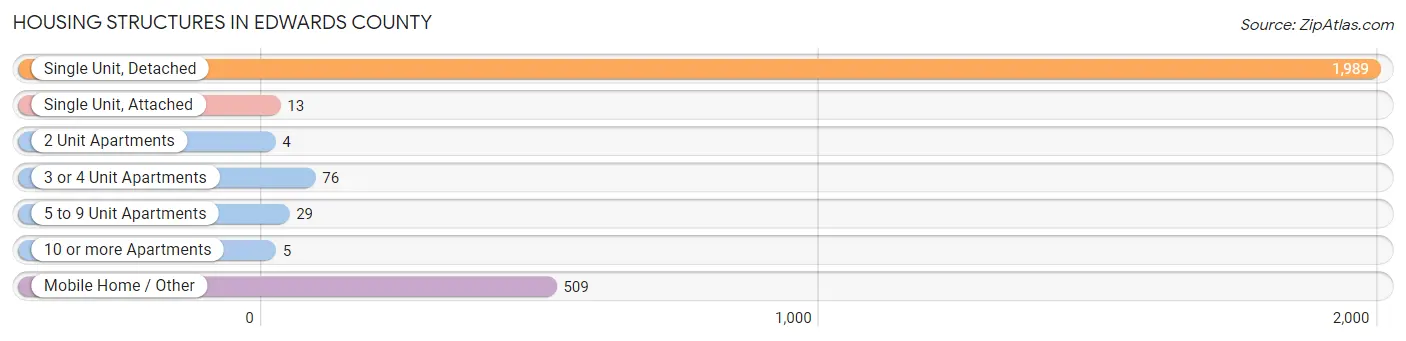
| Structure Type | # Housing Units | % Housing Units |
| Single Unit, Detached | 1,989 | 75.8% |
| Single Unit, Attached | 13 | 0.5% |
| 2 Unit Apartments | 4 | 0.2% |
| 3 or 4 Unit Apartments | 76 | 2.9% |
| 5 to 9 Unit Apartments | 29 | 1.1% |
| 10 or more Apartments | 5 | 0.2% |
| Mobile Home / Other | 509 | 19.4% |
| Total | 2,625 | 100.0% |
Housing Structures by Occupancy in Edwards County
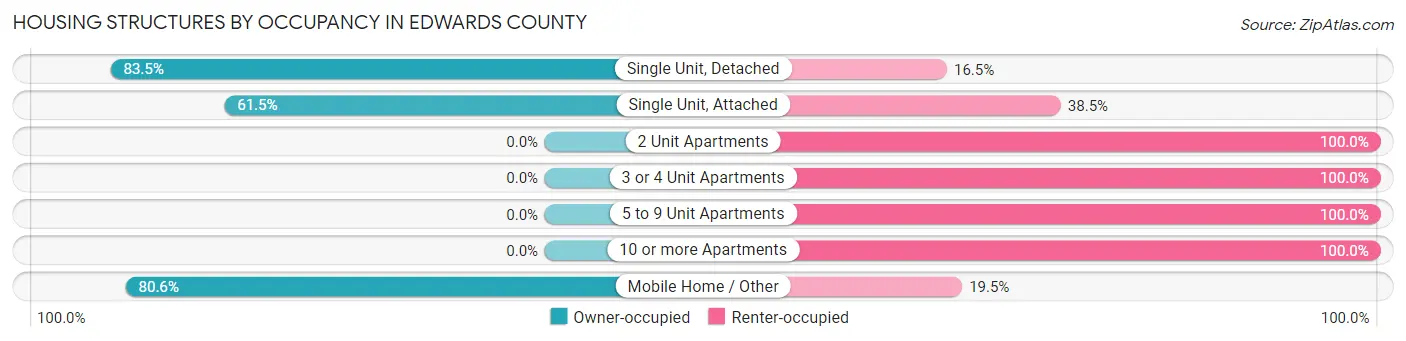
| Structure Type | Owner-occupied | Renter-occupied |
| Single Unit, Detached | 1,660 (83.5%) | 329 (16.5%) |
| Single Unit, Attached | 8 (61.5%) | 5 (38.5%) |
| 2 Unit Apartments | 0 (0.0%) | 4 (100.0%) |
| 3 or 4 Unit Apartments | 0 (0.0%) | 76 (100.0%) |
| 5 to 9 Unit Apartments | 0 (0.0%) | 29 (100.0%) |
| 10 or more Apartments | 0 (0.0%) | 5 (100.0%) |
| Mobile Home / Other | 410 (80.5%) | 99 (19.5%) |
| Total | 2,078 (79.2%) | 547 (20.8%) |
Housing Structures by Number of Rooms in Edwards County
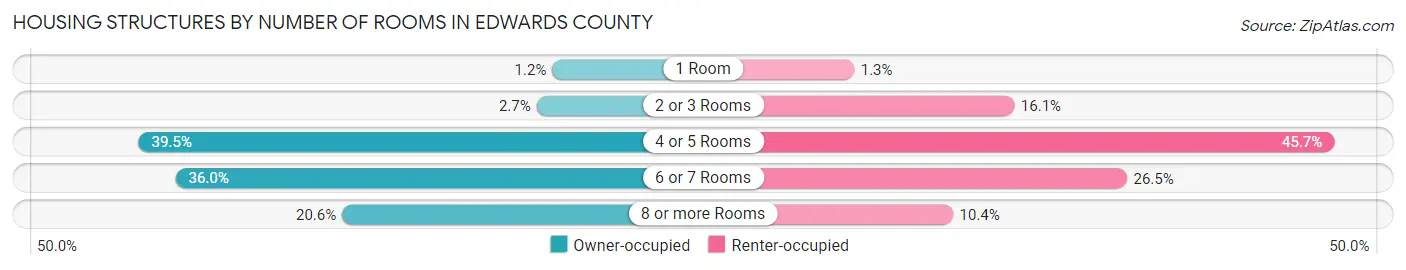
| Number of Rooms | Owner-occupied | Renter-occupied |
| 1 Room | 25 (1.2%) | 7 (1.3%) |
| 2 or 3 Rooms | 55 (2.6%) | 88 (16.1%) |
| 4 or 5 Rooms | 820 (39.5%) | 250 (45.7%) |
| 6 or 7 Rooms | 749 (36.0%) | 145 (26.5%) |
| 8 or more Rooms | 429 (20.6%) | 57 (10.4%) |
| Total | 2,078 (100.0%) | 547 (100.0%) |
Housing Structure by Heating Type in Edwards County
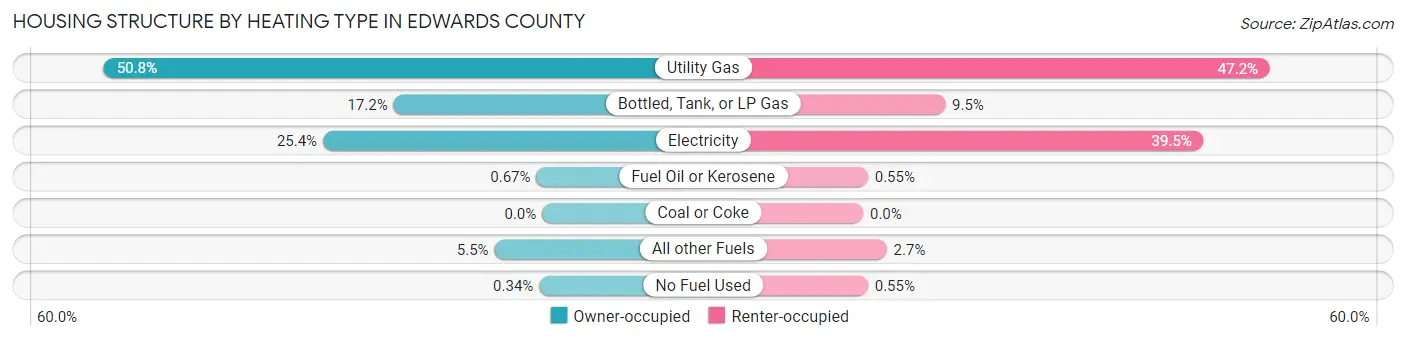
| Heating Type | Owner-occupied | Renter-occupied |
| Utility Gas | 1,056 (50.8%) | 258 (47.2%) |
| Bottled, Tank, or LP Gas | 358 (17.2%) | 52 (9.5%) |
| Electricity | 528 (25.4%) | 216 (39.5%) |
| Fuel Oil or Kerosene | 14 (0.7%) | 3 (0.5%) |
| Coal or Coke | 0 (0.0%) | 0 (0.0%) |
| All other Fuels | 115 (5.5%) | 15 (2.7%) |
| No Fuel Used | 7 (0.3%) | 3 (0.5%) |
| Total | 2,078 (100.0%) | 547 (100.0%) |
Household Vehicle Usage in Edwards County
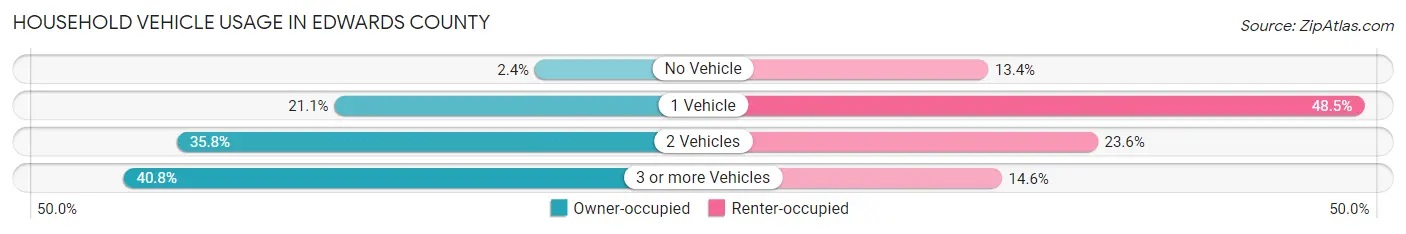
| Vehicles per Household | Owner-occupied | Renter-occupied |
| No Vehicle | 49 (2.4%) | 73 (13.4%) |
| 1 Vehicle | 438 (21.1%) | 265 (48.4%) |
| 2 Vehicles | 744 (35.8%) | 129 (23.6%) |
| 3 or more Vehicles | 847 (40.8%) | 80 (14.6%) |
| Total | 2,078 (100.0%) | 547 (100.0%) |
Real Estate & Mortgages in Edwards County
Real Estate and Mortgage Overview in Edwards County
| Characteristic | Without Mortgage | With Mortgage |
| Housing Units | 1,192 | 886 |
| Median Property Value | $89,000 | $95,500 |
| Median Household Income | $56,336 | $66 |
| Monthly Housing Costs | $440 | $17 |
| Real Estate Taxes | $1,189 | $24 |
Property Value by Mortgage Status in Edwards County
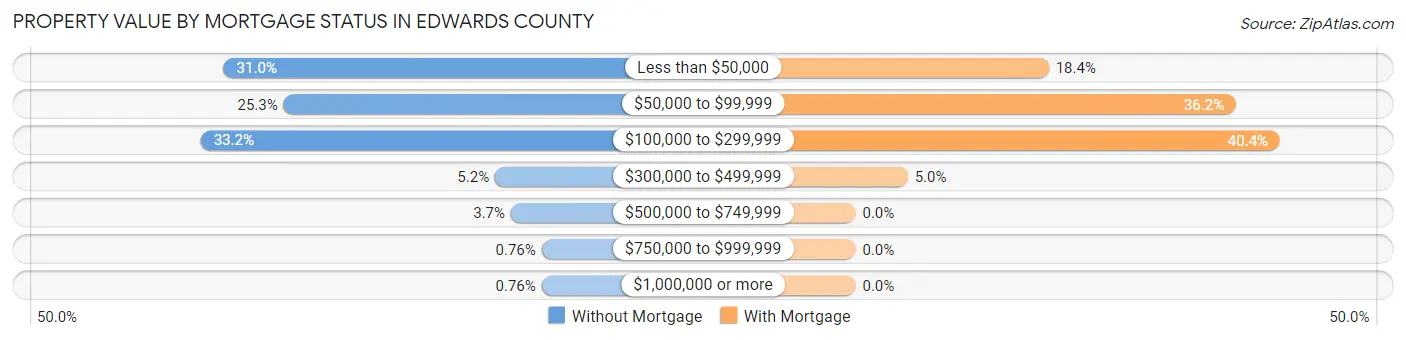
| Property Value | Without Mortgage | With Mortgage |
| Less than $50,000 | 370 (31.0%) | 163 (18.4%) |
| $50,000 to $99,999 | 302 (25.3%) | 321 (36.2%) |
| $100,000 to $299,999 | 396 (33.2%) | 358 (40.4%) |
| $300,000 to $499,999 | 62 (5.2%) | 44 (5.0%) |
| $500,000 to $749,999 | 44 (3.7%) | 0 (0.0%) |
| $750,000 to $999,999 | 9 (0.8%) | 0 (0.0%) |
| $1,000,000 or more | 9 (0.8%) | 0 (0.0%) |
| Total | 1,192 (100.0%) | 886 (100.0%) |
Household Income by Mortgage Status in Edwards County

| Household Income | Without Mortgage | With Mortgage |
| Less than $10,000 | 62 (5.2%) | 12 (1.3%) |
| $10,000 to $24,999 | 133 (11.2%) | 18 (2.0%) |
| $25,000 to $34,999 | 95 (8.0%) | 56 (6.3%) |
| $35,000 to $49,999 | 207 (17.4%) | 48 (5.4%) |
| $50,000 to $74,999 | 324 (27.2%) | 65 (7.3%) |
| $75,000 to $99,999 | 108 (9.1%) | 194 (21.9%) |
| $100,000 to $149,999 | 161 (13.5%) | 156 (17.6%) |
| $150,000 or more | 102 (8.6%) | 283 (31.9%) |
| Total | 1,192 (100.0%) | 886 (100.0%) |
Property Value to Household Income Ratio in Edwards County
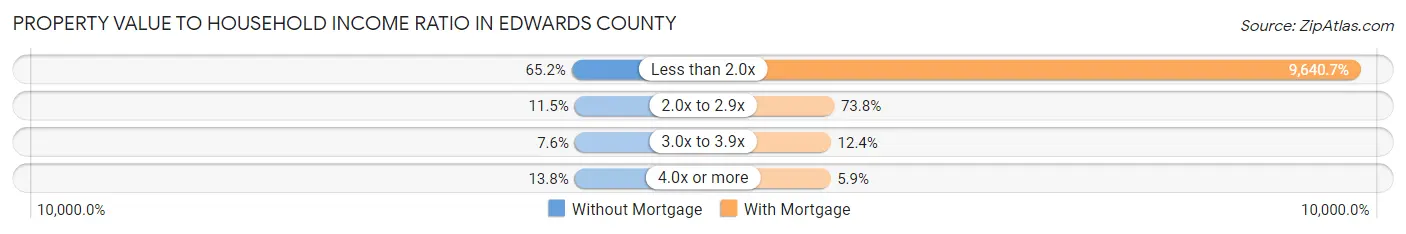
| Value-to-Income Ratio | Without Mortgage | With Mortgage |
| Less than 2.0x | 777 (65.2%) | 85,417 (9,640.7%) |
| 2.0x to 2.9x | 137 (11.5%) | 654 (73.8%) |
| 3.0x to 3.9x | 91 (7.6%) | 110 (12.4%) |
| 4.0x or more | 164 (13.8%) | 52 (5.9%) |
| Total | 1,192 (100.0%) | 886 (100.0%) |
Real Estate Taxes by Mortgage Status in Edwards County
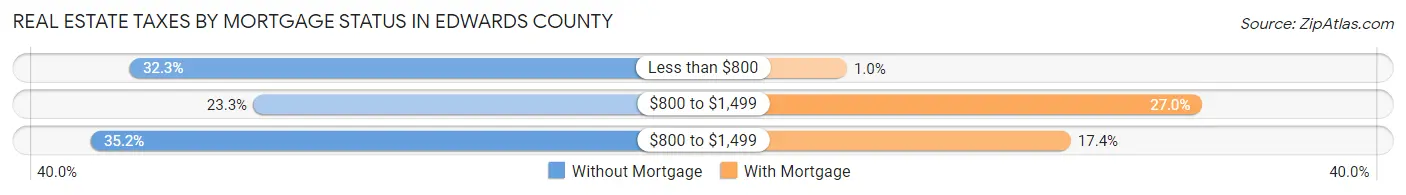
| Property Taxes | Without Mortgage | With Mortgage |
| Less than $800 | 385 (32.3%) | 9 (1.0%) |
| $800 to $1,499 | 278 (23.3%) | 239 (27.0%) |
| $800 to $1,499 | 419 (35.1%) | 154 (17.4%) |
| Total | 1,192 (100.0%) | 886 (100.0%) |
Health & Disability in Edwards County
Health Insurance Coverage by Age in Edwards County
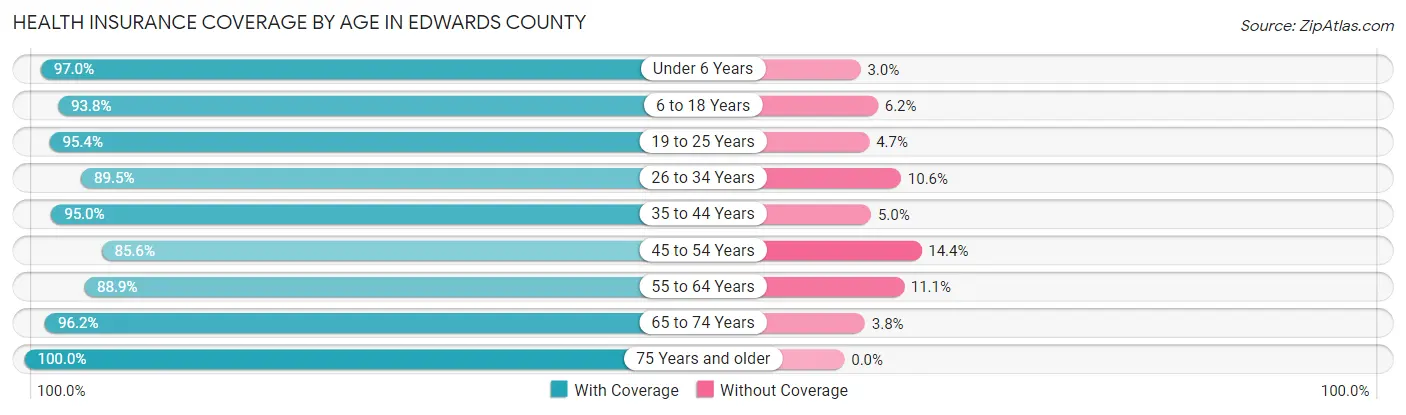
| Age Bracket | With Coverage | Without Coverage |
| Under 6 Years | 481 (97.0%) | 15 (3.0%) |
| 6 to 18 Years | 962 (93.8%) | 64 (6.2%) |
| 19 to 25 Years | 369 (95.4%) | 18 (4.6%) |
| 26 to 34 Years | 475 (89.4%) | 56 (10.5%) |
| 35 to 44 Years | 687 (95.0%) | 36 (5.0%) |
| 45 to 54 Years | 668 (85.6%) | 112 (14.4%) |
| 55 to 64 Years | 801 (88.9%) | 100 (11.1%) |
| 65 to 74 Years | 728 (96.2%) | 29 (3.8%) |
| 75 Years and older | 560 (100.0%) | 0 (0.0%) |
| Total | 5,731 (93.0%) | 430 (7.0%) |
Health Insurance Coverage by Citizenship Status in Edwards County
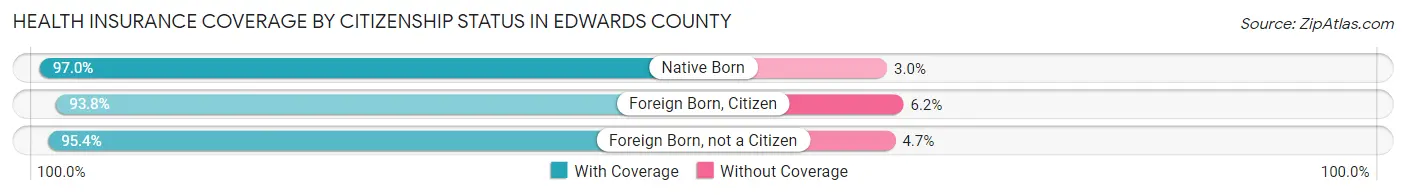
| Citizenship Status | With Coverage | Without Coverage |
| Native Born | 481 (97.0%) | 15 (3.0%) |
| Foreign Born, Citizen | 962 (93.8%) | 64 (6.2%) |
| Foreign Born, not a Citizen | 369 (95.4%) | 18 (4.6%) |
Health Insurance Coverage by Household Income in Edwards County
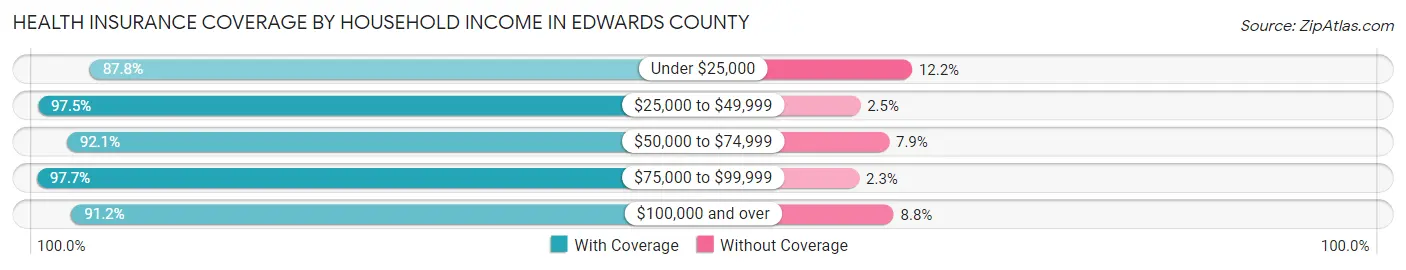
| Household Income | With Coverage | Without Coverage |
| Under $25,000 | 719 (87.8%) | 100 (12.2%) |
| $25,000 to $49,999 | 1,088 (97.5%) | 28 (2.5%) |
| $50,000 to $74,999 | 1,245 (92.1%) | 107 (7.9%) |
| $75,000 to $99,999 | 845 (97.7%) | 20 (2.3%) |
| $100,000 and over | 1,821 (91.2%) | 175 (8.8%) |
Public vs Private Health Insurance Coverage by Age in Edwards County
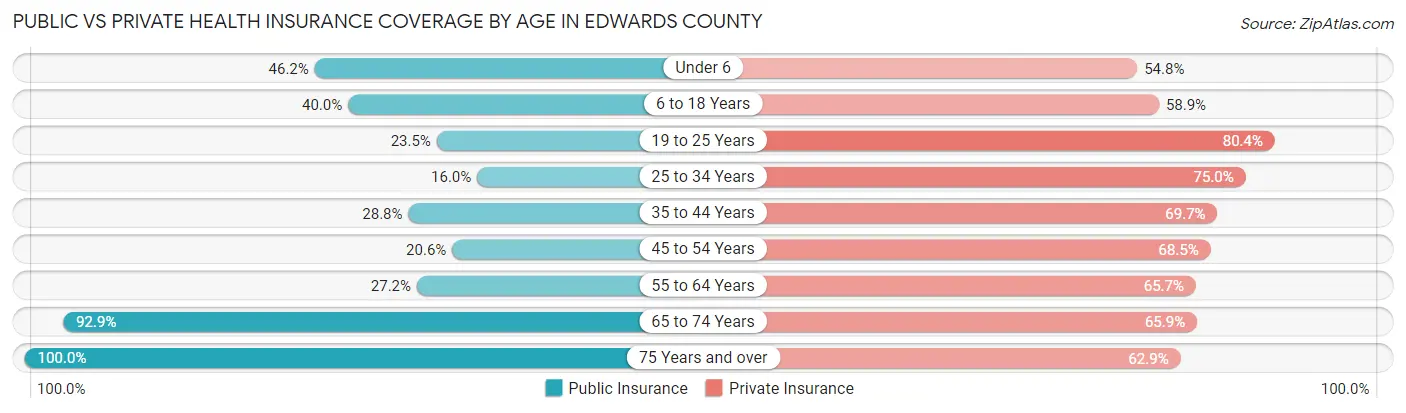
| Age Bracket | Public Insurance | Private Insurance |
| Under 6 | 229 (46.2%) | 272 (54.8%) |
| 6 to 18 Years | 410 (40.0%) | 604 (58.9%) |
| 19 to 25 Years | 91 (23.5%) | 311 (80.4%) |
| 25 to 34 Years | 85 (16.0%) | 398 (75.0%) |
| 35 to 44 Years | 208 (28.8%) | 504 (69.7%) |
| 45 to 54 Years | 161 (20.6%) | 534 (68.5%) |
| 55 to 64 Years | 245 (27.2%) | 592 (65.7%) |
| 65 to 74 Years | 703 (92.9%) | 499 (65.9%) |
| 75 Years and over | 560 (100.0%) | 352 (62.9%) |
| Total | 2,692 (43.7%) | 4,066 (66.0%) |
Disability Status by Sex by Age in Edwards County
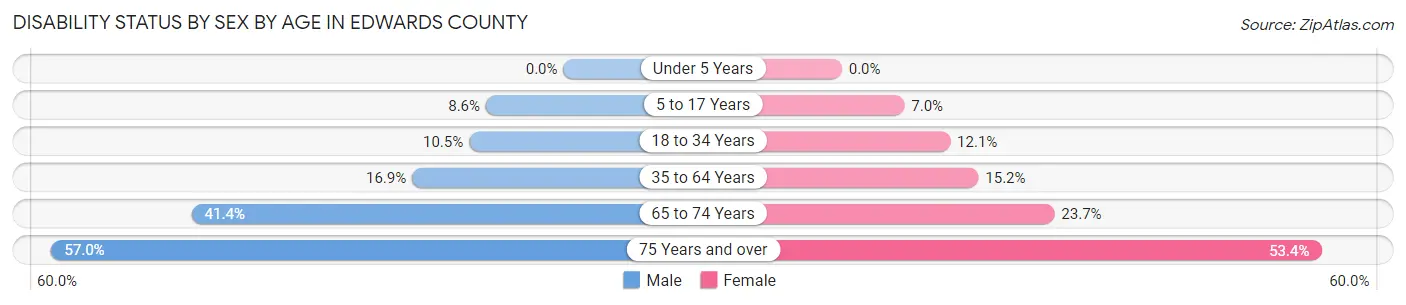
| Age Bracket | Male | Female |
| Under 5 Years | 0 (0.0%) | 0 (0.0%) |
| 5 to 17 Years | 46 (8.6%) | 37 (7.0%) |
| 18 to 34 Years | 55 (10.5%) | 59 (12.1%) |
| 35 to 64 Years | 209 (16.9%) | 177 (15.2%) |
| 65 to 74 Years | 149 (41.4%) | 94 (23.7%) |
| 75 Years and over | 126 (57.0%) | 181 (53.4%) |
Disability Class by Sex by Age in Edwards County
Disability Class: Hearing Difficulty
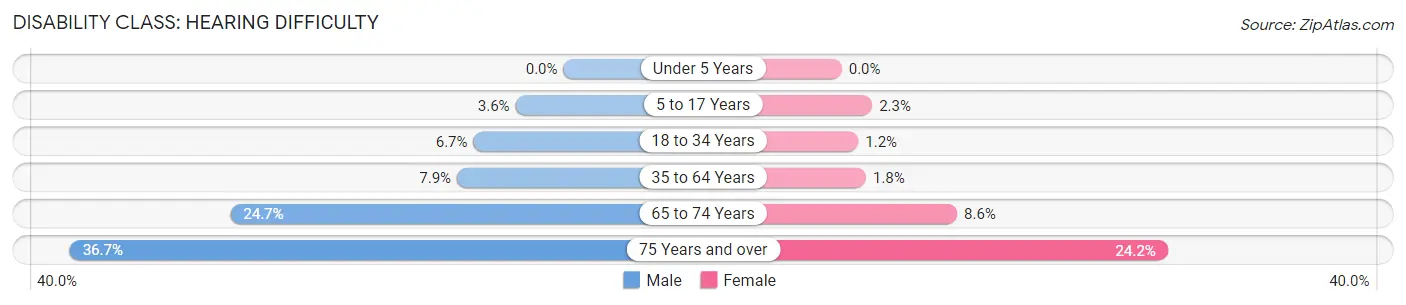
| Age Bracket | Male | Female |
| Under 5 Years | 0 (0.0%) | 0 (0.0%) |
| 5 to 17 Years | 19 (3.6%) | 12 (2.3%) |
| 18 to 34 Years | 35 (6.7%) | 6 (1.2%) |
| 35 to 64 Years | 98 (7.9%) | 21 (1.8%) |
| 65 to 74 Years | 89 (24.7%) | 34 (8.6%) |
| 75 Years and over | 81 (36.6%) | 82 (24.2%) |
Disability Class: Vision Difficulty
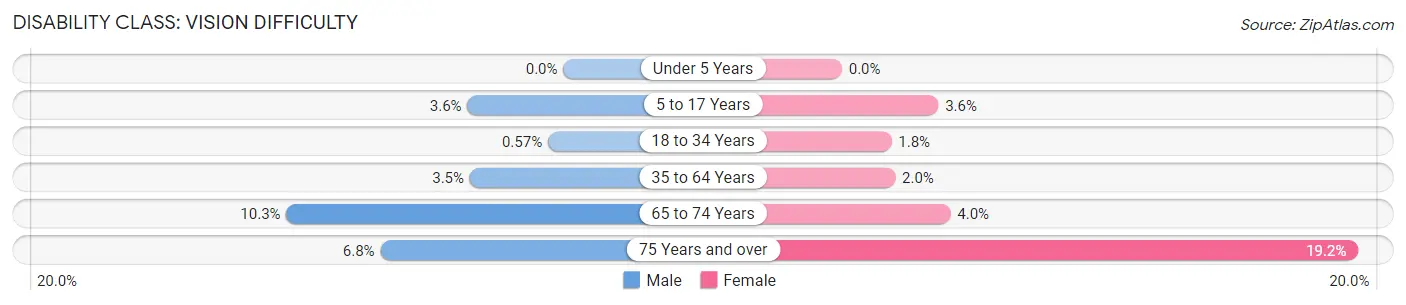
| Age Bracket | Male | Female |
| Under 5 Years | 0 (0.0%) | 0 (0.0%) |
| 5 to 17 Years | 19 (3.6%) | 19 (3.6%) |
| 18 to 34 Years | 3 (0.6%) | 9 (1.8%) |
| 35 to 64 Years | 43 (3.5%) | 23 (2.0%) |
| 65 to 74 Years | 37 (10.3%) | 16 (4.0%) |
| 75 Years and over | 15 (6.8%) | 65 (19.2%) |
Disability Class: Cognitive Difficulty
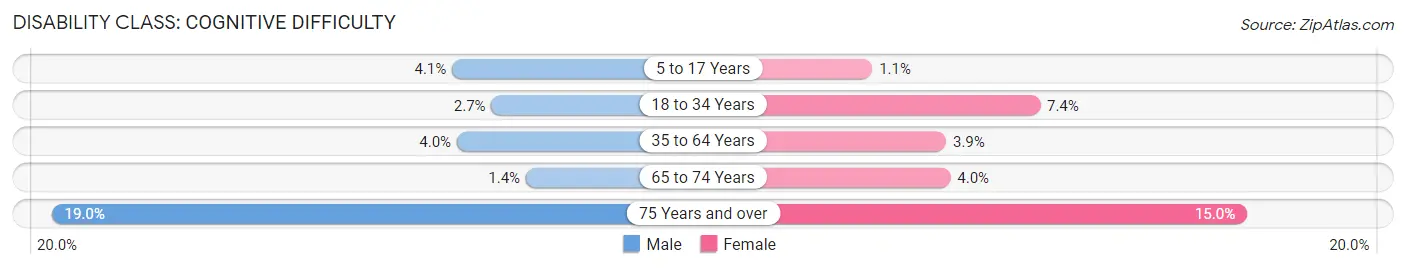
| Age Bracket | Male | Female |
| 5 to 17 Years | 22 (4.1%) | 6 (1.1%) |
| 18 to 34 Years | 14 (2.7%) | 36 (7.4%) |
| 35 to 64 Years | 49 (4.0%) | 45 (3.9%) |
| 65 to 74 Years | 5 (1.4%) | 16 (4.0%) |
| 75 Years and over | 42 (19.0%) | 51 (15.0%) |
Disability Class: Ambulatory Difficulty
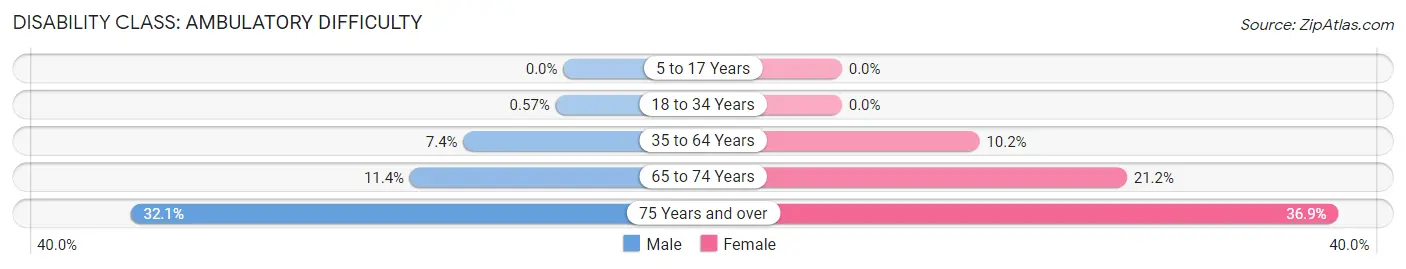
| Age Bracket | Male | Female |
| 5 to 17 Years | 0 (0.0%) | 0 (0.0%) |
| 18 to 34 Years | 3 (0.6%) | 0 (0.0%) |
| 35 to 64 Years | 92 (7.4%) | 119 (10.2%) |
| 65 to 74 Years | 41 (11.4%) | 84 (21.2%) |
| 75 Years and over | 71 (32.1%) | 125 (36.9%) |
Disability Class: Self-Care Difficulty
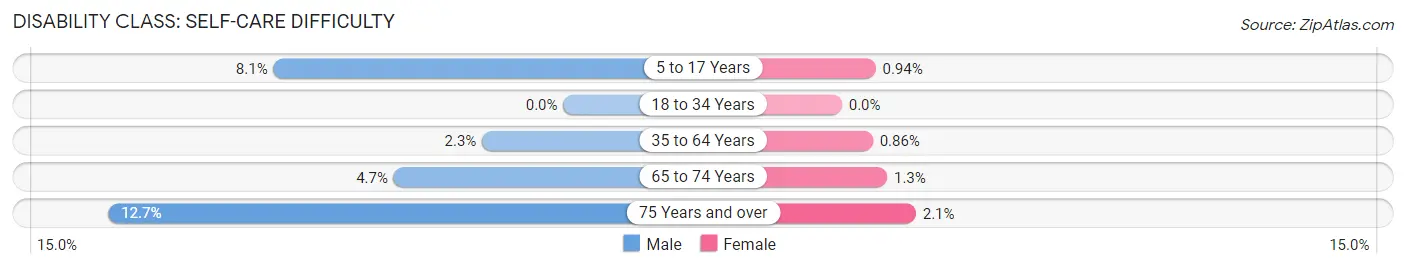
| Age Bracket | Male | Female |
| 5 to 17 Years | 43 (8.1%) | 5 (0.9%) |
| 18 to 34 Years | 0 (0.0%) | 0 (0.0%) |
| 35 to 64 Years | 28 (2.3%) | 10 (0.9%) |
| 65 to 74 Years | 17 (4.7%) | 5 (1.3%) |
| 75 Years and over | 28 (12.7%) | 7 (2.1%) |
Technology Access in Edwards County
Computing Device Access in Edwards County
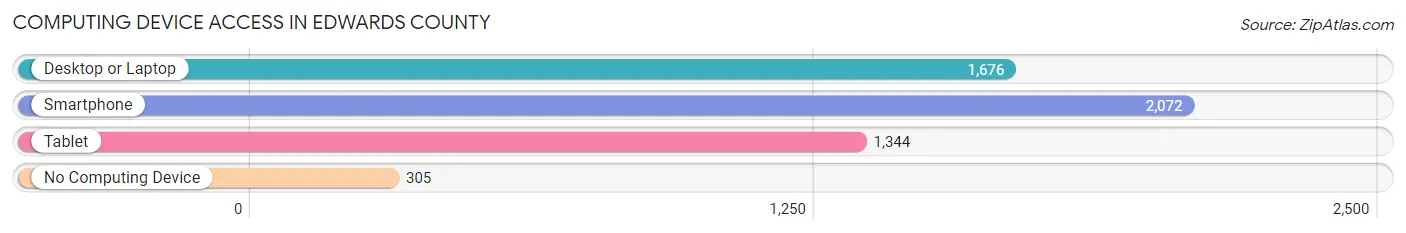
| Device Type | # Households | % Households |
| Desktop or Laptop | 1,676 | 63.8% |
| Smartphone | 2,072 | 78.9% |
| Tablet | 1,344 | 51.2% |
| No Computing Device | 305 | 11.6% |
| Total | 2,625 | 100.0% |
Internet Access in Edwards County
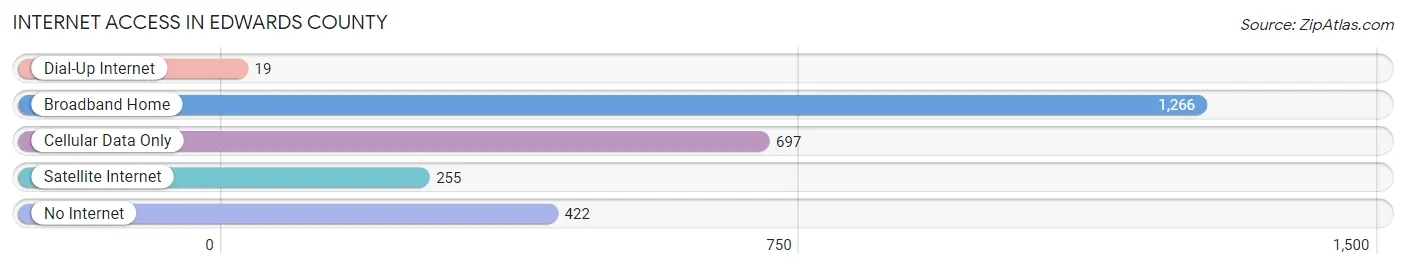
| Internet Type | # Households | % Households |
| Dial-Up Internet | 19 | 0.7% |
| Broadband Home | 1,266 | 48.2% |
| Cellular Data Only | 697 | 26.6% |
| Satellite Internet | 255 | 9.7% |
| No Internet | 422 | 16.1% |
| Total | 2,625 | 100.0% |
Edwards County Summary
Edwards County is located in the southeastern corner of Illinois, and is part of the Shawnee National Forest. It is bordered by Wabash County to the north, White County to the east, Saline County to the south, and Richland County to the west. The county seat is Albion, and the county has a total area of 441 square miles. As of the 2010 census, the population was 6,721.
Geography
Edwards County is located in the southeastern corner of Illinois, and is part of the Shawnee National Forest. It is bordered by Wabash County to the north, White County to the east, Saline County to the south, and Richland County to the west. The county seat is Albion, and the county has a total area of 441 square miles. The terrain is mostly rolling hills, with some flat areas in the north and south. The highest point in the county is located in the northwest corner, at an elevation of 890 feet. The county is drained by the Little Wabash River, which flows through the center of the county.
History
Edwards County was formed in 1814 from parts of White and Gallatin counties. It was named for Ninian Edwards, the Governor of Illinois Territory from 1809 to 1818. The county was initially settled by farmers, and the first county seat was located in Brownsville. In 1821, the county seat was moved to Albion, which remains the county seat today.
The county was largely agricultural throughout the 19th century, with corn, wheat, and oats being the main crops. In the early 20th century, the county began to diversify its economy, with the development of coal mining, oil production, and manufacturing. The county also became a popular tourist destination, with the opening of the Shawnee National Forest in the 1930s.
Economy
The economy of Edwards County is largely based on agriculture, with corn, soybeans, and wheat being the main crops. The county also has a strong manufacturing sector, with companies such as Caterpillar, John Deere, and International Harvester having plants in the county. The county also has a growing tourism industry, with the Shawnee National Forest and the nearby Rend Lake providing recreational opportunities.
Demographics
As of the 2010 census, the population of Edwards County was 6,721. The population is largely white (96.2%), with small percentages of African American (1.7%), Native American (0.3%), Asian (0.2%), and other races (1.6%). The median household income is $41,945, and the median family income is $50,945. The per capita income is $20,945. The unemployment rate is 6.2%.
Conclusion
Edwards County is located in the southeastern corner of Illinois, and is part of the Shawnee National Forest. It is bordered by Wabash County to the north, White County to the east, Saline County to the south, and Richland County to the west. The county was formed in 1814, and the county seat is Albion. The economy of Edwards County is largely based on agriculture, with corn, soybeans, and wheat being the main crops. The county also has a strong manufacturing sector, with companies such as Caterpillar, John Deere, and International Harvester having plants in the county. The population of Edwards County is 6,721, and the median household income is $41,945.
Common Questions
What is Per Capita Income in Edwards County?
Per Capita income in Edwards County is $31,081.
What is the Median Family Income in Edwards County?
Median Family Income in Edwards County is $74,297.
What is the Median Household income in Edwards County?
Median Household Income in Edwards County is $60,784.
What is Income or Wage Gap in Edwards County?
Income or Wage Gap in Edwards County is 44.8%.
Women in Edwards County earn 55.2 cents for every dollar earned by a man.
What is Family Income Deficit in Edwards County?
Family Income Deficit in Edwards County is $10,123.
Families that are below poverty line in Edwards County earn $10,123 less on average than the poverty threshold level.
What is Inequality or Gini Index in Edwards County?
Inequality or Gini Index in Edwards County is 0.41.
What is the Total Population of Edwards County?
Total Population of Edwards County is 6,182.
What is the Total Male Population of Edwards County?
Total Male Population of Edwards County is 3,064.
What is the Total Female Population of Edwards County?
Total Female Population of Edwards County is 3,118.
What is the Ratio of Males per 100 Females in Edwards County?
There are 98.27 Males per 100 Females in Edwards County.
What is the Ratio of Females per 100 Males in Edwards County?
There are 101.76 Females per 100 Males in Edwards County.
What is the Median Population Age in Edwards County?
Median Population Age in Edwards County is 44.2 Years.
What is the Average Family Size in Edwards County
Average Family Size in Edwards County is 2.9 People.
What is the Average Household Size in Edwards County
Average Household Size in Edwards County is 2.3 People.
How Large is the Labor Force in Edwards County?
There are 2,889 People in the Labor Forcein in Edwards County.
What is the Percentage of People in the Labor Force in Edwards County?
58.1% of People are in the Labor Force in Edwards County.
What is the Unemployment Rate in Edwards County?
Unemployment Rate in Edwards County is 6.7%.