Clinton County, IL Map & Demographics
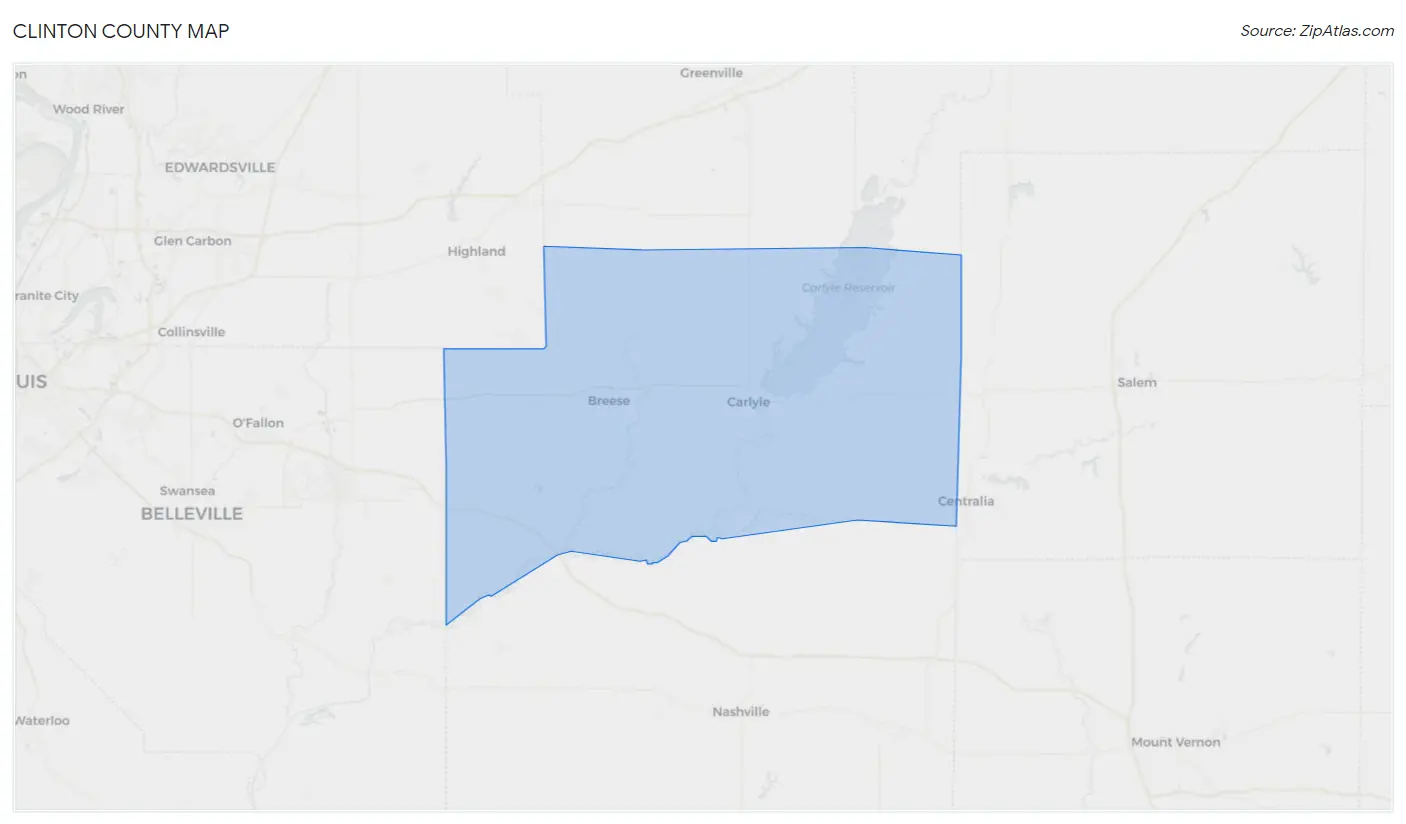
Clinton County Map
Clinton County Overview
$39,409
PER CAPITA INCOME
$96,875
AVG FAMILY INCOME
$78,054
AVG HOUSEHOLD INCOME
29.7%
WAGE / INCOME GAP [ % ]
70.3¢/ $1
WAGE / INCOME GAP [ $ ]
$12,355
FAMILY INCOME DEFICIT
0.43
INEQUALITY / GINI INDEX
36,998
TOTAL POPULATION
19,318
MALE POPULATION
17,680
FEMALE POPULATION
109.26
MALES / 100 FEMALES
91.52
FEMALES / 100 MALES
41.0
MEDIAN AGE
3.0
AVG FAMILY SIZE
2.4
AVG HOUSEHOLD SIZE
18,965
LABOR FORCE [ PEOPLE ]
62.9%
PERCENT IN LABOR FORCE
3.0%
UNEMPLOYMENT RATE
Clinton County Area Codes
Income in Clinton County
Income Overview in Clinton County
Per Capita Income in Clinton County is $39,409, while median incomes of families and households are $96,875 and $78,054 respectively.
| Characteristic | Number | Measure |
| Per Capita Income | 36,998 | $39,409 |
| Median Family Income | 9,732 | $96,875 |
| Mean Family Income | 9,732 | $116,096 |
| Median Household Income | 14,493 | $78,054 |
| Mean Household Income | 14,493 | $99,933 |
| Income Deficit | 9,732 | $12,355 |
| Wage / Income Gap (%) | 36,998 | 29.66% |
| Wage / Income Gap ($) | 36,998 | 70.34¢ per $1 |
| Gini / Inequality Index | 36,998 | 0.43 |
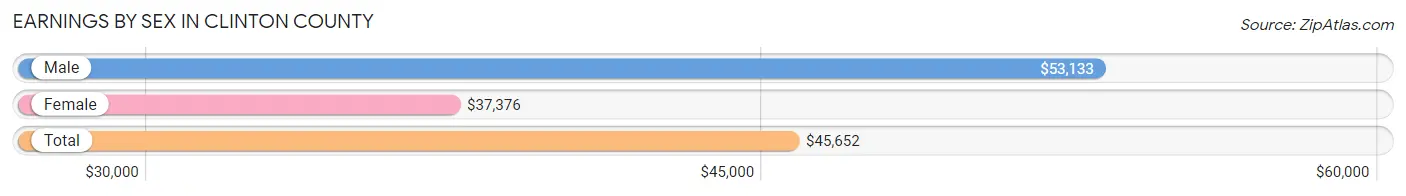
Earnings by Sex in Clinton County
Average Earnings in Clinton County are $45,652, $53,133 for men and $37,376 for women, a difference of 29.7%.
| Sex | Number | Average Earnings |
| Male | 10,659 (53.8%) | $53,133 |
| Female | 9,162 (46.2%) | $37,376 |
| Total | 19,821 (100.0%) | $45,652 |
Earnings by Sex by Income Bracket in Clinton County
The most common earnings brackets in Clinton County are $75,000 to $99,999 for men (1,900 | 17.8%) and $55,000 to $64,999 for women (808 | 8.8%).
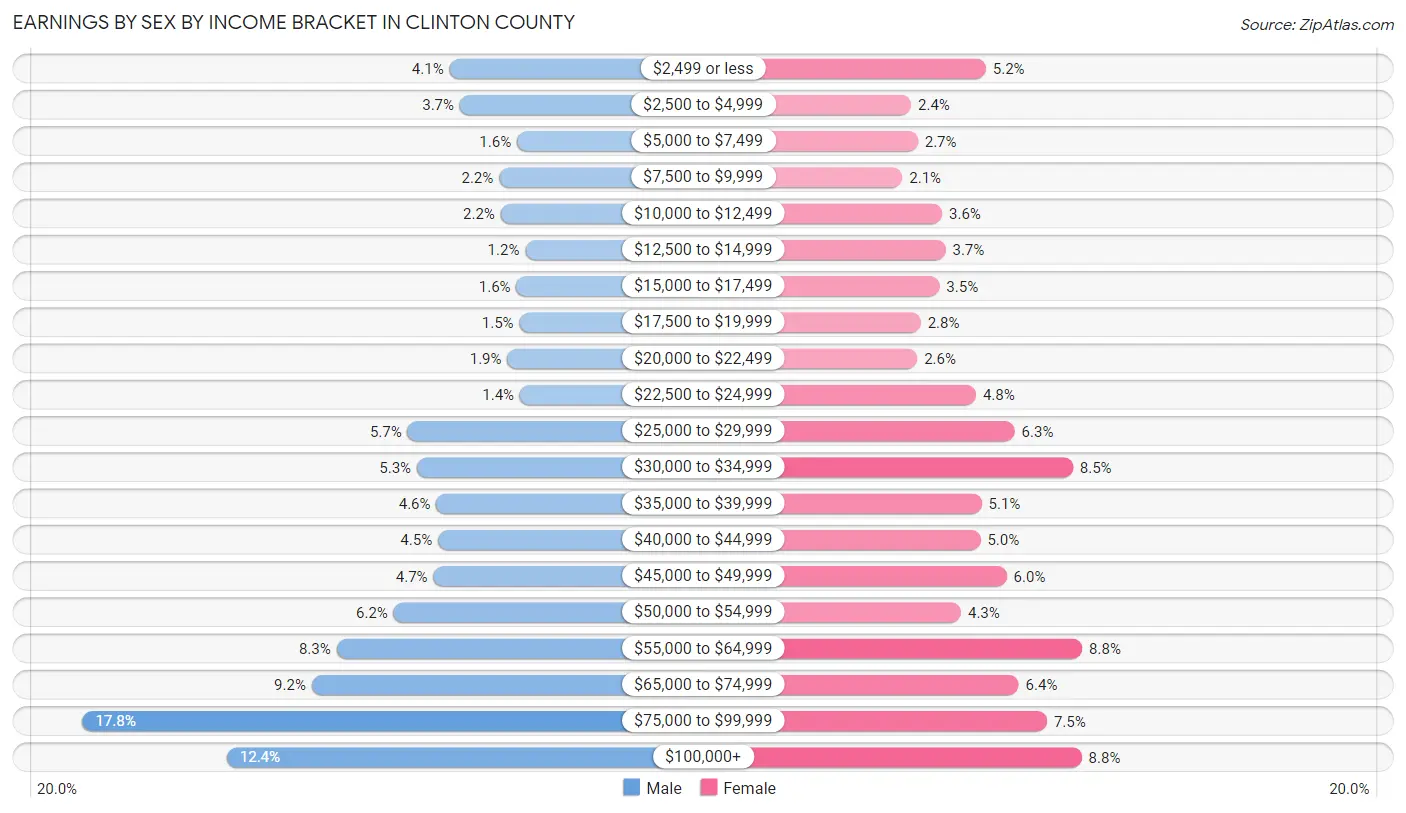
| Income | Male | Female |
| $2,499 or less | 435 (4.1%) | 477 (5.2%) |
| $2,500 to $4,999 | 393 (3.7%) | 221 (2.4%) |
| $5,000 to $7,499 | 165 (1.5%) | 244 (2.7%) |
| $7,500 to $9,999 | 237 (2.2%) | 191 (2.1%) |
| $10,000 to $12,499 | 230 (2.2%) | 327 (3.6%) |
| $12,500 to $14,999 | 132 (1.2%) | 339 (3.7%) |
| $15,000 to $17,499 | 167 (1.6%) | 318 (3.5%) |
| $17,500 to $19,999 | 156 (1.5%) | 254 (2.8%) |
| $20,000 to $22,499 | 204 (1.9%) | 242 (2.6%) |
| $22,500 to $24,999 | 153 (1.4%) | 443 (4.8%) |
| $25,000 to $29,999 | 602 (5.7%) | 576 (6.3%) |
| $30,000 to $34,999 | 565 (5.3%) | 776 (8.5%) |
| $35,000 to $39,999 | 487 (4.6%) | 463 (5.1%) |
| $40,000 to $44,999 | 481 (4.5%) | 459 (5.0%) |
| $45,000 to $49,999 | 499 (4.7%) | 549 (6.0%) |
| $50,000 to $54,999 | 658 (6.2%) | 392 (4.3%) |
| $55,000 to $64,999 | 886 (8.3%) | 808 (8.8%) |
| $65,000 to $74,999 | 985 (9.2%) | 590 (6.4%) |
| $75,000 to $99,999 | 1,900 (17.8%) | 687 (7.5%) |
| $100,000+ | 1,324 (12.4%) | 806 (8.8%) |
| Total | 10,659 (100.0%) | 9,162 (100.0%) |
Earnings by Sex by Educational Attainment in Clinton County
Average earnings in Clinton County are $59,454 for men and $42,125 for women, a difference of 29.1%. Men with an educational attainment of graduate degree enjoy the highest average annual earnings of $97,786, while those with less than high school education earn the least with $28,636. Women with an educational attainment of graduate degree earn the most with the average annual earnings of $73,819, while those with less than high school education have the smallest earnings of $19,702.
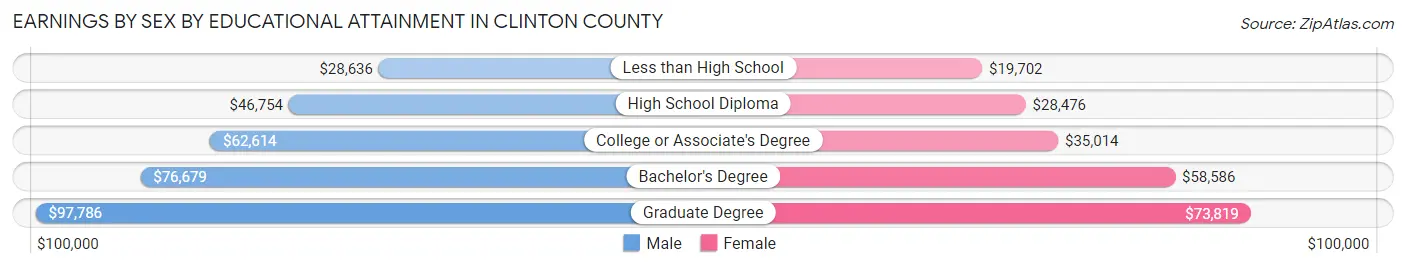
| Educational Attainment | Male Income | Female Income |
| Less than High School | $28,636 | $19,702 |
| High School Diploma | $46,754 | $28,476 |
| College or Associate's Degree | $62,614 | $35,014 |
| Bachelor's Degree | $76,679 | $58,586 |
| Graduate Degree | $97,786 | $73,819 |
| Total | $59,454 | $42,125 |
Family Income in Clinton County
Family Income Brackets in Clinton County
According to the Clinton County family income data, there are 2,433 families falling into the $100,000 to $149,999 income range, which is the most common income bracket and makes up 25.0% of all families. Conversely, the less than $10,000 income bracket is the least frequent group with only 156 families (1.6%) belonging to this category.
| Income Bracket | # Families | % Families |
| Less than $10,000 | 156 | 1.6% |
| $10,000 to $14,999 | 224 | 2.3% |
| $15,000 to $24,999 | 195 | 2.0% |
| $25,000 to $34,999 | 380 | 3.9% |
| $35,000 to $49,999 | 779 | 8.0% |
| $50,000 to $74,999 | 1,674 | 17.2% |
| $75,000 to $99,999 | 1,703 | 17.5% |
| $100,000 to $149,999 | 2,433 | 25.0% |
| $150,000 to $199,999 | 1,216 | 12.5% |
| $200,000+ | 973 | 10.0% |
Family Income by Famaliy Size in Clinton County
4-person families (1,779 | 18.3%) account for the highest median family income in Clinton County with $118,750 per family, while 2-person families (5,092 | 52.3%) have the highest median income of $43,206 per family member.
| Income Bracket | # Families | Median Income |
| 2-Person Families | 5,092 (52.3%) | $86,412 |
| 3-Person Families | 1,660 (17.1%) | $114,205 |
| 4-Person Families | 1,779 (18.3%) | $118,750 |
| 5-Person Families | 895 (9.2%) | $104,375 |
| 6-Person Families | 232 (2.4%) | $80,000 |
| 7+ Person Families | 74 (0.8%) | $115,208 |
| Total | 9,732 (100.0%) | $96,875 |
Family Income by Number of Earners in Clinton County
The median family income in Clinton County is $96,875, with families comprising 3+ earners (1,143) having the highest median family income of $142,023, while families with no earners (1,194) have the lowest median family income of $55,645, accounting for 11.7% and 12.3% of families, respectively.
| Number of Earners | # Families | Median Income |
| No Earners | 1,194 (12.3%) | $55,645 |
| 1 Earner | 2,863 (29.4%) | $64,713 |
| 2 Earners | 4,532 (46.6%) | $117,691 |
| 3+ Earners | 1,143 (11.7%) | $142,023 |
| Total | 9,732 (100.0%) | $96,875 |
Household Income in Clinton County
Household Income Brackets in Clinton County
With 3,000 households falling in the category, the $100,000 to $149,999 income range is the most frequent in Clinton County, accounting for 20.7% of all households. In contrast, only 449 households (3.1%) fall into the $10,000 to $14,999 income bracket, making it the least populous group.
| Income Bracket | # Households | % Households |
| Less than $10,000 | 478 | 3.3% |
| $10,000 to $14,999 | 449 | 3.1% |
| $15,000 to $24,999 | 725 | 5.0% |
| $25,000 to $34,999 | 1,217 | 8.4% |
| $35,000 to $49,999 | 1,464 | 10.1% |
| $50,000 to $74,999 | 2,536 | 17.5% |
| $75,000 to $99,999 | 2,232 | 15.4% |
| $100,000 to $149,999 | 3,000 | 20.7% |
| $150,000 to $199,999 | 1,304 | 9.0% |
| $200,000+ | 1,087 | 7.5% |
Household Income by Householder Age in Clinton County
The median household income in Clinton County is $78,054, with the highest median household income of $95,169 found in the 25 to 44 years age bracket for the primary householder. A total of 4,341 households (29.9%) fall into this category. Meanwhile, the 15 to 24 years age bracket for the primary householder has the lowest median household income of $48,988, with 413 households (2.9%) in this group.
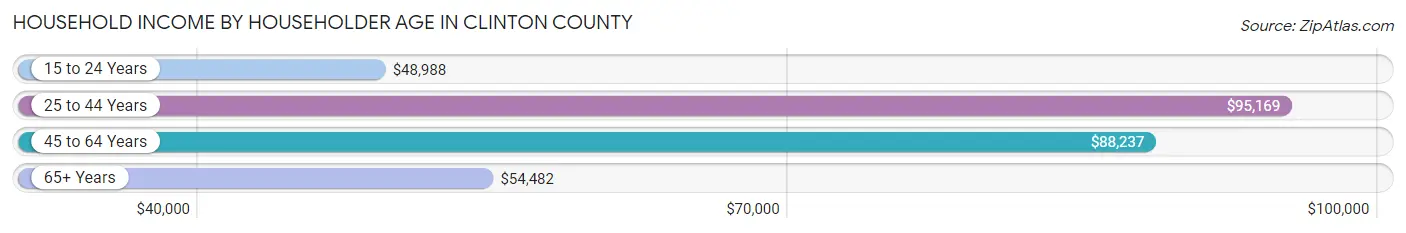
| Income Bracket | # Households | Median Income |
| 15 to 24 Years | 413 (2.9%) | $48,988 |
| 25 to 44 Years | 4,341 (29.9%) | $95,169 |
| 45 to 64 Years | 5,448 (37.6%) | $88,237 |
| 65+ Years | 4,291 (29.6%) | $54,482 |
| Total | 14,493 (100.0%) | $78,054 |
Poverty in Clinton County
Income Below Poverty by Sex and Age in Clinton County
With 7.7% poverty level for males and 6.8% for females among the residents of Clinton County, 15 year old males and 15 year old females are the most vulnerable to poverty, with 44 males (20.9%) and 24 females (17.3%) in their respective age groups living below the poverty level.
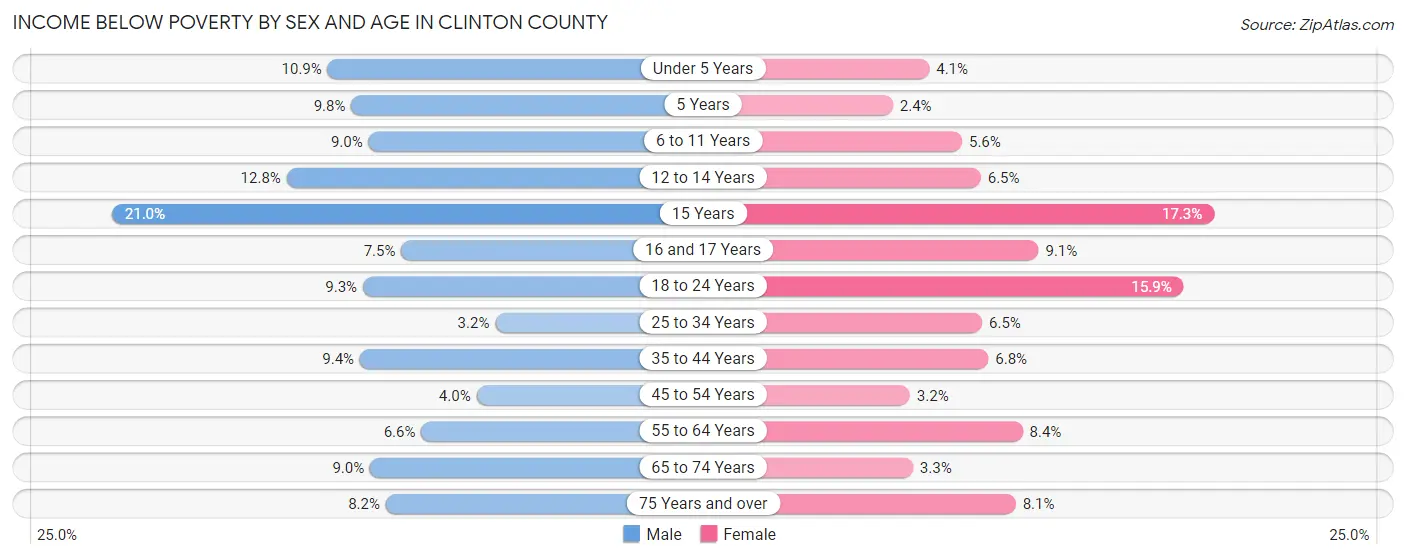
| Age Bracket | Male | Female |
| Under 5 Years | 122 (10.9%) | 36 (4.1%) |
| 5 Years | 25 (9.8%) | 7 (2.4%) |
| 6 to 11 Years | 117 (9.0%) | 74 (5.6%) |
| 12 to 14 Years | 80 (12.8%) | 34 (6.5%) |
| 15 Years | 44 (20.9%) | 24 (17.3%) |
| 16 and 17 Years | 40 (7.5%) | 47 (9.1%) |
| 18 to 24 Years | 133 (9.3%) | 193 (15.9%) |
| 25 to 34 Years | 71 (3.2%) | 137 (6.5%) |
| 35 to 44 Years | 208 (9.4%) | 147 (6.8%) |
| 45 to 54 Years | 91 (4.0%) | 68 (3.2%) |
| 55 to 64 Years | 174 (6.6%) | 227 (8.4%) |
| 65 to 74 Years | 161 (9.0%) | 62 (3.3%) |
| 75 Years and over | 91 (8.2%) | 118 (8.1%) |
| Total | 1,357 (7.7%) | 1,174 (6.8%) |
Income Above Poverty by Sex and Age in Clinton County
According to the poverty statistics in Clinton County, males aged 25 to 34 years and females aged 5 years are the age groups that are most secure financially, with 96.8% of males and 97.6% of females in these age groups living above the poverty line.
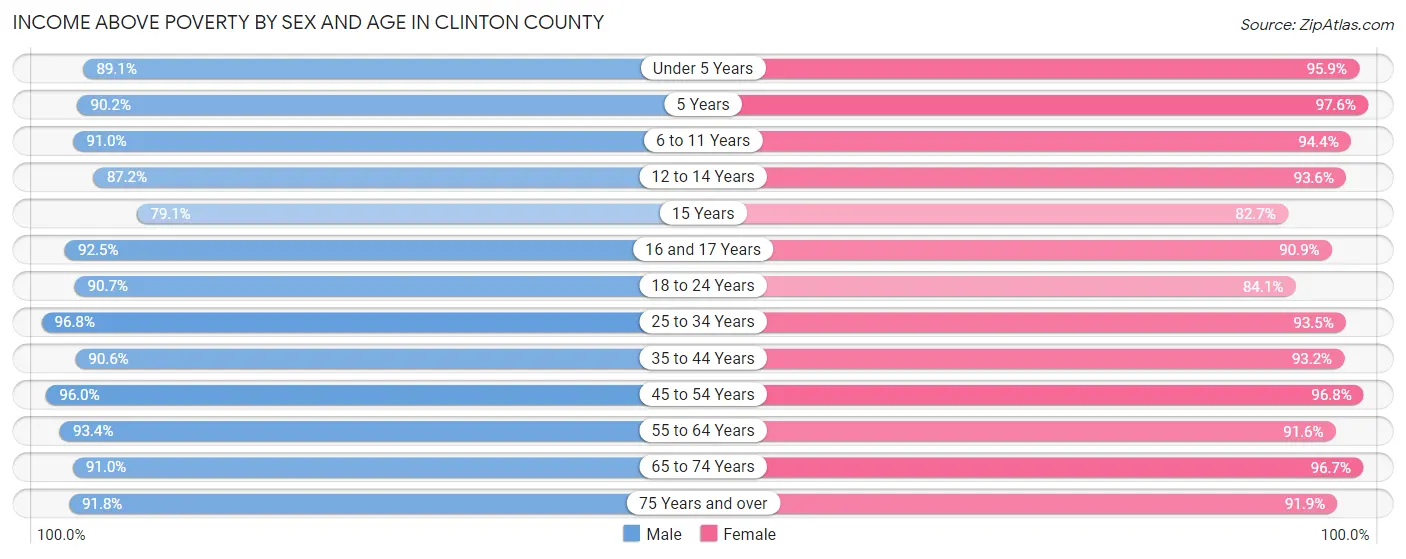
| Age Bracket | Male | Female |
| Under 5 Years | 993 (89.1%) | 850 (95.9%) |
| 5 Years | 229 (90.2%) | 288 (97.6%) |
| 6 to 11 Years | 1,177 (91.0%) | 1,253 (94.4%) |
| 12 to 14 Years | 543 (87.2%) | 493 (93.5%) |
| 15 Years | 166 (79.0%) | 115 (82.7%) |
| 16 and 17 Years | 492 (92.5%) | 468 (90.9%) |
| 18 to 24 Years | 1,297 (90.7%) | 1,024 (84.1%) |
| 25 to 34 Years | 2,177 (96.8%) | 1,966 (93.5%) |
| 35 to 44 Years | 1,996 (90.6%) | 2,015 (93.2%) |
| 45 to 54 Years | 2,165 (96.0%) | 2,086 (96.8%) |
| 55 to 64 Years | 2,468 (93.4%) | 2,480 (91.6%) |
| 65 to 74 Years | 1,634 (91.0%) | 1,817 (96.7%) |
| 75 Years and over | 1,014 (91.8%) | 1,344 (91.9%) |
| Total | 16,351 (92.3%) | 16,199 (93.2%) |
Income Below Poverty Among Married-Couple Families in Clinton County
The poverty statistics for married-couple families in Clinton County show that 3.0% or 240 of the total 7,911 families live below the poverty line. Families with 5 or more children have the highest poverty rate of 24.1%, comprising of 7 families. On the other hand, families with no children have the lowest poverty rate of 2.2%, which includes 108 families.
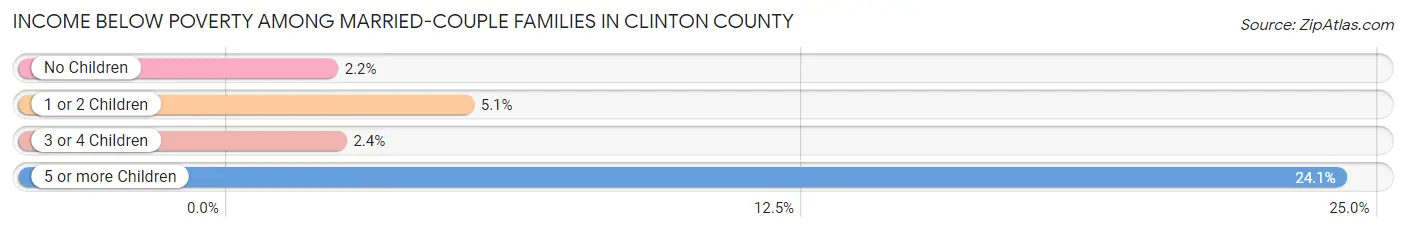
| Children | Above Poverty | Below Poverty |
| No Children | 4,880 (97.8%) | 108 (2.2%) |
| 1 or 2 Children | 1,940 (94.9%) | 105 (5.1%) |
| 3 or 4 Children | 829 (97.6%) | 20 (2.4%) |
| 5 or more Children | 22 (75.9%) | 7 (24.1%) |
| Total | 7,671 (97.0%) | 240 (3.0%) |
Income Below Poverty Among Single-Parent Households in Clinton County
According to the poverty data in Clinton County, 7.3% or 48 single-father households and 18.9% or 220 single-mother households are living below the poverty line. Among single-father households, those with 3 or 4 children have the highest poverty rate, with 24 households (30.0%) experiencing poverty. Likewise, among single-mother households, those with 5 or more children have the highest poverty rate, with 4 households (36.4%) falling below the poverty line.
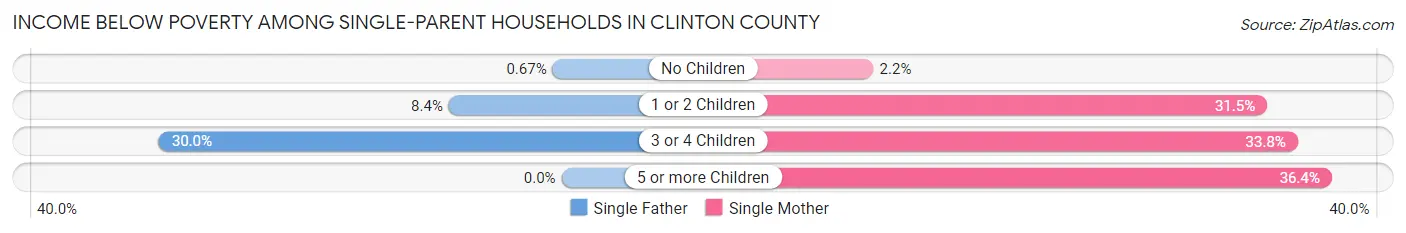
| Children | Single Father | Single Mother |
| No Children | 2 (0.7%) | 11 (2.2%) |
| 1 or 2 Children | 22 (8.4%) | 182 (31.5%) |
| 3 or 4 Children | 24 (30.0%) | 23 (33.8%) |
| 5 or more Children | 0 (0.0%) | 4 (36.4%) |
| Total | 48 (7.3%) | 220 (18.9%) |
Income Below Poverty Among Married-Couple vs Single-Parent Households in Clinton County
The poverty data for Clinton County shows that 240 of the married-couple family households (3.0%) and 268 of the single-parent households (14.7%) are living below the poverty level. Within the married-couple family households, those with 5 or more children have the highest poverty rate, with 7 households (24.1%) falling below the poverty line. Among the single-parent households, those with 3 or 4 children have the highest poverty rate, with 47 household (31.8%) living below poverty.
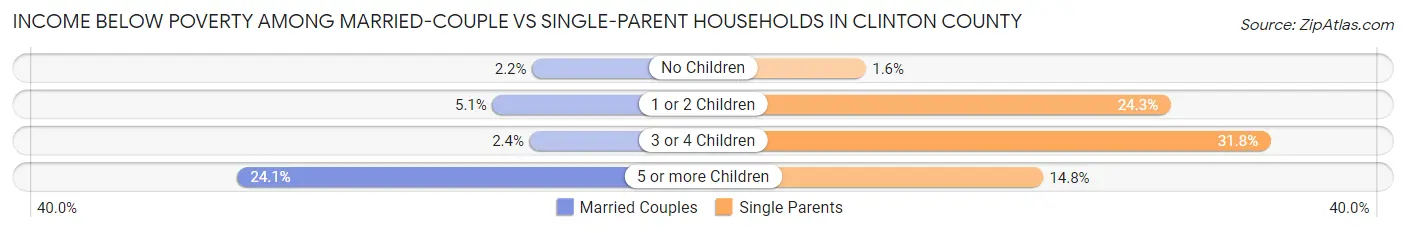
| Children | Married-Couple Families | Single-Parent Households |
| No Children | 108 (2.2%) | 13 (1.6%) |
| 1 or 2 Children | 105 (5.1%) | 204 (24.3%) |
| 3 or 4 Children | 20 (2.4%) | 47 (31.8%) |
| 5 or more Children | 7 (24.1%) | 4 (14.8%) |
| Total | 240 (3.0%) | 268 (14.7%) |
Race in Clinton County
The most populous races in Clinton County are White / Caucasian (34,000 | 91.9%), Two or more Races (1,348 | 3.6%), and Hispanic or Latino (1,220 | 3.3%).
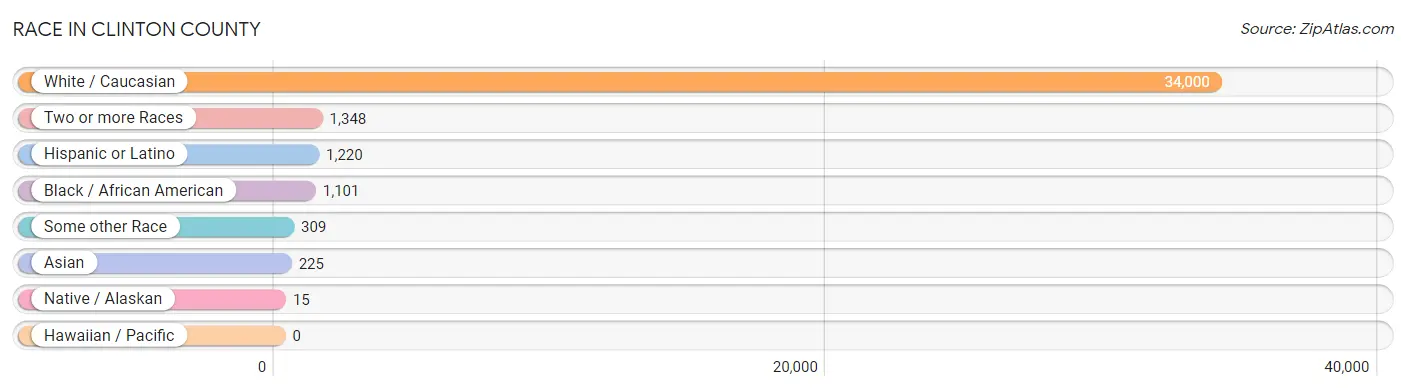
| Race | # Population | % Population |
| Asian | 225 | 0.6% |
| Black / African American | 1,101 | 3.0% |
| Hawaiian / Pacific | 0 | 0.0% |
| Hispanic or Latino | 1,220 | 3.3% |
| Native / Alaskan | 15 | 0.0% |
| White / Caucasian | 34,000 | 91.9% |
| Two or more Races | 1,348 | 3.6% |
| Some other Race | 309 | 0.8% |
| Total | 36,998 | 100.0% |
Ancestry in Clinton County
The most populous ancestries reported in Clinton County are German (16,853 | 45.6%), Irish (2,766 | 7.5%), American (2,532 | 6.8%), English (1,879 | 5.1%), and French (1,166 | 3.2%), together accounting for 68.1% of all Clinton County residents.
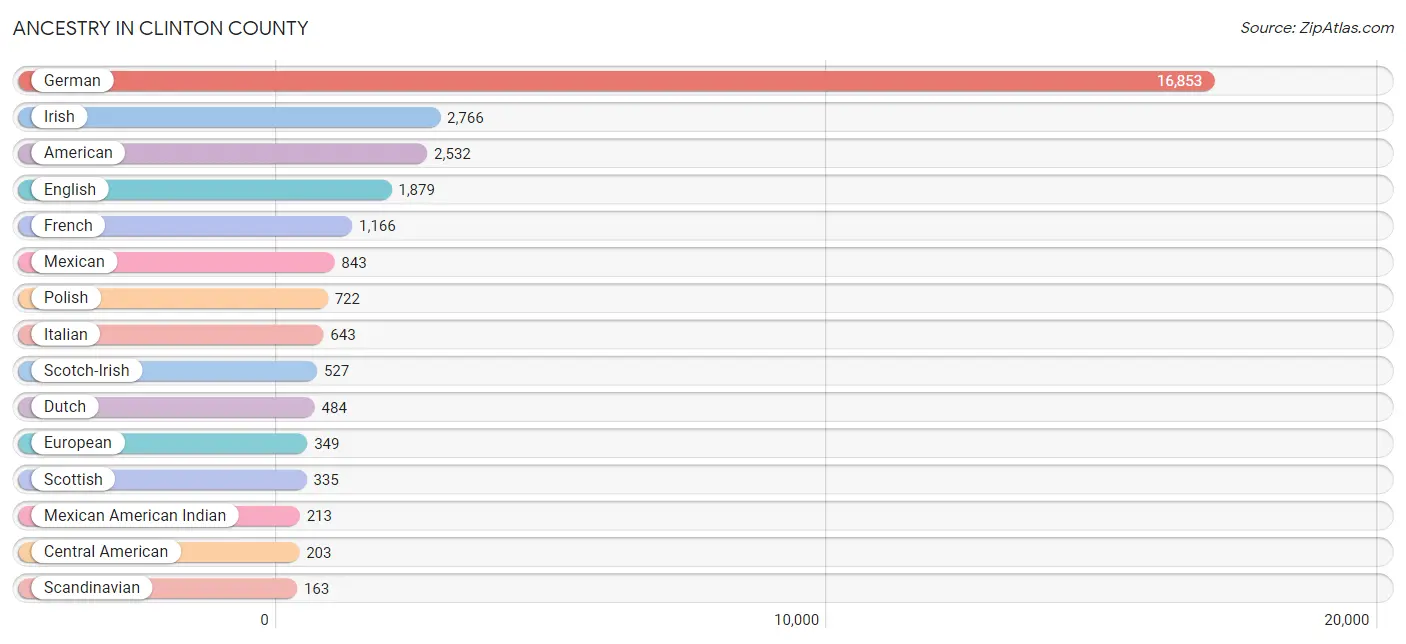
| Ancestry | # Population | % Population |
| African | 2 | 0.0% |
| Alaska Native | 13 | 0.0% |
| American | 2,532 | 6.8% |
| Arab | 1 | 0.0% |
| Australian | 10 | 0.0% |
| Austrian | 36 | 0.1% |
| Belgian | 22 | 0.1% |
| Bhutanese | 40 | 0.1% |
| Blackfeet | 7 | 0.0% |
| British | 89 | 0.2% |
| Bulgarian | 16 | 0.0% |
| Burmese | 45 | 0.1% |
| Cajun | 10 | 0.0% |
| Canadian | 16 | 0.0% |
| Central American | 203 | 0.5% |
| Central American Indian | 3 | 0.0% |
| Cherokee | 105 | 0.3% |
| Cheyenne | 7 | 0.0% |
| Choctaw | 1 | 0.0% |
| Creek | 3 | 0.0% |
| Croatian | 27 | 0.1% |
| Cuban | 16 | 0.0% |
| Czech | 36 | 0.1% |
| Czechoslovakian | 16 | 0.0% |
| Danish | 25 | 0.1% |
| Dominican | 42 | 0.1% |
| Dutch | 484 | 1.3% |
| Eastern European | 22 | 0.1% |
| English | 1,879 | 5.1% |
| European | 349 | 0.9% |
| Finnish | 2 | 0.0% |
| French | 1,166 | 3.2% |
| French Canadian | 66 | 0.2% |
| German | 16,853 | 45.6% |
| Greek | 56 | 0.2% |
| Guamanian / Chamorro | 2 | 0.0% |
| Guatemalan | 76 | 0.2% |
| Honduran | 119 | 0.3% |
| Hungarian | 125 | 0.3% |
| Indian (Asian) | 52 | 0.1% |
| Iranian | 8 | 0.0% |
| Irish | 2,766 | 7.5% |
| Italian | 643 | 1.7% |
| Jamaican | 5 | 0.0% |
| Korean | 82 | 0.2% |
| Lebanese | 1 | 0.0% |
| Lithuanian | 16 | 0.0% |
| Mexican | 843 | 2.3% |
| Mexican American Indian | 213 | 0.6% |
| Navajo | 1 | 0.0% |
| Northern European | 13 | 0.0% |
| Norwegian | 83 | 0.2% |
| Pakistani | 38 | 0.1% |
| Panamanian | 8 | 0.0% |
| Polish | 722 | 1.9% |
| Portuguese | 2 | 0.0% |
| Puerto Rican | 38 | 0.1% |
| Puget Sound Salish | 1 | 0.0% |
| Russian | 51 | 0.1% |
| Samoan | 12 | 0.0% |
| Scandinavian | 163 | 0.4% |
| Scotch-Irish | 527 | 1.4% |
| Scottish | 335 | 0.9% |
| Slavic | 3 | 0.0% |
| Slovak | 5 | 0.0% |
| Spaniard | 18 | 0.1% |
| Spanish | 51 | 0.1% |
| Sri Lankan | 16 | 0.0% |
| Subsaharan African | 2 | 0.0% |
| Swedish | 107 | 0.3% |
| Swiss | 64 | 0.2% |
| Turkish | 1 | 0.0% |
| Ukrainian | 30 | 0.1% |
| Welsh | 53 | 0.1% |
| Yugoslavian | 5 | 0.0% | View All 75 Rows |
Immigrants in Clinton County
The most numerous immigrant groups reported in Clinton County came from Latin America (521 | 1.4%), Central America (474 | 1.3%), Mexico (287 | 0.8%), Asia (144 | 0.4%), and Europe (137 | 0.4%), together accounting for 4.2% of all Clinton County residents.
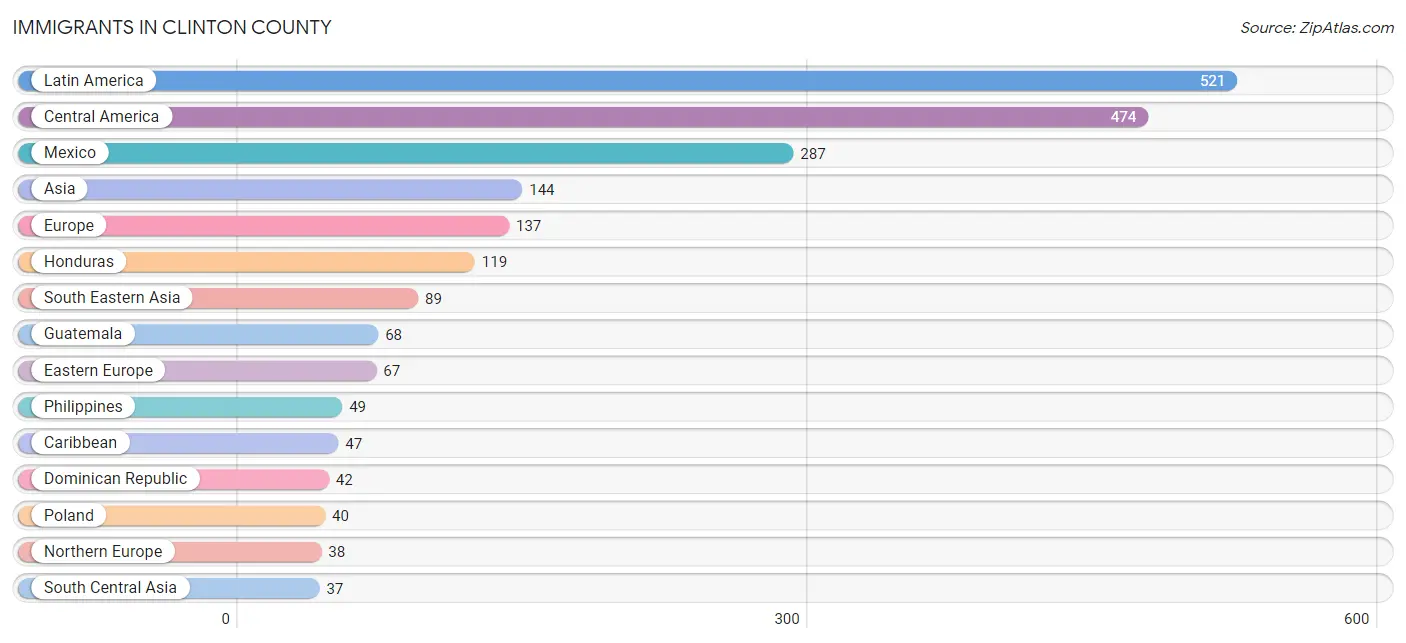
| Immigration Origin | # Population | % Population |
| Africa | 1 | 0.0% |
| Asia | 144 | 0.4% |
| Bulgaria | 16 | 0.0% |
| Canada | 28 | 0.1% |
| Caribbean | 47 | 0.1% |
| Central America | 474 | 1.3% |
| China | 2 | 0.0% |
| Dominican Republic | 42 | 0.1% |
| Eastern Asia | 18 | 0.1% |
| Eastern Europe | 67 | 0.2% |
| England | 20 | 0.1% |
| Europe | 137 | 0.4% |
| Germany | 32 | 0.1% |
| Guatemala | 68 | 0.2% |
| Honduras | 119 | 0.3% |
| Iran | 3 | 0.0% |
| Jamaica | 5 | 0.0% |
| Japan | 7 | 0.0% |
| Korea | 9 | 0.0% |
| Latin America | 521 | 1.4% |
| Mexico | 287 | 0.8% |
| Nigeria | 1 | 0.0% |
| Northern Europe | 38 | 0.1% |
| Pakistan | 34 | 0.1% |
| Philippines | 49 | 0.1% |
| Poland | 40 | 0.1% |
| South Central Asia | 37 | 0.1% |
| South Eastern Asia | 89 | 0.2% |
| Thailand | 27 | 0.1% |
| Ukraine | 6 | 0.0% |
| Vietnam | 13 | 0.0% |
| Western Africa | 1 | 0.0% |
| Western Europe | 32 | 0.1% | View All 33 Rows |
Sex and Age in Clinton County
Sex and Age in Clinton County
The most populous age groups in Clinton County are 35 to 39 Years (1,590 | 8.2%) for men and 55 to 59 Years (1,384 | 7.8%) for women.
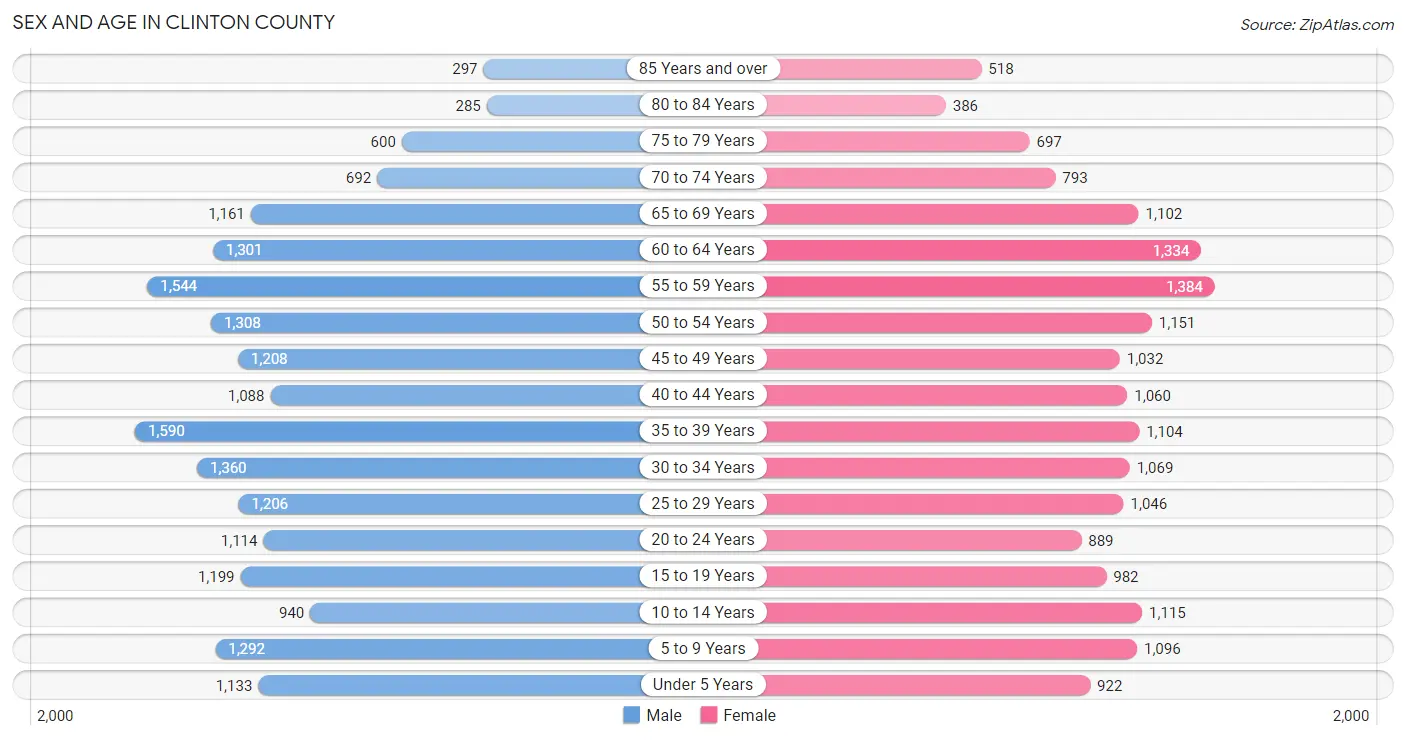
| Age Bracket | Male | Female |
| Under 5 Years | 1,133 (5.9%) | 922 (5.2%) |
| 5 to 9 Years | 1,292 (6.7%) | 1,096 (6.2%) |
| 10 to 14 Years | 940 (4.9%) | 1,115 (6.3%) |
| 15 to 19 Years | 1,199 (6.2%) | 982 (5.6%) |
| 20 to 24 Years | 1,114 (5.8%) | 889 (5.0%) |
| 25 to 29 Years | 1,206 (6.2%) | 1,046 (5.9%) |
| 30 to 34 Years | 1,360 (7.0%) | 1,069 (6.0%) |
| 35 to 39 Years | 1,590 (8.2%) | 1,104 (6.2%) |
| 40 to 44 Years | 1,088 (5.6%) | 1,060 (6.0%) |
| 45 to 49 Years | 1,208 (6.2%) | 1,032 (5.8%) |
| 50 to 54 Years | 1,308 (6.8%) | 1,151 (6.5%) |
| 55 to 59 Years | 1,544 (8.0%) | 1,384 (7.8%) |
| 60 to 64 Years | 1,301 (6.7%) | 1,334 (7.5%) |
| 65 to 69 Years | 1,161 (6.0%) | 1,102 (6.2%) |
| 70 to 74 Years | 692 (3.6%) | 793 (4.5%) |
| 75 to 79 Years | 600 (3.1%) | 697 (3.9%) |
| 80 to 84 Years | 285 (1.5%) | 386 (2.2%) |
| 85 Years and over | 297 (1.5%) | 518 (2.9%) |
| Total | 19,318 (100.0%) | 17,680 (100.0%) |
Families and Households in Clinton County
Median Family Size in Clinton County
The median family size in Clinton County is 2.96 persons per family, with married-couple families (7,911 | 81.3%) accounting for the largest median family size of 2.98 persons per family. On the other hand, single male/father families (655 | 6.7%) represent the smallest median family size with 2.70 persons per family.
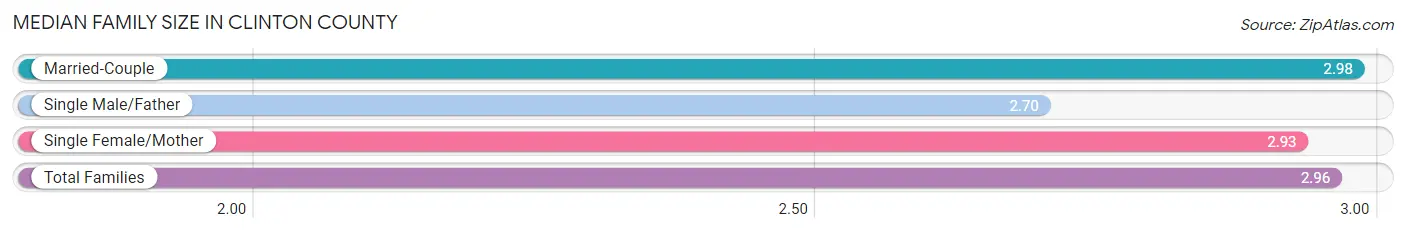
| Family Type | # Families | Family Size |
| Married-Couple | 7,911 (81.3%) | 2.98 |
| Single Male/Father | 655 (6.7%) | 2.70 |
| Single Female/Mother | 1,166 (12.0%) | 2.93 |
| Total Families | 9,732 (100.0%) | 2.96 |
Median Household Size in Clinton County
The median household size in Clinton County is 2.42 persons per household, with single female/mother households (1,166 | 8.1%) accounting for the largest median household size of 3.18 persons per household. non-family households (4,761 | 32.9%) represent the smallest median household size with 1.16 persons per household.
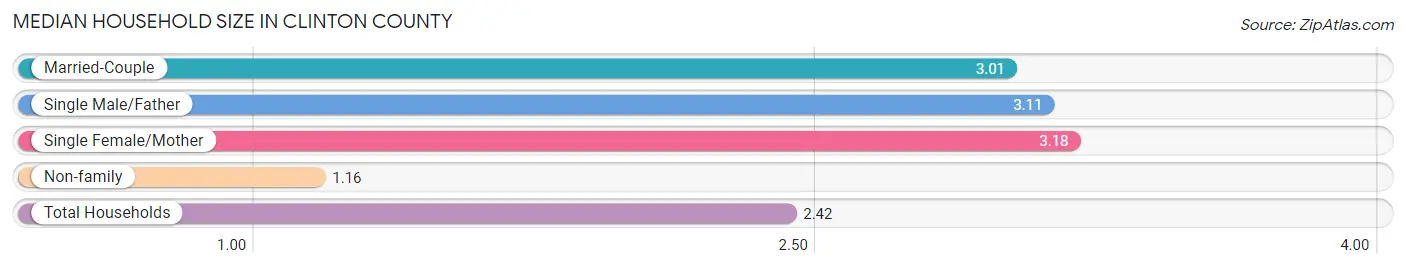
| Household Type | # Households | Household Size |
| Married-Couple | 7,911 (54.6%) | 3.01 |
| Single Male/Father | 655 (4.5%) | 3.11 |
| Single Female/Mother | 1,166 (8.1%) | 3.18 |
| Non-family | 4,761 (32.9%) | 1.16 |
| Total Households | 14,493 (100.0%) | 2.42 |
Household Size by Marriage Status in Clinton County
Out of a total of 14,493 households in Clinton County, 9,732 (67.1%) are family households, while 4,761 (32.9%) are nonfamily households. The most numerous type of family households are 2-person households, comprising 4,798, and the most common type of nonfamily households are 1-person households, comprising 4,069.
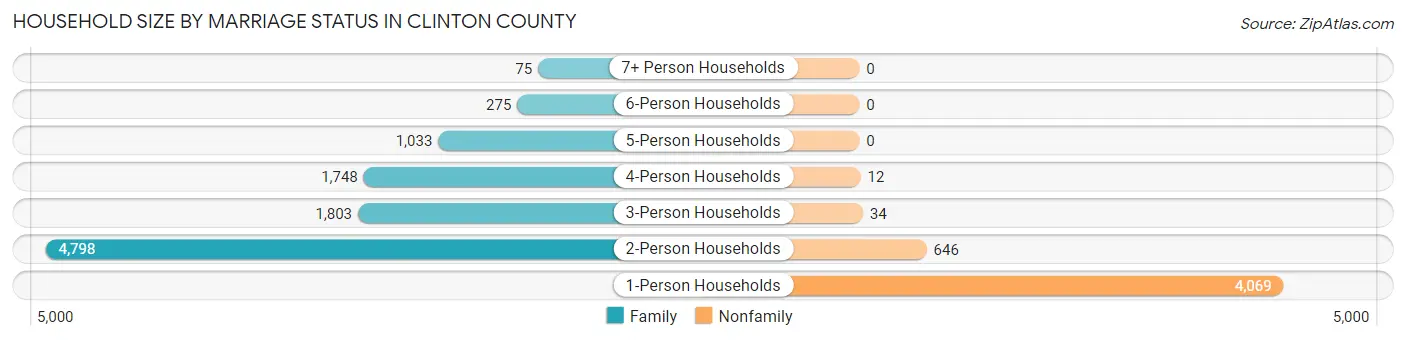
| Household Size | Family Households | Nonfamily Households |
| 1-Person Households | - | 4,069 (28.1%) |
| 2-Person Households | 4,798 (33.1%) | 646 (4.5%) |
| 3-Person Households | 1,803 (12.4%) | 34 (0.2%) |
| 4-Person Households | 1,748 (12.1%) | 12 (0.1%) |
| 5-Person Households | 1,033 (7.1%) | 0 (0.0%) |
| 6-Person Households | 275 (1.9%) | 0 (0.0%) |
| 7+ Person Households | 75 (0.5%) | 0 (0.0%) |
| Total | 9,732 (67.1%) | 4,761 (32.9%) |
Female Fertility in Clinton County
Fertility by Age in Clinton County
Average fertility rate in Clinton County is 72.0 births per 1,000 women. Women in the age bracket of 20 to 34 years have the highest fertility rate with 120.0 births per 1,000 women. Women in the age bracket of 20 to 34 years acount for 67.2% of all women with births.
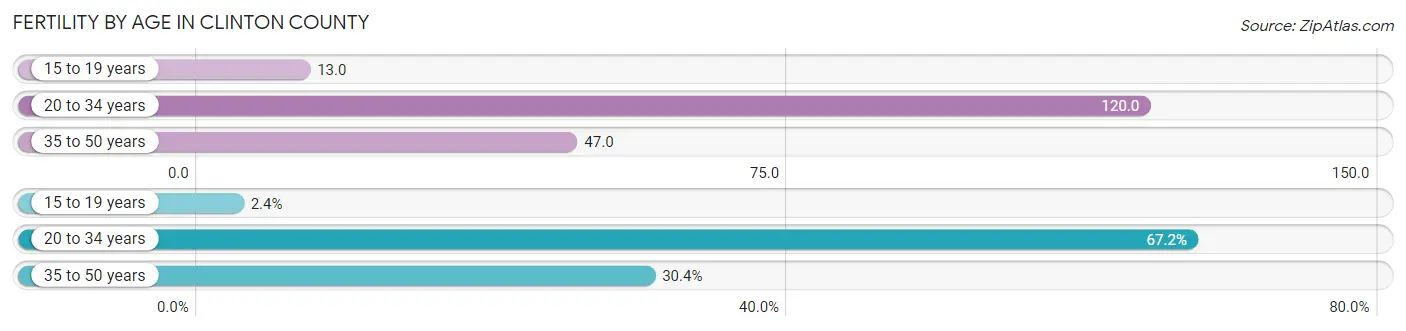
| Age Bracket | Women with Births | Births / 1,000 Women |
| 15 to 19 years | 13 (2.4%) | 13.0 |
| 20 to 34 years | 361 (67.2%) | 120.0 |
| 35 to 50 years | 163 (30.3%) | 47.0 |
| Total | 537 (100.0%) | 72.0 |
Fertility by Age by Marriage Status in Clinton County
68.2% of women with births (537) in Clinton County are married. The highest percentage of unmarried women with births falls into 15 to 19 years age bracket with 100.0% of them unmarried at the time of birth, while the lowest percentage of unmarried women with births belong to 35 to 50 years age bracket with 0.0% of them unmarried.
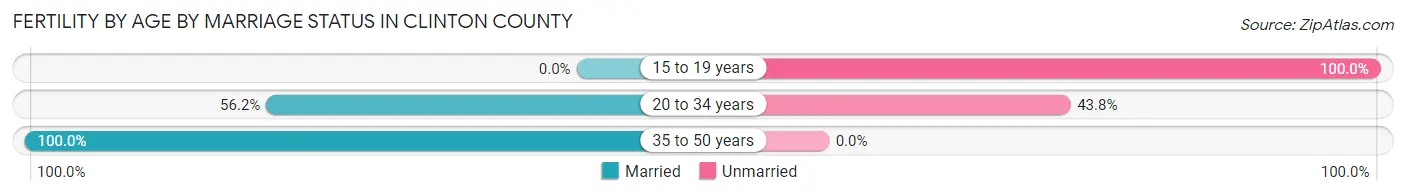
| Age Bracket | Married | Unmarried |
| 15 to 19 years | 0 (0.0%) | 13 (100.0%) |
| 20 to 34 years | 203 (56.2%) | 158 (43.8%) |
| 35 to 50 years | 163 (100.0%) | 0 (0.0%) |
| Total | 366 (68.2%) | 171 (31.8%) |
Fertility by Education in Clinton County
Average fertility rate in Clinton County is 72.0 births per 1,000 women. Women with the education attainment of graduate degree have the highest fertility rate of 137.0 births per 1,000 women, while women with the education attainment of less than high school have the lowest fertility at 15.0 births per 1,000 women. Women with the education attainment of college or associate's degree represent 34.4% of all women with births.
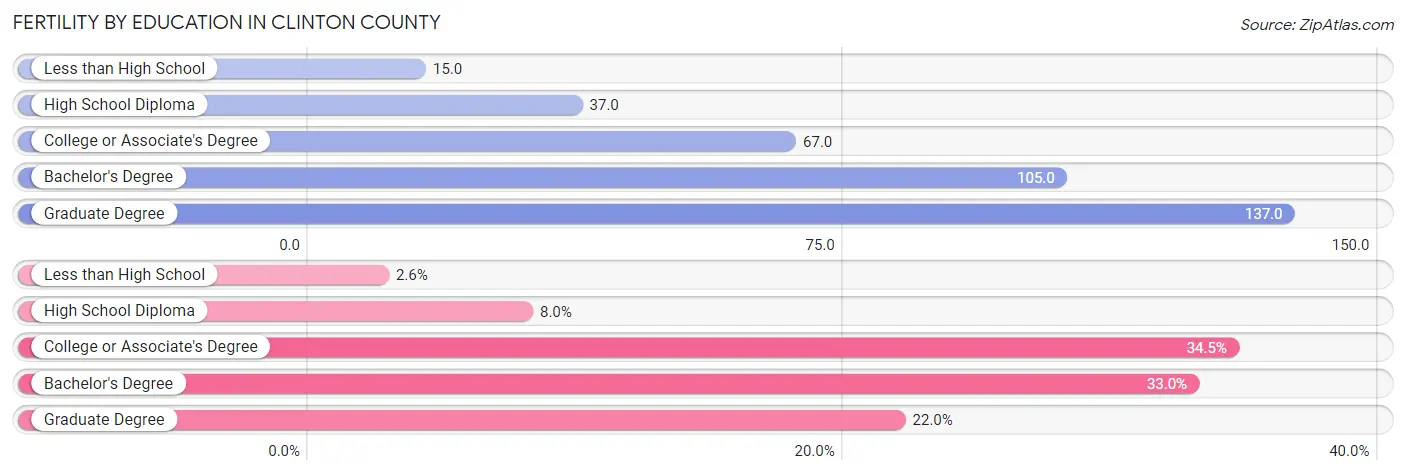
| Educational Attainment | Women with Births | Births / 1,000 Women |
| Less than High School | 14 (2.6%) | 15.0 |
| High School Diploma | 43 (8.0%) | 37.0 |
| College or Associate's Degree | 185 (34.4%) | 67.0 |
| Bachelor's Degree | 177 (33.0%) | 105.0 |
| Graduate Degree | 118 (22.0%) | 137.0 |
| Total | 537 (100.0%) | 72.0 |
Fertility by Education by Marriage Status in Clinton County
31.8% of women with births in Clinton County are unmarried. Women with the educational attainment of graduate degree are most likely to be married with 100.0% of them married at childbirth, while women with the educational attainment of less than high school are least likely to be married with 85.7% of them unmarried at childbirth.
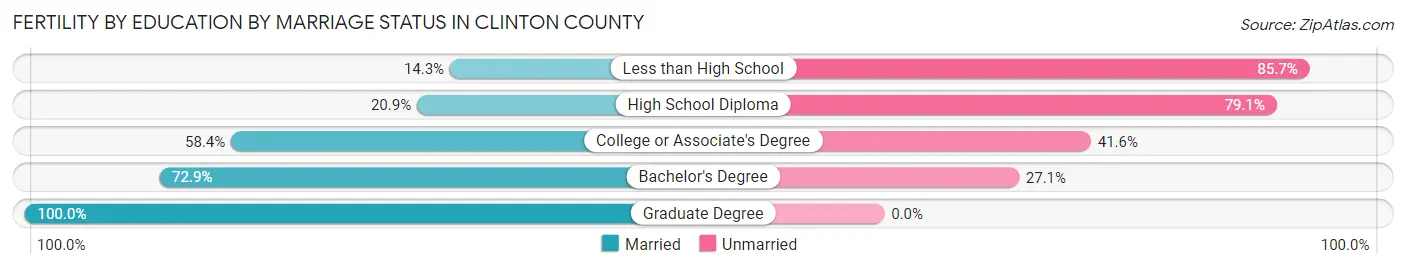
| Educational Attainment | Married | Unmarried |
| Less than High School | 2 (14.3%) | 12 (85.7%) |
| High School Diploma | 9 (20.9%) | 34 (79.1%) |
| College or Associate's Degree | 108 (58.4%) | 77 (41.6%) |
| Bachelor's Degree | 129 (72.9%) | 48 (27.1%) |
| Graduate Degree | 118 (100.0%) | 0 (0.0%) |
| Total | 366 (68.2%) | 171 (31.8%) |
Employment Characteristics in Clinton County
Employment by Class of Employer in Clinton County
Among the 18,038 employed individuals in Clinton County, private company employees (12,157 | 67.4%), not-for-profit organizations (1,408 | 7.8%), and self-employed (not incorporated) (1,124 | 6.2%) make up the most common classes of employment.
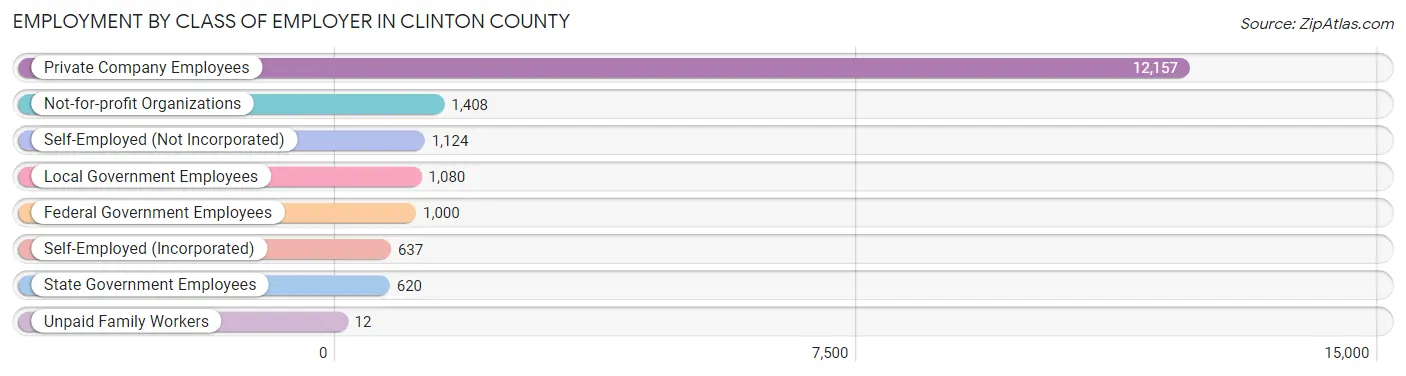
| Employer Class | # Employees | % Employees |
| Private Company Employees | 12,157 | 67.4% |
| Self-Employed (Incorporated) | 637 | 3.5% |
| Self-Employed (Not Incorporated) | 1,124 | 6.2% |
| Not-for-profit Organizations | 1,408 | 7.8% |
| Local Government Employees | 1,080 | 6.0% |
| State Government Employees | 620 | 3.4% |
| Federal Government Employees | 1,000 | 5.5% |
| Unpaid Family Workers | 12 | 0.1% |
| Total | 18,038 | 100.0% |
Employment Status by Age in Clinton County
According to the labor force statistics for Clinton County, out of the total population over 16 years of age (30,151), 62.9% or 18,965 individuals are in the labor force, with 3.0% or 569 of them unemployed. The age group with the highest labor force participation rate is 30 to 34 years, with 86.7% or 2,106 individuals in the labor force. Within the labor force, the 16 to 19 years age range has the highest percentage of unemployed individuals, with 13.4% or 108 of them being unemployed.
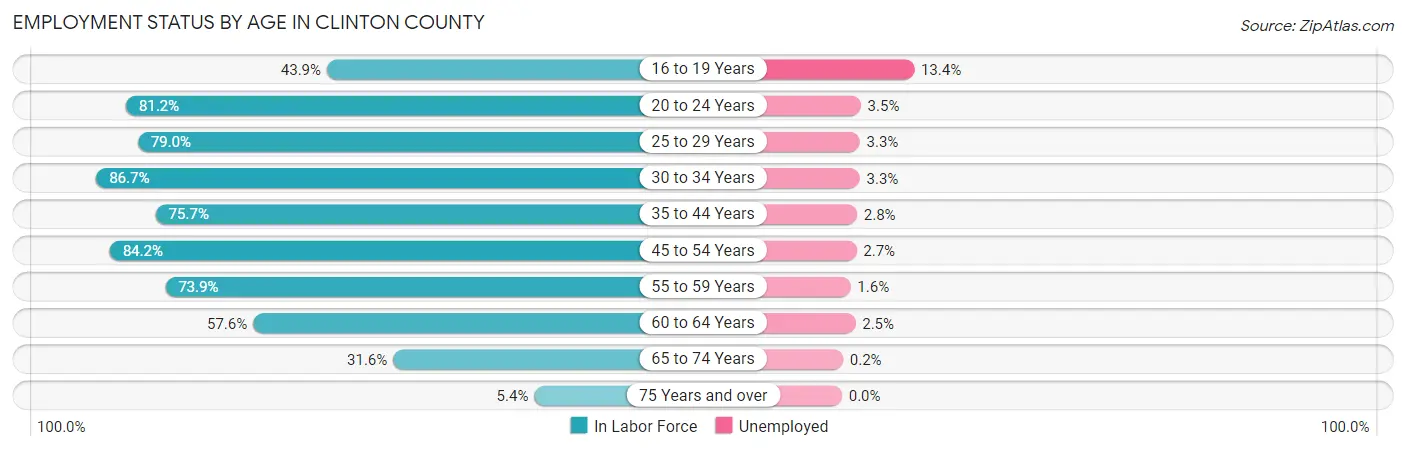
| Age Bracket | In Labor Force | Unemployed |
| 16 to 19 Years | 804 (43.9%) | 108 (13.4%) |
| 20 to 24 Years | 1,626 (81.2%) | 57 (3.5%) |
| 25 to 29 Years | 1,779 (79.0%) | 59 (3.3%) |
| 30 to 34 Years | 2,106 (86.7%) | 69 (3.3%) |
| 35 to 44 Years | 3,665 (75.7%) | 103 (2.8%) |
| 45 to 54 Years | 3,957 (84.2%) | 107 (2.7%) |
| 55 to 59 Years | 2,164 (73.9%) | 35 (1.6%) |
| 60 to 64 Years | 1,518 (57.6%) | 38 (2.5%) |
| 65 to 74 Years | 1,184 (31.6%) | 2 (0.2%) |
| 75 Years and over | 150 (5.4%) | 0 (0.0%) |
| Total | 18,965 (62.9%) | 569 (3.0%) |
Employment Status by Educational Attainment in Clinton County
According to labor force statistics for Clinton County, 76.8% of individuals (15,195) out of the total population between 25 and 64 years of age (19,785) are in the labor force, with 2.7% or 410 of them being unemployed. The group with the highest labor force participation rate are those with the educational attainment of bachelor's degree or higher, with 88.4% or 4,475 individuals in the labor force. Within the labor force, individuals with less than high school education have the highest percentage of unemployment, with 12.2% or 57 of them being unemployed.
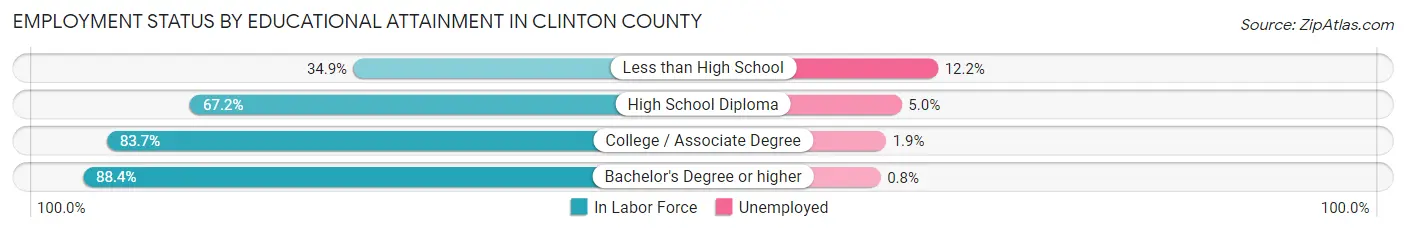
| Educational Attainment | In Labor Force | Unemployed |
| Less than High School | 466 (34.9%) | 163 (12.2%) |
| High School Diploma | 3,914 (67.2%) | 291 (5.0%) |
| College / Associate Degree | 6,331 (83.7%) | 144 (1.9%) |
| Bachelor's Degree or higher | 4,475 (88.4%) | 40 (0.8%) |
| Total | 15,195 (76.8%) | 534 (2.7%) |
Employment Occupations by Sex in Clinton County
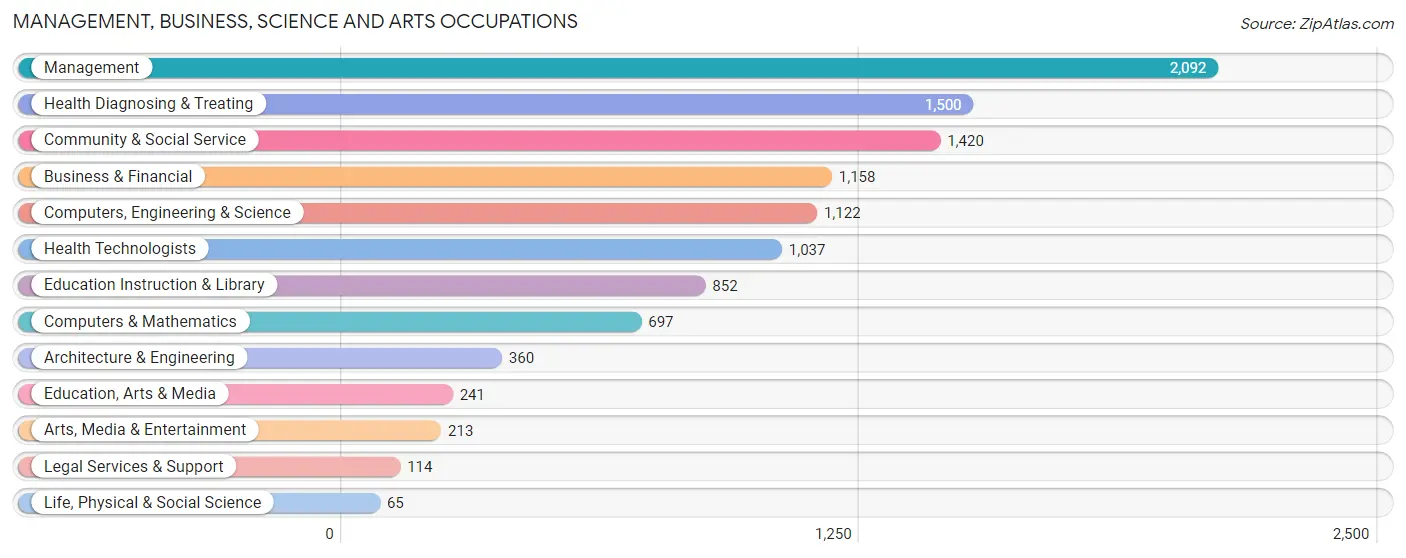
Management, Business, Science and Arts Occupations
The most common Management, Business, Science and Arts occupations in Clinton County are Management (2,092 | 11.4%), Health Diagnosing & Treating (1,500 | 8.2%), Community & Social Service (1,420 | 7.8%), Business & Financial (1,158 | 6.3%), and Computers, Engineering & Science (1,122 | 6.1%).
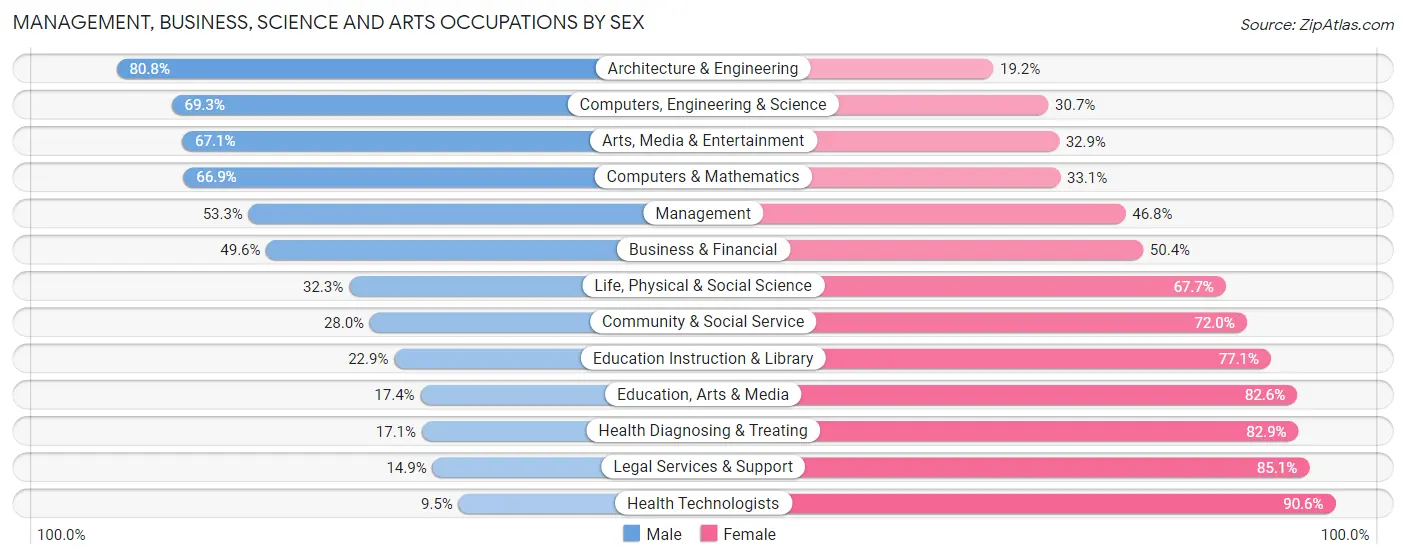
Management, Business, Science and Arts Occupations by Sex
Within the Management, Business, Science and Arts occupations in Clinton County, the most male-oriented occupations are Architecture & Engineering (80.8%), Computers, Engineering & Science (69.3%), and Arts, Media & Entertainment (67.1%), while the most female-oriented occupations are Health Technologists (90.5%), Legal Services & Support (85.1%), and Health Diagnosing & Treating (82.9%).
| Occupation | Male | Female |
| Management | 1,114 (53.2%) | 978 (46.8%) |
| Business & Financial | 574 (49.6%) | 584 (50.4%) |
| Computers, Engineering & Science | 778 (69.3%) | 344 (30.7%) |
| Computers & Mathematics | 466 (66.9%) | 231 (33.1%) |
| Architecture & Engineering | 291 (80.8%) | 69 (19.2%) |
| Life, Physical & Social Science | 21 (32.3%) | 44 (67.7%) |
| Community & Social Service | 397 (28.0%) | 1,023 (72.0%) |
| Education, Arts & Media | 42 (17.4%) | 199 (82.6%) |
| Legal Services & Support | 17 (14.9%) | 97 (85.1%) |
| Education Instruction & Library | 195 (22.9%) | 657 (77.1%) |
| Arts, Media & Entertainment | 143 (67.1%) | 70 (32.9%) |
| Health Diagnosing & Treating | 257 (17.1%) | 1,243 (82.9%) |
| Health Technologists | 98 (9.5%) | 939 (90.5%) |
| Total (Category) | 3,120 (42.8%) | 4,172 (57.2%) |
| Total (Overall) | 9,743 (53.3%) | 8,538 (46.7%) |
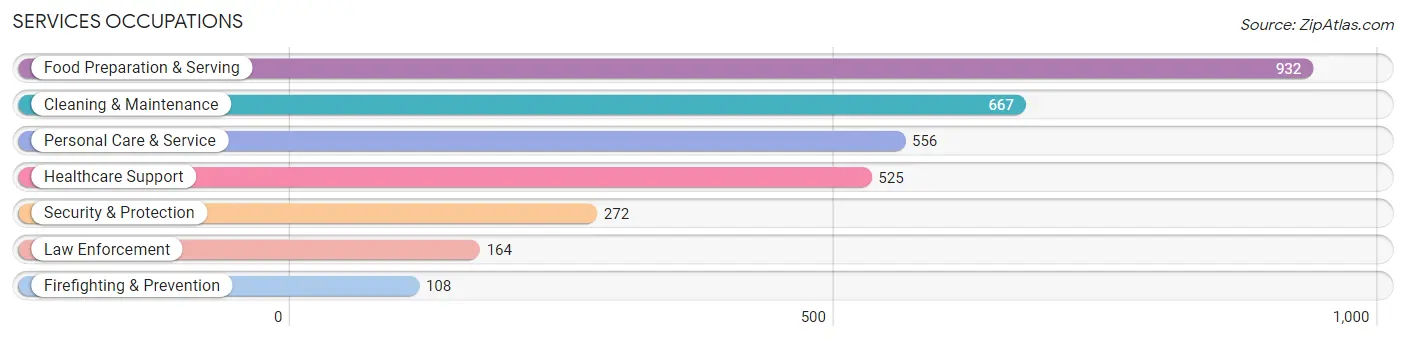
Services Occupations
The most common Services occupations in Clinton County are Food Preparation & Serving (932 | 5.1%), Cleaning & Maintenance (667 | 3.6%), Personal Care & Service (556 | 3.0%), Healthcare Support (525 | 2.9%), and Security & Protection (272 | 1.5%).
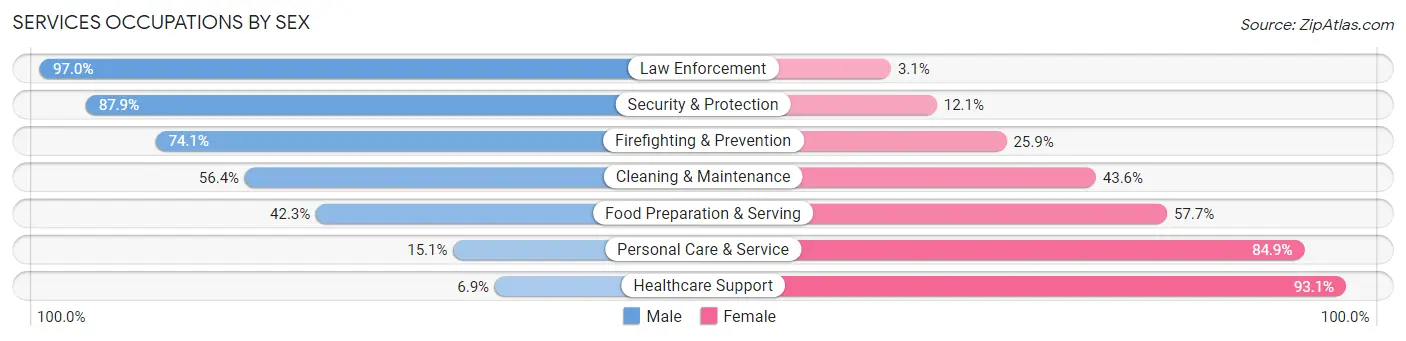
Services Occupations by Sex
Within the Services occupations in Clinton County, the most male-oriented occupations are Law Enforcement (97.0%), Security & Protection (87.9%), and Firefighting & Prevention (74.1%), while the most female-oriented occupations are Healthcare Support (93.1%), Personal Care & Service (84.9%), and Food Preparation & Serving (57.7%).
| Occupation | Male | Female |
| Healthcare Support | 36 (6.9%) | 489 (93.1%) |
| Security & Protection | 239 (87.9%) | 33 (12.1%) |
| Firefighting & Prevention | 80 (74.1%) | 28 (25.9%) |
| Law Enforcement | 159 (97.0%) | 5 (3.0%) |
| Food Preparation & Serving | 394 (42.3%) | 538 (57.7%) |
| Cleaning & Maintenance | 376 (56.4%) | 291 (43.6%) |
| Personal Care & Service | 84 (15.1%) | 472 (84.9%) |
| Total (Category) | 1,129 (38.3%) | 1,823 (61.8%) |
| Total (Overall) | 9,743 (53.3%) | 8,538 (46.7%) |
Sales and Office Occupations
The most common Sales and Office occupations in Clinton County are Office & Administration (1,760 | 9.6%), and Sales & Related (1,130 | 6.2%).
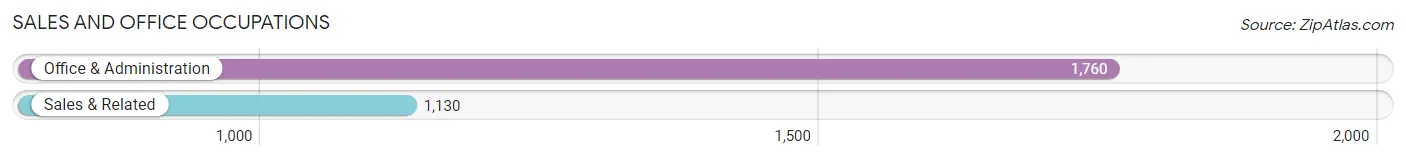
Sales and Office Occupations by Sex

| Occupation | Male | Female |
| Sales & Related | 616 (54.5%) | 514 (45.5%) |
| Office & Administration | 222 (12.6%) | 1,538 (87.4%) |
| Total (Category) | 838 (29.0%) | 2,052 (71.0%) |
| Total (Overall) | 9,743 (53.3%) | 8,538 (46.7%) |
Natural Resources, Construction and Maintenance Occupations
The most common Natural Resources, Construction and Maintenance occupations in Clinton County are Construction & Extraction (1,424 | 7.8%), Installation, Maintenance & Repair (569 | 3.1%), and Farming, Fishing & Forestry (131 | 0.7%).
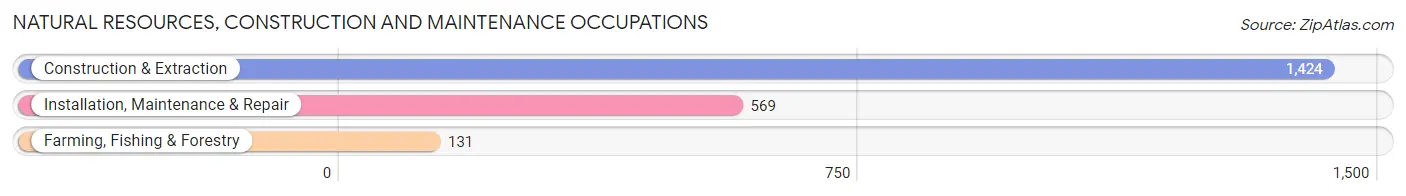
Natural Resources, Construction and Maintenance Occupations by Sex
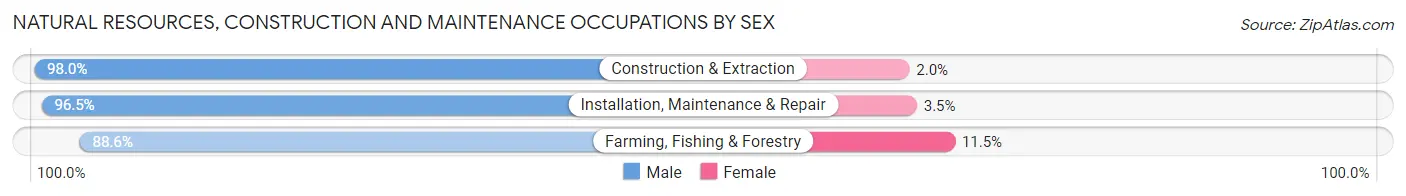
| Occupation | Male | Female |
| Farming, Fishing & Forestry | 116 (88.5%) | 15 (11.5%) |
| Construction & Extraction | 1,396 (98.0%) | 28 (2.0%) |
| Installation, Maintenance & Repair | 549 (96.5%) | 20 (3.5%) |
| Total (Category) | 2,061 (97.0%) | 63 (3.0%) |
| Total (Overall) | 9,743 (53.3%) | 8,538 (46.7%) |
Production, Transportation and Moving Occupations
The most common Production, Transportation and Moving occupations in Clinton County are Production (1,207 | 6.6%), Transportation (936 | 5.1%), and Material Moving (880 | 4.8%).
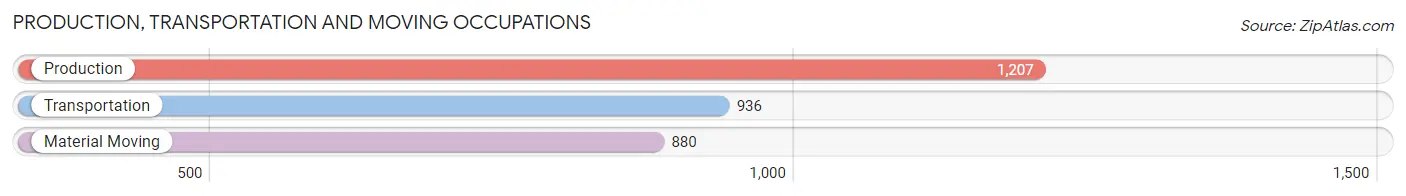
Production, Transportation and Moving Occupations by Sex
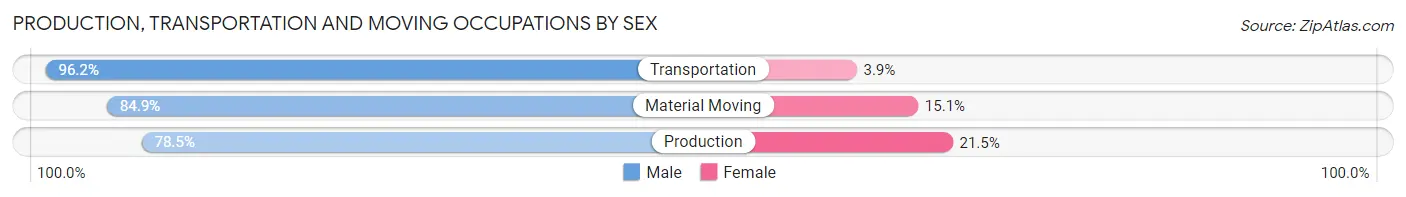
| Occupation | Male | Female |
| Production | 948 (78.5%) | 259 (21.5%) |
| Transportation | 900 (96.2%) | 36 (3.8%) |
| Material Moving | 747 (84.9%) | 133 (15.1%) |
| Total (Category) | 2,595 (85.8%) | 428 (14.2%) |
| Total (Overall) | 9,743 (53.3%) | 8,538 (46.7%) |
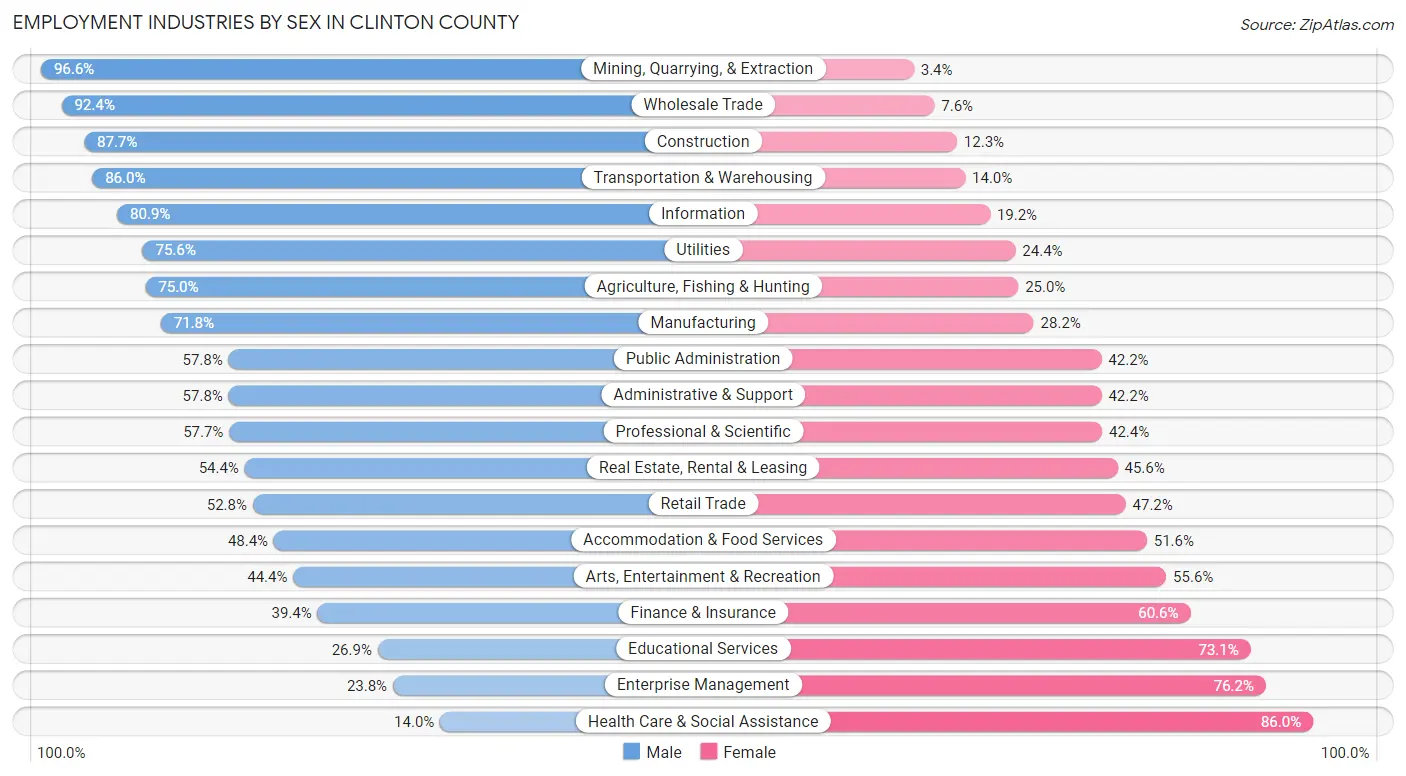
Employment Industries by Sex in Clinton County
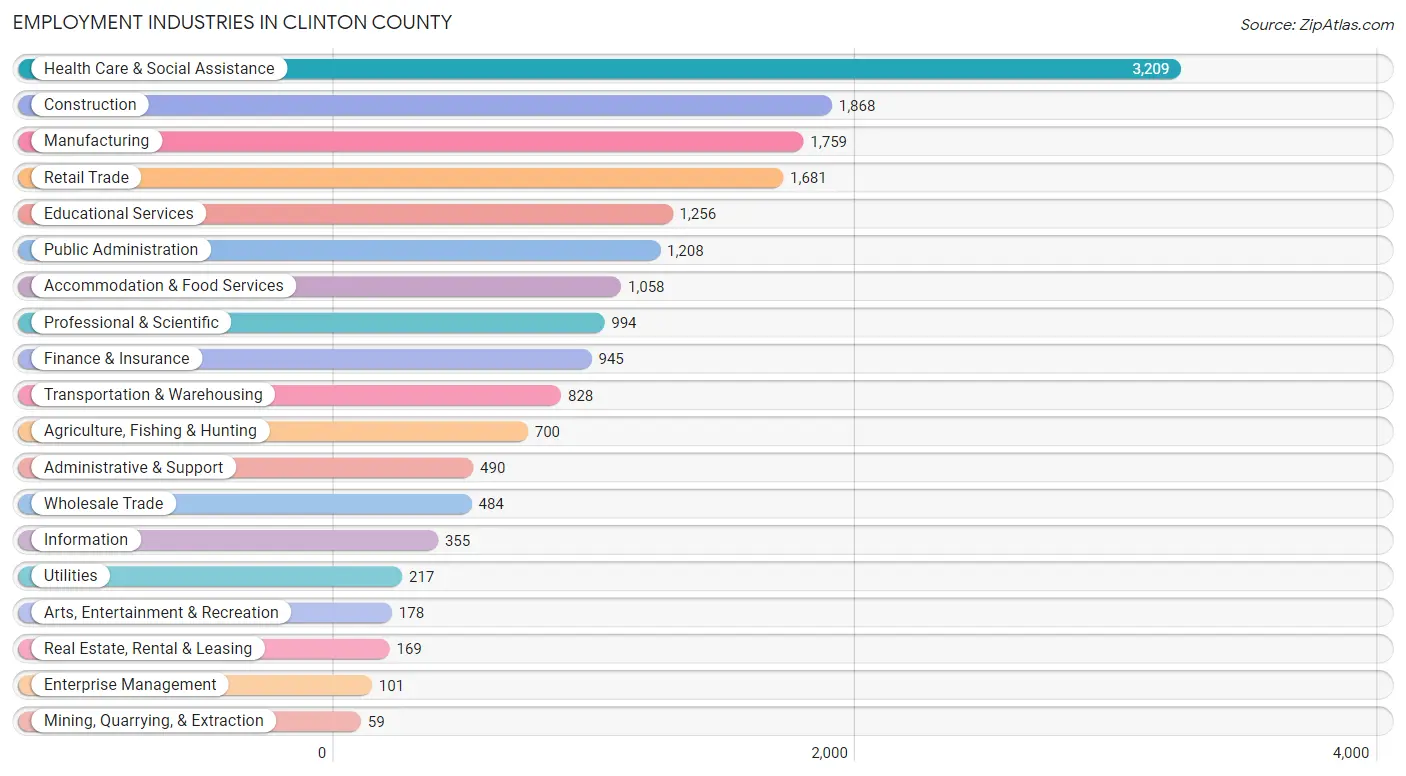
Employment Industries in Clinton County
The major employment industries in Clinton County include Health Care & Social Assistance (3,209 | 17.5%), Construction (1,868 | 10.2%), Manufacturing (1,759 | 9.6%), Retail Trade (1,681 | 9.2%), and Educational Services (1,256 | 6.9%).
Employment Industries by Sex in Clinton County
The Clinton County industries that see more men than women are Mining, Quarrying, & Extraction (96.6%), Wholesale Trade (92.4%), and Construction (87.7%), whereas the industries that tend to have a higher number of women are Health Care & Social Assistance (86.0%), Enterprise Management (76.2%), and Educational Services (73.1%).
| Industry | Male | Female |
| Agriculture, Fishing & Hunting | 525 (75.0%) | 175 (25.0%) |
| Mining, Quarrying, & Extraction | 57 (96.6%) | 2 (3.4%) |
| Construction | 1,638 (87.7%) | 230 (12.3%) |
| Manufacturing | 1,263 (71.8%) | 496 (28.2%) |
| Wholesale Trade | 447 (92.4%) | 37 (7.6%) |
| Retail Trade | 887 (52.8%) | 794 (47.2%) |
| Transportation & Warehousing | 712 (86.0%) | 116 (14.0%) |
| Utilities | 164 (75.6%) | 53 (24.4%) |
| Information | 287 (80.8%) | 68 (19.2%) |
| Finance & Insurance | 372 (39.4%) | 573 (60.6%) |
| Real Estate, Rental & Leasing | 92 (54.4%) | 77 (45.6%) |
| Professional & Scientific | 573 (57.7%) | 421 (42.3%) |
| Enterprise Management | 24 (23.8%) | 77 (76.2%) |
| Administrative & Support | 283 (57.8%) | 207 (42.2%) |
| Educational Services | 338 (26.9%) | 918 (73.1%) |
| Health Care & Social Assistance | 449 (14.0%) | 2,760 (86.0%) |
| Arts, Entertainment & Recreation | 79 (44.4%) | 99 (55.6%) |
| Accommodation & Food Services | 512 (48.4%) | 546 (51.6%) |
| Public Administration | 698 (57.8%) | 510 (42.2%) |
| Total | 9,743 (53.3%) | 8,538 (46.7%) |
Education in Clinton County
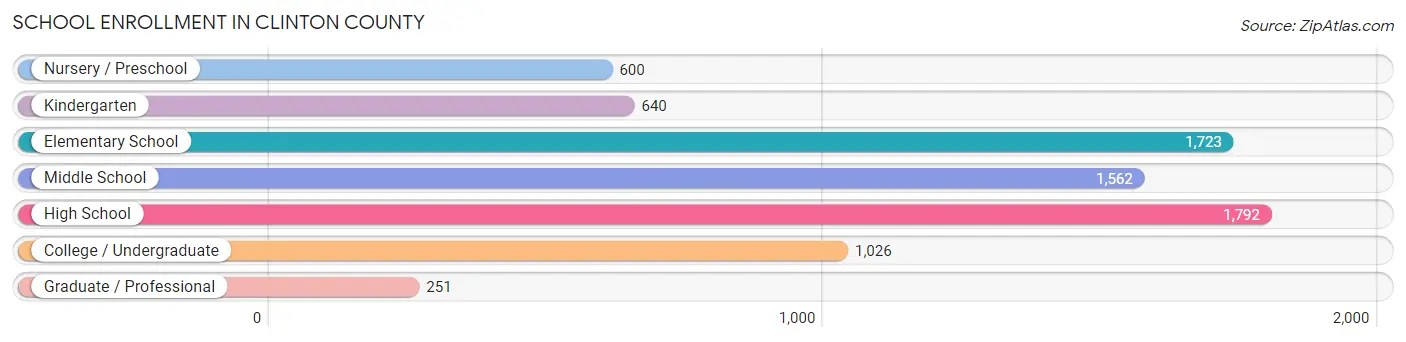
School Enrollment in Clinton County
The most common levels of schooling among the 7,594 students in Clinton County are high school (1,792 | 23.6%), elementary school (1,723 | 22.7%), and middle school (1,562 | 20.6%).
| School Level | # Students | % Students |
| Nursery / Preschool | 600 | 7.9% |
| Kindergarten | 640 | 8.4% |
| Elementary School | 1,723 | 22.7% |
| Middle School | 1,562 | 20.6% |
| High School | 1,792 | 23.6% |
| College / Undergraduate | 1,026 | 13.5% |
| Graduate / Professional | 251 | 3.3% |
| Total | 7,594 | 100.0% |
School Enrollment by Age by Funding Source in Clinton County
Out of a total of 7,594 students who are enrolled in schools in Clinton County, 1,390 (18.3%) attend a private institution, while the remaining 6,204 (81.7%) are enrolled in public schools. The age group of 35 years and over has the highest likelihood of being enrolled in private schools, with 82 (34.3% in the age bracket) enrolled. Conversely, the age group of 10 to 14 year olds has the lowest likelihood of being enrolled in a private school, with 1,761 (88.3% in the age bracket) attending a public institution.
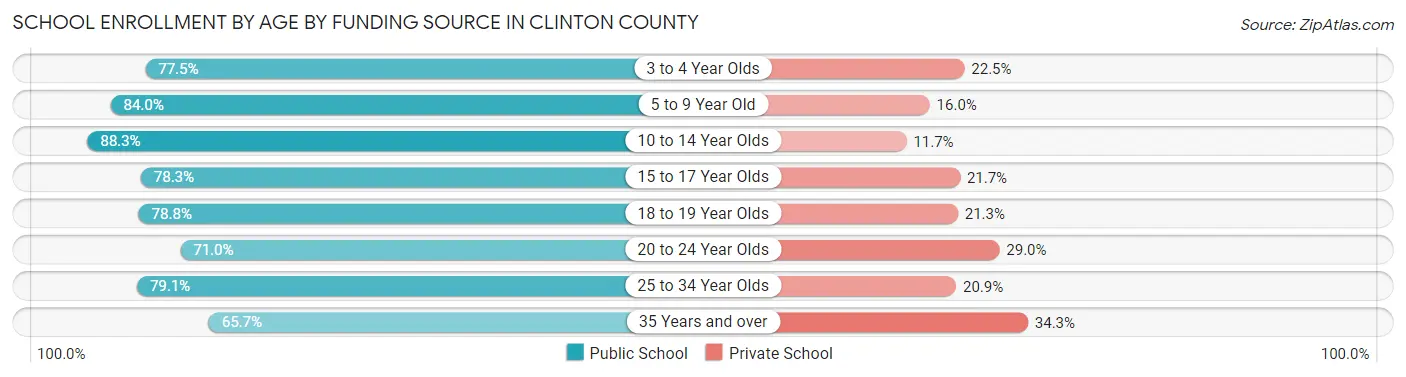
| Age Bracket | Public School | Private School |
| 3 to 4 Year Olds | 331 (77.5%) | 96 (22.5%) |
| 5 to 9 Year Old | 1,913 (84.0%) | 365 (16.0%) |
| 10 to 14 Year Olds | 1,761 (88.3%) | 233 (11.7%) |
| 15 to 17 Year Olds | 1,078 (78.3%) | 298 (21.7%) |
| 18 to 19 Year Olds | 415 (78.7%) | 112 (21.2%) |
| 20 to 24 Year Olds | 382 (71.0%) | 156 (29.0%) |
| 25 to 34 Year Olds | 170 (79.1%) | 45 (20.9%) |
| 35 Years and over | 157 (65.7%) | 82 (34.3%) |
| Total | 6,204 (81.7%) | 1,390 (18.3%) |
Educational Attainment by Field of Study in Clinton County
Business (1,846 | 27.8%), education (1,022 | 15.4%), science & technology (937 | 14.1%), arts & humanities (507 | 7.6%), and computers & mathematics (400 | 6.0%) are the most common fields of study among 6,647 individuals in Clinton County who have obtained a bachelor's degree or higher.
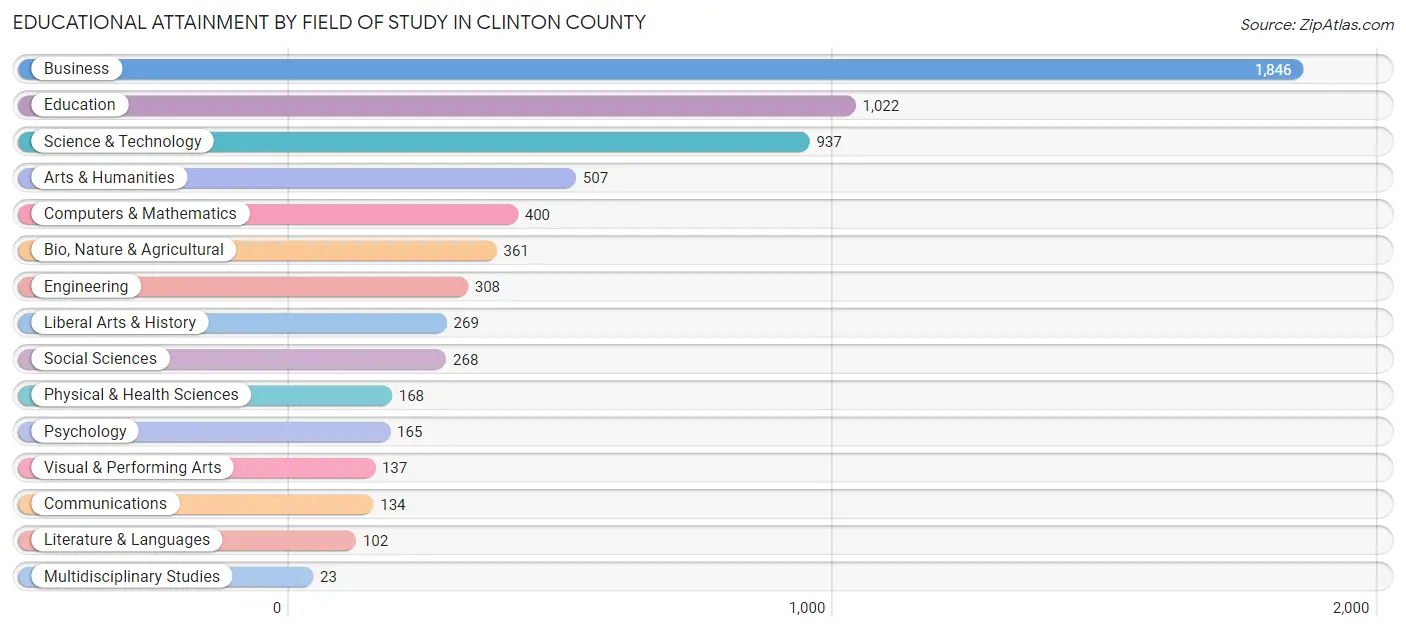
| Field of Study | # Graduates | % Graduates |
| Computers & Mathematics | 400 | 6.0% |
| Bio, Nature & Agricultural | 361 | 5.4% |
| Physical & Health Sciences | 168 | 2.5% |
| Psychology | 165 | 2.5% |
| Social Sciences | 268 | 4.0% |
| Engineering | 308 | 4.6% |
| Multidisciplinary Studies | 23 | 0.4% |
| Science & Technology | 937 | 14.1% |
| Business | 1,846 | 27.8% |
| Education | 1,022 | 15.4% |
| Literature & Languages | 102 | 1.5% |
| Liberal Arts & History | 269 | 4.1% |
| Visual & Performing Arts | 137 | 2.1% |
| Communications | 134 | 2.0% |
| Arts & Humanities | 507 | 7.6% |
| Total | 6,647 | 100.0% |
Transportation & Commute in Clinton County
Vehicle Availability by Sex in Clinton County
The most prevalent vehicle ownership categories in Clinton County are males with 2 vehicles (3,854, accounting for 40.2%) and females with 2 vehicles (3,240, making up 46.2%).
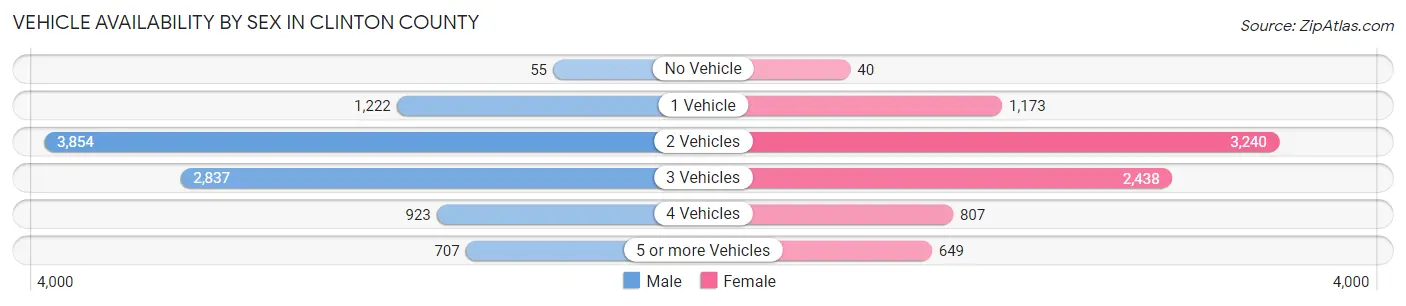
| Vehicles Available | Male | Female |
| No Vehicle | 55 (0.6%) | 40 (0.5%) |
| 1 Vehicle | 1,222 (12.7%) | 1,173 (14.1%) |
| 2 Vehicles | 3,854 (40.2%) | 3,240 (38.8%) |
| 3 Vehicles | 2,837 (29.6%) | 2,438 (29.2%) |
| 4 Vehicles | 923 (9.6%) | 807 (9.7%) |
| 5 or more Vehicles | 707 (7.4%) | 649 (7.8%) |
| Total | 9,598 (100.0%) | 8,347 (100.0%) |
Commute Time in Clinton County
The most frequently occuring commute durations in Clinton County are 5 to 9 minutes (2,091 commuters, 12.8%), 20 to 24 minutes (2,073 commuters, 12.7%), and 10 to 14 minutes (2,036 commuters, 12.5%).
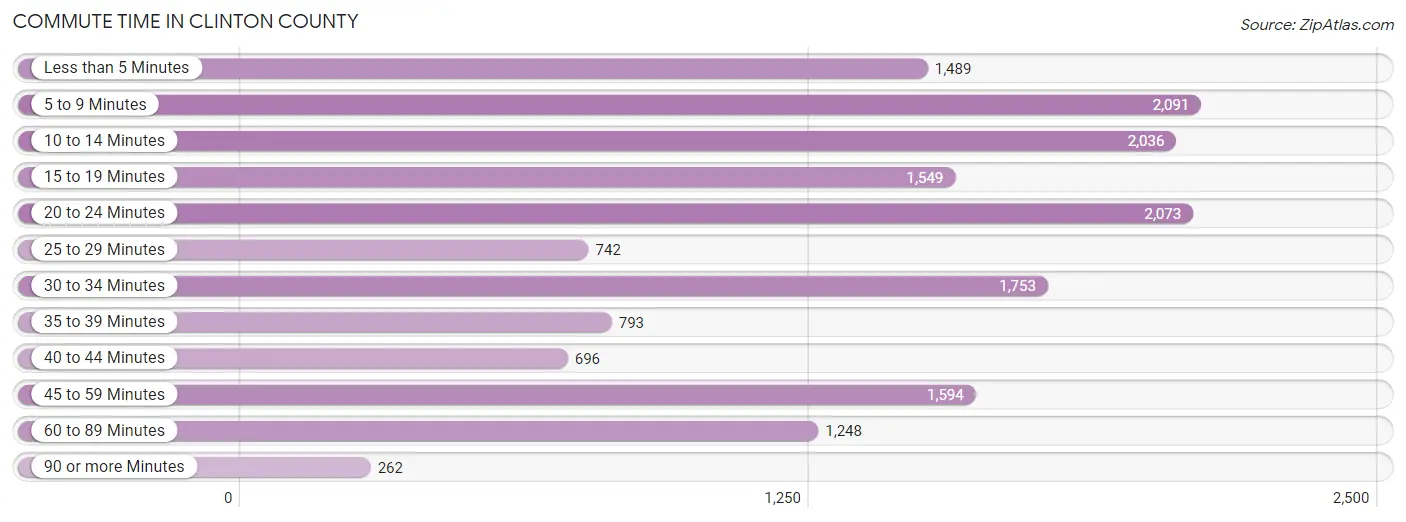
| Commute Time | # Commuters | % Commuters |
| Less than 5 Minutes | 1,489 | 9.1% |
| 5 to 9 Minutes | 2,091 | 12.8% |
| 10 to 14 Minutes | 2,036 | 12.5% |
| 15 to 19 Minutes | 1,549 | 9.5% |
| 20 to 24 Minutes | 2,073 | 12.7% |
| 25 to 29 Minutes | 742 | 4.5% |
| 30 to 34 Minutes | 1,753 | 10.7% |
| 35 to 39 Minutes | 793 | 4.9% |
| 40 to 44 Minutes | 696 | 4.3% |
| 45 to 59 Minutes | 1,594 | 9.8% |
| 60 to 89 Minutes | 1,248 | 7.6% |
| 90 or more Minutes | 262 | 1.6% |
Commute Time by Sex in Clinton County
The most common commute times in Clinton County are 5 to 9 minutes (1,168 commuters, 13.4%) for males and 10 to 14 minutes (966 commuters, 12.7%) for females.
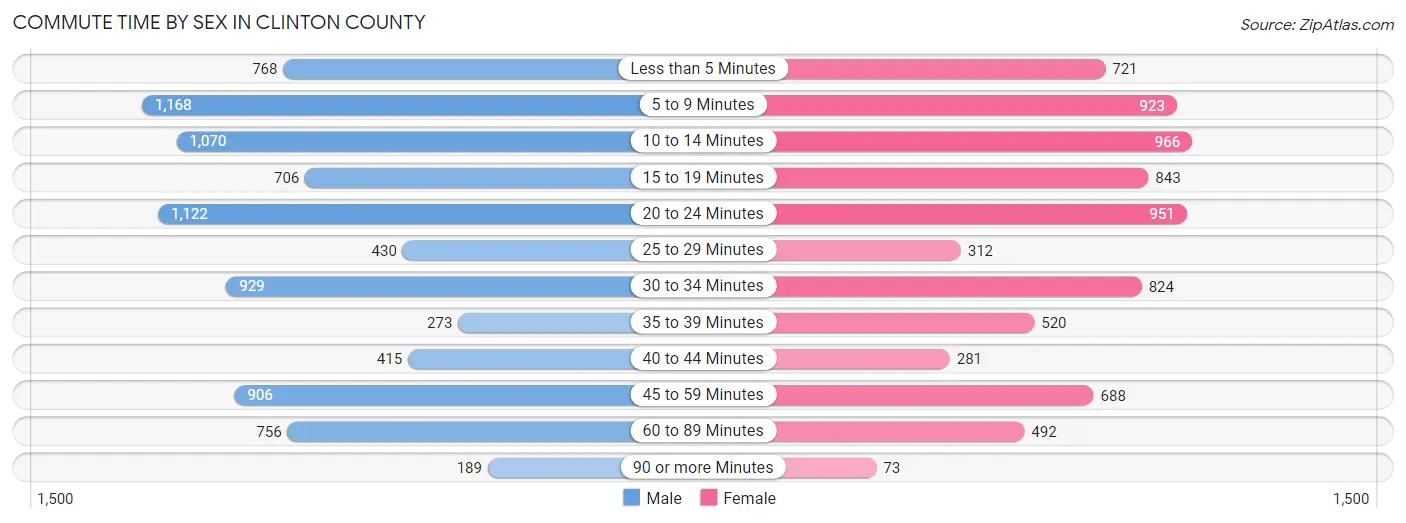
| Commute Time | Male | Female |
| Less than 5 Minutes | 768 (8.8%) | 721 (9.5%) |
| 5 to 9 Minutes | 1,168 (13.4%) | 923 (12.1%) |
| 10 to 14 Minutes | 1,070 (12.2%) | 966 (12.7%) |
| 15 to 19 Minutes | 706 (8.1%) | 843 (11.1%) |
| 20 to 24 Minutes | 1,122 (12.9%) | 951 (12.5%) |
| 25 to 29 Minutes | 430 (4.9%) | 312 (4.1%) |
| 30 to 34 Minutes | 929 (10.6%) | 824 (10.8%) |
| 35 to 39 Minutes | 273 (3.1%) | 520 (6.9%) |
| 40 to 44 Minutes | 415 (4.8%) | 281 (3.7%) |
| 45 to 59 Minutes | 906 (10.4%) | 688 (9.1%) |
| 60 to 89 Minutes | 756 (8.7%) | 492 (6.5%) |
| 90 or more Minutes | 189 (2.2%) | 73 (1.0%) |
Time of Departure to Work by Sex in Clinton County
The most frequent times of departure to work in Clinton County are 6:30 AM to 6:59 AM (1,190, 13.6%) for males and 7:00 AM to 7:29 AM (1,514, 19.9%) for females.
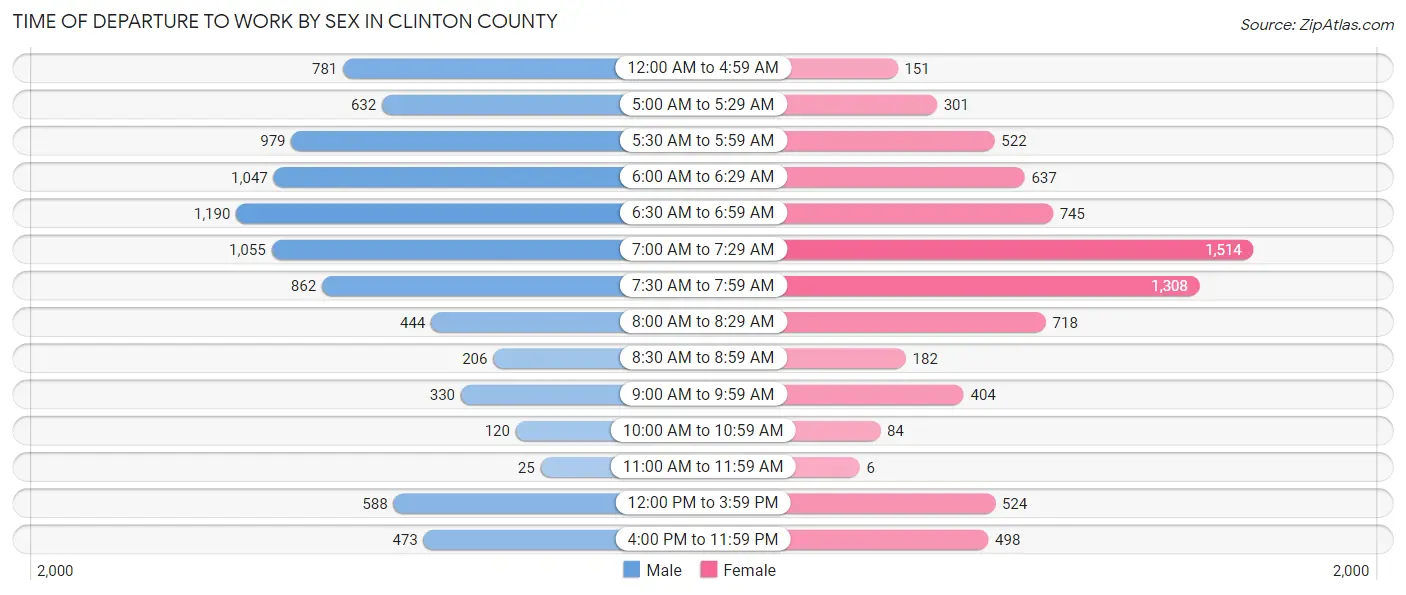
| Time of Departure | Male | Female |
| 12:00 AM to 4:59 AM | 781 (8.9%) | 151 (2.0%) |
| 5:00 AM to 5:29 AM | 632 (7.2%) | 301 (4.0%) |
| 5:30 AM to 5:59 AM | 979 (11.2%) | 522 (6.9%) |
| 6:00 AM to 6:29 AM | 1,047 (12.0%) | 637 (8.4%) |
| 6:30 AM to 6:59 AM | 1,190 (13.6%) | 745 (9.8%) |
| 7:00 AM to 7:29 AM | 1,055 (12.1%) | 1,514 (19.9%) |
| 7:30 AM to 7:59 AM | 862 (9.9%) | 1,308 (17.2%) |
| 8:00 AM to 8:29 AM | 444 (5.1%) | 718 (9.5%) |
| 8:30 AM to 8:59 AM | 206 (2.4%) | 182 (2.4%) |
| 9:00 AM to 9:59 AM | 330 (3.8%) | 404 (5.3%) |
| 10:00 AM to 10:59 AM | 120 (1.4%) | 84 (1.1%) |
| 11:00 AM to 11:59 AM | 25 (0.3%) | 6 (0.1%) |
| 12:00 PM to 3:59 PM | 588 (6.7%) | 524 (6.9%) |
| 4:00 PM to 11:59 PM | 473 (5.4%) | 498 (6.6%) |
| Total | 8,732 (100.0%) | 7,594 (100.0%) |
Housing Occupancy in Clinton County
Occupancy by Ownership in Clinton County
Of the total 14,493 dwellings in Clinton County, owner-occupied units account for 11,530 (79.6%), while renter-occupied units make up 2,963 (20.4%).
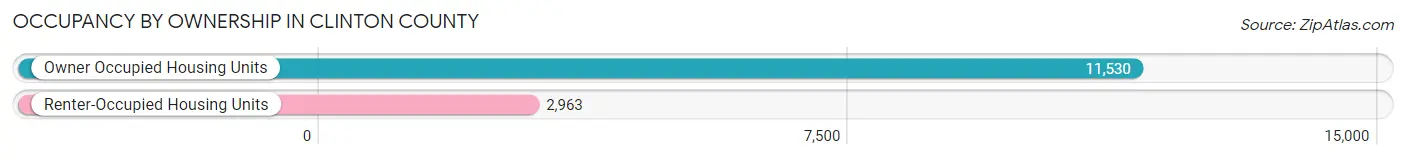
| Occupancy | # Housing Units | % Housing Units |
| Owner Occupied Housing Units | 11,530 | 79.6% |
| Renter-Occupied Housing Units | 2,963 | 20.4% |
| Total Occupied Housing Units | 14,493 | 100.0% |
Occupancy by Household Size in Clinton County
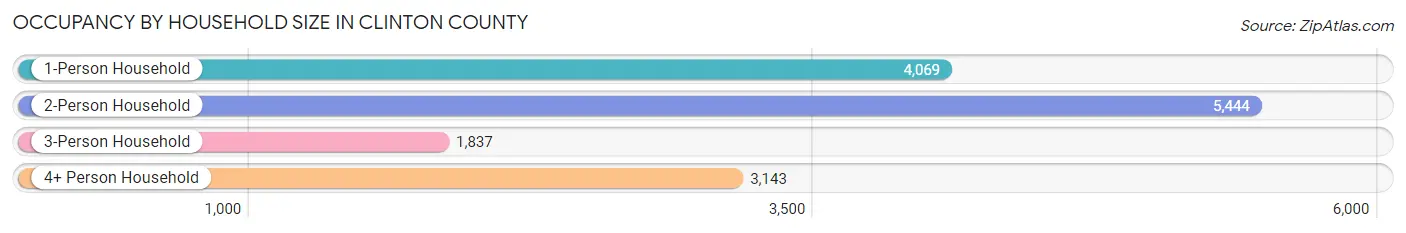
| Household Size | # Housing Units | % Housing Units |
| 1-Person Household | 4,069 | 28.1% |
| 2-Person Household | 5,444 | 37.6% |
| 3-Person Household | 1,837 | 12.7% |
| 4+ Person Household | 3,143 | 21.7% |
| Total Housing Units | 14,493 | 100.0% |
Occupancy by Ownership by Household Size in Clinton County
| Household Size | Owner-occupied | Renter-occupied |
| 1-Person Household | 2,850 (70.0%) | 1,219 (30.0%) |
| 2-Person Household | 4,640 (85.2%) | 804 (14.8%) |
| 3-Person Household | 1,486 (80.9%) | 351 (19.1%) |
| 4+ Person Household | 2,554 (81.3%) | 589 (18.7%) |
| Total Housing Units | 11,530 (79.6%) | 2,963 (20.4%) |
Occupancy by Educational Attainment in Clinton County
| Household Size | Owner-occupied | Renter-occupied |
| Less than High School | 474 (63.0%) | 278 (37.0%) |
| High School Diploma | 3,525 (79.9%) | 886 (20.1%) |
| College/Associate Degree | 4,591 (80.1%) | 1,143 (19.9%) |
| Bachelor's Degree or higher | 2,940 (81.8%) | 656 (18.2%) |
Occupancy by Age of Householder in Clinton County
| Age Bracket | # Households | % Households |
| Under 35 Years | 2,520 | 17.4% |
| 35 to 44 Years | 2,234 | 15.4% |
| 45 to 54 Years | 2,496 | 17.2% |
| 55 to 64 Years | 2,952 | 20.4% |
| 65 to 74 Years | 2,350 | 16.2% |
| 75 to 84 Years | 1,412 | 9.7% |
| 85 Years and Over | 529 | 3.6% |
| Total | 14,493 | 100.0% |
Housing Finances in Clinton County
Median Income by Occupancy in Clinton County
| Occupancy Type | # Households | Median Income |
| Owner-Occupied | 11,530 (79.6%) | $88,689 |
| Renter-Occupied | 2,963 (20.4%) | $44,844 |
| Average | 14,493 (100.0%) | $78,054 |
Occupancy by Householder Income Bracket in Clinton County
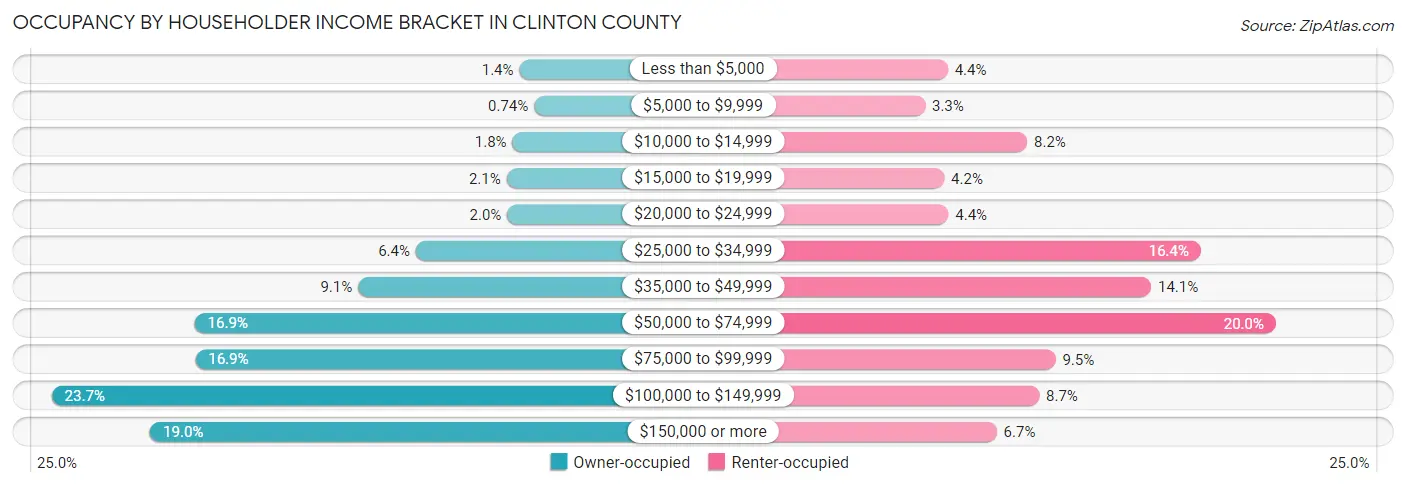
| Income Bracket | Owner-occupied | Renter-occupied |
| Less than $5,000 | 166 (1.4%) | 130 (4.4%) |
| $5,000 to $9,999 | 85 (0.7%) | 98 (3.3%) |
| $10,000 to $14,999 | 204 (1.8%) | 242 (8.2%) |
| $15,000 to $19,999 | 236 (2.1%) | 125 (4.2%) |
| $20,000 to $24,999 | 233 (2.0%) | 131 (4.4%) |
| $25,000 to $34,999 | 734 (6.4%) | 487 (16.4%) |
| $35,000 to $49,999 | 1,052 (9.1%) | 417 (14.1%) |
| $50,000 to $74,999 | 1,948 (16.9%) | 593 (20.0%) |
| $75,000 to $99,999 | 1,945 (16.9%) | 282 (9.5%) |
| $100,000 to $149,999 | 2,734 (23.7%) | 259 (8.7%) |
| $150,000 or more | 2,193 (19.0%) | 199 (6.7%) |
| Total | 11,530 (100.0%) | 2,963 (100.0%) |
Monthly Housing Cost Tiers in Clinton County
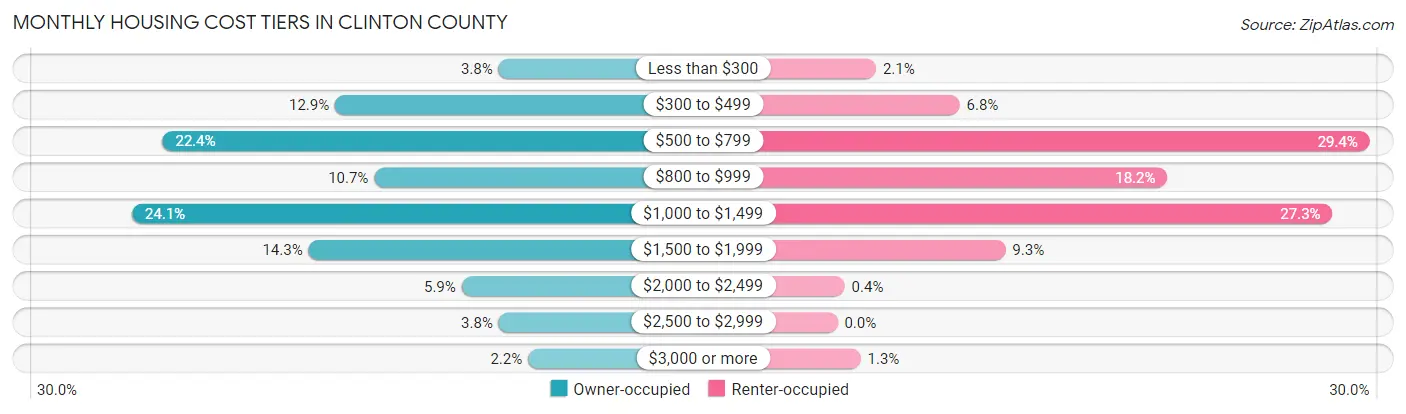
| Monthly Cost | Owner-occupied | Renter-occupied |
| Less than $300 | 440 (3.8%) | 63 (2.1%) |
| $300 to $499 | 1,482 (12.9%) | 200 (6.8%) |
| $500 to $799 | 2,581 (22.4%) | 871 (29.4%) |
| $800 to $999 | 1,233 (10.7%) | 540 (18.2%) |
| $1,000 to $1,499 | 2,775 (24.1%) | 810 (27.3%) |
| $1,500 to $1,999 | 1,651 (14.3%) | 275 (9.3%) |
| $2,000 to $2,499 | 676 (5.9%) | 12 (0.4%) |
| $2,500 to $2,999 | 439 (3.8%) | 0 (0.0%) |
| $3,000 or more | 253 (2.2%) | 38 (1.3%) |
| Total | 11,530 (100.0%) | 2,963 (100.0%) |
Physical Housing Characteristics in Clinton County
Housing Structures in Clinton County
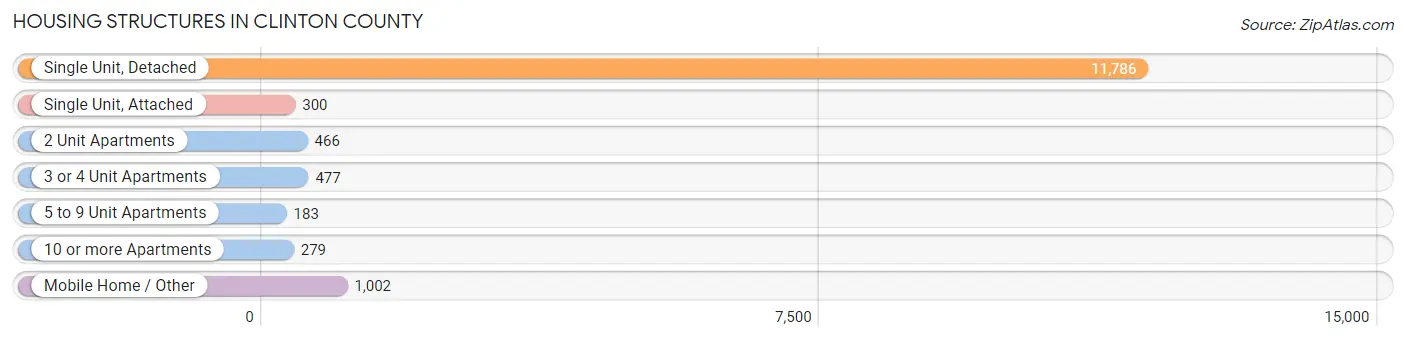
| Structure Type | # Housing Units | % Housing Units |
| Single Unit, Detached | 11,786 | 81.3% |
| Single Unit, Attached | 300 | 2.1% |
| 2 Unit Apartments | 466 | 3.2% |
| 3 or 4 Unit Apartments | 477 | 3.3% |
| 5 to 9 Unit Apartments | 183 | 1.3% |
| 10 or more Apartments | 279 | 1.9% |
| Mobile Home / Other | 1,002 | 6.9% |
| Total | 14,493 | 100.0% |
Housing Structures by Occupancy in Clinton County
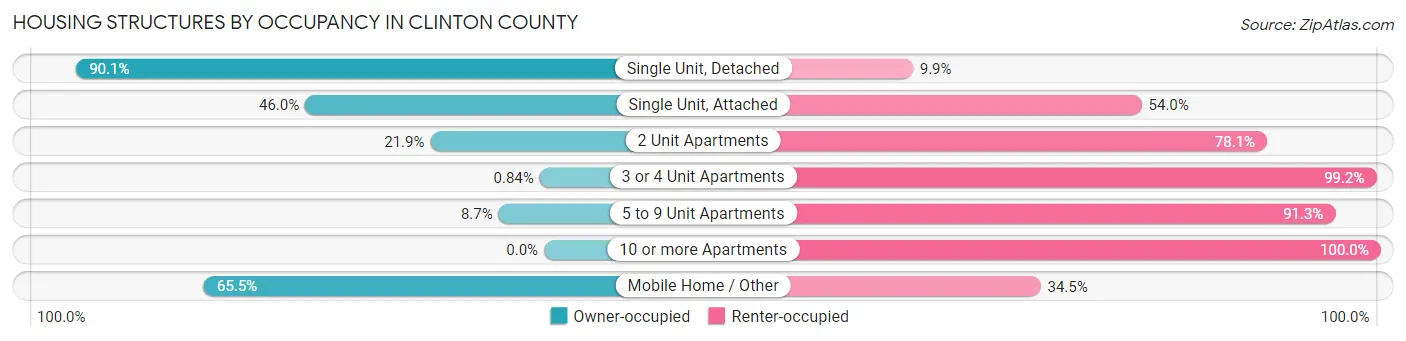
| Structure Type | Owner-occupied | Renter-occupied |
| Single Unit, Detached | 10,614 (90.1%) | 1,172 (9.9%) |
| Single Unit, Attached | 138 (46.0%) | 162 (54.0%) |
| 2 Unit Apartments | 102 (21.9%) | 364 (78.1%) |
| 3 or 4 Unit Apartments | 4 (0.8%) | 473 (99.2%) |
| 5 to 9 Unit Apartments | 16 (8.7%) | 167 (91.3%) |
| 10 or more Apartments | 0 (0.0%) | 279 (100.0%) |
| Mobile Home / Other | 656 (65.5%) | 346 (34.5%) |
| Total | 11,530 (79.6%) | 2,963 (20.4%) |
Housing Structures by Number of Rooms in Clinton County
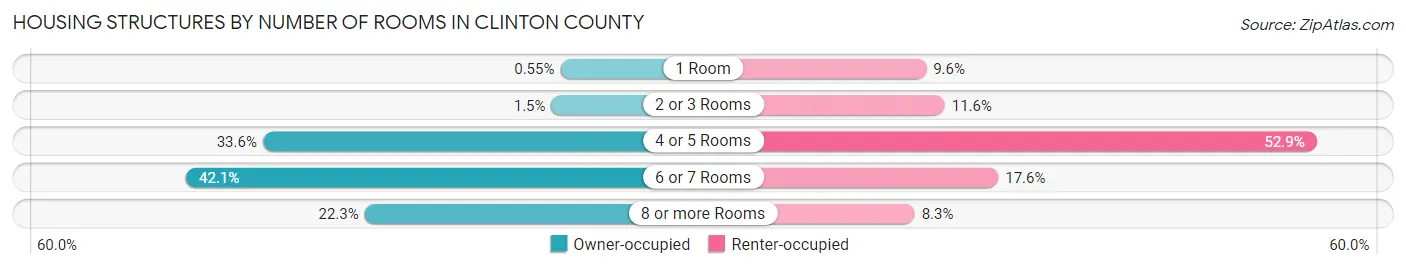
| Number of Rooms | Owner-occupied | Renter-occupied |
| 1 Room | 63 (0.5%) | 284 (9.6%) |
| 2 or 3 Rooms | 177 (1.5%) | 345 (11.6%) |
| 4 or 5 Rooms | 3,871 (33.6%) | 1,567 (52.9%) |
| 6 or 7 Rooms | 4,851 (42.1%) | 521 (17.6%) |
| 8 or more Rooms | 2,568 (22.3%) | 246 (8.3%) |
| Total | 11,530 (100.0%) | 2,963 (100.0%) |
Housing Structure by Heating Type in Clinton County
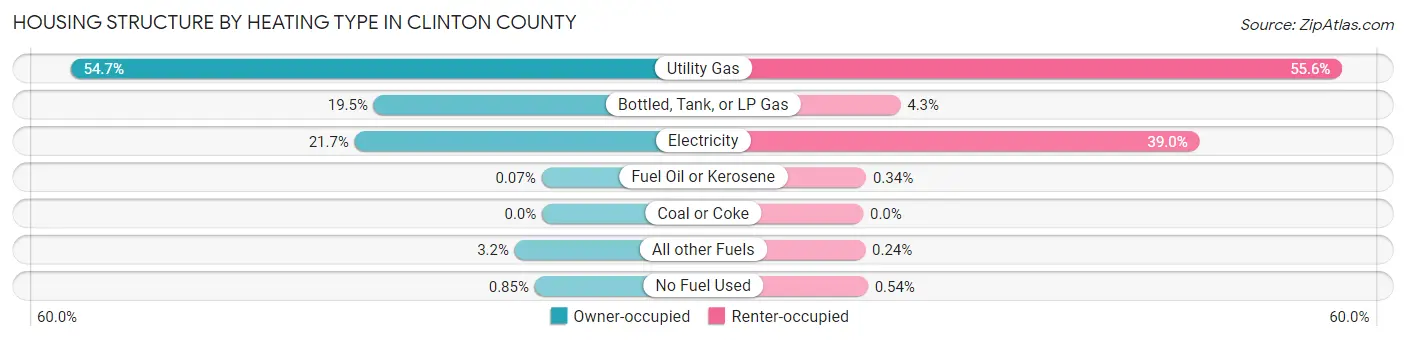
| Heating Type | Owner-occupied | Renter-occupied |
| Utility Gas | 6,304 (54.7%) | 1,646 (55.5%) |
| Bottled, Tank, or LP Gas | 2,249 (19.5%) | 128 (4.3%) |
| Electricity | 2,506 (21.7%) | 1,156 (39.0%) |
| Fuel Oil or Kerosene | 8 (0.1%) | 10 (0.3%) |
| Coal or Coke | 0 (0.0%) | 0 (0.0%) |
| All other Fuels | 365 (3.2%) | 7 (0.2%) |
| No Fuel Used | 98 (0.9%) | 16 (0.5%) |
| Total | 11,530 (100.0%) | 2,963 (100.0%) |
Household Vehicle Usage in Clinton County
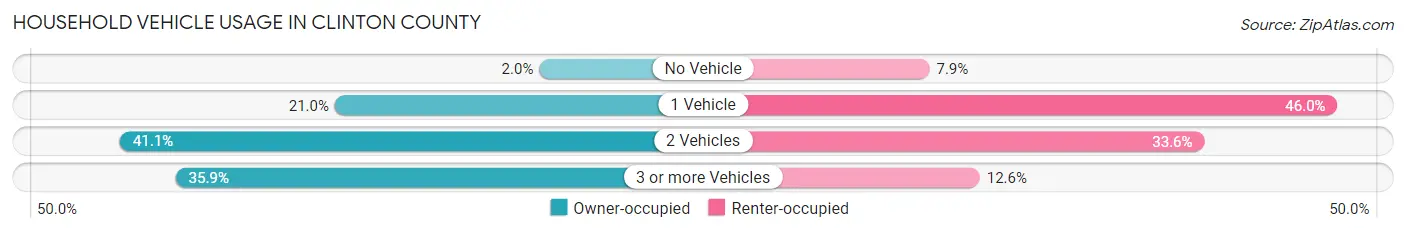
| Vehicles per Household | Owner-occupied | Renter-occupied |
| No Vehicle | 226 (2.0%) | 234 (7.9%) |
| 1 Vehicle | 2,426 (21.0%) | 1,362 (46.0%) |
| 2 Vehicles | 4,739 (41.1%) | 994 (33.6%) |
| 3 or more Vehicles | 4,139 (35.9%) | 373 (12.6%) |
| Total | 11,530 (100.0%) | 2,963 (100.0%) |
Real Estate & Mortgages in Clinton County
Real Estate and Mortgage Overview in Clinton County
| Characteristic | Without Mortgage | With Mortgage |
| Housing Units | 5,038 | 6,492 |
| Median Property Value | $154,100 | $183,700 |
| Median Household Income | $70,290 | $1,573 |
| Monthly Housing Costs | $587 | $251 |
| Real Estate Taxes | $2,994 | $154 |
Property Value by Mortgage Status in Clinton County
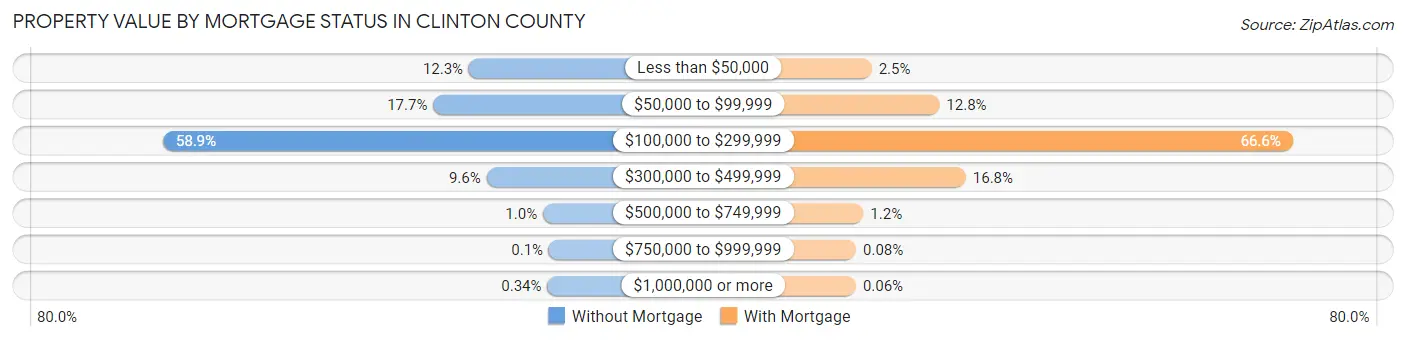
| Property Value | Without Mortgage | With Mortgage |
| Less than $50,000 | 619 (12.3%) | 160 (2.5%) |
| $50,000 to $99,999 | 893 (17.7%) | 830 (12.8%) |
| $100,000 to $299,999 | 2,969 (58.9%) | 4,324 (66.6%) |
| $300,000 to $499,999 | 484 (9.6%) | 1,091 (16.8%) |
| $500,000 to $749,999 | 51 (1.0%) | 78 (1.2%) |
| $750,000 to $999,999 | 5 (0.1%) | 5 (0.1%) |
| $1,000,000 or more | 17 (0.3%) | 4 (0.1%) |
| Total | 5,038 (100.0%) | 6,492 (100.0%) |
Household Income by Mortgage Status in Clinton County
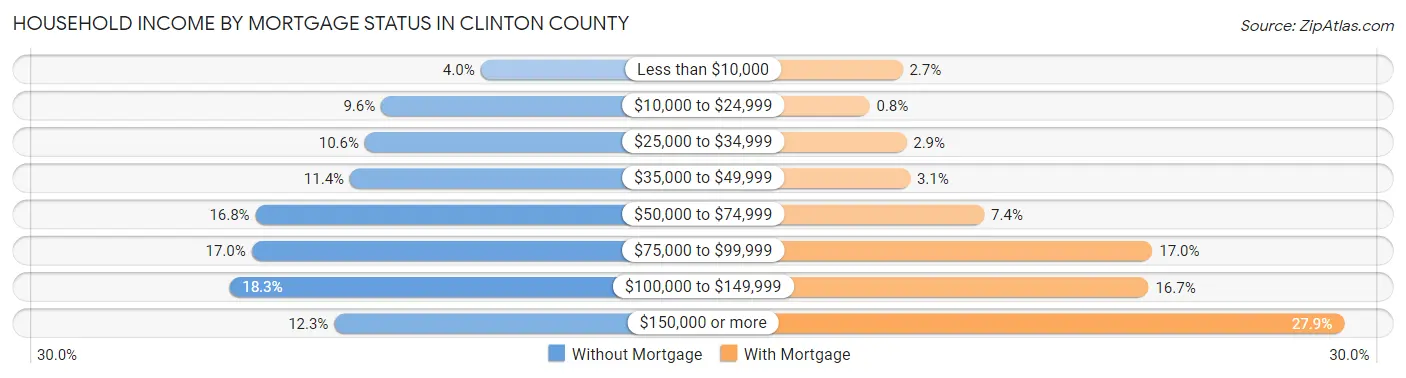
| Household Income | Without Mortgage | With Mortgage |
| Less than $10,000 | 199 (4.0%) | 174 (2.7%) |
| $10,000 to $24,999 | 485 (9.6%) | 52 (0.8%) |
| $25,000 to $34,999 | 532 (10.6%) | 188 (2.9%) |
| $35,000 to $49,999 | 575 (11.4%) | 202 (3.1%) |
| $50,000 to $74,999 | 847 (16.8%) | 477 (7.3%) |
| $75,000 to $99,999 | 858 (17.0%) | 1,101 (17.0%) |
| $100,000 to $149,999 | 922 (18.3%) | 1,087 (16.7%) |
| $150,000 or more | 620 (12.3%) | 1,812 (27.9%) |
| Total | 5,038 (100.0%) | 6,492 (100.0%) |
Property Value to Household Income Ratio in Clinton County
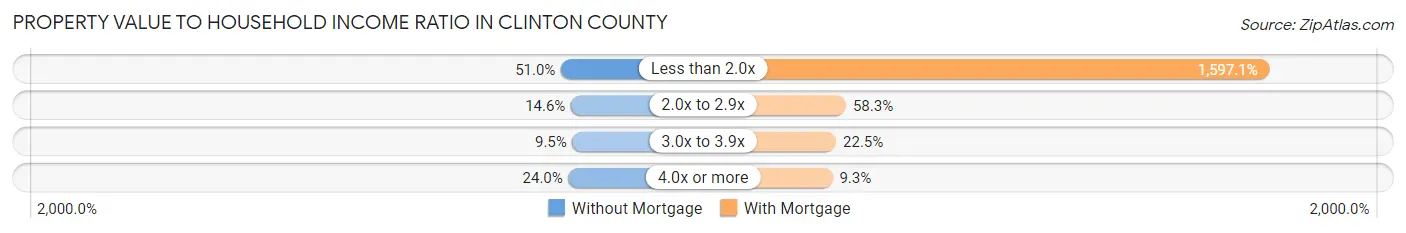
| Value-to-Income Ratio | Without Mortgage | With Mortgage |
| Less than 2.0x | 2,567 (50.9%) | 103,685 (1,597.1%) |
| 2.0x to 2.9x | 734 (14.6%) | 3,782 (58.3%) |
| 3.0x to 3.9x | 480 (9.5%) | 1,462 (22.5%) |
| 4.0x or more | 1,207 (24.0%) | 606 (9.3%) |
| Total | 5,038 (100.0%) | 6,492 (100.0%) |
Real Estate Taxes by Mortgage Status in Clinton County
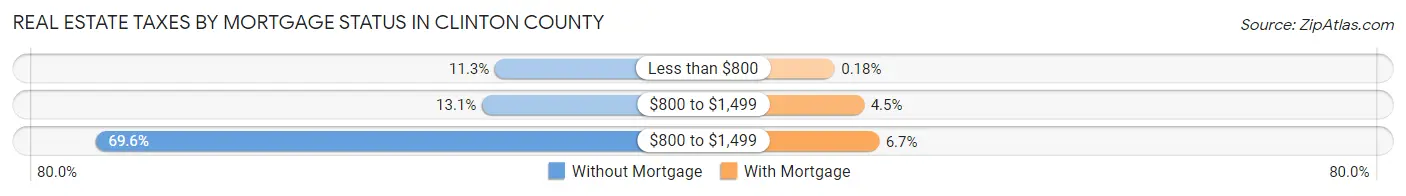
| Property Taxes | Without Mortgage | With Mortgage |
| Less than $800 | 567 (11.3%) | 12 (0.2%) |
| $800 to $1,499 | 662 (13.1%) | 291 (4.5%) |
| $800 to $1,499 | 3,508 (69.6%) | 433 (6.7%) |
| Total | 5,038 (100.0%) | 6,492 (100.0%) |
Health & Disability in Clinton County
Health Insurance Coverage by Age in Clinton County
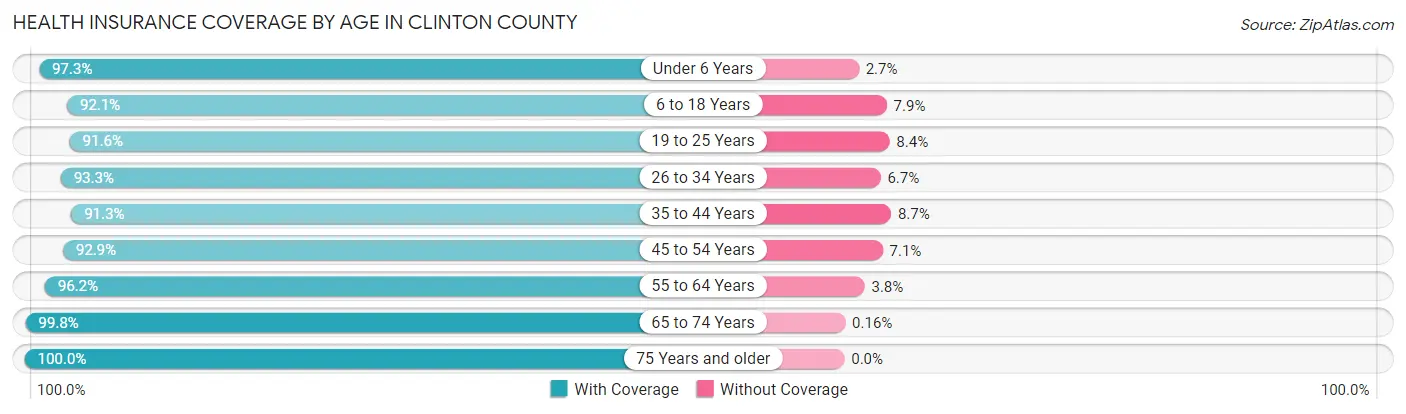
| Age Bracket | With Coverage | Without Coverage |
| Under 6 Years | 2,572 (97.3%) | 71 (2.7%) |
| 6 to 18 Years | 5,293 (92.1%) | 454 (7.9%) |
| 19 to 25 Years | 2,342 (91.6%) | 215 (8.4%) |
| 26 to 34 Years | 3,612 (93.3%) | 261 (6.7%) |
| 35 to 44 Years | 3,986 (91.3%) | 380 (8.7%) |
| 45 to 54 Years | 4,069 (92.9%) | 313 (7.1%) |
| 55 to 64 Years | 5,147 (96.2%) | 202 (3.8%) |
| 65 to 74 Years | 3,668 (99.8%) | 6 (0.2%) |
| 75 Years and older | 2,567 (100.0%) | 0 (0.0%) |
| Total | 33,256 (94.6%) | 1,902 (5.4%) |
Health Insurance Coverage by Citizenship Status in Clinton County
| Citizenship Status | With Coverage | Without Coverage |
| Native Born | 2,572 (97.3%) | 71 (2.7%) |
| Foreign Born, Citizen | 5,293 (92.1%) | 454 (7.9%) |
| Foreign Born, not a Citizen | 2,342 (91.6%) | 215 (8.4%) |
Health Insurance Coverage by Household Income in Clinton County
| Household Income | With Coverage | Without Coverage |
| Under $25,000 | 2,322 (93.1%) | 173 (6.9%) |
| $25,000 to $49,999 | 4,494 (89.6%) | 522 (10.4%) |
| $50,000 to $74,999 | 5,454 (92.6%) | 434 (7.4%) |
| $75,000 to $99,999 | 5,164 (96.5%) | 187 (3.5%) |
| $100,000 and over | 15,614 (96.4%) | 581 (3.6%) |
Public vs Private Health Insurance Coverage by Age in Clinton County
| Age Bracket | Public Insurance | Private Insurance |
| Under 6 | 653 (24.7%) | 2,060 (77.9%) |
| 6 to 18 Years | 1,428 (24.8%) | 4,140 (72.0%) |
| 19 to 25 Years | 308 (12.0%) | 2,102 (82.2%) |
| 25 to 34 Years | 623 (16.1%) | 3,174 (82.0%) |
| 35 to 44 Years | 744 (17.0%) | 3,410 (78.1%) |
| 45 to 54 Years | 422 (9.6%) | 3,788 (86.4%) |
| 55 to 64 Years | 945 (17.7%) | 4,497 (84.1%) |
| 65 to 74 Years | 3,521 (95.8%) | 2,463 (67.0%) |
| 75 Years and over | 2,548 (99.3%) | 1,785 (69.5%) |
| Total | 11,192 (31.8%) | 27,419 (78.0%) |
Disability Status by Sex by Age in Clinton County
| Age Bracket | Male | Female |
| Under 5 Years | 39 (3.4%) | 3 (0.3%) |
| 5 to 17 Years | 206 (6.9%) | 93 (3.3%) |
| 18 to 34 Years | 280 (7.7%) | 246 (7.5%) |
| 35 to 64 Years | 908 (12.8%) | 1,080 (15.4%) |
| 65 to 74 Years | 569 (31.7%) | 355 (18.9%) |
| 75 Years and over | 560 (50.7%) | 776 (53.1%) |
Disability Class by Sex by Age in Clinton County
Disability Class: Hearing Difficulty
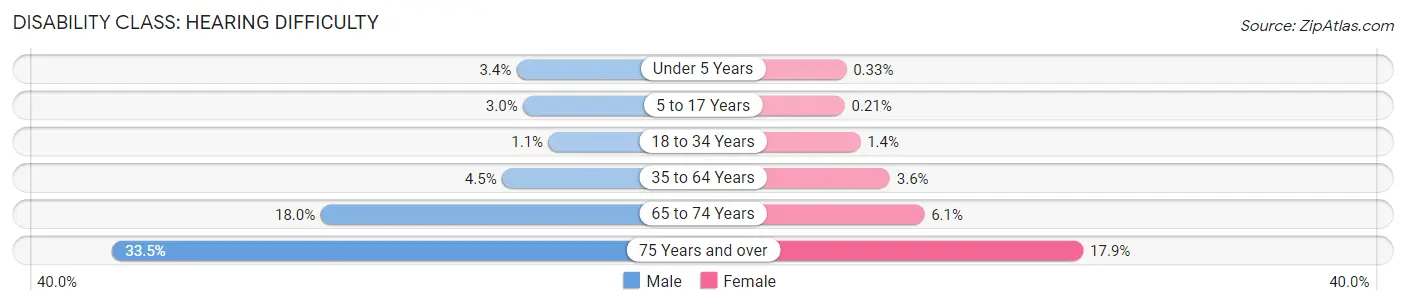
| Age Bracket | Male | Female |
| Under 5 Years | 39 (3.4%) | 3 (0.3%) |
| 5 to 17 Years | 88 (3.0%) | 6 (0.2%) |
| 18 to 34 Years | 39 (1.1%) | 45 (1.4%) |
| 35 to 64 Years | 320 (4.5%) | 251 (3.6%) |
| 65 to 74 Years | 323 (18.0%) | 115 (6.1%) |
| 75 Years and over | 370 (33.5%) | 262 (17.9%) |
Disability Class: Vision Difficulty
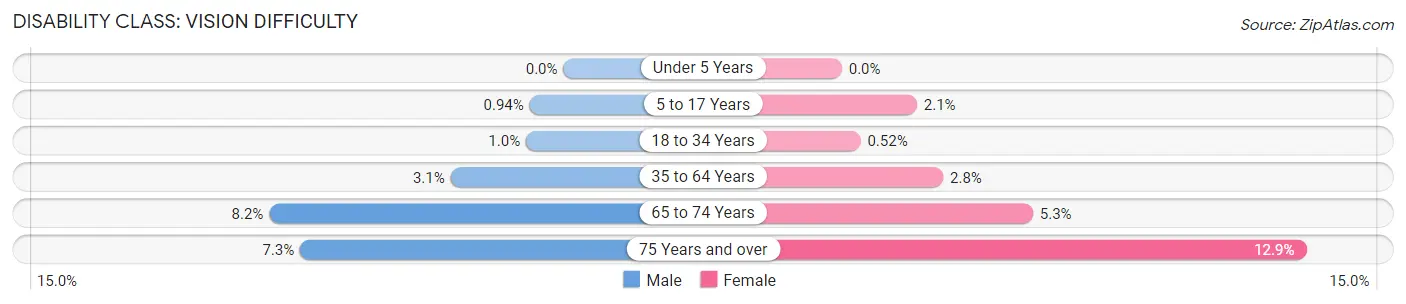
| Age Bracket | Male | Female |
| Under 5 Years | 0 (0.0%) | 0 (0.0%) |
| 5 to 17 Years | 28 (0.9%) | 60 (2.1%) |
| 18 to 34 Years | 38 (1.0%) | 17 (0.5%) |
| 35 to 64 Years | 222 (3.1%) | 198 (2.8%) |
| 65 to 74 Years | 147 (8.2%) | 100 (5.3%) |
| 75 Years and over | 81 (7.3%) | 189 (12.9%) |
Disability Class: Cognitive Difficulty
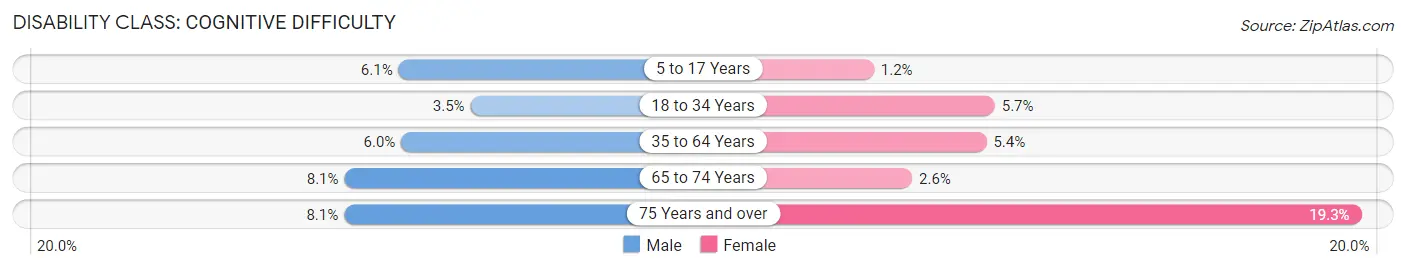
| Age Bracket | Male | Female |
| 5 to 17 Years | 182 (6.1%) | 34 (1.2%) |
| 18 to 34 Years | 126 (3.5%) | 186 (5.7%) |
| 35 to 64 Years | 426 (6.0%) | 377 (5.4%) |
| 65 to 74 Years | 146 (8.1%) | 49 (2.6%) |
| 75 Years and over | 90 (8.1%) | 282 (19.3%) |
Disability Class: Ambulatory Difficulty
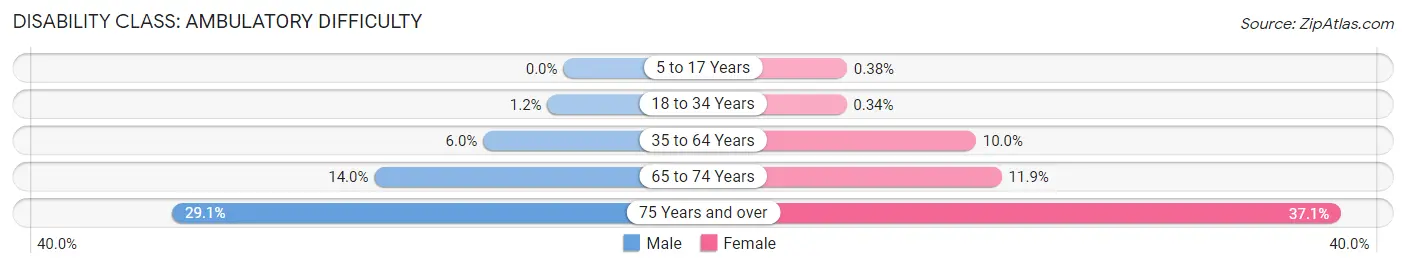
| Age Bracket | Male | Female |
| 5 to 17 Years | 0 (0.0%) | 11 (0.4%) |
| 18 to 34 Years | 43 (1.2%) | 11 (0.3%) |
| 35 to 64 Years | 421 (5.9%) | 699 (10.0%) |
| 65 to 74 Years | 252 (14.0%) | 223 (11.9%) |
| 75 Years and over | 321 (29.0%) | 542 (37.1%) |
Disability Class: Self-Care Difficulty
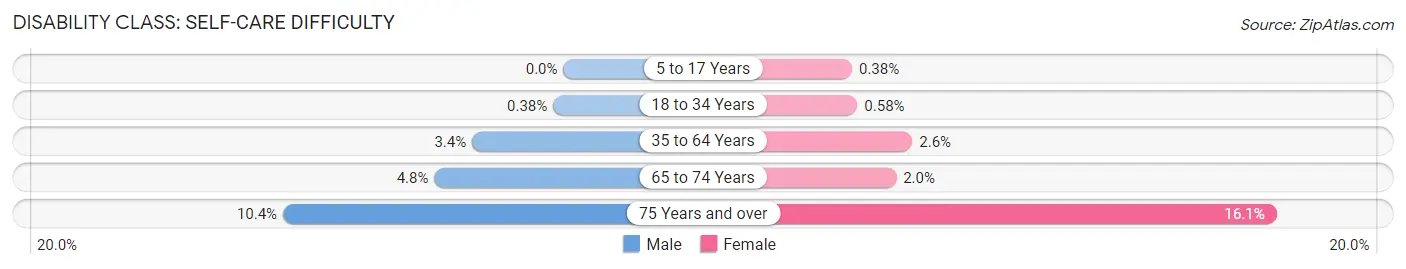
| Age Bracket | Male | Female |
| 5 to 17 Years | 0 (0.0%) | 11 (0.4%) |
| 18 to 34 Years | 14 (0.4%) | 19 (0.6%) |
| 35 to 64 Years | 240 (3.4%) | 184 (2.6%) |
| 65 to 74 Years | 86 (4.8%) | 38 (2.0%) |
| 75 Years and over | 115 (10.4%) | 236 (16.1%) |
Technology Access in Clinton County
Computing Device Access in Clinton County

| Device Type | # Households | % Households |
| Desktop or Laptop | 10,984 | 75.8% |
| Smartphone | 12,203 | 84.2% |
| Tablet | 8,667 | 59.8% |
| No Computing Device | 1,245 | 8.6% |
| Total | 14,493 | 100.0% |
Internet Access in Clinton County
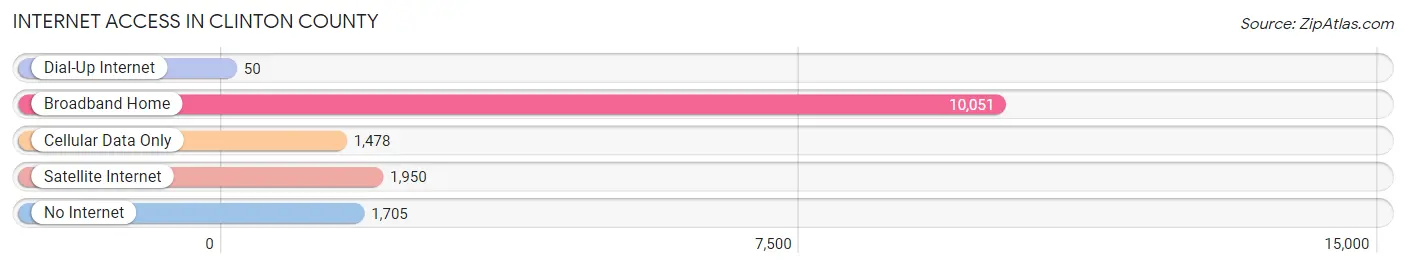
| Internet Type | # Households | % Households |
| Dial-Up Internet | 50 | 0.3% |
| Broadband Home | 10,051 | 69.4% |
| Cellular Data Only | 1,478 | 10.2% |
| Satellite Internet | 1,950 | 13.5% |
| No Internet | 1,705 | 11.8% |
| Total | 14,493 | 100.0% |
Clinton County Summary
County History
Clinton County, Illinois is located in the southwestern part of the state and is part of the St. Louis Metropolitan Statistical Area. The county was established in 1824 and was named after DeWitt Clinton, the former governor of New York. The county was originally part of Bond County, but was split off in 1824. The county seat is Carlyle, which was established in 1817.
The first settlers in the area were French traders and trappers, who were followed by German immigrants in the early 1800s. The county was largely agricultural, with the main crops being corn, wheat, and oats. The county also had a thriving timber industry, with the majority of the timber being used for railroad ties and other construction materials.
The county was also home to several small towns, including Breese, Aviston, and New Baden. These towns were largely agricultural, but also had some industry, such as brickyards and sawmills.
The county was also home to several Civil War battles, including the Battle of Vandalia and the Battle of Carlyle. The county was also home to several Civil War veterans, including General Ulysses S. Grant, who was born in the county.
Geography
Clinton County is located in the southwestern part of the state and is bordered by Bond County to the north, Madison County to the east, St. Clair County to the south, and Washington County to the west. The county covers an area of 545 square miles and has a population of 37,890 as of the 2010 census.
The county is largely rural, with the majority of the land being used for agricultural purposes. The terrain is mostly flat, with some rolling hills in the northern part of the county. The Kaskaskia River runs through the county, and there are several small lakes and ponds scattered throughout the area.
Economy
The economy of Clinton County is largely based on agriculture, with the main crops being corn, wheat, and oats. The county also has a thriving timber industry, with the majority of the timber being used for railroad ties and other construction materials.
The county is also home to several small businesses, including manufacturing, retail, and service industries. The county is also home to several large employers, including the Carlyle Lake Dam, which is the largest employer in the county.
Demographics
As of the 2010 census, the population of Clinton County was 37,890. The racial makeup of the county was 95.3% White, 1.2% African American, 0.3% Native American, 0.5% Asian, 0.1% Pacific Islander, 1.3% from other races, and 1.3% from two or more races. Hispanic or Latino of any race were 3.2% of the population.
The median income for a household in the county was $45,945, and the median income for a family was $54,945. The per capita income for the county was $21,945. About 8.3% of families and 11.2% of the population were below the poverty line, including 15.2% of those under age 18 and 8.2% of those age 65 or over.
Common Questions
What is Per Capita Income in Clinton County?
Per Capita income in Clinton County is $39,409.
What is the Median Family Income in Clinton County?
Median Family Income in Clinton County is $96,875.
What is the Median Household income in Clinton County?
Median Household Income in Clinton County is $78,054.
What is Income or Wage Gap in Clinton County?
Income or Wage Gap in Clinton County is 29.7%.
Women in Clinton County earn 70.3 cents for every dollar earned by a man.
What is Family Income Deficit in Clinton County?
Family Income Deficit in Clinton County is $12,355.
Families that are below poverty line in Clinton County earn $12,355 less on average than the poverty threshold level.
What is Inequality or Gini Index in Clinton County?
Inequality or Gini Index in Clinton County is 0.43.
What is the Total Population of Clinton County?
Total Population of Clinton County is 36,998.
What is the Total Male Population of Clinton County?
Total Male Population of Clinton County is 19,318.
What is the Total Female Population of Clinton County?
Total Female Population of Clinton County is 17,680.
What is the Ratio of Males per 100 Females in Clinton County?
There are 109.26 Males per 100 Females in Clinton County.
What is the Ratio of Females per 100 Males in Clinton County?
There are 91.52 Females per 100 Males in Clinton County.
What is the Median Population Age in Clinton County?
Median Population Age in Clinton County is 41.0 Years.
What is the Average Family Size in Clinton County
Average Family Size in Clinton County is 3.0 People.
What is the Average Household Size in Clinton County
Average Household Size in Clinton County is 2.4 People.
How Large is the Labor Force in Clinton County?
There are 18,965 People in the Labor Forcein in Clinton County.
What is the Percentage of People in the Labor Force in Clinton County?
62.9% of People are in the Labor Force in Clinton County.
What is the Unemployment Rate in Clinton County?
Unemployment Rate in Clinton County is 3.0%.