Clay County, IL Map & Demographics
Clay County Map
Clay County Overview
$32,495
PER CAPITA INCOME
$70,687
AVG FAMILY INCOME
$58,028
AVG HOUSEHOLD INCOME
35.2%
WAGE / INCOME GAP [ % ]
64.8¢/ $1
WAGE / INCOME GAP [ $ ]
$10,130
FAMILY INCOME DEFICIT
0.45
INEQUALITY / GINI INDEX
13,248
TOTAL POPULATION
6,650
MALE POPULATION
6,598
FEMALE POPULATION
100.79
MALES / 100 FEMALES
99.22
FEMALES / 100 MALES
41.8
MEDIAN AGE
3.0
AVG FAMILY SIZE
2.4
AVG HOUSEHOLD SIZE
6,164
LABOR FORCE [ PEOPLE ]
58.0%
PERCENT IN LABOR FORCE
6.0%
UNEMPLOYMENT RATE
Clay County Area Codes
Income in Clay County
Income Overview in Clay County
Per Capita Income in Clay County is $32,495, while median incomes of families and households are $70,687 and $58,028 respectively.
| Characteristic | Number | Measure |
| Per Capita Income | 13,248 | $32,495 |
| Median Family Income | 3,293 | $70,687 |
| Mean Family Income | 3,293 | $94,551 |
| Median Household Income | 5,477 | $58,028 |
| Mean Household Income | 5,477 | $76,897 |
| Income Deficit | 3,293 | $10,130 |
| Wage / Income Gap (%) | 13,248 | 35.23% |
| Wage / Income Gap ($) | 13,248 | 64.77¢ per $1 |
| Gini / Inequality Index | 13,248 | 0.45 |
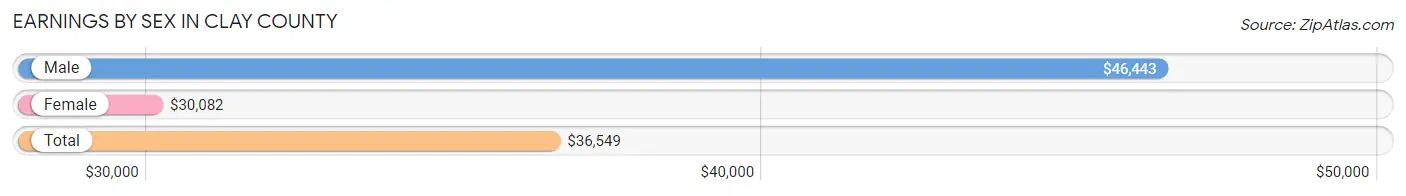
Earnings by Sex in Clay County
Average Earnings in Clay County are $36,549, $46,443 for men and $30,082 for women, a difference of 35.2%.
| Sex | Number | Average Earnings |
| Male | 3,317 (52.1%) | $46,443 |
| Female | 3,043 (47.8%) | $30,082 |
| Total | 6,360 (100.0%) | $36,549 |
Earnings by Sex by Income Bracket in Clay County
The most common earnings brackets in Clay County are $75,000 to $99,999 for men (438 | 13.2%) and $25,000 to $29,999 for women (343 | 11.3%).
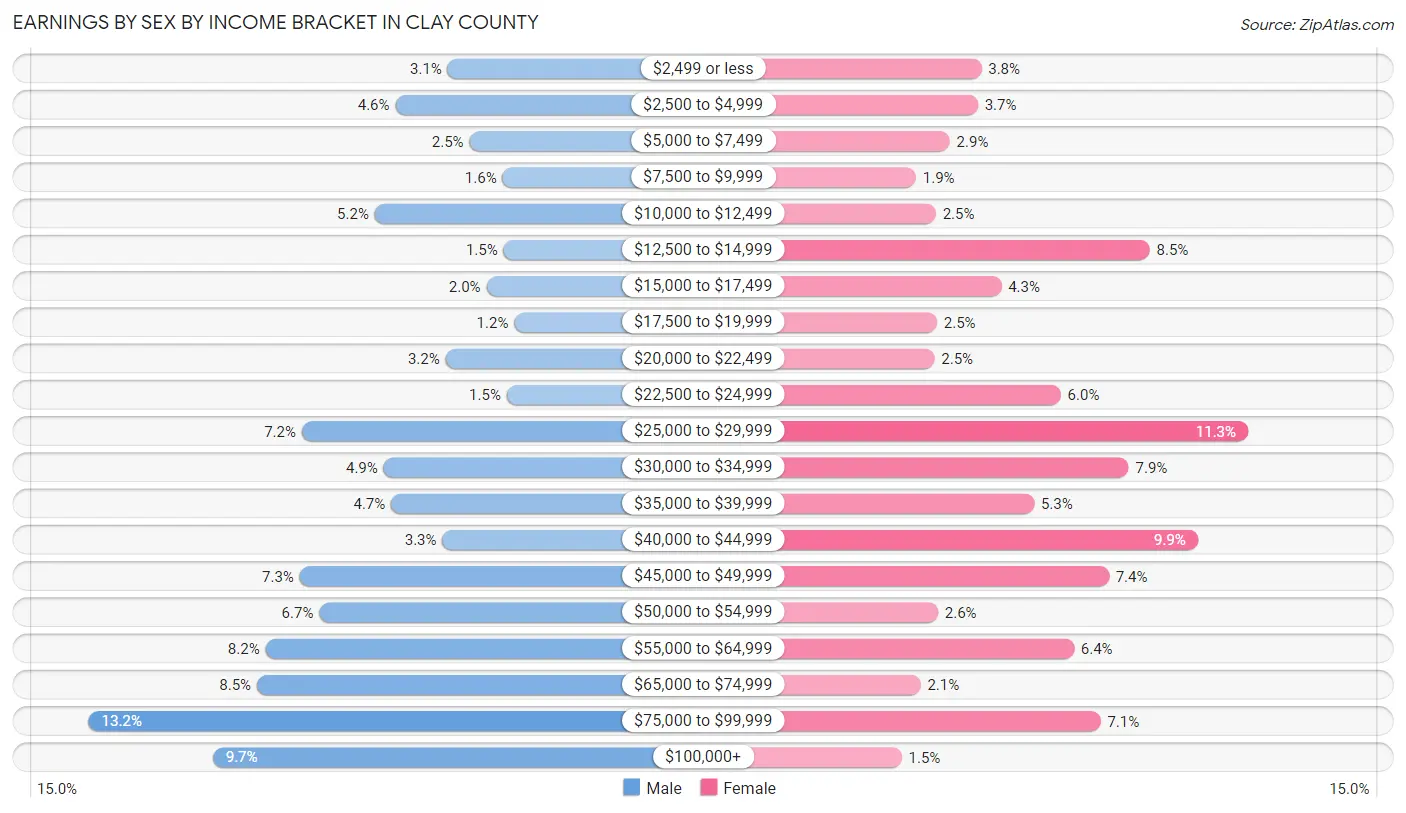
| Income | Male | Female |
| $2,499 or less | 103 (3.1%) | 115 (3.8%) |
| $2,500 to $4,999 | 152 (4.6%) | 112 (3.7%) |
| $5,000 to $7,499 | 83 (2.5%) | 88 (2.9%) |
| $7,500 to $9,999 | 52 (1.6%) | 59 (1.9%) |
| $10,000 to $12,499 | 171 (5.2%) | 76 (2.5%) |
| $12,500 to $14,999 | 51 (1.5%) | 259 (8.5%) |
| $15,000 to $17,499 | 67 (2.0%) | 132 (4.3%) |
| $17,500 to $19,999 | 41 (1.2%) | 77 (2.5%) |
| $20,000 to $22,499 | 105 (3.2%) | 75 (2.5%) |
| $22,500 to $24,999 | 48 (1.5%) | 183 (6.0%) |
| $25,000 to $29,999 | 239 (7.2%) | 343 (11.3%) |
| $30,000 to $34,999 | 163 (4.9%) | 241 (7.9%) |
| $35,000 to $39,999 | 156 (4.7%) | 160 (5.3%) |
| $40,000 to $44,999 | 108 (3.3%) | 300 (9.9%) |
| $45,000 to $49,999 | 241 (7.3%) | 224 (7.4%) |
| $50,000 to $54,999 | 223 (6.7%) | 78 (2.6%) |
| $55,000 to $64,999 | 273 (8.2%) | 194 (6.4%) |
| $65,000 to $74,999 | 281 (8.5%) | 63 (2.1%) |
| $75,000 to $99,999 | 438 (13.2%) | 217 (7.1%) |
| $100,000+ | 322 (9.7%) | 47 (1.5%) |
| Total | 3,317 (100.0%) | 3,043 (100.0%) |
Earnings by Sex by Educational Attainment in Clay County
Average earnings in Clay County are $51,317 for men and $33,522 for women, a difference of 34.7%. Men with an educational attainment of graduate degree enjoy the highest average annual earnings of $82,168, while those with less than high school education earn the least with $32,766. Women with an educational attainment of graduate degree earn the most with the average annual earnings of $71,164, while those with less than high school education have the smallest earnings of $14,200.
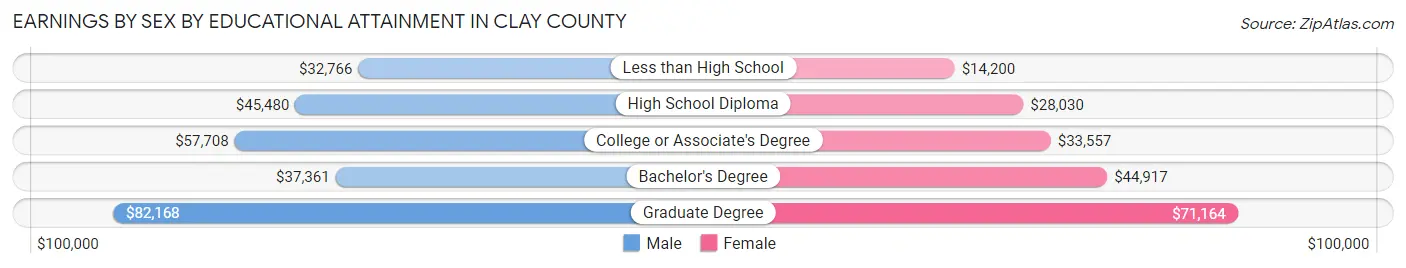
| Educational Attainment | Male Income | Female Income |
| Less than High School | $32,766 | $14,200 |
| High School Diploma | $45,480 | $28,030 |
| College or Associate's Degree | $57,708 | $33,557 |
| Bachelor's Degree | $37,361 | $44,917 |
| Graduate Degree | $82,168 | $71,164 |
| Total | $51,317 | $33,522 |
Family Income in Clay County
Family Income Brackets in Clay County
According to the Clay County family income data, there are 659 families falling into the $50,000 to $74,999 income range, which is the most common income bracket and makes up 20.0% of all families. Conversely, the $10,000 to $14,999 income bracket is the least frequent group with only 82 families (2.5%) belonging to this category.
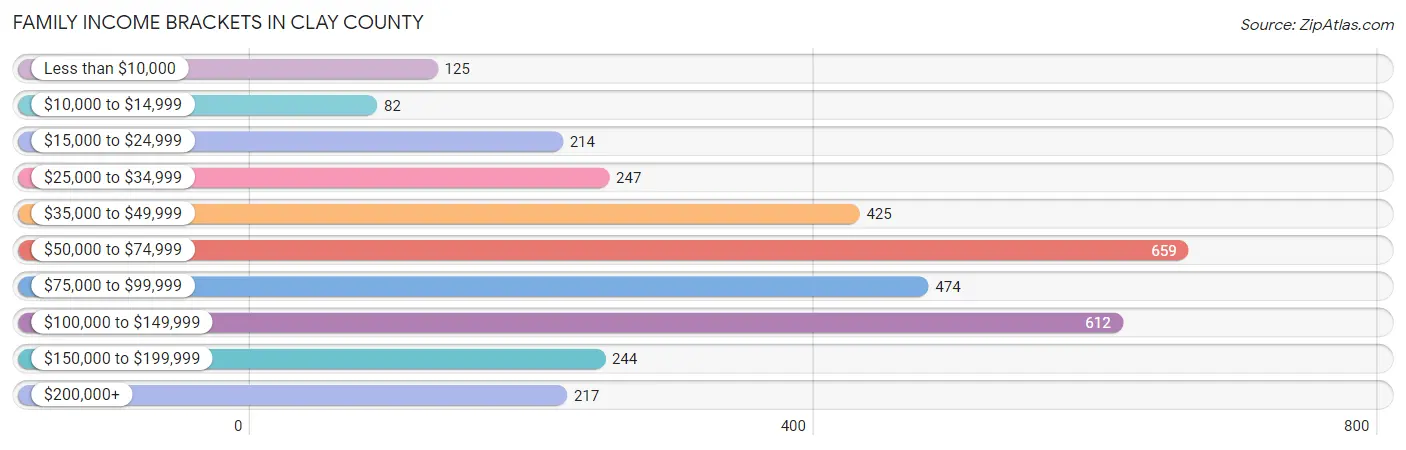
| Income Bracket | # Families | % Families |
| Less than $10,000 | 125 | 3.8% |
| $10,000 to $14,999 | 82 | 2.5% |
| $15,000 to $24,999 | 214 | 6.5% |
| $25,000 to $34,999 | 247 | 7.5% |
| $35,000 to $49,999 | 425 | 12.9% |
| $50,000 to $74,999 | 659 | 20.0% |
| $75,000 to $99,999 | 474 | 14.4% |
| $100,000 to $149,999 | 612 | 18.6% |
| $150,000 to $199,999 | 244 | 7.4% |
| $200,000+ | 217 | 6.6% |
Family Income by Famaliy Size in Clay County
4-person families (573 | 17.4%) account for the highest median family income in Clay County with $142,917 per family, while 4-person families (573 | 17.4%) have the highest median income of $35,729 per family member.
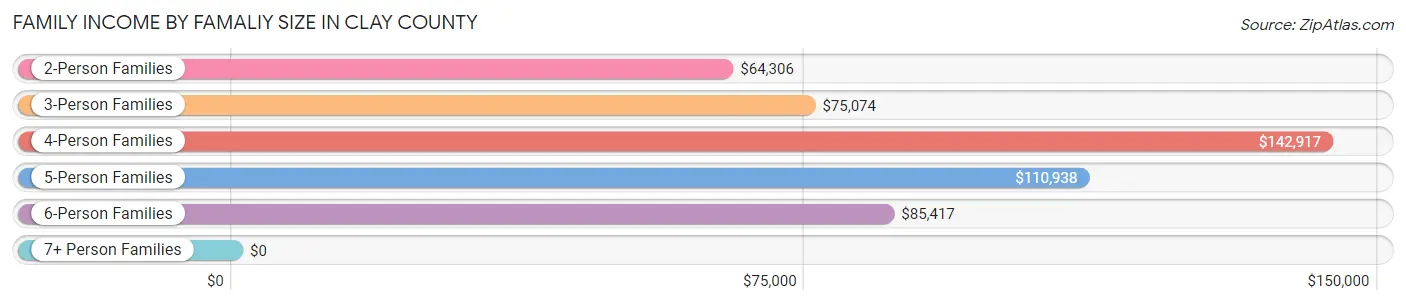
| Income Bracket | # Families | Median Income |
| 2-Person Families | 1,832 (55.6%) | $64,306 |
| 3-Person Families | 581 (17.6%) | $75,074 |
| 4-Person Families | 573 (17.4%) | $142,917 |
| 5-Person Families | 277 (8.4%) | $110,938 |
| 6-Person Families | 19 (0.6%) | $85,417 |
| 7+ Person Families | 11 (0.3%) | $0 |
| Total | 3,293 (100.0%) | $70,687 |
Family Income by Number of Earners in Clay County
The median family income in Clay County is $70,687, with families comprising 3+ earners (328) having the highest median family income of $134,583, while families with 1 earner (1,052) have the lowest median family income of $42,833, accounting for 10.0% and 32.0% of families, respectively.
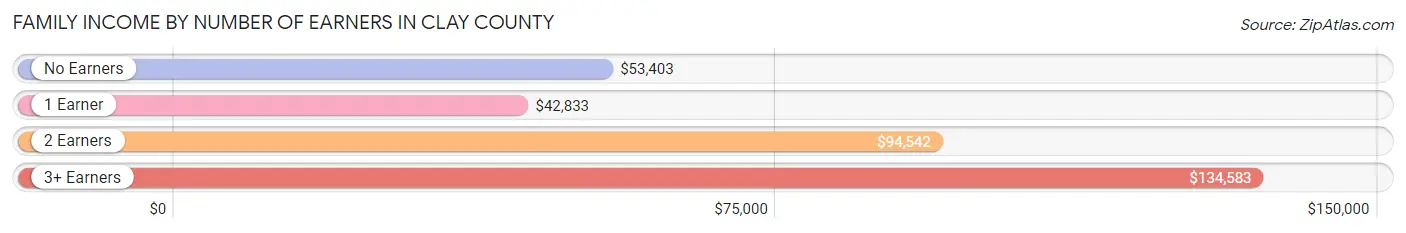
| Number of Earners | # Families | Median Income |
| No Earners | 728 (22.1%) | $53,403 |
| 1 Earner | 1,052 (32.0%) | $42,833 |
| 2 Earners | 1,185 (36.0%) | $94,542 |
| 3+ Earners | 328 (10.0%) | $134,583 |
| Total | 3,293 (100.0%) | $70,687 |
Household Income in Clay County
Household Income Brackets in Clay County
With 1,134 households falling in the category, the $50,000 to $74,999 income range is the most frequent in Clay County, accounting for 20.7% of all households. In contrast, only 214 households (3.9%) fall into the less than $10,000 income bracket, making it the least populous group.
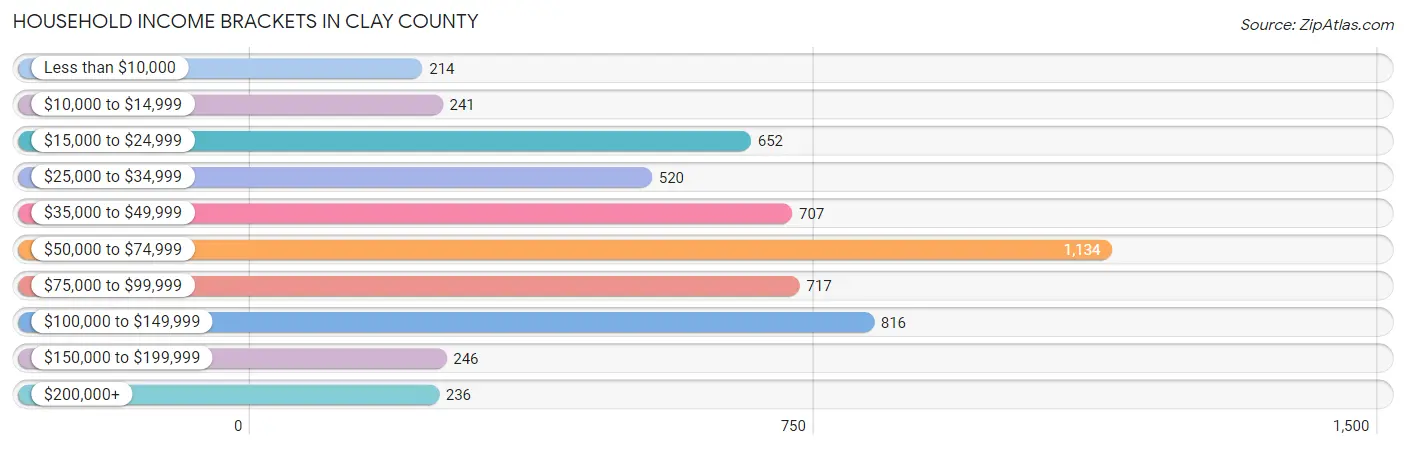
| Income Bracket | # Households | % Households |
| Less than $10,000 | 214 | 3.9% |
| $10,000 to $14,999 | 241 | 4.4% |
| $15,000 to $24,999 | 652 | 11.9% |
| $25,000 to $34,999 | 520 | 9.5% |
| $35,000 to $49,999 | 707 | 12.9% |
| $50,000 to $74,999 | 1,134 | 20.7% |
| $75,000 to $99,999 | 717 | 13.1% |
| $100,000 to $149,999 | 816 | 14.9% |
| $150,000 to $199,999 | 246 | 4.5% |
| $200,000+ | 236 | 4.3% |
Household Income by Householder Age in Clay County
The median household income in Clay County is $58,028, with the highest median household income of $81,875 found in the 45 to 64 years age bracket for the primary householder. A total of 1,785 households (32.6%) fall into this category. Meanwhile, the 65+ years age bracket for the primary householder has the lowest median household income of $41,976, with 1,879 households (34.3%) in this group.
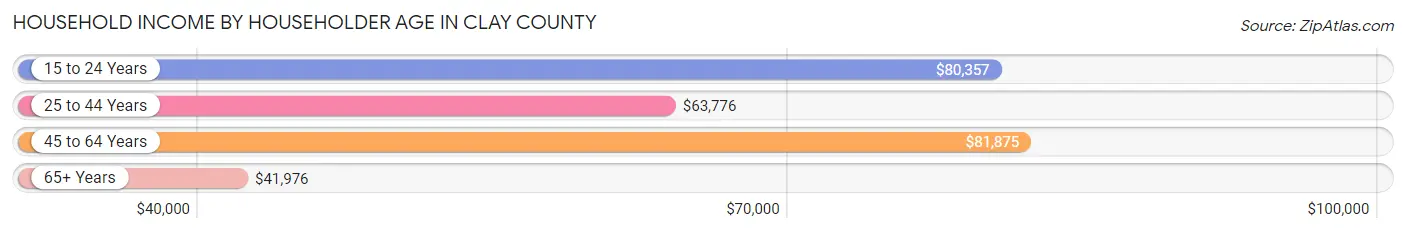
| Income Bracket | # Households | Median Income |
| 15 to 24 Years | 154 (2.8%) | $80,357 |
| 25 to 44 Years | 1,659 (30.3%) | $63,776 |
| 45 to 64 Years | 1,785 (32.6%) | $81,875 |
| 65+ Years | 1,879 (34.3%) | $41,976 |
| Total | 5,477 (100.0%) | $58,028 |
Poverty in Clay County
Income Below Poverty by Sex and Age in Clay County
With 15.4% poverty level for males and 16.1% for females among the residents of Clay County, 15 year old males and 35 to 44 year old females are the most vulnerable to poverty, with 21 males (31.8%) and 268 females (35.1%) in their respective age groups living below the poverty level.
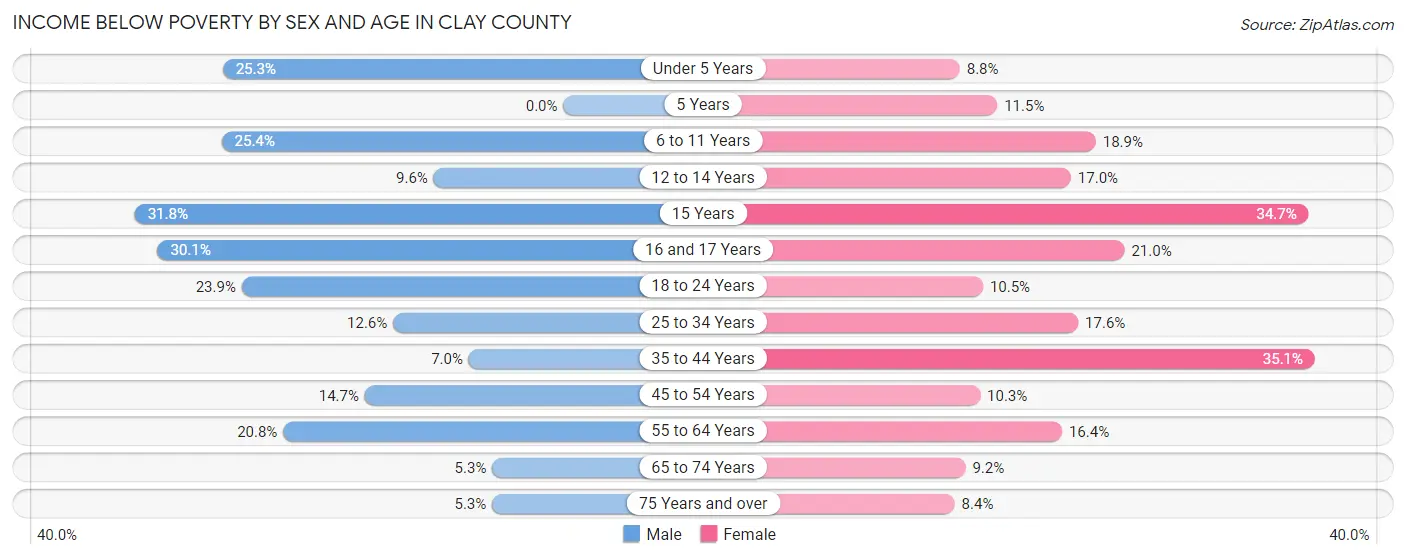
| Age Bracket | Male | Female |
| Under 5 Years | 88 (25.3%) | 29 (8.8%) |
| 5 Years | 0 (0.0%) | 6 (11.5%) |
| 6 to 11 Years | 155 (25.4%) | 86 (18.9%) |
| 12 to 14 Years | 21 (9.6%) | 58 (17.0%) |
| 15 Years | 21 (31.8%) | 35 (34.6%) |
| 16 and 17 Years | 72 (30.1%) | 34 (21.0%) |
| 18 to 24 Years | 112 (23.9%) | 52 (10.5%) |
| 25 to 34 Years | 100 (12.6%) | 129 (17.5%) |
| 35 to 44 Years | 54 (7.0%) | 268 (35.1%) |
| 45 to 54 Years | 120 (14.7%) | 75 (10.3%) |
| 55 to 64 Years | 198 (20.8%) | 146 (16.4%) |
| 65 to 74 Years | 41 (5.3%) | 68 (9.2%) |
| 75 Years and over | 23 (5.3%) | 57 (8.4%) |
| Total | 1,005 (15.4%) | 1,043 (16.1%) |
Income Above Poverty by Sex and Age in Clay County
According to the poverty statistics in Clay County, males aged 5 years and females aged 75 years and over are the age groups that are most secure financially, with 100.0% of males and 91.6% of females in these age groups living above the poverty line.
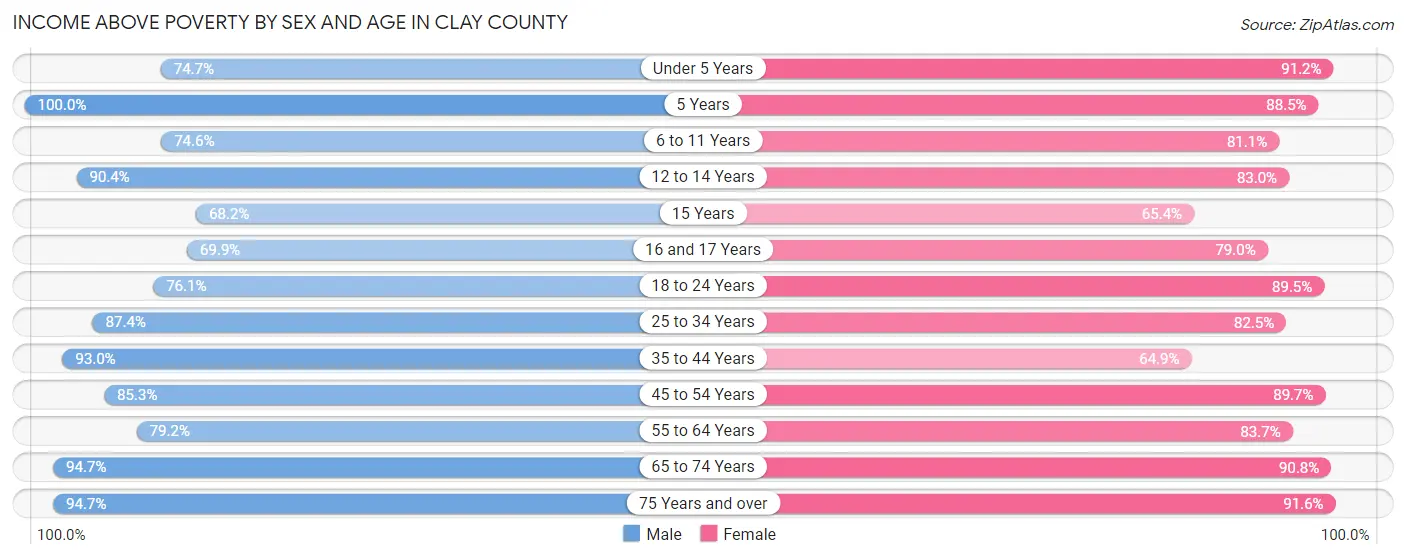
| Age Bracket | Male | Female |
| Under 5 Years | 260 (74.7%) | 302 (91.2%) |
| 5 Years | 34 (100.0%) | 46 (88.5%) |
| 6 to 11 Years | 456 (74.6%) | 370 (81.1%) |
| 12 to 14 Years | 197 (90.4%) | 283 (83.0%) |
| 15 Years | 45 (68.2%) | 66 (65.3%) |
| 16 and 17 Years | 167 (69.9%) | 128 (79.0%) |
| 18 to 24 Years | 357 (76.1%) | 444 (89.5%) |
| 25 to 34 Years | 691 (87.4%) | 606 (82.5%) |
| 35 to 44 Years | 715 (93.0%) | 495 (64.9%) |
| 45 to 54 Years | 694 (85.3%) | 655 (89.7%) |
| 55 to 64 Years | 754 (79.2%) | 747 (83.7%) |
| 65 to 74 Years | 736 (94.7%) | 673 (90.8%) |
| 75 Years and over | 412 (94.7%) | 623 (91.6%) |
| Total | 5,518 (84.6%) | 5,438 (83.9%) |
Income Below Poverty Among Married-Couple Families in Clay County
The poverty statistics for married-couple families in Clay County show that 3.5% or 86 of the total 2,490 families live below the poverty line. Families with 5 or more children have the highest poverty rate of 90.9%, comprising of 10 families. On the other hand, families with 1 or 2 children have the lowest poverty rate of 1.5%, which includes 10 families.
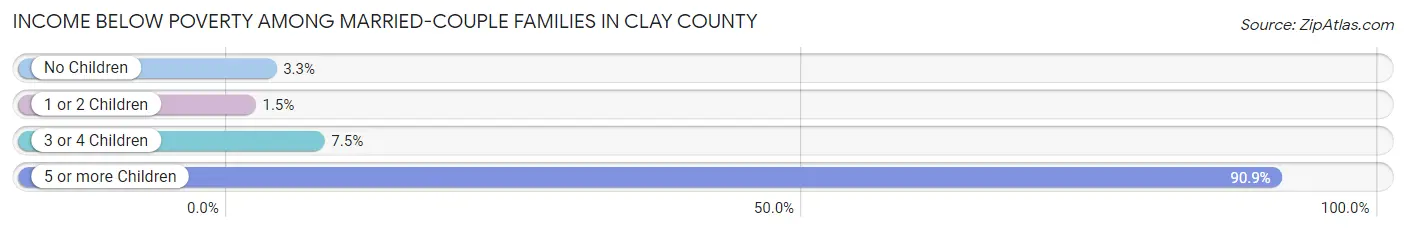
| Children | Above Poverty | Below Poverty |
| No Children | 1,630 (96.7%) | 56 (3.3%) |
| 1 or 2 Children | 650 (98.5%) | 10 (1.5%) |
| 3 or 4 Children | 123 (92.5%) | 10 (7.5%) |
| 5 or more Children | 1 (9.1%) | 10 (90.9%) |
| Total | 2,404 (96.6%) | 86 (3.5%) |
Income Below Poverty Among Single-Parent Households in Clay County
According to the poverty data in Clay County, 21.2% or 76 single-father households and 38.3% or 170 single-mother households are living below the poverty line. Among single-father households, those with 3 or 4 children have the highest poverty rate, with 10 households (40.0%) experiencing poverty. Likewise, among single-mother households, those with 3 or 4 children have the highest poverty rate, with 44 households (52.4%) falling below the poverty line.
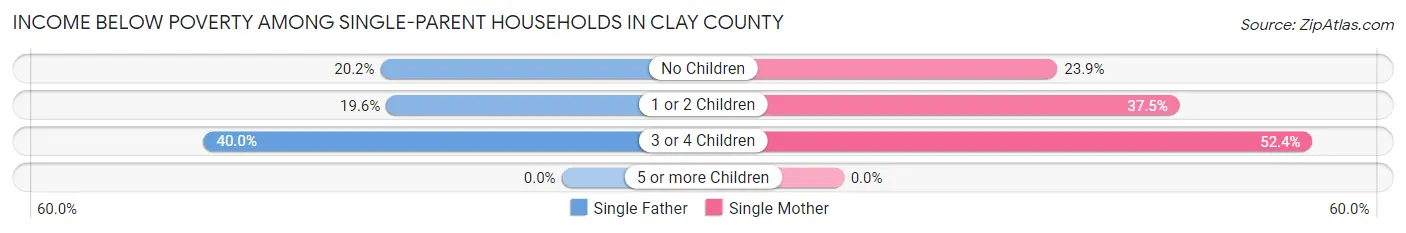
| Children | Single Father | Single Mother |
| No Children | 17 (20.2%) | 16 (23.9%) |
| 1 or 2 Children | 49 (19.6%) | 110 (37.5%) |
| 3 or 4 Children | 10 (40.0%) | 44 (52.4%) |
| 5 or more Children | 0 (0.0%) | 0 (0.0%) |
| Total | 76 (21.2%) | 170 (38.3%) |
Income Below Poverty Among Married-Couple vs Single-Parent Households in Clay County
The poverty data for Clay County shows that 86 of the married-couple family households (3.5%) and 246 of the single-parent households (30.6%) are living below the poverty level. Within the married-couple family households, those with 5 or more children have the highest poverty rate, with 10 households (90.9%) falling below the poverty line. Among the single-parent households, those with 3 or 4 children have the highest poverty rate, with 54 household (49.5%) living below poverty.
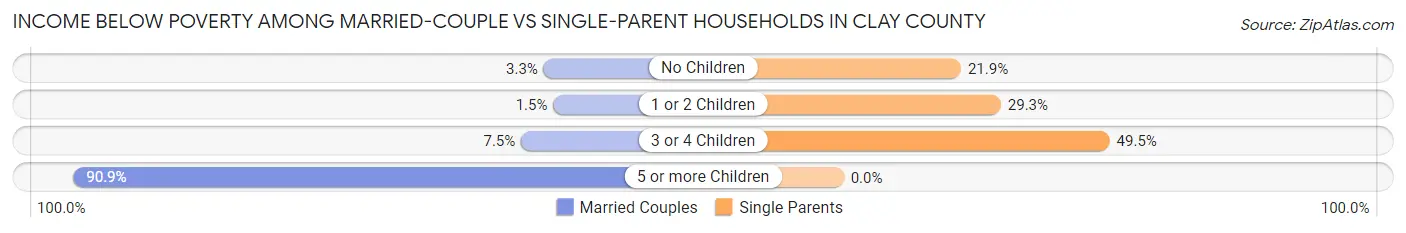
| Children | Married-Couple Families | Single-Parent Households |
| No Children | 56 (3.3%) | 33 (21.8%) |
| 1 or 2 Children | 10 (1.5%) | 159 (29.3%) |
| 3 or 4 Children | 10 (7.5%) | 54 (49.5%) |
| 5 or more Children | 10 (90.9%) | 0 (0.0%) |
| Total | 86 (3.5%) | 246 (30.6%) |
Race in Clay County
The most populous races in Clay County are White / Caucasian (12,648 | 95.5%), Two or more Races (394 | 3.0%), and Native / Alaskan (73 | 0.5%).
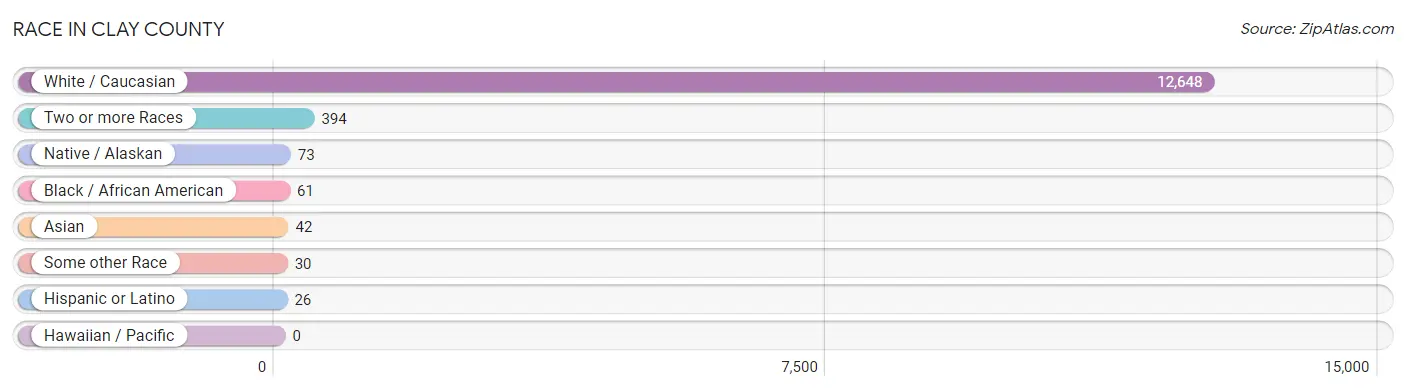
| Race | # Population | % Population |
| Asian | 42 | 0.3% |
| Black / African American | 61 | 0.5% |
| Hawaiian / Pacific | 0 | 0.0% |
| Hispanic or Latino | 26 | 0.2% |
| Native / Alaskan | 73 | 0.5% |
| White / Caucasian | 12,648 | 95.5% |
| Two or more Races | 394 | 3.0% |
| Some other Race | 30 | 0.2% |
| Total | 13,248 | 100.0% |
Ancestry in Clay County
The most populous ancestries reported in Clay County are German (3,053 | 23.0%), Irish (1,468 | 11.1%), American (1,428 | 10.8%), English (1,003 | 7.6%), and Polish (347 | 2.6%), together accounting for 55.1% of all Clay County residents.
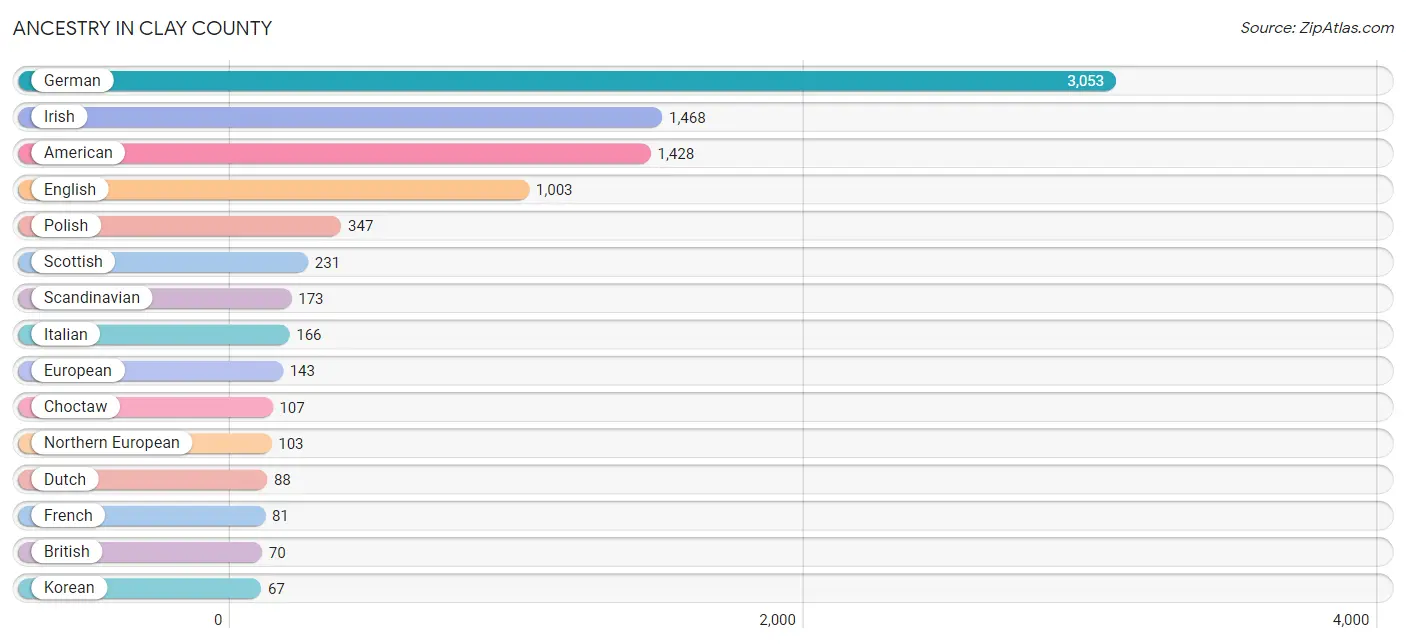
| Ancestry | # Population | % Population |
| American | 1,428 | 10.8% |
| Belgian | 13 | 0.1% |
| Blackfeet | 41 | 0.3% |
| British | 70 | 0.5% |
| Canadian | 3 | 0.0% |
| Celtic | 8 | 0.1% |
| Cherokee | 46 | 0.4% |
| Cheyenne | 4 | 0.0% |
| Choctaw | 107 | 0.8% |
| Comanche | 40 | 0.3% |
| Czech | 13 | 0.1% |
| Czechoslovakian | 7 | 0.1% |
| Danish | 28 | 0.2% |
| Dutch | 88 | 0.7% |
| Eastern European | 3 | 0.0% |
| English | 1,003 | 7.6% |
| European | 143 | 1.1% |
| Filipino | 6 | 0.1% |
| French | 81 | 0.6% |
| German | 3,053 | 23.0% |
| Greek | 5 | 0.0% |
| Hungarian | 7 | 0.1% |
| Irish | 1,468 | 11.1% |
| Italian | 166 | 1.3% |
| Korean | 67 | 0.5% |
| Mexican | 14 | 0.1% |
| Northern European | 103 | 0.8% |
| Norwegian | 67 | 0.5% |
| Pennsylvania German | 3 | 0.0% |
| Polish | 347 | 2.6% |
| Puerto Rican | 12 | 0.1% |
| Russian | 2 | 0.0% |
| Scandinavian | 173 | 1.3% |
| Scotch-Irish | 65 | 0.5% |
| Scottish | 231 | 1.7% |
| Sioux | 18 | 0.1% |
| Slovak | 6 | 0.1% |
| Sri Lankan | 19 | 0.1% |
| Swedish | 40 | 0.3% |
| Swiss | 9 | 0.1% |
| Welsh | 37 | 0.3% | View All 41 Rows |
Immigrants in Clay County
The most numerous immigrant groups reported in Clay County came from Asia (28 | 0.2%), Europe (25 | 0.2%), Germany (25 | 0.2%), Western Europe (25 | 0.2%), and South Eastern Asia (20 | 0.2%), together accounting for 0.9% of all Clay County residents.
| Immigration Origin | # Population | % Population |
| Africa | 1 | 0.0% |
| Asia | 28 | 0.2% |
| Central America | 3 | 0.0% |
| China | 6 | 0.1% |
| Congo | 1 | 0.0% |
| Eastern Asia | 6 | 0.1% |
| Europe | 25 | 0.2% |
| Germany | 25 | 0.2% |
| Latin America | 3 | 0.0% |
| Mexico | 3 | 0.0% |
| Middle Africa | 1 | 0.0% |
| Philippines | 1 | 0.0% |
| South Central Asia | 2 | 0.0% |
| South Eastern Asia | 20 | 0.2% |
| Sri Lanka | 2 | 0.0% |
| Taiwan | 6 | 0.1% |
| Vietnam | 19 | 0.1% |
| Western Europe | 25 | 0.2% | View All 18 Rows |
Sex and Age in Clay County
Sex and Age in Clay County
The most populous age groups in Clay County are 5 to 9 Years (533 | 8.0%) for men and 10 to 14 Years (539 | 8.2%) for women.
| Age Bracket | Male | Female |
| Under 5 Years | 383 (5.8%) | 344 (5.2%) |
| 5 to 9 Years | 533 (8.0%) | 322 (4.9%) |
| 10 to 14 Years | 333 (5.0%) | 539 (8.2%) |
| 15 to 19 Years | 435 (6.5%) | 420 (6.4%) |
| 20 to 24 Years | 340 (5.1%) | 345 (5.2%) |
| 25 to 29 Years | 437 (6.6%) | 368 (5.6%) |
| 30 to 34 Years | 365 (5.5%) | 367 (5.6%) |
| 35 to 39 Years | 329 (5.0%) | 380 (5.8%) |
| 40 to 44 Years | 450 (6.8%) | 383 (5.8%) |
| 45 to 49 Years | 383 (5.8%) | 354 (5.4%) |
| 50 to 54 Years | 451 (6.8%) | 376 (5.7%) |
| 55 to 59 Years | 456 (6.9%) | 508 (7.7%) |
| 60 to 64 Years | 508 (7.6%) | 412 (6.2%) |
| 65 to 69 Years | 481 (7.2%) | 436 (6.6%) |
| 70 to 74 Years | 320 (4.8%) | 341 (5.2%) |
| 75 to 79 Years | 159 (2.4%) | 219 (3.3%) |
| 80 to 84 Years | 104 (1.6%) | 213 (3.2%) |
| 85 Years and over | 183 (2.8%) | 271 (4.1%) |
| Total | 6,650 (100.0%) | 6,598 (100.0%) |
Families and Households in Clay County
Median Family Size in Clay County
The median family size in Clay County is 2.95 persons per family, with married-couple families (2,490 | 75.6%) accounting for the largest median family size of 2.97 persons per family. On the other hand, single male/father families (359 | 10.9%) represent the smallest median family size with 2.81 persons per family.
| Family Type | # Families | Family Size |
| Married-Couple | 2,490 (75.6%) | 2.97 |
| Single Male/Father | 359 (10.9%) | 2.81 |
| Single Female/Mother | 444 (13.5%) | 2.96 |
| Total Families | 3,293 (100.0%) | 2.95 |
Median Household Size in Clay County
The median household size in Clay County is 2.36 persons per household, with single male/father households (359 | 6.6%) accounting for the largest median household size of 3.46 persons per household. non-family households (2,184 | 39.9%) represent the smallest median household size with 1.25 persons per household.
| Household Type | # Households | Household Size |
| Married-Couple | 2,490 (45.5%) | 2.99 |
| Single Male/Father | 359 (6.6%) | 3.46 |
| Single Female/Mother | 444 (8.1%) | 3.38 |
| Non-family | 2,184 (39.9%) | 1.25 |
| Total Households | 5,477 (100.0%) | 2.36 |
Household Size by Marriage Status in Clay County
Out of a total of 5,477 households in Clay County, 3,293 (60.1%) are family households, while 2,184 (39.9%) are nonfamily households. The most numerous type of family households are 2-person households, comprising 1,597, and the most common type of nonfamily households are 1-person households, comprising 1,814.
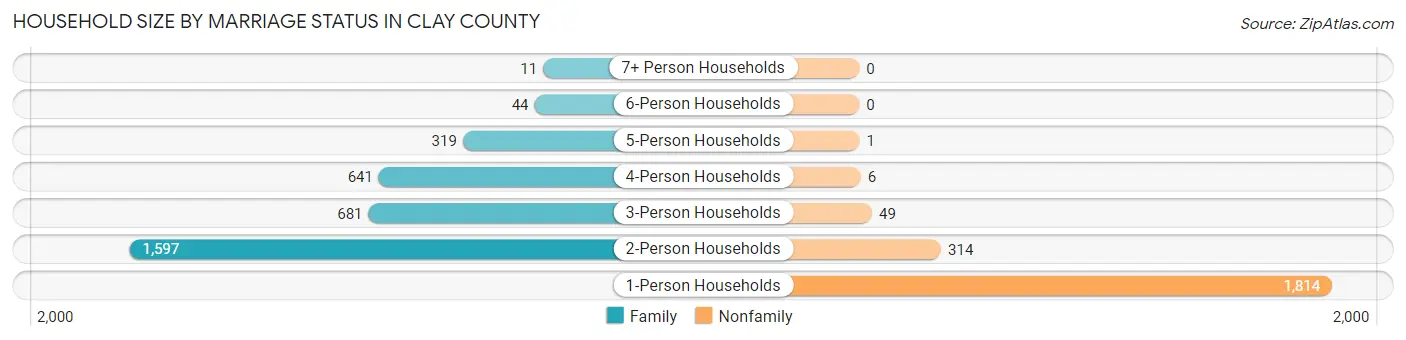
| Household Size | Family Households | Nonfamily Households |
| 1-Person Households | - | 1,814 (33.1%) |
| 2-Person Households | 1,597 (29.2%) | 314 (5.7%) |
| 3-Person Households | 681 (12.4%) | 49 (0.9%) |
| 4-Person Households | 641 (11.7%) | 6 (0.1%) |
| 5-Person Households | 319 (5.8%) | 1 (0.0%) |
| 6-Person Households | 44 (0.8%) | 0 (0.0%) |
| 7+ Person Households | 11 (0.2%) | 0 (0.0%) |
| Total | 3,293 (60.1%) | 2,184 (39.9%) |
Female Fertility in Clay County
Fertility by Age in Clay County
Average fertility rate in Clay County is 44.0 births per 1,000 women. Women in the age bracket of 20 to 34 years have the highest fertility rate with 97.0 births per 1,000 women. Women in the age bracket of 20 to 34 years acount for 88.2% of all women with births.
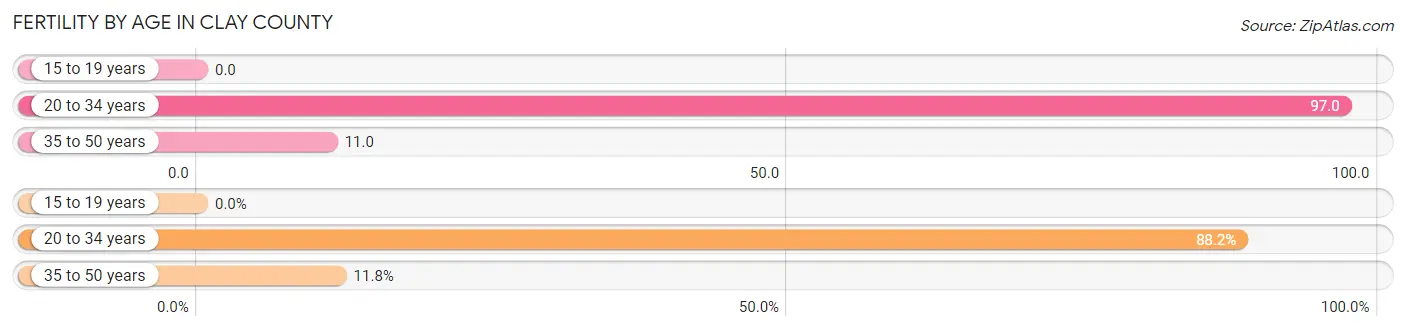
| Age Bracket | Women with Births | Births / 1,000 Women |
| 15 to 19 years | 0 (0.0%) | 0.0 |
| 20 to 34 years | 105 (88.2%) | 97.0 |
| 35 to 50 years | 14 (11.8%) | 11.0 |
| Total | 119 (100.0%) | 44.0 |
Fertility by Age by Marriage Status in Clay County
98.3% of women with births (119) in Clay County are married. The highest percentage of unmarried women with births falls into 20 to 34 years age bracket with 1.9% of them unmarried at the time of birth, while the lowest percentage of unmarried women with births belong to 35 to 50 years age bracket with 0.0% of them unmarried.
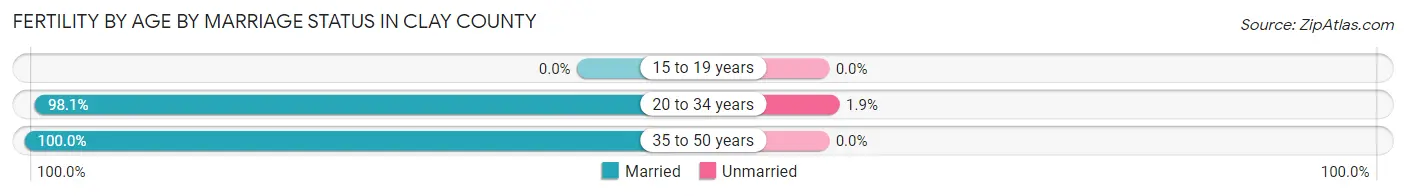
| Age Bracket | Married | Unmarried |
| 15 to 19 years | 0 (0.0%) | 0 (0.0%) |
| 20 to 34 years | 103 (98.1%) | 2 (1.9%) |
| 35 to 50 years | 14 (100.0%) | 0 (0.0%) |
| Total | 117 (98.3%) | 2 (1.7%) |
Fertility by Education in Clay County
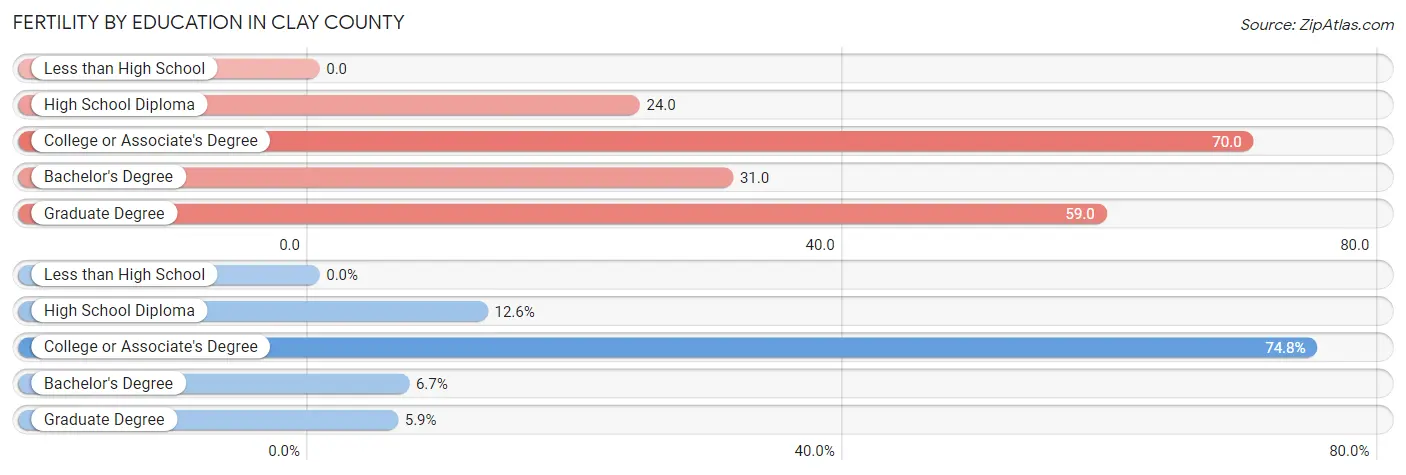
| Educational Attainment | Women with Births | Births / 1,000 Women |
| Less than High School | 0 (0.0%) | 0.0 |
| High School Diploma | 15 (12.6%) | 24.0 |
| College or Associate's Degree | 89 (74.8%) | 70.0 |
| Bachelor's Degree | 8 (6.7%) | 31.0 |
| Graduate Degree | 7 (5.9%) | 59.0 |
| Total | 119 (100.0%) | 44.0 |
Fertility by Education by Marriage Status in Clay County
1.7% of women with births in Clay County are unmarried. Women with the educational attainment of high school diploma are most likely to be married with 100.0% of them married at childbirth, while women with the educational attainment of college or associate's degree are least likely to be married with 2.2% of them unmarried at childbirth.
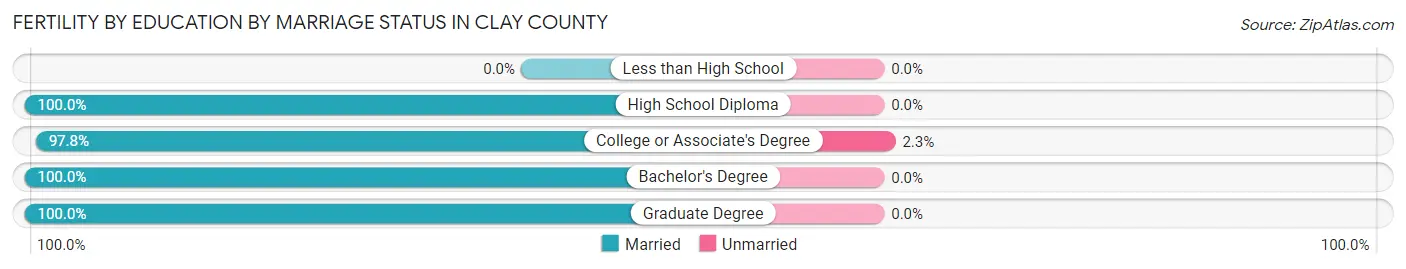
| Educational Attainment | Married | Unmarried |
| Less than High School | 0 (0.0%) | 0 (0.0%) |
| High School Diploma | 15 (100.0%) | 0 (0.0%) |
| College or Associate's Degree | 87 (97.8%) | 2 (2.2%) |
| Bachelor's Degree | 8 (100.0%) | 0 (0.0%) |
| Graduate Degree | 7 (100.0%) | 0 (0.0%) |
| Total | 117 (98.3%) | 2 (1.7%) |
Employment Characteristics in Clay County
Employment by Class of Employer in Clay County
Among the 5,711 employed individuals in Clay County, private company employees (3,844 | 67.3%), not-for-profit organizations (498 | 8.7%), and local government employees (465 | 8.1%) make up the most common classes of employment.
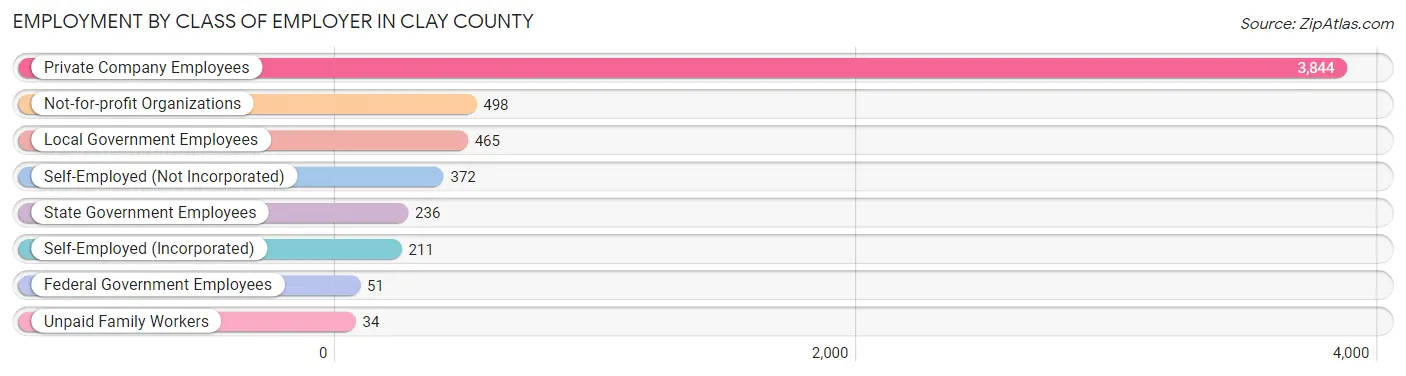
| Employer Class | # Employees | % Employees |
| Private Company Employees | 3,844 | 67.3% |
| Self-Employed (Incorporated) | 211 | 3.7% |
| Self-Employed (Not Incorporated) | 372 | 6.5% |
| Not-for-profit Organizations | 498 | 8.7% |
| Local Government Employees | 465 | 8.1% |
| State Government Employees | 236 | 4.1% |
| Federal Government Employees | 51 | 0.9% |
| Unpaid Family Workers | 34 | 0.6% |
| Total | 5,711 | 100.0% |
Employment Status by Age in Clay County
According to the labor force statistics for Clay County, out of the total population over 16 years of age (10,627), 58.0% or 6,164 individuals are in the labor force, with 6.0% or 370 of them unemployed. The age group with the highest labor force participation rate is 25 to 29 years, with 89.7% or 722 individuals in the labor force. Within the labor force, the 35 to 44 years age range has the highest percentage of unemployed individuals, with 10.0% or 126 of them being unemployed.
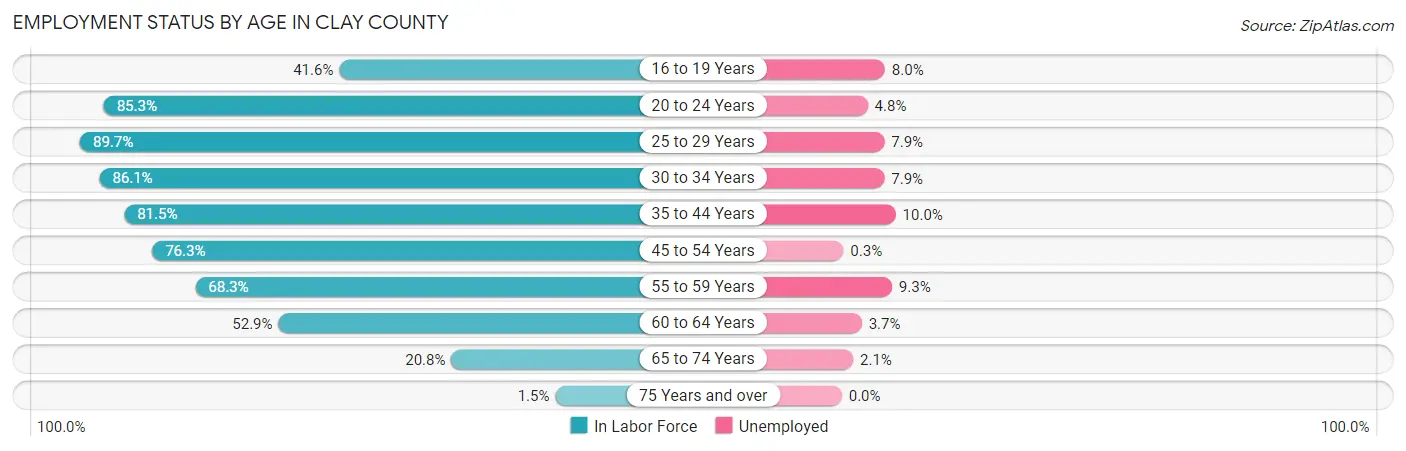
| Age Bracket | In Labor Force | Unemployed |
| 16 to 19 Years | 286 (41.6%) | 23 (8.0%) |
| 20 to 24 Years | 584 (85.3%) | 28 (4.8%) |
| 25 to 29 Years | 722 (89.7%) | 57 (7.9%) |
| 30 to 34 Years | 630 (86.1%) | 50 (7.9%) |
| 35 to 44 Years | 1,257 (81.5%) | 126 (10.0%) |
| 45 to 54 Years | 1,193 (76.3%) | 4 (0.3%) |
| 55 to 59 Years | 658 (68.3%) | 61 (9.3%) |
| 60 to 64 Years | 487 (52.9%) | 18 (3.7%) |
| 65 to 74 Years | 328 (20.8%) | 7 (2.1%) |
| 75 Years and over | 17 (1.5%) | 0 (0.0%) |
| Total | 6,164 (58.0%) | 370 (6.0%) |
Employment Status by Educational Attainment in Clay County
According to labor force statistics for Clay County, 75.8% of individuals (4,947) out of the total population between 25 and 64 years of age (6,527) are in the labor force, with 6.3% or 312 of them being unemployed. The group with the highest labor force participation rate are those with the educational attainment of bachelor's degree or higher, with 91.9% or 979 individuals in the labor force. Within the labor force, individuals with high school diploma education have the highest percentage of unemployment, with 10.1% or 166 of them being unemployed.
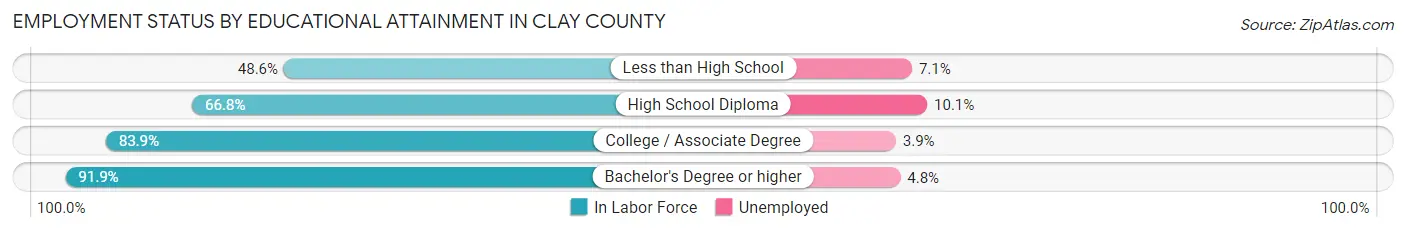
| Educational Attainment | In Labor Force | Unemployed |
| Less than High School | 268 (48.6%) | 39 (7.1%) |
| High School Diploma | 1,646 (66.8%) | 249 (10.1%) |
| College / Associate Degree | 2,052 (83.9%) | 95 (3.9%) |
| Bachelor's Degree or higher | 979 (91.9%) | 51 (4.8%) |
| Total | 4,947 (75.8%) | 411 (6.3%) |
Employment Occupations by Sex in Clay County
Management, Business, Science and Arts Occupations
The most common Management, Business, Science and Arts occupations in Clay County are Management (598 | 10.3%), Community & Social Service (518 | 8.9%), Education Instruction & Library (387 | 6.7%), Health Diagnosing & Treating (358 | 6.2%), and Health Technologists (272 | 4.7%).
Management, Business, Science and Arts Occupations by Sex
Within the Management, Business, Science and Arts occupations in Clay County, the most male-oriented occupations are Computers & Mathematics (100.0%), Life, Physical & Social Science (100.0%), and Computers, Engineering & Science (98.5%), while the most female-oriented occupations are Arts, Media & Entertainment (100.0%), Education Instruction & Library (96.1%), and Community & Social Service (87.3%).
| Occupation | Male | Female |
| Management | 336 (56.2%) | 262 (43.8%) |
| Business & Financial | 114 (50.0%) | 114 (50.0%) |
| Computers, Engineering & Science | 263 (98.5%) | 4 (1.5%) |
| Computers & Mathematics | 43 (100.0%) | 0 (0.0%) |
| Architecture & Engineering | 183 (97.9%) | 4 (2.1%) |
| Life, Physical & Social Science | 37 (100.0%) | 0 (0.0%) |
| Community & Social Service | 66 (12.7%) | 452 (87.3%) |
| Education, Arts & Media | 41 (42.3%) | 56 (57.7%) |
| Legal Services & Support | 10 (50.0%) | 10 (50.0%) |
| Education Instruction & Library | 15 (3.9%) | 372 (96.1%) |
| Arts, Media & Entertainment | 0 (0.0%) | 14 (100.0%) |
| Health Diagnosing & Treating | 163 (45.5%) | 195 (54.5%) |
| Health Technologists | 150 (55.1%) | 122 (44.9%) |
| Total (Category) | 942 (47.8%) | 1,027 (52.2%) |
| Total (Overall) | 2,984 (51.5%) | 2,805 (48.4%) |
Services Occupations
The most common Services occupations in Clay County are Healthcare Support (414 | 7.1%), Food Preparation & Serving (173 | 3.0%), Cleaning & Maintenance (169 | 2.9%), Personal Care & Service (88 | 1.5%), and Security & Protection (55 | 0.9%).
Services Occupations by Sex
Within the Services occupations in Clay County, the most male-oriented occupations are Firefighting & Prevention (100.0%), Security & Protection (96.4%), and Law Enforcement (95.4%), while the most female-oriented occupations are Healthcare Support (97.6%), Food Preparation & Serving (73.4%), and Personal Care & Service (69.3%).
| Occupation | Male | Female |
| Healthcare Support | 10 (2.4%) | 404 (97.6%) |
| Security & Protection | 53 (96.4%) | 2 (3.6%) |
| Firefighting & Prevention | 12 (100.0%) | 0 (0.0%) |
| Law Enforcement | 41 (95.4%) | 2 (4.6%) |
| Food Preparation & Serving | 46 (26.6%) | 127 (73.4%) |
| Cleaning & Maintenance | 81 (47.9%) | 88 (52.1%) |
| Personal Care & Service | 27 (30.7%) | 61 (69.3%) |
| Total (Category) | 217 (24.1%) | 682 (75.9%) |
| Total (Overall) | 2,984 (51.5%) | 2,805 (48.4%) |
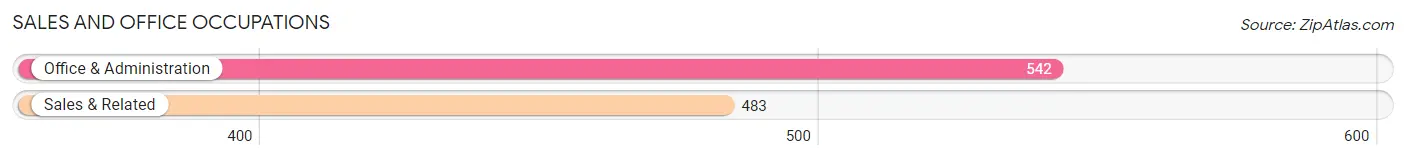
Sales and Office Occupations
The most common Sales and Office occupations in Clay County are Office & Administration (542 | 9.4%), and Sales & Related (483 | 8.3%).
Sales and Office Occupations by Sex
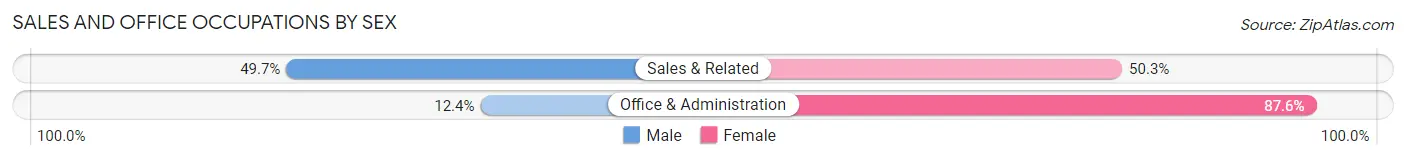
| Occupation | Male | Female |
| Sales & Related | 240 (49.7%) | 243 (50.3%) |
| Office & Administration | 67 (12.4%) | 475 (87.6%) |
| Total (Category) | 307 (29.9%) | 718 (70.1%) |
| Total (Overall) | 2,984 (51.5%) | 2,805 (48.4%) |
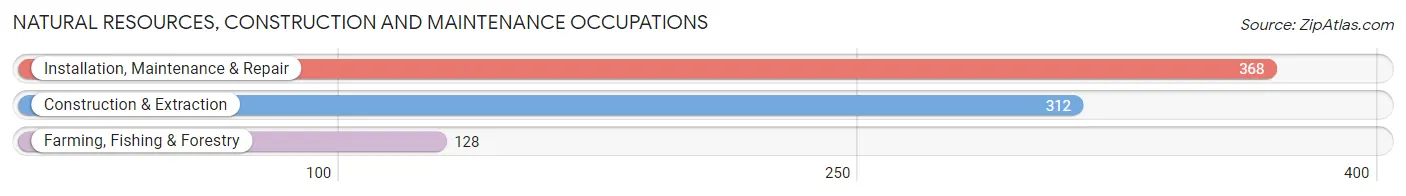
Natural Resources, Construction and Maintenance Occupations
The most common Natural Resources, Construction and Maintenance occupations in Clay County are Installation, Maintenance & Repair (368 | 6.4%), Construction & Extraction (312 | 5.4%), and Farming, Fishing & Forestry (128 | 2.2%).
Natural Resources, Construction and Maintenance Occupations by Sex
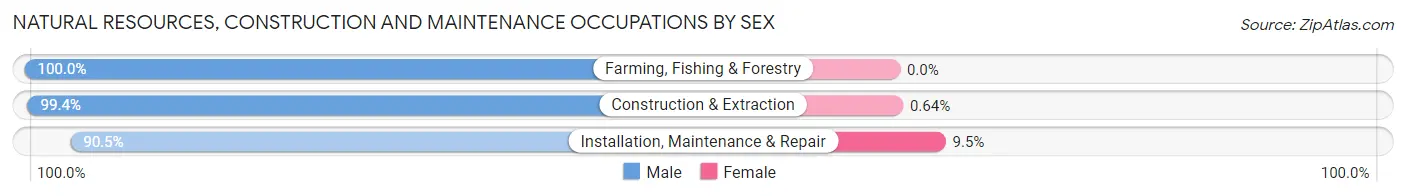
| Occupation | Male | Female |
| Farming, Fishing & Forestry | 128 (100.0%) | 0 (0.0%) |
| Construction & Extraction | 310 (99.4%) | 2 (0.6%) |
| Installation, Maintenance & Repair | 333 (90.5%) | 35 (9.5%) |
| Total (Category) | 771 (95.4%) | 37 (4.6%) |
| Total (Overall) | 2,984 (51.5%) | 2,805 (48.4%) |
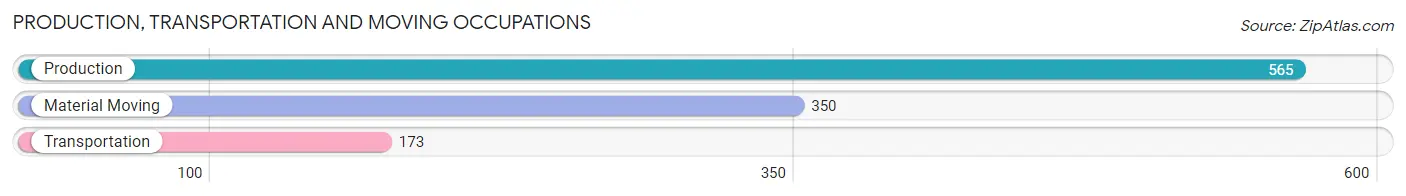
Production, Transportation and Moving Occupations
The most common Production, Transportation and Moving occupations in Clay County are Production (565 | 9.8%), Material Moving (350 | 6.0%), and Transportation (173 | 3.0%).
Production, Transportation and Moving Occupations by Sex
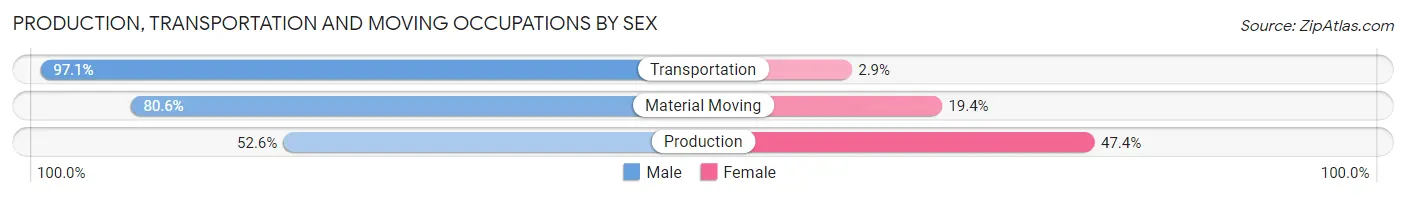
| Occupation | Male | Female |
| Production | 297 (52.6%) | 268 (47.4%) |
| Transportation | 168 (97.1%) | 5 (2.9%) |
| Material Moving | 282 (80.6%) | 68 (19.4%) |
| Total (Category) | 747 (68.7%) | 341 (31.3%) |
| Total (Overall) | 2,984 (51.5%) | 2,805 (48.4%) |
Employment Industries by Sex in Clay County
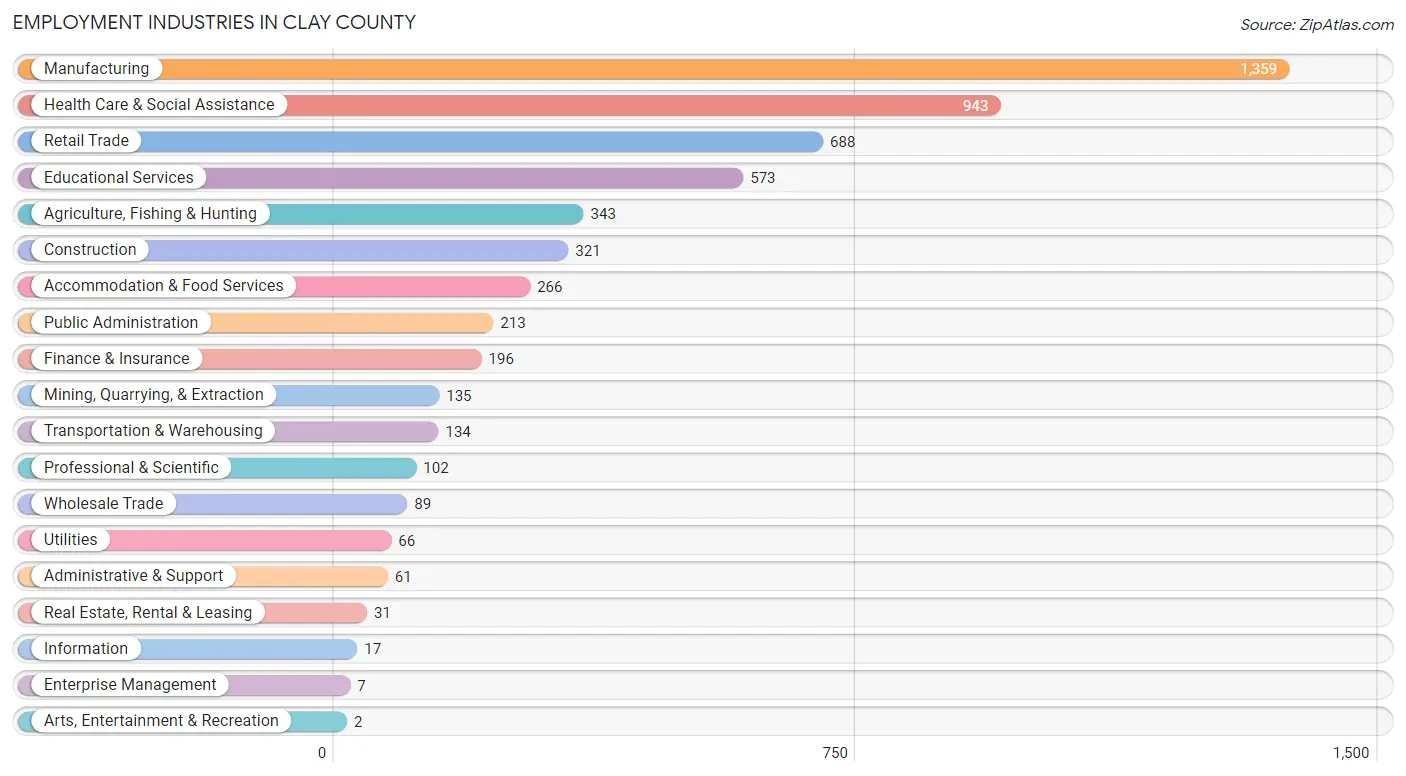
Employment Industries in Clay County
The major employment industries in Clay County include Manufacturing (1,359 | 23.5%), Health Care & Social Assistance (943 | 16.3%), Retail Trade (688 | 11.9%), Educational Services (573 | 9.9%), and Agriculture, Fishing & Hunting (343 | 5.9%).
Employment Industries by Sex in Clay County
The Clay County industries that see more men than women are Construction (98.4%), Utilities (95.5%), and Transportation & Warehousing (91.0%), whereas the industries that tend to have a higher number of women are Enterprise Management (100.0%), Arts, Entertainment & Recreation (100.0%), and Health Care & Social Assistance (89.9%).
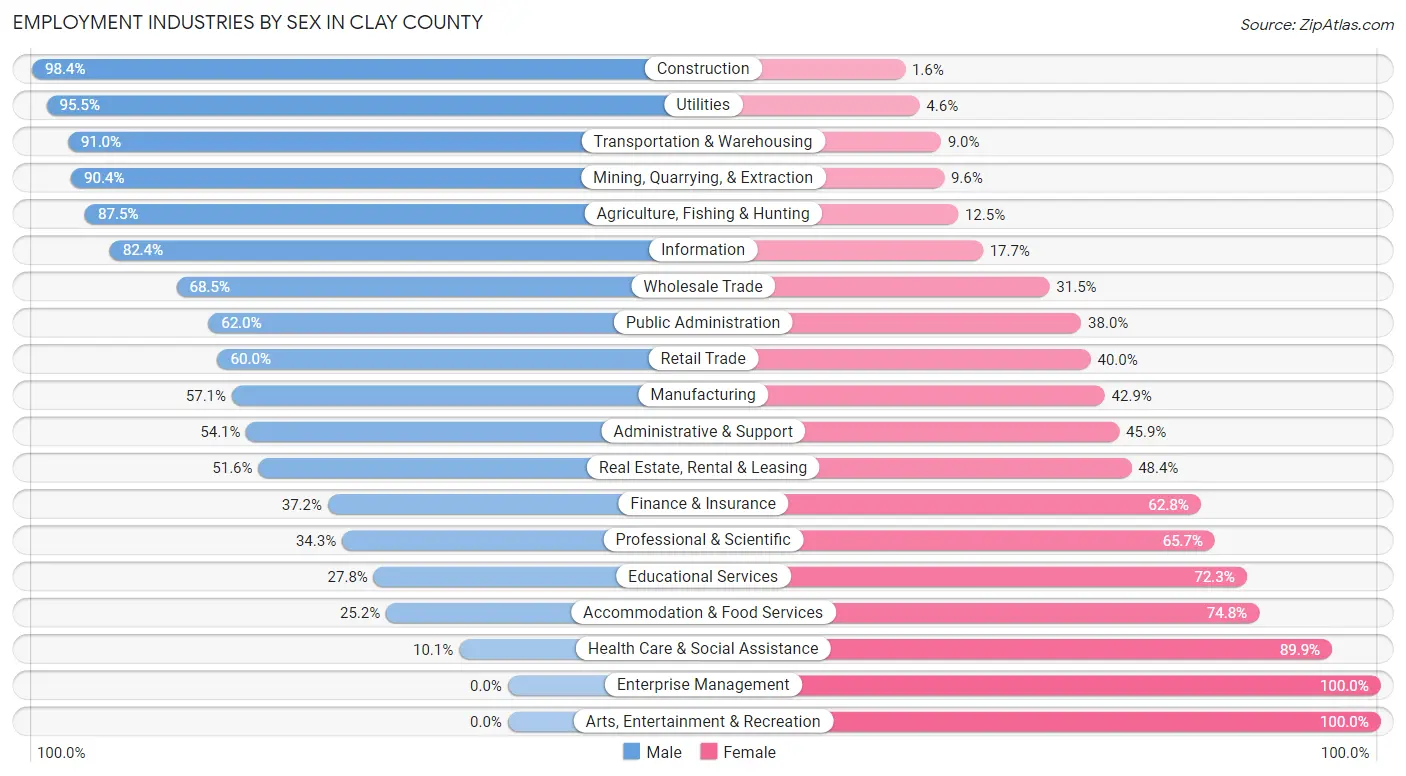
| Industry | Male | Female |
| Agriculture, Fishing & Hunting | 300 (87.5%) | 43 (12.5%) |
| Mining, Quarrying, & Extraction | 122 (90.4%) | 13 (9.6%) |
| Construction | 316 (98.4%) | 5 (1.6%) |
| Manufacturing | 776 (57.1%) | 583 (42.9%) |
| Wholesale Trade | 61 (68.5%) | 28 (31.5%) |
| Retail Trade | 413 (60.0%) | 275 (40.0%) |
| Transportation & Warehousing | 122 (91.0%) | 12 (9.0%) |
| Utilities | 63 (95.5%) | 3 (4.5%) |
| Information | 14 (82.4%) | 3 (17.6%) |
| Finance & Insurance | 73 (37.2%) | 123 (62.8%) |
| Real Estate, Rental & Leasing | 16 (51.6%) | 15 (48.4%) |
| Professional & Scientific | 35 (34.3%) | 67 (65.7%) |
| Enterprise Management | 0 (0.0%) | 7 (100.0%) |
| Administrative & Support | 33 (54.1%) | 28 (45.9%) |
| Educational Services | 159 (27.8%) | 414 (72.3%) |
| Health Care & Social Assistance | 95 (10.1%) | 848 (89.9%) |
| Arts, Entertainment & Recreation | 0 (0.0%) | 2 (100.0%) |
| Accommodation & Food Services | 67 (25.2%) | 199 (74.8%) |
| Public Administration | 132 (62.0%) | 81 (38.0%) |
| Total | 2,984 (51.5%) | 2,805 (48.4%) |
Education in Clay County
School Enrollment in Clay County
The most common levels of schooling among the 2,987 students in Clay County are middle school (718 | 24.0%), high school (688 | 23.0%), and elementary school (687 | 23.0%).
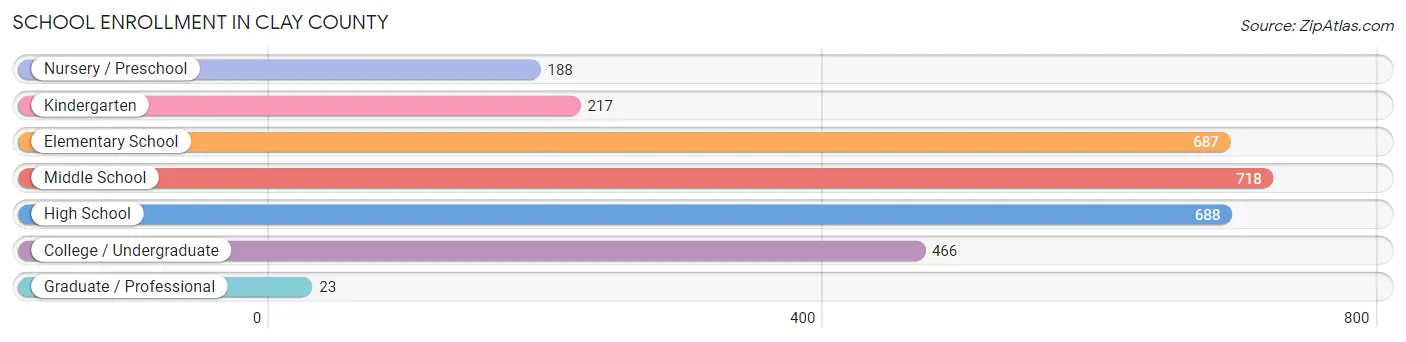
| School Level | # Students | % Students |
| Nursery / Preschool | 188 | 6.3% |
| Kindergarten | 217 | 7.3% |
| Elementary School | 687 | 23.0% |
| Middle School | 718 | 24.0% |
| High School | 688 | 23.0% |
| College / Undergraduate | 466 | 15.6% |
| Graduate / Professional | 23 | 0.8% |
| Total | 2,987 | 100.0% |
School Enrollment by Age by Funding Source in Clay County
Out of a total of 2,987 students who are enrolled in schools in Clay County, 311 (10.4%) attend a private institution, while the remaining 2,676 (89.6%) are enrolled in public schools. The age group of 35 years and over has the highest likelihood of being enrolled in private schools, with 35 (21.3% in the age bracket) enrolled. Conversely, the age group of 3 to 4 year olds has the lowest likelihood of being enrolled in a private school, with 148 (100.0% in the age bracket) attending a public institution.
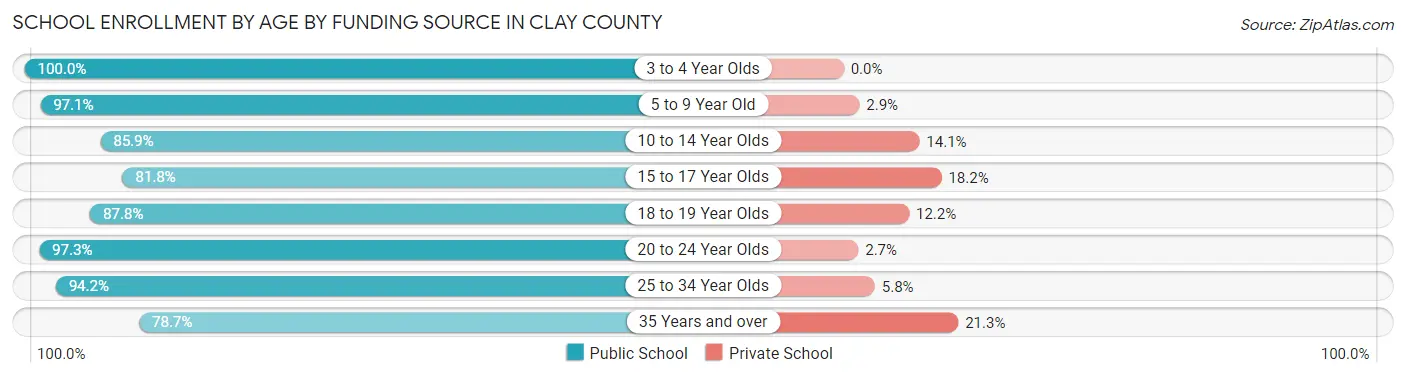
| Age Bracket | Public School | Private School |
| 3 to 4 Year Olds | 148 (100.0%) | 0 (0.0%) |
| 5 to 9 Year Old | 830 (97.1%) | 25 (2.9%) |
| 10 to 14 Year Olds | 749 (85.9%) | 123 (14.1%) |
| 15 to 17 Year Olds | 404 (81.8%) | 90 (18.2%) |
| 18 to 19 Year Olds | 209 (87.8%) | 29 (12.2%) |
| 20 to 24 Year Olds | 143 (97.3%) | 4 (2.7%) |
| 25 to 34 Year Olds | 65 (94.2%) | 4 (5.8%) |
| 35 Years and over | 129 (78.7%) | 35 (21.3%) |
| Total | 2,676 (89.6%) | 311 (10.4%) |
Educational Attainment by Field of Study in Clay County
Education (453 | 30.3%), bio, nature & agricultural (290 | 19.4%), science & technology (178 | 11.9%), business (147 | 9.8%), and liberal arts & history (98 | 6.6%) are the most common fields of study among 1,494 individuals in Clay County who have obtained a bachelor's degree or higher.
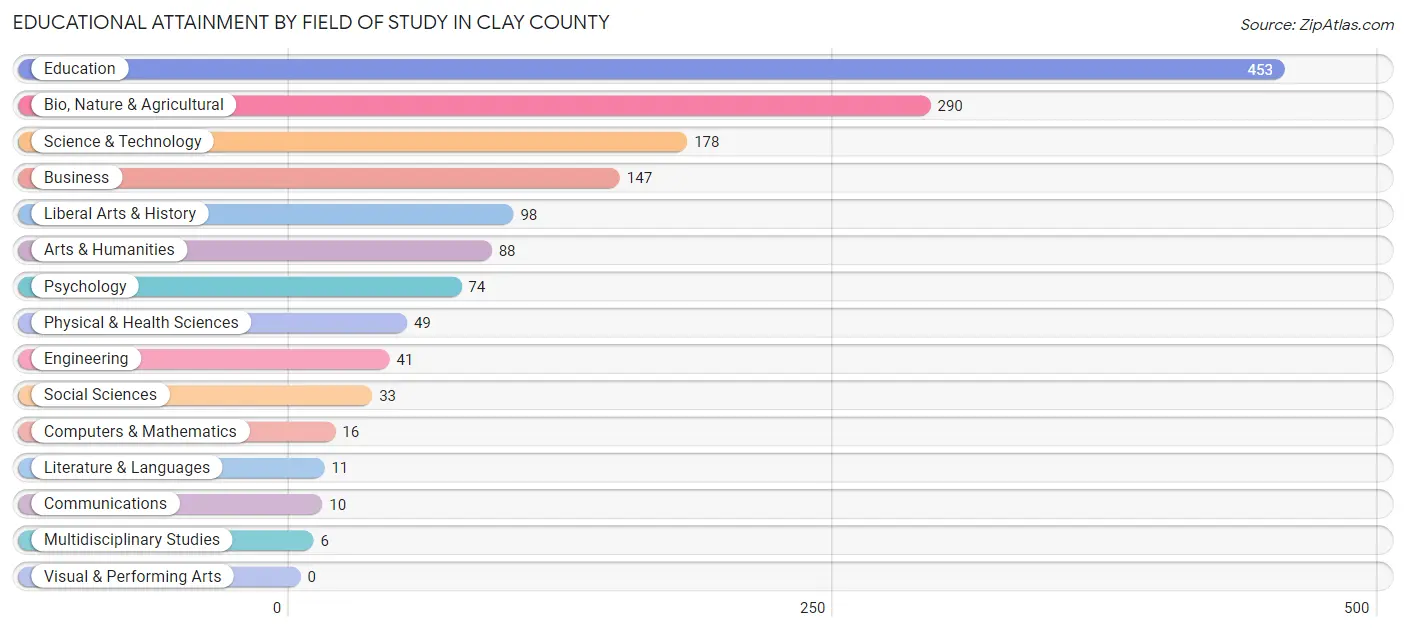
| Field of Study | # Graduates | % Graduates |
| Computers & Mathematics | 16 | 1.1% |
| Bio, Nature & Agricultural | 290 | 19.4% |
| Physical & Health Sciences | 49 | 3.3% |
| Psychology | 74 | 5.0% |
| Social Sciences | 33 | 2.2% |
| Engineering | 41 | 2.7% |
| Multidisciplinary Studies | 6 | 0.4% |
| Science & Technology | 178 | 11.9% |
| Business | 147 | 9.8% |
| Education | 453 | 30.3% |
| Literature & Languages | 11 | 0.7% |
| Liberal Arts & History | 98 | 6.6% |
| Visual & Performing Arts | 0 | 0.0% |
| Communications | 10 | 0.7% |
| Arts & Humanities | 88 | 5.9% |
| Total | 1,494 | 100.0% |
Transportation & Commute in Clay County
Vehicle Availability by Sex in Clay County
The most prevalent vehicle ownership categories in Clay County are males with 2 vehicles (1,013, accounting for 34.3%) and females with 2 vehicles (848, making up 37.3%).
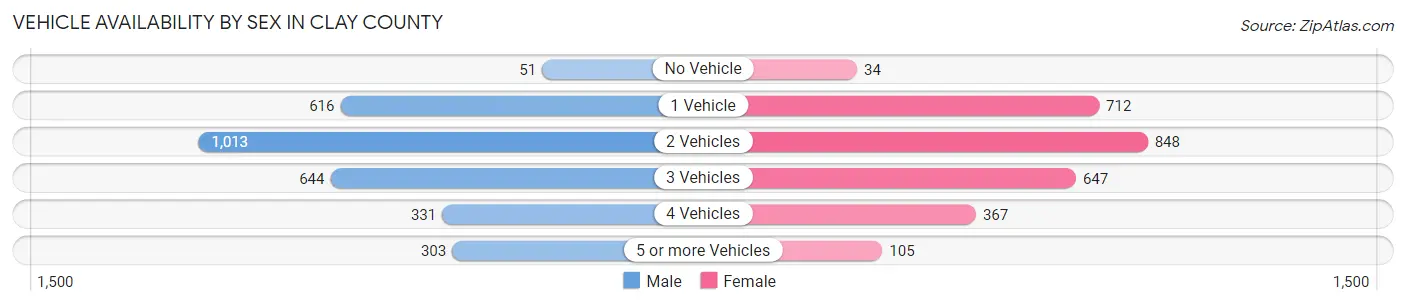
| Vehicles Available | Male | Female |
| No Vehicle | 51 (1.7%) | 34 (1.3%) |
| 1 Vehicle | 616 (20.8%) | 712 (26.2%) |
| 2 Vehicles | 1,013 (34.3%) | 848 (31.3%) |
| 3 Vehicles | 644 (21.8%) | 647 (23.8%) |
| 4 Vehicles | 331 (11.2%) | 367 (13.5%) |
| 5 or more Vehicles | 303 (10.2%) | 105 (3.9%) |
| Total | 2,958 (100.0%) | 2,713 (100.0%) |
Commute Time in Clay County
The most frequently occuring commute durations in Clay County are 5 to 9 minutes (1,193 commuters, 22.7%), 10 to 14 minutes (930 commuters, 17.7%), and 15 to 19 minutes (602 commuters, 11.5%).
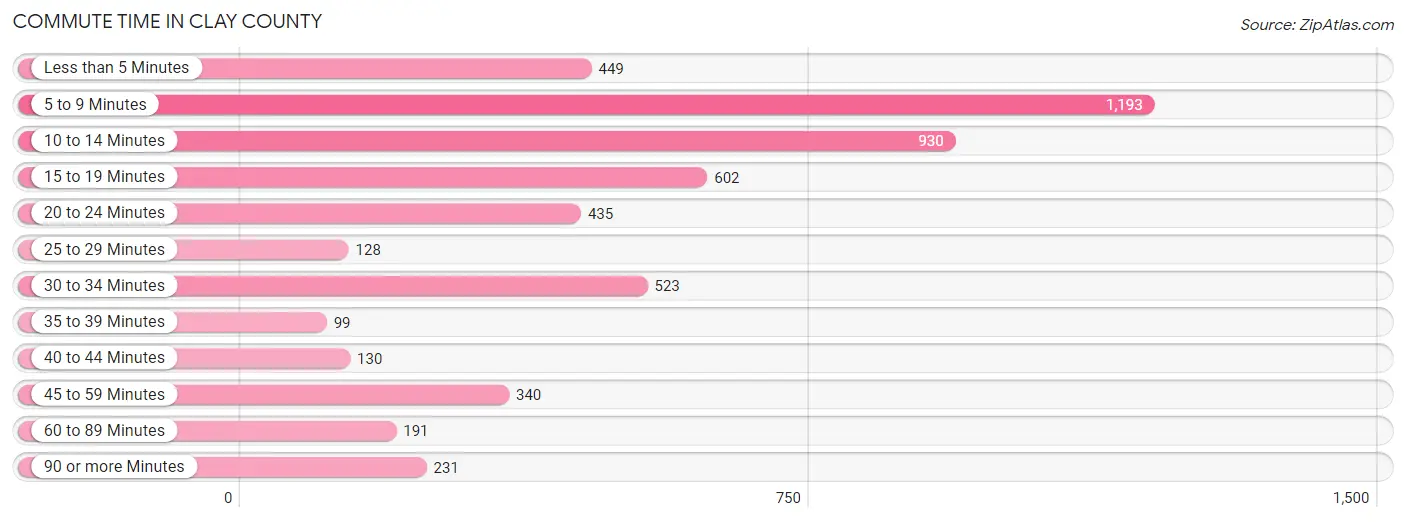
| Commute Time | # Commuters | % Commuters |
| Less than 5 Minutes | 449 | 8.6% |
| 5 to 9 Minutes | 1,193 | 22.7% |
| 10 to 14 Minutes | 930 | 17.7% |
| 15 to 19 Minutes | 602 | 11.5% |
| 20 to 24 Minutes | 435 | 8.3% |
| 25 to 29 Minutes | 128 | 2.4% |
| 30 to 34 Minutes | 523 | 10.0% |
| 35 to 39 Minutes | 99 | 1.9% |
| 40 to 44 Minutes | 130 | 2.5% |
| 45 to 59 Minutes | 340 | 6.5% |
| 60 to 89 Minutes | 191 | 3.6% |
| 90 or more Minutes | 231 | 4.4% |
Commute Time by Sex in Clay County
The most common commute times in Clay County are 5 to 9 minutes (647 commuters, 24.0%) for males and 5 to 9 minutes (546 commuters, 21.3%) for females.
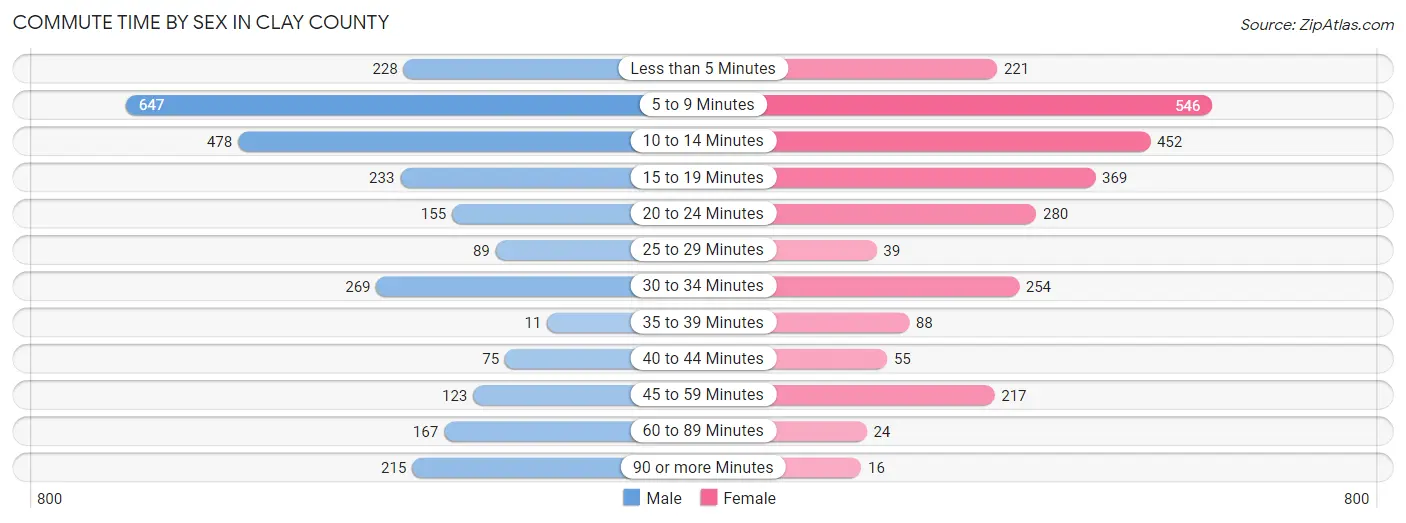
| Commute Time | Male | Female |
| Less than 5 Minutes | 228 (8.5%) | 221 (8.6%) |
| 5 to 9 Minutes | 647 (24.0%) | 546 (21.3%) |
| 10 to 14 Minutes | 478 (17.8%) | 452 (17.6%) |
| 15 to 19 Minutes | 233 (8.7%) | 369 (14.4%) |
| 20 to 24 Minutes | 155 (5.8%) | 280 (10.9%) |
| 25 to 29 Minutes | 89 (3.3%) | 39 (1.5%) |
| 30 to 34 Minutes | 269 (10.0%) | 254 (9.9%) |
| 35 to 39 Minutes | 11 (0.4%) | 88 (3.4%) |
| 40 to 44 Minutes | 75 (2.8%) | 55 (2.1%) |
| 45 to 59 Minutes | 123 (4.6%) | 217 (8.5%) |
| 60 to 89 Minutes | 167 (6.2%) | 24 (0.9%) |
| 90 or more Minutes | 215 (8.0%) | 16 (0.6%) |
Time of Departure to Work by Sex in Clay County
The most frequent times of departure to work in Clay County are 6:30 AM to 6:59 AM (435, 16.2%) for males and 7:30 AM to 7:59 AM (633, 24.7%) for females.
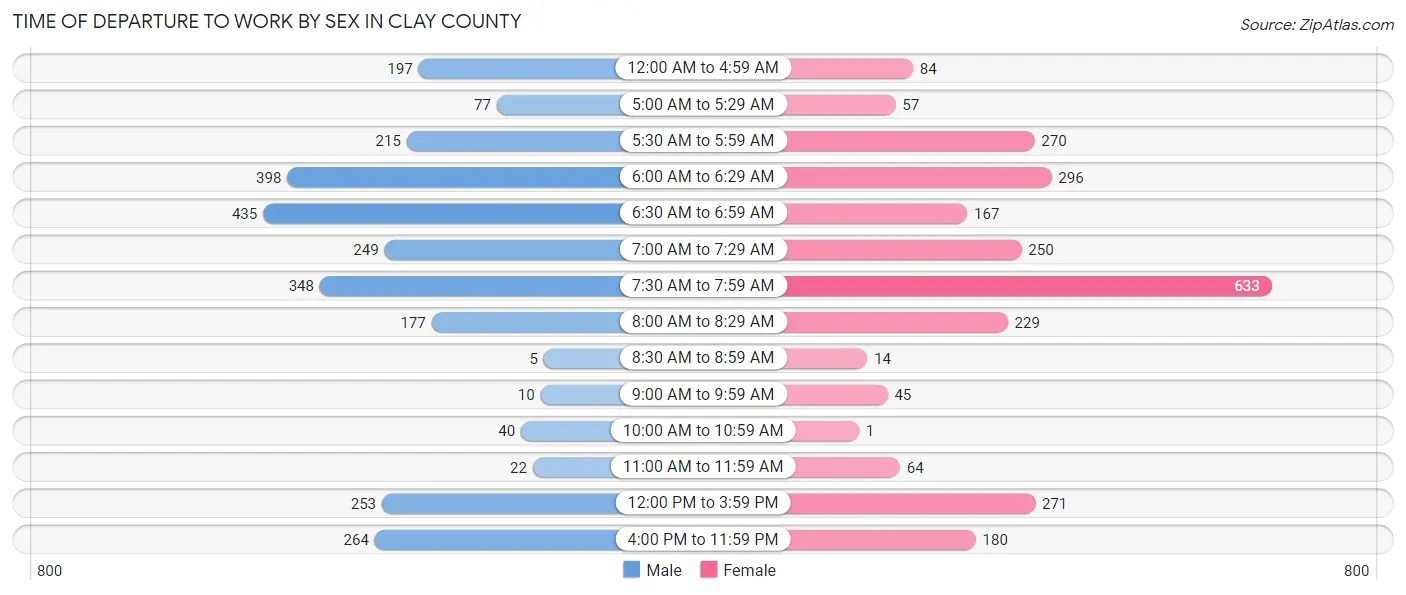
| Time of Departure | Male | Female |
| 12:00 AM to 4:59 AM | 197 (7.3%) | 84 (3.3%) |
| 5:00 AM to 5:29 AM | 77 (2.9%) | 57 (2.2%) |
| 5:30 AM to 5:59 AM | 215 (8.0%) | 270 (10.5%) |
| 6:00 AM to 6:29 AM | 398 (14.8%) | 296 (11.6%) |
| 6:30 AM to 6:59 AM | 435 (16.2%) | 167 (6.5%) |
| 7:00 AM to 7:29 AM | 249 (9.3%) | 250 (9.8%) |
| 7:30 AM to 7:59 AM | 348 (12.9%) | 633 (24.7%) |
| 8:00 AM to 8:29 AM | 177 (6.6%) | 229 (8.9%) |
| 8:30 AM to 8:59 AM | 5 (0.2%) | 14 (0.5%) |
| 9:00 AM to 9:59 AM | 10 (0.4%) | 45 (1.8%) |
| 10:00 AM to 10:59 AM | 40 (1.5%) | 1 (0.0%) |
| 11:00 AM to 11:59 AM | 22 (0.8%) | 64 (2.5%) |
| 12:00 PM to 3:59 PM | 253 (9.4%) | 271 (10.6%) |
| 4:00 PM to 11:59 PM | 264 (9.8%) | 180 (7.0%) |
| Total | 2,690 (100.0%) | 2,561 (100.0%) |
Housing Occupancy in Clay County
Occupancy by Ownership in Clay County
Of the total 5,477 dwellings in Clay County, owner-occupied units account for 4,203 (76.7%), while renter-occupied units make up 1,274 (23.3%).
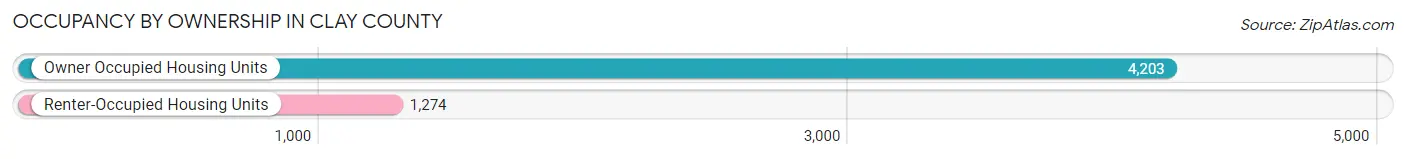
| Occupancy | # Housing Units | % Housing Units |
| Owner Occupied Housing Units | 4,203 | 76.7% |
| Renter-Occupied Housing Units | 1,274 | 23.3% |
| Total Occupied Housing Units | 5,477 | 100.0% |
Occupancy by Household Size in Clay County
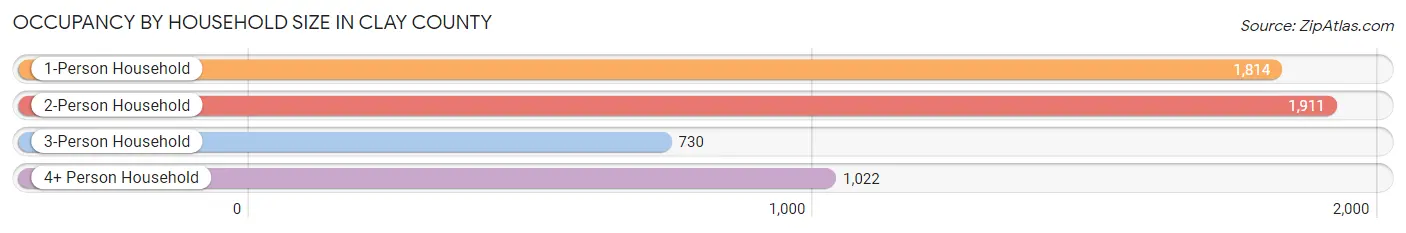
| Household Size | # Housing Units | % Housing Units |
| 1-Person Household | 1,814 | 33.1% |
| 2-Person Household | 1,911 | 34.9% |
| 3-Person Household | 730 | 13.3% |
| 4+ Person Household | 1,022 | 18.7% |
| Total Housing Units | 5,477 | 100.0% |
Occupancy by Ownership by Household Size in Clay County
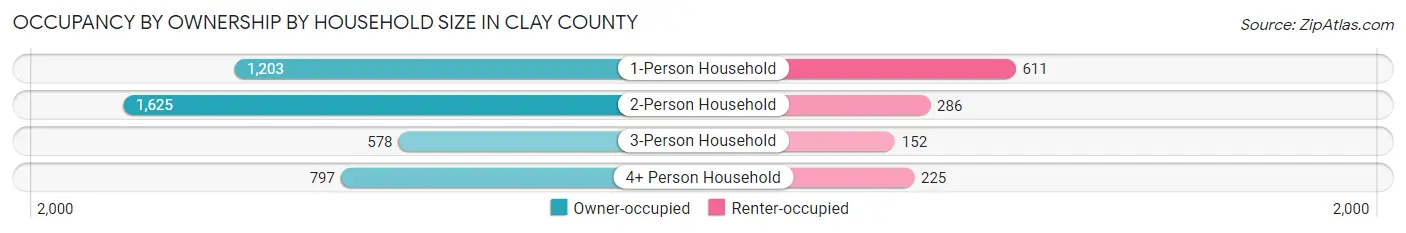
| Household Size | Owner-occupied | Renter-occupied |
| 1-Person Household | 1,203 (66.3%) | 611 (33.7%) |
| 2-Person Household | 1,625 (85.0%) | 286 (15.0%) |
| 3-Person Household | 578 (79.2%) | 152 (20.8%) |
| 4+ Person Household | 797 (78.0%) | 225 (22.0%) |
| Total Housing Units | 4,203 (76.7%) | 1,274 (23.3%) |
Occupancy by Educational Attainment in Clay County
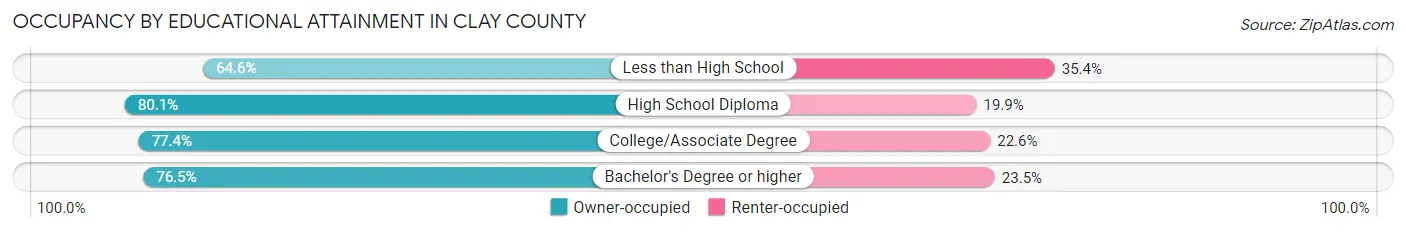
| Household Size | Owner-occupied | Renter-occupied |
| Less than High School | 392 (64.6%) | 215 (35.4%) |
| High School Diploma | 1,493 (80.1%) | 371 (19.9%) |
| College/Associate Degree | 1,662 (77.4%) | 486 (22.6%) |
| Bachelor's Degree or higher | 656 (76.5%) | 202 (23.5%) |
Occupancy by Age of Householder in Clay County
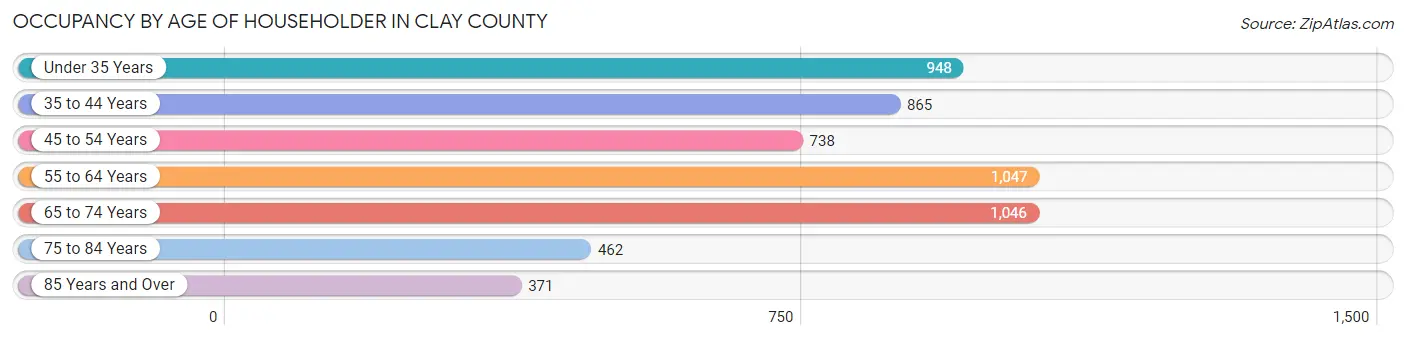
| Age Bracket | # Households | % Households |
| Under 35 Years | 948 | 17.3% |
| 35 to 44 Years | 865 | 15.8% |
| 45 to 54 Years | 738 | 13.5% |
| 55 to 64 Years | 1,047 | 19.1% |
| 65 to 74 Years | 1,046 | 19.1% |
| 75 to 84 Years | 462 | 8.4% |
| 85 Years and Over | 371 | 6.8% |
| Total | 5,477 | 100.0% |
Housing Finances in Clay County
Median Income by Occupancy in Clay County
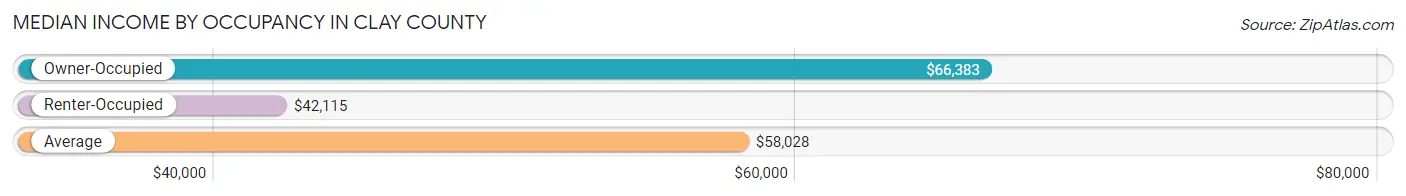
| Occupancy Type | # Households | Median Income |
| Owner-Occupied | 4,203 (76.7%) | $66,383 |
| Renter-Occupied | 1,274 (23.3%) | $42,115 |
| Average | 5,477 (100.0%) | $58,028 |
Occupancy by Householder Income Bracket in Clay County
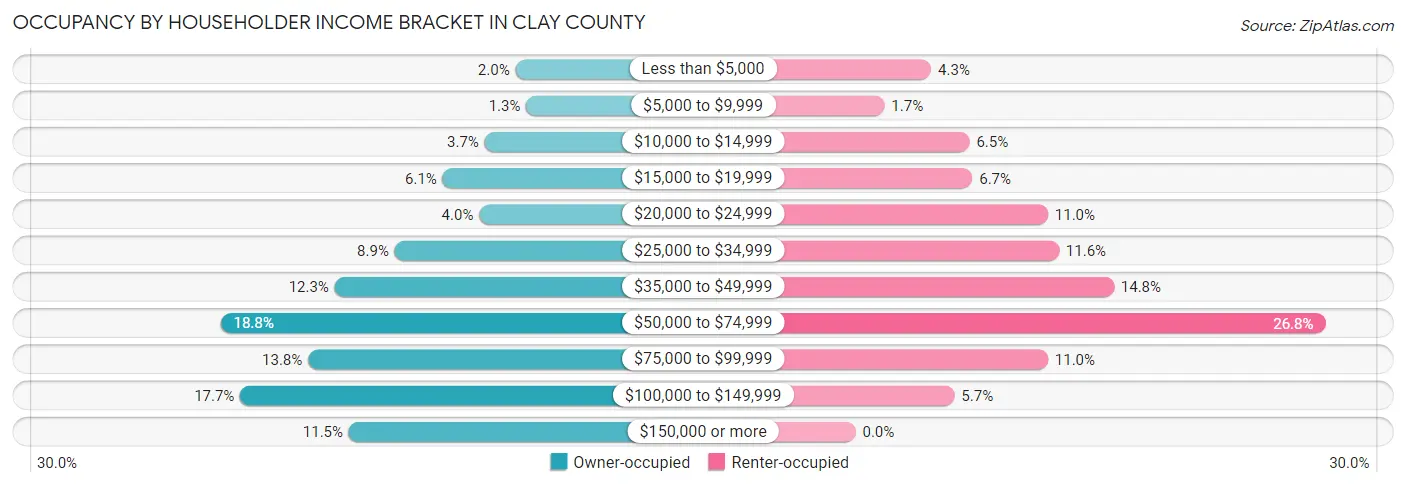
| Income Bracket | Owner-occupied | Renter-occupied |
| Less than $5,000 | 82 (1.9%) | 55 (4.3%) |
| $5,000 to $9,999 | 56 (1.3%) | 21 (1.7%) |
| $10,000 to $14,999 | 156 (3.7%) | 83 (6.5%) |
| $15,000 to $19,999 | 257 (6.1%) | 85 (6.7%) |
| $20,000 to $24,999 | 169 (4.0%) | 140 (11.0%) |
| $25,000 to $34,999 | 372 (8.8%) | 148 (11.6%) |
| $35,000 to $49,999 | 516 (12.3%) | 188 (14.8%) |
| $50,000 to $74,999 | 790 (18.8%) | 342 (26.8%) |
| $75,000 to $99,999 | 580 (13.8%) | 140 (11.0%) |
| $100,000 to $149,999 | 743 (17.7%) | 72 (5.7%) |
| $150,000 or more | 482 (11.5%) | 0 (0.0%) |
| Total | 4,203 (100.0%) | 1,274 (100.0%) |
Monthly Housing Cost Tiers in Clay County
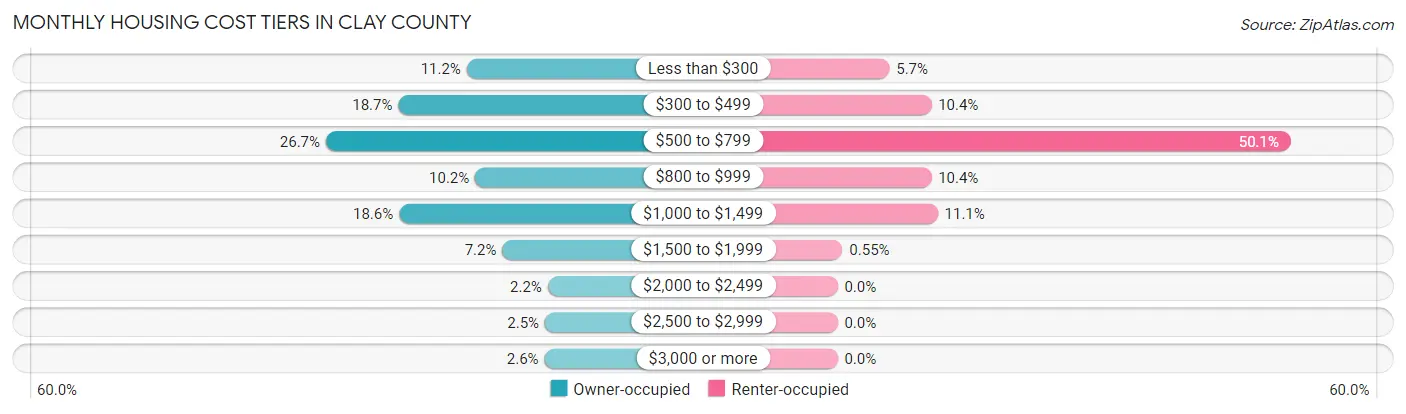
| Monthly Cost | Owner-occupied | Renter-occupied |
| Less than $300 | 469 (11.2%) | 73 (5.7%) |
| $300 to $499 | 787 (18.7%) | 132 (10.4%) |
| $500 to $799 | 1,123 (26.7%) | 638 (50.1%) |
| $800 to $999 | 430 (10.2%) | 132 (10.4%) |
| $1,000 to $1,499 | 783 (18.6%) | 141 (11.1%) |
| $1,500 to $1,999 | 304 (7.2%) | 7 (0.5%) |
| $2,000 to $2,499 | 93 (2.2%) | 0 (0.0%) |
| $2,500 to $2,999 | 106 (2.5%) | 0 (0.0%) |
| $3,000 or more | 108 (2.6%) | 0 (0.0%) |
| Total | 4,203 (100.0%) | 1,274 (100.0%) |
Physical Housing Characteristics in Clay County
Housing Structures in Clay County
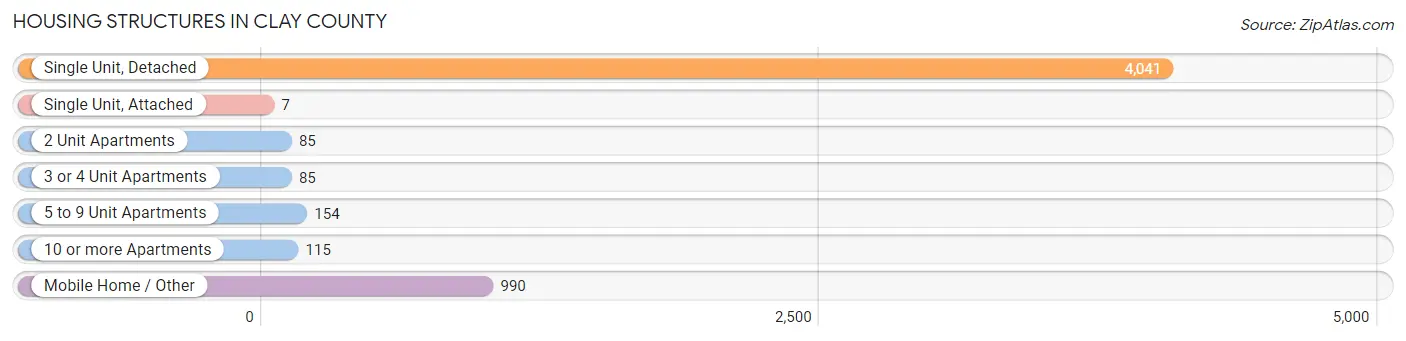
| Structure Type | # Housing Units | % Housing Units |
| Single Unit, Detached | 4,041 | 73.8% |
| Single Unit, Attached | 7 | 0.1% |
| 2 Unit Apartments | 85 | 1.5% |
| 3 or 4 Unit Apartments | 85 | 1.5% |
| 5 to 9 Unit Apartments | 154 | 2.8% |
| 10 or more Apartments | 115 | 2.1% |
| Mobile Home / Other | 990 | 18.1% |
| Total | 5,477 | 100.0% |
Housing Structures by Occupancy in Clay County
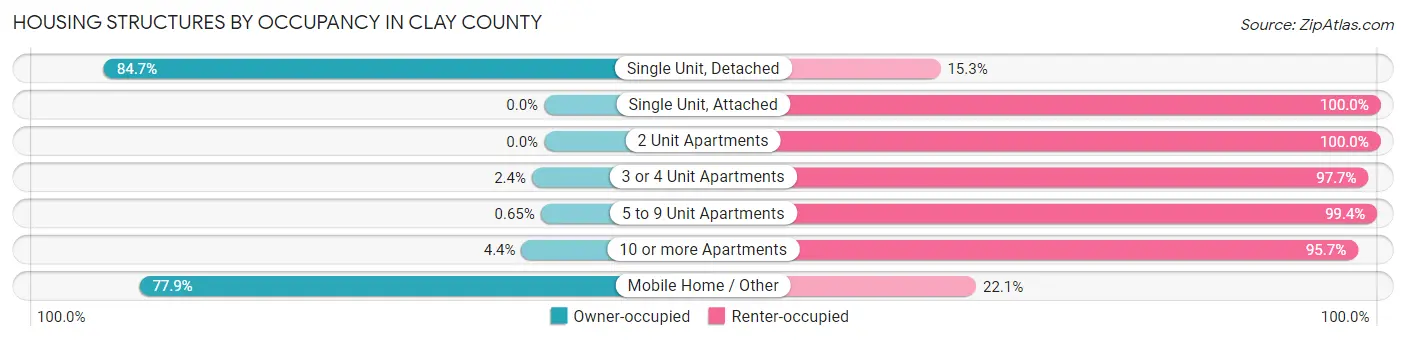
| Structure Type | Owner-occupied | Renter-occupied |
| Single Unit, Detached | 3,424 (84.7%) | 617 (15.3%) |
| Single Unit, Attached | 0 (0.0%) | 7 (100.0%) |
| 2 Unit Apartments | 0 (0.0%) | 85 (100.0%) |
| 3 or 4 Unit Apartments | 2 (2.4%) | 83 (97.7%) |
| 5 to 9 Unit Apartments | 1 (0.6%) | 153 (99.4%) |
| 10 or more Apartments | 5 (4.3%) | 110 (95.7%) |
| Mobile Home / Other | 771 (77.9%) | 219 (22.1%) |
| Total | 4,203 (76.7%) | 1,274 (23.3%) |
Housing Structures by Number of Rooms in Clay County
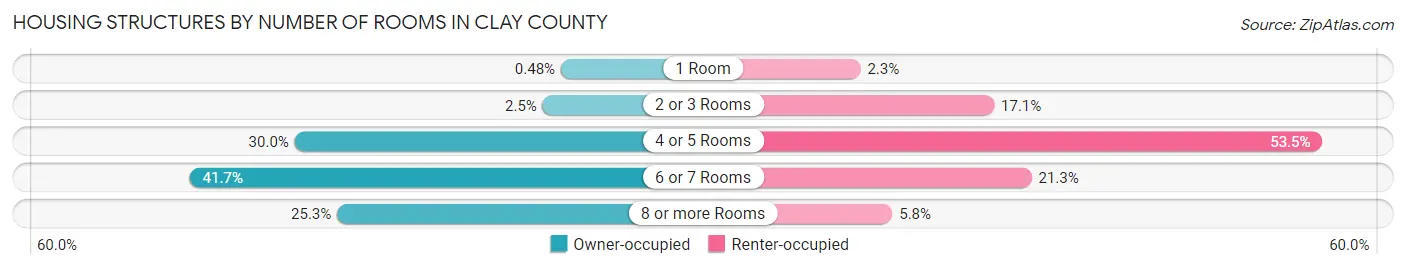
| Number of Rooms | Owner-occupied | Renter-occupied |
| 1 Room | 20 (0.5%) | 29 (2.3%) |
| 2 or 3 Rooms | 105 (2.5%) | 218 (17.1%) |
| 4 or 5 Rooms | 1,262 (30.0%) | 682 (53.5%) |
| 6 or 7 Rooms | 1,752 (41.7%) | 271 (21.3%) |
| 8 or more Rooms | 1,064 (25.3%) | 74 (5.8%) |
| Total | 4,203 (100.0%) | 1,274 (100.0%) |
Housing Structure by Heating Type in Clay County
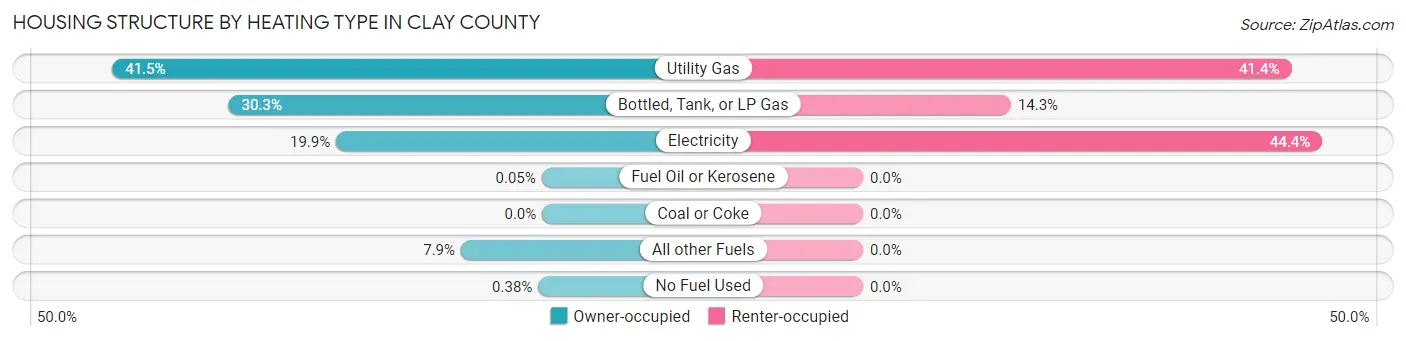
| Heating Type | Owner-occupied | Renter-occupied |
| Utility Gas | 1,745 (41.5%) | 527 (41.4%) |
| Bottled, Tank, or LP Gas | 1,273 (30.3%) | 182 (14.3%) |
| Electricity | 837 (19.9%) | 565 (44.4%) |
| Fuel Oil or Kerosene | 2 (0.1%) | 0 (0.0%) |
| Coal or Coke | 0 (0.0%) | 0 (0.0%) |
| All other Fuels | 330 (7.9%) | 0 (0.0%) |
| No Fuel Used | 16 (0.4%) | 0 (0.0%) |
| Total | 4,203 (100.0%) | 1,274 (100.0%) |
Household Vehicle Usage in Clay County
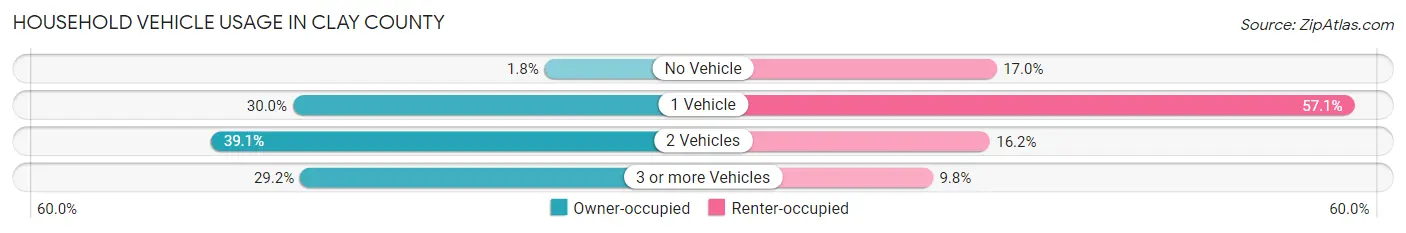
| Vehicles per Household | Owner-occupied | Renter-occupied |
| No Vehicle | 74 (1.8%) | 216 (17.0%) |
| 1 Vehicle | 1,259 (29.9%) | 727 (57.1%) |
| 2 Vehicles | 1,645 (39.1%) | 206 (16.2%) |
| 3 or more Vehicles | 1,225 (29.1%) | 125 (9.8%) |
| Total | 4,203 (100.0%) | 1,274 (100.0%) |
Real Estate & Mortgages in Clay County
Real Estate and Mortgage Overview in Clay County
| Characteristic | Without Mortgage | With Mortgage |
| Housing Units | 2,243 | 1,960 |
| Median Property Value | $86,400 | $117,600 |
| Median Household Income | $53,826 | $328 |
| Monthly Housing Costs | $476 | $103 |
| Real Estate Taxes | $993 | $35 |
Property Value by Mortgage Status in Clay County
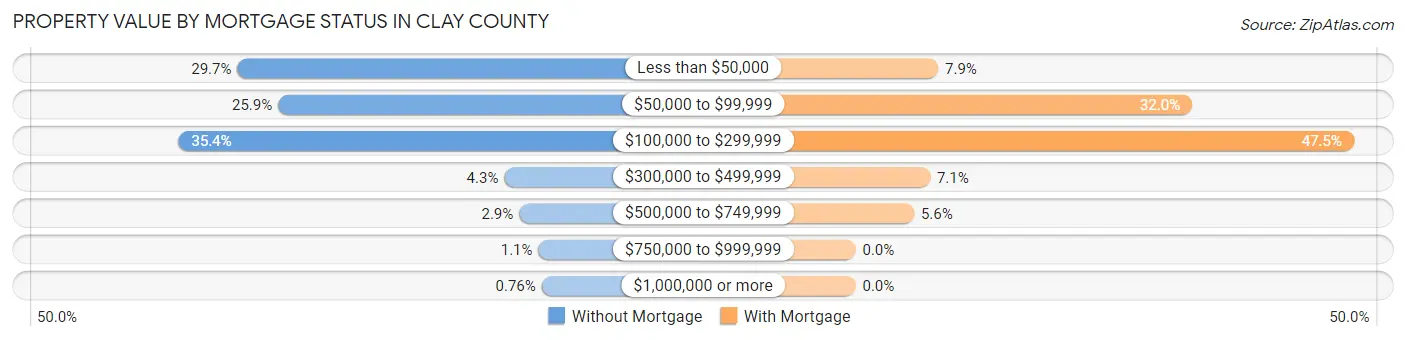
| Property Value | Without Mortgage | With Mortgage |
| Less than $50,000 | 667 (29.7%) | 154 (7.9%) |
| $50,000 to $99,999 | 580 (25.9%) | 628 (32.0%) |
| $100,000 to $299,999 | 793 (35.3%) | 930 (47.4%) |
| $300,000 to $499,999 | 97 (4.3%) | 139 (7.1%) |
| $500,000 to $749,999 | 65 (2.9%) | 109 (5.6%) |
| $750,000 to $999,999 | 24 (1.1%) | 0 (0.0%) |
| $1,000,000 or more | 17 (0.8%) | 0 (0.0%) |
| Total | 2,243 (100.0%) | 1,960 (100.0%) |
Household Income by Mortgage Status in Clay County
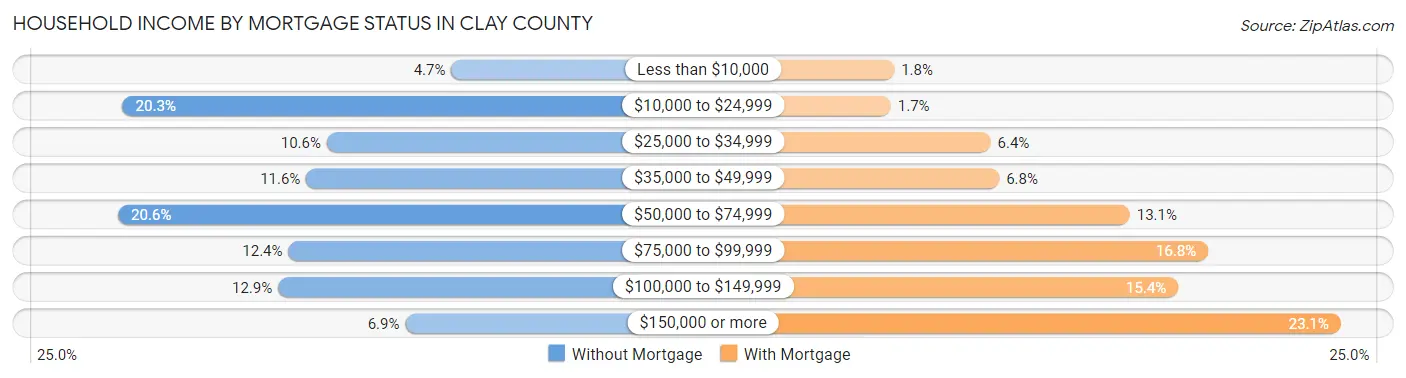
| Household Income | Without Mortgage | With Mortgage |
| Less than $10,000 | 105 (4.7%) | 36 (1.8%) |
| $10,000 to $24,999 | 456 (20.3%) | 33 (1.7%) |
| $25,000 to $34,999 | 238 (10.6%) | 126 (6.4%) |
| $35,000 to $49,999 | 260 (11.6%) | 134 (6.8%) |
| $50,000 to $74,999 | 461 (20.5%) | 256 (13.1%) |
| $75,000 to $99,999 | 279 (12.4%) | 329 (16.8%) |
| $100,000 to $149,999 | 290 (12.9%) | 301 (15.4%) |
| $150,000 or more | 154 (6.9%) | 453 (23.1%) |
| Total | 2,243 (100.0%) | 1,960 (100.0%) |
Property Value to Household Income Ratio in Clay County
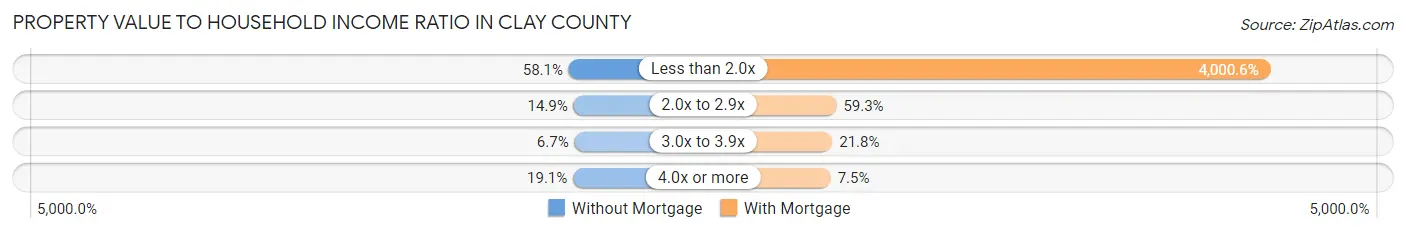
| Value-to-Income Ratio | Without Mortgage | With Mortgage |
| Less than 2.0x | 1,302 (58.1%) | 78,412 (4,000.6%) |
| 2.0x to 2.9x | 333 (14.8%) | 1,163 (59.3%) |
| 3.0x to 3.9x | 151 (6.7%) | 427 (21.8%) |
| 4.0x or more | 428 (19.1%) | 147 (7.5%) |
| Total | 2,243 (100.0%) | 1,960 (100.0%) |
Real Estate Taxes by Mortgage Status in Clay County
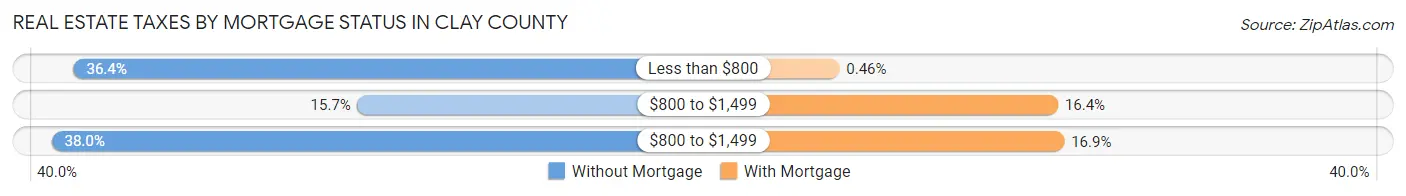
| Property Taxes | Without Mortgage | With Mortgage |
| Less than $800 | 817 (36.4%) | 9 (0.5%) |
| $800 to $1,499 | 353 (15.7%) | 322 (16.4%) |
| $800 to $1,499 | 853 (38.0%) | 331 (16.9%) |
| Total | 2,243 (100.0%) | 1,960 (100.0%) |
Health & Disability in Clay County
Health Insurance Coverage by Age in Clay County
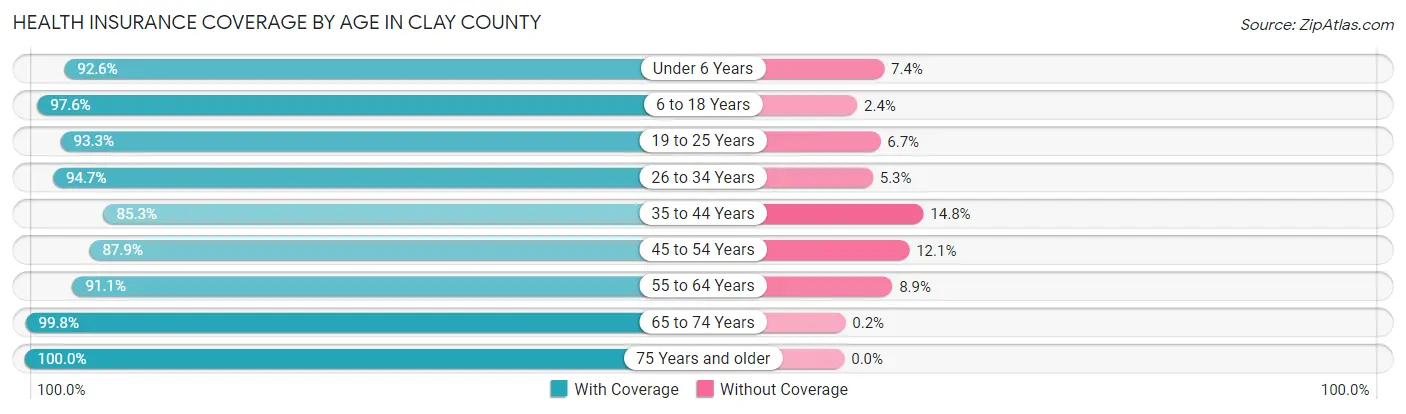
| Age Bracket | With Coverage | Without Coverage |
| Under 6 Years | 761 (92.6%) | 61 (7.4%) |
| 6 to 18 Years | 2,364 (97.6%) | 58 (2.4%) |
| 19 to 25 Years | 804 (93.3%) | 58 (6.7%) |
| 26 to 34 Years | 1,338 (94.7%) | 75 (5.3%) |
| 35 to 44 Years | 1,306 (85.3%) | 226 (14.7%) |
| 45 to 54 Years | 1,357 (87.9%) | 187 (12.1%) |
| 55 to 64 Years | 1,680 (91.1%) | 165 (8.9%) |
| 65 to 74 Years | 1,515 (99.8%) | 3 (0.2%) |
| 75 Years and older | 1,115 (100.0%) | 0 (0.0%) |
| Total | 12,240 (93.6%) | 833 (6.4%) |
Health Insurance Coverage by Citizenship Status in Clay County
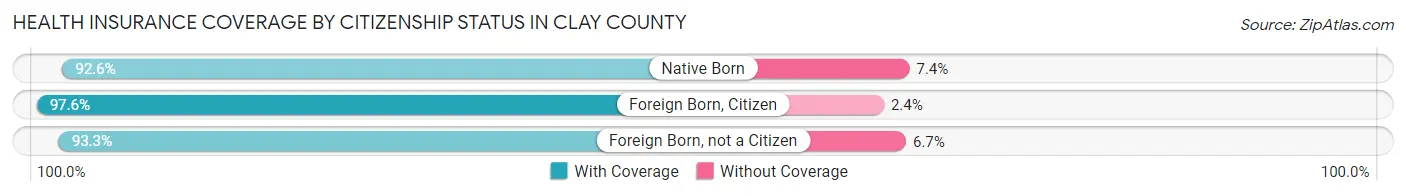
| Citizenship Status | With Coverage | Without Coverage |
| Native Born | 761 (92.6%) | 61 (7.4%) |
| Foreign Born, Citizen | 2,364 (97.6%) | 58 (2.4%) |
| Foreign Born, not a Citizen | 804 (93.3%) | 58 (6.7%) |
Health Insurance Coverage by Household Income in Clay County
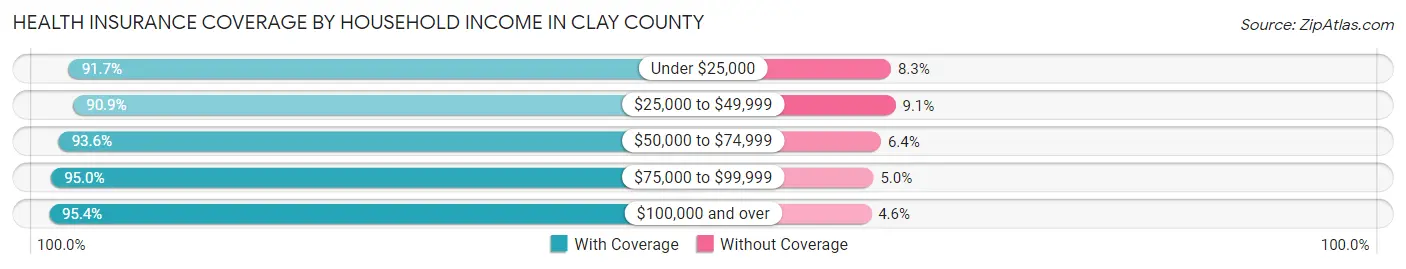
| Household Income | With Coverage | Without Coverage |
| Under $25,000 | 1,617 (91.7%) | 146 (8.3%) |
| $25,000 to $49,999 | 2,449 (90.9%) | 246 (9.1%) |
| $50,000 to $74,999 | 2,326 (93.6%) | 159 (6.4%) |
| $75,000 to $99,999 | 1,899 (95.0%) | 100 (5.0%) |
| $100,000 and over | 3,778 (95.4%) | 181 (4.6%) |
Public vs Private Health Insurance Coverage by Age in Clay County
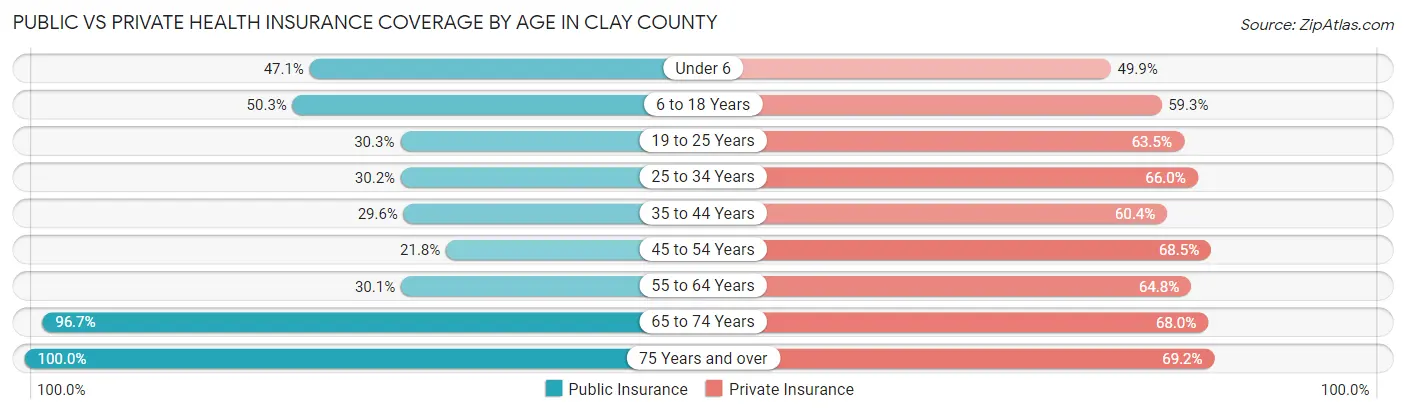
| Age Bracket | Public Insurance | Private Insurance |
| Under 6 | 387 (47.1%) | 410 (49.9%) |
| 6 to 18 Years | 1,217 (50.2%) | 1,436 (59.3%) |
| 19 to 25 Years | 261 (30.3%) | 547 (63.5%) |
| 25 to 34 Years | 426 (30.1%) | 933 (66.0%) |
| 35 to 44 Years | 454 (29.6%) | 925 (60.4%) |
| 45 to 54 Years | 336 (21.8%) | 1,058 (68.5%) |
| 55 to 64 Years | 556 (30.1%) | 1,196 (64.8%) |
| 65 to 74 Years | 1,468 (96.7%) | 1,032 (68.0%) |
| 75 Years and over | 1,115 (100.0%) | 771 (69.2%) |
| Total | 6,220 (47.6%) | 8,308 (63.5%) |
Disability Status by Sex by Age in Clay County
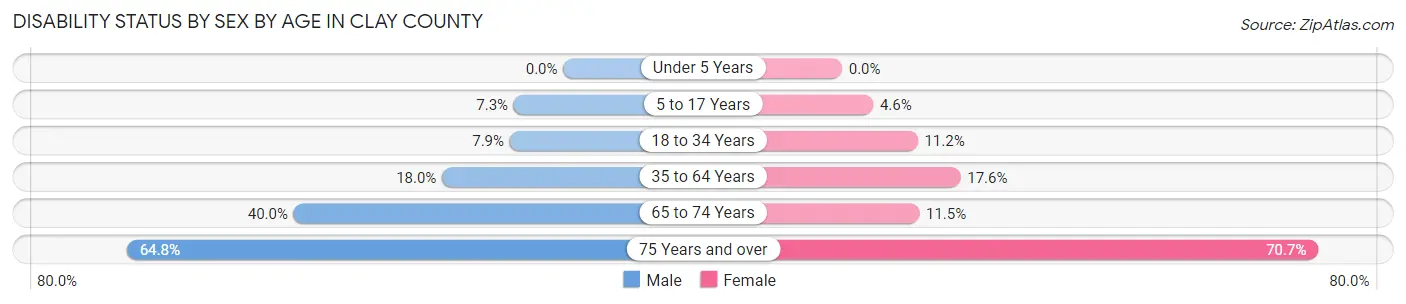
| Age Bracket | Male | Female |
| Under 5 Years | 0 (0.0%) | 0 (0.0%) |
| 5 to 17 Years | 86 (7.3%) | 52 (4.6%) |
| 18 to 34 Years | 100 (7.9%) | 139 (11.2%) |
| 35 to 64 Years | 456 (18.0%) | 420 (17.6%) |
| 65 to 74 Years | 311 (40.0%) | 85 (11.5%) |
| 75 Years and over | 282 (64.8%) | 481 (70.7%) |
Disability Class by Sex by Age in Clay County
Disability Class: Hearing Difficulty
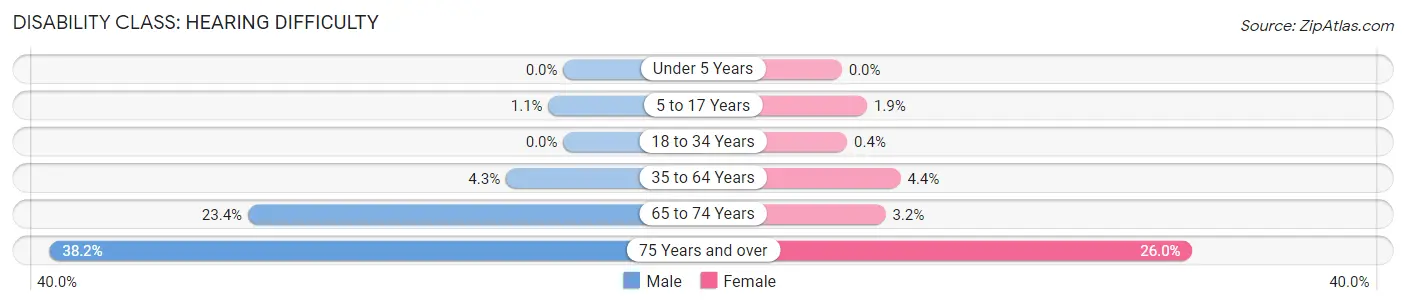
| Age Bracket | Male | Female |
| Under 5 Years | 0 (0.0%) | 0 (0.0%) |
| 5 to 17 Years | 13 (1.1%) | 21 (1.9%) |
| 18 to 34 Years | 0 (0.0%) | 5 (0.4%) |
| 35 to 64 Years | 108 (4.3%) | 104 (4.4%) |
| 65 to 74 Years | 182 (23.4%) | 24 (3.2%) |
| 75 Years and over | 166 (38.2%) | 177 (26.0%) |
Disability Class: Vision Difficulty
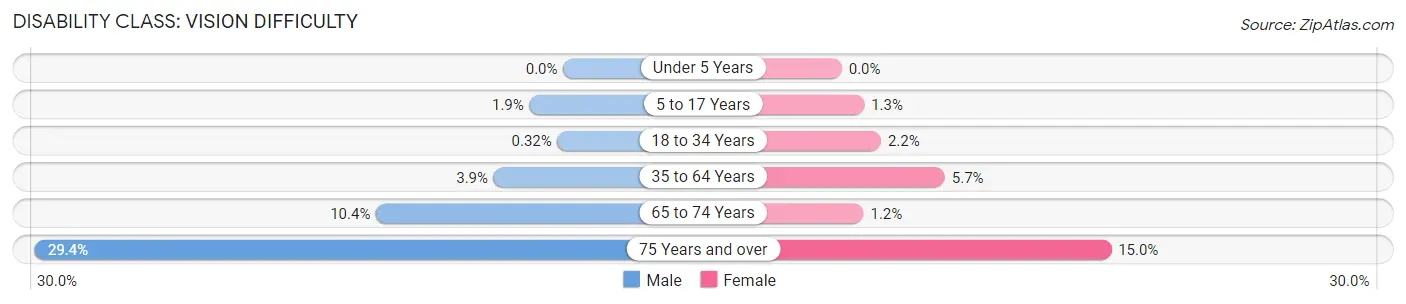
| Age Bracket | Male | Female |
| Under 5 Years | 0 (0.0%) | 0 (0.0%) |
| 5 to 17 Years | 22 (1.9%) | 14 (1.3%) |
| 18 to 34 Years | 4 (0.3%) | 27 (2.2%) |
| 35 to 64 Years | 98 (3.9%) | 137 (5.7%) |
| 65 to 74 Years | 81 (10.4%) | 9 (1.2%) |
| 75 Years and over | 128 (29.4%) | 102 (15.0%) |
Disability Class: Cognitive Difficulty
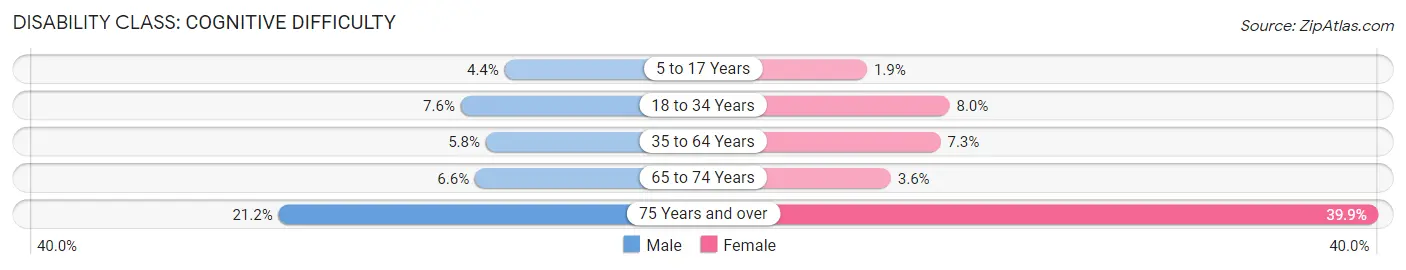
| Age Bracket | Male | Female |
| 5 to 17 Years | 51 (4.4%) | 21 (1.9%) |
| 18 to 34 Years | 96 (7.6%) | 99 (8.0%) |
| 35 to 64 Years | 146 (5.8%) | 175 (7.3%) |
| 65 to 74 Years | 51 (6.6%) | 27 (3.6%) |
| 75 Years and over | 92 (21.1%) | 271 (39.9%) |
Disability Class: Ambulatory Difficulty
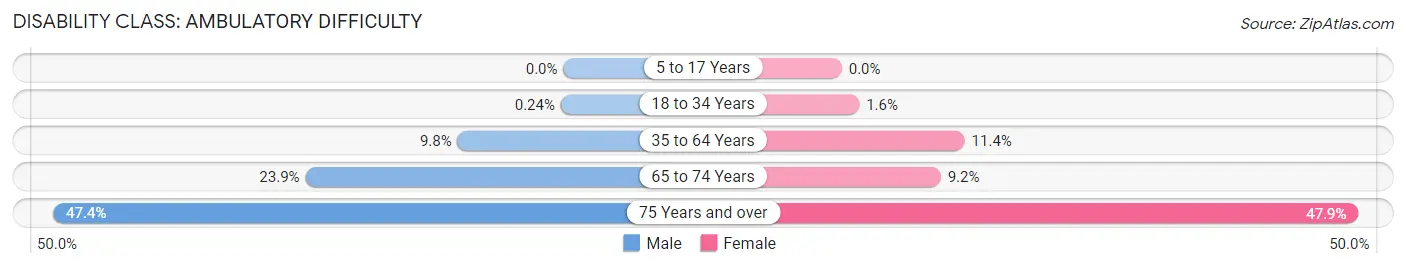
| Age Bracket | Male | Female |
| 5 to 17 Years | 0 (0.0%) | 0 (0.0%) |
| 18 to 34 Years | 3 (0.2%) | 20 (1.6%) |
| 35 to 64 Years | 249 (9.8%) | 272 (11.4%) |
| 65 to 74 Years | 186 (23.9%) | 68 (9.2%) |
| 75 Years and over | 206 (47.4%) | 326 (47.9%) |
Disability Class: Self-Care Difficulty
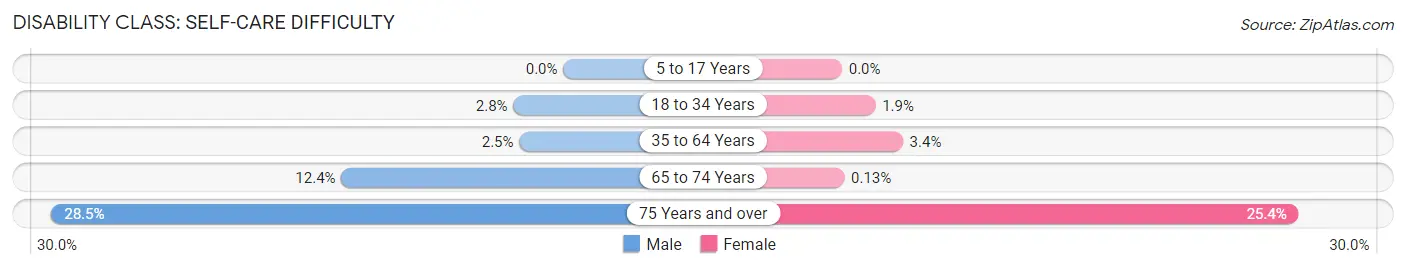
| Age Bracket | Male | Female |
| 5 to 17 Years | 0 (0.0%) | 0 (0.0%) |
| 18 to 34 Years | 35 (2.8%) | 23 (1.9%) |
| 35 to 64 Years | 62 (2.5%) | 81 (3.4%) |
| 65 to 74 Years | 96 (12.4%) | 1 (0.1%) |
| 75 Years and over | 124 (28.5%) | 173 (25.4%) |
Technology Access in Clay County
Computing Device Access in Clay County

| Device Type | # Households | % Households |
| Desktop or Laptop | 3,774 | 68.9% |
| Smartphone | 4,227 | 77.2% |
| Tablet | 2,752 | 50.2% |
| No Computing Device | 551 | 10.1% |
| Total | 5,477 | 100.0% |
Internet Access in Clay County
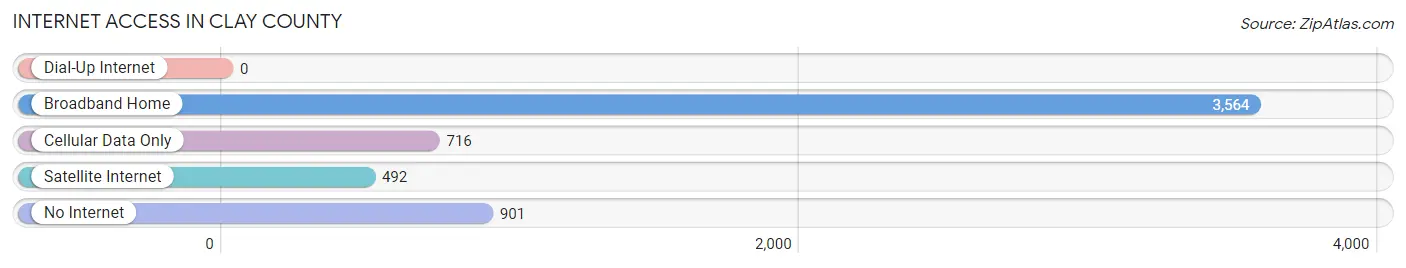
| Internet Type | # Households | % Households |
| Dial-Up Internet | 0 | 0.0% |
| Broadband Home | 3,564 | 65.1% |
| Cellular Data Only | 716 | 13.1% |
| Satellite Internet | 492 | 9.0% |
| No Internet | 901 | 16.5% |
| Total | 5,477 | 100.0% |
Clay County Summary
Clay County, Illinois is located in the southeastern corner of the state, and is bordered by Effingham County to the north, Marion County to the east, Wayne County to the south, and Fayette County to the west. The county seat is Louisville, and the county was named for Henry Clay, a prominent statesman from Kentucky.
Geography
Clay County covers an area of 576 square miles, and is mostly rural. The terrain is mostly flat, with some rolling hills in the northern part of the county. The county is drained by the Embarras River, which flows through the center of the county. The county is mostly covered in farmland, with some wooded areas in the northern part of the county.
Demographics
As of the 2010 census, Clay County had a population of 13,815. The racial makeup of the county was 97.3% White, 0.7% African American, 0.2% Native American, 0.2% Asian, 0.2% from other races, and 1.4% from two or more races. Hispanic or Latino of any race were 1.2% of the population.
The median income for a household in the county was $41,945, and the median income for a family was $50,945. The per capita income for the county was $20,845. About 11.2% of families and 14.2% of the population were below the poverty line, including 19.2% of those under age 18 and 8.2% of those age 65 or over.
Economy
Clay County is largely agricultural, with corn, soybeans, and wheat being the main crops. The county also has a strong manufacturing sector, with companies such as Caterpillar, John Deere, and International Harvester having plants in the county. The county also has a strong tourism industry, with attractions such as the Embarras River Wildlife Refuge, the Clay County Fair, and the Clay County Museum.
History
Clay County was formed in 1824 from parts of Effingham and Fayette counties. The county was named for Henry Clay, a prominent statesman from Kentucky. The county seat was originally located in the town of Clay City, but was moved to Louisville in 1827.
Clay County was an important center of the Underground Railroad, with many of the county's residents helping to hide and transport escaped slaves. The county was also an important center of the temperance movement, with many of the county's churches and organizations supporting the cause.
Clay County was also an important center of the Civil War, with many of the county's residents enlisting in the Union Army. The county was also the site of several skirmishes between Union and Confederate forces.
Clay County has continued to be an important center of agriculture and industry in the state of Illinois. The county has also become an important center of tourism, with attractions such as the Embarras River Wildlife Refuge, the Clay County Fair, and the Clay County Museum.
Common Questions
What is Per Capita Income in Clay County?
Per Capita income in Clay County is $32,495.
What is the Median Family Income in Clay County?
Median Family Income in Clay County is $70,687.
What is the Median Household income in Clay County?
Median Household Income in Clay County is $58,028.
What is Income or Wage Gap in Clay County?
Income or Wage Gap in Clay County is 35.2%.
Women in Clay County earn 64.8 cents for every dollar earned by a man.
What is Family Income Deficit in Clay County?
Family Income Deficit in Clay County is $10,130.
Families that are below poverty line in Clay County earn $10,130 less on average than the poverty threshold level.
What is Inequality or Gini Index in Clay County?
Inequality or Gini Index in Clay County is 0.45.
What is the Total Population of Clay County?
Total Population of Clay County is 13,248.
What is the Total Male Population of Clay County?
Total Male Population of Clay County is 6,650.
What is the Total Female Population of Clay County?
Total Female Population of Clay County is 6,598.
What is the Ratio of Males per 100 Females in Clay County?
There are 100.79 Males per 100 Females in Clay County.
What is the Ratio of Females per 100 Males in Clay County?
There are 99.22 Females per 100 Males in Clay County.
What is the Median Population Age in Clay County?
Median Population Age in Clay County is 41.8 Years.
What is the Average Family Size in Clay County
Average Family Size in Clay County is 3.0 People.
What is the Average Household Size in Clay County
Average Household Size in Clay County is 2.4 People.
How Large is the Labor Force in Clay County?
There are 6,164 People in the Labor Forcein in Clay County.
What is the Percentage of People in the Labor Force in Clay County?
58.0% of People are in the Labor Force in Clay County.
What is the Unemployment Rate in Clay County?
Unemployment Rate in Clay County is 6.0%.