Alexander County, IL Map & Demographics
Alexander County Map
Alexander County Overview
$21,922
PER CAPITA INCOME
$58,106
AVG FAMILY INCOME
$40,365
AVG HOUSEHOLD INCOME
5.6%
WAGE / INCOME GAP [ % ]
94.4¢/ $1
WAGE / INCOME GAP [ $ ]
$7,567
FAMILY INCOME DEFICIT
0.45
INEQUALITY / GINI INDEX
5,261
TOTAL POPULATION
2,561
MALE POPULATION
2,700
FEMALE POPULATION
94.85
MALES / 100 FEMALES
105.43
FEMALES / 100 MALES
44.9
MEDIAN AGE
4.3
AVG FAMILY SIZE
3.0
AVG HOUSEHOLD SIZE
2,028
LABOR FORCE [ PEOPLE ]
48.0%
PERCENT IN LABOR FORCE
9.3%
UNEMPLOYMENT RATE
Alexander County Area Codes
Income in Alexander County
Income Overview in Alexander County
Per Capita Income in Alexander County is $21,922, while median incomes of families and households are $58,106 and $40,365 respectively.
| Characteristic | Number | Measure |
| Per Capita Income | 5,261 | $21,922 |
| Median Family Income | 974 | $58,106 |
| Mean Family Income | 974 | $70,724 |
| Median Household Income | 1,727 | $40,365 |
| Mean Household Income | 1,727 | $53,921 |
| Income Deficit | 974 | $7,567 |
| Wage / Income Gap (%) | 5,261 | 5.63% |
| Wage / Income Gap ($) | 5,261 | 94.37¢ per $1 |
| Gini / Inequality Index | 5,261 | 0.45 |
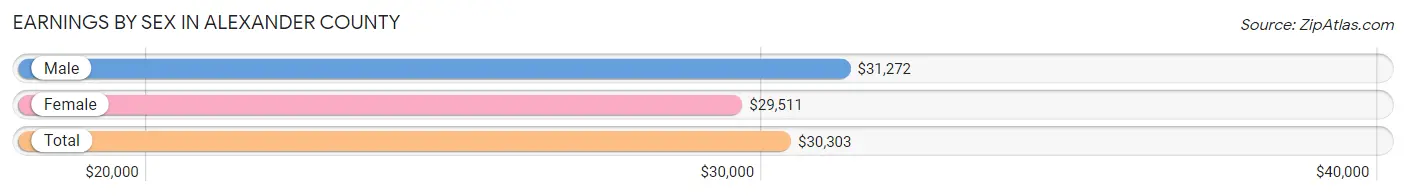
Earnings by Sex in Alexander County
Average Earnings in Alexander County are $30,303, $31,272 for men and $29,511 for women, a difference of 5.6%.
| Sex | Number | Average Earnings |
| Male | 1,110 (54.1%) | $31,272 |
| Female | 940 (45.9%) | $29,511 |
| Total | 2,050 (100.0%) | $30,303 |
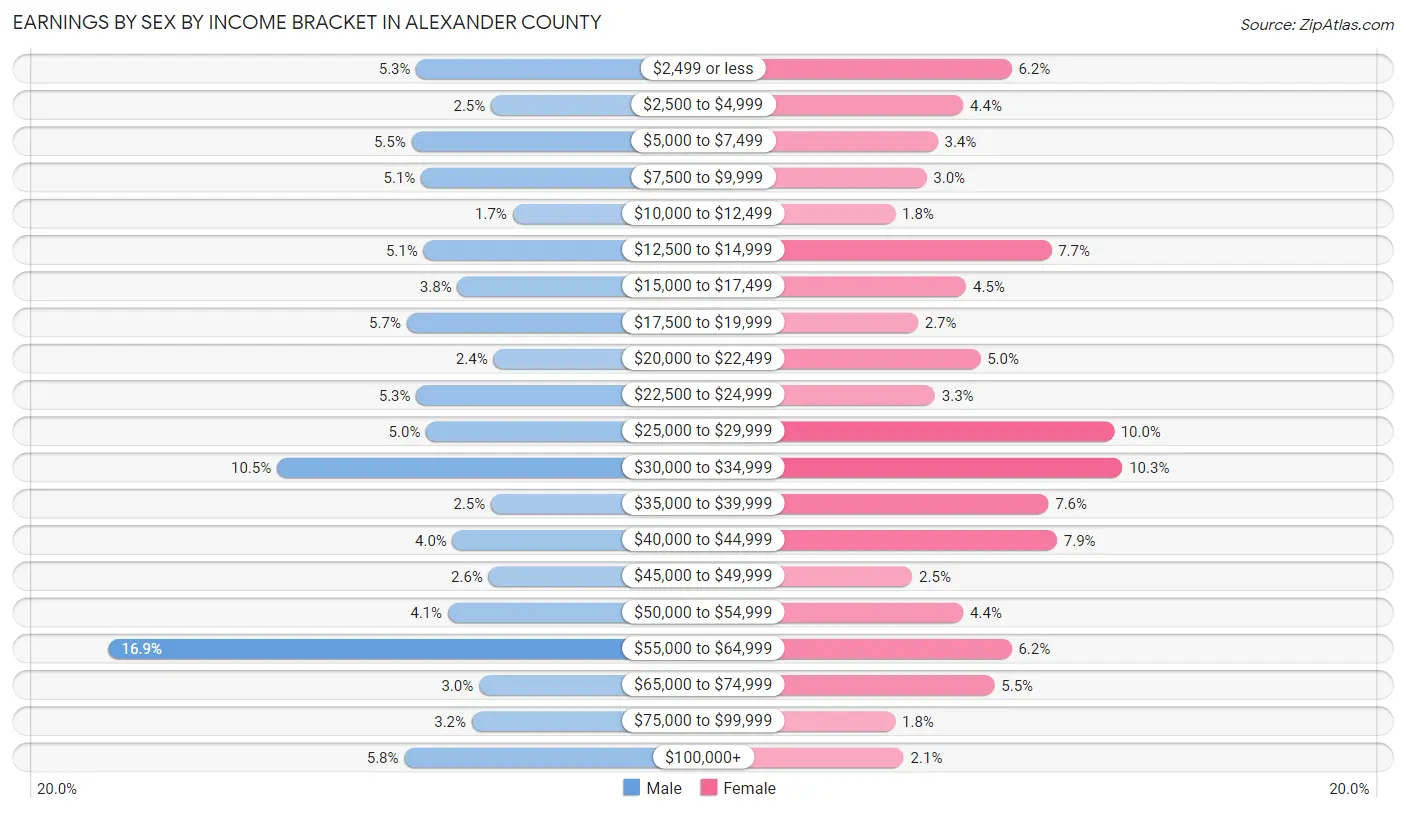
Earnings by Sex by Income Bracket in Alexander County
The most common earnings brackets in Alexander County are $55,000 to $64,999 for men (187 | 16.9%) and $30,000 to $34,999 for women (97 | 10.3%).
| Income | Male | Female |
| $2,499 or less | 59 (5.3%) | 58 (6.2%) |
| $2,500 to $4,999 | 28 (2.5%) | 41 (4.4%) |
| $5,000 to $7,499 | 61 (5.5%) | 32 (3.4%) |
| $7,500 to $9,999 | 57 (5.1%) | 28 (3.0%) |
| $10,000 to $12,499 | 19 (1.7%) | 17 (1.8%) |
| $12,500 to $14,999 | 56 (5.1%) | 72 (7.7%) |
| $15,000 to $17,499 | 42 (3.8%) | 42 (4.5%) |
| $17,500 to $19,999 | 63 (5.7%) | 25 (2.7%) |
| $20,000 to $22,499 | 27 (2.4%) | 47 (5.0%) |
| $22,500 to $24,999 | 59 (5.3%) | 31 (3.3%) |
| $25,000 to $29,999 | 55 (5.0%) | 94 (10.0%) |
| $30,000 to $34,999 | 117 (10.5%) | 97 (10.3%) |
| $35,000 to $39,999 | 28 (2.5%) | 71 (7.5%) |
| $40,000 to $44,999 | 44 (4.0%) | 74 (7.9%) |
| $45,000 to $49,999 | 29 (2.6%) | 23 (2.5%) |
| $50,000 to $54,999 | 46 (4.1%) | 41 (4.4%) |
| $55,000 to $64,999 | 187 (16.9%) | 58 (6.2%) |
| $65,000 to $74,999 | 33 (3.0%) | 52 (5.5%) |
| $75,000 to $99,999 | 36 (3.2%) | 17 (1.8%) |
| $100,000+ | 64 (5.8%) | 20 (2.1%) |
| Total | 1,110 (100.0%) | 940 (100.0%) |
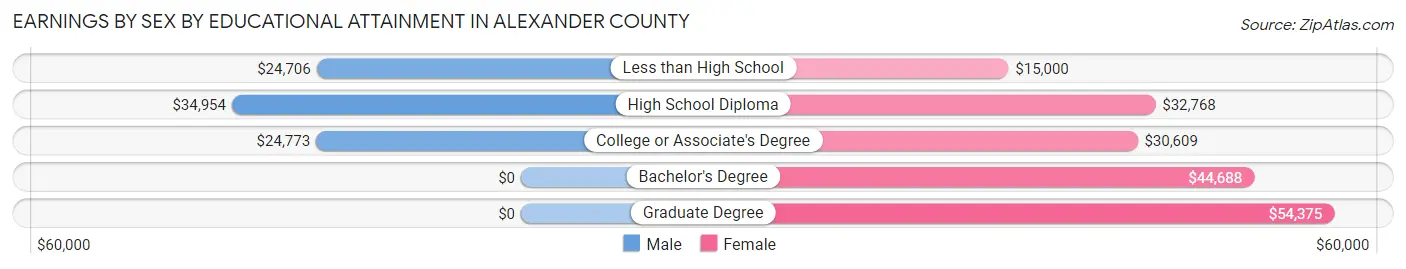
Earnings by Sex by Educational Attainment in Alexander County
Average earnings in Alexander County are $33,938 for men and $30,685 for women, a difference of 9.6%. Men with an educational attainment of high school diploma enjoy the highest average annual earnings of $34,954, while those with less than high school education earn the least with $24,706. Women with an educational attainment of graduate degree earn the most with the average annual earnings of $54,375, while those with less than high school education have the smallest earnings of $15,000.
| Educational Attainment | Male Income | Female Income |
| Less than High School | $24,706 | $15,000 |
| High School Diploma | $34,954 | $32,768 |
| College or Associate's Degree | $24,773 | $30,609 |
| Bachelor's Degree | - | - |
| Graduate Degree | - | - |
| Total | $33,938 | $30,685 |
Family Income in Alexander County
Family Income Brackets in Alexander County
According to the Alexander County family income data, there are 219 families falling into the $50,000 to $74,999 income range, which is the most common income bracket and makes up 22.5% of all families. Conversely, the $10,000 to $14,999 income bracket is the least frequent group with only 13 families (1.3%) belonging to this category.
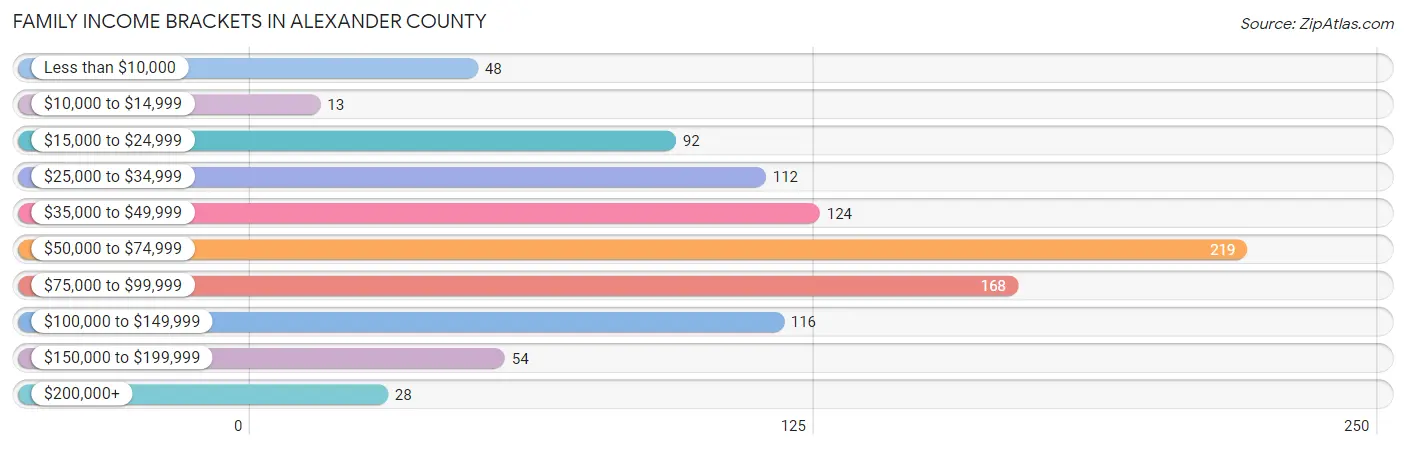
| Income Bracket | # Families | % Families |
| Less than $10,000 | 48 | 4.9% |
| $10,000 to $14,999 | 13 | 1.3% |
| $15,000 to $24,999 | 92 | 9.4% |
| $25,000 to $34,999 | 112 | 11.5% |
| $35,000 to $49,999 | 124 | 12.7% |
| $50,000 to $74,999 | 219 | 22.5% |
| $75,000 to $99,999 | 168 | 17.2% |
| $100,000 to $149,999 | 116 | 11.9% |
| $150,000 to $199,999 | 54 | 5.5% |
| $200,000+ | 28 | 2.9% |
Family Income by Famaliy Size in Alexander County
7+ person families (8 | 0.8%) account for the highest median family income in Alexander County with $76,250 per family, while 2-person families (556 | 57.1%) have the highest median income of $27,159 per family member.
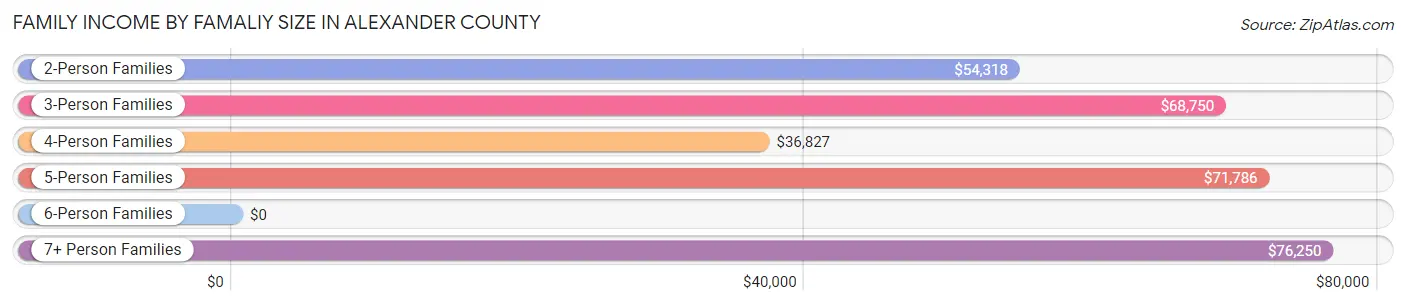
| Income Bracket | # Families | Median Income |
| 2-Person Families | 556 (57.1%) | $54,318 |
| 3-Person Families | 218 (22.4%) | $68,750 |
| 4-Person Families | 109 (11.2%) | $36,827 |
| 5-Person Families | 80 (8.2%) | $71,786 |
| 6-Person Families | 3 (0.3%) | $0 |
| 7+ Person Families | 8 (0.8%) | $76,250 |
| Total | 974 (100.0%) | $58,106 |
Family Income by Number of Earners in Alexander County
The median family income in Alexander County is $58,106, with families comprising 3+ earners (62) having the highest median family income of $123,393, while families with 1 earner (382) have the lowest median family income of $40,769, accounting for 6.4% and 39.2% of families, respectively.
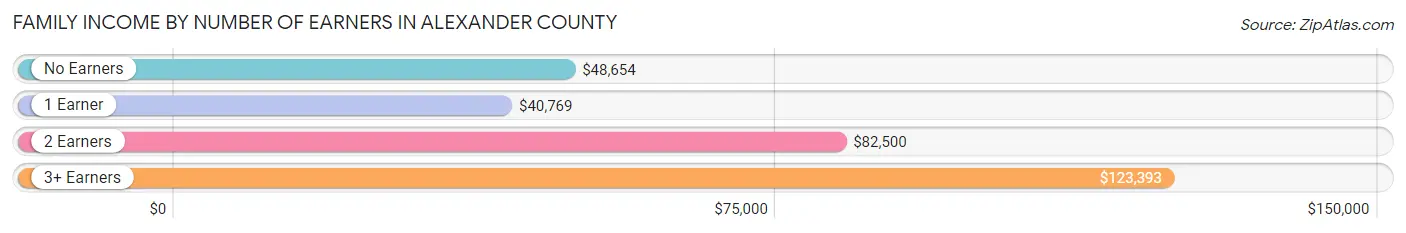
| Number of Earners | # Families | Median Income |
| No Earners | 210 (21.6%) | $48,654 |
| 1 Earner | 382 (39.2%) | $40,769 |
| 2 Earners | 320 (32.9%) | $82,500 |
| 3+ Earners | 62 (6.4%) | $123,393 |
| Total | 974 (100.0%) | $58,106 |
Household Income in Alexander County
Household Income Brackets in Alexander County
With 323 households falling in the category, the $50,000 to $74,999 income range is the most frequent in Alexander County, accounting for 18.7% of all households. In contrast, only 28 households (1.6%) fall into the $200,000+ income bracket, making it the least populous group.
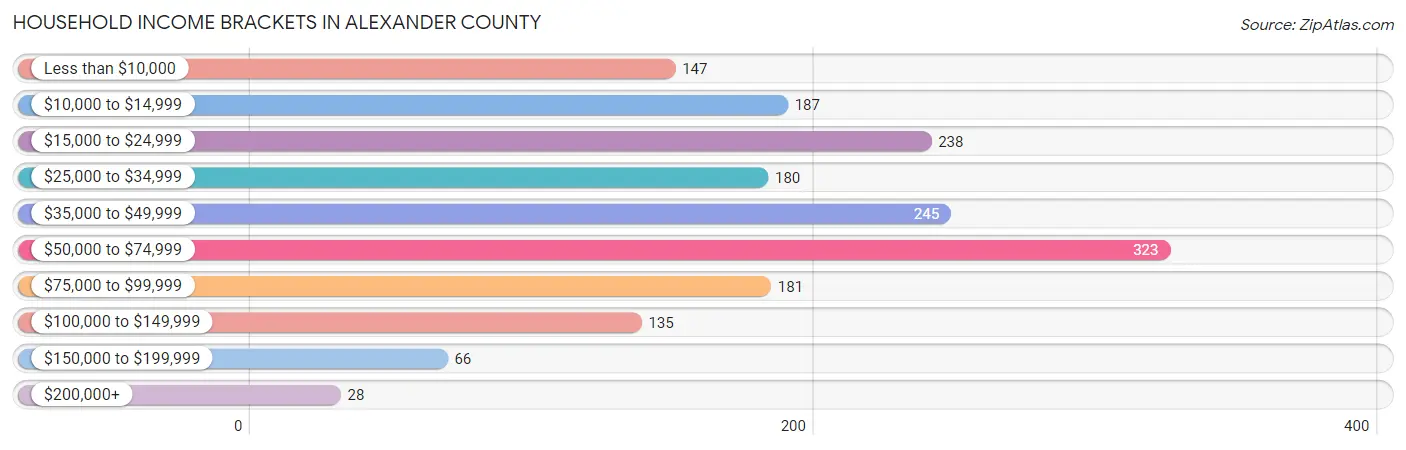
| Income Bracket | # Households | % Households |
| Less than $10,000 | 147 | 8.5% |
| $10,000 to $14,999 | 187 | 10.8% |
| $15,000 to $24,999 | 238 | 13.8% |
| $25,000 to $34,999 | 180 | 10.4% |
| $35,000 to $49,999 | 245 | 14.2% |
| $50,000 to $74,999 | 323 | 18.7% |
| $75,000 to $99,999 | 181 | 10.5% |
| $100,000 to $149,999 | 135 | 7.8% |
| $150,000 to $199,999 | 66 | 3.8% |
| $200,000+ | 28 | 1.6% |
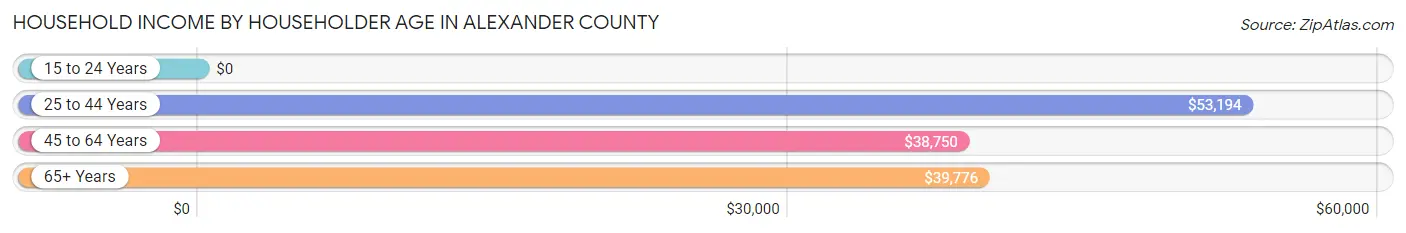
Household Income by Householder Age in Alexander County
The median household income in Alexander County is $40,365, with the highest median household income of $53,194 found in the 25 to 44 years age bracket for the primary householder. A total of 257 households (14.9%) fall into this category. Meanwhile, the 15 to 24 years age bracket for the primary householder has the lowest median household income of $0, with 2 households (0.1%) in this group.
| Income Bracket | # Households | Median Income |
| 15 to 24 Years | 2 (0.1%) | $0 |
| 25 to 44 Years | 257 (14.9%) | $53,194 |
| 45 to 64 Years | 713 (41.3%) | $38,750 |
| 65+ Years | 755 (43.7%) | $39,776 |
| Total | 1,727 (100.0%) | $40,365 |
Poverty in Alexander County
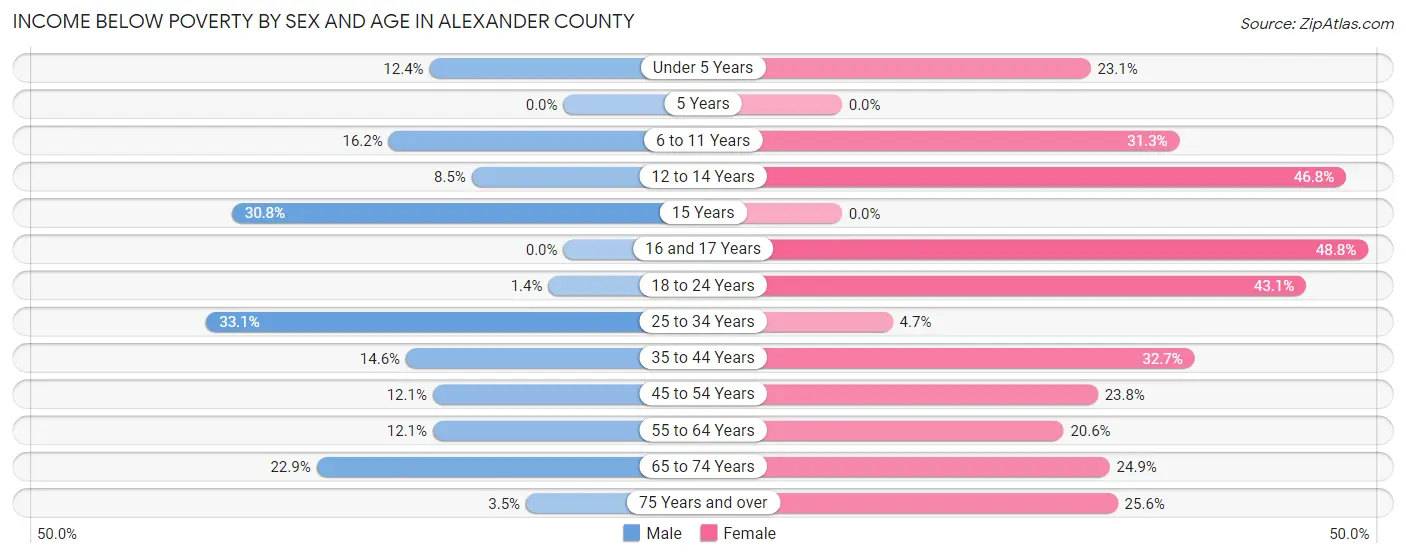
Income Below Poverty by Sex and Age in Alexander County
With 15.4% poverty level for males and 27.2% for females among the residents of Alexander County, 25 to 34 year old males and 16 and 17 year old females are the most vulnerable to poverty, with 109 males (33.1%) and 42 females (48.8%) in their respective age groups living below the poverty level.
| Age Bracket | Male | Female |
| Under 5 Years | 22 (12.4%) | 18 (23.1%) |
| 5 Years | 0 (0.0%) | 0 (0.0%) |
| 6 to 11 Years | 30 (16.2%) | 52 (31.3%) |
| 12 to 14 Years | 8 (8.5%) | 95 (46.8%) |
| 15 Years | 4 (30.8%) | 0 (0.0%) |
| 16 and 17 Years | 0 (0.0%) | 42 (48.8%) |
| 18 to 24 Years | 2 (1.4%) | 84 (43.1%) |
| 25 to 34 Years | 109 (33.1%) | 10 (4.7%) |
| 35 to 44 Years | 45 (14.6%) | 92 (32.7%) |
| 45 to 54 Years | 24 (12.1%) | 76 (23.7%) |
| 55 to 64 Years | 50 (12.1%) | 86 (20.6%) |
| 65 to 74 Years | 85 (22.9%) | 88 (24.9%) |
| 75 Years and over | 6 (3.5%) | 75 (25.6%) |
| Total | 385 (15.4%) | 718 (27.2%) |
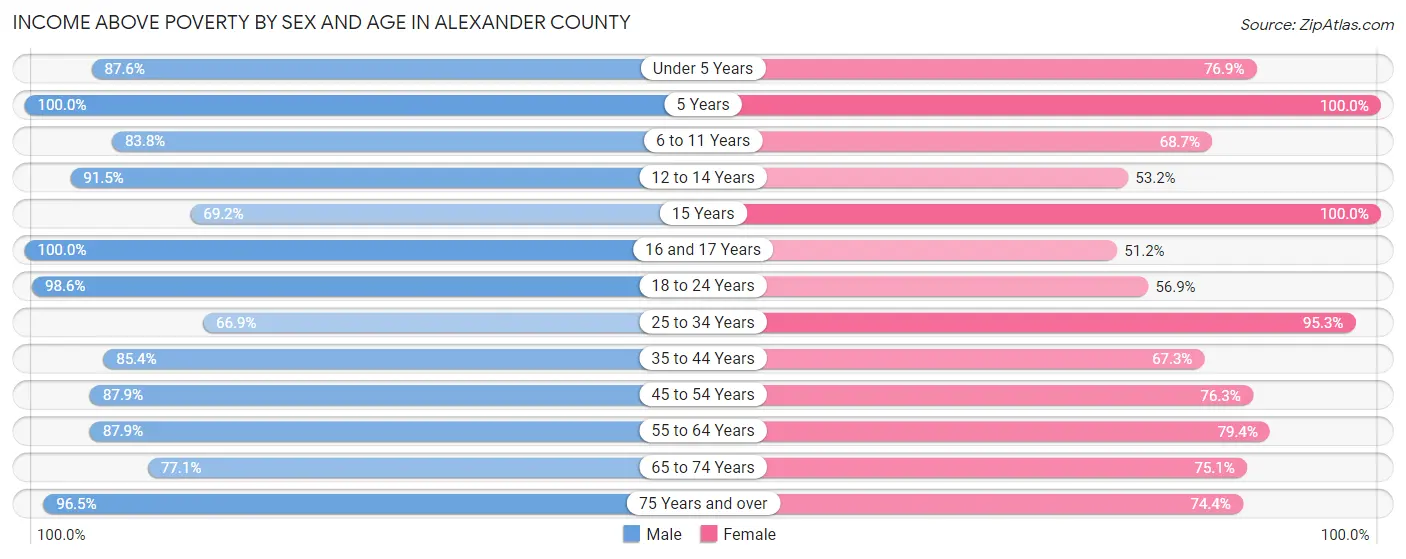
Income Above Poverty by Sex and Age in Alexander County
According to the poverty statistics in Alexander County, males aged 5 years and females aged 5 years are the age groups that are most secure financially, with 100.0% of males and 100.0% of females in these age groups living above the poverty line.
| Age Bracket | Male | Female |
| Under 5 Years | 155 (87.6%) | 60 (76.9%) |
| 5 Years | 67 (100.0%) | 22 (100.0%) |
| 6 to 11 Years | 155 (83.8%) | 114 (68.7%) |
| 12 to 14 Years | 86 (91.5%) | 108 (53.2%) |
| 15 Years | 9 (69.2%) | 15 (100.0%) |
| 16 and 17 Years | 34 (100.0%) | 44 (51.2%) |
| 18 to 24 Years | 141 (98.6%) | 111 (56.9%) |
| 25 to 34 Years | 220 (66.9%) | 202 (95.3%) |
| 35 to 44 Years | 263 (85.4%) | 189 (67.3%) |
| 45 to 54 Years | 174 (87.9%) | 244 (76.2%) |
| 55 to 64 Years | 363 (87.9%) | 332 (79.4%) |
| 65 to 74 Years | 286 (77.1%) | 266 (75.1%) |
| 75 Years and over | 167 (96.5%) | 218 (74.4%) |
| Total | 2,120 (84.6%) | 1,925 (72.8%) |
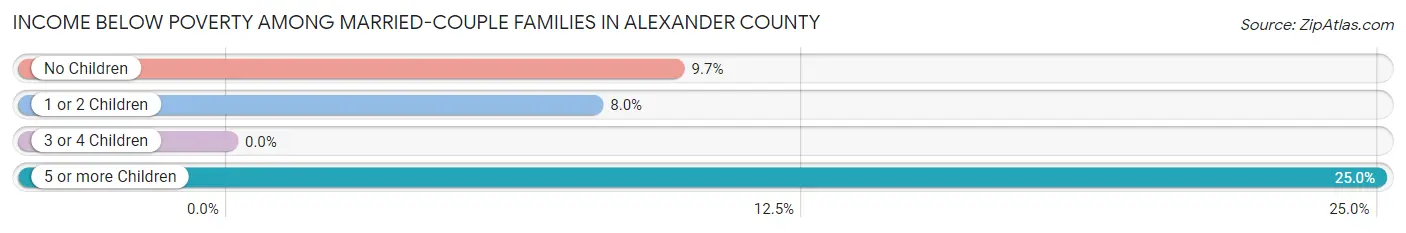
Income Below Poverty Among Married-Couple Families in Alexander County
The poverty statistics for married-couple families in Alexander County show that 8.8% or 61 of the total 690 families live below the poverty line. Families with 5 or more children have the highest poverty rate of 25.0%, comprising of 2 families. On the other hand, families with 3 or 4 children have the lowest poverty rate of 0.0%, which includes 0 families.
| Children | Above Poverty | Below Poverty |
| No Children | 483 (90.3%) | 52 (9.7%) |
| 1 or 2 Children | 81 (92.0%) | 7 (8.0%) |
| 3 or 4 Children | 59 (100.0%) | 0 (0.0%) |
| 5 or more Children | 6 (75.0%) | 2 (25.0%) |
| Total | 629 (91.2%) | 61 (8.8%) |
Income Below Poverty Among Single-Parent Households in Alexander County
According to the poverty data in Alexander County, 55.9% or 38 single-father households and 22.2% or 48 single-mother households are living below the poverty line. Among single-father households, those with 3 or 4 children have the highest poverty rate, with 4 households (100.0%) experiencing poverty. Likewise, among single-mother households, those with 1 or 2 children have the highest poverty rate, with 43 households (36.4%) falling below the poverty line.
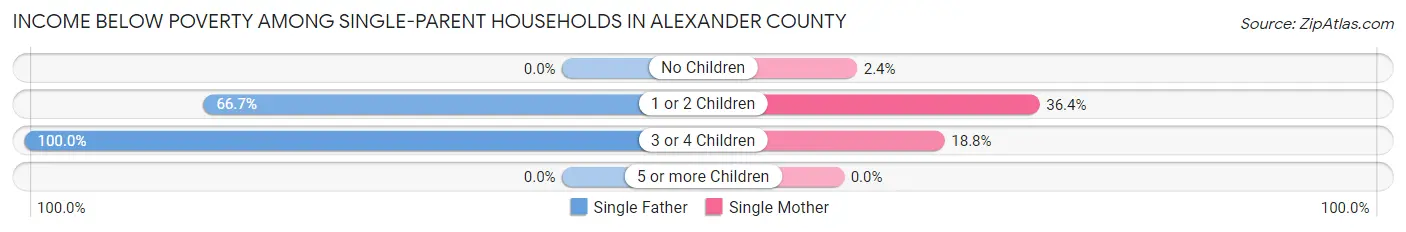
| Children | Single Father | Single Mother |
| No Children | 0 (0.0%) | 2 (2.4%) |
| 1 or 2 Children | 34 (66.7%) | 43 (36.4%) |
| 3 or 4 Children | 4 (100.0%) | 3 (18.8%) |
| 5 or more Children | 0 (0.0%) | 0 (0.0%) |
| Total | 38 (55.9%) | 48 (22.2%) |
Income Below Poverty Among Married-Couple vs Single-Parent Households in Alexander County
The poverty data for Alexander County shows that 61 of the married-couple family households (8.8%) and 86 of the single-parent households (30.3%) are living below the poverty level. Within the married-couple family households, those with 5 or more children have the highest poverty rate, with 2 households (25.0%) falling below the poverty line. Among the single-parent households, those with 1 or 2 children have the highest poverty rate, with 77 household (45.6%) living below poverty.
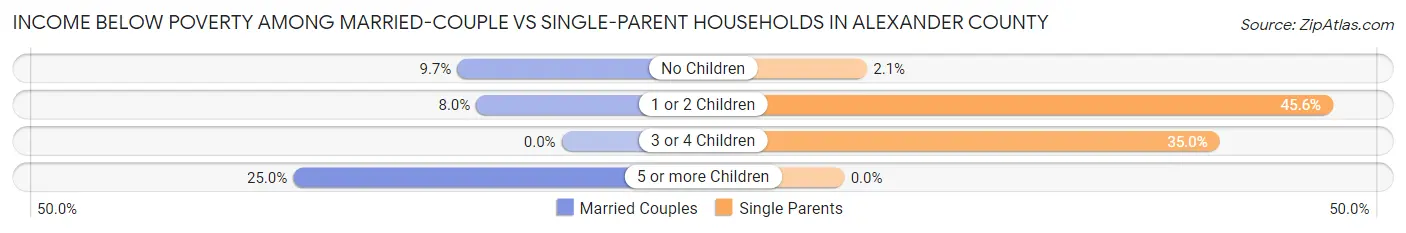
| Children | Married-Couple Families | Single-Parent Households |
| No Children | 52 (9.7%) | 2 (2.1%) |
| 1 or 2 Children | 7 (8.0%) | 77 (45.6%) |
| 3 or 4 Children | 0 (0.0%) | 7 (35.0%) |
| 5 or more Children | 2 (25.0%) | 0 (0.0%) |
| Total | 61 (8.8%) | 86 (30.3%) |
Race in Alexander County
The most populous races in Alexander County are White / Caucasian (3,340 | 63.5%), Black / African American (1,748 | 33.2%), and Two or more Races (144 | 2.7%).
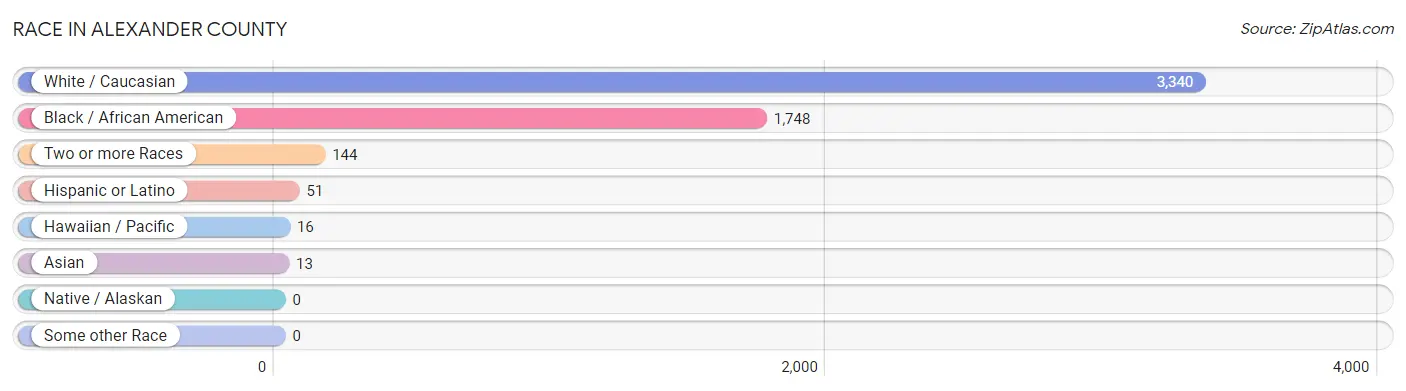
| Race | # Population | % Population |
| Asian | 13 | 0.3% |
| Black / African American | 1,748 | 33.2% |
| Hawaiian / Pacific | 16 | 0.3% |
| Hispanic or Latino | 51 | 1.0% |
| Native / Alaskan | 0 | 0.0% |
| White / Caucasian | 3,340 | 63.5% |
| Two or more Races | 144 | 2.7% |
| Some other Race | 0 | 0.0% |
| Total | 5,261 | 100.0% |
Ancestry in Alexander County
The most populous ancestries reported in Alexander County are German (647 | 12.3%), Irish (371 | 7.0%), English (351 | 6.7%), American (255 | 4.9%), and Eastern European (80 | 1.5%), together accounting for 32.4% of all Alexander County residents.
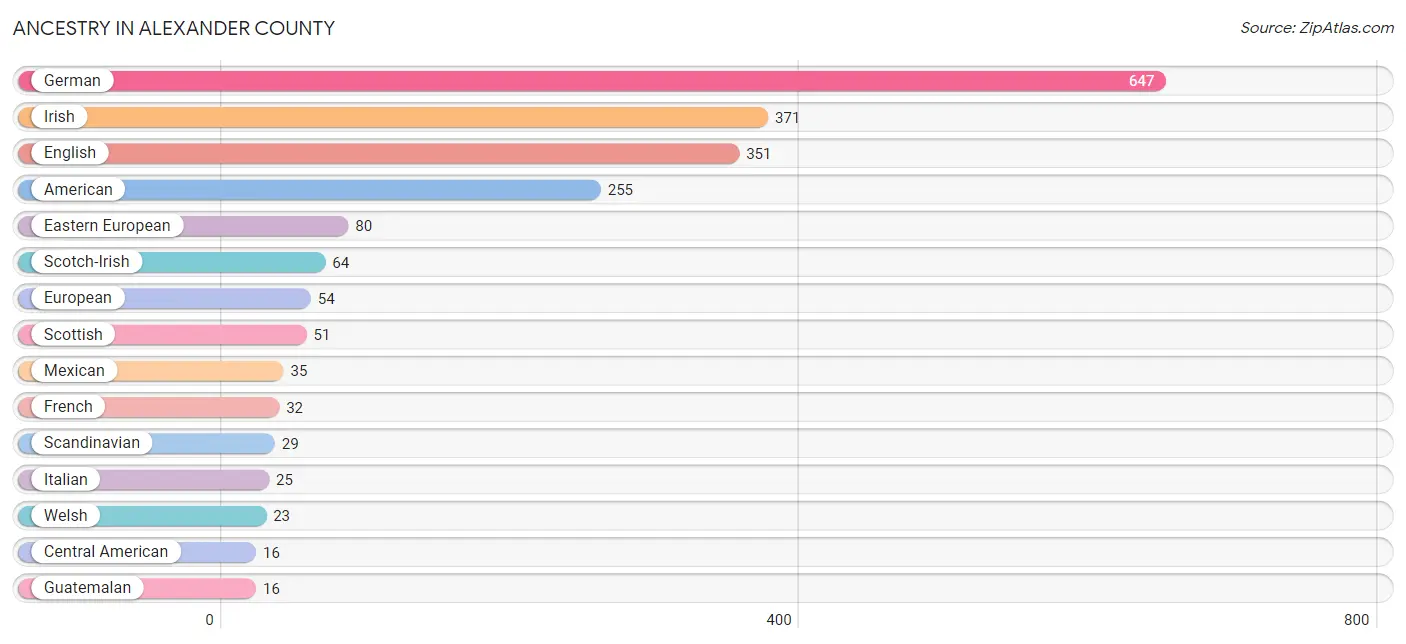
| Ancestry | # Population | % Population |
| American | 255 | 4.9% |
| Belgian | 2 | 0.0% |
| Bhutanese | 1 | 0.0% |
| Blackfeet | 1 | 0.0% |
| Central American | 16 | 0.3% |
| Cherokee | 4 | 0.1% |
| Czech | 6 | 0.1% |
| Dutch | 15 | 0.3% |
| Eastern European | 80 | 1.5% |
| English | 351 | 6.7% |
| European | 54 | 1.0% |
| French | 32 | 0.6% |
| German | 647 | 12.3% |
| Guatemalan | 16 | 0.3% |
| Indian (Asian) | 11 | 0.2% |
| Irish | 371 | 7.0% |
| Italian | 25 | 0.5% |
| Jamaican | 3 | 0.1% |
| Korean | 15 | 0.3% |
| Mexican | 35 | 0.7% |
| Native Hawaiian | 16 | 0.3% |
| Norwegian | 8 | 0.2% |
| Polish | 6 | 0.1% |
| Russian | 3 | 0.1% |
| Scandinavian | 29 | 0.5% |
| Scotch-Irish | 64 | 1.2% |
| Scottish | 51 | 1.0% |
| Swedish | 2 | 0.0% |
| Welsh | 23 | 0.4% | View All 29 Rows |
Immigrants in Alexander County
The most numerous immigrant groups reported in Alexander County came from Caribbean (23 | 0.4%), Jamaica (23 | 0.4%), Latin America (23 | 0.4%), Asia (12 | 0.2%), and Eastern Asia (12 | 0.2%), together accounting for 1.8% of all Alexander County residents.
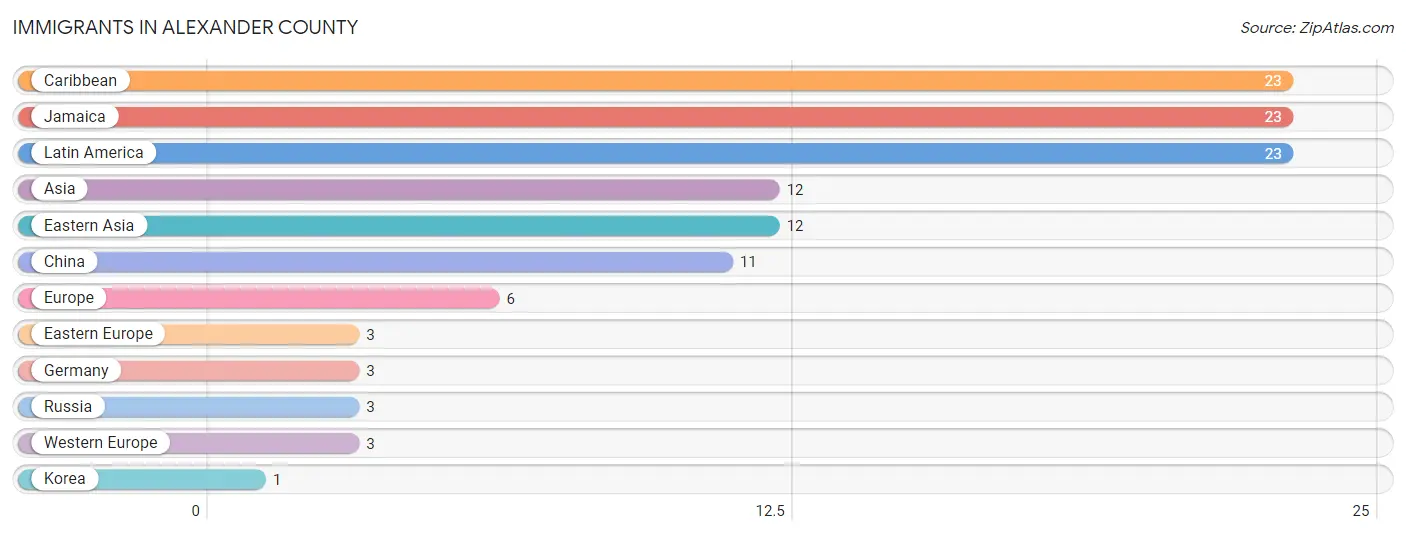
| Immigration Origin | # Population | % Population |
| Asia | 12 | 0.2% |
| Caribbean | 23 | 0.4% |
| China | 11 | 0.2% |
| Eastern Asia | 12 | 0.2% |
| Eastern Europe | 3 | 0.1% |
| Europe | 6 | 0.1% |
| Germany | 3 | 0.1% |
| Jamaica | 23 | 0.4% |
| Korea | 1 | 0.0% |
| Latin America | 23 | 0.4% |
| Russia | 3 | 0.1% |
| Western Europe | 3 | 0.1% | View All 12 Rows |
Sex and Age in Alexander County
Sex and Age in Alexander County
The most populous age groups in Alexander County are 5 to 9 Years (261 | 10.2%) for men and 55 to 59 Years (266 | 9.9%) for women.
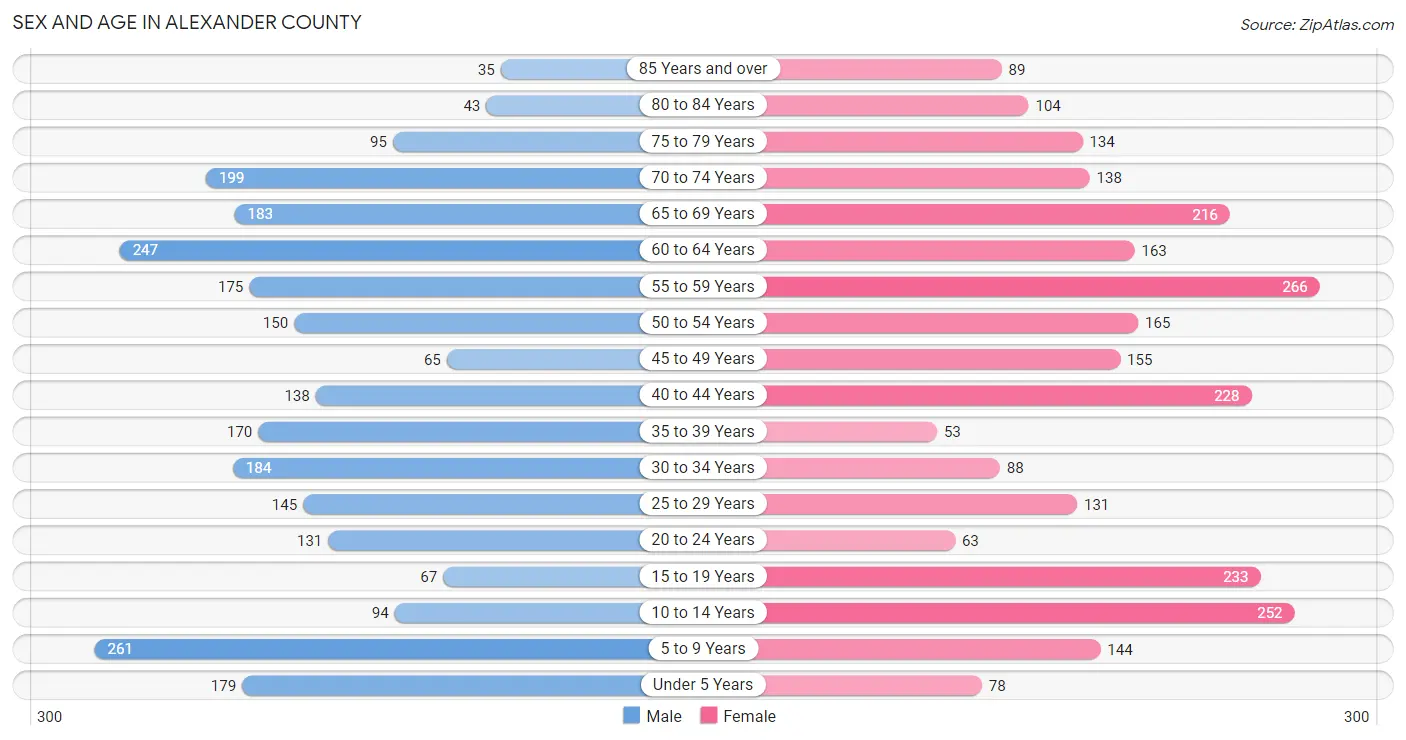
| Age Bracket | Male | Female |
| Under 5 Years | 179 (7.0%) | 78 (2.9%) |
| 5 to 9 Years | 261 (10.2%) | 144 (5.3%) |
| 10 to 14 Years | 94 (3.7%) | 252 (9.3%) |
| 15 to 19 Years | 67 (2.6%) | 233 (8.6%) |
| 20 to 24 Years | 131 (5.1%) | 63 (2.3%) |
| 25 to 29 Years | 145 (5.7%) | 131 (4.9%) |
| 30 to 34 Years | 184 (7.2%) | 88 (3.3%) |
| 35 to 39 Years | 170 (6.6%) | 53 (2.0%) |
| 40 to 44 Years | 138 (5.4%) | 228 (8.4%) |
| 45 to 49 Years | 65 (2.5%) | 155 (5.7%) |
| 50 to 54 Years | 150 (5.9%) | 165 (6.1%) |
| 55 to 59 Years | 175 (6.8%) | 266 (9.9%) |
| 60 to 64 Years | 247 (9.6%) | 163 (6.0%) |
| 65 to 69 Years | 183 (7.1%) | 216 (8.0%) |
| 70 to 74 Years | 199 (7.8%) | 138 (5.1%) |
| 75 to 79 Years | 95 (3.7%) | 134 (5.0%) |
| 80 to 84 Years | 43 (1.7%) | 104 (3.8%) |
| 85 Years and over | 35 (1.4%) | 89 (3.3%) |
| Total | 2,561 (100.0%) | 2,700 (100.0%) |
Families and Households in Alexander County
Median Family Size in Alexander County
The median family size in Alexander County is 4.29 persons per family, with single female/mother families (216 | 22.2%) accounting for the largest median family size of 6.7 persons per family. On the other hand, married-couple families (690 | 70.8%) represent the smallest median family size with 3.53 persons per family.
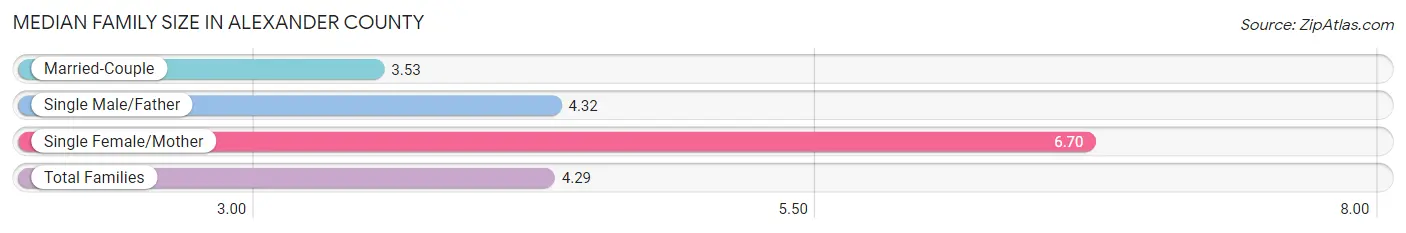
| Family Type | # Families | Family Size |
| Married-Couple | 690 (70.8%) | 3.53 |
| Single Male/Father | 68 (7.0%) | 4.32 |
| Single Female/Mother | 216 (22.2%) | 6.70 |
| Total Families | 974 (100.0%) | 4.29 |
Median Household Size in Alexander County
The median household size in Alexander County is 2.97 persons per household, with single female/mother households (216 | 12.5%) accounting for the largest median household size of 6.87 persons per household. non-family households (753 | 43.6%) represent the smallest median household size with 1.13 persons per household.
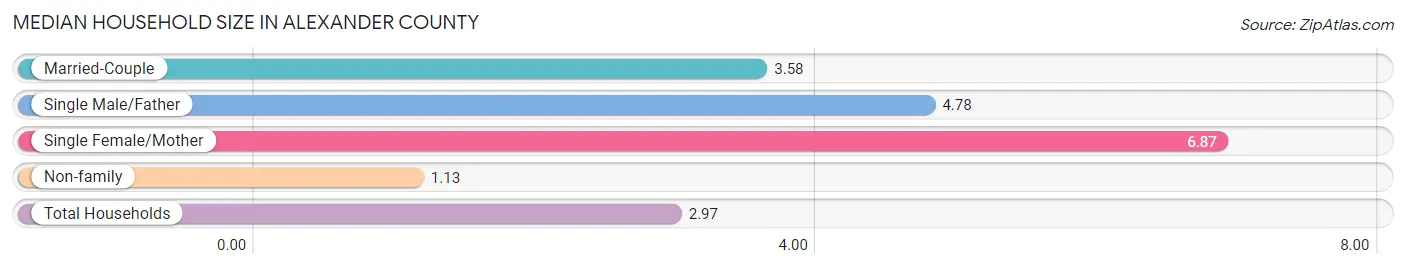
| Household Type | # Households | Household Size |
| Married-Couple | 690 (40.0%) | 3.58 |
| Single Male/Father | 68 (3.9%) | 4.78 |
| Single Female/Mother | 216 (12.5%) | 6.87 |
| Non-family | 753 (43.6%) | 1.13 |
| Total Households | 1,727 (100.0%) | 2.97 |
Household Size by Marriage Status in Alexander County
Out of a total of 1,727 households in Alexander County, 974 (56.4%) are family households, while 753 (43.6%) are nonfamily households. The most numerous type of family households are 2-person households, comprising 552, and the most common type of nonfamily households are 1-person households, comprising 714.
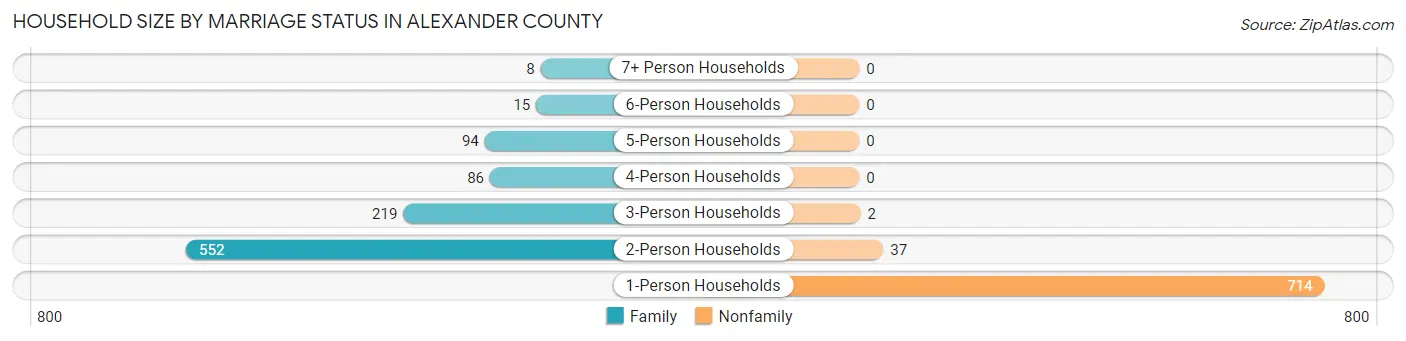
| Household Size | Family Households | Nonfamily Households |
| 1-Person Households | - | 714 (41.3%) |
| 2-Person Households | 552 (32.0%) | 37 (2.1%) |
| 3-Person Households | 219 (12.7%) | 2 (0.1%) |
| 4-Person Households | 86 (5.0%) | 0 (0.0%) |
| 5-Person Households | 94 (5.4%) | 0 (0.0%) |
| 6-Person Households | 15 (0.9%) | 0 (0.0%) |
| 7+ Person Households | 8 (0.5%) | 0 (0.0%) |
| Total | 974 (56.4%) | 753 (43.6%) |
Female Fertility in Alexander County
Fertility by Age in Alexander County
Average fertility rate in Alexander County is 40.0 births per 1,000 women. Women in the age bracket of 20 to 34 years have the highest fertility rate with 135.0 births per 1,000 women. Women in the age bracket of 20 to 34 years acount for 100.0% of all women with births.
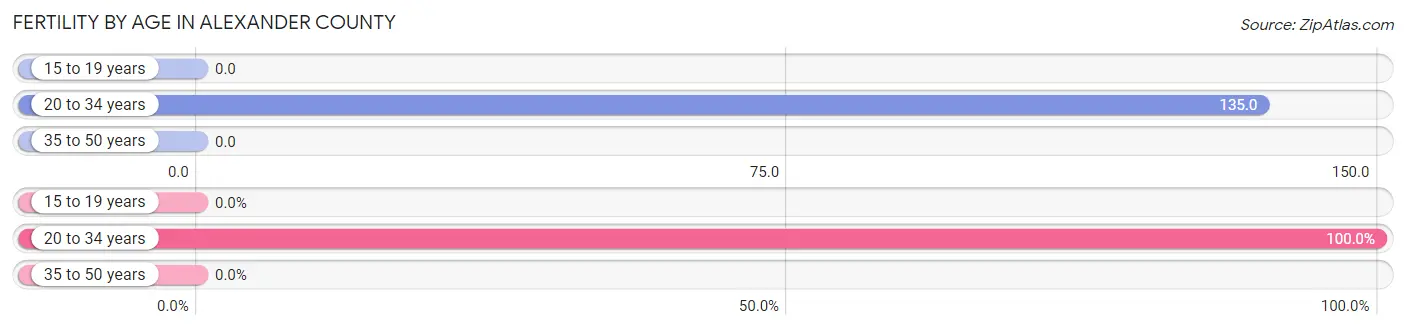
| Age Bracket | Women with Births | Births / 1,000 Women |
| 15 to 19 years | 0 (0.0%) | 0.0 |
| 20 to 34 years | 38 (100.0%) | 135.0 |
| 35 to 50 years | 0 (0.0%) | 0.0 |
| Total | 38 (100.0%) | 40.0 |
Fertility by Age by Marriage Status in Alexander County
34.2% of women with births (38) in Alexander County are married. The highest percentage of unmarried women with births falls into 20 to 34 years age bracket with 65.8% of them unmarried at the time of birth, while the lowest percentage of unmarried women with births belong to 20 to 34 years age bracket with 65.8% of them unmarried.
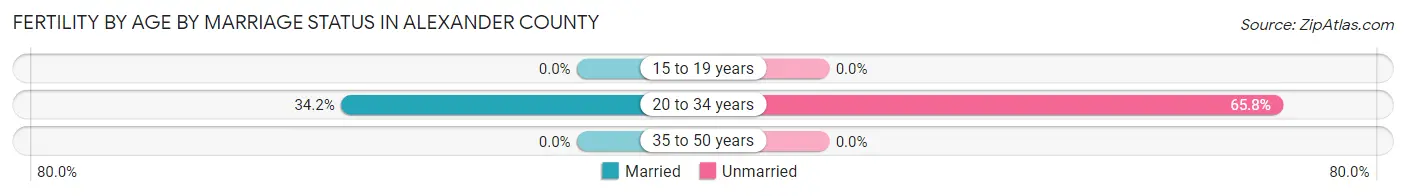
| Age Bracket | Married | Unmarried |
| 15 to 19 years | 0 (0.0%) | 0 (0.0%) |
| 20 to 34 years | 13 (34.2%) | 25 (65.8%) |
| 35 to 50 years | 0 (0.0%) | 0 (0.0%) |
| Total | 13 (34.2%) | 25 (65.8%) |
Fertility by Education in Alexander County
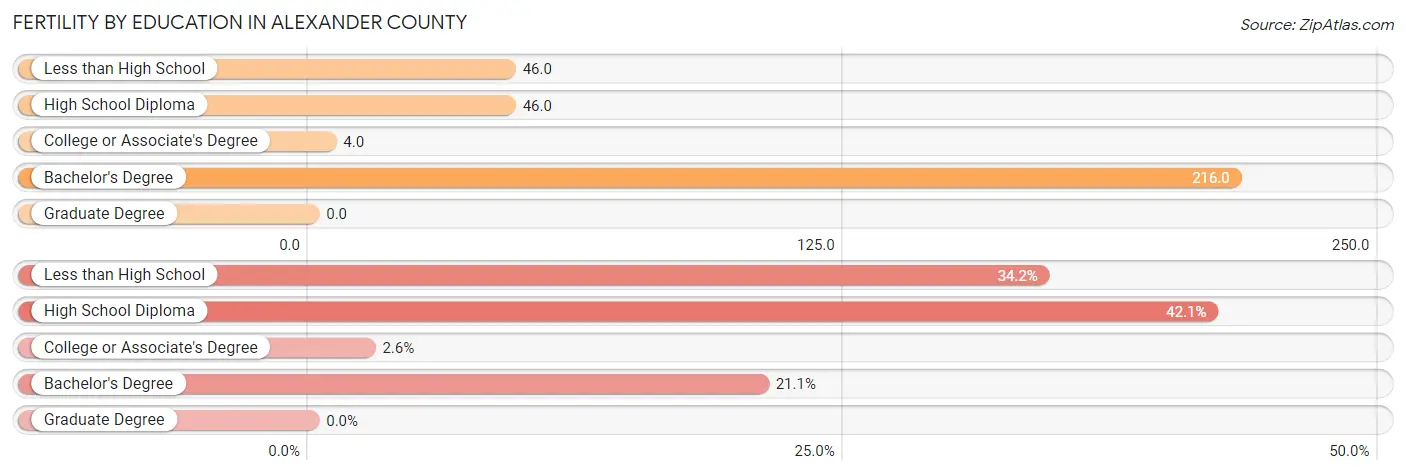
| Educational Attainment | Women with Births | Births / 1,000 Women |
| Less than High School | 13 (34.2%) | 46.0 |
| High School Diploma | 16 (42.1%) | 46.0 |
| College or Associate's Degree | 1 (2.6%) | 4.0 |
| Bachelor's Degree | 8 (21.0%) | 216.0 |
| Graduate Degree | 0 (0.0%) | 0.0 |
| Total | 38 (100.0%) | 40.0 |
Fertility by Education by Marriage Status in Alexander County
65.8% of women with births in Alexander County are unmarried. Women with the educational attainment of college or associate's degree are most likely to be married with 100.0% of them married at childbirth, while women with the educational attainment of less than high school are least likely to be married with 100.0% of them unmarried at childbirth.
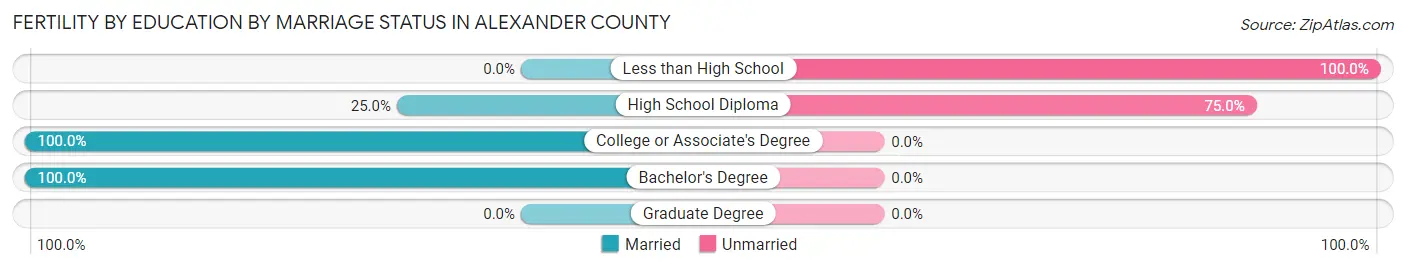
| Educational Attainment | Married | Unmarried |
| Less than High School | 0 (0.0%) | 13 (100.0%) |
| High School Diploma | 4 (25.0%) | 12 (75.0%) |
| College or Associate's Degree | 1 (100.0%) | 0 (0.0%) |
| Bachelor's Degree | 8 (100.0%) | 0 (0.0%) |
| Graduate Degree | 0 (0.0%) | 0 (0.0%) |
| Total | 13 (34.2%) | 25 (65.8%) |
Employment Characteristics in Alexander County
Employment by Class of Employer in Alexander County
Among the 1,797 employed individuals in Alexander County, private company employees (1,239 | 69.0%), local government employees (203 | 11.3%), and state government employees (150 | 8.4%) make up the most common classes of employment.
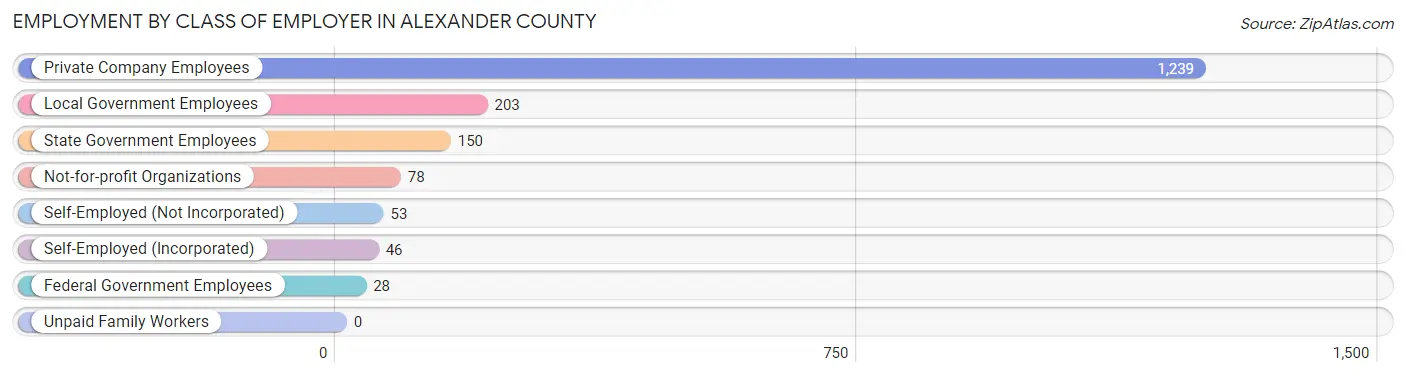
| Employer Class | # Employees | % Employees |
| Private Company Employees | 1,239 | 69.0% |
| Self-Employed (Incorporated) | 46 | 2.6% |
| Self-Employed (Not Incorporated) | 53 | 2.9% |
| Not-for-profit Organizations | 78 | 4.3% |
| Local Government Employees | 203 | 11.3% |
| State Government Employees | 150 | 8.4% |
| Federal Government Employees | 28 | 1.6% |
| Unpaid Family Workers | 0 | 0.0% |
| Total | 1,797 | 100.0% |
Employment Status by Age in Alexander County
According to the labor force statistics for Alexander County, out of the total population over 16 years of age (4,225), 48.0% or 2,028 individuals are in the labor force, with 9.3% or 189 of them unemployed. The age group with the highest labor force participation rate is 30 to 34 years, with 89.3% or 243 individuals in the labor force. Within the labor force, the 35 to 44 years age range has the highest percentage of unemployed individuals, with 26.2% or 114 of them being unemployed.
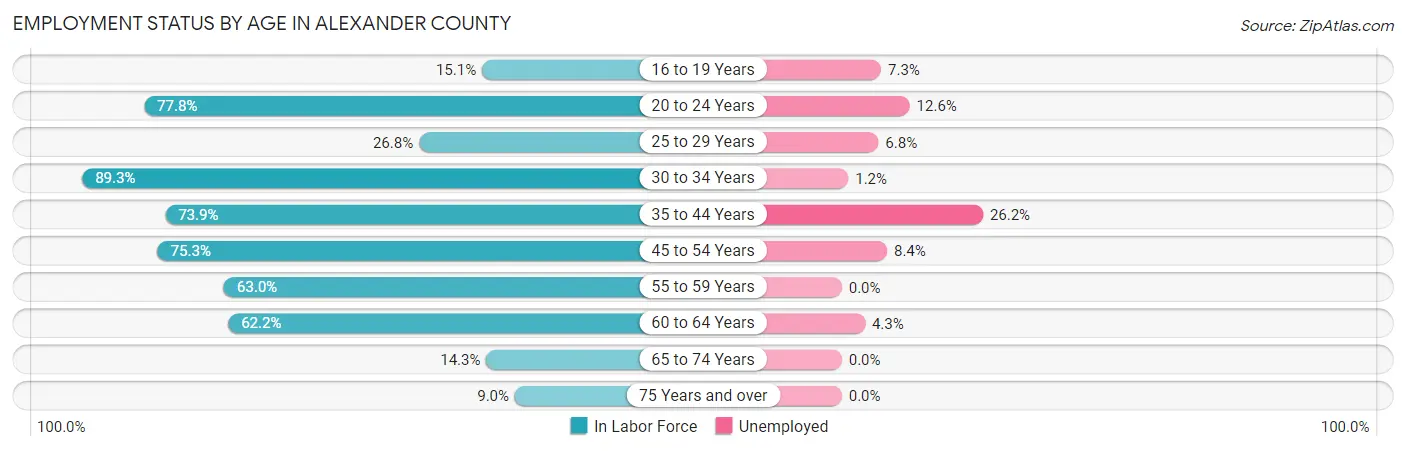
| Age Bracket | In Labor Force | Unemployed |
| 16 to 19 Years | 41 (15.1%) | 3 (7.3%) |
| 20 to 24 Years | 151 (77.8%) | 19 (12.6%) |
| 25 to 29 Years | 74 (26.8%) | 5 (6.8%) |
| 30 to 34 Years | 243 (89.3%) | 3 (1.2%) |
| 35 to 44 Years | 435 (73.9%) | 114 (26.2%) |
| 45 to 54 Years | 403 (75.3%) | 34 (8.4%) |
| 55 to 59 Years | 278 (63.0%) | 0 (0.0%) |
| 60 to 64 Years | 255 (62.2%) | 11 (4.3%) |
| 65 to 74 Years | 105 (14.3%) | 0 (0.0%) |
| 75 Years and over | 45 (9.0%) | 0 (0.0%) |
| Total | 2,028 (48.0%) | 189 (9.3%) |
Employment Status by Educational Attainment in Alexander County
According to labor force statistics for Alexander County, 66.9% of individuals (1,688) out of the total population between 25 and 64 years of age (2,523) are in the labor force, with 9.9% or 167 of them being unemployed. The group with the highest labor force participation rate are those with the educational attainment of bachelor's degree or higher, with 82.3% or 190 individuals in the labor force. Within the labor force, individuals with less than high school education have the highest percentage of unemployment, with 37.1% or 66 of them being unemployed.
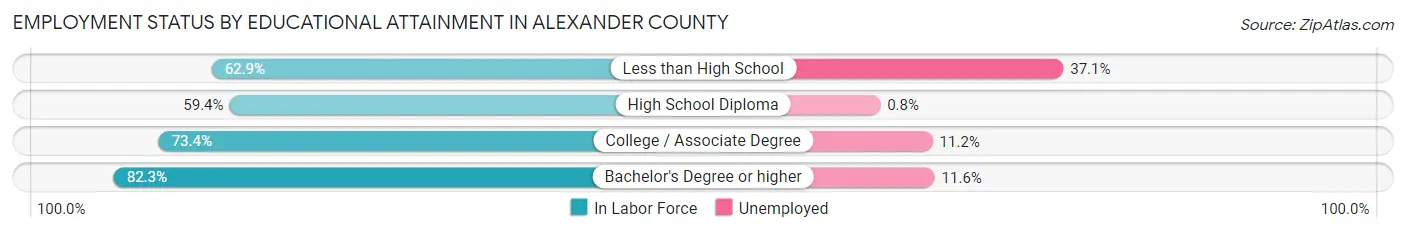
| Educational Attainment | In Labor Force | Unemployed |
| Less than High School | 178 (62.9%) | 105 (37.1%) |
| High School Diploma | 659 (59.4%) | 9 (0.8%) |
| College / Associate Degree | 661 (73.4%) | 101 (11.2%) |
| Bachelor's Degree or higher | 190 (82.3%) | 27 (11.6%) |
| Total | 1,688 (66.9%) | 250 (9.9%) |
Employment Occupations by Sex in Alexander County
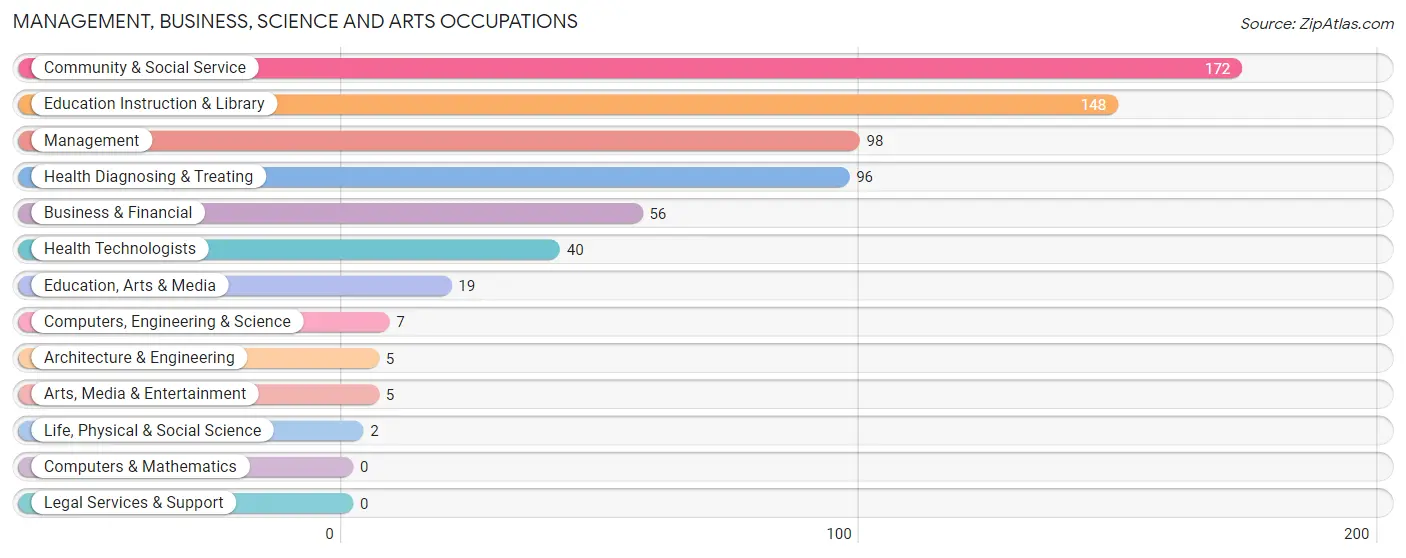
Management, Business, Science and Arts Occupations
The most common Management, Business, Science and Arts occupations in Alexander County are Community & Social Service (172 | 9.3%), Education Instruction & Library (148 | 8.0%), Management (98 | 5.3%), Health Diagnosing & Treating (96 | 5.2%), and Business & Financial (56 | 3.0%).
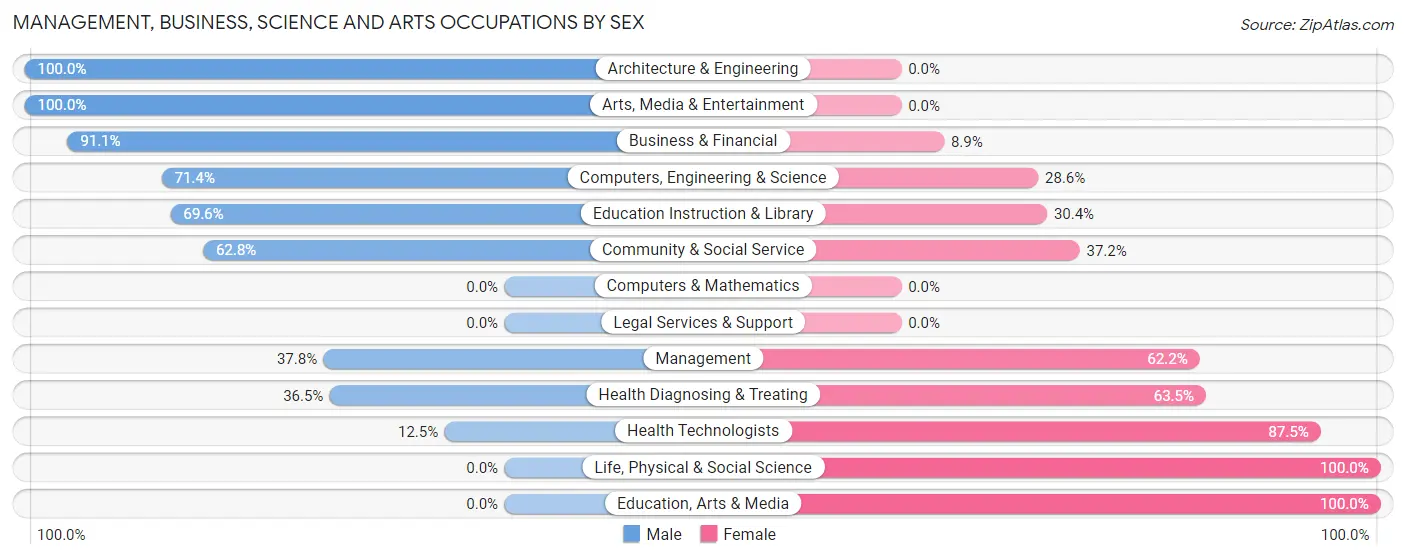
Management, Business, Science and Arts Occupations by Sex
Within the Management, Business, Science and Arts occupations in Alexander County, the most male-oriented occupations are Architecture & Engineering (100.0%), Arts, Media & Entertainment (100.0%), and Business & Financial (91.1%), while the most female-oriented occupations are Life, Physical & Social Science (100.0%), Education, Arts & Media (100.0%), and Health Technologists (87.5%).
| Occupation | Male | Female |
| Management | 37 (37.8%) | 61 (62.2%) |
| Business & Financial | 51 (91.1%) | 5 (8.9%) |
| Computers, Engineering & Science | 5 (71.4%) | 2 (28.6%) |
| Computers & Mathematics | 0 (0.0%) | 0 (0.0%) |
| Architecture & Engineering | 5 (100.0%) | 0 (0.0%) |
| Life, Physical & Social Science | 0 (0.0%) | 2 (100.0%) |
| Community & Social Service | 108 (62.8%) | 64 (37.2%) |
| Education, Arts & Media | 0 (0.0%) | 19 (100.0%) |
| Legal Services & Support | 0 (0.0%) | 0 (0.0%) |
| Education Instruction & Library | 103 (69.6%) | 45 (30.4%) |
| Arts, Media & Entertainment | 5 (100.0%) | 0 (0.0%) |
| Health Diagnosing & Treating | 35 (36.5%) | 61 (63.5%) |
| Health Technologists | 5 (12.5%) | 35 (87.5%) |
| Total (Category) | 236 (55.0%) | 193 (45.0%) |
| Total (Overall) | 1,037 (56.3%) | 804 (43.7%) |
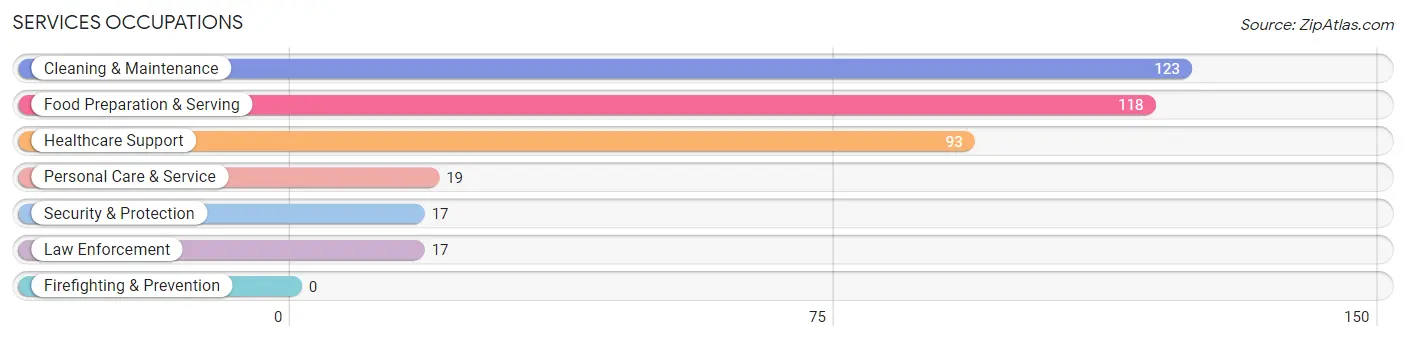
Services Occupations
The most common Services occupations in Alexander County are Cleaning & Maintenance (123 | 6.7%), Food Preparation & Serving (118 | 6.4%), Healthcare Support (93 | 5.1%), Personal Care & Service (19 | 1.0%), and Security & Protection (17 | 0.9%).
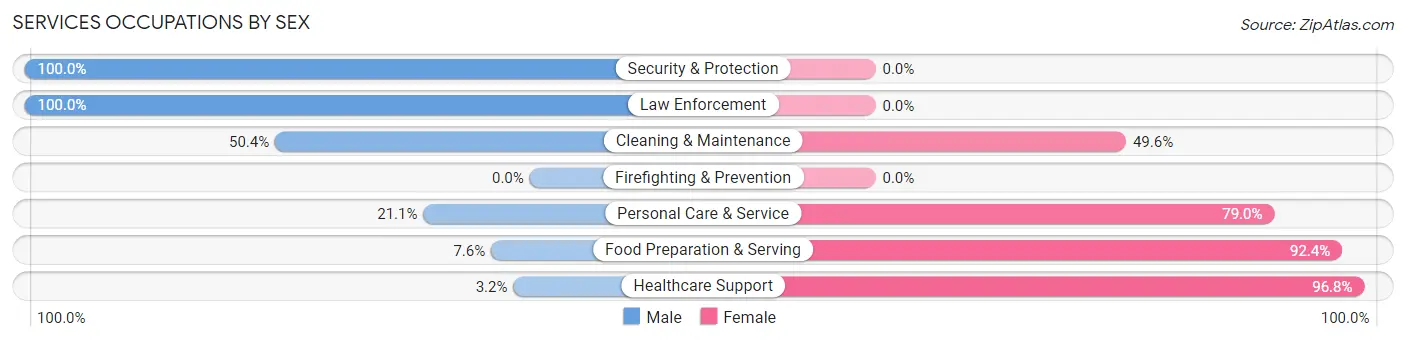
Services Occupations by Sex
Within the Services occupations in Alexander County, the most male-oriented occupations are Security & Protection (100.0%), Law Enforcement (100.0%), and Cleaning & Maintenance (50.4%), while the most female-oriented occupations are Healthcare Support (96.8%), Food Preparation & Serving (92.4%), and Personal Care & Service (78.9%).
| Occupation | Male | Female |
| Healthcare Support | 3 (3.2%) | 90 (96.8%) |
| Security & Protection | 17 (100.0%) | 0 (0.0%) |
| Firefighting & Prevention | 0 (0.0%) | 0 (0.0%) |
| Law Enforcement | 17 (100.0%) | 0 (0.0%) |
| Food Preparation & Serving | 9 (7.6%) | 109 (92.4%) |
| Cleaning & Maintenance | 62 (50.4%) | 61 (49.6%) |
| Personal Care & Service | 4 (21.0%) | 15 (78.9%) |
| Total (Category) | 95 (25.7%) | 275 (74.3%) |
| Total (Overall) | 1,037 (56.3%) | 804 (43.7%) |
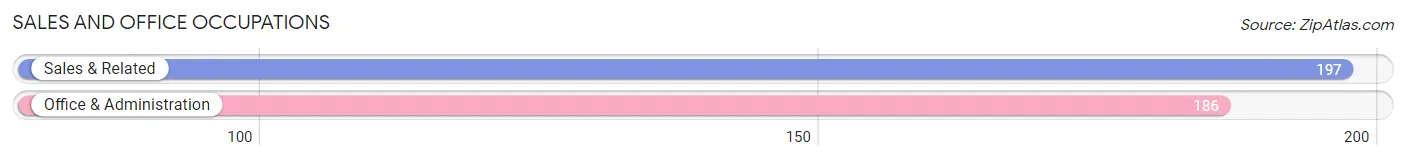
Sales and Office Occupations
The most common Sales and Office occupations in Alexander County are Sales & Related (197 | 10.7%), and Office & Administration (186 | 10.1%).
Sales and Office Occupations by Sex
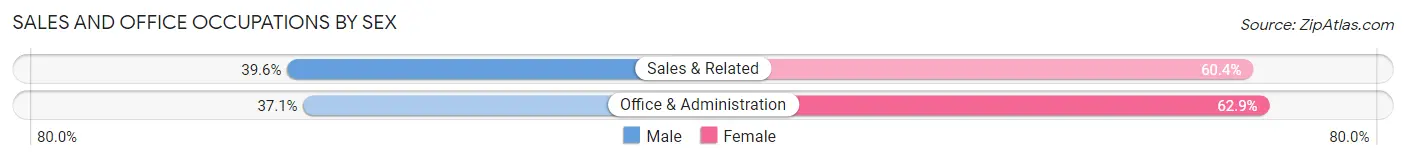
| Occupation | Male | Female |
| Sales & Related | 78 (39.6%) | 119 (60.4%) |
| Office & Administration | 69 (37.1%) | 117 (62.9%) |
| Total (Category) | 147 (38.4%) | 236 (61.6%) |
| Total (Overall) | 1,037 (56.3%) | 804 (43.7%) |
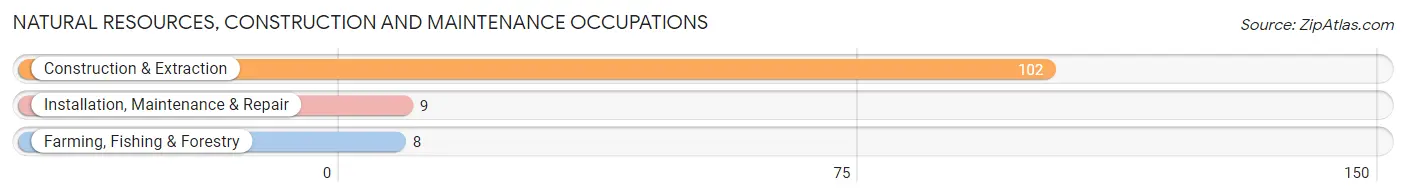
Natural Resources, Construction and Maintenance Occupations
The most common Natural Resources, Construction and Maintenance occupations in Alexander County are Construction & Extraction (102 | 5.5%), Installation, Maintenance & Repair (9 | 0.5%), and Farming, Fishing & Forestry (8 | 0.4%).
Natural Resources, Construction and Maintenance Occupations by Sex
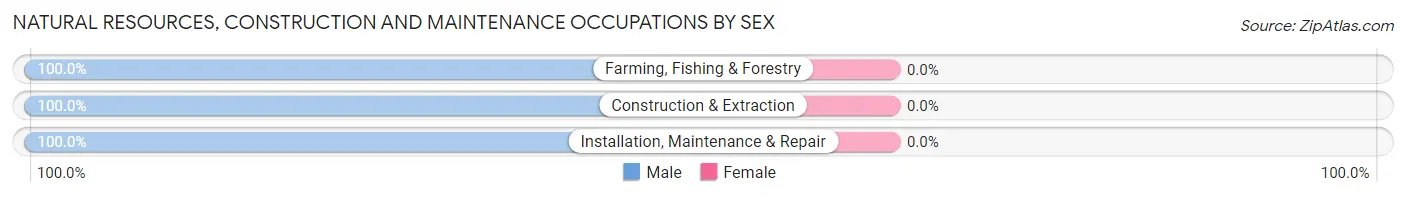
| Occupation | Male | Female |
| Farming, Fishing & Forestry | 8 (100.0%) | 0 (0.0%) |
| Construction & Extraction | 102 (100.0%) | 0 (0.0%) |
| Installation, Maintenance & Repair | 9 (100.0%) | 0 (0.0%) |
| Total (Category) | 119 (100.0%) | 0 (0.0%) |
| Total (Overall) | 1,037 (56.3%) | 804 (43.7%) |
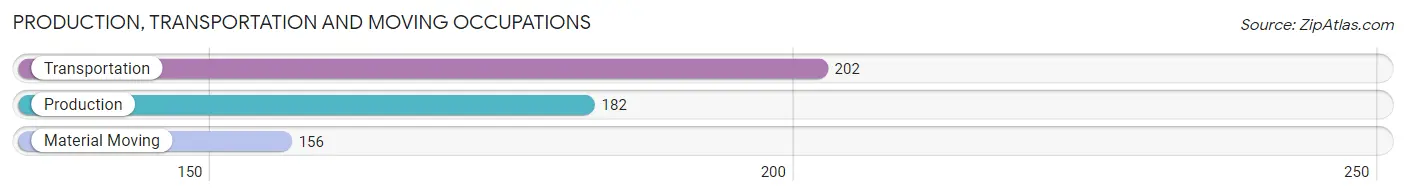
Production, Transportation and Moving Occupations
The most common Production, Transportation and Moving occupations in Alexander County are Transportation (202 | 11.0%), Production (182 | 9.9%), and Material Moving (156 | 8.5%).
Production, Transportation and Moving Occupations by Sex
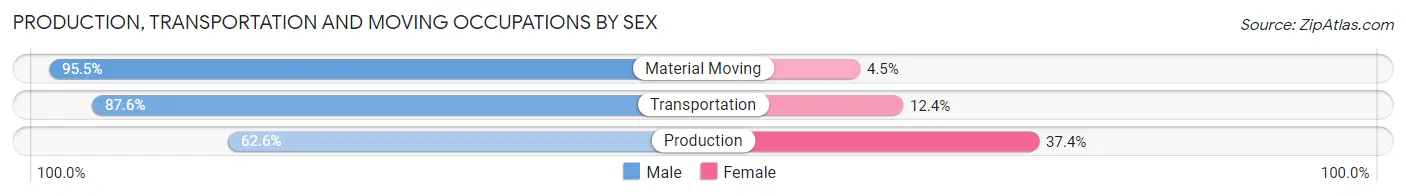
| Occupation | Male | Female |
| Production | 114 (62.6%) | 68 (37.4%) |
| Transportation | 177 (87.6%) | 25 (12.4%) |
| Material Moving | 149 (95.5%) | 7 (4.5%) |
| Total (Category) | 440 (81.5%) | 100 (18.5%) |
| Total (Overall) | 1,037 (56.3%) | 804 (43.7%) |
Employment Industries by Sex in Alexander County
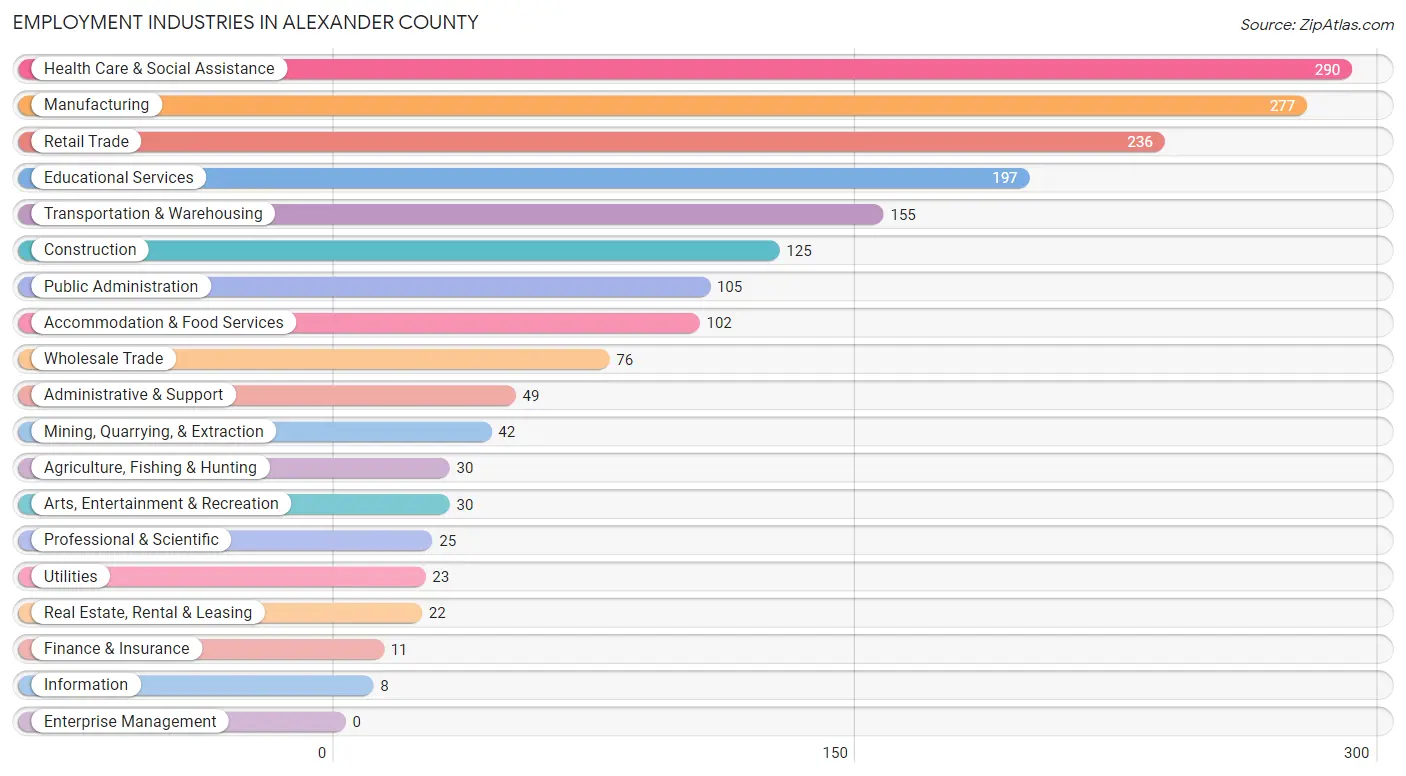
Employment Industries in Alexander County
The major employment industries in Alexander County include Health Care & Social Assistance (290 | 15.8%), Manufacturing (277 | 15.0%), Retail Trade (236 | 12.8%), Educational Services (197 | 10.7%), and Transportation & Warehousing (155 | 8.4%).
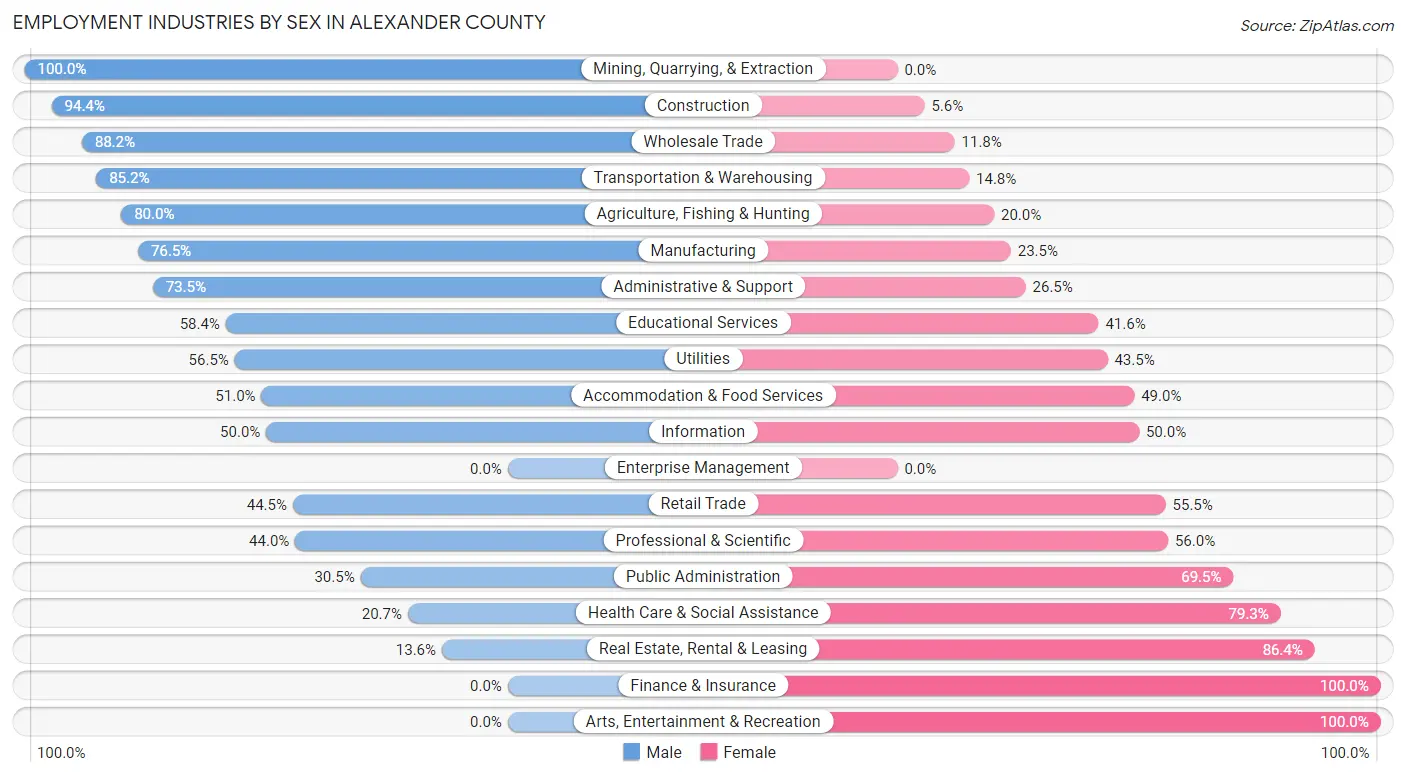
Employment Industries by Sex in Alexander County
The Alexander County industries that see more men than women are Mining, Quarrying, & Extraction (100.0%), Construction (94.4%), and Wholesale Trade (88.2%), whereas the industries that tend to have a higher number of women are Finance & Insurance (100.0%), Arts, Entertainment & Recreation (100.0%), and Real Estate, Rental & Leasing (86.4%).
| Industry | Male | Female |
| Agriculture, Fishing & Hunting | 24 (80.0%) | 6 (20.0%) |
| Mining, Quarrying, & Extraction | 42 (100.0%) | 0 (0.0%) |
| Construction | 118 (94.4%) | 7 (5.6%) |
| Manufacturing | 212 (76.5%) | 65 (23.5%) |
| Wholesale Trade | 67 (88.2%) | 9 (11.8%) |
| Retail Trade | 105 (44.5%) | 131 (55.5%) |
| Transportation & Warehousing | 132 (85.2%) | 23 (14.8%) |
| Utilities | 13 (56.5%) | 10 (43.5%) |
| Information | 4 (50.0%) | 4 (50.0%) |
| Finance & Insurance | 0 (0.0%) | 11 (100.0%) |
| Real Estate, Rental & Leasing | 3 (13.6%) | 19 (86.4%) |
| Professional & Scientific | 11 (44.0%) | 14 (56.0%) |
| Enterprise Management | 0 (0.0%) | 0 (0.0%) |
| Administrative & Support | 36 (73.5%) | 13 (26.5%) |
| Educational Services | 115 (58.4%) | 82 (41.6%) |
| Health Care & Social Assistance | 60 (20.7%) | 230 (79.3%) |
| Arts, Entertainment & Recreation | 0 (0.0%) | 30 (100.0%) |
| Accommodation & Food Services | 52 (51.0%) | 50 (49.0%) |
| Public Administration | 32 (30.5%) | 73 (69.5%) |
| Total | 1,037 (56.3%) | 804 (43.7%) |
Education in Alexander County
School Enrollment in Alexander County
The most common levels of schooling among the 1,154 students in Alexander County are high school (308 | 26.7%), elementary school (297 | 25.7%), and middle school (291 | 25.2%).

| School Level | # Students | % Students |
| Nursery / Preschool | 129 | 11.2% |
| Kindergarten | 69 | 6.0% |
| Elementary School | 297 | 25.7% |
| Middle School | 291 | 25.2% |
| High School | 308 | 26.7% |
| College / Undergraduate | 60 | 5.2% |
| Graduate / Professional | 0 | 0.0% |
| Total | 1,154 | 100.0% |
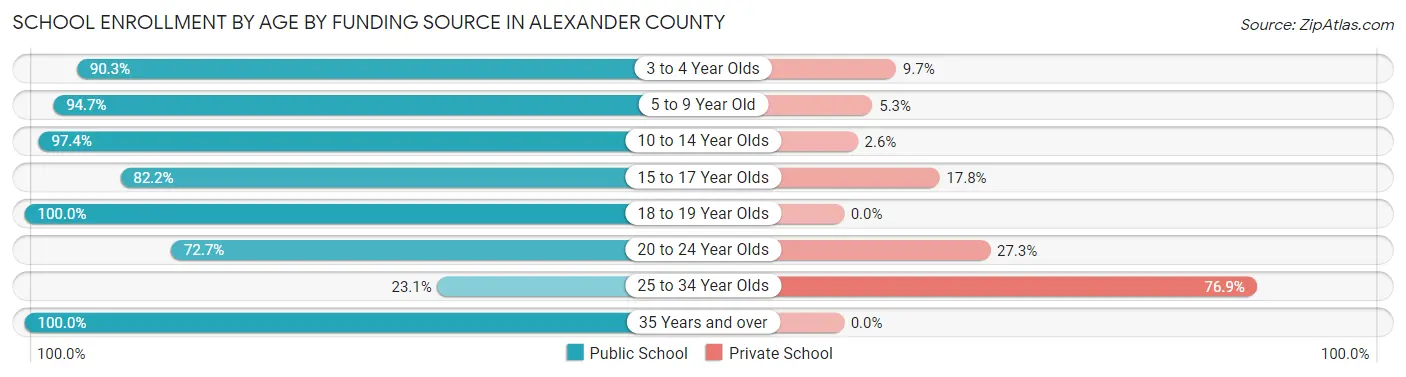
School Enrollment by Age by Funding Source in Alexander County
Out of a total of 1,154 students who are enrolled in schools in Alexander County, 97 (8.4%) attend a private institution, while the remaining 1,057 (91.6%) are enrolled in public schools. The age group of 25 to 34 year olds has the highest likelihood of being enrolled in private schools, with 30 (76.9% in the age bracket) enrolled. Conversely, the age group of 18 to 19 year olds has the lowest likelihood of being enrolled in a private school, with 117 (100.0% in the age bracket) attending a public institution.
| Age Bracket | Public School | Private School |
| 3 to 4 Year Olds | 102 (90.3%) | 11 (9.7%) |
| 5 to 9 Year Old | 373 (94.7%) | 21 (5.3%) |
| 10 to 14 Year Olds | 337 (97.4%) | 9 (2.6%) |
| 15 to 17 Year Olds | 106 (82.2%) | 23 (17.8%) |
| 18 to 19 Year Olds | 117 (100.0%) | 0 (0.0%) |
| 20 to 24 Year Olds | 8 (72.7%) | 3 (27.3%) |
| 25 to 34 Year Olds | 9 (23.1%) | 30 (76.9%) |
| 35 Years and over | 5 (100.0%) | 0 (0.0%) |
| Total | 1,057 (91.6%) | 97 (8.4%) |
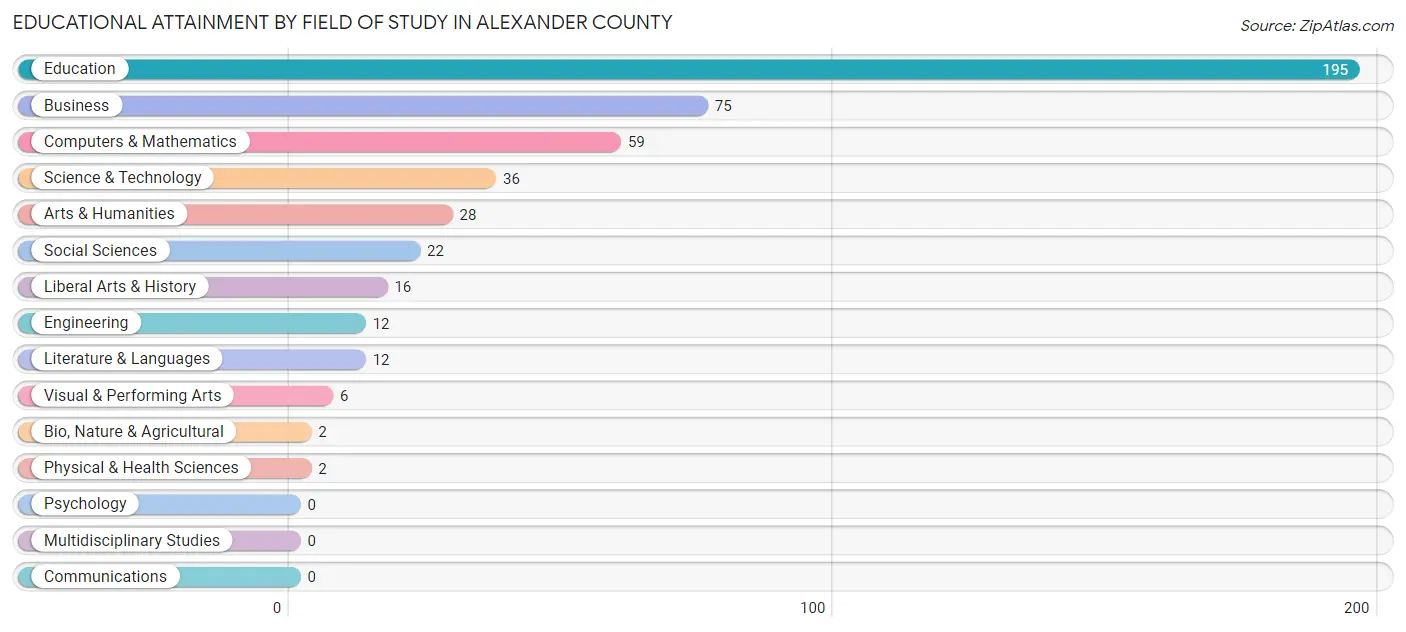
Educational Attainment by Field of Study in Alexander County
Education (195 | 41.9%), business (75 | 16.1%), computers & mathematics (59 | 12.7%), science & technology (36 | 7.7%), and arts & humanities (28 | 6.0%) are the most common fields of study among 465 individuals in Alexander County who have obtained a bachelor's degree or higher.
| Field of Study | # Graduates | % Graduates |
| Computers & Mathematics | 59 | 12.7% |
| Bio, Nature & Agricultural | 2 | 0.4% |
| Physical & Health Sciences | 2 | 0.4% |
| Psychology | 0 | 0.0% |
| Social Sciences | 22 | 4.7% |
| Engineering | 12 | 2.6% |
| Multidisciplinary Studies | 0 | 0.0% |
| Science & Technology | 36 | 7.7% |
| Business | 75 | 16.1% |
| Education | 195 | 41.9% |
| Literature & Languages | 12 | 2.6% |
| Liberal Arts & History | 16 | 3.4% |
| Visual & Performing Arts | 6 | 1.3% |
| Communications | 0 | 0.0% |
| Arts & Humanities | 28 | 6.0% |
| Total | 465 | 100.0% |
Transportation & Commute in Alexander County
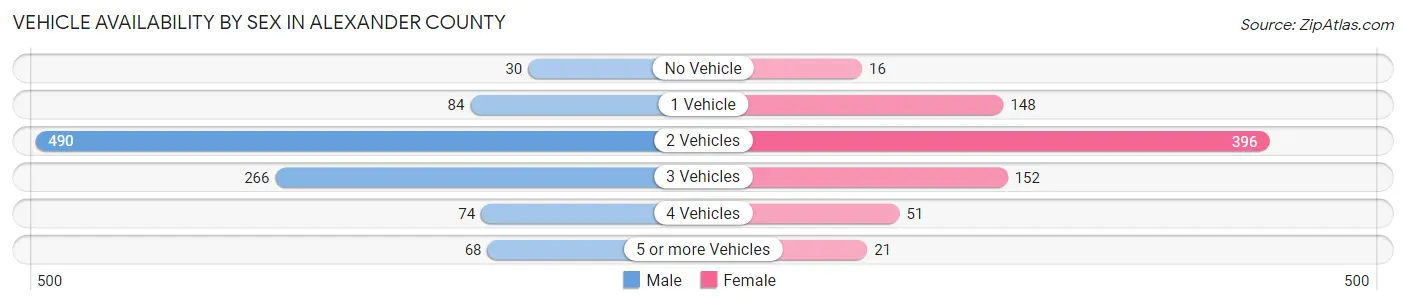
Vehicle Availability by Sex in Alexander County
The most prevalent vehicle ownership categories in Alexander County are males with 2 vehicles (490, accounting for 48.4%) and females with 2 vehicles (396, making up 62.5%).
| Vehicles Available | Male | Female |
| No Vehicle | 30 (3.0%) | 16 (2.0%) |
| 1 Vehicle | 84 (8.3%) | 148 (18.9%) |
| 2 Vehicles | 490 (48.4%) | 396 (50.5%) |
| 3 Vehicles | 266 (26.3%) | 152 (19.4%) |
| 4 Vehicles | 74 (7.3%) | 51 (6.5%) |
| 5 or more Vehicles | 68 (6.7%) | 21 (2.7%) |
| Total | 1,012 (100.0%) | 784 (100.0%) |
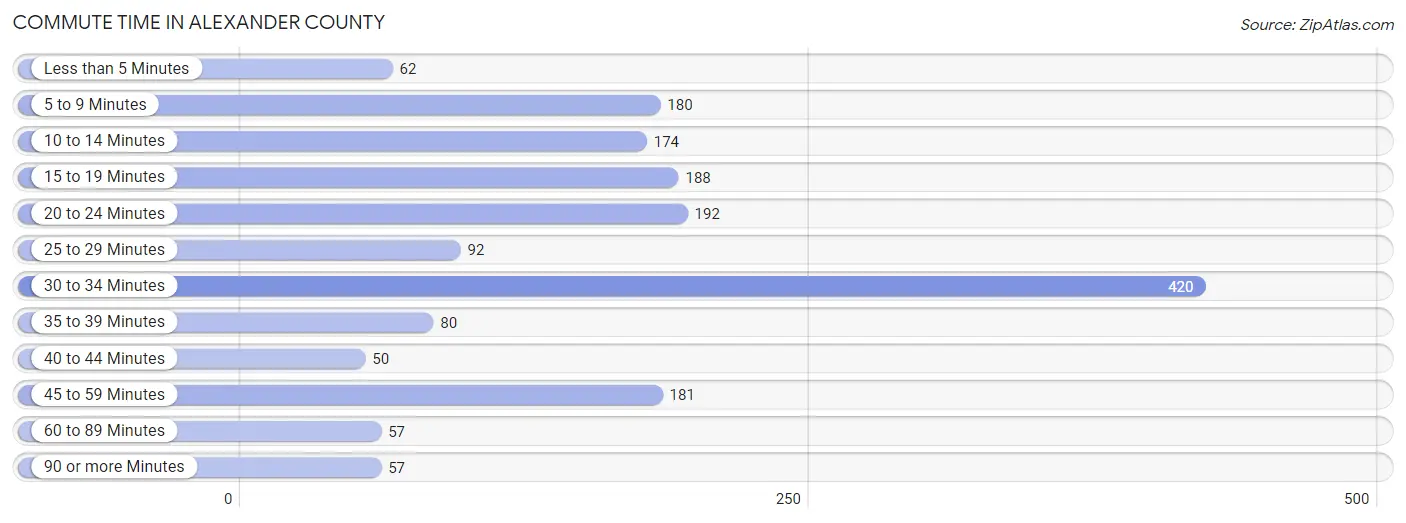
Commute Time in Alexander County
The most frequently occuring commute durations in Alexander County are 30 to 34 minutes (420 commuters, 24.2%), 20 to 24 minutes (192 commuters, 11.1%), and 15 to 19 minutes (188 commuters, 10.8%).
| Commute Time | # Commuters | % Commuters |
| Less than 5 Minutes | 62 | 3.6% |
| 5 to 9 Minutes | 180 | 10.4% |
| 10 to 14 Minutes | 174 | 10.0% |
| 15 to 19 Minutes | 188 | 10.8% |
| 20 to 24 Minutes | 192 | 11.1% |
| 25 to 29 Minutes | 92 | 5.3% |
| 30 to 34 Minutes | 420 | 24.2% |
| 35 to 39 Minutes | 80 | 4.6% |
| 40 to 44 Minutes | 50 | 2.9% |
| 45 to 59 Minutes | 181 | 10.4% |
| 60 to 89 Minutes | 57 | 3.3% |
| 90 or more Minutes | 57 | 3.3% |
Commute Time by Sex in Alexander County
The most common commute times in Alexander County are 30 to 34 minutes (189 commuters, 19.3%) for males and 30 to 34 minutes (231 commuters, 30.6%) for females.
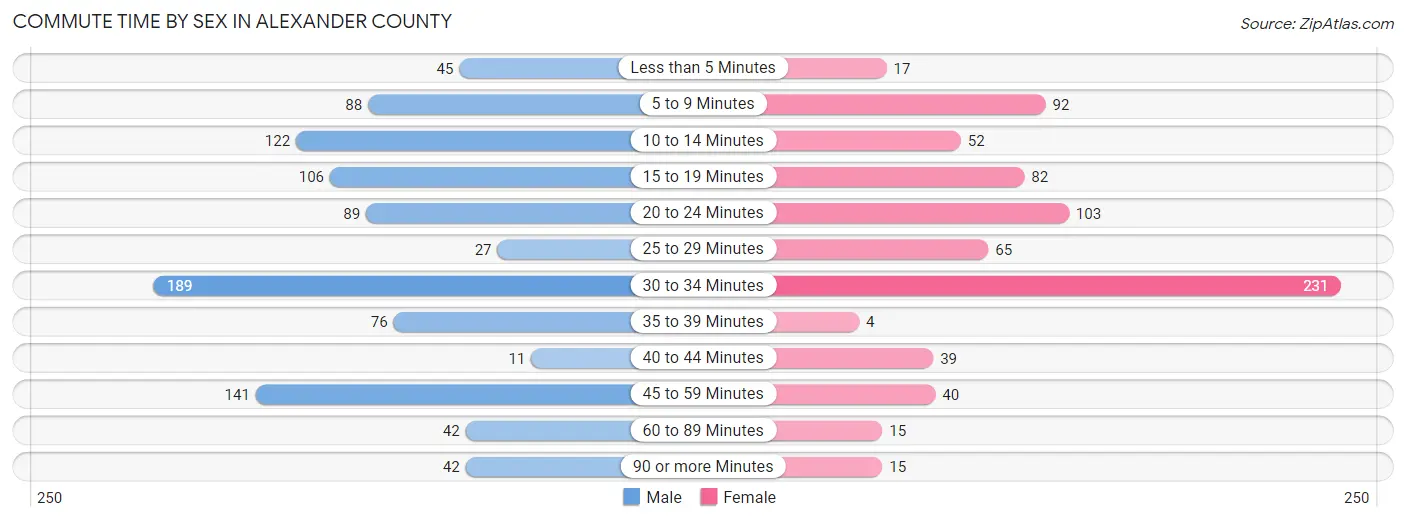
| Commute Time | Male | Female |
| Less than 5 Minutes | 45 (4.6%) | 17 (2.2%) |
| 5 to 9 Minutes | 88 (9.0%) | 92 (12.2%) |
| 10 to 14 Minutes | 122 (12.5%) | 52 (6.9%) |
| 15 to 19 Minutes | 106 (10.8%) | 82 (10.9%) |
| 20 to 24 Minutes | 89 (9.1%) | 103 (13.6%) |
| 25 to 29 Minutes | 27 (2.8%) | 65 (8.6%) |
| 30 to 34 Minutes | 189 (19.3%) | 231 (30.6%) |
| 35 to 39 Minutes | 76 (7.8%) | 4 (0.5%) |
| 40 to 44 Minutes | 11 (1.1%) | 39 (5.2%) |
| 45 to 59 Minutes | 141 (14.4%) | 40 (5.3%) |
| 60 to 89 Minutes | 42 (4.3%) | 15 (2.0%) |
| 90 or more Minutes | 42 (4.3%) | 15 (2.0%) |
Time of Departure to Work by Sex in Alexander County
The most frequent times of departure to work in Alexander County are 8:00 AM to 8:29 AM (293, 30.0%) for males and 7:30 AM to 7:59 AM (147, 19.5%) for females.
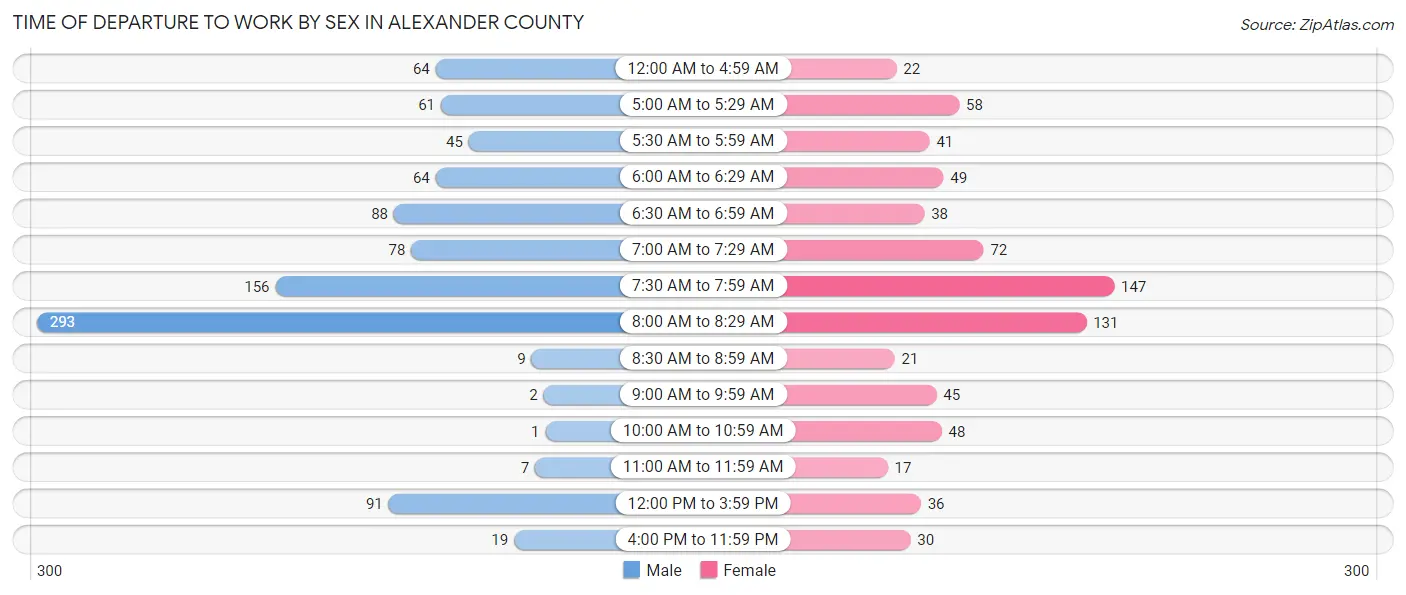
| Time of Departure | Male | Female |
| 12:00 AM to 4:59 AM | 64 (6.5%) | 22 (2.9%) |
| 5:00 AM to 5:29 AM | 61 (6.2%) | 58 (7.7%) |
| 5:30 AM to 5:59 AM | 45 (4.6%) | 41 (5.4%) |
| 6:00 AM to 6:29 AM | 64 (6.5%) | 49 (6.5%) |
| 6:30 AM to 6:59 AM | 88 (9.0%) | 38 (5.0%) |
| 7:00 AM to 7:29 AM | 78 (8.0%) | 72 (9.5%) |
| 7:30 AM to 7:59 AM | 156 (16.0%) | 147 (19.5%) |
| 8:00 AM to 8:29 AM | 293 (30.0%) | 131 (17.3%) |
| 8:30 AM to 8:59 AM | 9 (0.9%) | 21 (2.8%) |
| 9:00 AM to 9:59 AM | 2 (0.2%) | 45 (6.0%) |
| 10:00 AM to 10:59 AM | 1 (0.1%) | 48 (6.4%) |
| 11:00 AM to 11:59 AM | 7 (0.7%) | 17 (2.2%) |
| 12:00 PM to 3:59 PM | 91 (9.3%) | 36 (4.8%) |
| 4:00 PM to 11:59 PM | 19 (1.9%) | 30 (4.0%) |
| Total | 978 (100.0%) | 755 (100.0%) |
Housing Occupancy in Alexander County
Occupancy by Ownership in Alexander County
Of the total 1,727 dwellings in Alexander County, owner-occupied units account for 1,346 (77.9%), while renter-occupied units make up 381 (22.1%).
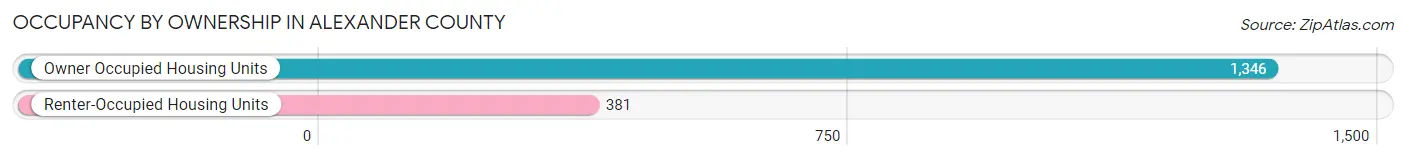
| Occupancy | # Housing Units | % Housing Units |
| Owner Occupied Housing Units | 1,346 | 77.9% |
| Renter-Occupied Housing Units | 381 | 22.1% |
| Total Occupied Housing Units | 1,727 | 100.0% |
Occupancy by Household Size in Alexander County
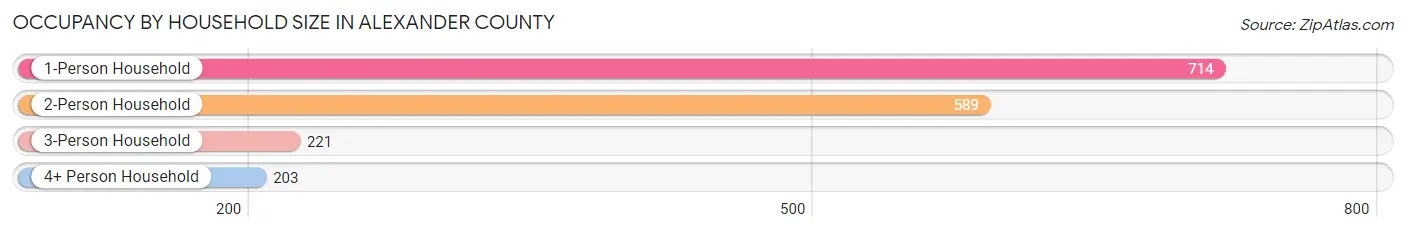
| Household Size | # Housing Units | % Housing Units |
| 1-Person Household | 714 | 41.3% |
| 2-Person Household | 589 | 34.1% |
| 3-Person Household | 221 | 12.8% |
| 4+ Person Household | 203 | 11.7% |
| Total Housing Units | 1,727 | 100.0% |
Occupancy by Ownership by Household Size in Alexander County
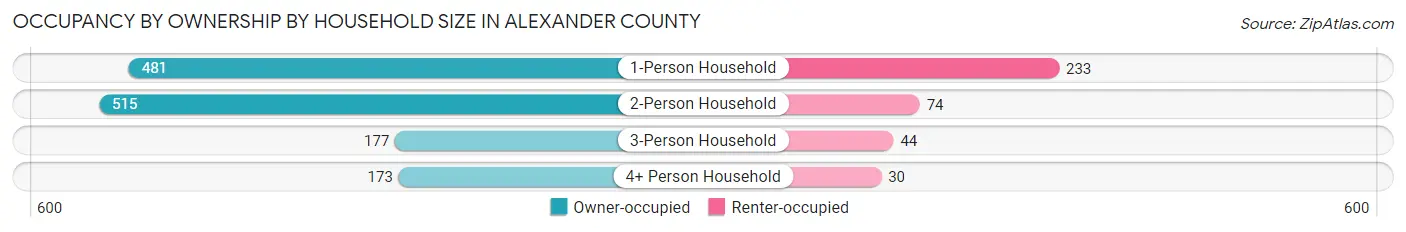
| Household Size | Owner-occupied | Renter-occupied |
| 1-Person Household | 481 (67.4%) | 233 (32.6%) |
| 2-Person Household | 515 (87.4%) | 74 (12.6%) |
| 3-Person Household | 177 (80.1%) | 44 (19.9%) |
| 4+ Person Household | 173 (85.2%) | 30 (14.8%) |
| Total Housing Units | 1,346 (77.9%) | 381 (22.1%) |
Occupancy by Educational Attainment in Alexander County
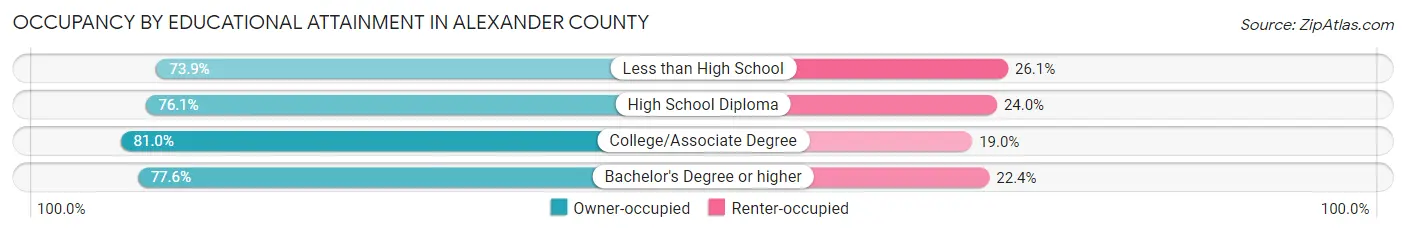
| Household Size | Owner-occupied | Renter-occupied |
| Less than High School | 178 (73.9%) | 63 (26.1%) |
| High School Diploma | 435 (76.0%) | 137 (23.9%) |
| College/Associate Degree | 574 (81.0%) | 135 (19.0%) |
| Bachelor's Degree or higher | 159 (77.6%) | 46 (22.4%) |
Occupancy by Age of Householder in Alexander County
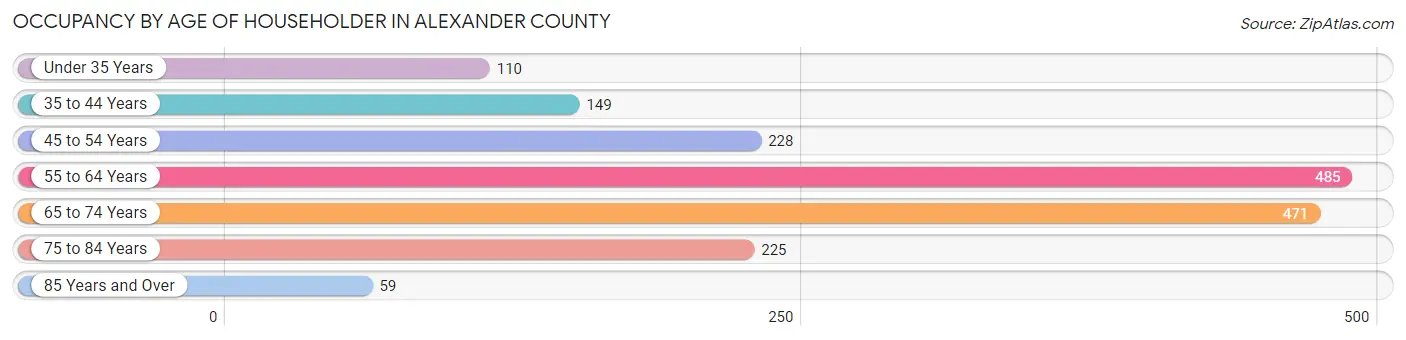
| Age Bracket | # Households | % Households |
| Under 35 Years | 110 | 6.4% |
| 35 to 44 Years | 149 | 8.6% |
| 45 to 54 Years | 228 | 13.2% |
| 55 to 64 Years | 485 | 28.1% |
| 65 to 74 Years | 471 | 27.3% |
| 75 to 84 Years | 225 | 13.0% |
| 85 Years and Over | 59 | 3.4% |
| Total | 1,727 | 100.0% |
Housing Finances in Alexander County
Median Income by Occupancy in Alexander County
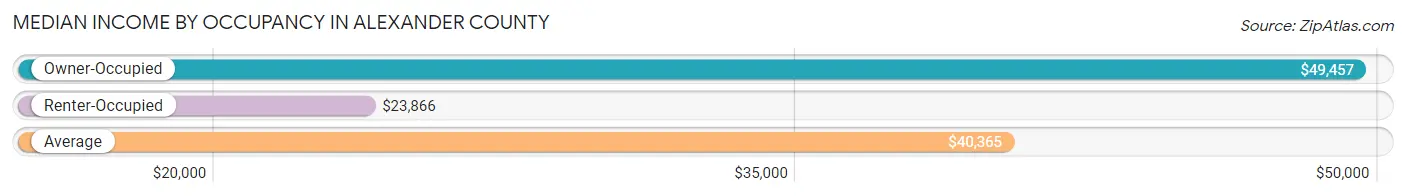
| Occupancy Type | # Households | Median Income |
| Owner-Occupied | 1,346 (77.9%) | $49,457 |
| Renter-Occupied | 381 (22.1%) | $23,866 |
| Average | 1,727 (100.0%) | $40,365 |
Occupancy by Householder Income Bracket in Alexander County
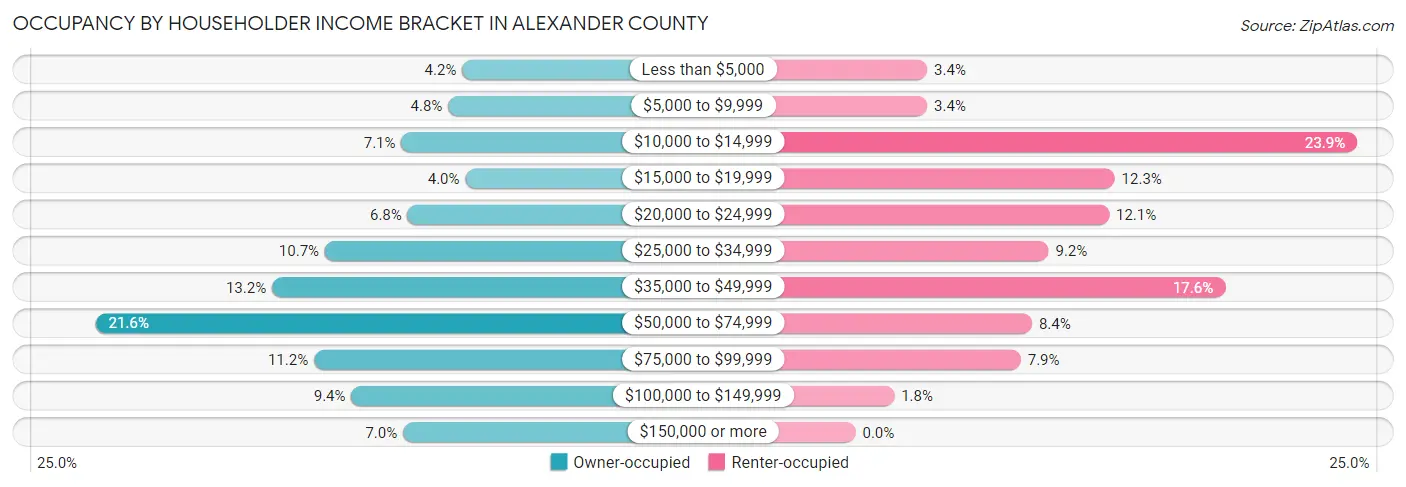
| Income Bracket | Owner-occupied | Renter-occupied |
| Less than $5,000 | 56 (4.2%) | 13 (3.4%) |
| $5,000 to $9,999 | 65 (4.8%) | 13 (3.4%) |
| $10,000 to $14,999 | 95 (7.1%) | 91 (23.9%) |
| $15,000 to $19,999 | 54 (4.0%) | 47 (12.3%) |
| $20,000 to $24,999 | 91 (6.8%) | 46 (12.1%) |
| $25,000 to $34,999 | 144 (10.7%) | 35 (9.2%) |
| $35,000 to $49,999 | 178 (13.2%) | 67 (17.6%) |
| $50,000 to $74,999 | 291 (21.6%) | 32 (8.4%) |
| $75,000 to $99,999 | 151 (11.2%) | 30 (7.9%) |
| $100,000 to $149,999 | 127 (9.4%) | 7 (1.8%) |
| $150,000 or more | 94 (7.0%) | 0 (0.0%) |
| Total | 1,346 (100.0%) | 381 (100.0%) |
Monthly Housing Cost Tiers in Alexander County
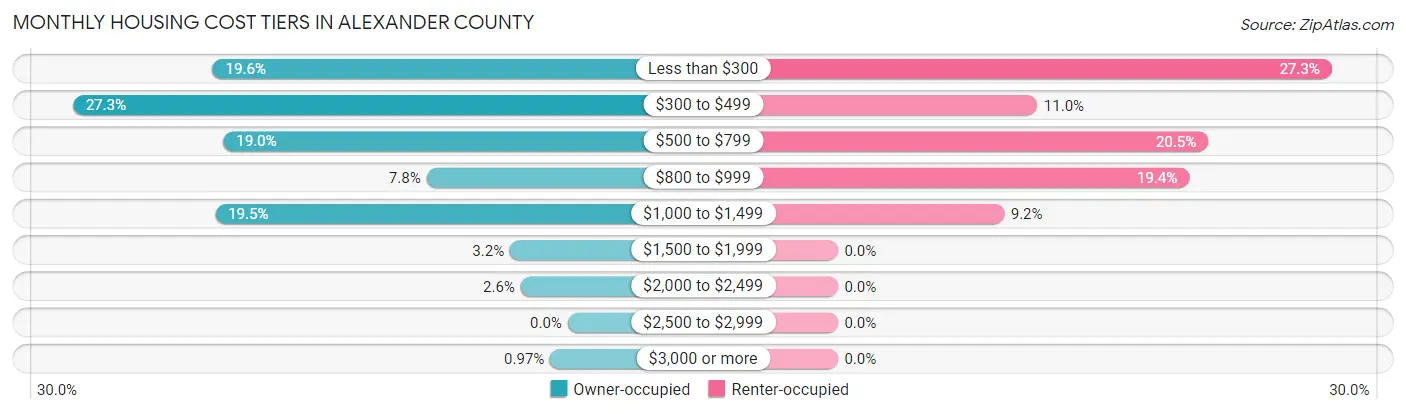
| Monthly Cost | Owner-occupied | Renter-occupied |
| Less than $300 | 264 (19.6%) | 104 (27.3%) |
| $300 to $499 | 368 (27.3%) | 42 (11.0%) |
| $500 to $799 | 256 (19.0%) | 78 (20.5%) |
| $800 to $999 | 105 (7.8%) | 74 (19.4%) |
| $1,000 to $1,499 | 262 (19.5%) | 35 (9.2%) |
| $1,500 to $1,999 | 43 (3.2%) | 0 (0.0%) |
| $2,000 to $2,499 | 35 (2.6%) | 0 (0.0%) |
| $2,500 to $2,999 | 0 (0.0%) | 0 (0.0%) |
| $3,000 or more | 13 (1.0%) | 0 (0.0%) |
| Total | 1,346 (100.0%) | 381 (100.0%) |
Physical Housing Characteristics in Alexander County
Housing Structures in Alexander County
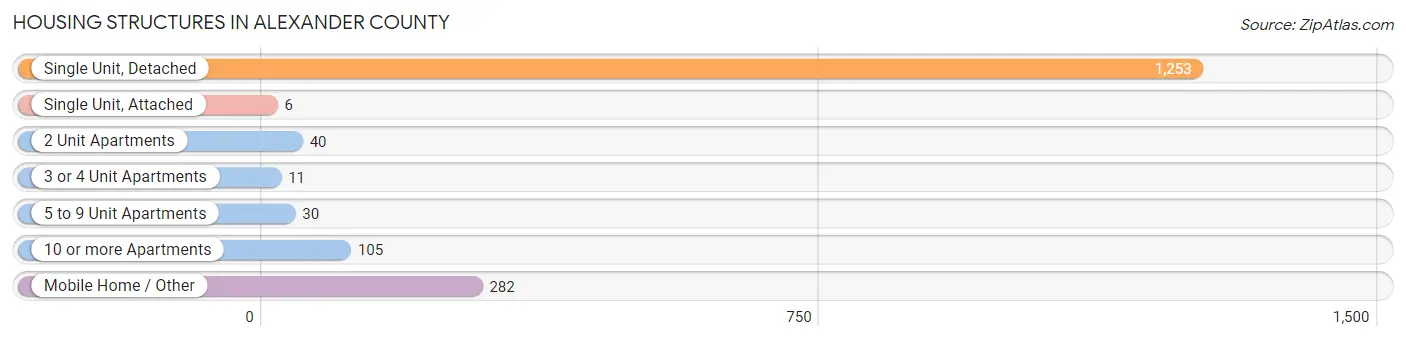
| Structure Type | # Housing Units | % Housing Units |
| Single Unit, Detached | 1,253 | 72.6% |
| Single Unit, Attached | 6 | 0.4% |
| 2 Unit Apartments | 40 | 2.3% |
| 3 or 4 Unit Apartments | 11 | 0.6% |
| 5 to 9 Unit Apartments | 30 | 1.7% |
| 10 or more Apartments | 105 | 6.1% |
| Mobile Home / Other | 282 | 16.3% |
| Total | 1,727 | 100.0% |
Housing Structures by Occupancy in Alexander County
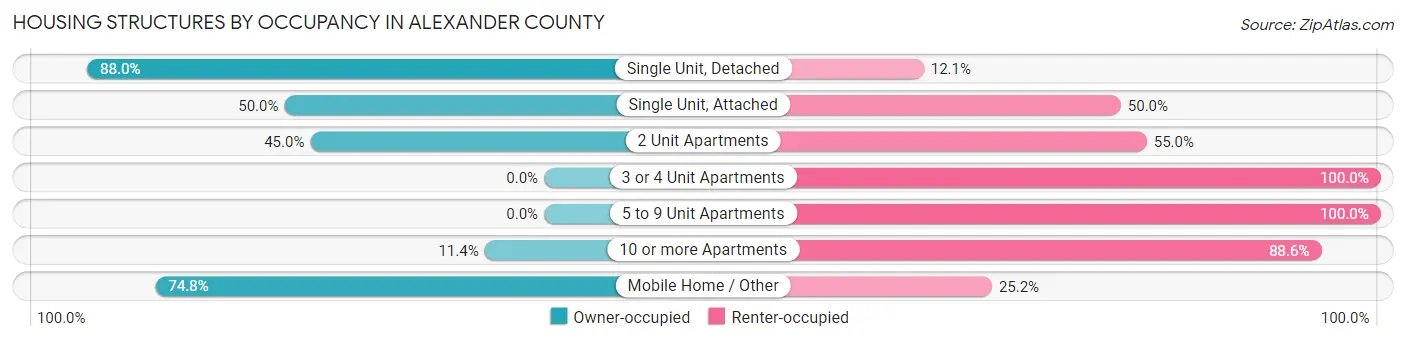
| Structure Type | Owner-occupied | Renter-occupied |
| Single Unit, Detached | 1,102 (87.9%) | 151 (12.0%) |
| Single Unit, Attached | 3 (50.0%) | 3 (50.0%) |
| 2 Unit Apartments | 18 (45.0%) | 22 (55.0%) |
| 3 or 4 Unit Apartments | 0 (0.0%) | 11 (100.0%) |
| 5 to 9 Unit Apartments | 0 (0.0%) | 30 (100.0%) |
| 10 or more Apartments | 12 (11.4%) | 93 (88.6%) |
| Mobile Home / Other | 211 (74.8%) | 71 (25.2%) |
| Total | 1,346 (77.9%) | 381 (22.1%) |
Housing Structures by Number of Rooms in Alexander County
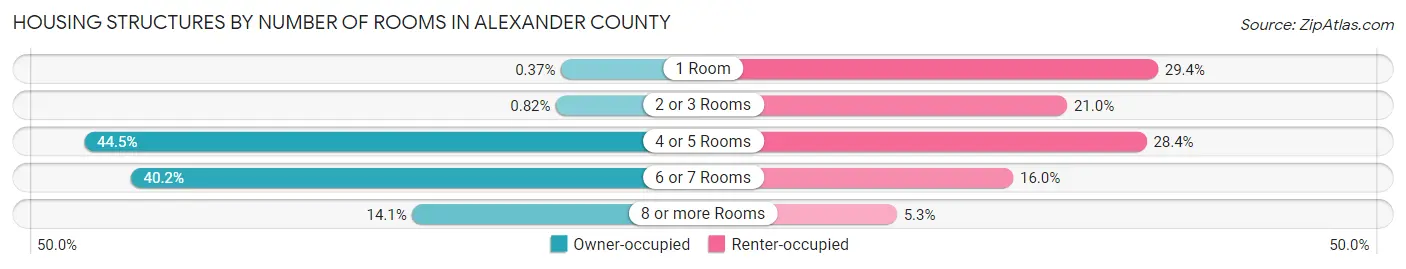
| Number of Rooms | Owner-occupied | Renter-occupied |
| 1 Room | 5 (0.4%) | 112 (29.4%) |
| 2 or 3 Rooms | 11 (0.8%) | 80 (21.0%) |
| 4 or 5 Rooms | 599 (44.5%) | 108 (28.3%) |
| 6 or 7 Rooms | 541 (40.2%) | 61 (16.0%) |
| 8 or more Rooms | 190 (14.1%) | 20 (5.2%) |
| Total | 1,346 (100.0%) | 381 (100.0%) |
Housing Structure by Heating Type in Alexander County
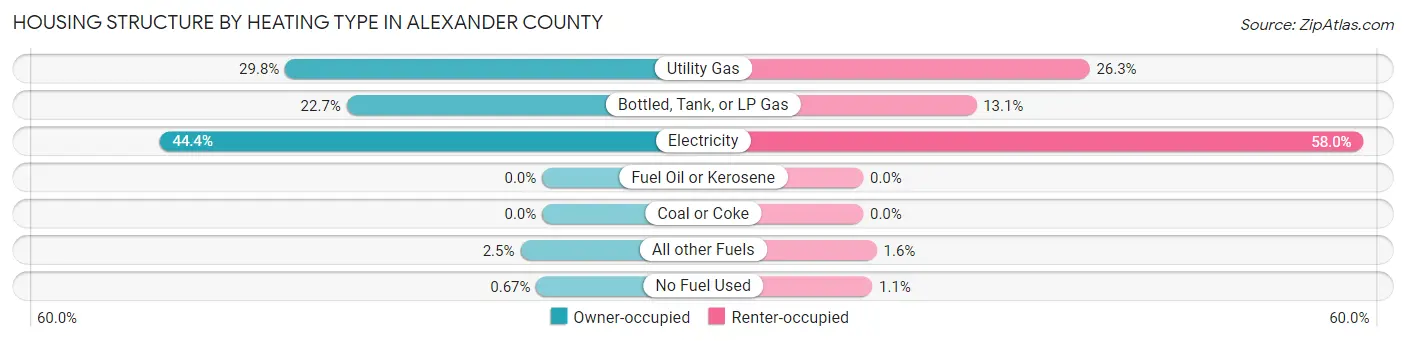
| Heating Type | Owner-occupied | Renter-occupied |
| Utility Gas | 401 (29.8%) | 100 (26.3%) |
| Bottled, Tank, or LP Gas | 305 (22.7%) | 50 (13.1%) |
| Electricity | 597 (44.4%) | 221 (58.0%) |
| Fuel Oil or Kerosene | 0 (0.0%) | 0 (0.0%) |
| Coal or Coke | 0 (0.0%) | 0 (0.0%) |
| All other Fuels | 34 (2.5%) | 6 (1.6%) |
| No Fuel Used | 9 (0.7%) | 4 (1.1%) |
| Total | 1,346 (100.0%) | 381 (100.0%) |
Household Vehicle Usage in Alexander County
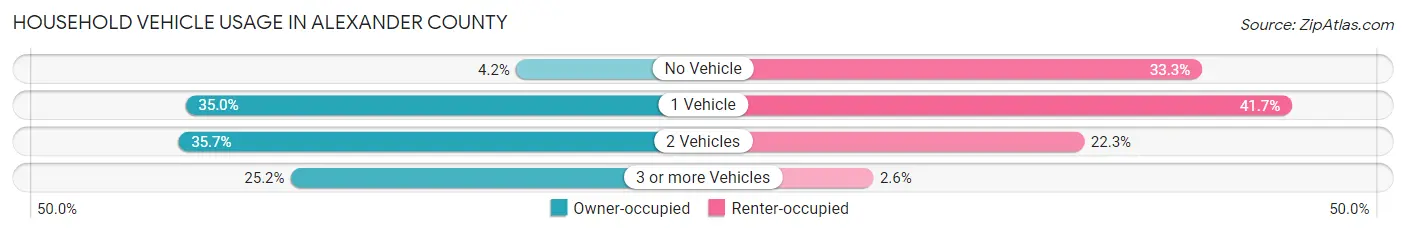
| Vehicles per Household | Owner-occupied | Renter-occupied |
| No Vehicle | 56 (4.2%) | 127 (33.3%) |
| 1 Vehicle | 471 (35.0%) | 159 (41.7%) |
| 2 Vehicles | 480 (35.7%) | 85 (22.3%) |
| 3 or more Vehicles | 339 (25.2%) | 10 (2.6%) |
| Total | 1,346 (100.0%) | 381 (100.0%) |
Real Estate & Mortgages in Alexander County
Real Estate and Mortgage Overview in Alexander County
| Characteristic | Without Mortgage | With Mortgage |
| Housing Units | 877 | 469 |
| Median Property Value | $37,700 | $144,700 |
| Median Household Income | $39,350 | $48 |
| Monthly Housing Costs | $427 | $6 |
| Real Estate Taxes | $485 | $52 |
Property Value by Mortgage Status in Alexander County
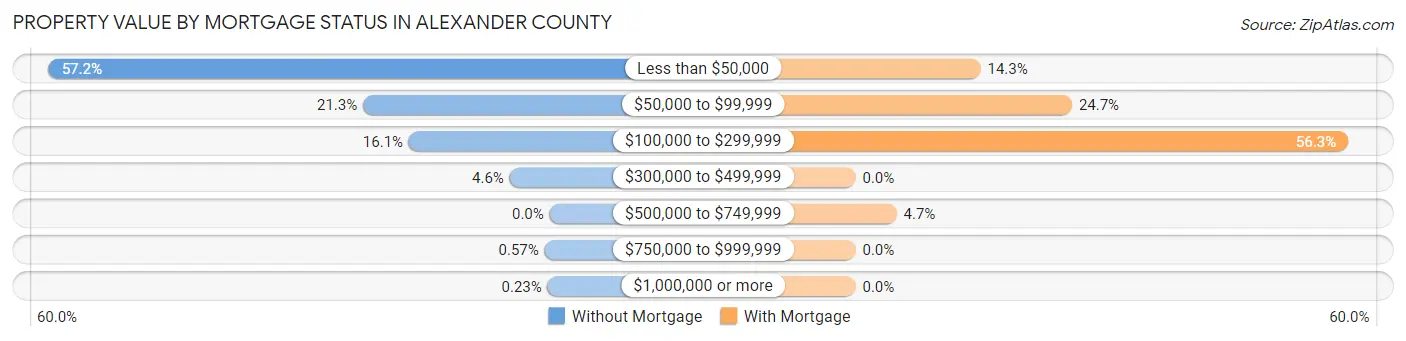
| Property Value | Without Mortgage | With Mortgage |
| Less than $50,000 | 502 (57.2%) | 67 (14.3%) |
| $50,000 to $99,999 | 187 (21.3%) | 116 (24.7%) |
| $100,000 to $299,999 | 141 (16.1%) | 264 (56.3%) |
| $300,000 to $499,999 | 40 (4.6%) | 0 (0.0%) |
| $500,000 to $749,999 | 0 (0.0%) | 22 (4.7%) |
| $750,000 to $999,999 | 5 (0.6%) | 0 (0.0%) |
| $1,000,000 or more | 2 (0.2%) | 0 (0.0%) |
| Total | 877 (100.0%) | 469 (100.0%) |
Household Income by Mortgage Status in Alexander County
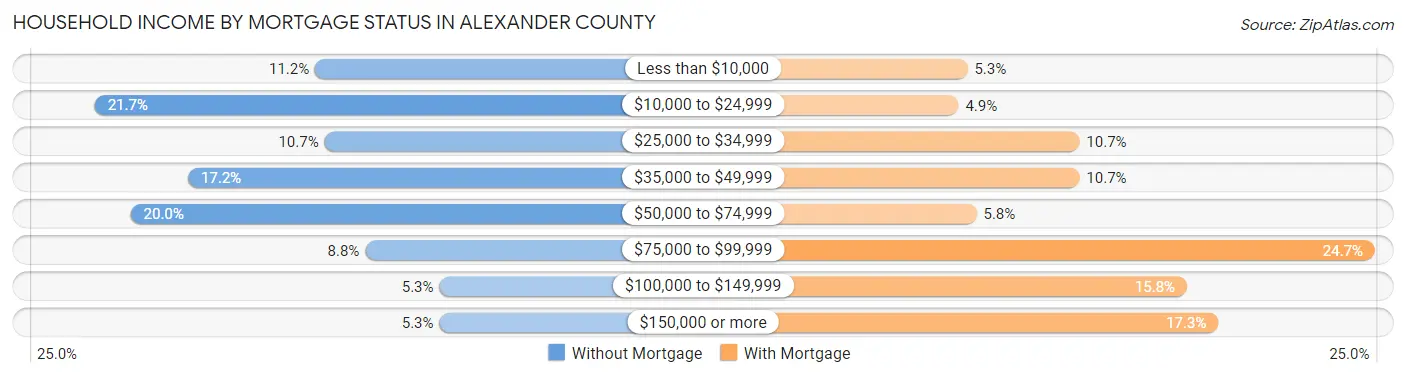
| Household Income | Without Mortgage | With Mortgage |
| Less than $10,000 | 98 (11.2%) | 25 (5.3%) |
| $10,000 to $24,999 | 190 (21.7%) | 23 (4.9%) |
| $25,000 to $34,999 | 94 (10.7%) | 50 (10.7%) |
| $35,000 to $49,999 | 151 (17.2%) | 50 (10.7%) |
| $50,000 to $74,999 | 175 (20.0%) | 27 (5.8%) |
| $75,000 to $99,999 | 77 (8.8%) | 116 (24.7%) |
| $100,000 to $149,999 | 46 (5.2%) | 74 (15.8%) |
| $150,000 or more | 46 (5.2%) | 81 (17.3%) |
| Total | 877 (100.0%) | 469 (100.0%) |
Property Value to Household Income Ratio in Alexander County
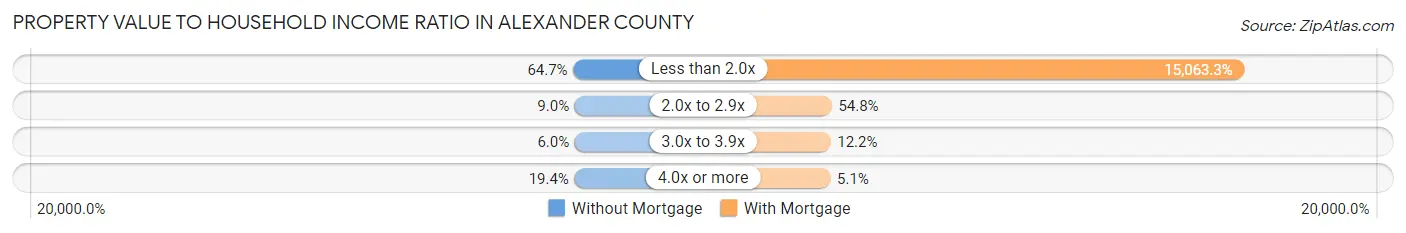
| Value-to-Income Ratio | Without Mortgage | With Mortgage |
| Less than 2.0x | 567 (64.6%) | 70,647 (15,063.3%) |
| 2.0x to 2.9x | 79 (9.0%) | 257 (54.8%) |
| 3.0x to 3.9x | 53 (6.0%) | 57 (12.1%) |
| 4.0x or more | 170 (19.4%) | 24 (5.1%) |
| Total | 877 (100.0%) | 469 (100.0%) |
Real Estate Taxes by Mortgage Status in Alexander County
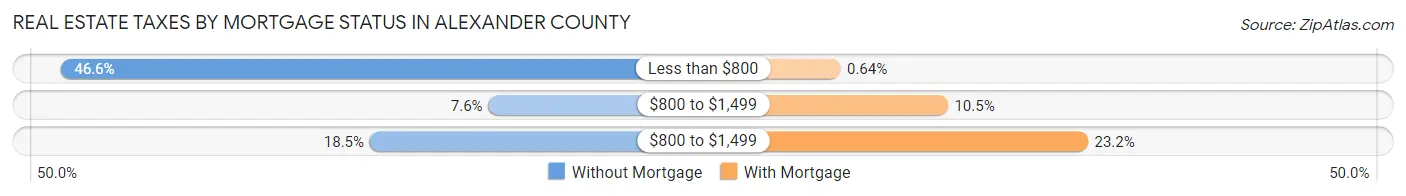
| Property Taxes | Without Mortgage | With Mortgage |
| Less than $800 | 409 (46.6%) | 3 (0.6%) |
| $800 to $1,499 | 67 (7.6%) | 49 (10.4%) |
| $800 to $1,499 | 162 (18.5%) | 109 (23.2%) |
| Total | 877 (100.0%) | 469 (100.0%) |
Health & Disability in Alexander County
Health Insurance Coverage by Age in Alexander County
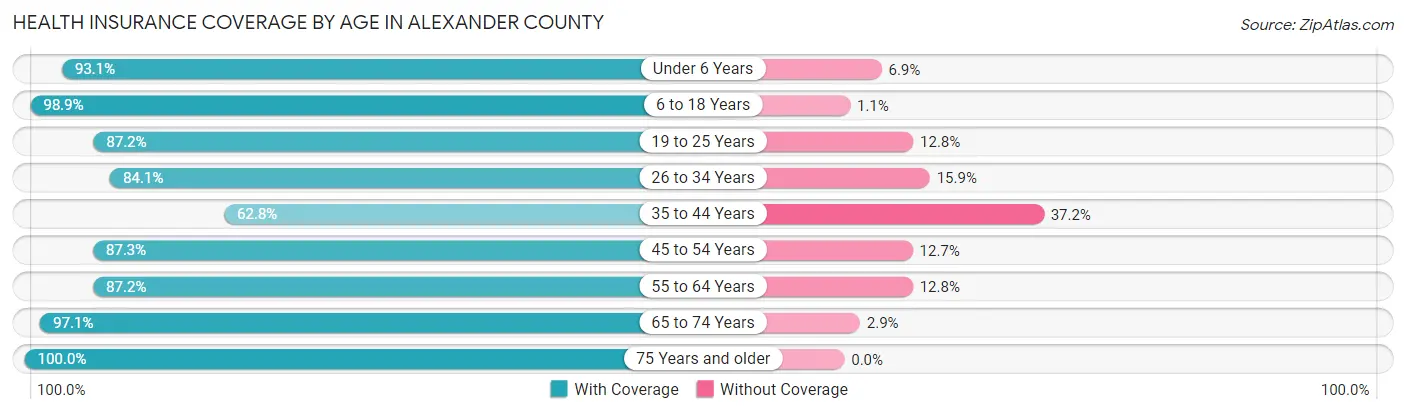
| Age Bracket | With Coverage | Without Coverage |
| Under 6 Years | 322 (93.1%) | 24 (6.9%) |
| 6 to 18 Years | 829 (98.9%) | 9 (1.1%) |
| 19 to 25 Years | 326 (87.2%) | 48 (12.8%) |
| 26 to 34 Years | 401 (84.1%) | 76 (15.9%) |
| 35 to 44 Years | 370 (62.8%) | 219 (37.2%) |
| 45 to 54 Years | 452 (87.3%) | 66 (12.7%) |
| 55 to 64 Years | 725 (87.2%) | 106 (12.8%) |
| 65 to 74 Years | 704 (97.1%) | 21 (2.9%) |
| 75 Years and older | 466 (100.0%) | 0 (0.0%) |
| Total | 4,595 (89.0%) | 569 (11.0%) |
Health Insurance Coverage by Citizenship Status in Alexander County
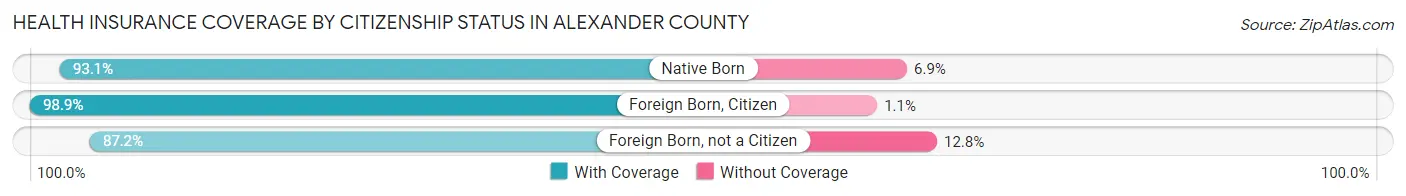
| Citizenship Status | With Coverage | Without Coverage |
| Native Born | 322 (93.1%) | 24 (6.9%) |
| Foreign Born, Citizen | 829 (98.9%) | 9 (1.1%) |
| Foreign Born, not a Citizen | 326 (87.2%) | 48 (12.8%) |
Health Insurance Coverage by Household Income in Alexander County
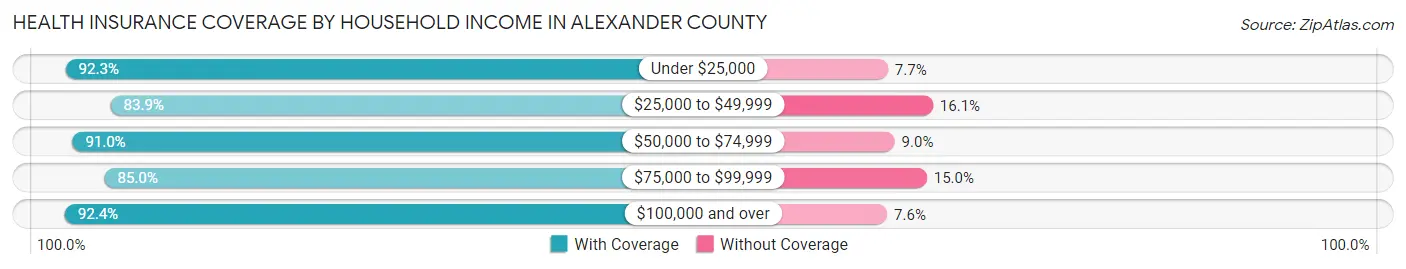
| Household Income | With Coverage | Without Coverage |
| Under $25,000 | 1,019 (92.3%) | 85 (7.7%) |
| $25,000 to $49,999 | 983 (83.9%) | 189 (16.1%) |
| $50,000 to $74,999 | 944 (91.0%) | 93 (9.0%) |
| $75,000 to $99,999 | 737 (85.0%) | 130 (15.0%) |
| $100,000 and over | 880 (92.4%) | 72 (7.6%) |
Public vs Private Health Insurance Coverage by Age in Alexander County
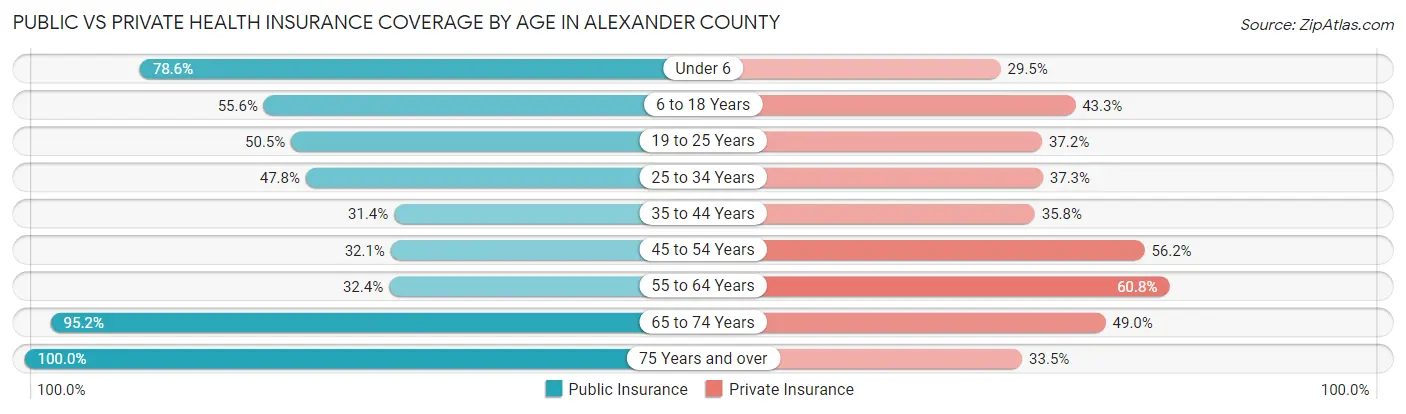
| Age Bracket | Public Insurance | Private Insurance |
| Under 6 | 272 (78.6%) | 102 (29.5%) |
| 6 to 18 Years | 466 (55.6%) | 363 (43.3%) |
| 19 to 25 Years | 189 (50.5%) | 139 (37.2%) |
| 25 to 34 Years | 228 (47.8%) | 178 (37.3%) |
| 35 to 44 Years | 185 (31.4%) | 211 (35.8%) |
| 45 to 54 Years | 166 (32.1%) | 291 (56.2%) |
| 55 to 64 Years | 269 (32.4%) | 505 (60.8%) |
| 65 to 74 Years | 690 (95.2%) | 355 (49.0%) |
| 75 Years and over | 466 (100.0%) | 156 (33.5%) |
| Total | 2,931 (56.8%) | 2,300 (44.5%) |
Disability Status by Sex by Age in Alexander County
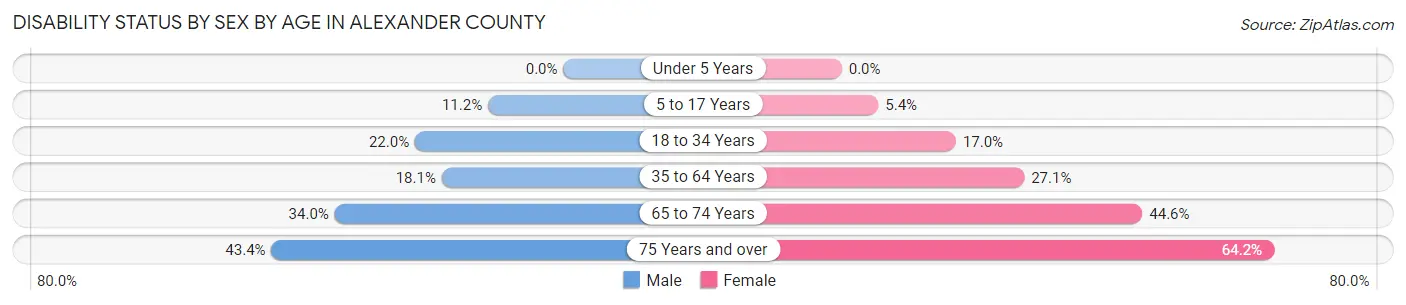
| Age Bracket | Male | Female |
| Under 5 Years | 0 (0.0%) | 0 (0.0%) |
| 5 to 17 Years | 45 (11.2%) | 27 (5.4%) |
| 18 to 34 Years | 104 (22.0%) | 69 (17.0%) |
| 35 to 64 Years | 166 (18.1%) | 276 (27.1%) |
| 65 to 74 Years | 126 (34.0%) | 158 (44.6%) |
| 75 Years and over | 75 (43.3%) | 188 (64.2%) |
Disability Class by Sex by Age in Alexander County
Disability Class: Hearing Difficulty
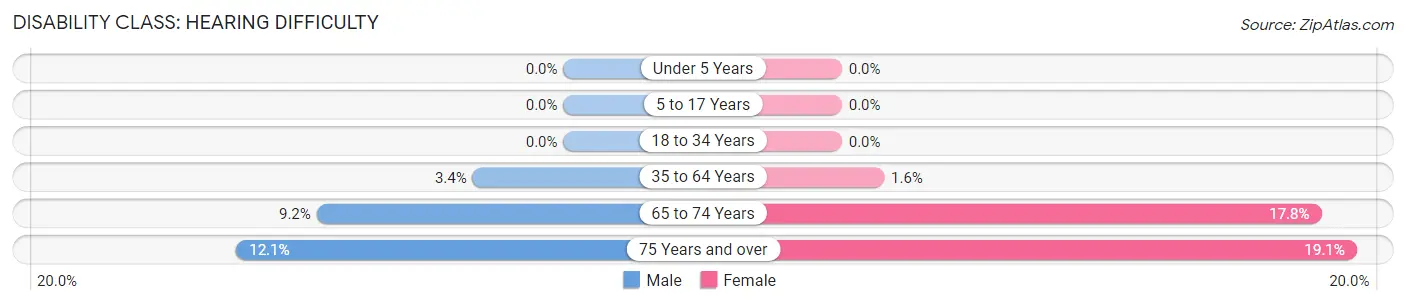
| Age Bracket | Male | Female |
| Under 5 Years | 0 (0.0%) | 0 (0.0%) |
| 5 to 17 Years | 0 (0.0%) | 0 (0.0%) |
| 18 to 34 Years | 0 (0.0%) | 0 (0.0%) |
| 35 to 64 Years | 31 (3.4%) | 16 (1.6%) |
| 65 to 74 Years | 34 (9.2%) | 63 (17.8%) |
| 75 Years and over | 21 (12.1%) | 56 (19.1%) |
Disability Class: Vision Difficulty
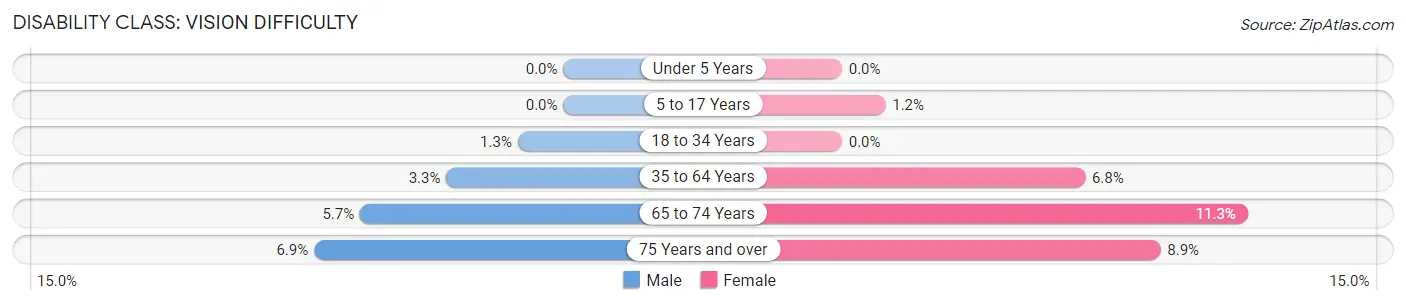
| Age Bracket | Male | Female |
| Under 5 Years | 0 (0.0%) | 0 (0.0%) |
| 5 to 17 Years | 0 (0.0%) | 6 (1.2%) |
| 18 to 34 Years | 6 (1.3%) | 0 (0.0%) |
| 35 to 64 Years | 30 (3.3%) | 69 (6.8%) |
| 65 to 74 Years | 21 (5.7%) | 40 (11.3%) |
| 75 Years and over | 12 (6.9%) | 26 (8.9%) |
Disability Class: Cognitive Difficulty
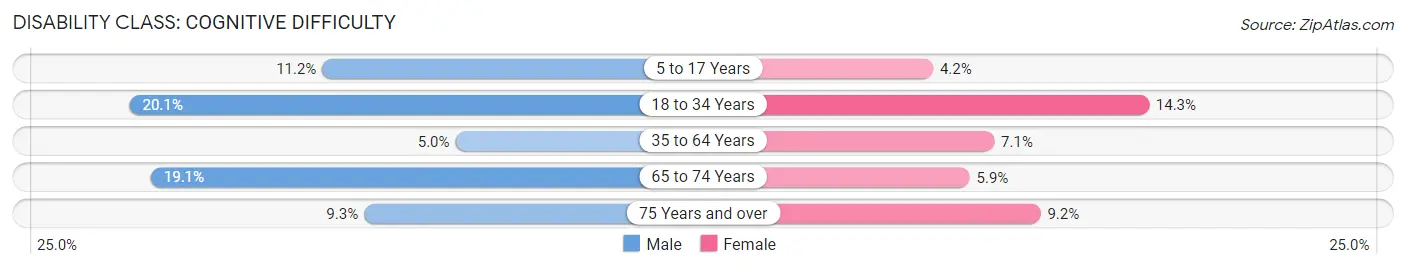
| Age Bracket | Male | Female |
| 5 to 17 Years | 45 (11.2%) | 21 (4.2%) |
| 18 to 34 Years | 95 (20.1%) | 58 (14.2%) |
| 35 to 64 Years | 46 (5.0%) | 72 (7.1%) |
| 65 to 74 Years | 71 (19.1%) | 21 (5.9%) |
| 75 Years and over | 16 (9.2%) | 27 (9.2%) |
Disability Class: Ambulatory Difficulty
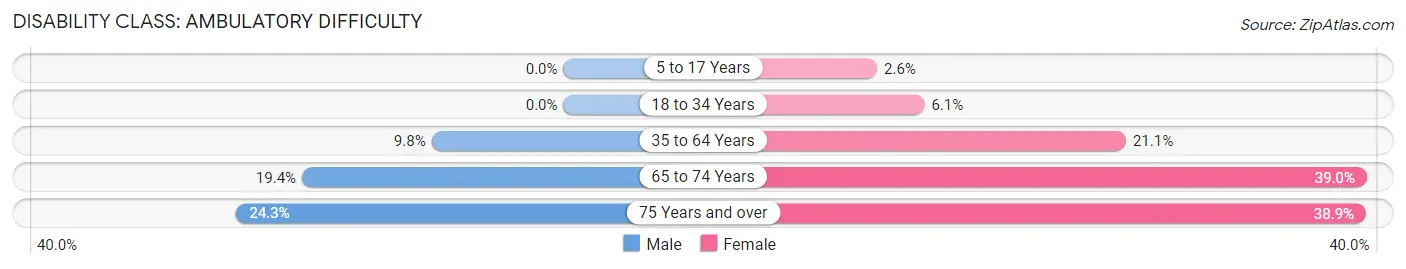
| Age Bracket | Male | Female |
| 5 to 17 Years | 0 (0.0%) | 13 (2.6%) |
| 18 to 34 Years | 0 (0.0%) | 25 (6.1%) |
| 35 to 64 Years | 90 (9.8%) | 215 (21.1%) |
| 65 to 74 Years | 72 (19.4%) | 138 (39.0%) |
| 75 Years and over | 42 (24.3%) | 114 (38.9%) |
Disability Class: Self-Care Difficulty
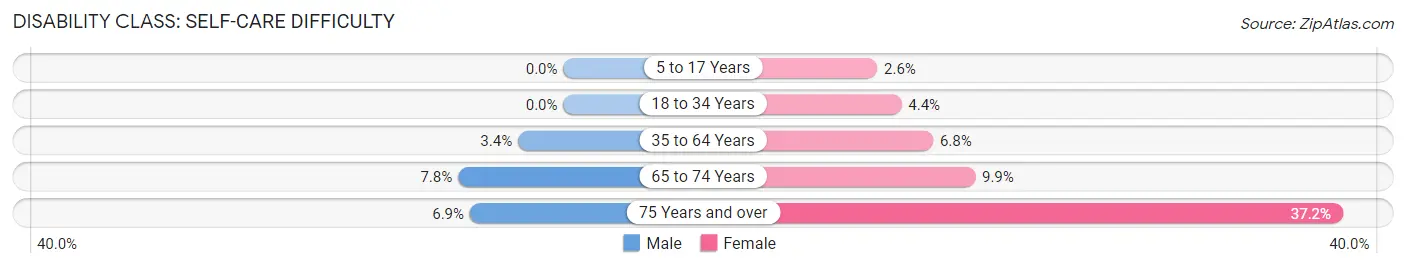
| Age Bracket | Male | Female |
| 5 to 17 Years | 0 (0.0%) | 13 (2.6%) |
| 18 to 34 Years | 0 (0.0%) | 18 (4.4%) |
| 35 to 64 Years | 31 (3.4%) | 69 (6.8%) |
| 65 to 74 Years | 29 (7.8%) | 35 (9.9%) |
| 75 Years and over | 12 (6.9%) | 109 (37.2%) |
Technology Access in Alexander County
Computing Device Access in Alexander County
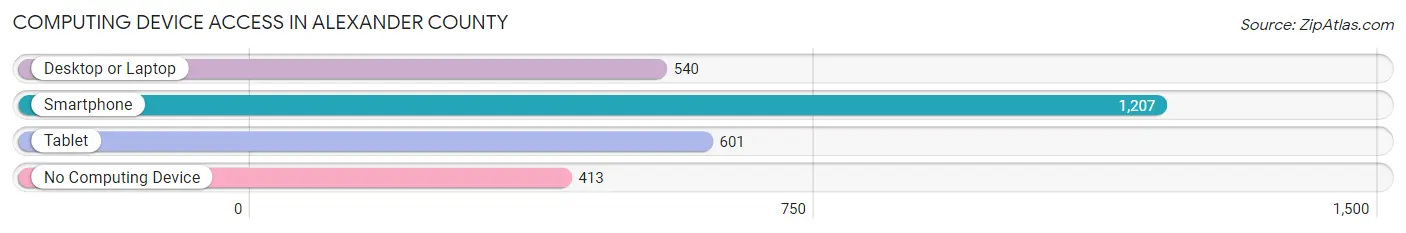
| Device Type | # Households | % Households |
| Desktop or Laptop | 540 | 31.3% |
| Smartphone | 1,207 | 69.9% |
| Tablet | 601 | 34.8% |
| No Computing Device | 413 | 23.9% |
| Total | 1,727 | 100.0% |
Internet Access in Alexander County
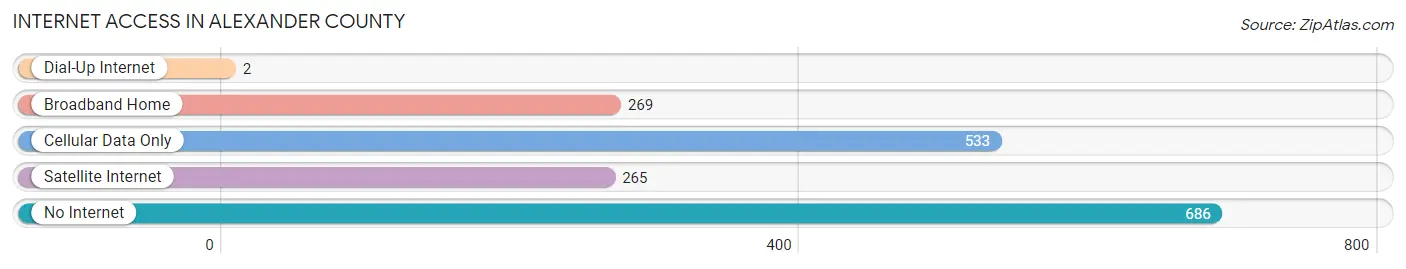
| Internet Type | # Households | % Households |
| Dial-Up Internet | 2 | 0.1% |
| Broadband Home | 269 | 15.6% |
| Cellular Data Only | 533 | 30.9% |
| Satellite Internet | 265 | 15.3% |
| No Internet | 686 | 39.7% |
| Total | 1,727 | 100.0% |
Alexander County Summary
Alexander County is located in the southernmost part of Illinois, and is bordered by the Mississippi River to the west and the Ohio River to the east. It is part of the Cape Girardeau-Jackson, MO-IL Metropolitan Statistical Area. The county was established in 1819 and named after William M. Alexander, a prominent early settler. As of the 2010 census, the population was 8,238, making it the least populous county in Illinois.
Geography
Alexander County is located in the southernmost part of Illinois, and is bordered by the Mississippi River to the west and the Ohio River to the east. It is part of the Cape Girardeau-Jackson, MO-IL Metropolitan Statistical Area. The county has a total area of 519 square miles, of which 517 square miles is land and 2 square miles (0.4%) is water. The terrain is mostly flat, with some rolling hills in the northern part of the county. The highest point in the county is located in the northwest corner, at an elevation of 590 feet.
The county is divided into two distinct regions: the uplands and the lowlands. The uplands are located in the northern part of the county and are characterized by rolling hills and wooded areas. The lowlands are located in the southern part of the county and are characterized by flat, open farmland.
Climate
Alexander County has a humid continental climate, with hot, humid summers and cold, dry winters. The average annual temperature is 54°F, with an average high of 79°F in July and an average low of 29°F in January. The average annual precipitation is 40 inches, with the majority of it falling in the spring and summer months.
Demographics
As of the 2010 census, there were 8,238 people, 3,093 households, and 2,097 families residing in the county. The population density was 16 people per square mile. There were 3,521 housing units at an average density of 7 per square mile. The racial makeup of the county was 97.2% White, 0.7% African American, 0.2% Native American, 0.2% Asian, 0.1% Pacific Islander, 0.5% from other races, and 1.1% from two or more races. Hispanic or Latino of any race were 1.7% of the population.
The median income for a household in the county was $37,917, and the median income for a family was $45,938. Males had a median income of $35,938 versus $25,917 for females. The per capita income for the county was $17,917. About 11.2% of families and 14.2% of the population were below the poverty line, including 19.2% of those under age 18 and 10.2% of those age 65 or over.
Economy
The economy of Alexander County is largely based on agriculture. The county is home to a variety of crops, including corn, soybeans, wheat, hay, and sorghum. Livestock production is also important to the local economy, with beef cattle, dairy cattle, and hogs being the primary species raised.
The county is also home to several manufacturing companies, including a steel mill, a paper mill, and a plastics plant. The county is also home to several retail businesses, including grocery stores, restaurants, and clothing stores.
Conclusion
Alexander County is located in the southernmost part of Illinois, and is bordered by the Mississippi River to the west and the Ohio River to the east. It is part of the Cape Girardeau-Jackson, MO-IL Metropolitan Statistical Area. The county has a total area of 519 square miles, of which 517 square miles is land and 2 square miles (0.4%) is water. The terrain is mostly flat, with some rolling hills in the northern part of the county. The population of the county was 8,238 as of the 2010 census.
The economy of Alexander County is largely based on agriculture, with crops such as corn, soybeans, wheat, hay, and sorghum being the primary crops grown. Livestock production is also important to the local economy, with beef cattle, dairy cattle, and hogs being the primary species raised. The county is also home to several manufacturing companies, including a steel mill, a paper mill, and a plastics plant. The county is also home to several retail businesses, including grocery stores, restaurants, and clothing stores.
Common Questions
What is Per Capita Income in Alexander County?
Per Capita income in Alexander County is $21,922.
What is the Median Family Income in Alexander County?
Median Family Income in Alexander County is $58,106.
What is the Median Household income in Alexander County?
Median Household Income in Alexander County is $40,365.
What is Income or Wage Gap in Alexander County?
Income or Wage Gap in Alexander County is 5.6%.
Women in Alexander County earn 94.4 cents for every dollar earned by a man.
What is Family Income Deficit in Alexander County?
Family Income Deficit in Alexander County is $7,567.
Families that are below poverty line in Alexander County earn $7,567 less on average than the poverty threshold level.
What is Inequality or Gini Index in Alexander County?
Inequality or Gini Index in Alexander County is 0.45.
What is the Total Population of Alexander County?
Total Population of Alexander County is 5,261.
What is the Total Male Population of Alexander County?
Total Male Population of Alexander County is 2,561.
What is the Total Female Population of Alexander County?
Total Female Population of Alexander County is 2,700.
What is the Ratio of Males per 100 Females in Alexander County?
There are 94.85 Males per 100 Females in Alexander County.
What is the Ratio of Females per 100 Males in Alexander County?
There are 105.43 Females per 100 Males in Alexander County.
What is the Median Population Age in Alexander County?
Median Population Age in Alexander County is 44.9 Years.
What is the Average Family Size in Alexander County
Average Family Size in Alexander County is 4.3 People.
What is the Average Household Size in Alexander County
Average Household Size in Alexander County is 3.0 People.
How Large is the Labor Force in Alexander County?
There are 2,028 People in the Labor Forcein in Alexander County.
What is the Percentage of People in the Labor Force in Alexander County?
48.0% of People are in the Labor Force in Alexander County.
What is the Unemployment Rate in Alexander County?
Unemployment Rate in Alexander County is 9.3%.