Rembert, SC Map & Demographics
Rembert Map
Rembert Overview
$16,552
PER CAPITA INCOME
$57,778
AVG FAMILY INCOME
$57,778
AVG HOUSEHOLD INCOME
32.6%
WAGE / INCOME GAP [ % ]
67.4¢/ $1
WAGE / INCOME GAP [ $ ]
0.19
INEQUALITY / GINI INDEX
255
TOTAL POPULATION
88
MALE POPULATION
167
FEMALE POPULATION
52.69
MALES / 100 FEMALES
189.77
FEMALES / 100 MALES
41.3
MEDIAN AGE
5.1
AVG FAMILY SIZE
5.1
AVG HOUSEHOLD SIZE
101
LABOR FORCE [ PEOPLE ]
50.2%
PERCENT IN LABOR FORCE
Rembert Zip Codes
Income in Rembert
Income Overview in Rembert
Per Capita Income in Rembert is $16,552, while median incomes of families and households are $57,778 and $57,778 respectively.
| Characteristic | Number | Measure |
| Per Capita Income | 255 | $16,552 |
| Median Family Income | 50 | $57,778 |
| Mean Family Income | 50 | $67,582 |
| Median Household Income | 50 | $57,778 |
| Mean Household Income | 50 | $67,582 |
| Income Deficit | 50 | $0 |
| Wage / Income Gap (%) | 255 | 32.60% |
| Wage / Income Gap ($) | 255 | 67.40¢ per $1 |
| Gini / Inequality Index | 255 | 0.19 |
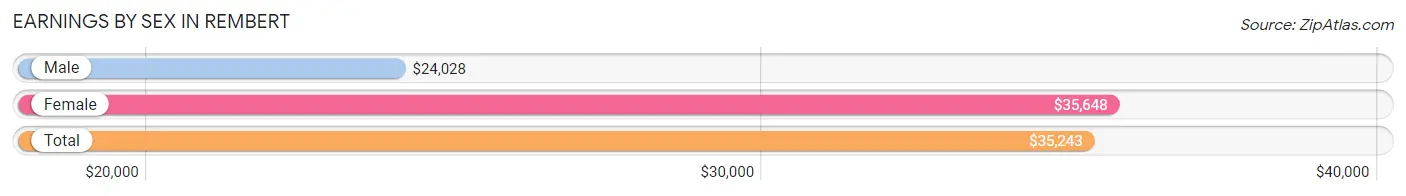
Earnings by Sex in Rembert
Average Earnings in Rembert are $35,243, $24,028 for men and $35,648 for women, a difference of 32.6%.
| Sex | Number | Average Earnings |
| Male | 25 (24.7%) | $24,028 |
| Female | 76 (75.2%) | $35,648 |
| Total | 101 (100.0%) | $35,243 |
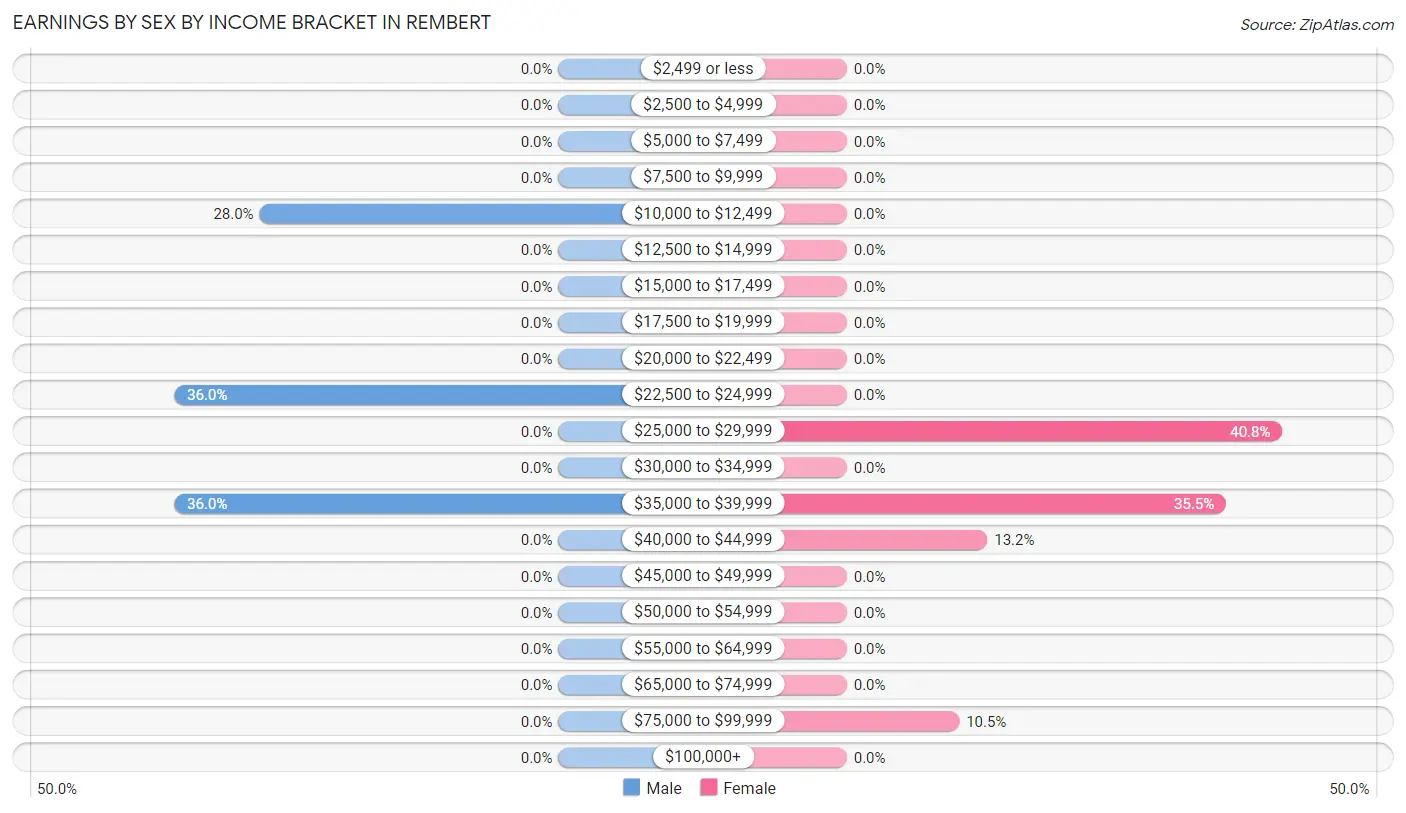
Earnings by Sex by Income Bracket in Rembert
The most common earnings brackets in Rembert are $22,500 to $24,999 for men (9 | 36.0%) and $25,000 to $29,999 for women (31 | 40.8%).
| Income | Male | Female |
| $2,499 or less | 0 (0.0%) | 0 (0.0%) |
| $2,500 to $4,999 | 0 (0.0%) | 0 (0.0%) |
| $5,000 to $7,499 | 0 (0.0%) | 0 (0.0%) |
| $7,500 to $9,999 | 0 (0.0%) | 0 (0.0%) |
| $10,000 to $12,499 | 7 (28.0%) | 0 (0.0%) |
| $12,500 to $14,999 | 0 (0.0%) | 0 (0.0%) |
| $15,000 to $17,499 | 0 (0.0%) | 0 (0.0%) |
| $17,500 to $19,999 | 0 (0.0%) | 0 (0.0%) |
| $20,000 to $22,499 | 0 (0.0%) | 0 (0.0%) |
| $22,500 to $24,999 | 9 (36.0%) | 0 (0.0%) |
| $25,000 to $29,999 | 0 (0.0%) | 31 (40.8%) |
| $30,000 to $34,999 | 0 (0.0%) | 0 (0.0%) |
| $35,000 to $39,999 | 9 (36.0%) | 27 (35.5%) |
| $40,000 to $44,999 | 0 (0.0%) | 10 (13.2%) |
| $45,000 to $49,999 | 0 (0.0%) | 0 (0.0%) |
| $50,000 to $54,999 | 0 (0.0%) | 0 (0.0%) |
| $55,000 to $64,999 | 0 (0.0%) | 0 (0.0%) |
| $65,000 to $74,999 | 0 (0.0%) | 0 (0.0%) |
| $75,000 to $99,999 | 0 (0.0%) | 8 (10.5%) |
| $100,000+ | 0 (0.0%) | 0 (0.0%) |
| Total | 25 (100.0%) | 76 (100.0%) |
Earnings by Sex by Educational Attainment in Rembert
| Educational Attainment | Male Income | Female Income |
| Less than High School | - | - |
| High School Diploma | - | - |
| College or Associate's Degree | - | - |
| Bachelor's Degree | - | - |
| Graduate Degree | - | - |
| Total | $24,028 | $35,648 |
Family Income in Rembert
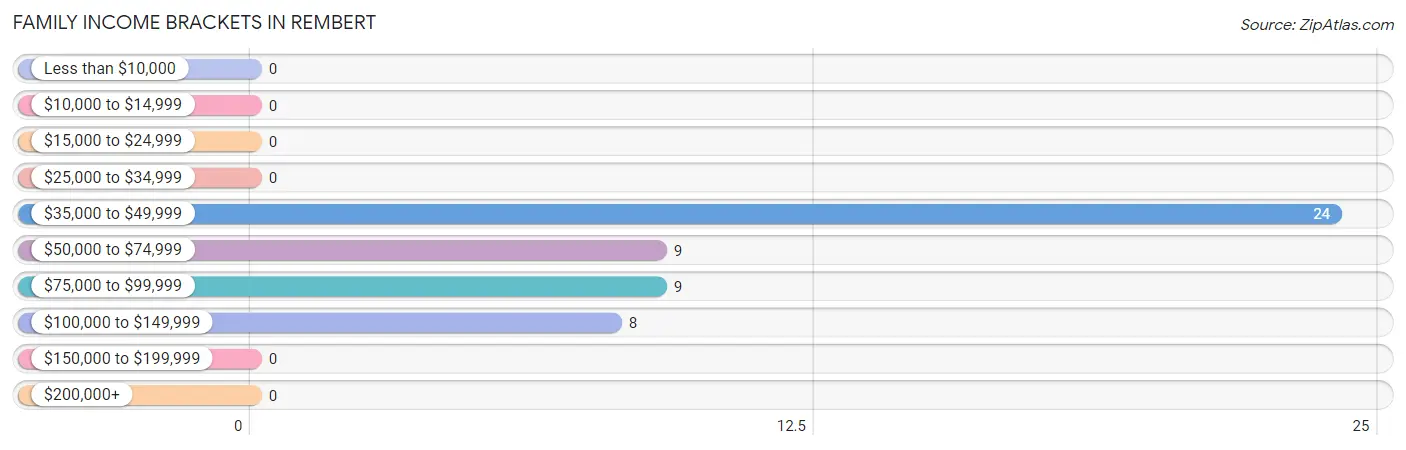
Family Income Brackets in Rembert
According to the Rembert family income data, there are 24 families falling into the $35,000 to $49,999 income range, which is the most common income bracket and makes up 48.0% of all families.
| Income Bracket | # Families | % Families |
| Less than $10,000 | 0 | 0.0% |
| $10,000 to $14,999 | 0 | 0.0% |
| $15,000 to $24,999 | 0 | 0.0% |
| $25,000 to $34,999 | 0 | 0.0% |
| $35,000 to $49,999 | 24 | 48.0% |
| $50,000 to $74,999 | 9 | 18.0% |
| $75,000 to $99,999 | 9 | 18.0% |
| $100,000 to $149,999 | 8 | 16.0% |
| $150,000 to $199,999 | 0 | 0.0% |
| $200,000+ | 0 | 0.0% |
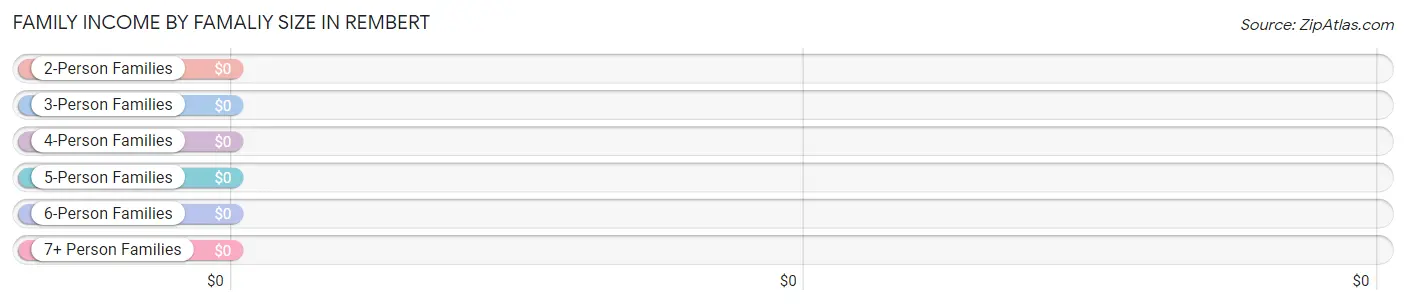
Family Income by Famaliy Size in Rembert
| Income Bracket | # Families | Median Income |
| 2-Person Families | 17 (34.0%) | $0 |
| 3-Person Families | 0 (0.0%) | $0 |
| 4-Person Families | 0 (0.0%) | $0 |
| 5-Person Families | 33 (66.0%) | $0 |
| 6-Person Families | 0 (0.0%) | $0 |
| 7+ Person Families | 0 (0.0%) | $0 |
| Total | 50 (100.0%) | $57,778 |
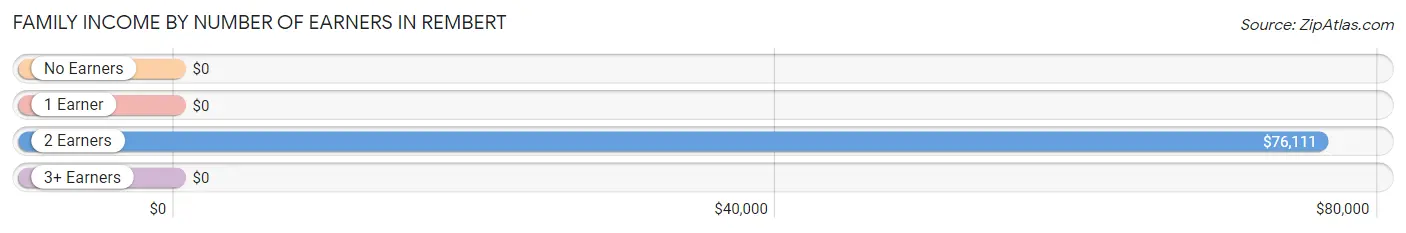
Family Income by Number of Earners in Rembert
| Number of Earners | # Families | Median Income |
| No Earners | 0 (0.0%) | $0 |
| 1 Earner | 24 (48.0%) | $0 |
| 2 Earners | 26 (52.0%) | $76,111 |
| 3+ Earners | 0 (0.0%) | $0 |
| Total | 50 (100.0%) | $57,778 |
Household Income in Rembert
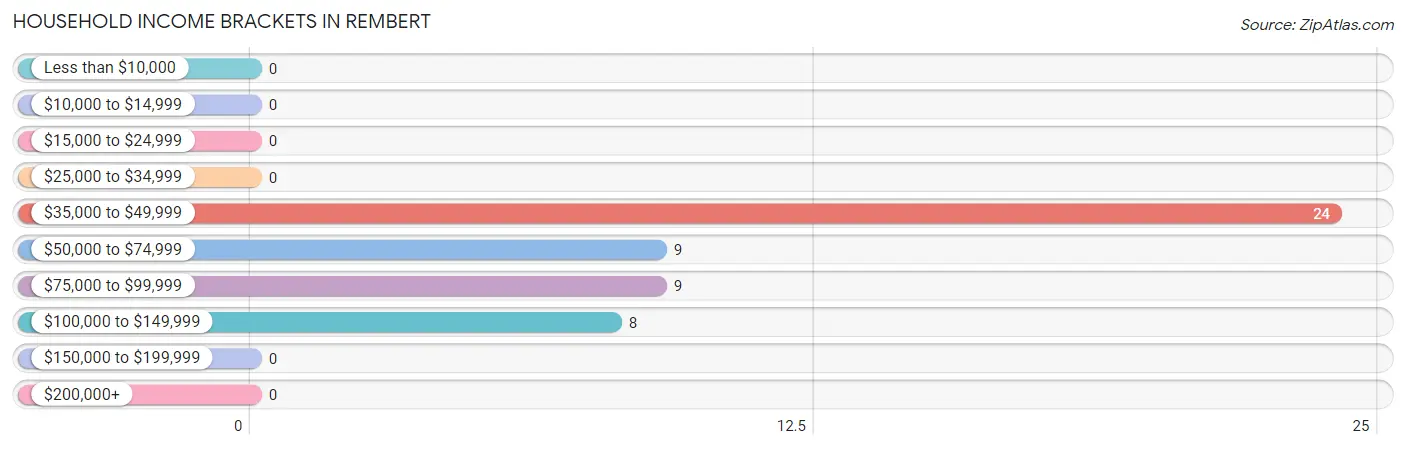
Household Income Brackets in Rembert
With 24 households falling in the category, the $35,000 to $49,999 income range is the most frequent in Rembert, accounting for 48.0% of all households.
| Income Bracket | # Households | % Households |
| Less than $10,000 | 0 | 0.0% |
| $10,000 to $14,999 | 0 | 0.0% |
| $15,000 to $24,999 | 0 | 0.0% |
| $25,000 to $34,999 | 0 | 0.0% |
| $35,000 to $49,999 | 24 | 48.0% |
| $50,000 to $74,999 | 9 | 18.0% |
| $75,000 to $99,999 | 9 | 18.0% |
| $100,000 to $149,999 | 8 | 16.0% |
| $150,000 to $199,999 | 0 | 0.0% |
| $200,000+ | 0 | 0.0% |
Household Income by Householder Age in Rembert
| Income Bracket | # Households | Median Income |
| 15 to 24 Years | 0 (0.0%) | $0 |
| 25 to 44 Years | 9 (18.0%) | $0 |
| 45 to 64 Years | 9 (18.0%) | $0 |
| 65+ Years | 32 (64.0%) | $0 |
| Total | 50 (100.0%) | $57,778 |
Poverty in Rembert
Income Below Poverty by Sex and Age in Rembert
| Age Bracket | Male | Female |
| Under 5 Years | 0 (0.0%) | 0 (0.0%) |
| 5 Years | 0 (0.0%) | 0 (0.0%) |
| 6 to 11 Years | 0 (0.0%) | 0 (0.0%) |
| 12 to 14 Years | 0 (0.0%) | 0 (0.0%) |
| 15 Years | 0 (0.0%) | 0 (0.0%) |
| 16 and 17 Years | 0 (0.0%) | 0 (0.0%) |
| 18 to 24 Years | 0 (0.0%) | 0 (0.0%) |
| 25 to 34 Years | 0 (0.0%) | 0 (0.0%) |
| 35 to 44 Years | 0 (0.0%) | 0 (0.0%) |
| 45 to 54 Years | 0 (0.0%) | 0 (0.0%) |
| 55 to 64 Years | 0 (0.0%) | 0 (0.0%) |
| 65 to 74 Years | 0 (0.0%) | 0 (0.0%) |
| 75 Years and over | 0 (0.0%) | 0 (0.0%) |
| Total | 0 (0.0%) | 0 (0.0%) |
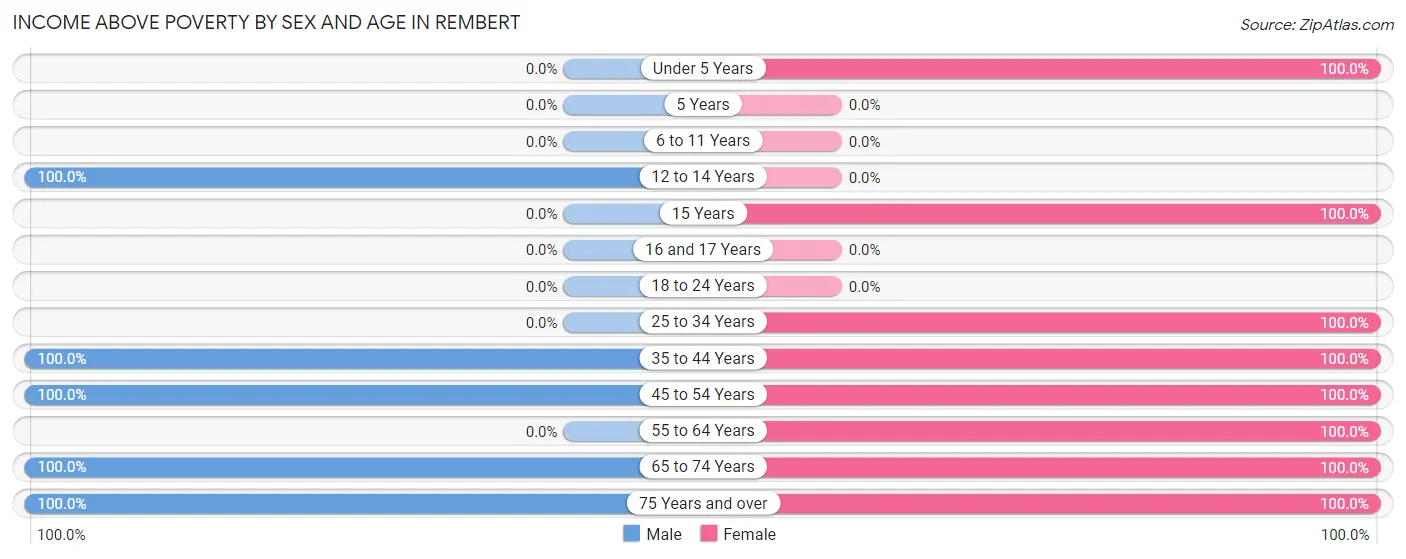
Income Above Poverty by Sex and Age in Rembert
According to the poverty statistics in Rembert, males aged 12 to 14 years and females aged under 5 years are the age groups that are most secure financially, with 100.0% of males and 100.0% of females in these age groups living above the poverty line.
| Age Bracket | Male | Female |
| Under 5 Years | 0 (0.0%) | 15 (100.0%) |
| 5 Years | 0 (0.0%) | 0 (0.0%) |
| 6 to 11 Years | 0 (0.0%) | 0 (0.0%) |
| 12 to 14 Years | 14 (100.0%) | 0 (0.0%) |
| 15 Years | 0 (0.0%) | 25 (100.0%) |
| 16 and 17 Years | 0 (0.0%) | 0 (0.0%) |
| 18 to 24 Years | 0 (0.0%) | 0 (0.0%) |
| 25 to 34 Years | 0 (0.0%) | 31 (100.0%) |
| 35 to 44 Years | 34 (100.0%) | 27 (100.0%) |
| 45 to 54 Years | 9 (100.0%) | 10 (100.0%) |
| 55 to 64 Years | 0 (0.0%) | 25 (100.0%) |
| 65 to 74 Years | 7 (100.0%) | 8 (100.0%) |
| 75 Years and over | 24 (100.0%) | 26 (100.0%) |
| Total | 88 (100.0%) | 167 (100.0%) |
Income Below Poverty Among Married-Couple Families in Rembert
| Children | Above Poverty | Below Poverty |
| No Children | 41 (100.0%) | 0 (0.0%) |
| 1 or 2 Children | 0 (0.0%) | 0 (0.0%) |
| 3 or 4 Children | 9 (100.0%) | 0 (0.0%) |
| 5 or more Children | 0 (0.0%) | 0 (0.0%) |
| Total | 50 (100.0%) | 0 (0.0%) |
Income Below Poverty Among Single-Parent Households in Rembert
| Children | Single Father | Single Mother |
| No Children | 0 (0.0%) | 0 (0.0%) |
| 1 or 2 Children | 0 (0.0%) | 0 (0.0%) |
| 3 or 4 Children | 0 (0.0%) | 0 (0.0%) |
| 5 or more Children | 0 (0.0%) | 0 (0.0%) |
| Total | 0 (0.0%) | 0 (0.0%) |
Income Below Poverty Among Married-Couple vs Single-Parent Households in Rembert
| Children | Married-Couple Families | Single-Parent Households |
| No Children | 0 (0.0%) | 0 (0.0%) |
| 1 or 2 Children | 0 (0.0%) | 0 (0.0%) |
| 3 or 4 Children | 0 (0.0%) | 0 (0.0%) |
| 5 or more Children | 0 (0.0%) | 0 (0.0%) |
| Total | 0 (0.0%) | 0 (0.0%) |
Race in Rembert
The most populous races in Rembert are Black / African American (146 | 57.3%), Asian (90 | 35.3%), and White / Caucasian (19 | 7.4%).
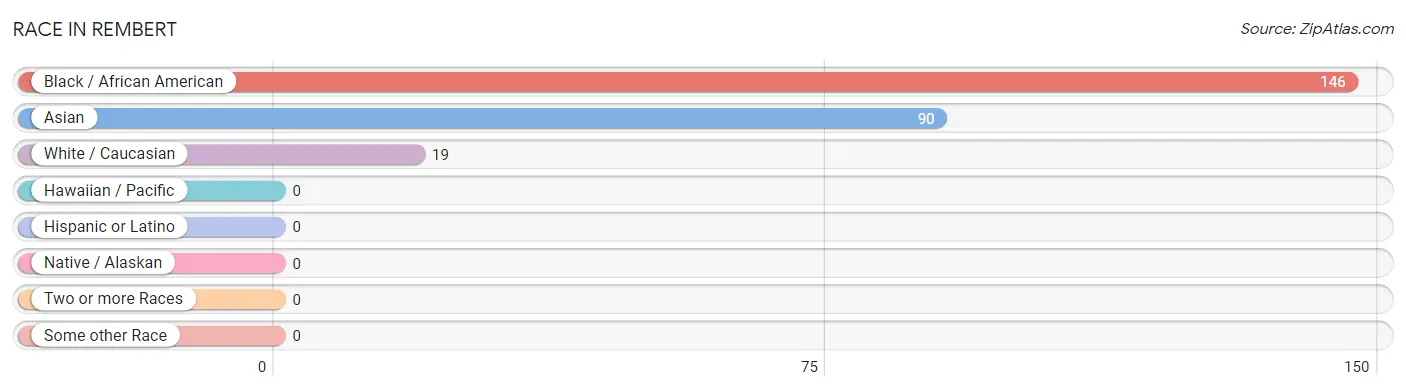
| Race | # Population | % Population |
| Asian | 90 | 35.3% |
| Black / African American | 146 | 57.3% |
| Hawaiian / Pacific | 0 | 0.0% |
| Hispanic or Latino | 0 | 0.0% |
| Native / Alaskan | 0 | 0.0% |
| White / Caucasian | 19 | 7.4% |
| Two or more Races | 0 | 0.0% |
| Some other Race | 0 | 0.0% |
| Total | 255 | 100.0% |
Ancestry in Rembert
The most populous ancestries reported in Rembert are Korean (90 | 35.3%), German (9 | 3.5%), and Irish (9 | 3.5%), together accounting for 42.3% of all Rembert residents.
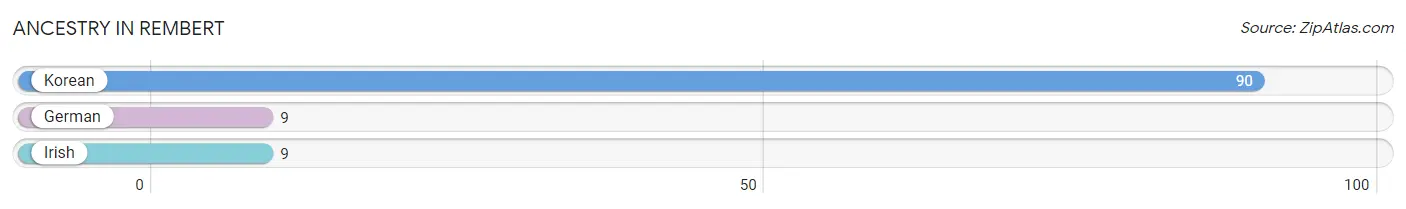
| Ancestry | # Population | % Population |
| German | 9 | 3.5% |
| Irish | 9 | 3.5% |
| Korean | 90 | 35.3% | View All 3 Rows |
Immigrants in Rembert
The most numerous immigrant groups reported in Rembert came from Asia (75 | 29.4%), Philippines (75 | 29.4%), and South Eastern Asia (75 | 29.4%), together accounting for 88.2% of all Rembert residents.
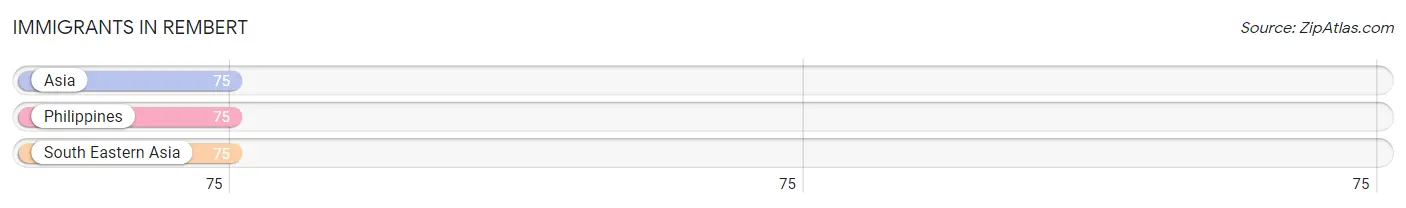
| Immigration Origin | # Population | % Population |
| Asia | 75 | 29.4% |
| Philippines | 75 | 29.4% |
| South Eastern Asia | 75 | 29.4% | View All 3 Rows |
Sex and Age in Rembert
Sex and Age in Rembert
The most populous age groups in Rembert are 40 to 44 Years (34 | 38.6%) for men and 25 to 29 Years (31 | 18.6%) for women.
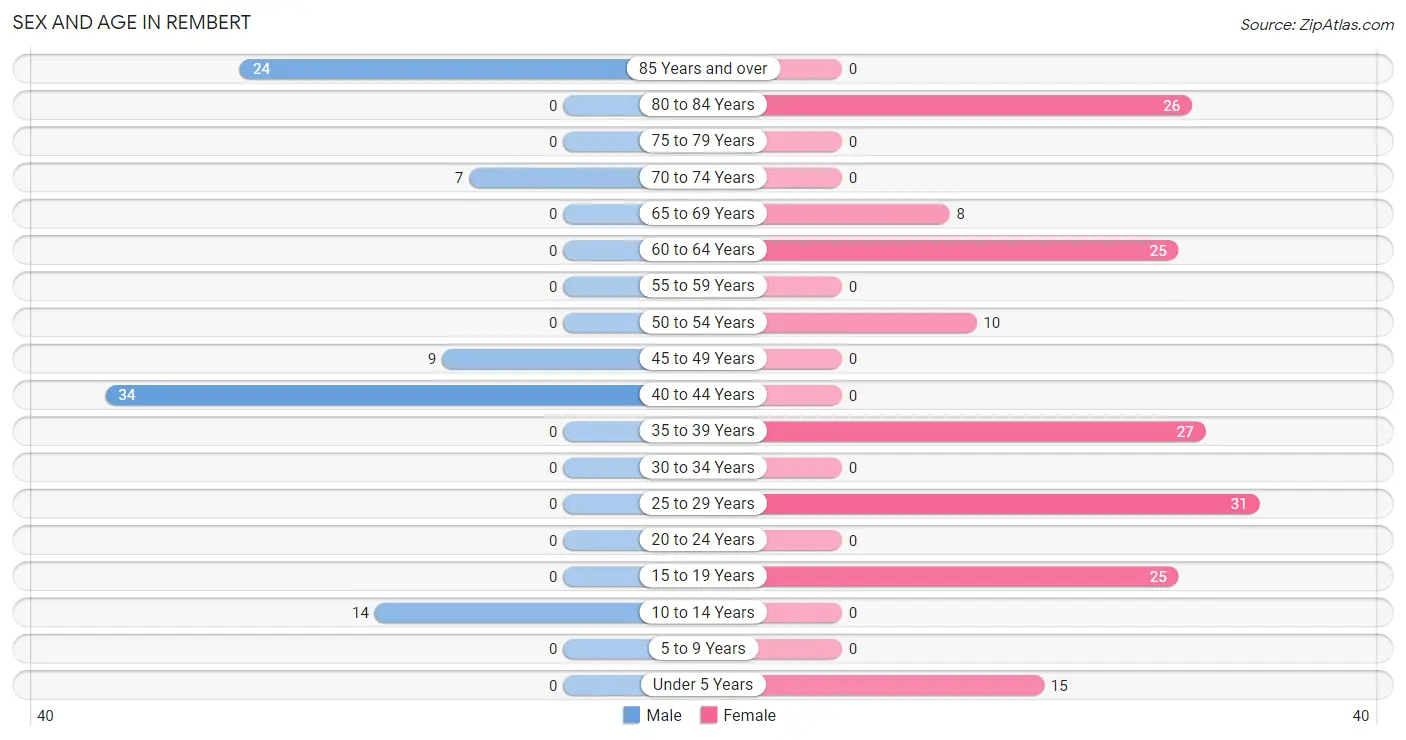
| Age Bracket | Male | Female |
| Under 5 Years | 0 (0.0%) | 15 (9.0%) |
| 5 to 9 Years | 0 (0.0%) | 0 (0.0%) |
| 10 to 14 Years | 14 (15.9%) | 0 (0.0%) |
| 15 to 19 Years | 0 (0.0%) | 25 (15.0%) |
| 20 to 24 Years | 0 (0.0%) | 0 (0.0%) |
| 25 to 29 Years | 0 (0.0%) | 31 (18.6%) |
| 30 to 34 Years | 0 (0.0%) | 0 (0.0%) |
| 35 to 39 Years | 0 (0.0%) | 27 (16.2%) |
| 40 to 44 Years | 34 (38.6%) | 0 (0.0%) |
| 45 to 49 Years | 9 (10.2%) | 0 (0.0%) |
| 50 to 54 Years | 0 (0.0%) | 10 (6.0%) |
| 55 to 59 Years | 0 (0.0%) | 0 (0.0%) |
| 60 to 64 Years | 0 (0.0%) | 25 (15.0%) |
| 65 to 69 Years | 0 (0.0%) | 8 (4.8%) |
| 70 to 74 Years | 7 (8.0%) | 0 (0.0%) |
| 75 to 79 Years | 0 (0.0%) | 0 (0.0%) |
| 80 to 84 Years | 0 (0.0%) | 26 (15.6%) |
| 85 Years and over | 24 (27.3%) | 0 (0.0%) |
| Total | 88 (100.0%) | 167 (100.0%) |
Families and Households in Rembert
Median Family Size in Rembert
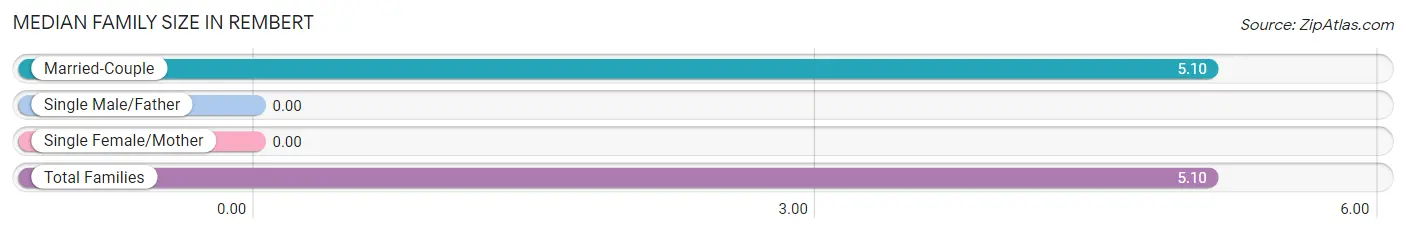
| Family Type | # Families | Family Size |
| Married-Couple | 50 (100.0%) | 5.10 |
| Single Male/Father | 0 (0.0%) | - |
| Single Female/Mother | 0 (0.0%) | - |
| Total Families | 50 (100.0%) | 5.10 |
Median Household Size in Rembert
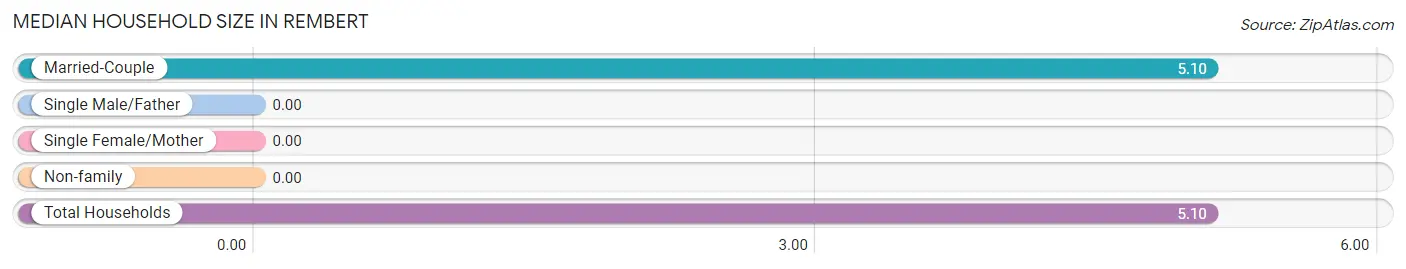
| Household Type | # Households | Household Size |
| Married-Couple | 50 (100.0%) | 5.10 |
| Single Male/Father | 0 (0.0%) | - |
| Single Female/Mother | 0 (0.0%) | - |
| Non-family | 0 (0.0%) | - |
| Total Households | 50 (100.0%) | 5.10 |
Household Size by Marriage Status in Rembert
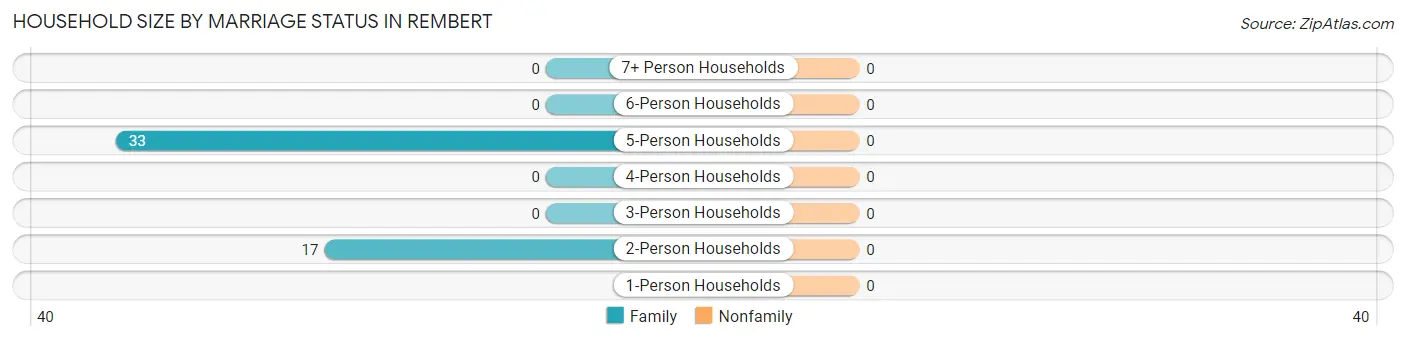
| Household Size | Family Households | Nonfamily Households |
| 1-Person Households | - | 0 (0.0%) |
| 2-Person Households | 17 (34.0%) | 0 (0.0%) |
| 3-Person Households | 0 (0.0%) | 0 (0.0%) |
| 4-Person Households | 0 (0.0%) | 0 (0.0%) |
| 5-Person Households | 33 (66.0%) | 0 (0.0%) |
| 6-Person Households | 0 (0.0%) | 0 (0.0%) |
| 7+ Person Households | 0 (0.0%) | 0 (0.0%) |
| Total | 50 (100.0%) | 0 (0.0%) |
Female Fertility in Rembert
Fertility by Age in Rembert
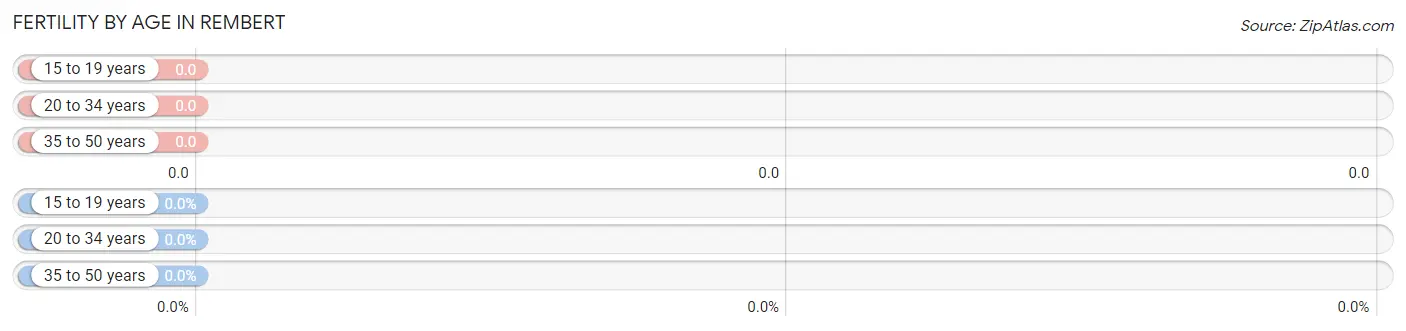
| Age Bracket | Women with Births | Births / 1,000 Women |
| 15 to 19 years | 0 (0.0%) | 0.0 |
| 20 to 34 years | 0 (0.0%) | 0.0 |
| 35 to 50 years | 0 (0.0%) | 0.0 |
| Total | 0 (0.0%) | 0.0 |
Fertility by Age by Marriage Status in Rembert
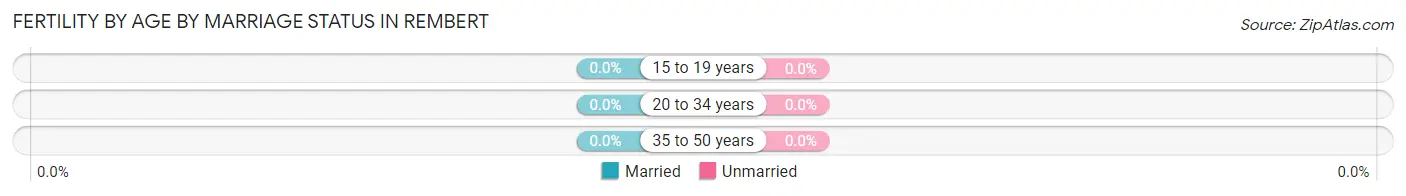
| Age Bracket | Married | Unmarried |
| 15 to 19 years | 0 (0.0%) | 0 (0.0%) |
| 20 to 34 years | 0 (0.0%) | 0 (0.0%) |
| 35 to 50 years | 0 (0.0%) | 0 (0.0%) |
| Total | 0 (0.0%) | 0 (0.0%) |
Fertility by Education in Rembert
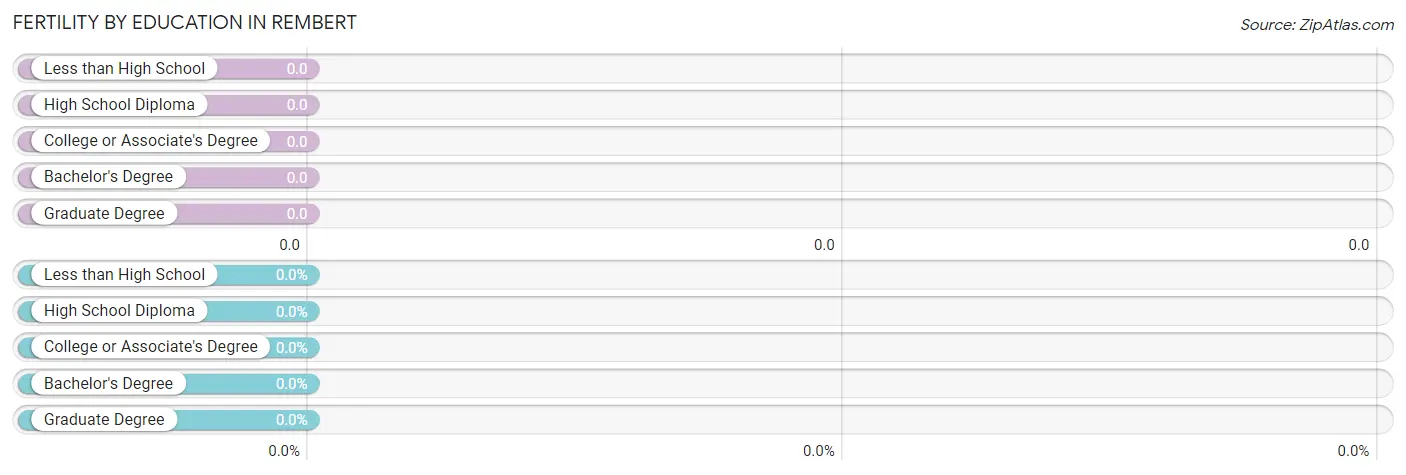
| Educational Attainment | Women with Births | Births / 1,000 Women |
| Less than High School | 0 (0.0%) | 0.0 |
| High School Diploma | 0 (0.0%) | 0.0 |
| College or Associate's Degree | 0 (0.0%) | 0.0 |
| Bachelor's Degree | 0 (0.0%) | 0.0 |
| Graduate Degree | 0 (0.0%) | 0.0 |
| Total | 0 (0.0%) | 0.0 |
Fertility by Education by Marriage Status in Rembert
| Educational Attainment | Married | Unmarried |
| Less than High School | 0 (0.0%) | 0 (0.0%) |
| High School Diploma | 0 (0.0%) | 0 (0.0%) |
| College or Associate's Degree | 0 (0.0%) | 0 (0.0%) |
| Bachelor's Degree | 0 (0.0%) | 0 (0.0%) |
| Graduate Degree | 0 (0.0%) | 0 (0.0%) |
| Total | 0 (0.0%) | 0 (0.0%) |
Employment Characteristics in Rembert
Employment by Class of Employer in Rembert
Among the 101 employed individuals in Rembert, private company employees (77 | 76.2%), state government employees (9 | 8.9%), and self-employed (incorporated) (8 | 7.9%) make up the most common classes of employment.
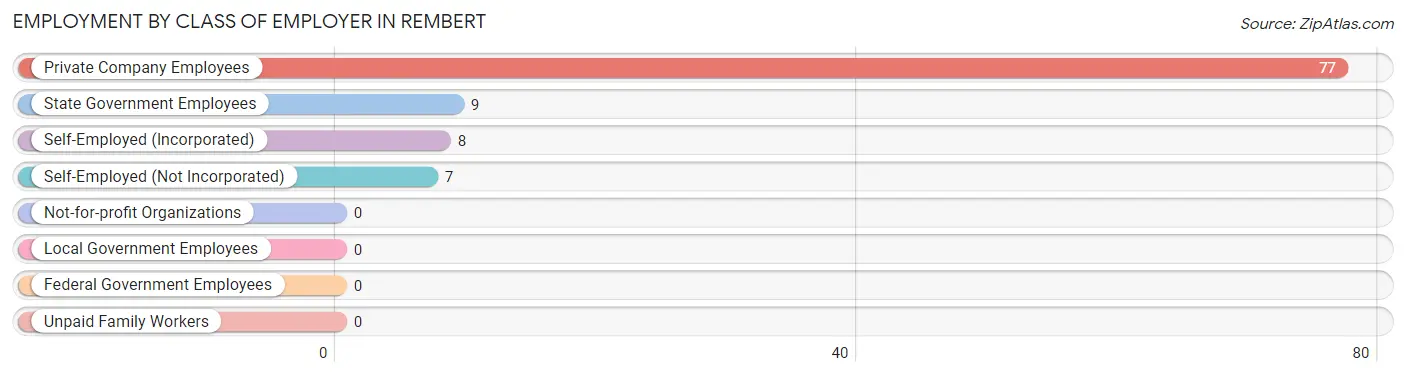
| Employer Class | # Employees | % Employees |
| Private Company Employees | 77 | 76.2% |
| Self-Employed (Incorporated) | 8 | 7.9% |
| Self-Employed (Not Incorporated) | 7 | 6.9% |
| Not-for-profit Organizations | 0 | 0.0% |
| Local Government Employees | 0 | 0.0% |
| State Government Employees | 9 | 8.9% |
| Federal Government Employees | 0 | 0.0% |
| Unpaid Family Workers | 0 | 0.0% |
| Total | 101 | 100.0% |
Employment Status by Age in Rembert
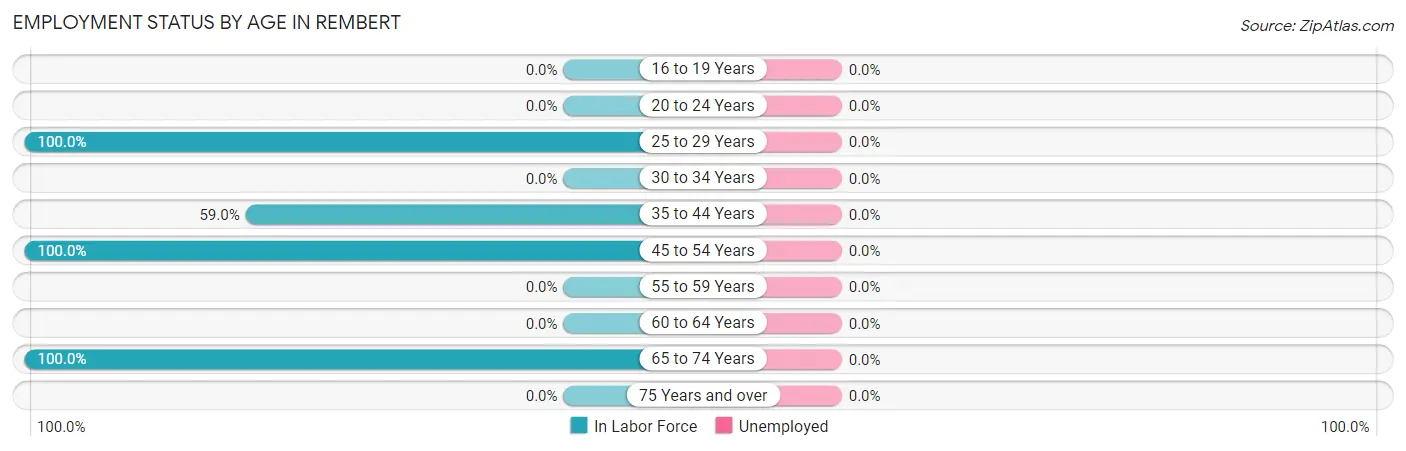
| Age Bracket | In Labor Force | Unemployed |
| 16 to 19 Years | 0 (0.0%) | 0 (0.0%) |
| 20 to 24 Years | 0 (0.0%) | 0 (0.0%) |
| 25 to 29 Years | 31 (100.0%) | 0 (0.0%) |
| 30 to 34 Years | 0 (0.0%) | 0 (0.0%) |
| 35 to 44 Years | 36 (59.0%) | 0 (0.0%) |
| 45 to 54 Years | 19 (100.0%) | 0 (0.0%) |
| 55 to 59 Years | 0 (0.0%) | 0 (0.0%) |
| 60 to 64 Years | 0 (0.0%) | 0 (0.0%) |
| 65 to 74 Years | 15 (100.0%) | 0 (0.0%) |
| 75 Years and over | 0 (0.0%) | 0 (0.0%) |
| Total | 101 (50.2%) | 0 (0.0%) |
Employment Status by Educational Attainment in Rembert
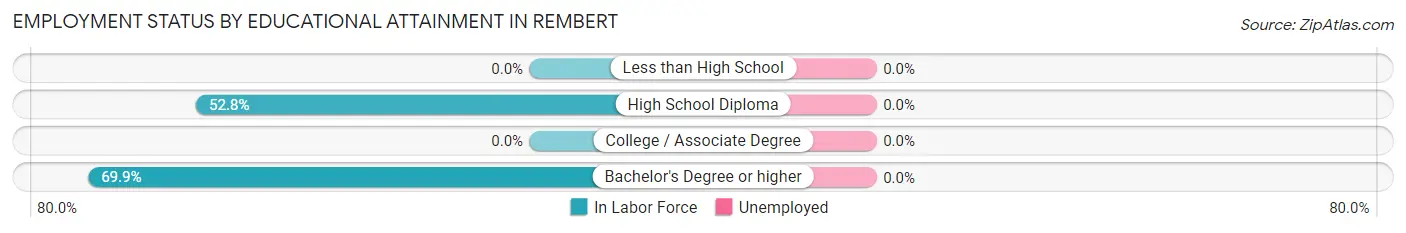
| Educational Attainment | In Labor Force | Unemployed |
| Less than High School | 0 (0.0%) | 0 (0.0%) |
| High School Diploma | 28 (52.8%) | 0 (0.0%) |
| College / Associate Degree | 0 (0.0%) | 0 (0.0%) |
| Bachelor's Degree or higher | 58 (69.9%) | 0 (0.0%) |
| Total | 86 (63.2%) | 0 (0.0%) |
Employment Occupations by Sex in Rembert
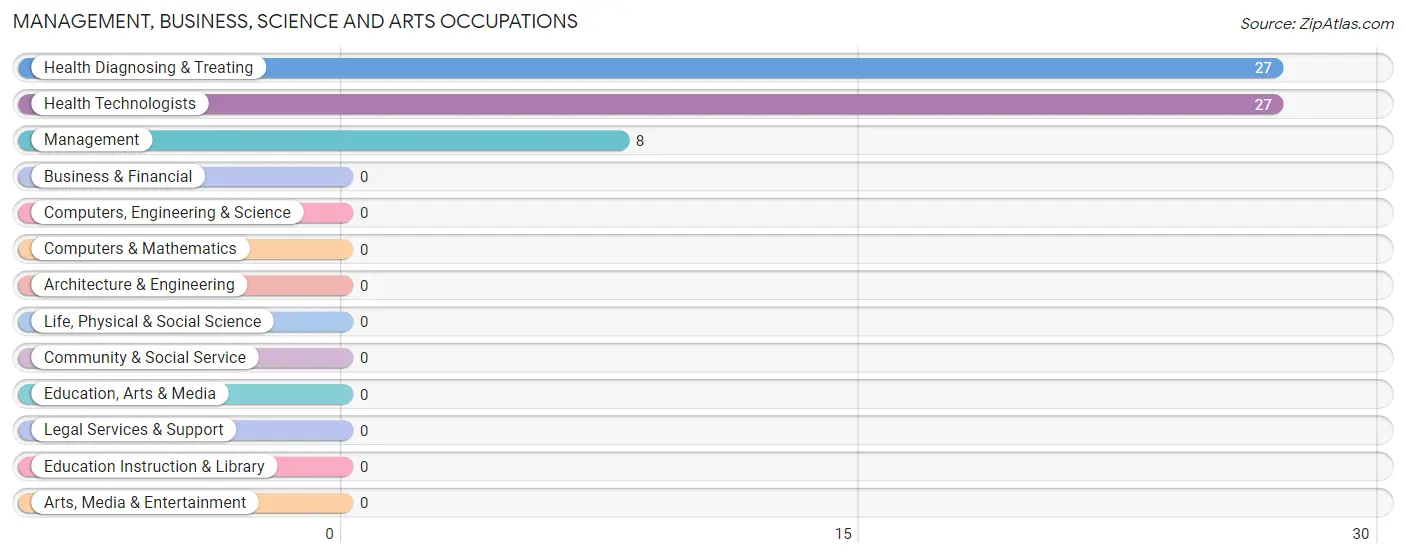
Management, Business, Science and Arts Occupations
The most common Management, Business, Science and Arts occupations in Rembert are Health Diagnosing & Treating (27 | 26.7%), Health Technologists (27 | 26.7%), and Management (8 | 7.9%).
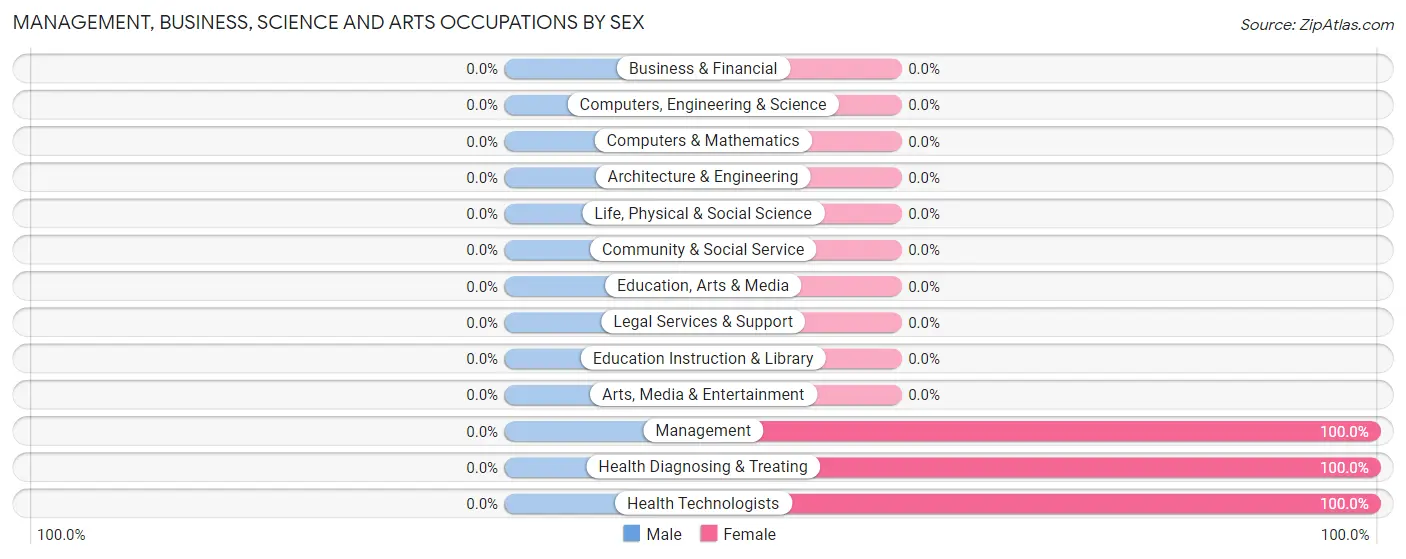
Management, Business, Science and Arts Occupations by Sex
| Occupation | Male | Female |
| Management | 0 (0.0%) | 8 (100.0%) |
| Business & Financial | 0 (0.0%) | 0 (0.0%) |
| Computers, Engineering & Science | 0 (0.0%) | 0 (0.0%) |
| Computers & Mathematics | 0 (0.0%) | 0 (0.0%) |
| Architecture & Engineering | 0 (0.0%) | 0 (0.0%) |
| Life, Physical & Social Science | 0 (0.0%) | 0 (0.0%) |
| Community & Social Service | 0 (0.0%) | 0 (0.0%) |
| Education, Arts & Media | 0 (0.0%) | 0 (0.0%) |
| Legal Services & Support | 0 (0.0%) | 0 (0.0%) |
| Education Instruction & Library | 0 (0.0%) | 0 (0.0%) |
| Arts, Media & Entertainment | 0 (0.0%) | 0 (0.0%) |
| Health Diagnosing & Treating | 0 (0.0%) | 27 (100.0%) |
| Health Technologists | 0 (0.0%) | 27 (100.0%) |
| Total (Category) | 0 (0.0%) | 35 (100.0%) |
| Total (Overall) | 25 (24.7%) | 76 (75.2%) |
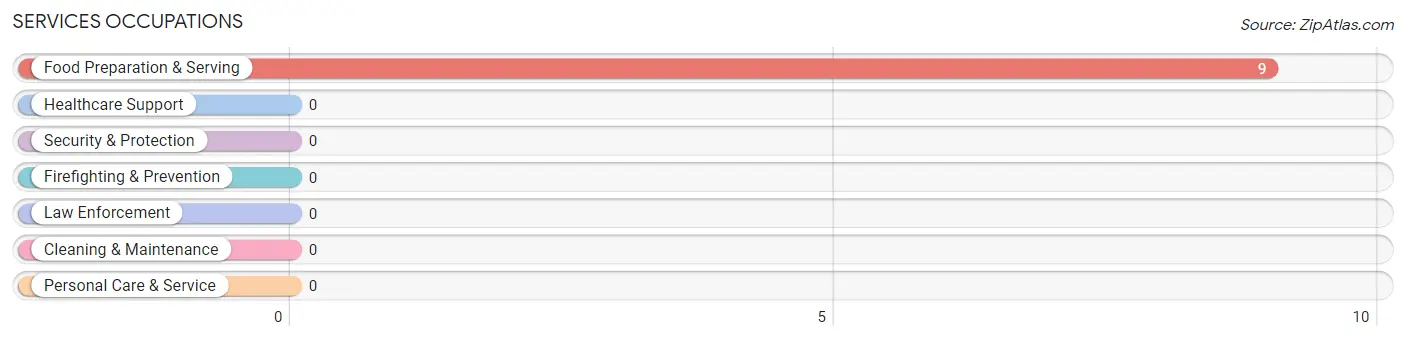
Services Occupations
The most common Services occupations in Rembert are , and Food Preparation & Serving (9 | 8.9%).
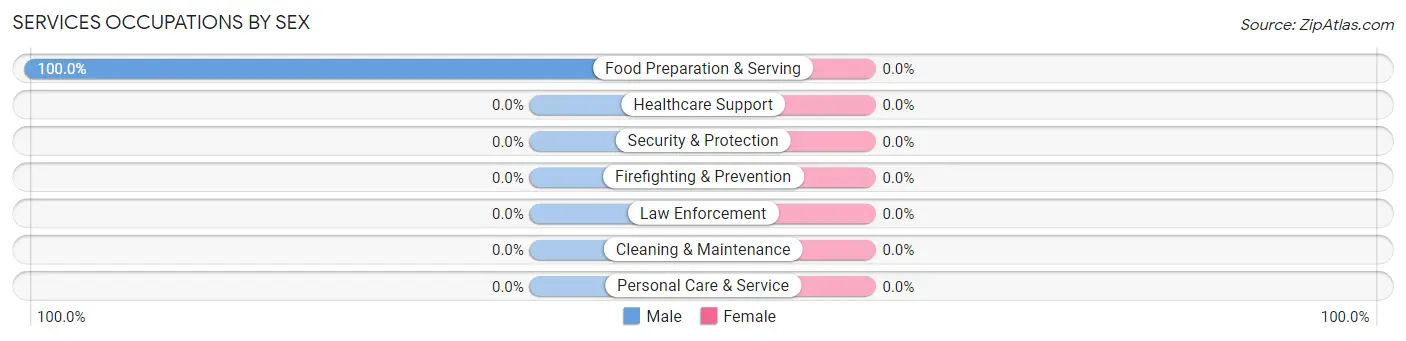
Services Occupations by Sex
| Occupation | Male | Female |
| Healthcare Support | 0 (0.0%) | 0 (0.0%) |
| Security & Protection | 0 (0.0%) | 0 (0.0%) |
| Firefighting & Prevention | 0 (0.0%) | 0 (0.0%) |
| Law Enforcement | 0 (0.0%) | 0 (0.0%) |
| Food Preparation & Serving | 9 (100.0%) | 0 (0.0%) |
| Cleaning & Maintenance | 0 (0.0%) | 0 (0.0%) |
| Personal Care & Service | 0 (0.0%) | 0 (0.0%) |
| Total (Category) | 9 (100.0%) | 0 (0.0%) |
| Total (Overall) | 25 (24.7%) | 76 (75.2%) |
Sales and Office Occupations
The most common Sales and Office occupations in Rembert are Office & Administration (41 | 40.6%), and Sales & Related (7 | 6.9%).
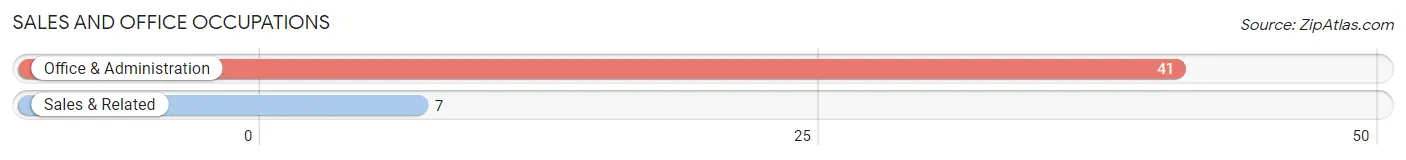
Sales and Office Occupations by Sex
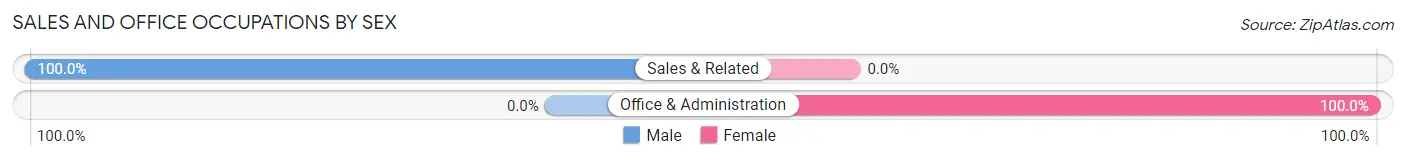
| Occupation | Male | Female |
| Sales & Related | 7 (100.0%) | 0 (0.0%) |
| Office & Administration | 0 (0.0%) | 41 (100.0%) |
| Total (Category) | 7 (14.6%) | 41 (85.4%) |
| Total (Overall) | 25 (24.7%) | 76 (75.2%) |
Natural Resources, Construction and Maintenance Occupations
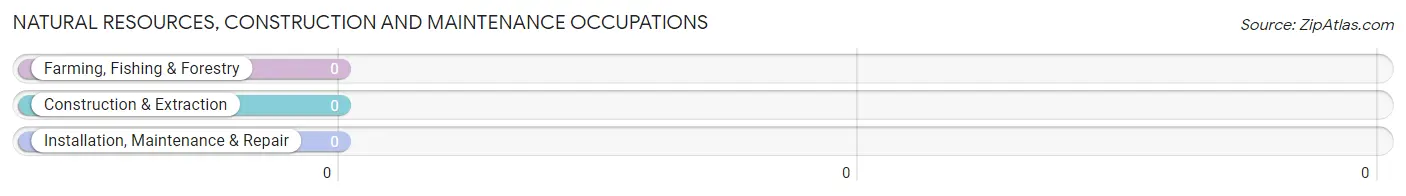
Natural Resources, Construction and Maintenance Occupations by Sex
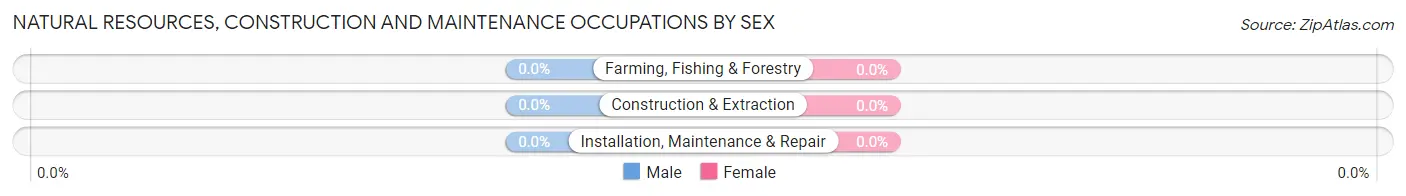
| Occupation | Male | Female |
| Farming, Fishing & Forestry | 0 (0.0%) | 0 (0.0%) |
| Construction & Extraction | 0 (0.0%) | 0 (0.0%) |
| Installation, Maintenance & Repair | 0 (0.0%) | 0 (0.0%) |
| Total (Category) | 0 (0.0%) | 0 (0.0%) |
| Total (Overall) | 25 (24.7%) | 76 (75.2%) |
Production, Transportation and Moving Occupations
The most common Production, Transportation and Moving occupations in Rembert are , and Production (9 | 8.9%).
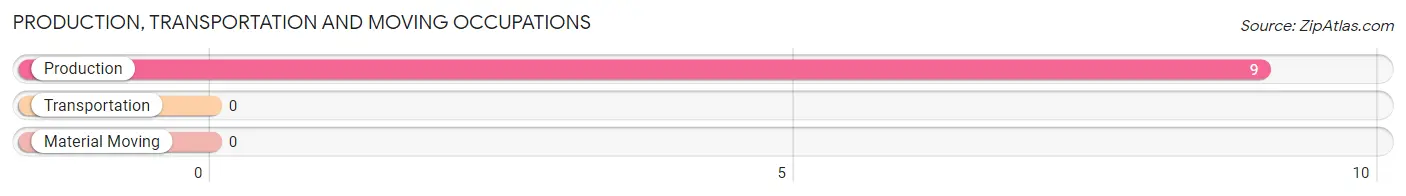
Production, Transportation and Moving Occupations by Sex
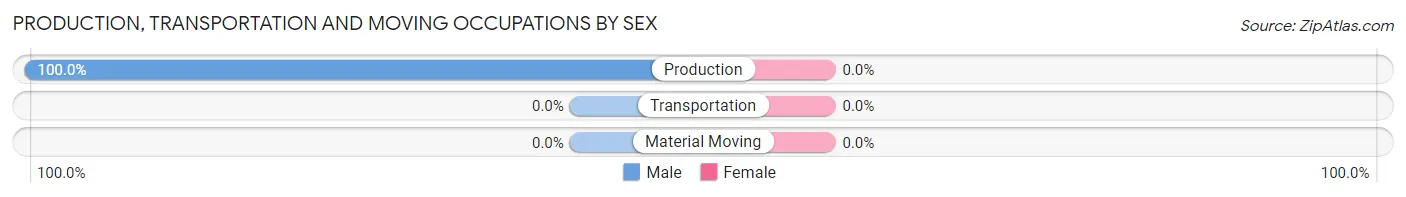
| Occupation | Male | Female |
| Production | 9 (100.0%) | 0 (0.0%) |
| Transportation | 0 (0.0%) | 0 (0.0%) |
| Material Moving | 0 (0.0%) | 0 (0.0%) |
| Total (Category) | 9 (100.0%) | 0 (0.0%) |
| Total (Overall) | 25 (24.7%) | 76 (75.2%) |
Employment Industries by Sex in Rembert
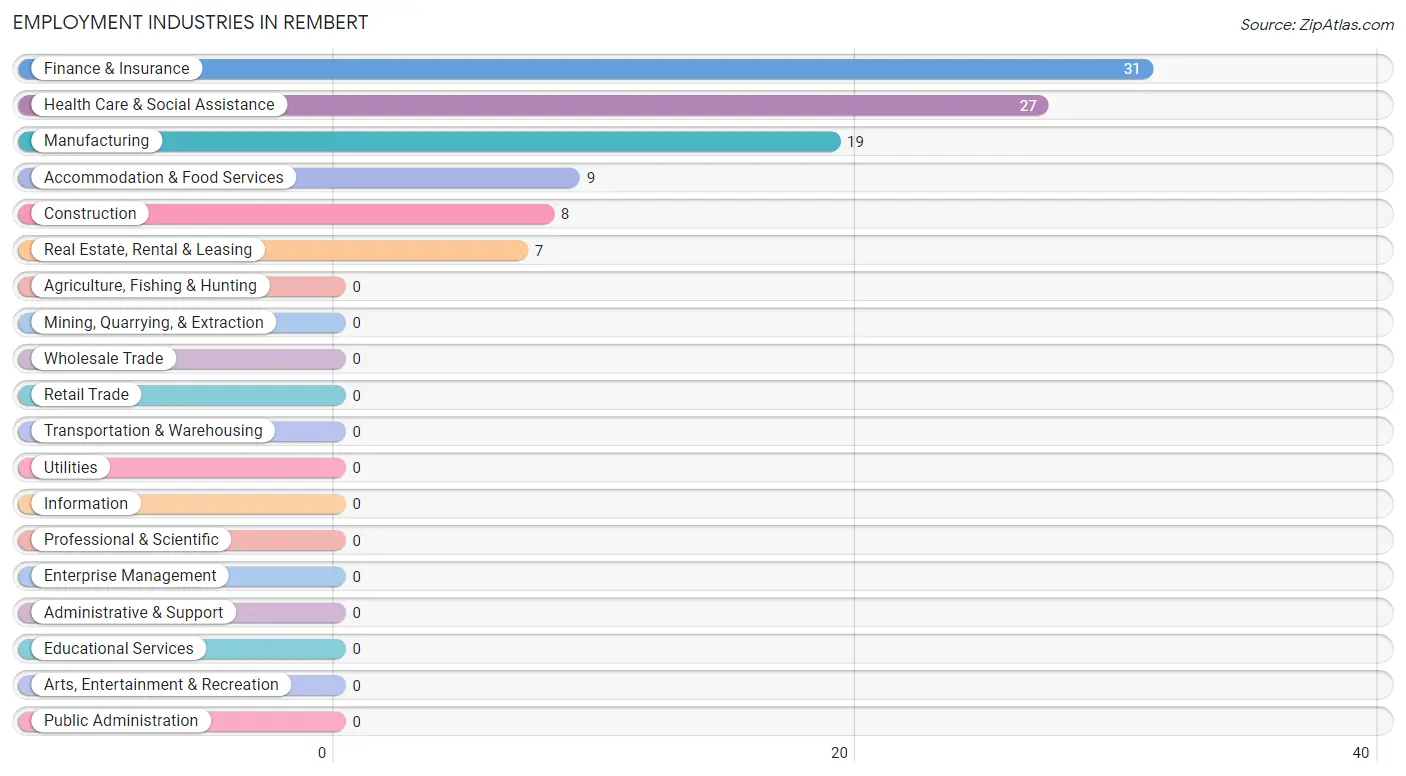
Employment Industries in Rembert
The major employment industries in Rembert include Finance & Insurance (31 | 30.7%), Health Care & Social Assistance (27 | 26.7%), Manufacturing (19 | 18.8%), Accommodation & Food Services (9 | 8.9%), and Construction (8 | 7.9%).
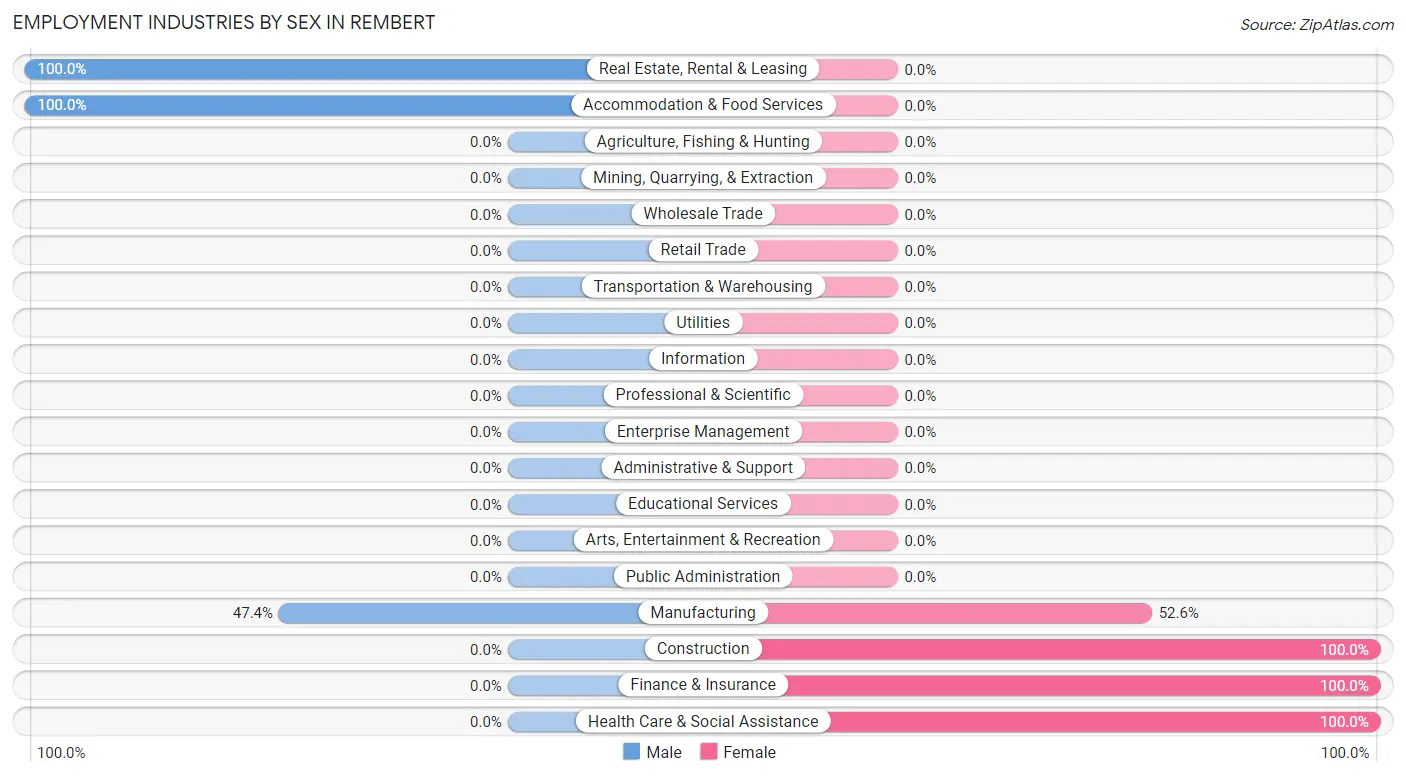
Employment Industries by Sex in Rembert
The Rembert industries that see more men than women are Real Estate, Rental & Leasing (100.0%), Accommodation & Food Services (100.0%), and Manufacturing (47.4%), whereas the industries that tend to have a higher number of women are Construction (100.0%), Finance & Insurance (100.0%), and Health Care & Social Assistance (100.0%).
| Industry | Male | Female |
| Agriculture, Fishing & Hunting | 0 (0.0%) | 0 (0.0%) |
| Mining, Quarrying, & Extraction | 0 (0.0%) | 0 (0.0%) |
| Construction | 0 (0.0%) | 8 (100.0%) |
| Manufacturing | 9 (47.4%) | 10 (52.6%) |
| Wholesale Trade | 0 (0.0%) | 0 (0.0%) |
| Retail Trade | 0 (0.0%) | 0 (0.0%) |
| Transportation & Warehousing | 0 (0.0%) | 0 (0.0%) |
| Utilities | 0 (0.0%) | 0 (0.0%) |
| Information | 0 (0.0%) | 0 (0.0%) |
| Finance & Insurance | 0 (0.0%) | 31 (100.0%) |
| Real Estate, Rental & Leasing | 7 (100.0%) | 0 (0.0%) |
| Professional & Scientific | 0 (0.0%) | 0 (0.0%) |
| Enterprise Management | 0 (0.0%) | 0 (0.0%) |
| Administrative & Support | 0 (0.0%) | 0 (0.0%) |
| Educational Services | 0 (0.0%) | 0 (0.0%) |
| Health Care & Social Assistance | 0 (0.0%) | 27 (100.0%) |
| Arts, Entertainment & Recreation | 0 (0.0%) | 0 (0.0%) |
| Accommodation & Food Services | 9 (100.0%) | 0 (0.0%) |
| Public Administration | 0 (0.0%) | 0 (0.0%) |
| Total | 25 (24.7%) | 76 (75.2%) |
Education in Rembert
School Enrollment in Rembert
The most common levels of schooling among the 54 students in Rembert are high school (39 | 72.2%), and nursery / preschool (15 | 27.8%).
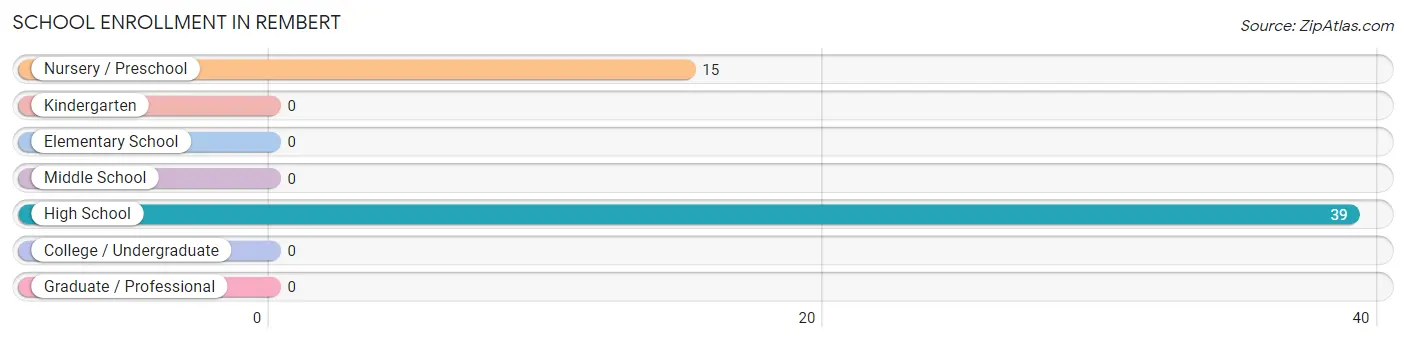
| School Level | # Students | % Students |
| Nursery / Preschool | 15 | 27.8% |
| Kindergarten | 0 | 0.0% |
| Elementary School | 0 | 0.0% |
| Middle School | 0 | 0.0% |
| High School | 39 | 72.2% |
| College / Undergraduate | 0 | 0.0% |
| Graduate / Professional | 0 | 0.0% |
| Total | 54 | 100.0% |
School Enrollment by Age by Funding Source in Rembert
Out of a total of 54 students who are enrolled in schools in Rembert, 14 (25.9%) attend a private institution, while the remaining 40 (74.1%) are enrolled in public schools. The age group of 10 to 14 year olds has the highest likelihood of being enrolled in private schools, with 14 (100.0% in the age bracket) enrolled. Conversely, the age group of 3 to 4 year olds has the lowest likelihood of being enrolled in a private school, with 15 (100.0% in the age bracket) attending a public institution.
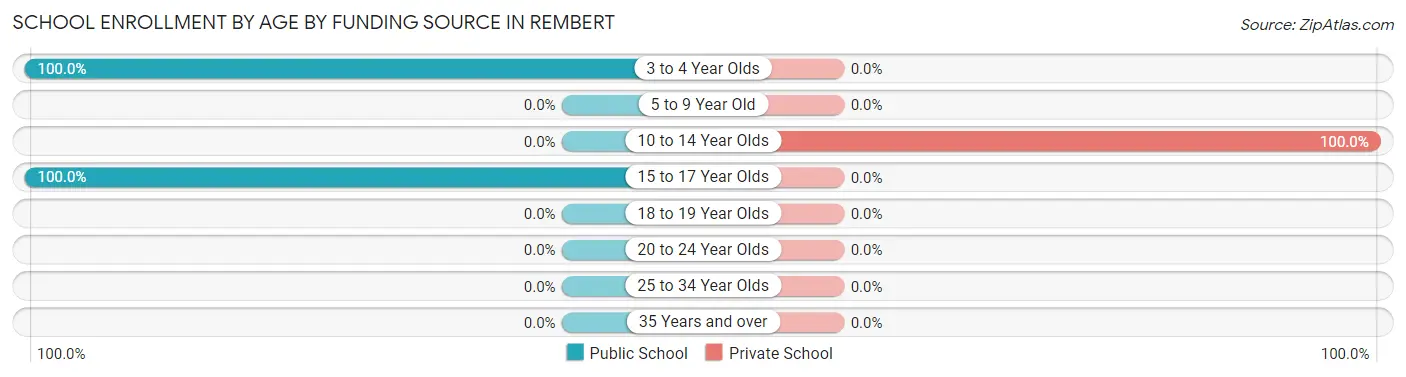
| Age Bracket | Public School | Private School |
| 3 to 4 Year Olds | 15 (100.0%) | 0 (0.0%) |
| 5 to 9 Year Old | 0 (0.0%) | 0 (0.0%) |
| 10 to 14 Year Olds | 0 (0.0%) | 14 (100.0%) |
| 15 to 17 Year Olds | 25 (100.0%) | 0 (0.0%) |
| 18 to 19 Year Olds | 0 (0.0%) | 0 (0.0%) |
| 20 to 24 Year Olds | 0 (0.0%) | 0 (0.0%) |
| 25 to 34 Year Olds | 0 (0.0%) | 0 (0.0%) |
| 35 Years and over | 0 (0.0%) | 0 (0.0%) |
| Total | 40 (74.1%) | 14 (25.9%) |
Educational Attainment by Field of Study in Rembert
Visual & performing arts (31 | 34.4%), science & technology (27 | 30.0%), arts & humanities (25 | 27.8%), and business (7 | 7.8%) are the most common fields of study among 90 individuals in Rembert who have obtained a bachelor's degree or higher.
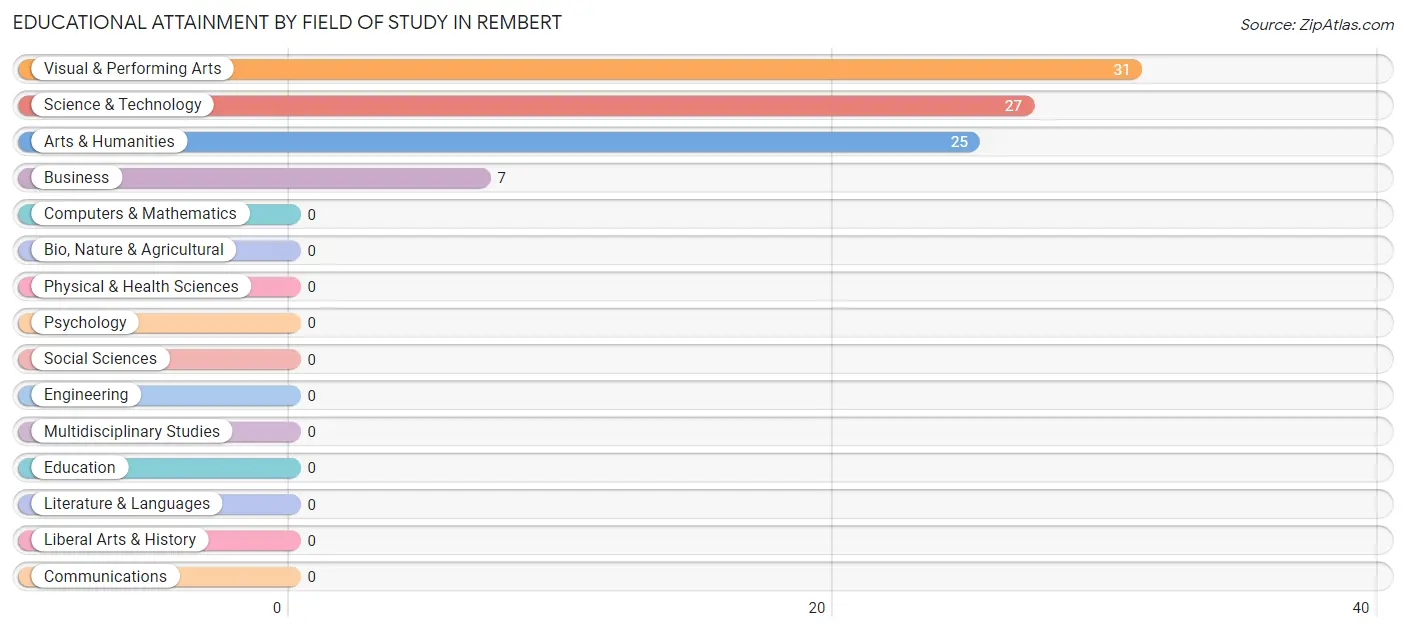
| Field of Study | # Graduates | % Graduates |
| Computers & Mathematics | 0 | 0.0% |
| Bio, Nature & Agricultural | 0 | 0.0% |
| Physical & Health Sciences | 0 | 0.0% |
| Psychology | 0 | 0.0% |
| Social Sciences | 0 | 0.0% |
| Engineering | 0 | 0.0% |
| Multidisciplinary Studies | 0 | 0.0% |
| Science & Technology | 27 | 30.0% |
| Business | 7 | 7.8% |
| Education | 0 | 0.0% |
| Literature & Languages | 0 | 0.0% |
| Liberal Arts & History | 0 | 0.0% |
| Visual & Performing Arts | 31 | 34.4% |
| Communications | 0 | 0.0% |
| Arts & Humanities | 25 | 27.8% |
| Total | 90 | 100.0% |
Transportation & Commute in Rembert
Vehicle Availability by Sex in Rembert
The most prevalent vehicle ownership categories in Rembert are males with 3 vehicles (25, accounting for 100.0%) and females with 3 vehicles (45, making up 32.9%).
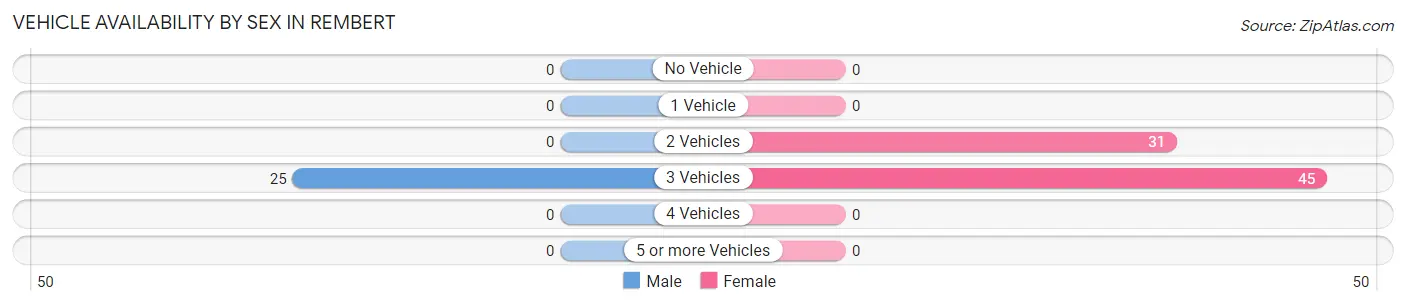
| Vehicles Available | Male | Female |
| No Vehicle | 0 (0.0%) | 0 (0.0%) |
| 1 Vehicle | 0 (0.0%) | 0 (0.0%) |
| 2 Vehicles | 0 (0.0%) | 31 (40.8%) |
| 3 Vehicles | 25 (100.0%) | 45 (59.2%) |
| 4 Vehicles | 0 (0.0%) | 0 (0.0%) |
| 5 or more Vehicles | 0 (0.0%) | 0 (0.0%) |
| Total | 25 (100.0%) | 76 (100.0%) |
Commute Time in Rembert
The most frequently occuring commute durations in Rembert are 60 to 89 minutes (31 commuters, 33.3%), 30 to 34 minutes (27 commuters, 29.0%), and 20 to 24 minutes (16 commuters, 17.2%).
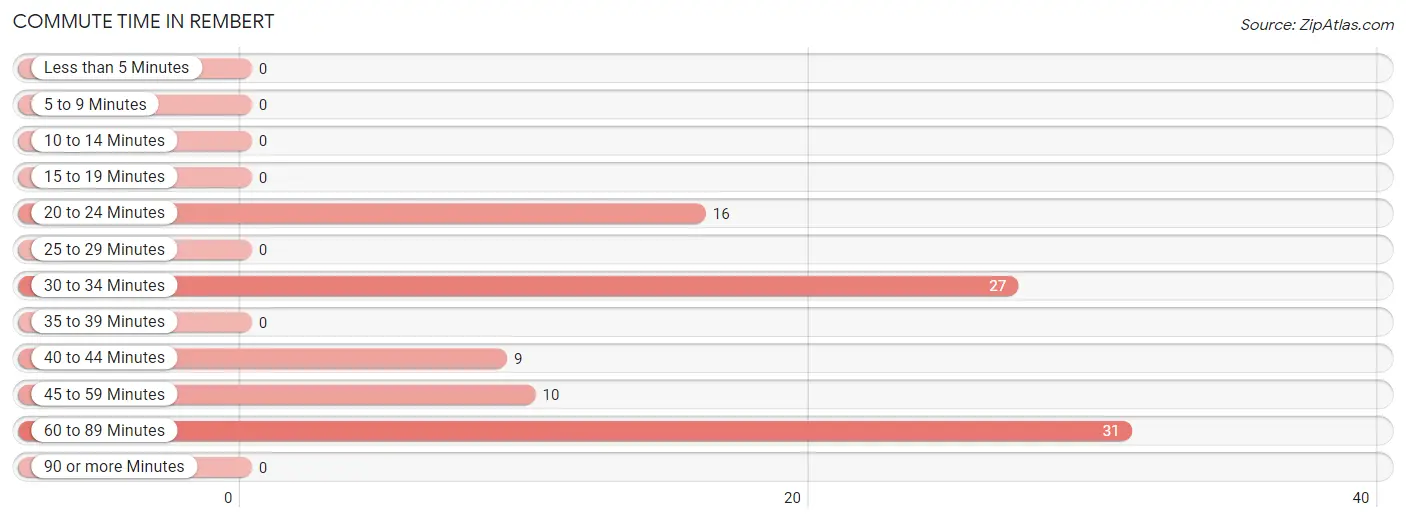
| Commute Time | # Commuters | % Commuters |
| Less than 5 Minutes | 0 | 0.0% |
| 5 to 9 Minutes | 0 | 0.0% |
| 10 to 14 Minutes | 0 | 0.0% |
| 15 to 19 Minutes | 0 | 0.0% |
| 20 to 24 Minutes | 16 | 17.2% |
| 25 to 29 Minutes | 0 | 0.0% |
| 30 to 34 Minutes | 27 | 29.0% |
| 35 to 39 Minutes | 0 | 0.0% |
| 40 to 44 Minutes | 9 | 9.7% |
| 45 to 59 Minutes | 10 | 10.7% |
| 60 to 89 Minutes | 31 | 33.3% |
| 90 or more Minutes | 0 | 0.0% |
Commute Time by Sex in Rembert
The most common commute times in Rembert are 20 to 24 minutes (16 commuters, 64.0%) for males and 60 to 89 minutes (31 commuters, 45.6%) for females.
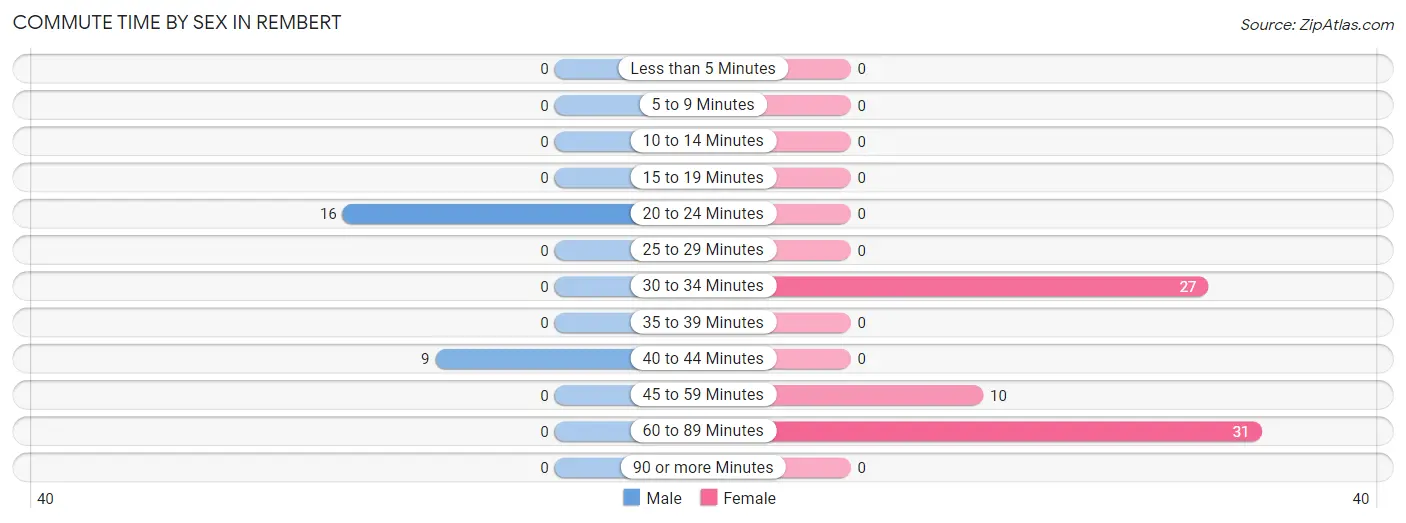
| Commute Time | Male | Female |
| Less than 5 Minutes | 0 (0.0%) | 0 (0.0%) |
| 5 to 9 Minutes | 0 (0.0%) | 0 (0.0%) |
| 10 to 14 Minutes | 0 (0.0%) | 0 (0.0%) |
| 15 to 19 Minutes | 0 (0.0%) | 0 (0.0%) |
| 20 to 24 Minutes | 16 (64.0%) | 0 (0.0%) |
| 25 to 29 Minutes | 0 (0.0%) | 0 (0.0%) |
| 30 to 34 Minutes | 0 (0.0%) | 27 (39.7%) |
| 35 to 39 Minutes | 0 (0.0%) | 0 (0.0%) |
| 40 to 44 Minutes | 9 (36.0%) | 0 (0.0%) |
| 45 to 59 Minutes | 0 (0.0%) | 10 (14.7%) |
| 60 to 89 Minutes | 0 (0.0%) | 31 (45.6%) |
| 90 or more Minutes | 0 (0.0%) | 0 (0.0%) |
Time of Departure to Work by Sex in Rembert
The most frequent times of departure to work in Rembert are 12:00 AM to 4:59 AM (9, 36.0%) for males and 7:00 AM to 7:29 AM (41, 60.3%) for females.
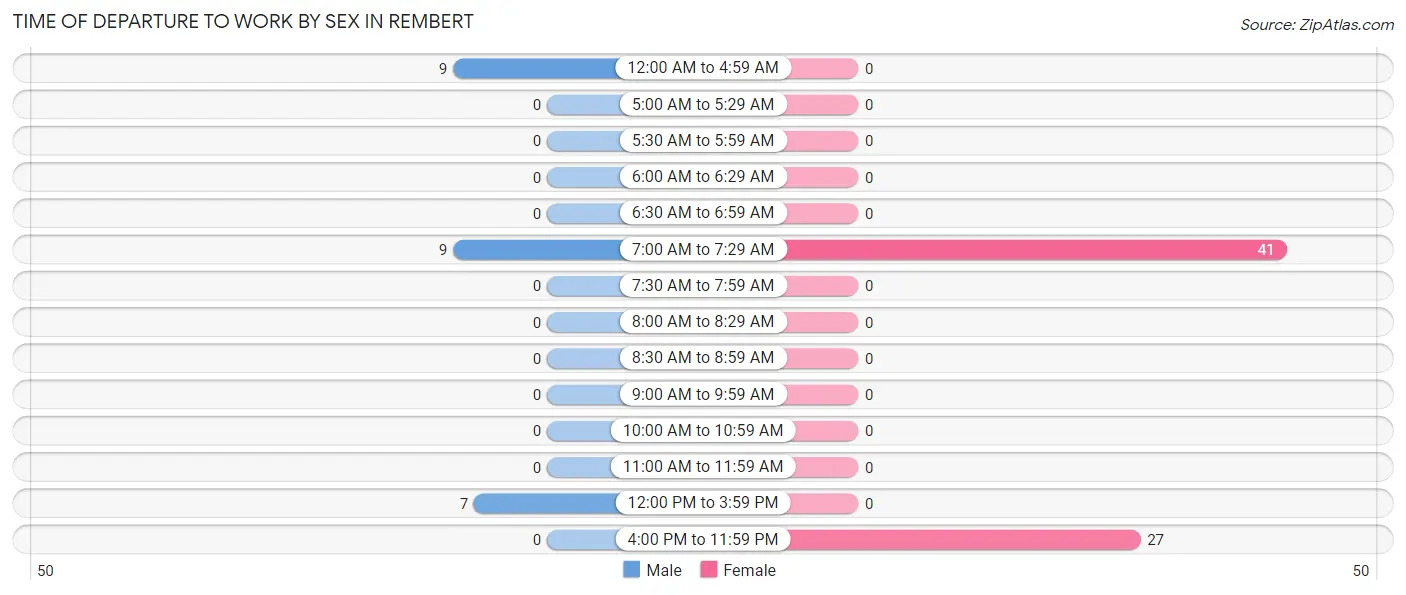
| Time of Departure | Male | Female |
| 12:00 AM to 4:59 AM | 9 (36.0%) | 0 (0.0%) |
| 5:00 AM to 5:29 AM | 0 (0.0%) | 0 (0.0%) |
| 5:30 AM to 5:59 AM | 0 (0.0%) | 0 (0.0%) |
| 6:00 AM to 6:29 AM | 0 (0.0%) | 0 (0.0%) |
| 6:30 AM to 6:59 AM | 0 (0.0%) | 0 (0.0%) |
| 7:00 AM to 7:29 AM | 9 (36.0%) | 41 (60.3%) |
| 7:30 AM to 7:59 AM | 0 (0.0%) | 0 (0.0%) |
| 8:00 AM to 8:29 AM | 0 (0.0%) | 0 (0.0%) |
| 8:30 AM to 8:59 AM | 0 (0.0%) | 0 (0.0%) |
| 9:00 AM to 9:59 AM | 0 (0.0%) | 0 (0.0%) |
| 10:00 AM to 10:59 AM | 0 (0.0%) | 0 (0.0%) |
| 11:00 AM to 11:59 AM | 0 (0.0%) | 0 (0.0%) |
| 12:00 PM to 3:59 PM | 7 (28.0%) | 0 (0.0%) |
| 4:00 PM to 11:59 PM | 0 (0.0%) | 27 (39.7%) |
| Total | 25 (100.0%) | 68 (100.0%) |
Housing Occupancy in Rembert
Occupancy by Ownership in Rembert
Of the total 50 dwellings in Rembert, owner-occupied units account for 26 (52.0%), while renter-occupied units make up 24 (48.0%).
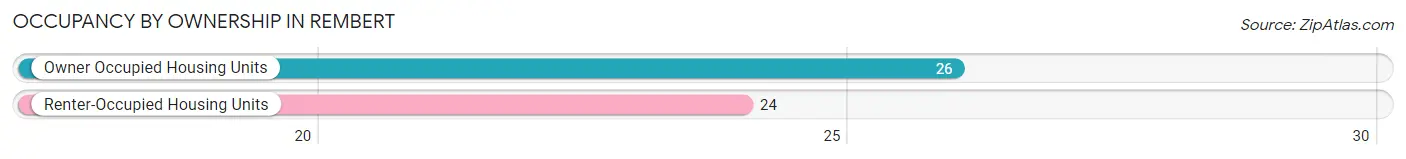
| Occupancy | # Housing Units | % Housing Units |
| Owner Occupied Housing Units | 26 | 52.0% |
| Renter-Occupied Housing Units | 24 | 48.0% |
| Total Occupied Housing Units | 50 | 100.0% |
Occupancy by Household Size in Rembert
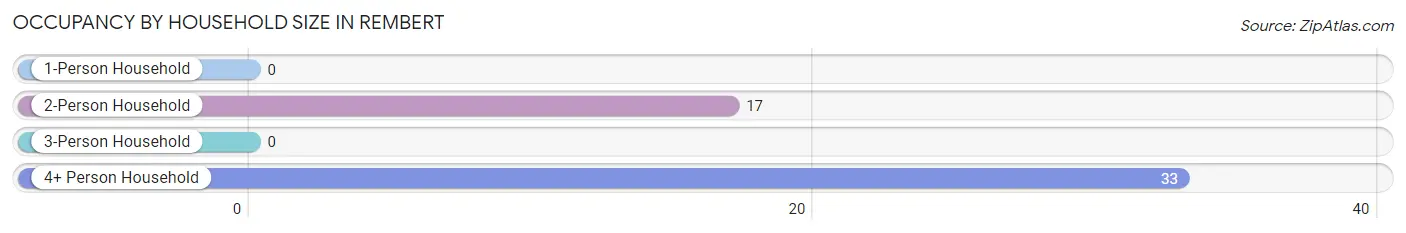
| Household Size | # Housing Units | % Housing Units |
| 1-Person Household | 0 | 0.0% |
| 2-Person Household | 17 | 34.0% |
| 3-Person Household | 0 | 0.0% |
| 4+ Person Household | 33 | 66.0% |
| Total Housing Units | 50 | 100.0% |
Occupancy by Ownership by Household Size in Rembert
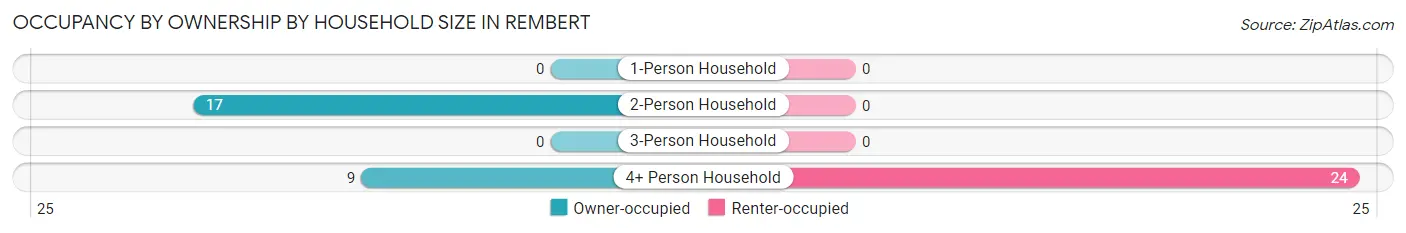
| Household Size | Owner-occupied | Renter-occupied |
| 1-Person Household | 0 (0.0%) | 0 (0.0%) |
| 2-Person Household | 17 (100.0%) | 0 (0.0%) |
| 3-Person Household | 0 (0.0%) | 0 (0.0%) |
| 4+ Person Household | 9 (27.3%) | 24 (72.7%) |
| Total Housing Units | 26 (52.0%) | 24 (48.0%) |
Occupancy by Educational Attainment in Rembert
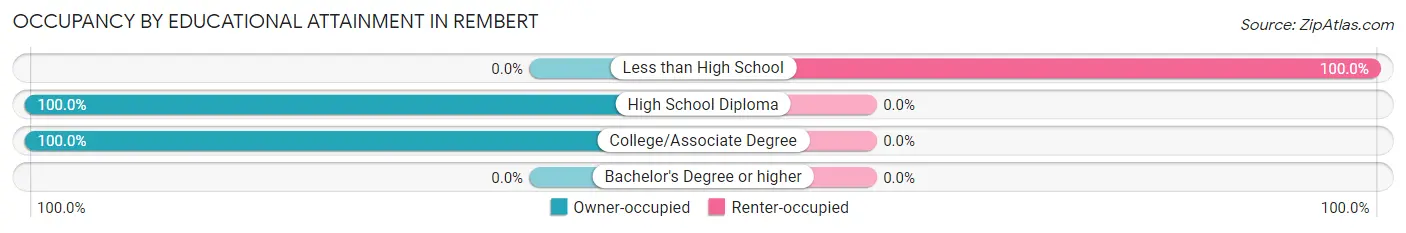
| Household Size | Owner-occupied | Renter-occupied |
| Less than High School | 0 (0.0%) | 24 (100.0%) |
| High School Diploma | 18 (100.0%) | 0 (0.0%) |
| College/Associate Degree | 8 (100.0%) | 0 (0.0%) |
| Bachelor's Degree or higher | 0 (0.0%) | 0 (0.0%) |
Occupancy by Age of Householder in Rembert
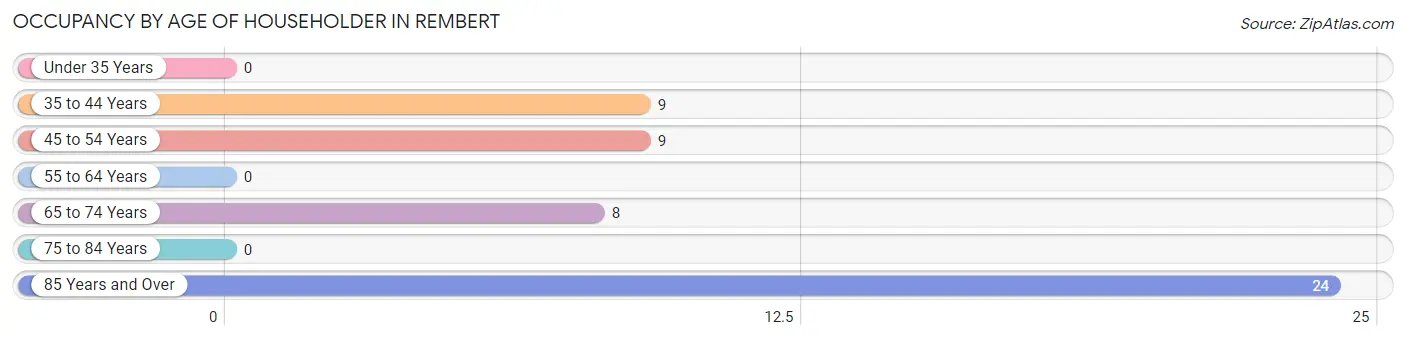
| Age Bracket | # Households | % Households |
| Under 35 Years | 0 | 0.0% |
| 35 to 44 Years | 9 | 18.0% |
| 45 to 54 Years | 9 | 18.0% |
| 55 to 64 Years | 0 | 0.0% |
| 65 to 74 Years | 8 | 16.0% |
| 75 to 84 Years | 0 | 0.0% |
| 85 Years and Over | 24 | 48.0% |
| Total | 50 | 100.0% |
Housing Finances in Rembert
Median Income by Occupancy in Rembert
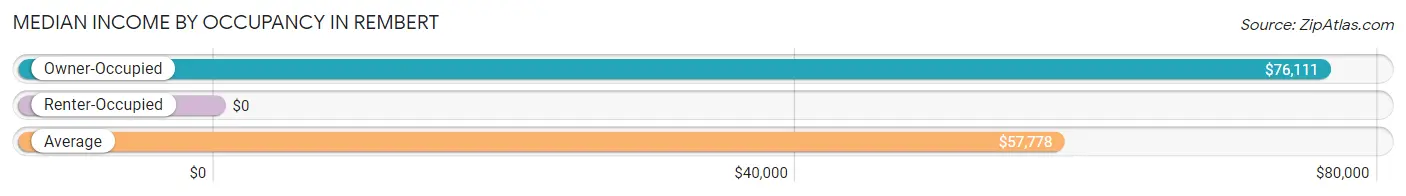
| Occupancy Type | # Households | Median Income |
| Owner-Occupied | 26 (52.0%) | $76,111 |
| Renter-Occupied | 24 (48.0%) | $0 |
| Average | 50 (100.0%) | $57,778 |
Occupancy by Householder Income Bracket in Rembert
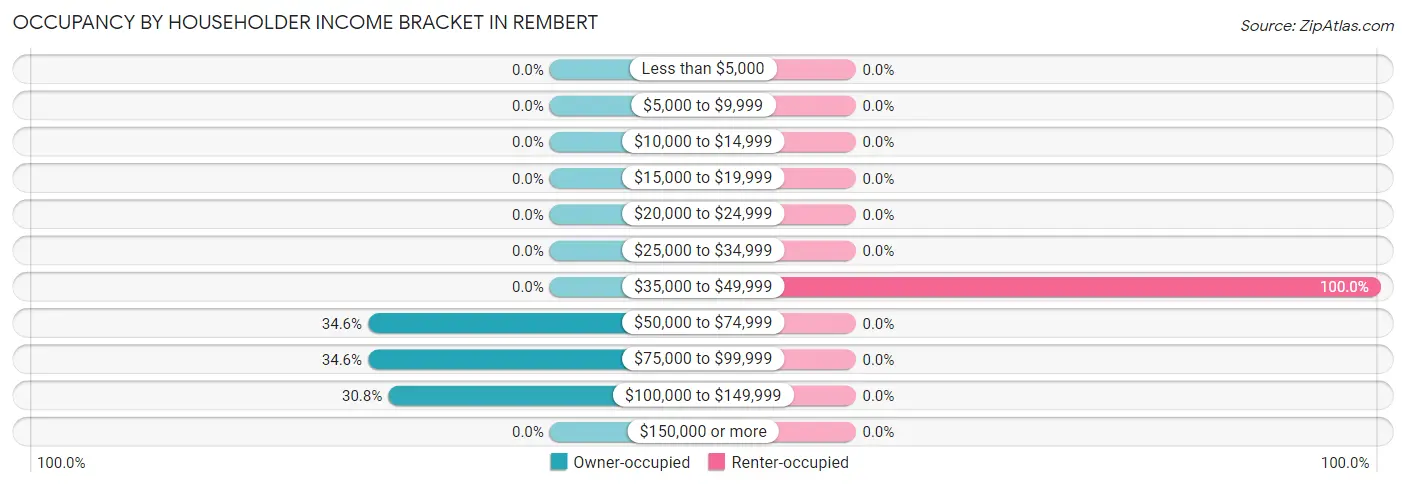
| Income Bracket | Owner-occupied | Renter-occupied |
| Less than $5,000 | 0 (0.0%) | 0 (0.0%) |
| $5,000 to $9,999 | 0 (0.0%) | 0 (0.0%) |
| $10,000 to $14,999 | 0 (0.0%) | 0 (0.0%) |
| $15,000 to $19,999 | 0 (0.0%) | 0 (0.0%) |
| $20,000 to $24,999 | 0 (0.0%) | 0 (0.0%) |
| $25,000 to $34,999 | 0 (0.0%) | 0 (0.0%) |
| $35,000 to $49,999 | 0 (0.0%) | 24 (100.0%) |
| $50,000 to $74,999 | 9 (34.6%) | 0 (0.0%) |
| $75,000 to $99,999 | 9 (34.6%) | 0 (0.0%) |
| $100,000 to $149,999 | 8 (30.8%) | 0 (0.0%) |
| $150,000 or more | 0 (0.0%) | 0 (0.0%) |
| Total | 26 (100.0%) | 24 (100.0%) |
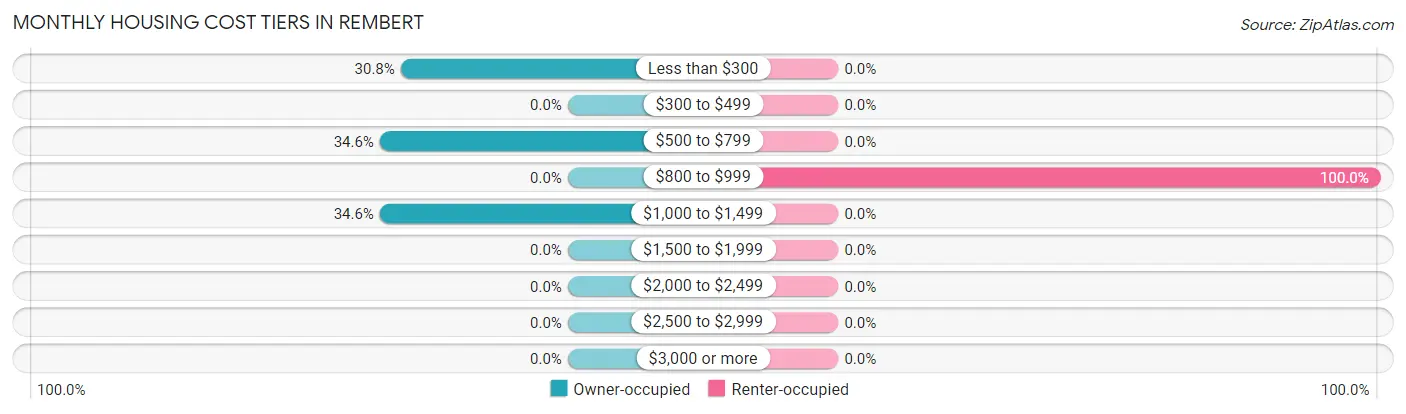
Monthly Housing Cost Tiers in Rembert
| Monthly Cost | Owner-occupied | Renter-occupied |
| Less than $300 | 8 (30.8%) | 0 (0.0%) |
| $300 to $499 | 0 (0.0%) | 0 (0.0%) |
| $500 to $799 | 9 (34.6%) | 0 (0.0%) |
| $800 to $999 | 0 (0.0%) | 24 (100.0%) |
| $1,000 to $1,499 | 9 (34.6%) | 0 (0.0%) |
| $1,500 to $1,999 | 0 (0.0%) | 0 (0.0%) |
| $2,000 to $2,499 | 0 (0.0%) | 0 (0.0%) |
| $2,500 to $2,999 | 0 (0.0%) | 0 (0.0%) |
| $3,000 or more | 0 (0.0%) | 0 (0.0%) |
| Total | 26 (100.0%) | 24 (100.0%) |
Physical Housing Characteristics in Rembert
Housing Structures in Rembert
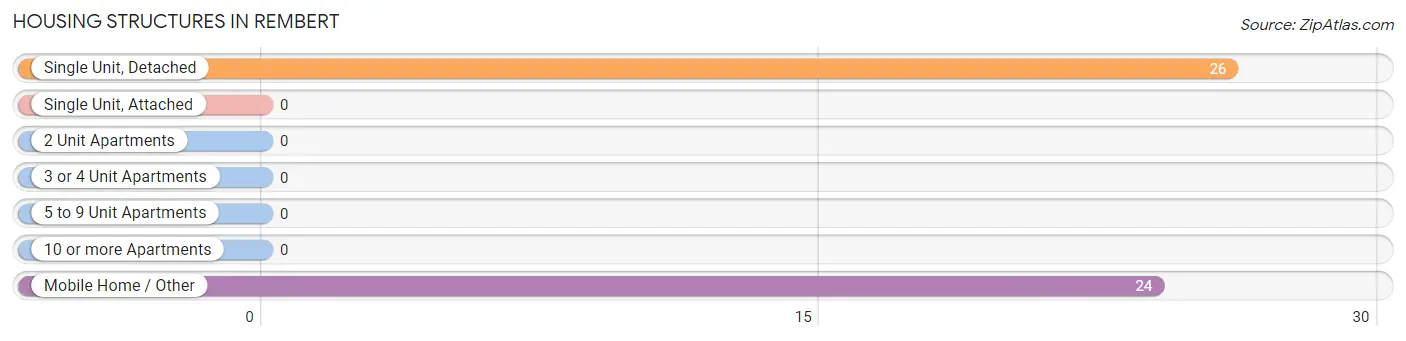
| Structure Type | # Housing Units | % Housing Units |
| Single Unit, Detached | 26 | 52.0% |
| Single Unit, Attached | 0 | 0.0% |
| 2 Unit Apartments | 0 | 0.0% |
| 3 or 4 Unit Apartments | 0 | 0.0% |
| 5 to 9 Unit Apartments | 0 | 0.0% |
| 10 or more Apartments | 0 | 0.0% |
| Mobile Home / Other | 24 | 48.0% |
| Total | 50 | 100.0% |
Housing Structures by Occupancy in Rembert
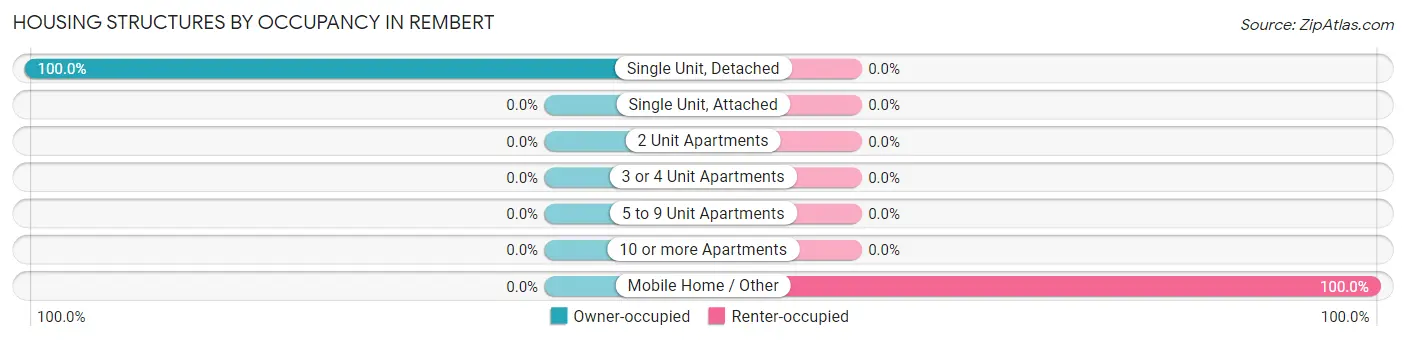
| Structure Type | Owner-occupied | Renter-occupied |
| Single Unit, Detached | 26 (100.0%) | 0 (0.0%) |
| Single Unit, Attached | 0 (0.0%) | 0 (0.0%) |
| 2 Unit Apartments | 0 (0.0%) | 0 (0.0%) |
| 3 or 4 Unit Apartments | 0 (0.0%) | 0 (0.0%) |
| 5 to 9 Unit Apartments | 0 (0.0%) | 0 (0.0%) |
| 10 or more Apartments | 0 (0.0%) | 0 (0.0%) |
| Mobile Home / Other | 0 (0.0%) | 24 (100.0%) |
| Total | 26 (52.0%) | 24 (48.0%) |
Housing Structures by Number of Rooms in Rembert
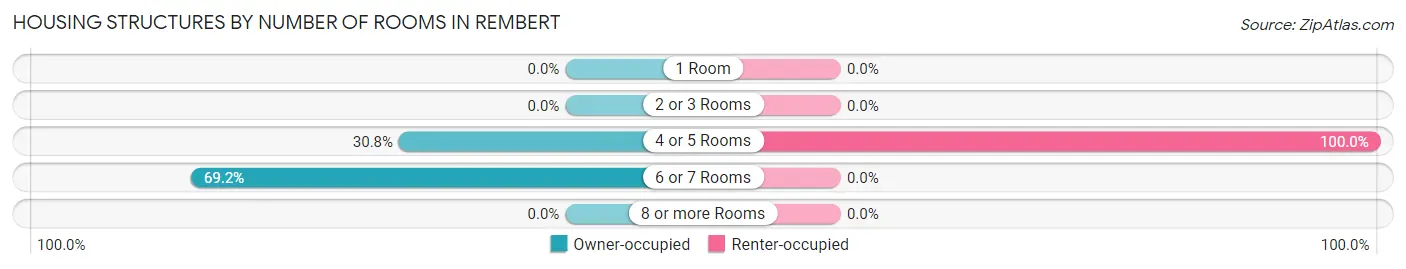
| Number of Rooms | Owner-occupied | Renter-occupied |
| 1 Room | 0 (0.0%) | 0 (0.0%) |
| 2 or 3 Rooms | 0 (0.0%) | 0 (0.0%) |
| 4 or 5 Rooms | 8 (30.8%) | 24 (100.0%) |
| 6 or 7 Rooms | 18 (69.2%) | 0 (0.0%) |
| 8 or more Rooms | 0 (0.0%) | 0 (0.0%) |
| Total | 26 (100.0%) | 24 (100.0%) |
Housing Structure by Heating Type in Rembert
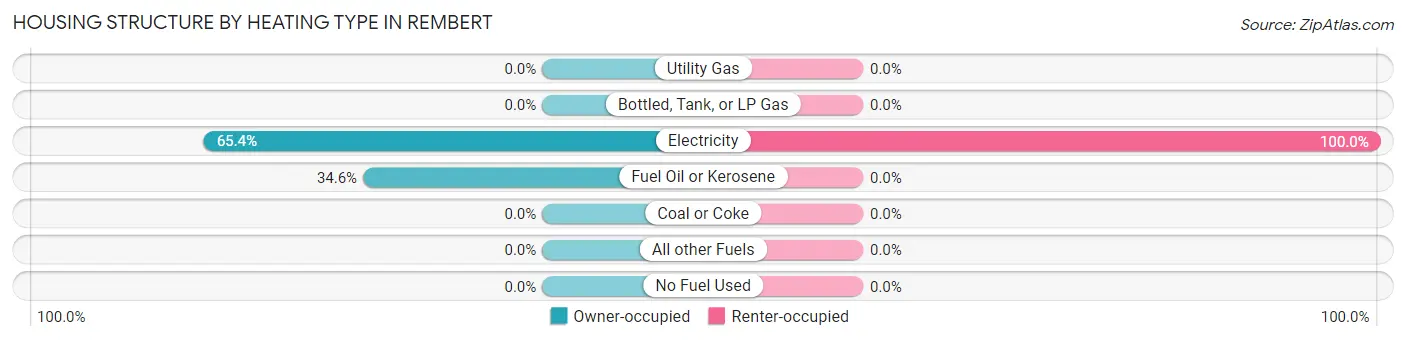
| Heating Type | Owner-occupied | Renter-occupied |
| Utility Gas | 0 (0.0%) | 0 (0.0%) |
| Bottled, Tank, or LP Gas | 0 (0.0%) | 0 (0.0%) |
| Electricity | 17 (65.4%) | 24 (100.0%) |
| Fuel Oil or Kerosene | 9 (34.6%) | 0 (0.0%) |
| Coal or Coke | 0 (0.0%) | 0 (0.0%) |
| All other Fuels | 0 (0.0%) | 0 (0.0%) |
| No Fuel Used | 0 (0.0%) | 0 (0.0%) |
| Total | 26 (100.0%) | 24 (100.0%) |
Household Vehicle Usage in Rembert
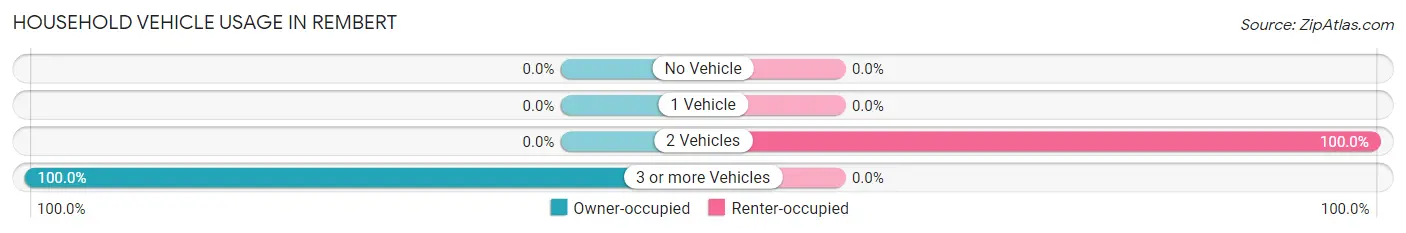
| Vehicles per Household | Owner-occupied | Renter-occupied |
| No Vehicle | 0 (0.0%) | 0 (0.0%) |
| 1 Vehicle | 0 (0.0%) | 0 (0.0%) |
| 2 Vehicles | 0 (0.0%) | 24 (100.0%) |
| 3 or more Vehicles | 26 (100.0%) | 0 (0.0%) |
| Total | 26 (100.0%) | 24 (100.0%) |
Real Estate & Mortgages in Rembert
Real Estate and Mortgage Overview in Rembert
| Characteristic | Without Mortgage | With Mortgage |
| Housing Units | 17 | 9 |
| Median Property Value | - | - |
| Median Household Income | - | - |
| Monthly Housing Costs | - | - |
| Real Estate Taxes | - | - |
Property Value by Mortgage Status in Rembert
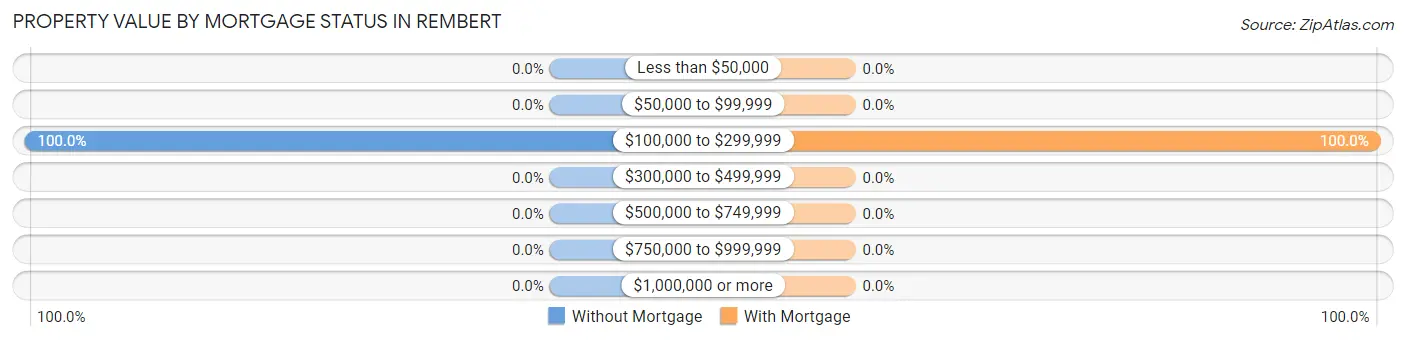
| Property Value | Without Mortgage | With Mortgage |
| Less than $50,000 | 0 (0.0%) | 0 (0.0%) |
| $50,000 to $99,999 | 0 (0.0%) | 0 (0.0%) |
| $100,000 to $299,999 | 17 (100.0%) | 9 (100.0%) |
| $300,000 to $499,999 | 0 (0.0%) | 0 (0.0%) |
| $500,000 to $749,999 | 0 (0.0%) | 0 (0.0%) |
| $750,000 to $999,999 | 0 (0.0%) | 0 (0.0%) |
| $1,000,000 or more | 0 (0.0%) | 0 (0.0%) |
| Total | 17 (100.0%) | 9 (100.0%) |
Household Income by Mortgage Status in Rembert
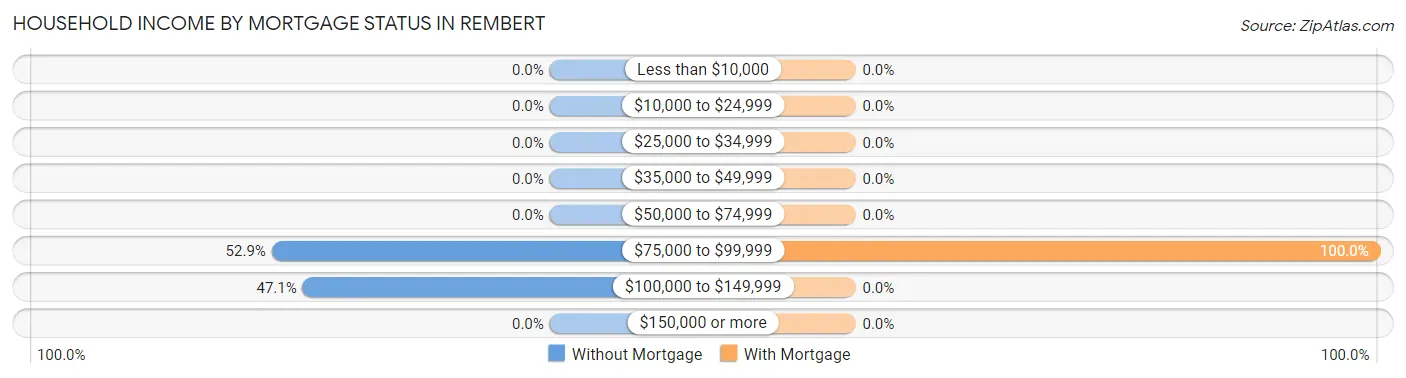
| Household Income | Without Mortgage | With Mortgage |
| Less than $10,000 | 0 (0.0%) | 0 (0.0%) |
| $10,000 to $24,999 | 0 (0.0%) | 0 (0.0%) |
| $25,000 to $34,999 | 0 (0.0%) | 0 (0.0%) |
| $35,000 to $49,999 | 0 (0.0%) | 0 (0.0%) |
| $50,000 to $74,999 | 0 (0.0%) | 0 (0.0%) |
| $75,000 to $99,999 | 9 (52.9%) | 9 (100.0%) |
| $100,000 to $149,999 | 8 (47.1%) | 0 (0.0%) |
| $150,000 or more | 0 (0.0%) | 0 (0.0%) |
| Total | 17 (100.0%) | 9 (100.0%) |
Property Value to Household Income Ratio in Rembert
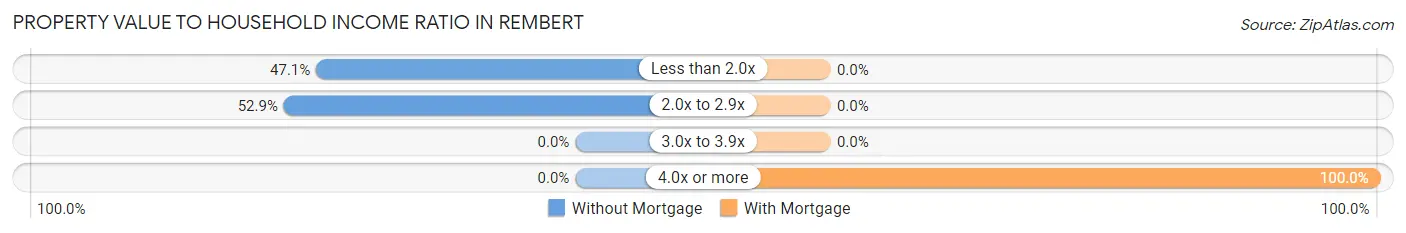
| Value-to-Income Ratio | Without Mortgage | With Mortgage |
| Less than 2.0x | 8 (47.1%) | 0 (0.0%) |
| 2.0x to 2.9x | 9 (52.9%) | 0 (0.0%) |
| 3.0x to 3.9x | 0 (0.0%) | 0 (0.0%) |
| 4.0x or more | 0 (0.0%) | 9 (100.0%) |
| Total | 17 (100.0%) | 9 (100.0%) |
Real Estate Taxes by Mortgage Status in Rembert
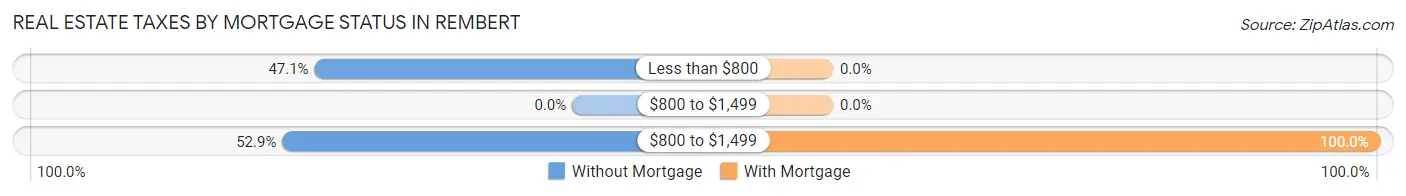
| Property Taxes | Without Mortgage | With Mortgage |
| Less than $800 | 8 (47.1%) | 0 (0.0%) |
| $800 to $1,499 | 0 (0.0%) | 0 (0.0%) |
| $800 to $1,499 | 9 (52.9%) | 9 (100.0%) |
| Total | 17 (100.0%) | 9 (100.0%) |
Health & Disability in Rembert
Health Insurance Coverage by Age in Rembert
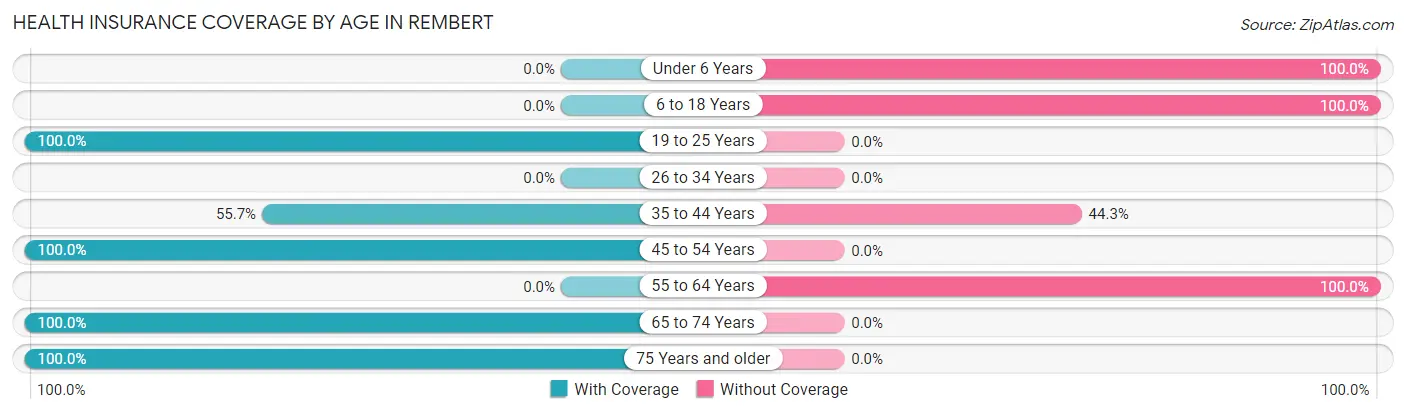
| Age Bracket | With Coverage | Without Coverage |
| Under 6 Years | 0 (0.0%) | 15 (100.0%) |
| 6 to 18 Years | 0 (0.0%) | 39 (100.0%) |
| 19 to 25 Years | 31 (100.0%) | 0 (0.0%) |
| 26 to 34 Years | 0 (0.0%) | 0 (0.0%) |
| 35 to 44 Years | 34 (55.7%) | 27 (44.3%) |
| 45 to 54 Years | 19 (100.0%) | 0 (0.0%) |
| 55 to 64 Years | 0 (0.0%) | 25 (100.0%) |
| 65 to 74 Years | 15 (100.0%) | 0 (0.0%) |
| 75 Years and older | 50 (100.0%) | 0 (0.0%) |
| Total | 149 (58.4%) | 106 (41.6%) |
Health Insurance Coverage by Citizenship Status in Rembert
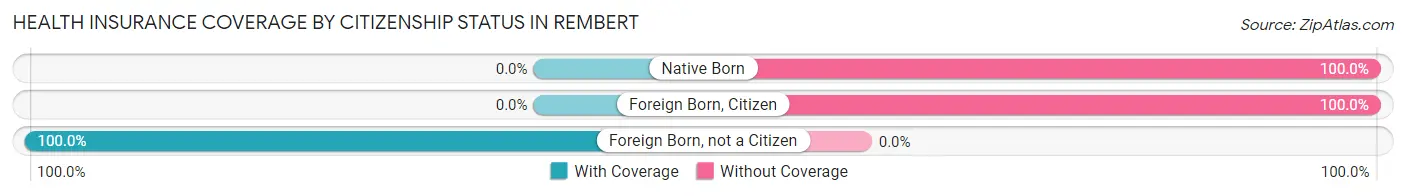
| Citizenship Status | With Coverage | Without Coverage |
| Native Born | 0 (0.0%) | 15 (100.0%) |
| Foreign Born, Citizen | 0 (0.0%) | 39 (100.0%) |
| Foreign Born, not a Citizen | 31 (100.0%) | 0 (0.0%) |
Health Insurance Coverage by Household Income in Rembert
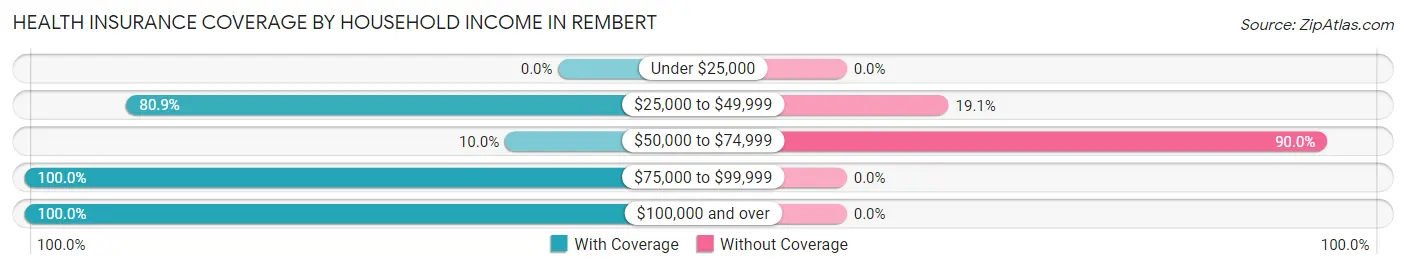
| Household Income | With Coverage | Without Coverage |
| Under $25,000 | 0 (0.0%) | 0 (0.0%) |
| $25,000 to $49,999 | 106 (80.9%) | 25 (19.1%) |
| $50,000 to $74,999 | 9 (10.0%) | 81 (90.0%) |
| $75,000 to $99,999 | 19 (100.0%) | 0 (0.0%) |
| $100,000 and over | 15 (100.0%) | 0 (0.0%) |
Public vs Private Health Insurance Coverage by Age in Rembert
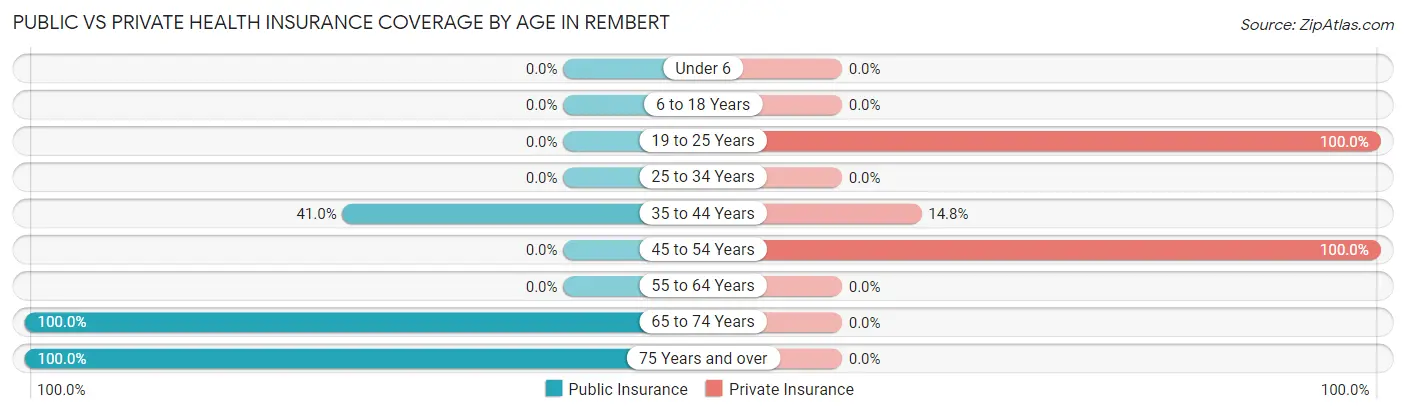
| Age Bracket | Public Insurance | Private Insurance |
| Under 6 | 0 (0.0%) | 0 (0.0%) |
| 6 to 18 Years | 0 (0.0%) | 0 (0.0%) |
| 19 to 25 Years | 0 (0.0%) | 31 (100.0%) |
| 25 to 34 Years | 0 (0.0%) | 0 (0.0%) |
| 35 to 44 Years | 25 (41.0%) | 9 (14.7%) |
| 45 to 54 Years | 0 (0.0%) | 19 (100.0%) |
| 55 to 64 Years | 0 (0.0%) | 0 (0.0%) |
| 65 to 74 Years | 15 (100.0%) | 0 (0.0%) |
| 75 Years and over | 50 (100.0%) | 0 (0.0%) |
| Total | 90 (35.3%) | 59 (23.1%) |
Disability Status by Sex by Age in Rembert
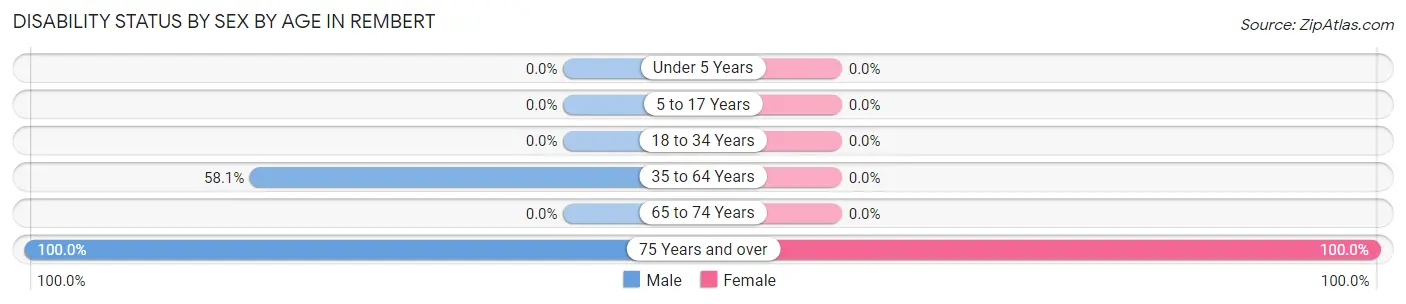
| Age Bracket | Male | Female |
| Under 5 Years | 0 (0.0%) | 0 (0.0%) |
| 5 to 17 Years | 0 (0.0%) | 0 (0.0%) |
| 18 to 34 Years | 0 (0.0%) | 0 (0.0%) |
| 35 to 64 Years | 25 (58.1%) | 0 (0.0%) |
| 65 to 74 Years | 0 (0.0%) | 0 (0.0%) |
| 75 Years and over | 24 (100.0%) | 26 (100.0%) |
Disability Class by Sex by Age in Rembert
Disability Class: Hearing Difficulty
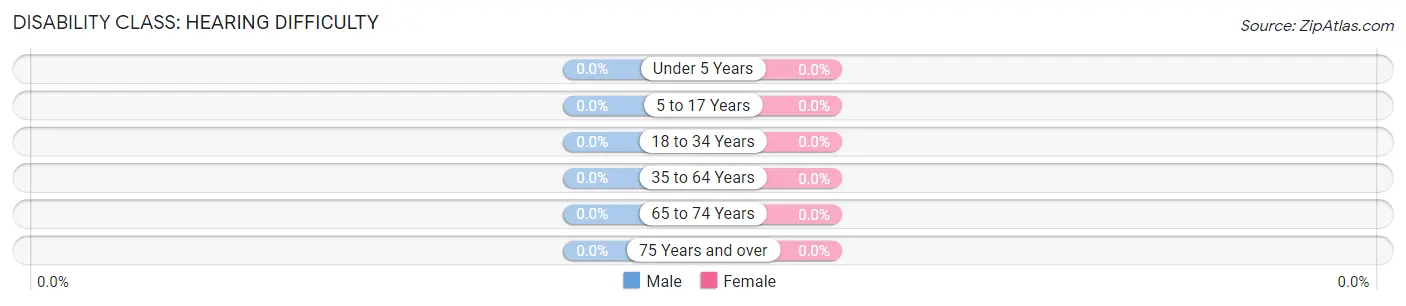
| Age Bracket | Male | Female |
| Under 5 Years | 0 (0.0%) | 0 (0.0%) |
| 5 to 17 Years | 0 (0.0%) | 0 (0.0%) |
| 18 to 34 Years | 0 (0.0%) | 0 (0.0%) |
| 35 to 64 Years | 0 (0.0%) | 0 (0.0%) |
| 65 to 74 Years | 0 (0.0%) | 0 (0.0%) |
| 75 Years and over | 0 (0.0%) | 0 (0.0%) |
Disability Class: Vision Difficulty
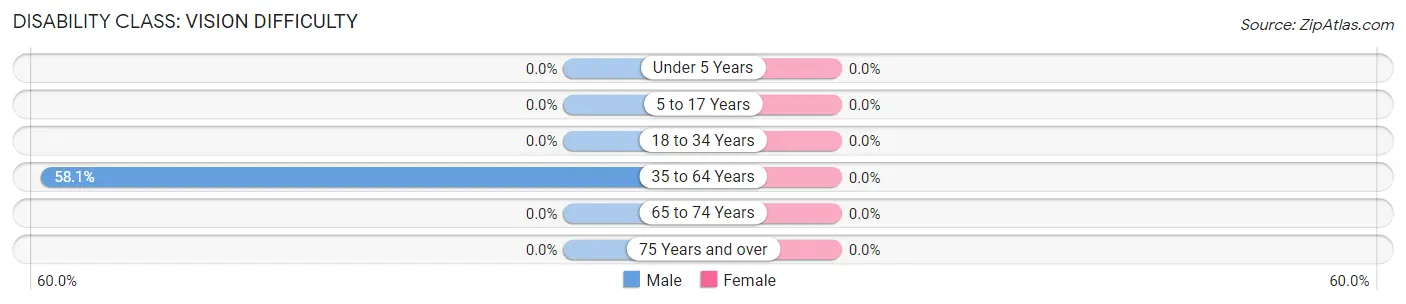
| Age Bracket | Male | Female |
| Under 5 Years | 0 (0.0%) | 0 (0.0%) |
| 5 to 17 Years | 0 (0.0%) | 0 (0.0%) |
| 18 to 34 Years | 0 (0.0%) | 0 (0.0%) |
| 35 to 64 Years | 25 (58.1%) | 0 (0.0%) |
| 65 to 74 Years | 0 (0.0%) | 0 (0.0%) |
| 75 Years and over | 0 (0.0%) | 0 (0.0%) |
Disability Class: Cognitive Difficulty
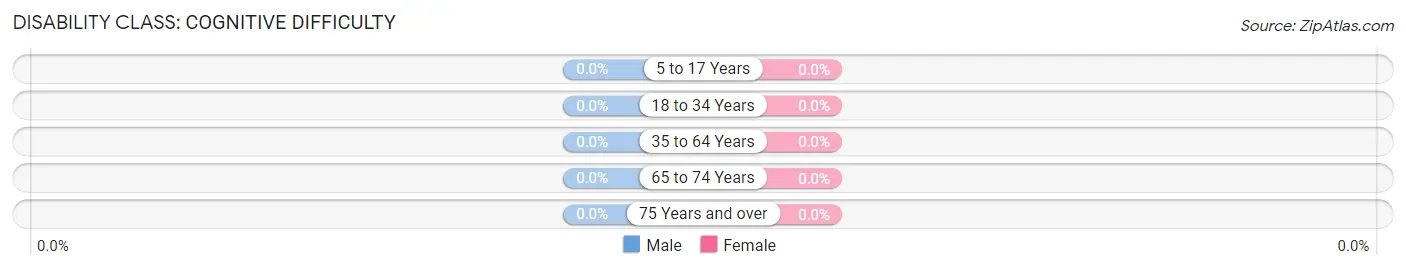
| Age Bracket | Male | Female |
| 5 to 17 Years | 0 (0.0%) | 0 (0.0%) |
| 18 to 34 Years | 0 (0.0%) | 0 (0.0%) |
| 35 to 64 Years | 0 (0.0%) | 0 (0.0%) |
| 65 to 74 Years | 0 (0.0%) | 0 (0.0%) |
| 75 Years and over | 0 (0.0%) | 0 (0.0%) |
Disability Class: Ambulatory Difficulty
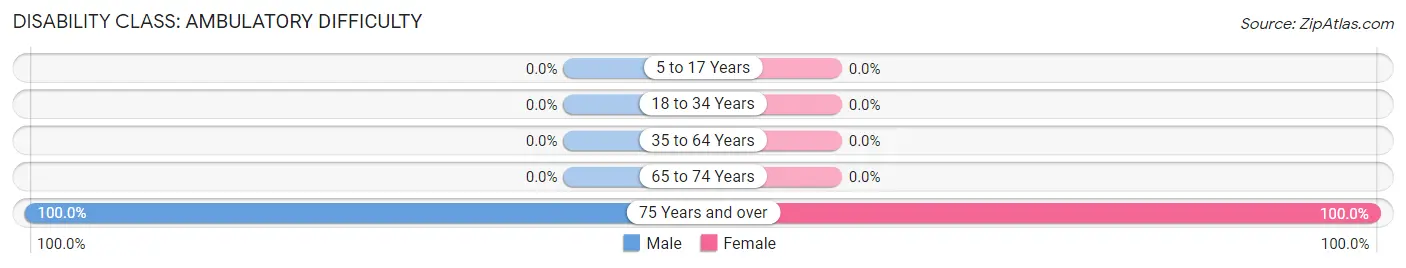
| Age Bracket | Male | Female |
| 5 to 17 Years | 0 (0.0%) | 0 (0.0%) |
| 18 to 34 Years | 0 (0.0%) | 0 (0.0%) |
| 35 to 64 Years | 0 (0.0%) | 0 (0.0%) |
| 65 to 74 Years | 0 (0.0%) | 0 (0.0%) |
| 75 Years and over | 24 (100.0%) | 26 (100.0%) |
Disability Class: Self-Care Difficulty
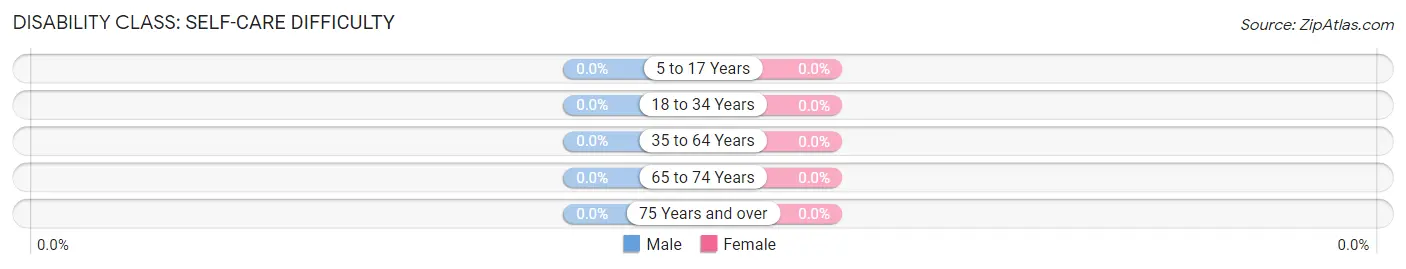
| Age Bracket | Male | Female |
| 5 to 17 Years | 0 (0.0%) | 0 (0.0%) |
| 18 to 34 Years | 0 (0.0%) | 0 (0.0%) |
| 35 to 64 Years | 0 (0.0%) | 0 (0.0%) |
| 65 to 74 Years | 0 (0.0%) | 0 (0.0%) |
| 75 Years and over | 0 (0.0%) | 0 (0.0%) |
Technology Access in Rembert
Computing Device Access in Rembert
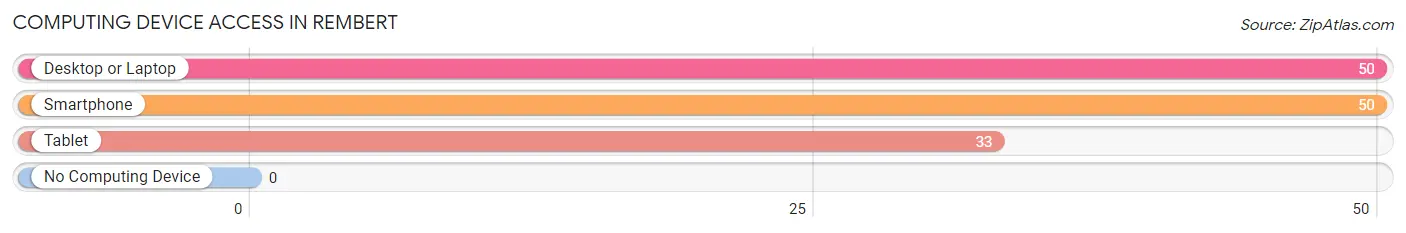
| Device Type | # Households | % Households |
| Desktop or Laptop | 50 | 100.0% |
| Smartphone | 50 | 100.0% |
| Tablet | 33 | 66.0% |
| No Computing Device | 0 | 0.0% |
| Total | 50 | 100.0% |
Internet Access in Rembert
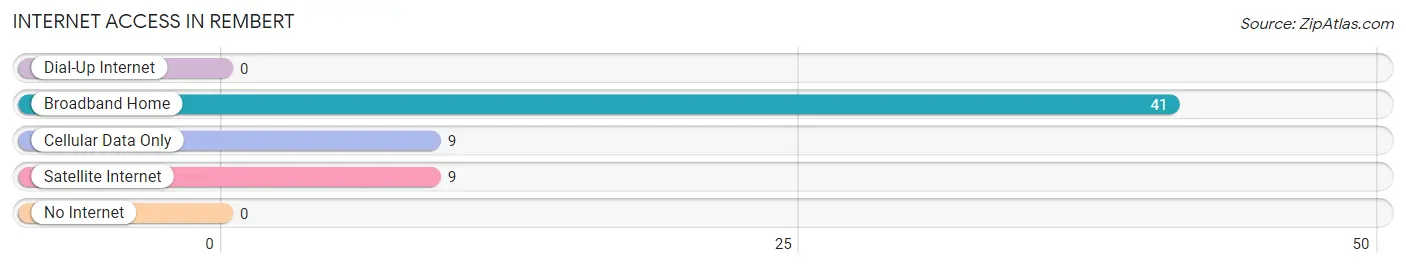
| Internet Type | # Households | % Households |
| Dial-Up Internet | 0 | 0.0% |
| Broadband Home | 41 | 82.0% |
| Cellular Data Only | 9 | 18.0% |
| Satellite Internet | 9 | 18.0% |
| No Internet | 0 | 0.0% |
| Total | 50 | 100.0% |
Rembert Summary
Rembert is an unincorporated community located in Sumter County, South Carolina. It is situated along the banks of the Wateree River, approximately 20 miles east of the state capital of Columbia. The population of Rembert was estimated to be around 1,000 in 2020.
Geography
Rembert is located in the Midlands region of South Carolina, in the Piedmont region of the state. It is situated along the banks of the Wateree River, approximately 20 miles east of the state capital of Columbia. The town is located in the Sumter County, and is bordered by the towns of Wedgefield, Pinewood, and Dalzell. The terrain of the area is mostly flat, with some rolling hills. The climate is humid subtropical, with hot, humid summers and mild winters.
Economy
Rembert’s economy is largely based on agriculture and forestry. The town is home to several farms, which produce a variety of crops, including cotton, soybeans, corn, and peanuts. The town is also home to several timber companies, which harvest timber from the surrounding forests. In addition, the town is home to several small businesses, including convenience stores, restaurants, and auto repair shops.
Demographics
Rembert is a predominantly African-American community, with a population of around 1,000 in 2020. The median household income in the town is $30,000, and the median age is 37. The town has a high rate of poverty, with nearly 40% of the population living below the poverty line.
History
Rembert was founded in the early 1800s by freed slaves who had been given land grants by the state of South Carolina. The town was named after a local plantation owner, William Rembert. The town grew slowly over the years, and by the early 1900s, it had become a thriving community. The town was home to several churches, schools, and businesses.
In the mid-1900s, the town began to decline, as many of its residents moved away in search of better economic opportunities. The town’s population decreased significantly, and by the late 1990s, it had become a small, rural community. In recent years, the town has seen a resurgence, as new businesses have opened and the population has grown.
Conclusion
Rembert is a small, rural community located in Sumter County, South Carolina. It is situated along the banks of the Wateree River, approximately 20 miles east of the state capital of Columbia. The town is predominantly African-American, with a population of around 1,000 in 2020. The economy of the town is largely based on agriculture and forestry, and the town is home to several small businesses. The town has a long history, dating back to the early 1800s, when it was founded by freed slaves. In recent years, the town has seen a resurgence, as new businesses have opened and the population has grown.
Common Questions
What is Per Capita Income in Rembert?
Per Capita income in Rembert is $16,552.
What is the Median Family Income in Rembert?
Median Family Income in Rembert is $57,778.
What is the Median Household income in Rembert?
Median Household Income in Rembert is $57,778.
What is Income or Wage Gap in Rembert?
Income or Wage Gap in Rembert is 32.6%.
Women in Rembert earn 67.4 cents for every dollar earned by a man.
What is Inequality or Gini Index in Rembert?
Inequality or Gini Index in Rembert is 0.19.
What is the Total Population of Rembert?
Total Population of Rembert is 255.
What is the Total Male Population of Rembert?
Total Male Population of Rembert is 88.
What is the Total Female Population of Rembert?
Total Female Population of Rembert is 167.
What is the Ratio of Males per 100 Females in Rembert?
There are 52.69 Males per 100 Females in Rembert.
What is the Ratio of Females per 100 Males in Rembert?
There are 189.77 Females per 100 Males in Rembert.
What is the Median Population Age in Rembert?
Median Population Age in Rembert is 41.3 Years.
What is the Average Family Size in Rembert
Average Family Size in Rembert is 5.1 People.
What is the Average Household Size in Rembert
Average Household Size in Rembert is 5.1 People.
How Large is the Labor Force in Rembert?
There are 101 People in the Labor Forcein in Rembert.
What is the Percentage of People in the Labor Force in Rembert?
50.2% of People are in the Labor Force in Rembert.