Dillard, OR Map & Demographics
Dillard Map
Dillard Overview
$19,492
PER CAPITA INCOME
$46,944
AVG HOUSEHOLD INCOME
0.23
INEQUALITY / GINI INDEX
316
TOTAL POPULATION
206
MALE POPULATION
110
FEMALE POPULATION
187.27
MALES / 100 FEMALES
53.40
FEMALES / 100 MALES
50.2
MEDIAN AGE
2.9
AVG FAMILY SIZE
2.2
AVG HOUSEHOLD SIZE
129
LABOR FORCE [ PEOPLE ]
55.4%
PERCENT IN LABOR FORCE
21.7%
UNEMPLOYMENT RATE
Dillard Zip Codes
Dillard Area Codes
Income in Dillard
Income Overview in Dillard
| Characteristic | Number | Measure |
| Per Capita Income | 316 | $19,492 |
| Median Family Income | 93 | $0 |
| Mean Family Income | 93 | $0 |
| Median Household Income | 144 | $46,944 |
| Mean Household Income | 144 | $44,649 |
| Income Deficit | 93 | $0 |
| Wage / Income Gap (%) | 316 | 0.00% |
| Wage / Income Gap ($) | 316 | 100.00¢ per $1 |
| Gini / Inequality Index | 316 | 0.23 |
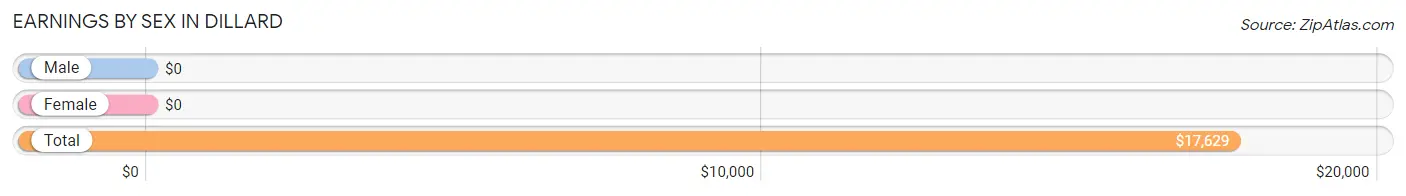
Earnings by Sex in Dillard
| Sex | Number | Average Earnings |
| Male | 61 (47.3%) | $0 |
| Female | 68 (52.7%) | $0 |
| Total | 129 (100.0%) | $17,629 |
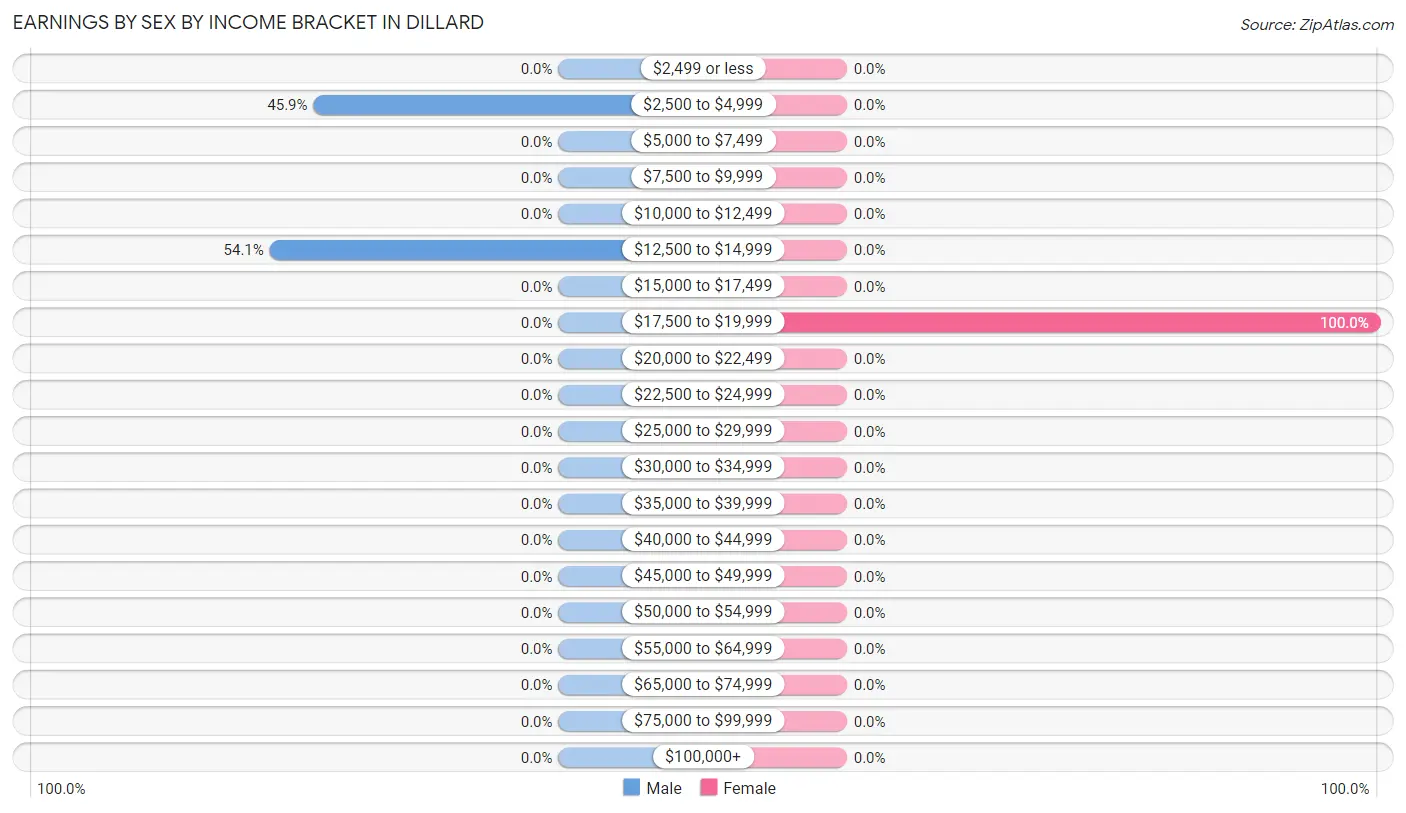
Earnings by Sex by Income Bracket in Dillard
The most common earnings brackets in Dillard are $12,500 to $14,999 for men (33 | 54.1%) and $17,500 to $19,999 for women (68 | 100.0%).
| Income | Male | Female |
| $2,499 or less | 0 (0.0%) | 0 (0.0%) |
| $2,500 to $4,999 | 28 (45.9%) | 0 (0.0%) |
| $5,000 to $7,499 | 0 (0.0%) | 0 (0.0%) |
| $7,500 to $9,999 | 0 (0.0%) | 0 (0.0%) |
| $10,000 to $12,499 | 0 (0.0%) | 0 (0.0%) |
| $12,500 to $14,999 | 33 (54.1%) | 0 (0.0%) |
| $15,000 to $17,499 | 0 (0.0%) | 0 (0.0%) |
| $17,500 to $19,999 | 0 (0.0%) | 68 (100.0%) |
| $20,000 to $22,499 | 0 (0.0%) | 0 (0.0%) |
| $22,500 to $24,999 | 0 (0.0%) | 0 (0.0%) |
| $25,000 to $29,999 | 0 (0.0%) | 0 (0.0%) |
| $30,000 to $34,999 | 0 (0.0%) | 0 (0.0%) |
| $35,000 to $39,999 | 0 (0.0%) | 0 (0.0%) |
| $40,000 to $44,999 | 0 (0.0%) | 0 (0.0%) |
| $45,000 to $49,999 | 0 (0.0%) | 0 (0.0%) |
| $50,000 to $54,999 | 0 (0.0%) | 0 (0.0%) |
| $55,000 to $64,999 | 0 (0.0%) | 0 (0.0%) |
| $65,000 to $74,999 | 0 (0.0%) | 0 (0.0%) |
| $75,000 to $99,999 | 0 (0.0%) | 0 (0.0%) |
| $100,000+ | 0 (0.0%) | 0 (0.0%) |
| Total | 61 (100.0%) | 68 (100.0%) |
Earnings by Sex by Educational Attainment in Dillard
| Educational Attainment | Male Income | Female Income |
| Less than High School | - | - |
| High School Diploma | - | - |
| College or Associate's Degree | - | - |
| Bachelor's Degree | - | - |
| Graduate Degree | - | - |
| Total | - | - |
Family Income in Dillard
Family Income Brackets in Dillard
According to the Dillard family income data, there are 68 families falling into the $50,000 to $74,999 income range, which is the most common income bracket and makes up 73.1% of all families.
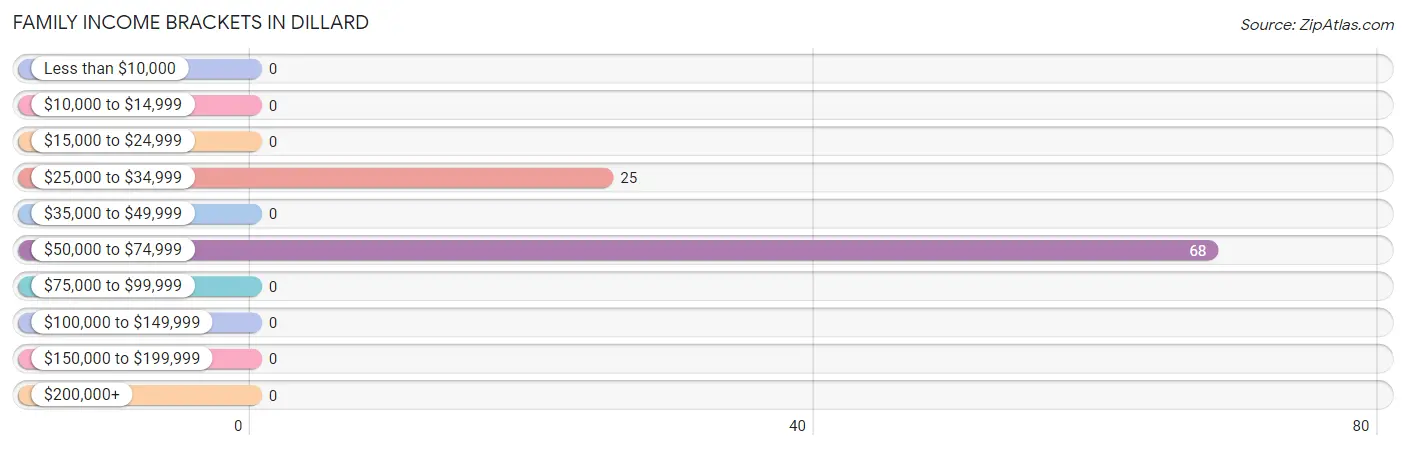
| Income Bracket | # Families | % Families |
| Less than $10,000 | 0 | 0.0% |
| $10,000 to $14,999 | 0 | 0.0% |
| $15,000 to $24,999 | 0 | 0.0% |
| $25,000 to $34,999 | 25 | 26.9% |
| $35,000 to $49,999 | 0 | 0.0% |
| $50,000 to $74,999 | 68 | 73.1% |
| $75,000 to $99,999 | 0 | 0.0% |
| $100,000 to $149,999 | 0 | 0.0% |
| $150,000 to $199,999 | 0 | 0.0% |
| $200,000+ | 0 | 0.0% |
Family Income by Famaliy Size in Dillard
| Income Bracket | # Families | Median Income |
| 2-Person Families | 68 (73.1%) | $0 |
| 3-Person Families | 0 (0.0%) | $0 |
| 4-Person Families | 0 (0.0%) | $0 |
| 5-Person Families | 25 (26.9%) | $0 |
| 6-Person Families | 0 (0.0%) | $0 |
| 7+ Person Families | 0 (0.0%) | $0 |
| Total | 93 (100.0%) | $0 |
Family Income by Number of Earners in Dillard
| Number of Earners | # Families | Median Income |
| No Earners | 0 (0.0%) | $0 |
| 1 Earner | 93 (100.0%) | $0 |
| 2 Earners | 0 (0.0%) | $0 |
| 3+ Earners | 0 (0.0%) | $0 |
| Total | 93 (100.0%) | $0 |
Household Income in Dillard
Household Income Brackets in Dillard
With 68 households falling in the category, the $50,000 to $74,999 income range is the most frequent in Dillard, accounting for 47.2% of all households.
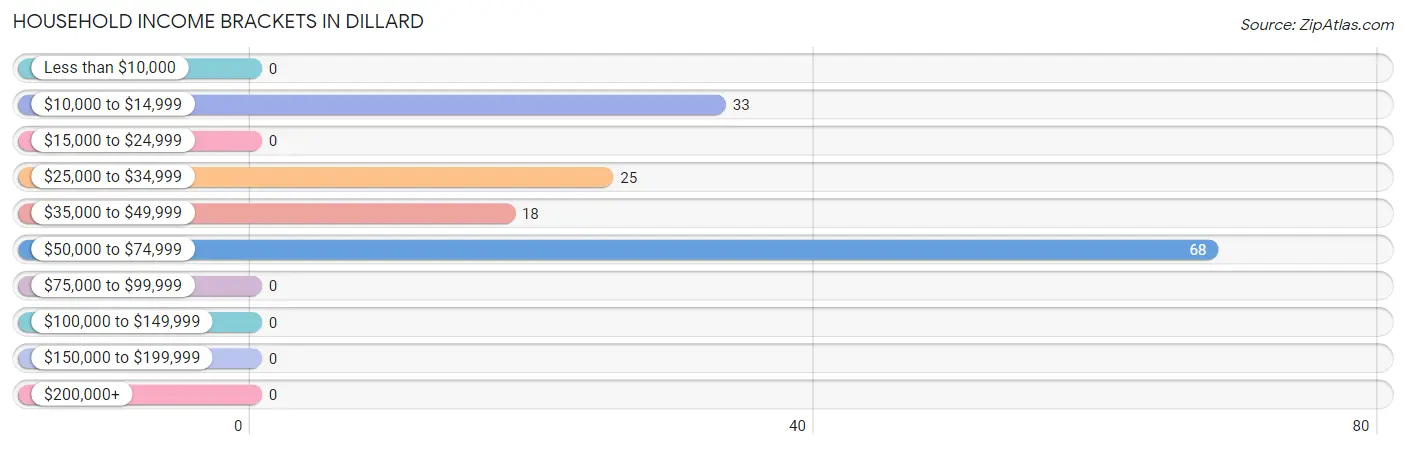
| Income Bracket | # Households | % Households |
| Less than $10,000 | 0 | 0.0% |
| $10,000 to $14,999 | 33 | 22.9% |
| $15,000 to $24,999 | 0 | 0.0% |
| $25,000 to $34,999 | 25 | 17.4% |
| $35,000 to $49,999 | 18 | 12.5% |
| $50,000 to $74,999 | 68 | 47.2% |
| $75,000 to $99,999 | 0 | 0.0% |
| $100,000 to $149,999 | 0 | 0.0% |
| $150,000 to $199,999 | 0 | 0.0% |
| $200,000+ | 0 | 0.0% |
Household Income by Householder Age in Dillard
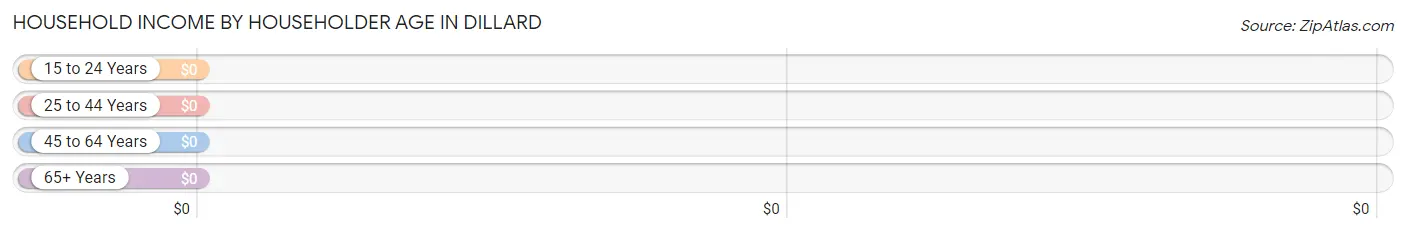
| Income Bracket | # Households | Median Income |
| 15 to 24 Years | 0 (0.0%) | $0 |
| 25 to 44 Years | 33 (22.9%) | $0 |
| 45 to 64 Years | 68 (47.2%) | $0 |
| 65+ Years | 43 (29.9%) | $0 |
| Total | 144 (100.0%) | $46,944 |
Poverty in Dillard
Income Below Poverty by Sex and Age in Dillard
With 70.4% poverty level for males and 21.8% for females among the residents of Dillard, 6 to 11 year old males and 5 year old females are the most vulnerable to poverty, with 59 males (100.0%) and 24 females (100.0%) in their respective age groups living below the poverty level.
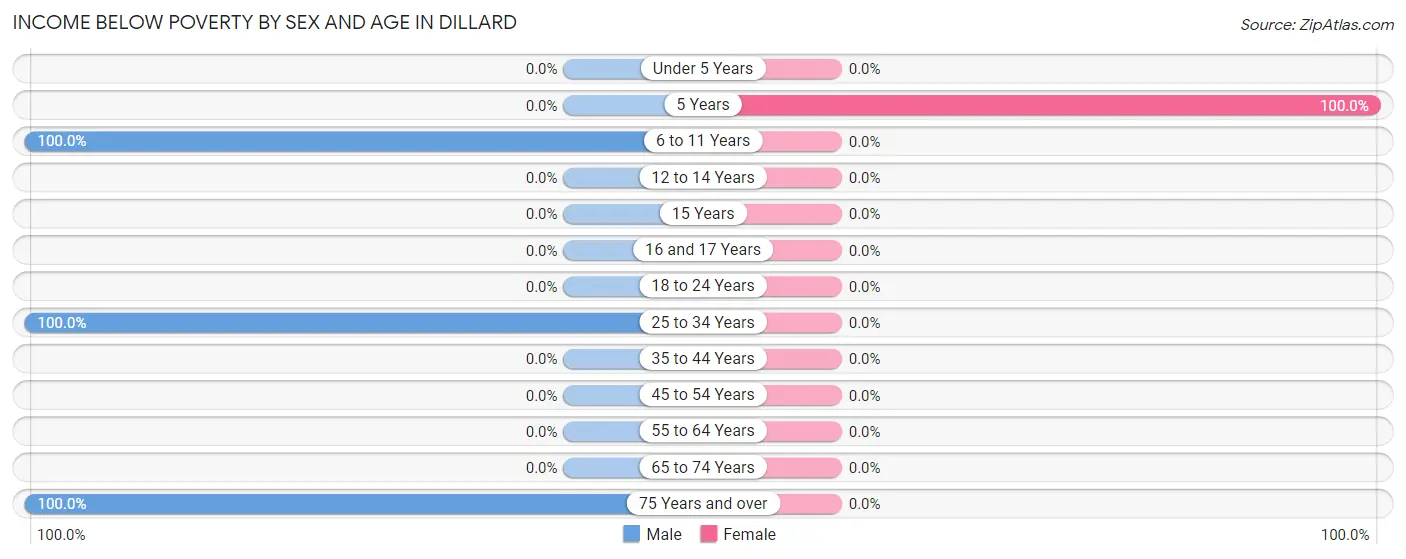
| Age Bracket | Male | Female |
| Under 5 Years | 0 (0.0%) | 0 (0.0%) |
| 5 Years | 0 (0.0%) | 24 (100.0%) |
| 6 to 11 Years | 59 (100.0%) | 0 (0.0%) |
| 12 to 14 Years | 0 (0.0%) | 0 (0.0%) |
| 15 Years | 0 (0.0%) | 0 (0.0%) |
| 16 and 17 Years | 0 (0.0%) | 0 (0.0%) |
| 18 to 24 Years | 0 (0.0%) | 0 (0.0%) |
| 25 to 34 Years | 61 (100.0%) | 0 (0.0%) |
| 35 to 44 Years | 0 (0.0%) | 0 (0.0%) |
| 45 to 54 Years | 0 (0.0%) | 0 (0.0%) |
| 55 to 64 Years | 0 (0.0%) | 0 (0.0%) |
| 65 to 74 Years | 0 (0.0%) | 0 (0.0%) |
| 75 Years and over | 25 (100.0%) | 0 (0.0%) |
| Total | 145 (70.4%) | 24 (21.8%) |
Income Above Poverty by Sex and Age in Dillard
According to the poverty statistics in Dillard, males aged 65 to 74 years and females aged 45 to 54 years are the age groups that are most secure financially, with 100.0% of males and 100.0% of females in these age groups living above the poverty line.
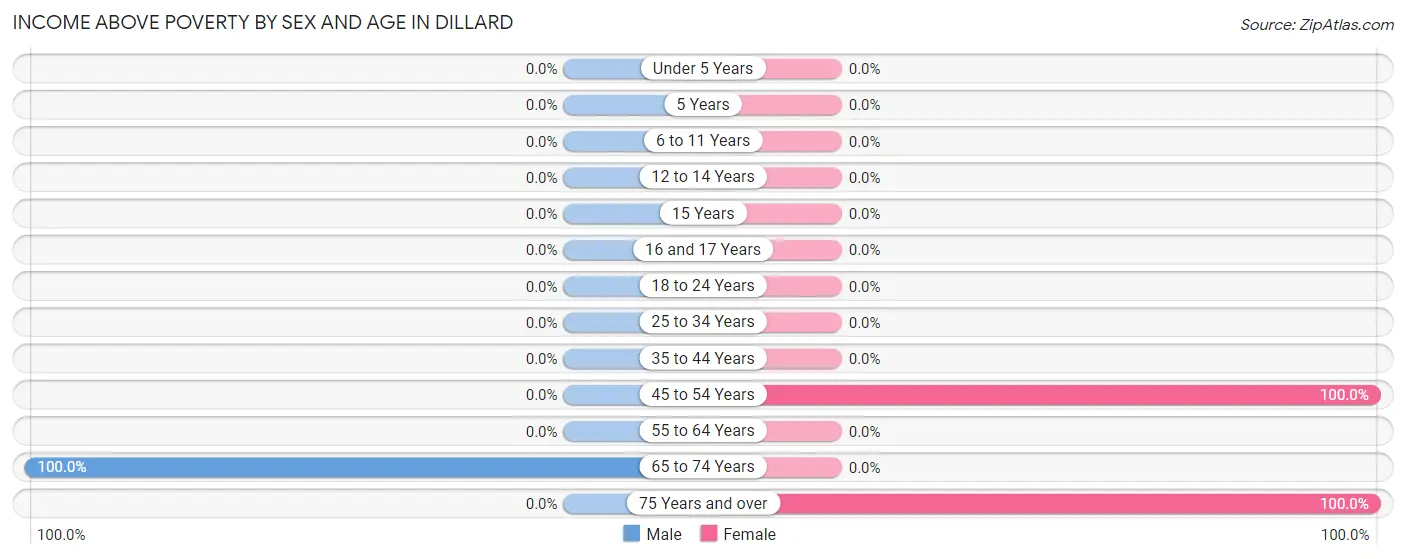
| Age Bracket | Male | Female |
| Under 5 Years | 0 (0.0%) | 0 (0.0%) |
| 5 Years | 0 (0.0%) | 0 (0.0%) |
| 6 to 11 Years | 0 (0.0%) | 0 (0.0%) |
| 12 to 14 Years | 0 (0.0%) | 0 (0.0%) |
| 15 Years | 0 (0.0%) | 0 (0.0%) |
| 16 and 17 Years | 0 (0.0%) | 0 (0.0%) |
| 18 to 24 Years | 0 (0.0%) | 0 (0.0%) |
| 25 to 34 Years | 0 (0.0%) | 0 (0.0%) |
| 35 to 44 Years | 0 (0.0%) | 0 (0.0%) |
| 45 to 54 Years | 0 (0.0%) | 68 (100.0%) |
| 55 to 64 Years | 0 (0.0%) | 0 (0.0%) |
| 65 to 74 Years | 61 (100.0%) | 0 (0.0%) |
| 75 Years and over | 0 (0.0%) | 18 (100.0%) |
| Total | 61 (29.6%) | 86 (78.2%) |
Income Below Poverty Among Married-Couple Families in Dillard
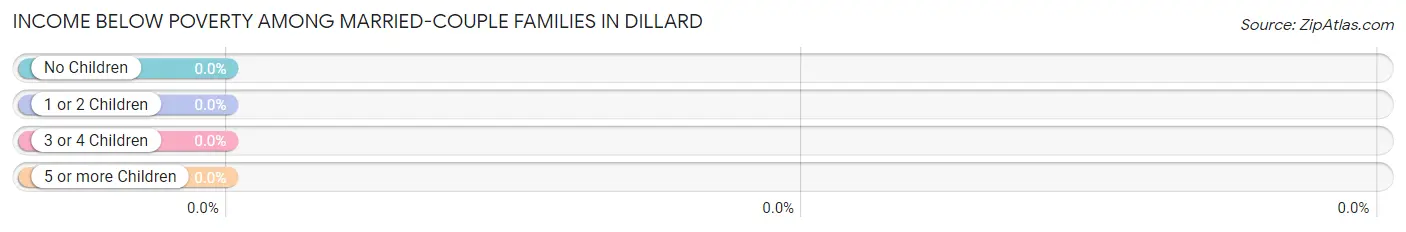
| Children | Above Poverty | Below Poverty |
| No Children | 68 (100.0%) | 0 (0.0%) |
| 1 or 2 Children | 0 (0.0%) | 0 (0.0%) |
| 3 or 4 Children | 0 (0.0%) | 0 (0.0%) |
| 5 or more Children | 0 (0.0%) | 0 (0.0%) |
| Total | 68 (100.0%) | 0 (0.0%) |
Income Below Poverty Among Single-Parent Households in Dillard
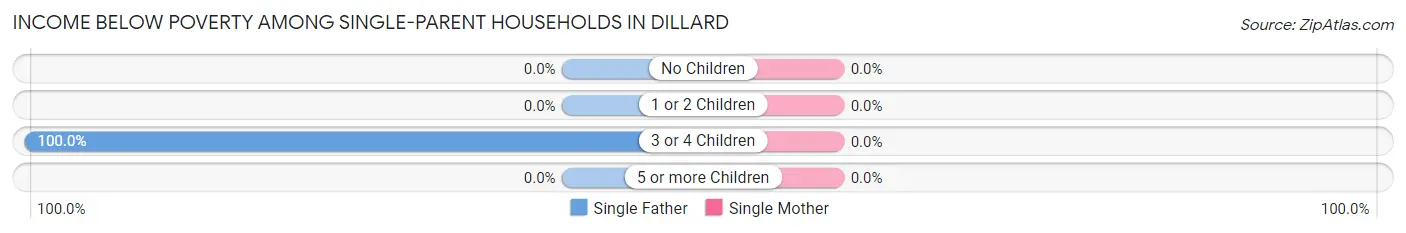
| Children | Single Father | Single Mother |
| No Children | 0 (0.0%) | 0 (0.0%) |
| 1 or 2 Children | 0 (0.0%) | 0 (0.0%) |
| 3 or 4 Children | 25 (100.0%) | 0 (0.0%) |
| 5 or more Children | 0 (0.0%) | 0 (0.0%) |
| Total | 25 (100.0%) | 0 (0.0%) |
Income Below Poverty Among Married-Couple vs Single-Parent Households in Dillard
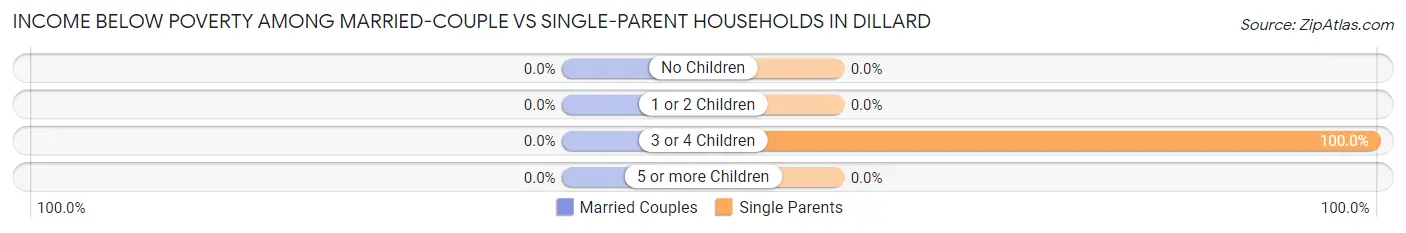
| Children | Married-Couple Families | Single-Parent Households |
| No Children | 0 (0.0%) | 0 (0.0%) |
| 1 or 2 Children | 0 (0.0%) | 0 (0.0%) |
| 3 or 4 Children | 0 (0.0%) | 25 (100.0%) |
| 5 or more Children | 0 (0.0%) | 0 (0.0%) |
| Total | 0 (0.0%) | 25 (100.0%) |
Race in Dillard
The most populous races in Dillard are White / Caucasian (283 | 89.6%), Hispanic or Latino (33 | 10.4%), and Native / Alaskan (33 | 10.4%).
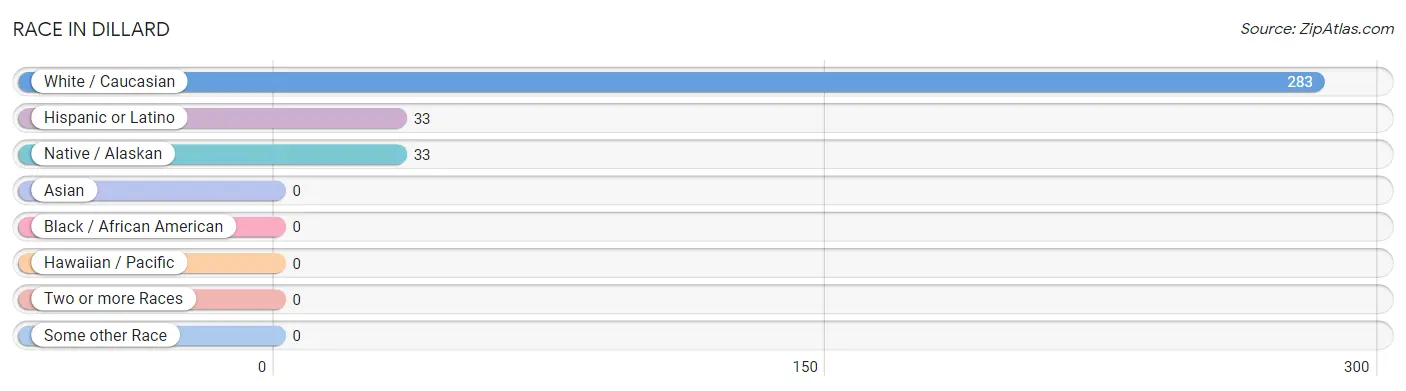
| Race | # Population | % Population |
| Asian | 0 | 0.0% |
| Black / African American | 0 | 0.0% |
| Hawaiian / Pacific | 0 | 0.0% |
| Hispanic or Latino | 33 | 10.4% |
| Native / Alaskan | 33 | 10.4% |
| White / Caucasian | 283 | 89.6% |
| Two or more Races | 0 | 0.0% |
| Some other Race | 0 | 0.0% |
| Total | 316 | 100.0% |
Ancestry in Dillard
The most populous ancestries reported in Dillard are German (176 | 55.7%), English (136 | 43.0%), Irish (68 | 21.5%), Mexican (33 | 10.4%), and Scottish (28 | 8.9%), together accounting for 139.6% of all Dillard residents.
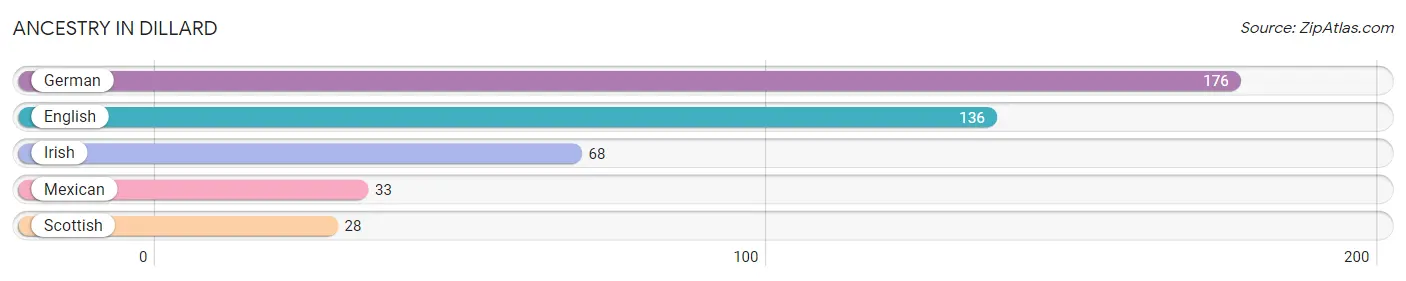
| Ancestry | # Population | % Population |
| English | 136 | 43.0% |
| German | 176 | 55.7% |
| Irish | 68 | 21.5% |
| Mexican | 33 | 10.4% |
| Scottish | 28 | 8.9% | View All 5 Rows |
Immigrants in Dillard

| Immigration Origin | # Population | % Population | View All 0 Rows |
Sex and Age in Dillard
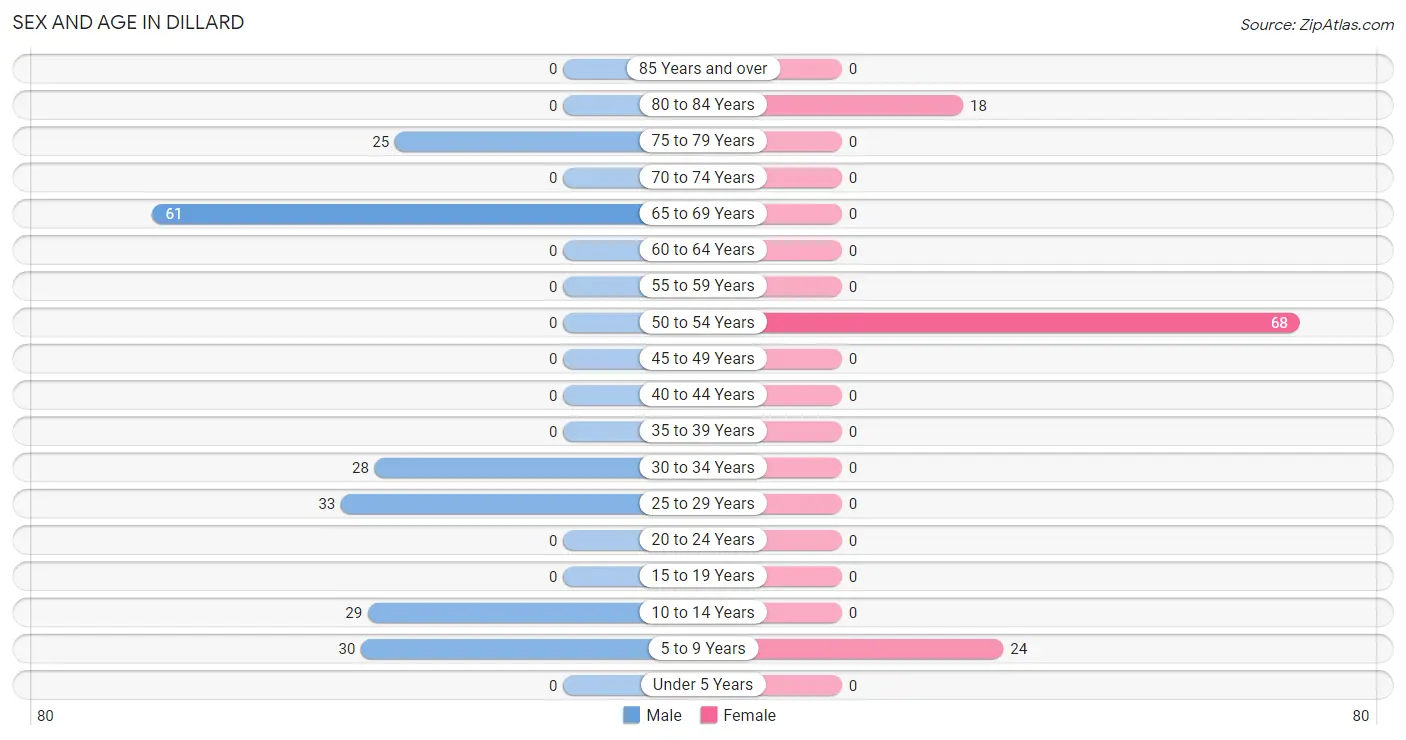
Sex and Age in Dillard
The most populous age groups in Dillard are 65 to 69 Years (61 | 29.6%) for men and 50 to 54 Years (68 | 61.8%) for women.
| Age Bracket | Male | Female |
| Under 5 Years | 0 (0.0%) | 0 (0.0%) |
| 5 to 9 Years | 30 (14.6%) | 24 (21.8%) |
| 10 to 14 Years | 29 (14.1%) | 0 (0.0%) |
| 15 to 19 Years | 0 (0.0%) | 0 (0.0%) |
| 20 to 24 Years | 0 (0.0%) | 0 (0.0%) |
| 25 to 29 Years | 33 (16.0%) | 0 (0.0%) |
| 30 to 34 Years | 28 (13.6%) | 0 (0.0%) |
| 35 to 39 Years | 0 (0.0%) | 0 (0.0%) |
| 40 to 44 Years | 0 (0.0%) | 0 (0.0%) |
| 45 to 49 Years | 0 (0.0%) | 0 (0.0%) |
| 50 to 54 Years | 0 (0.0%) | 68 (61.8%) |
| 55 to 59 Years | 0 (0.0%) | 0 (0.0%) |
| 60 to 64 Years | 0 (0.0%) | 0 (0.0%) |
| 65 to 69 Years | 61 (29.6%) | 0 (0.0%) |
| 70 to 74 Years | 0 (0.0%) | 0 (0.0%) |
| 75 to 79 Years | 25 (12.1%) | 0 (0.0%) |
| 80 to 84 Years | 0 (0.0%) | 18 (16.4%) |
| 85 Years and over | 0 (0.0%) | 0 (0.0%) |
| Total | 206 (100.0%) | 110 (100.0%) |
Families and Households in Dillard
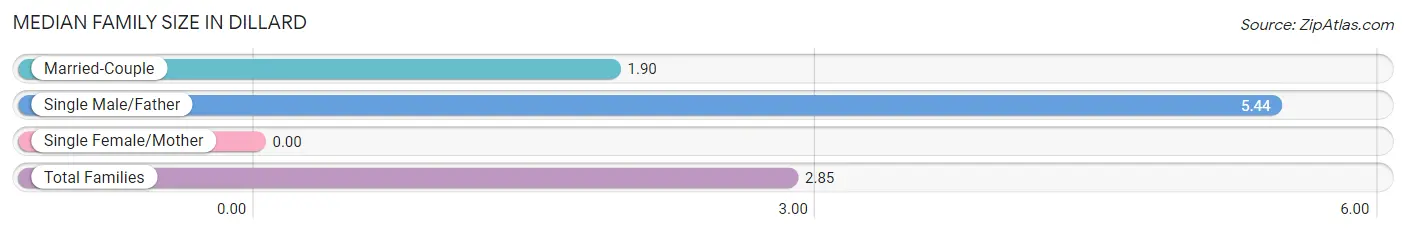
Median Family Size in Dillard
| Family Type | # Families | Family Size |
| Married-Couple | 68 (73.1%) | 1.90 |
| Single Male/Father | 25 (26.9%) | 5.44 |
| Single Female/Mother | 0 (0.0%) | - |
| Total Families | 93 (100.0%) | 2.85 |
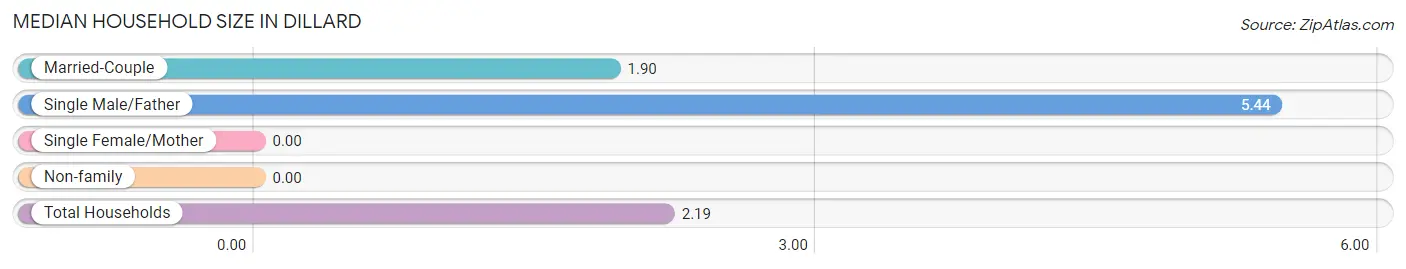
Median Household Size in Dillard
| Household Type | # Households | Household Size |
| Married-Couple | 68 (47.2%) | 1.90 |
| Single Male/Father | 25 (17.4%) | 5.44 |
| Single Female/Mother | 0 (0.0%) | - |
| Non-family | 51 (35.4%) | - |
| Total Households | 144 (100.0%) | 2.19 |
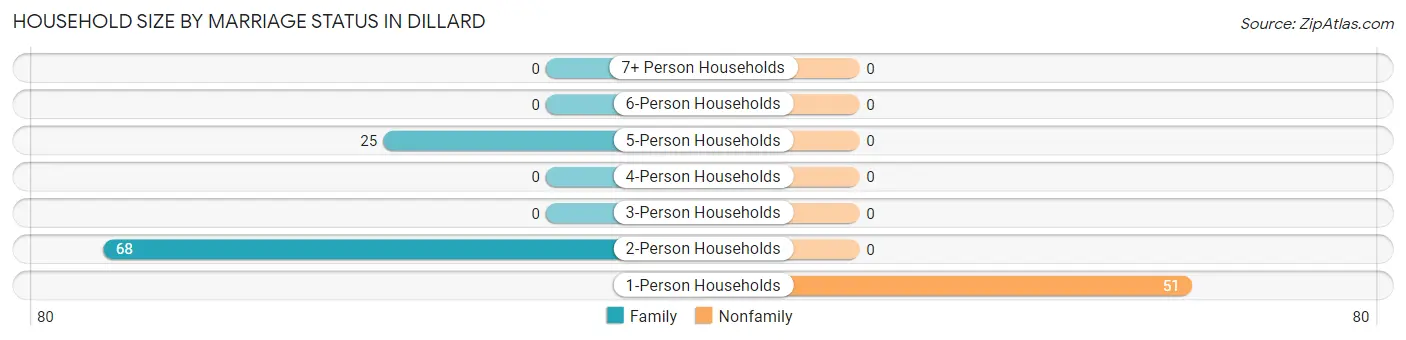
Household Size by Marriage Status in Dillard
Out of a total of 144 households in Dillard, 93 (64.6%) are family households, while 51 (35.4%) are nonfamily households. The most numerous type of family households are 2-person households, comprising 68, and the most common type of nonfamily households are 1-person households, comprising 51.
| Household Size | Family Households | Nonfamily Households |
| 1-Person Households | - | 51 (35.4%) |
| 2-Person Households | 68 (47.2%) | 0 (0.0%) |
| 3-Person Households | 0 (0.0%) | 0 (0.0%) |
| 4-Person Households | 0 (0.0%) | 0 (0.0%) |
| 5-Person Households | 25 (17.4%) | 0 (0.0%) |
| 6-Person Households | 0 (0.0%) | 0 (0.0%) |
| 7+ Person Households | 0 (0.0%) | 0 (0.0%) |
| Total | 93 (64.6%) | 51 (35.4%) |
Female Fertility in Dillard
Fertility by Age in Dillard
| Age Bracket | Women with Births | Births / 1,000 Women |
| 15 to 19 years | 0 (0.0%) | 0.0 |
| 20 to 34 years | 0 (0.0%) | 0.0 |
| 35 to 50 years | 0 (0.0%) | 0.0 |
| Total | 0 (0.0%) | 0.0 |
Fertility by Age by Marriage Status in Dillard
| Age Bracket | Married | Unmarried |
| 15 to 19 years | 0 (0.0%) | 0 (0.0%) |
| 20 to 34 years | 0 (0.0%) | 0 (0.0%) |
| 35 to 50 years | 0 (0.0%) | 0 (0.0%) |
| Total | 0 (0.0%) | 0 (0.0%) |
Fertility by Education in Dillard
| Educational Attainment | Women with Births | Births / 1,000 Women |
| Less than High School | 0 (0.0%) | 0.0 |
| High School Diploma | 0 (0.0%) | 0.0 |
| College or Associate's Degree | 0 (0.0%) | 0.0 |
| Bachelor's Degree | 0 (0.0%) | 0.0 |
| Graduate Degree | 0 (0.0%) | 0.0 |
| Total | 0 (0.0%) | 0.0 |
Fertility by Education by Marriage Status in Dillard
| Educational Attainment | Married | Unmarried |
| Less than High School | 0 (0.0%) | 0 (0.0%) |
| High School Diploma | 0 (0.0%) | 0 (0.0%) |
| College or Associate's Degree | 0 (0.0%) | 0 (0.0%) |
| Bachelor's Degree | 0 (0.0%) | 0 (0.0%) |
| Graduate Degree | 0 (0.0%) | 0 (0.0%) |
| Total | 0 (0.0%) | 0 (0.0%) |
Employment Characteristics in Dillard
Employment by Class of Employer in Dillard
Among the 101 employed individuals in Dillard, , and private company employees (101 | 100.0%) make up the most common classes of employment.
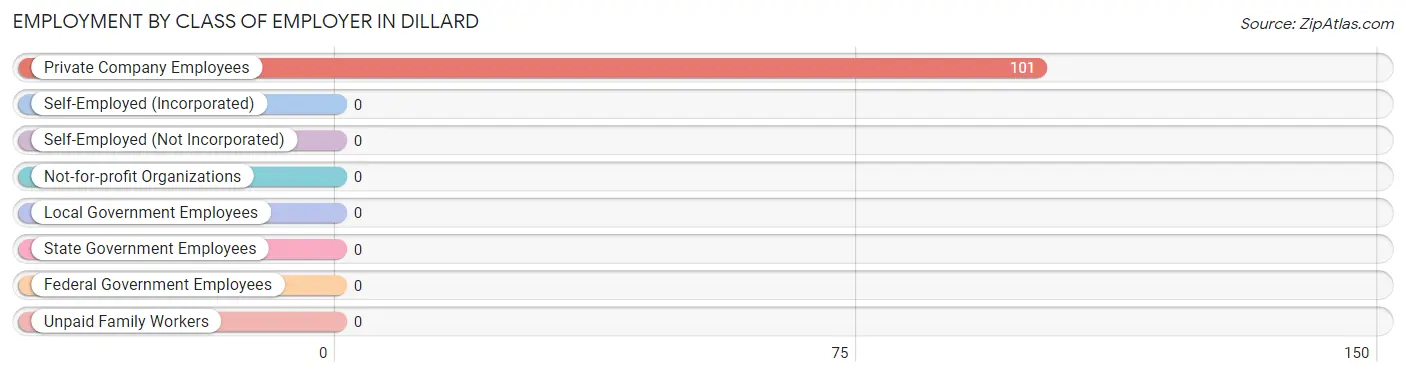
| Employer Class | # Employees | % Employees |
| Private Company Employees | 101 | 100.0% |
| Self-Employed (Incorporated) | 0 | 0.0% |
| Self-Employed (Not Incorporated) | 0 | 0.0% |
| Not-for-profit Organizations | 0 | 0.0% |
| Local Government Employees | 0 | 0.0% |
| State Government Employees | 0 | 0.0% |
| Federal Government Employees | 0 | 0.0% |
| Unpaid Family Workers | 0 | 0.0% |
| Total | 101 | 100.0% |
Employment Status by Age in Dillard
According to the labor force statistics for Dillard, out of the total population over 16 years of age (233), 55.4% or 129 individuals are in the labor force, with 21.7% or 28 of them unemployed. The age group with the highest labor force participation rate is 25 to 29 years, with 100.0% or 33 individuals in the labor force. Within the labor force, the 30 to 34 years age range has the highest percentage of unemployed individuals, with 100.0% or 28 of them being unemployed.
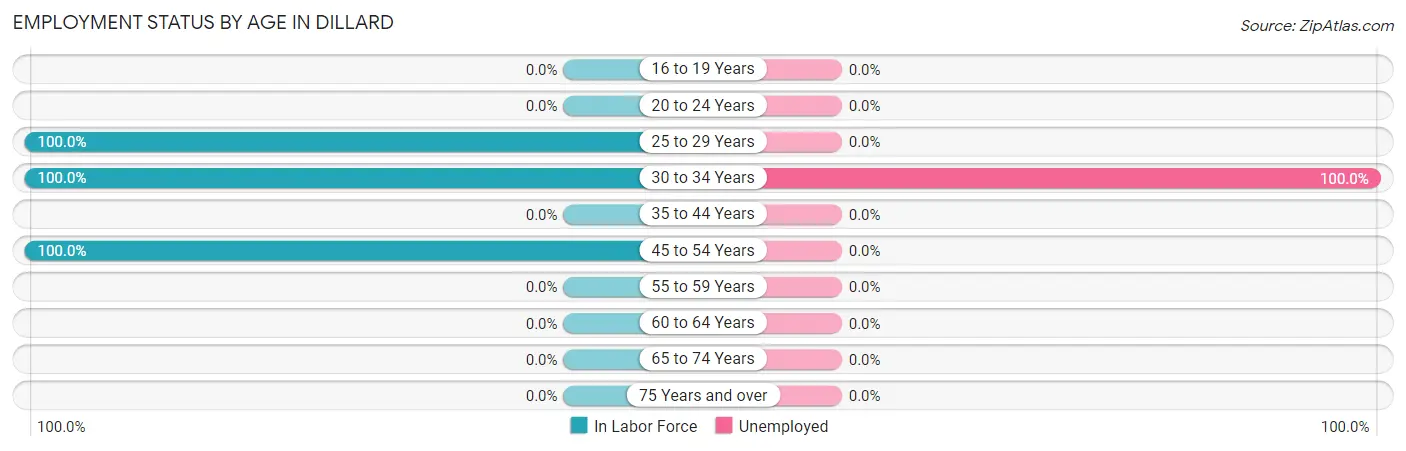
| Age Bracket | In Labor Force | Unemployed |
| 16 to 19 Years | 0 (0.0%) | 0 (0.0%) |
| 20 to 24 Years | 0 (0.0%) | 0 (0.0%) |
| 25 to 29 Years | 33 (100.0%) | 0 (0.0%) |
| 30 to 34 Years | 28 (100.0%) | 28 (100.0%) |
| 35 to 44 Years | 0 (0.0%) | 0 (0.0%) |
| 45 to 54 Years | 68 (100.0%) | 0 (0.0%) |
| 55 to 59 Years | 0 (0.0%) | 0 (0.0%) |
| 60 to 64 Years | 0 (0.0%) | 0 (0.0%) |
| 65 to 74 Years | 0 (0.0%) | 0 (0.0%) |
| 75 Years and over | 0 (0.0%) | 0 (0.0%) |
| Total | 129 (55.4%) | 28 (21.7%) |
Employment Status by Educational Attainment in Dillard
According to labor force statistics for Dillard, 100.0% of individuals (129) out of the total population between 25 and 64 years of age (129) are in the labor force, with 21.7% or 28 of them being unemployed. The group with the highest labor force participation rate are those with the educational attainment of high school diploma, with 100.0% or 68 individuals in the labor force. Within the labor force, individuals with college / associate degree education have the highest percentage of unemployment, with 45.9% or 28 of them being unemployed.
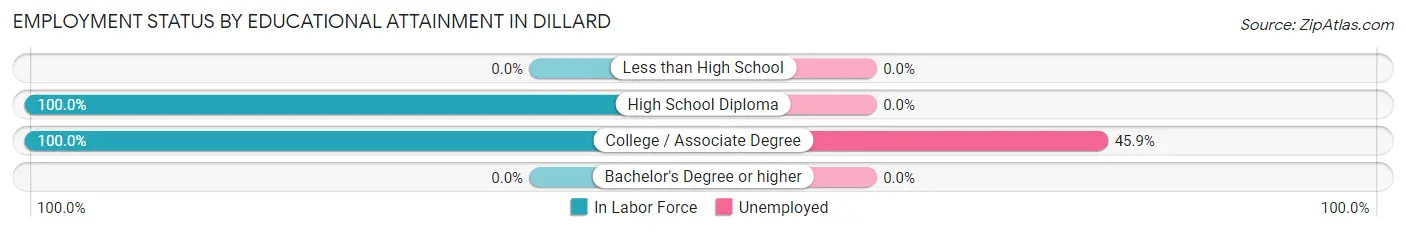
| Educational Attainment | In Labor Force | Unemployed |
| Less than High School | 0 (0.0%) | 0 (0.0%) |
| High School Diploma | 68 (100.0%) | 0 (0.0%) |
| College / Associate Degree | 61 (100.0%) | 28 (45.9%) |
| Bachelor's Degree or higher | 0 (0.0%) | 0 (0.0%) |
| Total | 129 (100.0%) | 28 (21.7%) |
Employment Occupations by Sex in Dillard
Management, Business, Science and Arts Occupations
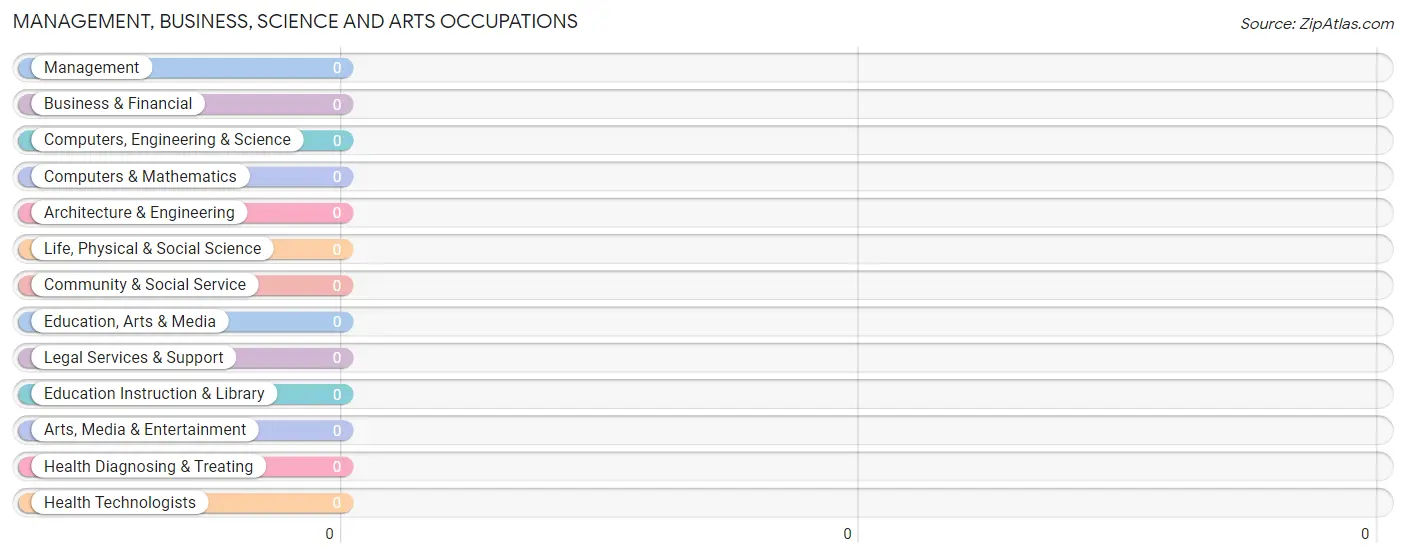
Management, Business, Science and Arts Occupations by Sex
| Occupation | Male | Female |
| Management | 0 (0.0%) | 0 (0.0%) |
| Business & Financial | 0 (0.0%) | 0 (0.0%) |
| Computers, Engineering & Science | 0 (0.0%) | 0 (0.0%) |
| Computers & Mathematics | 0 (0.0%) | 0 (0.0%) |
| Architecture & Engineering | 0 (0.0%) | 0 (0.0%) |
| Life, Physical & Social Science | 0 (0.0%) | 0 (0.0%) |
| Community & Social Service | 0 (0.0%) | 0 (0.0%) |
| Education, Arts & Media | 0 (0.0%) | 0 (0.0%) |
| Legal Services & Support | 0 (0.0%) | 0 (0.0%) |
| Education Instruction & Library | 0 (0.0%) | 0 (0.0%) |
| Arts, Media & Entertainment | 0 (0.0%) | 0 (0.0%) |
| Health Diagnosing & Treating | 0 (0.0%) | 0 (0.0%) |
| Health Technologists | 0 (0.0%) | 0 (0.0%) |
| Total (Category) | 0 (0.0%) | 0 (0.0%) |
| Total (Overall) | 33 (32.7%) | 68 (67.3%) |
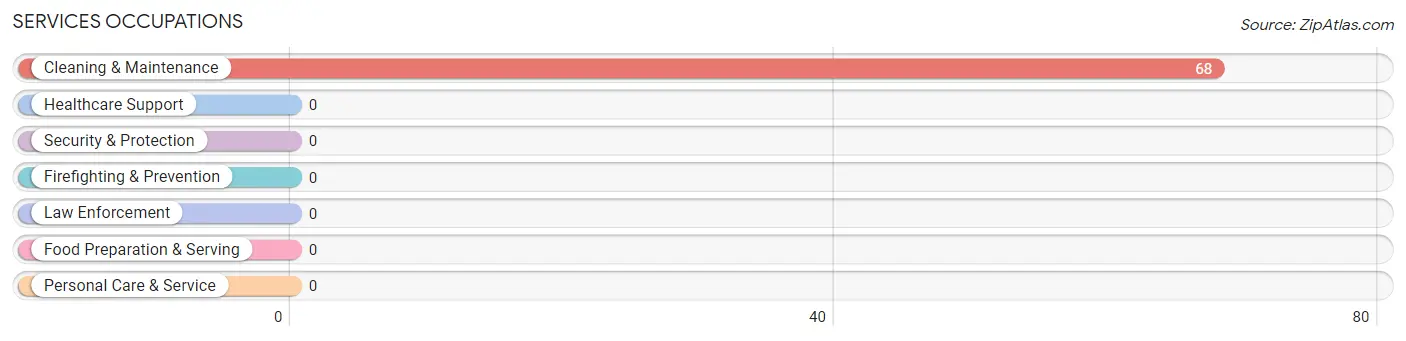
Services Occupations
The most common Services occupations in Dillard are , and Cleaning & Maintenance (68 | 67.3%).
Services Occupations by Sex
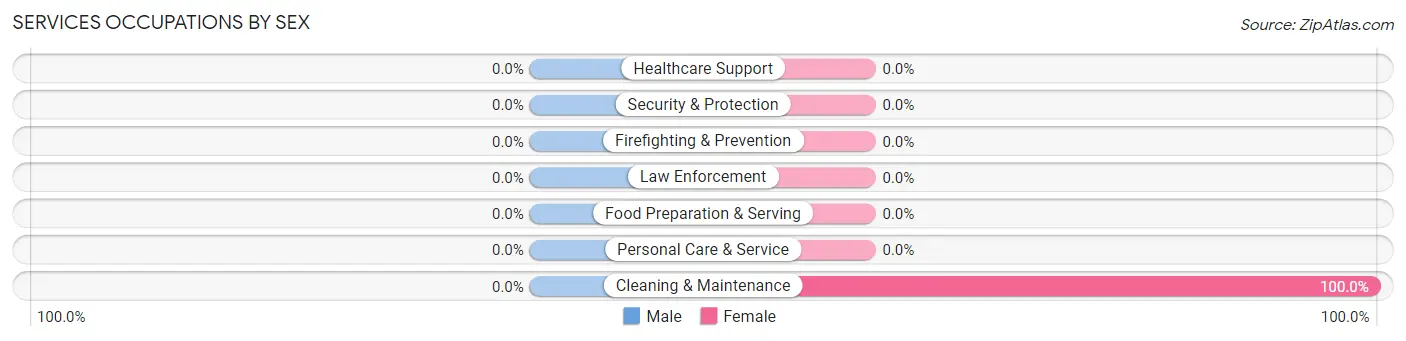
| Occupation | Male | Female |
| Healthcare Support | 0 (0.0%) | 0 (0.0%) |
| Security & Protection | 0 (0.0%) | 0 (0.0%) |
| Firefighting & Prevention | 0 (0.0%) | 0 (0.0%) |
| Law Enforcement | 0 (0.0%) | 0 (0.0%) |
| Food Preparation & Serving | 0 (0.0%) | 0 (0.0%) |
| Cleaning & Maintenance | 0 (0.0%) | 68 (100.0%) |
| Personal Care & Service | 0 (0.0%) | 0 (0.0%) |
| Total (Category) | 0 (0.0%) | 68 (100.0%) |
| Total (Overall) | 33 (32.7%) | 68 (67.3%) |
Sales and Office Occupations
Sales and Office Occupations by Sex
| Occupation | Male | Female |
| Sales & Related | 0 (0.0%) | 0 (0.0%) |
| Office & Administration | 0 (0.0%) | 0 (0.0%) |
| Total (Category) | 0 (0.0%) | 0 (0.0%) |
| Total (Overall) | 33 (32.7%) | 68 (67.3%) |
Natural Resources, Construction and Maintenance Occupations
Natural Resources, Construction and Maintenance Occupations by Sex
| Occupation | Male | Female |
| Farming, Fishing & Forestry | 0 (0.0%) | 0 (0.0%) |
| Construction & Extraction | 0 (0.0%) | 0 (0.0%) |
| Installation, Maintenance & Repair | 0 (0.0%) | 0 (0.0%) |
| Total (Category) | 0 (0.0%) | 0 (0.0%) |
| Total (Overall) | 33 (32.7%) | 68 (67.3%) |
Production, Transportation and Moving Occupations
The most common Production, Transportation and Moving occupations in Dillard are , and Material Moving (33 | 32.7%).
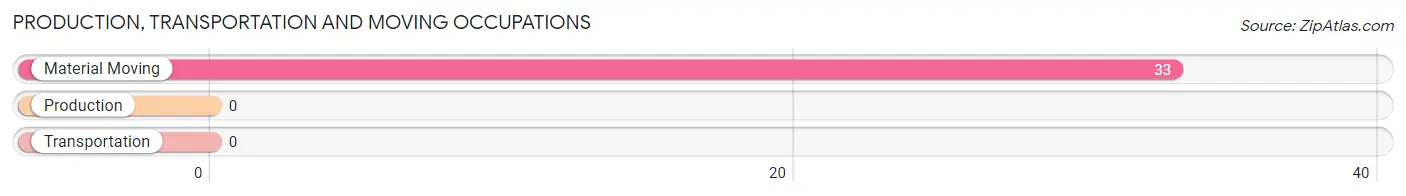
Production, Transportation and Moving Occupations by Sex
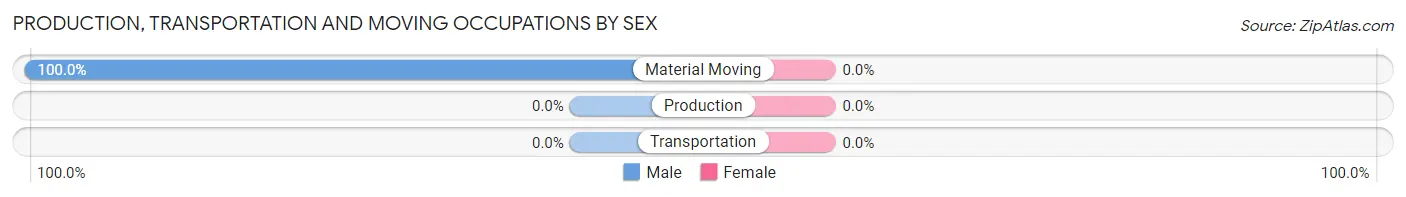
| Occupation | Male | Female |
| Production | 0 (0.0%) | 0 (0.0%) |
| Transportation | 0 (0.0%) | 0 (0.0%) |
| Material Moving | 33 (100.0%) | 0 (0.0%) |
| Total (Category) | 33 (100.0%) | 0 (0.0%) |
| Total (Overall) | 33 (32.7%) | 68 (67.3%) |
Employment Industries by Sex in Dillard
Employment Industries in Dillard
The major employment industries in Dillard include Real Estate, Rental & Leasing (68 | 67.3%), and Manufacturing (33 | 32.7%).
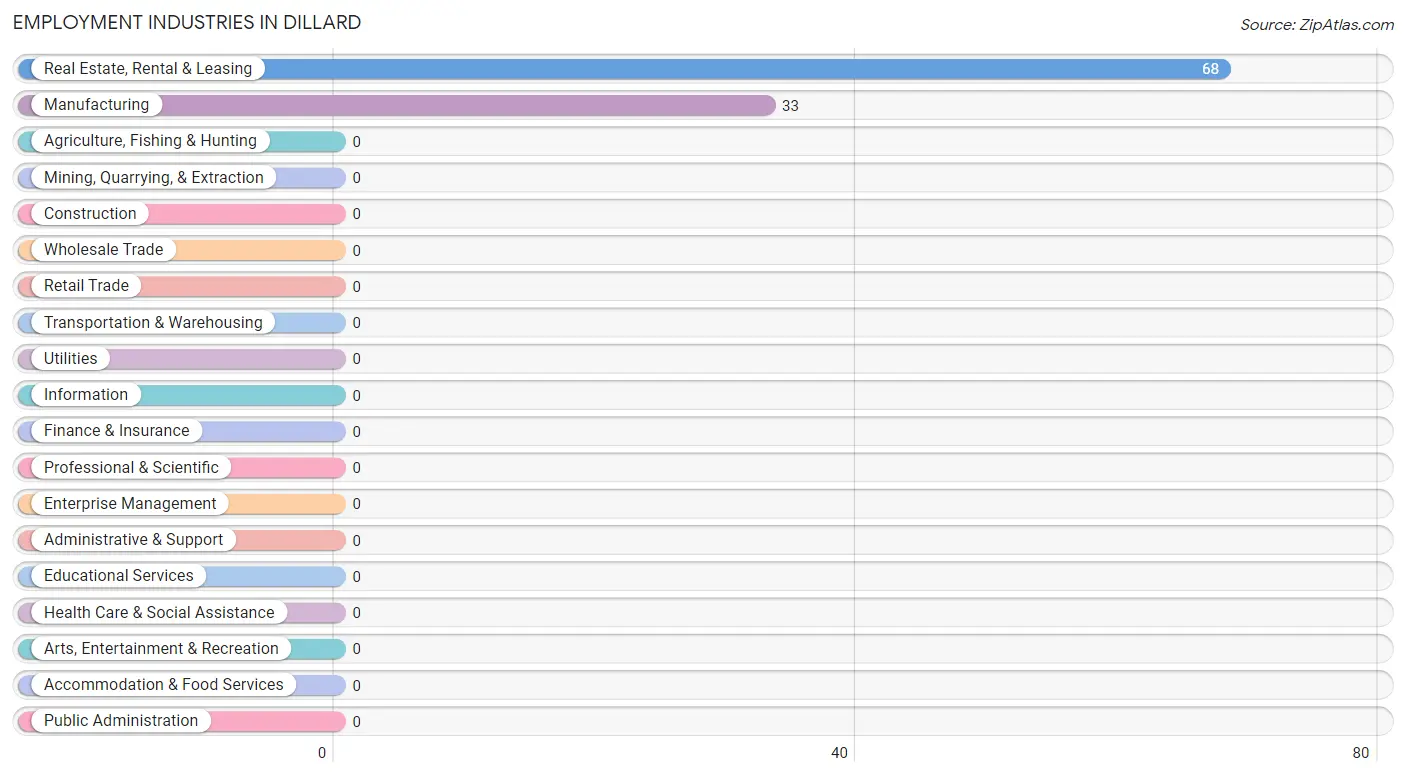
Employment Industries by Sex in Dillard
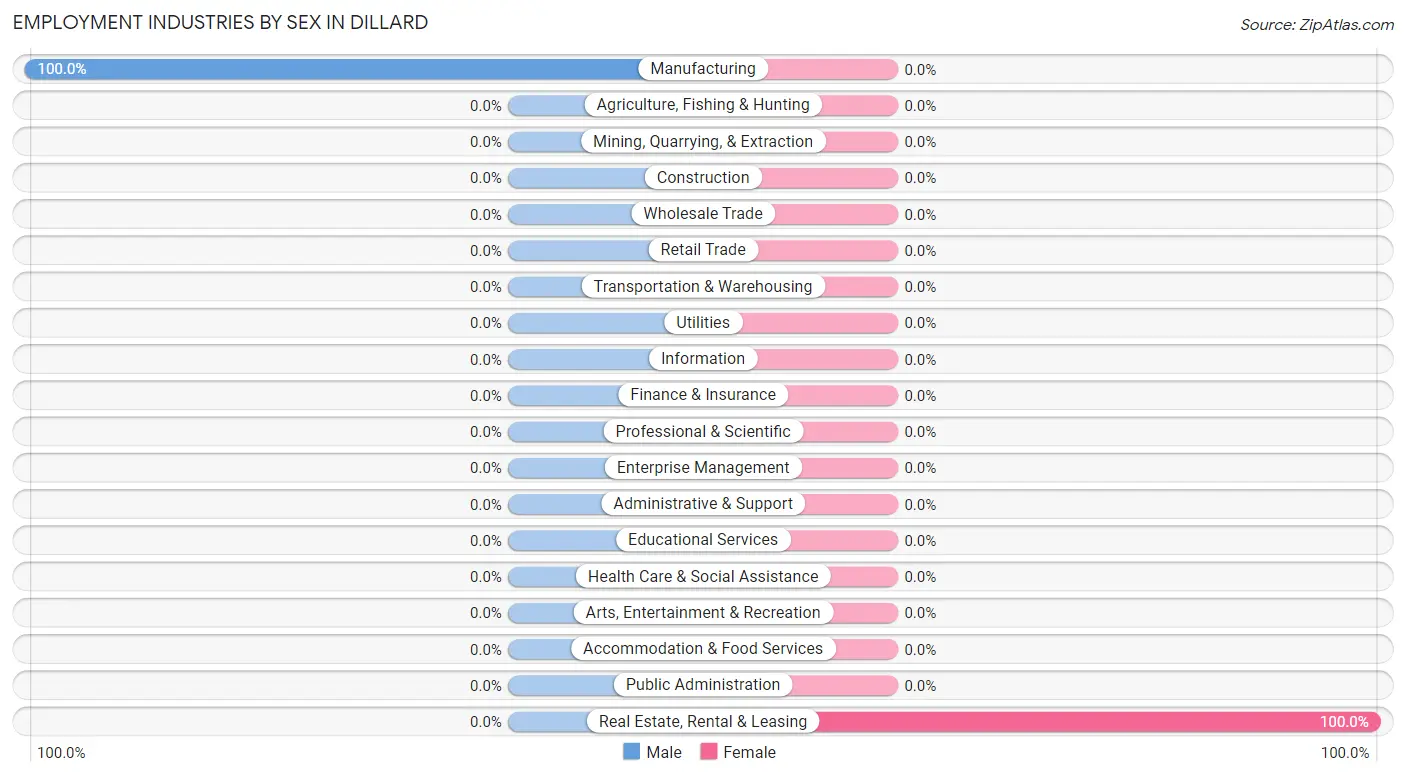
| Industry | Male | Female |
| Agriculture, Fishing & Hunting | 0 (0.0%) | 0 (0.0%) |
| Mining, Quarrying, & Extraction | 0 (0.0%) | 0 (0.0%) |
| Construction | 0 (0.0%) | 0 (0.0%) |
| Manufacturing | 33 (100.0%) | 0 (0.0%) |
| Wholesale Trade | 0 (0.0%) | 0 (0.0%) |
| Retail Trade | 0 (0.0%) | 0 (0.0%) |
| Transportation & Warehousing | 0 (0.0%) | 0 (0.0%) |
| Utilities | 0 (0.0%) | 0 (0.0%) |
| Information | 0 (0.0%) | 0 (0.0%) |
| Finance & Insurance | 0 (0.0%) | 0 (0.0%) |
| Real Estate, Rental & Leasing | 0 (0.0%) | 68 (100.0%) |
| Professional & Scientific | 0 (0.0%) | 0 (0.0%) |
| Enterprise Management | 0 (0.0%) | 0 (0.0%) |
| Administrative & Support | 0 (0.0%) | 0 (0.0%) |
| Educational Services | 0 (0.0%) | 0 (0.0%) |
| Health Care & Social Assistance | 0 (0.0%) | 0 (0.0%) |
| Arts, Entertainment & Recreation | 0 (0.0%) | 0 (0.0%) |
| Accommodation & Food Services | 0 (0.0%) | 0 (0.0%) |
| Public Administration | 0 (0.0%) | 0 (0.0%) |
| Total | 33 (32.7%) | 68 (67.3%) |
Education in Dillard
School Enrollment in Dillard
The most common levels of schooling among the 83 students in Dillard are kindergarten (54 | 65.1%), and elementary school (29 | 34.9%).
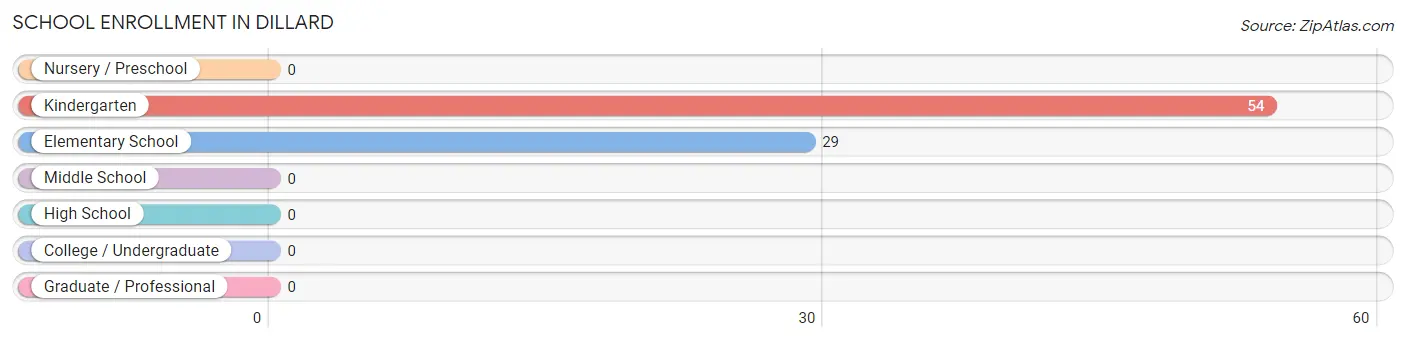
| School Level | # Students | % Students |
| Nursery / Preschool | 0 | 0.0% |
| Kindergarten | 54 | 65.1% |
| Elementary School | 29 | 34.9% |
| Middle School | 0 | 0.0% |
| High School | 0 | 0.0% |
| College / Undergraduate | 0 | 0.0% |
| Graduate / Professional | 0 | 0.0% |
| Total | 83 | 100.0% |
School Enrollment by Age by Funding Source in Dillard
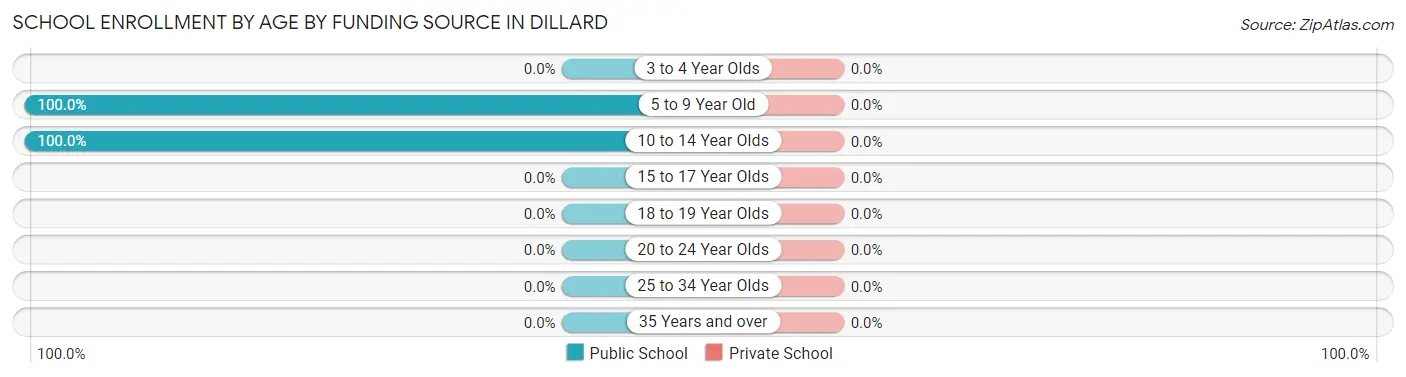
| Age Bracket | Public School | Private School |
| 3 to 4 Year Olds | 0 (0.0%) | 0 (0.0%) |
| 5 to 9 Year Old | 54 (100.0%) | 0 (0.0%) |
| 10 to 14 Year Olds | 29 (100.0%) | 0 (0.0%) |
| 15 to 17 Year Olds | 0 (0.0%) | 0 (0.0%) |
| 18 to 19 Year Olds | 0 (0.0%) | 0 (0.0%) |
| 20 to 24 Year Olds | 0 (0.0%) | 0 (0.0%) |
| 25 to 34 Year Olds | 0 (0.0%) | 0 (0.0%) |
| 35 Years and over | 0 (0.0%) | 0 (0.0%) |
| Total | 83 (100.0%) | 0 (0.0%) |
Educational Attainment by Field of Study in Dillard
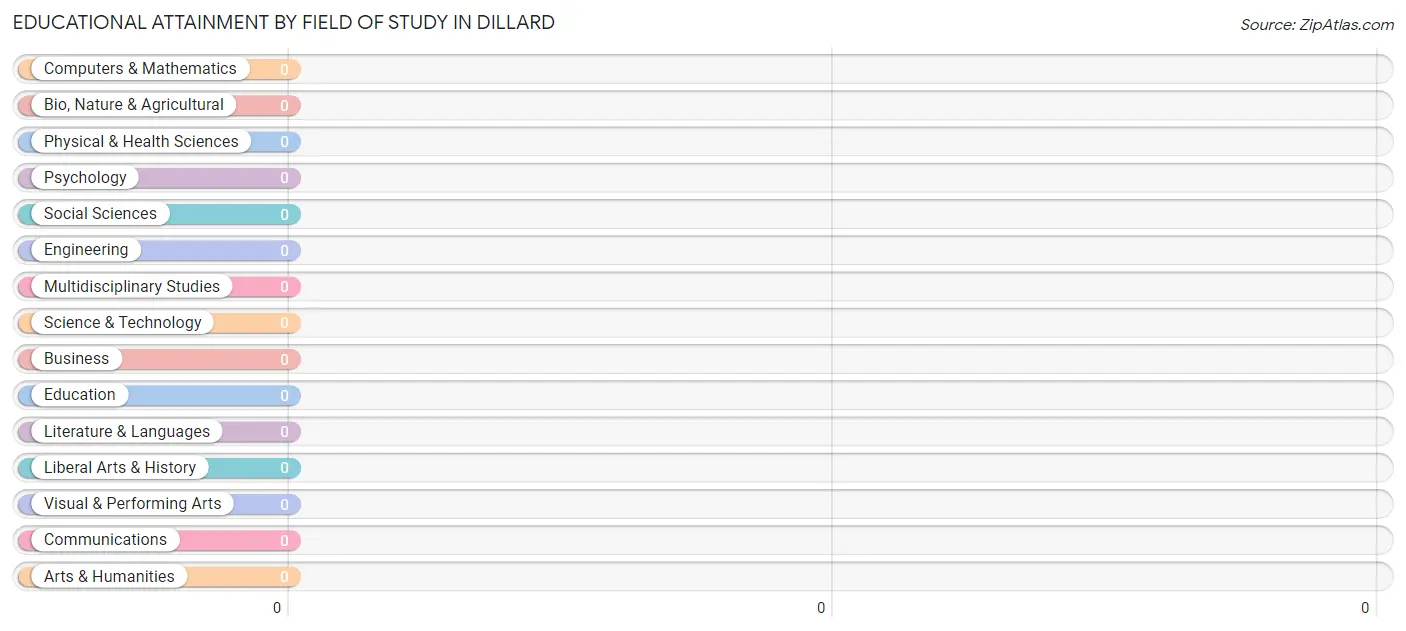
| Field of Study | # Graduates | % Graduates |
| Computers & Mathematics | 0 | 0.0% |
| Bio, Nature & Agricultural | 0 | 0.0% |
| Physical & Health Sciences | 0 | 0.0% |
| Psychology | 0 | 0.0% |
| Social Sciences | 0 | 0.0% |
| Engineering | 0 | 0.0% |
| Multidisciplinary Studies | 0 | 0.0% |
| Science & Technology | 0 | 0.0% |
| Business | 0 | 0.0% |
| Education | 0 | 0.0% |
| Literature & Languages | 0 | 0.0% |
| Liberal Arts & History | 0 | 0.0% |
| Visual & Performing Arts | 0 | 0.0% |
| Communications | 0 | 0.0% |
| Arts & Humanities | 0 | 0.0% |
| Total | 0 | 0.0% |
Transportation & Commute in Dillard
Vehicle Availability by Sex in Dillard
The most prevalent vehicle ownership categories in Dillard are males with 1 vehicle (33, accounting for 100.0%) and females with 1 vehicle (0, making up 48.5%).
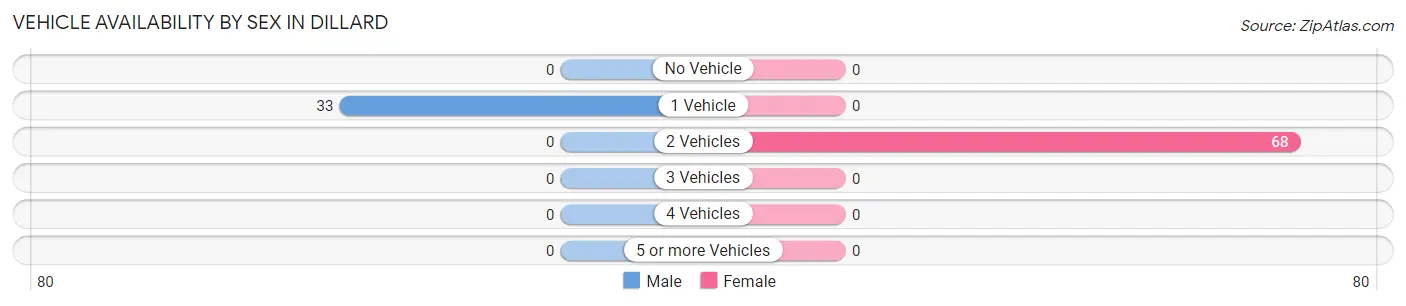
| Vehicles Available | Male | Female |
| No Vehicle | 0 (0.0%) | 0 (0.0%) |
| 1 Vehicle | 33 (100.0%) | 0 (0.0%) |
| 2 Vehicles | 0 (0.0%) | 68 (100.0%) |
| 3 Vehicles | 0 (0.0%) | 0 (0.0%) |
| 4 Vehicles | 0 (0.0%) | 0 (0.0%) |
| 5 or more Vehicles | 0 (0.0%) | 0 (0.0%) |
| Total | 33 (100.0%) | 68 (100.0%) |
Commute Time in Dillard
The most frequently occuring commute durations in Dillard are 20 to 24 minutes (68 commuters, 67.3%), 15 to 19 minutes (33 commuters, 32.7%), and less than 5 minutes (0 commuters, 0.0%).
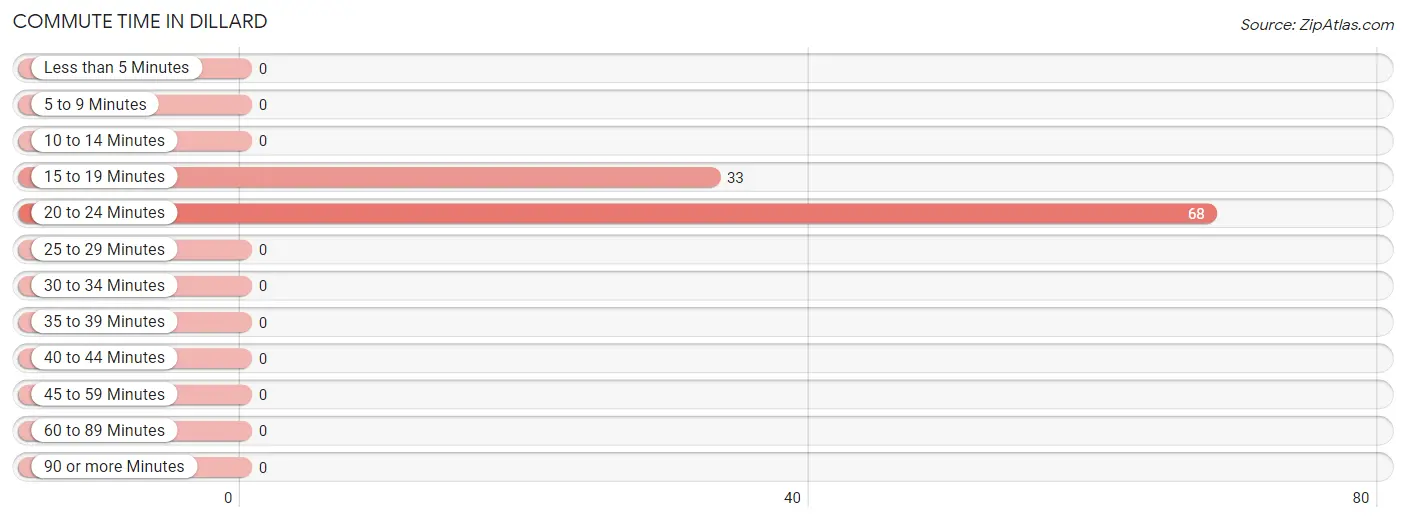
| Commute Time | # Commuters | % Commuters |
| Less than 5 Minutes | 0 | 0.0% |
| 5 to 9 Minutes | 0 | 0.0% |
| 10 to 14 Minutes | 0 | 0.0% |
| 15 to 19 Minutes | 33 | 32.7% |
| 20 to 24 Minutes | 68 | 67.3% |
| 25 to 29 Minutes | 0 | 0.0% |
| 30 to 34 Minutes | 0 | 0.0% |
| 35 to 39 Minutes | 0 | 0.0% |
| 40 to 44 Minutes | 0 | 0.0% |
| 45 to 59 Minutes | 0 | 0.0% |
| 60 to 89 Minutes | 0 | 0.0% |
| 90 or more Minutes | 0 | 0.0% |
Commute Time by Sex in Dillard
The most common commute times in Dillard are 15 to 19 minutes (33 commuters, 100.0%) for males and 20 to 24 minutes (68 commuters, 100.0%) for females.
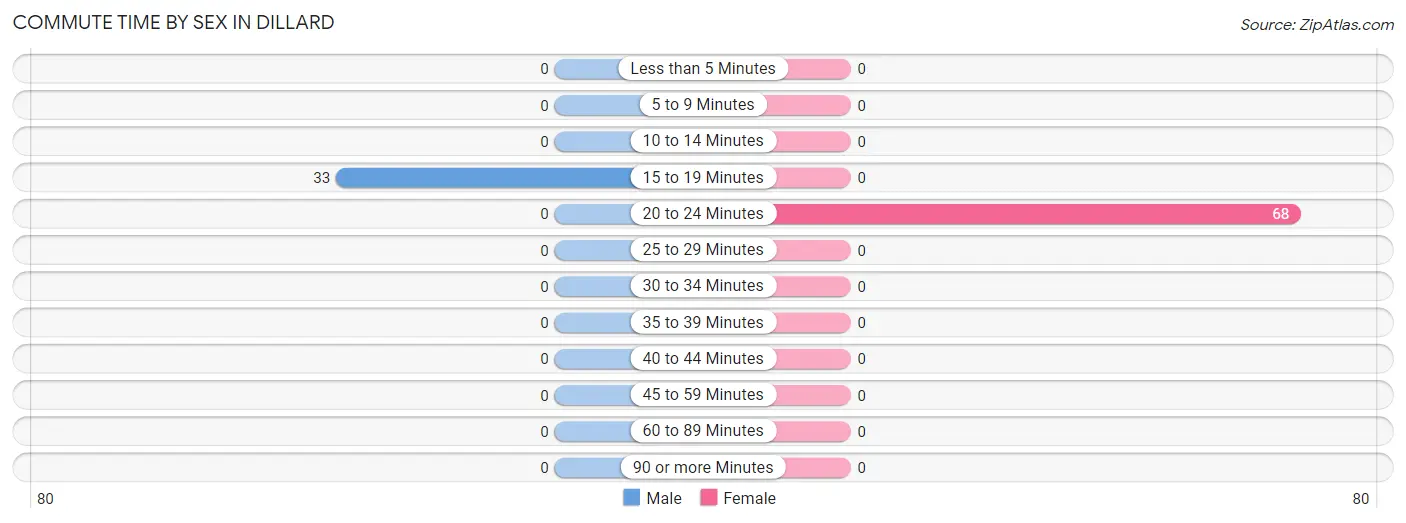
| Commute Time | Male | Female |
| Less than 5 Minutes | 0 (0.0%) | 0 (0.0%) |
| 5 to 9 Minutes | 0 (0.0%) | 0 (0.0%) |
| 10 to 14 Minutes | 0 (0.0%) | 0 (0.0%) |
| 15 to 19 Minutes | 33 (100.0%) | 0 (0.0%) |
| 20 to 24 Minutes | 0 (0.0%) | 68 (100.0%) |
| 25 to 29 Minutes | 0 (0.0%) | 0 (0.0%) |
| 30 to 34 Minutes | 0 (0.0%) | 0 (0.0%) |
| 35 to 39 Minutes | 0 (0.0%) | 0 (0.0%) |
| 40 to 44 Minutes | 0 (0.0%) | 0 (0.0%) |
| 45 to 59 Minutes | 0 (0.0%) | 0 (0.0%) |
| 60 to 89 Minutes | 0 (0.0%) | 0 (0.0%) |
| 90 or more Minutes | 0 (0.0%) | 0 (0.0%) |
Time of Departure to Work by Sex in Dillard
The most frequent times of departure to work in Dillard are 7:30 AM to 7:59 AM (33, 100.0%) for males and 10:00 AM to 10:59 AM (68, 100.0%) for females.
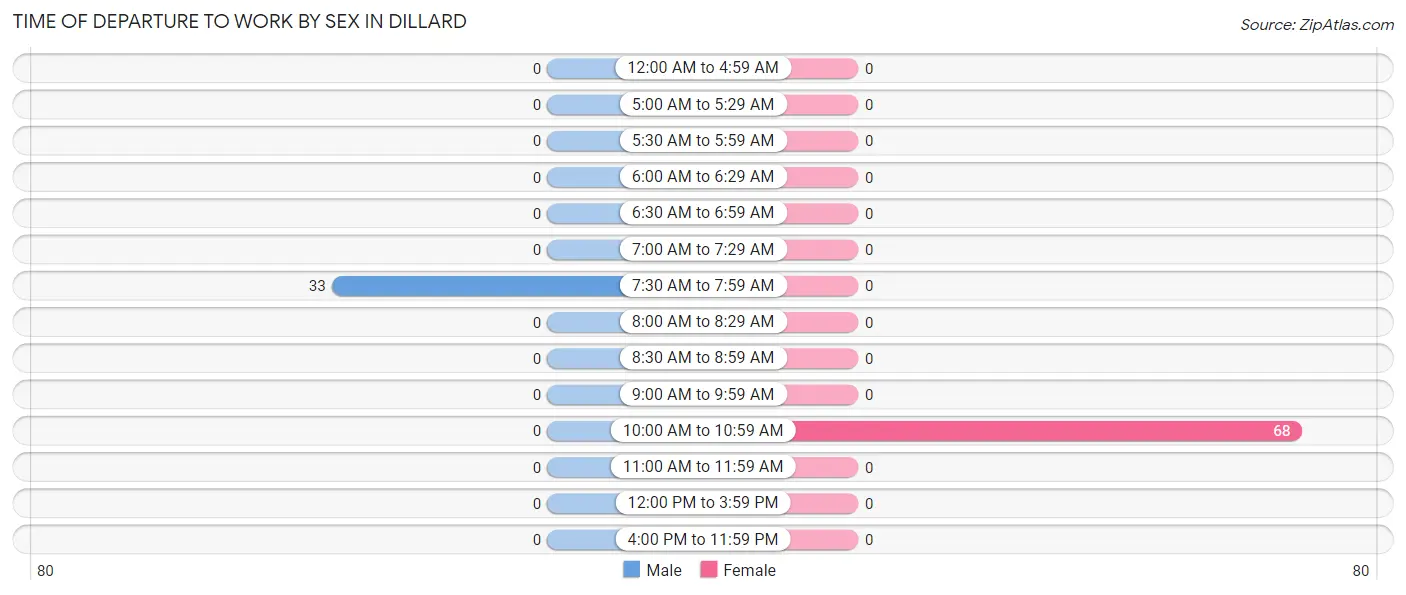
| Time of Departure | Male | Female |
| 12:00 AM to 4:59 AM | 0 (0.0%) | 0 (0.0%) |
| 5:00 AM to 5:29 AM | 0 (0.0%) | 0 (0.0%) |
| 5:30 AM to 5:59 AM | 0 (0.0%) | 0 (0.0%) |
| 6:00 AM to 6:29 AM | 0 (0.0%) | 0 (0.0%) |
| 6:30 AM to 6:59 AM | 0 (0.0%) | 0 (0.0%) |
| 7:00 AM to 7:29 AM | 0 (0.0%) | 0 (0.0%) |
| 7:30 AM to 7:59 AM | 33 (100.0%) | 0 (0.0%) |
| 8:00 AM to 8:29 AM | 0 (0.0%) | 0 (0.0%) |
| 8:30 AM to 8:59 AM | 0 (0.0%) | 0 (0.0%) |
| 9:00 AM to 9:59 AM | 0 (0.0%) | 0 (0.0%) |
| 10:00 AM to 10:59 AM | 0 (0.0%) | 68 (100.0%) |
| 11:00 AM to 11:59 AM | 0 (0.0%) | 0 (0.0%) |
| 12:00 PM to 3:59 PM | 0 (0.0%) | 0 (0.0%) |
| 4:00 PM to 11:59 PM | 0 (0.0%) | 0 (0.0%) |
| Total | 33 (100.0%) | 68 (100.0%) |
Housing Occupancy in Dillard
Occupancy by Ownership in Dillard
Of the total 144 dwellings in Dillard, owner-occupied units account for 25 (17.4%), while renter-occupied units make up 119 (82.6%).
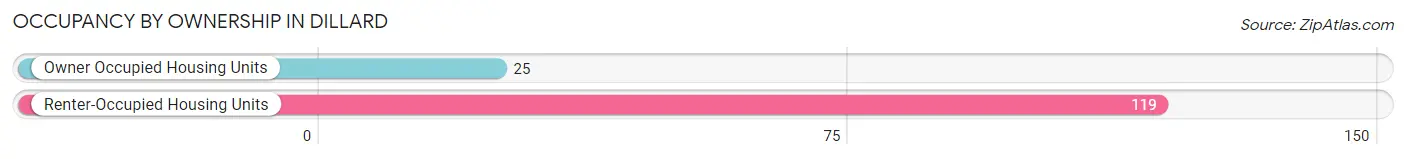
| Occupancy | # Housing Units | % Housing Units |
| Owner Occupied Housing Units | 25 | 17.4% |
| Renter-Occupied Housing Units | 119 | 82.6% |
| Total Occupied Housing Units | 144 | 100.0% |
Occupancy by Household Size in Dillard
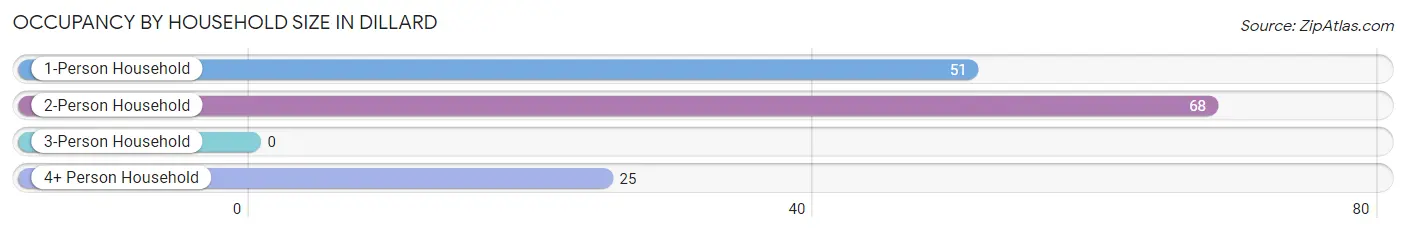
| Household Size | # Housing Units | % Housing Units |
| 1-Person Household | 51 | 35.4% |
| 2-Person Household | 68 | 47.2% |
| 3-Person Household | 0 | 0.0% |
| 4+ Person Household | 25 | 17.4% |
| Total Housing Units | 144 | 100.0% |
Occupancy by Ownership by Household Size in Dillard
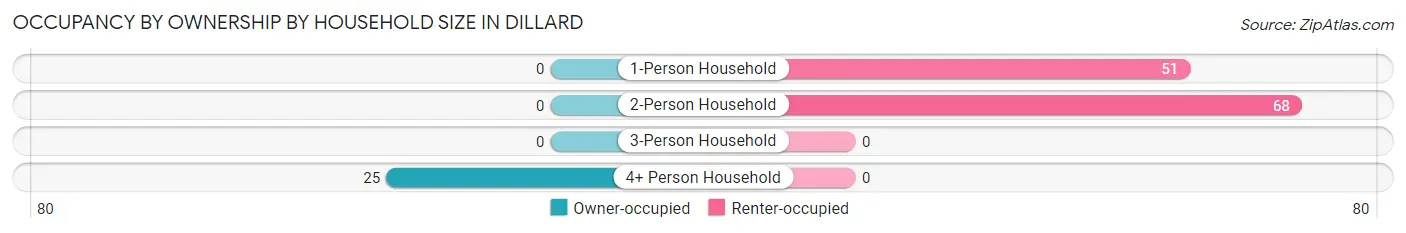
| Household Size | Owner-occupied | Renter-occupied |
| 1-Person Household | 0 (0.0%) | 51 (100.0%) |
| 2-Person Household | 0 (0.0%) | 68 (100.0%) |
| 3-Person Household | 0 (0.0%) | 0 (0.0%) |
| 4+ Person Household | 25 (100.0%) | 0 (0.0%) |
| Total Housing Units | 25 (17.4%) | 119 (82.6%) |
Occupancy by Educational Attainment in Dillard
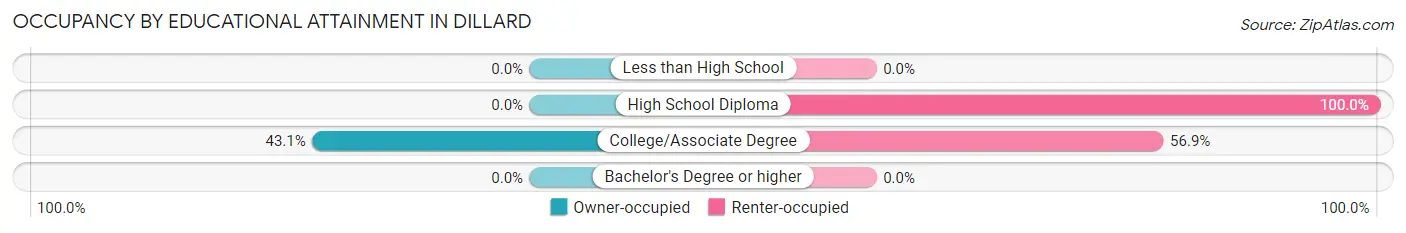
| Household Size | Owner-occupied | Renter-occupied |
| Less than High School | 0 (0.0%) | 0 (0.0%) |
| High School Diploma | 0 (0.0%) | 86 (100.0%) |
| College/Associate Degree | 25 (43.1%) | 33 (56.9%) |
| Bachelor's Degree or higher | 0 (0.0%) | 0 (0.0%) |
Occupancy by Age of Householder in Dillard
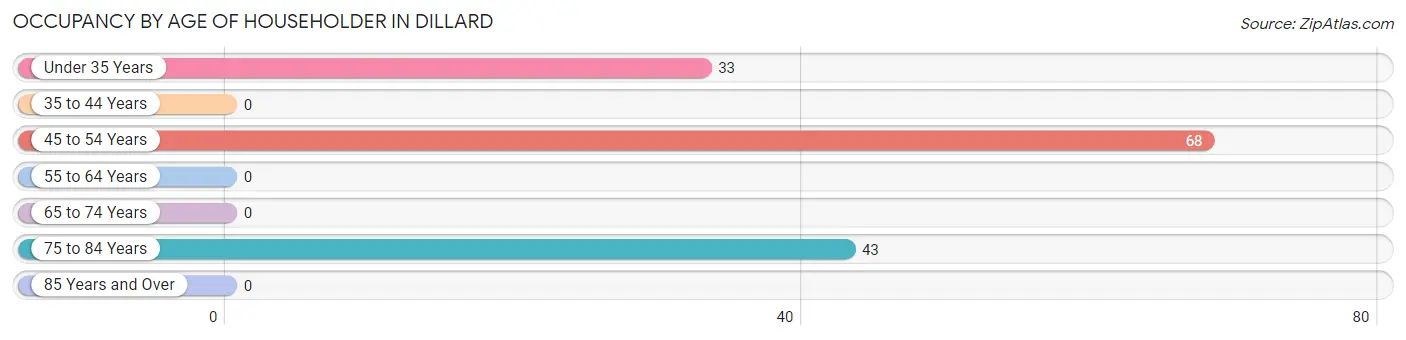
| Age Bracket | # Households | % Households |
| Under 35 Years | 33 | 22.9% |
| 35 to 44 Years | 0 | 0.0% |
| 45 to 54 Years | 68 | 47.2% |
| 55 to 64 Years | 0 | 0.0% |
| 65 to 74 Years | 0 | 0.0% |
| 75 to 84 Years | 43 | 29.9% |
| 85 Years and Over | 0 | 0.0% |
| Total | 144 | 100.0% |
Housing Finances in Dillard
Median Income by Occupancy in Dillard
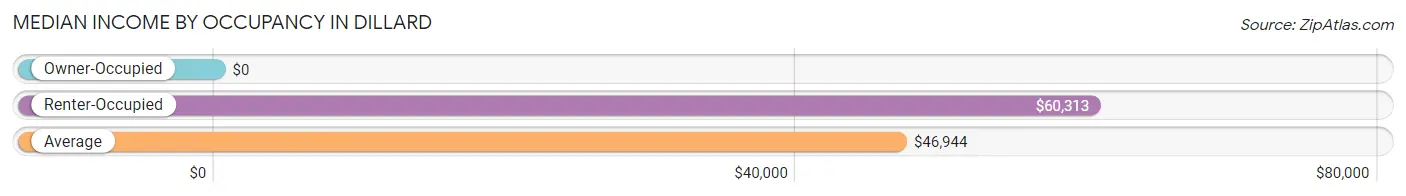
| Occupancy Type | # Households | Median Income |
| Owner-Occupied | 25 (17.4%) | $0 |
| Renter-Occupied | 119 (82.6%) | $60,313 |
| Average | 144 (100.0%) | $46,944 |
Occupancy by Householder Income Bracket in Dillard
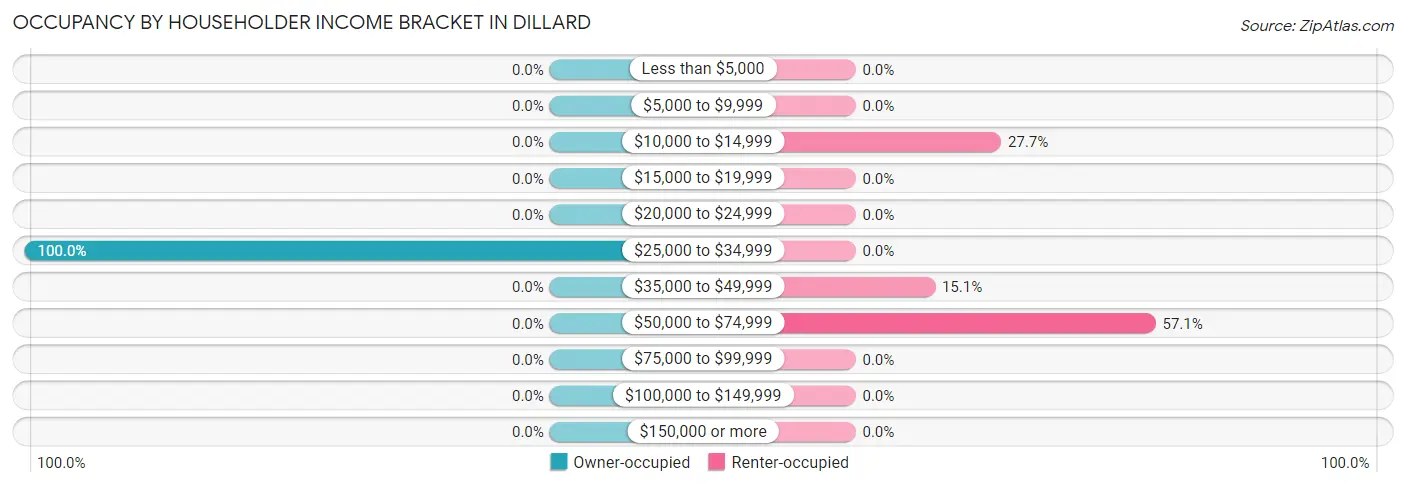
| Income Bracket | Owner-occupied | Renter-occupied |
| Less than $5,000 | 0 (0.0%) | 0 (0.0%) |
| $5,000 to $9,999 | 0 (0.0%) | 0 (0.0%) |
| $10,000 to $14,999 | 0 (0.0%) | 33 (27.7%) |
| $15,000 to $19,999 | 0 (0.0%) | 0 (0.0%) |
| $20,000 to $24,999 | 0 (0.0%) | 0 (0.0%) |
| $25,000 to $34,999 | 25 (100.0%) | 0 (0.0%) |
| $35,000 to $49,999 | 0 (0.0%) | 18 (15.1%) |
| $50,000 to $74,999 | 0 (0.0%) | 68 (57.1%) |
| $75,000 to $99,999 | 0 (0.0%) | 0 (0.0%) |
| $100,000 to $149,999 | 0 (0.0%) | 0 (0.0%) |
| $150,000 or more | 0 (0.0%) | 0 (0.0%) |
| Total | 25 (100.0%) | 119 (100.0%) |
Monthly Housing Cost Tiers in Dillard
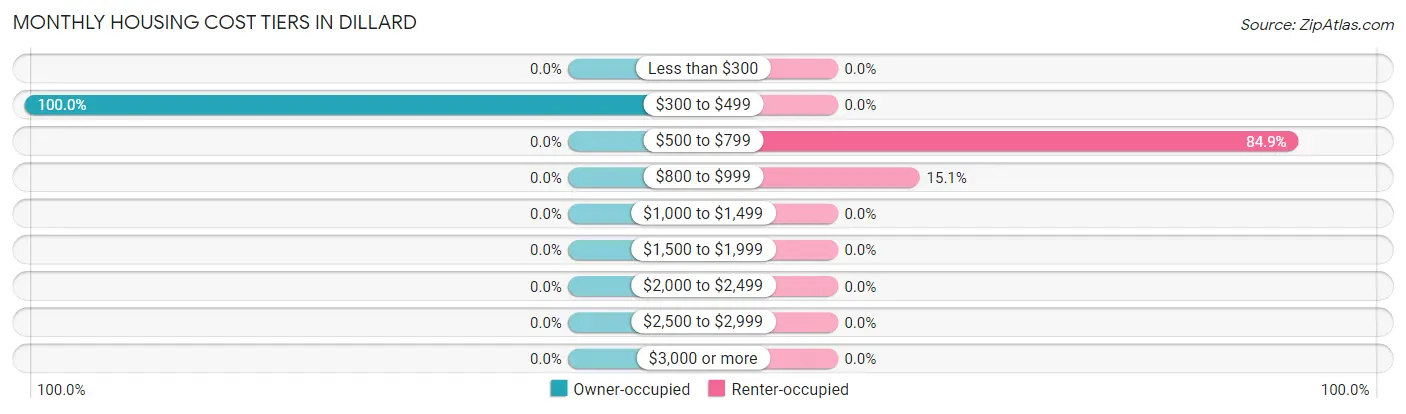
| Monthly Cost | Owner-occupied | Renter-occupied |
| Less than $300 | 0 (0.0%) | 0 (0.0%) |
| $300 to $499 | 25 (100.0%) | 0 (0.0%) |
| $500 to $799 | 0 (0.0%) | 101 (84.9%) |
| $800 to $999 | 0 (0.0%) | 18 (15.1%) |
| $1,000 to $1,499 | 0 (0.0%) | 0 (0.0%) |
| $1,500 to $1,999 | 0 (0.0%) | 0 (0.0%) |
| $2,000 to $2,499 | 0 (0.0%) | 0 (0.0%) |
| $2,500 to $2,999 | 0 (0.0%) | 0 (0.0%) |
| $3,000 or more | 0 (0.0%) | 0 (0.0%) |
| Total | 25 (100.0%) | 119 (100.0%) |
Physical Housing Characteristics in Dillard
Housing Structures in Dillard
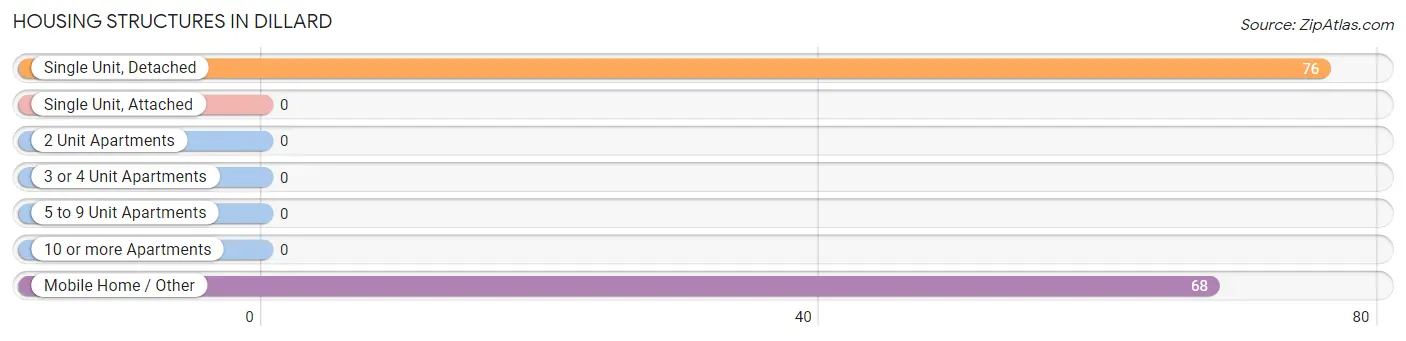
| Structure Type | # Housing Units | % Housing Units |
| Single Unit, Detached | 76 | 52.8% |
| Single Unit, Attached | 0 | 0.0% |
| 2 Unit Apartments | 0 | 0.0% |
| 3 or 4 Unit Apartments | 0 | 0.0% |
| 5 to 9 Unit Apartments | 0 | 0.0% |
| 10 or more Apartments | 0 | 0.0% |
| Mobile Home / Other | 68 | 47.2% |
| Total | 144 | 100.0% |
Housing Structures by Occupancy in Dillard
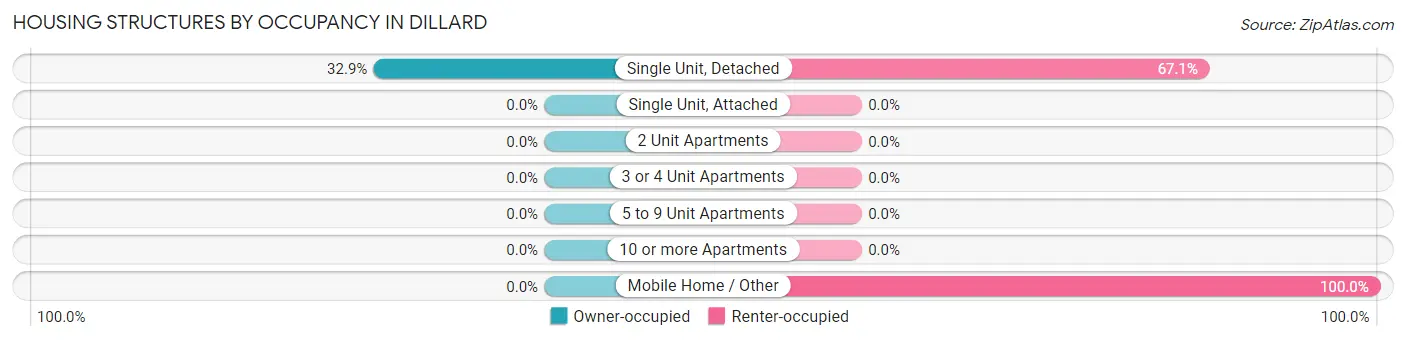
| Structure Type | Owner-occupied | Renter-occupied |
| Single Unit, Detached | 25 (32.9%) | 51 (67.1%) |
| Single Unit, Attached | 0 (0.0%) | 0 (0.0%) |
| 2 Unit Apartments | 0 (0.0%) | 0 (0.0%) |
| 3 or 4 Unit Apartments | 0 (0.0%) | 0 (0.0%) |
| 5 to 9 Unit Apartments | 0 (0.0%) | 0 (0.0%) |
| 10 or more Apartments | 0 (0.0%) | 0 (0.0%) |
| Mobile Home / Other | 0 (0.0%) | 68 (100.0%) |
| Total | 25 (17.4%) | 119 (82.6%) |
Housing Structures by Number of Rooms in Dillard
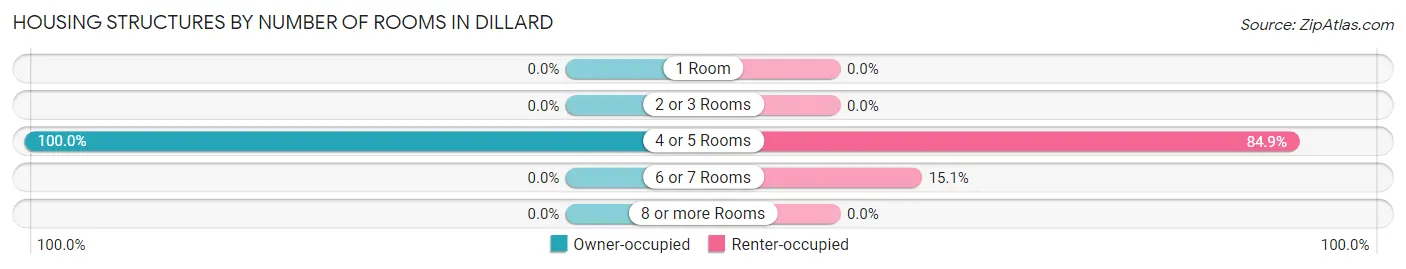
| Number of Rooms | Owner-occupied | Renter-occupied |
| 1 Room | 0 (0.0%) | 0 (0.0%) |
| 2 or 3 Rooms | 0 (0.0%) | 0 (0.0%) |
| 4 or 5 Rooms | 25 (100.0%) | 101 (84.9%) |
| 6 or 7 Rooms | 0 (0.0%) | 18 (15.1%) |
| 8 or more Rooms | 0 (0.0%) | 0 (0.0%) |
| Total | 25 (100.0%) | 119 (100.0%) |
Housing Structure by Heating Type in Dillard
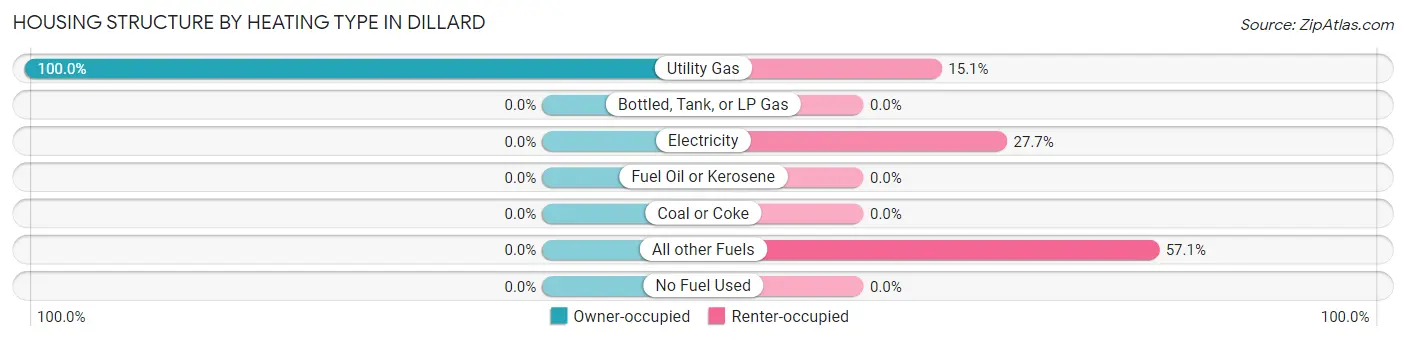
| Heating Type | Owner-occupied | Renter-occupied |
| Utility Gas | 25 (100.0%) | 18 (15.1%) |
| Bottled, Tank, or LP Gas | 0 (0.0%) | 0 (0.0%) |
| Electricity | 0 (0.0%) | 33 (27.7%) |
| Fuel Oil or Kerosene | 0 (0.0%) | 0 (0.0%) |
| Coal or Coke | 0 (0.0%) | 0 (0.0%) |
| All other Fuels | 0 (0.0%) | 68 (57.1%) |
| No Fuel Used | 0 (0.0%) | 0 (0.0%) |
| Total | 25 (100.0%) | 119 (100.0%) |
Household Vehicle Usage in Dillard
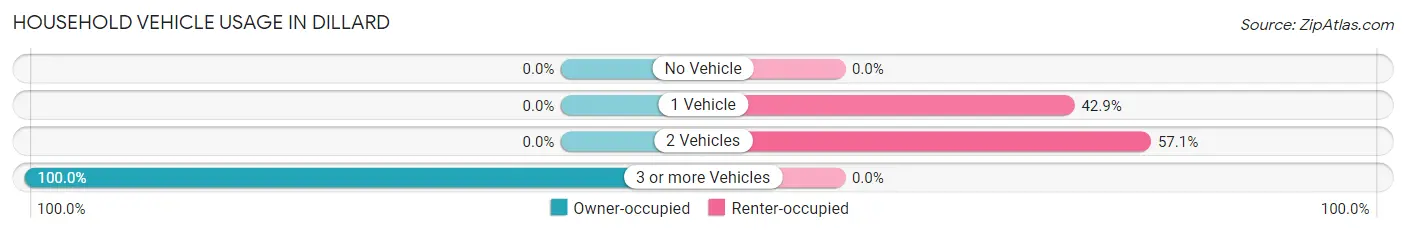
| Vehicles per Household | Owner-occupied | Renter-occupied |
| No Vehicle | 0 (0.0%) | 0 (0.0%) |
| 1 Vehicle | 0 (0.0%) | 51 (42.9%) |
| 2 Vehicles | 0 (0.0%) | 68 (57.1%) |
| 3 or more Vehicles | 25 (100.0%) | 0 (0.0%) |
| Total | 25 (100.0%) | 119 (100.0%) |
Real Estate & Mortgages in Dillard
Real Estate and Mortgage Overview in Dillard
| Characteristic | Without Mortgage | With Mortgage |
| Housing Units | 25 | 0 |
| Median Property Value | - | - |
| Median Household Income | - | - |
| Monthly Housing Costs | - | - |
| Real Estate Taxes | - | - |
Property Value by Mortgage Status in Dillard
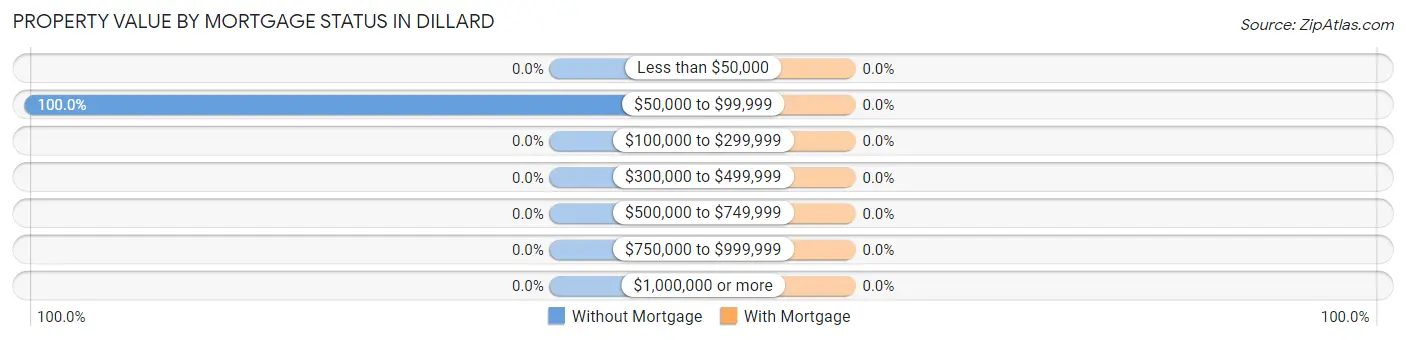
| Property Value | Without Mortgage | With Mortgage |
| Less than $50,000 | 0 (0.0%) | 0 (0.0%) |
| $50,000 to $99,999 | 25 (100.0%) | 0 (0.0%) |
| $100,000 to $299,999 | 0 (0.0%) | 0 (0.0%) |
| $300,000 to $499,999 | 0 (0.0%) | 0 (0.0%) |
| $500,000 to $749,999 | 0 (0.0%) | 0 (0.0%) |
| $750,000 to $999,999 | 0 (0.0%) | 0 (0.0%) |
| $1,000,000 or more | 0 (0.0%) | 0 (0.0%) |
| Total | 25 (100.0%) | 0 (0.0%) |
Household Income by Mortgage Status in Dillard
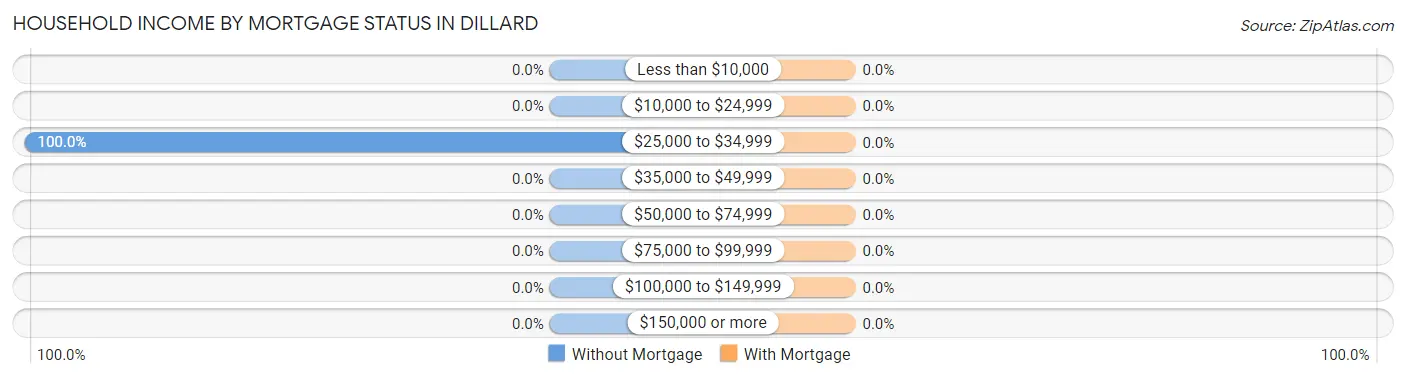
| Household Income | Without Mortgage | With Mortgage |
| Less than $10,000 | 0 (0.0%) | 0 (0.0%) |
| $10,000 to $24,999 | 0 (0.0%) | 0 (0.0%) |
| $25,000 to $34,999 | 25 (100.0%) | 0 (0.0%) |
| $35,000 to $49,999 | 0 (0.0%) | 0 (0.0%) |
| $50,000 to $74,999 | 0 (0.0%) | 0 (0.0%) |
| $75,000 to $99,999 | 0 (0.0%) | 0 (0.0%) |
| $100,000 to $149,999 | 0 (0.0%) | 0 (0.0%) |
| $150,000 or more | 0 (0.0%) | 0 (0.0%) |
| Total | 25 (100.0%) | 0 (0.0%) |
Property Value to Household Income Ratio in Dillard
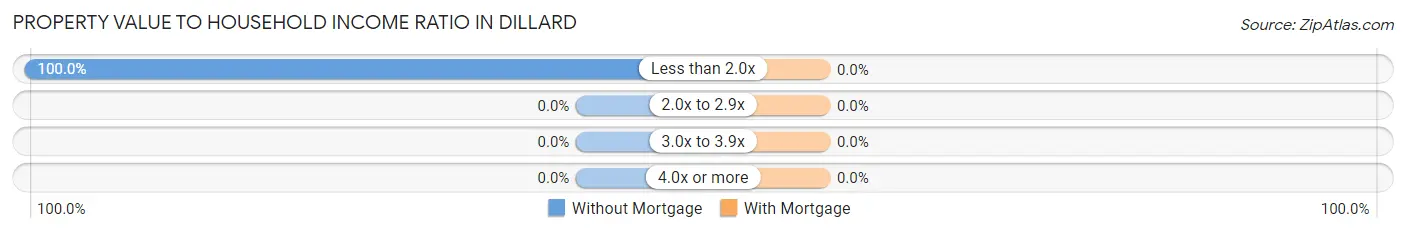
| Value-to-Income Ratio | Without Mortgage | With Mortgage |
| Less than 2.0x | 25 (100.0%) | 0 (0.0%) |
| 2.0x to 2.9x | 0 (0.0%) | 0 (0.0%) |
| 3.0x to 3.9x | 0 (0.0%) | 0 (0.0%) |
| 4.0x or more | 0 (0.0%) | 0 (0.0%) |
| Total | 25 (100.0%) | 0 (0.0%) |
Real Estate Taxes by Mortgage Status in Dillard
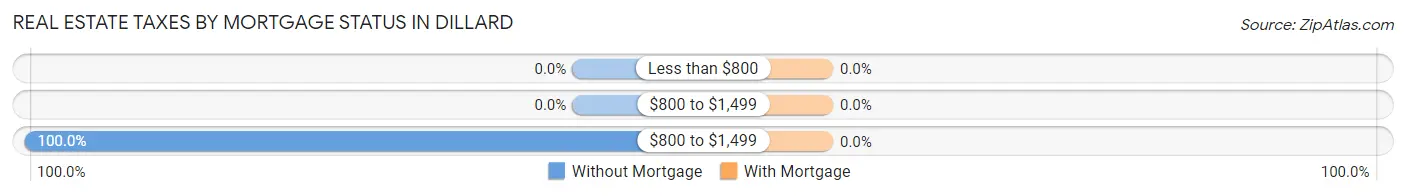
| Property Taxes | Without Mortgage | With Mortgage |
| Less than $800 | 0 (0.0%) | 0 (0.0%) |
| $800 to $1,499 | 0 (0.0%) | 0 (0.0%) |
| $800 to $1,499 | 25 (100.0%) | 0 (0.0%) |
| Total | 25 (100.0%) | 0 (0.0%) |
Health & Disability in Dillard
Health Insurance Coverage by Age in Dillard
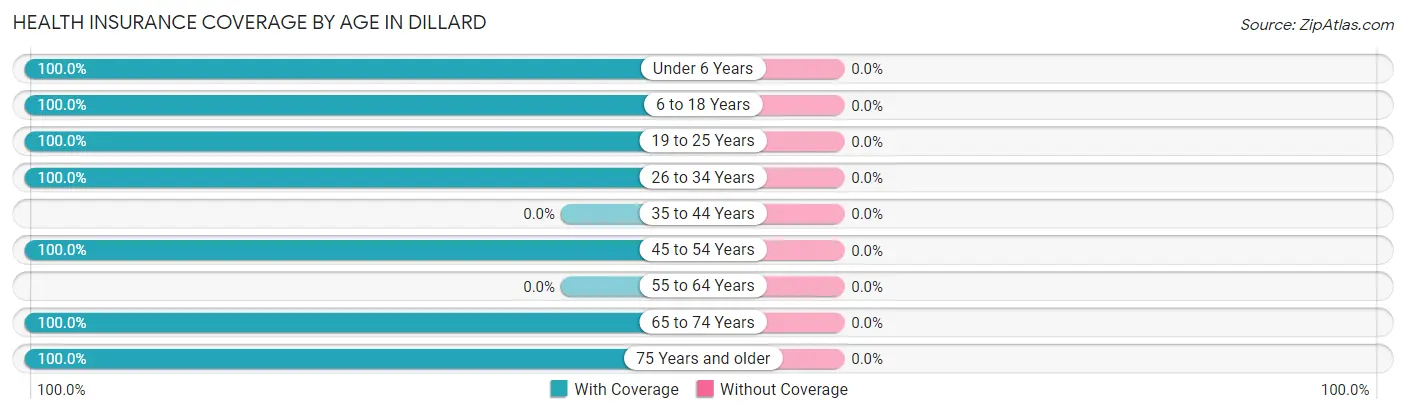
| Age Bracket | With Coverage | Without Coverage |
| Under 6 Years | 24 (100.0%) | 0 (0.0%) |
| 6 to 18 Years | 59 (100.0%) | 0 (0.0%) |
| 19 to 25 Years | 33 (100.0%) | 0 (0.0%) |
| 26 to 34 Years | 28 (100.0%) | 0 (0.0%) |
| 35 to 44 Years | 0 (0.0%) | 0 (0.0%) |
| 45 to 54 Years | 68 (100.0%) | 0 (0.0%) |
| 55 to 64 Years | 0 (0.0%) | 0 (0.0%) |
| 65 to 74 Years | 61 (100.0%) | 0 (0.0%) |
| 75 Years and older | 43 (100.0%) | 0 (0.0%) |
| Total | 316 (100.0%) | 0 (0.0%) |
Health Insurance Coverage by Citizenship Status in Dillard
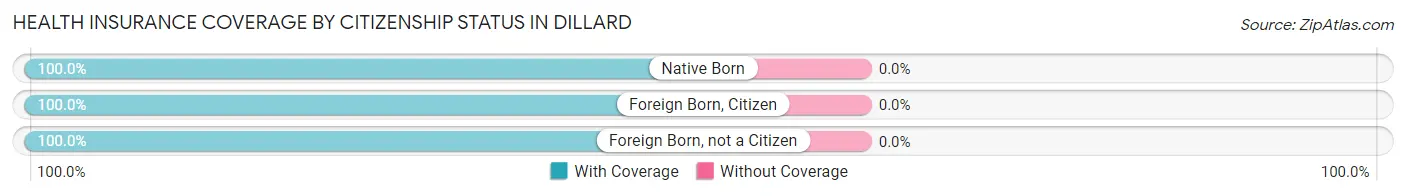
| Citizenship Status | With Coverage | Without Coverage |
| Native Born | 24 (100.0%) | 0 (0.0%) |
| Foreign Born, Citizen | 59 (100.0%) | 0 (0.0%) |
| Foreign Born, not a Citizen | 33 (100.0%) | 0 (0.0%) |
Health Insurance Coverage by Household Income in Dillard
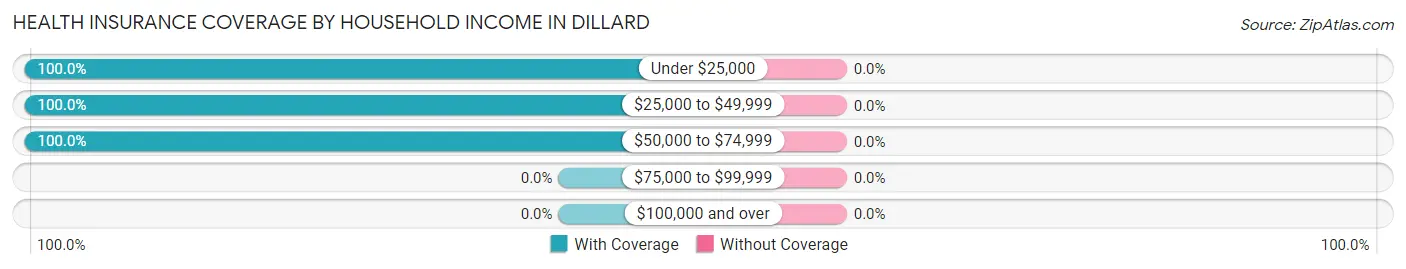
| Household Income | With Coverage | Without Coverage |
| Under $25,000 | 33 (100.0%) | 0 (0.0%) |
| $25,000 to $49,999 | 154 (100.0%) | 0 (0.0%) |
| $50,000 to $74,999 | 129 (100.0%) | 0 (0.0%) |
| $75,000 to $99,999 | 0 (0.0%) | 0 (0.0%) |
| $100,000 and over | 0 (0.0%) | 0 (0.0%) |
Public vs Private Health Insurance Coverage by Age in Dillard
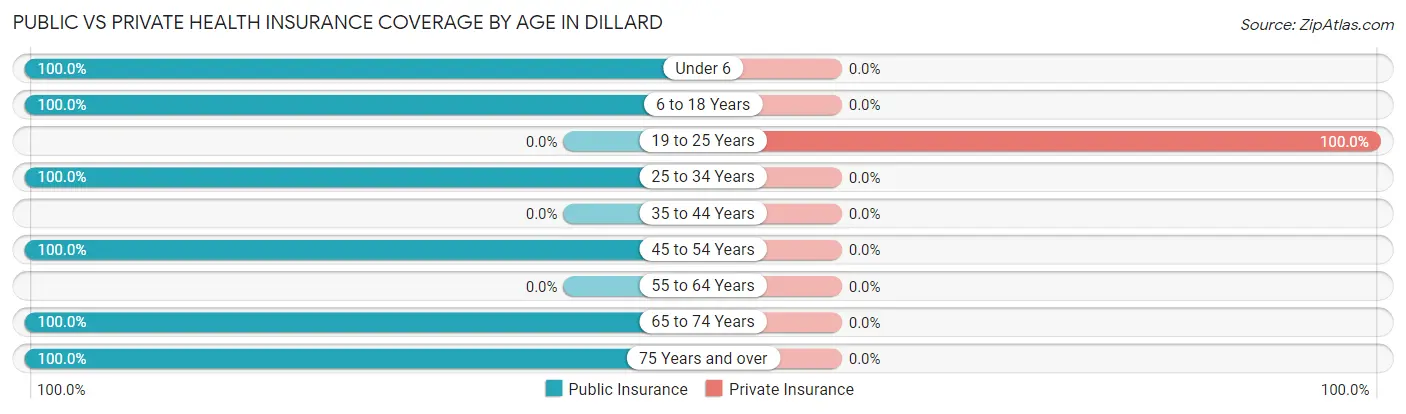
| Age Bracket | Public Insurance | Private Insurance |
| Under 6 | 24 (100.0%) | 0 (0.0%) |
| 6 to 18 Years | 59 (100.0%) | 0 (0.0%) |
| 19 to 25 Years | 0 (0.0%) | 33 (100.0%) |
| 25 to 34 Years | 28 (100.0%) | 0 (0.0%) |
| 35 to 44 Years | 0 (0.0%) | 0 (0.0%) |
| 45 to 54 Years | 68 (100.0%) | 0 (0.0%) |
| 55 to 64 Years | 0 (0.0%) | 0 (0.0%) |
| 65 to 74 Years | 61 (100.0%) | 0 (0.0%) |
| 75 Years and over | 43 (100.0%) | 0 (0.0%) |
| Total | 283 (89.6%) | 33 (10.4%) |
Disability Status by Sex by Age in Dillard
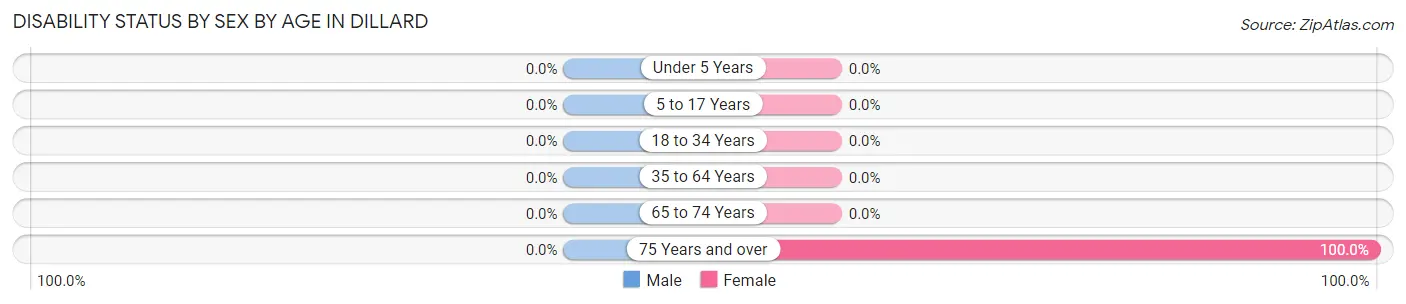
| Age Bracket | Male | Female |
| Under 5 Years | 0 (0.0%) | 0 (0.0%) |
| 5 to 17 Years | 0 (0.0%) | 0 (0.0%) |
| 18 to 34 Years | 0 (0.0%) | 0 (0.0%) |
| 35 to 64 Years | 0 (0.0%) | 0 (0.0%) |
| 65 to 74 Years | 0 (0.0%) | 0 (0.0%) |
| 75 Years and over | 0 (0.0%) | 18 (100.0%) |
Disability Class by Sex by Age in Dillard
Disability Class: Hearing Difficulty
| Age Bracket | Male | Female |
| Under 5 Years | 0 (0.0%) | 0 (0.0%) |
| 5 to 17 Years | 0 (0.0%) | 0 (0.0%) |
| 18 to 34 Years | 0 (0.0%) | 0 (0.0%) |
| 35 to 64 Years | 0 (0.0%) | 0 (0.0%) |
| 65 to 74 Years | 0 (0.0%) | 0 (0.0%) |
| 75 Years and over | 0 (0.0%) | 0 (0.0%) |
Disability Class: Vision Difficulty
| Age Bracket | Male | Female |
| Under 5 Years | 0 (0.0%) | 0 (0.0%) |
| 5 to 17 Years | 0 (0.0%) | 0 (0.0%) |
| 18 to 34 Years | 0 (0.0%) | 0 (0.0%) |
| 35 to 64 Years | 0 (0.0%) | 0 (0.0%) |
| 65 to 74 Years | 0 (0.0%) | 0 (0.0%) |
| 75 Years and over | 0 (0.0%) | 18 (100.0%) |
Disability Class: Cognitive Difficulty
| Age Bracket | Male | Female |
| 5 to 17 Years | 0 (0.0%) | 0 (0.0%) |
| 18 to 34 Years | 0 (0.0%) | 0 (0.0%) |
| 35 to 64 Years | 0 (0.0%) | 0 (0.0%) |
| 65 to 74 Years | 0 (0.0%) | 0 (0.0%) |
| 75 Years and over | 0 (0.0%) | 0 (0.0%) |
Disability Class: Ambulatory Difficulty
| Age Bracket | Male | Female |
| 5 to 17 Years | 0 (0.0%) | 0 (0.0%) |
| 18 to 34 Years | 0 (0.0%) | 0 (0.0%) |
| 35 to 64 Years | 0 (0.0%) | 0 (0.0%) |
| 65 to 74 Years | 0 (0.0%) | 0 (0.0%) |
| 75 Years and over | 0 (0.0%) | 18 (100.0%) |
Disability Class: Self-Care Difficulty
| Age Bracket | Male | Female |
| 5 to 17 Years | 0 (0.0%) | 0 (0.0%) |
| 18 to 34 Years | 0 (0.0%) | 0 (0.0%) |
| 35 to 64 Years | 0 (0.0%) | 0 (0.0%) |
| 65 to 74 Years | 0 (0.0%) | 0 (0.0%) |
| 75 Years and over | 0 (0.0%) | 0 (0.0%) |
Technology Access in Dillard
Computing Device Access in Dillard
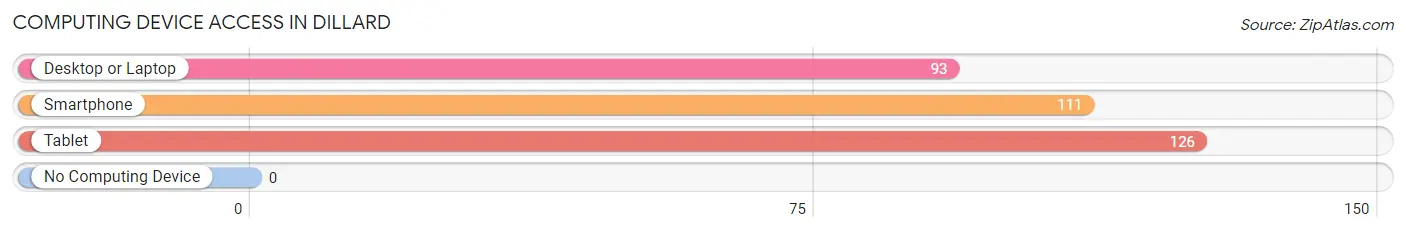
| Device Type | # Households | % Households |
| Desktop or Laptop | 93 | 64.6% |
| Smartphone | 111 | 77.1% |
| Tablet | 126 | 87.5% |
| No Computing Device | 0 | 0.0% |
| Total | 144 | 100.0% |
Internet Access in Dillard
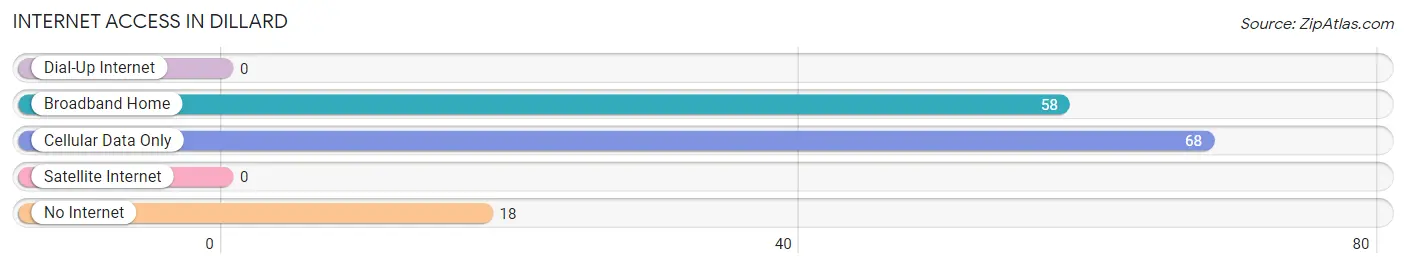
| Internet Type | # Households | % Households |
| Dial-Up Internet | 0 | 0.0% |
| Broadband Home | 58 | 40.3% |
| Cellular Data Only | 68 | 47.2% |
| Satellite Internet | 0 | 0.0% |
| No Internet | 18 | 12.5% |
| Total | 144 | 100.0% |
Dillard Summary
Dillard is a small unincorporated community located in the U.S. state of Oregon. It is situated in the foothills of the Cascade Mountains, approximately 20 miles east of Eugene. The town is home to a population of just over 200 people, and is known for its rural charm and close-knit community.
History
The area that is now Dillard was first settled in the late 1800s by homesteaders. The town was originally known as “Dillardsville”, named after the first settler, William Dillard. The town was officially incorporated in 1910, and the name was shortened to “Dillard”.
In the early 1900s, Dillard was a thriving logging and farming community. The town was home to several sawmills, a general store, a post office, and a school. The town also had a thriving social life, with dances, picnics, and other events.
In the 1950s, the logging industry began to decline, and the town’s population began to dwindle. The post office closed in the 1960s, and the school closed in the 1970s. In the 1980s, the town was revitalized by the arrival of new residents, and the population began to grow again.
Geography
Dillard is located in the foothills of the Cascade Mountains, approximately 20 miles east of Eugene. The town is situated at an elevation of 1,000 feet, and is surrounded by rolling hills and lush forests. The McKenzie River runs through the town, and is a popular spot for fishing and swimming.
The climate in Dillard is mild and temperate, with warm summers and cool winters. The average annual temperature is around 50 degrees Fahrenheit, and the average annual precipitation is around 40 inches.
Economy
The economy of Dillard is largely based on agriculture and tourism. The town is home to several small farms, which produce a variety of fruits and vegetables. The town is also a popular destination for outdoor recreation, and is home to several campgrounds and hiking trails.
In addition, Dillard is home to several small businesses, including a cafe, a general store, and a gas station. The town also has a small airport, which serves as a hub for private and charter flights.
Demographics
As of the 2010 census, the population of Dillard was 206. The racial makeup of the town was 97.1% White, 0.5% Native American, 0.5% Asian, 0.5% from other races, and 1.4% from two or more races. The median household income was $37,500, and the median age was 44.
Conclusion
Dillard is a small unincorporated community located in the U.S. state of Oregon. It is situated in the foothills of the Cascade Mountains, approximately 20 miles east of Eugene. The town is home to a population of just over 200 people, and is known for its rural charm and close-knit community. The economy of Dillard is largely based on agriculture and tourism, and the town is a popular destination for outdoor recreation. The population of Dillard is predominantly White, with a median household income of $37,500 and a median age of 44.
Common Questions
What is Per Capita Income in Dillard?
Per Capita income in Dillard is $19,492.
What is the Median Household income in Dillard?
Median Household Income in Dillard is $46,944.
What is Inequality or Gini Index in Dillard?
Inequality or Gini Index in Dillard is 0.23.
What is the Total Population of Dillard?
Total Population of Dillard is 316.
What is the Total Male Population of Dillard?
Total Male Population of Dillard is 206.
What is the Total Female Population of Dillard?
Total Female Population of Dillard is 110.
What is the Ratio of Males per 100 Females in Dillard?
There are 187.27 Males per 100 Females in Dillard.
What is the Ratio of Females per 100 Males in Dillard?
There are 53.40 Females per 100 Males in Dillard.
What is the Median Population Age in Dillard?
Median Population Age in Dillard is 50.2 Years.
What is the Average Family Size in Dillard
Average Family Size in Dillard is 2.9 People.
What is the Average Household Size in Dillard
Average Household Size in Dillard is 2.2 People.
How Large is the Labor Force in Dillard?
There are 129 People in the Labor Forcein in Dillard.
What is the Percentage of People in the Labor Force in Dillard?
55.4% of People are in the Labor Force in Dillard.
What is the Unemployment Rate in Dillard?
Unemployment Rate in Dillard is 21.7%.