Fairfield, TN Map & Demographics
Fairfield Map
Fairfield Overview
$16,816
PER CAPITA INCOME
0.36
INEQUALITY / GINI INDEX
266
TOTAL POPULATION
130
MALE POPULATION
136
FEMALE POPULATION
95.59
MALES / 100 FEMALES
104.62
FEMALES / 100 MALES
41.4
MEDIAN AGE
2.6
AVG FAMILY SIZE
2.6
AVG HOUSEHOLD SIZE
186
LABOR FORCE [ PEOPLE ]
73.8%
PERCENT IN LABOR FORCE
21.5%
UNEMPLOYMENT RATE
Income in Fairfield
Income Overview in Fairfield
| Characteristic | Number | Measure |
| Per Capita Income | 266 | $16,816 |
| Median Family Income | 101 | $0 |
| Mean Family Income | 101 | $43,762 |
| Median Household Income | 101 | $0 |
| Mean Household Income | 101 | $43,762 |
| Income Deficit | 101 | $0 |
| Wage / Income Gap (%) | 266 | 0.00% |
| Wage / Income Gap ($) | 266 | 100.00¢ per $1 |
| Gini / Inequality Index | 266 | 0.36 |
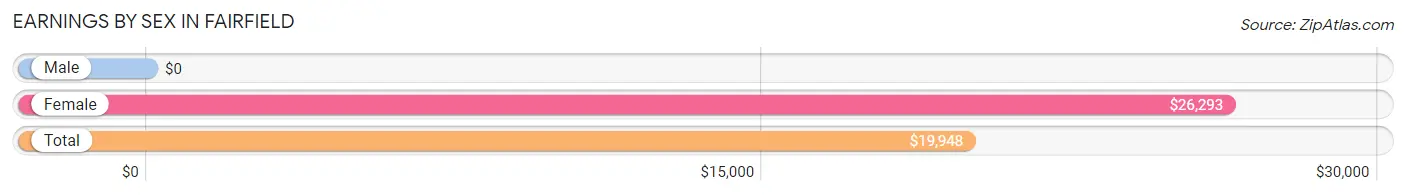
Earnings by Sex in Fairfield
| Sex | Number | Average Earnings |
| Male | 64 (43.8%) | $0 |
| Female | 82 (56.2%) | $26,293 |
| Total | 146 (100.0%) | $19,948 |
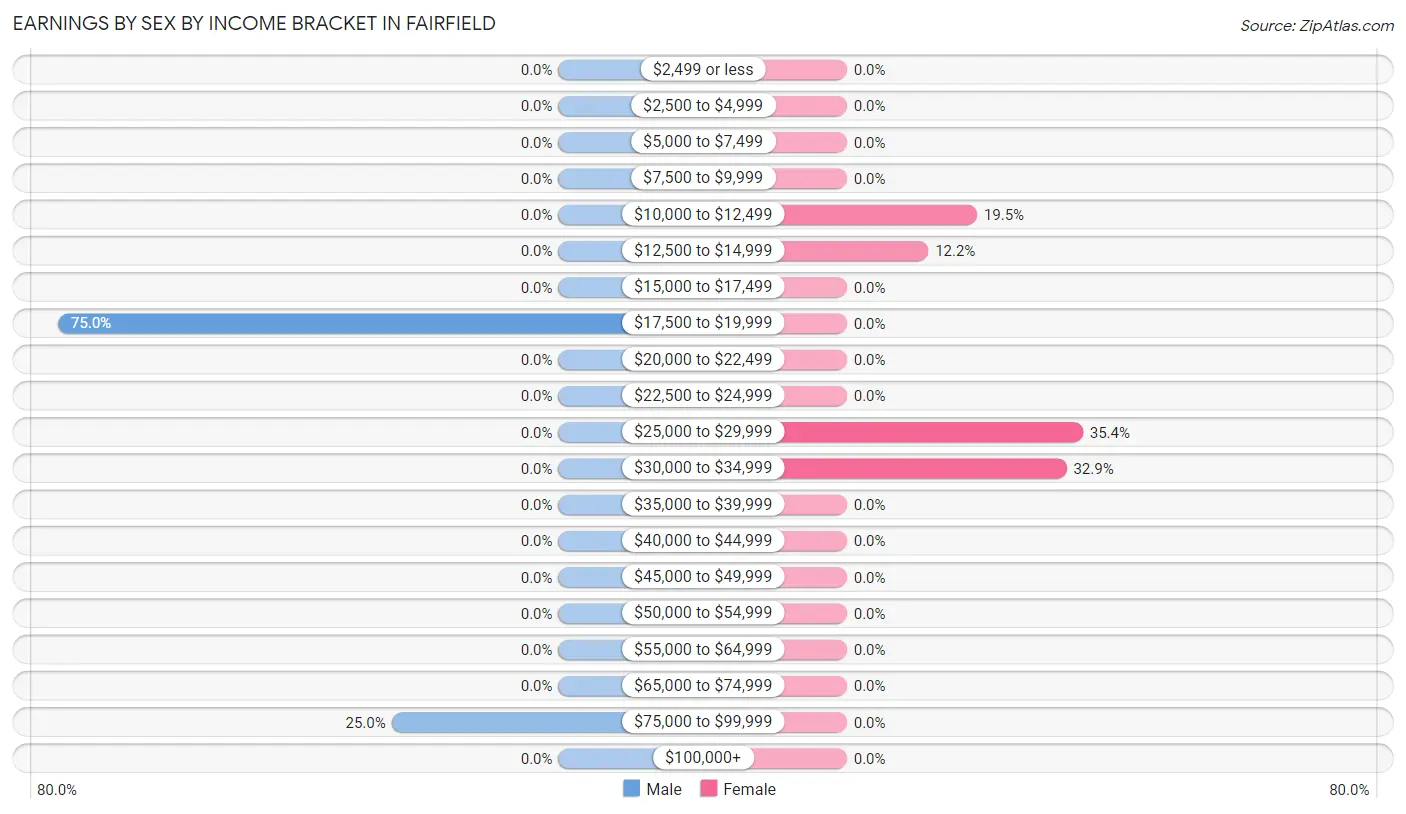
Earnings by Sex by Income Bracket in Fairfield
The most common earnings brackets in Fairfield are $17,500 to $19,999 for men (48 | 75.0%) and $25,000 to $29,999 for women (29 | 35.4%).
| Income | Male | Female |
| $2,499 or less | 0 (0.0%) | 0 (0.0%) |
| $2,500 to $4,999 | 0 (0.0%) | 0 (0.0%) |
| $5,000 to $7,499 | 0 (0.0%) | 0 (0.0%) |
| $7,500 to $9,999 | 0 (0.0%) | 0 (0.0%) |
| $10,000 to $12,499 | 0 (0.0%) | 16 (19.5%) |
| $12,500 to $14,999 | 0 (0.0%) | 10 (12.2%) |
| $15,000 to $17,499 | 0 (0.0%) | 0 (0.0%) |
| $17,500 to $19,999 | 48 (75.0%) | 0 (0.0%) |
| $20,000 to $22,499 | 0 (0.0%) | 0 (0.0%) |
| $22,500 to $24,999 | 0 (0.0%) | 0 (0.0%) |
| $25,000 to $29,999 | 0 (0.0%) | 29 (35.4%) |
| $30,000 to $34,999 | 0 (0.0%) | 27 (32.9%) |
| $35,000 to $39,999 | 0 (0.0%) | 0 (0.0%) |
| $40,000 to $44,999 | 0 (0.0%) | 0 (0.0%) |
| $45,000 to $49,999 | 0 (0.0%) | 0 (0.0%) |
| $50,000 to $54,999 | 0 (0.0%) | 0 (0.0%) |
| $55,000 to $64,999 | 0 (0.0%) | 0 (0.0%) |
| $65,000 to $74,999 | 0 (0.0%) | 0 (0.0%) |
| $75,000 to $99,999 | 16 (25.0%) | 0 (0.0%) |
| $100,000+ | 0 (0.0%) | 0 (0.0%) |
| Total | 64 (100.0%) | 82 (100.0%) |
Earnings by Sex by Educational Attainment in Fairfield
| Educational Attainment | Male Income | Female Income |
| Less than High School | - | - |
| High School Diploma | - | - |
| College or Associate's Degree | - | - |
| Bachelor's Degree | - | - |
| Graduate Degree | - | - |
| Total | - | - |
Family Income in Fairfield
Family Income Brackets in Fairfield
According to the Fairfield family income data, there are 48 families falling into the $15,000 to $24,999 income range, which is the most common income bracket and makes up 47.5% of all families.
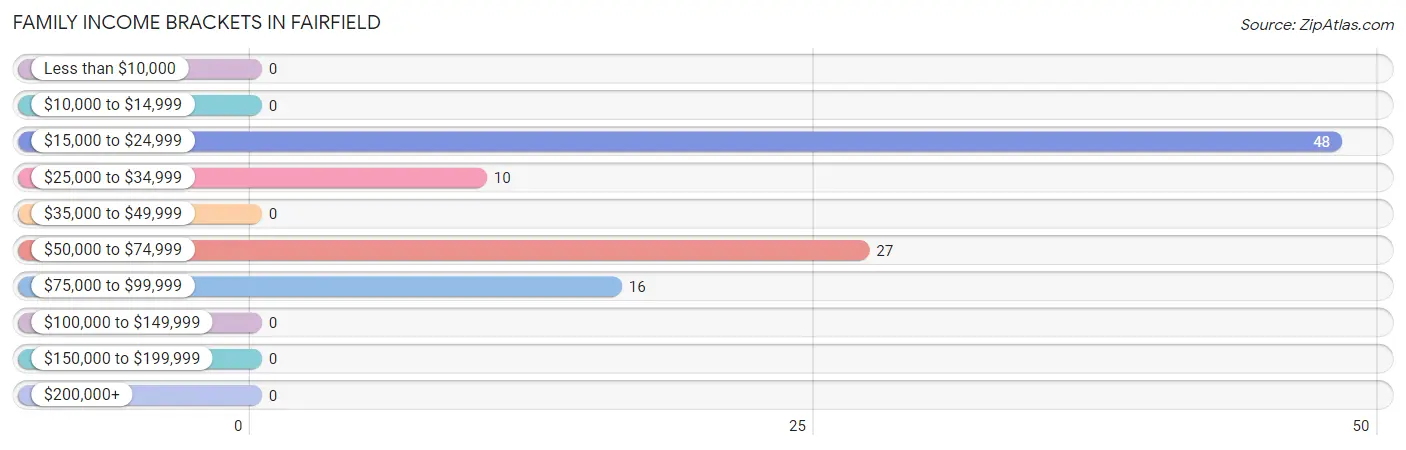
| Income Bracket | # Families | % Families |
| Less than $10,000 | 0 | 0.0% |
| $10,000 to $14,999 | 0 | 0.0% |
| $15,000 to $24,999 | 48 | 47.5% |
| $25,000 to $34,999 | 10 | 9.9% |
| $35,000 to $49,999 | 0 | 0.0% |
| $50,000 to $74,999 | 27 | 26.7% |
| $75,000 to $99,999 | 16 | 15.8% |
| $100,000 to $149,999 | 0 | 0.0% |
| $150,000 to $199,999 | 0 | 0.0% |
| $200,000+ | 0 | 0.0% |
Family Income by Famaliy Size in Fairfield
| Income Bracket | # Families | Median Income |
| 2-Person Families | 48 (47.5%) | $0 |
| 3-Person Families | 37 (36.6%) | $0 |
| 4-Person Families | 16 (15.8%) | $0 |
| 5-Person Families | 0 (0.0%) | $0 |
| 6-Person Families | 0 (0.0%) | $0 |
| 7+ Person Families | 0 (0.0%) | $0 |
| Total | 101 (100.0%) | $0 |
Family Income by Number of Earners in Fairfield
| Number of Earners | # Families | Median Income |
| No Earners | 0 (0.0%) | $0 |
| 1 Earner | 58 (57.4%) | $0 |
| 2 Earners | 43 (42.6%) | $0 |
| 3+ Earners | 0 (0.0%) | $0 |
| Total | 101 (100.0%) | $0 |
Household Income in Fairfield
Household Income Brackets in Fairfield
With 48 households falling in the category, the $15,000 to $24,999 income range is the most frequent in Fairfield, accounting for 47.5% of all households.
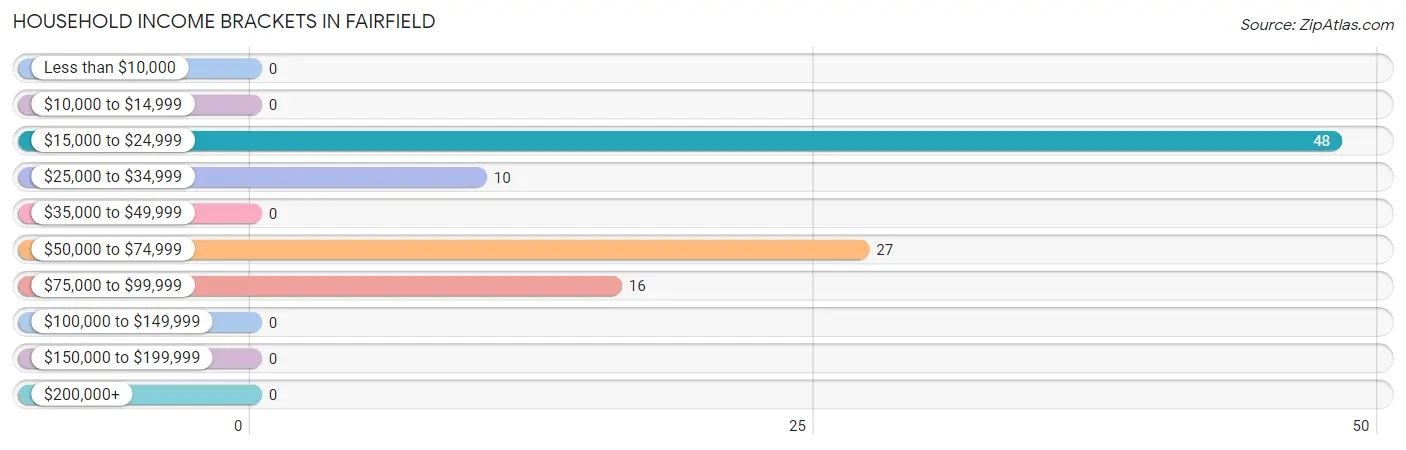
| Income Bracket | # Households | % Households |
| Less than $10,000 | 0 | 0.0% |
| $10,000 to $14,999 | 0 | 0.0% |
| $15,000 to $24,999 | 48 | 47.5% |
| $25,000 to $34,999 | 10 | 9.9% |
| $35,000 to $49,999 | 0 | 0.0% |
| $50,000 to $74,999 | 27 | 26.7% |
| $75,000 to $99,999 | 16 | 15.8% |
| $100,000 to $149,999 | 0 | 0.0% |
| $150,000 to $199,999 | 0 | 0.0% |
| $200,000+ | 0 | 0.0% |
Household Income by Householder Age in Fairfield
| Income Bracket | # Households | Median Income |
| 15 to 24 Years | 0 (0.0%) | $0 |
| 25 to 44 Years | 43 (42.6%) | $0 |
| 45 to 64 Years | 58 (57.4%) | $0 |
| 65+ Years | 0 (0.0%) | $0 |
| Total | 101 (100.0%) | $0 |
Poverty in Fairfield
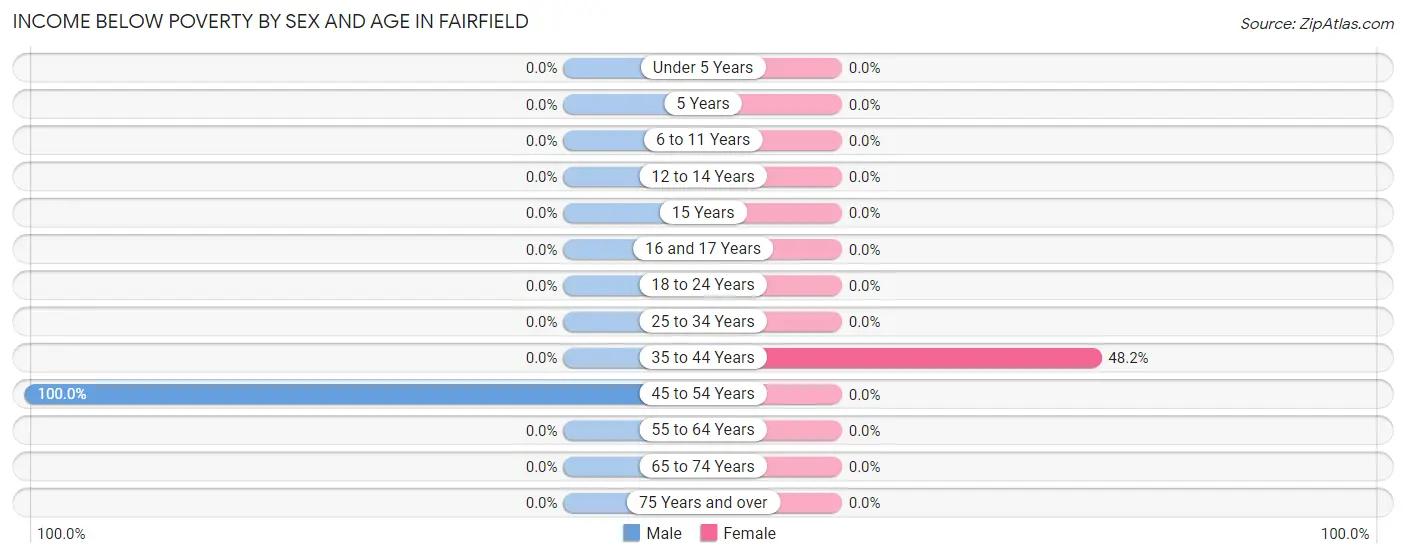
Income Below Poverty by Sex and Age in Fairfield
With 36.9% poverty level for males and 29.4% for females among the residents of Fairfield, 45 to 54 year old males and 35 to 44 year old females are the most vulnerable to poverty, with 48 males (100.0%) and 40 females (48.2%) in their respective age groups living below the poverty level.
| Age Bracket | Male | Female |
| Under 5 Years | 0 (0.0%) | 0 (0.0%) |
| 5 Years | 0 (0.0%) | 0 (0.0%) |
| 6 to 11 Years | 0 (0.0%) | 0 (0.0%) |
| 12 to 14 Years | 0 (0.0%) | 0 (0.0%) |
| 15 Years | 0 (0.0%) | 0 (0.0%) |
| 16 and 17 Years | 0 (0.0%) | 0 (0.0%) |
| 18 to 24 Years | 0 (0.0%) | 0 (0.0%) |
| 25 to 34 Years | 0 (0.0%) | 0 (0.0%) |
| 35 to 44 Years | 0 (0.0%) | 40 (48.2%) |
| 45 to 54 Years | 48 (100.0%) | 0 (0.0%) |
| 55 to 64 Years | 0 (0.0%) | 0 (0.0%) |
| 65 to 74 Years | 0 (0.0%) | 0 (0.0%) |
| 75 Years and over | 0 (0.0%) | 0 (0.0%) |
| Total | 48 (36.9%) | 40 (29.4%) |
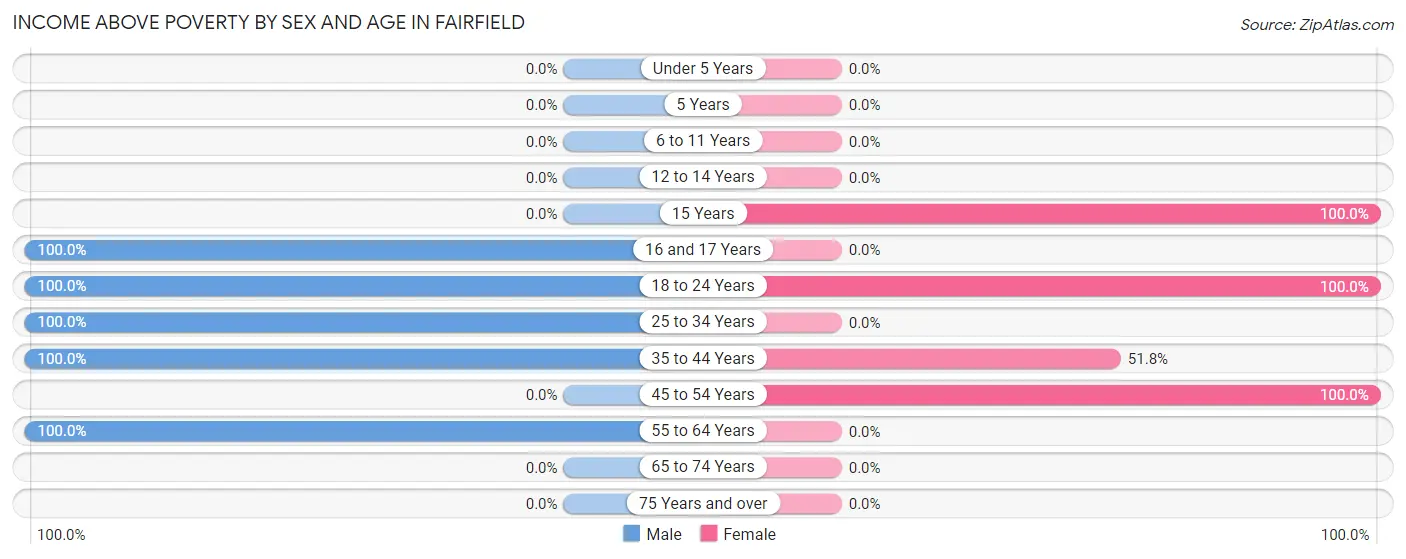
Income Above Poverty by Sex and Age in Fairfield
According to the poverty statistics in Fairfield, males aged 16 and 17 years and females aged 15 years are the age groups that are most secure financially, with 100.0% of males and 100.0% of females in these age groups living above the poverty line.
| Age Bracket | Male | Female |
| Under 5 Years | 0 (0.0%) | 0 (0.0%) |
| 5 Years | 0 (0.0%) | 0 (0.0%) |
| 6 to 11 Years | 0 (0.0%) | 0 (0.0%) |
| 12 to 14 Years | 0 (0.0%) | 0 (0.0%) |
| 15 Years | 0 (0.0%) | 14 (100.0%) |
| 16 and 17 Years | 27 (100.0%) | 0 (0.0%) |
| 18 to 24 Years | 18 (100.0%) | 29 (100.0%) |
| 25 to 34 Years | 11 (100.0%) | 0 (0.0%) |
| 35 to 44 Years | 16 (100.0%) | 43 (51.8%) |
| 45 to 54 Years | 0 (0.0%) | 10 (100.0%) |
| 55 to 64 Years | 10 (100.0%) | 0 (0.0%) |
| 65 to 74 Years | 0 (0.0%) | 0 (0.0%) |
| 75 Years and over | 0 (0.0%) | 0 (0.0%) |
| Total | 82 (63.1%) | 96 (70.6%) |
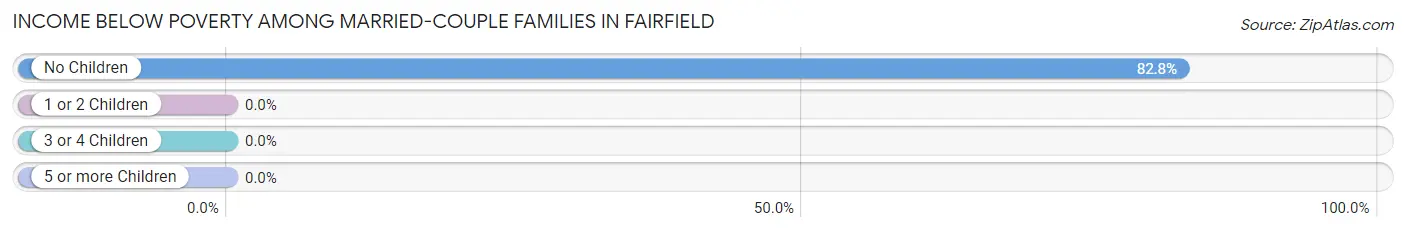
Income Below Poverty Among Married-Couple Families in Fairfield
The poverty statistics for married-couple families in Fairfield show that 64.9% or 48 of the total 74 families live below the poverty line. Families with no children have the highest poverty rate of 82.8%, comprising of 48 families. On the other hand, families with 1 or 2 children have the lowest poverty rate of 0.0%, which includes 0 families.
| Children | Above Poverty | Below Poverty |
| No Children | 10 (17.2%) | 48 (82.8%) |
| 1 or 2 Children | 16 (100.0%) | 0 (0.0%) |
| 3 or 4 Children | 0 (0.0%) | 0 (0.0%) |
| 5 or more Children | 0 (0.0%) | 0 (0.0%) |
| Total | 26 (35.1%) | 48 (64.9%) |
Income Below Poverty Among Single-Parent Households in Fairfield
| Children | Single Father | Single Mother |
| No Children | 0 (0.0%) | 0 (0.0%) |
| 1 or 2 Children | 0 (0.0%) | 0 (0.0%) |
| 3 or 4 Children | 0 (0.0%) | 0 (0.0%) |
| 5 or more Children | 0 (0.0%) | 0 (0.0%) |
| Total | 0 (0.0%) | 0 (0.0%) |
Income Below Poverty Among Married-Couple vs Single-Parent Households in Fairfield
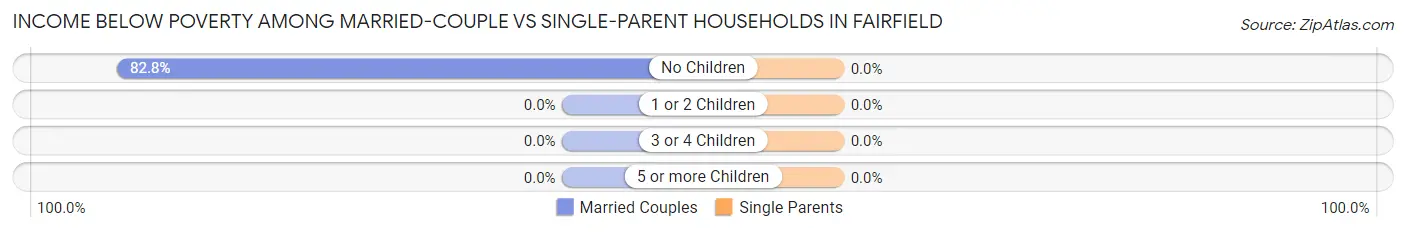
| Children | Married-Couple Families | Single-Parent Households |
| No Children | 48 (82.8%) | 0 (0.0%) |
| 1 or 2 Children | 0 (0.0%) | 0 (0.0%) |
| 3 or 4 Children | 0 (0.0%) | 0 (0.0%) |
| 5 or more Children | 0 (0.0%) | 0 (0.0%) |
| Total | 48 (64.9%) | 0 (0.0%) |
Race in Fairfield
The most populous races in Fairfield are , and White / Caucasian (266 | 100.0%).
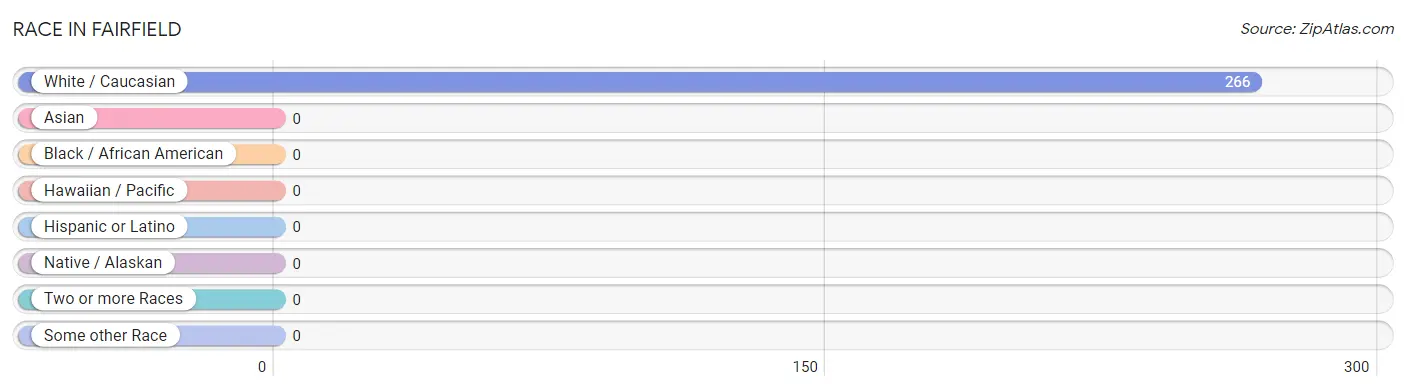
| Race | # Population | % Population |
| Asian | 0 | 0.0% |
| Black / African American | 0 | 0.0% |
| Hawaiian / Pacific | 0 | 0.0% |
| Hispanic or Latino | 0 | 0.0% |
| Native / Alaskan | 0 | 0.0% |
| White / Caucasian | 266 | 100.0% |
| Two or more Races | 0 | 0.0% |
| Some other Race | 0 | 0.0% |
| Total | 266 | 100.0% |
Ancestry in Fairfield

| Ancestry | # Population | % Population | View All 0 Rows |
Immigrants in Fairfield

| Immigration Origin | # Population | % Population | View All 0 Rows |
Sex and Age in Fairfield
Sex and Age in Fairfield
The most populous age groups in Fairfield are 45 to 49 Years (48 | 36.9%) for men and 40 to 44 Years (56 | 41.2%) for women.
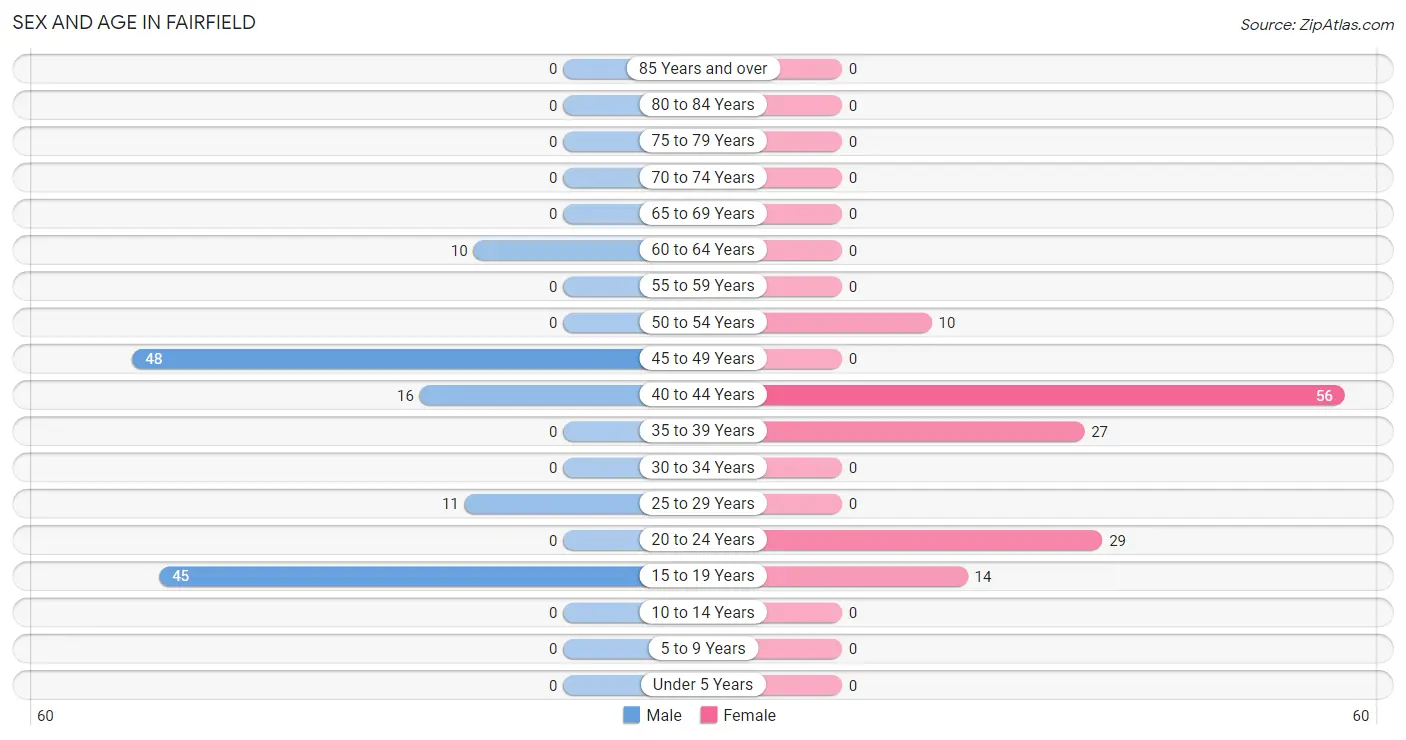
| Age Bracket | Male | Female |
| Under 5 Years | 0 (0.0%) | 0 (0.0%) |
| 5 to 9 Years | 0 (0.0%) | 0 (0.0%) |
| 10 to 14 Years | 0 (0.0%) | 0 (0.0%) |
| 15 to 19 Years | 45 (34.6%) | 14 (10.3%) |
| 20 to 24 Years | 0 (0.0%) | 29 (21.3%) |
| 25 to 29 Years | 11 (8.5%) | 0 (0.0%) |
| 30 to 34 Years | 0 (0.0%) | 0 (0.0%) |
| 35 to 39 Years | 0 (0.0%) | 27 (19.9%) |
| 40 to 44 Years | 16 (12.3%) | 56 (41.2%) |
| 45 to 49 Years | 48 (36.9%) | 0 (0.0%) |
| 50 to 54 Years | 0 (0.0%) | 10 (7.3%) |
| 55 to 59 Years | 0 (0.0%) | 0 (0.0%) |
| 60 to 64 Years | 10 (7.7%) | 0 (0.0%) |
| 65 to 69 Years | 0 (0.0%) | 0 (0.0%) |
| 70 to 74 Years | 0 (0.0%) | 0 (0.0%) |
| 75 to 79 Years | 0 (0.0%) | 0 (0.0%) |
| 80 to 84 Years | 0 (0.0%) | 0 (0.0%) |
| 85 Years and over | 0 (0.0%) | 0 (0.0%) |
| Total | 130 (100.0%) | 136 (100.0%) |
Families and Households in Fairfield
Median Family Size in Fairfield
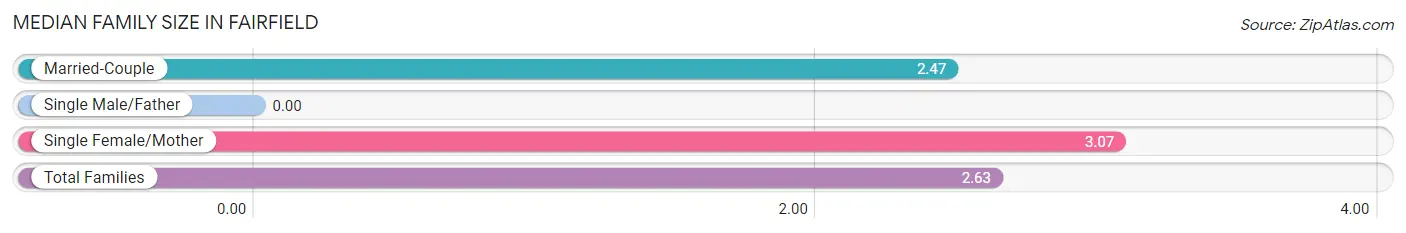
| Family Type | # Families | Family Size |
| Married-Couple | 74 (73.3%) | 2.47 |
| Single Male/Father | 0 (0.0%) | - |
| Single Female/Mother | 27 (26.7%) | 3.07 |
| Total Families | 101 (100.0%) | 2.63 |
Median Household Size in Fairfield
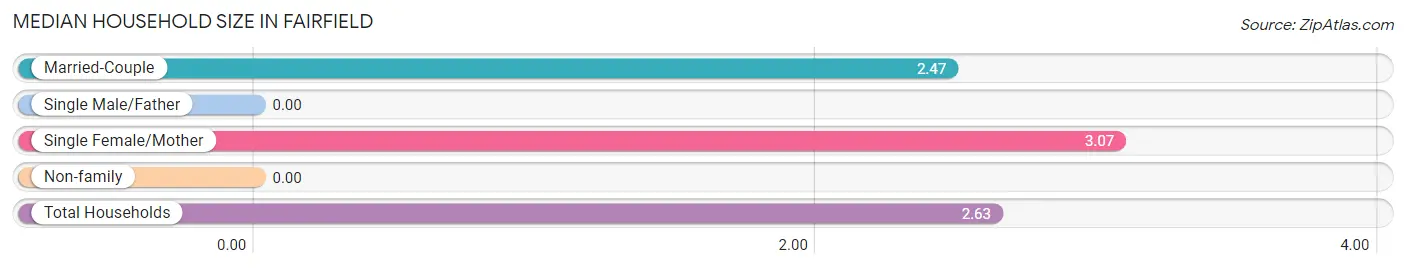
| Household Type | # Households | Household Size |
| Married-Couple | 74 (73.3%) | 2.47 |
| Single Male/Father | 0 (0.0%) | - |
| Single Female/Mother | 27 (26.7%) | 3.07 |
| Non-family | 0 (0.0%) | - |
| Total Households | 101 (100.0%) | 2.63 |
Household Size by Marriage Status in Fairfield
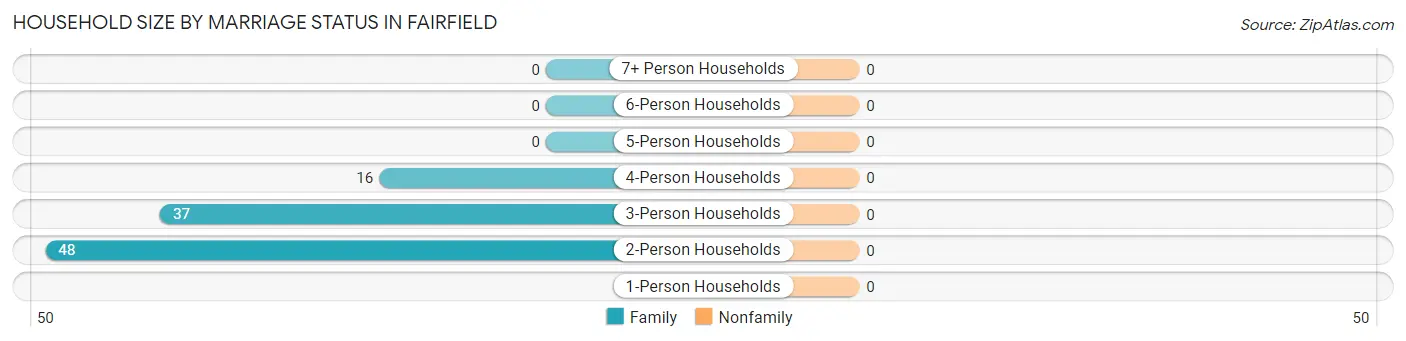
| Household Size | Family Households | Nonfamily Households |
| 1-Person Households | - | 0 (0.0%) |
| 2-Person Households | 48 (47.5%) | 0 (0.0%) |
| 3-Person Households | 37 (36.6%) | 0 (0.0%) |
| 4-Person Households | 16 (15.8%) | 0 (0.0%) |
| 5-Person Households | 0 (0.0%) | 0 (0.0%) |
| 6-Person Households | 0 (0.0%) | 0 (0.0%) |
| 7+ Person Households | 0 (0.0%) | 0 (0.0%) |
| Total | 101 (100.0%) | 0 (0.0%) |
Female Fertility in Fairfield
Fertility by Age in Fairfield
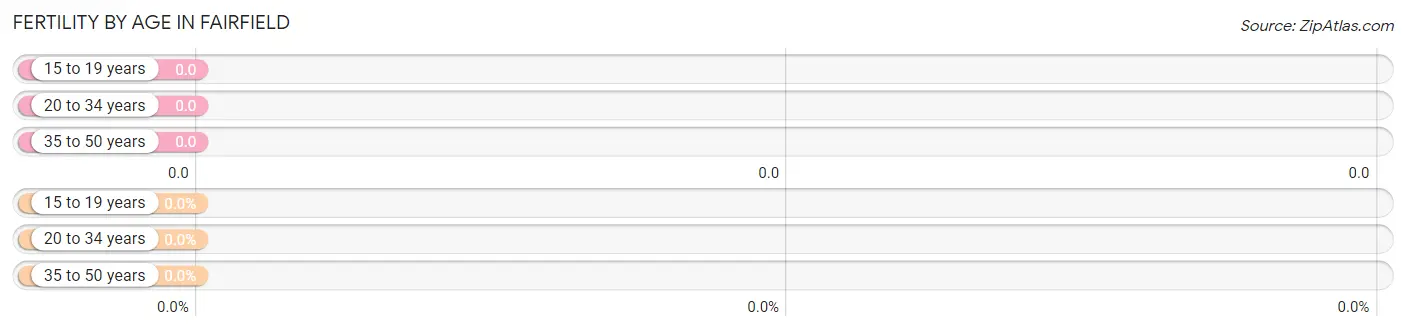
| Age Bracket | Women with Births | Births / 1,000 Women |
| 15 to 19 years | 0 (0.0%) | 0.0 |
| 20 to 34 years | 0 (0.0%) | 0.0 |
| 35 to 50 years | 0 (0.0%) | 0.0 |
| Total | 0 (0.0%) | 0.0 |
Fertility by Age by Marriage Status in Fairfield
| Age Bracket | Married | Unmarried |
| 15 to 19 years | 0 (0.0%) | 0 (0.0%) |
| 20 to 34 years | 0 (0.0%) | 0 (0.0%) |
| 35 to 50 years | 0 (0.0%) | 0 (0.0%) |
| Total | 0 (0.0%) | 0 (0.0%) |
Fertility by Education in Fairfield
| Educational Attainment | Women with Births | Births / 1,000 Women |
| Less than High School | 0 (0.0%) | 0.0 |
| High School Diploma | 0 (0.0%) | 0.0 |
| College or Associate's Degree | 0 (0.0%) | 0.0 |
| Bachelor's Degree | 0 (0.0%) | 0.0 |
| Graduate Degree | 0 (0.0%) | 0.0 |
| Total | 0 (0.0%) | 0.0 |
Fertility by Education by Marriage Status in Fairfield
| Educational Attainment | Married | Unmarried |
| Less than High School | 0 (0.0%) | 0 (0.0%) |
| High School Diploma | 0 (0.0%) | 0 (0.0%) |
| College or Associate's Degree | 0 (0.0%) | 0 (0.0%) |
| Bachelor's Degree | 0 (0.0%) | 0 (0.0%) |
| Graduate Degree | 0 (0.0%) | 0 (0.0%) |
| Total | 0 (0.0%) | 0 (0.0%) |
Employment Characteristics in Fairfield
Employment by Class of Employer in Fairfield
Among the 146 employed individuals in Fairfield, self-employed (incorporated) (64 | 43.8%), private company employees (55 | 37.7%), and state government employees (27 | 18.5%) make up the most common classes of employment.
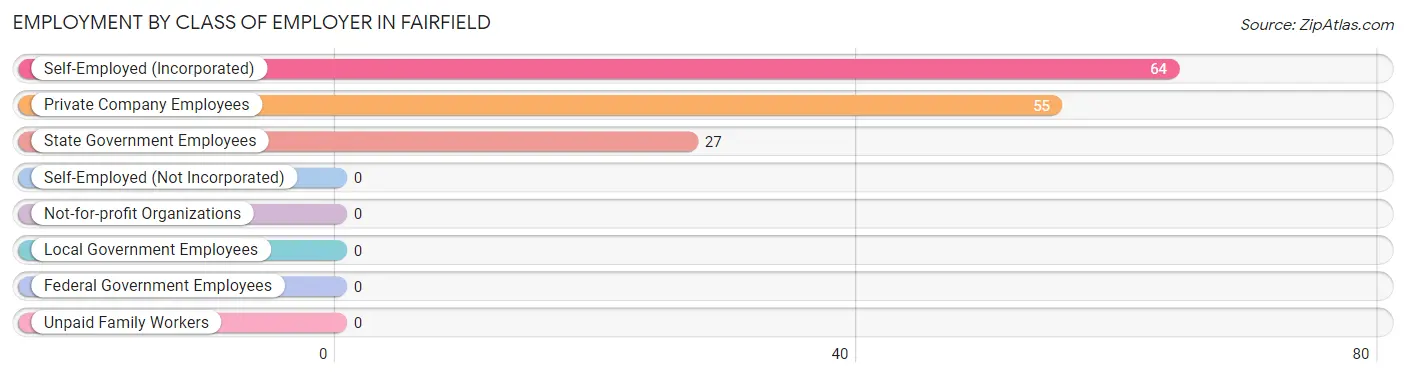
| Employer Class | # Employees | % Employees |
| Private Company Employees | 55 | 37.7% |
| Self-Employed (Incorporated) | 64 | 43.8% |
| Self-Employed (Not Incorporated) | 0 | 0.0% |
| Not-for-profit Organizations | 0 | 0.0% |
| Local Government Employees | 0 | 0.0% |
| State Government Employees | 27 | 18.5% |
| Federal Government Employees | 0 | 0.0% |
| Unpaid Family Workers | 0 | 0.0% |
| Total | 146 | 100.0% |
Employment Status by Age in Fairfield
According to the labor force statistics for Fairfield, out of the total population over 16 years of age (252), 73.8% or 186 individuals are in the labor force, with 21.5% or 40 of them unemployed. The age group with the highest labor force participation rate is 20 to 24 years, with 100.0% or 29 individuals in the labor force. Within the labor force, the 35 to 44 years age range has the highest percentage of unemployed individuals, with 40.4% or 40 of them being unemployed.
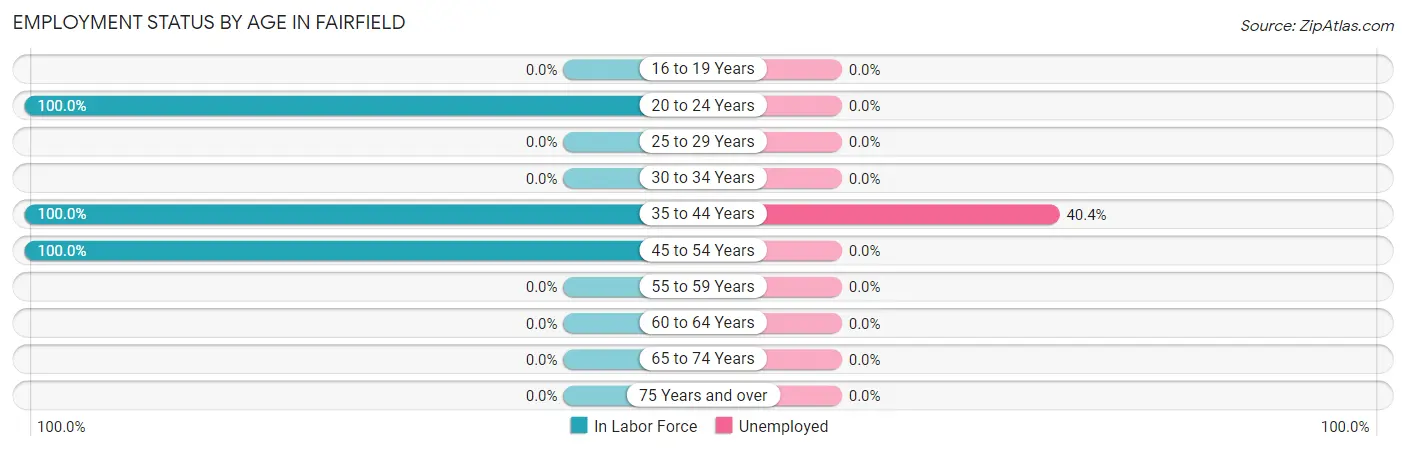
| Age Bracket | In Labor Force | Unemployed |
| 16 to 19 Years | 0 (0.0%) | 0 (0.0%) |
| 20 to 24 Years | 29 (100.0%) | 0 (0.0%) |
| 25 to 29 Years | 0 (0.0%) | 0 (0.0%) |
| 30 to 34 Years | 0 (0.0%) | 0 (0.0%) |
| 35 to 44 Years | 99 (100.0%) | 40 (40.4%) |
| 45 to 54 Years | 58 (100.0%) | 0 (0.0%) |
| 55 to 59 Years | 0 (0.0%) | 0 (0.0%) |
| 60 to 64 Years | 0 (0.0%) | 0 (0.0%) |
| 65 to 74 Years | 0 (0.0%) | 0 (0.0%) |
| 75 Years and over | 0 (0.0%) | 0 (0.0%) |
| Total | 186 (73.8%) | 40 (21.5%) |
Employment Status by Educational Attainment in Fairfield
According to labor force statistics for Fairfield, 88.2% of individuals (157) out of the total population between 25 and 64 years of age (178) are in the labor force, with 25.5% or 40 of them being unemployed. The group with the highest labor force participation rate are those with the educational attainment of college / associate degree, with 100.0% or 59 individuals in the labor force. Within the labor force, individuals with high school diploma education have the highest percentage of unemployment, with 40.8% or 40 of them being unemployed.
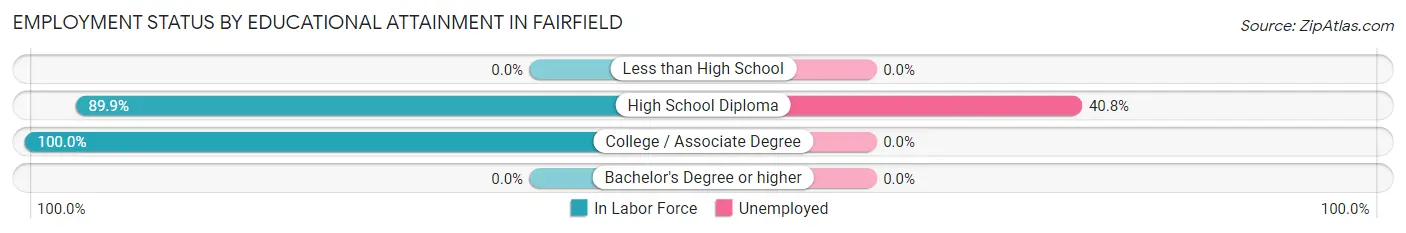
| Educational Attainment | In Labor Force | Unemployed |
| Less than High School | 0 (0.0%) | 0 (0.0%) |
| High School Diploma | 98 (89.9%) | 44 (40.8%) |
| College / Associate Degree | 59 (100.0%) | 0 (0.0%) |
| Bachelor's Degree or higher | 0 (0.0%) | 0 (0.0%) |
| Total | 157 (88.2%) | 45 (25.5%) |
Employment Occupations by Sex in Fairfield
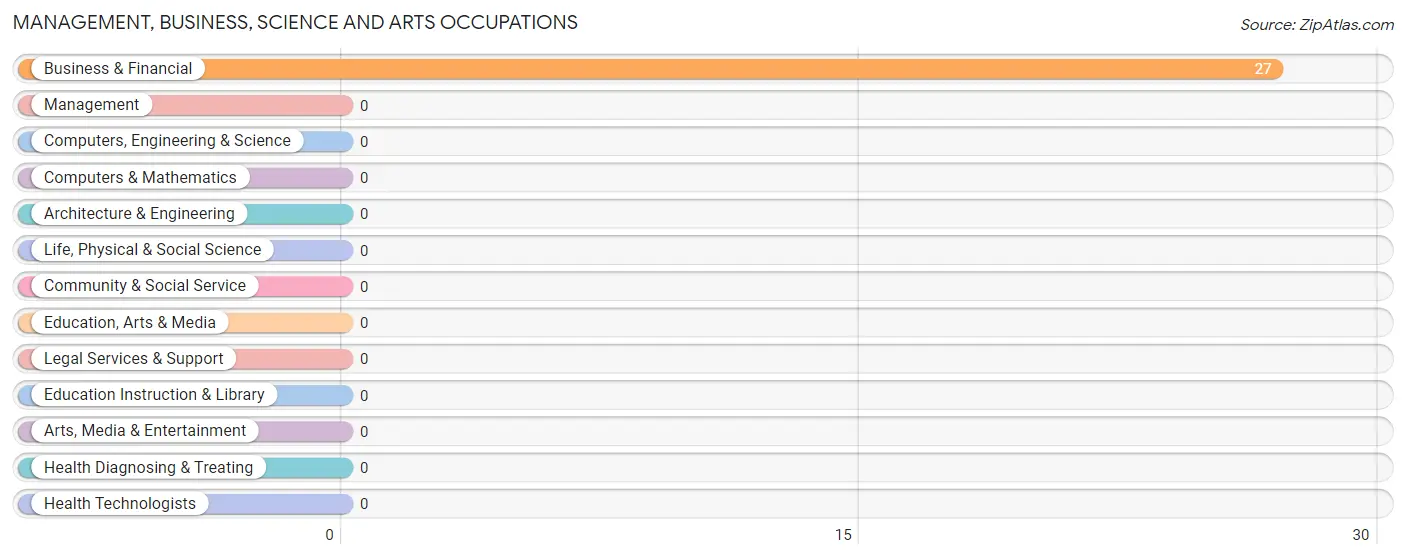
Management, Business, Science and Arts Occupations
The most common Management, Business, Science and Arts occupations in Fairfield are , and Business & Financial (27 | 18.5%).
Management, Business, Science and Arts Occupations by Sex
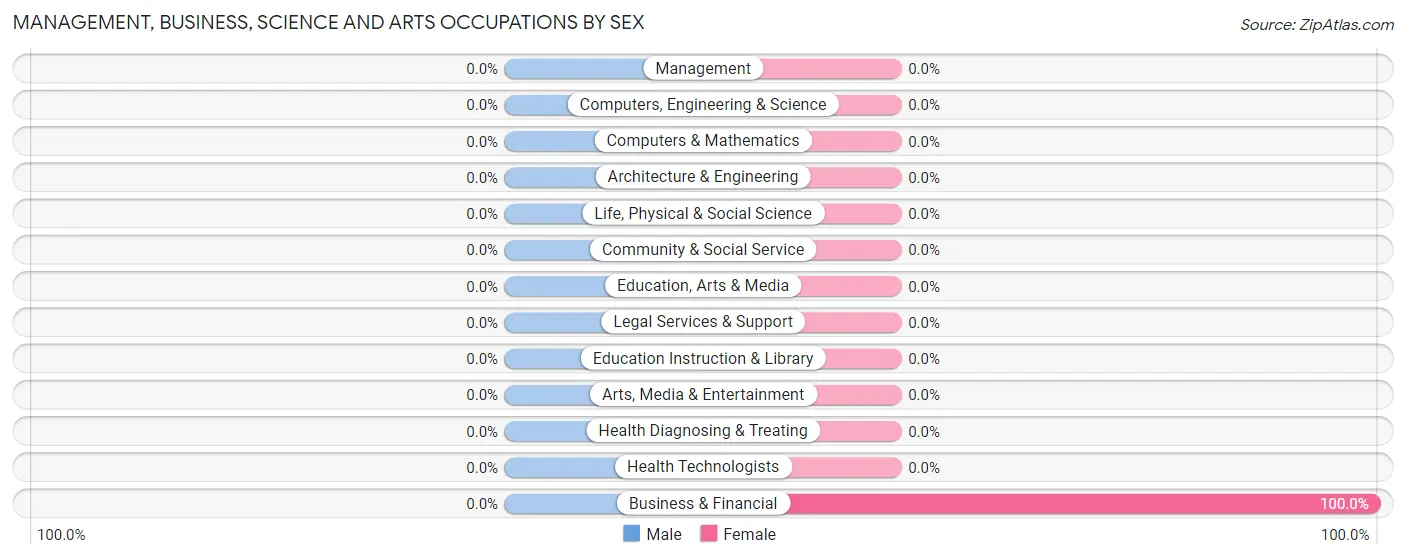
| Occupation | Male | Female |
| Management | 0 (0.0%) | 0 (0.0%) |
| Business & Financial | 0 (0.0%) | 27 (100.0%) |
| Computers, Engineering & Science | 0 (0.0%) | 0 (0.0%) |
| Computers & Mathematics | 0 (0.0%) | 0 (0.0%) |
| Architecture & Engineering | 0 (0.0%) | 0 (0.0%) |
| Life, Physical & Social Science | 0 (0.0%) | 0 (0.0%) |
| Community & Social Service | 0 (0.0%) | 0 (0.0%) |
| Education, Arts & Media | 0 (0.0%) | 0 (0.0%) |
| Legal Services & Support | 0 (0.0%) | 0 (0.0%) |
| Education Instruction & Library | 0 (0.0%) | 0 (0.0%) |
| Arts, Media & Entertainment | 0 (0.0%) | 0 (0.0%) |
| Health Diagnosing & Treating | 0 (0.0%) | 0 (0.0%) |
| Health Technologists | 0 (0.0%) | 0 (0.0%) |
| Total (Category) | 0 (0.0%) | 27 (100.0%) |
| Total (Overall) | 64 (43.8%) | 82 (56.2%) |
Services Occupations
Services Occupations by Sex
| Occupation | Male | Female |
| Healthcare Support | 0 (0.0%) | 0 (0.0%) |
| Security & Protection | 0 (0.0%) | 0 (0.0%) |
| Firefighting & Prevention | 0 (0.0%) | 0 (0.0%) |
| Law Enforcement | 0 (0.0%) | 0 (0.0%) |
| Food Preparation & Serving | 0 (0.0%) | 0 (0.0%) |
| Cleaning & Maintenance | 0 (0.0%) | 0 (0.0%) |
| Personal Care & Service | 0 (0.0%) | 0 (0.0%) |
| Total (Category) | 0 (0.0%) | 0 (0.0%) |
| Total (Overall) | 64 (43.8%) | 82 (56.2%) |
Sales and Office Occupations
The most common Sales and Office occupations in Fairfield are Sales & Related (39 | 26.7%), and Office & Administration (16 | 11.0%).
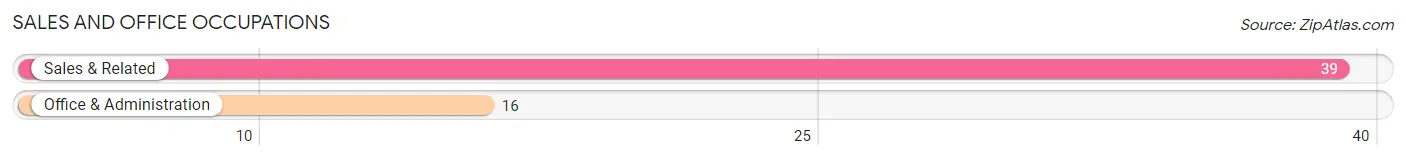
Sales and Office Occupations by Sex
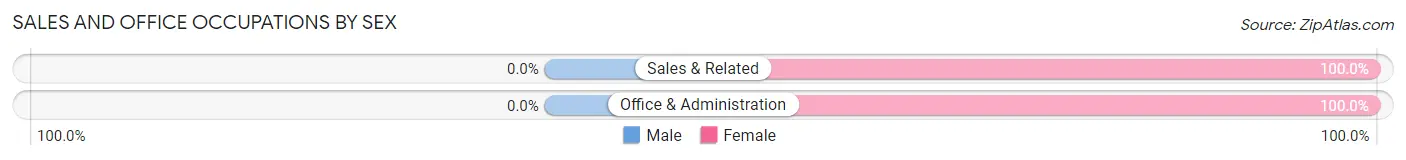
| Occupation | Male | Female |
| Sales & Related | 0 (0.0%) | 39 (100.0%) |
| Office & Administration | 0 (0.0%) | 16 (100.0%) |
| Total (Category) | 0 (0.0%) | 55 (100.0%) |
| Total (Overall) | 64 (43.8%) | 82 (56.2%) |
Natural Resources, Construction and Maintenance Occupations
Natural Resources, Construction and Maintenance Occupations by Sex
| Occupation | Male | Female |
| Farming, Fishing & Forestry | 0 (0.0%) | 0 (0.0%) |
| Construction & Extraction | 0 (0.0%) | 0 (0.0%) |
| Installation, Maintenance & Repair | 0 (0.0%) | 0 (0.0%) |
| Total (Category) | 0 (0.0%) | 0 (0.0%) |
| Total (Overall) | 64 (43.8%) | 82 (56.2%) |
Production, Transportation and Moving Occupations
The most common Production, Transportation and Moving occupations in Fairfield are Material Moving (48 | 32.9%), and Production (16 | 11.0%).
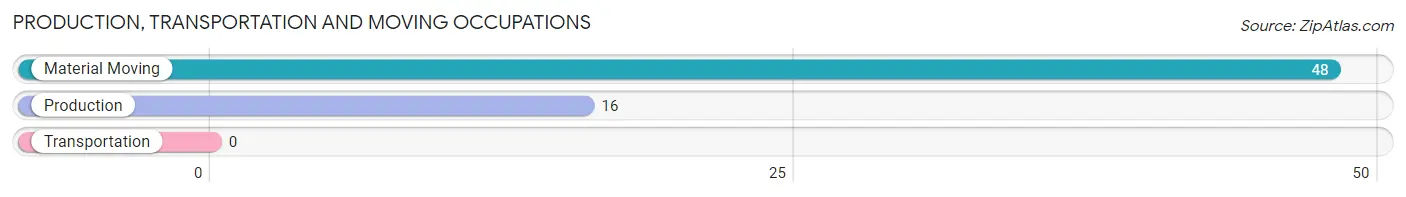
Production, Transportation and Moving Occupations by Sex
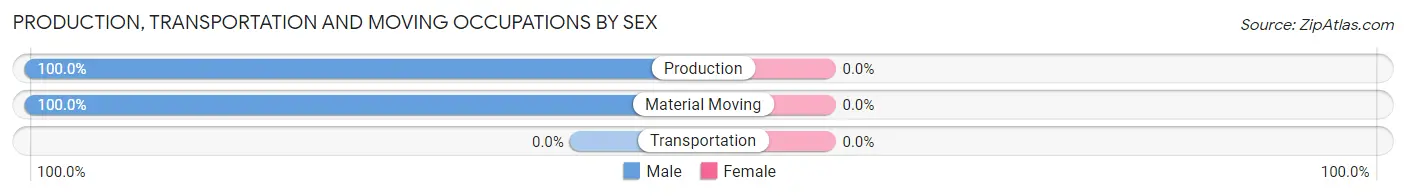
| Occupation | Male | Female |
| Production | 16 (100.0%) | 0 (0.0%) |
| Transportation | 0 (0.0%) | 0 (0.0%) |
| Material Moving | 48 (100.0%) | 0 (0.0%) |
| Total (Category) | 64 (100.0%) | 0 (0.0%) |
| Total (Overall) | 64 (43.8%) | 82 (56.2%) |
Employment Industries by Sex in Fairfield
Employment Industries in Fairfield
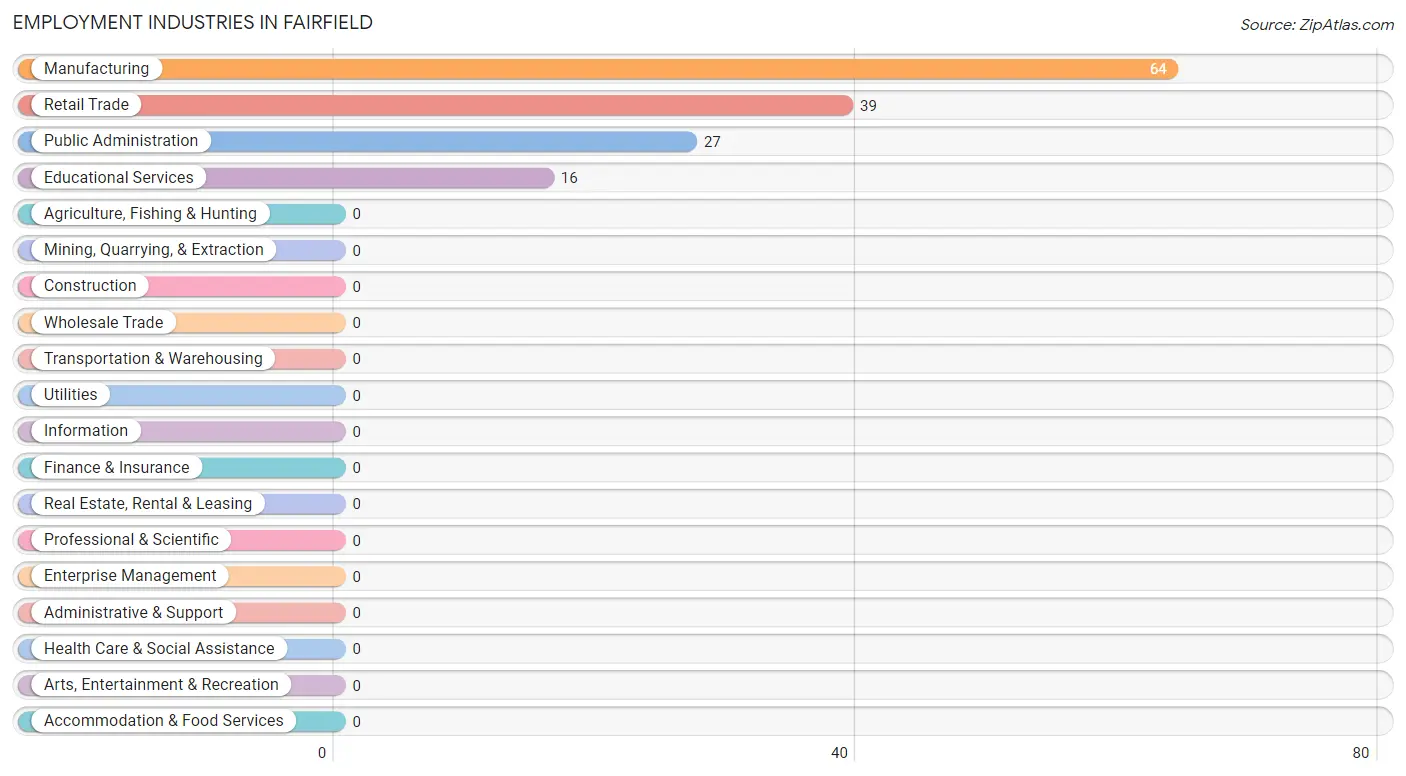
The major employment industries in Fairfield include Manufacturing (64 | 43.8%), Retail Trade (39 | 26.7%), Public Administration (27 | 18.5%), and Educational Services (16 | 11.0%).
Employment Industries by Sex in Fairfield
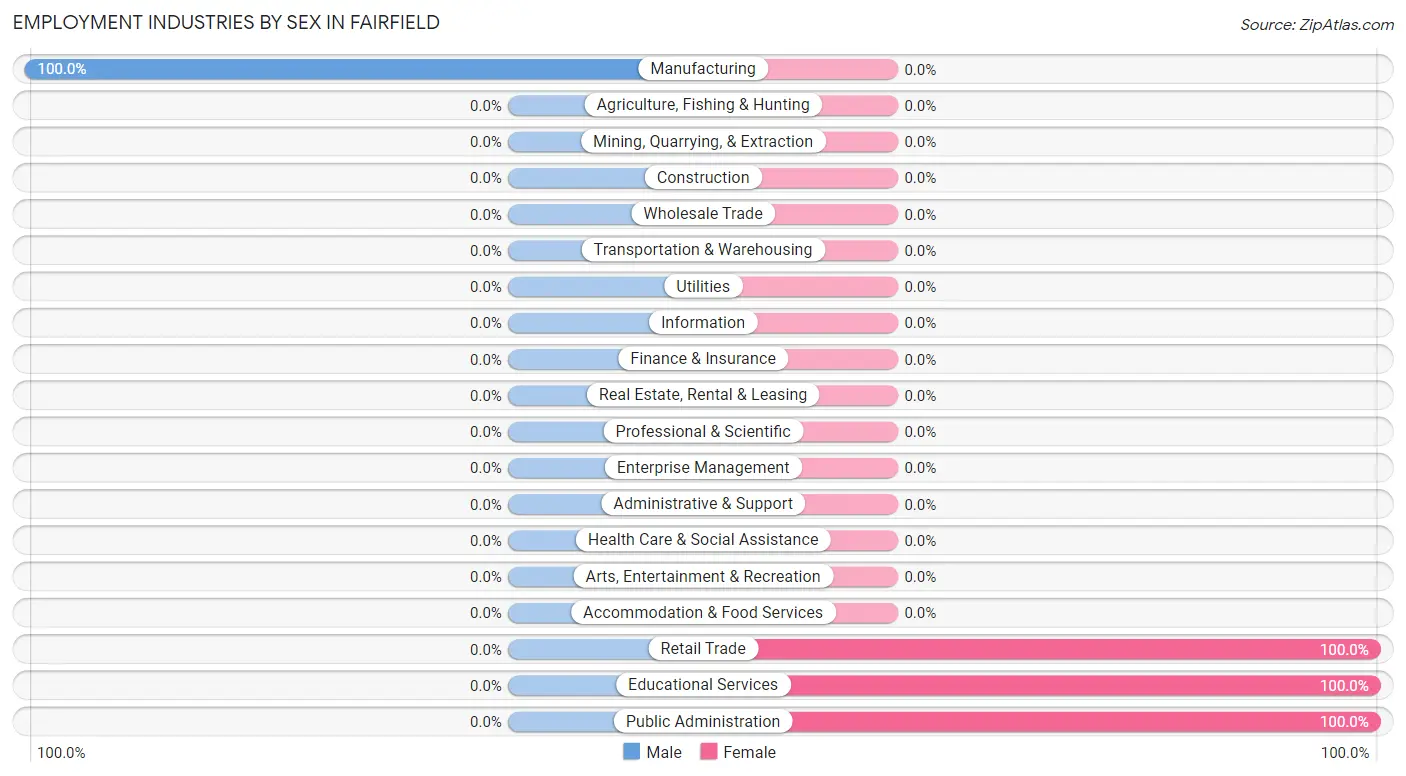
| Industry | Male | Female |
| Agriculture, Fishing & Hunting | 0 (0.0%) | 0 (0.0%) |
| Mining, Quarrying, & Extraction | 0 (0.0%) | 0 (0.0%) |
| Construction | 0 (0.0%) | 0 (0.0%) |
| Manufacturing | 64 (100.0%) | 0 (0.0%) |
| Wholesale Trade | 0 (0.0%) | 0 (0.0%) |
| Retail Trade | 0 (0.0%) | 39 (100.0%) |
| Transportation & Warehousing | 0 (0.0%) | 0 (0.0%) |
| Utilities | 0 (0.0%) | 0 (0.0%) |
| Information | 0 (0.0%) | 0 (0.0%) |
| Finance & Insurance | 0 (0.0%) | 0 (0.0%) |
| Real Estate, Rental & Leasing | 0 (0.0%) | 0 (0.0%) |
| Professional & Scientific | 0 (0.0%) | 0 (0.0%) |
| Enterprise Management | 0 (0.0%) | 0 (0.0%) |
| Administrative & Support | 0 (0.0%) | 0 (0.0%) |
| Educational Services | 0 (0.0%) | 16 (100.0%) |
| Health Care & Social Assistance | 0 (0.0%) | 0 (0.0%) |
| Arts, Entertainment & Recreation | 0 (0.0%) | 0 (0.0%) |
| Accommodation & Food Services | 0 (0.0%) | 0 (0.0%) |
| Public Administration | 0 (0.0%) | 27 (100.0%) |
| Total | 64 (43.8%) | 82 (56.2%) |
Education in Fairfield
School Enrollment in Fairfield
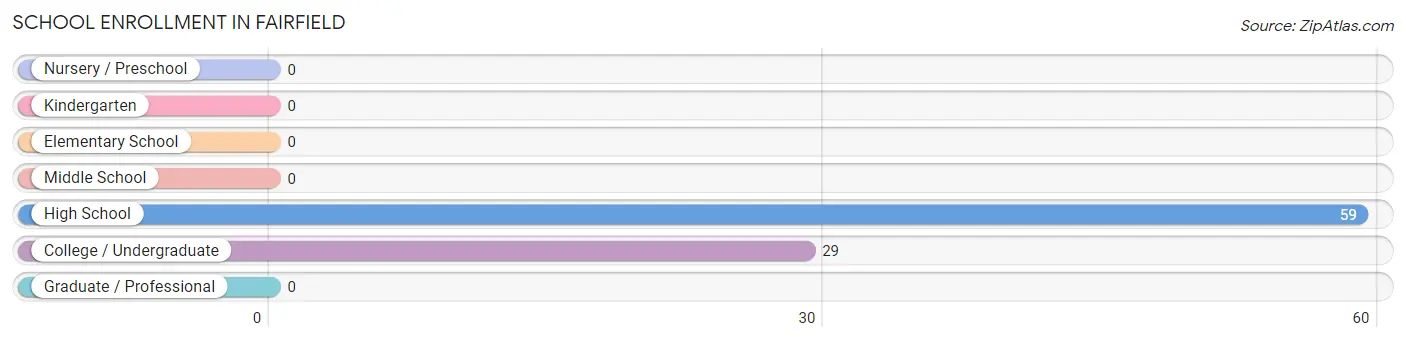
The most common levels of schooling among the 88 students in Fairfield are high school (59 | 67.0%), and college / undergraduate (29 | 33.0%).
| School Level | # Students | % Students |
| Nursery / Preschool | 0 | 0.0% |
| Kindergarten | 0 | 0.0% |
| Elementary School | 0 | 0.0% |
| Middle School | 0 | 0.0% |
| High School | 59 | 67.0% |
| College / Undergraduate | 29 | 33.0% |
| Graduate / Professional | 0 | 0.0% |
| Total | 88 | 100.0% |
School Enrollment by Age by Funding Source in Fairfield
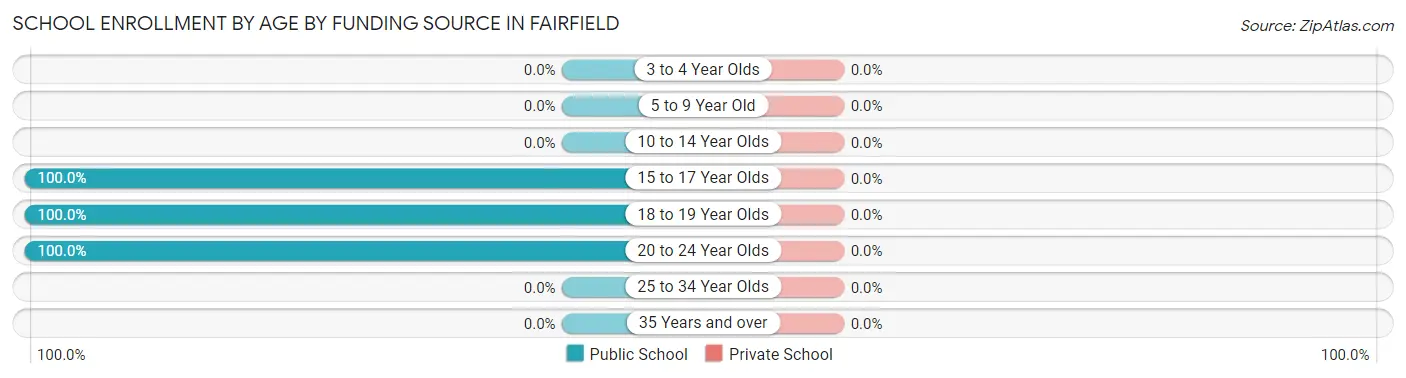
| Age Bracket | Public School | Private School |
| 3 to 4 Year Olds | 0 (0.0%) | 0 (0.0%) |
| 5 to 9 Year Old | 0 (0.0%) | 0 (0.0%) |
| 10 to 14 Year Olds | 0 (0.0%) | 0 (0.0%) |
| 15 to 17 Year Olds | 41 (100.0%) | 0 (0.0%) |
| 18 to 19 Year Olds | 18 (100.0%) | 0 (0.0%) |
| 20 to 24 Year Olds | 29 (100.0%) | 0 (0.0%) |
| 25 to 34 Year Olds | 0 (0.0%) | 0 (0.0%) |
| 35 Years and over | 0 (0.0%) | 0 (0.0%) |
| Total | 88 (100.0%) | 0 (0.0%) |
Educational Attainment by Field of Study in Fairfield
| Field of Study | # Graduates | % Graduates |
| Computers & Mathematics | 0 | 0.0% |
| Bio, Nature & Agricultural | 0 | 0.0% |
| Physical & Health Sciences | 0 | 0.0% |
| Psychology | 0 | 0.0% |
| Social Sciences | 0 | 0.0% |
| Engineering | 0 | 0.0% |
| Multidisciplinary Studies | 0 | 0.0% |
| Science & Technology | 0 | 0.0% |
| Business | 0 | 0.0% |
| Education | 0 | 0.0% |
| Literature & Languages | 0 | 0.0% |
| Liberal Arts & History | 0 | 0.0% |
| Visual & Performing Arts | 0 | 0.0% |
| Communications | 0 | 0.0% |
| Arts & Humanities | 0 | 0.0% |
| Total | 0 | 0.0% |
Transportation & Commute in Fairfield
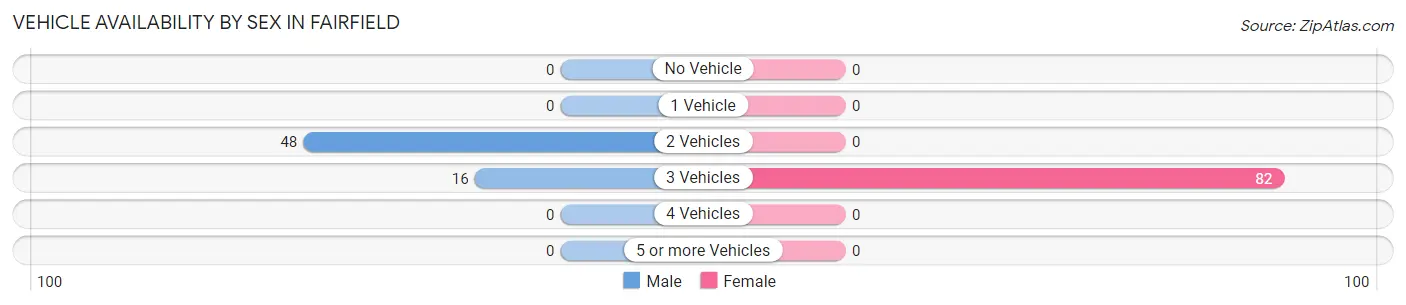
Vehicle Availability by Sex in Fairfield
The most prevalent vehicle ownership categories in Fairfield are males with 2 vehicles (48, accounting for 75.0%) and females with 2 vehicles (0, making up 58.5%).
| Vehicles Available | Male | Female |
| No Vehicle | 0 (0.0%) | 0 (0.0%) |
| 1 Vehicle | 0 (0.0%) | 0 (0.0%) |
| 2 Vehicles | 48 (75.0%) | 0 (0.0%) |
| 3 Vehicles | 16 (25.0%) | 82 (100.0%) |
| 4 Vehicles | 0 (0.0%) | 0 (0.0%) |
| 5 or more Vehicles | 0 (0.0%) | 0 (0.0%) |
| Total | 64 (100.0%) | 82 (100.0%) |
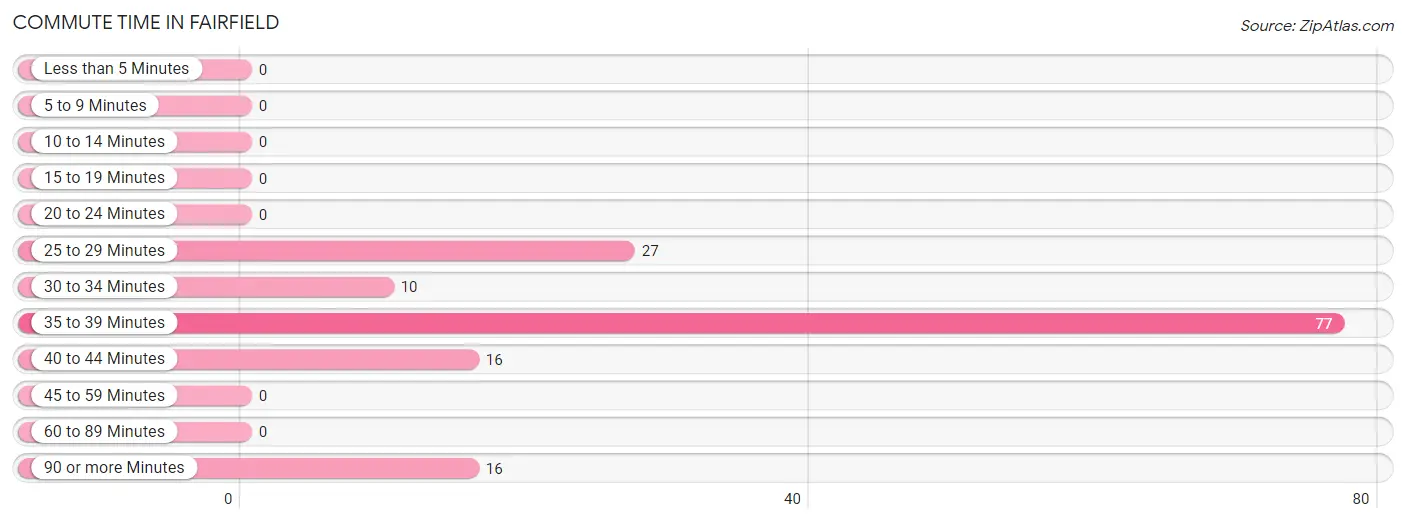
Commute Time in Fairfield
The most frequently occuring commute durations in Fairfield are 35 to 39 minutes (77 commuters, 52.7%), 25 to 29 minutes (27 commuters, 18.5%), and 40 to 44 minutes (16 commuters, 11.0%).
| Commute Time | # Commuters | % Commuters |
| Less than 5 Minutes | 0 | 0.0% |
| 5 to 9 Minutes | 0 | 0.0% |
| 10 to 14 Minutes | 0 | 0.0% |
| 15 to 19 Minutes | 0 | 0.0% |
| 20 to 24 Minutes | 0 | 0.0% |
| 25 to 29 Minutes | 27 | 18.5% |
| 30 to 34 Minutes | 10 | 6.9% |
| 35 to 39 Minutes | 77 | 52.7% |
| 40 to 44 Minutes | 16 | 11.0% |
| 45 to 59 Minutes | 0 | 0.0% |
| 60 to 89 Minutes | 0 | 0.0% |
| 90 or more Minutes | 16 | 11.0% |
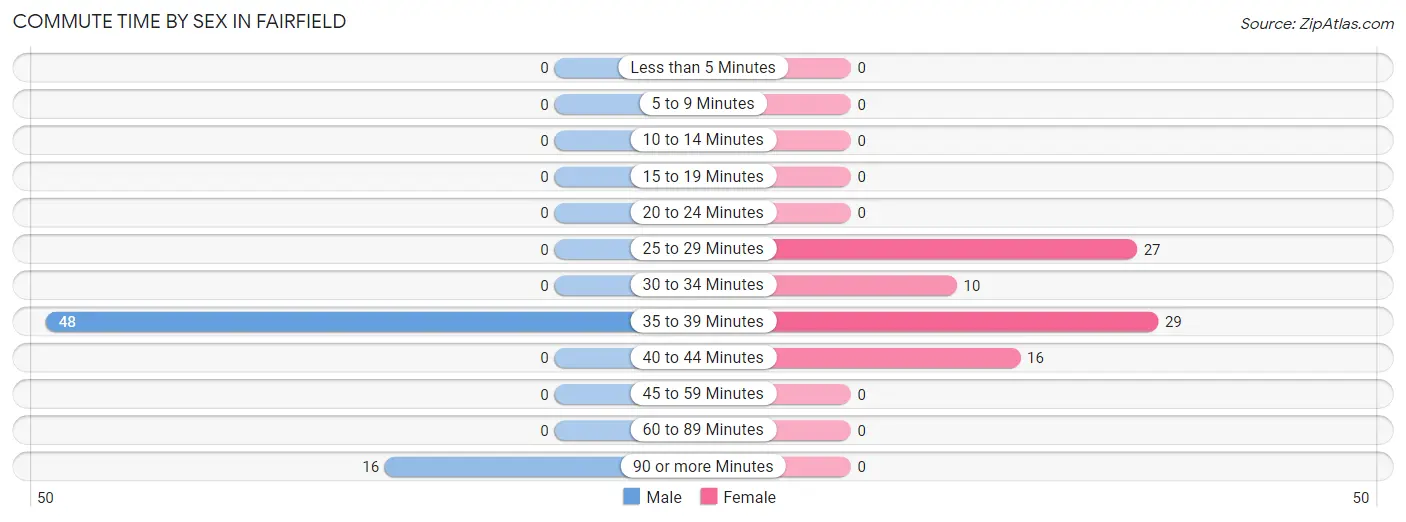
Commute Time by Sex in Fairfield
The most common commute times in Fairfield are 35 to 39 minutes (48 commuters, 75.0%) for males and 35 to 39 minutes (29 commuters, 35.4%) for females.
| Commute Time | Male | Female |
| Less than 5 Minutes | 0 (0.0%) | 0 (0.0%) |
| 5 to 9 Minutes | 0 (0.0%) | 0 (0.0%) |
| 10 to 14 Minutes | 0 (0.0%) | 0 (0.0%) |
| 15 to 19 Minutes | 0 (0.0%) | 0 (0.0%) |
| 20 to 24 Minutes | 0 (0.0%) | 0 (0.0%) |
| 25 to 29 Minutes | 0 (0.0%) | 27 (32.9%) |
| 30 to 34 Minutes | 0 (0.0%) | 10 (12.2%) |
| 35 to 39 Minutes | 48 (75.0%) | 29 (35.4%) |
| 40 to 44 Minutes | 0 (0.0%) | 16 (19.5%) |
| 45 to 59 Minutes | 0 (0.0%) | 0 (0.0%) |
| 60 to 89 Minutes | 0 (0.0%) | 0 (0.0%) |
| 90 or more Minutes | 16 (25.0%) | 0 (0.0%) |
Time of Departure to Work by Sex in Fairfield
The most frequent times of departure to work in Fairfield are 6:30 AM to 6:59 AM (48, 75.0%) for males and 7:00 AM to 7:29 AM (45, 54.9%) for females.
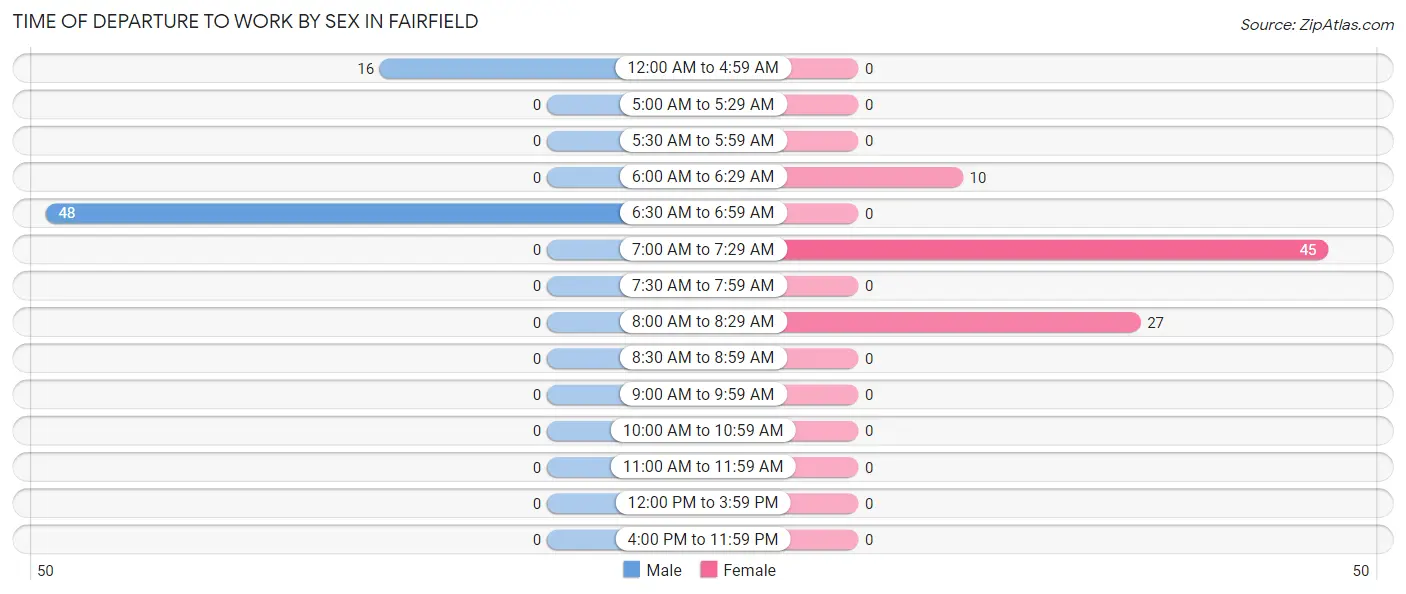
| Time of Departure | Male | Female |
| 12:00 AM to 4:59 AM | 16 (25.0%) | 0 (0.0%) |
| 5:00 AM to 5:29 AM | 0 (0.0%) | 0 (0.0%) |
| 5:30 AM to 5:59 AM | 0 (0.0%) | 0 (0.0%) |
| 6:00 AM to 6:29 AM | 0 (0.0%) | 10 (12.2%) |
| 6:30 AM to 6:59 AM | 48 (75.0%) | 0 (0.0%) |
| 7:00 AM to 7:29 AM | 0 (0.0%) | 45 (54.9%) |
| 7:30 AM to 7:59 AM | 0 (0.0%) | 0 (0.0%) |
| 8:00 AM to 8:29 AM | 0 (0.0%) | 27 (32.9%) |
| 8:30 AM to 8:59 AM | 0 (0.0%) | 0 (0.0%) |
| 9:00 AM to 9:59 AM | 0 (0.0%) | 0 (0.0%) |
| 10:00 AM to 10:59 AM | 0 (0.0%) | 0 (0.0%) |
| 11:00 AM to 11:59 AM | 0 (0.0%) | 0 (0.0%) |
| 12:00 PM to 3:59 PM | 0 (0.0%) | 0 (0.0%) |
| 4:00 PM to 11:59 PM | 0 (0.0%) | 0 (0.0%) |
| Total | 64 (100.0%) | 82 (100.0%) |
Housing Occupancy in Fairfield
Occupancy by Ownership in Fairfield
Of the total 101 dwellings in Fairfield, owner-occupied units account for 53 (52.5%), while renter-occupied units make up 48 (47.5%).
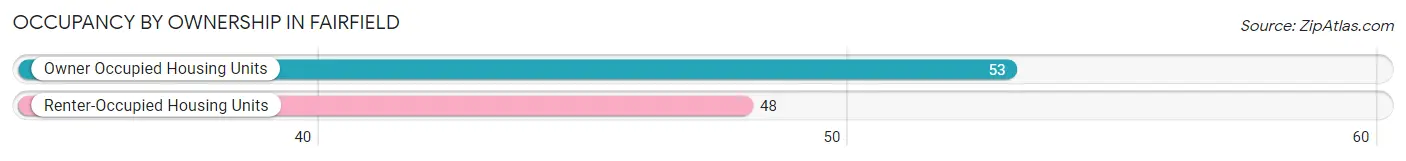
| Occupancy | # Housing Units | % Housing Units |
| Owner Occupied Housing Units | 53 | 52.5% |
| Renter-Occupied Housing Units | 48 | 47.5% |
| Total Occupied Housing Units | 101 | 100.0% |
Occupancy by Household Size in Fairfield
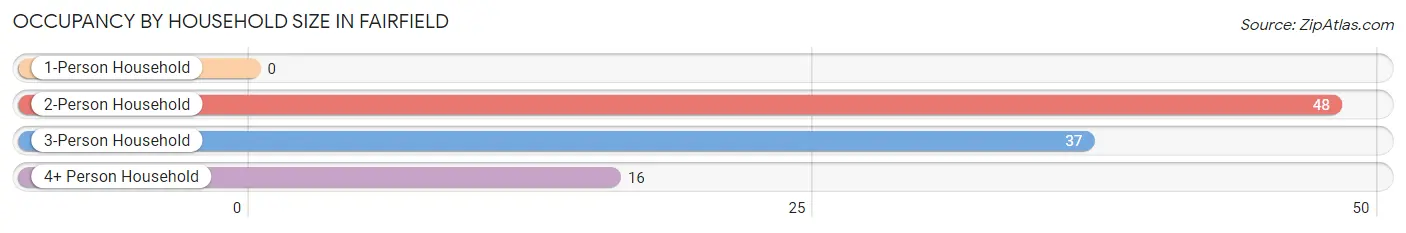
| Household Size | # Housing Units | % Housing Units |
| 1-Person Household | 0 | 0.0% |
| 2-Person Household | 48 | 47.5% |
| 3-Person Household | 37 | 36.6% |
| 4+ Person Household | 16 | 15.8% |
| Total Housing Units | 101 | 100.0% |
Occupancy by Ownership by Household Size in Fairfield
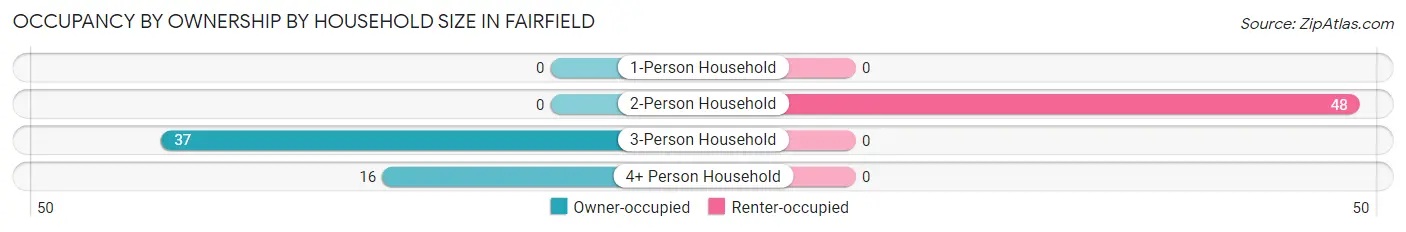
| Household Size | Owner-occupied | Renter-occupied |
| 1-Person Household | 0 (0.0%) | 0 (0.0%) |
| 2-Person Household | 0 (0.0%) | 48 (100.0%) |
| 3-Person Household | 37 (100.0%) | 0 (0.0%) |
| 4+ Person Household | 16 (100.0%) | 0 (0.0%) |
| Total Housing Units | 53 (52.5%) | 48 (47.5%) |
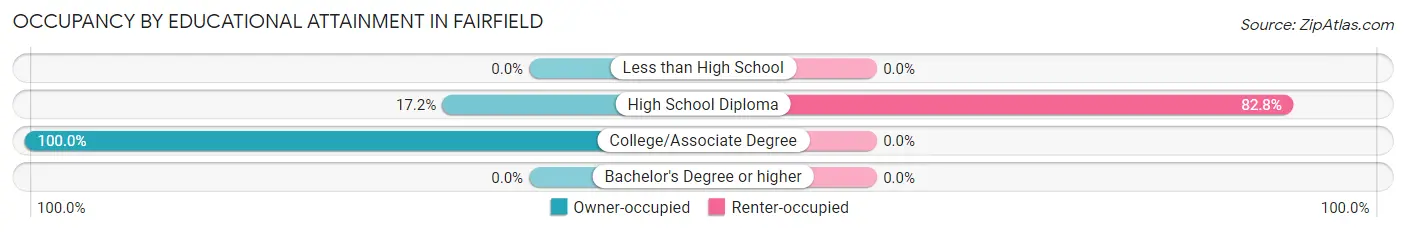
Occupancy by Educational Attainment in Fairfield
| Household Size | Owner-occupied | Renter-occupied |
| Less than High School | 0 (0.0%) | 0 (0.0%) |
| High School Diploma | 10 (17.2%) | 48 (82.8%) |
| College/Associate Degree | 43 (100.0%) | 0 (0.0%) |
| Bachelor's Degree or higher | 0 (0.0%) | 0 (0.0%) |
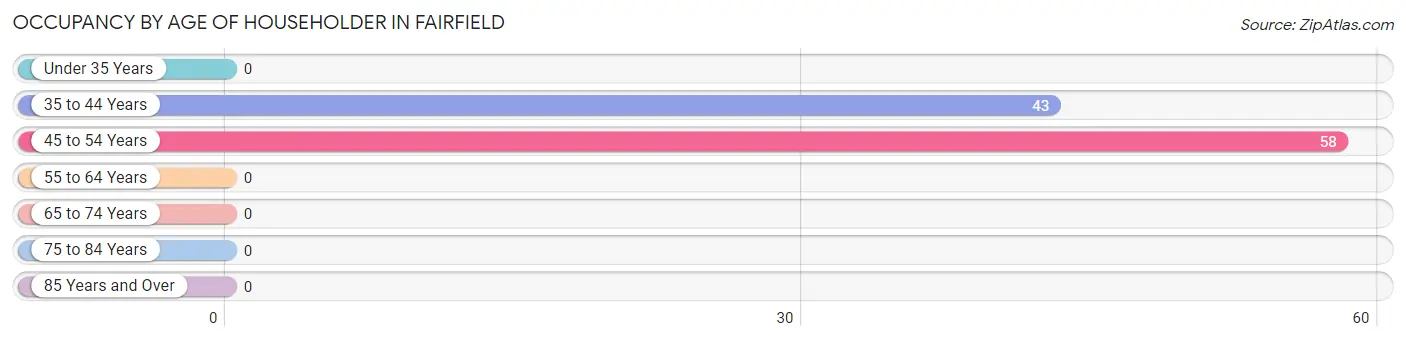
Occupancy by Age of Householder in Fairfield
| Age Bracket | # Households | % Households |
| Under 35 Years | 0 | 0.0% |
| 35 to 44 Years | 43 | 42.6% |
| 45 to 54 Years | 58 | 57.4% |
| 55 to 64 Years | 0 | 0.0% |
| 65 to 74 Years | 0 | 0.0% |
| 75 to 84 Years | 0 | 0.0% |
| 85 Years and Over | 0 | 0.0% |
| Total | 101 | 100.0% |
Housing Finances in Fairfield
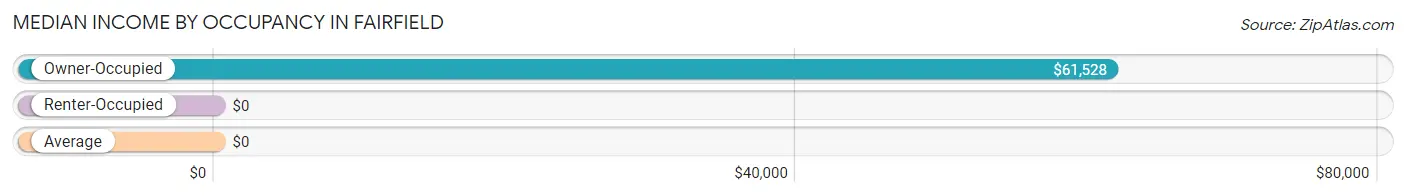
Median Income by Occupancy in Fairfield
| Occupancy Type | # Households | Median Income |
| Owner-Occupied | 53 (52.5%) | $61,528 |
| Renter-Occupied | 48 (47.5%) | $0 |
| Average | 101 (100.0%) | $0 |
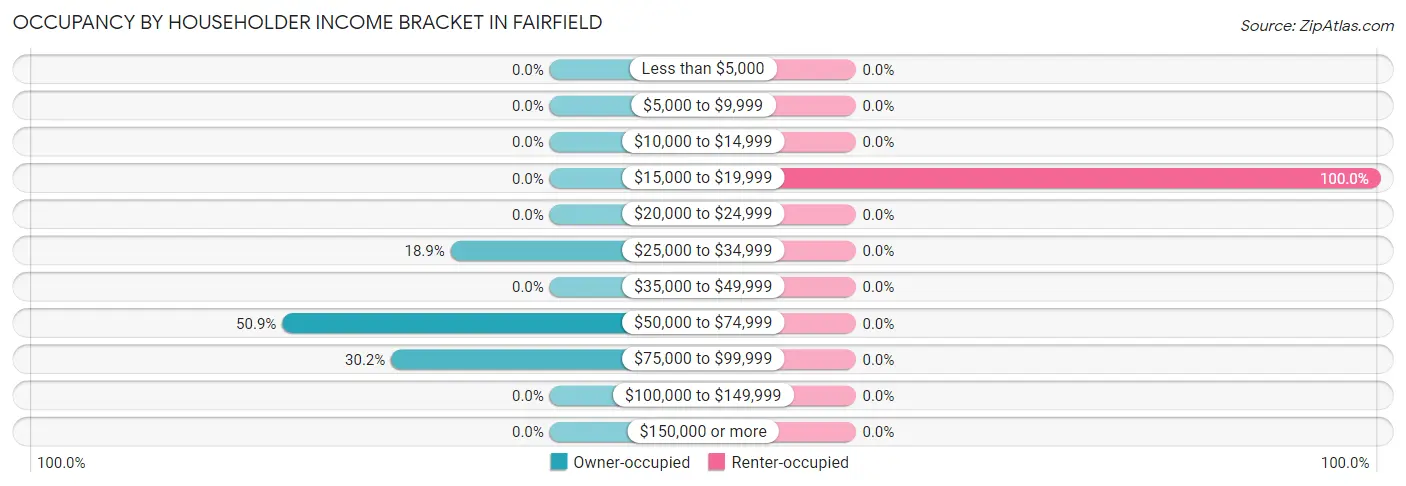
Occupancy by Householder Income Bracket in Fairfield
| Income Bracket | Owner-occupied | Renter-occupied |
| Less than $5,000 | 0 (0.0%) | 0 (0.0%) |
| $5,000 to $9,999 | 0 (0.0%) | 0 (0.0%) |
| $10,000 to $14,999 | 0 (0.0%) | 0 (0.0%) |
| $15,000 to $19,999 | 0 (0.0%) | 48 (100.0%) |
| $20,000 to $24,999 | 0 (0.0%) | 0 (0.0%) |
| $25,000 to $34,999 | 10 (18.9%) | 0 (0.0%) |
| $35,000 to $49,999 | 0 (0.0%) | 0 (0.0%) |
| $50,000 to $74,999 | 27 (50.9%) | 0 (0.0%) |
| $75,000 to $99,999 | 16 (30.2%) | 0 (0.0%) |
| $100,000 to $149,999 | 0 (0.0%) | 0 (0.0%) |
| $150,000 or more | 0 (0.0%) | 0 (0.0%) |
| Total | 53 (100.0%) | 48 (100.0%) |
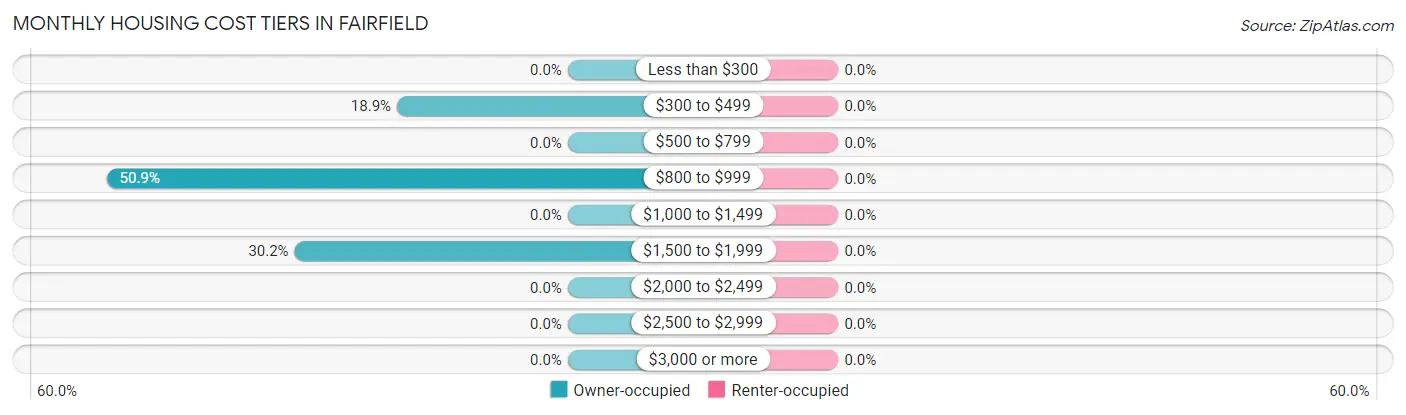
Monthly Housing Cost Tiers in Fairfield
| Monthly Cost | Owner-occupied | Renter-occupied |
| Less than $300 | 0 (0.0%) | 0 (0.0%) |
| $300 to $499 | 10 (18.9%) | 0 (0.0%) |
| $500 to $799 | 0 (0.0%) | 0 (0.0%) |
| $800 to $999 | 27 (50.9%) | 0 (0.0%) |
| $1,000 to $1,499 | 0 (0.0%) | 0 (0.0%) |
| $1,500 to $1,999 | 16 (30.2%) | 0 (0.0%) |
| $2,000 to $2,499 | 0 (0.0%) | 0 (0.0%) |
| $2,500 to $2,999 | 0 (0.0%) | 0 (0.0%) |
| $3,000 or more | 0 (0.0%) | 0 (0.0%) |
| Total | 53 (100.0%) | 48 (100.0%) |
Physical Housing Characteristics in Fairfield
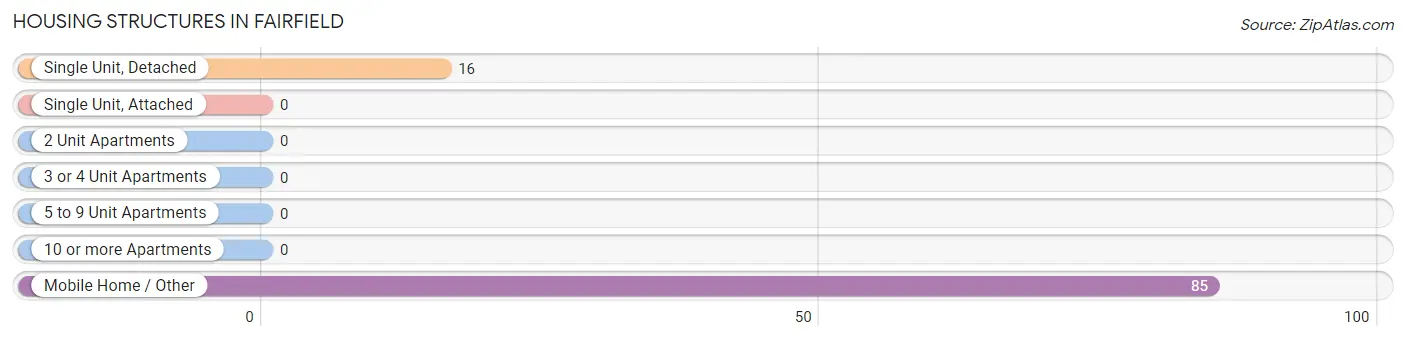
Housing Structures in Fairfield
| Structure Type | # Housing Units | % Housing Units |
| Single Unit, Detached | 16 | 15.8% |
| Single Unit, Attached | 0 | 0.0% |
| 2 Unit Apartments | 0 | 0.0% |
| 3 or 4 Unit Apartments | 0 | 0.0% |
| 5 to 9 Unit Apartments | 0 | 0.0% |
| 10 or more Apartments | 0 | 0.0% |
| Mobile Home / Other | 85 | 84.2% |
| Total | 101 | 100.0% |
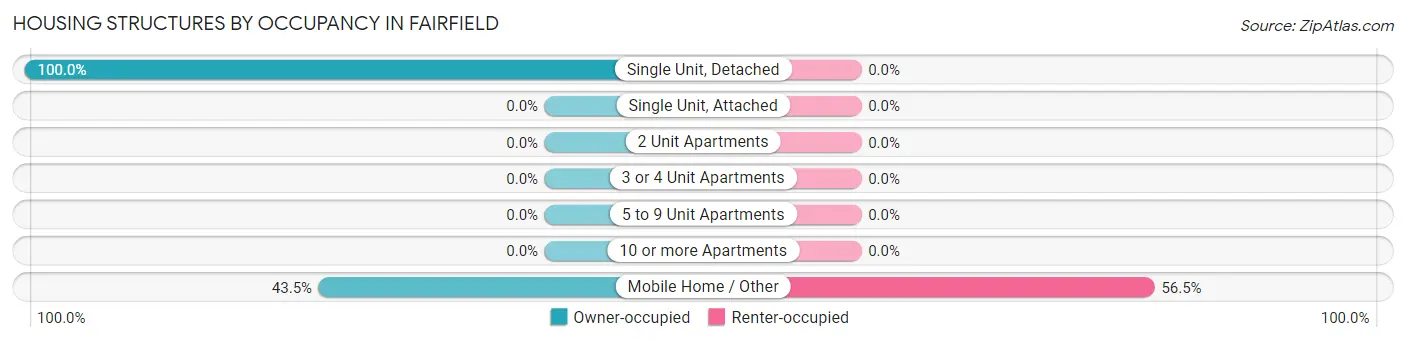
Housing Structures by Occupancy in Fairfield
| Structure Type | Owner-occupied | Renter-occupied |
| Single Unit, Detached | 16 (100.0%) | 0 (0.0%) |
| Single Unit, Attached | 0 (0.0%) | 0 (0.0%) |
| 2 Unit Apartments | 0 (0.0%) | 0 (0.0%) |
| 3 or 4 Unit Apartments | 0 (0.0%) | 0 (0.0%) |
| 5 to 9 Unit Apartments | 0 (0.0%) | 0 (0.0%) |
| 10 or more Apartments | 0 (0.0%) | 0 (0.0%) |
| Mobile Home / Other | 37 (43.5%) | 48 (56.5%) |
| Total | 53 (52.5%) | 48 (47.5%) |
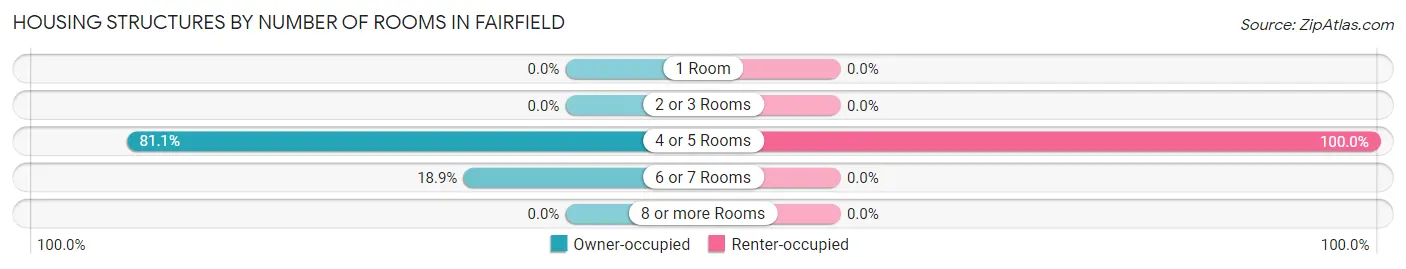
Housing Structures by Number of Rooms in Fairfield
| Number of Rooms | Owner-occupied | Renter-occupied |
| 1 Room | 0 (0.0%) | 0 (0.0%) |
| 2 or 3 Rooms | 0 (0.0%) | 0 (0.0%) |
| 4 or 5 Rooms | 43 (81.1%) | 48 (100.0%) |
| 6 or 7 Rooms | 10 (18.9%) | 0 (0.0%) |
| 8 or more Rooms | 0 (0.0%) | 0 (0.0%) |
| Total | 53 (100.0%) | 48 (100.0%) |
Housing Structure by Heating Type in Fairfield
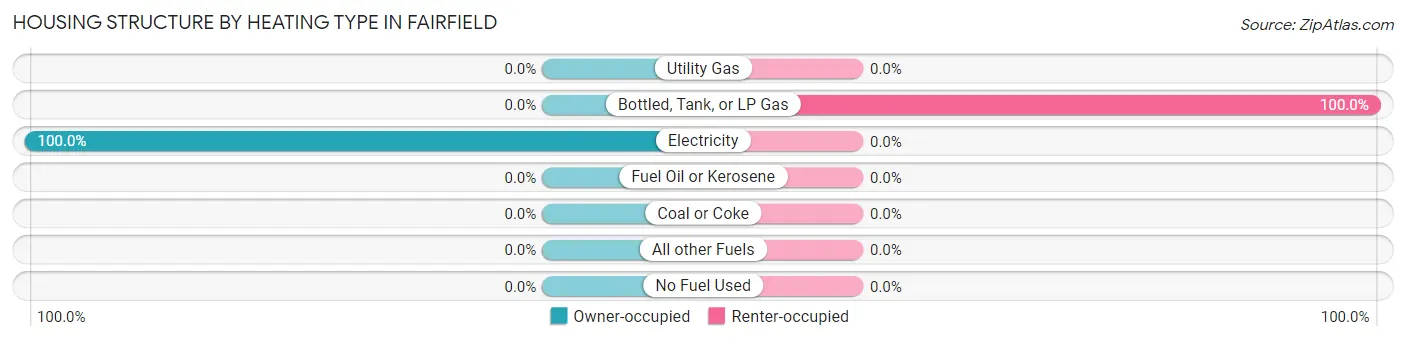
| Heating Type | Owner-occupied | Renter-occupied |
| Utility Gas | 0 (0.0%) | 0 (0.0%) |
| Bottled, Tank, or LP Gas | 0 (0.0%) | 48 (100.0%) |
| Electricity | 53 (100.0%) | 0 (0.0%) |
| Fuel Oil or Kerosene | 0 (0.0%) | 0 (0.0%) |
| Coal or Coke | 0 (0.0%) | 0 (0.0%) |
| All other Fuels | 0 (0.0%) | 0 (0.0%) |
| No Fuel Used | 0 (0.0%) | 0 (0.0%) |
| Total | 53 (100.0%) | 48 (100.0%) |
Household Vehicle Usage in Fairfield
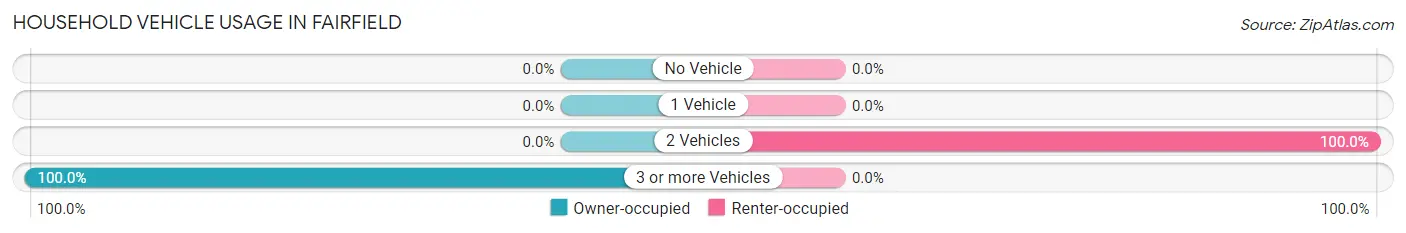
| Vehicles per Household | Owner-occupied | Renter-occupied |
| No Vehicle | 0 (0.0%) | 0 (0.0%) |
| 1 Vehicle | 0 (0.0%) | 0 (0.0%) |
| 2 Vehicles | 0 (0.0%) | 48 (100.0%) |
| 3 or more Vehicles | 53 (100.0%) | 0 (0.0%) |
| Total | 53 (100.0%) | 48 (100.0%) |
Real Estate & Mortgages in Fairfield
Real Estate and Mortgage Overview in Fairfield
| Characteristic | Without Mortgage | With Mortgage |
| Housing Units | 10 | 43 |
| Median Property Value | - | - |
| Median Household Income | - | - |
| Monthly Housing Costs | - | - |
| Real Estate Taxes | - | - |
Property Value by Mortgage Status in Fairfield
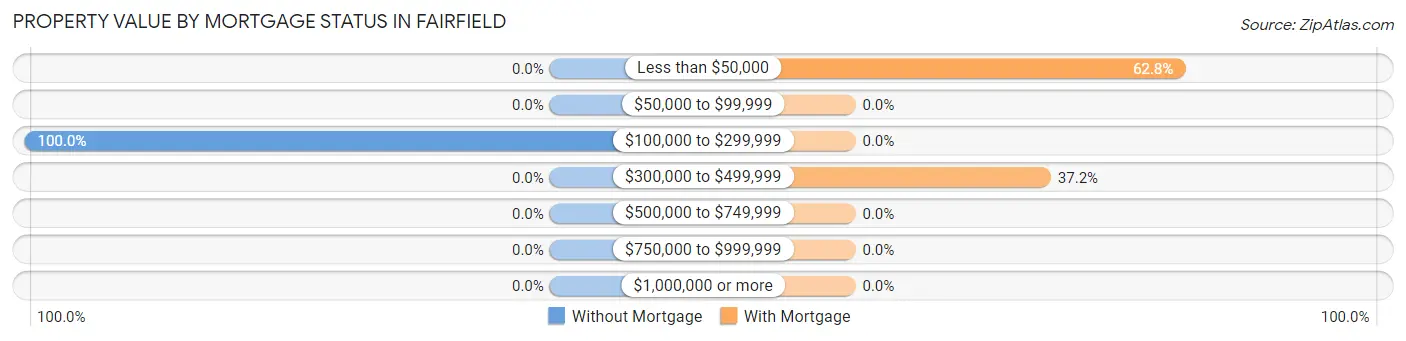
| Property Value | Without Mortgage | With Mortgage |
| Less than $50,000 | 0 (0.0%) | 27 (62.8%) |
| $50,000 to $99,999 | 0 (0.0%) | 0 (0.0%) |
| $100,000 to $299,999 | 10 (100.0%) | 0 (0.0%) |
| $300,000 to $499,999 | 0 (0.0%) | 16 (37.2%) |
| $500,000 to $749,999 | 0 (0.0%) | 0 (0.0%) |
| $750,000 to $999,999 | 0 (0.0%) | 0 (0.0%) |
| $1,000,000 or more | 0 (0.0%) | 0 (0.0%) |
| Total | 10 (100.0%) | 43 (100.0%) |
Household Income by Mortgage Status in Fairfield
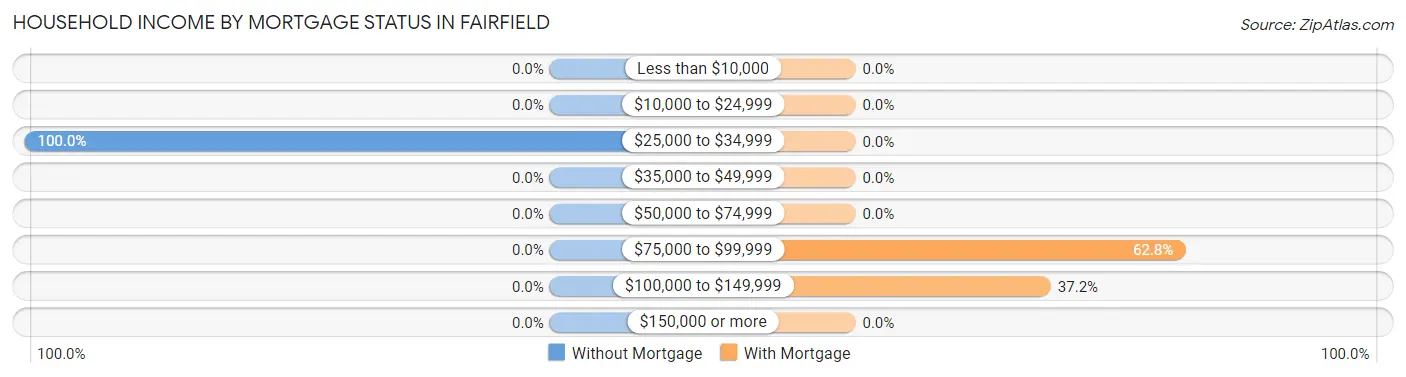
| Household Income | Without Mortgage | With Mortgage |
| Less than $10,000 | 0 (0.0%) | 0 (0.0%) |
| $10,000 to $24,999 | 0 (0.0%) | 0 (0.0%) |
| $25,000 to $34,999 | 10 (100.0%) | 0 (0.0%) |
| $35,000 to $49,999 | 0 (0.0%) | 0 (0.0%) |
| $50,000 to $74,999 | 0 (0.0%) | 0 (0.0%) |
| $75,000 to $99,999 | 0 (0.0%) | 27 (62.8%) |
| $100,000 to $149,999 | 0 (0.0%) | 16 (37.2%) |
| $150,000 or more | 0 (0.0%) | 0 (0.0%) |
| Total | 10 (100.0%) | 43 (100.0%) |
Property Value to Household Income Ratio in Fairfield
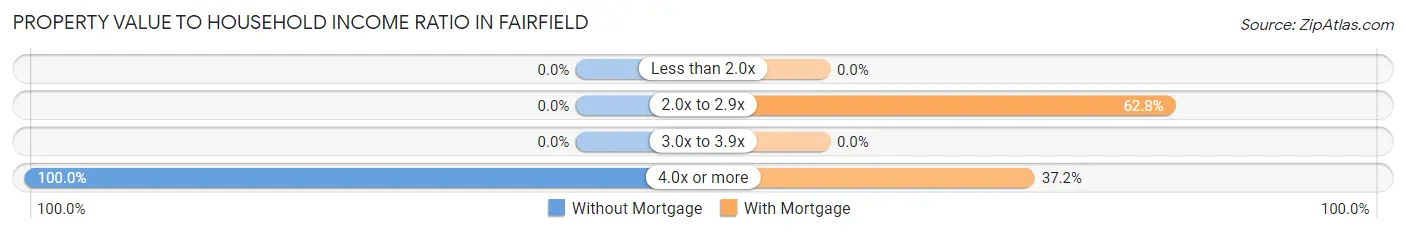
| Value-to-Income Ratio | Without Mortgage | With Mortgage |
| Less than 2.0x | 0 (0.0%) | 0 (0.0%) |
| 2.0x to 2.9x | 0 (0.0%) | 27 (62.8%) |
| 3.0x to 3.9x | 0 (0.0%) | 0 (0.0%) |
| 4.0x or more | 10 (100.0%) | 16 (37.2%) |
| Total | 10 (100.0%) | 43 (100.0%) |
Real Estate Taxes by Mortgage Status in Fairfield
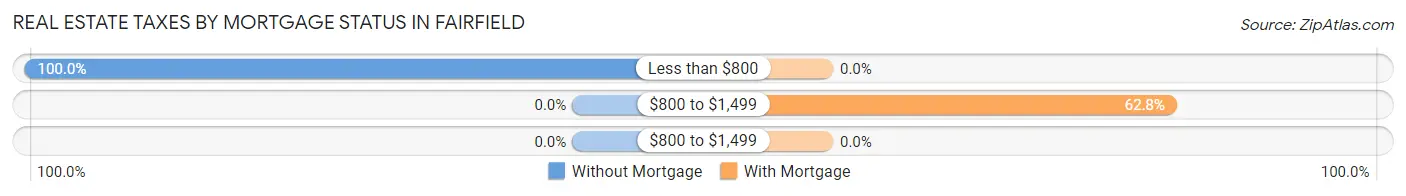
| Property Taxes | Without Mortgage | With Mortgage |
| Less than $800 | 10 (100.0%) | 0 (0.0%) |
| $800 to $1,499 | 0 (0.0%) | 27 (62.8%) |
| $800 to $1,499 | 0 (0.0%) | 0 (0.0%) |
| Total | 10 (100.0%) | 43 (100.0%) |
Health & Disability in Fairfield
Health Insurance Coverage by Age in Fairfield
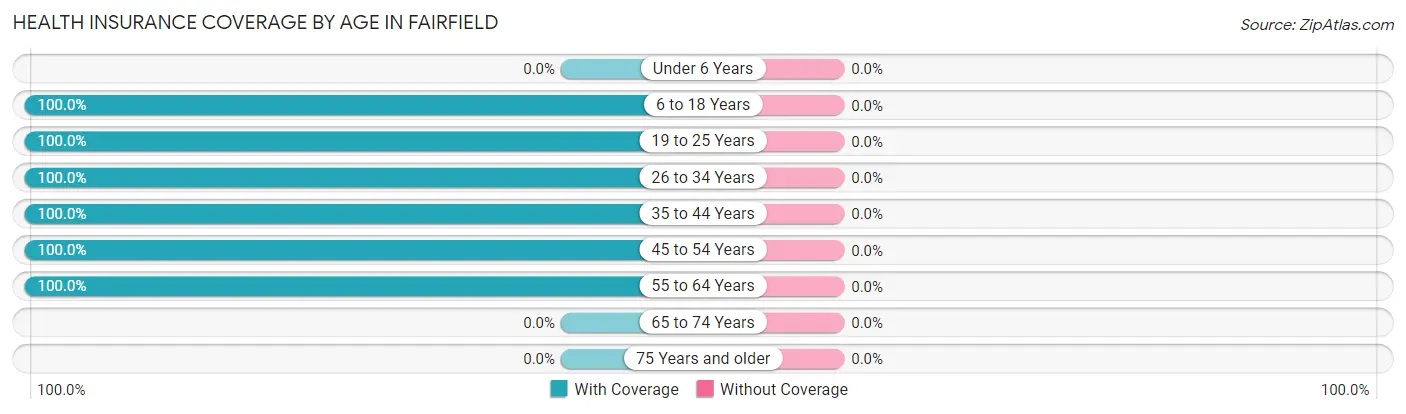
| Age Bracket | With Coverage | Without Coverage |
| Under 6 Years | 0 (0.0%) | 0 (0.0%) |
| 6 to 18 Years | 59 (100.0%) | 0 (0.0%) |
| 19 to 25 Years | 29 (100.0%) | 0 (0.0%) |
| 26 to 34 Years | 11 (100.0%) | 0 (0.0%) |
| 35 to 44 Years | 99 (100.0%) | 0 (0.0%) |
| 45 to 54 Years | 58 (100.0%) | 0 (0.0%) |
| 55 to 64 Years | 10 (100.0%) | 0 (0.0%) |
| 65 to 74 Years | 0 (0.0%) | 0 (0.0%) |
| 75 Years and older | 0 (0.0%) | 0 (0.0%) |
| Total | 266 (100.0%) | 0 (0.0%) |
Health Insurance Coverage by Citizenship Status in Fairfield
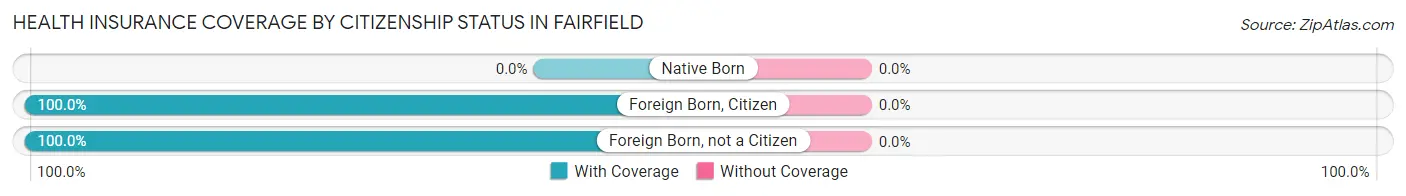
| Citizenship Status | With Coverage | Without Coverage |
| Native Born | 0 (0.0%) | 0 (0.0%) |
| Foreign Born, Citizen | 59 (100.0%) | 0 (0.0%) |
| Foreign Born, not a Citizen | 29 (100.0%) | 0 (0.0%) |
Health Insurance Coverage by Household Income in Fairfield
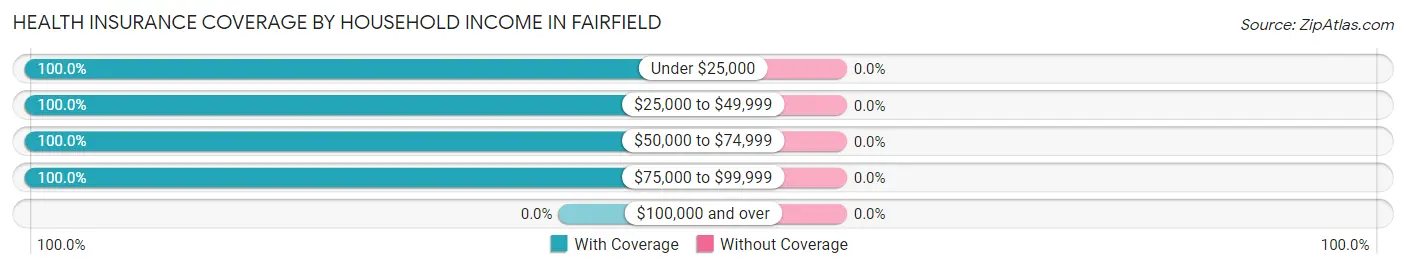
| Household Income | With Coverage | Without Coverage |
| Under $25,000 | 88 (100.0%) | 0 (0.0%) |
| $25,000 to $49,999 | 31 (100.0%) | 0 (0.0%) |
| $50,000 to $74,999 | 83 (100.0%) | 0 (0.0%) |
| $75,000 to $99,999 | 64 (100.0%) | 0 (0.0%) |
| $100,000 and over | 0 (0.0%) | 0 (0.0%) |
Public vs Private Health Insurance Coverage by Age in Fairfield
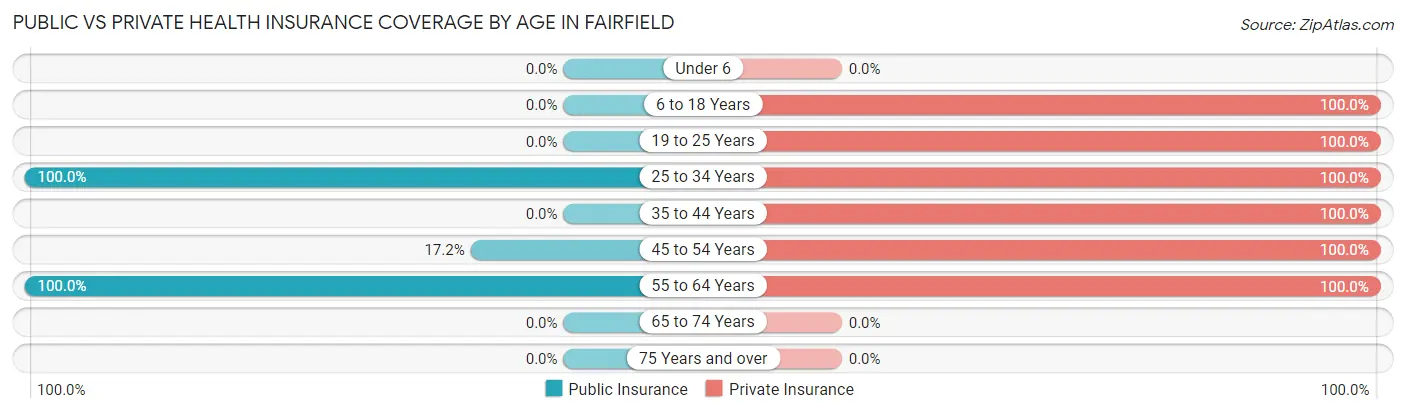
| Age Bracket | Public Insurance | Private Insurance |
| Under 6 | 0 (0.0%) | 0 (0.0%) |
| 6 to 18 Years | 0 (0.0%) | 59 (100.0%) |
| 19 to 25 Years | 0 (0.0%) | 29 (100.0%) |
| 25 to 34 Years | 11 (100.0%) | 11 (100.0%) |
| 35 to 44 Years | 0 (0.0%) | 99 (100.0%) |
| 45 to 54 Years | 10 (17.2%) | 58 (100.0%) |
| 55 to 64 Years | 10 (100.0%) | 10 (100.0%) |
| 65 to 74 Years | 0 (0.0%) | 0 (0.0%) |
| 75 Years and over | 0 (0.0%) | 0 (0.0%) |
| Total | 31 (11.7%) | 266 (100.0%) |
Disability Status by Sex by Age in Fairfield
| Age Bracket | Male | Female |
| Under 5 Years | 0 (0.0%) | 0 (0.0%) |
| 5 to 17 Years | 0 (0.0%) | 0 (0.0%) |
| 18 to 34 Years | 0 (0.0%) | 0 (0.0%) |
| 35 to 64 Years | 0 (0.0%) | 0 (0.0%) |
| 65 to 74 Years | 0 (0.0%) | 0 (0.0%) |
| 75 Years and over | 0 (0.0%) | 0 (0.0%) |
Disability Class by Sex by Age in Fairfield
Disability Class: Hearing Difficulty
| Age Bracket | Male | Female |
| Under 5 Years | 0 (0.0%) | 0 (0.0%) |
| 5 to 17 Years | 0 (0.0%) | 0 (0.0%) |
| 18 to 34 Years | 0 (0.0%) | 0 (0.0%) |
| 35 to 64 Years | 0 (0.0%) | 0 (0.0%) |
| 65 to 74 Years | 0 (0.0%) | 0 (0.0%) |
| 75 Years and over | 0 (0.0%) | 0 (0.0%) |
Disability Class: Vision Difficulty
| Age Bracket | Male | Female |
| Under 5 Years | 0 (0.0%) | 0 (0.0%) |
| 5 to 17 Years | 0 (0.0%) | 0 (0.0%) |
| 18 to 34 Years | 0 (0.0%) | 0 (0.0%) |
| 35 to 64 Years | 0 (0.0%) | 0 (0.0%) |
| 65 to 74 Years | 0 (0.0%) | 0 (0.0%) |
| 75 Years and over | 0 (0.0%) | 0 (0.0%) |
Disability Class: Cognitive Difficulty
| Age Bracket | Male | Female |
| 5 to 17 Years | 0 (0.0%) | 0 (0.0%) |
| 18 to 34 Years | 0 (0.0%) | 0 (0.0%) |
| 35 to 64 Years | 0 (0.0%) | 0 (0.0%) |
| 65 to 74 Years | 0 (0.0%) | 0 (0.0%) |
| 75 Years and over | 0 (0.0%) | 0 (0.0%) |
Disability Class: Ambulatory Difficulty
| Age Bracket | Male | Female |
| 5 to 17 Years | 0 (0.0%) | 0 (0.0%) |
| 18 to 34 Years | 0 (0.0%) | 0 (0.0%) |
| 35 to 64 Years | 0 (0.0%) | 0 (0.0%) |
| 65 to 74 Years | 0 (0.0%) | 0 (0.0%) |
| 75 Years and over | 0 (0.0%) | 0 (0.0%) |
Disability Class: Self-Care Difficulty
| Age Bracket | Male | Female |
| 5 to 17 Years | 0 (0.0%) | 0 (0.0%) |
| 18 to 34 Years | 0 (0.0%) | 0 (0.0%) |
| 35 to 64 Years | 0 (0.0%) | 0 (0.0%) |
| 65 to 74 Years | 0 (0.0%) | 0 (0.0%) |
| 75 Years and over | 0 (0.0%) | 0 (0.0%) |
Technology Access in Fairfield
Computing Device Access in Fairfield
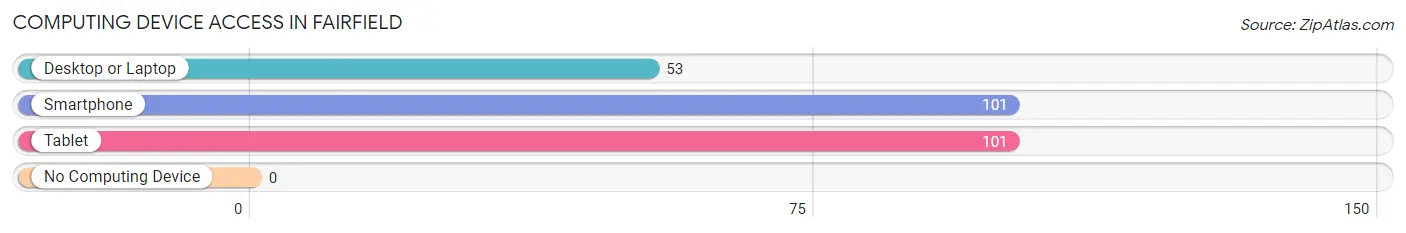
| Device Type | # Households | % Households |
| Desktop or Laptop | 53 | 52.5% |
| Smartphone | 101 | 100.0% |
| Tablet | 101 | 100.0% |
| No Computing Device | 0 | 0.0% |
| Total | 101 | 100.0% |
Internet Access in Fairfield
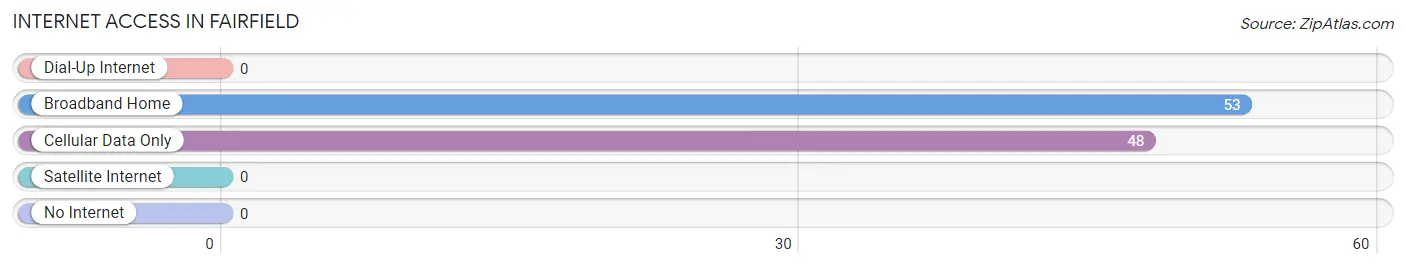
| Internet Type | # Households | % Households |
| Dial-Up Internet | 0 | 0.0% |
| Broadband Home | 53 | 52.5% |
| Cellular Data Only | 48 | 47.5% |
| Satellite Internet | 0 | 0.0% |
| No Internet | 0 | 0.0% |
| Total | 101 | 100.0% |
Fairfield Summary
Fairfield, Tennessee is a small town located in the southeastern corner of the state, in the foothills of the Appalachian Mountains. It is part of the Chattanooga metropolitan area and is situated along the Tennessee River. The town has a population of approximately 1,500 people and is known for its rural charm and friendly atmosphere.
History
Fairfield was first settled in the early 1800s by a group of settlers from North Carolina. The town was originally known as “Fairfield Station” and was a stop on the Nashville and Chattanooga Railroad. The town was officially incorporated in 1872 and was named after the nearby Fairfield Plantation.
The town grew steadily throughout the late 19th and early 20th centuries, and by the 1950s, it had become a popular tourist destination. The town was home to several resorts, including the Fairfield Inn and the Fairfield Hotel. The town also had a thriving agricultural industry, with several farms and orchards in the area.
Geography
Fairfield is located in southeastern Tennessee, in the foothills of the Appalachian Mountains. The town is situated along the Tennessee River, and is part of the Chattanooga metropolitan area. The town is surrounded by rolling hills and lush forests, and is home to several parks and recreational areas.
The climate in Fairfield is mild and temperate, with hot summers and cool winters. The average annual temperature is around 60 degrees Fahrenheit, and the average annual precipitation is around 45 inches.
Economy
Fairfield’s economy is largely based on tourism and agriculture. The town is home to several resorts and hotels, as well as several farms and orchards. The town also has a thriving retail sector, with several shops and restaurants in the area.
The town is also home to several manufacturing companies, including a furniture factory and a paper mill. The town is also home to several small businesses, including a winery and a brewery.
Demographics
As of the 2010 census, Fairfield had a population of 1,500 people. The racial makeup of the town was 95.3% White, 1.7% African American, 0.7% Native American, 0.3% Asian, and 1.7% from other races. The median household income was $37,500, and the median family income was $45,000.
The town is home to several churches, including the Fairfield United Methodist Church and the Fairfield Baptist Church. The town is also home to several schools, including Fairfield Elementary School and Fairfield High School.
Conclusion
Fairfield, Tennessee is a small town located in the southeastern corner of the state, in the foothills of the Appalachian Mountains. It is part of the Chattanooga metropolitan area and is situated along the Tennessee River. The town has a population of approximately 1,500 people and is known for its rural charm and friendly atmosphere. The town’s economy is largely based on tourism and agriculture, and it is home to several resorts, farms, and orchards. The town is also home to several churches, schools, and small businesses.
Common Questions
What is Per Capita Income in Fairfield?
Per Capita income in Fairfield is $16,816.
What is Inequality or Gini Index in Fairfield?
Inequality or Gini Index in Fairfield is 0.36.
What is the Total Population of Fairfield?
Total Population of Fairfield is 266.
What is the Total Male Population of Fairfield?
Total Male Population of Fairfield is 130.
What is the Total Female Population of Fairfield?
Total Female Population of Fairfield is 136.
What is the Ratio of Males per 100 Females in Fairfield?
There are 95.59 Males per 100 Females in Fairfield.
What is the Ratio of Females per 100 Males in Fairfield?
There are 104.62 Females per 100 Males in Fairfield.
What is the Median Population Age in Fairfield?
Median Population Age in Fairfield is 41.4 Years.
What is the Average Family Size in Fairfield
Average Family Size in Fairfield is 2.6 People.
What is the Average Household Size in Fairfield
Average Household Size in Fairfield is 2.6 People.
How Large is the Labor Force in Fairfield?
There are 186 People in the Labor Forcein in Fairfield.
What is the Percentage of People in the Labor Force in Fairfield?
73.8% of People are in the Labor Force in Fairfield.
What is the Unemployment Rate in Fairfield?
Unemployment Rate in Fairfield is 21.5%.