Fair Oaks, OR Map & Demographics
Fair Oaks Map
Fair Oaks Overview
$39,182
PER CAPITA INCOME
$66,705
AVG HOUSEHOLD INCOME
0.28
INEQUALITY / GINI INDEX
204
TOTAL POPULATION
117
MALE POPULATION
87
FEMALE POPULATION
134.48
MALES / 100 FEMALES
74.36
FEMALES / 100 MALES
62.9
MEDIAN AGE
2.2
AVG FAMILY SIZE
2.0
AVG HOUSEHOLD SIZE
79
LABOR FORCE [ PEOPLE ]
38.7%
PERCENT IN LABOR FORCE
17.7%
UNEMPLOYMENT RATE
Income in Fair Oaks
Income Overview in Fair Oaks
| Characteristic | Number | Measure |
| Per Capita Income | 204 | $39,182 |
| Median Family Income | 73 | $0 |
| Mean Family Income | 73 | $80,090 |
| Median Household Income | 101 | $66,705 |
| Mean Household Income | 101 | $78,081 |
| Income Deficit | 73 | $0 |
| Wage / Income Gap (%) | 204 | 0.00% |
| Wage / Income Gap ($) | 204 | 100.00¢ per $1 |
| Gini / Inequality Index | 204 | 0.28 |
Earnings by Sex in Fair Oaks
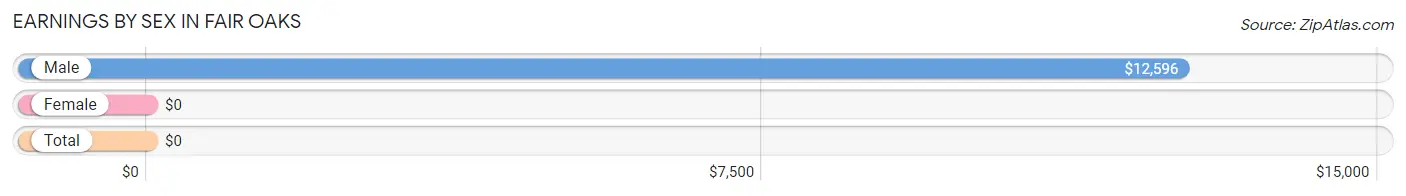
| Sex | Number | Average Earnings |
| Male | 64 (57.7%) | $12,596 |
| Female | 47 (42.3%) | $0 |
| Total | 111 (100.0%) | $0 |
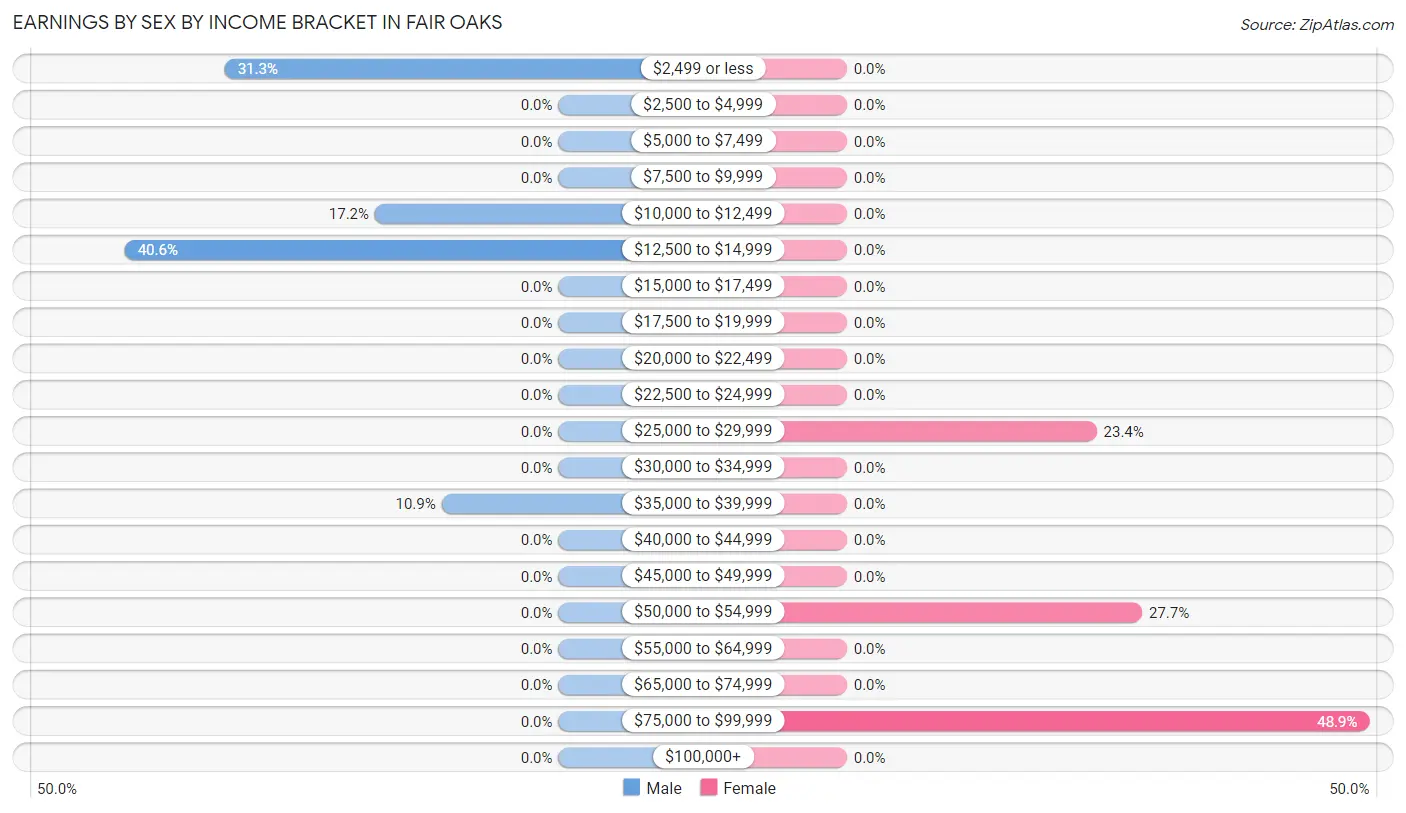
Earnings by Sex by Income Bracket in Fair Oaks
The most common earnings brackets in Fair Oaks are $12,500 to $14,999 for men (26 | 40.6%) and $75,000 to $99,999 for women (23 | 48.9%).
| Income | Male | Female |
| $2,499 or less | 20 (31.2%) | 0 (0.0%) |
| $2,500 to $4,999 | 0 (0.0%) | 0 (0.0%) |
| $5,000 to $7,499 | 0 (0.0%) | 0 (0.0%) |
| $7,500 to $9,999 | 0 (0.0%) | 0 (0.0%) |
| $10,000 to $12,499 | 11 (17.2%) | 0 (0.0%) |
| $12,500 to $14,999 | 26 (40.6%) | 0 (0.0%) |
| $15,000 to $17,499 | 0 (0.0%) | 0 (0.0%) |
| $17,500 to $19,999 | 0 (0.0%) | 0 (0.0%) |
| $20,000 to $22,499 | 0 (0.0%) | 0 (0.0%) |
| $22,500 to $24,999 | 0 (0.0%) | 0 (0.0%) |
| $25,000 to $29,999 | 0 (0.0%) | 11 (23.4%) |
| $30,000 to $34,999 | 0 (0.0%) | 0 (0.0%) |
| $35,000 to $39,999 | 7 (10.9%) | 0 (0.0%) |
| $40,000 to $44,999 | 0 (0.0%) | 0 (0.0%) |
| $45,000 to $49,999 | 0 (0.0%) | 0 (0.0%) |
| $50,000 to $54,999 | 0 (0.0%) | 13 (27.7%) |
| $55,000 to $64,999 | 0 (0.0%) | 0 (0.0%) |
| $65,000 to $74,999 | 0 (0.0%) | 0 (0.0%) |
| $75,000 to $99,999 | 0 (0.0%) | 23 (48.9%) |
| $100,000+ | 0 (0.0%) | 0 (0.0%) |
| Total | 64 (100.0%) | 47 (100.0%) |
Earnings by Sex by Educational Attainment in Fair Oaks
| Educational Attainment | Male Income | Female Income |
| Less than High School | - | - |
| High School Diploma | - | - |
| College or Associate's Degree | - | - |
| Bachelor's Degree | - | - |
| Graduate Degree | - | - |
| Total | $12,596 | $0 |
Family Income in Fair Oaks
Family Income Brackets in Fair Oaks
According to the Fair Oaks family income data, there are 23 families falling into the $100,000 to $149,999 income range, which is the most common income bracket and makes up 31.5% of all families.
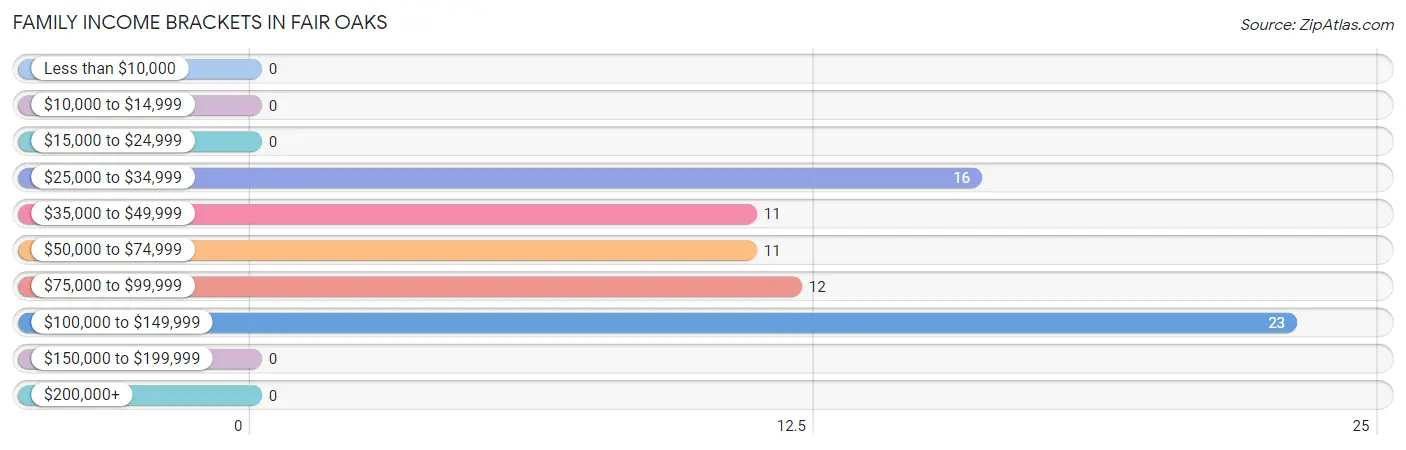
| Income Bracket | # Families | % Families |
| Less than $10,000 | 0 | 0.0% |
| $10,000 to $14,999 | 0 | 0.0% |
| $15,000 to $24,999 | 0 | 0.0% |
| $25,000 to $34,999 | 16 | 21.9% |
| $35,000 to $49,999 | 11 | 15.1% |
| $50,000 to $74,999 | 11 | 15.1% |
| $75,000 to $99,999 | 12 | 16.4% |
| $100,000 to $149,999 | 23 | 31.5% |
| $150,000 to $199,999 | 0 | 0.0% |
| $200,000+ | 0 | 0.0% |
Family Income by Famaliy Size in Fair Oaks
| Income Bracket | # Families | Median Income |
| 2-Person Families | 61 (83.6%) | $0 |
| 3-Person Families | 12 (16.4%) | $0 |
| 4-Person Families | 0 (0.0%) | $0 |
| 5-Person Families | 0 (0.0%) | $0 |
| 6-Person Families | 0 (0.0%) | $0 |
| 7+ Person Families | 0 (0.0%) | $0 |
| Total | 73 (100.0%) | $0 |
Family Income by Number of Earners in Fair Oaks
| Number of Earners | # Families | Median Income |
| No Earners | 0 (0.0%) | $0 |
| 1 Earner | 50 (68.5%) | $0 |
| 2 Earners | 23 (31.5%) | $0 |
| 3+ Earners | 0 (0.0%) | $0 |
| Total | 73 (100.0%) | $0 |
Household Income in Fair Oaks
Household Income Brackets in Fair Oaks
With 27 households falling in the category, the $50,000 to $74,999 income range is the most frequent in Fair Oaks, accounting for 26.7% of all households.
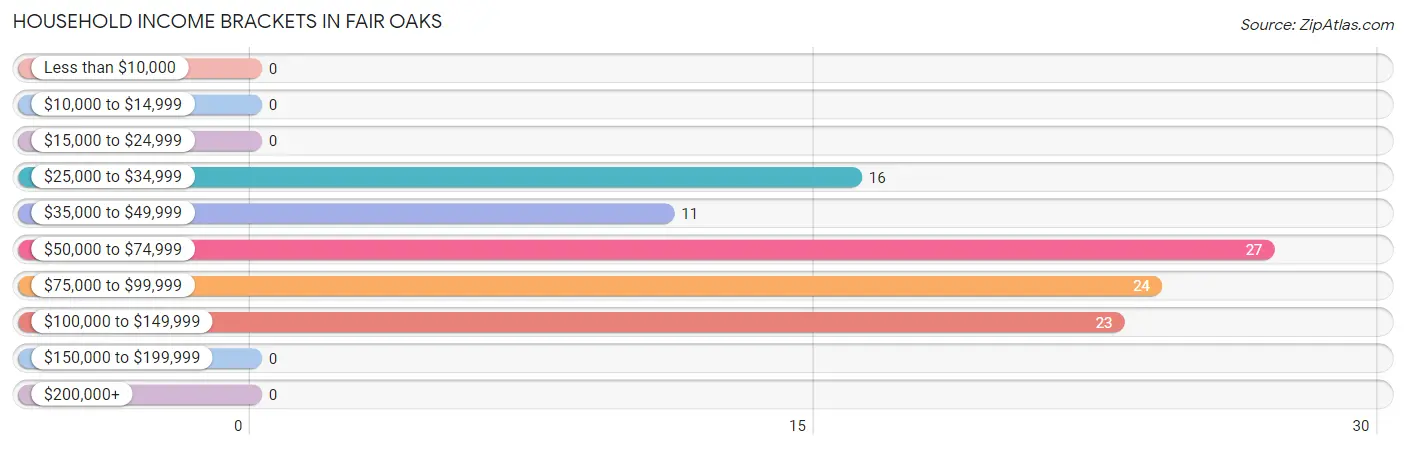
| Income Bracket | # Households | % Households |
| Less than $10,000 | 0 | 0.0% |
| $10,000 to $14,999 | 0 | 0.0% |
| $15,000 to $24,999 | 0 | 0.0% |
| $25,000 to $34,999 | 16 | 15.8% |
| $35,000 to $49,999 | 11 | 10.9% |
| $50,000 to $74,999 | 27 | 26.7% |
| $75,000 to $99,999 | 24 | 23.8% |
| $100,000 to $149,999 | 23 | 22.8% |
| $150,000 to $199,999 | 0 | 0.0% |
| $200,000+ | 0 | 0.0% |
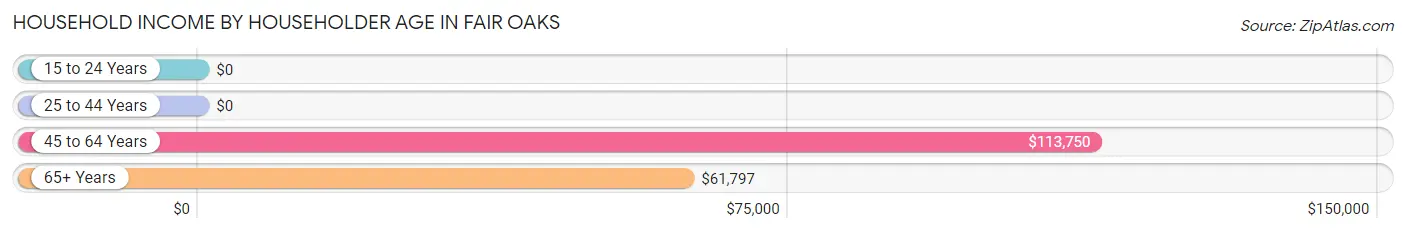
Household Income by Householder Age in Fair Oaks
The median household income in Fair Oaks is $66,705, with the highest median household income of $113,750 found in the 45 to 64 years age bracket for the primary householder. A total of 46 households (45.5%) fall into this category.
| Income Bracket | # Households | Median Income |
| 15 to 24 Years | 0 (0.0%) | $0 |
| 25 to 44 Years | 0 (0.0%) | $0 |
| 45 to 64 Years | 46 (45.5%) | $113,750 |
| 65+ Years | 55 (54.5%) | $61,797 |
| Total | 101 (100.0%) | $66,705 |
Poverty in Fair Oaks
Income Below Poverty by Sex and Age in Fair Oaks
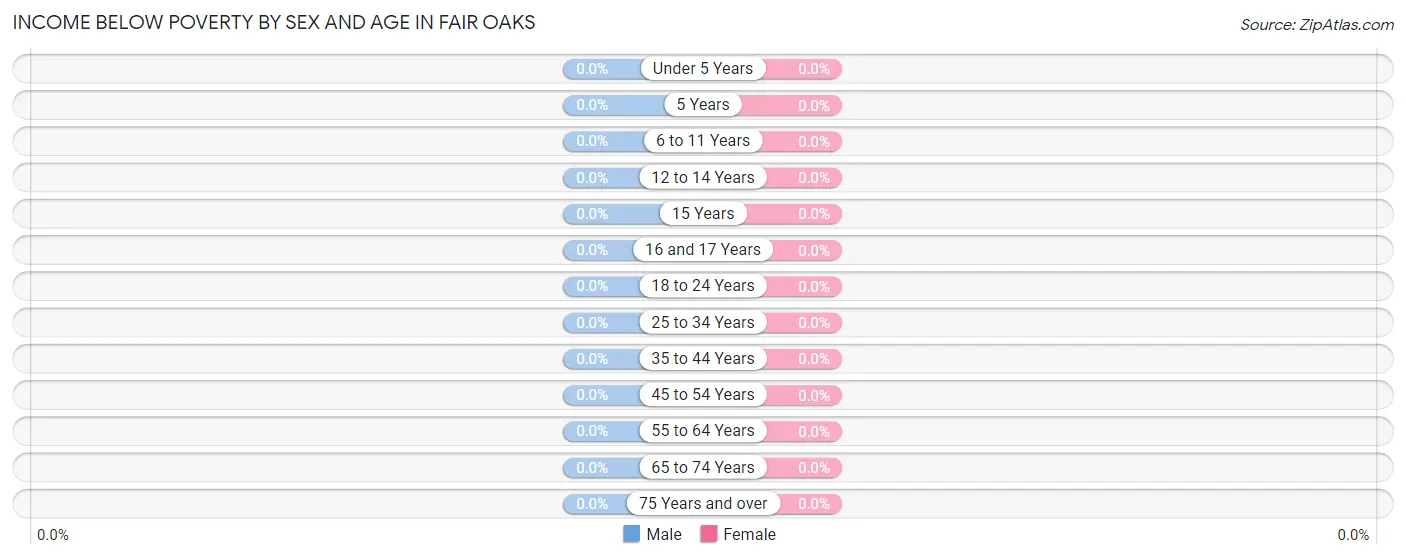
| Age Bracket | Male | Female |
| Under 5 Years | 0 (0.0%) | 0 (0.0%) |
| 5 Years | 0 (0.0%) | 0 (0.0%) |
| 6 to 11 Years | 0 (0.0%) | 0 (0.0%) |
| 12 to 14 Years | 0 (0.0%) | 0 (0.0%) |
| 15 Years | 0 (0.0%) | 0 (0.0%) |
| 16 and 17 Years | 0 (0.0%) | 0 (0.0%) |
| 18 to 24 Years | 0 (0.0%) | 0 (0.0%) |
| 25 to 34 Years | 0 (0.0%) | 0 (0.0%) |
| 35 to 44 Years | 0 (0.0%) | 0 (0.0%) |
| 45 to 54 Years | 0 (0.0%) | 0 (0.0%) |
| 55 to 64 Years | 0 (0.0%) | 0 (0.0%) |
| 65 to 74 Years | 0 (0.0%) | 0 (0.0%) |
| 75 Years and over | 0 (0.0%) | 0 (0.0%) |
| Total | 0 (0.0%) | 0 (0.0%) |
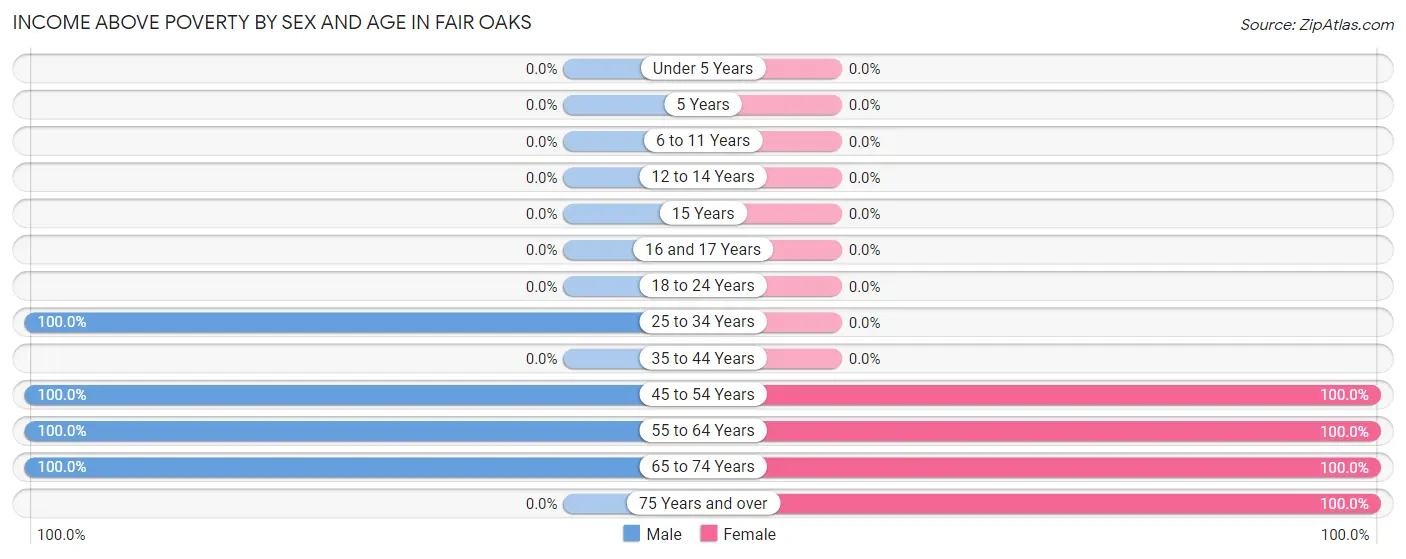
Income Above Poverty by Sex and Age in Fair Oaks
According to the poverty statistics in Fair Oaks, males aged 25 to 34 years and females aged 45 to 54 years are the age groups that are most secure financially, with 100.0% of males and 100.0% of females in these age groups living above the poverty line.
| Age Bracket | Male | Female |
| Under 5 Years | 0 (0.0%) | 0 (0.0%) |
| 5 Years | 0 (0.0%) | 0 (0.0%) |
| 6 to 11 Years | 0 (0.0%) | 0 (0.0%) |
| 12 to 14 Years | 0 (0.0%) | 0 (0.0%) |
| 15 Years | 0 (0.0%) | 0 (0.0%) |
| 16 and 17 Years | 0 (0.0%) | 0 (0.0%) |
| 18 to 24 Years | 0 (0.0%) | 0 (0.0%) |
| 25 to 34 Years | 14 (100.0%) | 0 (0.0%) |
| 35 to 44 Years | 0 (0.0%) | 0 (0.0%) |
| 45 to 54 Years | 12 (100.0%) | 24 (100.0%) |
| 55 to 64 Years | 32 (100.0%) | 23 (100.0%) |
| 65 to 74 Years | 59 (100.0%) | 24 (100.0%) |
| 75 Years and over | 0 (0.0%) | 16 (100.0%) |
| Total | 117 (100.0%) | 87 (100.0%) |
Income Below Poverty Among Married-Couple Families in Fair Oaks
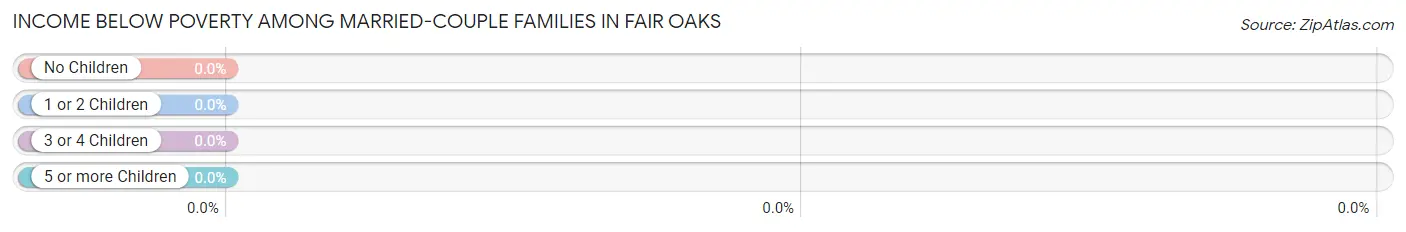
| Children | Above Poverty | Below Poverty |
| No Children | 73 (100.0%) | 0 (0.0%) |
| 1 or 2 Children | 0 (0.0%) | 0 (0.0%) |
| 3 or 4 Children | 0 (0.0%) | 0 (0.0%) |
| 5 or more Children | 0 (0.0%) | 0 (0.0%) |
| Total | 73 (100.0%) | 0 (0.0%) |
Income Below Poverty Among Single-Parent Households in Fair Oaks
| Children | Single Father | Single Mother |
| No Children | 0 (0.0%) | 0 (0.0%) |
| 1 or 2 Children | 0 (0.0%) | 0 (0.0%) |
| 3 or 4 Children | 0 (0.0%) | 0 (0.0%) |
| 5 or more Children | 0 (0.0%) | 0 (0.0%) |
| Total | 0 (0.0%) | 0 (0.0%) |
Income Below Poverty Among Married-Couple vs Single-Parent Households in Fair Oaks
| Children | Married-Couple Families | Single-Parent Households |
| No Children | 0 (0.0%) | 0 (0.0%) |
| 1 or 2 Children | 0 (0.0%) | 0 (0.0%) |
| 3 or 4 Children | 0 (0.0%) | 0 (0.0%) |
| 5 or more Children | 0 (0.0%) | 0 (0.0%) |
| Total | 0 (0.0%) | 0 (0.0%) |
Race in Fair Oaks
The most populous races in Fair Oaks are White / Caucasian (204 | 100.0%), and Hispanic or Latino (7 | 3.4%).
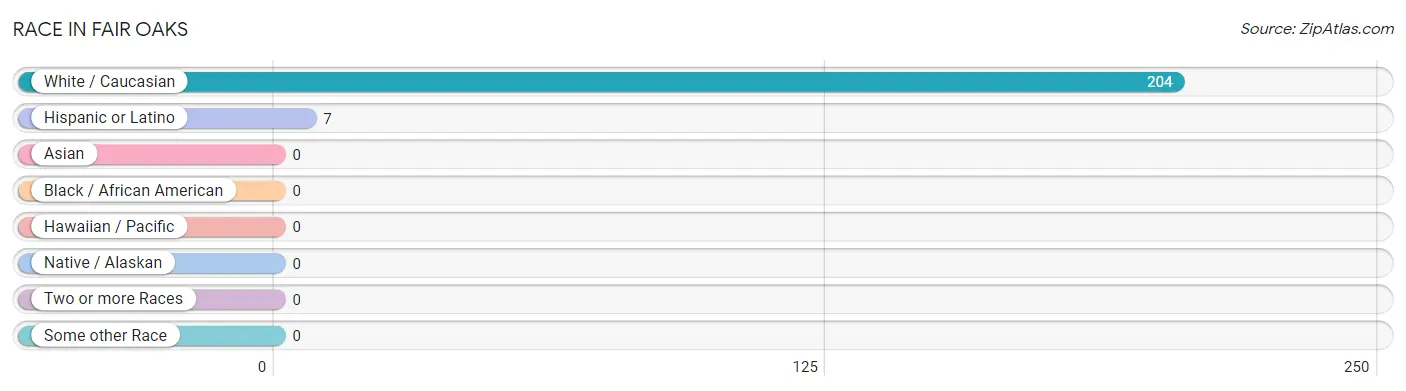
| Race | # Population | % Population |
| Asian | 0 | 0.0% |
| Black / African American | 0 | 0.0% |
| Hawaiian / Pacific | 0 | 0.0% |
| Hispanic or Latino | 7 | 3.4% |
| Native / Alaskan | 0 | 0.0% |
| White / Caucasian | 204 | 100.0% |
| Two or more Races | 0 | 0.0% |
| Some other Race | 0 | 0.0% |
| Total | 204 | 100.0% |
Ancestry in Fair Oaks
The most populous ancestries reported in Fair Oaks are Irish (64 | 31.4%), English (43 | 21.1%), Scottish (39 | 19.1%), German (37 | 18.1%), and Portuguese (23 | 11.3%), together accounting for 101.0% of all Fair Oaks residents.
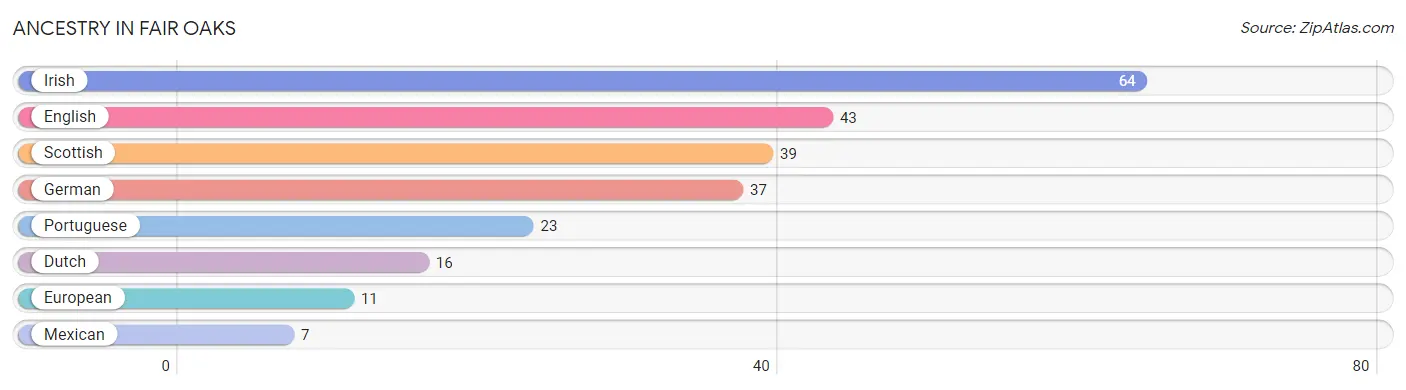
| Ancestry | # Population | % Population |
| Dutch | 16 | 7.8% |
| English | 43 | 21.1% |
| European | 11 | 5.4% |
| German | 37 | 18.1% |
| Irish | 64 | 31.4% |
| Mexican | 7 | 3.4% |
| Portuguese | 23 | 11.3% |
| Scottish | 39 | 19.1% | View All 8 Rows |
Immigrants in Fair Oaks
The most numerous immigrant groups reported in Fair Oaks came from Europe (12 | 5.9%), Northern Europe (12 | 5.9%), Scotland (12 | 5.9%), Central America (7 | 3.4%), and Latin America (7 | 3.4%), together accounting for 24.5% of all Fair Oaks residents.
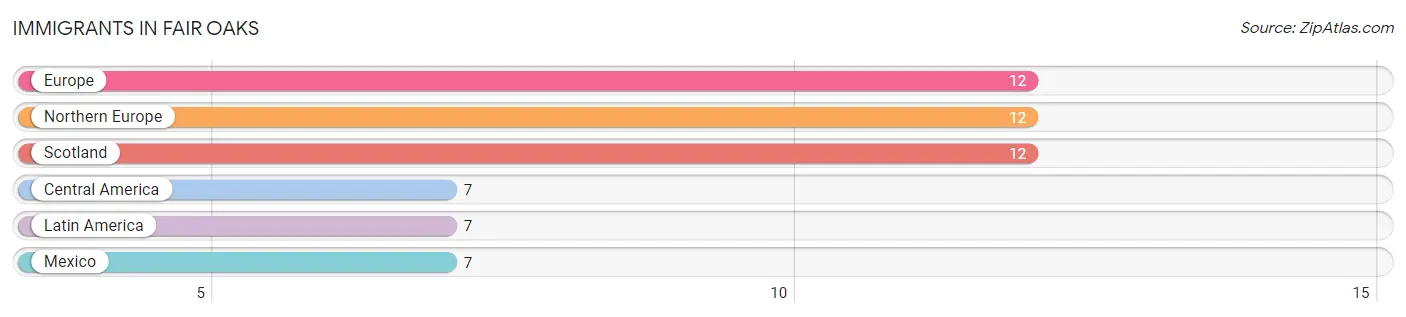
| Immigration Origin | # Population | % Population |
| Central America | 7 | 3.4% |
| Europe | 12 | 5.9% |
| Latin America | 7 | 3.4% |
| Mexico | 7 | 3.4% |
| Northern Europe | 12 | 5.9% |
| Scotland | 12 | 5.9% | View All 6 Rows |
Sex and Age in Fair Oaks
Sex and Age in Fair Oaks
The most populous age groups in Fair Oaks are 65 to 69 Years (31 | 26.5%) for men and 50 to 54 Years (24 | 27.6%) for women.
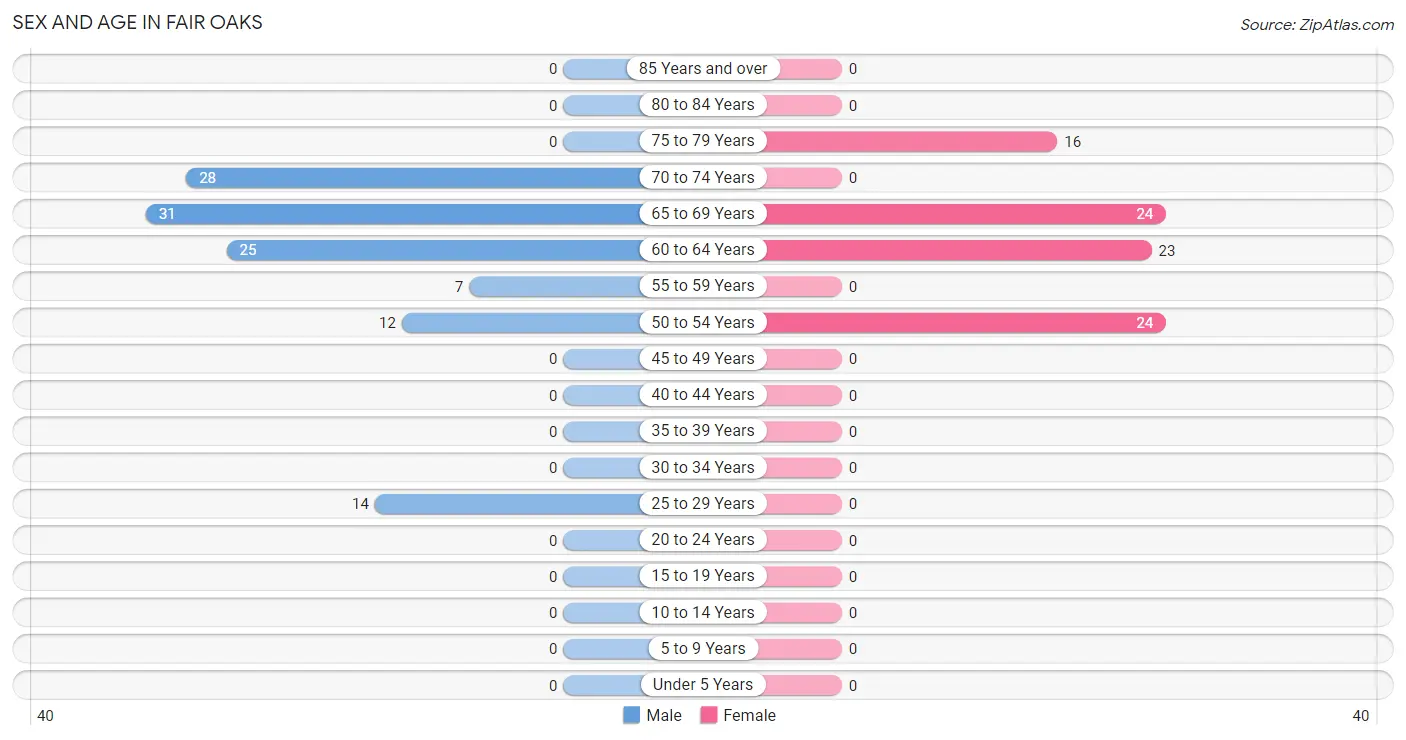
| Age Bracket | Male | Female |
| Under 5 Years | 0 (0.0%) | 0 (0.0%) |
| 5 to 9 Years | 0 (0.0%) | 0 (0.0%) |
| 10 to 14 Years | 0 (0.0%) | 0 (0.0%) |
| 15 to 19 Years | 0 (0.0%) | 0 (0.0%) |
| 20 to 24 Years | 0 (0.0%) | 0 (0.0%) |
| 25 to 29 Years | 14 (12.0%) | 0 (0.0%) |
| 30 to 34 Years | 0 (0.0%) | 0 (0.0%) |
| 35 to 39 Years | 0 (0.0%) | 0 (0.0%) |
| 40 to 44 Years | 0 (0.0%) | 0 (0.0%) |
| 45 to 49 Years | 0 (0.0%) | 0 (0.0%) |
| 50 to 54 Years | 12 (10.3%) | 24 (27.6%) |
| 55 to 59 Years | 7 (6.0%) | 0 (0.0%) |
| 60 to 64 Years | 25 (21.4%) | 23 (26.4%) |
| 65 to 69 Years | 31 (26.5%) | 24 (27.6%) |
| 70 to 74 Years | 28 (23.9%) | 0 (0.0%) |
| 75 to 79 Years | 0 (0.0%) | 16 (18.4%) |
| 80 to 84 Years | 0 (0.0%) | 0 (0.0%) |
| 85 Years and over | 0 (0.0%) | 0 (0.0%) |
| Total | 117 (100.0%) | 87 (100.0%) |
Families and Households in Fair Oaks
Median Family Size in Fair Oaks
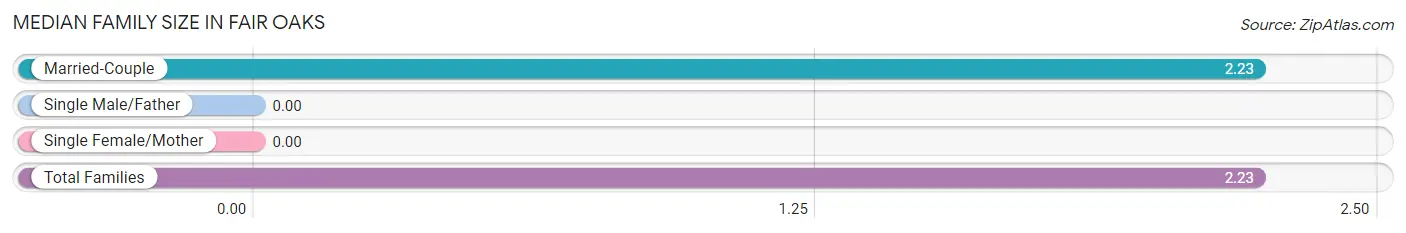
| Family Type | # Families | Family Size |
| Married-Couple | 73 (100.0%) | 2.23 |
| Single Male/Father | 0 (0.0%) | - |
| Single Female/Mother | 0 (0.0%) | - |
| Total Families | 73 (100.0%) | 2.23 |
Median Household Size in Fair Oaks
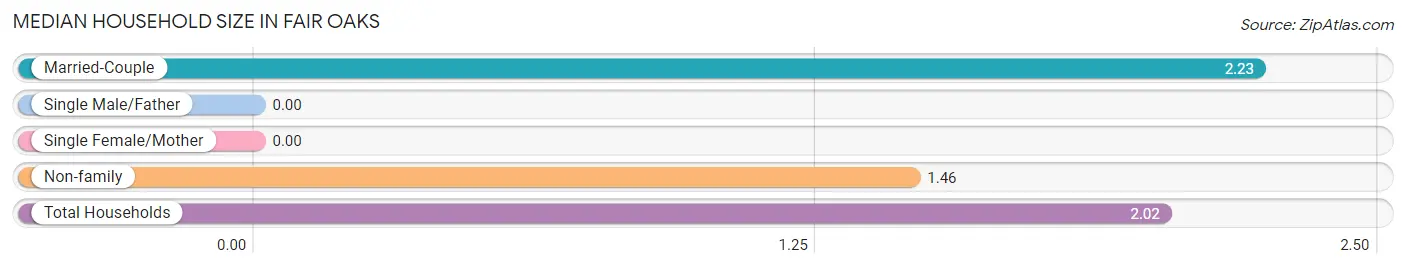
| Household Type | # Households | Household Size |
| Married-Couple | 73 (72.3%) | 2.23 |
| Single Male/Father | 0 (0.0%) | - |
| Single Female/Mother | 0 (0.0%) | - |
| Non-family | 28 (27.7%) | 1.46 |
| Total Households | 101 (100.0%) | 2.02 |
Household Size by Marriage Status in Fair Oaks
Out of a total of 101 households in Fair Oaks, 73 (72.3%) are family households, while 28 (27.7%) are nonfamily households. The most numerous type of family households are 2-person households, comprising 61, and the most common type of nonfamily households are 1-person households, comprising 16.
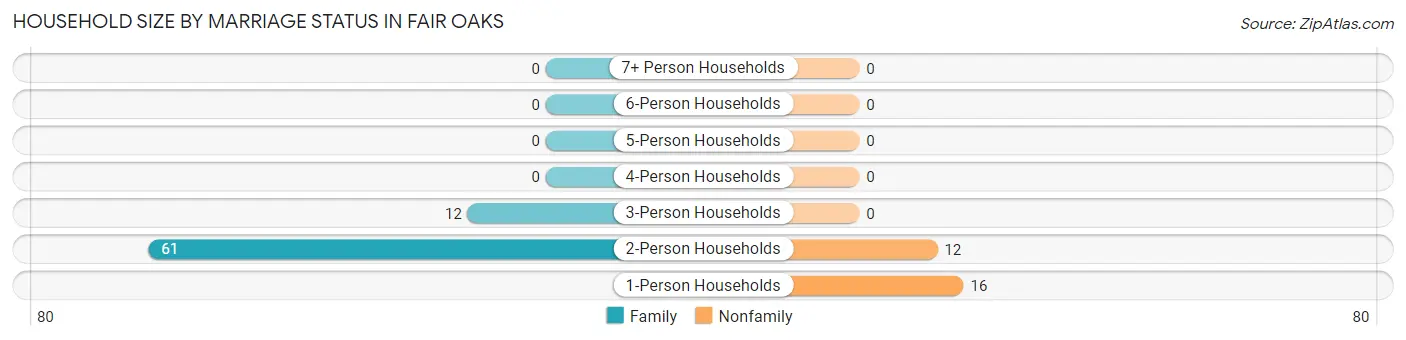
| Household Size | Family Households | Nonfamily Households |
| 1-Person Households | - | 16 (15.8%) |
| 2-Person Households | 61 (60.4%) | 12 (11.9%) |
| 3-Person Households | 12 (11.9%) | 0 (0.0%) |
| 4-Person Households | 0 (0.0%) | 0 (0.0%) |
| 5-Person Households | 0 (0.0%) | 0 (0.0%) |
| 6-Person Households | 0 (0.0%) | 0 (0.0%) |
| 7+ Person Households | 0 (0.0%) | 0 (0.0%) |
| Total | 73 (72.3%) | 28 (27.7%) |
Female Fertility in Fair Oaks
Fertility by Age in Fair Oaks
| Age Bracket | Women with Births | Births / 1,000 Women |
| 15 to 19 years | 0 (0.0%) | 0.0 |
| 20 to 34 years | 0 (0.0%) | 0.0 |
| 35 to 50 years | 0 (0.0%) | 0.0 |
| Total | 0 (0.0%) | 0.0 |
Fertility by Age by Marriage Status in Fair Oaks
| Age Bracket | Married | Unmarried |
| 15 to 19 years | 0 (0.0%) | 0 (0.0%) |
| 20 to 34 years | 0 (0.0%) | 0 (0.0%) |
| 35 to 50 years | 0 (0.0%) | 0 (0.0%) |
| Total | 0 (0.0%) | 0 (0.0%) |
Fertility by Education in Fair Oaks
| Educational Attainment | Women with Births | Births / 1,000 Women |
| Less than High School | 0 (0.0%) | 0.0 |
| High School Diploma | 0 (0.0%) | 0.0 |
| College or Associate's Degree | 0 (0.0%) | 0.0 |
| Bachelor's Degree | 0 (0.0%) | 0.0 |
| Graduate Degree | 0 (0.0%) | 0.0 |
| Total | 0 (0.0%) | 0.0 |
Fertility by Education by Marriage Status in Fair Oaks
| Educational Attainment | Married | Unmarried |
| Less than High School | 0 (0.0%) | 0 (0.0%) |
| High School Diploma | 0 (0.0%) | 0 (0.0%) |
| College or Associate's Degree | 0 (0.0%) | 0 (0.0%) |
| Bachelor's Degree | 0 (0.0%) | 0 (0.0%) |
| Graduate Degree | 0 (0.0%) | 0 (0.0%) |
| Total | 0 (0.0%) | 0 (0.0%) |
Employment Characteristics in Fair Oaks
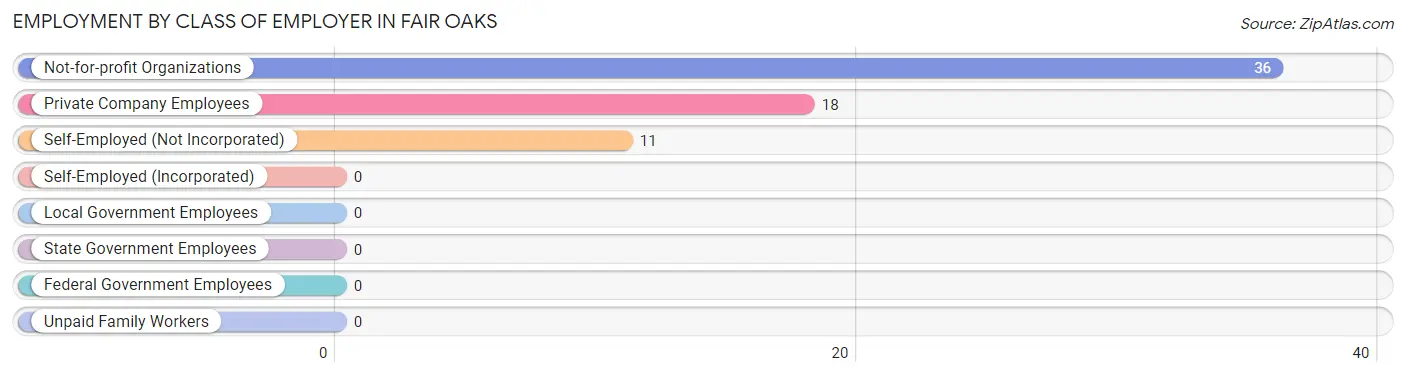
Employment by Class of Employer in Fair Oaks
Among the 65 employed individuals in Fair Oaks, not-for-profit organizations (36 | 55.4%), private company employees (18 | 27.7%), and self-employed (not incorporated) (11 | 16.9%) make up the most common classes of employment.
| Employer Class | # Employees | % Employees |
| Private Company Employees | 18 | 27.7% |
| Self-Employed (Incorporated) | 0 | 0.0% |
| Self-Employed (Not Incorporated) | 11 | 16.9% |
| Not-for-profit Organizations | 36 | 55.4% |
| Local Government Employees | 0 | 0.0% |
| State Government Employees | 0 | 0.0% |
| Federal Government Employees | 0 | 0.0% |
| Unpaid Family Workers | 0 | 0.0% |
| Total | 65 | 100.0% |
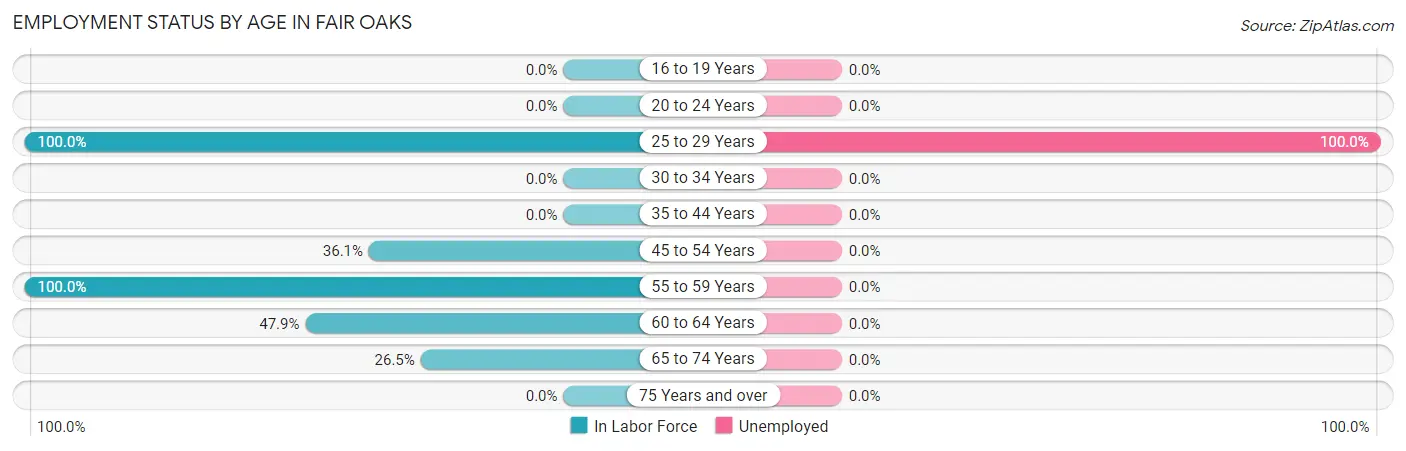
Employment Status by Age in Fair Oaks
According to the labor force statistics for Fair Oaks, out of the total population over 16 years of age (204), 38.7% or 79 individuals are in the labor force, with 17.7% or 14 of them unemployed. The age group with the highest labor force participation rate is 25 to 29 years, with 100.0% or 14 individuals in the labor force. Within the labor force, the 25 to 29 years age range has the highest percentage of unemployed individuals, with 100.0% or 14 of them being unemployed.
| Age Bracket | In Labor Force | Unemployed |
| 16 to 19 Years | 0 (0.0%) | 0 (0.0%) |
| 20 to 24 Years | 0 (0.0%) | 0 (0.0%) |
| 25 to 29 Years | 14 (100.0%) | 14 (100.0%) |
| 30 to 34 Years | 0 (0.0%) | 0 (0.0%) |
| 35 to 44 Years | 0 (0.0%) | 0 (0.0%) |
| 45 to 54 Years | 13 (36.1%) | 0 (0.0%) |
| 55 to 59 Years | 7 (100.0%) | 0 (0.0%) |
| 60 to 64 Years | 23 (47.9%) | 0 (0.0%) |
| 65 to 74 Years | 22 (26.5%) | 0 (0.0%) |
| 75 Years and over | 0 (0.0%) | 0 (0.0%) |
| Total | 79 (38.7%) | 14 (17.7%) |
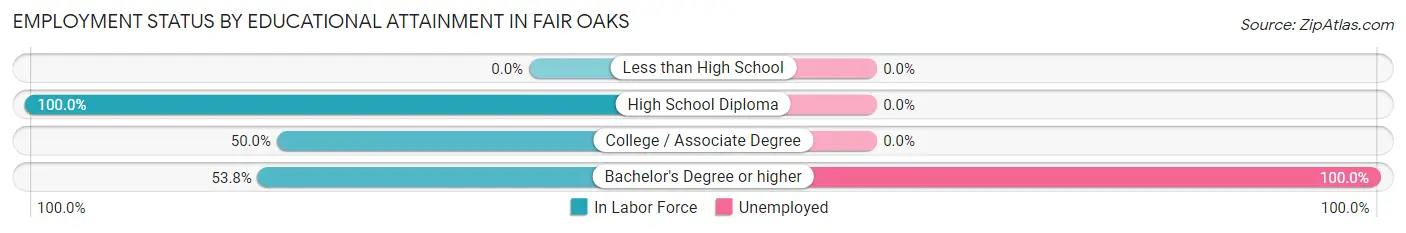
Employment Status by Educational Attainment in Fair Oaks
According to labor force statistics for Fair Oaks, 54.3% of individuals (57) out of the total population between 25 and 64 years of age (105) are in the labor force, with 24.6% or 14 of them being unemployed. The group with the highest labor force participation rate are those with the educational attainment of high school diploma, with 100.0% or 7 individuals in the labor force. Within the labor force, individuals with bachelor's degree or higher education have the highest percentage of unemployment, with 100.0% or 14 of them being unemployed.
| Educational Attainment | In Labor Force | Unemployed |
| Less than High School | 0 (0.0%) | 0 (0.0%) |
| High School Diploma | 7 (100.0%) | 0 (0.0%) |
| College / Associate Degree | 36 (50.0%) | 0 (0.0%) |
| Bachelor's Degree or higher | 14 (53.8%) | 26 (100.0%) |
| Total | 57 (54.3%) | 26 (24.6%) |
Employment Occupations by Sex in Fair Oaks
Management, Business, Science and Arts Occupations
The most common Management, Business, Science and Arts occupations in Fair Oaks are , and Management (23 | 35.4%).
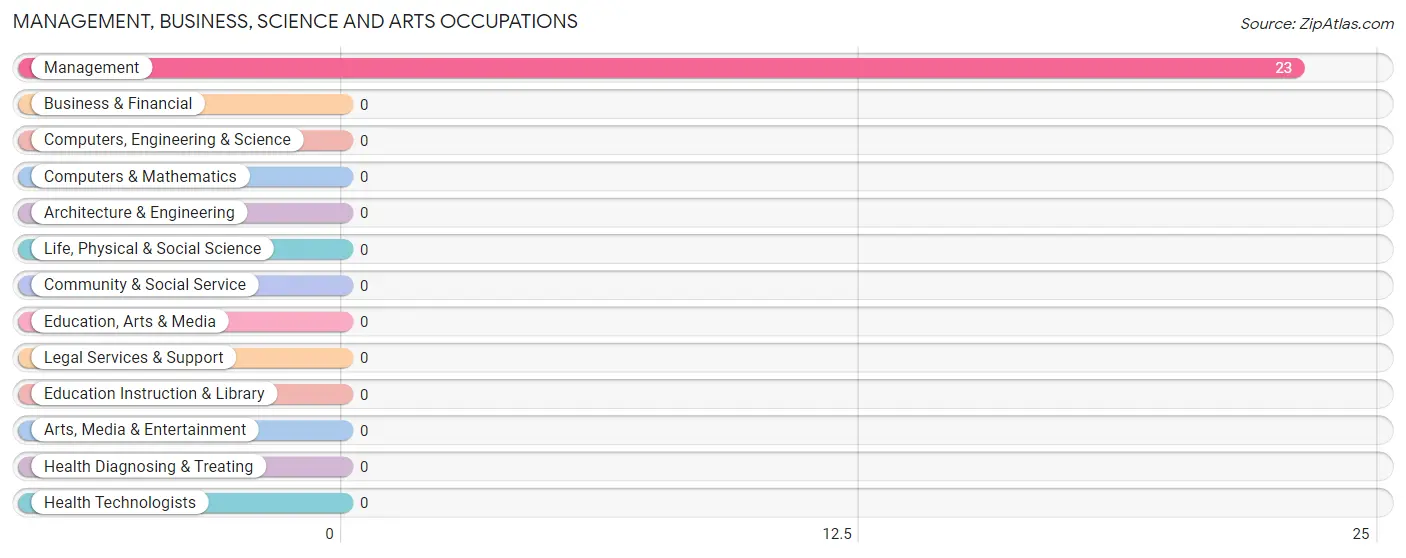
Management, Business, Science and Arts Occupations by Sex
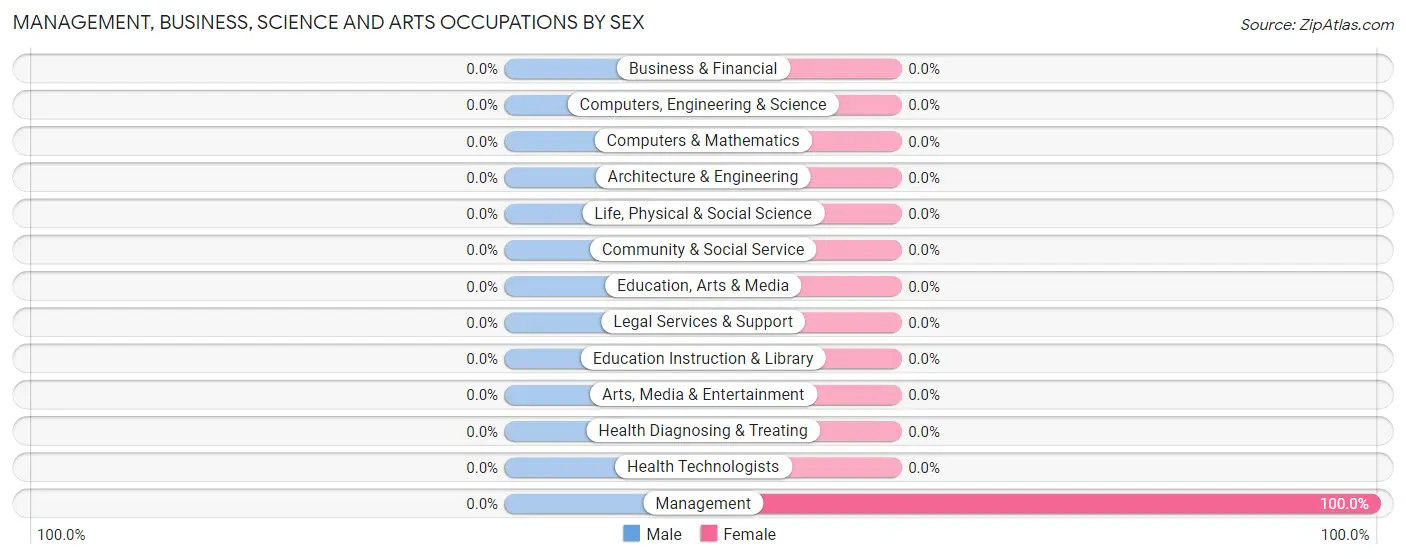
| Occupation | Male | Female |
| Management | 0 (0.0%) | 23 (100.0%) |
| Business & Financial | 0 (0.0%) | 0 (0.0%) |
| Computers, Engineering & Science | 0 (0.0%) | 0 (0.0%) |
| Computers & Mathematics | 0 (0.0%) | 0 (0.0%) |
| Architecture & Engineering | 0 (0.0%) | 0 (0.0%) |
| Life, Physical & Social Science | 0 (0.0%) | 0 (0.0%) |
| Community & Social Service | 0 (0.0%) | 0 (0.0%) |
| Education, Arts & Media | 0 (0.0%) | 0 (0.0%) |
| Legal Services & Support | 0 (0.0%) | 0 (0.0%) |
| Education Instruction & Library | 0 (0.0%) | 0 (0.0%) |
| Arts, Media & Entertainment | 0 (0.0%) | 0 (0.0%) |
| Health Diagnosing & Treating | 0 (0.0%) | 0 (0.0%) |
| Health Technologists | 0 (0.0%) | 0 (0.0%) |
| Total (Category) | 0 (0.0%) | 23 (100.0%) |
| Total (Overall) | 18 (27.7%) | 47 (72.3%) |
Services Occupations
Services Occupations by Sex
| Occupation | Male | Female |
| Healthcare Support | 0 (0.0%) | 0 (0.0%) |
| Security & Protection | 0 (0.0%) | 0 (0.0%) |
| Firefighting & Prevention | 0 (0.0%) | 0 (0.0%) |
| Law Enforcement | 0 (0.0%) | 0 (0.0%) |
| Food Preparation & Serving | 0 (0.0%) | 0 (0.0%) |
| Cleaning & Maintenance | 0 (0.0%) | 0 (0.0%) |
| Personal Care & Service | 0 (0.0%) | 0 (0.0%) |
| Total (Category) | 0 (0.0%) | 0 (0.0%) |
| Total (Overall) | 18 (27.7%) | 47 (72.3%) |
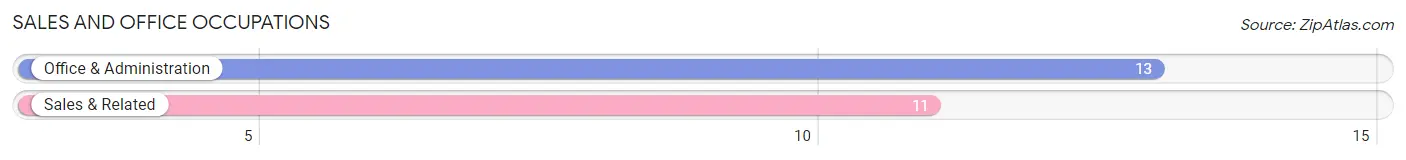
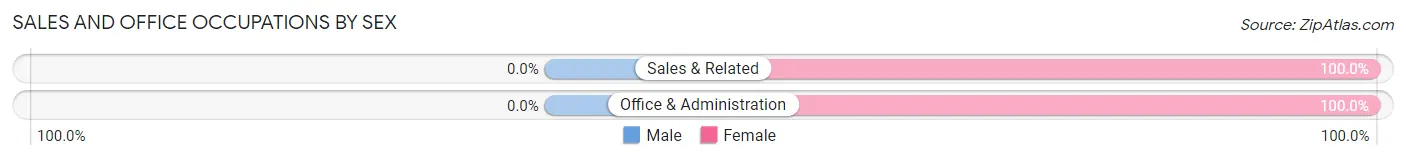
Sales and Office Occupations
The most common Sales and Office occupations in Fair Oaks are Office & Administration (13 | 20.0%), and Sales & Related (11 | 16.9%).
Sales and Office Occupations by Sex
| Occupation | Male | Female |
| Sales & Related | 0 (0.0%) | 11 (100.0%) |
| Office & Administration | 0 (0.0%) | 13 (100.0%) |
| Total (Category) | 0 (0.0%) | 24 (100.0%) |
| Total (Overall) | 18 (27.7%) | 47 (72.3%) |
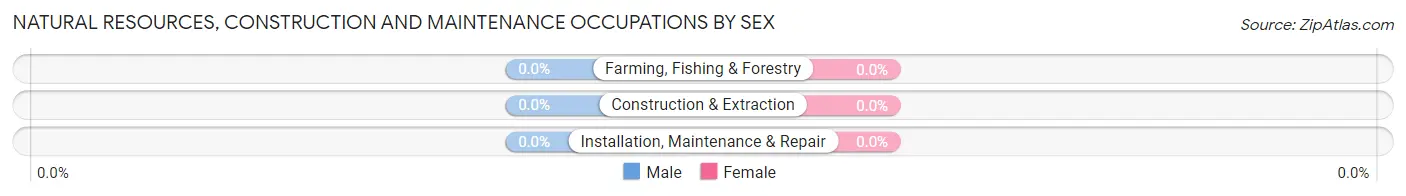
Natural Resources, Construction and Maintenance Occupations
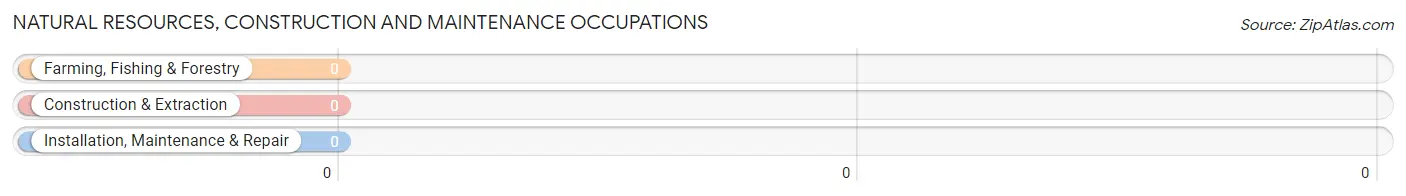
Natural Resources, Construction and Maintenance Occupations by Sex
| Occupation | Male | Female |
| Farming, Fishing & Forestry | 0 (0.0%) | 0 (0.0%) |
| Construction & Extraction | 0 (0.0%) | 0 (0.0%) |
| Installation, Maintenance & Repair | 0 (0.0%) | 0 (0.0%) |
| Total (Category) | 0 (0.0%) | 0 (0.0%) |
| Total (Overall) | 18 (27.7%) | 47 (72.3%) |
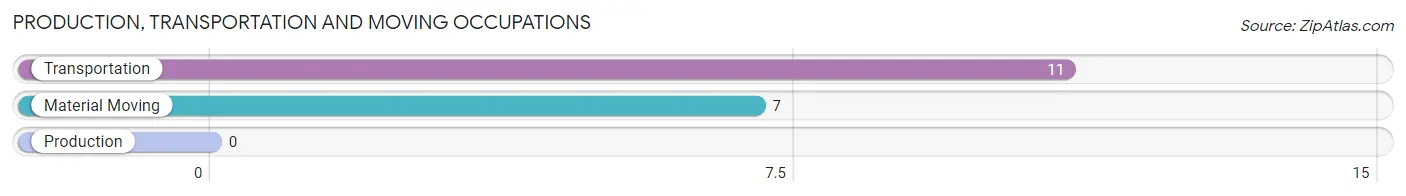
Production, Transportation and Moving Occupations
The most common Production, Transportation and Moving occupations in Fair Oaks are Transportation (11 | 16.9%), and Material Moving (7 | 10.8%).
Production, Transportation and Moving Occupations by Sex
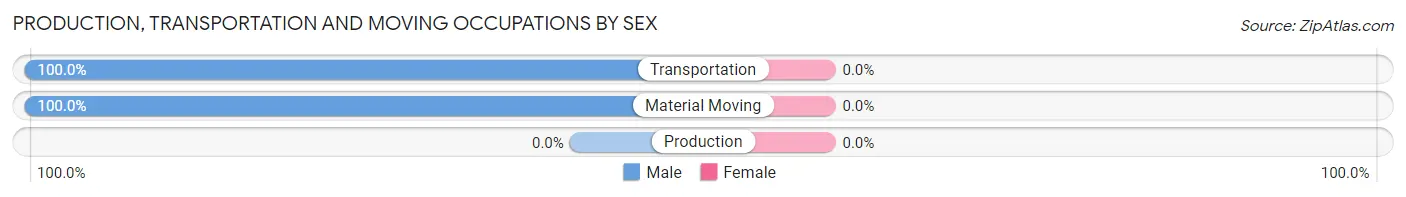
| Occupation | Male | Female |
| Production | 0 (0.0%) | 0 (0.0%) |
| Transportation | 11 (100.0%) | 0 (0.0%) |
| Material Moving | 7 (100.0%) | 0 (0.0%) |
| Total (Category) | 18 (100.0%) | 0 (0.0%) |
| Total (Overall) | 18 (27.7%) | 47 (72.3%) |
Employment Industries by Sex in Fair Oaks
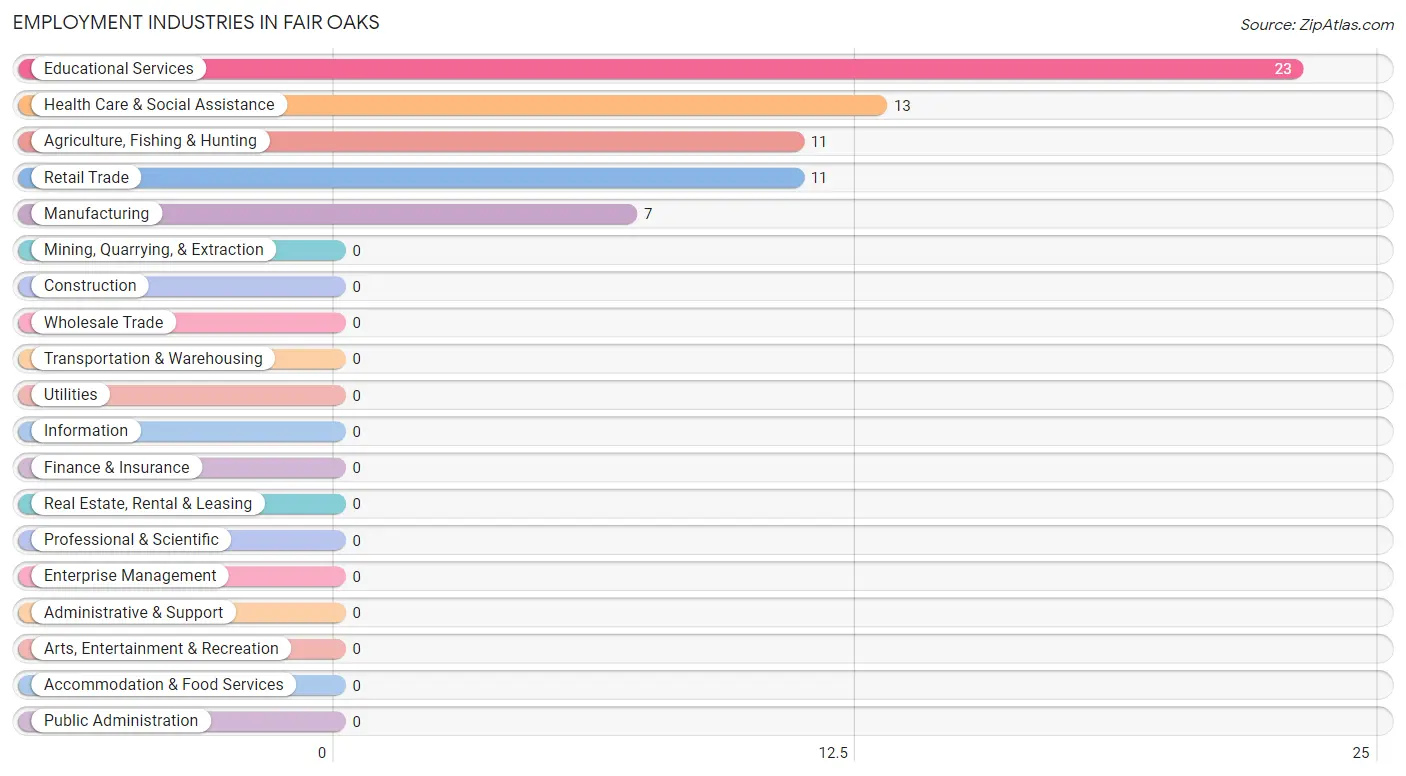
Employment Industries in Fair Oaks
The major employment industries in Fair Oaks include Educational Services (23 | 35.4%), Health Care & Social Assistance (13 | 20.0%), Agriculture, Fishing & Hunting (11 | 16.9%), Retail Trade (11 | 16.9%), and Manufacturing (7 | 10.8%).
Employment Industries by Sex in Fair Oaks
The Fair Oaks industries that see more men than women are Agriculture, Fishing & Hunting (100.0%), and Manufacturing (100.0%), whereas the industries that tend to have a higher number of women are Retail Trade (100.0%), Educational Services (100.0%), and Health Care & Social Assistance (100.0%).
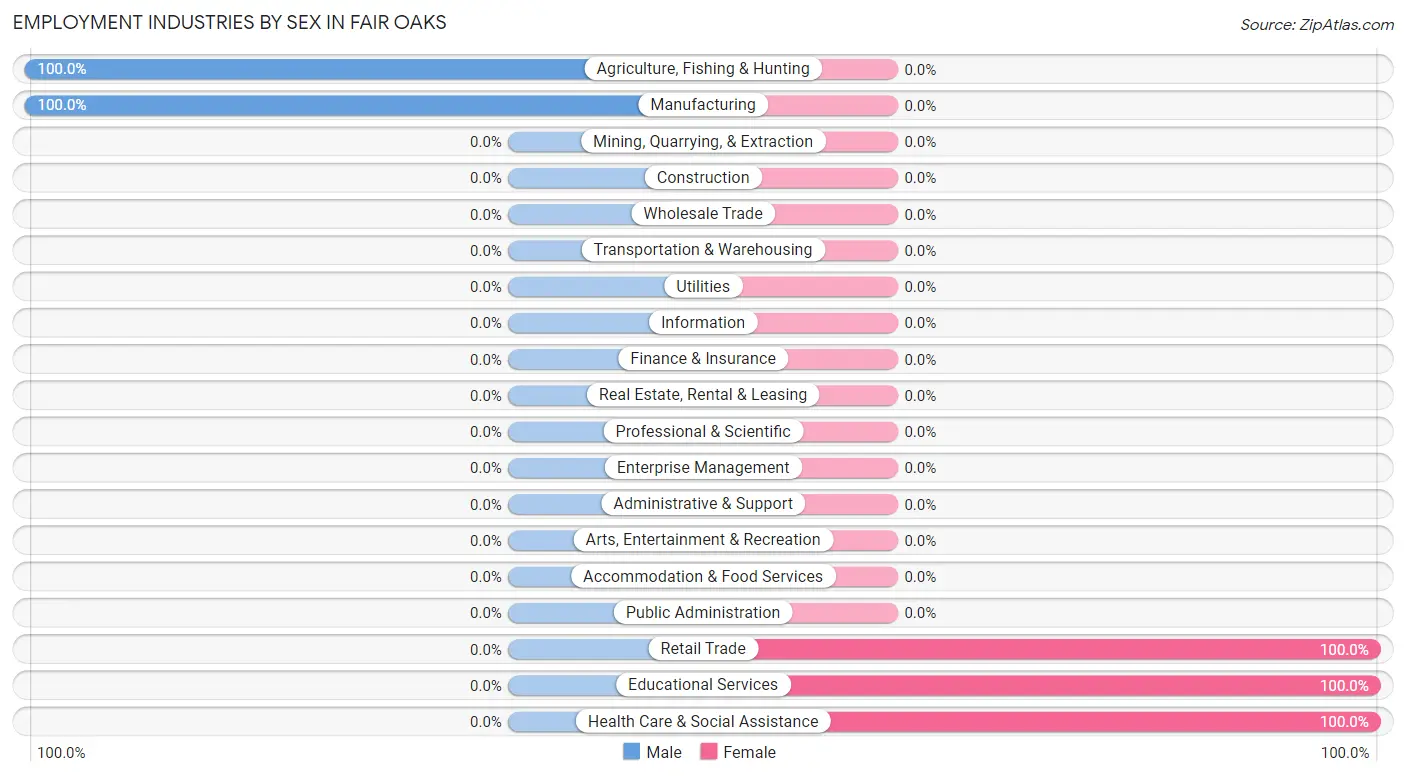
| Industry | Male | Female |
| Agriculture, Fishing & Hunting | 11 (100.0%) | 0 (0.0%) |
| Mining, Quarrying, & Extraction | 0 (0.0%) | 0 (0.0%) |
| Construction | 0 (0.0%) | 0 (0.0%) |
| Manufacturing | 7 (100.0%) | 0 (0.0%) |
| Wholesale Trade | 0 (0.0%) | 0 (0.0%) |
| Retail Trade | 0 (0.0%) | 11 (100.0%) |
| Transportation & Warehousing | 0 (0.0%) | 0 (0.0%) |
| Utilities | 0 (0.0%) | 0 (0.0%) |
| Information | 0 (0.0%) | 0 (0.0%) |
| Finance & Insurance | 0 (0.0%) | 0 (0.0%) |
| Real Estate, Rental & Leasing | 0 (0.0%) | 0 (0.0%) |
| Professional & Scientific | 0 (0.0%) | 0 (0.0%) |
| Enterprise Management | 0 (0.0%) | 0 (0.0%) |
| Administrative & Support | 0 (0.0%) | 0 (0.0%) |
| Educational Services | 0 (0.0%) | 23 (100.0%) |
| Health Care & Social Assistance | 0 (0.0%) | 13 (100.0%) |
| Arts, Entertainment & Recreation | 0 (0.0%) | 0 (0.0%) |
| Accommodation & Food Services | 0 (0.0%) | 0 (0.0%) |
| Public Administration | 0 (0.0%) | 0 (0.0%) |
| Total | 18 (27.7%) | 47 (72.3%) |
Education in Fair Oaks
School Enrollment in Fair Oaks
| School Level | # Students | % Students |
| Nursery / Preschool | 0 | 0.0% |
| Kindergarten | 0 | 0.0% |
| Elementary School | 0 | 0.0% |
| Middle School | 0 | 0.0% |
| High School | 0 | 0.0% |
| College / Undergraduate | 0 | 0.0% |
| Graduate / Professional | 0 | 0.0% |
| Total | 0 | 0.0% |
School Enrollment by Age by Funding Source in Fair Oaks
| Age Bracket | Public School | Private School |
| 3 to 4 Year Olds | 0 (0.0%) | 0 (0.0%) |
| 5 to 9 Year Old | 0 (0.0%) | 0 (0.0%) |
| 10 to 14 Year Olds | 0 (0.0%) | 0 (0.0%) |
| 15 to 17 Year Olds | 0 (0.0%) | 0 (0.0%) |
| 18 to 19 Year Olds | 0 (0.0%) | 0 (0.0%) |
| 20 to 24 Year Olds | 0 (0.0%) | 0 (0.0%) |
| 25 to 34 Year Olds | 0 (0.0%) | 0 (0.0%) |
| 35 Years and over | 0 (0.0%) | 0 (0.0%) |
| Total | 0 (0.0%) | 0 (0.0%) |
Educational Attainment by Field of Study in Fair Oaks
Bio, nature & agricultural (14 | 36.8%), physical & health sciences (12 | 31.6%), and social sciences (12 | 31.6%) are the most common fields of study among 38 individuals in Fair Oaks who have obtained a bachelor's degree or higher.
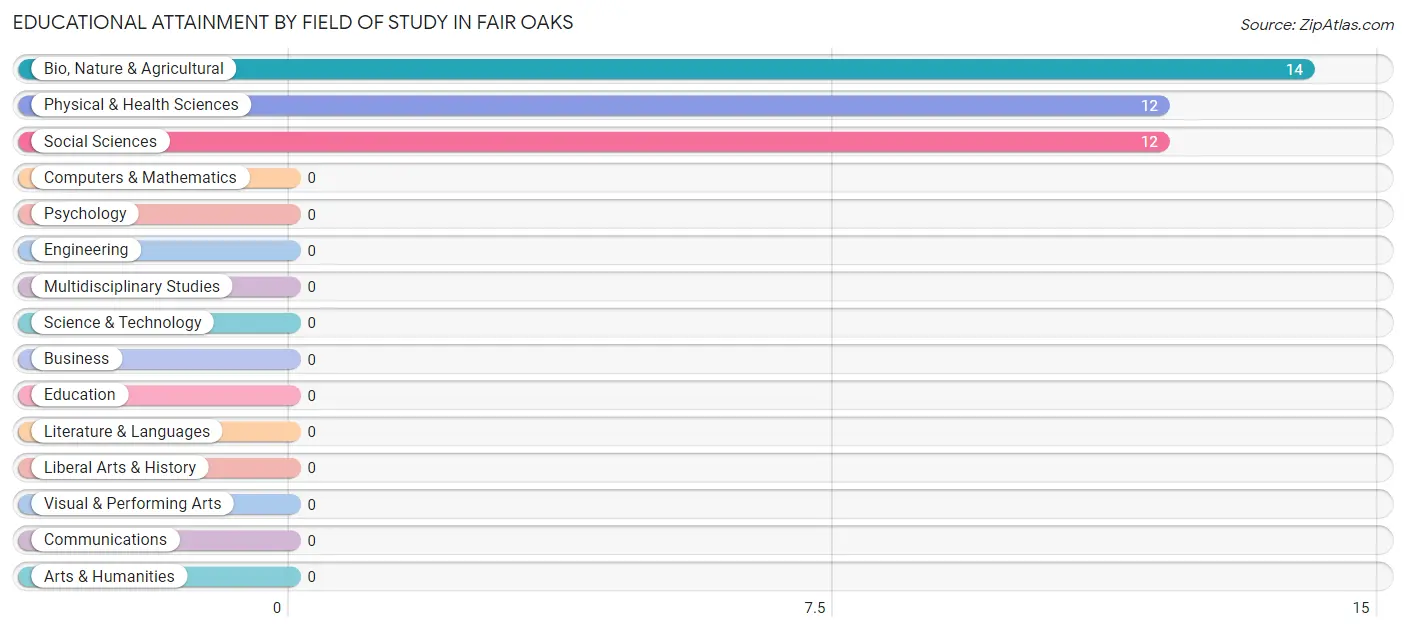
| Field of Study | # Graduates | % Graduates |
| Computers & Mathematics | 0 | 0.0% |
| Bio, Nature & Agricultural | 14 | 36.8% |
| Physical & Health Sciences | 12 | 31.6% |
| Psychology | 0 | 0.0% |
| Social Sciences | 12 | 31.6% |
| Engineering | 0 | 0.0% |
| Multidisciplinary Studies | 0 | 0.0% |
| Science & Technology | 0 | 0.0% |
| Business | 0 | 0.0% |
| Education | 0 | 0.0% |
| Literature & Languages | 0 | 0.0% |
| Liberal Arts & History | 0 | 0.0% |
| Visual & Performing Arts | 0 | 0.0% |
| Communications | 0 | 0.0% |
| Arts & Humanities | 0 | 0.0% |
| Total | 38 | 100.0% |
Transportation & Commute in Fair Oaks
Vehicle Availability by Sex in Fair Oaks
The most prevalent vehicle ownership categories in Fair Oaks are males with 3 vehicles (18, accounting for 100.0%) and females with 3 vehicles (34, making up 38.3%).
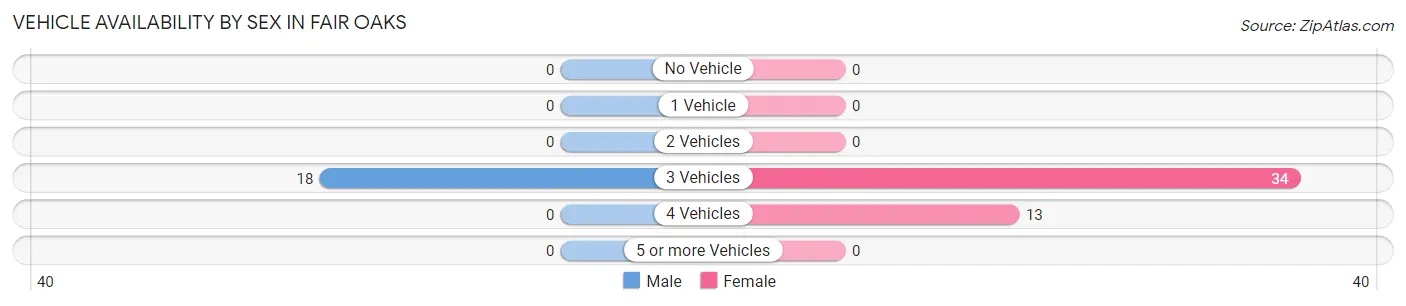
| Vehicles Available | Male | Female |
| No Vehicle | 0 (0.0%) | 0 (0.0%) |
| 1 Vehicle | 0 (0.0%) | 0 (0.0%) |
| 2 Vehicles | 0 (0.0%) | 0 (0.0%) |
| 3 Vehicles | 18 (100.0%) | 34 (72.3%) |
| 4 Vehicles | 0 (0.0%) | 13 (27.7%) |
| 5 or more Vehicles | 0 (0.0%) | 0 (0.0%) |
| Total | 18 (100.0%) | 47 (100.0%) |
Commute Time in Fair Oaks
The most frequently occuring commute durations in Fair Oaks are 20 to 24 minutes (23 commuters, 44.2%), 30 to 34 minutes (22 commuters, 42.3%), and 25 to 29 minutes (7 commuters, 13.5%).
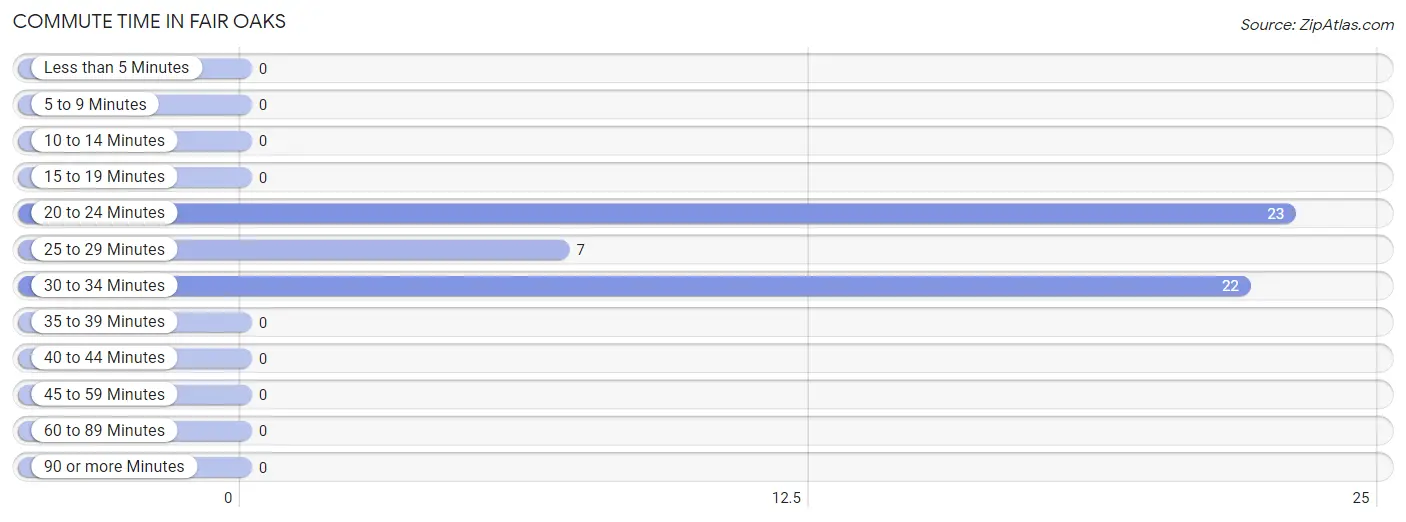
| Commute Time | # Commuters | % Commuters |
| Less than 5 Minutes | 0 | 0.0% |
| 5 to 9 Minutes | 0 | 0.0% |
| 10 to 14 Minutes | 0 | 0.0% |
| 15 to 19 Minutes | 0 | 0.0% |
| 20 to 24 Minutes | 23 | 44.2% |
| 25 to 29 Minutes | 7 | 13.5% |
| 30 to 34 Minutes | 22 | 42.3% |
| 35 to 39 Minutes | 0 | 0.0% |
| 40 to 44 Minutes | 0 | 0.0% |
| 45 to 59 Minutes | 0 | 0.0% |
| 60 to 89 Minutes | 0 | 0.0% |
| 90 or more Minutes | 0 | 0.0% |
Commute Time by Sex in Fair Oaks
The most common commute times in Fair Oaks are 30 to 34 minutes (11 commuters, 61.1%) for males and 20 to 24 minutes (23 commuters, 67.6%) for females.
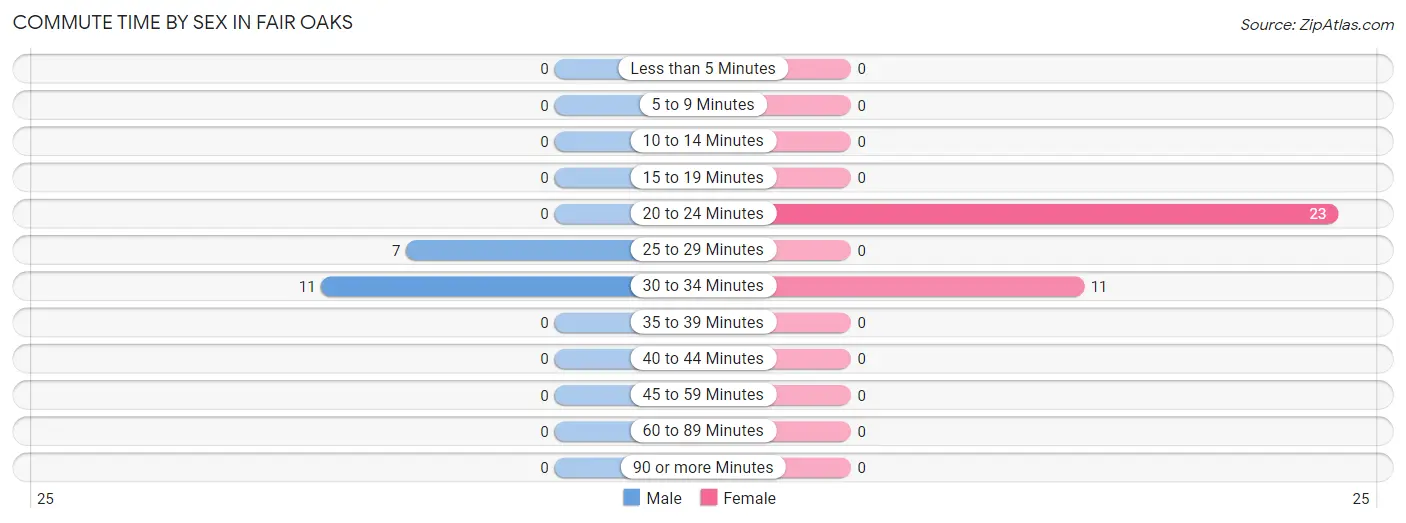
| Commute Time | Male | Female |
| Less than 5 Minutes | 0 (0.0%) | 0 (0.0%) |
| 5 to 9 Minutes | 0 (0.0%) | 0 (0.0%) |
| 10 to 14 Minutes | 0 (0.0%) | 0 (0.0%) |
| 15 to 19 Minutes | 0 (0.0%) | 0 (0.0%) |
| 20 to 24 Minutes | 0 (0.0%) | 23 (67.6%) |
| 25 to 29 Minutes | 7 (38.9%) | 0 (0.0%) |
| 30 to 34 Minutes | 11 (61.1%) | 11 (32.4%) |
| 35 to 39 Minutes | 0 (0.0%) | 0 (0.0%) |
| 40 to 44 Minutes | 0 (0.0%) | 0 (0.0%) |
| 45 to 59 Minutes | 0 (0.0%) | 0 (0.0%) |
| 60 to 89 Minutes | 0 (0.0%) | 0 (0.0%) |
| 90 or more Minutes | 0 (0.0%) | 0 (0.0%) |
Time of Departure to Work by Sex in Fair Oaks
The most frequent times of departure to work in Fair Oaks are 5:30 AM to 5:59 AM (11, 61.1%) for males and 7:00 AM to 7:29 AM (23, 67.6%) for females.
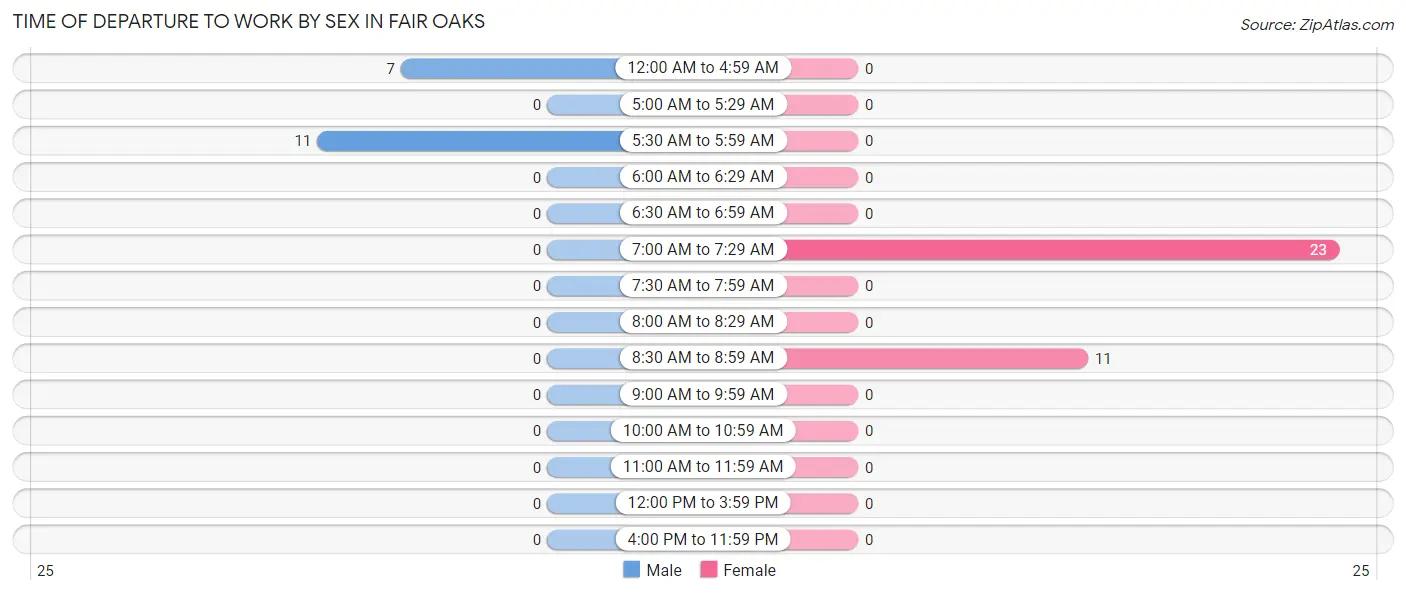
| Time of Departure | Male | Female |
| 12:00 AM to 4:59 AM | 7 (38.9%) | 0 (0.0%) |
| 5:00 AM to 5:29 AM | 0 (0.0%) | 0 (0.0%) |
| 5:30 AM to 5:59 AM | 11 (61.1%) | 0 (0.0%) |
| 6:00 AM to 6:29 AM | 0 (0.0%) | 0 (0.0%) |
| 6:30 AM to 6:59 AM | 0 (0.0%) | 0 (0.0%) |
| 7:00 AM to 7:29 AM | 0 (0.0%) | 23 (67.6%) |
| 7:30 AM to 7:59 AM | 0 (0.0%) | 0 (0.0%) |
| 8:00 AM to 8:29 AM | 0 (0.0%) | 0 (0.0%) |
| 8:30 AM to 8:59 AM | 0 (0.0%) | 11 (32.4%) |
| 9:00 AM to 9:59 AM | 0 (0.0%) | 0 (0.0%) |
| 10:00 AM to 10:59 AM | 0 (0.0%) | 0 (0.0%) |
| 11:00 AM to 11:59 AM | 0 (0.0%) | 0 (0.0%) |
| 12:00 PM to 3:59 PM | 0 (0.0%) | 0 (0.0%) |
| 4:00 PM to 11:59 PM | 0 (0.0%) | 0 (0.0%) |
| Total | 18 (100.0%) | 34 (100.0%) |
Housing Occupancy in Fair Oaks
Occupancy by Ownership in Fair Oaks
Of the total 101 dwellings in Fair Oaks, owner-occupied units account for 101 (100.0%), while renter-occupied units make up 0 (0.0%).
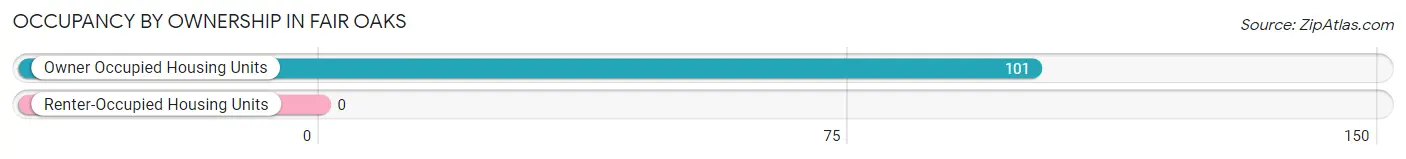
| Occupancy | # Housing Units | % Housing Units |
| Owner Occupied Housing Units | 101 | 100.0% |
| Renter-Occupied Housing Units | 0 | 0.0% |
| Total Occupied Housing Units | 101 | 100.0% |
Occupancy by Household Size in Fair Oaks
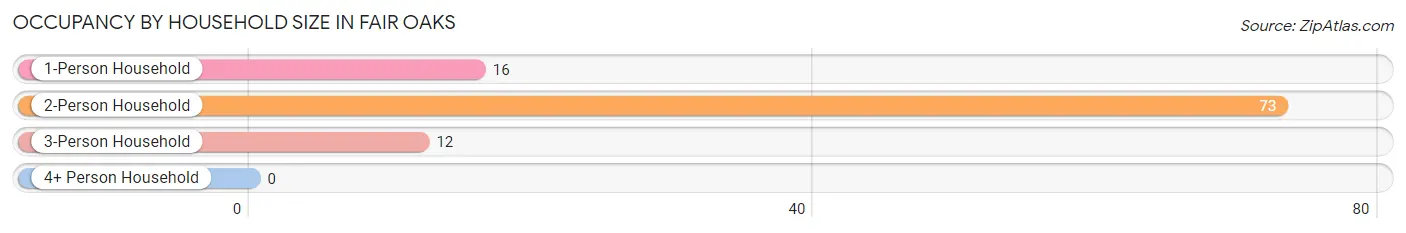
| Household Size | # Housing Units | % Housing Units |
| 1-Person Household | 16 | 15.8% |
| 2-Person Household | 73 | 72.3% |
| 3-Person Household | 12 | 11.9% |
| 4+ Person Household | 0 | 0.0% |
| Total Housing Units | 101 | 100.0% |
Occupancy by Ownership by Household Size in Fair Oaks
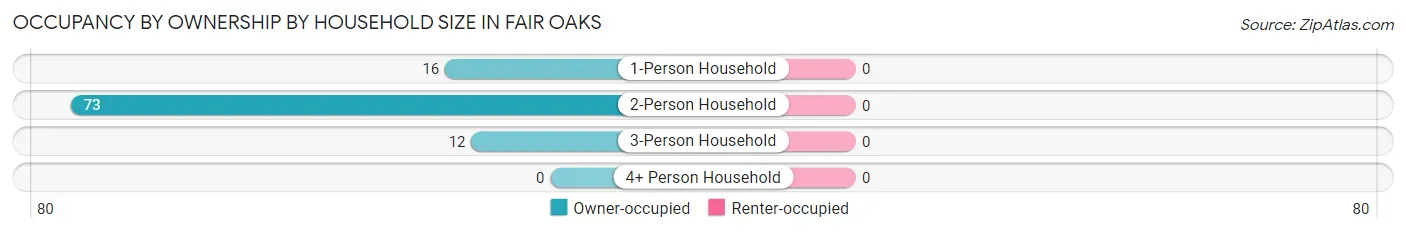
| Household Size | Owner-occupied | Renter-occupied |
| 1-Person Household | 16 (100.0%) | 0 (0.0%) |
| 2-Person Household | 73 (100.0%) | 0 (0.0%) |
| 3-Person Household | 12 (100.0%) | 0 (0.0%) |
| 4+ Person Household | 0 (0.0%) | 0 (0.0%) |
| Total Housing Units | 101 (100.0%) | 0 (0.0%) |
Occupancy by Educational Attainment in Fair Oaks
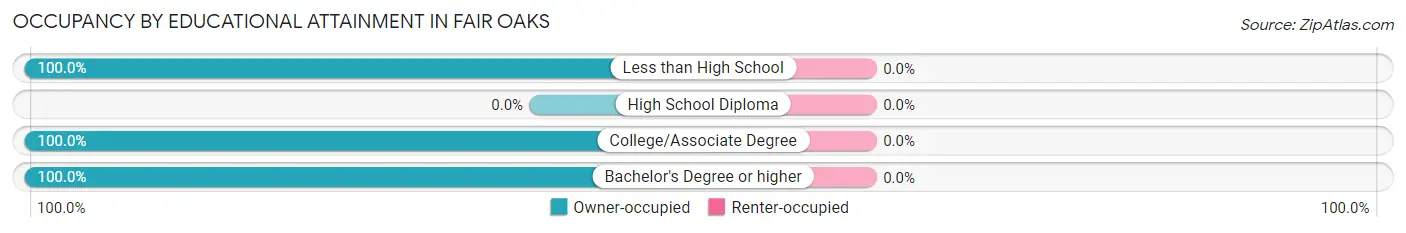
| Household Size | Owner-occupied | Renter-occupied |
| Less than High School | 11 (100.0%) | 0 (0.0%) |
| High School Diploma | 0 (0.0%) | 0 (0.0%) |
| College/Associate Degree | 66 (100.0%) | 0 (0.0%) |
| Bachelor's Degree or higher | 24 (100.0%) | 0 (0.0%) |
Occupancy by Age of Householder in Fair Oaks
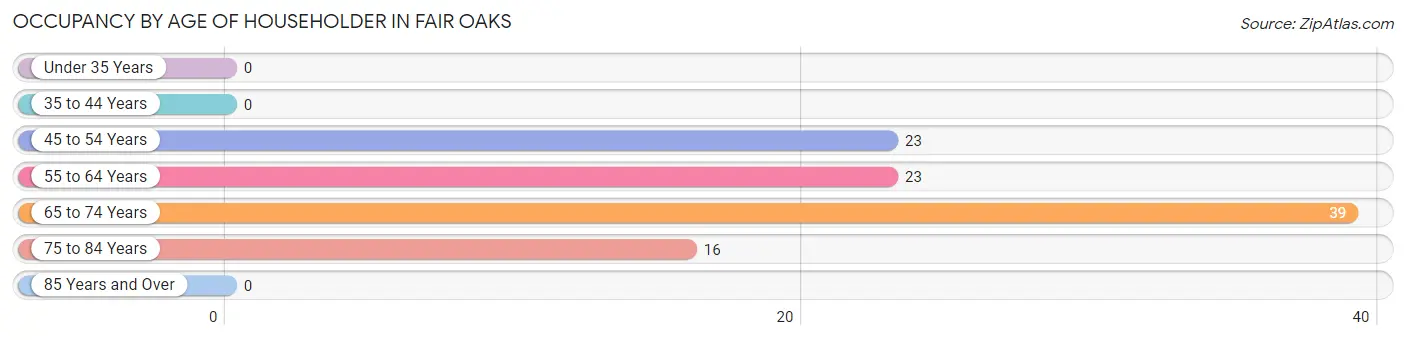
| Age Bracket | # Households | % Households |
| Under 35 Years | 0 | 0.0% |
| 35 to 44 Years | 0 | 0.0% |
| 45 to 54 Years | 23 | 22.8% |
| 55 to 64 Years | 23 | 22.8% |
| 65 to 74 Years | 39 | 38.6% |
| 75 to 84 Years | 16 | 15.8% |
| 85 Years and Over | 0 | 0.0% |
| Total | 101 | 100.0% |
Housing Finances in Fair Oaks
Median Income by Occupancy in Fair Oaks
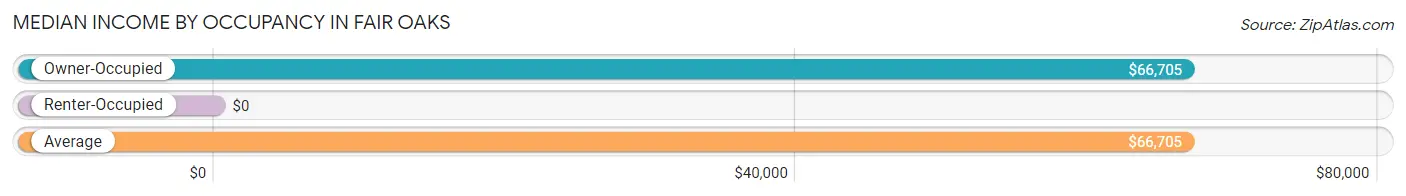
| Occupancy Type | # Households | Median Income |
| Owner-Occupied | 101 (100.0%) | $66,705 |
| Renter-Occupied | 0 (0.0%) | $0 |
| Average | 101 (100.0%) | $66,705 |
Occupancy by Householder Income Bracket in Fair Oaks
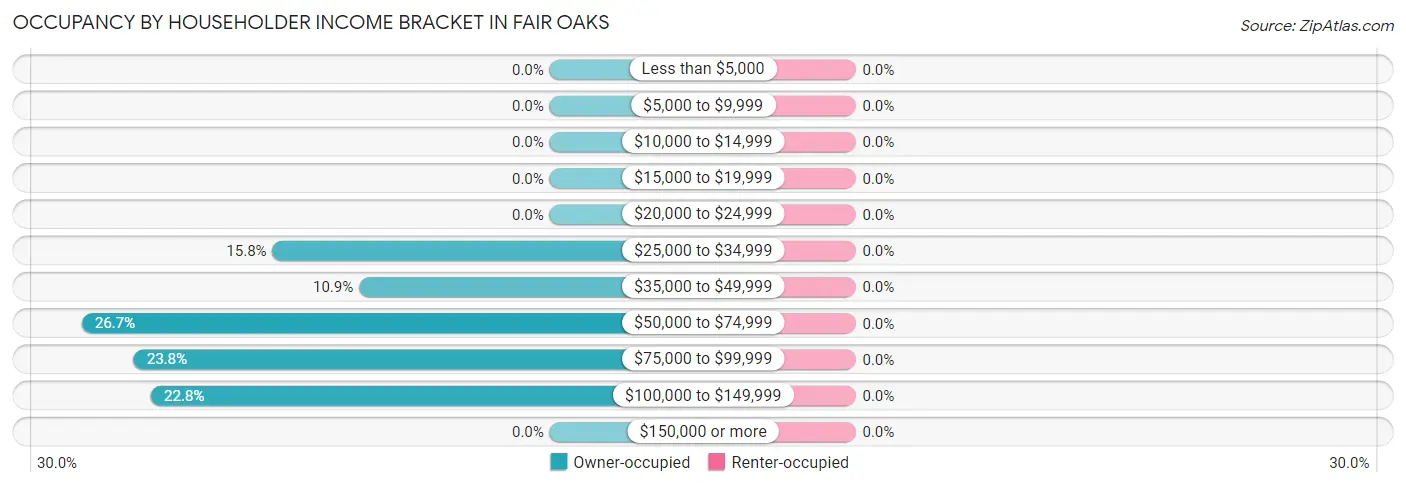
| Income Bracket | Owner-occupied | Renter-occupied |
| Less than $5,000 | 0 (0.0%) | 0 (0.0%) |
| $5,000 to $9,999 | 0 (0.0%) | 0 (0.0%) |
| $10,000 to $14,999 | 0 (0.0%) | 0 (0.0%) |
| $15,000 to $19,999 | 0 (0.0%) | 0 (0.0%) |
| $20,000 to $24,999 | 0 (0.0%) | 0 (0.0%) |
| $25,000 to $34,999 | 16 (15.8%) | 0 (0.0%) |
| $35,000 to $49,999 | 11 (10.9%) | 0 (0.0%) |
| $50,000 to $74,999 | 27 (26.7%) | 0 (0.0%) |
| $75,000 to $99,999 | 24 (23.8%) | 0 (0.0%) |
| $100,000 to $149,999 | 23 (22.8%) | 0 (0.0%) |
| $150,000 or more | 0 (0.0%) | 0 (0.0%) |
| Total | 101 (100.0%) | 0 (0.0%) |
Monthly Housing Cost Tiers in Fair Oaks
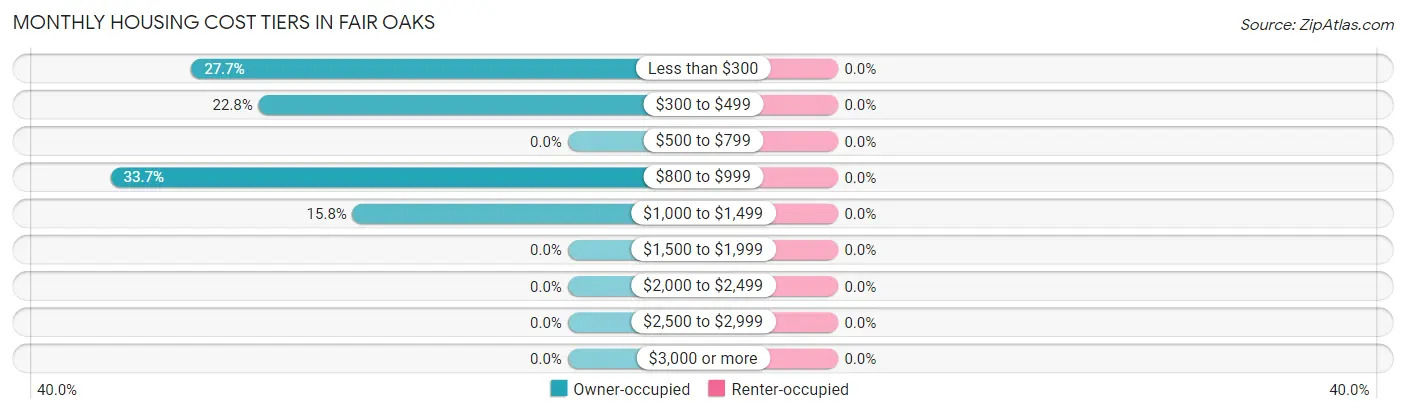
| Monthly Cost | Owner-occupied | Renter-occupied |
| Less than $300 | 28 (27.7%) | 0 (0.0%) |
| $300 to $499 | 23 (22.8%) | 0 (0.0%) |
| $500 to $799 | 0 (0.0%) | 0 (0.0%) |
| $800 to $999 | 34 (33.7%) | 0 (0.0%) |
| $1,000 to $1,499 | 16 (15.8%) | 0 (0.0%) |
| $1,500 to $1,999 | 0 (0.0%) | 0 (0.0%) |
| $2,000 to $2,499 | 0 (0.0%) | 0 (0.0%) |
| $2,500 to $2,999 | 0 (0.0%) | 0 (0.0%) |
| $3,000 or more | 0 (0.0%) | 0 (0.0%) |
| Total | 101 (100.0%) | 0 (0.0%) |
Physical Housing Characteristics in Fair Oaks
Housing Structures in Fair Oaks
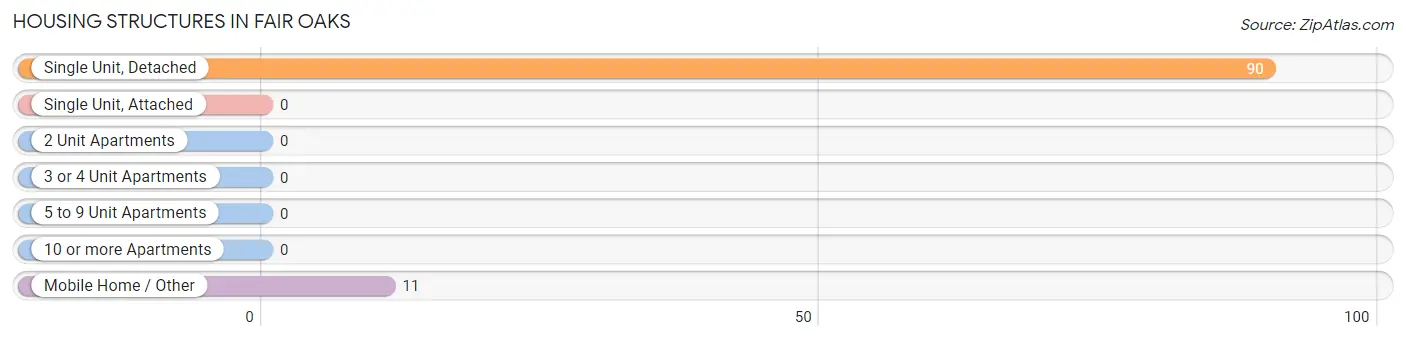
| Structure Type | # Housing Units | % Housing Units |
| Single Unit, Detached | 90 | 89.1% |
| Single Unit, Attached | 0 | 0.0% |
| 2 Unit Apartments | 0 | 0.0% |
| 3 or 4 Unit Apartments | 0 | 0.0% |
| 5 to 9 Unit Apartments | 0 | 0.0% |
| 10 or more Apartments | 0 | 0.0% |
| Mobile Home / Other | 11 | 10.9% |
| Total | 101 | 100.0% |
Housing Structures by Occupancy in Fair Oaks
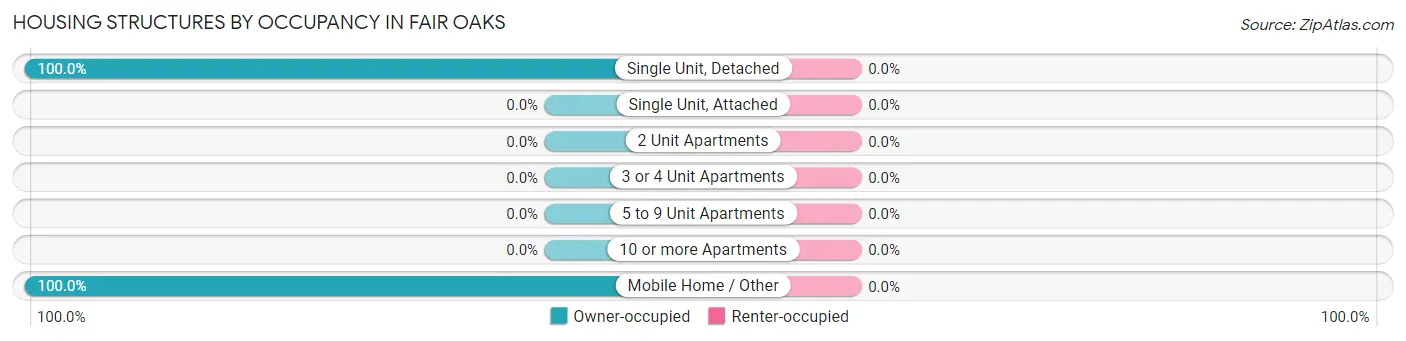
| Structure Type | Owner-occupied | Renter-occupied |
| Single Unit, Detached | 90 (100.0%) | 0 (0.0%) |
| Single Unit, Attached | 0 (0.0%) | 0 (0.0%) |
| 2 Unit Apartments | 0 (0.0%) | 0 (0.0%) |
| 3 or 4 Unit Apartments | 0 (0.0%) | 0 (0.0%) |
| 5 to 9 Unit Apartments | 0 (0.0%) | 0 (0.0%) |
| 10 or more Apartments | 0 (0.0%) | 0 (0.0%) |
| Mobile Home / Other | 11 (100.0%) | 0 (0.0%) |
| Total | 101 (100.0%) | 0 (0.0%) |
Housing Structures by Number of Rooms in Fair Oaks
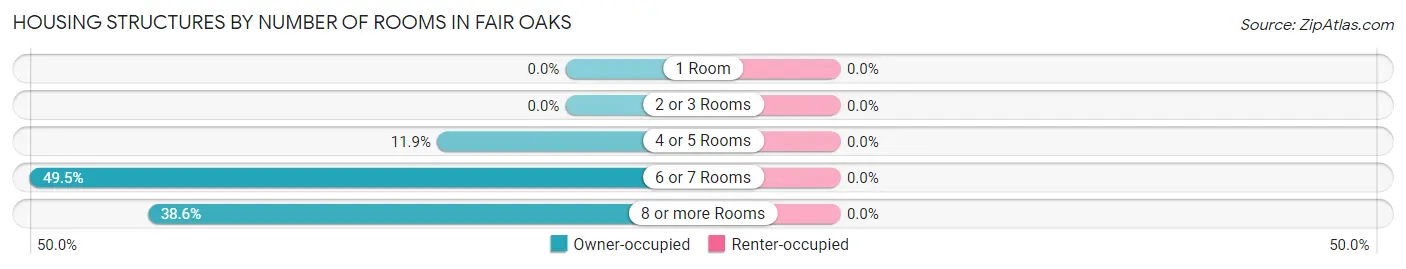
| Number of Rooms | Owner-occupied | Renter-occupied |
| 1 Room | 0 (0.0%) | 0 (0.0%) |
| 2 or 3 Rooms | 0 (0.0%) | 0 (0.0%) |
| 4 or 5 Rooms | 12 (11.9%) | 0 (0.0%) |
| 6 or 7 Rooms | 50 (49.5%) | 0 (0.0%) |
| 8 or more Rooms | 39 (38.6%) | 0 (0.0%) |
| Total | 101 (100.0%) | 0 (0.0%) |
Housing Structure by Heating Type in Fair Oaks
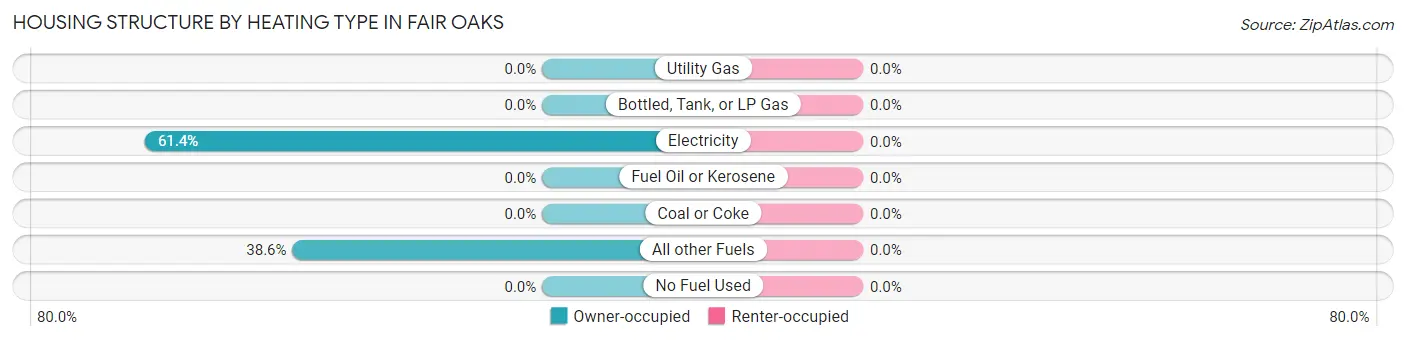
| Heating Type | Owner-occupied | Renter-occupied |
| Utility Gas | 0 (0.0%) | 0 (0.0%) |
| Bottled, Tank, or LP Gas | 0 (0.0%) | 0 (0.0%) |
| Electricity | 62 (61.4%) | 0 (0.0%) |
| Fuel Oil or Kerosene | 0 (0.0%) | 0 (0.0%) |
| Coal or Coke | 0 (0.0%) | 0 (0.0%) |
| All other Fuels | 39 (38.6%) | 0 (0.0%) |
| No Fuel Used | 0 (0.0%) | 0 (0.0%) |
| Total | 101 (100.0%) | 0 (0.0%) |
Household Vehicle Usage in Fair Oaks
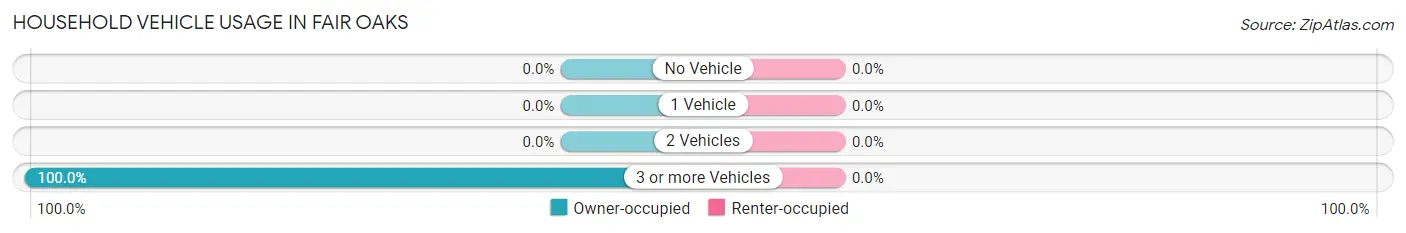
| Vehicles per Household | Owner-occupied | Renter-occupied |
| No Vehicle | 0 (0.0%) | 0 (0.0%) |
| 1 Vehicle | 0 (0.0%) | 0 (0.0%) |
| 2 Vehicles | 0 (0.0%) | 0 (0.0%) |
| 3 or more Vehicles | 101 (100.0%) | 0 (0.0%) |
| Total | 101 (100.0%) | 0 (0.0%) |
Real Estate & Mortgages in Fair Oaks
Real Estate and Mortgage Overview in Fair Oaks
| Characteristic | Without Mortgage | With Mortgage |
| Housing Units | 51 | 50 |
| Median Property Value | $275,900 | $0 |
| Median Household Income | $67,159 | $0 |
| Monthly Housing Costs | $246 | $0 |
| Real Estate Taxes | $1,453 | $0 |
Property Value by Mortgage Status in Fair Oaks
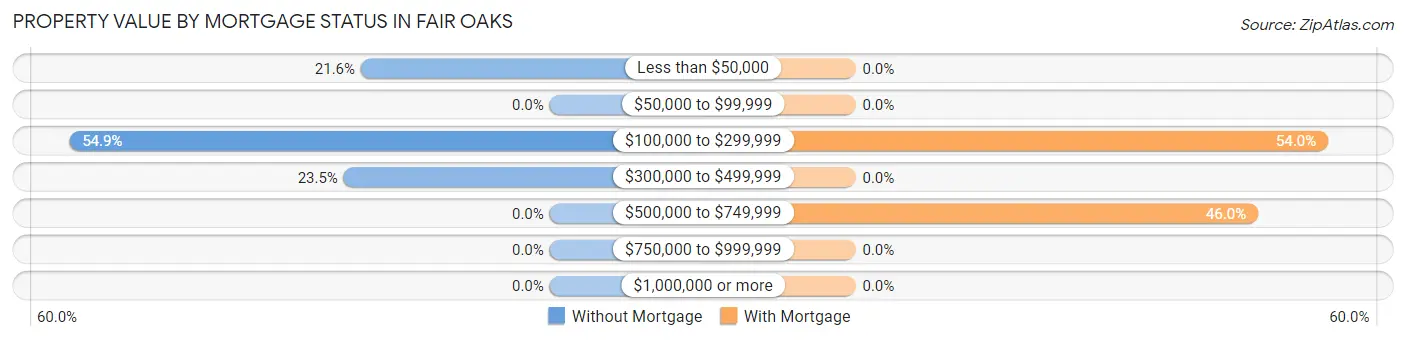
| Property Value | Without Mortgage | With Mortgage |
| Less than $50,000 | 11 (21.6%) | 0 (0.0%) |
| $50,000 to $99,999 | 0 (0.0%) | 0 (0.0%) |
| $100,000 to $299,999 | 28 (54.9%) | 27 (54.0%) |
| $300,000 to $499,999 | 12 (23.5%) | 0 (0.0%) |
| $500,000 to $749,999 | 0 (0.0%) | 23 (46.0%) |
| $750,000 to $999,999 | 0 (0.0%) | 0 (0.0%) |
| $1,000,000 or more | 0 (0.0%) | 0 (0.0%) |
| Total | 51 (100.0%) | 50 (100.0%) |
Household Income by Mortgage Status in Fair Oaks
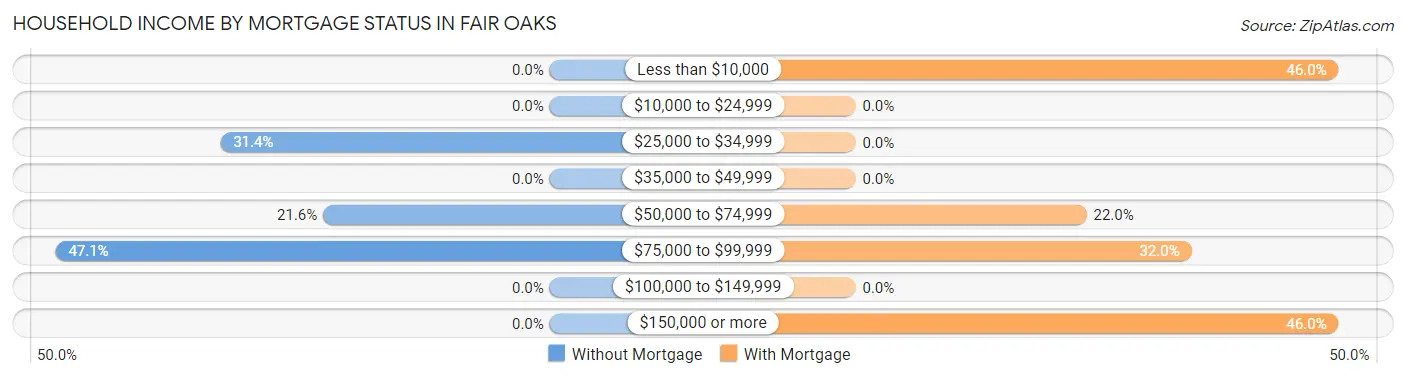
| Household Income | Without Mortgage | With Mortgage |
| Less than $10,000 | 0 (0.0%) | 23 (46.0%) |
| $10,000 to $24,999 | 0 (0.0%) | 0 (0.0%) |
| $25,000 to $34,999 | 16 (31.4%) | 0 (0.0%) |
| $35,000 to $49,999 | 0 (0.0%) | 0 (0.0%) |
| $50,000 to $74,999 | 11 (21.6%) | 11 (22.0%) |
| $75,000 to $99,999 | 24 (47.1%) | 16 (32.0%) |
| $100,000 to $149,999 | 0 (0.0%) | 0 (0.0%) |
| $150,000 or more | 0 (0.0%) | 23 (46.0%) |
| Total | 51 (100.0%) | 50 (100.0%) |
Property Value to Household Income Ratio in Fair Oaks
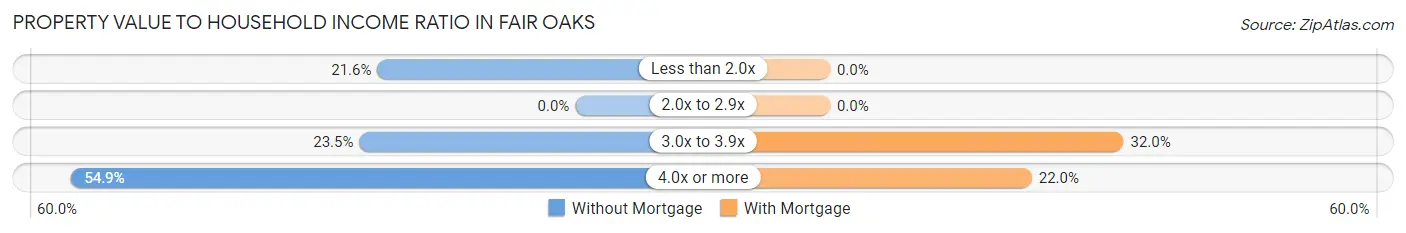
| Value-to-Income Ratio | Without Mortgage | With Mortgage |
| Less than 2.0x | 11 (21.6%) | 0 (0.0%) |
| 2.0x to 2.9x | 0 (0.0%) | 0 (0.0%) |
| 3.0x to 3.9x | 12 (23.5%) | 16 (32.0%) |
| 4.0x or more | 28 (54.9%) | 11 (22.0%) |
| Total | 51 (100.0%) | 50 (100.0%) |
Real Estate Taxes by Mortgage Status in Fair Oaks
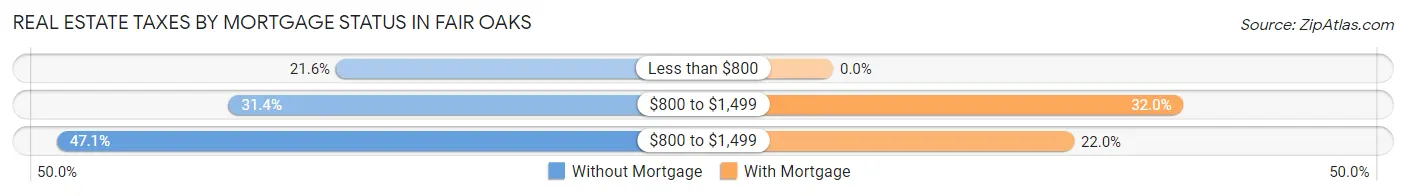
| Property Taxes | Without Mortgage | With Mortgage |
| Less than $800 | 11 (21.6%) | 0 (0.0%) |
| $800 to $1,499 | 16 (31.4%) | 16 (32.0%) |
| $800 to $1,499 | 24 (47.1%) | 11 (22.0%) |
| Total | 51 (100.0%) | 50 (100.0%) |
Health & Disability in Fair Oaks
Health Insurance Coverage by Age in Fair Oaks
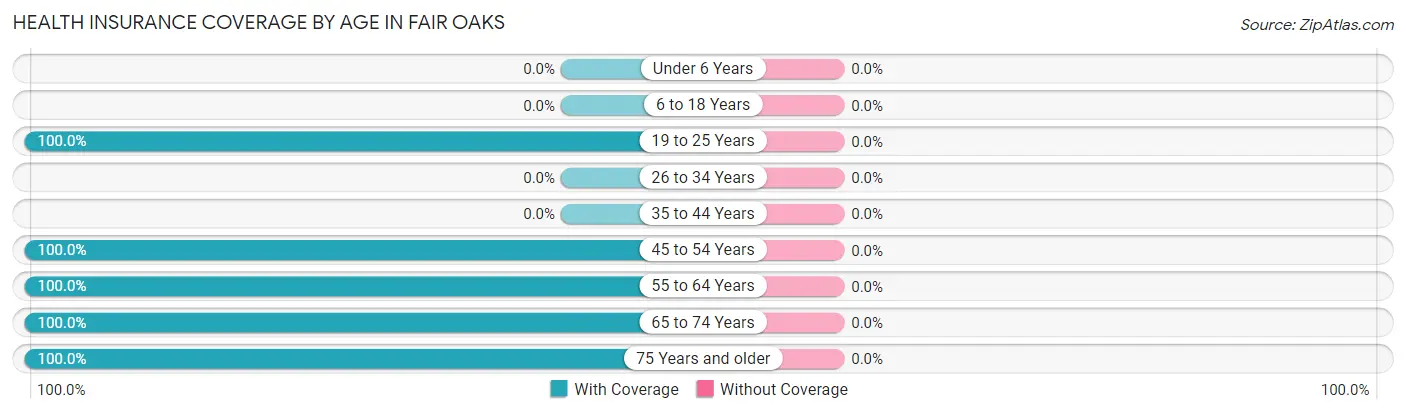
| Age Bracket | With Coverage | Without Coverage |
| Under 6 Years | 0 (0.0%) | 0 (0.0%) |
| 6 to 18 Years | 0 (0.0%) | 0 (0.0%) |
| 19 to 25 Years | 14 (100.0%) | 0 (0.0%) |
| 26 to 34 Years | 0 (0.0%) | 0 (0.0%) |
| 35 to 44 Years | 0 (0.0%) | 0 (0.0%) |
| 45 to 54 Years | 36 (100.0%) | 0 (0.0%) |
| 55 to 64 Years | 55 (100.0%) | 0 (0.0%) |
| 65 to 74 Years | 83 (100.0%) | 0 (0.0%) |
| 75 Years and older | 16 (100.0%) | 0 (0.0%) |
| Total | 204 (100.0%) | 0 (0.0%) |
Health Insurance Coverage by Citizenship Status in Fair Oaks
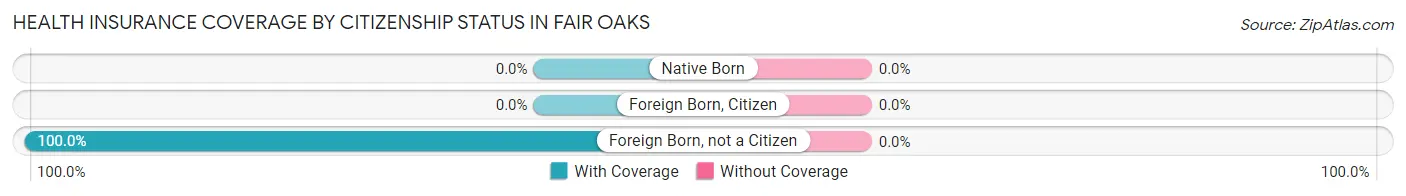
| Citizenship Status | With Coverage | Without Coverage |
| Native Born | 0 (0.0%) | 0 (0.0%) |
| Foreign Born, Citizen | 0 (0.0%) | 0 (0.0%) |
| Foreign Born, not a Citizen | 14 (100.0%) | 0 (0.0%) |
Health Insurance Coverage by Household Income in Fair Oaks
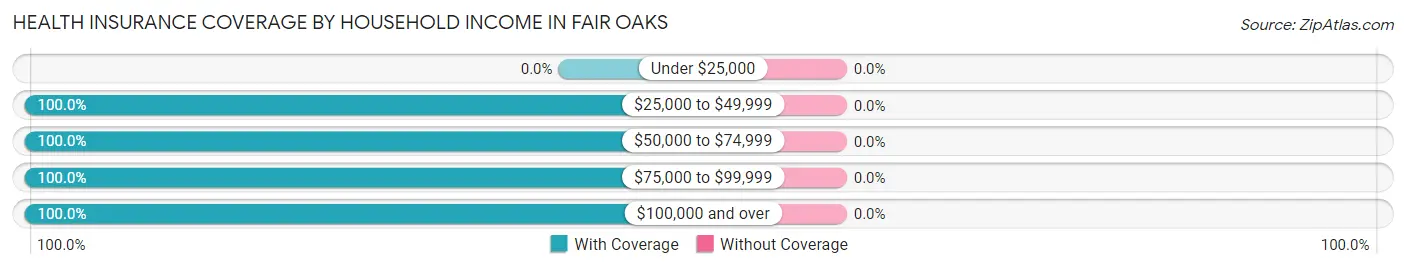
| Household Income | With Coverage | Without Coverage |
| Under $25,000 | 0 (0.0%) | 0 (0.0%) |
| $25,000 to $49,999 | 54 (100.0%) | 0 (0.0%) |
| $50,000 to $74,999 | 38 (100.0%) | 0 (0.0%) |
| $75,000 to $99,999 | 64 (100.0%) | 0 (0.0%) |
| $100,000 and over | 48 (100.0%) | 0 (0.0%) |
Public vs Private Health Insurance Coverage by Age in Fair Oaks
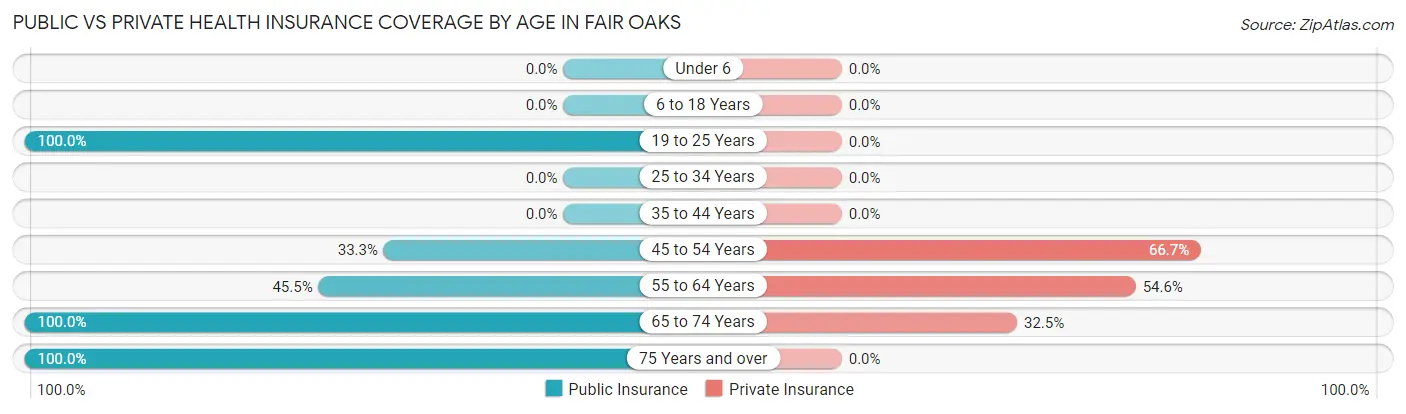
| Age Bracket | Public Insurance | Private Insurance |
| Under 6 | 0 (0.0%) | 0 (0.0%) |
| 6 to 18 Years | 0 (0.0%) | 0 (0.0%) |
| 19 to 25 Years | 14 (100.0%) | 0 (0.0%) |
| 25 to 34 Years | 0 (0.0%) | 0 (0.0%) |
| 35 to 44 Years | 0 (0.0%) | 0 (0.0%) |
| 45 to 54 Years | 12 (33.3%) | 24 (66.7%) |
| 55 to 64 Years | 25 (45.5%) | 30 (54.5%) |
| 65 to 74 Years | 83 (100.0%) | 27 (32.5%) |
| 75 Years and over | 16 (100.0%) | 0 (0.0%) |
| Total | 150 (73.5%) | 81 (39.7%) |
Disability Status by Sex by Age in Fair Oaks
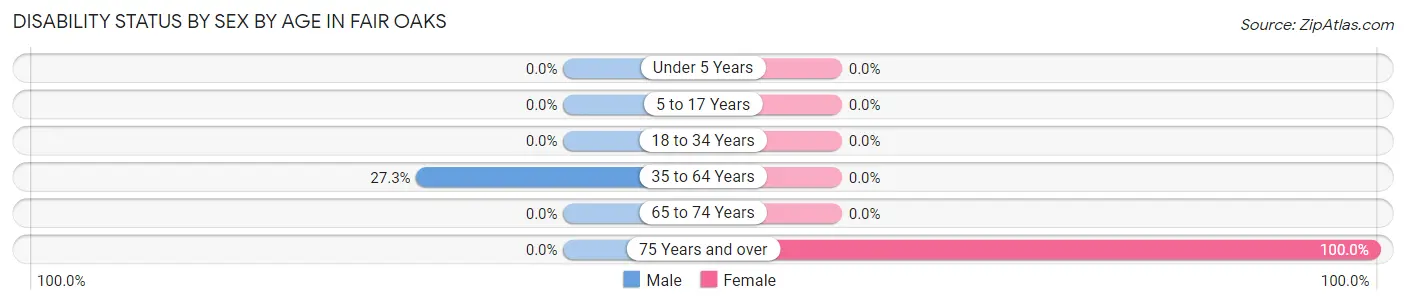
| Age Bracket | Male | Female |
| Under 5 Years | 0 (0.0%) | 0 (0.0%) |
| 5 to 17 Years | 0 (0.0%) | 0 (0.0%) |
| 18 to 34 Years | 0 (0.0%) | 0 (0.0%) |
| 35 to 64 Years | 12 (27.3%) | 0 (0.0%) |
| 65 to 74 Years | 0 (0.0%) | 0 (0.0%) |
| 75 Years and over | 0 (0.0%) | 16 (100.0%) |
Disability Class by Sex by Age in Fair Oaks
Disability Class: Hearing Difficulty
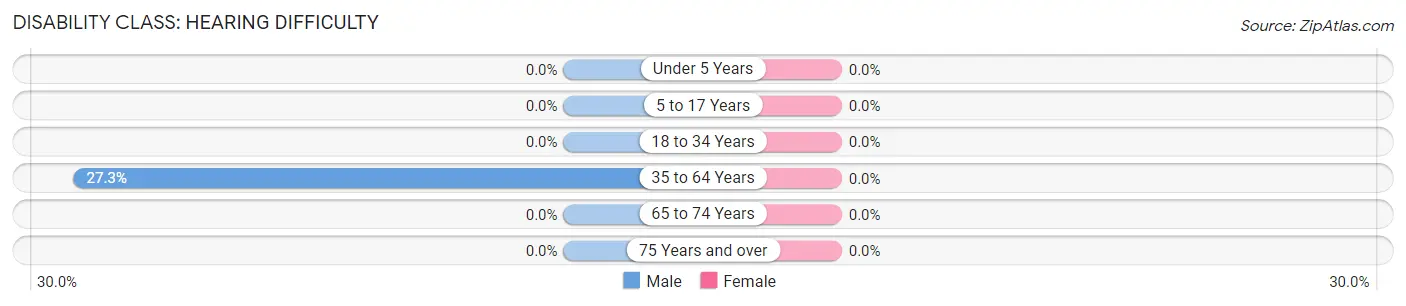
| Age Bracket | Male | Female |
| Under 5 Years | 0 (0.0%) | 0 (0.0%) |
| 5 to 17 Years | 0 (0.0%) | 0 (0.0%) |
| 18 to 34 Years | 0 (0.0%) | 0 (0.0%) |
| 35 to 64 Years | 12 (27.3%) | 0 (0.0%) |
| 65 to 74 Years | 0 (0.0%) | 0 (0.0%) |
| 75 Years and over | 0 (0.0%) | 0 (0.0%) |
Disability Class: Vision Difficulty
| Age Bracket | Male | Female |
| Under 5 Years | 0 (0.0%) | 0 (0.0%) |
| 5 to 17 Years | 0 (0.0%) | 0 (0.0%) |
| 18 to 34 Years | 0 (0.0%) | 0 (0.0%) |
| 35 to 64 Years | 0 (0.0%) | 0 (0.0%) |
| 65 to 74 Years | 0 (0.0%) | 0 (0.0%) |
| 75 Years and over | 0 (0.0%) | 0 (0.0%) |
Disability Class: Cognitive Difficulty
| Age Bracket | Male | Female |
| 5 to 17 Years | 0 (0.0%) | 0 (0.0%) |
| 18 to 34 Years | 0 (0.0%) | 0 (0.0%) |
| 35 to 64 Years | 0 (0.0%) | 0 (0.0%) |
| 65 to 74 Years | 0 (0.0%) | 0 (0.0%) |
| 75 Years and over | 0 (0.0%) | 0 (0.0%) |
Disability Class: Ambulatory Difficulty
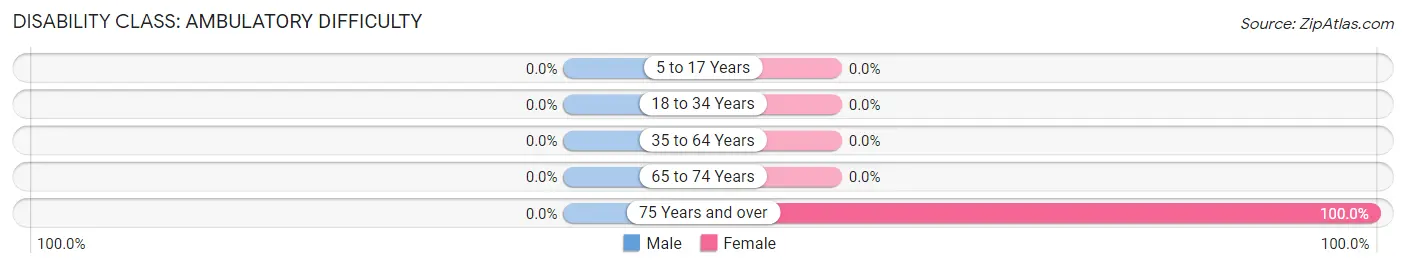
| Age Bracket | Male | Female |
| 5 to 17 Years | 0 (0.0%) | 0 (0.0%) |
| 18 to 34 Years | 0 (0.0%) | 0 (0.0%) |
| 35 to 64 Years | 0 (0.0%) | 0 (0.0%) |
| 65 to 74 Years | 0 (0.0%) | 0 (0.0%) |
| 75 Years and over | 0 (0.0%) | 16 (100.0%) |
Disability Class: Self-Care Difficulty
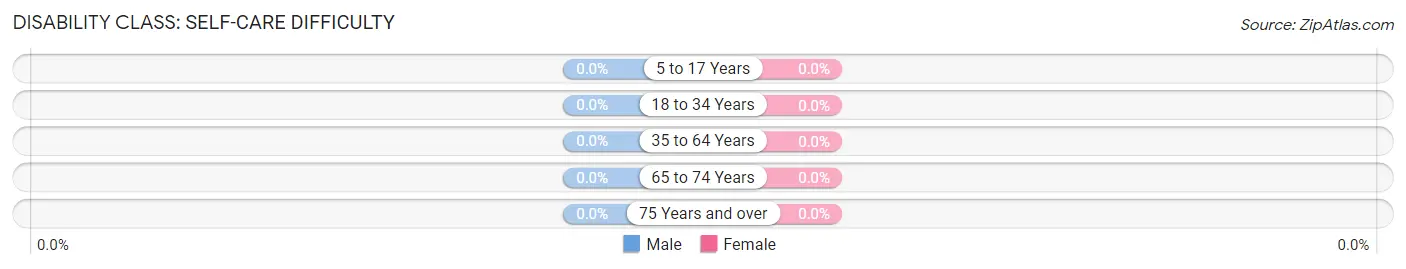
| Age Bracket | Male | Female |
| 5 to 17 Years | 0 (0.0%) | 0 (0.0%) |
| 18 to 34 Years | 0 (0.0%) | 0 (0.0%) |
| 35 to 64 Years | 0 (0.0%) | 0 (0.0%) |
| 65 to 74 Years | 0 (0.0%) | 0 (0.0%) |
| 75 Years and over | 0 (0.0%) | 0 (0.0%) |
Technology Access in Fair Oaks
Computing Device Access in Fair Oaks
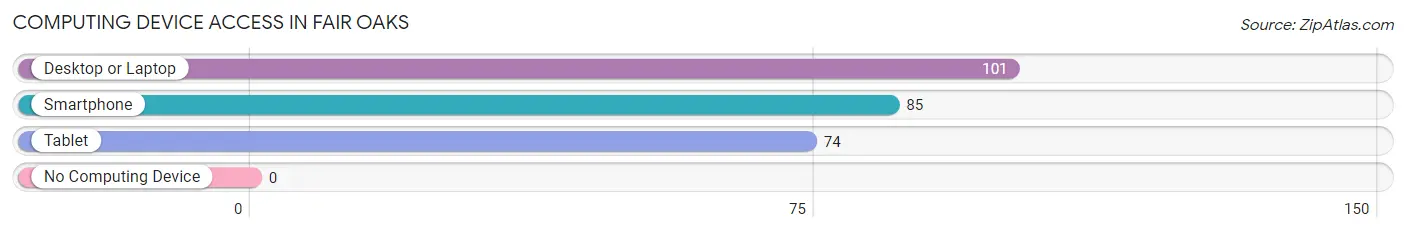
| Device Type | # Households | % Households |
| Desktop or Laptop | 101 | 100.0% |
| Smartphone | 85 | 84.2% |
| Tablet | 74 | 73.3% |
| No Computing Device | 0 | 0.0% |
| Total | 101 | 100.0% |
Internet Access in Fair Oaks
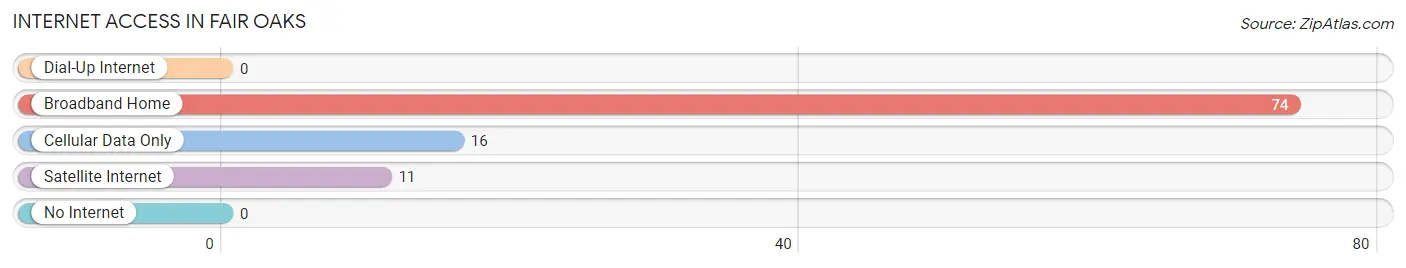
| Internet Type | # Households | % Households |
| Dial-Up Internet | 0 | 0.0% |
| Broadband Home | 74 | 73.3% |
| Cellular Data Only | 16 | 15.8% |
| Satellite Internet | 11 | 10.9% |
| No Internet | 0 | 0.0% |
| Total | 101 | 100.0% |
Fair Oaks Summary
Founded in 1855, Fair Oaks, Oregon is a small rural community located in the Willamette Valley of Oregon. The town is situated on the banks of the Willamette River, approximately 25 miles south of Portland. Fair Oaks is a small, unincorporated community with a population of just over 1,000 people.
Geography
Fair Oaks is located in the Willamette Valley of Oregon, approximately 25 miles south of Portland. The town is situated on the banks of the Willamette River, and is surrounded by rolling hills and lush forests. The climate in Fair Oaks is mild and temperate, with average temperatures ranging from the mid-50s in the winter to the mid-80s in the summer.
Economy
Fair Oaks is a small, rural community with a limited economy. The primary industries in the area are agriculture and forestry. The town is home to several small farms, as well as a few larger agricultural operations. The forestry industry is also important to the local economy, with several logging companies operating in the area. In addition, Fair Oaks is home to a few small businesses, including a grocery store, a hardware store, and a few restaurants.
Demographics
As of the 2010 census, Fair Oaks had a population of 1,072 people. The racial makeup of the town was 94.3% White, 0.7% African American, 0.7% Native American, 0.7% Asian, 0.3% Pacific Islander, and 2.7% from other races. The median household income in Fair Oaks was $45,000, and the median family income was $50,000.
History
Fair Oaks was founded in 1855 by a group of settlers from the Oregon Trail. The town was originally known as “Fair Oaks Station”, and was a stop on the Oregon Trail. The town was officially incorporated in 1876, and the name was changed to Fair Oaks. In the late 19th century, the town was a major hub for the timber industry, and the local economy was largely based on logging and lumber production. In the early 20th century, the town began to transition to an agricultural economy, and the local farms began to produce a variety of crops, including wheat, corn, and hay.
Today, Fair Oaks is a small, rural community with a population of just over 1,000 people. The town is home to several small farms, as well as a few larger agricultural operations. The forestry industry is also important to the local economy, with several logging companies operating in the area. In addition, Fair Oaks is home to a few small businesses, including a grocery store, a hardware store, and a few restaurants.
Common Questions
What is Per Capita Income in Fair Oaks?
Per Capita income in Fair Oaks is $39,182.
What is the Median Household income in Fair Oaks?
Median Household Income in Fair Oaks is $66,705.
What is Inequality or Gini Index in Fair Oaks?
Inequality or Gini Index in Fair Oaks is 0.28.
What is the Total Population of Fair Oaks?
Total Population of Fair Oaks is 204.
What is the Total Male Population of Fair Oaks?
Total Male Population of Fair Oaks is 117.
What is the Total Female Population of Fair Oaks?
Total Female Population of Fair Oaks is 87.
What is the Ratio of Males per 100 Females in Fair Oaks?
There are 134.48 Males per 100 Females in Fair Oaks.
What is the Ratio of Females per 100 Males in Fair Oaks?
There are 74.36 Females per 100 Males in Fair Oaks.
What is the Median Population Age in Fair Oaks?
Median Population Age in Fair Oaks is 62.9 Years.
What is the Average Family Size in Fair Oaks
Average Family Size in Fair Oaks is 2.2 People.
What is the Average Household Size in Fair Oaks
Average Household Size in Fair Oaks is 2.0 People.
How Large is the Labor Force in Fair Oaks?
There are 79 People in the Labor Forcein in Fair Oaks.
What is the Percentage of People in the Labor Force in Fair Oaks?
38.7% of People are in the Labor Force in Fair Oaks.
What is the Unemployment Rate in Fair Oaks?
Unemployment Rate in Fair Oaks is 17.7%.