La Presa, TX Map & Demographics
La Presa Map
La Presa Overview
$14,595
PER CAPITA INCOME
$50,691
AVG FAMILY INCOME
$50,505
AVG HOUSEHOLD INCOME
61.1%
WAGE / INCOME GAP [ % ]
38.9¢/ $1
WAGE / INCOME GAP [ $ ]
0.13
INEQUALITY / GINI INDEX
220
TOTAL POPULATION
123
MALE POPULATION
97
FEMALE POPULATION
126.80
MALES / 100 FEMALES
78.86
FEMALES / 100 MALES
37.7
MEDIAN AGE
2.9
AVG FAMILY SIZE
2.9
AVG HOUSEHOLD SIZE
87
LABOR FORCE [ PEOPLE ]
61.3%
PERCENT IN LABOR FORCE
Income in La Presa
Income Overview in La Presa
Per Capita Income in La Presa is $14,595, while median incomes of families and households are $50,691 and $50,505 respectively.
| Characteristic | Number | Measure |
| Per Capita Income | 220 | $14,595 |
| Median Family Income | 68 | $50,691 |
| Mean Family Income | 68 | $0 |
| Median Household Income | 75 | $50,505 |
| Mean Household Income | 75 | $43,392 |
| Income Deficit | 68 | $0 |
| Wage / Income Gap (%) | 220 | 61.13% |
| Wage / Income Gap ($) | 220 | 38.87¢ per $1 |
| Gini / Inequality Index | 220 | 0.13 |
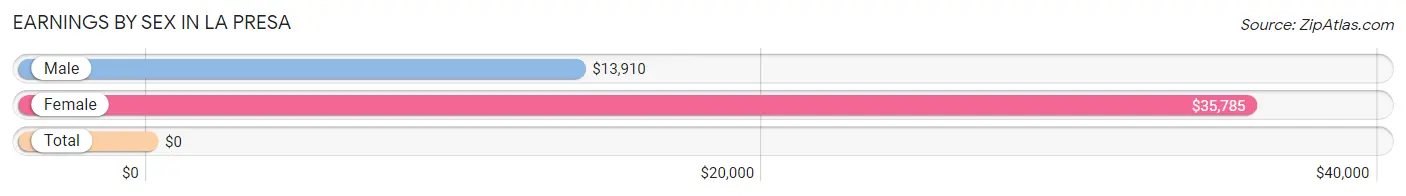
Earnings by Sex in La Presa
| Sex | Number | Average Earnings |
| Male | 71 (54.6%) | $13,910 |
| Female | 59 (45.4%) | $35,785 |
| Total | 130 (100.0%) | $0 |
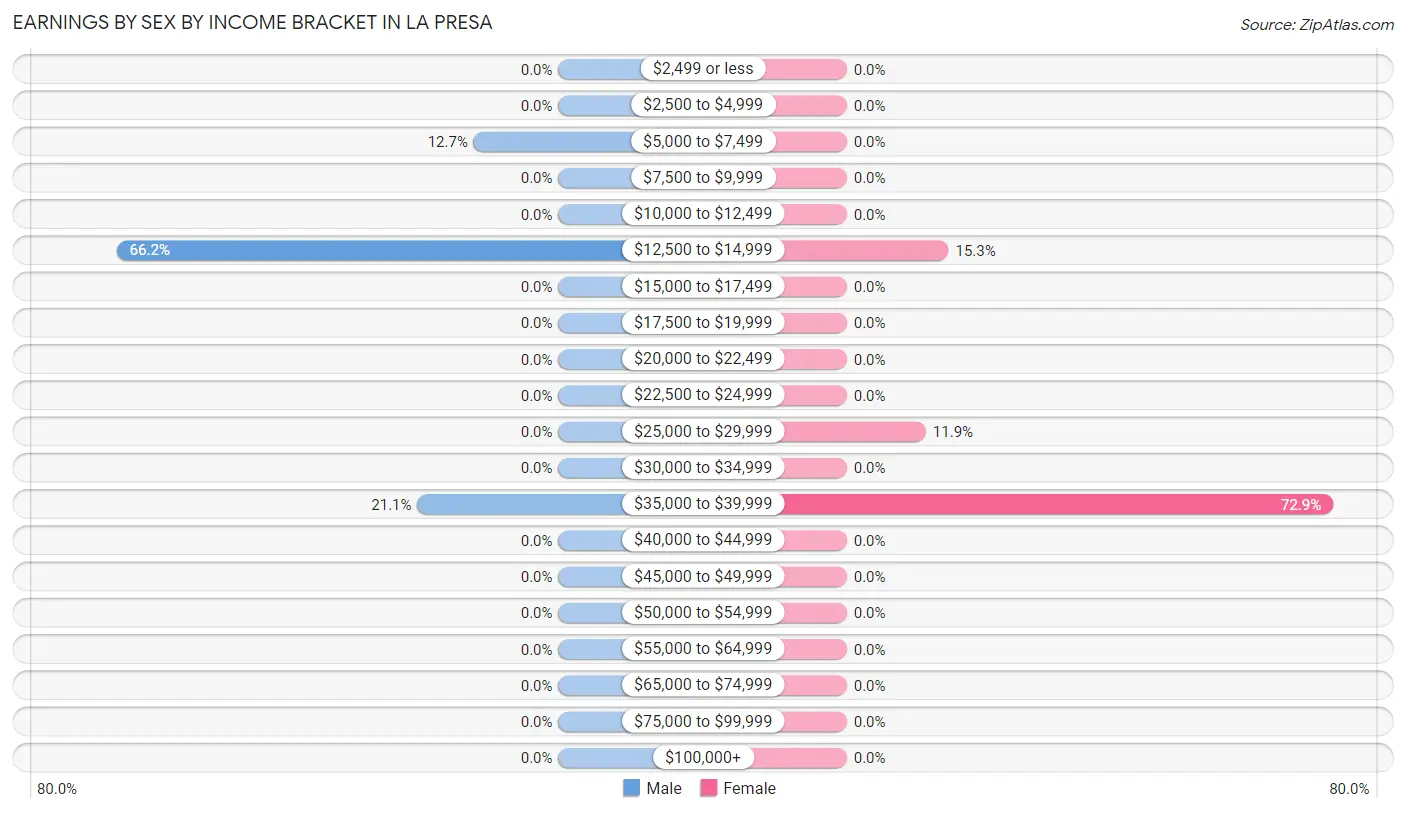
Earnings by Sex by Income Bracket in La Presa
The most common earnings brackets in La Presa are $12,500 to $14,999 for men (47 | 66.2%) and $35,000 to $39,999 for women (43 | 72.9%).
| Income | Male | Female |
| $2,499 or less | 0 (0.0%) | 0 (0.0%) |
| $2,500 to $4,999 | 0 (0.0%) | 0 (0.0%) |
| $5,000 to $7,499 | 9 (12.7%) | 0 (0.0%) |
| $7,500 to $9,999 | 0 (0.0%) | 0 (0.0%) |
| $10,000 to $12,499 | 0 (0.0%) | 0 (0.0%) |
| $12,500 to $14,999 | 47 (66.2%) | 9 (15.2%) |
| $15,000 to $17,499 | 0 (0.0%) | 0 (0.0%) |
| $17,500 to $19,999 | 0 (0.0%) | 0 (0.0%) |
| $20,000 to $22,499 | 0 (0.0%) | 0 (0.0%) |
| $22,500 to $24,999 | 0 (0.0%) | 0 (0.0%) |
| $25,000 to $29,999 | 0 (0.0%) | 7 (11.9%) |
| $30,000 to $34,999 | 0 (0.0%) | 0 (0.0%) |
| $35,000 to $39,999 | 15 (21.1%) | 43 (72.9%) |
| $40,000 to $44,999 | 0 (0.0%) | 0 (0.0%) |
| $45,000 to $49,999 | 0 (0.0%) | 0 (0.0%) |
| $50,000 to $54,999 | 0 (0.0%) | 0 (0.0%) |
| $55,000 to $64,999 | 0 (0.0%) | 0 (0.0%) |
| $65,000 to $74,999 | 0 (0.0%) | 0 (0.0%) |
| $75,000 to $99,999 | 0 (0.0%) | 0 (0.0%) |
| $100,000+ | 0 (0.0%) | 0 (0.0%) |
| Total | 71 (100.0%) | 59 (100.0%) |
Earnings by Sex by Educational Attainment in La Presa
| Educational Attainment | Male Income | Female Income |
| Less than High School | - | - |
| High School Diploma | - | - |
| College or Associate's Degree | - | - |
| Bachelor's Degree | - | - |
| Graduate Degree | - | - |
| Total | $13,910 | $35,785 |
Family Income in La Presa
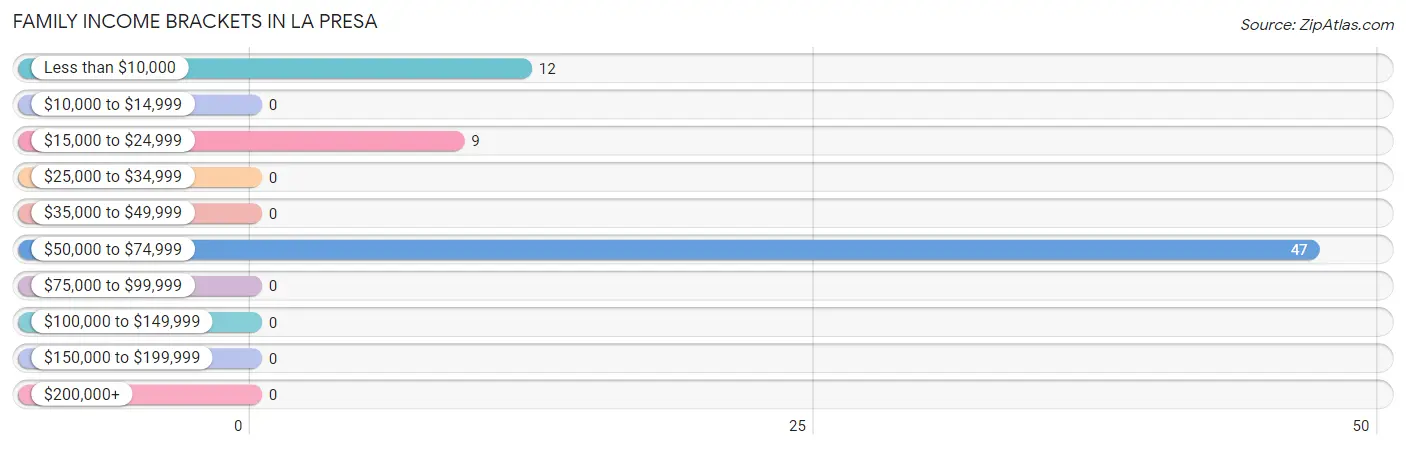
Family Income Brackets in La Presa
According to the La Presa family income data, there are 47 families falling into the $50,000 to $74,999 income range, which is the most common income bracket and makes up 69.1% of all families.
| Income Bracket | # Families | % Families |
| Less than $10,000 | 12 | 17.6% |
| $10,000 to $14,999 | 0 | 0.0% |
| $15,000 to $24,999 | 9 | 13.2% |
| $25,000 to $34,999 | 0 | 0.0% |
| $35,000 to $49,999 | 0 | 0.0% |
| $50,000 to $74,999 | 47 | 69.1% |
| $75,000 to $99,999 | 0 | 0.0% |
| $100,000 to $149,999 | 0 | 0.0% |
| $150,000 to $199,999 | 0 | 0.0% |
| $200,000+ | 0 | 0.0% |
Family Income by Famaliy Size in La Presa
| Income Bracket | # Families | Median Income |
| 2-Person Families | 47 (69.1%) | $0 |
| 3-Person Families | 0 (0.0%) | $0 |
| 4-Person Families | 9 (13.2%) | $0 |
| 5-Person Families | 12 (17.6%) | $0 |
| 6-Person Families | 0 (0.0%) | $0 |
| 7+ Person Families | 0 (0.0%) | $0 |
| Total | 68 (100.0%) | $50,691 |
Family Income by Number of Earners in La Presa
| Number of Earners | # Families | Median Income |
| No Earners | 12 (17.6%) | $0 |
| 1 Earner | 0 (0.0%) | $0 |
| 2 Earners | 56 (82.4%) | $0 |
| 3+ Earners | 0 (0.0%) | $0 |
| Total | 68 (100.0%) | $50,691 |
Household Income in La Presa
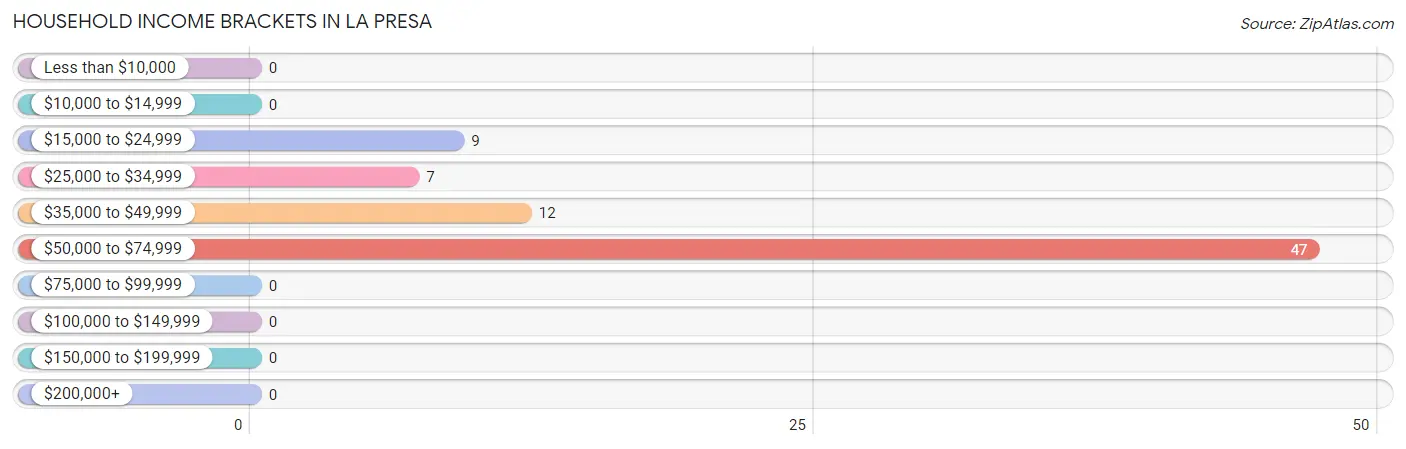
Household Income Brackets in La Presa
With 47 households falling in the category, the $50,000 to $74,999 income range is the most frequent in La Presa, accounting for 62.7% of all households.
| Income Bracket | # Households | % Households |
| Less than $10,000 | 0 | 0.0% |
| $10,000 to $14,999 | 0 | 0.0% |
| $15,000 to $24,999 | 9 | 12.0% |
| $25,000 to $34,999 | 7 | 9.3% |
| $35,000 to $49,999 | 12 | 16.0% |
| $50,000 to $74,999 | 47 | 62.7% |
| $75,000 to $99,999 | 0 | 0.0% |
| $100,000 to $149,999 | 0 | 0.0% |
| $150,000 to $199,999 | 0 | 0.0% |
| $200,000+ | 0 | 0.0% |
Household Income by Householder Age in La Presa
The median household income in La Presa is $50,505, with the highest median household income of $29,286 found in the 25 to 44 years age bracket for the primary householder. A total of 28 households (37.3%) fall into this category.
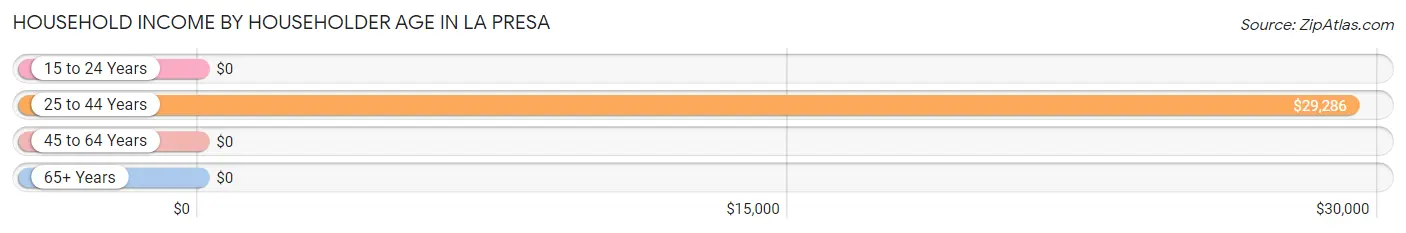
| Income Bracket | # Households | Median Income |
| 15 to 24 Years | 0 (0.0%) | $0 |
| 25 to 44 Years | 28 (37.3%) | $29,286 |
| 45 to 64 Years | 47 (62.7%) | $0 |
| 65+ Years | 0 (0.0%) | $0 |
| Total | 75 (100.0%) | $50,505 |
Poverty in La Presa
Income Below Poverty by Sex and Age in La Presa
With 49.6% poverty level for males and 48.4% for females among the residents of La Presa, under 5 year old males and under 5 year old females are the most vulnerable to poverty, with 9 males (100.0%) and 26 females (100.0%) in their respective age groups living below the poverty level.
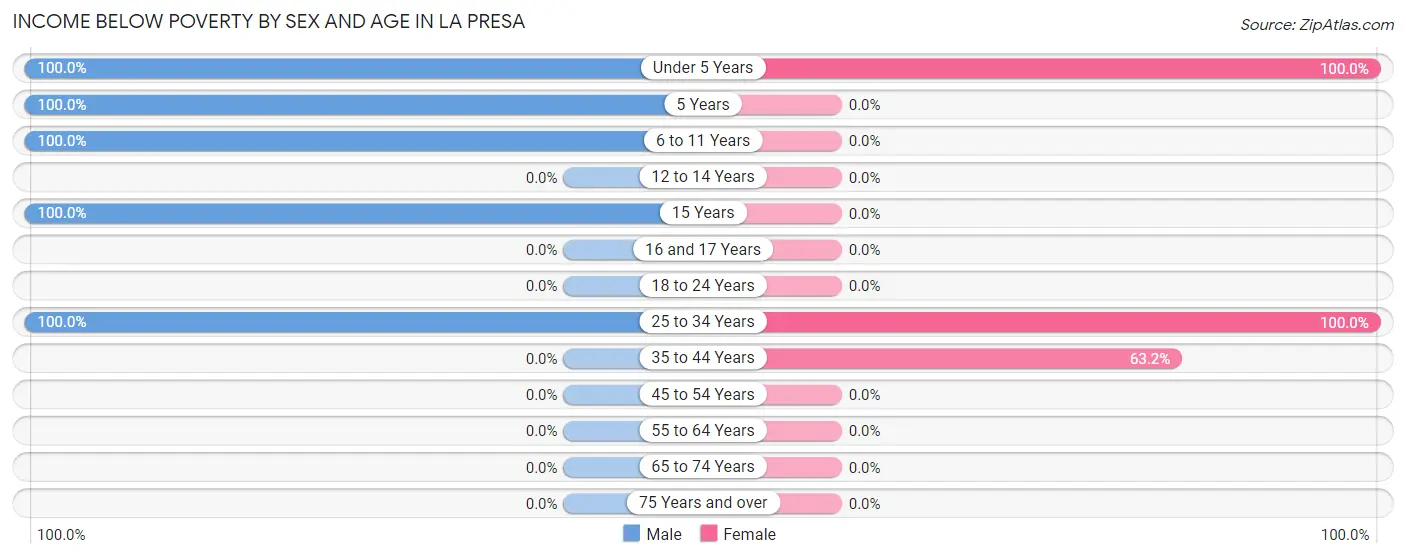
| Age Bracket | Male | Female |
| Under 5 Years | 9 (100.0%) | 26 (100.0%) |
| 5 Years | 15 (100.0%) | 0 (0.0%) |
| 6 to 11 Years | 15 (100.0%) | 0 (0.0%) |
| 12 to 14 Years | 0 (0.0%) | 0 (0.0%) |
| 15 Years | 13 (100.0%) | 0 (0.0%) |
| 16 and 17 Years | 0 (0.0%) | 0 (0.0%) |
| 18 to 24 Years | 0 (0.0%) | 0 (0.0%) |
| 25 to 34 Years | 9 (100.0%) | 9 (100.0%) |
| 35 to 44 Years | 0 (0.0%) | 12 (63.2%) |
| 45 to 54 Years | 0 (0.0%) | 0 (0.0%) |
| 55 to 64 Years | 0 (0.0%) | 0 (0.0%) |
| 65 to 74 Years | 0 (0.0%) | 0 (0.0%) |
| 75 Years and over | 0 (0.0%) | 0 (0.0%) |
| Total | 61 (49.6%) | 47 (48.4%) |
Income Above Poverty by Sex and Age in La Presa
According to the poverty statistics in La Presa, males aged 45 to 54 years and females aged 55 to 64 years are the age groups that are most secure financially, with 100.0% of males and 100.0% of females in these age groups living above the poverty line.
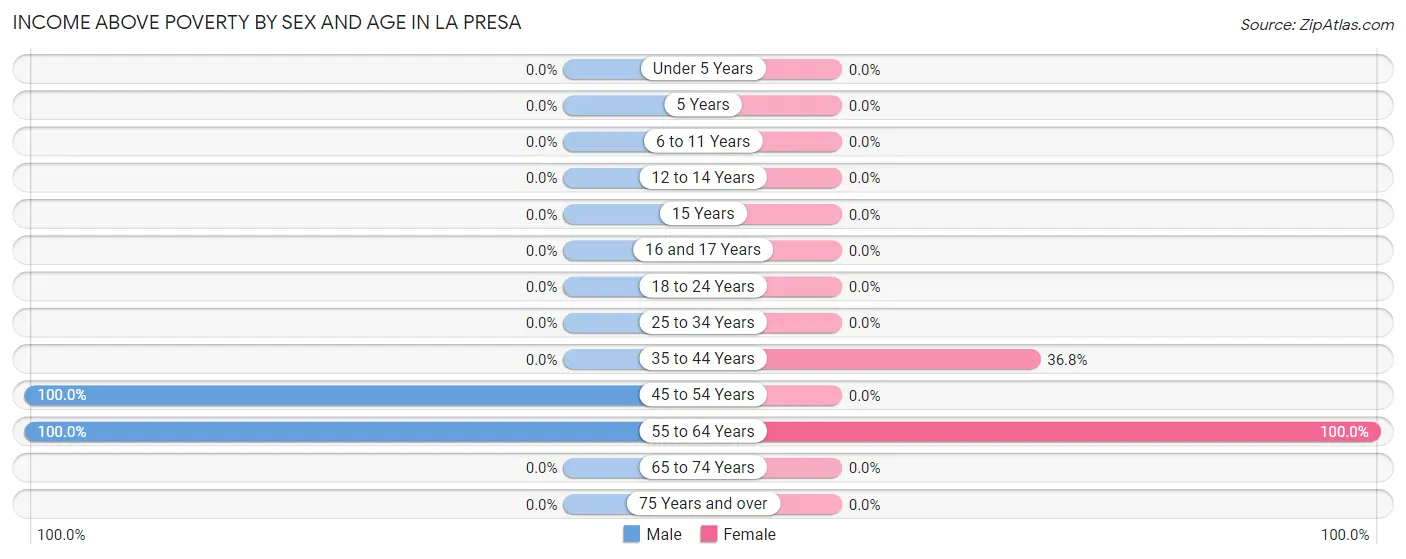
| Age Bracket | Male | Female |
| Under 5 Years | 0 (0.0%) | 0 (0.0%) |
| 5 Years | 0 (0.0%) | 0 (0.0%) |
| 6 to 11 Years | 0 (0.0%) | 0 (0.0%) |
| 12 to 14 Years | 0 (0.0%) | 0 (0.0%) |
| 15 Years | 0 (0.0%) | 0 (0.0%) |
| 16 and 17 Years | 0 (0.0%) | 0 (0.0%) |
| 18 to 24 Years | 0 (0.0%) | 0 (0.0%) |
| 25 to 34 Years | 0 (0.0%) | 0 (0.0%) |
| 35 to 44 Years | 0 (0.0%) | 7 (36.8%) |
| 45 to 54 Years | 15 (100.0%) | 0 (0.0%) |
| 55 to 64 Years | 47 (100.0%) | 43 (100.0%) |
| 65 to 74 Years | 0 (0.0%) | 0 (0.0%) |
| 75 Years and over | 0 (0.0%) | 0 (0.0%) |
| Total | 62 (50.4%) | 50 (51.5%) |
Income Below Poverty Among Married-Couple Families in La Presa
The poverty statistics for married-couple families in La Presa show that 16.1% or 9 of the total 56 families live below the poverty line. Families with 1 or 2 children have the highest poverty rate of 100.0%, comprising of 9 families. On the other hand, families with no children have the lowest poverty rate of 0.0%, which includes 0 families.
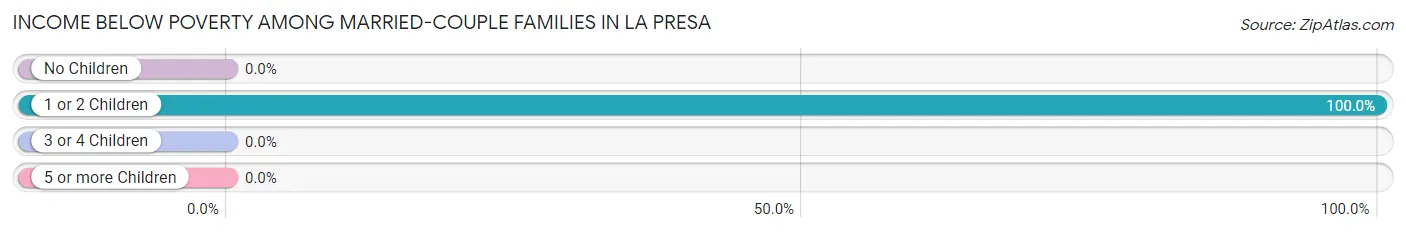
| Children | Above Poverty | Below Poverty |
| No Children | 47 (100.0%) | 0 (0.0%) |
| 1 or 2 Children | 0 (0.0%) | 9 (100.0%) |
| 3 or 4 Children | 0 (0.0%) | 0 (0.0%) |
| 5 or more Children | 0 (0.0%) | 0 (0.0%) |
| Total | 47 (83.9%) | 9 (16.1%) |
Income Below Poverty Among Single-Parent Households in La Presa
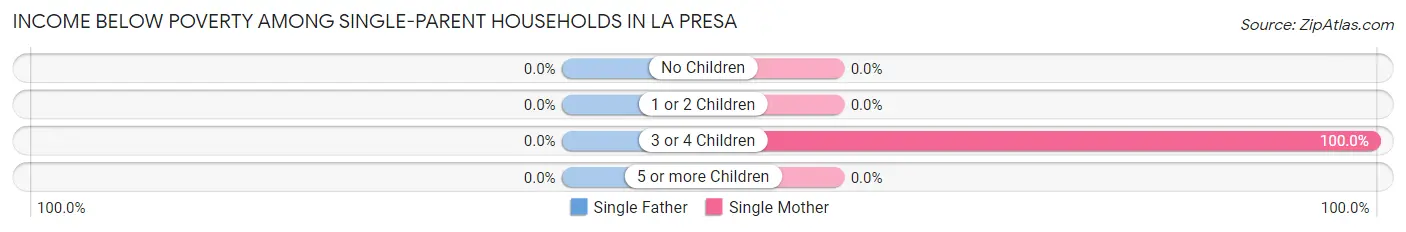
| Children | Single Father | Single Mother |
| No Children | 0 (0.0%) | 0 (0.0%) |
| 1 or 2 Children | 0 (0.0%) | 0 (0.0%) |
| 3 or 4 Children | 0 (0.0%) | 12 (100.0%) |
| 5 or more Children | 0 (0.0%) | 0 (0.0%) |
| Total | 0 (0.0%) | 12 (100.0%) |
Income Below Poverty Among Married-Couple vs Single-Parent Households in La Presa
The poverty data for La Presa shows that 9 of the married-couple family households (16.1%) and 12 of the single-parent households (100.0%) are living below the poverty level. Within the married-couple family households, those with 1 or 2 children have the highest poverty rate, with 9 households (100.0%) falling below the poverty line. Among the single-parent households, those with 3 or 4 children have the highest poverty rate, with 12 household (100.0%) living below poverty.
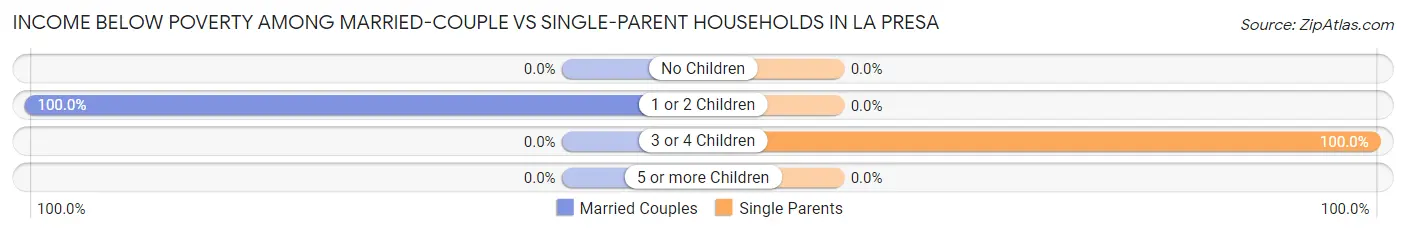
| Children | Married-Couple Families | Single-Parent Households |
| No Children | 0 (0.0%) | 0 (0.0%) |
| 1 or 2 Children | 9 (100.0%) | 0 (0.0%) |
| 3 or 4 Children | 0 (0.0%) | 12 (100.0%) |
| 5 or more Children | 0 (0.0%) | 0 (0.0%) |
| Total | 9 (16.1%) | 12 (100.0%) |
Race in La Presa
The most populous races in La Presa are Hispanic or Latino (220 | 100.0%), White / Caucasian (126 | 57.3%), and Two or more Races (87 | 39.6%).
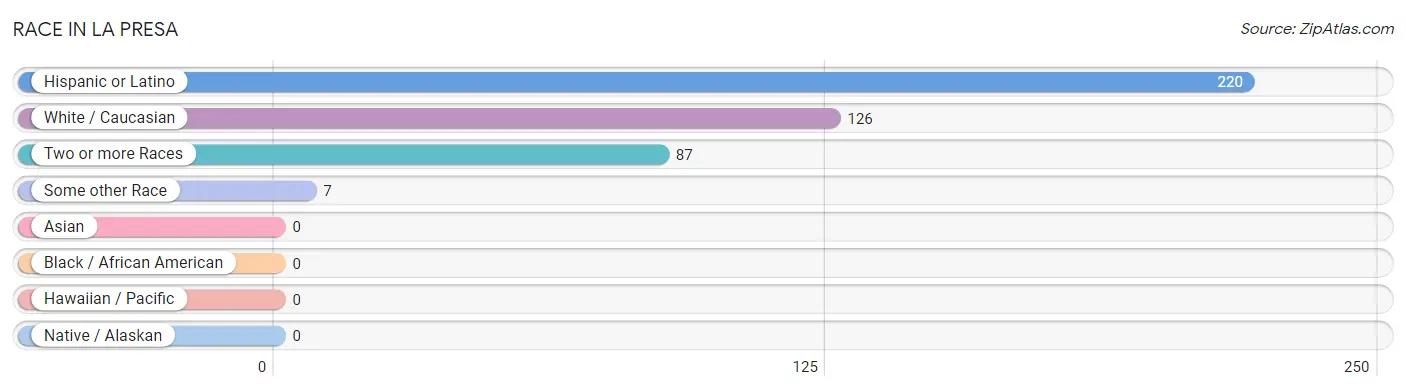
| Race | # Population | % Population |
| Asian | 0 | 0.0% |
| Black / African American | 0 | 0.0% |
| Hawaiian / Pacific | 0 | 0.0% |
| Hispanic or Latino | 220 | 100.0% |
| Native / Alaskan | 0 | 0.0% |
| White / Caucasian | 126 | 57.3% |
| Two or more Races | 87 | 39.6% |
| Some other Race | 7 | 3.2% |
| Total | 220 | 100.0% |
Ancestry in La Presa
The most populous ancestries reported in La Presa are , and Mexican (220 | 100.0%), together accounting for 100.0% of all La Presa residents.

| Ancestry | # Population | % Population |
| Mexican | 220 | 100.0% | View All 1 Rows |
Immigrants in La Presa
The most numerous immigrant groups reported in La Presa came from Central America (56 | 25.5%), Latin America (56 | 25.5%), and Mexico (56 | 25.5%), together accounting for 76.4% of all La Presa residents.
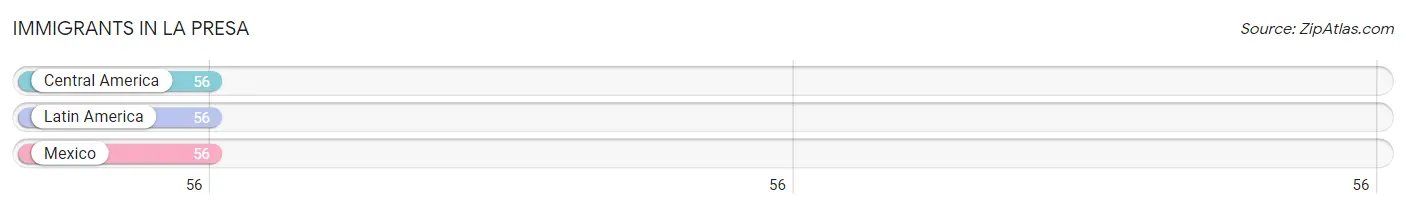
| Immigration Origin | # Population | % Population |
| Central America | 56 | 25.5% |
| Latin America | 56 | 25.5% |
| Mexico | 56 | 25.5% | View All 3 Rows |
Sex and Age in La Presa
Sex and Age in La Presa
The most populous age groups in La Presa are 55 to 59 Years (47 | 38.2%) for men and 55 to 59 Years (43 | 44.3%) for women.
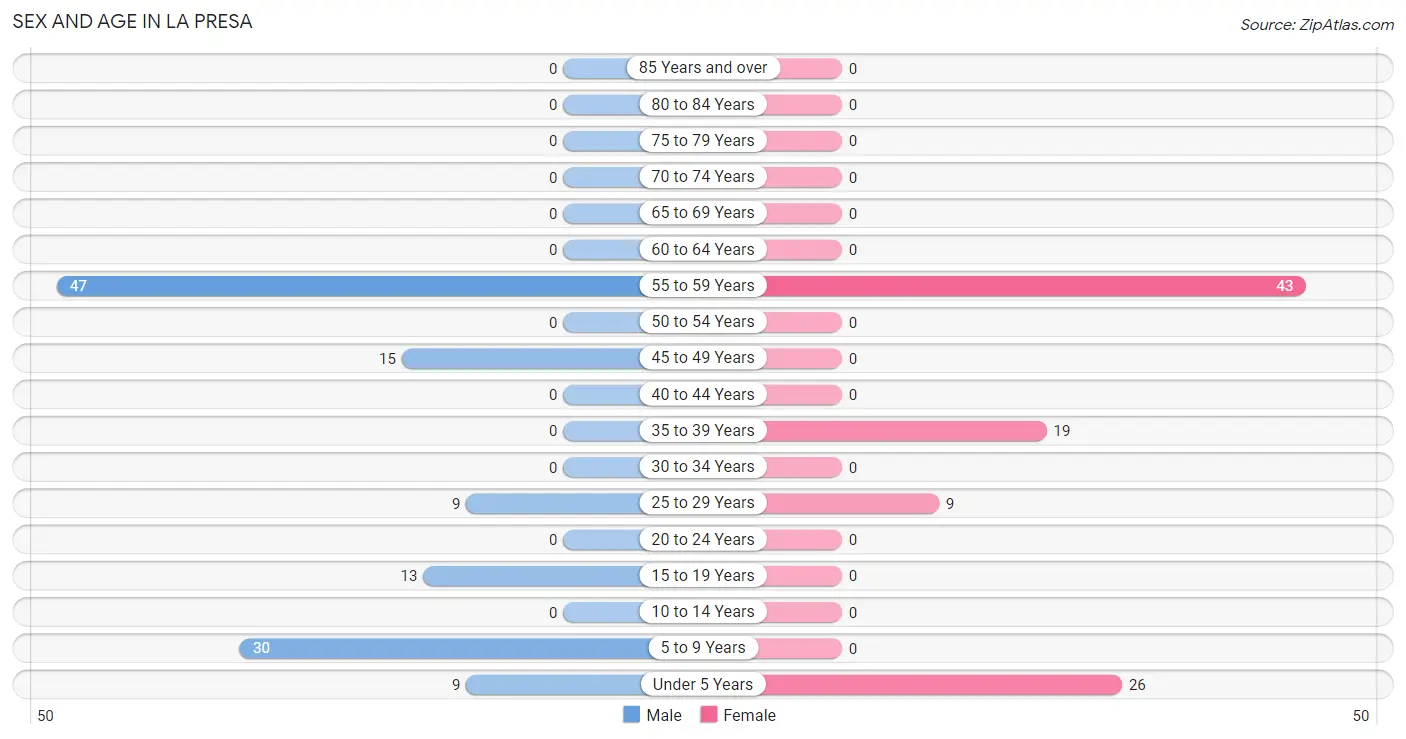
| Age Bracket | Male | Female |
| Under 5 Years | 9 (7.3%) | 26 (26.8%) |
| 5 to 9 Years | 30 (24.4%) | 0 (0.0%) |
| 10 to 14 Years | 0 (0.0%) | 0 (0.0%) |
| 15 to 19 Years | 13 (10.6%) | 0 (0.0%) |
| 20 to 24 Years | 0 (0.0%) | 0 (0.0%) |
| 25 to 29 Years | 9 (7.3%) | 9 (9.3%) |
| 30 to 34 Years | 0 (0.0%) | 0 (0.0%) |
| 35 to 39 Years | 0 (0.0%) | 19 (19.6%) |
| 40 to 44 Years | 0 (0.0%) | 0 (0.0%) |
| 45 to 49 Years | 15 (12.2%) | 0 (0.0%) |
| 50 to 54 Years | 0 (0.0%) | 0 (0.0%) |
| 55 to 59 Years | 47 (38.2%) | 43 (44.3%) |
| 60 to 64 Years | 0 (0.0%) | 0 (0.0%) |
| 65 to 69 Years | 0 (0.0%) | 0 (0.0%) |
| 70 to 74 Years | 0 (0.0%) | 0 (0.0%) |
| 75 to 79 Years | 0 (0.0%) | 0 (0.0%) |
| 80 to 84 Years | 0 (0.0%) | 0 (0.0%) |
| 85 Years and over | 0 (0.0%) | 0 (0.0%) |
| Total | 123 (100.0%) | 97 (100.0%) |
Families and Households in La Presa
Median Family Size in La Presa
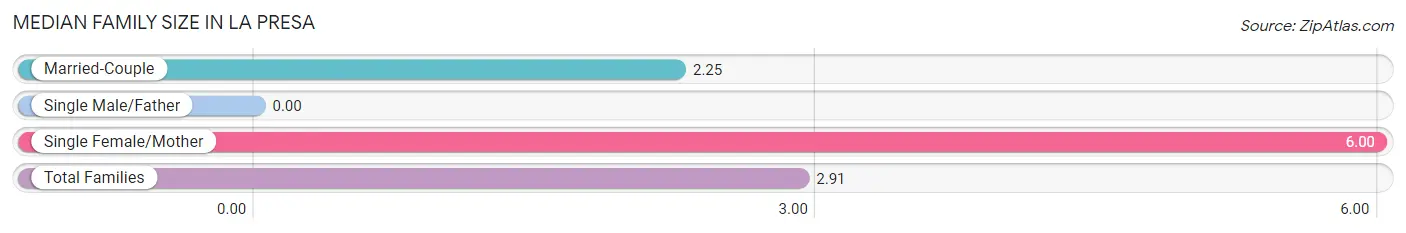
| Family Type | # Families | Family Size |
| Married-Couple | 56 (82.4%) | 2.25 |
| Single Male/Father | 0 (0.0%) | - |
| Single Female/Mother | 12 (17.6%) | 6.00 |
| Total Families | 68 (100.0%) | 2.91 |
Median Household Size in La Presa
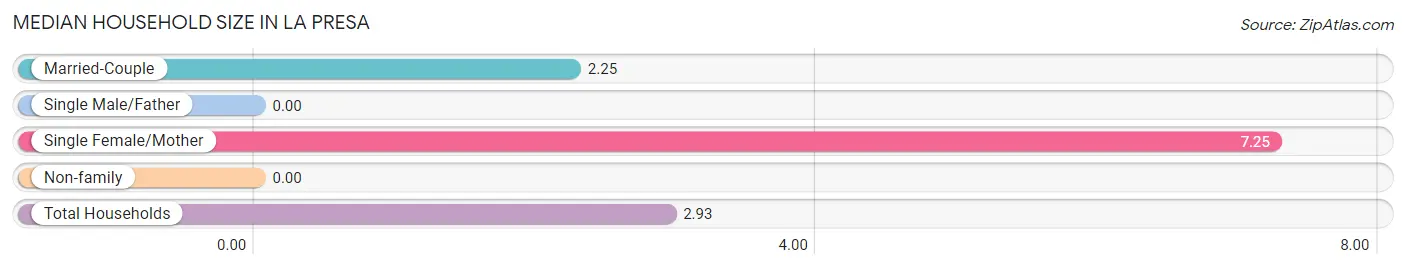
| Household Type | # Households | Household Size |
| Married-Couple | 56 (74.7%) | 2.25 |
| Single Male/Father | 0 (0.0%) | - |
| Single Female/Mother | 12 (16.0%) | 7.25 |
| Non-family | 7 (9.3%) | - |
| Total Households | 75 (100.0%) | 2.93 |
Household Size by Marriage Status in La Presa
Out of a total of 75 households in La Presa, 68 (90.7%) are family households, while 7 (9.3%) are nonfamily households. The most numerous type of family households are 2-person households, comprising 47, and the most common type of nonfamily households are 1-person households, comprising 7.
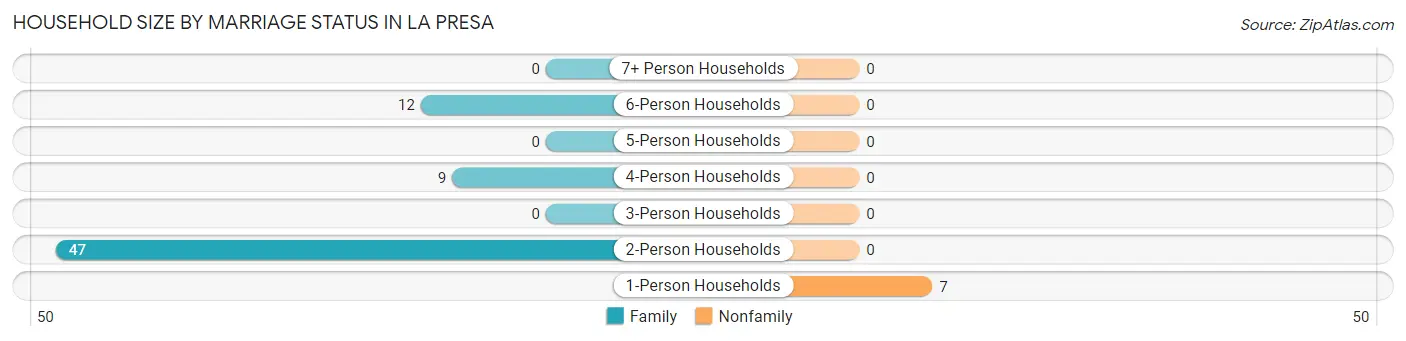
| Household Size | Family Households | Nonfamily Households |
| 1-Person Households | - | 7 (9.3%) |
| 2-Person Households | 47 (62.7%) | 0 (0.0%) |
| 3-Person Households | 0 (0.0%) | 0 (0.0%) |
| 4-Person Households | 9 (12.0%) | 0 (0.0%) |
| 5-Person Households | 0 (0.0%) | 0 (0.0%) |
| 6-Person Households | 12 (16.0%) | 0 (0.0%) |
| 7+ Person Households | 0 (0.0%) | 0 (0.0%) |
| Total | 68 (90.7%) | 7 (9.3%) |
Female Fertility in La Presa
Fertility by Age in La Presa
Average fertility rate in La Presa is 429.0 births per 1,000 women. Women in the age bracket of 35 to 50 years have the highest fertility rate with 632.0 births per 1,000 women. Women in the age bracket of 35 to 50 years acount for 100.0% of all women with births.
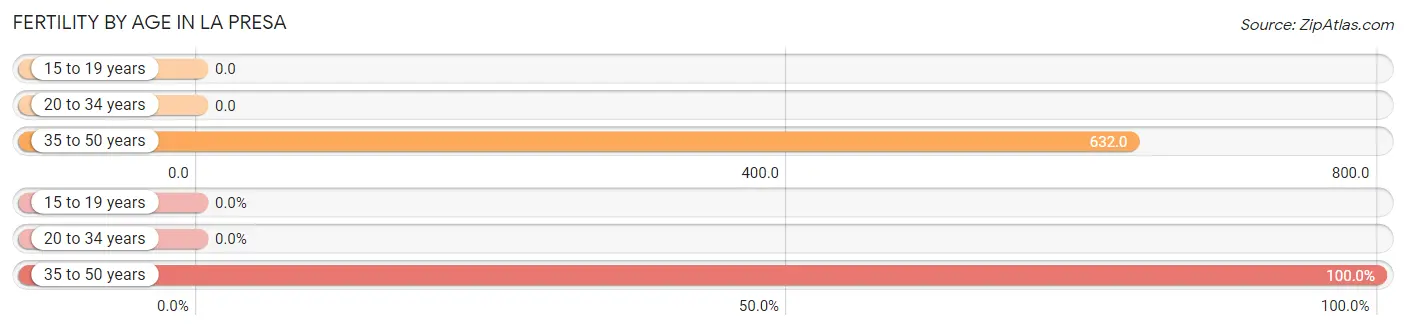
| Age Bracket | Women with Births | Births / 1,000 Women |
| 15 to 19 years | 0 (0.0%) | 0.0 |
| 20 to 34 years | 0 (0.0%) | 0.0 |
| 35 to 50 years | 12 (100.0%) | 632.0 |
| Total | 12 (100.0%) | 429.0 |
Fertility by Age by Marriage Status in La Presa
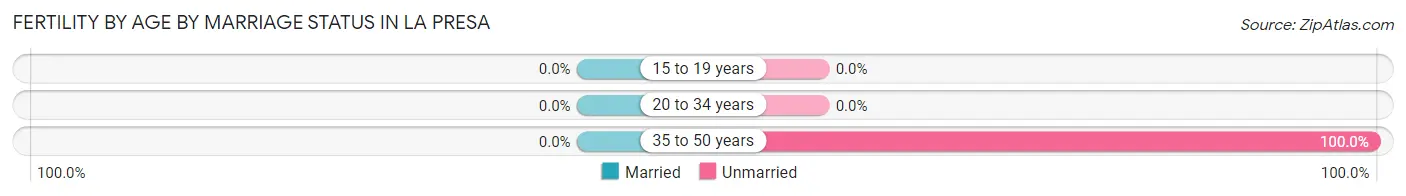
| Age Bracket | Married | Unmarried |
| 15 to 19 years | 0 (0.0%) | 0 (0.0%) |
| 20 to 34 years | 0 (0.0%) | 0 (0.0%) |
| 35 to 50 years | 0 (0.0%) | 12 (100.0%) |
| Total | 0 (0.0%) | 12 (100.0%) |
Fertility by Education in La Presa
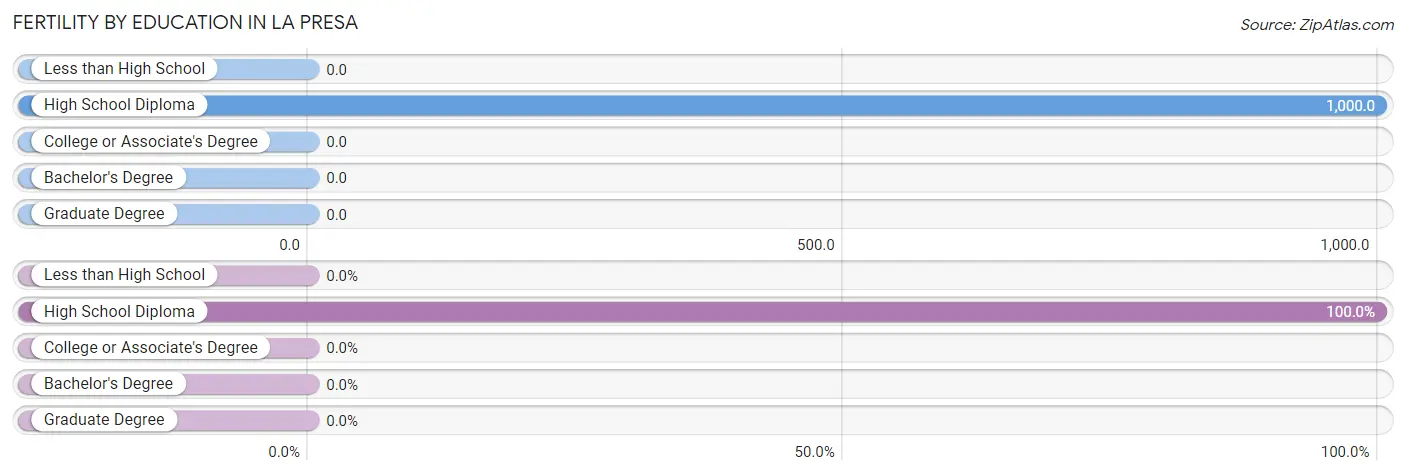
| Educational Attainment | Women with Births | Births / 1,000 Women |
| Less than High School | 0 (0.0%) | 0.0 |
| High School Diploma | 12 (100.0%) | 1,000.0 |
| College or Associate's Degree | 0 (0.0%) | 0.0 |
| Bachelor's Degree | 0 (0.0%) | 0.0 |
| Graduate Degree | 0 (0.0%) | 0.0 |
| Total | 12 (100.0%) | 429.0 |
Fertility by Education by Marriage Status in La Presa
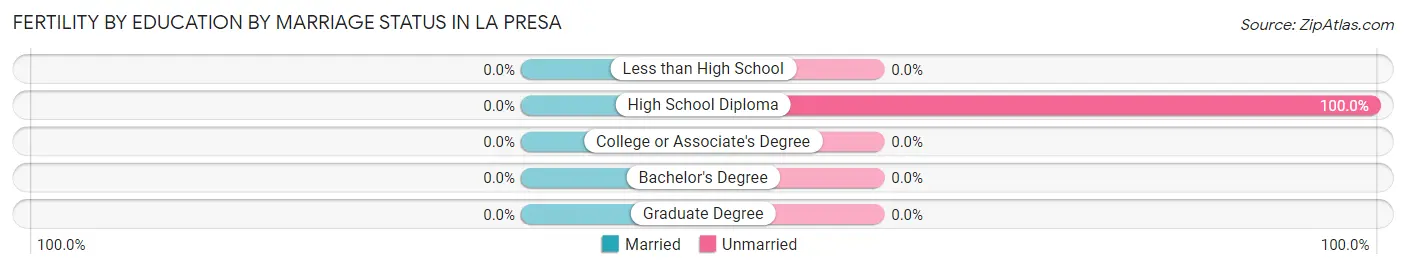
| Educational Attainment | Married | Unmarried |
| Less than High School | 0 (0.0%) | 0 (0.0%) |
| High School Diploma | 0 (0.0%) | 12 (100.0%) |
| College or Associate's Degree | 0 (0.0%) | 0 (0.0%) |
| Bachelor's Degree | 0 (0.0%) | 0 (0.0%) |
| Graduate Degree | 0 (0.0%) | 0 (0.0%) |
| Total | 0 (0.0%) | 12 (100.0%) |
Employment Characteristics in La Presa
Employment by Class of Employer in La Presa
Among the 87 employed individuals in La Presa, self-employed (not incorporated) (47 | 54.0%), and private company employees (40 | 46.0%) make up the most common classes of employment.
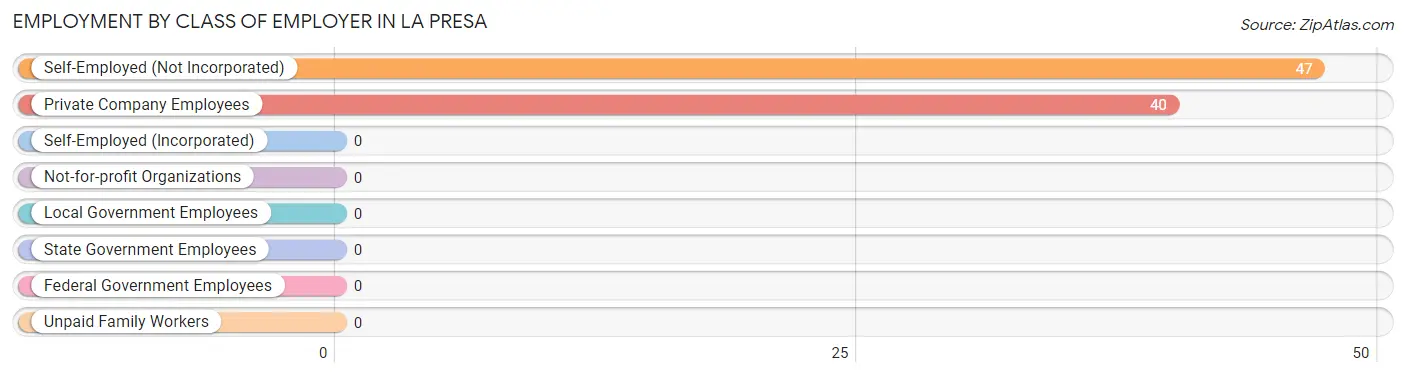
| Employer Class | # Employees | % Employees |
| Private Company Employees | 40 | 46.0% |
| Self-Employed (Incorporated) | 0 | 0.0% |
| Self-Employed (Not Incorporated) | 47 | 54.0% |
| Not-for-profit Organizations | 0 | 0.0% |
| Local Government Employees | 0 | 0.0% |
| State Government Employees | 0 | 0.0% |
| Federal Government Employees | 0 | 0.0% |
| Unpaid Family Workers | 0 | 0.0% |
| Total | 87 | 100.0% |
Employment Status by Age in La Presa
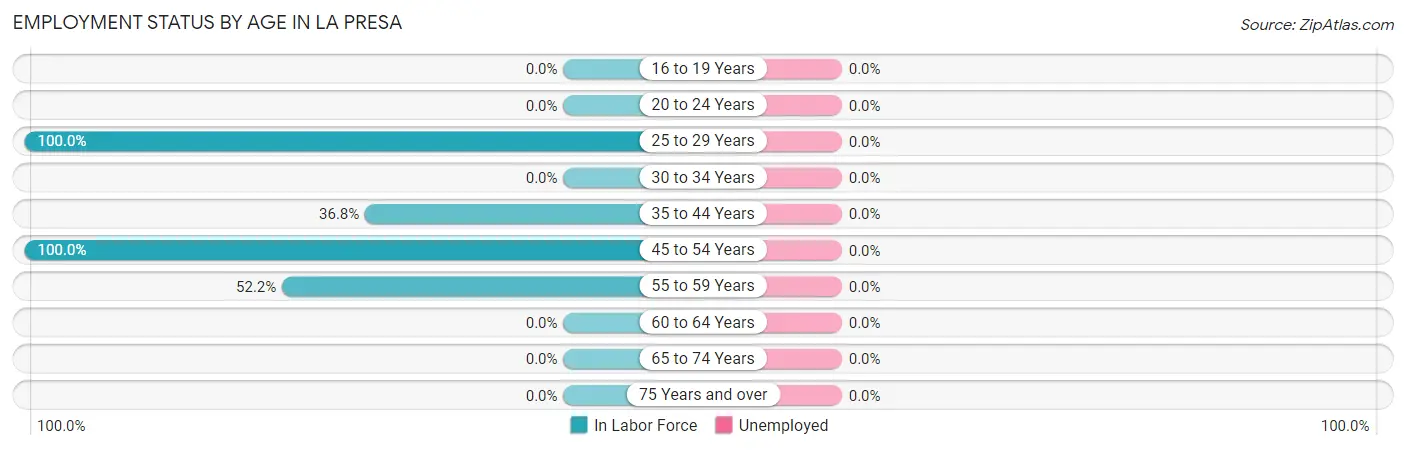
| Age Bracket | In Labor Force | Unemployed |
| 16 to 19 Years | 0 (0.0%) | 0 (0.0%) |
| 20 to 24 Years | 0 (0.0%) | 0 (0.0%) |
| 25 to 29 Years | 18 (100.0%) | 0 (0.0%) |
| 30 to 34 Years | 0 (0.0%) | 0 (0.0%) |
| 35 to 44 Years | 7 (36.8%) | 0 (0.0%) |
| 45 to 54 Years | 15 (100.0%) | 0 (0.0%) |
| 55 to 59 Years | 47 (52.2%) | 0 (0.0%) |
| 60 to 64 Years | 0 (0.0%) | 0 (0.0%) |
| 65 to 74 Years | 0 (0.0%) | 0 (0.0%) |
| 75 Years and over | 0 (0.0%) | 0 (0.0%) |
| Total | 87 (61.3%) | 0 (0.0%) |
Employment Status by Educational Attainment in La Presa
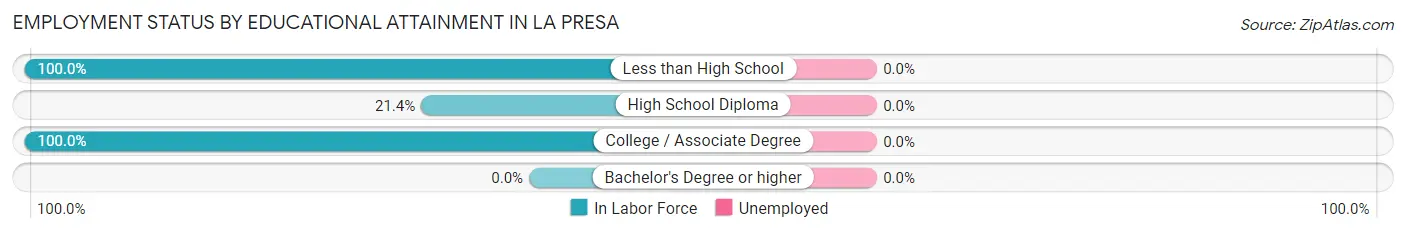
| Educational Attainment | In Labor Force | Unemployed |
| Less than High School | 56 (100.0%) | 0 (0.0%) |
| High School Diploma | 15 (21.4%) | 0 (0.0%) |
| College / Associate Degree | 16 (100.0%) | 0 (0.0%) |
| Bachelor's Degree or higher | 0 (0.0%) | 0 (0.0%) |
| Total | 87 (61.3%) | 0 (0.0%) |
Employment Occupations by Sex in La Presa
Management, Business, Science and Arts Occupations
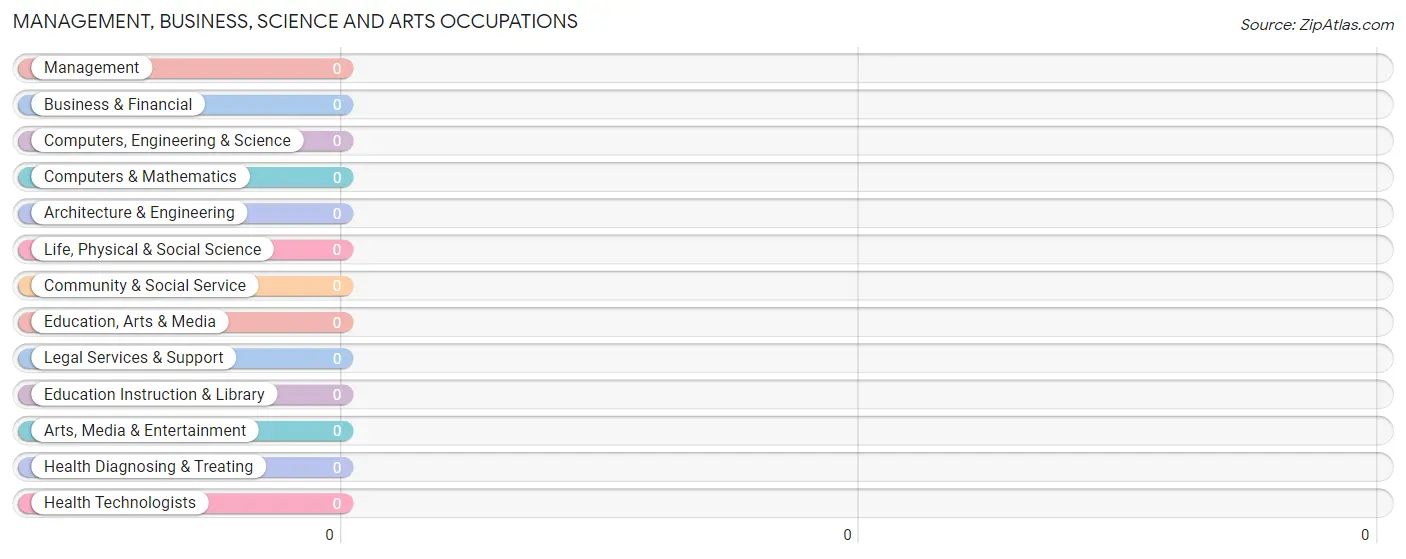
Management, Business, Science and Arts Occupations by Sex
| Occupation | Male | Female |
| Management | 0 (0.0%) | 0 (0.0%) |
| Business & Financial | 0 (0.0%) | 0 (0.0%) |
| Computers, Engineering & Science | 0 (0.0%) | 0 (0.0%) |
| Computers & Mathematics | 0 (0.0%) | 0 (0.0%) |
| Architecture & Engineering | 0 (0.0%) | 0 (0.0%) |
| Life, Physical & Social Science | 0 (0.0%) | 0 (0.0%) |
| Community & Social Service | 0 (0.0%) | 0 (0.0%) |
| Education, Arts & Media | 0 (0.0%) | 0 (0.0%) |
| Legal Services & Support | 0 (0.0%) | 0 (0.0%) |
| Education Instruction & Library | 0 (0.0%) | 0 (0.0%) |
| Arts, Media & Entertainment | 0 (0.0%) | 0 (0.0%) |
| Health Diagnosing & Treating | 0 (0.0%) | 0 (0.0%) |
| Health Technologists | 0 (0.0%) | 0 (0.0%) |
| Total (Category) | 0 (0.0%) | 0 (0.0%) |
| Total (Overall) | 71 (81.6%) | 16 (18.4%) |
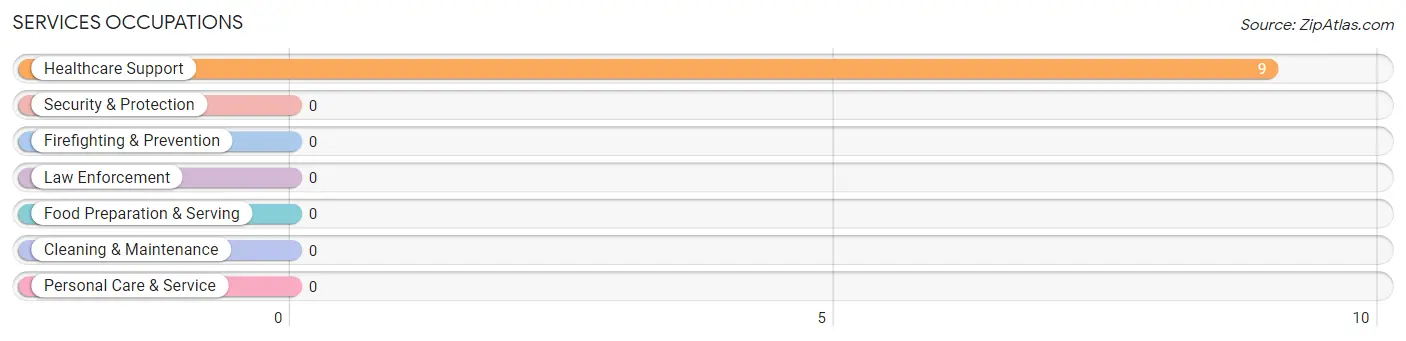
Services Occupations
The most common Services occupations in La Presa are , and Healthcare Support (9 | 10.3%).
Services Occupations by Sex
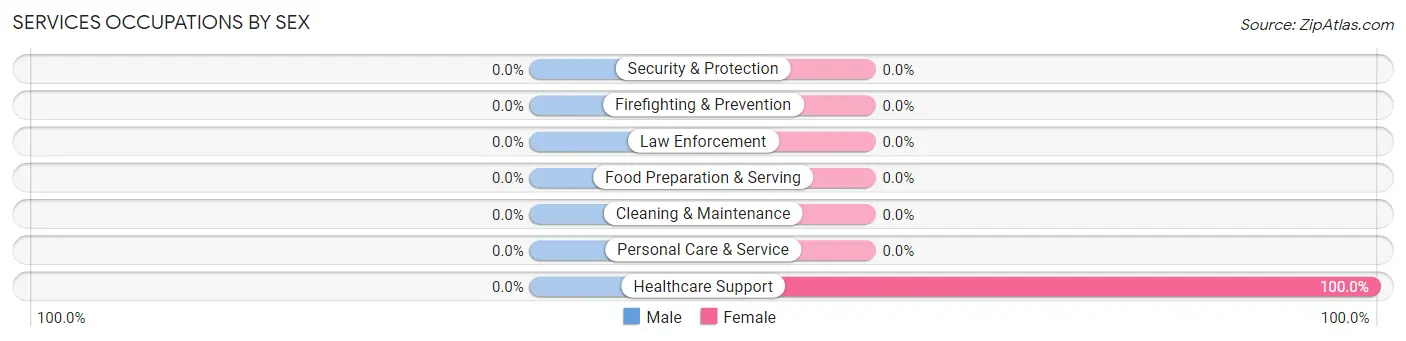
| Occupation | Male | Female |
| Healthcare Support | 0 (0.0%) | 9 (100.0%) |
| Security & Protection | 0 (0.0%) | 0 (0.0%) |
| Firefighting & Prevention | 0 (0.0%) | 0 (0.0%) |
| Law Enforcement | 0 (0.0%) | 0 (0.0%) |
| Food Preparation & Serving | 0 (0.0%) | 0 (0.0%) |
| Cleaning & Maintenance | 0 (0.0%) | 0 (0.0%) |
| Personal Care & Service | 0 (0.0%) | 0 (0.0%) |
| Total (Category) | 0 (0.0%) | 9 (100.0%) |
| Total (Overall) | 71 (81.6%) | 16 (18.4%) |
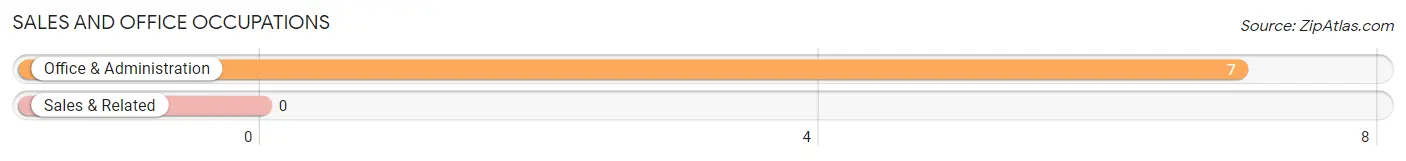
Sales and Office Occupations
The most common Sales and Office occupations in La Presa are , and Office & Administration (7 | 8.1%).
Sales and Office Occupations by Sex
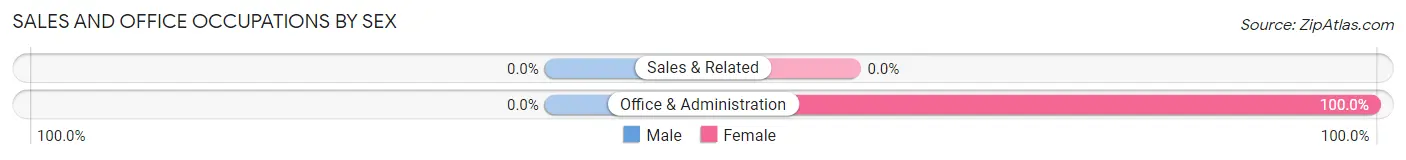
| Occupation | Male | Female |
| Sales & Related | 0 (0.0%) | 0 (0.0%) |
| Office & Administration | 0 (0.0%) | 7 (100.0%) |
| Total (Category) | 0 (0.0%) | 7 (100.0%) |
| Total (Overall) | 71 (81.6%) | 16 (18.4%) |
Natural Resources, Construction and Maintenance Occupations
The most common Natural Resources, Construction and Maintenance occupations in La Presa are , and Construction & Extraction (24 | 27.6%).
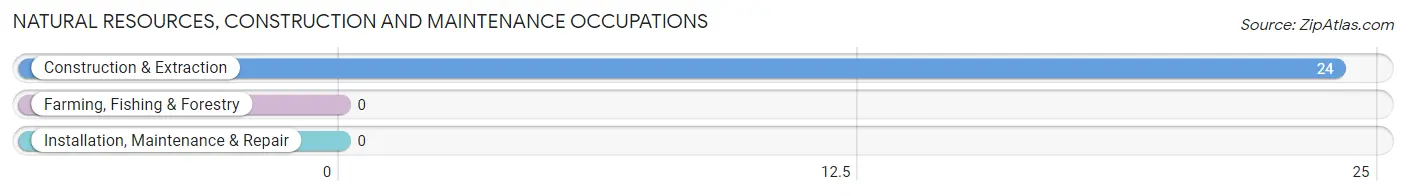
Natural Resources, Construction and Maintenance Occupations by Sex
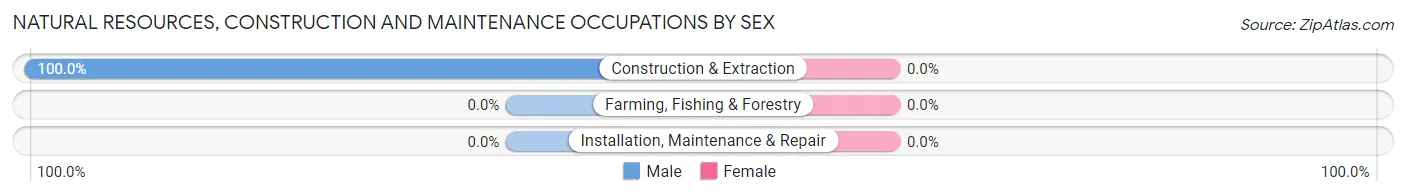
| Occupation | Male | Female |
| Farming, Fishing & Forestry | 0 (0.0%) | 0 (0.0%) |
| Construction & Extraction | 24 (100.0%) | 0 (0.0%) |
| Installation, Maintenance & Repair | 0 (0.0%) | 0 (0.0%) |
| Total (Category) | 24 (100.0%) | 0 (0.0%) |
| Total (Overall) | 71 (81.6%) | 16 (18.4%) |
Production, Transportation and Moving Occupations
The most common Production, Transportation and Moving occupations in La Presa are , and Transportation (47 | 54.0%).
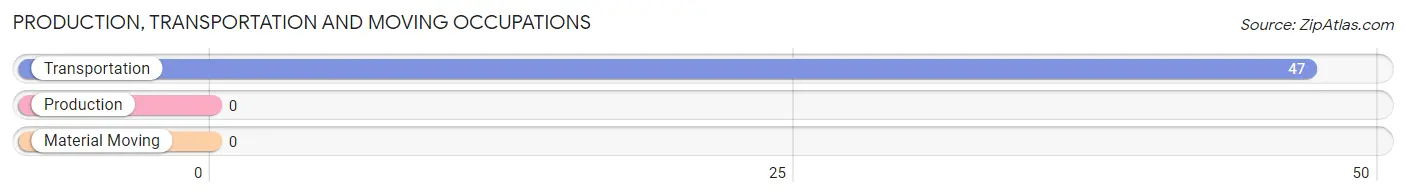
Production, Transportation and Moving Occupations by Sex
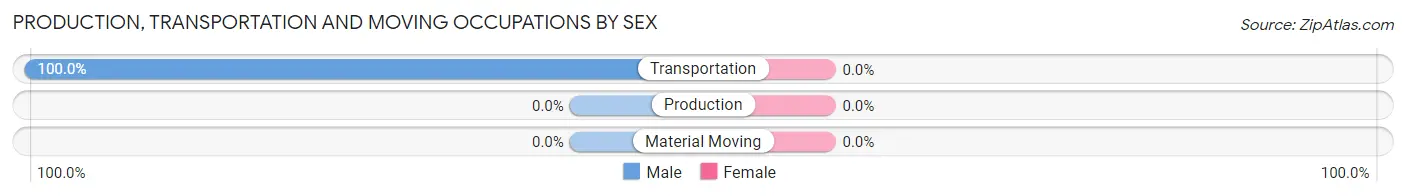
| Occupation | Male | Female |
| Production | 0 (0.0%) | 0 (0.0%) |
| Transportation | 47 (100.0%) | 0 (0.0%) |
| Material Moving | 0 (0.0%) | 0 (0.0%) |
| Total (Category) | 47 (100.0%) | 0 (0.0%) |
| Total (Overall) | 71 (81.6%) | 16 (18.4%) |
Employment Industries by Sex in La Presa
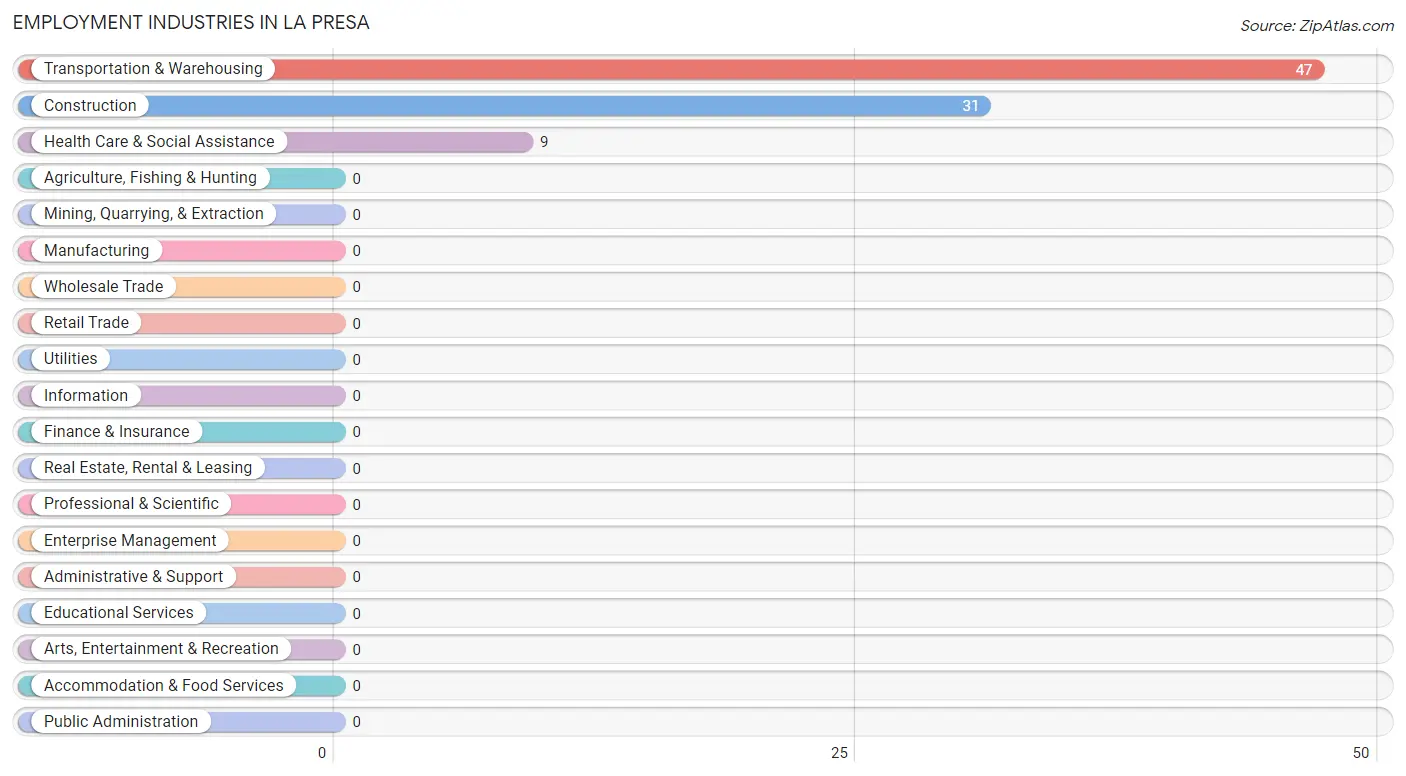
Employment Industries in La Presa
The major employment industries in La Presa include Transportation & Warehousing (47 | 54.0%), Construction (31 | 35.6%), and Health Care & Social Assistance (9 | 10.3%).
Employment Industries by Sex in La Presa
The La Presa industries that see more men than women are Transportation & Warehousing (100.0%), and Construction (77.4%), whereas the industries that tend to have a higher number of women are Health Care & Social Assistance (100.0%), and Construction (22.6%).
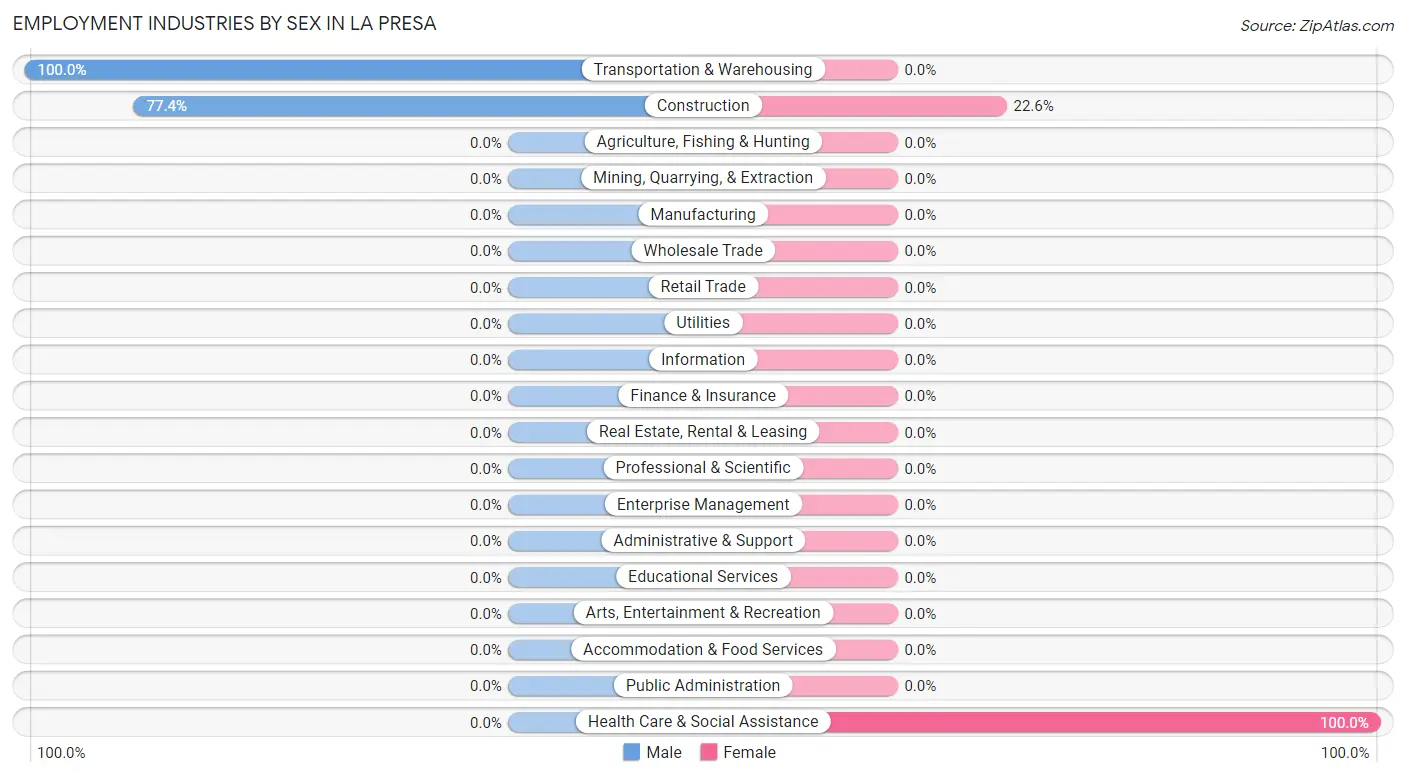
| Industry | Male | Female |
| Agriculture, Fishing & Hunting | 0 (0.0%) | 0 (0.0%) |
| Mining, Quarrying, & Extraction | 0 (0.0%) | 0 (0.0%) |
| Construction | 24 (77.4%) | 7 (22.6%) |
| Manufacturing | 0 (0.0%) | 0 (0.0%) |
| Wholesale Trade | 0 (0.0%) | 0 (0.0%) |
| Retail Trade | 0 (0.0%) | 0 (0.0%) |
| Transportation & Warehousing | 47 (100.0%) | 0 (0.0%) |
| Utilities | 0 (0.0%) | 0 (0.0%) |
| Information | 0 (0.0%) | 0 (0.0%) |
| Finance & Insurance | 0 (0.0%) | 0 (0.0%) |
| Real Estate, Rental & Leasing | 0 (0.0%) | 0 (0.0%) |
| Professional & Scientific | 0 (0.0%) | 0 (0.0%) |
| Enterprise Management | 0 (0.0%) | 0 (0.0%) |
| Administrative & Support | 0 (0.0%) | 0 (0.0%) |
| Educational Services | 0 (0.0%) | 0 (0.0%) |
| Health Care & Social Assistance | 0 (0.0%) | 9 (100.0%) |
| Arts, Entertainment & Recreation | 0 (0.0%) | 0 (0.0%) |
| Accommodation & Food Services | 0 (0.0%) | 0 (0.0%) |
| Public Administration | 0 (0.0%) | 0 (0.0%) |
| Total | 71 (81.6%) | 16 (18.4%) |
Education in La Presa
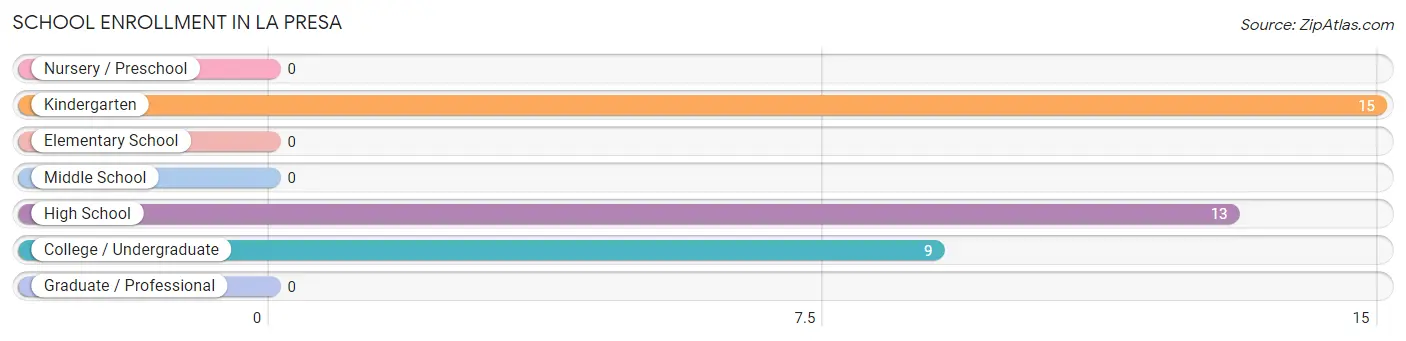
School Enrollment in La Presa
The most common levels of schooling among the 37 students in La Presa are kindergarten (15 | 40.5%), high school (13 | 35.1%), and college / undergraduate (9 | 24.3%).
| School Level | # Students | % Students |
| Nursery / Preschool | 0 | 0.0% |
| Kindergarten | 15 | 40.5% |
| Elementary School | 0 | 0.0% |
| Middle School | 0 | 0.0% |
| High School | 13 | 35.1% |
| College / Undergraduate | 9 | 24.3% |
| Graduate / Professional | 0 | 0.0% |
| Total | 37 | 100.0% |
School Enrollment by Age by Funding Source in La Presa
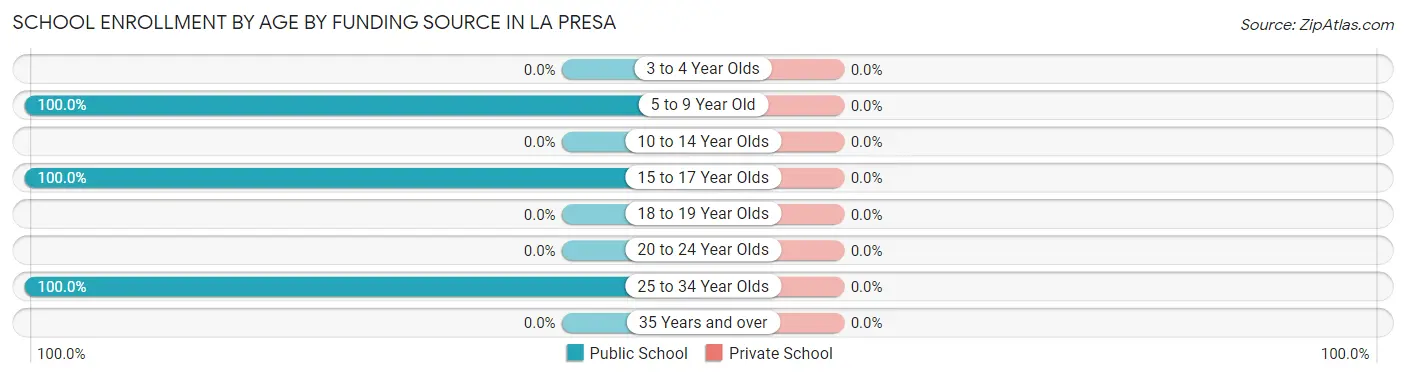
| Age Bracket | Public School | Private School |
| 3 to 4 Year Olds | 0 (0.0%) | 0 (0.0%) |
| 5 to 9 Year Old | 15 (100.0%) | 0 (0.0%) |
| 10 to 14 Year Olds | 0 (0.0%) | 0 (0.0%) |
| 15 to 17 Year Olds | 13 (100.0%) | 0 (0.0%) |
| 18 to 19 Year Olds | 0 (0.0%) | 0 (0.0%) |
| 20 to 24 Year Olds | 0 (0.0%) | 0 (0.0%) |
| 25 to 34 Year Olds | 9 (100.0%) | 0 (0.0%) |
| 35 Years and over | 0 (0.0%) | 0 (0.0%) |
| Total | 37 (100.0%) | 0 (0.0%) |
Educational Attainment by Field of Study in La Presa
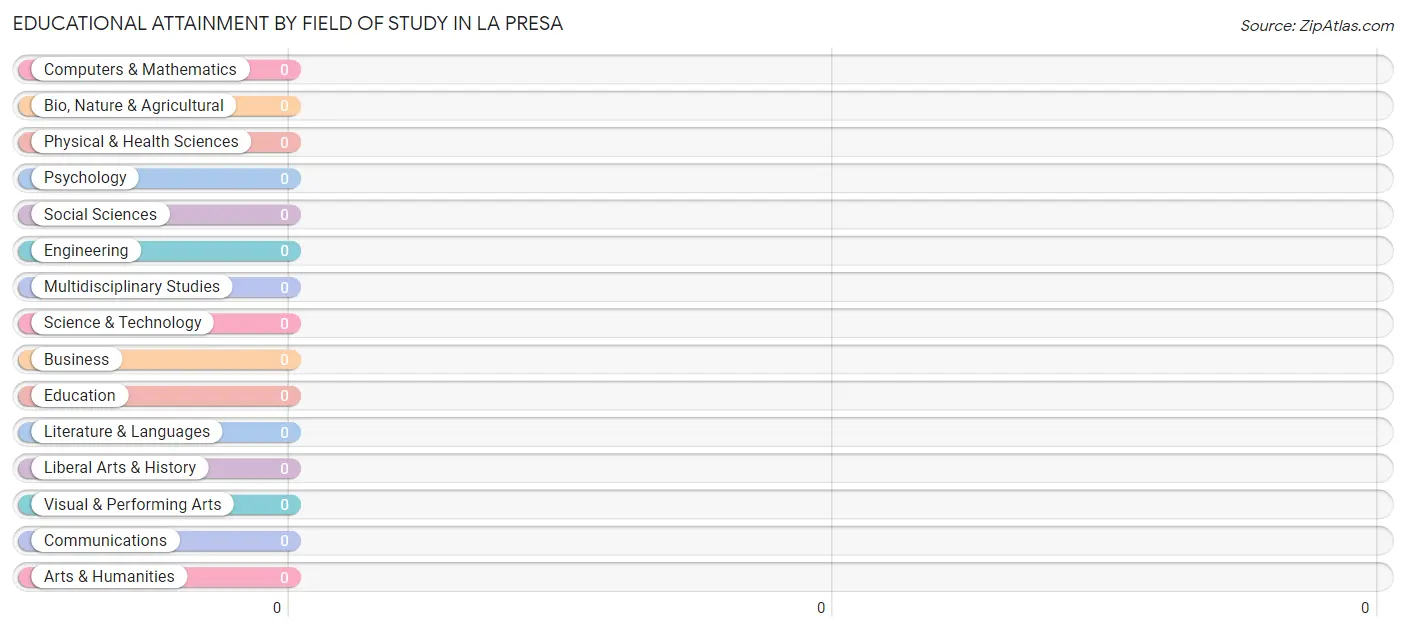
| Field of Study | # Graduates | % Graduates |
| Computers & Mathematics | 0 | 0.0% |
| Bio, Nature & Agricultural | 0 | 0.0% |
| Physical & Health Sciences | 0 | 0.0% |
| Psychology | 0 | 0.0% |
| Social Sciences | 0 | 0.0% |
| Engineering | 0 | 0.0% |
| Multidisciplinary Studies | 0 | 0.0% |
| Science & Technology | 0 | 0.0% |
| Business | 0 | 0.0% |
| Education | 0 | 0.0% |
| Literature & Languages | 0 | 0.0% |
| Liberal Arts & History | 0 | 0.0% |
| Visual & Performing Arts | 0 | 0.0% |
| Communications | 0 | 0.0% |
| Arts & Humanities | 0 | 0.0% |
| Total | 0 | 0.0% |
Transportation & Commute in La Presa
Vehicle Availability by Sex in La Presa
The most prevalent vehicle ownership categories in La Presa are males with 5 or more vehicles (47, accounting for 66.2%) and females with 5 or more vehicles (0, making up 293.8%).
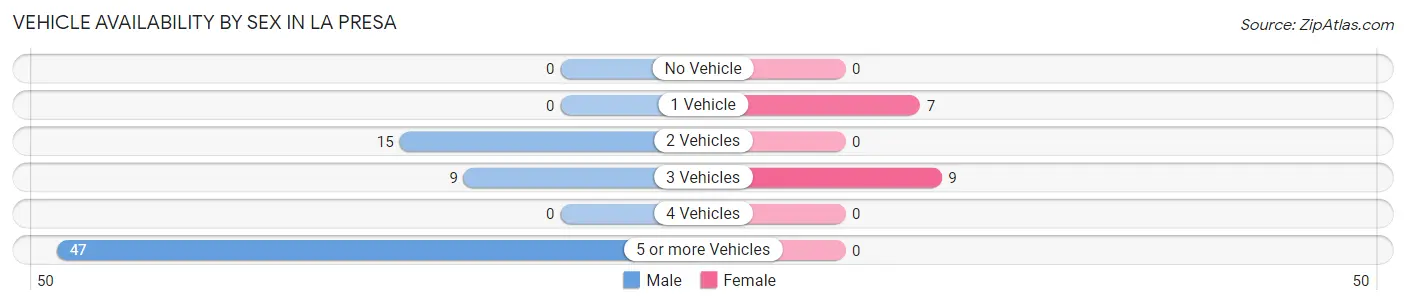
| Vehicles Available | Male | Female |
| No Vehicle | 0 (0.0%) | 0 (0.0%) |
| 1 Vehicle | 0 (0.0%) | 7 (43.8%) |
| 2 Vehicles | 15 (21.1%) | 0 (0.0%) |
| 3 Vehicles | 9 (12.7%) | 9 (56.2%) |
| 4 Vehicles | 0 (0.0%) | 0 (0.0%) |
| 5 or more Vehicles | 47 (66.2%) | 0 (0.0%) |
| Total | 71 (100.0%) | 16 (100.0%) |
Commute Time in La Presa
The most frequently occuring commute durations in La Presa are 90 or more minutes (47 commuters, 54.0%), 30 to 34 minutes (33 commuters, 37.9%), and less than 5 minutes (7 commuters, 8.1%).

| Commute Time | # Commuters | % Commuters |
| Less than 5 Minutes | 7 | 8.1% |
| 5 to 9 Minutes | 0 | 0.0% |
| 10 to 14 Minutes | 0 | 0.0% |
| 15 to 19 Minutes | 0 | 0.0% |
| 20 to 24 Minutes | 0 | 0.0% |
| 25 to 29 Minutes | 0 | 0.0% |
| 30 to 34 Minutes | 33 | 37.9% |
| 35 to 39 Minutes | 0 | 0.0% |
| 40 to 44 Minutes | 0 | 0.0% |
| 45 to 59 Minutes | 0 | 0.0% |
| 60 to 89 Minutes | 0 | 0.0% |
| 90 or more Minutes | 47 | 54.0% |
Commute Time by Sex in La Presa
The most common commute times in La Presa are 90 or more minutes (47 commuters, 66.2%) for males and 30 to 34 minutes (9 commuters, 56.2%) for females.
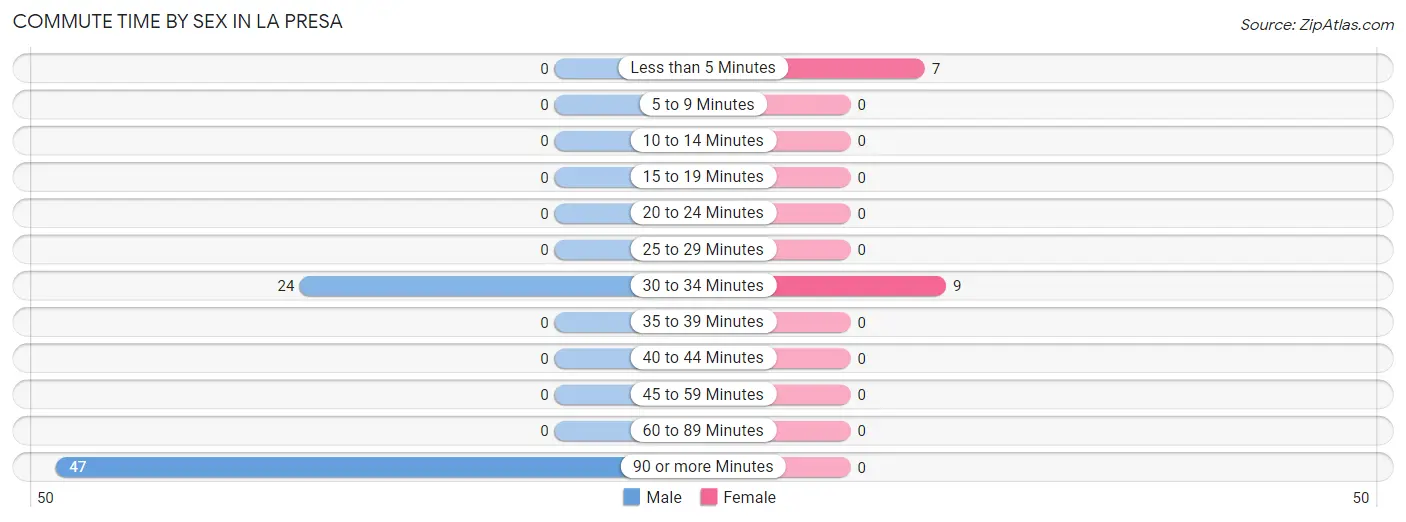
| Commute Time | Male | Female |
| Less than 5 Minutes | 0 (0.0%) | 7 (43.8%) |
| 5 to 9 Minutes | 0 (0.0%) | 0 (0.0%) |
| 10 to 14 Minutes | 0 (0.0%) | 0 (0.0%) |
| 15 to 19 Minutes | 0 (0.0%) | 0 (0.0%) |
| 20 to 24 Minutes | 0 (0.0%) | 0 (0.0%) |
| 25 to 29 Minutes | 0 (0.0%) | 0 (0.0%) |
| 30 to 34 Minutes | 24 (33.8%) | 9 (56.2%) |
| 35 to 39 Minutes | 0 (0.0%) | 0 (0.0%) |
| 40 to 44 Minutes | 0 (0.0%) | 0 (0.0%) |
| 45 to 59 Minutes | 0 (0.0%) | 0 (0.0%) |
| 60 to 89 Minutes | 0 (0.0%) | 0 (0.0%) |
| 90 or more Minutes | 47 (66.2%) | 0 (0.0%) |
Time of Departure to Work by Sex in La Presa
The most frequent times of departure to work in La Presa are 12:00 AM to 4:59 AM (47, 66.2%) for males and 8:00 AM to 8:29 AM (16, 100.0%) for females.
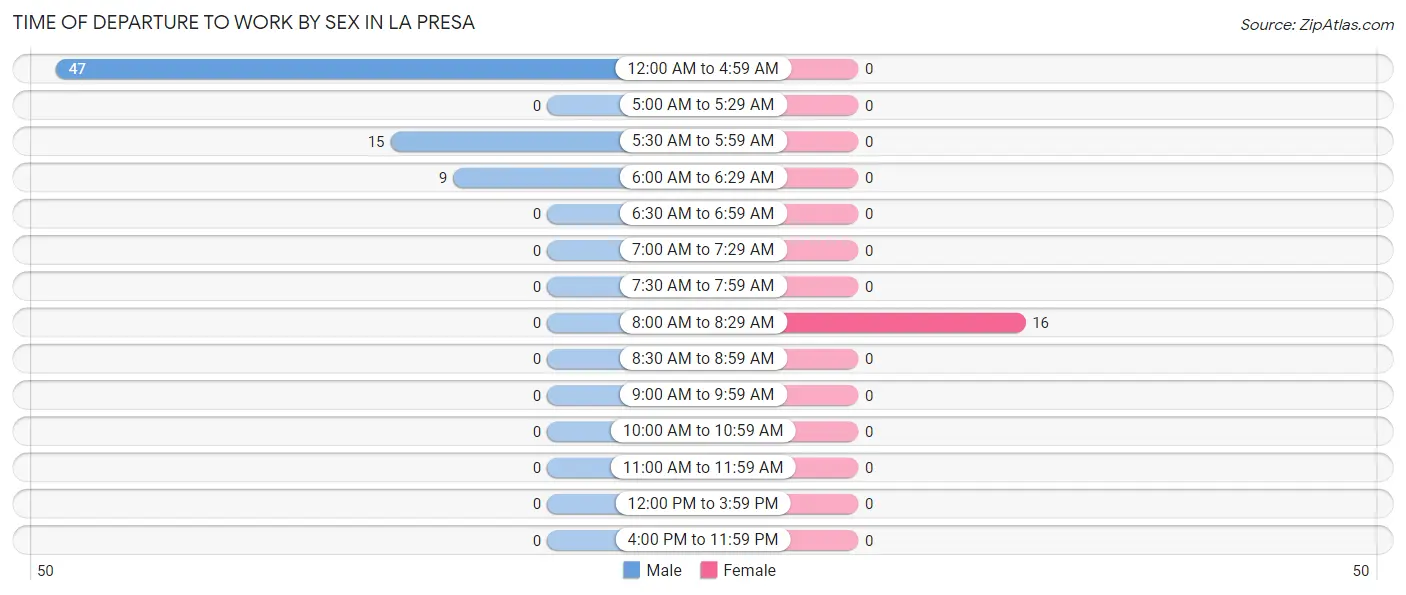
| Time of Departure | Male | Female |
| 12:00 AM to 4:59 AM | 47 (66.2%) | 0 (0.0%) |
| 5:00 AM to 5:29 AM | 0 (0.0%) | 0 (0.0%) |
| 5:30 AM to 5:59 AM | 15 (21.1%) | 0 (0.0%) |
| 6:00 AM to 6:29 AM | 9 (12.7%) | 0 (0.0%) |
| 6:30 AM to 6:59 AM | 0 (0.0%) | 0 (0.0%) |
| 7:00 AM to 7:29 AM | 0 (0.0%) | 0 (0.0%) |
| 7:30 AM to 7:59 AM | 0 (0.0%) | 0 (0.0%) |
| 8:00 AM to 8:29 AM | 0 (0.0%) | 16 (100.0%) |
| 8:30 AM to 8:59 AM | 0 (0.0%) | 0 (0.0%) |
| 9:00 AM to 9:59 AM | 0 (0.0%) | 0 (0.0%) |
| 10:00 AM to 10:59 AM | 0 (0.0%) | 0 (0.0%) |
| 11:00 AM to 11:59 AM | 0 (0.0%) | 0 (0.0%) |
| 12:00 PM to 3:59 PM | 0 (0.0%) | 0 (0.0%) |
| 4:00 PM to 11:59 PM | 0 (0.0%) | 0 (0.0%) |
| Total | 71 (100.0%) | 16 (100.0%) |
Housing Occupancy in La Presa
Occupancy by Ownership in La Presa
Of the total 75 dwellings in La Presa, owner-occupied units account for 47 (62.7%), while renter-occupied units make up 28 (37.3%).
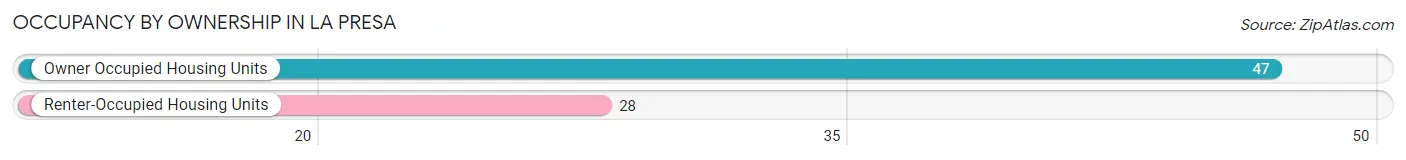
| Occupancy | # Housing Units | % Housing Units |
| Owner Occupied Housing Units | 47 | 62.7% |
| Renter-Occupied Housing Units | 28 | 37.3% |
| Total Occupied Housing Units | 75 | 100.0% |
Occupancy by Household Size in La Presa
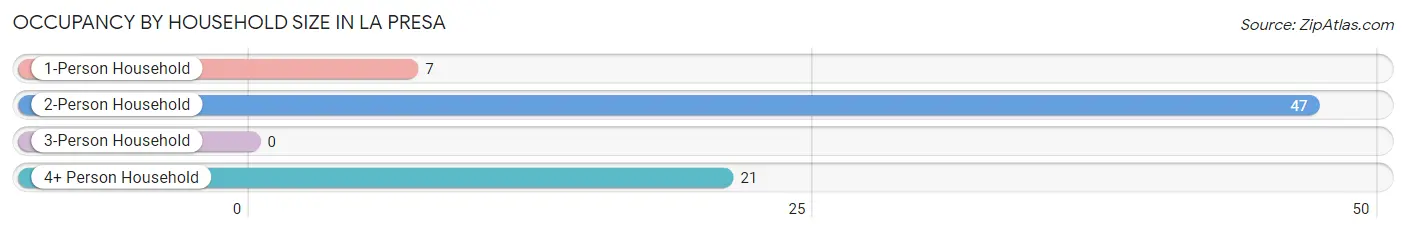
| Household Size | # Housing Units | % Housing Units |
| 1-Person Household | 7 | 9.3% |
| 2-Person Household | 47 | 62.7% |
| 3-Person Household | 0 | 0.0% |
| 4+ Person Household | 21 | 28.0% |
| Total Housing Units | 75 | 100.0% |
Occupancy by Ownership by Household Size in La Presa
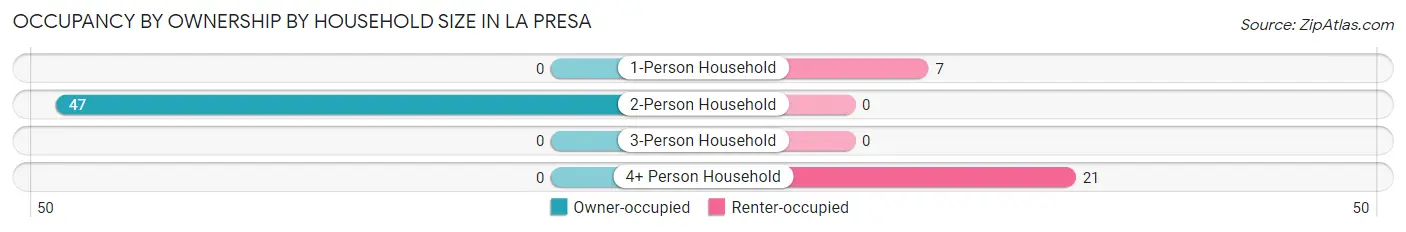
| Household Size | Owner-occupied | Renter-occupied |
| 1-Person Household | 0 (0.0%) | 7 (100.0%) |
| 2-Person Household | 47 (100.0%) | 0 (0.0%) |
| 3-Person Household | 0 (0.0%) | 0 (0.0%) |
| 4+ Person Household | 0 (0.0%) | 21 (100.0%) |
| Total Housing Units | 47 (62.7%) | 28 (37.3%) |
Occupancy by Educational Attainment in La Presa
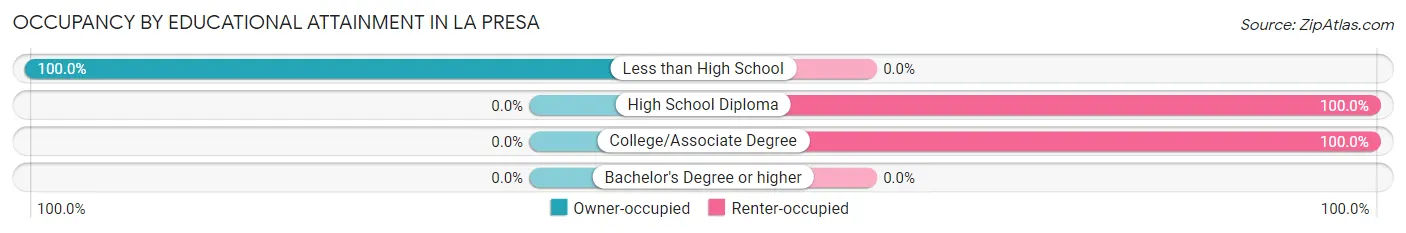
| Household Size | Owner-occupied | Renter-occupied |
| Less than High School | 47 (100.0%) | 0 (0.0%) |
| High School Diploma | 0 (0.0%) | 12 (100.0%) |
| College/Associate Degree | 0 (0.0%) | 16 (100.0%) |
| Bachelor's Degree or higher | 0 (0.0%) | 0 (0.0%) |
Occupancy by Age of Householder in La Presa
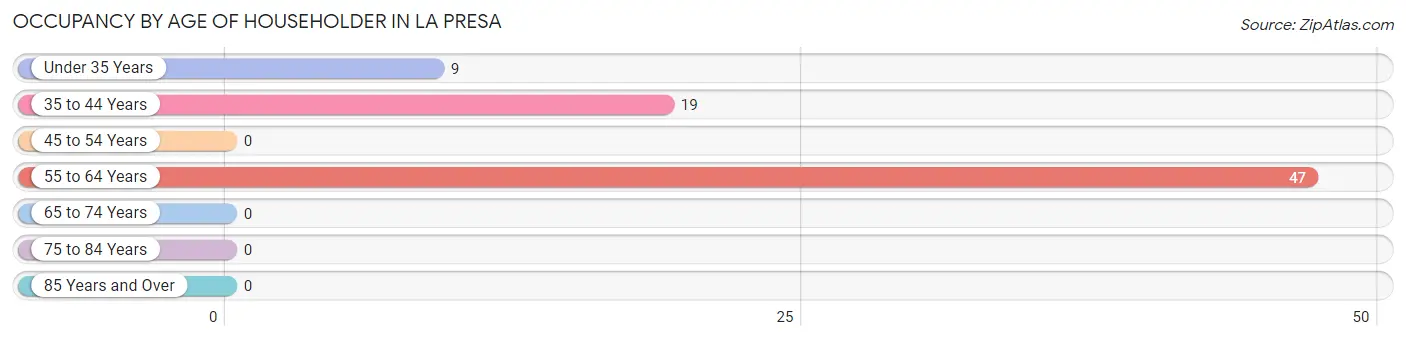
| Age Bracket | # Households | % Households |
| Under 35 Years | 9 | 12.0% |
| 35 to 44 Years | 19 | 25.3% |
| 45 to 54 Years | 0 | 0.0% |
| 55 to 64 Years | 47 | 62.7% |
| 65 to 74 Years | 0 | 0.0% |
| 75 to 84 Years | 0 | 0.0% |
| 85 Years and Over | 0 | 0.0% |
| Total | 75 | 100.0% |
Housing Finances in La Presa
Median Income by Occupancy in La Presa
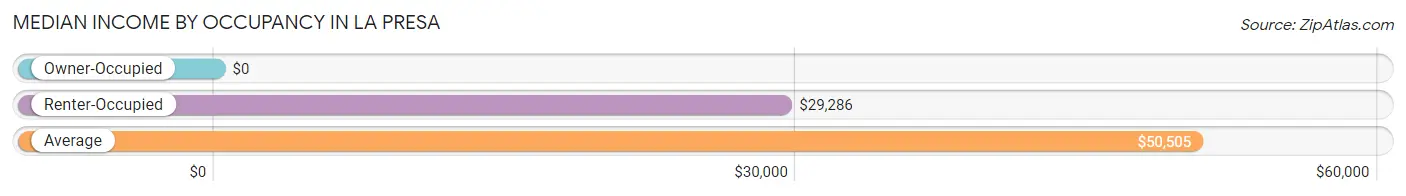
| Occupancy Type | # Households | Median Income |
| Owner-Occupied | 47 (62.7%) | $0 |
| Renter-Occupied | 28 (37.3%) | $29,286 |
| Average | 75 (100.0%) | $50,505 |
Occupancy by Householder Income Bracket in La Presa
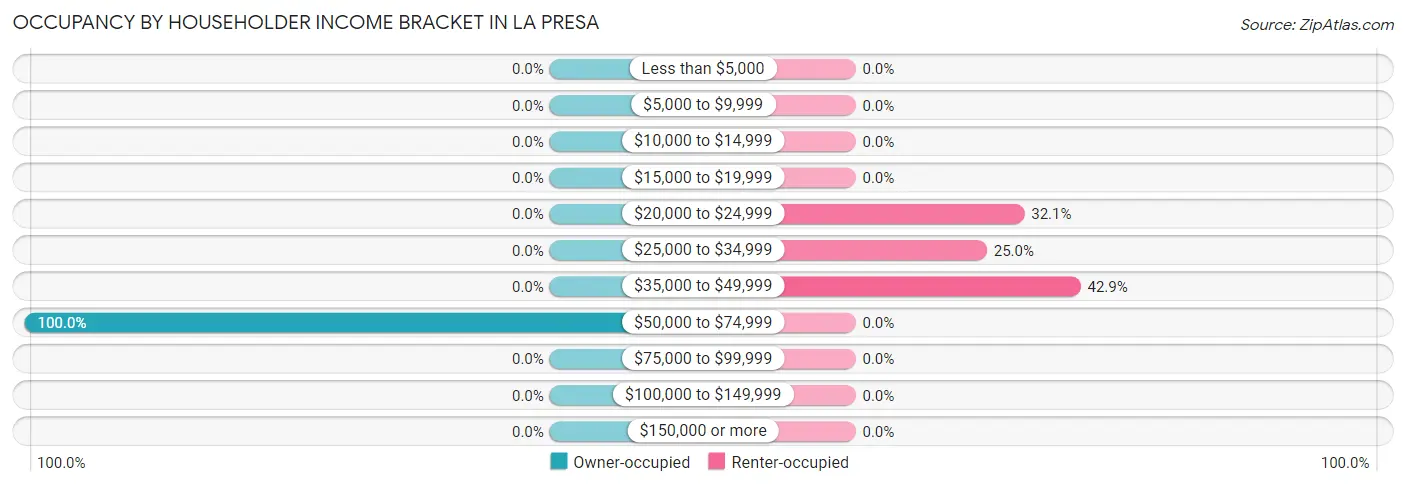
| Income Bracket | Owner-occupied | Renter-occupied |
| Less than $5,000 | 0 (0.0%) | 0 (0.0%) |
| $5,000 to $9,999 | 0 (0.0%) | 0 (0.0%) |
| $10,000 to $14,999 | 0 (0.0%) | 0 (0.0%) |
| $15,000 to $19,999 | 0 (0.0%) | 0 (0.0%) |
| $20,000 to $24,999 | 0 (0.0%) | 9 (32.1%) |
| $25,000 to $34,999 | 0 (0.0%) | 7 (25.0%) |
| $35,000 to $49,999 | 0 (0.0%) | 12 (42.9%) |
| $50,000 to $74,999 | 47 (100.0%) | 0 (0.0%) |
| $75,000 to $99,999 | 0 (0.0%) | 0 (0.0%) |
| $100,000 to $149,999 | 0 (0.0%) | 0 (0.0%) |
| $150,000 or more | 0 (0.0%) | 0 (0.0%) |
| Total | 47 (100.0%) | 28 (100.0%) |
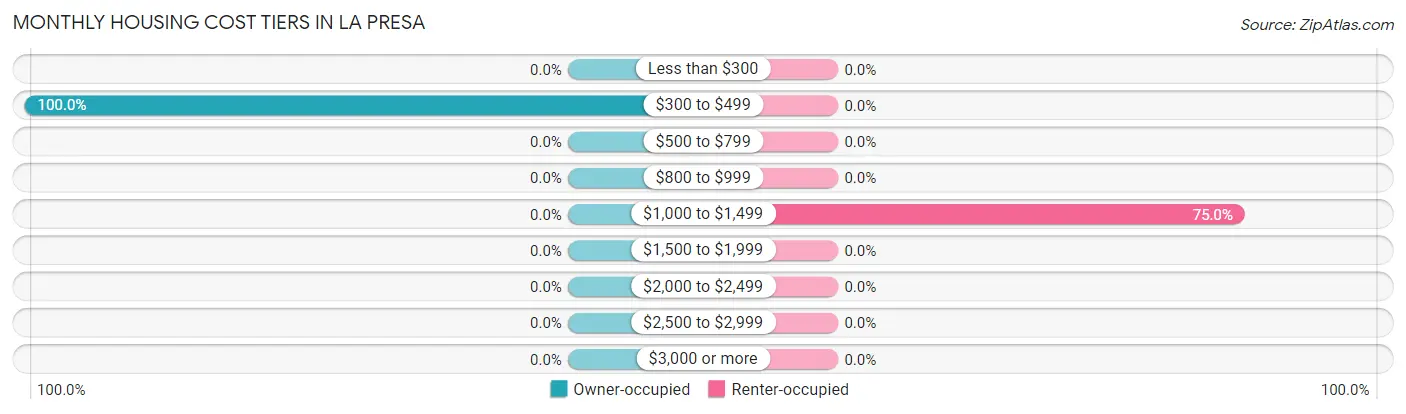
Monthly Housing Cost Tiers in La Presa
| Monthly Cost | Owner-occupied | Renter-occupied |
| Less than $300 | 0 (0.0%) | 0 (0.0%) |
| $300 to $499 | 47 (100.0%) | 0 (0.0%) |
| $500 to $799 | 0 (0.0%) | 0 (0.0%) |
| $800 to $999 | 0 (0.0%) | 0 (0.0%) |
| $1,000 to $1,499 | 0 (0.0%) | 21 (75.0%) |
| $1,500 to $1,999 | 0 (0.0%) | 0 (0.0%) |
| $2,000 to $2,499 | 0 (0.0%) | 0 (0.0%) |
| $2,500 to $2,999 | 0 (0.0%) | 0 (0.0%) |
| $3,000 or more | 0 (0.0%) | 0 (0.0%) |
| Total | 47 (100.0%) | 28 (100.0%) |
Physical Housing Characteristics in La Presa
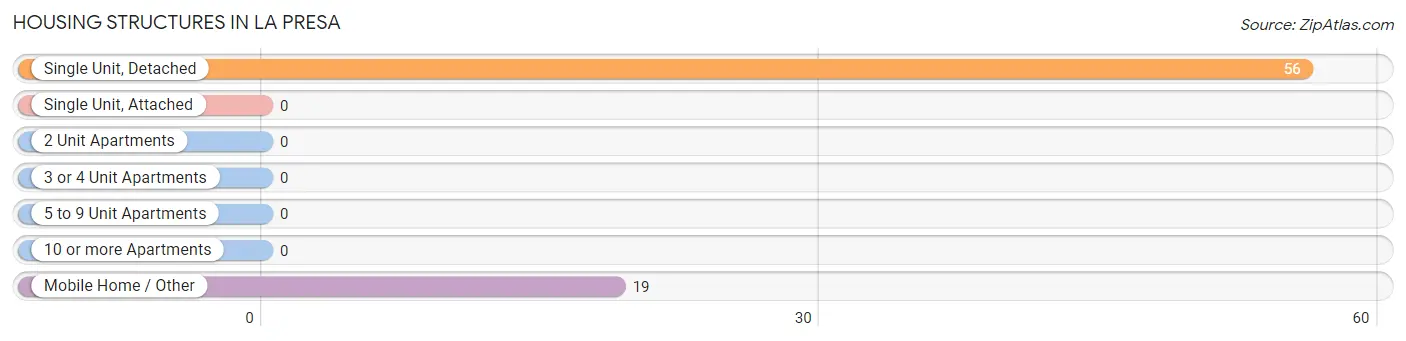
Housing Structures in La Presa
| Structure Type | # Housing Units | % Housing Units |
| Single Unit, Detached | 56 | 74.7% |
| Single Unit, Attached | 0 | 0.0% |
| 2 Unit Apartments | 0 | 0.0% |
| 3 or 4 Unit Apartments | 0 | 0.0% |
| 5 to 9 Unit Apartments | 0 | 0.0% |
| 10 or more Apartments | 0 | 0.0% |
| Mobile Home / Other | 19 | 25.3% |
| Total | 75 | 100.0% |
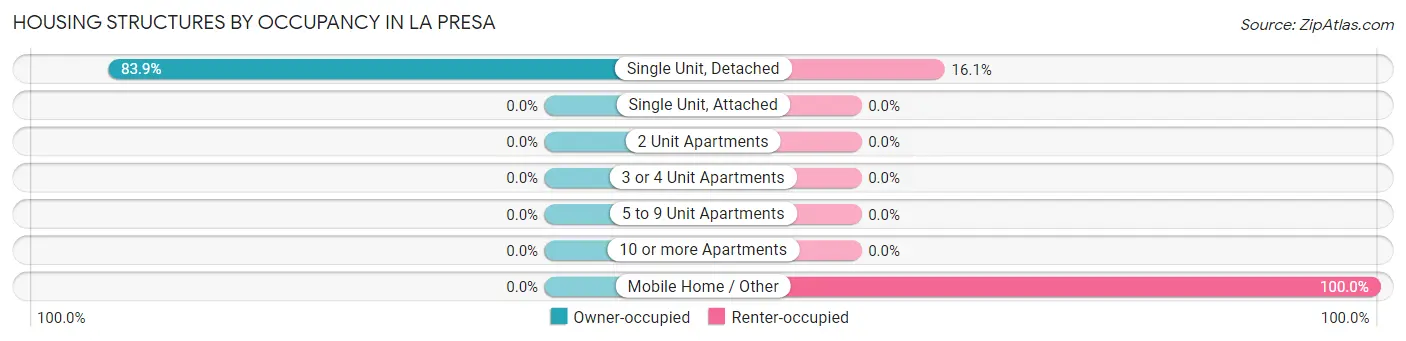
Housing Structures by Occupancy in La Presa
| Structure Type | Owner-occupied | Renter-occupied |
| Single Unit, Detached | 47 (83.9%) | 9 (16.1%) |
| Single Unit, Attached | 0 (0.0%) | 0 (0.0%) |
| 2 Unit Apartments | 0 (0.0%) | 0 (0.0%) |
| 3 or 4 Unit Apartments | 0 (0.0%) | 0 (0.0%) |
| 5 to 9 Unit Apartments | 0 (0.0%) | 0 (0.0%) |
| 10 or more Apartments | 0 (0.0%) | 0 (0.0%) |
| Mobile Home / Other | 0 (0.0%) | 19 (100.0%) |
| Total | 47 (62.7%) | 28 (37.3%) |
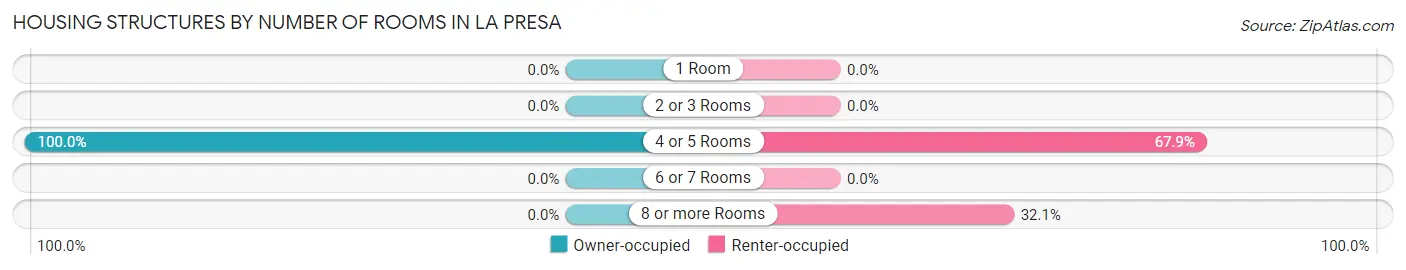
Housing Structures by Number of Rooms in La Presa
| Number of Rooms | Owner-occupied | Renter-occupied |
| 1 Room | 0 (0.0%) | 0 (0.0%) |
| 2 or 3 Rooms | 0 (0.0%) | 0 (0.0%) |
| 4 or 5 Rooms | 47 (100.0%) | 19 (67.9%) |
| 6 or 7 Rooms | 0 (0.0%) | 0 (0.0%) |
| 8 or more Rooms | 0 (0.0%) | 9 (32.1%) |
| Total | 47 (100.0%) | 28 (100.0%) |
Housing Structure by Heating Type in La Presa
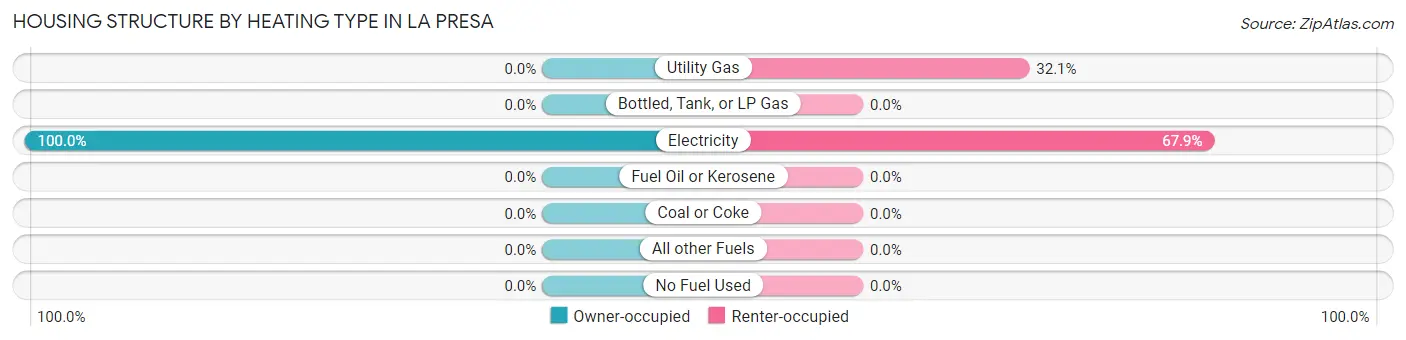
| Heating Type | Owner-occupied | Renter-occupied |
| Utility Gas | 0 (0.0%) | 9 (32.1%) |
| Bottled, Tank, or LP Gas | 0 (0.0%) | 0 (0.0%) |
| Electricity | 47 (100.0%) | 19 (67.9%) |
| Fuel Oil or Kerosene | 0 (0.0%) | 0 (0.0%) |
| Coal or Coke | 0 (0.0%) | 0 (0.0%) |
| All other Fuels | 0 (0.0%) | 0 (0.0%) |
| No Fuel Used | 0 (0.0%) | 0 (0.0%) |
| Total | 47 (100.0%) | 28 (100.0%) |
Household Vehicle Usage in La Presa
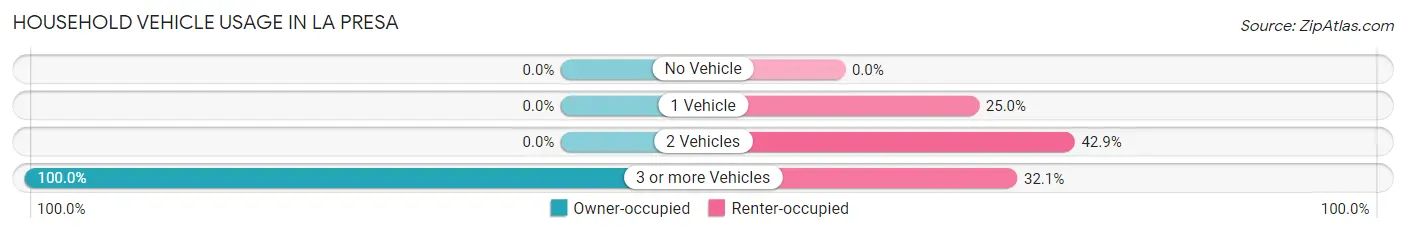
| Vehicles per Household | Owner-occupied | Renter-occupied |
| No Vehicle | 0 (0.0%) | 0 (0.0%) |
| 1 Vehicle | 0 (0.0%) | 7 (25.0%) |
| 2 Vehicles | 0 (0.0%) | 12 (42.9%) |
| 3 or more Vehicles | 47 (100.0%) | 9 (32.1%) |
| Total | 47 (100.0%) | 28 (100.0%) |
Real Estate & Mortgages in La Presa
Real Estate and Mortgage Overview in La Presa
| Characteristic | Without Mortgage | With Mortgage |
| Housing Units | 47 | 0 |
| Median Property Value | - | - |
| Median Household Income | - | - |
| Monthly Housing Costs | - | - |
| Real Estate Taxes | - | - |
Property Value by Mortgage Status in La Presa
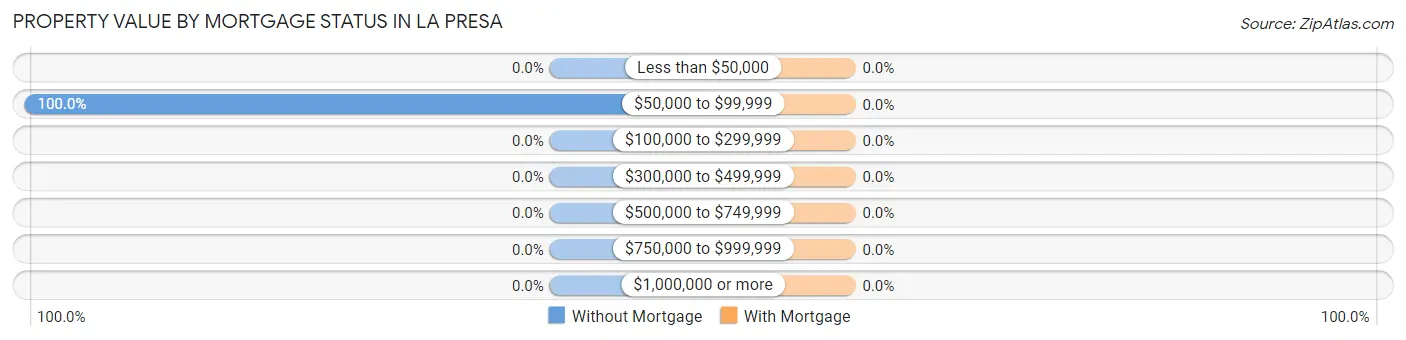
| Property Value | Without Mortgage | With Mortgage |
| Less than $50,000 | 0 (0.0%) | 0 (0.0%) |
| $50,000 to $99,999 | 47 (100.0%) | 0 (0.0%) |
| $100,000 to $299,999 | 0 (0.0%) | 0 (0.0%) |
| $300,000 to $499,999 | 0 (0.0%) | 0 (0.0%) |
| $500,000 to $749,999 | 0 (0.0%) | 0 (0.0%) |
| $750,000 to $999,999 | 0 (0.0%) | 0 (0.0%) |
| $1,000,000 or more | 0 (0.0%) | 0 (0.0%) |
| Total | 47 (100.0%) | 0 (0.0%) |
Household Income by Mortgage Status in La Presa
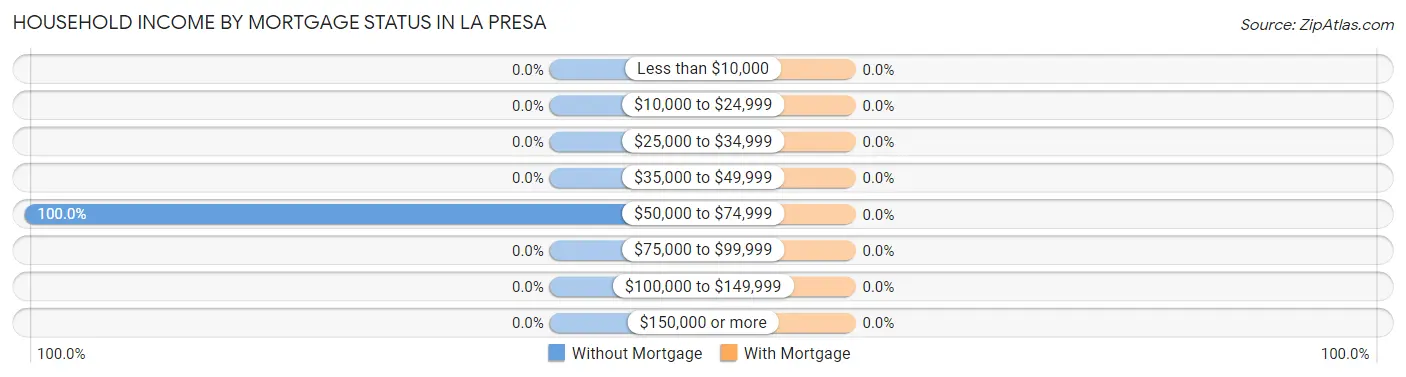
| Household Income | Without Mortgage | With Mortgage |
| Less than $10,000 | 0 (0.0%) | 0 (0.0%) |
| $10,000 to $24,999 | 0 (0.0%) | 0 (0.0%) |
| $25,000 to $34,999 | 0 (0.0%) | 0 (0.0%) |
| $35,000 to $49,999 | 0 (0.0%) | 0 (0.0%) |
| $50,000 to $74,999 | 47 (100.0%) | 0 (0.0%) |
| $75,000 to $99,999 | 0 (0.0%) | 0 (0.0%) |
| $100,000 to $149,999 | 0 (0.0%) | 0 (0.0%) |
| $150,000 or more | 0 (0.0%) | 0 (0.0%) |
| Total | 47 (100.0%) | 0 (0.0%) |
Property Value to Household Income Ratio in La Presa
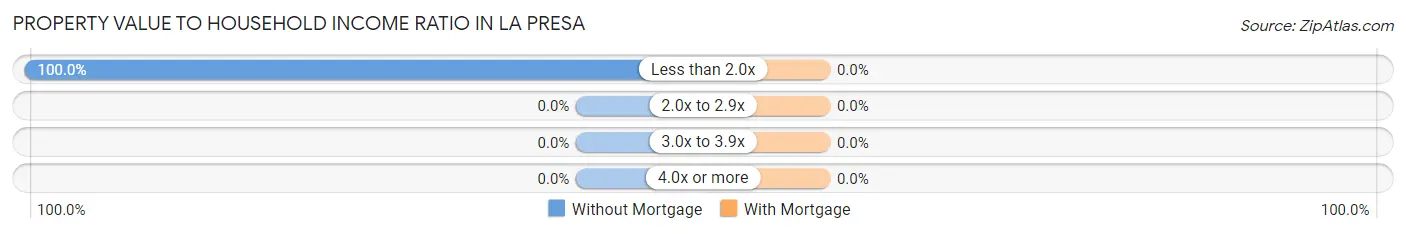
| Value-to-Income Ratio | Without Mortgage | With Mortgage |
| Less than 2.0x | 47 (100.0%) | 0 (0.0%) |
| 2.0x to 2.9x | 0 (0.0%) | 0 (0.0%) |
| 3.0x to 3.9x | 0 (0.0%) | 0 (0.0%) |
| 4.0x or more | 0 (0.0%) | 0 (0.0%) |
| Total | 47 (100.0%) | 0 (0.0%) |
Real Estate Taxes by Mortgage Status in La Presa
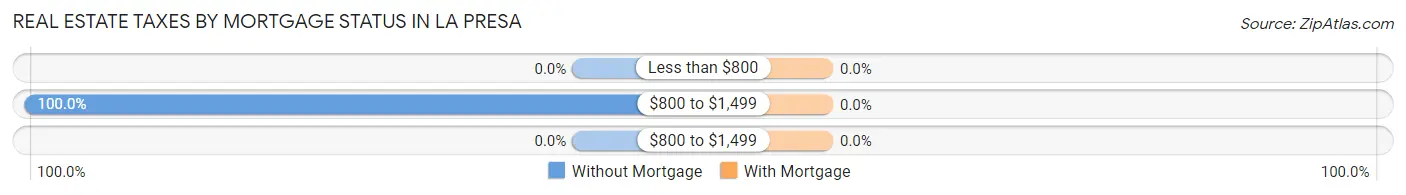
| Property Taxes | Without Mortgage | With Mortgage |
| Less than $800 | 0 (0.0%) | 0 (0.0%) |
| $800 to $1,499 | 47 (100.0%) | 0 (0.0%) |
| $800 to $1,499 | 0 (0.0%) | 0 (0.0%) |
| Total | 47 (100.0%) | 0 (0.0%) |
Health & Disability in La Presa
Health Insurance Coverage by Age in La Presa
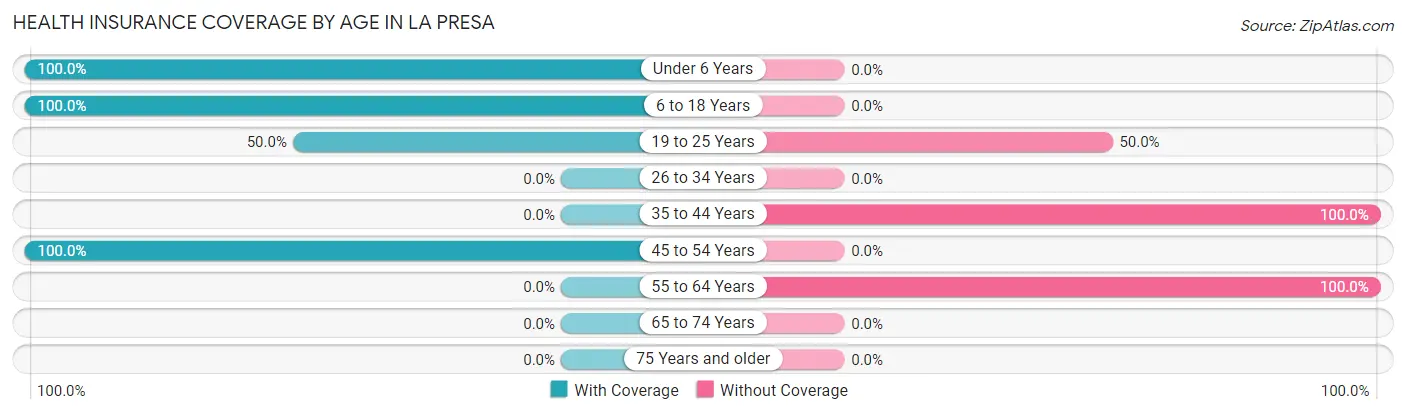
| Age Bracket | With Coverage | Without Coverage |
| Under 6 Years | 50 (100.0%) | 0 (0.0%) |
| 6 to 18 Years | 28 (100.0%) | 0 (0.0%) |
| 19 to 25 Years | 9 (50.0%) | 9 (50.0%) |
| 26 to 34 Years | 0 (0.0%) | 0 (0.0%) |
| 35 to 44 Years | 0 (0.0%) | 19 (100.0%) |
| 45 to 54 Years | 15 (100.0%) | 0 (0.0%) |
| 55 to 64 Years | 0 (0.0%) | 90 (100.0%) |
| 65 to 74 Years | 0 (0.0%) | 0 (0.0%) |
| 75 Years and older | 0 (0.0%) | 0 (0.0%) |
| Total | 102 (46.4%) | 118 (53.6%) |
Health Insurance Coverage by Citizenship Status in La Presa
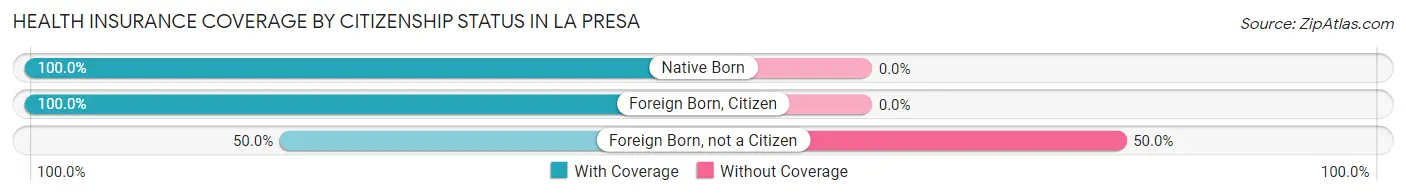
| Citizenship Status | With Coverage | Without Coverage |
| Native Born | 50 (100.0%) | 0 (0.0%) |
| Foreign Born, Citizen | 28 (100.0%) | 0 (0.0%) |
| Foreign Born, not a Citizen | 9 (50.0%) | 9 (50.0%) |
Health Insurance Coverage by Household Income in La Presa
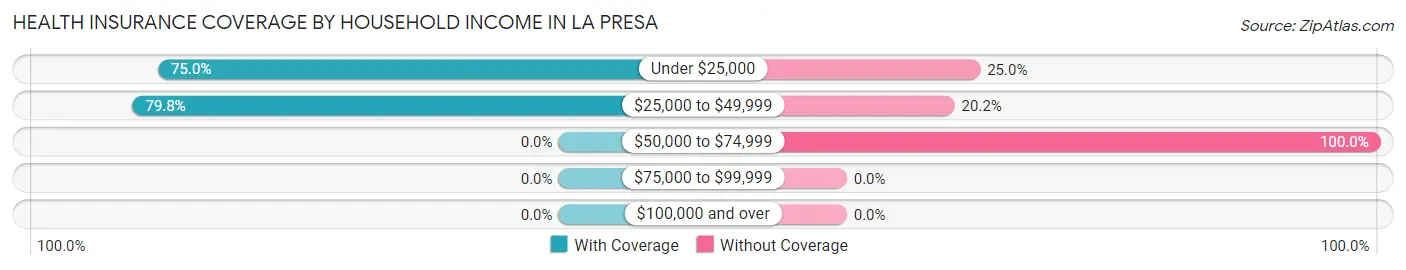
| Household Income | With Coverage | Without Coverage |
| Under $25,000 | 27 (75.0%) | 9 (25.0%) |
| $25,000 to $49,999 | 75 (79.8%) | 19 (20.2%) |
| $50,000 to $74,999 | 0 (0.0%) | 90 (100.0%) |
| $75,000 to $99,999 | 0 (0.0%) | 0 (0.0%) |
| $100,000 and over | 0 (0.0%) | 0 (0.0%) |
Public vs Private Health Insurance Coverage by Age in La Presa
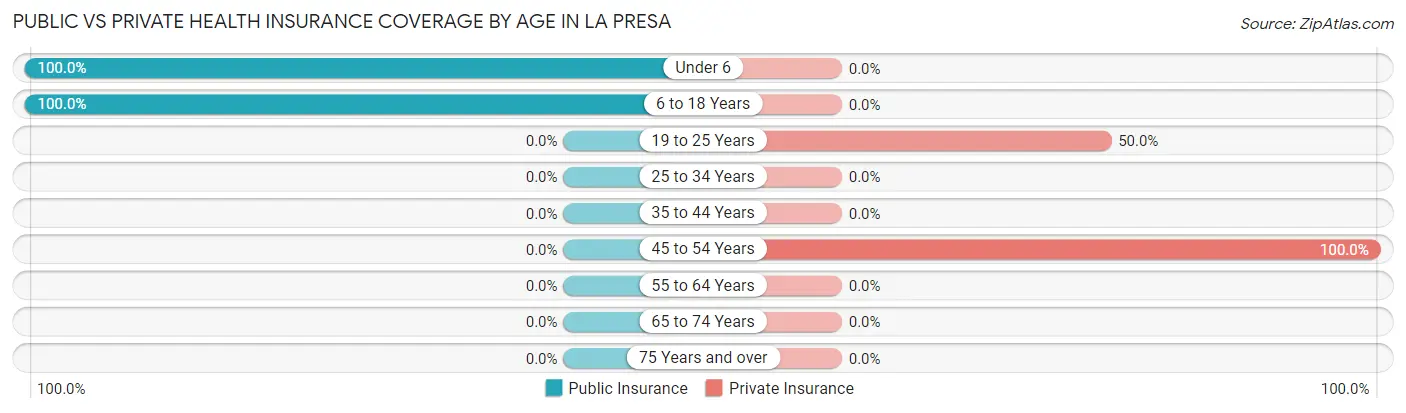
| Age Bracket | Public Insurance | Private Insurance |
| Under 6 | 50 (100.0%) | 0 (0.0%) |
| 6 to 18 Years | 28 (100.0%) | 0 (0.0%) |
| 19 to 25 Years | 0 (0.0%) | 9 (50.0%) |
| 25 to 34 Years | 0 (0.0%) | 0 (0.0%) |
| 35 to 44 Years | 0 (0.0%) | 0 (0.0%) |
| 45 to 54 Years | 0 (0.0%) | 15 (100.0%) |
| 55 to 64 Years | 0 (0.0%) | 0 (0.0%) |
| 65 to 74 Years | 0 (0.0%) | 0 (0.0%) |
| 75 Years and over | 0 (0.0%) | 0 (0.0%) |
| Total | 78 (35.4%) | 24 (10.9%) |
Disability Status by Sex by Age in La Presa
| Age Bracket | Male | Female |
| Under 5 Years | 0 (0.0%) | 0 (0.0%) |
| 5 to 17 Years | 0 (0.0%) | 0 (0.0%) |
| 18 to 34 Years | 0 (0.0%) | 0 (0.0%) |
| 35 to 64 Years | 0 (0.0%) | 0 (0.0%) |
| 65 to 74 Years | 0 (0.0%) | 0 (0.0%) |
| 75 Years and over | 0 (0.0%) | 0 (0.0%) |
Disability Class by Sex by Age in La Presa
Disability Class: Hearing Difficulty
| Age Bracket | Male | Female |
| Under 5 Years | 0 (0.0%) | 0 (0.0%) |
| 5 to 17 Years | 0 (0.0%) | 0 (0.0%) |
| 18 to 34 Years | 0 (0.0%) | 0 (0.0%) |
| 35 to 64 Years | 0 (0.0%) | 0 (0.0%) |
| 65 to 74 Years | 0 (0.0%) | 0 (0.0%) |
| 75 Years and over | 0 (0.0%) | 0 (0.0%) |
Disability Class: Vision Difficulty
| Age Bracket | Male | Female |
| Under 5 Years | 0 (0.0%) | 0 (0.0%) |
| 5 to 17 Years | 0 (0.0%) | 0 (0.0%) |
| 18 to 34 Years | 0 (0.0%) | 0 (0.0%) |
| 35 to 64 Years | 0 (0.0%) | 0 (0.0%) |
| 65 to 74 Years | 0 (0.0%) | 0 (0.0%) |
| 75 Years and over | 0 (0.0%) | 0 (0.0%) |
Disability Class: Cognitive Difficulty
| Age Bracket | Male | Female |
| 5 to 17 Years | 0 (0.0%) | 0 (0.0%) |
| 18 to 34 Years | 0 (0.0%) | 0 (0.0%) |
| 35 to 64 Years | 0 (0.0%) | 0 (0.0%) |
| 65 to 74 Years | 0 (0.0%) | 0 (0.0%) |
| 75 Years and over | 0 (0.0%) | 0 (0.0%) |
Disability Class: Ambulatory Difficulty
| Age Bracket | Male | Female |
| 5 to 17 Years | 0 (0.0%) | 0 (0.0%) |
| 18 to 34 Years | 0 (0.0%) | 0 (0.0%) |
| 35 to 64 Years | 0 (0.0%) | 0 (0.0%) |
| 65 to 74 Years | 0 (0.0%) | 0 (0.0%) |
| 75 Years and over | 0 (0.0%) | 0 (0.0%) |
Disability Class: Self-Care Difficulty
| Age Bracket | Male | Female |
| 5 to 17 Years | 0 (0.0%) | 0 (0.0%) |
| 18 to 34 Years | 0 (0.0%) | 0 (0.0%) |
| 35 to 64 Years | 0 (0.0%) | 0 (0.0%) |
| 65 to 74 Years | 0 (0.0%) | 0 (0.0%) |
| 75 Years and over | 0 (0.0%) | 0 (0.0%) |
Technology Access in La Presa
Computing Device Access in La Presa
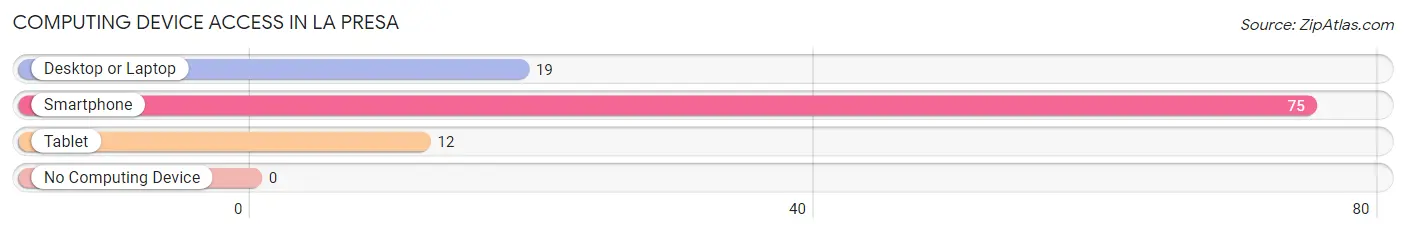
| Device Type | # Households | % Households |
| Desktop or Laptop | 19 | 25.3% |
| Smartphone | 75 | 100.0% |
| Tablet | 12 | 16.0% |
| No Computing Device | 0 | 0.0% |
| Total | 75 | 100.0% |
Internet Access in La Presa
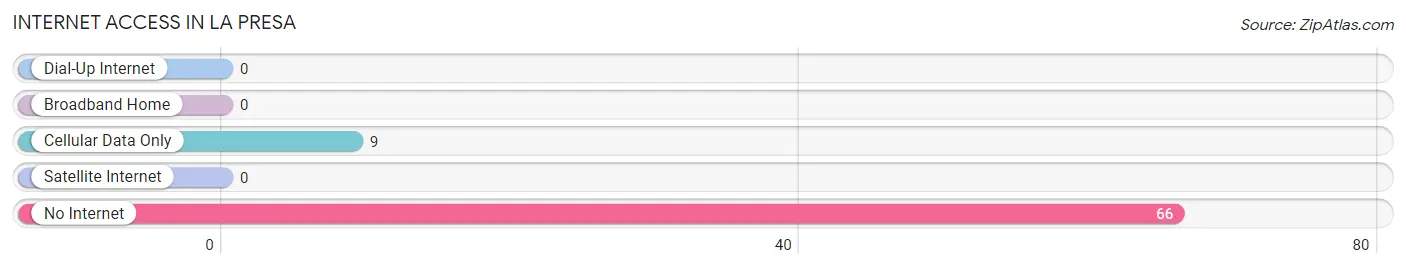
| Internet Type | # Households | % Households |
| Dial-Up Internet | 0 | 0.0% |
| Broadband Home | 0 | 0.0% |
| Cellular Data Only | 9 | 12.0% |
| Satellite Internet | 0 | 0.0% |
| No Internet | 66 | 88.0% |
| Total | 75 | 100.0% |
La Presa Summary
Presa, Texas is a small unincorporated community located in Starr County, Texas. It is situated on the banks of the Rio Grande River, approximately 20 miles south of Rio Grande City. The population of Presa was estimated to be around 1,000 people in 2000.
History
Presa, Texas was founded in the late 19th century by a group of Mexican settlers. The settlers were attracted to the area due to its fertile soil and abundant water supply from the Rio Grande River. The settlers named the community after the Spanish word for “dam”, as the area was known for its many dams used to irrigate the land.
In the early 20th century, Presa became a popular destination for Mexican immigrants seeking work in the United States. The community was also home to a large number of Mexican-American families who had been living in the area for generations.
Geography
Presa is located in Starr County, Texas, approximately 20 miles south of Rio Grande City. The community is situated on the banks of the Rio Grande River, which forms the border between the United States and Mexico. The area is characterized by flat terrain and is mostly used for agricultural purposes.
Economy
The economy of Presa is largely based on agriculture. The area is known for its production of cotton, corn, sorghum, and other crops. The community is also home to a number of small businesses, including restaurants, grocery stores, and other retail establishments.
Demographics
As of the 2000 census, the population of Presa was estimated to be around 1,000 people. The majority of the population is of Hispanic or Latino origin, with a small percentage of African Americans and other ethnicities. The median household income in Presa is approximately $20,000, and the median age is around 30 years old.
Conclusion
Presa, Texas is a small unincorporated community located in Starr County, Texas. It is situated on the banks of the Rio Grande River, approximately 20 miles south of Rio Grande City. The population of Presa was estimated to be around 1,000 people in 2000. The economy of Presa is largely based on agriculture, and the majority of the population is of Hispanic or Latino origin. Despite its small size, Presa is an important part of the local economy and culture of Starr County.
Common Questions
What is Per Capita Income in La Presa?
Per Capita income in La Presa is $14,595.
What is the Median Family Income in La Presa?
Median Family Income in La Presa is $50,691.
What is the Median Household income in La Presa?
Median Household Income in La Presa is $50,505.
What is Income or Wage Gap in La Presa?
Income or Wage Gap in La Presa is 61.1%.
Women in La Presa earn 38.9 cents for every dollar earned by a man.
What is Inequality or Gini Index in La Presa?
Inequality or Gini Index in La Presa is 0.13.
What is the Total Population of La Presa?
Total Population of La Presa is 220.
What is the Total Male Population of La Presa?
Total Male Population of La Presa is 123.
What is the Total Female Population of La Presa?
Total Female Population of La Presa is 97.
What is the Ratio of Males per 100 Females in La Presa?
There are 126.80 Males per 100 Females in La Presa.
What is the Ratio of Females per 100 Males in La Presa?
There are 78.86 Females per 100 Males in La Presa.
What is the Median Population Age in La Presa?
Median Population Age in La Presa is 37.7 Years.
What is the Average Family Size in La Presa
Average Family Size in La Presa is 2.9 People.
What is the Average Household Size in La Presa
Average Household Size in La Presa is 2.9 People.
How Large is the Labor Force in La Presa?
There are 87 People in the Labor Forcein in La Presa.
What is the Percentage of People in the Labor Force in La Presa?
61.3% of People are in the Labor Force in La Presa.