Green Acres, ND Map & Demographics
Green Acres Map
Green Acres Overview
$9,879
PER CAPITA INCOME
$39,875
AVG FAMILY INCOME
$50,197
AVG HOUSEHOLD INCOME
0.32
INEQUALITY / GINI INDEX
789
TOTAL POPULATION
468
MALE POPULATION
321
FEMALE POPULATION
145.79
MALES / 100 FEMALES
68.59
FEMALES / 100 MALES
24.6
MEDIAN AGE
5.2
AVG FAMILY SIZE
5.3
AVG HOUSEHOLD SIZE
158
LABOR FORCE [ PEOPLE ]
27.6%
PERCENT IN LABOR FORCE
Income in Green Acres
Income Overview in Green Acres
Per Capita Income in Green Acres is $9,879, while median incomes of families and households are $39,875 and $50,197 respectively.
| Characteristic | Number | Measure |
| Per Capita Income | 789 | $9,879 |
| Median Family Income | 137 | $39,875 |
| Mean Family Income | 137 | $42,269 |
| Median Household Income | 149 | $50,197 |
| Mean Household Income | 149 | $43,887 |
| Income Deficit | 137 | $0 |
| Wage / Income Gap (%) | 789 | 0.00% |
| Wage / Income Gap ($) | 789 | 100.00¢ per $1 |
| Gini / Inequality Index | 789 | 0.32 |
Earnings by Sex in Green Acres
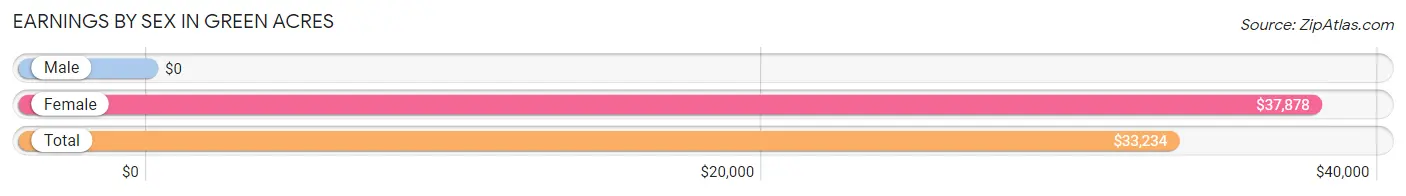
| Sex | Number | Average Earnings |
| Male | 78 (36.6%) | $0 |
| Female | 135 (63.4%) | $37,878 |
| Total | 213 (100.0%) | $33,234 |
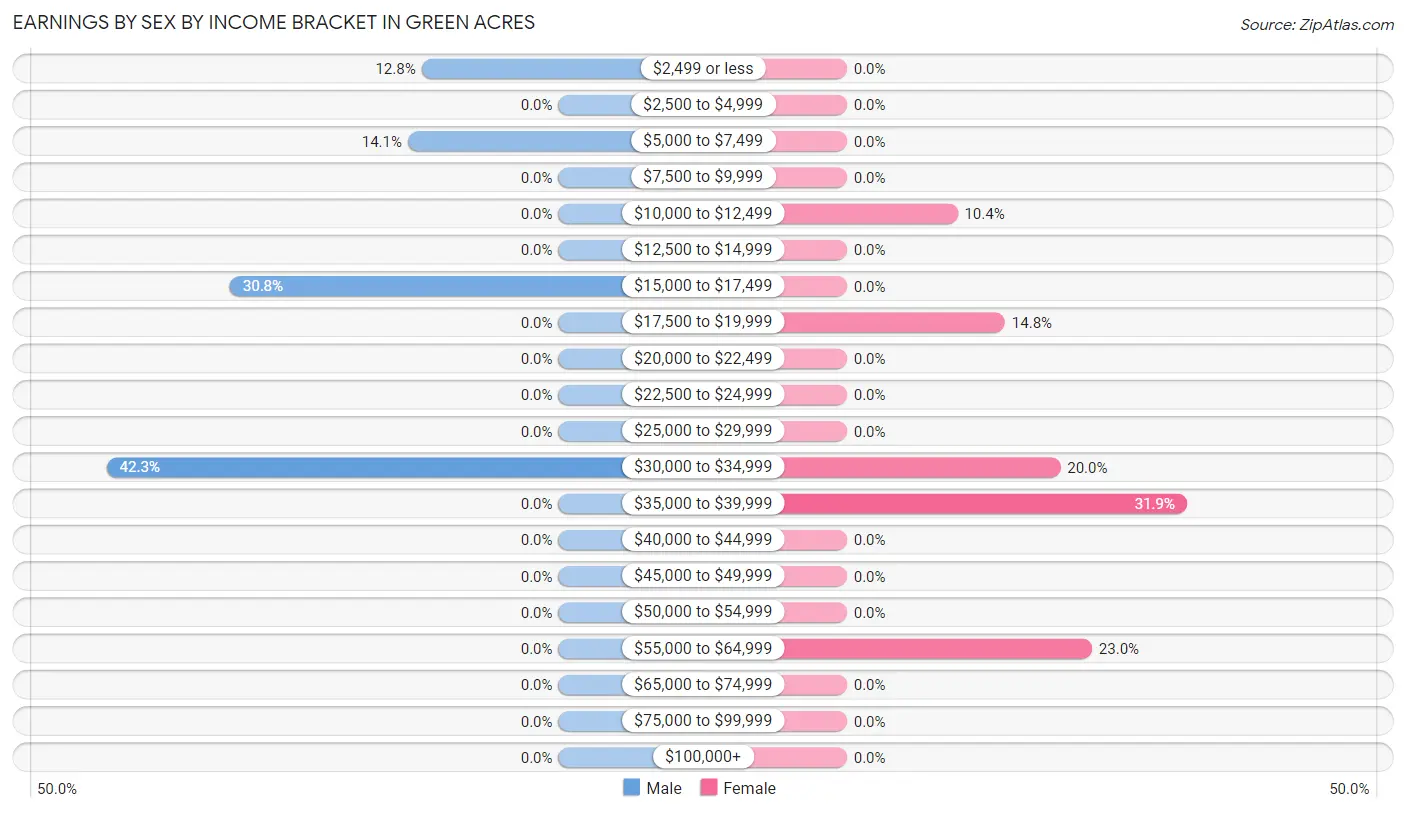
Earnings by Sex by Income Bracket in Green Acres
The most common earnings brackets in Green Acres are $30,000 to $34,999 for men (33 | 42.3%) and $35,000 to $39,999 for women (43 | 31.9%).
| Income | Male | Female |
| $2,499 or less | 10 (12.8%) | 0 (0.0%) |
| $2,500 to $4,999 | 0 (0.0%) | 0 (0.0%) |
| $5,000 to $7,499 | 11 (14.1%) | 0 (0.0%) |
| $7,500 to $9,999 | 0 (0.0%) | 0 (0.0%) |
| $10,000 to $12,499 | 0 (0.0%) | 14 (10.4%) |
| $12,500 to $14,999 | 0 (0.0%) | 0 (0.0%) |
| $15,000 to $17,499 | 24 (30.8%) | 0 (0.0%) |
| $17,500 to $19,999 | 0 (0.0%) | 20 (14.8%) |
| $20,000 to $22,499 | 0 (0.0%) | 0 (0.0%) |
| $22,500 to $24,999 | 0 (0.0%) | 0 (0.0%) |
| $25,000 to $29,999 | 0 (0.0%) | 0 (0.0%) |
| $30,000 to $34,999 | 33 (42.3%) | 27 (20.0%) |
| $35,000 to $39,999 | 0 (0.0%) | 43 (31.9%) |
| $40,000 to $44,999 | 0 (0.0%) | 0 (0.0%) |
| $45,000 to $49,999 | 0 (0.0%) | 0 (0.0%) |
| $50,000 to $54,999 | 0 (0.0%) | 0 (0.0%) |
| $55,000 to $64,999 | 0 (0.0%) | 31 (23.0%) |
| $65,000 to $74,999 | 0 (0.0%) | 0 (0.0%) |
| $75,000 to $99,999 | 0 (0.0%) | 0 (0.0%) |
| $100,000+ | 0 (0.0%) | 0 (0.0%) |
| Total | 78 (100.0%) | 135 (100.0%) |
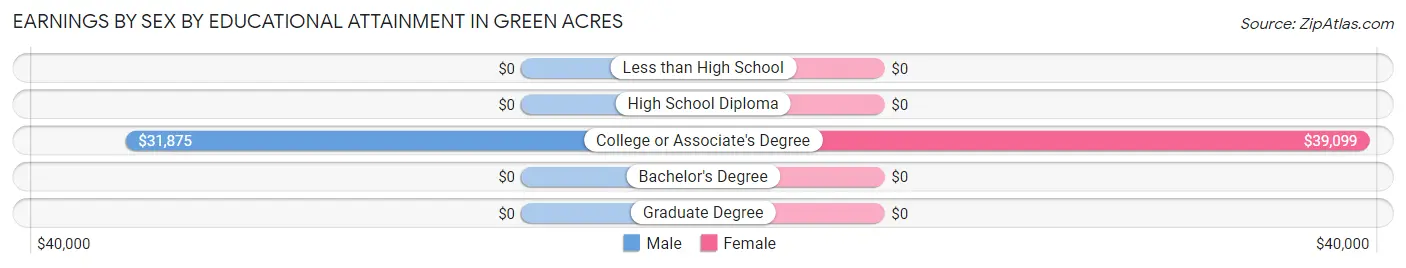
Earnings by Sex by Educational Attainment in Green Acres
Average earnings in Green Acres are $31,875 for men and $38,285 for women, a difference of 16.7%. Men with an educational attainment of college or associate's degree enjoy the highest average annual earnings of $31,875, while those with college or associate's degree education earn the least with $31,875. Women with an educational attainment of college or associate's degree earn the most with the average annual earnings of $39,099, while those with college or associate's degree education have the smallest earnings of $39,099.
| Educational Attainment | Male Income | Female Income |
| Less than High School | - | - |
| High School Diploma | - | - |
| College or Associate's Degree | $31,875 | $39,099 |
| Bachelor's Degree | - | - |
| Graduate Degree | - | - |
| Total | $31,875 | $38,285 |
Family Income in Green Acres
Family Income Brackets in Green Acres
According to the Green Acres family income data, there are 37 families falling into the $50,000 to $74,999 income range, which is the most common income bracket and makes up 27.0% of all families.
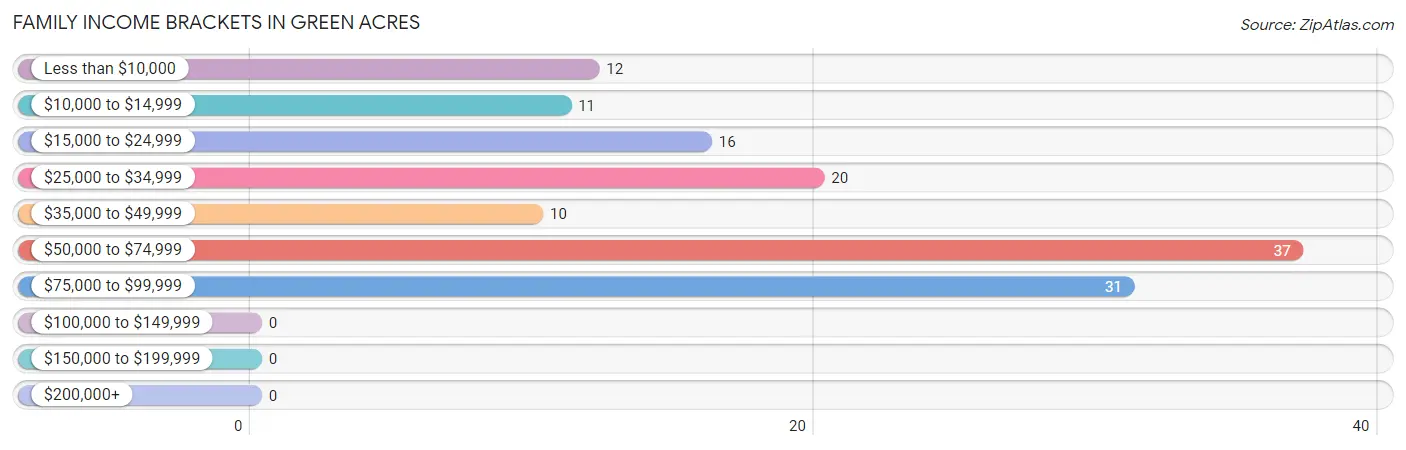
| Income Bracket | # Families | % Families |
| Less than $10,000 | 12 | 8.8% |
| $10,000 to $14,999 | 11 | 8.0% |
| $15,000 to $24,999 | 16 | 11.7% |
| $25,000 to $34,999 | 20 | 14.6% |
| $35,000 to $49,999 | 10 | 7.3% |
| $50,000 to $74,999 | 37 | 27.0% |
| $75,000 to $99,999 | 31 | 22.6% |
| $100,000 to $149,999 | 0 | 0.0% |
| $150,000 to $199,999 | 0 | 0.0% |
| $200,000+ | 0 | 0.0% |
Family Income by Famaliy Size in Green Acres
| Income Bracket | # Families | Median Income |
| 2-Person Families | 0 (0.0%) | $0 |
| 3-Person Families | 20 (14.6%) | $0 |
| 4-Person Families | 41 (29.9%) | $0 |
| 5-Person Families | 39 (28.5%) | $0 |
| 6-Person Families | 19 (13.9%) | $0 |
| 7+ Person Families | 18 (13.1%) | $0 |
| Total | 137 (100.0%) | $39,875 |
Family Income by Number of Earners in Green Acres
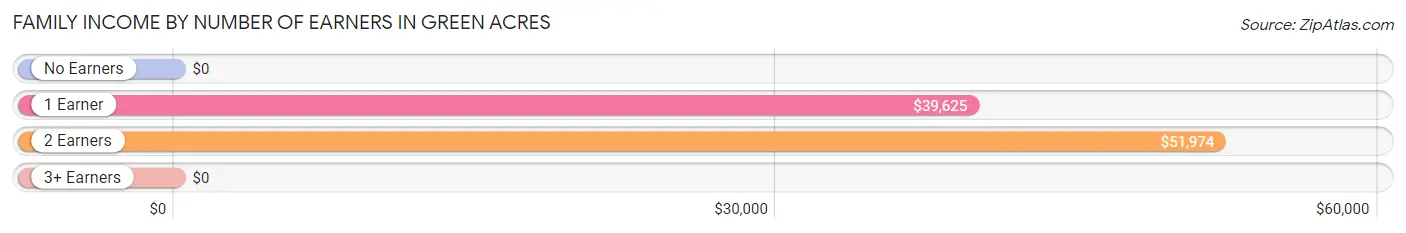
| Number of Earners | # Families | Median Income |
| No Earners | 28 (20.4%) | $0 |
| 1 Earner | 39 (28.5%) | $39,625 |
| 2 Earners | 70 (51.1%) | $51,974 |
| 3+ Earners | 0 (0.0%) | $0 |
| Total | 137 (100.0%) | $39,875 |
Household Income in Green Acres
Household Income Brackets in Green Acres
With 45 households falling in the category, the $50,000 to $74,999 income range is the most frequent in Green Acres, accounting for 30.2% of all households.
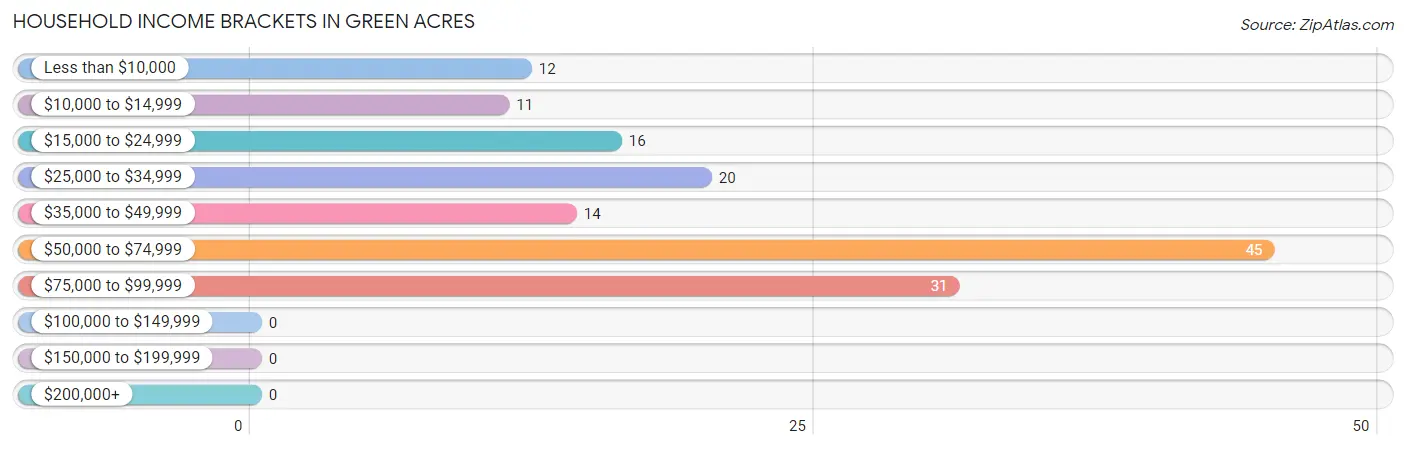
| Income Bracket | # Households | % Households |
| Less than $10,000 | 12 | 8.1% |
| $10,000 to $14,999 | 11 | 7.4% |
| $15,000 to $24,999 | 16 | 10.7% |
| $25,000 to $34,999 | 20 | 13.4% |
| $35,000 to $49,999 | 14 | 9.4% |
| $50,000 to $74,999 | 45 | 30.2% |
| $75,000 to $99,999 | 31 | 20.8% |
| $100,000 to $149,999 | 0 | 0.0% |
| $150,000 to $199,999 | 0 | 0.0% |
| $200,000+ | 0 | 0.0% |
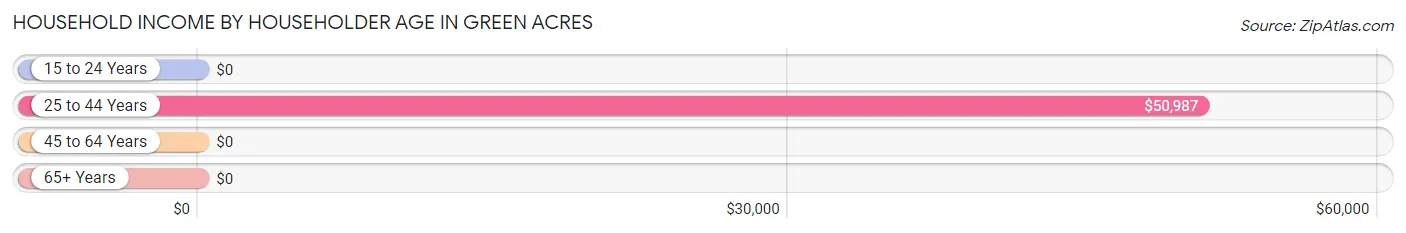
Household Income by Householder Age in Green Acres
The median household income in Green Acres is $50,197, with the highest median household income of $50,987 found in the 25 to 44 years age bracket for the primary householder. A total of 121 households (81.2%) fall into this category.
| Income Bracket | # Households | Median Income |
| 15 to 24 Years | 0 (0.0%) | $0 |
| 25 to 44 Years | 121 (81.2%) | $50,987 |
| 45 to 64 Years | 8 (5.4%) | $0 |
| 65+ Years | 20 (13.4%) | $0 |
| Total | 149 (100.0%) | $50,197 |
Poverty in Green Acres
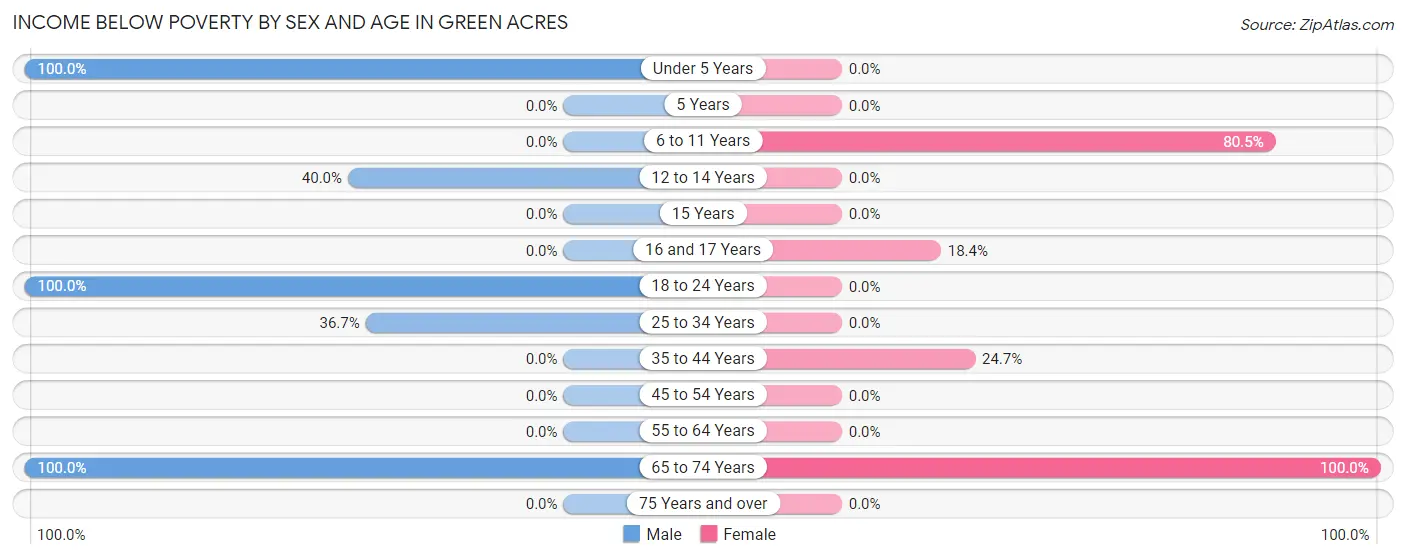
Income Below Poverty by Sex and Age in Green Acres
With 31.8% poverty level for males and 28.7% for females among the residents of Green Acres, under 5 year old males and 65 to 74 year old females are the most vulnerable to poverty, with 14 males (100.0%) and 20 females (100.0%) in their respective age groups living below the poverty level.
| Age Bracket | Male | Female |
| Under 5 Years | 14 (100.0%) | 0 (0.0%) |
| 5 Years | 0 (0.0%) | 0 (0.0%) |
| 6 to 11 Years | 0 (0.0%) | 33 (80.5%) |
| 12 to 14 Years | 10 (40.0%) | 0 (0.0%) |
| 15 Years | 0 (0.0%) | 0 (0.0%) |
| 16 and 17 Years | 0 (0.0%) | 9 (18.4%) |
| 18 to 24 Years | 81 (100.0%) | 0 (0.0%) |
| 25 to 34 Years | 29 (36.7%) | 0 (0.0%) |
| 35 to 44 Years | 0 (0.0%) | 23 (24.7%) |
| 45 to 54 Years | 0 (0.0%) | 0 (0.0%) |
| 55 to 64 Years | 0 (0.0%) | 0 (0.0%) |
| 65 to 74 Years | 15 (100.0%) | 20 (100.0%) |
| 75 Years and over | 0 (0.0%) | 0 (0.0%) |
| Total | 149 (31.8%) | 85 (28.7%) |
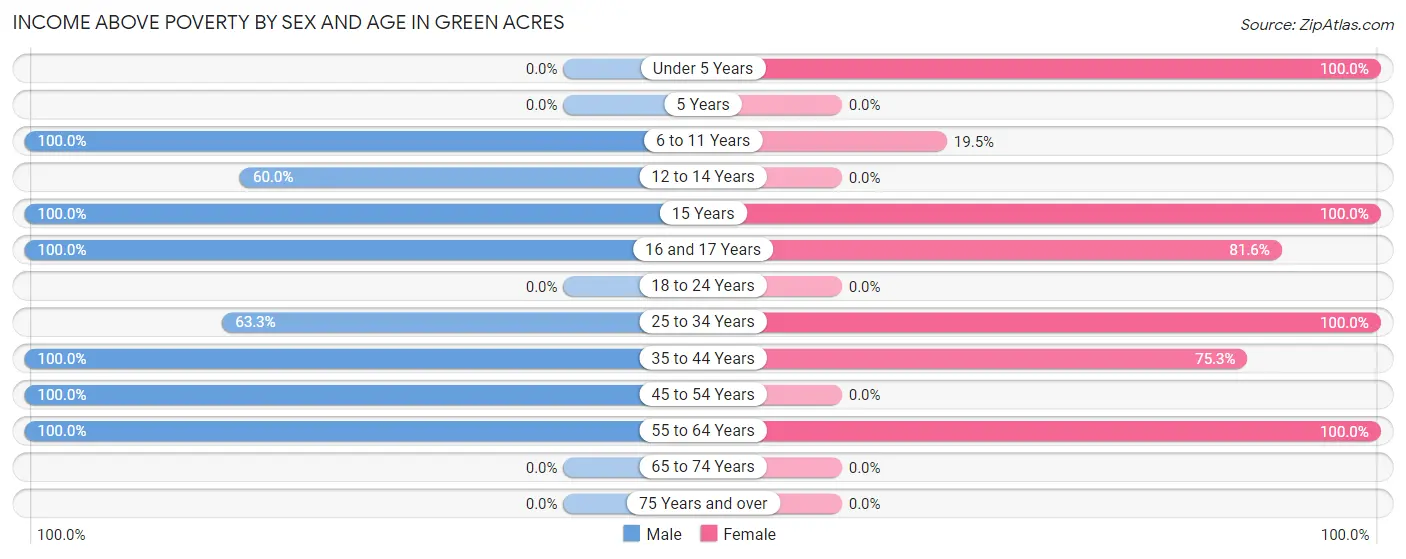
Income Above Poverty by Sex and Age in Green Acres
According to the poverty statistics in Green Acres, males aged 6 to 11 years and females aged under 5 years are the age groups that are most secure financially, with 100.0% of males and 100.0% of females in these age groups living above the poverty line.
| Age Bracket | Male | Female |
| Under 5 Years | 0 (0.0%) | 11 (100.0%) |
| 5 Years | 0 (0.0%) | 0 (0.0%) |
| 6 to 11 Years | 76 (100.0%) | 8 (19.5%) |
| 12 to 14 Years | 15 (60.0%) | 0 (0.0%) |
| 15 Years | 11 (100.0%) | 13 (100.0%) |
| 16 and 17 Years | 79 (100.0%) | 40 (81.6%) |
| 18 to 24 Years | 0 (0.0%) | 0 (0.0%) |
| 25 to 34 Years | 50 (63.3%) | 61 (100.0%) |
| 35 to 44 Years | 24 (100.0%) | 70 (75.3%) |
| 45 to 54 Years | 31 (100.0%) | 0 (0.0%) |
| 55 to 64 Years | 33 (100.0%) | 8 (100.0%) |
| 65 to 74 Years | 0 (0.0%) | 0 (0.0%) |
| 75 Years and over | 0 (0.0%) | 0 (0.0%) |
| Total | 319 (68.2%) | 211 (71.3%) |
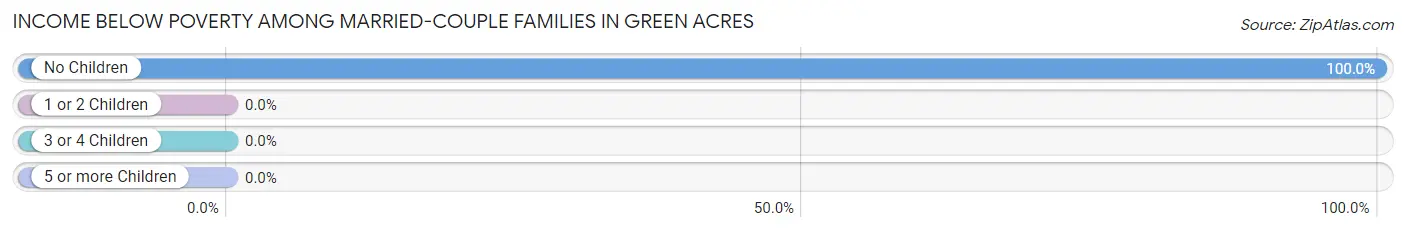
Income Below Poverty Among Married-Couple Families in Green Acres
The poverty statistics for married-couple families in Green Acres show that 34.0% or 16 of the total 47 families live below the poverty line. Families with no children have the highest poverty rate of 100.0%, comprising of 16 families. On the other hand, families with 1 or 2 children have the lowest poverty rate of 0.0%, which includes 0 families.
| Children | Above Poverty | Below Poverty |
| No Children | 0 (0.0%) | 16 (100.0%) |
| 1 or 2 Children | 31 (100.0%) | 0 (0.0%) |
| 3 or 4 Children | 0 (0.0%) | 0 (0.0%) |
| 5 or more Children | 0 (0.0%) | 0 (0.0%) |
| Total | 31 (66.0%) | 16 (34.0%) |
Income Below Poverty Among Single-Parent Households in Green Acres
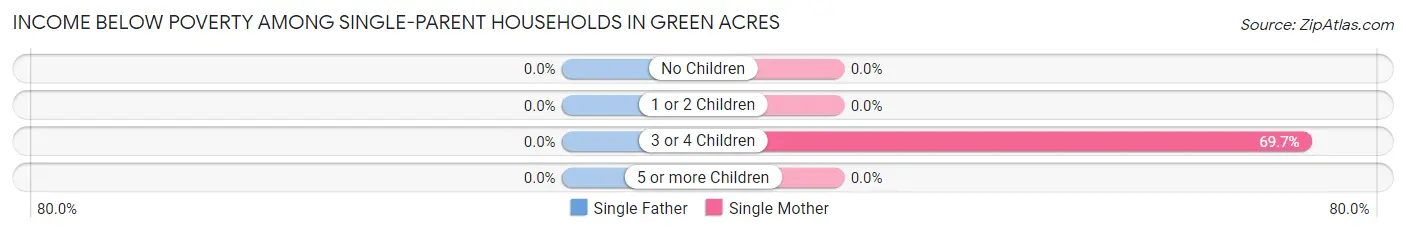
| Children | Single Father | Single Mother |
| No Children | 0 (0.0%) | 0 (0.0%) |
| 1 or 2 Children | 0 (0.0%) | 0 (0.0%) |
| 3 or 4 Children | 0 (0.0%) | 23 (69.7%) |
| 5 or more Children | 0 (0.0%) | 0 (0.0%) |
| Total | 0 (0.0%) | 23 (25.6%) |
Income Below Poverty Among Married-Couple vs Single-Parent Households in Green Acres
The poverty data for Green Acres shows that 16 of the married-couple family households (34.0%) and 23 of the single-parent households (25.6%) are living below the poverty level. Within the married-couple family households, those with no children have the highest poverty rate, with 16 households (100.0%) falling below the poverty line. Among the single-parent households, those with 3 or 4 children have the highest poverty rate, with 23 household (69.7%) living below poverty.
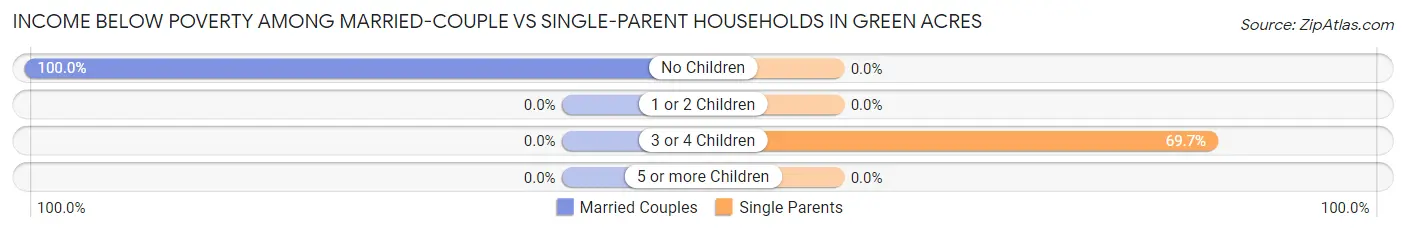
| Children | Married-Couple Families | Single-Parent Households |
| No Children | 16 (100.0%) | 0 (0.0%) |
| 1 or 2 Children | 0 (0.0%) | 0 (0.0%) |
| 3 or 4 Children | 0 (0.0%) | 23 (69.7%) |
| 5 or more Children | 0 (0.0%) | 0 (0.0%) |
| Total | 16 (34.0%) | 23 (25.6%) |
Race in Green Acres
The most populous races in Green Acres are Native / Alaskan (774 | 98.1%), and White / Caucasian (15 | 1.9%).
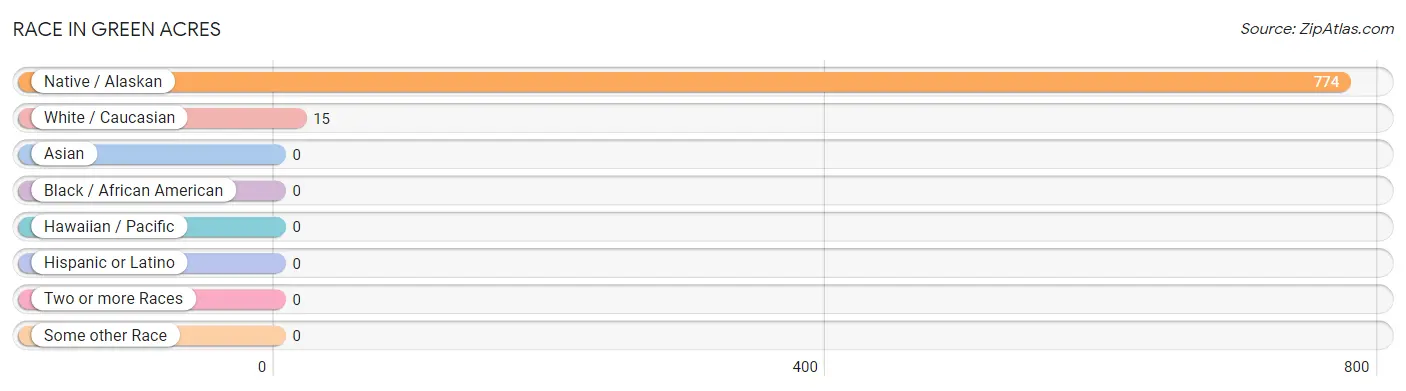
| Race | # Population | % Population |
| Asian | 0 | 0.0% |
| Black / African American | 0 | 0.0% |
| Hawaiian / Pacific | 0 | 0.0% |
| Hispanic or Latino | 0 | 0.0% |
| Native / Alaskan | 774 | 98.1% |
| White / Caucasian | 15 | 1.9% |
| Two or more Races | 0 | 0.0% |
| Some other Race | 0 | 0.0% |
| Total | 789 | 100.0% |
Ancestry in Green Acres
The most populous ancestries reported in Green Acres are Chippewa (762 | 96.6%), Cree (31 | 3.9%), German (15 | 1.9%), Norwegian (15 | 1.9%), and Sioux (12 | 1.5%), together accounting for 105.8% of all Green Acres residents.
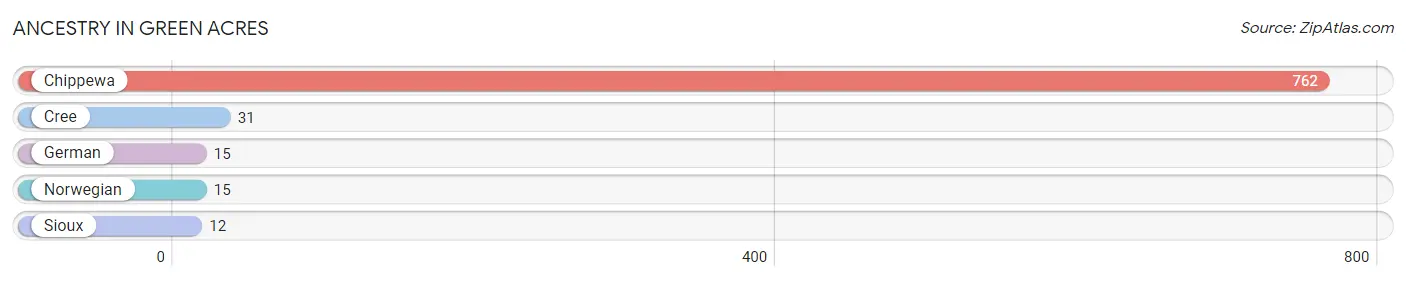
| Ancestry | # Population | % Population |
| Chippewa | 762 | 96.6% |
| Cree | 31 | 3.9% |
| German | 15 | 1.9% |
| Norwegian | 15 | 1.9% |
| Sioux | 12 | 1.5% | View All 5 Rows |
Immigrants in Green Acres

| Immigration Origin | # Population | % Population | View All 0 Rows |
Sex and Age in Green Acres
Sex and Age in Green Acres
The most populous age groups in Green Acres are 15 to 19 Years (100 | 21.4%) for men and 35 to 39 Years (82 | 25.6%) for women.
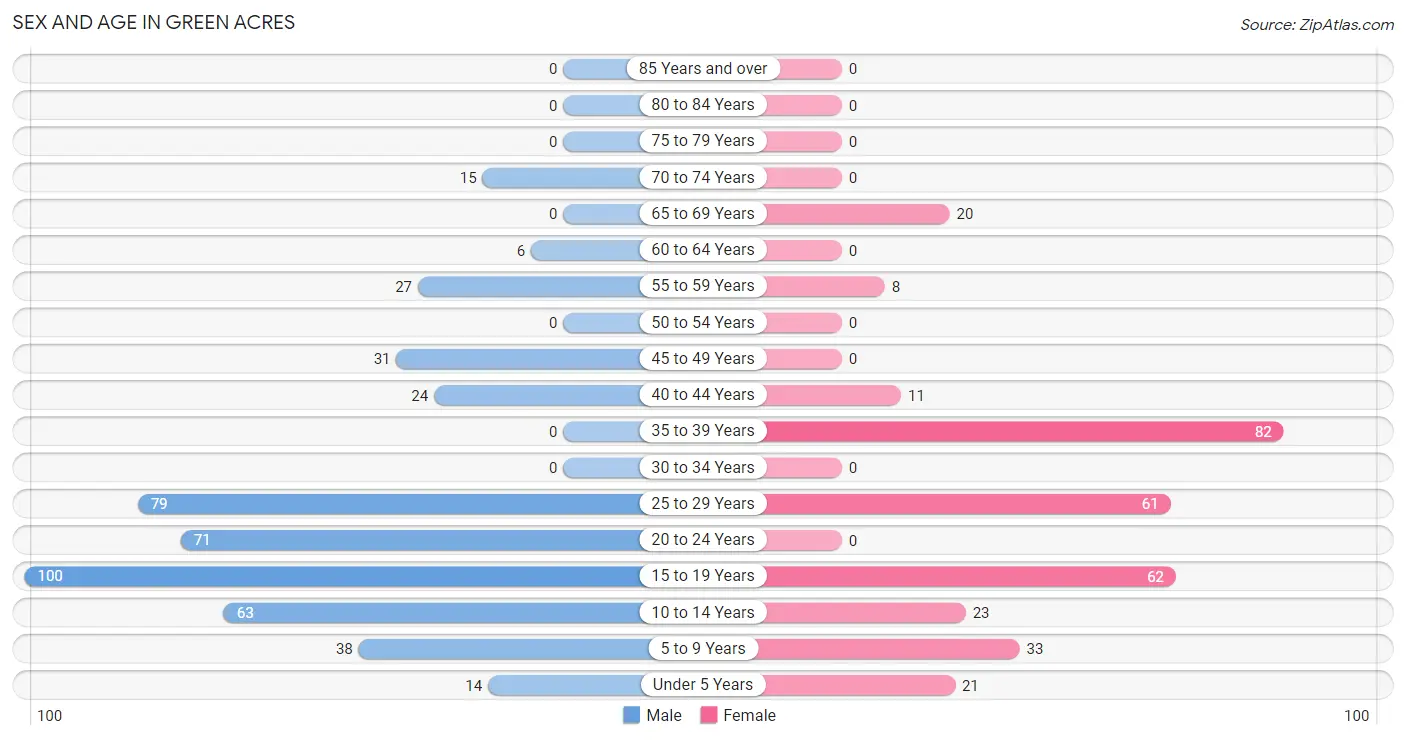
| Age Bracket | Male | Female |
| Under 5 Years | 14 (3.0%) | 21 (6.5%) |
| 5 to 9 Years | 38 (8.1%) | 33 (10.3%) |
| 10 to 14 Years | 63 (13.5%) | 23 (7.2%) |
| 15 to 19 Years | 100 (21.4%) | 62 (19.3%) |
| 20 to 24 Years | 71 (15.2%) | 0 (0.0%) |
| 25 to 29 Years | 79 (16.9%) | 61 (19.0%) |
| 30 to 34 Years | 0 (0.0%) | 0 (0.0%) |
| 35 to 39 Years | 0 (0.0%) | 82 (25.6%) |
| 40 to 44 Years | 24 (5.1%) | 11 (3.4%) |
| 45 to 49 Years | 31 (6.6%) | 0 (0.0%) |
| 50 to 54 Years | 0 (0.0%) | 0 (0.0%) |
| 55 to 59 Years | 27 (5.8%) | 8 (2.5%) |
| 60 to 64 Years | 6 (1.3%) | 0 (0.0%) |
| 65 to 69 Years | 0 (0.0%) | 20 (6.2%) |
| 70 to 74 Years | 15 (3.2%) | 0 (0.0%) |
| 75 to 79 Years | 0 (0.0%) | 0 (0.0%) |
| 80 to 84 Years | 0 (0.0%) | 0 (0.0%) |
| 85 Years and over | 0 (0.0%) | 0 (0.0%) |
| Total | 468 (100.0%) | 321 (100.0%) |
Families and Households in Green Acres
Median Family Size in Green Acres
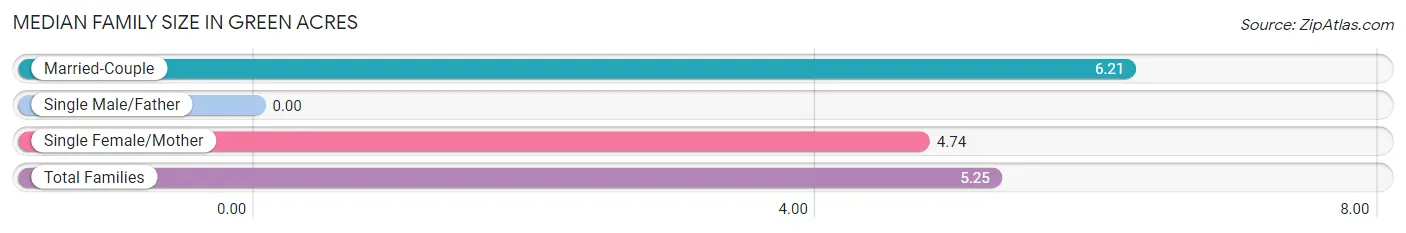
| Family Type | # Families | Family Size |
| Married-Couple | 47 (34.3%) | 6.21 |
| Single Male/Father | 0 (0.0%) | - |
| Single Female/Mother | 90 (65.7%) | 4.74 |
| Total Families | 137 (100.0%) | 5.25 |
Median Household Size in Green Acres
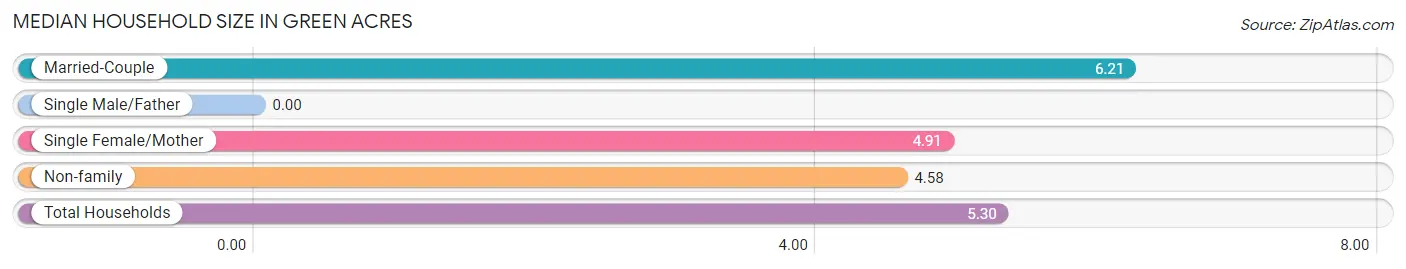
| Household Type | # Households | Household Size |
| Married-Couple | 47 (31.5%) | 6.21 |
| Single Male/Father | 0 (0.0%) | - |
| Single Female/Mother | 90 (60.4%) | 4.91 |
| Non-family | 12 (8.1%) | 4.58 |
| Total Households | 149 (100.0%) | 5.30 |
Household Size by Marriage Status in Green Acres
Out of a total of 149 households in Green Acres, 137 (91.9%) are family households, while 12 (8.1%) are nonfamily households. The most numerous type of family households are 4-person households, comprising 61, and the most common type of nonfamily households are 3-person households, comprising 8.
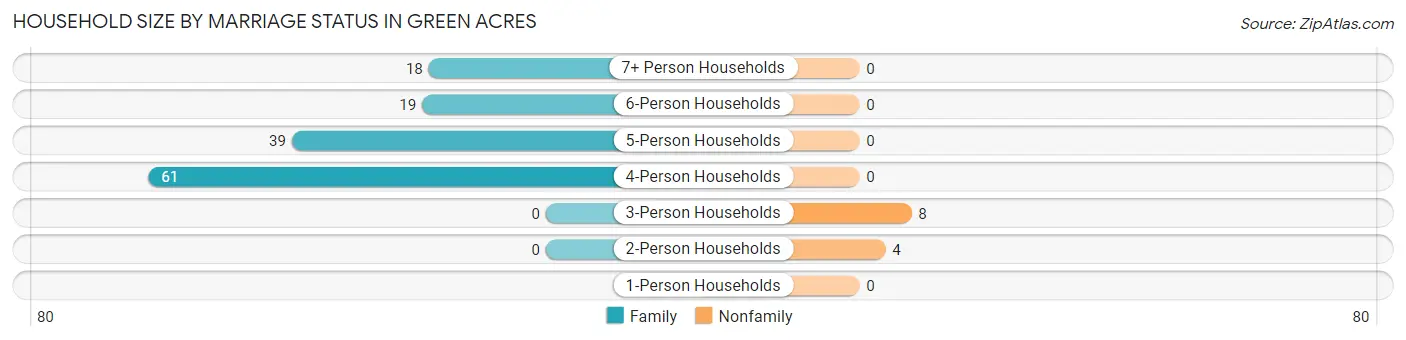
| Household Size | Family Households | Nonfamily Households |
| 1-Person Households | - | 0 (0.0%) |
| 2-Person Households | 0 (0.0%) | 4 (2.7%) |
| 3-Person Households | 0 (0.0%) | 8 (5.4%) |
| 4-Person Households | 61 (40.9%) | 0 (0.0%) |
| 5-Person Households | 39 (26.2%) | 0 (0.0%) |
| 6-Person Households | 19 (12.8%) | 0 (0.0%) |
| 7+ Person Households | 18 (12.1%) | 0 (0.0%) |
| Total | 137 (91.9%) | 12 (8.1%) |
Female Fertility in Green Acres
Fertility by Age in Green Acres
| Age Bracket | Women with Births | Births / 1,000 Women |
| 15 to 19 years | 0 (0.0%) | 0.0 |
| 20 to 34 years | 0 (0.0%) | 0.0 |
| 35 to 50 years | 0 (0.0%) | 0.0 |
| Total | 0 (0.0%) | 0.0 |
Fertility by Age by Marriage Status in Green Acres
| Age Bracket | Married | Unmarried |
| 15 to 19 years | 0 (0.0%) | 0 (0.0%) |
| 20 to 34 years | 0 (0.0%) | 0 (0.0%) |
| 35 to 50 years | 0 (0.0%) | 0 (0.0%) |
| Total | 0 (0.0%) | 0 (0.0%) |
Fertility by Education in Green Acres
| Educational Attainment | Women with Births | Births / 1,000 Women |
| Less than High School | 0 (0.0%) | 0.0 |
| High School Diploma | 0 (0.0%) | 0.0 |
| College or Associate's Degree | 0 (0.0%) | 0.0 |
| Bachelor's Degree | 0 (0.0%) | 0.0 |
| Graduate Degree | 0 (0.0%) | 0.0 |
| Total | 0 (0.0%) | 0.0 |
Fertility by Education by Marriage Status in Green Acres
| Educational Attainment | Married | Unmarried |
| Less than High School | 0 (0.0%) | 0 (0.0%) |
| High School Diploma | 0 (0.0%) | 0 (0.0%) |
| College or Associate's Degree | 0 (0.0%) | 0 (0.0%) |
| Bachelor's Degree | 0 (0.0%) | 0 (0.0%) |
| Graduate Degree | 0 (0.0%) | 0 (0.0%) |
| Total | 0 (0.0%) | 0 (0.0%) |
Employment Characteristics in Green Acres
Employment by Class of Employer in Green Acres
Among the 158 employed individuals in Green Acres, private company employees (61 | 38.6%), local government employees (51 | 32.3%), and not-for-profit organizations (46 | 29.1%) make up the most common classes of employment.
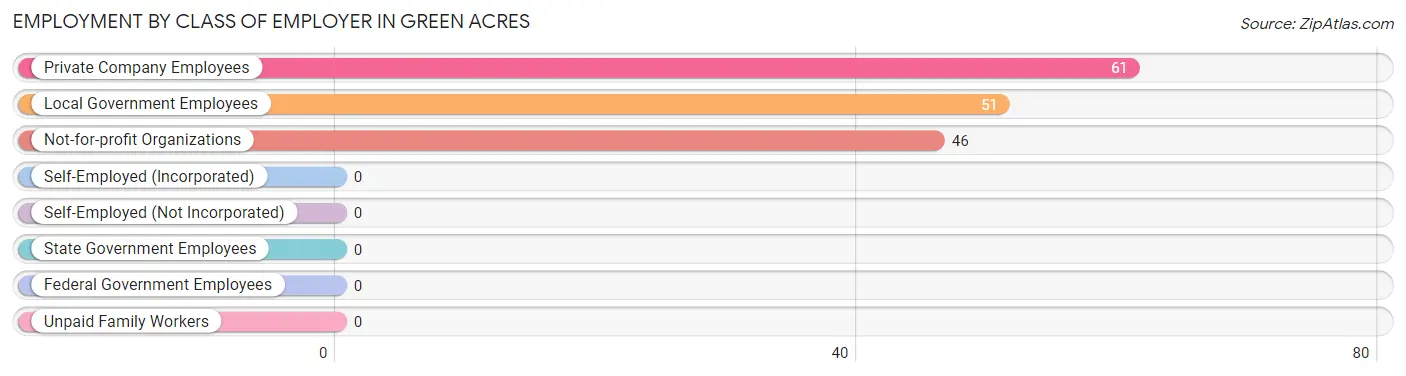
| Employer Class | # Employees | % Employees |
| Private Company Employees | 61 | 38.6% |
| Self-Employed (Incorporated) | 0 | 0.0% |
| Self-Employed (Not Incorporated) | 0 | 0.0% |
| Not-for-profit Organizations | 46 | 29.1% |
| Local Government Employees | 51 | 32.3% |
| State Government Employees | 0 | 0.0% |
| Federal Government Employees | 0 | 0.0% |
| Unpaid Family Workers | 0 | 0.0% |
| Total | 158 | 100.0% |
Employment Status by Age in Green Acres
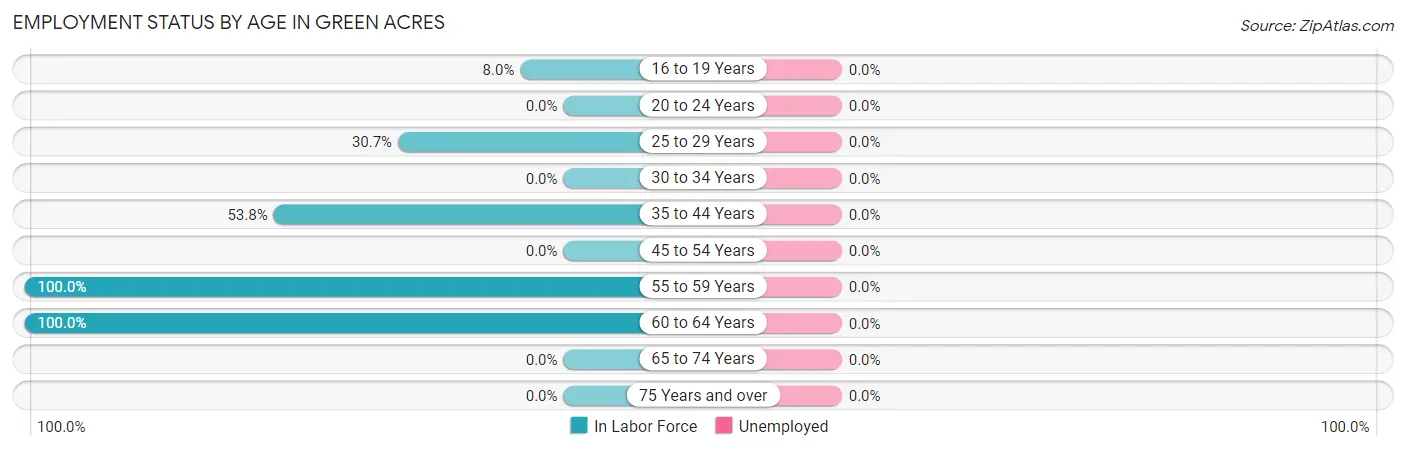
| Age Bracket | In Labor Force | Unemployed |
| 16 to 19 Years | 11 (8.0%) | 0 (0.0%) |
| 20 to 24 Years | 0 (0.0%) | 0 (0.0%) |
| 25 to 29 Years | 43 (30.7%) | 0 (0.0%) |
| 30 to 34 Years | 0 (0.0%) | 0 (0.0%) |
| 35 to 44 Years | 63 (53.8%) | 0 (0.0%) |
| 45 to 54 Years | 0 (0.0%) | 0 (0.0%) |
| 55 to 59 Years | 35 (100.0%) | 0 (0.0%) |
| 60 to 64 Years | 6 (100.0%) | 0 (0.0%) |
| 65 to 74 Years | 0 (0.0%) | 0 (0.0%) |
| 75 Years and over | 0 (0.0%) | 0 (0.0%) |
| Total | 158 (27.6%) | 0 (0.0%) |
Employment Status by Educational Attainment in Green Acres
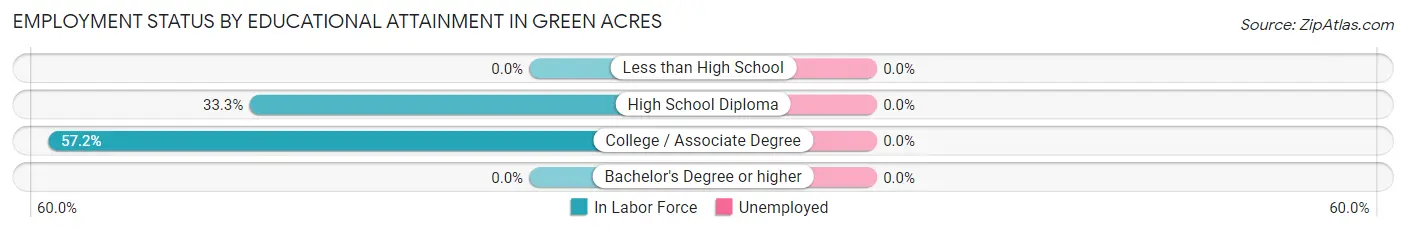
| Educational Attainment | In Labor Force | Unemployed |
| Less than High School | 0 (0.0%) | 0 (0.0%) |
| High School Diploma | 28 (33.3%) | 0 (0.0%) |
| College / Associate Degree | 119 (57.2%) | 0 (0.0%) |
| Bachelor's Degree or higher | 0 (0.0%) | 0 (0.0%) |
| Total | 147 (44.7%) | 0 (0.0%) |
Employment Occupations by Sex in Green Acres
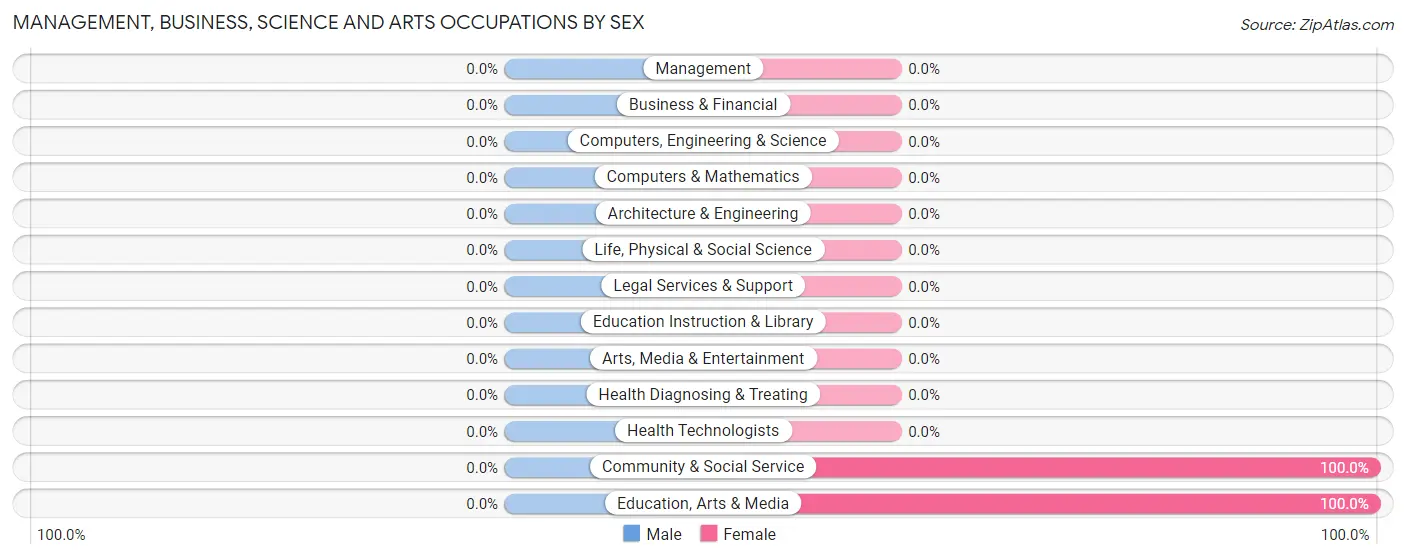
Management, Business, Science and Arts Occupations
The most common Management, Business, Science and Arts occupations in Green Acres are Community & Social Service (10 | 6.3%), and Education, Arts & Media (10 | 6.3%).
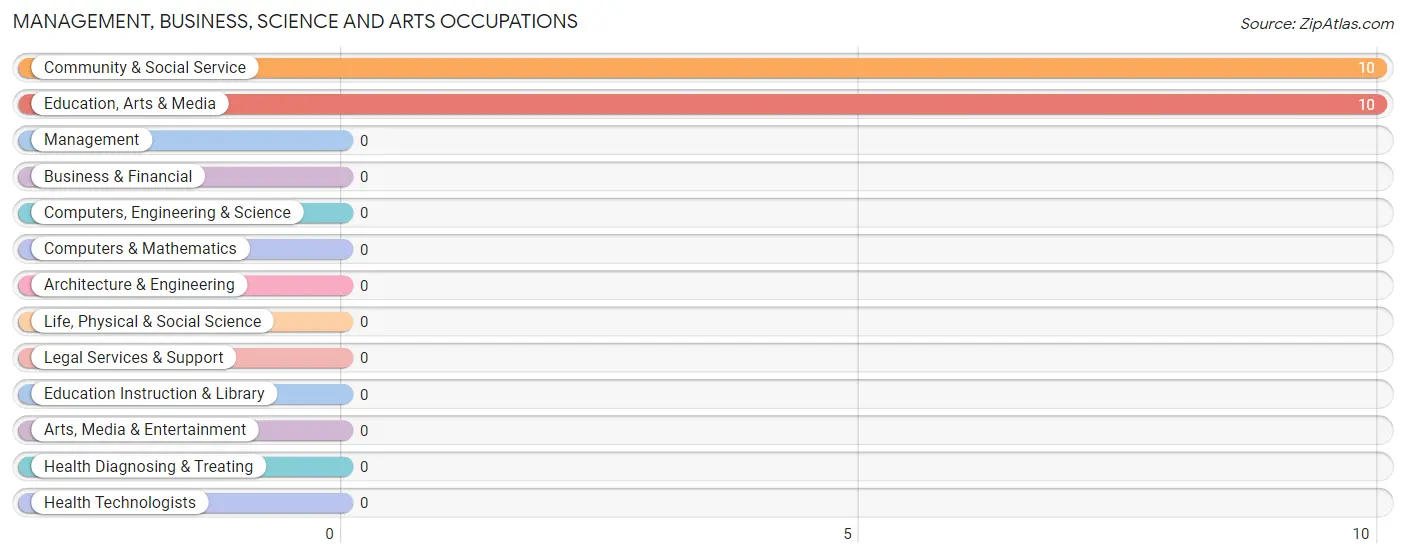
Management, Business, Science and Arts Occupations by Sex
| Occupation | Male | Female |
| Management | 0 (0.0%) | 0 (0.0%) |
| Business & Financial | 0 (0.0%) | 0 (0.0%) |
| Computers, Engineering & Science | 0 (0.0%) | 0 (0.0%) |
| Computers & Mathematics | 0 (0.0%) | 0 (0.0%) |
| Architecture & Engineering | 0 (0.0%) | 0 (0.0%) |
| Life, Physical & Social Science | 0 (0.0%) | 0 (0.0%) |
| Community & Social Service | 0 (0.0%) | 10 (100.0%) |
| Education, Arts & Media | 0 (0.0%) | 10 (100.0%) |
| Legal Services & Support | 0 (0.0%) | 0 (0.0%) |
| Education Instruction & Library | 0 (0.0%) | 0 (0.0%) |
| Arts, Media & Entertainment | 0 (0.0%) | 0 (0.0%) |
| Health Diagnosing & Treating | 0 (0.0%) | 0 (0.0%) |
| Health Technologists | 0 (0.0%) | 0 (0.0%) |
| Total (Category) | 0 (0.0%) | 10 (100.0%) |
| Total (Overall) | 68 (43.0%) | 90 (57.0%) |
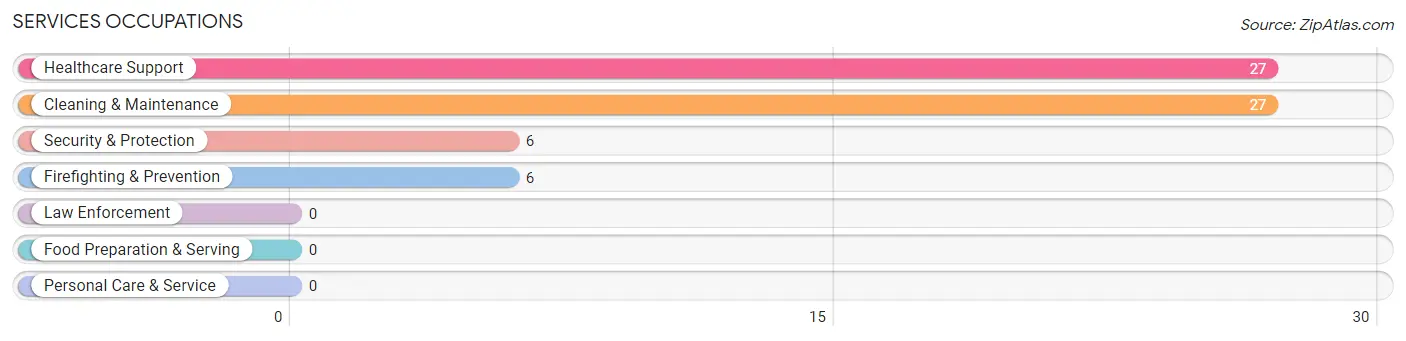
Services Occupations
The most common Services occupations in Green Acres are Healthcare Support (27 | 17.1%), Cleaning & Maintenance (27 | 17.1%), Security & Protection (6 | 3.8%), and Firefighting & Prevention (6 | 3.8%).
Services Occupations by Sex
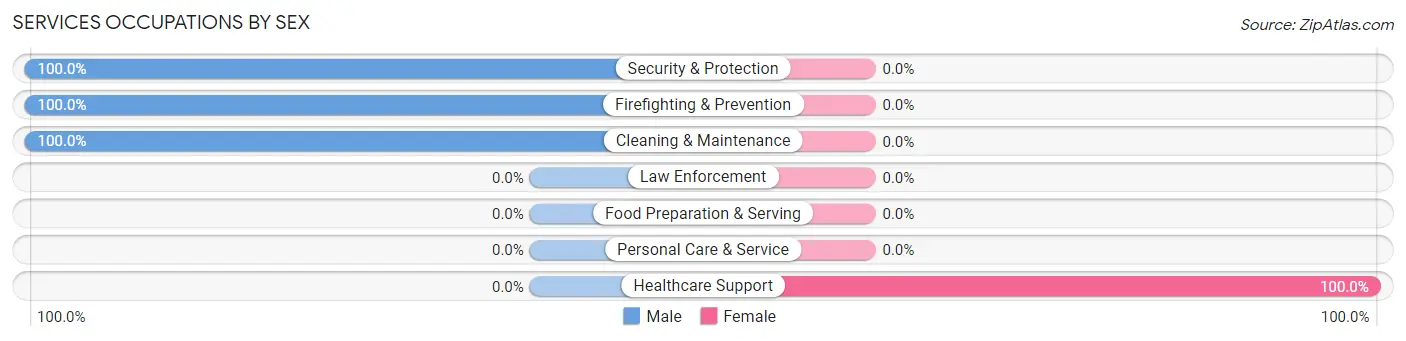
| Occupation | Male | Female |
| Healthcare Support | 0 (0.0%) | 27 (100.0%) |
| Security & Protection | 6 (100.0%) | 0 (0.0%) |
| Firefighting & Prevention | 6 (100.0%) | 0 (0.0%) |
| Law Enforcement | 0 (0.0%) | 0 (0.0%) |
| Food Preparation & Serving | 0 (0.0%) | 0 (0.0%) |
| Cleaning & Maintenance | 27 (100.0%) | 0 (0.0%) |
| Personal Care & Service | 0 (0.0%) | 0 (0.0%) |
| Total (Category) | 33 (55.0%) | 27 (45.0%) |
| Total (Overall) | 68 (43.0%) | 90 (57.0%) |
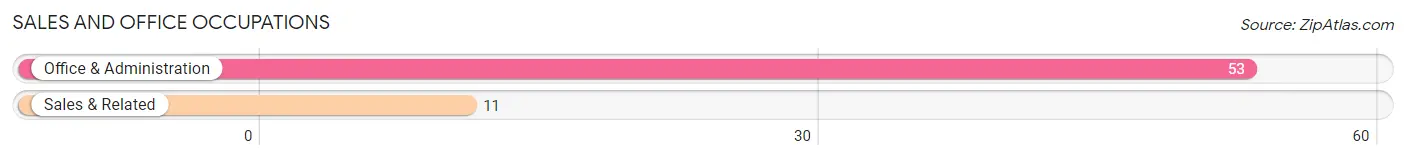
Sales and Office Occupations
The most common Sales and Office occupations in Green Acres are Office & Administration (53 | 33.5%), and Sales & Related (11 | 7.0%).
Sales and Office Occupations by Sex
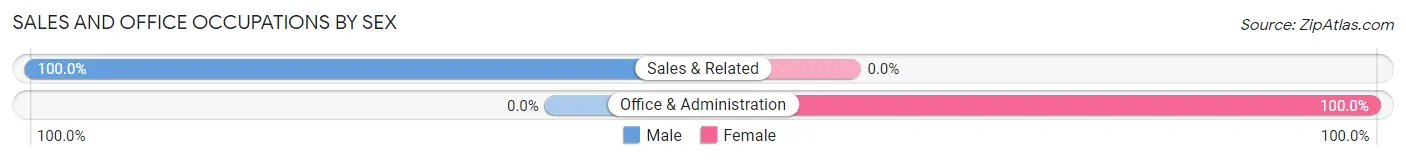
| Occupation | Male | Female |
| Sales & Related | 11 (100.0%) | 0 (0.0%) |
| Office & Administration | 0 (0.0%) | 53 (100.0%) |
| Total (Category) | 11 (17.2%) | 53 (82.8%) |
| Total (Overall) | 68 (43.0%) | 90 (57.0%) |
Natural Resources, Construction and Maintenance Occupations
The most common Natural Resources, Construction and Maintenance occupations in Green Acres are , and Construction & Extraction (24 | 15.2%).
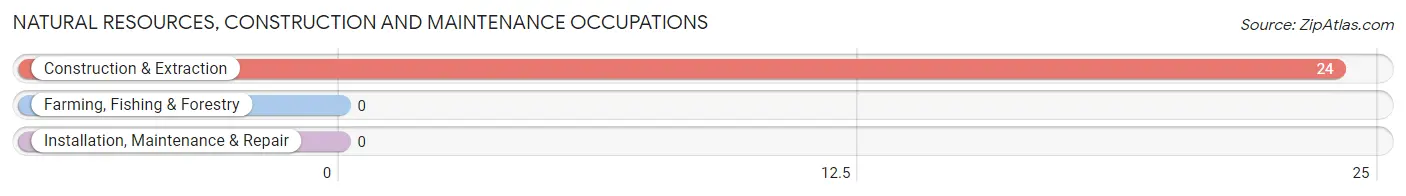
Natural Resources, Construction and Maintenance Occupations by Sex
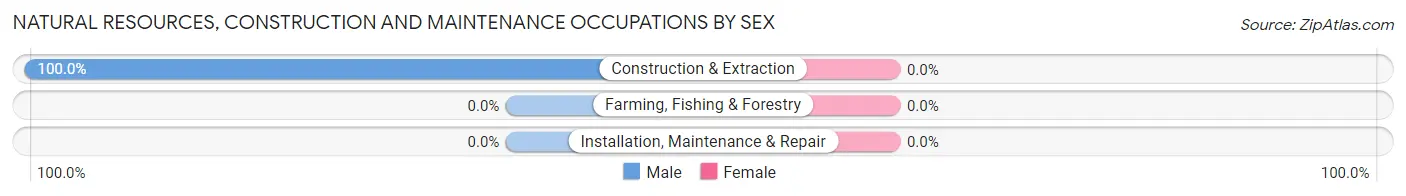
| Occupation | Male | Female |
| Farming, Fishing & Forestry | 0 (0.0%) | 0 (0.0%) |
| Construction & Extraction | 24 (100.0%) | 0 (0.0%) |
| Installation, Maintenance & Repair | 0 (0.0%) | 0 (0.0%) |
| Total (Category) | 24 (100.0%) | 0 (0.0%) |
| Total (Overall) | 68 (43.0%) | 90 (57.0%) |
Production, Transportation and Moving Occupations
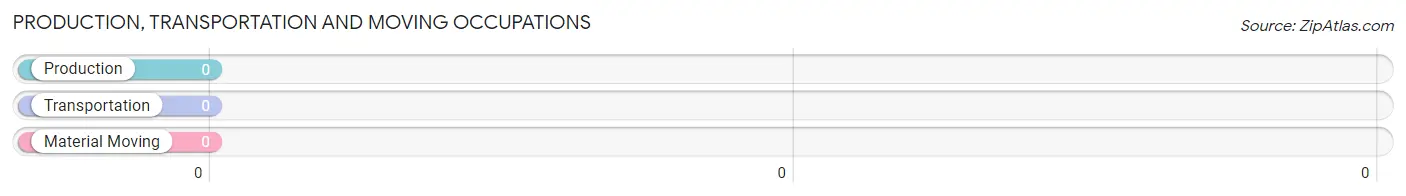
Production, Transportation and Moving Occupations by Sex
| Occupation | Male | Female |
| Production | 0 (0.0%) | 0 (0.0%) |
| Transportation | 0 (0.0%) | 0 (0.0%) |
| Material Moving | 0 (0.0%) | 0 (0.0%) |
| Total (Category) | 0 (0.0%) | 0 (0.0%) |
| Total (Overall) | 68 (43.0%) | 90 (57.0%) |
Employment Industries by Sex in Green Acres
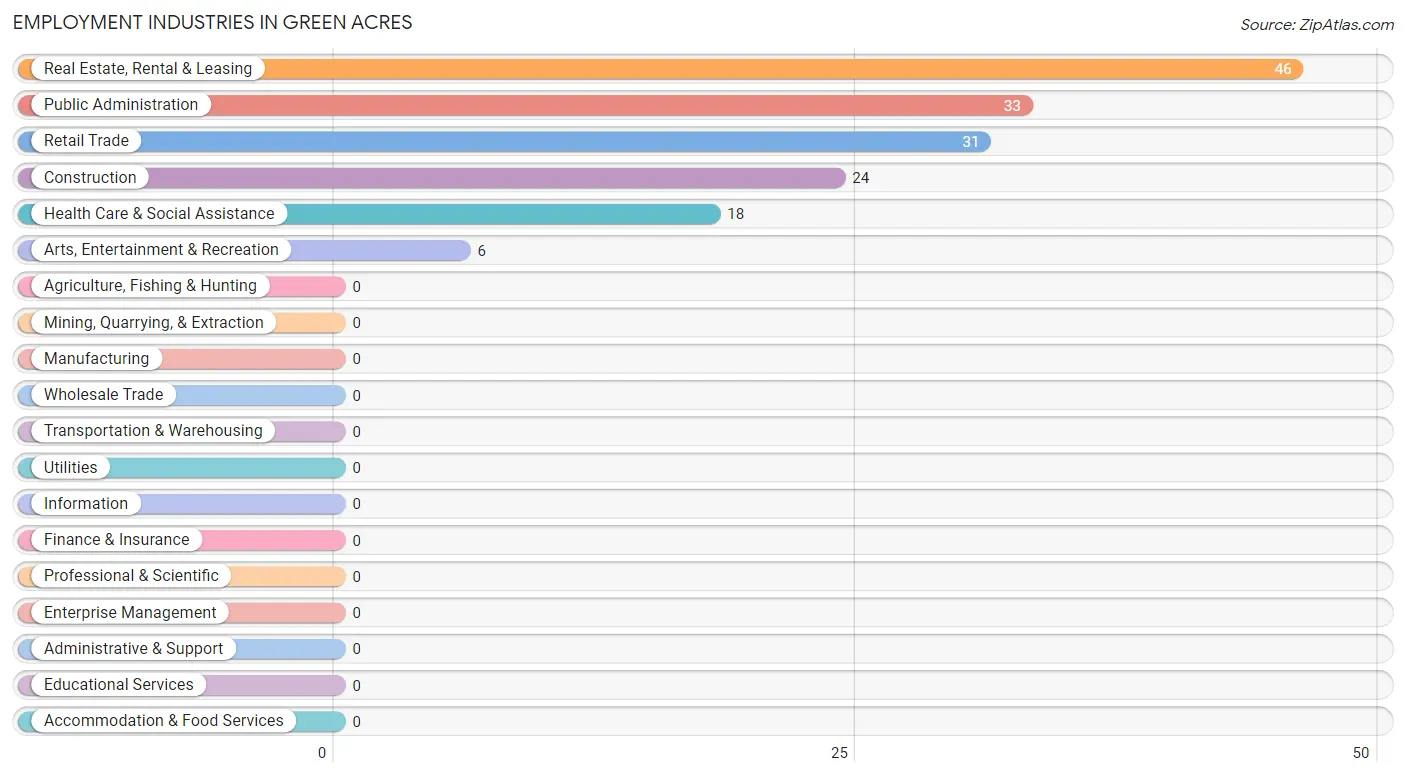
Employment Industries in Green Acres
The major employment industries in Green Acres include Real Estate, Rental & Leasing (46 | 29.1%), Public Administration (33 | 20.9%), Retail Trade (31 | 19.6%), Construction (24 | 15.2%), and Health Care & Social Assistance (18 | 11.4%).
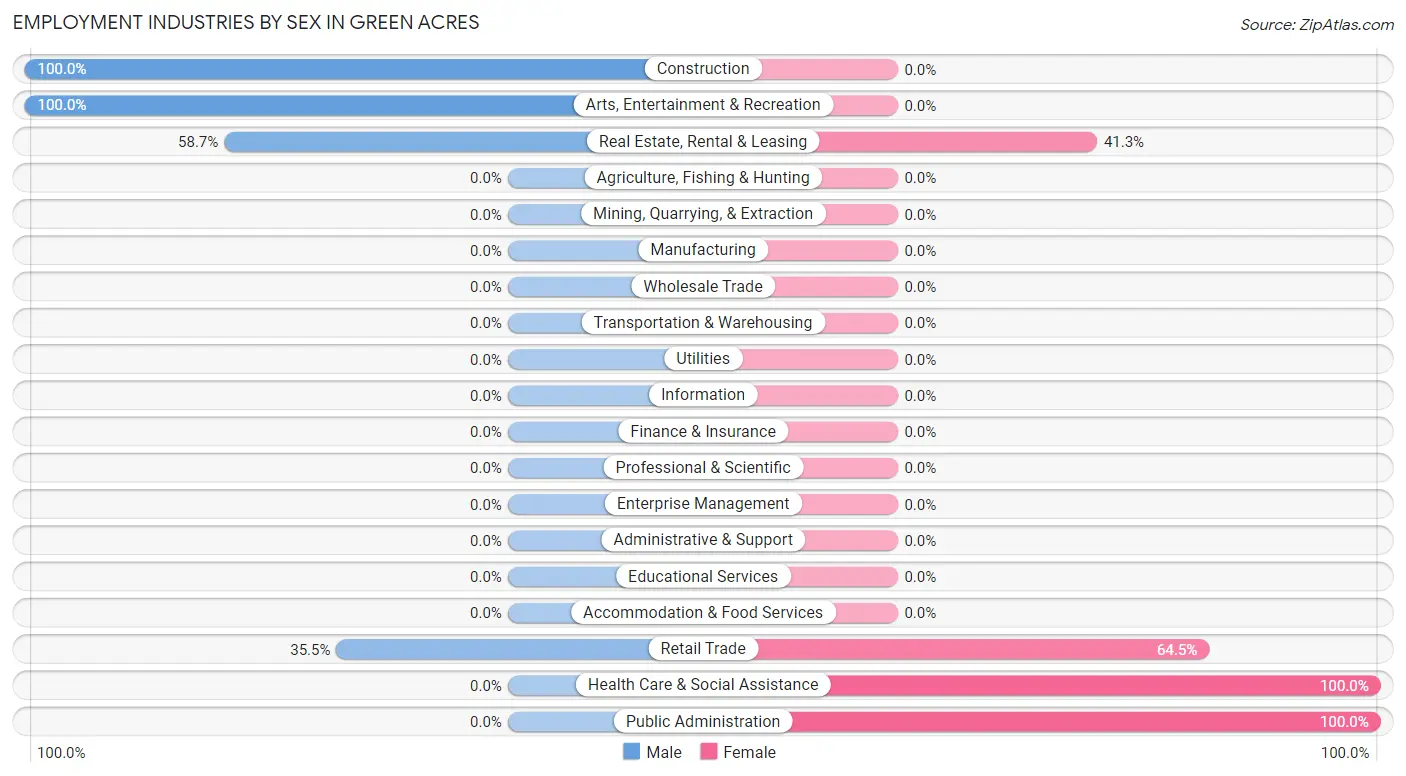
Employment Industries by Sex in Green Acres
The Green Acres industries that see more men than women are Construction (100.0%), Arts, Entertainment & Recreation (100.0%), and Real Estate, Rental & Leasing (58.7%), whereas the industries that tend to have a higher number of women are Health Care & Social Assistance (100.0%), Public Administration (100.0%), and Retail Trade (64.5%).
| Industry | Male | Female |
| Agriculture, Fishing & Hunting | 0 (0.0%) | 0 (0.0%) |
| Mining, Quarrying, & Extraction | 0 (0.0%) | 0 (0.0%) |
| Construction | 24 (100.0%) | 0 (0.0%) |
| Manufacturing | 0 (0.0%) | 0 (0.0%) |
| Wholesale Trade | 0 (0.0%) | 0 (0.0%) |
| Retail Trade | 11 (35.5%) | 20 (64.5%) |
| Transportation & Warehousing | 0 (0.0%) | 0 (0.0%) |
| Utilities | 0 (0.0%) | 0 (0.0%) |
| Information | 0 (0.0%) | 0 (0.0%) |
| Finance & Insurance | 0 (0.0%) | 0 (0.0%) |
| Real Estate, Rental & Leasing | 27 (58.7%) | 19 (41.3%) |
| Professional & Scientific | 0 (0.0%) | 0 (0.0%) |
| Enterprise Management | 0 (0.0%) | 0 (0.0%) |
| Administrative & Support | 0 (0.0%) | 0 (0.0%) |
| Educational Services | 0 (0.0%) | 0 (0.0%) |
| Health Care & Social Assistance | 0 (0.0%) | 18 (100.0%) |
| Arts, Entertainment & Recreation | 6 (100.0%) | 0 (0.0%) |
| Accommodation & Food Services | 0 (0.0%) | 0 (0.0%) |
| Public Administration | 0 (0.0%) | 33 (100.0%) |
| Total | 68 (43.0%) | 90 (57.0%) |
Education in Green Acres
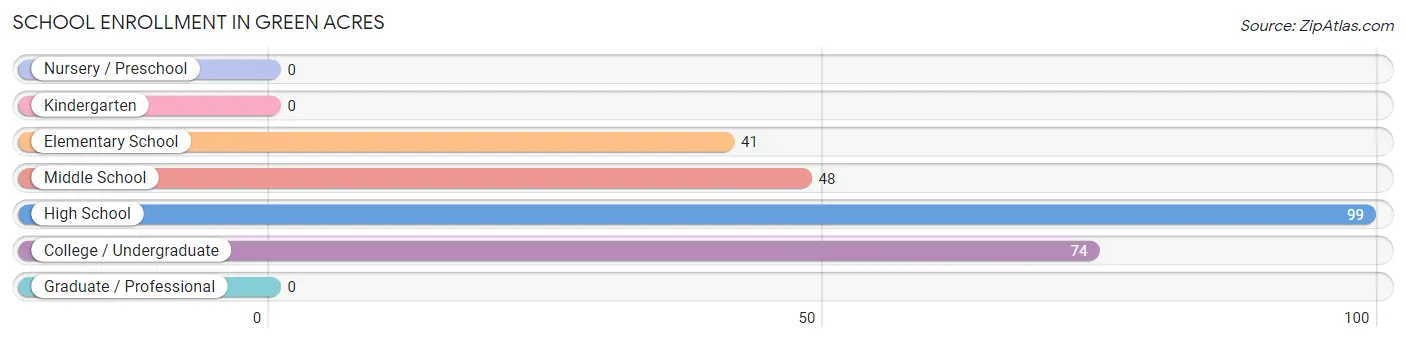
School Enrollment in Green Acres
The most common levels of schooling among the 262 students in Green Acres are high school (99 | 37.8%), college / undergraduate (74 | 28.2%), and middle school (48 | 18.3%).
| School Level | # Students | % Students |
| Nursery / Preschool | 0 | 0.0% |
| Kindergarten | 0 | 0.0% |
| Elementary School | 41 | 15.7% |
| Middle School | 48 | 18.3% |
| High School | 99 | 37.8% |
| College / Undergraduate | 74 | 28.2% |
| Graduate / Professional | 0 | 0.0% |
| Total | 262 | 100.0% |
School Enrollment by Age by Funding Source in Green Acres
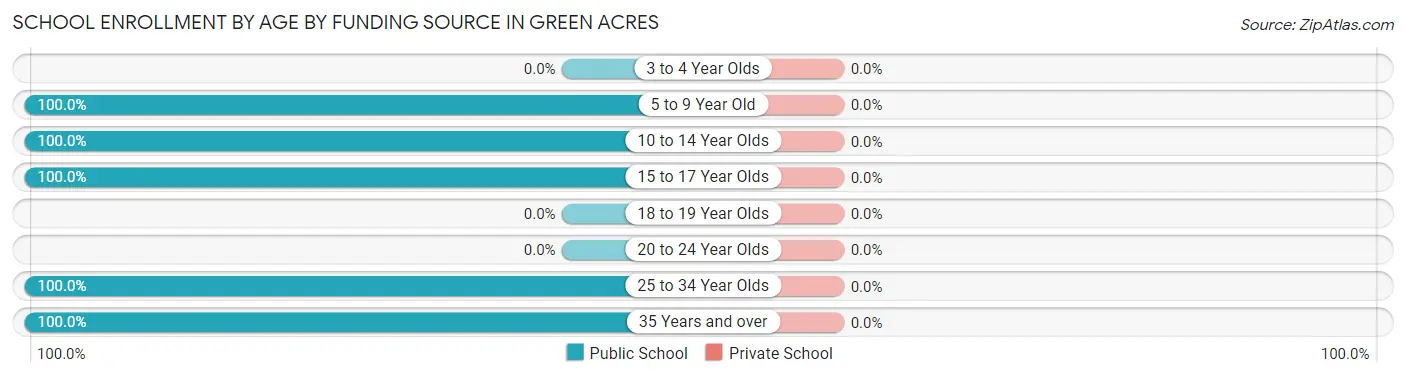
| Age Bracket | Public School | Private School |
| 3 to 4 Year Olds | 0 (0.0%) | 0 (0.0%) |
| 5 to 9 Year Old | 33 (100.0%) | 0 (0.0%) |
| 10 to 14 Year Olds | 71 (100.0%) | 0 (0.0%) |
| 15 to 17 Year Olds | 84 (100.0%) | 0 (0.0%) |
| 18 to 19 Year Olds | 0 (0.0%) | 0 (0.0%) |
| 20 to 24 Year Olds | 0 (0.0%) | 0 (0.0%) |
| 25 to 34 Year Olds | 43 (100.0%) | 0 (0.0%) |
| 35 Years and over | 31 (100.0%) | 0 (0.0%) |
| Total | 262 (100.0%) | 0 (0.0%) |
Educational Attainment by Field of Study in Green Acres
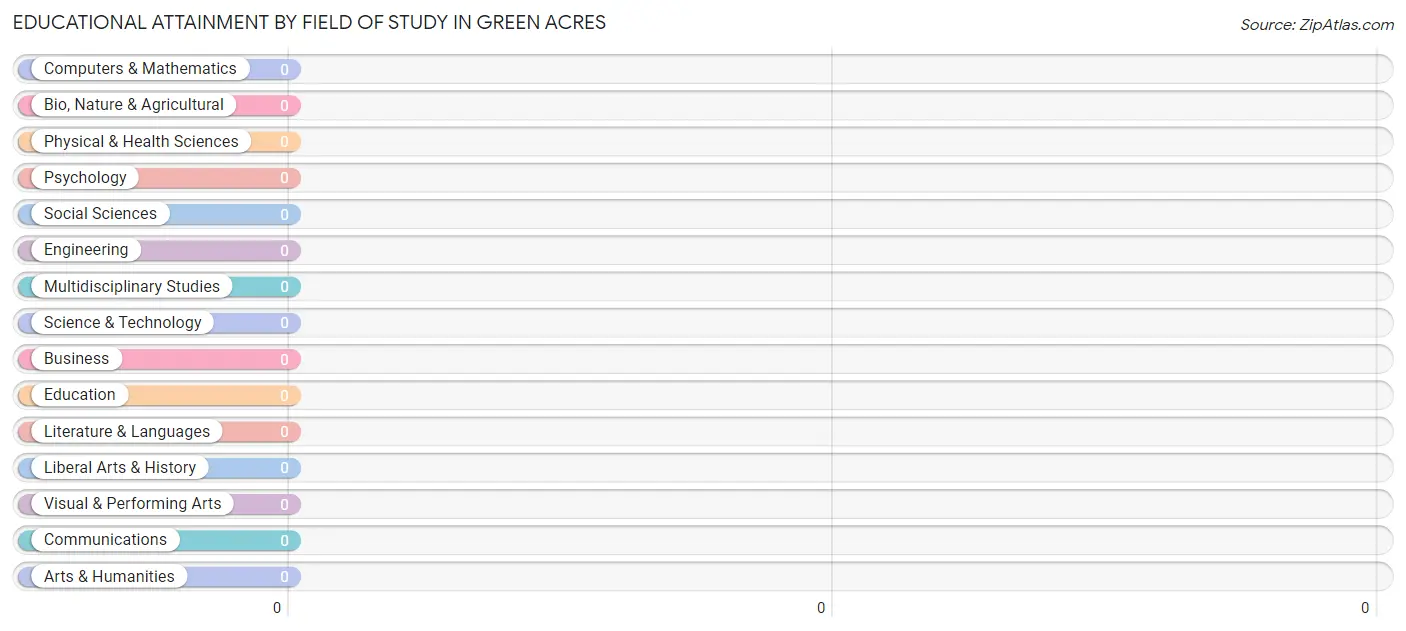
| Field of Study | # Graduates | % Graduates |
| Computers & Mathematics | 0 | 0.0% |
| Bio, Nature & Agricultural | 0 | 0.0% |
| Physical & Health Sciences | 0 | 0.0% |
| Psychology | 0 | 0.0% |
| Social Sciences | 0 | 0.0% |
| Engineering | 0 | 0.0% |
| Multidisciplinary Studies | 0 | 0.0% |
| Science & Technology | 0 | 0.0% |
| Business | 0 | 0.0% |
| Education | 0 | 0.0% |
| Literature & Languages | 0 | 0.0% |
| Liberal Arts & History | 0 | 0.0% |
| Visual & Performing Arts | 0 | 0.0% |
| Communications | 0 | 0.0% |
| Arts & Humanities | 0 | 0.0% |
| Total | 0 | 0.0% |
Transportation & Commute in Green Acres
Vehicle Availability by Sex in Green Acres
The most prevalent vehicle ownership categories in Green Acres are males with 2 vehicles (38, accounting for 55.9%) and females with 2 vehicles (19, making up 42.2%).
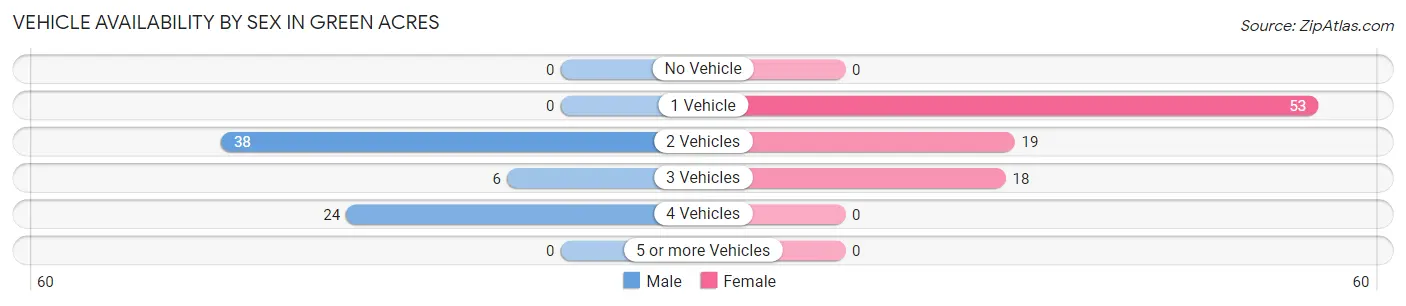
| Vehicles Available | Male | Female |
| No Vehicle | 0 (0.0%) | 0 (0.0%) |
| 1 Vehicle | 0 (0.0%) | 53 (58.9%) |
| 2 Vehicles | 38 (55.9%) | 19 (21.1%) |
| 3 Vehicles | 6 (8.8%) | 18 (20.0%) |
| 4 Vehicles | 24 (35.3%) | 0 (0.0%) |
| 5 or more Vehicles | 0 (0.0%) | 0 (0.0%) |
| Total | 68 (100.0%) | 90 (100.0%) |
Commute Time in Green Acres
The most frequently occuring commute durations in Green Acres are 10 to 14 minutes (95 commuters, 60.1%), 5 to 9 minutes (47 commuters, 29.7%), and 45 to 59 minutes (10 commuters, 6.3%).
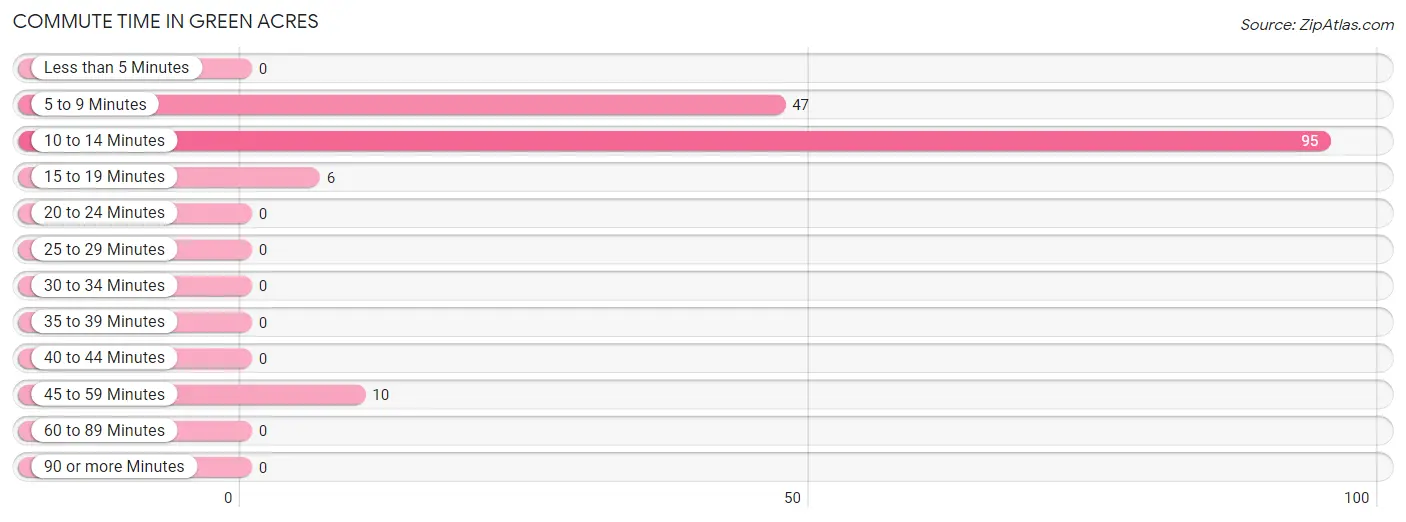
| Commute Time | # Commuters | % Commuters |
| Less than 5 Minutes | 0 | 0.0% |
| 5 to 9 Minutes | 47 | 29.7% |
| 10 to 14 Minutes | 95 | 60.1% |
| 15 to 19 Minutes | 6 | 3.8% |
| 20 to 24 Minutes | 0 | 0.0% |
| 25 to 29 Minutes | 0 | 0.0% |
| 30 to 34 Minutes | 0 | 0.0% |
| 35 to 39 Minutes | 0 | 0.0% |
| 40 to 44 Minutes | 0 | 0.0% |
| 45 to 59 Minutes | 10 | 6.3% |
| 60 to 89 Minutes | 0 | 0.0% |
| 90 or more Minutes | 0 | 0.0% |
Commute Time by Sex in Green Acres
The most common commute times in Green Acres are 10 to 14 minutes (35 commuters, 51.5%) for males and 10 to 14 minutes (60 commuters, 66.7%) for females.
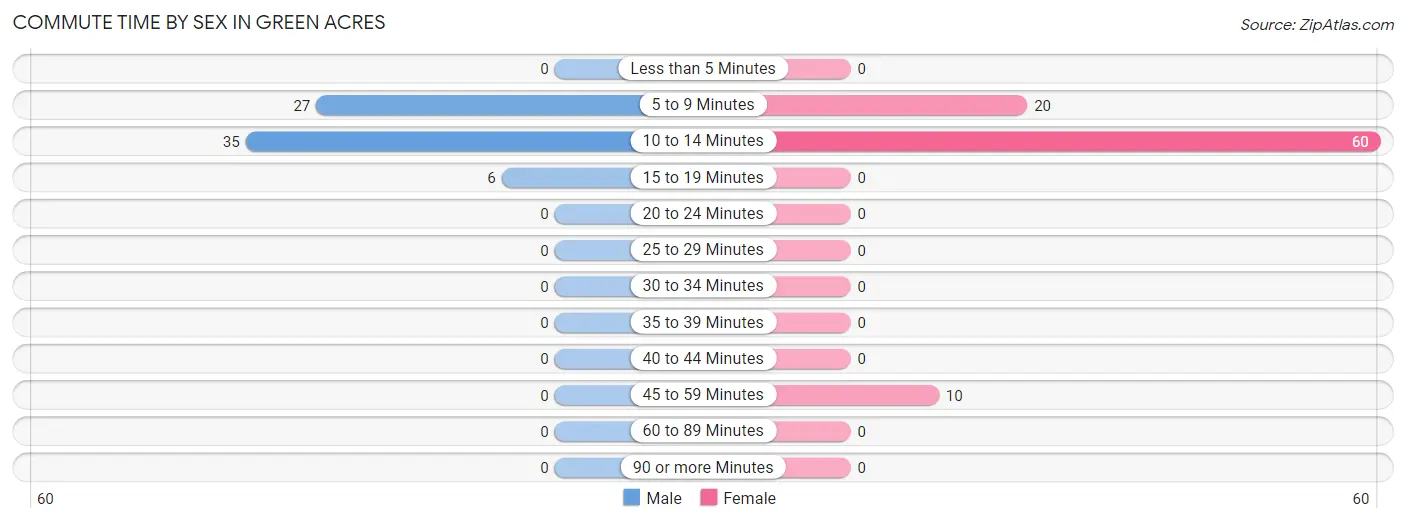
| Commute Time | Male | Female |
| Less than 5 Minutes | 0 (0.0%) | 0 (0.0%) |
| 5 to 9 Minutes | 27 (39.7%) | 20 (22.2%) |
| 10 to 14 Minutes | 35 (51.5%) | 60 (66.7%) |
| 15 to 19 Minutes | 6 (8.8%) | 0 (0.0%) |
| 20 to 24 Minutes | 0 (0.0%) | 0 (0.0%) |
| 25 to 29 Minutes | 0 (0.0%) | 0 (0.0%) |
| 30 to 34 Minutes | 0 (0.0%) | 0 (0.0%) |
| 35 to 39 Minutes | 0 (0.0%) | 0 (0.0%) |
| 40 to 44 Minutes | 0 (0.0%) | 0 (0.0%) |
| 45 to 59 Minutes | 0 (0.0%) | 10 (11.1%) |
| 60 to 89 Minutes | 0 (0.0%) | 0 (0.0%) |
| 90 or more Minutes | 0 (0.0%) | 0 (0.0%) |
Time of Departure to Work by Sex in Green Acres
The most frequent times of departure to work in Green Acres are 7:30 AM to 7:59 AM (33, 48.5%) for males and 6:30 AM to 6:59 AM (52, 57.8%) for females.
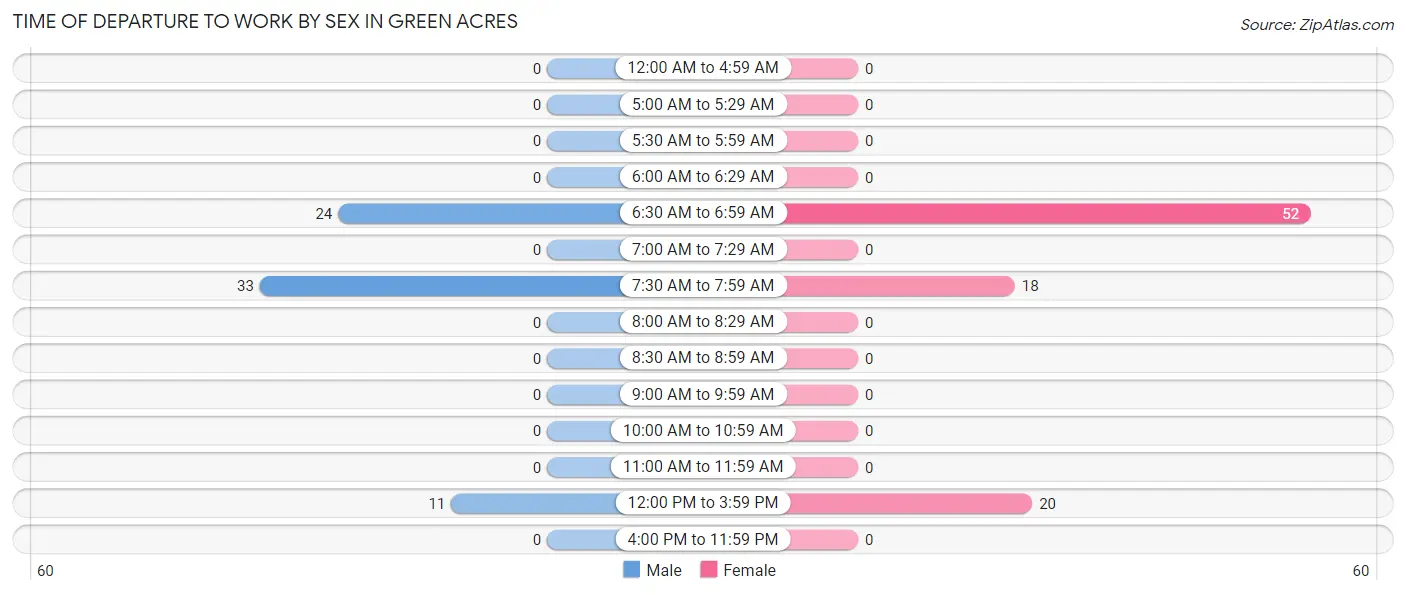
| Time of Departure | Male | Female |
| 12:00 AM to 4:59 AM | 0 (0.0%) | 0 (0.0%) |
| 5:00 AM to 5:29 AM | 0 (0.0%) | 0 (0.0%) |
| 5:30 AM to 5:59 AM | 0 (0.0%) | 0 (0.0%) |
| 6:00 AM to 6:29 AM | 0 (0.0%) | 0 (0.0%) |
| 6:30 AM to 6:59 AM | 24 (35.3%) | 52 (57.8%) |
| 7:00 AM to 7:29 AM | 0 (0.0%) | 0 (0.0%) |
| 7:30 AM to 7:59 AM | 33 (48.5%) | 18 (20.0%) |
| 8:00 AM to 8:29 AM | 0 (0.0%) | 0 (0.0%) |
| 8:30 AM to 8:59 AM | 0 (0.0%) | 0 (0.0%) |
| 9:00 AM to 9:59 AM | 0 (0.0%) | 0 (0.0%) |
| 10:00 AM to 10:59 AM | 0 (0.0%) | 0 (0.0%) |
| 11:00 AM to 11:59 AM | 0 (0.0%) | 0 (0.0%) |
| 12:00 PM to 3:59 PM | 11 (16.2%) | 20 (22.2%) |
| 4:00 PM to 11:59 PM | 0 (0.0%) | 0 (0.0%) |
| Total | 68 (100.0%) | 90 (100.0%) |
Housing Occupancy in Green Acres
Occupancy by Ownership in Green Acres
Of the total 149 dwellings in Green Acres, owner-occupied units account for 16 (10.7%), while renter-occupied units make up 133 (89.3%).
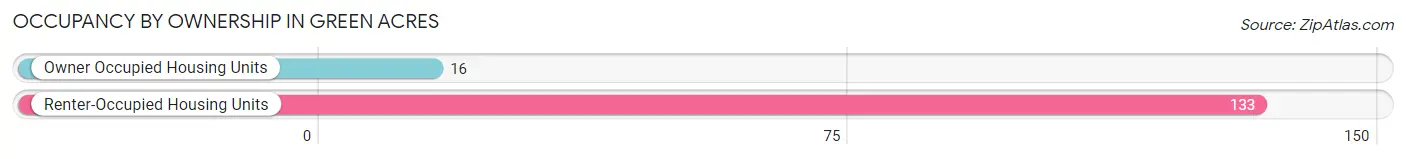
| Occupancy | # Housing Units | % Housing Units |
| Owner Occupied Housing Units | 16 | 10.7% |
| Renter-Occupied Housing Units | 133 | 89.3% |
| Total Occupied Housing Units | 149 | 100.0% |
Occupancy by Household Size in Green Acres
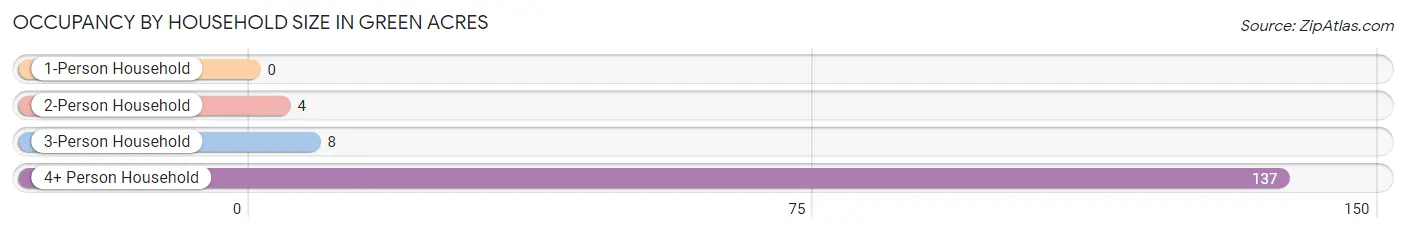
| Household Size | # Housing Units | % Housing Units |
| 1-Person Household | 0 | 0.0% |
| 2-Person Household | 4 | 2.7% |
| 3-Person Household | 8 | 5.4% |
| 4+ Person Household | 137 | 91.9% |
| Total Housing Units | 149 | 100.0% |
Occupancy by Ownership by Household Size in Green Acres
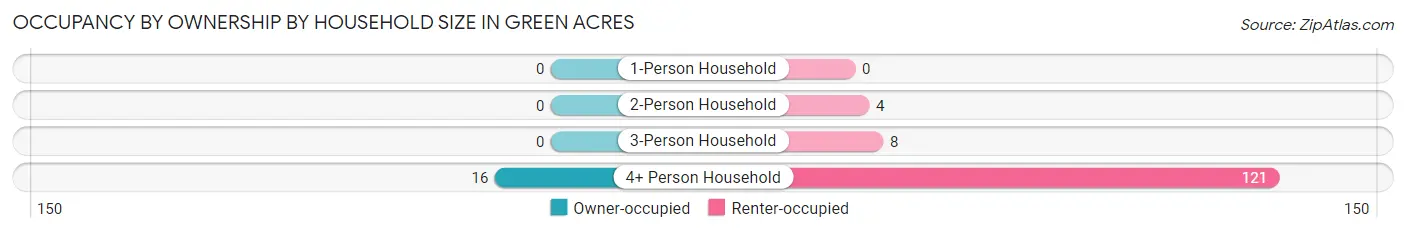
| Household Size | Owner-occupied | Renter-occupied |
| 1-Person Household | 0 (0.0%) | 0 (0.0%) |
| 2-Person Household | 0 (0.0%) | 4 (100.0%) |
| 3-Person Household | 0 (0.0%) | 8 (100.0%) |
| 4+ Person Household | 16 (11.7%) | 121 (88.3%) |
| Total Housing Units | 16 (10.7%) | 133 (89.3%) |
Occupancy by Educational Attainment in Green Acres
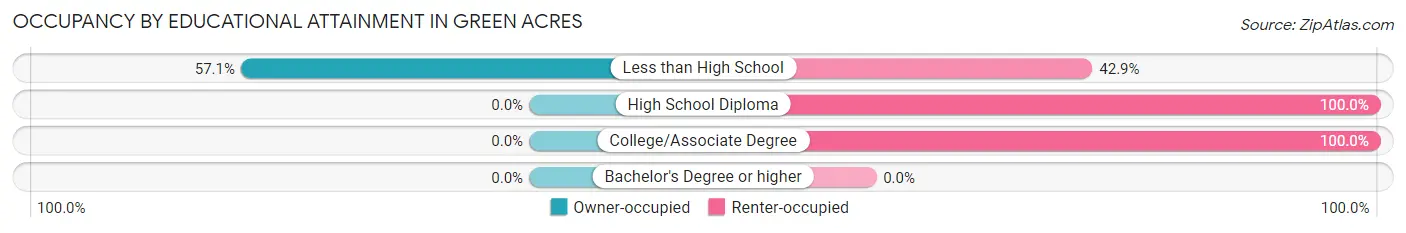
| Household Size | Owner-occupied | Renter-occupied |
| Less than High School | 16 (57.1%) | 12 (42.9%) |
| High School Diploma | 0 (0.0%) | 32 (100.0%) |
| College/Associate Degree | 0 (0.0%) | 89 (100.0%) |
| Bachelor's Degree or higher | 0 (0.0%) | 0 (0.0%) |
Occupancy by Age of Householder in Green Acres
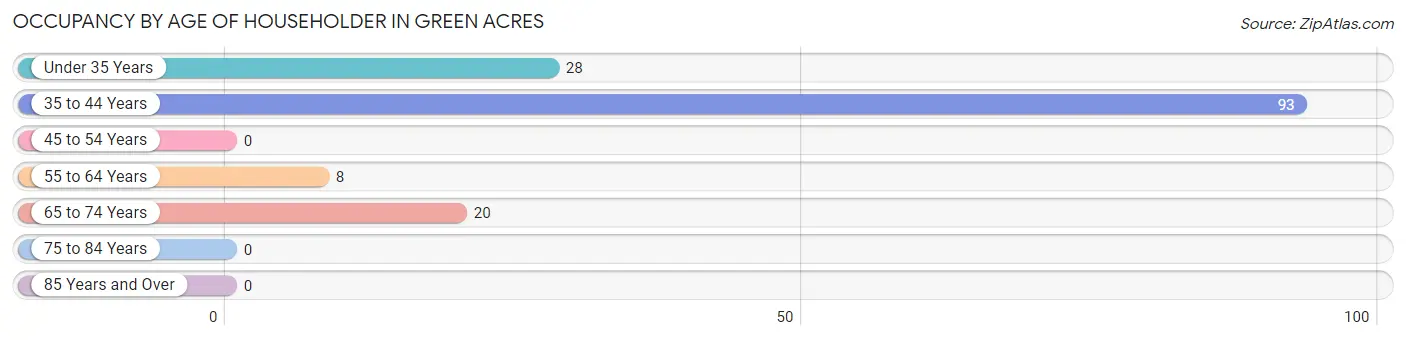
| Age Bracket | # Households | % Households |
| Under 35 Years | 28 | 18.8% |
| 35 to 44 Years | 93 | 62.4% |
| 45 to 54 Years | 0 | 0.0% |
| 55 to 64 Years | 8 | 5.4% |
| 65 to 74 Years | 20 | 13.4% |
| 75 to 84 Years | 0 | 0.0% |
| 85 Years and Over | 0 | 0.0% |
| Total | 149 | 100.0% |
Housing Finances in Green Acres
Median Income by Occupancy in Green Acres
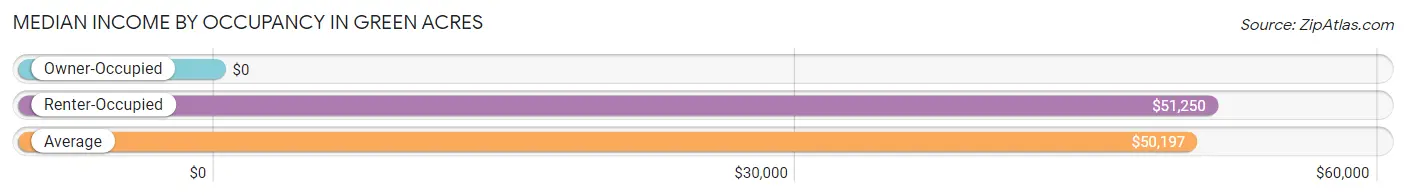
| Occupancy Type | # Households | Median Income |
| Owner-Occupied | 16 (10.7%) | $0 |
| Renter-Occupied | 133 (89.3%) | $51,250 |
| Average | 149 (100.0%) | $50,197 |
Occupancy by Householder Income Bracket in Green Acres
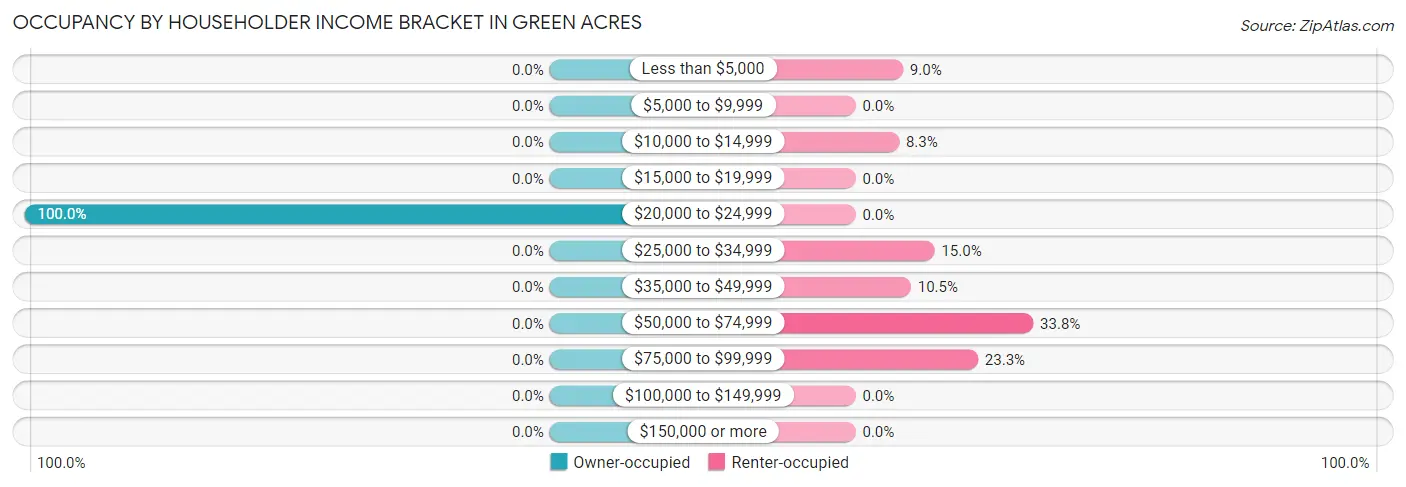
| Income Bracket | Owner-occupied | Renter-occupied |
| Less than $5,000 | 0 (0.0%) | 12 (9.0%) |
| $5,000 to $9,999 | 0 (0.0%) | 0 (0.0%) |
| $10,000 to $14,999 | 0 (0.0%) | 11 (8.3%) |
| $15,000 to $19,999 | 0 (0.0%) | 0 (0.0%) |
| $20,000 to $24,999 | 16 (100.0%) | 0 (0.0%) |
| $25,000 to $34,999 | 0 (0.0%) | 20 (15.0%) |
| $35,000 to $49,999 | 0 (0.0%) | 14 (10.5%) |
| $50,000 to $74,999 | 0 (0.0%) | 45 (33.8%) |
| $75,000 to $99,999 | 0 (0.0%) | 31 (23.3%) |
| $100,000 to $149,999 | 0 (0.0%) | 0 (0.0%) |
| $150,000 or more | 0 (0.0%) | 0 (0.0%) |
| Total | 16 (100.0%) | 133 (100.0%) |
Monthly Housing Cost Tiers in Green Acres
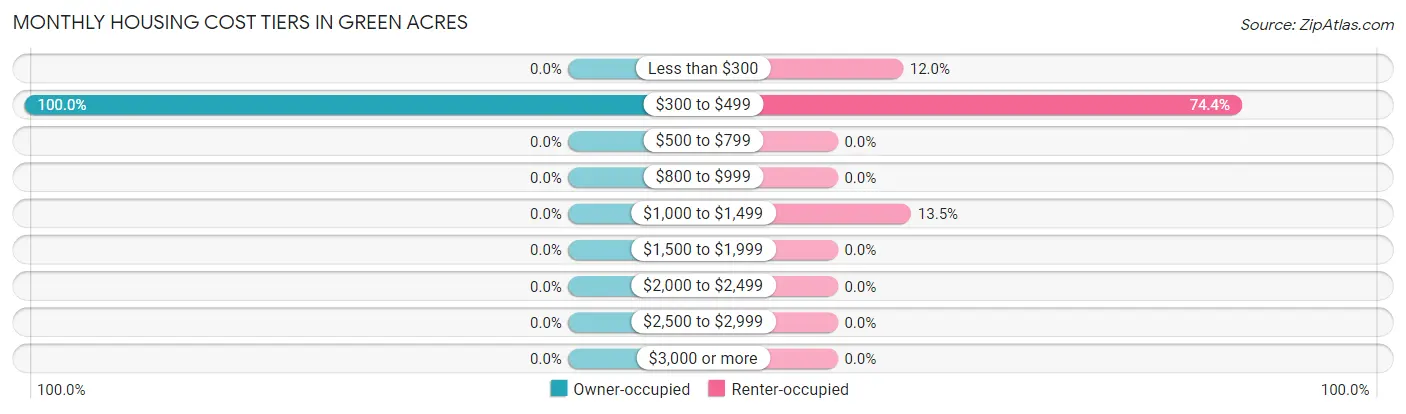
| Monthly Cost | Owner-occupied | Renter-occupied |
| Less than $300 | 0 (0.0%) | 16 (12.0%) |
| $300 to $499 | 16 (100.0%) | 99 (74.4%) |
| $500 to $799 | 0 (0.0%) | 0 (0.0%) |
| $800 to $999 | 0 (0.0%) | 0 (0.0%) |
| $1,000 to $1,499 | 0 (0.0%) | 18 (13.5%) |
| $1,500 to $1,999 | 0 (0.0%) | 0 (0.0%) |
| $2,000 to $2,499 | 0 (0.0%) | 0 (0.0%) |
| $2,500 to $2,999 | 0 (0.0%) | 0 (0.0%) |
| $3,000 or more | 0 (0.0%) | 0 (0.0%) |
| Total | 16 (100.0%) | 133 (100.0%) |
Physical Housing Characteristics in Green Acres
Housing Structures in Green Acres
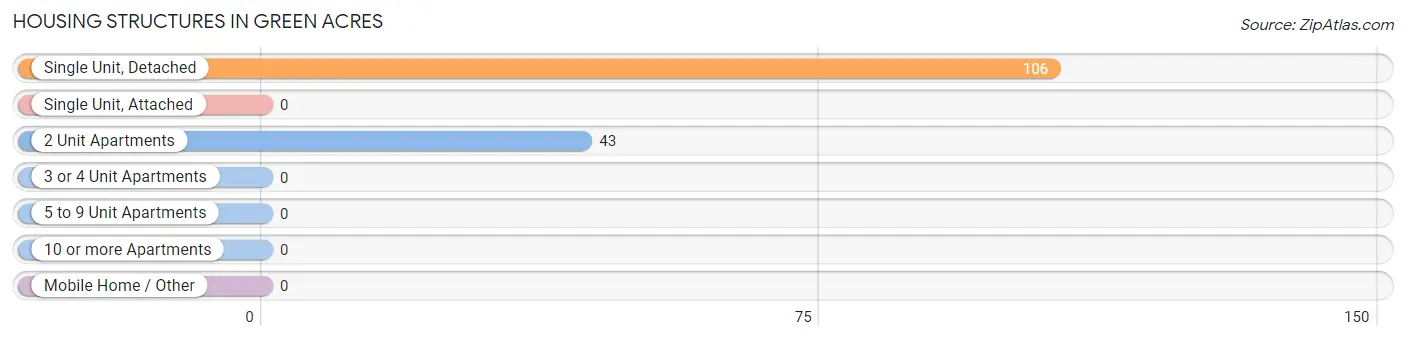
| Structure Type | # Housing Units | % Housing Units |
| Single Unit, Detached | 106 | 71.1% |
| Single Unit, Attached | 0 | 0.0% |
| 2 Unit Apartments | 43 | 28.9% |
| 3 or 4 Unit Apartments | 0 | 0.0% |
| 5 to 9 Unit Apartments | 0 | 0.0% |
| 10 or more Apartments | 0 | 0.0% |
| Mobile Home / Other | 0 | 0.0% |
| Total | 149 | 100.0% |
Housing Structures by Occupancy in Green Acres
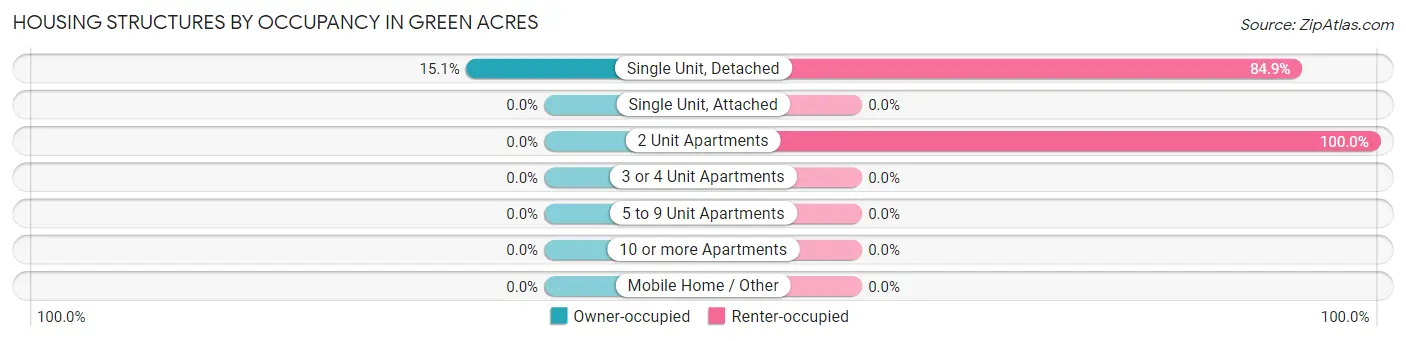
| Structure Type | Owner-occupied | Renter-occupied |
| Single Unit, Detached | 16 (15.1%) | 90 (84.9%) |
| Single Unit, Attached | 0 (0.0%) | 0 (0.0%) |
| 2 Unit Apartments | 0 (0.0%) | 43 (100.0%) |
| 3 or 4 Unit Apartments | 0 (0.0%) | 0 (0.0%) |
| 5 to 9 Unit Apartments | 0 (0.0%) | 0 (0.0%) |
| 10 or more Apartments | 0 (0.0%) | 0 (0.0%) |
| Mobile Home / Other | 0 (0.0%) | 0 (0.0%) |
| Total | 16 (10.7%) | 133 (89.3%) |
Housing Structures by Number of Rooms in Green Acres
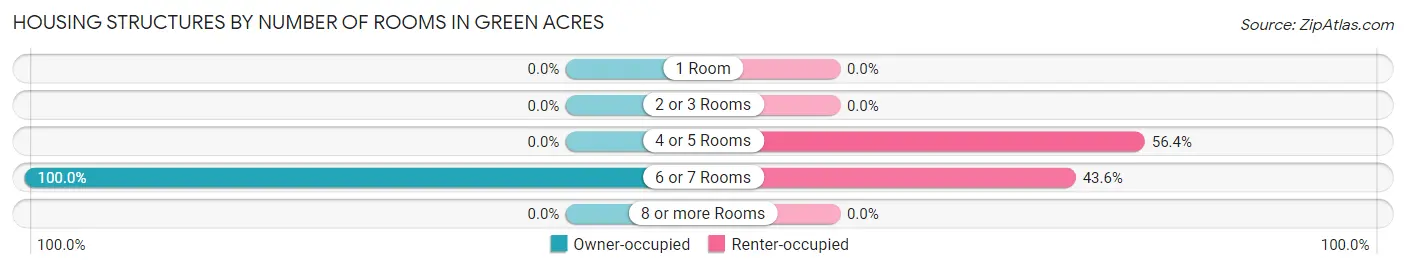
| Number of Rooms | Owner-occupied | Renter-occupied |
| 1 Room | 0 (0.0%) | 0 (0.0%) |
| 2 or 3 Rooms | 0 (0.0%) | 0 (0.0%) |
| 4 or 5 Rooms | 0 (0.0%) | 75 (56.4%) |
| 6 or 7 Rooms | 16 (100.0%) | 58 (43.6%) |
| 8 or more Rooms | 0 (0.0%) | 0 (0.0%) |
| Total | 16 (100.0%) | 133 (100.0%) |
Housing Structure by Heating Type in Green Acres
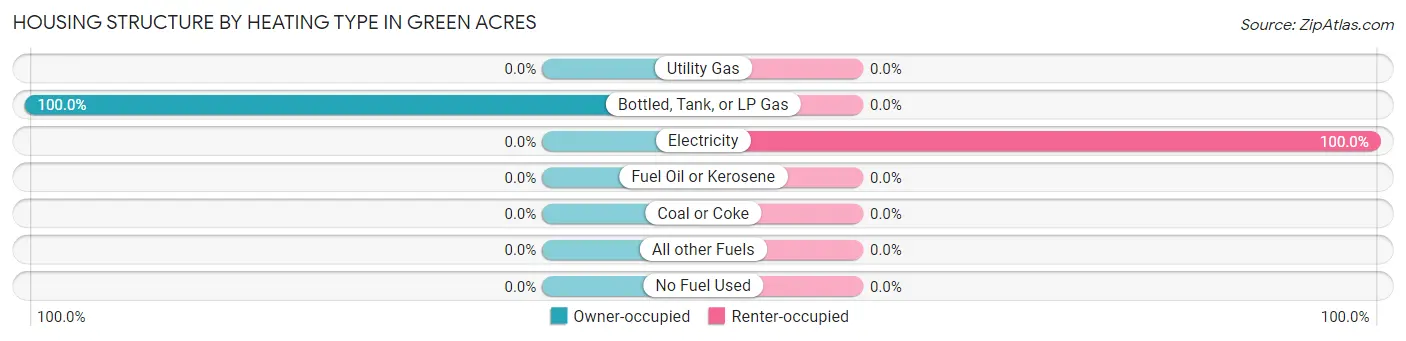
| Heating Type | Owner-occupied | Renter-occupied |
| Utility Gas | 0 (0.0%) | 0 (0.0%) |
| Bottled, Tank, or LP Gas | 16 (100.0%) | 0 (0.0%) |
| Electricity | 0 (0.0%) | 133 (100.0%) |
| Fuel Oil or Kerosene | 0 (0.0%) | 0 (0.0%) |
| Coal or Coke | 0 (0.0%) | 0 (0.0%) |
| All other Fuels | 0 (0.0%) | 0 (0.0%) |
| No Fuel Used | 0 (0.0%) | 0 (0.0%) |
| Total | 16 (100.0%) | 133 (100.0%) |
Household Vehicle Usage in Green Acres
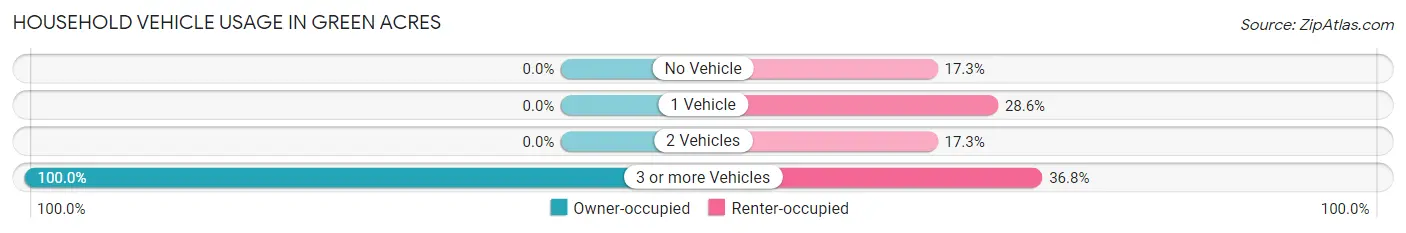
| Vehicles per Household | Owner-occupied | Renter-occupied |
| No Vehicle | 0 (0.0%) | 23 (17.3%) |
| 1 Vehicle | 0 (0.0%) | 38 (28.6%) |
| 2 Vehicles | 0 (0.0%) | 23 (17.3%) |
| 3 or more Vehicles | 16 (100.0%) | 49 (36.8%) |
| Total | 16 (100.0%) | 133 (100.0%) |
Real Estate & Mortgages in Green Acres
Real Estate and Mortgage Overview in Green Acres
| Characteristic | Without Mortgage | With Mortgage |
| Housing Units | 16 | 0 |
| Median Property Value | - | - |
| Median Household Income | - | - |
| Monthly Housing Costs | - | - |
| Real Estate Taxes | - | - |
Property Value by Mortgage Status in Green Acres
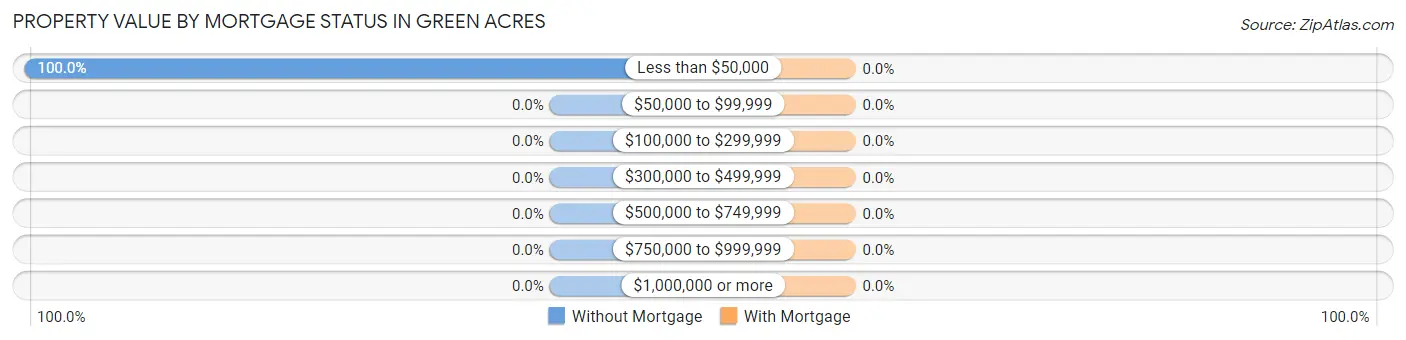
| Property Value | Without Mortgage | With Mortgage |
| Less than $50,000 | 16 (100.0%) | 0 (0.0%) |
| $50,000 to $99,999 | 0 (0.0%) | 0 (0.0%) |
| $100,000 to $299,999 | 0 (0.0%) | 0 (0.0%) |
| $300,000 to $499,999 | 0 (0.0%) | 0 (0.0%) |
| $500,000 to $749,999 | 0 (0.0%) | 0 (0.0%) |
| $750,000 to $999,999 | 0 (0.0%) | 0 (0.0%) |
| $1,000,000 or more | 0 (0.0%) | 0 (0.0%) |
| Total | 16 (100.0%) | 0 (0.0%) |
Household Income by Mortgage Status in Green Acres
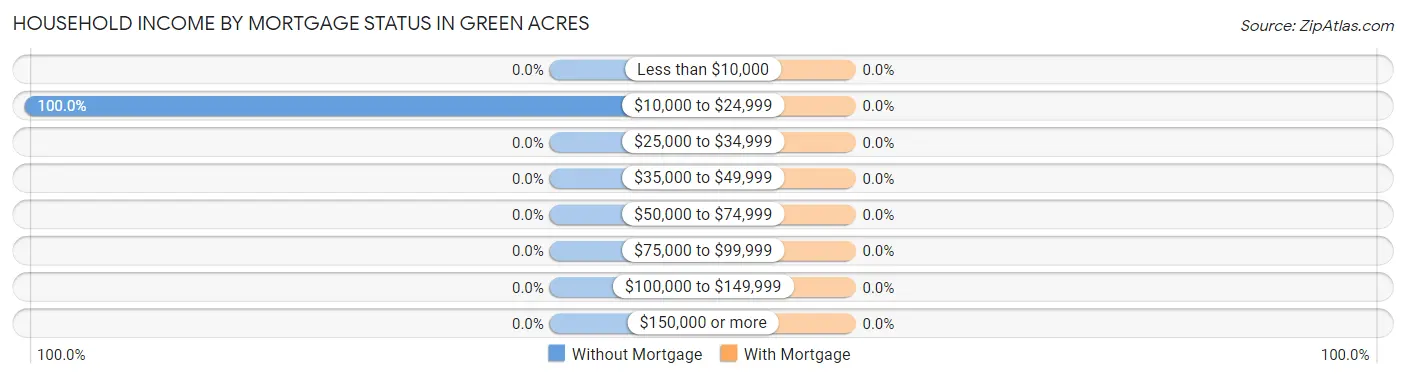
| Household Income | Without Mortgage | With Mortgage |
| Less than $10,000 | 0 (0.0%) | 0 (0.0%) |
| $10,000 to $24,999 | 16 (100.0%) | 0 (0.0%) |
| $25,000 to $34,999 | 0 (0.0%) | 0 (0.0%) |
| $35,000 to $49,999 | 0 (0.0%) | 0 (0.0%) |
| $50,000 to $74,999 | 0 (0.0%) | 0 (0.0%) |
| $75,000 to $99,999 | 0 (0.0%) | 0 (0.0%) |
| $100,000 to $149,999 | 0 (0.0%) | 0 (0.0%) |
| $150,000 or more | 0 (0.0%) | 0 (0.0%) |
| Total | 16 (100.0%) | 0 (0.0%) |
Property Value to Household Income Ratio in Green Acres
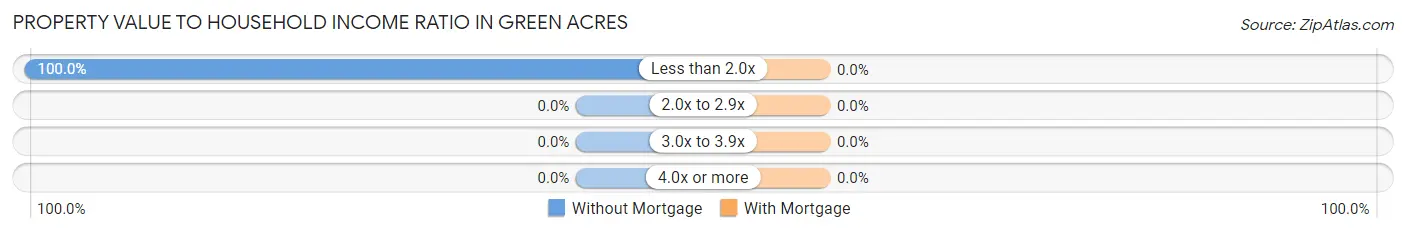
| Value-to-Income Ratio | Without Mortgage | With Mortgage |
| Less than 2.0x | 16 (100.0%) | 0 (0.0%) |
| 2.0x to 2.9x | 0 (0.0%) | 0 (0.0%) |
| 3.0x to 3.9x | 0 (0.0%) | 0 (0.0%) |
| 4.0x or more | 0 (0.0%) | 0 (0.0%) |
| Total | 16 (100.0%) | 0 (0.0%) |
Real Estate Taxes by Mortgage Status in Green Acres
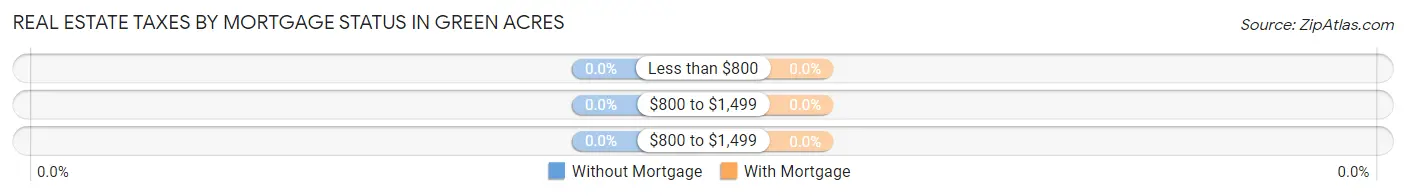
| Property Taxes | Without Mortgage | With Mortgage |
| Less than $800 | 0 (0.0%) | 0 (0.0%) |
| $800 to $1,499 | 0 (0.0%) | 0 (0.0%) |
| $800 to $1,499 | 0 (0.0%) | 0 (0.0%) |
| Total | 16 (100.0%) | 0 (0.0%) |
Health & Disability in Green Acres
Health Insurance Coverage by Age in Green Acres
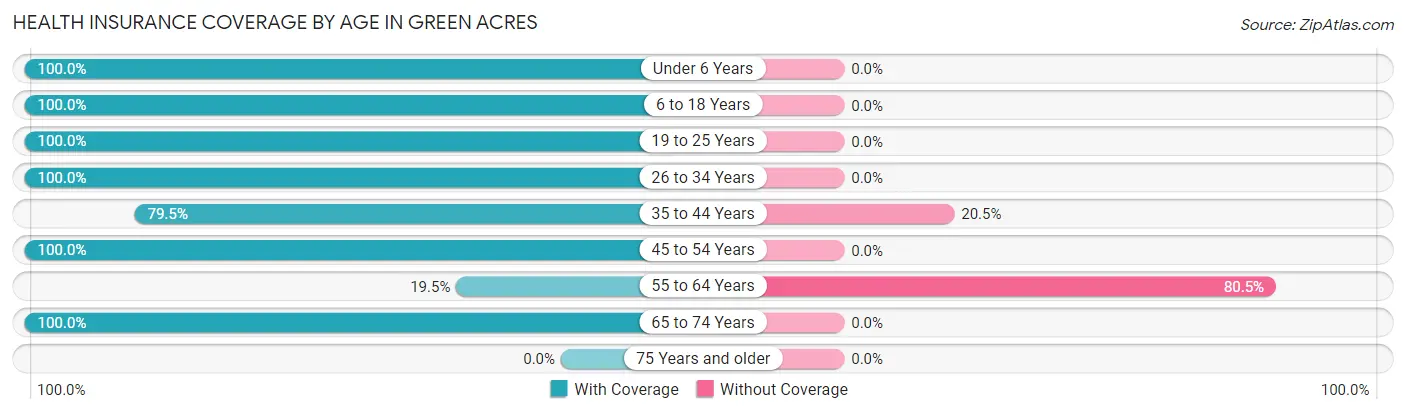
| Age Bracket | With Coverage | Without Coverage |
| Under 6 Years | 35 (100.0%) | 0 (0.0%) |
| 6 to 18 Years | 319 (100.0%) | 0 (0.0%) |
| 19 to 25 Years | 172 (100.0%) | 0 (0.0%) |
| 26 to 34 Years | 39 (100.0%) | 0 (0.0%) |
| 35 to 44 Years | 93 (79.5%) | 24 (20.5%) |
| 45 to 54 Years | 31 (100.0%) | 0 (0.0%) |
| 55 to 64 Years | 8 (19.5%) | 33 (80.5%) |
| 65 to 74 Years | 35 (100.0%) | 0 (0.0%) |
| 75 Years and older | 0 (0.0%) | 0 (0.0%) |
| Total | 732 (92.8%) | 57 (7.2%) |
Health Insurance Coverage by Citizenship Status in Green Acres
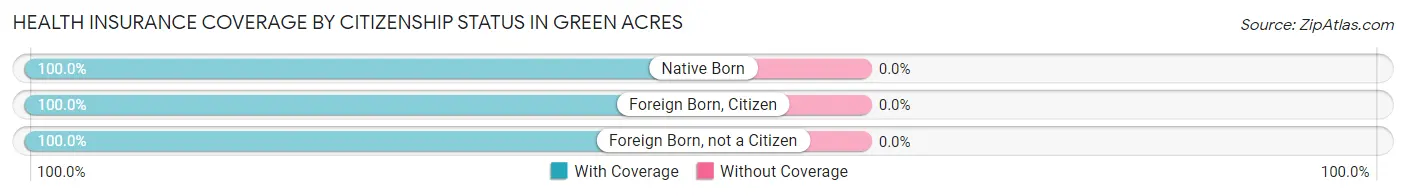
| Citizenship Status | With Coverage | Without Coverage |
| Native Born | 35 (100.0%) | 0 (0.0%) |
| Foreign Born, Citizen | 319 (100.0%) | 0 (0.0%) |
| Foreign Born, not a Citizen | 172 (100.0%) | 0 (0.0%) |
Health Insurance Coverage by Household Income in Green Acres
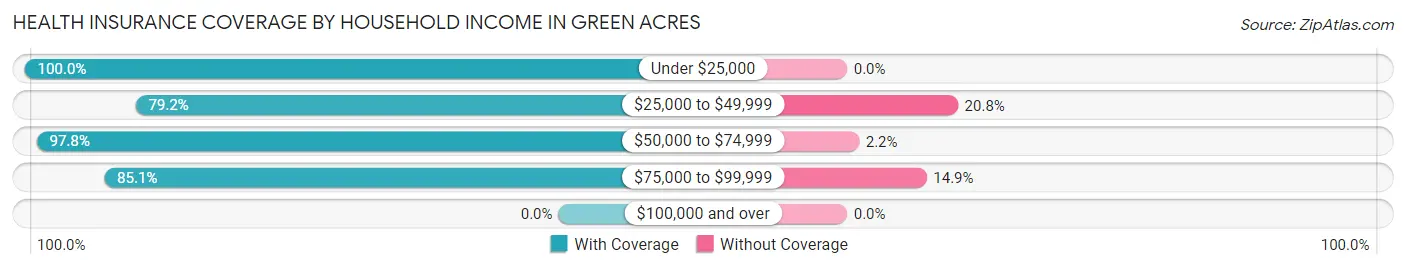
| Household Income | With Coverage | Without Coverage |
| Under $25,000 | 230 (100.0%) | 0 (0.0%) |
| $25,000 to $49,999 | 103 (79.2%) | 27 (20.8%) |
| $50,000 to $74,999 | 262 (97.8%) | 6 (2.2%) |
| $75,000 to $99,999 | 137 (85.1%) | 24 (14.9%) |
| $100,000 and over | 0 (0.0%) | 0 (0.0%) |
Public vs Private Health Insurance Coverage by Age in Green Acres
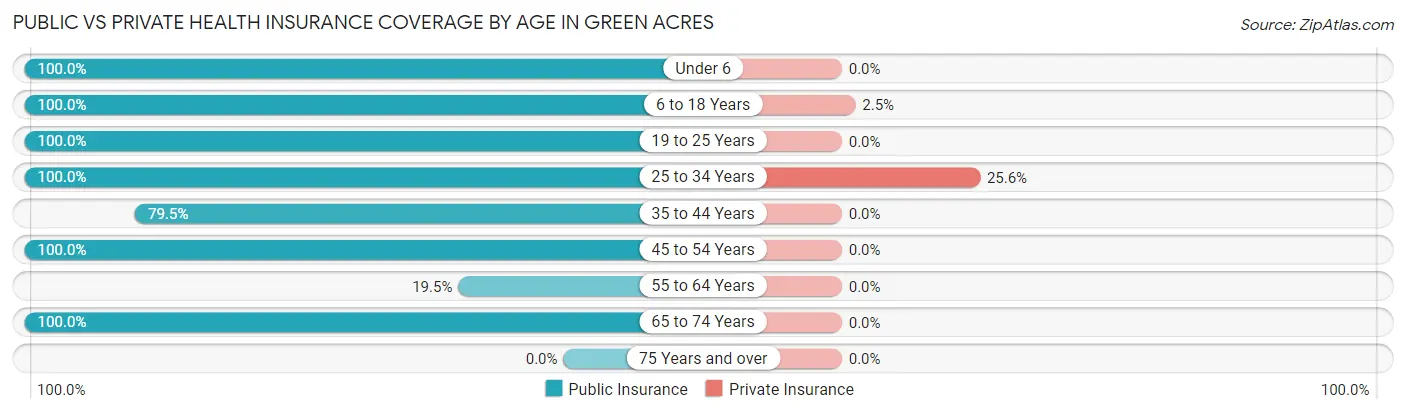
| Age Bracket | Public Insurance | Private Insurance |
| Under 6 | 35 (100.0%) | 0 (0.0%) |
| 6 to 18 Years | 319 (100.0%) | 8 (2.5%) |
| 19 to 25 Years | 172 (100.0%) | 0 (0.0%) |
| 25 to 34 Years | 39 (100.0%) | 10 (25.6%) |
| 35 to 44 Years | 93 (79.5%) | 0 (0.0%) |
| 45 to 54 Years | 31 (100.0%) | 0 (0.0%) |
| 55 to 64 Years | 8 (19.5%) | 0 (0.0%) |
| 65 to 74 Years | 35 (100.0%) | 0 (0.0%) |
| 75 Years and over | 0 (0.0%) | 0 (0.0%) |
| Total | 732 (92.8%) | 18 (2.3%) |
Disability Status by Sex by Age in Green Acres
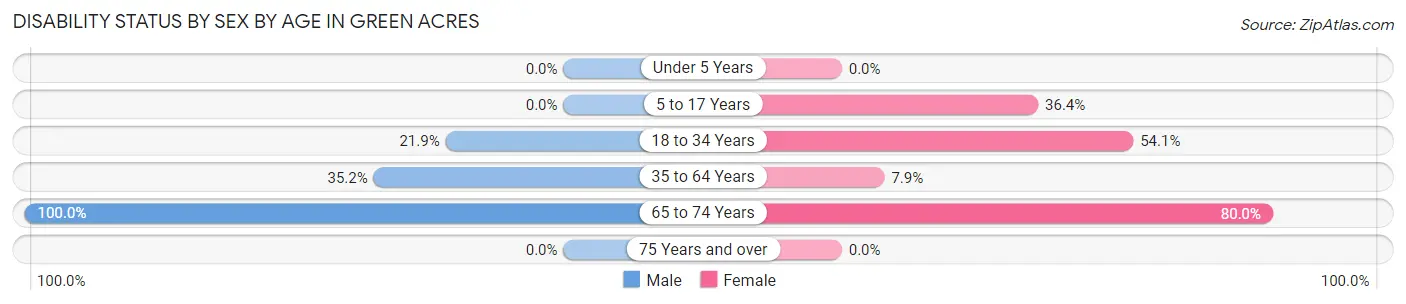
| Age Bracket | Male | Female |
| Under 5 Years | 0 (0.0%) | 0 (0.0%) |
| 5 to 17 Years | 0 (0.0%) | 43 (36.4%) |
| 18 to 34 Years | 35 (21.9%) | 33 (54.1%) |
| 35 to 64 Years | 31 (35.2%) | 8 (7.9%) |
| 65 to 74 Years | 15 (100.0%) | 16 (80.0%) |
| 75 Years and over | 0 (0.0%) | 0 (0.0%) |
Disability Class by Sex by Age in Green Acres
Disability Class: Hearing Difficulty
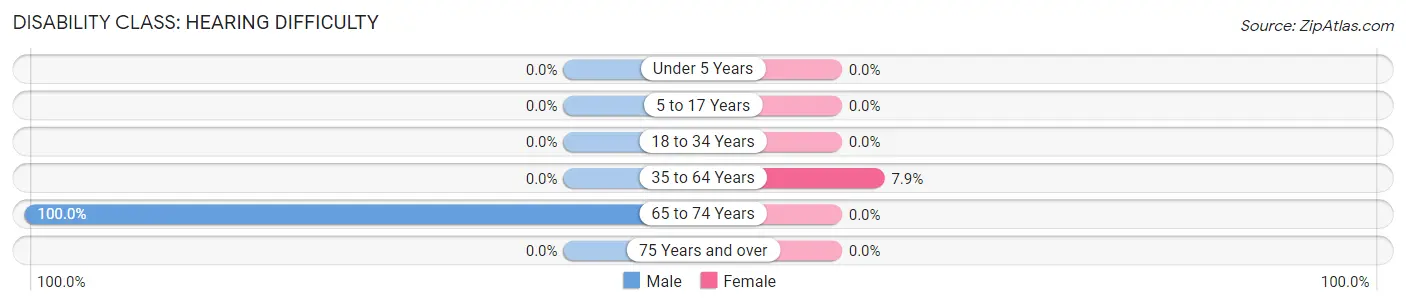
| Age Bracket | Male | Female |
| Under 5 Years | 0 (0.0%) | 0 (0.0%) |
| 5 to 17 Years | 0 (0.0%) | 0 (0.0%) |
| 18 to 34 Years | 0 (0.0%) | 0 (0.0%) |
| 35 to 64 Years | 0 (0.0%) | 8 (7.9%) |
| 65 to 74 Years | 15 (100.0%) | 0 (0.0%) |
| 75 Years and over | 0 (0.0%) | 0 (0.0%) |
Disability Class: Vision Difficulty
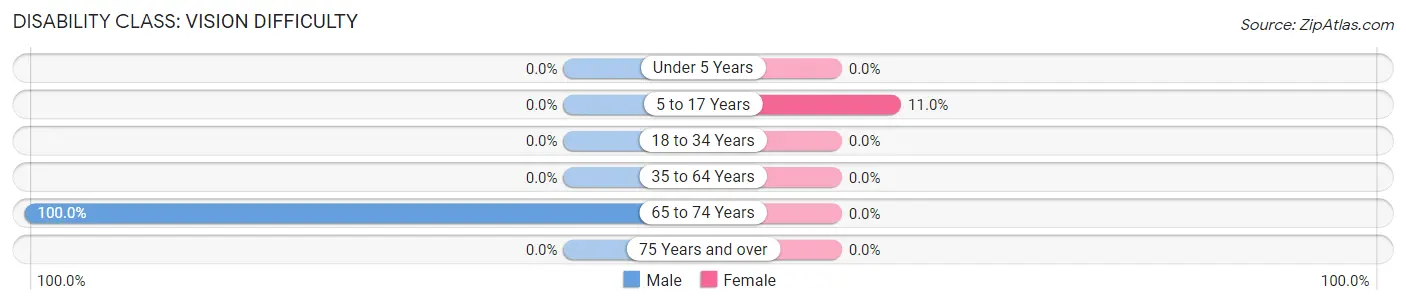
| Age Bracket | Male | Female |
| Under 5 Years | 0 (0.0%) | 0 (0.0%) |
| 5 to 17 Years | 0 (0.0%) | 13 (11.0%) |
| 18 to 34 Years | 0 (0.0%) | 0 (0.0%) |
| 35 to 64 Years | 0 (0.0%) | 0 (0.0%) |
| 65 to 74 Years | 15 (100.0%) | 0 (0.0%) |
| 75 Years and over | 0 (0.0%) | 0 (0.0%) |
Disability Class: Cognitive Difficulty
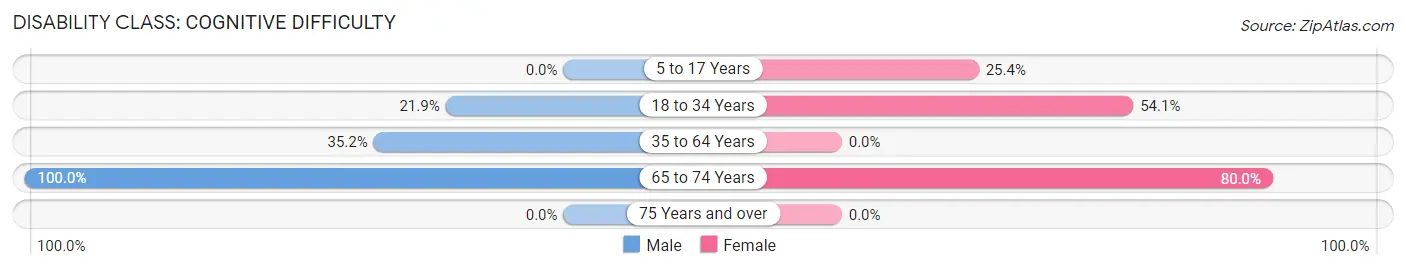
| Age Bracket | Male | Female |
| 5 to 17 Years | 0 (0.0%) | 30 (25.4%) |
| 18 to 34 Years | 35 (21.9%) | 33 (54.1%) |
| 35 to 64 Years | 31 (35.2%) | 0 (0.0%) |
| 65 to 74 Years | 15 (100.0%) | 16 (80.0%) |
| 75 Years and over | 0 (0.0%) | 0 (0.0%) |
Disability Class: Ambulatory Difficulty
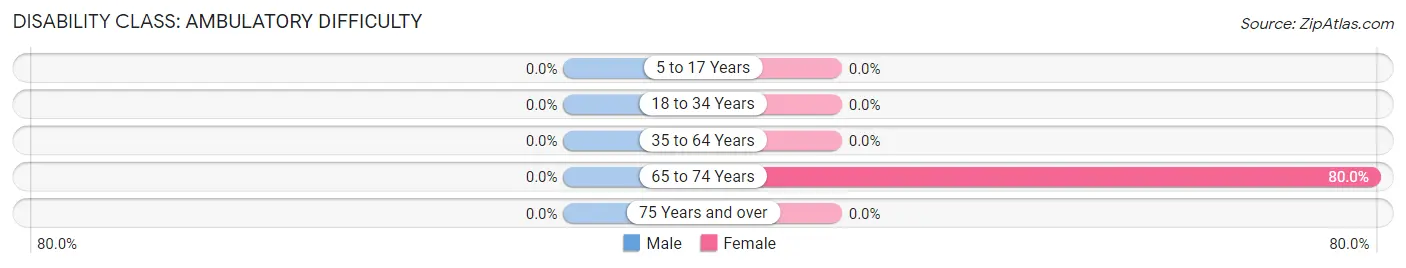
| Age Bracket | Male | Female |
| 5 to 17 Years | 0 (0.0%) | 0 (0.0%) |
| 18 to 34 Years | 0 (0.0%) | 0 (0.0%) |
| 35 to 64 Years | 0 (0.0%) | 0 (0.0%) |
| 65 to 74 Years | 0 (0.0%) | 16 (80.0%) |
| 75 Years and over | 0 (0.0%) | 0 (0.0%) |
Disability Class: Self-Care Difficulty
| Age Bracket | Male | Female |
| 5 to 17 Years | 0 (0.0%) | 0 (0.0%) |
| 18 to 34 Years | 0 (0.0%) | 0 (0.0%) |
| 35 to 64 Years | 0 (0.0%) | 0 (0.0%) |
| 65 to 74 Years | 0 (0.0%) | 0 (0.0%) |
| 75 Years and over | 0 (0.0%) | 0 (0.0%) |
Technology Access in Green Acres
Computing Device Access in Green Acres
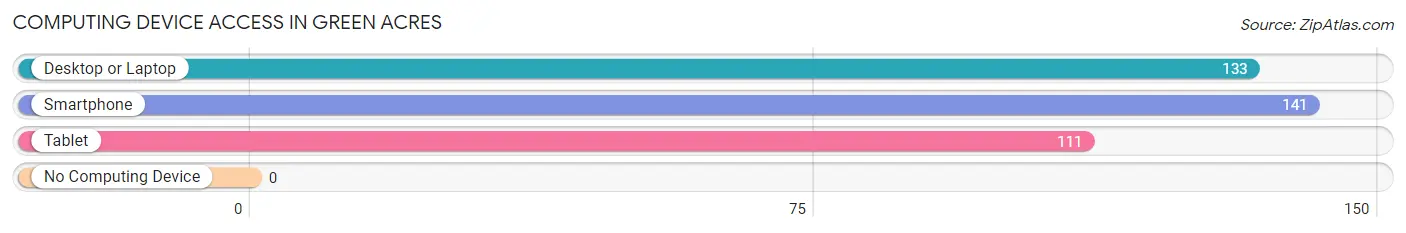
| Device Type | # Households | % Households |
| Desktop or Laptop | 133 | 89.3% |
| Smartphone | 141 | 94.6% |
| Tablet | 111 | 74.5% |
| No Computing Device | 0 | 0.0% |
| Total | 149 | 100.0% |
Internet Access in Green Acres
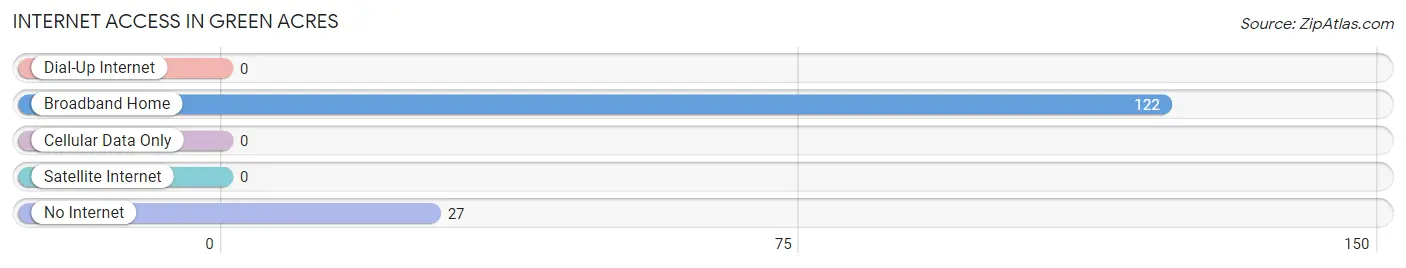
| Internet Type | # Households | % Households |
| Dial-Up Internet | 0 | 0.0% |
| Broadband Home | 122 | 81.9% |
| Cellular Data Only | 0 | 0.0% |
| Satellite Internet | 0 | 0.0% |
| No Internet | 27 | 18.1% |
| Total | 149 | 100.0% |
Green Acres Summary
Green Acres is a small city located in the state of North Dakota. It is situated in the southeastern corner of the state, near the border with Minnesota. The city has a population of approximately 1,500 people, and is part of the Grand Forks metropolitan area.
History
Green Acres was founded in 1883 by a group of settlers from Minnesota. The city was named after the nearby Green Acres Lake, which was named for its lush green vegetation. The city was originally a farming community, and the settlers grew wheat, corn, and other crops. In the early 1900s, the city began to grow as a result of the railroad, which brought in new businesses and people.
In the 1950s, Green Acres began to experience a population boom, as people moved to the city from other parts of the state. This growth was largely due to the city's proximity to the Grand Forks Air Force Base, which was established in 1951. The base brought in many new jobs and people to the area, and the population of Green Acres continued to grow throughout the 1950s and 1960s.
Geography
Green Acres is located in the southeastern corner of North Dakota, near the border with Minnesota. The city is situated on the banks of the Red River, which flows through the city and provides a natural border between the two states. The city is surrounded by rolling hills and farmland, and is located about 25 miles from the city of Grand Forks.
The climate in Green Acres is typical of the northern Great Plains, with cold winters and hot summers. The average temperature in the winter is around 20 degrees Fahrenheit, while the average temperature in the summer is around 75 degrees Fahrenheit. The city receives an average of 25 inches of precipitation each year, with most of it falling in the form of snow.
Economy
Green Acres is a small city, and its economy is largely based on agriculture. The city is home to several farms, which produce a variety of crops, including wheat, corn, and soybeans. The city also has a number of small businesses, including restaurants, retail stores, and service providers.
The city is also home to the Grand Forks Air Force Base, which provides a significant number of jobs to the local economy. The base is home to a number of military personnel, as well as civilian employees. The base also provides a number of services to the local community, including medical care, education, and recreation.
Demographics
As of the 2010 census, the population of Green Acres was 1,500 people. The city has a population that is predominantly white, with a small percentage of African Americans, Hispanics, and Native Americans. The median household income in the city is $45,000, and the median age is 37 years old. The city has a low unemployment rate, and the majority of the population is employed in the agricultural and service sectors.
Green Acres is a small city with a rich history and a vibrant economy. The city is home to a diverse population, and is a great place to live and work. The city is surrounded by beautiful scenery, and offers a variety of activities and attractions for residents and visitors alike.
Common Questions
What is Per Capita Income in Green Acres?
Per Capita income in Green Acres is $9,879.
What is the Median Family Income in Green Acres?
Median Family Income in Green Acres is $39,875.
What is the Median Household income in Green Acres?
Median Household Income in Green Acres is $50,197.
What is Inequality or Gini Index in Green Acres?
Inequality or Gini Index in Green Acres is 0.32.
What is the Total Population of Green Acres?
Total Population of Green Acres is 789.
What is the Total Male Population of Green Acres?
Total Male Population of Green Acres is 468.
What is the Total Female Population of Green Acres?
Total Female Population of Green Acres is 321.
What is the Ratio of Males per 100 Females in Green Acres?
There are 145.79 Males per 100 Females in Green Acres.
What is the Ratio of Females per 100 Males in Green Acres?
There are 68.59 Females per 100 Males in Green Acres.
What is the Median Population Age in Green Acres?
Median Population Age in Green Acres is 24.6 Years.
What is the Average Family Size in Green Acres
Average Family Size in Green Acres is 5.2 People.
What is the Average Household Size in Green Acres
Average Household Size in Green Acres is 5.3 People.
How Large is the Labor Force in Green Acres?
There are 158 People in the Labor Forcein in Green Acres.
What is the Percentage of People in the Labor Force in Green Acres?
27.6% of People are in the Labor Force in Green Acres.