Richards, MO Map & Demographics
Richards Map
Richards Overview
$13,422
PER CAPITA INCOME
$65,455
AVG HOUSEHOLD INCOME
59.3%
WAGE / INCOME GAP [ % ]
40.7¢/ $1
WAGE / INCOME GAP [ $ ]
0.22
INEQUALITY / GINI INDEX
138
TOTAL POPULATION
80
MALE POPULATION
58
FEMALE POPULATION
137.93
MALES / 100 FEMALES
72.50
FEMALES / 100 MALES
23.7
MEDIAN AGE
3.5
AVG FAMILY SIZE
4.9
AVG HOUSEHOLD SIZE
23
LABOR FORCE [ PEOPLE ]
27.7%
PERCENT IN LABOR FORCE
Richards Zip Codes
Richards Area Codes
Income in Richards
Income Overview in Richards
| Characteristic | Number | Measure |
| Per Capita Income | 138 | $13,422 |
| Median Family Income | 21 | $0 |
| Mean Family Income | 21 | $42,671 |
| Median Household Income | 28 | $65,455 |
| Mean Household Income | 28 | $56,529 |
| Income Deficit | 21 | $0 |
| Wage / Income Gap (%) | 138 | 59.29% |
| Wage / Income Gap ($) | 138 | 40.71¢ per $1 |
| Gini / Inequality Index | 138 | 0.22 |
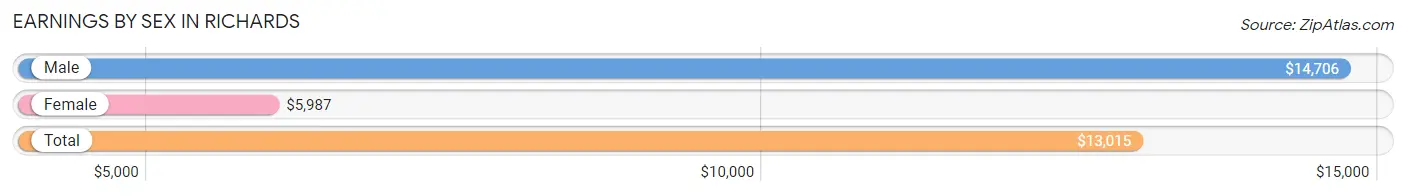
Earnings by Sex in Richards
Average Earnings in Richards are $13,015, $14,706 for men and $5,987 for women, a difference of 59.3%.
| Sex | Number | Average Earnings |
| Male | 34 (49.3%) | $14,706 |
| Female | 35 (50.7%) | $5,987 |
| Total | 69 (100.0%) | $13,015 |
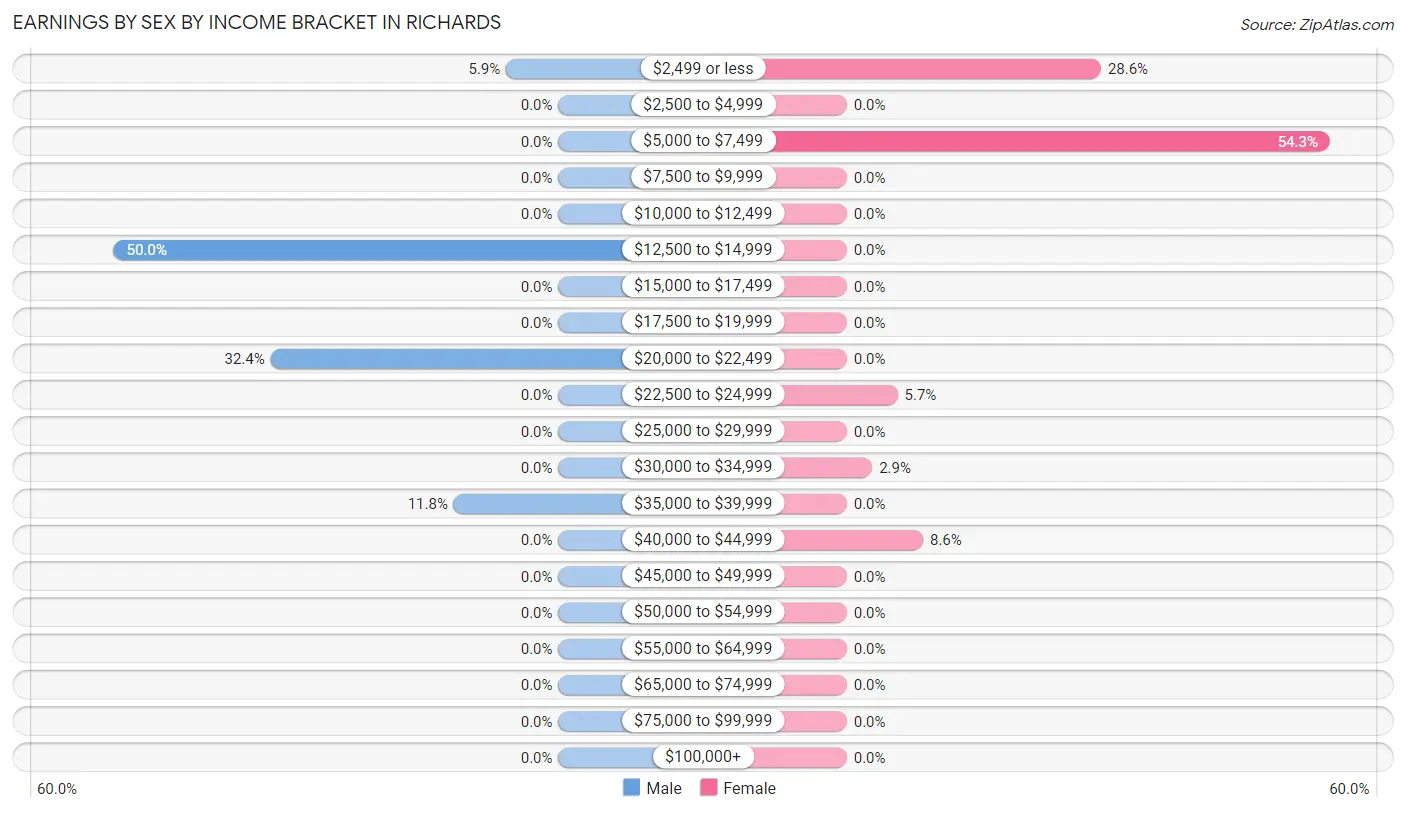
Earnings by Sex by Income Bracket in Richards
The most common earnings brackets in Richards are $12,500 to $14,999 for men (17 | 50.0%) and $5,000 to $7,499 for women (19 | 54.3%).
| Income | Male | Female |
| $2,499 or less | 2 (5.9%) | 10 (28.6%) |
| $2,500 to $4,999 | 0 (0.0%) | 0 (0.0%) |
| $5,000 to $7,499 | 0 (0.0%) | 19 (54.3%) |
| $7,500 to $9,999 | 0 (0.0%) | 0 (0.0%) |
| $10,000 to $12,499 | 0 (0.0%) | 0 (0.0%) |
| $12,500 to $14,999 | 17 (50.0%) | 0 (0.0%) |
| $15,000 to $17,499 | 0 (0.0%) | 0 (0.0%) |
| $17,500 to $19,999 | 0 (0.0%) | 0 (0.0%) |
| $20,000 to $22,499 | 11 (32.4%) | 0 (0.0%) |
| $22,500 to $24,999 | 0 (0.0%) | 2 (5.7%) |
| $25,000 to $29,999 | 0 (0.0%) | 0 (0.0%) |
| $30,000 to $34,999 | 0 (0.0%) | 1 (2.9%) |
| $35,000 to $39,999 | 4 (11.8%) | 0 (0.0%) |
| $40,000 to $44,999 | 0 (0.0%) | 3 (8.6%) |
| $45,000 to $49,999 | 0 (0.0%) | 0 (0.0%) |
| $50,000 to $54,999 | 0 (0.0%) | 0 (0.0%) |
| $55,000 to $64,999 | 0 (0.0%) | 0 (0.0%) |
| $65,000 to $74,999 | 0 (0.0%) | 0 (0.0%) |
| $75,000 to $99,999 | 0 (0.0%) | 0 (0.0%) |
| $100,000+ | 0 (0.0%) | 0 (0.0%) |
| Total | 34 (100.0%) | 35 (100.0%) |
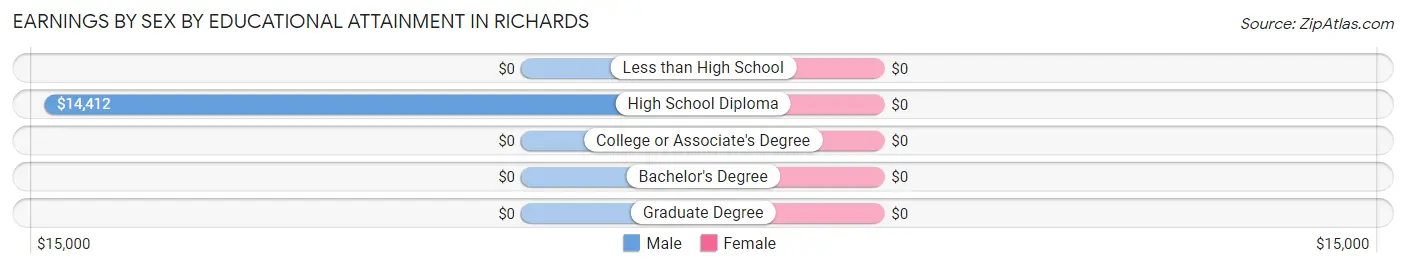
Earnings by Sex by Educational Attainment in Richards
| Educational Attainment | Male Income | Female Income |
| Less than High School | - | - |
| High School Diploma | $14,412 | $0 |
| College or Associate's Degree | - | - |
| Bachelor's Degree | - | - |
| Graduate Degree | - | - |
| Total | $14,706 | $2,499 |
Family Income in Richards
Family Income Brackets in Richards
According to the Richards family income data, there are 12 families falling into the $15,000 to $24,999 income range, which is the most common income bracket and makes up 57.1% of all families.
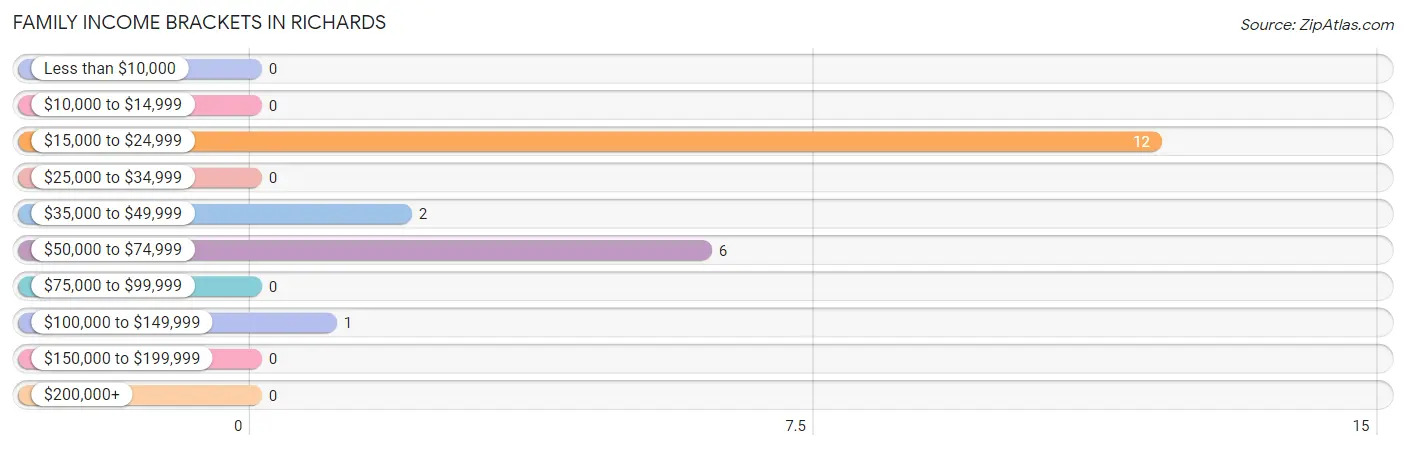
| Income Bracket | # Families | % Families |
| Less than $10,000 | 0 | 0.0% |
| $10,000 to $14,999 | 0 | 0.0% |
| $15,000 to $24,999 | 12 | 57.1% |
| $25,000 to $34,999 | 0 | 0.0% |
| $35,000 to $49,999 | 2 | 9.5% |
| $50,000 to $74,999 | 6 | 28.6% |
| $75,000 to $99,999 | 0 | 0.0% |
| $100,000 to $149,999 | 1 | 4.8% |
| $150,000 to $199,999 | 0 | 0.0% |
| $200,000+ | 0 | 0.0% |
Family Income by Famaliy Size in Richards
| Income Bracket | # Families | Median Income |
| 2-Person Families | 3 (14.3%) | $0 |
| 3-Person Families | 1 (4.8%) | $0 |
| 4-Person Families | 0 (0.0%) | $0 |
| 5-Person Families | 13 (61.9%) | $0 |
| 6-Person Families | 4 (19.1%) | $0 |
| 7+ Person Families | 0 (0.0%) | $0 |
| Total | 21 (100.0%) | $0 |
Family Income by Number of Earners in Richards
| Number of Earners | # Families | Median Income |
| No Earners | 4 (19.1%) | $0 |
| 1 Earner | 11 (52.4%) | $0 |
| 2 Earners | 6 (28.6%) | $0 |
| 3+ Earners | 0 (0.0%) | $0 |
| Total | 21 (100.0%) | $0 |
Household Income in Richards
Household Income Brackets in Richards
With 17 households falling in the category, the $50,000 to $74,999 income range is the most frequent in Richards, accounting for 60.7% of all households.
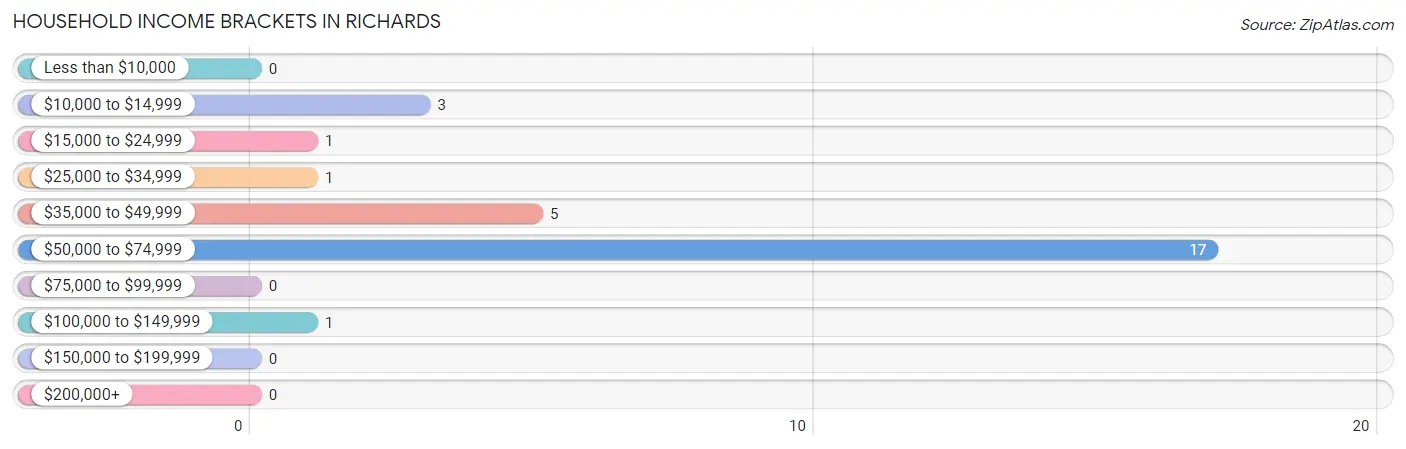
| Income Bracket | # Households | % Households |
| Less than $10,000 | 0 | 0.0% |
| $10,000 to $14,999 | 3 | 10.7% |
| $15,000 to $24,999 | 1 | 3.6% |
| $25,000 to $34,999 | 1 | 3.6% |
| $35,000 to $49,999 | 5 | 17.9% |
| $50,000 to $74,999 | 17 | 60.7% |
| $75,000 to $99,999 | 0 | 0.0% |
| $100,000 to $149,999 | 1 | 3.6% |
| $150,000 to $199,999 | 0 | 0.0% |
| $200,000+ | 0 | 0.0% |
Household Income by Householder Age in Richards
The median household income in Richards is $65,455, with the highest median household income of $66,477 found in the 25 to 44 years age bracket for the primary householder. A total of 17 households (60.7%) fall into this category.
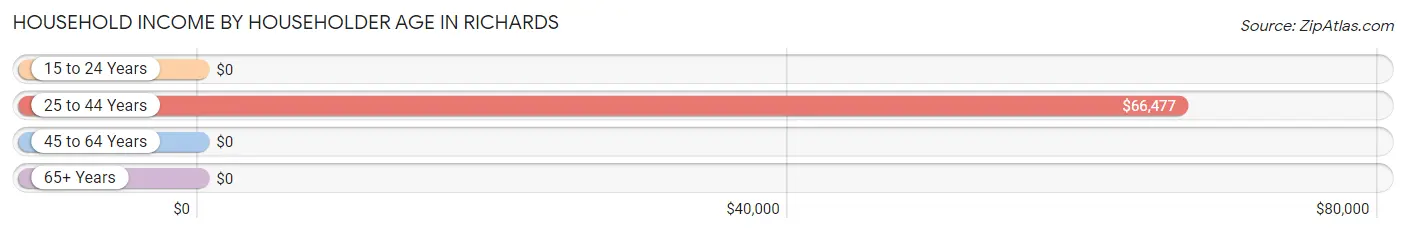
| Income Bracket | # Households | Median Income |
| 15 to 24 Years | 0 (0.0%) | $0 |
| 25 to 44 Years | 17 (60.7%) | $66,477 |
| 45 to 64 Years | 7 (25.0%) | $0 |
| 65+ Years | 4 (14.3%) | $0 |
| Total | 28 (100.0%) | $65,455 |
Poverty in Richards
Income Below Poverty by Sex and Age in Richards
With 54.4% poverty level for males and 67.2% for females among the residents of Richards, 6 to 11 year old males and 5 year old females are the most vulnerable to poverty, with 23 males (100.0%) and 10 females (100.0%) in their respective age groups living below the poverty level.
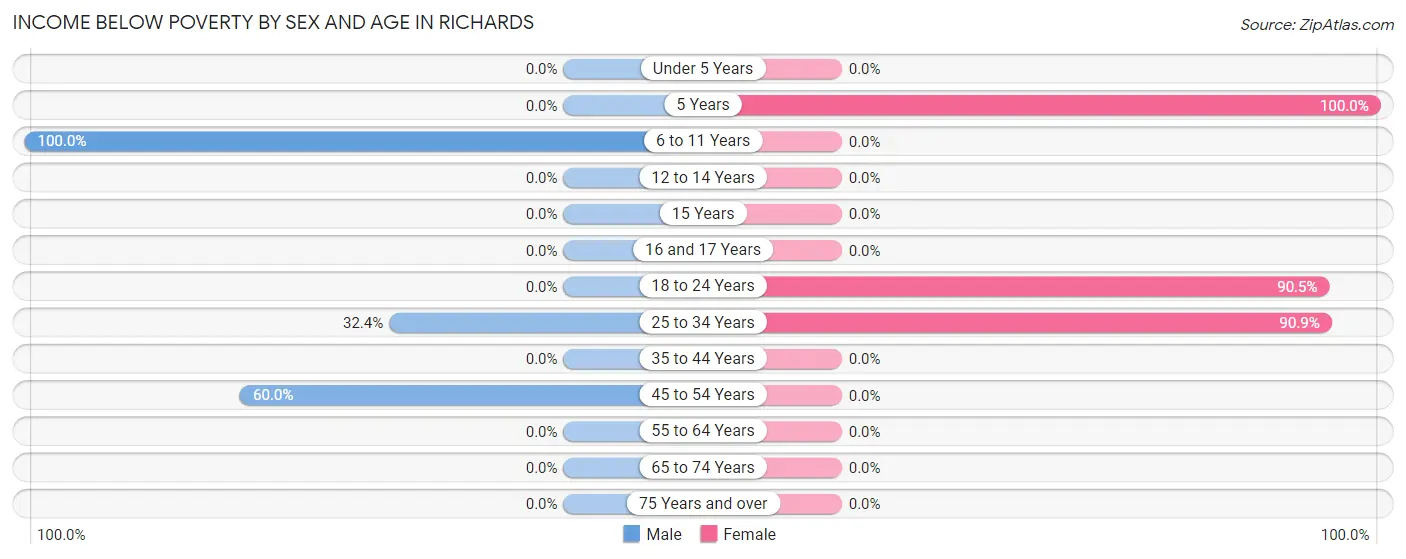
| Age Bracket | Male | Female |
| Under 5 Years | 0 (0.0%) | 0 (0.0%) |
| 5 Years | 0 (0.0%) | 10 (100.0%) |
| 6 to 11 Years | 23 (100.0%) | 0 (0.0%) |
| 12 to 14 Years | 0 (0.0%) | 0 (0.0%) |
| 15 Years | 0 (0.0%) | 0 (0.0%) |
| 16 and 17 Years | 0 (0.0%) | 0 (0.0%) |
| 18 to 24 Years | 0 (0.0%) | 19 (90.5%) |
| 25 to 34 Years | 11 (32.4%) | 10 (90.9%) |
| 35 to 44 Years | 0 (0.0%) | 0 (0.0%) |
| 45 to 54 Years | 3 (60.0%) | 0 (0.0%) |
| 55 to 64 Years | 0 (0.0%) | 0 (0.0%) |
| 65 to 74 Years | 0 (0.0%) | 0 (0.0%) |
| 75 Years and over | 0 (0.0%) | 0 (0.0%) |
| Total | 37 (54.4%) | 39 (67.2%) |
Income Above Poverty by Sex and Age in Richards
According to the poverty statistics in Richards, males aged under 5 years and females aged under 5 years are the age groups that are most secure financially, with 100.0% of males and 100.0% of females in these age groups living above the poverty line.
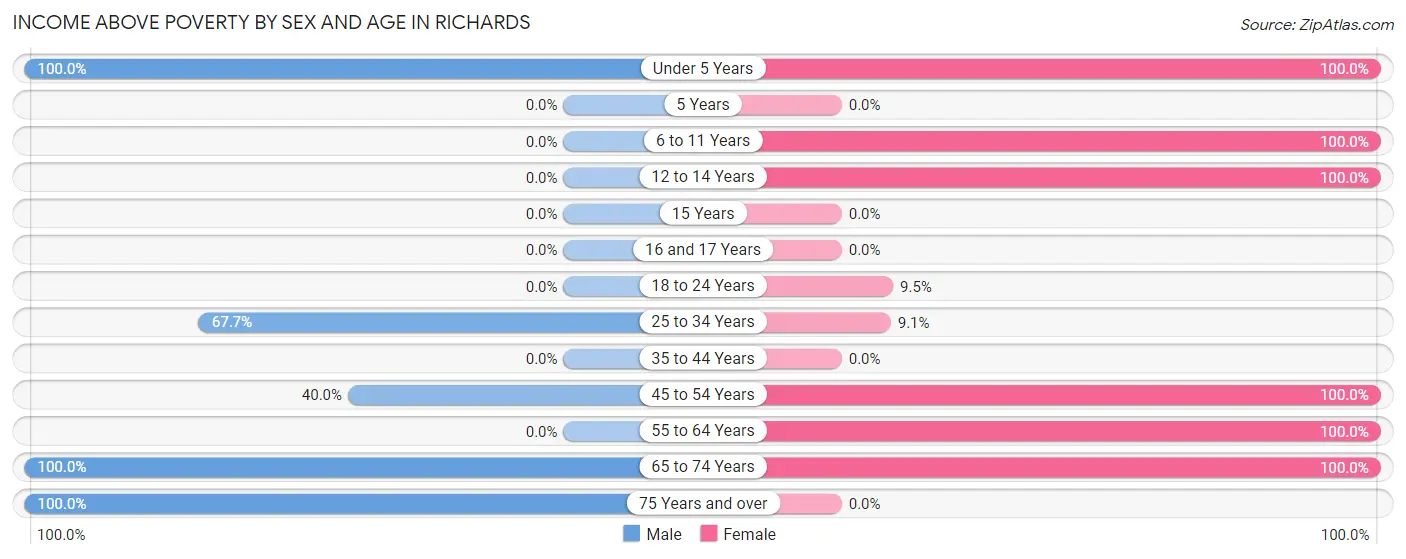
| Age Bracket | Male | Female |
| Under 5 Years | 2 (100.0%) | 1 (100.0%) |
| 5 Years | 0 (0.0%) | 0 (0.0%) |
| 6 to 11 Years | 0 (0.0%) | 5 (100.0%) |
| 12 to 14 Years | 0 (0.0%) | 2 (100.0%) |
| 15 Years | 0 (0.0%) | 0 (0.0%) |
| 16 and 17 Years | 0 (0.0%) | 0 (0.0%) |
| 18 to 24 Years | 0 (0.0%) | 2 (9.5%) |
| 25 to 34 Years | 23 (67.6%) | 1 (9.1%) |
| 35 to 44 Years | 0 (0.0%) | 0 (0.0%) |
| 45 to 54 Years | 2 (40.0%) | 5 (100.0%) |
| 55 to 64 Years | 0 (0.0%) | 1 (100.0%) |
| 65 to 74 Years | 2 (100.0%) | 2 (100.0%) |
| 75 Years and over | 2 (100.0%) | 0 (0.0%) |
| Total | 31 (45.6%) | 19 (32.8%) |
Income Below Poverty Among Married-Couple Families in Richards
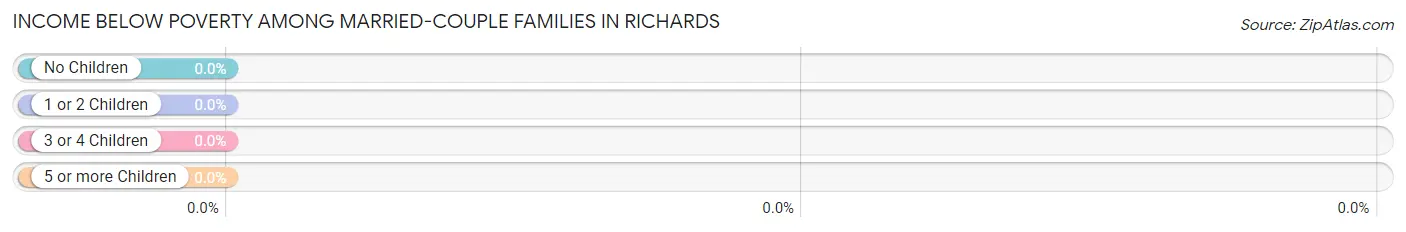
| Children | Above Poverty | Below Poverty |
| No Children | 3 (100.0%) | 0 (0.0%) |
| 1 or 2 Children | 0 (0.0%) | 0 (0.0%) |
| 3 or 4 Children | 6 (100.0%) | 0 (0.0%) |
| 5 or more Children | 0 (0.0%) | 0 (0.0%) |
| Total | 9 (100.0%) | 0 (0.0%) |
Income Below Poverty Among Single-Parent Households in Richards
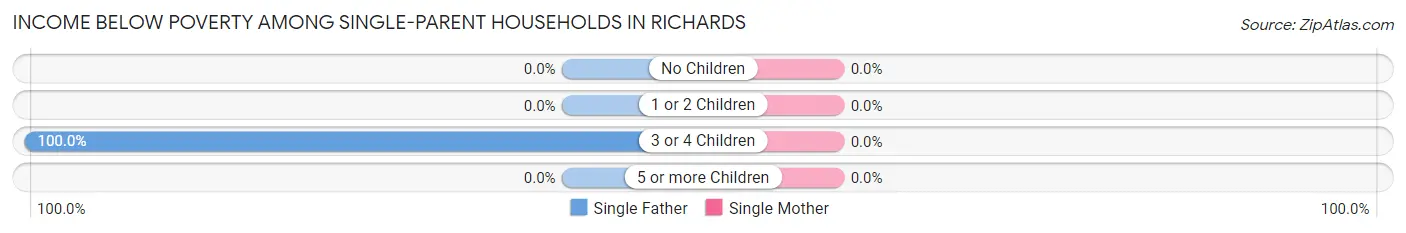
| Children | Single Father | Single Mother |
| No Children | 0 (0.0%) | 0 (0.0%) |
| 1 or 2 Children | 0 (0.0%) | 0 (0.0%) |
| 3 or 4 Children | 11 (100.0%) | 0 (0.0%) |
| 5 or more Children | 0 (0.0%) | 0 (0.0%) |
| Total | 11 (91.7%) | 0 (0.0%) |
Income Below Poverty Among Married-Couple vs Single-Parent Households in Richards
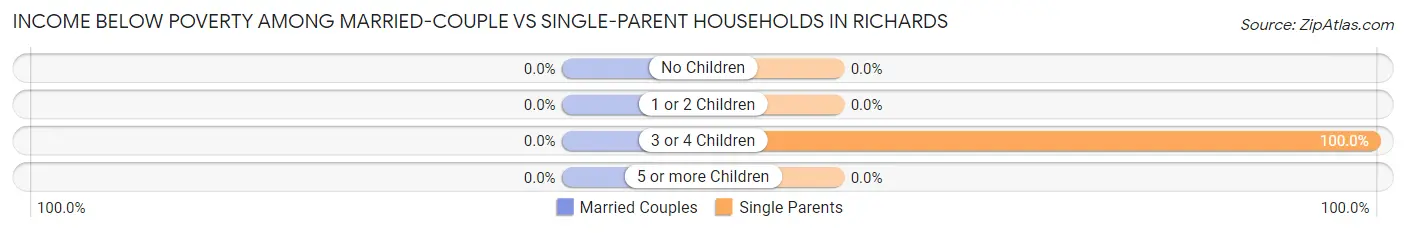
| Children | Married-Couple Families | Single-Parent Households |
| No Children | 0 (0.0%) | 0 (0.0%) |
| 1 or 2 Children | 0 (0.0%) | 0 (0.0%) |
| 3 or 4 Children | 0 (0.0%) | 11 (100.0%) |
| 5 or more Children | 0 (0.0%) | 0 (0.0%) |
| Total | 0 (0.0%) | 11 (91.7%) |
Race in Richards
The most populous races in Richards are White / Caucasian (131 | 94.9%), and Two or more Races (7 | 5.1%).
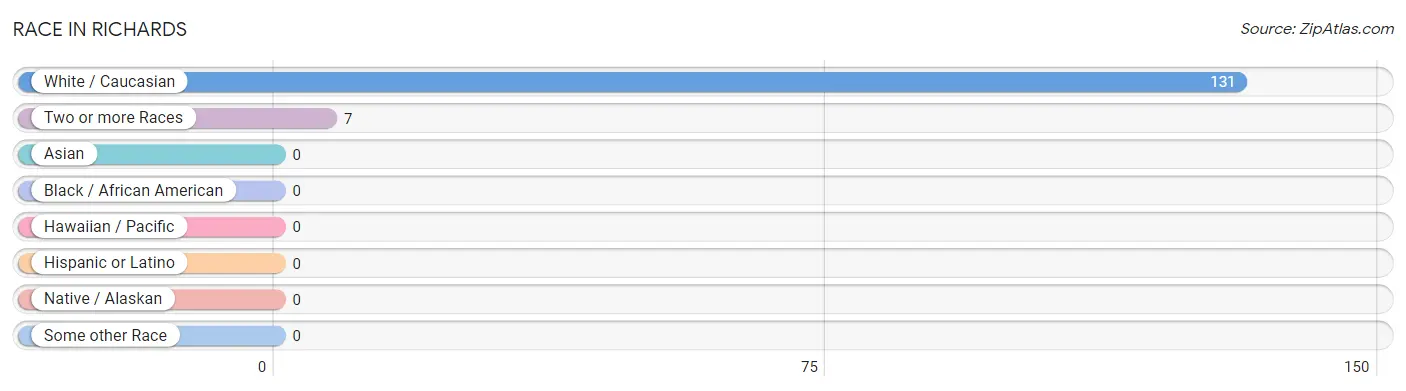
| Race | # Population | % Population |
| Asian | 0 | 0.0% |
| Black / African American | 0 | 0.0% |
| Hawaiian / Pacific | 0 | 0.0% |
| Hispanic or Latino | 0 | 0.0% |
| Native / Alaskan | 0 | 0.0% |
| White / Caucasian | 131 | 94.9% |
| Two or more Races | 7 | 5.1% |
| Some other Race | 0 | 0.0% |
| Total | 138 | 100.0% |
Ancestry in Richards
The most populous ancestries reported in Richards are Blackfeet (7 | 5.1%), Cherokee (7 | 5.1%), Irish (6 | 4.3%), English (1 | 0.7%), and French (1 | 0.7%), together accounting for 15.9% of all Richards residents.
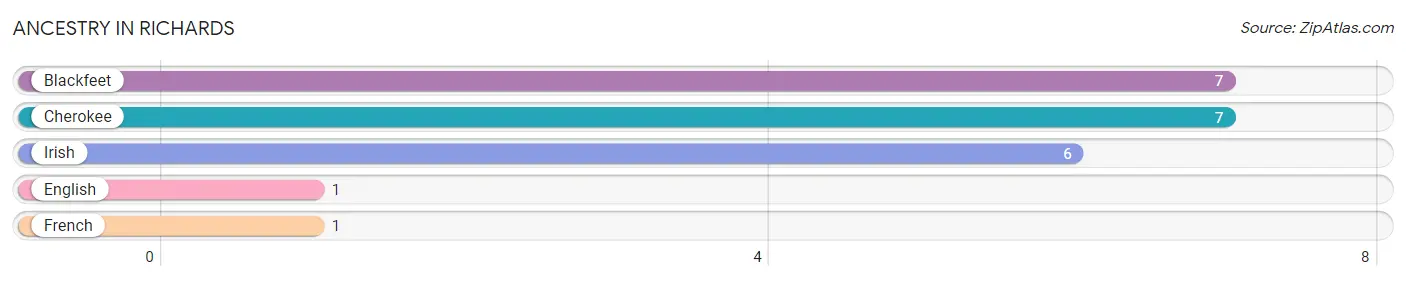
| Ancestry | # Population | % Population |
| Blackfeet | 7 | 5.1% |
| Cherokee | 7 | 5.1% |
| English | 1 | 0.7% |
| French | 1 | 0.7% |
| Irish | 6 | 4.3% | View All 5 Rows |
Immigrants in Richards

| Immigration Origin | # Population | % Population | View All 0 Rows |
Sex and Age in Richards
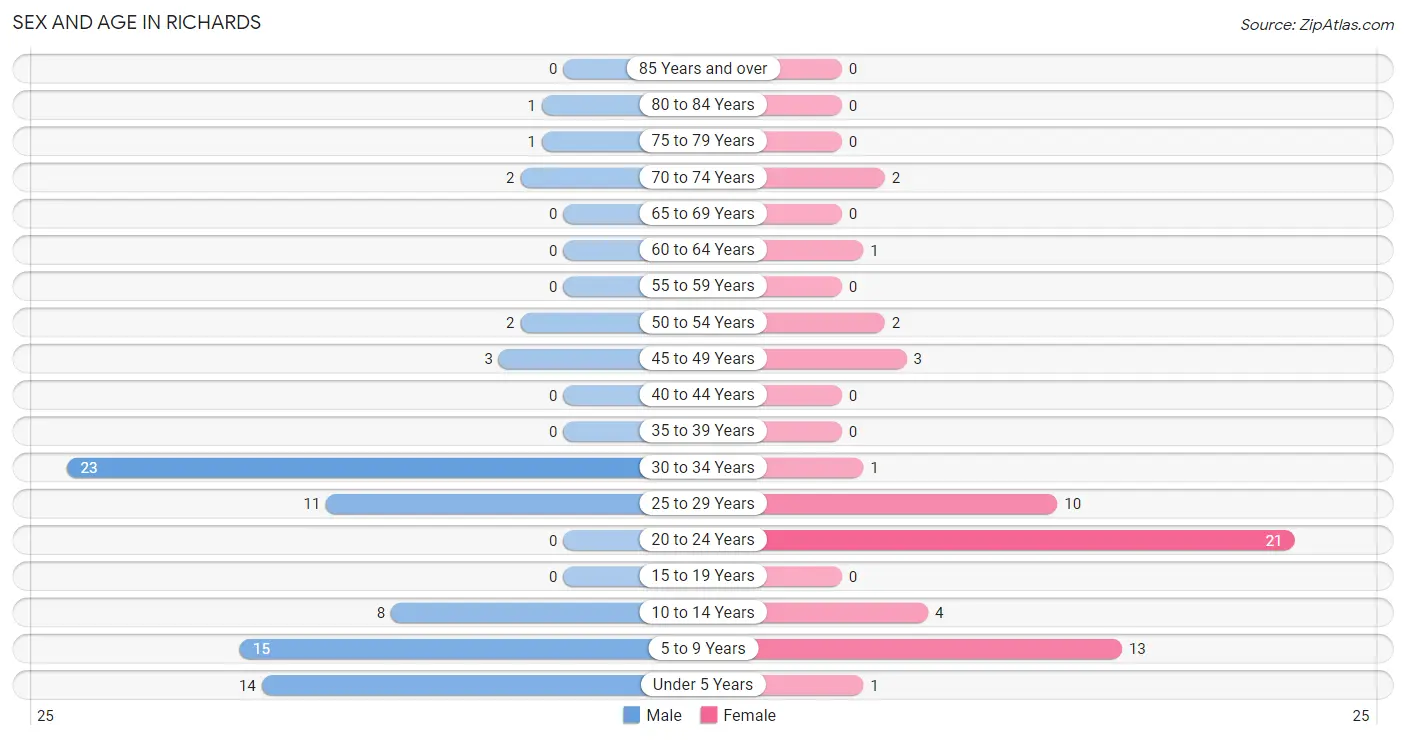
Sex and Age in Richards
The most populous age groups in Richards are 30 to 34 Years (23 | 28.7%) for men and 20 to 24 Years (21 | 36.2%) for women.
| Age Bracket | Male | Female |
| Under 5 Years | 14 (17.5%) | 1 (1.7%) |
| 5 to 9 Years | 15 (18.8%) | 13 (22.4%) |
| 10 to 14 Years | 8 (10.0%) | 4 (6.9%) |
| 15 to 19 Years | 0 (0.0%) | 0 (0.0%) |
| 20 to 24 Years | 0 (0.0%) | 21 (36.2%) |
| 25 to 29 Years | 11 (13.8%) | 10 (17.2%) |
| 30 to 34 Years | 23 (28.7%) | 1 (1.7%) |
| 35 to 39 Years | 0 (0.0%) | 0 (0.0%) |
| 40 to 44 Years | 0 (0.0%) | 0 (0.0%) |
| 45 to 49 Years | 3 (3.7%) | 3 (5.2%) |
| 50 to 54 Years | 2 (2.5%) | 2 (3.5%) |
| 55 to 59 Years | 0 (0.0%) | 0 (0.0%) |
| 60 to 64 Years | 0 (0.0%) | 1 (1.7%) |
| 65 to 69 Years | 0 (0.0%) | 0 (0.0%) |
| 70 to 74 Years | 2 (2.5%) | 2 (3.5%) |
| 75 to 79 Years | 1 (1.3%) | 0 (0.0%) |
| 80 to 84 Years | 1 (1.3%) | 0 (0.0%) |
| 85 Years and over | 0 (0.0%) | 0 (0.0%) |
| Total | 80 (100.0%) | 58 (100.0%) |
Families and Households in Richards
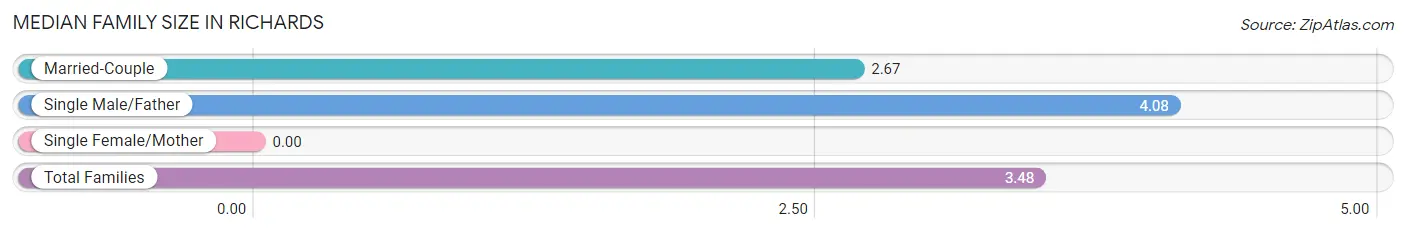
Median Family Size in Richards
| Family Type | # Families | Family Size |
| Married-Couple | 9 (42.9%) | 2.67 |
| Single Male/Father | 12 (57.1%) | 4.08 |
| Single Female/Mother | 0 (0.0%) | - |
| Total Families | 21 (100.0%) | 3.48 |
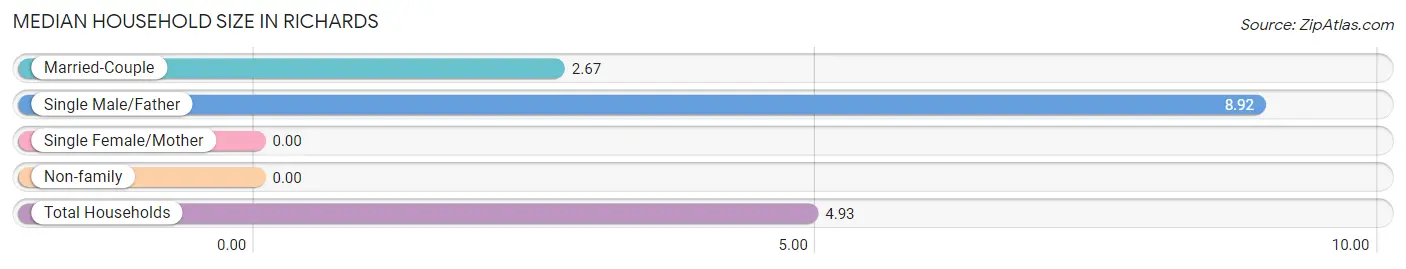
Median Household Size in Richards
| Household Type | # Households | Household Size |
| Married-Couple | 9 (32.1%) | 2.67 |
| Single Male/Father | 12 (42.9%) | 8.92 |
| Single Female/Mother | 0 (0.0%) | - |
| Non-family | 7 (25.0%) | - |
| Total Households | 28 (100.0%) | 4.93 |
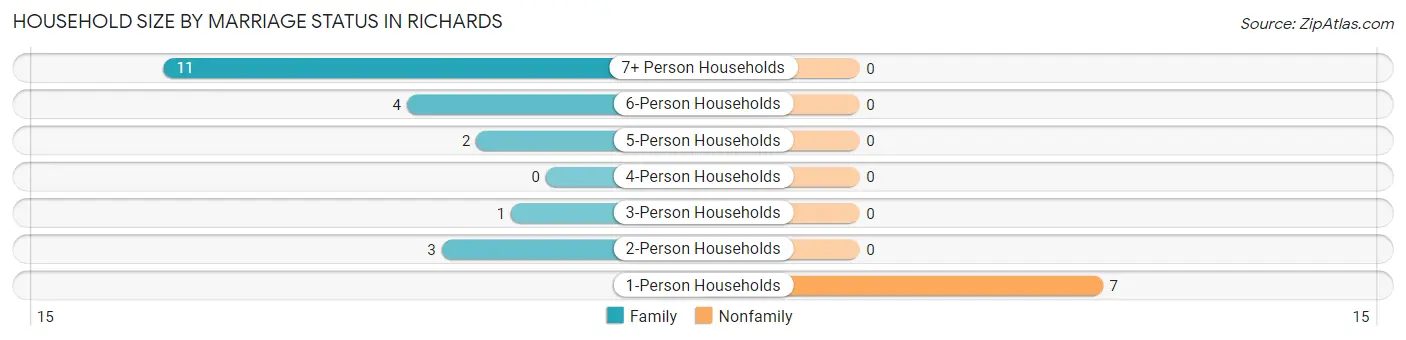
Household Size by Marriage Status in Richards
Out of a total of 28 households in Richards, 21 (75.0%) are family households, while 7 (25.0%) are nonfamily households. The most numerous type of family households are 7+ person households, comprising 11, and the most common type of nonfamily households are 1-person households, comprising 7.
| Household Size | Family Households | Nonfamily Households |
| 1-Person Households | - | 7 (25.0%) |
| 2-Person Households | 3 (10.7%) | 0 (0.0%) |
| 3-Person Households | 1 (3.6%) | 0 (0.0%) |
| 4-Person Households | 0 (0.0%) | 0 (0.0%) |
| 5-Person Households | 2 (7.1%) | 0 (0.0%) |
| 6-Person Households | 4 (14.3%) | 0 (0.0%) |
| 7+ Person Households | 11 (39.3%) | 0 (0.0%) |
| Total | 21 (75.0%) | 7 (25.0%) |
Female Fertility in Richards
Fertility by Age in Richards
Average fertility rate in Richards is 543.0 births per 1,000 women. Women in the age bracket of 20 to 34 years have the highest fertility rate with 594.0 births per 1,000 women. Women in the age bracket of 20 to 34 years acount for 100.0% of all women with births.
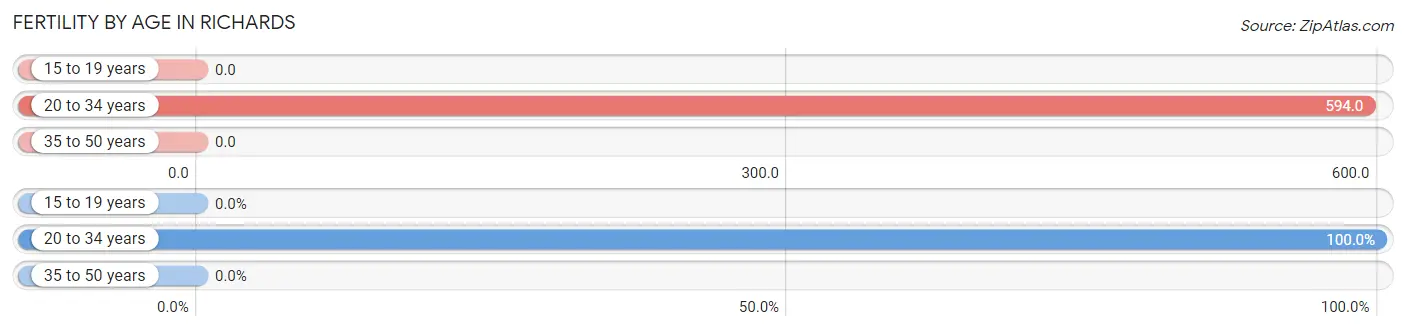
| Age Bracket | Women with Births | Births / 1,000 Women |
| 15 to 19 years | 0 (0.0%) | 0.0 |
| 20 to 34 years | 19 (100.0%) | 594.0 |
| 35 to 50 years | 0 (0.0%) | 0.0 |
| Total | 19 (100.0%) | 543.0 |
Fertility by Age by Marriage Status in Richards
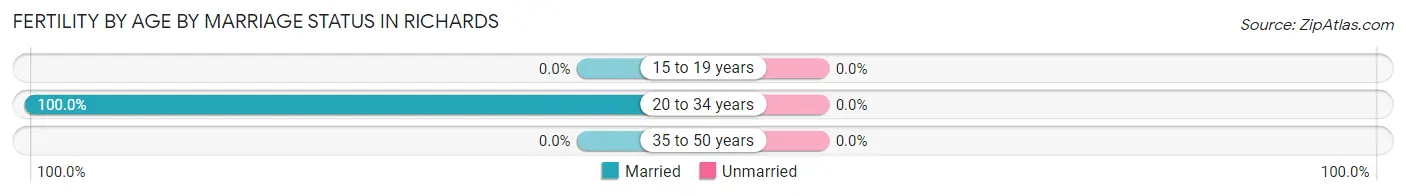
| Age Bracket | Married | Unmarried |
| 15 to 19 years | 0 (0.0%) | 0 (0.0%) |
| 20 to 34 years | 19 (100.0%) | 0 (0.0%) |
| 35 to 50 years | 0 (0.0%) | 0 (0.0%) |
| Total | 19 (100.0%) | 0 (0.0%) |
Fertility by Education in Richards
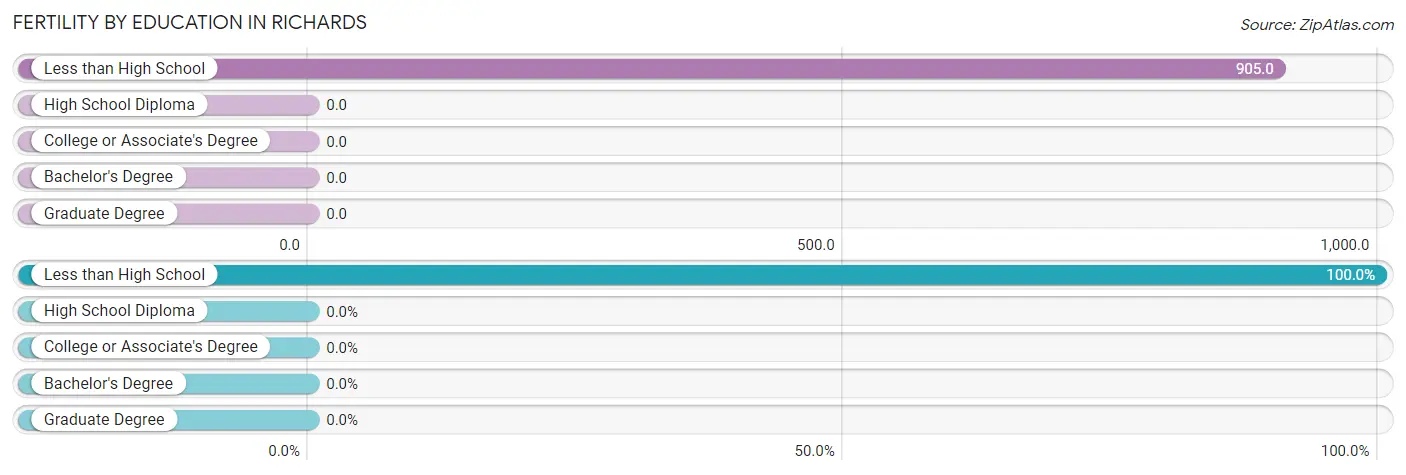
| Educational Attainment | Women with Births | Births / 1,000 Women |
| Less than High School | 19 (100.0%) | 905.0 |
| High School Diploma | 0 (0.0%) | 0.0 |
| College or Associate's Degree | 0 (0.0%) | 0.0 |
| Bachelor's Degree | 0 (0.0%) | 0.0 |
| Graduate Degree | 0 (0.0%) | 0.0 |
| Total | 19 (100.0%) | 543.0 |
Fertility by Education by Marriage Status in Richards
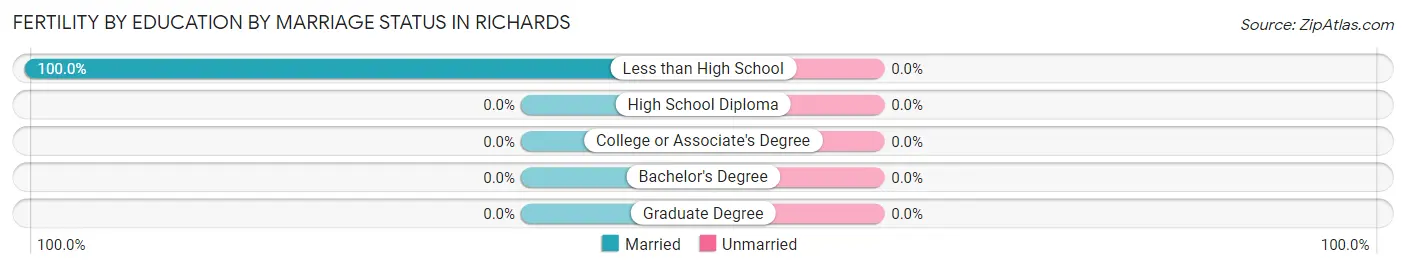
| Educational Attainment | Married | Unmarried |
| Less than High School | 19 (100.0%) | 0 (0.0%) |
| High School Diploma | 0 (0.0%) | 0 (0.0%) |
| College or Associate's Degree | 0 (0.0%) | 0 (0.0%) |
| Bachelor's Degree | 0 (0.0%) | 0 (0.0%) |
| Graduate Degree | 0 (0.0%) | 0 (0.0%) |
| Total | 19 (100.0%) | 0 (0.0%) |
Employment Characteristics in Richards
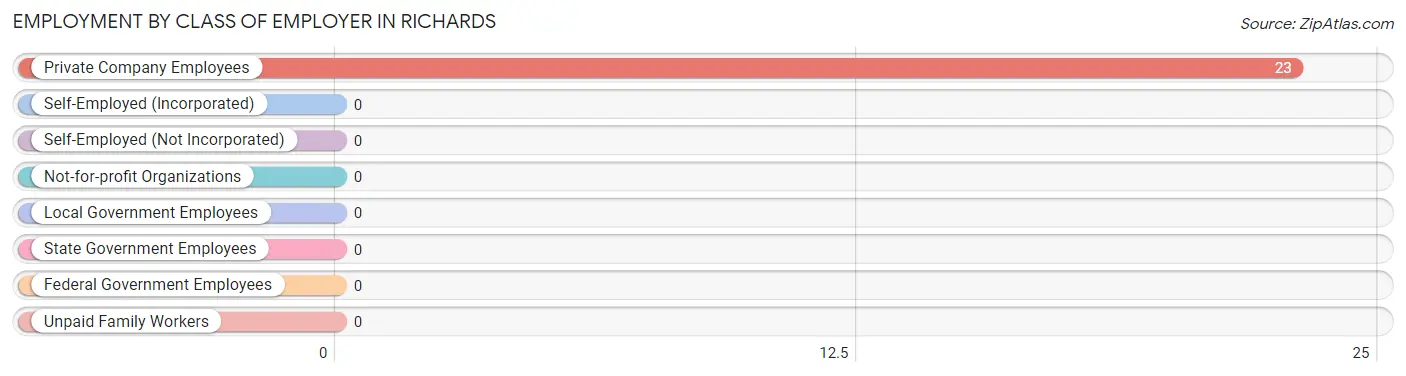
Employment by Class of Employer in Richards
Among the 23 employed individuals in Richards, , and private company employees (23 | 100.0%) make up the most common classes of employment.
| Employer Class | # Employees | % Employees |
| Private Company Employees | 23 | 100.0% |
| Self-Employed (Incorporated) | 0 | 0.0% |
| Self-Employed (Not Incorporated) | 0 | 0.0% |
| Not-for-profit Organizations | 0 | 0.0% |
| Local Government Employees | 0 | 0.0% |
| State Government Employees | 0 | 0.0% |
| Federal Government Employees | 0 | 0.0% |
| Unpaid Family Workers | 0 | 0.0% |
| Total | 23 | 100.0% |
Employment Status by Age in Richards
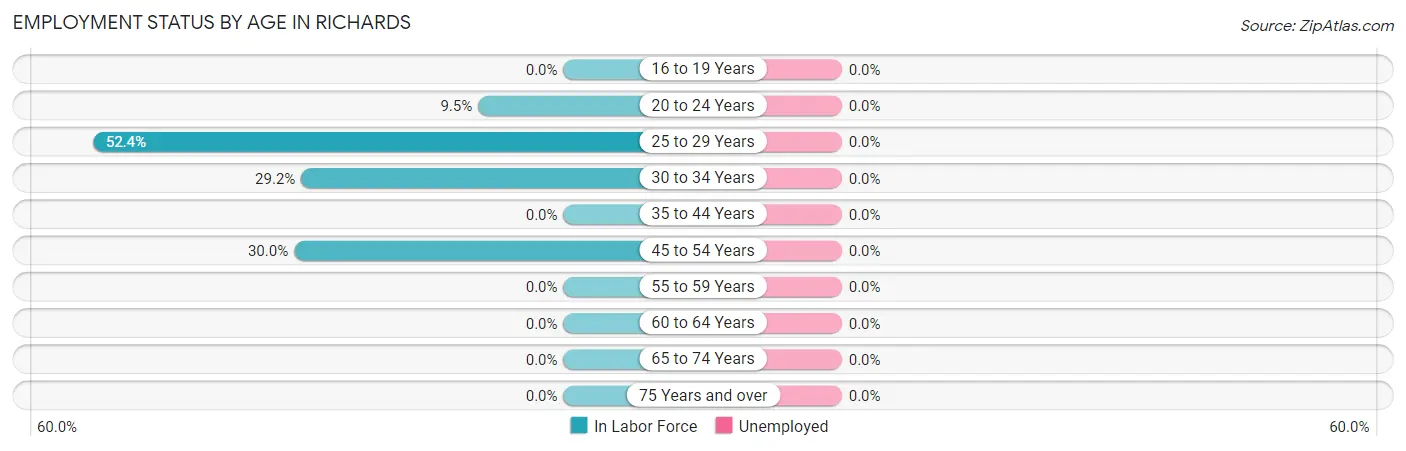
| Age Bracket | In Labor Force | Unemployed |
| 16 to 19 Years | 0 (0.0%) | 0 (0.0%) |
| 20 to 24 Years | 2 (9.5%) | 0 (0.0%) |
| 25 to 29 Years | 11 (52.4%) | 0 (0.0%) |
| 30 to 34 Years | 7 (29.2%) | 0 (0.0%) |
| 35 to 44 Years | 0 (0.0%) | 0 (0.0%) |
| 45 to 54 Years | 3 (30.0%) | 0 (0.0%) |
| 55 to 59 Years | 0 (0.0%) | 0 (0.0%) |
| 60 to 64 Years | 0 (0.0%) | 0 (0.0%) |
| 65 to 74 Years | 0 (0.0%) | 0 (0.0%) |
| 75 Years and over | 0 (0.0%) | 0 (0.0%) |
| Total | 23 (27.7%) | 0 (0.0%) |
Employment Status by Educational Attainment in Richards
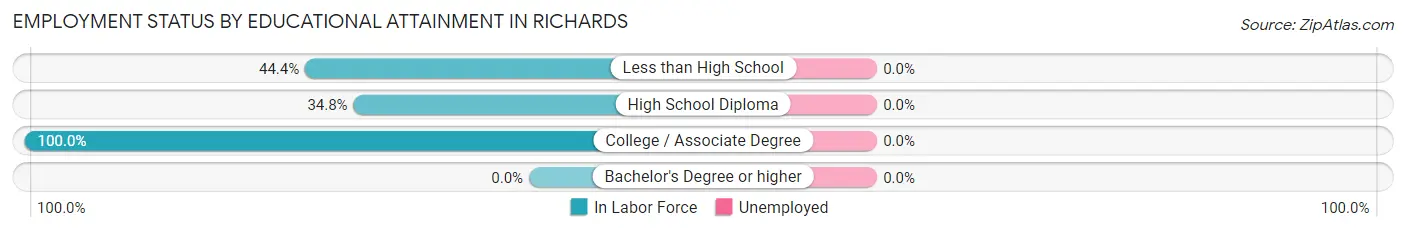
| Educational Attainment | In Labor Force | Unemployed |
| Less than High School | 4 (44.4%) | 0 (0.0%) |
| High School Diploma | 16 (34.8%) | 0 (0.0%) |
| College / Associate Degree | 1 (100.0%) | 0 (0.0%) |
| Bachelor's Degree or higher | 0 (0.0%) | 0 (0.0%) |
| Total | 21 (37.5%) | 0 (0.0%) |
Employment Occupations by Sex in Richards
Management, Business, Science and Arts Occupations
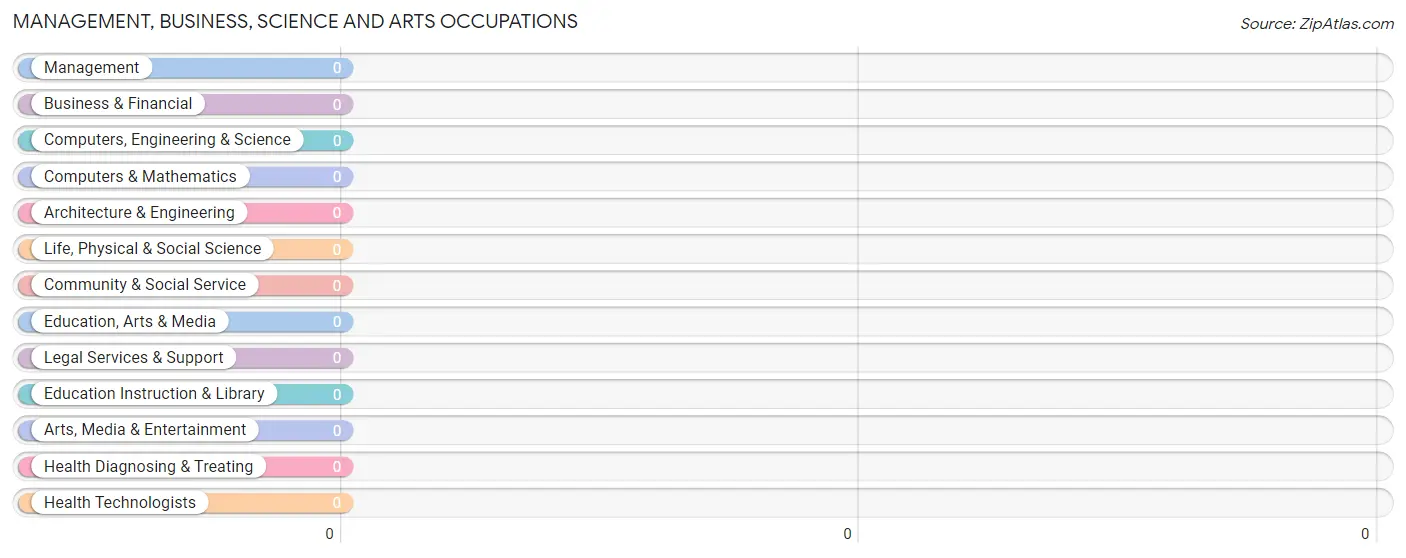
Management, Business, Science and Arts Occupations by Sex
| Occupation | Male | Female |
| Management | 0 (0.0%) | 0 (0.0%) |
| Business & Financial | 0 (0.0%) | 0 (0.0%) |
| Computers, Engineering & Science | 0 (0.0%) | 0 (0.0%) |
| Computers & Mathematics | 0 (0.0%) | 0 (0.0%) |
| Architecture & Engineering | 0 (0.0%) | 0 (0.0%) |
| Life, Physical & Social Science | 0 (0.0%) | 0 (0.0%) |
| Community & Social Service | 0 (0.0%) | 0 (0.0%) |
| Education, Arts & Media | 0 (0.0%) | 0 (0.0%) |
| Legal Services & Support | 0 (0.0%) | 0 (0.0%) |
| Education Instruction & Library | 0 (0.0%) | 0 (0.0%) |
| Arts, Media & Entertainment | 0 (0.0%) | 0 (0.0%) |
| Health Diagnosing & Treating | 0 (0.0%) | 0 (0.0%) |
| Health Technologists | 0 (0.0%) | 0 (0.0%) |
| Total (Category) | 0 (0.0%) | 0 (0.0%) |
| Total (Overall) | 17 (73.9%) | 6 (26.1%) |
Services Occupations
The most common Services occupations in Richards are , and Food Preparation & Serving (2 | 8.7%).
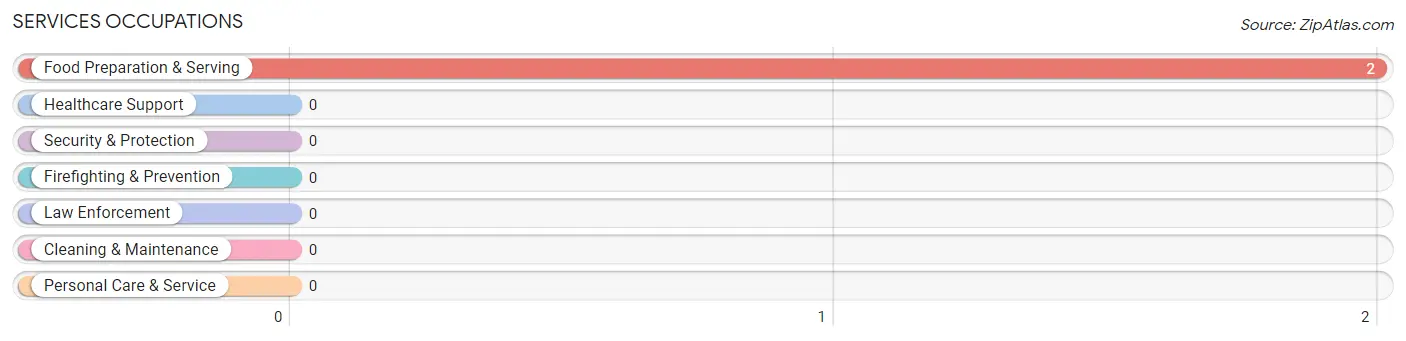
Services Occupations by Sex
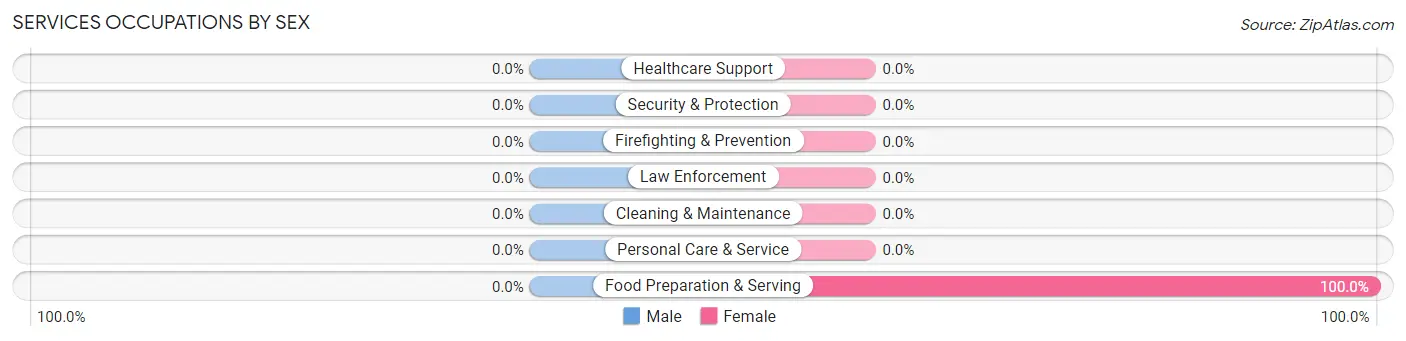
| Occupation | Male | Female |
| Healthcare Support | 0 (0.0%) | 0 (0.0%) |
| Security & Protection | 0 (0.0%) | 0 (0.0%) |
| Firefighting & Prevention | 0 (0.0%) | 0 (0.0%) |
| Law Enforcement | 0 (0.0%) | 0 (0.0%) |
| Food Preparation & Serving | 0 (0.0%) | 2 (100.0%) |
| Cleaning & Maintenance | 0 (0.0%) | 0 (0.0%) |
| Personal Care & Service | 0 (0.0%) | 0 (0.0%) |
| Total (Category) | 0 (0.0%) | 2 (100.0%) |
| Total (Overall) | 17 (73.9%) | 6 (26.1%) |
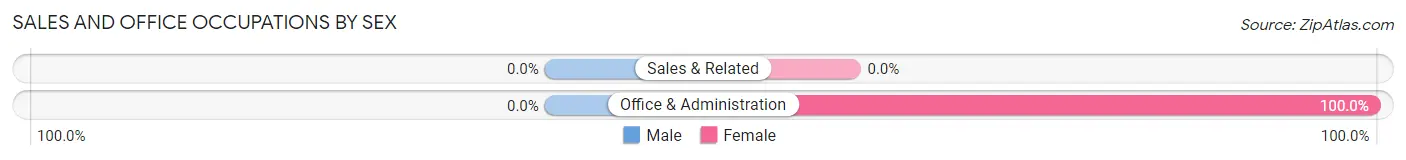
Sales and Office Occupations
The most common Sales and Office occupations in Richards are , and Office & Administration (1 | 4.3%).
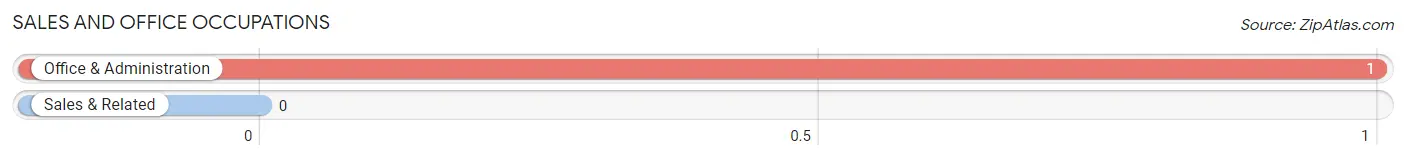
Sales and Office Occupations by Sex
| Occupation | Male | Female |
| Sales & Related | 0 (0.0%) | 0 (0.0%) |
| Office & Administration | 0 (0.0%) | 1 (100.0%) |
| Total (Category) | 0 (0.0%) | 1 (100.0%) |
| Total (Overall) | 17 (73.9%) | 6 (26.1%) |
Natural Resources, Construction and Maintenance Occupations
The most common Natural Resources, Construction and Maintenance occupations in Richards are , and Installation, Maintenance & Repair (11 | 47.8%).
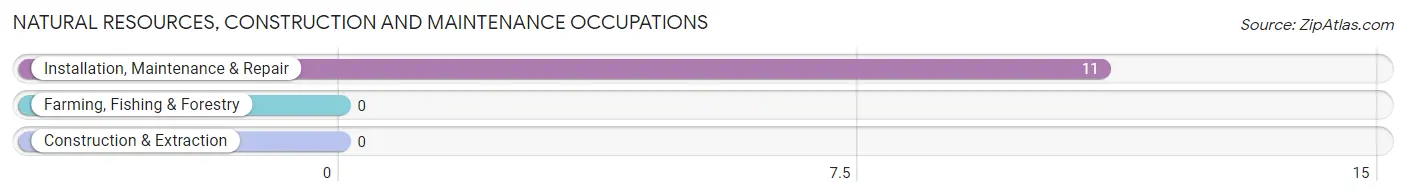
Natural Resources, Construction and Maintenance Occupations by Sex
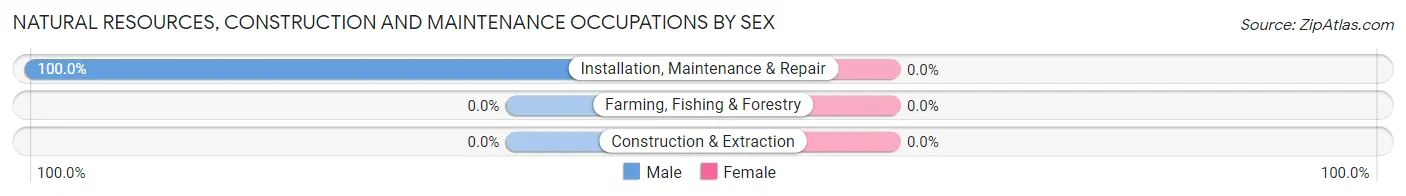
| Occupation | Male | Female |
| Farming, Fishing & Forestry | 0 (0.0%) | 0 (0.0%) |
| Construction & Extraction | 0 (0.0%) | 0 (0.0%) |
| Installation, Maintenance & Repair | 11 (100.0%) | 0 (0.0%) |
| Total (Category) | 11 (100.0%) | 0 (0.0%) |
| Total (Overall) | 17 (73.9%) | 6 (26.1%) |
Production, Transportation and Moving Occupations
The most common Production, Transportation and Moving occupations in Richards are Transportation (4 | 17.4%), Material Moving (3 | 13.0%), and Production (2 | 8.7%).
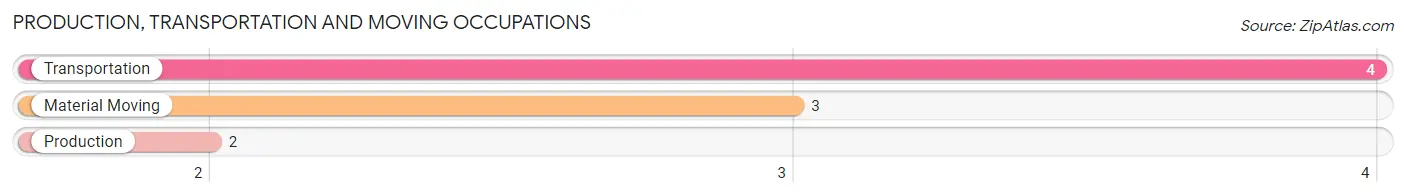
Production, Transportation and Moving Occupations by Sex
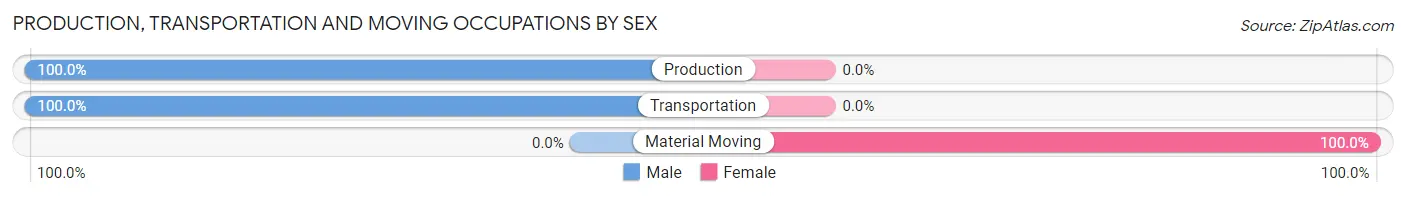
| Occupation | Male | Female |
| Production | 2 (100.0%) | 0 (0.0%) |
| Transportation | 4 (100.0%) | 0 (0.0%) |
| Material Moving | 0 (0.0%) | 3 (100.0%) |
| Total (Category) | 6 (66.7%) | 3 (33.3%) |
| Total (Overall) | 17 (73.9%) | 6 (26.1%) |
Employment Industries by Sex in Richards
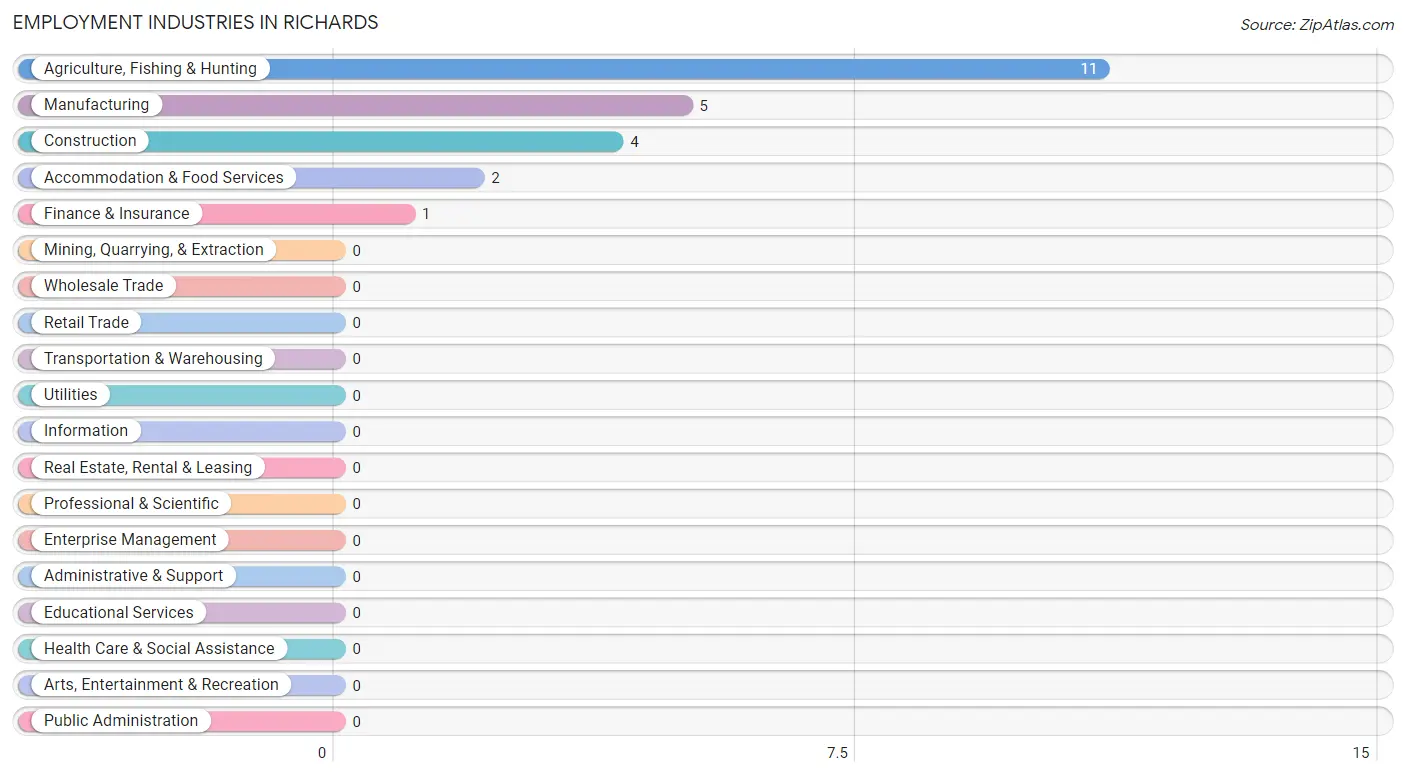
Employment Industries in Richards
The major employment industries in Richards include Agriculture, Fishing & Hunting (11 | 47.8%), Manufacturing (5 | 21.7%), Construction (4 | 17.4%), Accommodation & Food Services (2 | 8.7%), and Finance & Insurance (1 | 4.3%).
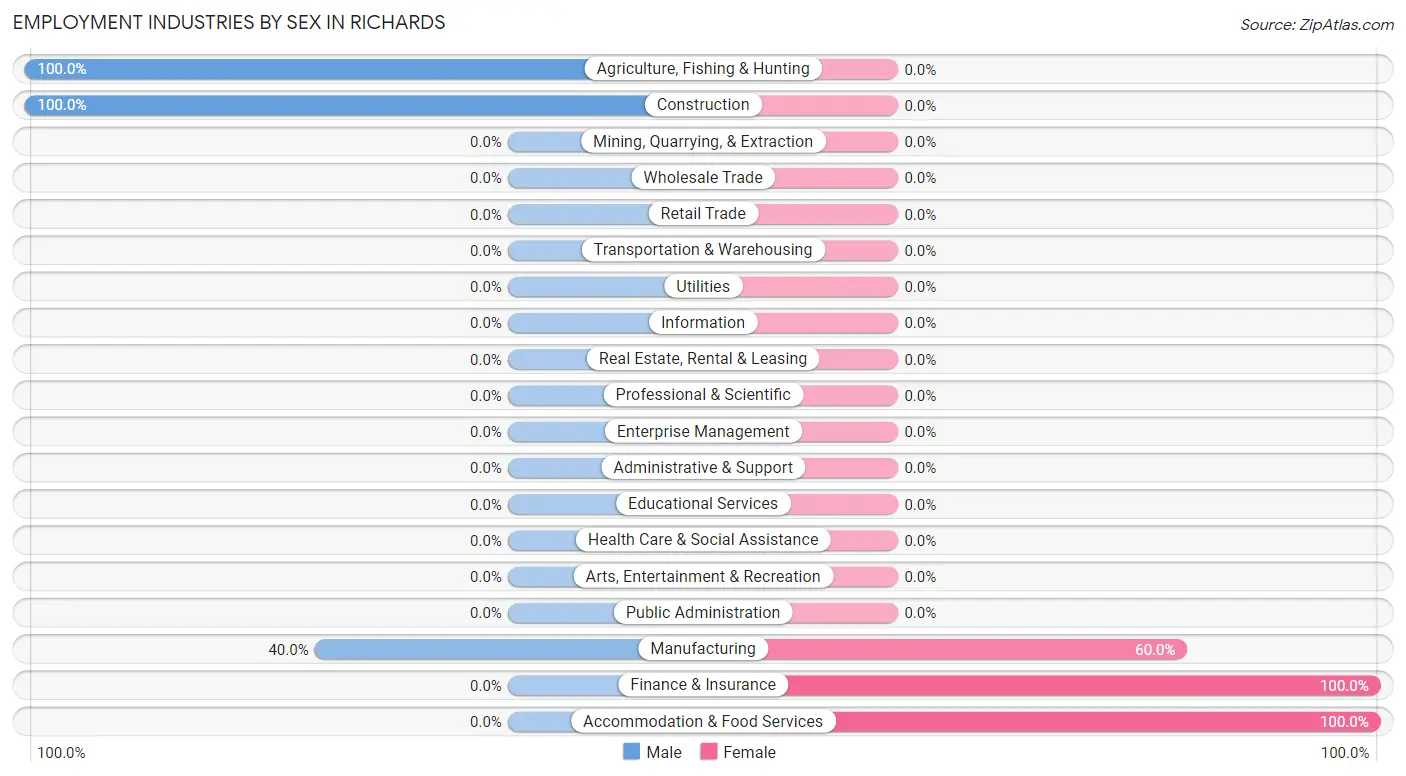
Employment Industries by Sex in Richards
The Richards industries that see more men than women are Agriculture, Fishing & Hunting (100.0%), Construction (100.0%), and Manufacturing (40.0%), whereas the industries that tend to have a higher number of women are Finance & Insurance (100.0%), Accommodation & Food Services (100.0%), and Manufacturing (60.0%).
| Industry | Male | Female |
| Agriculture, Fishing & Hunting | 11 (100.0%) | 0 (0.0%) |
| Mining, Quarrying, & Extraction | 0 (0.0%) | 0 (0.0%) |
| Construction | 4 (100.0%) | 0 (0.0%) |
| Manufacturing | 2 (40.0%) | 3 (60.0%) |
| Wholesale Trade | 0 (0.0%) | 0 (0.0%) |
| Retail Trade | 0 (0.0%) | 0 (0.0%) |
| Transportation & Warehousing | 0 (0.0%) | 0 (0.0%) |
| Utilities | 0 (0.0%) | 0 (0.0%) |
| Information | 0 (0.0%) | 0 (0.0%) |
| Finance & Insurance | 0 (0.0%) | 1 (100.0%) |
| Real Estate, Rental & Leasing | 0 (0.0%) | 0 (0.0%) |
| Professional & Scientific | 0 (0.0%) | 0 (0.0%) |
| Enterprise Management | 0 (0.0%) | 0 (0.0%) |
| Administrative & Support | 0 (0.0%) | 0 (0.0%) |
| Educational Services | 0 (0.0%) | 0 (0.0%) |
| Health Care & Social Assistance | 0 (0.0%) | 0 (0.0%) |
| Arts, Entertainment & Recreation | 0 (0.0%) | 0 (0.0%) |
| Accommodation & Food Services | 0 (0.0%) | 2 (100.0%) |
| Public Administration | 0 (0.0%) | 0 (0.0%) |
| Total | 17 (73.9%) | 6 (26.1%) |
Education in Richards
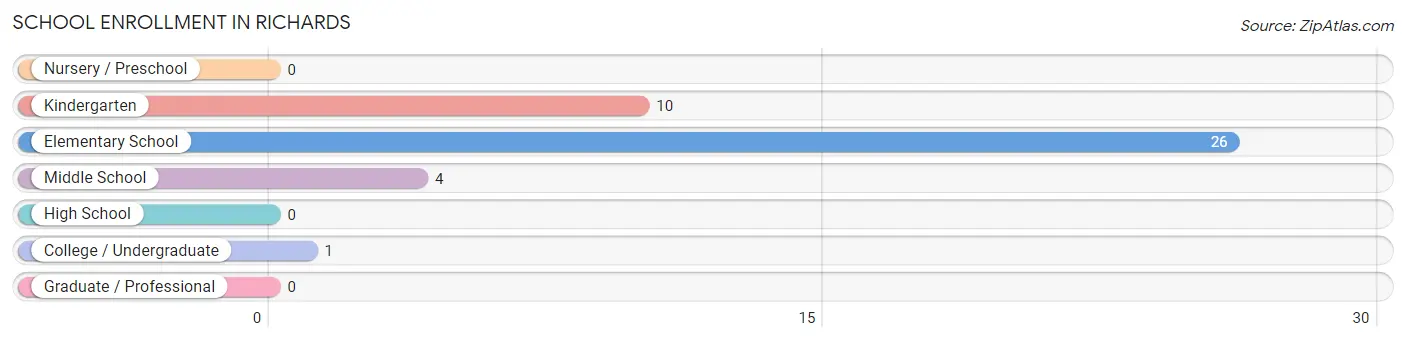
School Enrollment in Richards
The most common levels of schooling among the 41 students in Richards are elementary school (26 | 63.4%), kindergarten (10 | 24.4%), and middle school (4 | 9.8%).
| School Level | # Students | % Students |
| Nursery / Preschool | 0 | 0.0% |
| Kindergarten | 10 | 24.4% |
| Elementary School | 26 | 63.4% |
| Middle School | 4 | 9.8% |
| High School | 0 | 0.0% |
| College / Undergraduate | 1 | 2.4% |
| Graduate / Professional | 0 | 0.0% |
| Total | 41 | 100.0% |
School Enrollment by Age by Funding Source in Richards
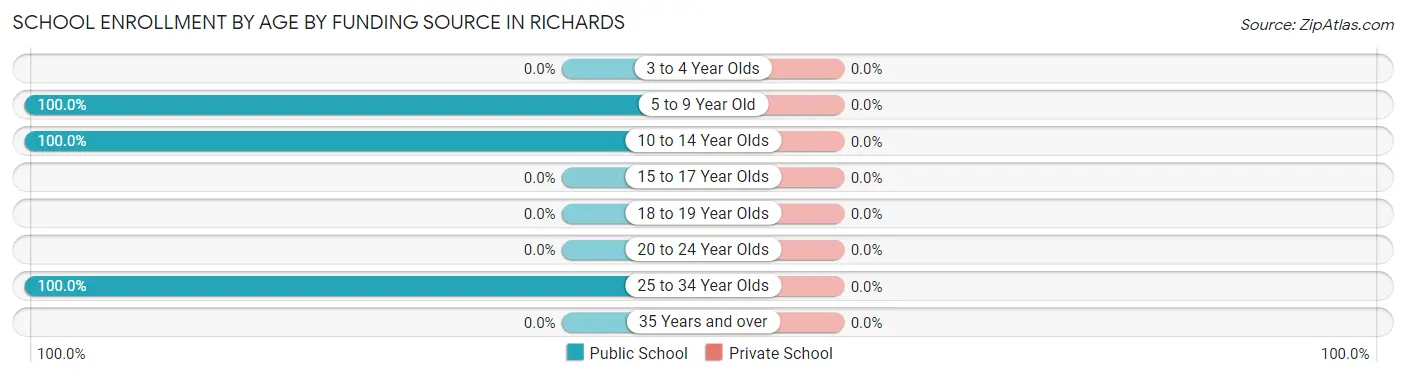
| Age Bracket | Public School | Private School |
| 3 to 4 Year Olds | 0 (0.0%) | 0 (0.0%) |
| 5 to 9 Year Old | 28 (100.0%) | 0 (0.0%) |
| 10 to 14 Year Olds | 12 (100.0%) | 0 (0.0%) |
| 15 to 17 Year Olds | 0 (0.0%) | 0 (0.0%) |
| 18 to 19 Year Olds | 0 (0.0%) | 0 (0.0%) |
| 20 to 24 Year Olds | 0 (0.0%) | 0 (0.0%) |
| 25 to 34 Year Olds | 1 (100.0%) | 0 (0.0%) |
| 35 Years and over | 0 (0.0%) | 0 (0.0%) |
| Total | 41 (100.0%) | 0 (0.0%) |
Educational Attainment by Field of Study in Richards
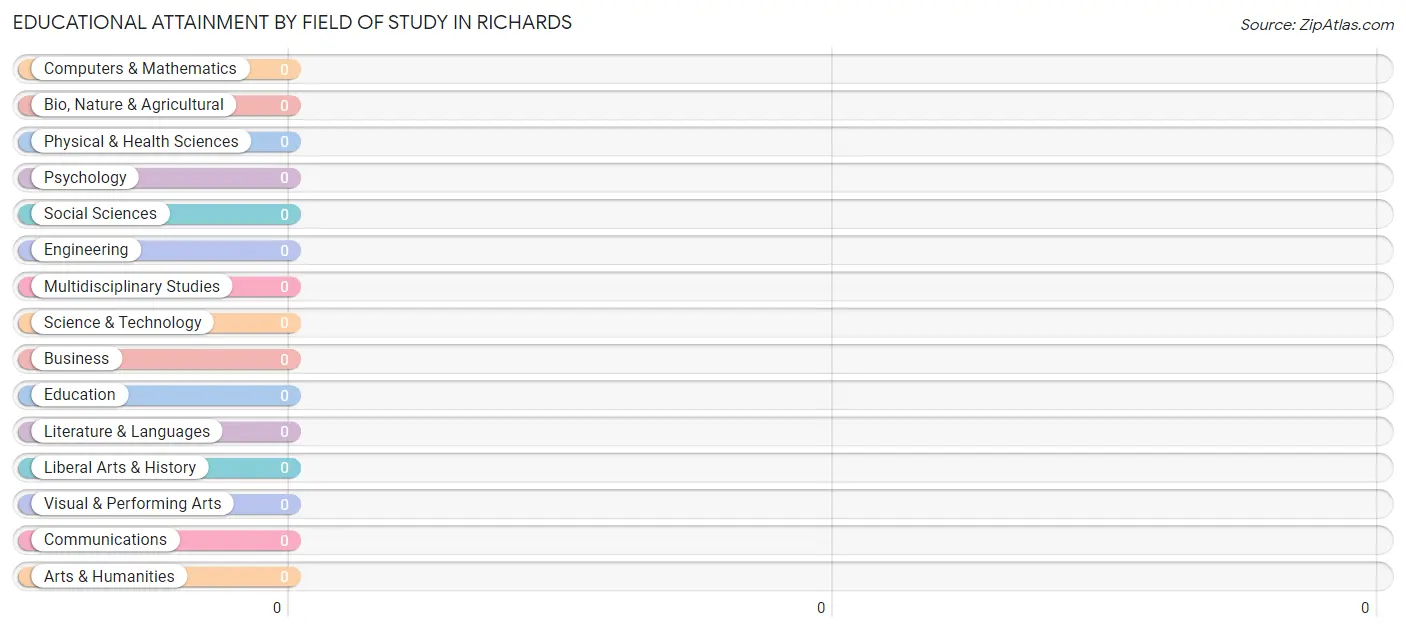
| Field of Study | # Graduates | % Graduates |
| Computers & Mathematics | 0 | 0.0% |
| Bio, Nature & Agricultural | 0 | 0.0% |
| Physical & Health Sciences | 0 | 0.0% |
| Psychology | 0 | 0.0% |
| Social Sciences | 0 | 0.0% |
| Engineering | 0 | 0.0% |
| Multidisciplinary Studies | 0 | 0.0% |
| Science & Technology | 0 | 0.0% |
| Business | 0 | 0.0% |
| Education | 0 | 0.0% |
| Literature & Languages | 0 | 0.0% |
| Liberal Arts & History | 0 | 0.0% |
| Visual & Performing Arts | 0 | 0.0% |
| Communications | 0 | 0.0% |
| Arts & Humanities | 0 | 0.0% |
| Total | 0 | 0.0% |
Transportation & Commute in Richards
Vehicle Availability by Sex in Richards
The most prevalent vehicle ownership categories in Richards are males with 4 vehicles (11, accounting for 64.7%) and females with 4 vehicles (0, making up 183.3%).
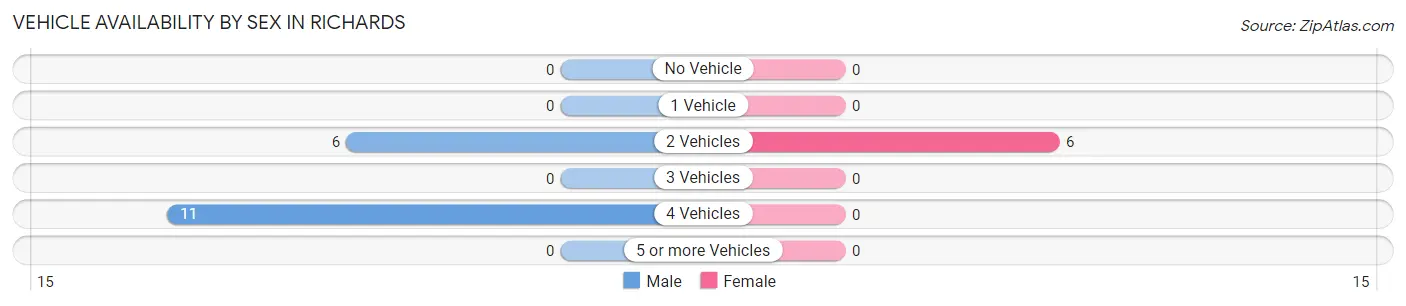
| Vehicles Available | Male | Female |
| No Vehicle | 0 (0.0%) | 0 (0.0%) |
| 1 Vehicle | 0 (0.0%) | 0 (0.0%) |
| 2 Vehicles | 6 (35.3%) | 6 (100.0%) |
| 3 Vehicles | 0 (0.0%) | 0 (0.0%) |
| 4 Vehicles | 11 (64.7%) | 0 (0.0%) |
| 5 or more Vehicles | 0 (0.0%) | 0 (0.0%) |
| Total | 17 (100.0%) | 6 (100.0%) |
Commute Time in Richards
The most frequently occuring commute durations in Richards are 5 to 9 minutes (11 commuters, 50.0%), 20 to 24 minutes (4 commuters, 18.2%), and 35 to 39 minutes (4 commuters, 18.2%).
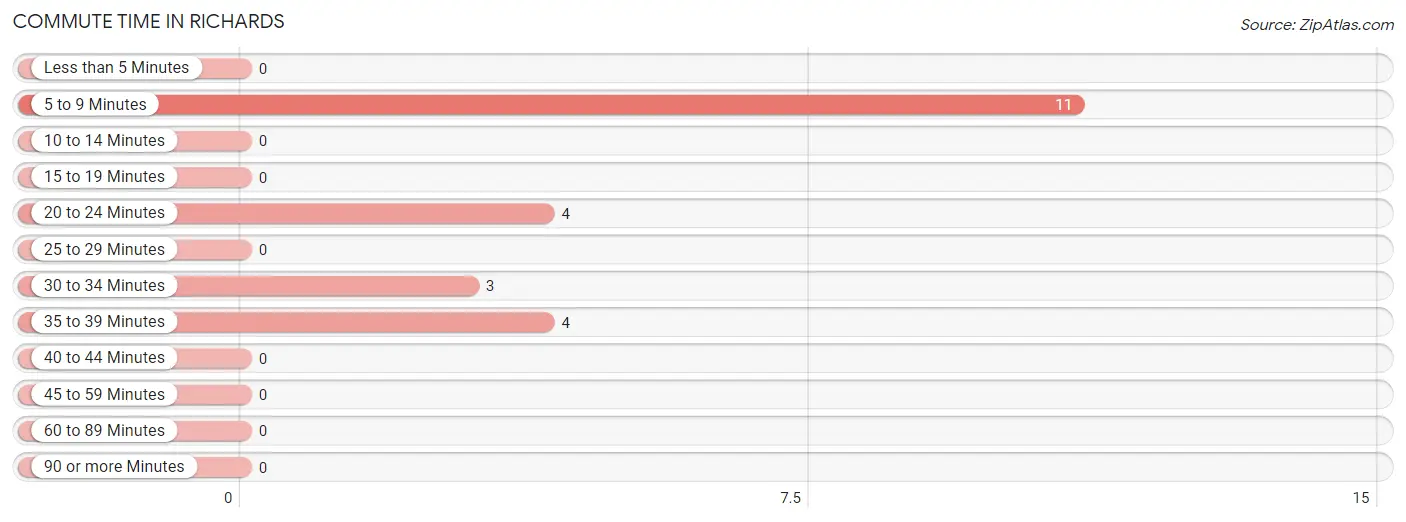
| Commute Time | # Commuters | % Commuters |
| Less than 5 Minutes | 0 | 0.0% |
| 5 to 9 Minutes | 11 | 50.0% |
| 10 to 14 Minutes | 0 | 0.0% |
| 15 to 19 Minutes | 0 | 0.0% |
| 20 to 24 Minutes | 4 | 18.2% |
| 25 to 29 Minutes | 0 | 0.0% |
| 30 to 34 Minutes | 3 | 13.6% |
| 35 to 39 Minutes | 4 | 18.2% |
| 40 to 44 Minutes | 0 | 0.0% |
| 45 to 59 Minutes | 0 | 0.0% |
| 60 to 89 Minutes | 0 | 0.0% |
| 90 or more Minutes | 0 | 0.0% |
Commute Time by Sex in Richards
The most common commute times in Richards are 5 to 9 minutes (11 commuters, 64.7%) for males and 30 to 34 minutes (3 commuters, 60.0%) for females.
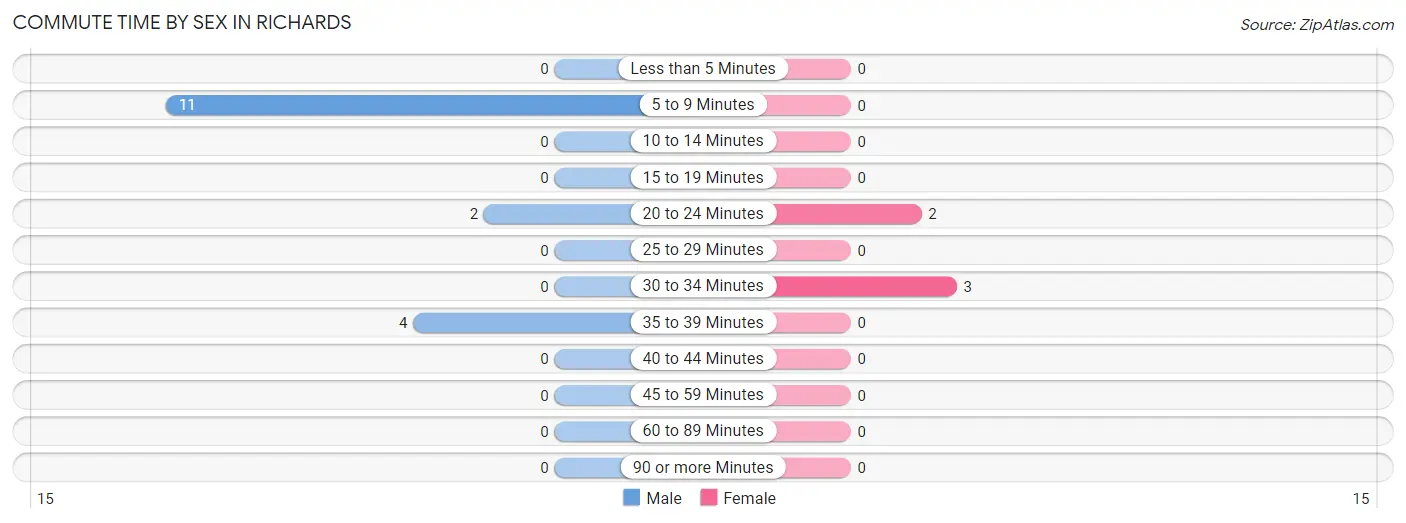
| Commute Time | Male | Female |
| Less than 5 Minutes | 0 (0.0%) | 0 (0.0%) |
| 5 to 9 Minutes | 11 (64.7%) | 0 (0.0%) |
| 10 to 14 Minutes | 0 (0.0%) | 0 (0.0%) |
| 15 to 19 Minutes | 0 (0.0%) | 0 (0.0%) |
| 20 to 24 Minutes | 2 (11.8%) | 2 (40.0%) |
| 25 to 29 Minutes | 0 (0.0%) | 0 (0.0%) |
| 30 to 34 Minutes | 0 (0.0%) | 3 (60.0%) |
| 35 to 39 Minutes | 4 (23.5%) | 0 (0.0%) |
| 40 to 44 Minutes | 0 (0.0%) | 0 (0.0%) |
| 45 to 59 Minutes | 0 (0.0%) | 0 (0.0%) |
| 60 to 89 Minutes | 0 (0.0%) | 0 (0.0%) |
| 90 or more Minutes | 0 (0.0%) | 0 (0.0%) |
Time of Departure to Work by Sex in Richards
The most frequent times of departure to work in Richards are 12:00 AM to 4:59 AM (13, 76.5%) for males and 5:30 AM to 5:59 AM (3, 60.0%) for females.
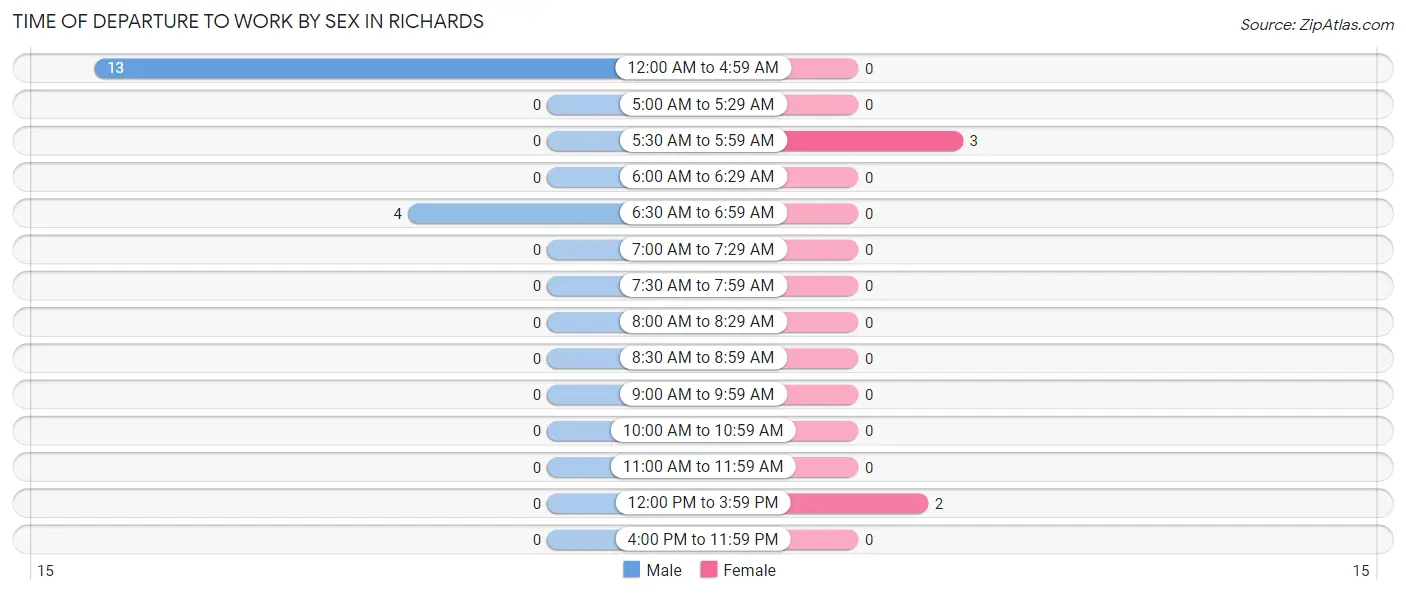
| Time of Departure | Male | Female |
| 12:00 AM to 4:59 AM | 13 (76.5%) | 0 (0.0%) |
| 5:00 AM to 5:29 AM | 0 (0.0%) | 0 (0.0%) |
| 5:30 AM to 5:59 AM | 0 (0.0%) | 3 (60.0%) |
| 6:00 AM to 6:29 AM | 0 (0.0%) | 0 (0.0%) |
| 6:30 AM to 6:59 AM | 4 (23.5%) | 0 (0.0%) |
| 7:00 AM to 7:29 AM | 0 (0.0%) | 0 (0.0%) |
| 7:30 AM to 7:59 AM | 0 (0.0%) | 0 (0.0%) |
| 8:00 AM to 8:29 AM | 0 (0.0%) | 0 (0.0%) |
| 8:30 AM to 8:59 AM | 0 (0.0%) | 0 (0.0%) |
| 9:00 AM to 9:59 AM | 0 (0.0%) | 0 (0.0%) |
| 10:00 AM to 10:59 AM | 0 (0.0%) | 0 (0.0%) |
| 11:00 AM to 11:59 AM | 0 (0.0%) | 0 (0.0%) |
| 12:00 PM to 3:59 PM | 0 (0.0%) | 2 (40.0%) |
| 4:00 PM to 11:59 PM | 0 (0.0%) | 0 (0.0%) |
| Total | 17 (100.0%) | 5 (100.0%) |
Housing Occupancy in Richards
Occupancy by Ownership in Richards
Of the total 28 dwellings in Richards, owner-occupied units account for 21 (75.0%), while renter-occupied units make up 7 (25.0%).
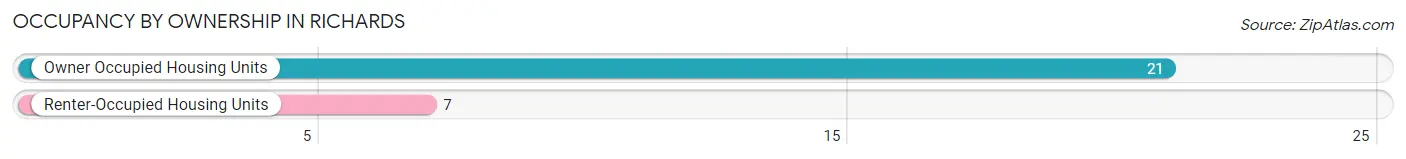
| Occupancy | # Housing Units | % Housing Units |
| Owner Occupied Housing Units | 21 | 75.0% |
| Renter-Occupied Housing Units | 7 | 25.0% |
| Total Occupied Housing Units | 28 | 100.0% |
Occupancy by Household Size in Richards
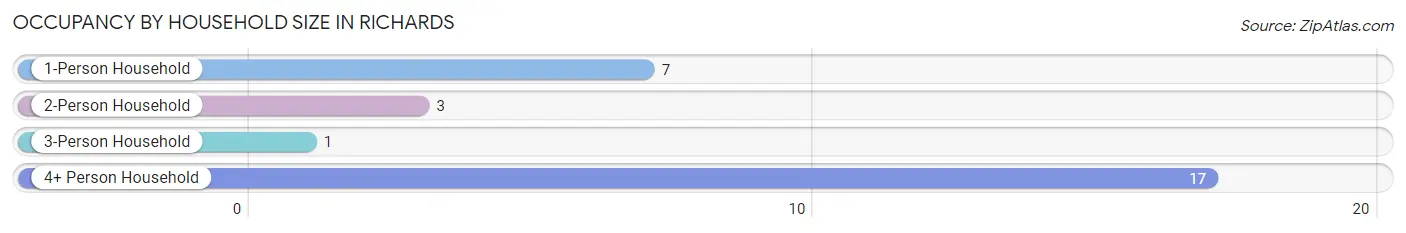
| Household Size | # Housing Units | % Housing Units |
| 1-Person Household | 7 | 25.0% |
| 2-Person Household | 3 | 10.7% |
| 3-Person Household | 1 | 3.6% |
| 4+ Person Household | 17 | 60.7% |
| Total Housing Units | 28 | 100.0% |
Occupancy by Ownership by Household Size in Richards
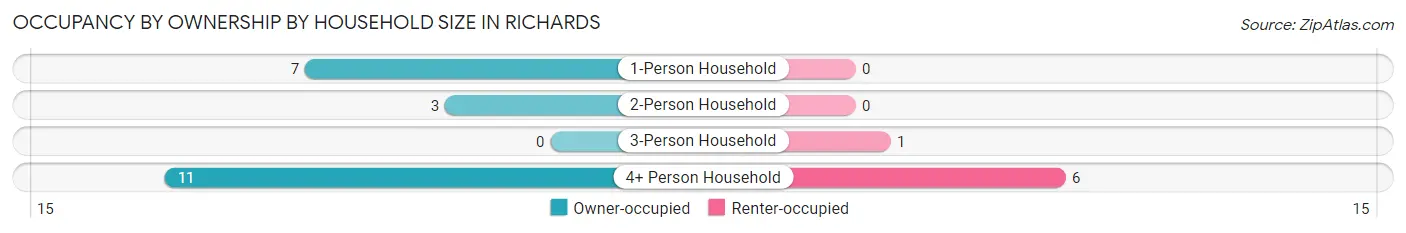
| Household Size | Owner-occupied | Renter-occupied |
| 1-Person Household | 7 (100.0%) | 0 (0.0%) |
| 2-Person Household | 3 (100.0%) | 0 (0.0%) |
| 3-Person Household | 0 (0.0%) | 1 (100.0%) |
| 4+ Person Household | 11 (64.7%) | 6 (35.3%) |
| Total Housing Units | 21 (75.0%) | 7 (25.0%) |
Occupancy by Educational Attainment in Richards
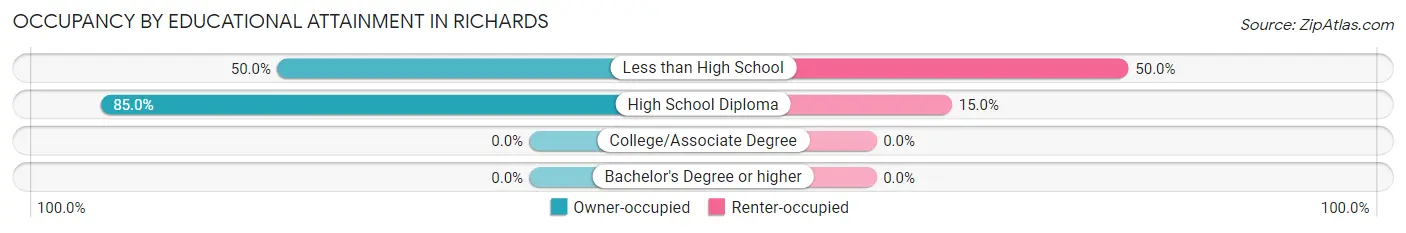
| Household Size | Owner-occupied | Renter-occupied |
| Less than High School | 4 (50.0%) | 4 (50.0%) |
| High School Diploma | 17 (85.0%) | 3 (15.0%) |
| College/Associate Degree | 0 (0.0%) | 0 (0.0%) |
| Bachelor's Degree or higher | 0 (0.0%) | 0 (0.0%) |
Occupancy by Age of Householder in Richards
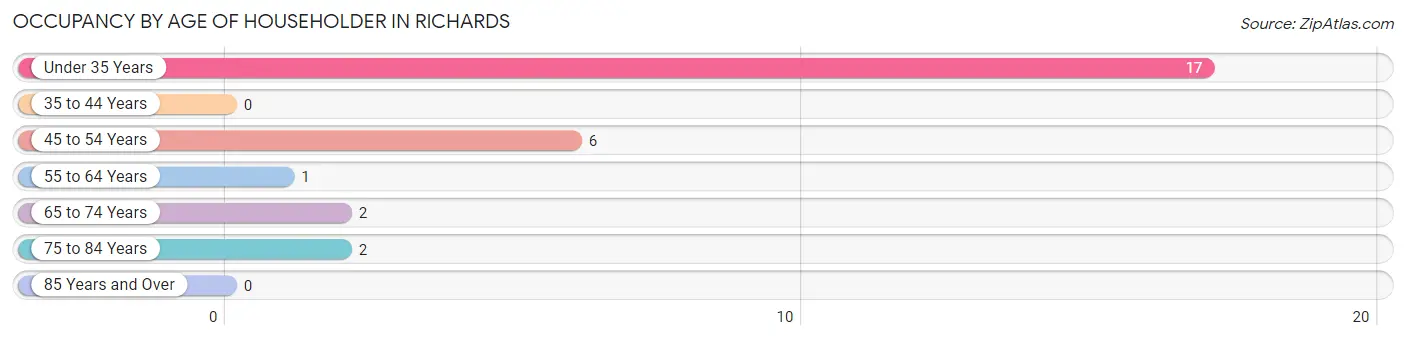
| Age Bracket | # Households | % Households |
| Under 35 Years | 17 | 60.7% |
| 35 to 44 Years | 0 | 0.0% |
| 45 to 54 Years | 6 | 21.4% |
| 55 to 64 Years | 1 | 3.6% |
| 65 to 74 Years | 2 | 7.1% |
| 75 to 84 Years | 2 | 7.1% |
| 85 Years and Over | 0 | 0.0% |
| Total | 28 | 100.0% |
Housing Finances in Richards
Median Income by Occupancy in Richards
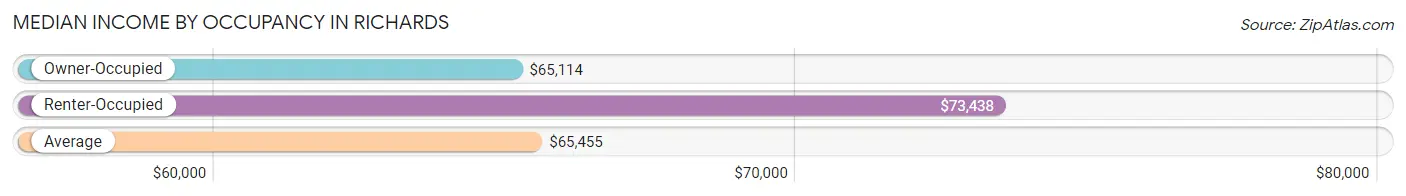
| Occupancy Type | # Households | Median Income |
| Owner-Occupied | 21 (75.0%) | $65,114 |
| Renter-Occupied | 7 (25.0%) | $73,438 |
| Average | 28 (100.0%) | $65,455 |
Occupancy by Householder Income Bracket in Richards
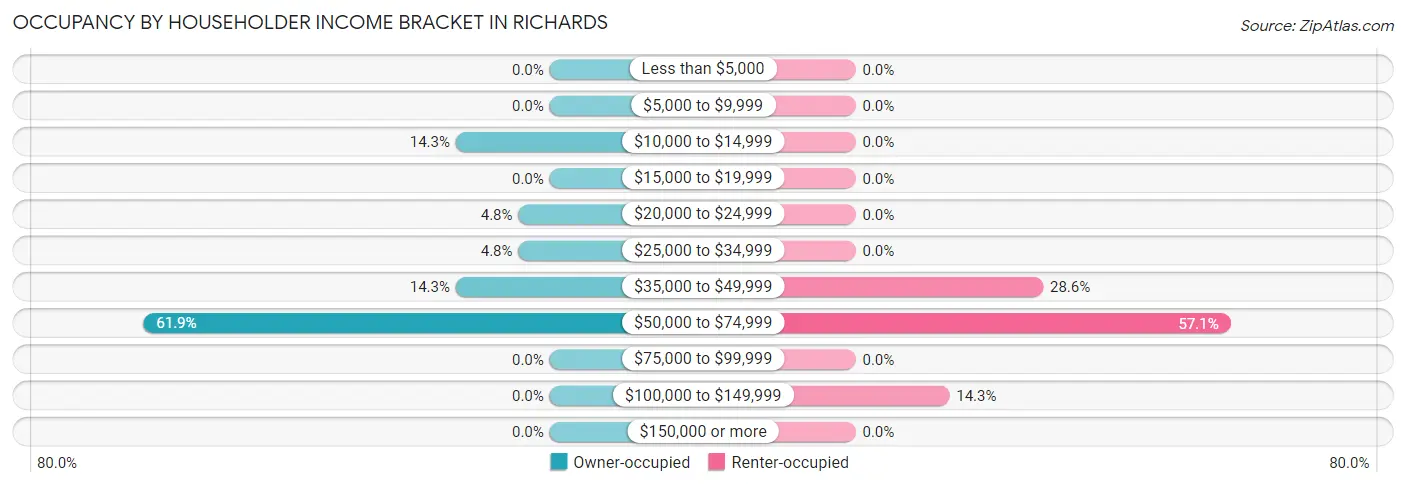
| Income Bracket | Owner-occupied | Renter-occupied |
| Less than $5,000 | 0 (0.0%) | 0 (0.0%) |
| $5,000 to $9,999 | 0 (0.0%) | 0 (0.0%) |
| $10,000 to $14,999 | 3 (14.3%) | 0 (0.0%) |
| $15,000 to $19,999 | 0 (0.0%) | 0 (0.0%) |
| $20,000 to $24,999 | 1 (4.8%) | 0 (0.0%) |
| $25,000 to $34,999 | 1 (4.8%) | 0 (0.0%) |
| $35,000 to $49,999 | 3 (14.3%) | 2 (28.6%) |
| $50,000 to $74,999 | 13 (61.9%) | 4 (57.1%) |
| $75,000 to $99,999 | 0 (0.0%) | 0 (0.0%) |
| $100,000 to $149,999 | 0 (0.0%) | 1 (14.3%) |
| $150,000 or more | 0 (0.0%) | 0 (0.0%) |
| Total | 21 (100.0%) | 7 (100.0%) |
Monthly Housing Cost Tiers in Richards
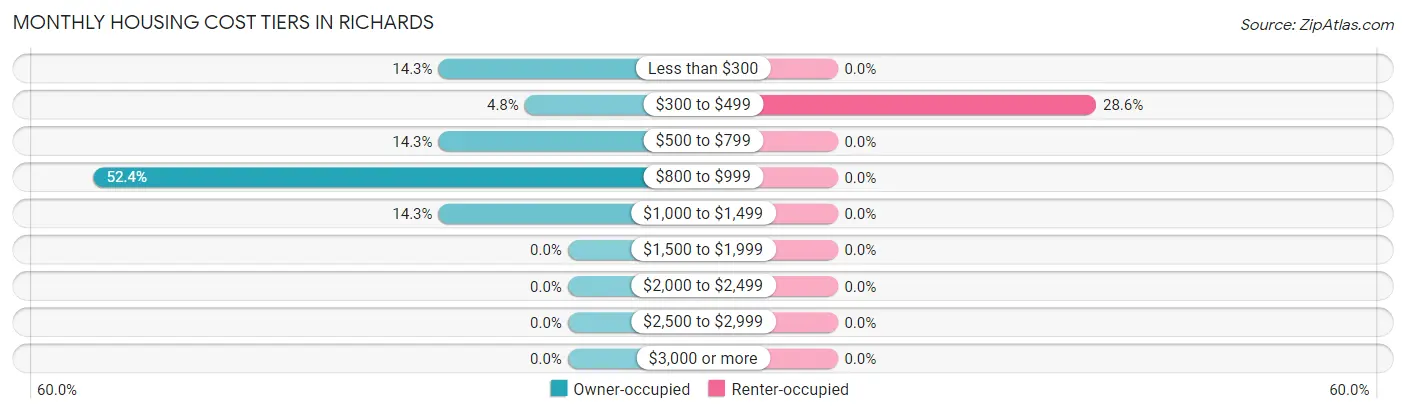
| Monthly Cost | Owner-occupied | Renter-occupied |
| Less than $300 | 3 (14.3%) | 0 (0.0%) |
| $300 to $499 | 1 (4.8%) | 2 (28.6%) |
| $500 to $799 | 3 (14.3%) | 0 (0.0%) |
| $800 to $999 | 11 (52.4%) | 0 (0.0%) |
| $1,000 to $1,499 | 3 (14.3%) | 0 (0.0%) |
| $1,500 to $1,999 | 0 (0.0%) | 0 (0.0%) |
| $2,000 to $2,499 | 0 (0.0%) | 0 (0.0%) |
| $2,500 to $2,999 | 0 (0.0%) | 0 (0.0%) |
| $3,000 or more | 0 (0.0%) | 0 (0.0%) |
| Total | 21 (100.0%) | 7 (100.0%) |
Physical Housing Characteristics in Richards
Housing Structures in Richards
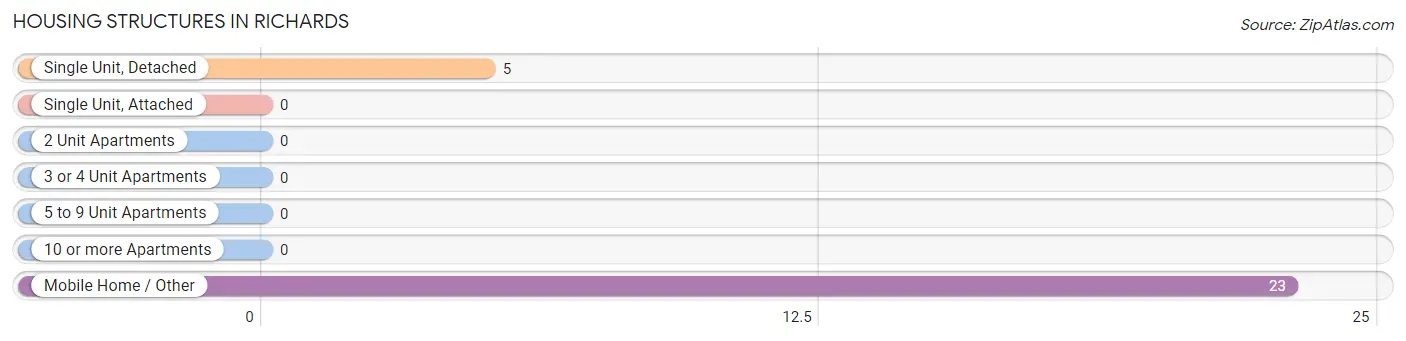
| Structure Type | # Housing Units | % Housing Units |
| Single Unit, Detached | 5 | 17.9% |
| Single Unit, Attached | 0 | 0.0% |
| 2 Unit Apartments | 0 | 0.0% |
| 3 or 4 Unit Apartments | 0 | 0.0% |
| 5 to 9 Unit Apartments | 0 | 0.0% |
| 10 or more Apartments | 0 | 0.0% |
| Mobile Home / Other | 23 | 82.1% |
| Total | 28 | 100.0% |
Housing Structures by Occupancy in Richards
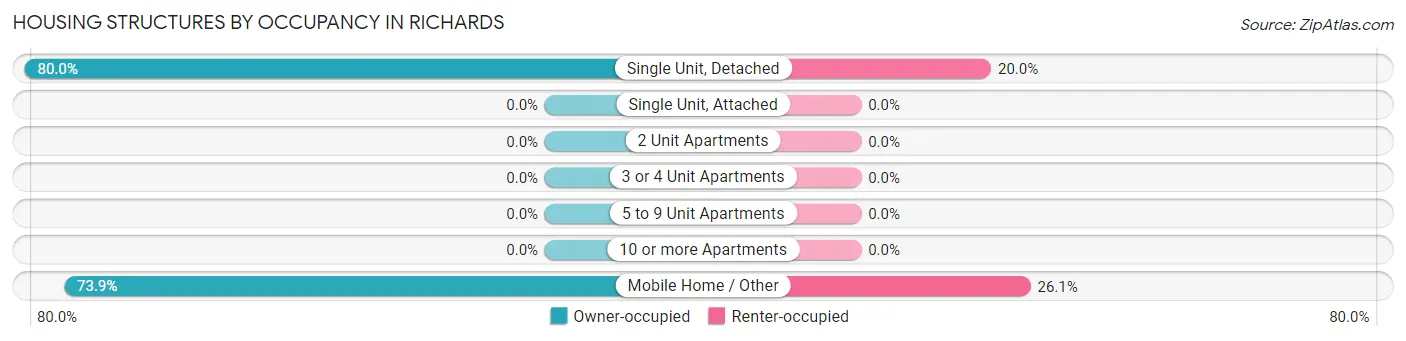
| Structure Type | Owner-occupied | Renter-occupied |
| Single Unit, Detached | 4 (80.0%) | 1 (20.0%) |
| Single Unit, Attached | 0 (0.0%) | 0 (0.0%) |
| 2 Unit Apartments | 0 (0.0%) | 0 (0.0%) |
| 3 or 4 Unit Apartments | 0 (0.0%) | 0 (0.0%) |
| 5 to 9 Unit Apartments | 0 (0.0%) | 0 (0.0%) |
| 10 or more Apartments | 0 (0.0%) | 0 (0.0%) |
| Mobile Home / Other | 17 (73.9%) | 6 (26.1%) |
| Total | 21 (75.0%) | 7 (25.0%) |
Housing Structures by Number of Rooms in Richards
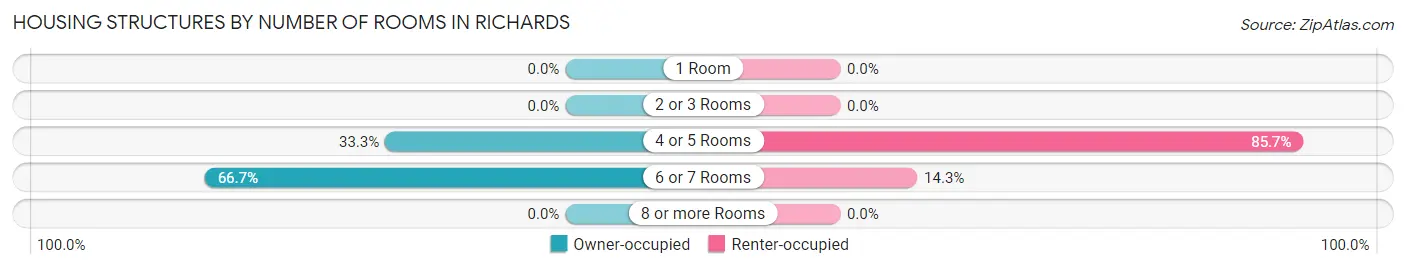
| Number of Rooms | Owner-occupied | Renter-occupied |
| 1 Room | 0 (0.0%) | 0 (0.0%) |
| 2 or 3 Rooms | 0 (0.0%) | 0 (0.0%) |
| 4 or 5 Rooms | 7 (33.3%) | 6 (85.7%) |
| 6 or 7 Rooms | 14 (66.7%) | 1 (14.3%) |
| 8 or more Rooms | 0 (0.0%) | 0 (0.0%) |
| Total | 21 (100.0%) | 7 (100.0%) |
Housing Structure by Heating Type in Richards
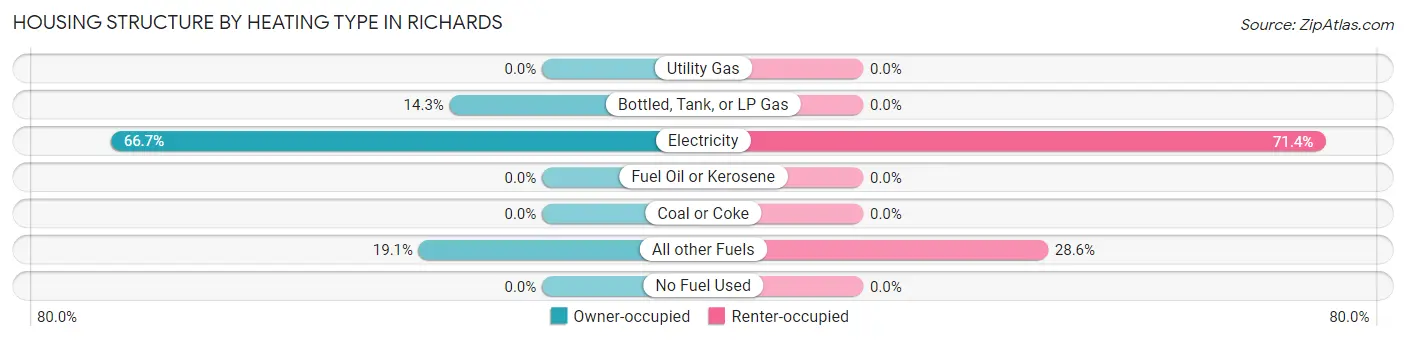
| Heating Type | Owner-occupied | Renter-occupied |
| Utility Gas | 0 (0.0%) | 0 (0.0%) |
| Bottled, Tank, or LP Gas | 3 (14.3%) | 0 (0.0%) |
| Electricity | 14 (66.7%) | 5 (71.4%) |
| Fuel Oil or Kerosene | 0 (0.0%) | 0 (0.0%) |
| Coal or Coke | 0 (0.0%) | 0 (0.0%) |
| All other Fuels | 4 (19.1%) | 2 (28.6%) |
| No Fuel Used | 0 (0.0%) | 0 (0.0%) |
| Total | 21 (100.0%) | 7 (100.0%) |
Household Vehicle Usage in Richards
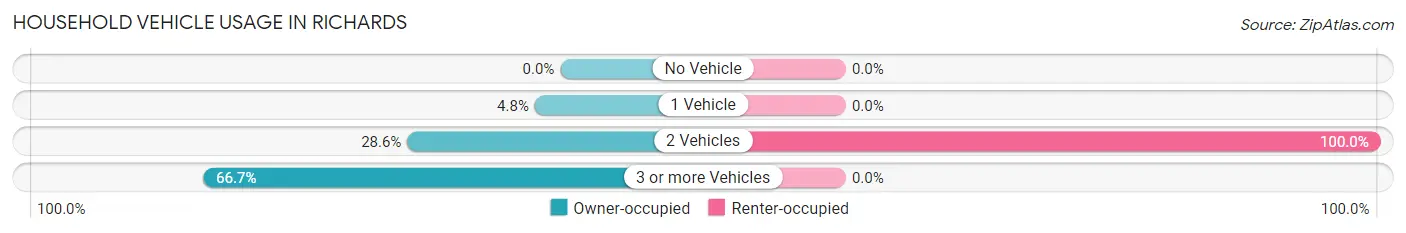
| Vehicles per Household | Owner-occupied | Renter-occupied |
| No Vehicle | 0 (0.0%) | 0 (0.0%) |
| 1 Vehicle | 1 (4.8%) | 0 (0.0%) |
| 2 Vehicles | 6 (28.6%) | 7 (100.0%) |
| 3 or more Vehicles | 14 (66.7%) | 0 (0.0%) |
| Total | 21 (100.0%) | 7 (100.0%) |
Real Estate & Mortgages in Richards
Real Estate and Mortgage Overview in Richards
| Characteristic | Without Mortgage | With Mortgage |
| Housing Units | 7 | 14 |
| Median Property Value | - | - |
| Median Household Income | - | - |
| Monthly Housing Costs | - | - |
| Real Estate Taxes | $500 | $0 |
Property Value by Mortgage Status in Richards
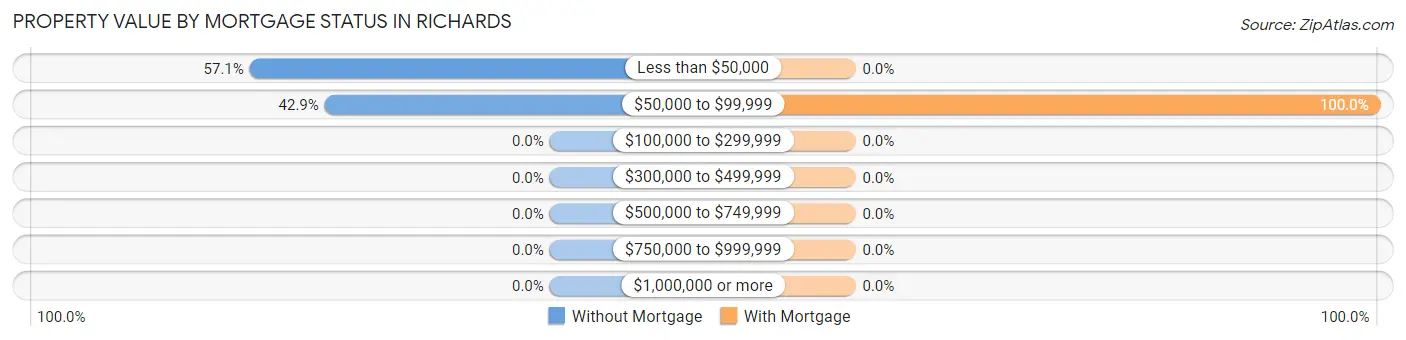
| Property Value | Without Mortgage | With Mortgage |
| Less than $50,000 | 4 (57.1%) | 0 (0.0%) |
| $50,000 to $99,999 | 3 (42.9%) | 14 (100.0%) |
| $100,000 to $299,999 | 0 (0.0%) | 0 (0.0%) |
| $300,000 to $499,999 | 0 (0.0%) | 0 (0.0%) |
| $500,000 to $749,999 | 0 (0.0%) | 0 (0.0%) |
| $750,000 to $999,999 | 0 (0.0%) | 0 (0.0%) |
| $1,000,000 or more | 0 (0.0%) | 0 (0.0%) |
| Total | 7 (100.0%) | 14 (100.0%) |
Household Income by Mortgage Status in Richards
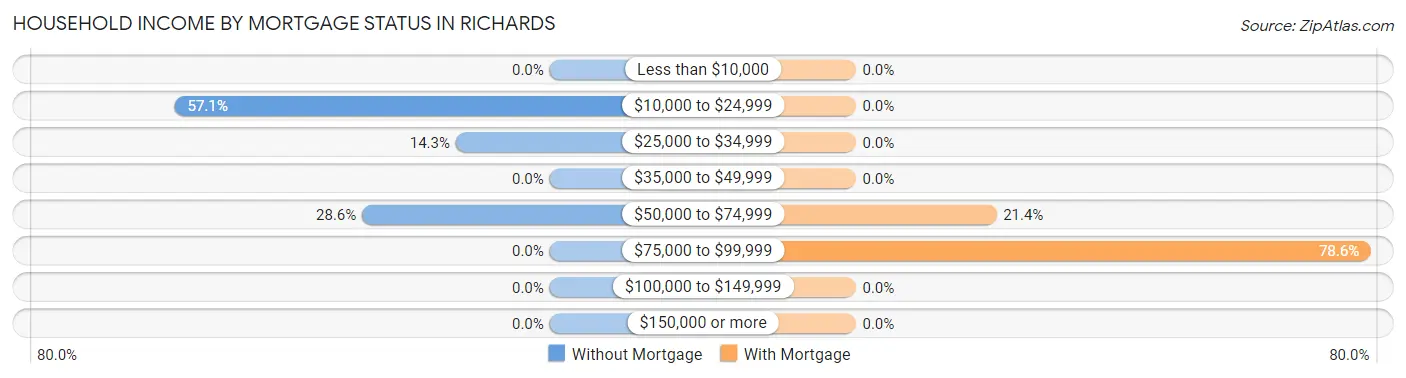
| Household Income | Without Mortgage | With Mortgage |
| Less than $10,000 | 0 (0.0%) | 0 (0.0%) |
| $10,000 to $24,999 | 4 (57.1%) | 0 (0.0%) |
| $25,000 to $34,999 | 1 (14.3%) | 0 (0.0%) |
| $35,000 to $49,999 | 0 (0.0%) | 0 (0.0%) |
| $50,000 to $74,999 | 2 (28.6%) | 3 (21.4%) |
| $75,000 to $99,999 | 0 (0.0%) | 11 (78.6%) |
| $100,000 to $149,999 | 0 (0.0%) | 0 (0.0%) |
| $150,000 or more | 0 (0.0%) | 0 (0.0%) |
| Total | 7 (100.0%) | 14 (100.0%) |
Property Value to Household Income Ratio in Richards
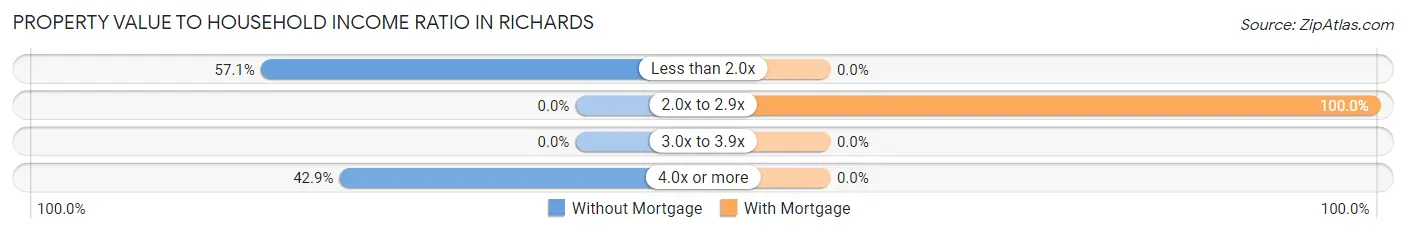
| Value-to-Income Ratio | Without Mortgage | With Mortgage |
| Less than 2.0x | 4 (57.1%) | 0 (0.0%) |
| 2.0x to 2.9x | 0 (0.0%) | 14 (100.0%) |
| 3.0x to 3.9x | 0 (0.0%) | 0 (0.0%) |
| 4.0x or more | 3 (42.9%) | 0 (0.0%) |
| Total | 7 (100.0%) | 14 (100.0%) |
Real Estate Taxes by Mortgage Status in Richards
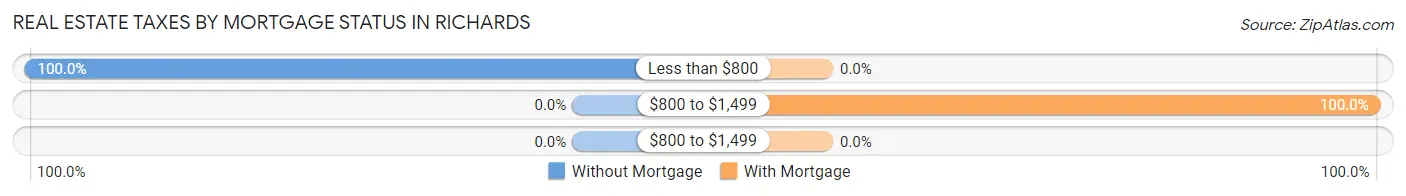
| Property Taxes | Without Mortgage | With Mortgage |
| Less than $800 | 7 (100.0%) | 0 (0.0%) |
| $800 to $1,499 | 0 (0.0%) | 14 (100.0%) |
| $800 to $1,499 | 0 (0.0%) | 0 (0.0%) |
| Total | 7 (100.0%) | 14 (100.0%) |
Health & Disability in Richards
Health Insurance Coverage by Age in Richards
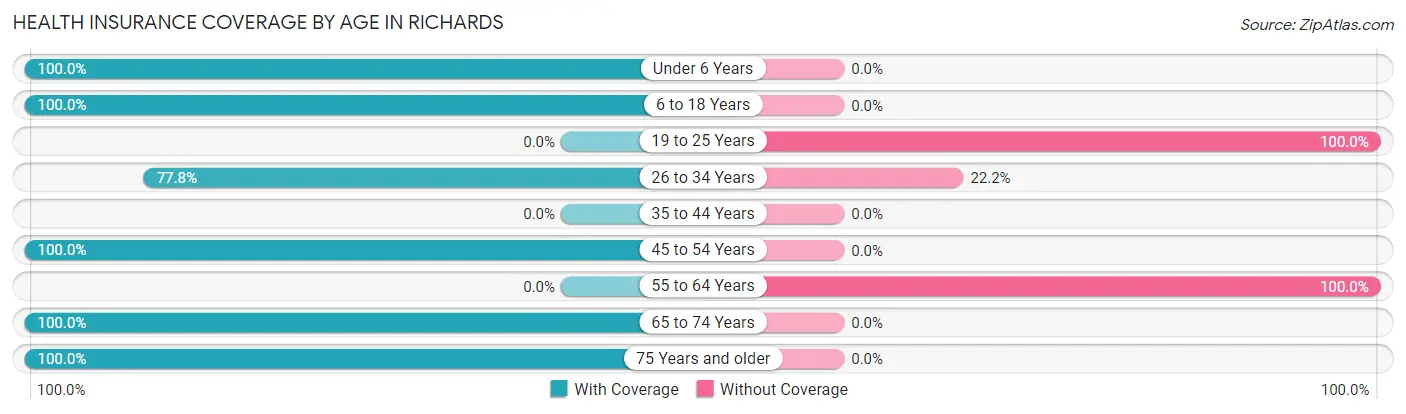
| Age Bracket | With Coverage | Without Coverage |
| Under 6 Years | 25 (100.0%) | 0 (0.0%) |
| 6 to 18 Years | 30 (100.0%) | 0 (0.0%) |
| 19 to 25 Years | 0 (0.0%) | 21 (100.0%) |
| 26 to 34 Years | 35 (77.8%) | 10 (22.2%) |
| 35 to 44 Years | 0 (0.0%) | 0 (0.0%) |
| 45 to 54 Years | 10 (100.0%) | 0 (0.0%) |
| 55 to 64 Years | 0 (0.0%) | 1 (100.0%) |
| 65 to 74 Years | 4 (100.0%) | 0 (0.0%) |
| 75 Years and older | 2 (100.0%) | 0 (0.0%) |
| Total | 106 (76.8%) | 32 (23.2%) |
Health Insurance Coverage by Citizenship Status in Richards
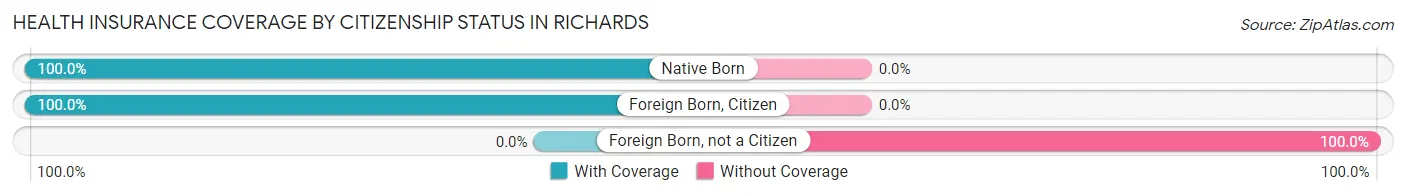
| Citizenship Status | With Coverage | Without Coverage |
| Native Born | 25 (100.0%) | 0 (0.0%) |
| Foreign Born, Citizen | 30 (100.0%) | 0 (0.0%) |
| Foreign Born, not a Citizen | 0 (0.0%) | 21 (100.0%) |
Health Insurance Coverage by Household Income in Richards
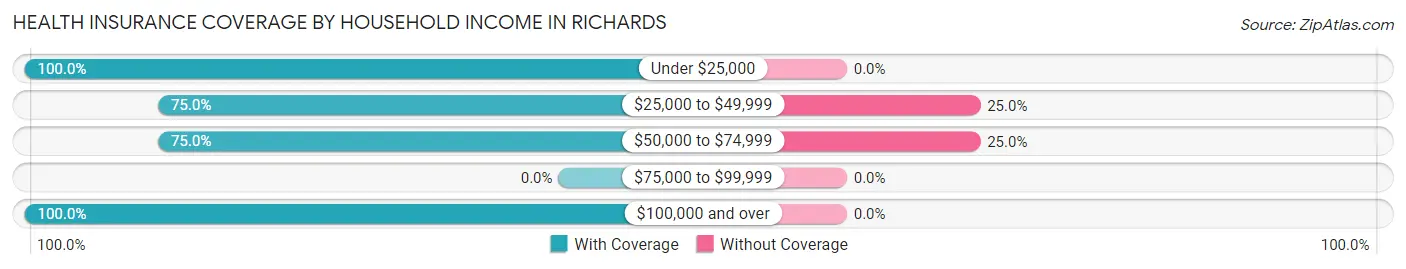
| Household Income | With Coverage | Without Coverage |
| Under $25,000 | 5 (100.0%) | 0 (0.0%) |
| $25,000 to $49,999 | 9 (75.0%) | 3 (25.0%) |
| $50,000 to $74,999 | 87 (75.0%) | 29 (25.0%) |
| $75,000 to $99,999 | 0 (0.0%) | 0 (0.0%) |
| $100,000 and over | 5 (100.0%) | 0 (0.0%) |
Public vs Private Health Insurance Coverage by Age in Richards
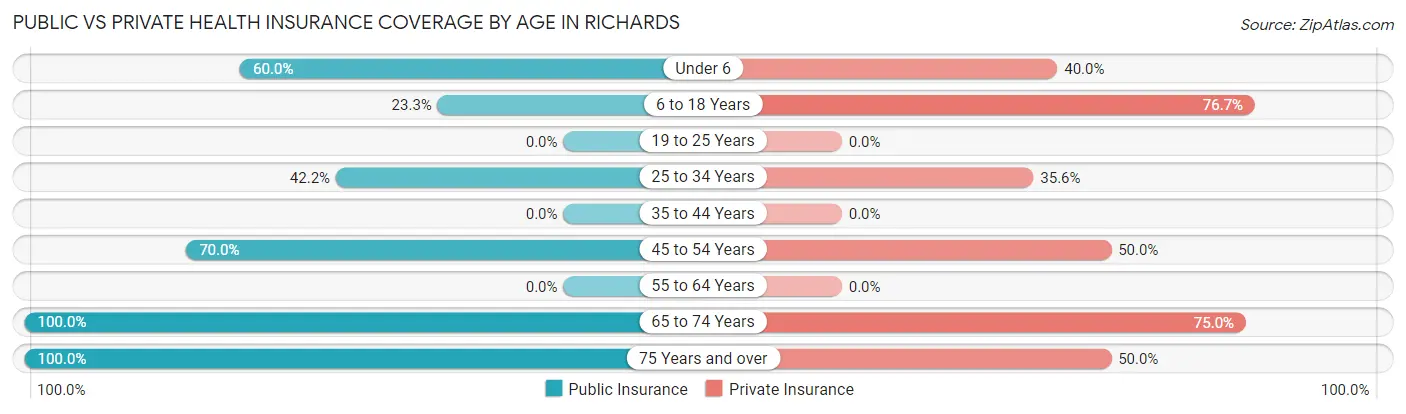
| Age Bracket | Public Insurance | Private Insurance |
| Under 6 | 15 (60.0%) | 10 (40.0%) |
| 6 to 18 Years | 7 (23.3%) | 23 (76.7%) |
| 19 to 25 Years | 0 (0.0%) | 0 (0.0%) |
| 25 to 34 Years | 19 (42.2%) | 16 (35.6%) |
| 35 to 44 Years | 0 (0.0%) | 0 (0.0%) |
| 45 to 54 Years | 7 (70.0%) | 5 (50.0%) |
| 55 to 64 Years | 0 (0.0%) | 0 (0.0%) |
| 65 to 74 Years | 4 (100.0%) | 3 (75.0%) |
| 75 Years and over | 2 (100.0%) | 1 (50.0%) |
| Total | 54 (39.1%) | 58 (42.0%) |
Disability Status by Sex by Age in Richards
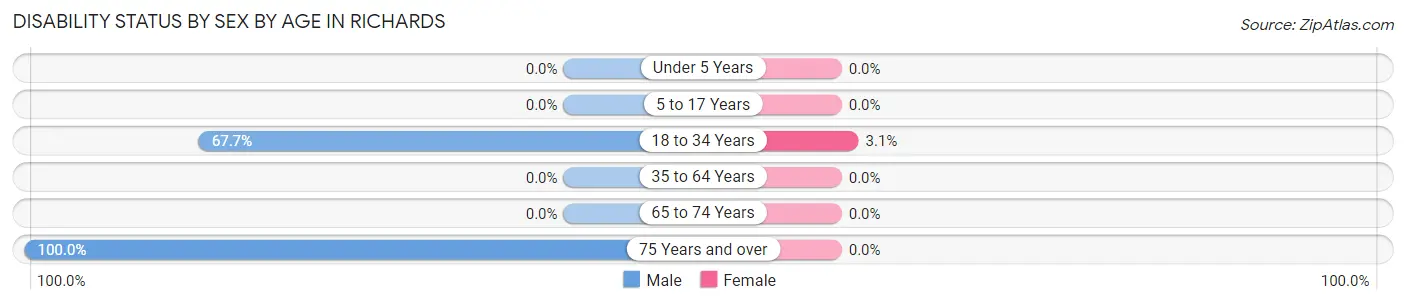
| Age Bracket | Male | Female |
| Under 5 Years | 0 (0.0%) | 0 (0.0%) |
| 5 to 17 Years | 0 (0.0%) | 0 (0.0%) |
| 18 to 34 Years | 23 (67.6%) | 1 (3.1%) |
| 35 to 64 Years | 0 (0.0%) | 0 (0.0%) |
| 65 to 74 Years | 0 (0.0%) | 0 (0.0%) |
| 75 Years and over | 2 (100.0%) | 0 (0.0%) |
Disability Class by Sex by Age in Richards
Disability Class: Hearing Difficulty
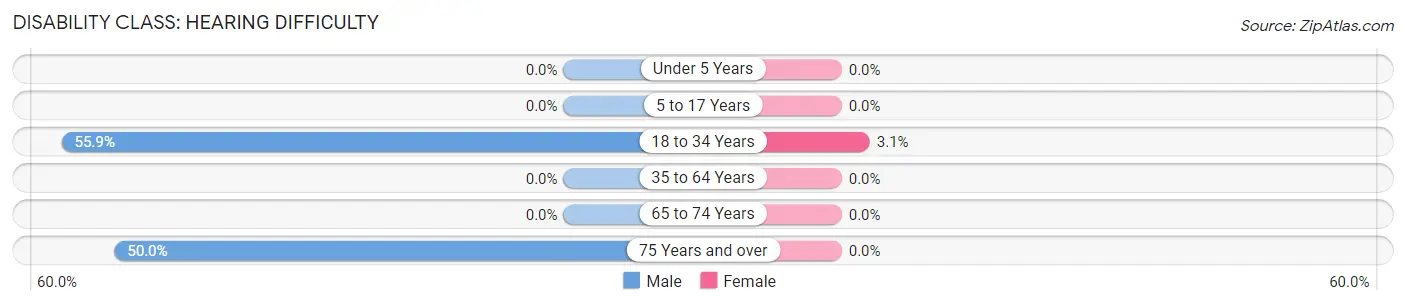
| Age Bracket | Male | Female |
| Under 5 Years | 0 (0.0%) | 0 (0.0%) |
| 5 to 17 Years | 0 (0.0%) | 0 (0.0%) |
| 18 to 34 Years | 19 (55.9%) | 1 (3.1%) |
| 35 to 64 Years | 0 (0.0%) | 0 (0.0%) |
| 65 to 74 Years | 0 (0.0%) | 0 (0.0%) |
| 75 Years and over | 1 (50.0%) | 0 (0.0%) |
Disability Class: Vision Difficulty
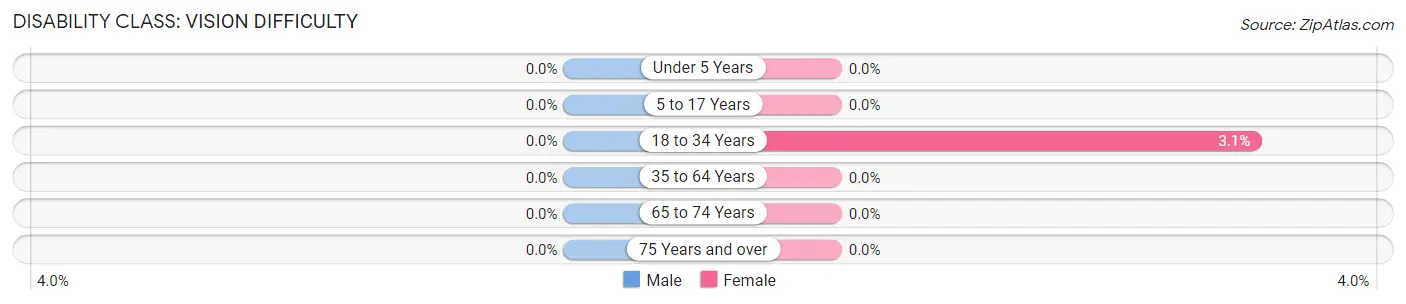
| Age Bracket | Male | Female |
| Under 5 Years | 0 (0.0%) | 0 (0.0%) |
| 5 to 17 Years | 0 (0.0%) | 0 (0.0%) |
| 18 to 34 Years | 0 (0.0%) | 1 (3.1%) |
| 35 to 64 Years | 0 (0.0%) | 0 (0.0%) |
| 65 to 74 Years | 0 (0.0%) | 0 (0.0%) |
| 75 Years and over | 0 (0.0%) | 0 (0.0%) |
Disability Class: Cognitive Difficulty
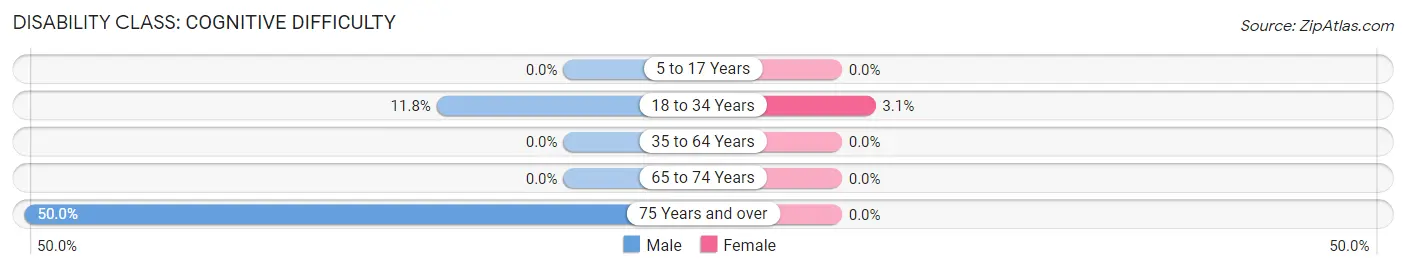
| Age Bracket | Male | Female |
| 5 to 17 Years | 0 (0.0%) | 0 (0.0%) |
| 18 to 34 Years | 4 (11.8%) | 1 (3.1%) |
| 35 to 64 Years | 0 (0.0%) | 0 (0.0%) |
| 65 to 74 Years | 0 (0.0%) | 0 (0.0%) |
| 75 Years and over | 1 (50.0%) | 0 (0.0%) |
Disability Class: Ambulatory Difficulty
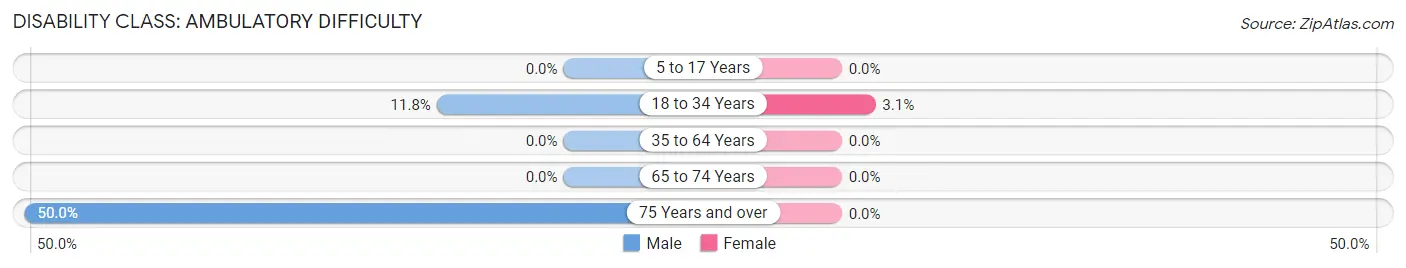
| Age Bracket | Male | Female |
| 5 to 17 Years | 0 (0.0%) | 0 (0.0%) |
| 18 to 34 Years | 4 (11.8%) | 1 (3.1%) |
| 35 to 64 Years | 0 (0.0%) | 0 (0.0%) |
| 65 to 74 Years | 0 (0.0%) | 0 (0.0%) |
| 75 Years and over | 1 (50.0%) | 0 (0.0%) |
Disability Class: Self-Care Difficulty
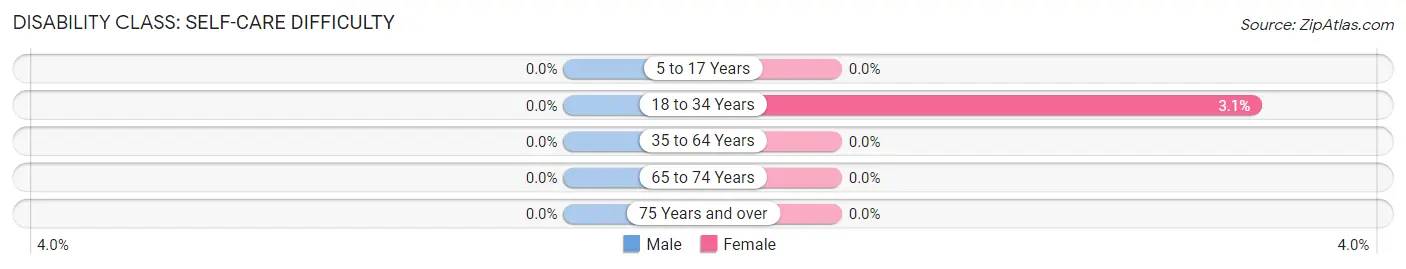
| Age Bracket | Male | Female |
| 5 to 17 Years | 0 (0.0%) | 0 (0.0%) |
| 18 to 34 Years | 0 (0.0%) | 1 (3.1%) |
| 35 to 64 Years | 0 (0.0%) | 0 (0.0%) |
| 65 to 74 Years | 0 (0.0%) | 0 (0.0%) |
| 75 Years and over | 0 (0.0%) | 0 (0.0%) |
Technology Access in Richards
Computing Device Access in Richards
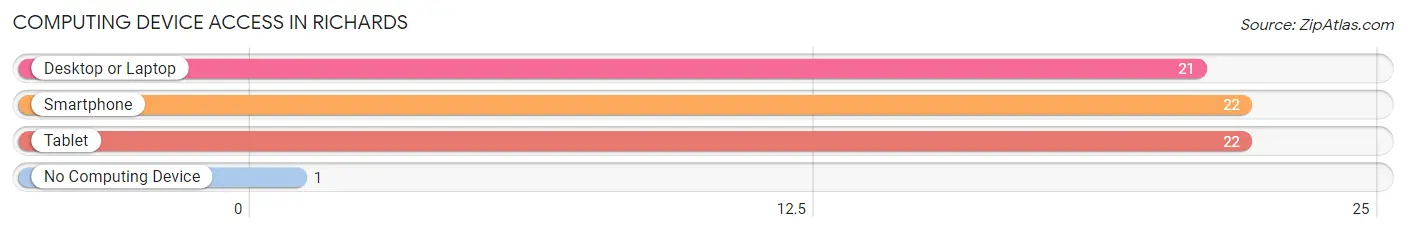
| Device Type | # Households | % Households |
| Desktop or Laptop | 21 | 75.0% |
| Smartphone | 22 | 78.6% |
| Tablet | 22 | 78.6% |
| No Computing Device | 1 | 3.6% |
| Total | 28 | 100.0% |
Internet Access in Richards
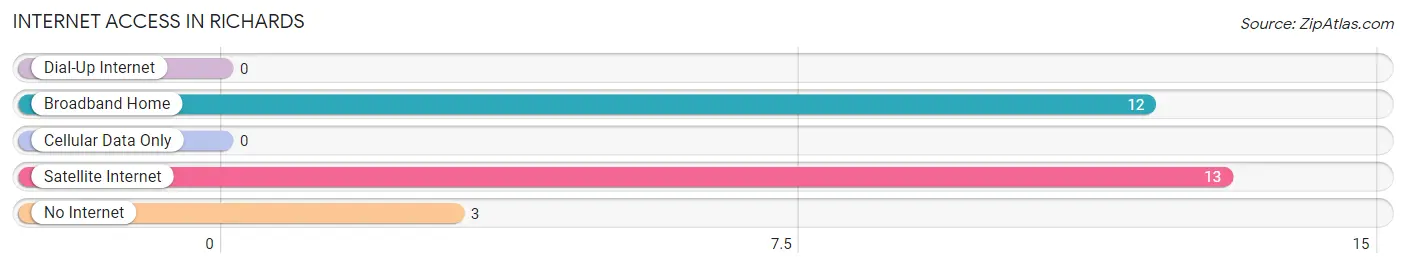
| Internet Type | # Households | % Households |
| Dial-Up Internet | 0 | 0.0% |
| Broadband Home | 12 | 42.9% |
| Cellular Data Only | 0 | 0.0% |
| Satellite Internet | 13 | 46.4% |
| No Internet | 3 | 10.7% |
| Total | 28 | 100.0% |
Richards Summary
Richards, Missouri is a small town located in the southeastern corner of the state, in the Ozark Mountains. It is situated in the heart of the Mark Twain National Forest, and is surrounded by rolling hills, lush forests, and numerous creeks and streams. The town is home to a population of just over 500 people, and is known for its rural charm and friendly atmosphere.
Geography
Richards is located in the southeastern corner of Missouri, in the Ozark Mountains. It is situated in the heart of the Mark Twain National Forest, and is surrounded by rolling hills, lush forests, and numerous creeks and streams. The town is located at an elevation of 890 feet, and is approximately 20 miles from the nearest major city, Springfield. The climate in Richards is humid subtropical, with hot, humid summers and mild winters.
Economy
The economy of Richards is largely based on agriculture and tourism. The town is home to several small farms, which produce a variety of crops, including corn, soybeans, wheat, and hay. The town also has a thriving tourism industry, with many visitors coming to enjoy the area’s natural beauty and outdoor activities. The town is also home to several small businesses, including a grocery store, a hardware store, and a few restaurants.
Demographics
As of the 2010 census, the population of Richards was 514 people. The racial makeup of the town was 97.3% White, 0.6% African American, 0.2% Native American, 0.2% Asian, 0.4% from other races, and 1.3% from two or more races. The median household income in Richards was $37,500, and the median family income was $41,250. The per capita income in the town was $17,845.
Conclusion
Richards, Missouri is a small town located in the southeastern corner of the state, in the Ozark Mountains. It is home to a population of just over 500 people, and is known for its rural charm and friendly atmosphere. The economy of Richards is largely based on agriculture and tourism, and the town is home to several small businesses. The racial makeup of the town is predominantly White, with a small percentage of African American, Native American, and Asian residents. The median household income in Richards is $37,500, and the per capita income is $17,845.
Common Questions
What is Per Capita Income in Richards?
Per Capita income in Richards is $13,422.
What is the Median Household income in Richards?
Median Household Income in Richards is $65,455.
What is Income or Wage Gap in Richards?
Income or Wage Gap in Richards is 59.3%.
Women in Richards earn 40.7 cents for every dollar earned by a man.
What is Inequality or Gini Index in Richards?
Inequality or Gini Index in Richards is 0.22.
What is the Total Population of Richards?
Total Population of Richards is 138.
What is the Total Male Population of Richards?
Total Male Population of Richards is 80.
What is the Total Female Population of Richards?
Total Female Population of Richards is 58.
What is the Ratio of Males per 100 Females in Richards?
There are 137.93 Males per 100 Females in Richards.
What is the Ratio of Females per 100 Males in Richards?
There are 72.50 Females per 100 Males in Richards.
What is the Median Population Age in Richards?
Median Population Age in Richards is 23.7 Years.
What is the Average Family Size in Richards
Average Family Size in Richards is 3.5 People.
What is the Average Household Size in Richards
Average Household Size in Richards is 4.9 People.
How Large is the Labor Force in Richards?
There are 23 People in the Labor Forcein in Richards.
What is the Percentage of People in the Labor Force in Richards?
27.7% of People are in the Labor Force in Richards.