Humphreys, MO Map & Demographics
Humphreys Map
Humphreys Overview
$13,298
PER CAPITA INCOME
$31,667
AVG HOUSEHOLD INCOME
0.33
INEQUALITY / GINI INDEX
85
TOTAL POPULATION
36
MALE POPULATION
49
FEMALE POPULATION
73.47
MALES / 100 FEMALES
136.11
FEMALES / 100 MALES
50.6
MEDIAN AGE
3.1
AVG FAMILY SIZE
3.0
AVG HOUSEHOLD SIZE
15
LABOR FORCE [ PEOPLE ]
22.7%
PERCENT IN LABOR FORCE
Humphreys Zip Codes
Income in Humphreys
Income Overview in Humphreys
| Characteristic | Number | Measure |
| Per Capita Income | 85 | $13,298 |
| Median Family Income | 14 | $0 |
| Mean Family Income | 14 | $33,186 |
| Median Household Income | 28 | $31,667 |
| Mean Household Income | 28 | $37,139 |
| Income Deficit | 14 | $0 |
| Wage / Income Gap (%) | 85 | 0.00% |
| Wage / Income Gap ($) | 85 | 100.00¢ per $1 |
| Gini / Inequality Index | 85 | 0.33 |
Earnings by Sex in Humphreys
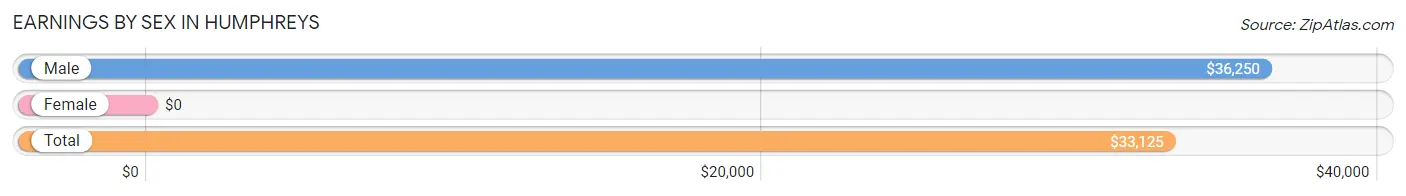
| Sex | Number | Average Earnings |
| Male | 12 (60.0%) | $36,250 |
| Female | 8 (40.0%) | $0 |
| Total | 20 (100.0%) | $33,125 |
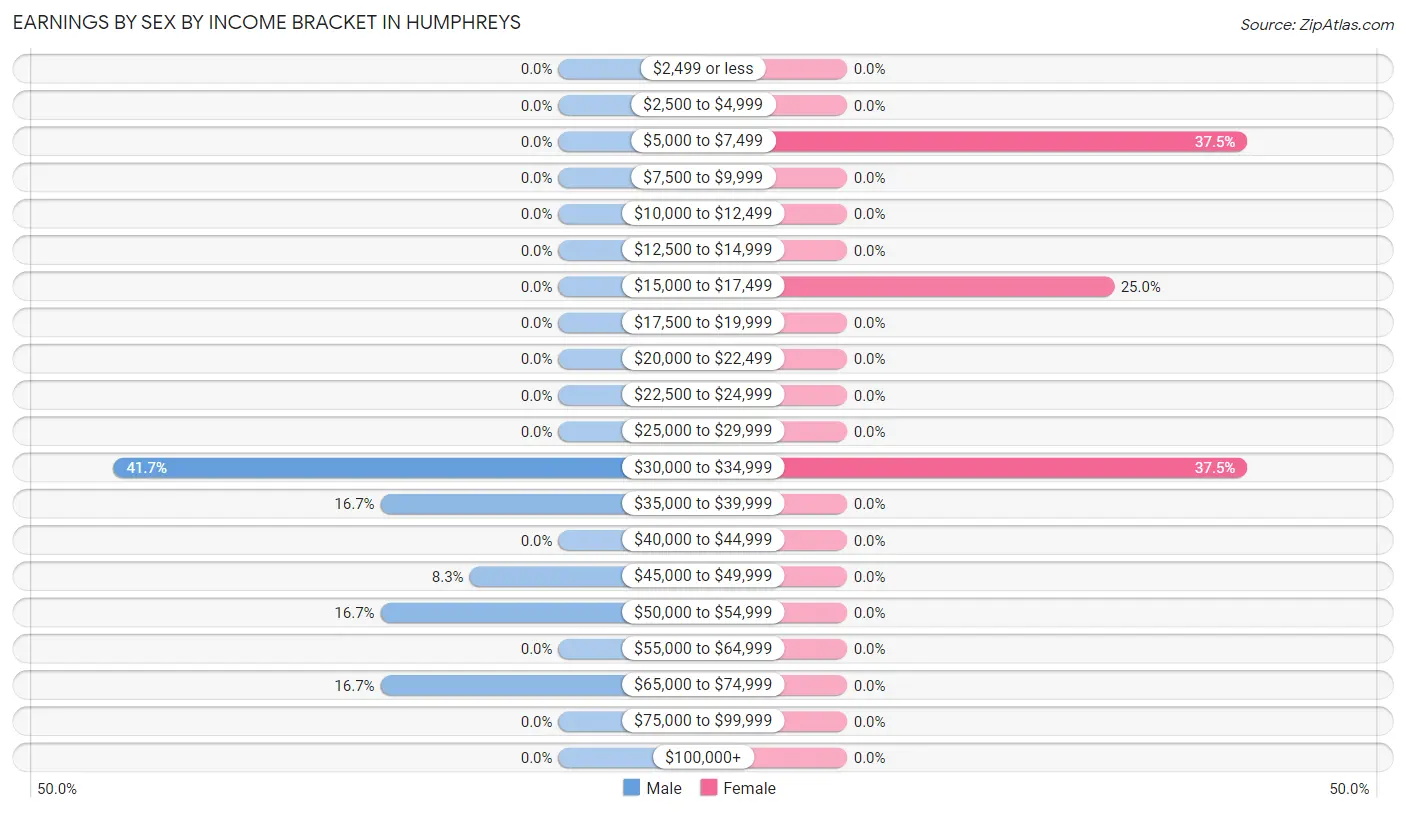
Earnings by Sex by Income Bracket in Humphreys
The most common earnings brackets in Humphreys are $30,000 to $34,999 for men (5 | 41.7%) and $5,000 to $7,499 for women (3 | 37.5%).
| Income | Male | Female |
| $2,499 or less | 0 (0.0%) | 0 (0.0%) |
| $2,500 to $4,999 | 0 (0.0%) | 0 (0.0%) |
| $5,000 to $7,499 | 0 (0.0%) | 3 (37.5%) |
| $7,500 to $9,999 | 0 (0.0%) | 0 (0.0%) |
| $10,000 to $12,499 | 0 (0.0%) | 0 (0.0%) |
| $12,500 to $14,999 | 0 (0.0%) | 0 (0.0%) |
| $15,000 to $17,499 | 0 (0.0%) | 2 (25.0%) |
| $17,500 to $19,999 | 0 (0.0%) | 0 (0.0%) |
| $20,000 to $22,499 | 0 (0.0%) | 0 (0.0%) |
| $22,500 to $24,999 | 0 (0.0%) | 0 (0.0%) |
| $25,000 to $29,999 | 0 (0.0%) | 0 (0.0%) |
| $30,000 to $34,999 | 5 (41.7%) | 3 (37.5%) |
| $35,000 to $39,999 | 2 (16.7%) | 0 (0.0%) |
| $40,000 to $44,999 | 0 (0.0%) | 0 (0.0%) |
| $45,000 to $49,999 | 1 (8.3%) | 0 (0.0%) |
| $50,000 to $54,999 | 2 (16.7%) | 0 (0.0%) |
| $55,000 to $64,999 | 0 (0.0%) | 0 (0.0%) |
| $65,000 to $74,999 | 2 (16.7%) | 0 (0.0%) |
| $75,000 to $99,999 | 0 (0.0%) | 0 (0.0%) |
| $100,000+ | 0 (0.0%) | 0 (0.0%) |
| Total | 12 (100.0%) | 8 (100.0%) |
Earnings by Sex by Educational Attainment in Humphreys
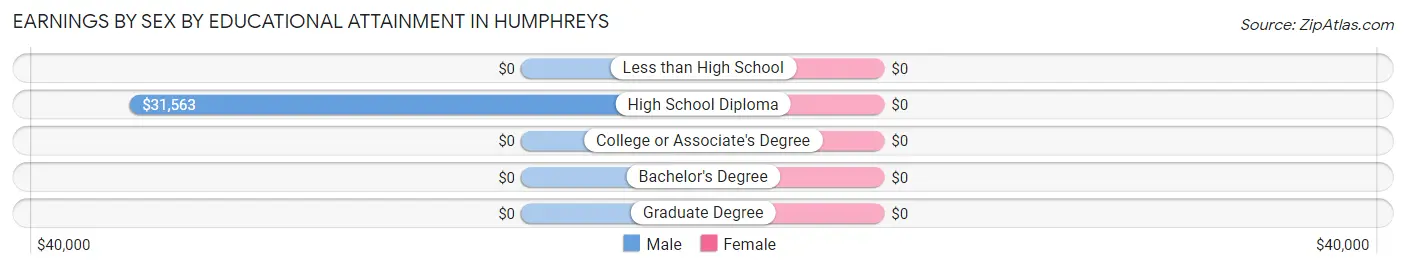
| Educational Attainment | Male Income | Female Income |
| Less than High School | - | - |
| High School Diploma | $31,563 | $0 |
| College or Associate's Degree | - | - |
| Bachelor's Degree | - | - |
| Graduate Degree | - | - |
| Total | $35,625 | $0 |
Family Income in Humphreys
Family Income Brackets in Humphreys
According to the Humphreys family income data, there are 6 families falling into the $50,000 to $74,999 income range, which is the most common income bracket and makes up 42.9% of all families.
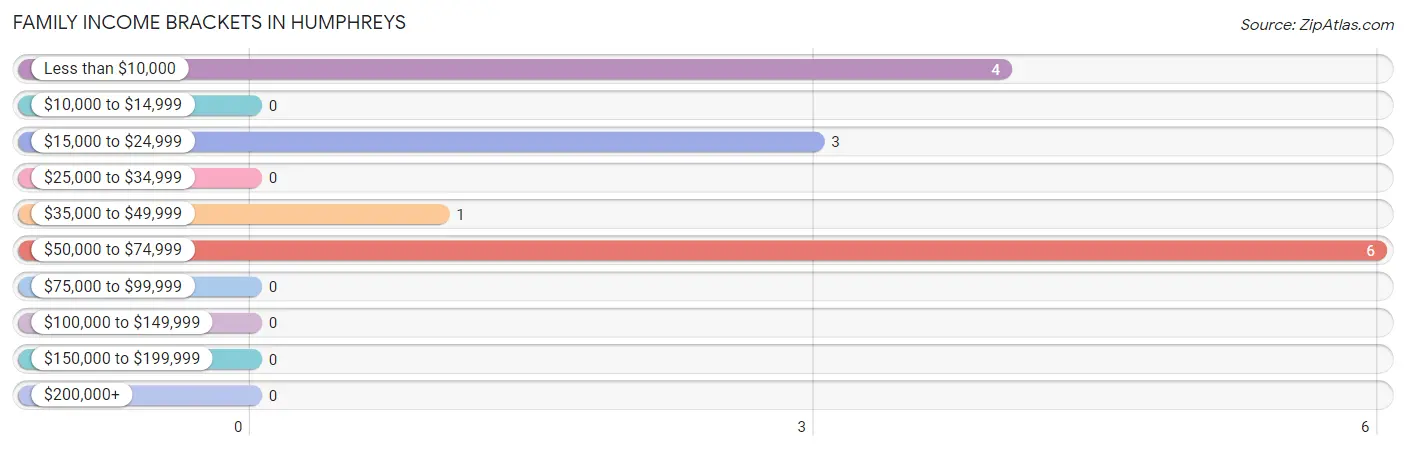
| Income Bracket | # Families | % Families |
| Less than $10,000 | 4 | 28.6% |
| $10,000 to $14,999 | 0 | 0.0% |
| $15,000 to $24,999 | 3 | 21.4% |
| $25,000 to $34,999 | 0 | 0.0% |
| $35,000 to $49,999 | 1 | 7.1% |
| $50,000 to $74,999 | 6 | 42.9% |
| $75,000 to $99,999 | 0 | 0.0% |
| $100,000 to $149,999 | 0 | 0.0% |
| $150,000 to $199,999 | 0 | 0.0% |
| $200,000+ | 0 | 0.0% |
Family Income by Famaliy Size in Humphreys
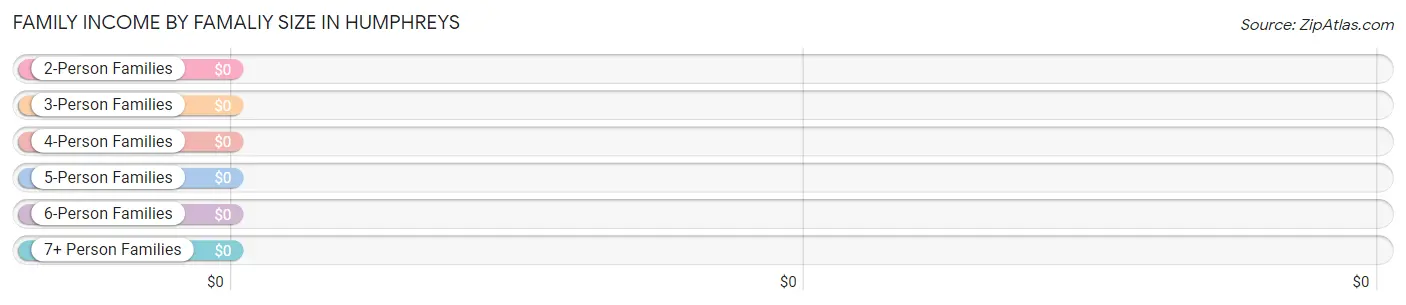
| Income Bracket | # Families | Median Income |
| 2-Person Families | 9 (64.3%) | $0 |
| 3-Person Families | 3 (21.4%) | $0 |
| 4-Person Families | 2 (14.3%) | $0 |
| 5-Person Families | 0 (0.0%) | $0 |
| 6-Person Families | 0 (0.0%) | $0 |
| 7+ Person Families | 0 (0.0%) | $0 |
| Total | 14 (100.0%) | $0 |
Family Income by Number of Earners in Humphreys
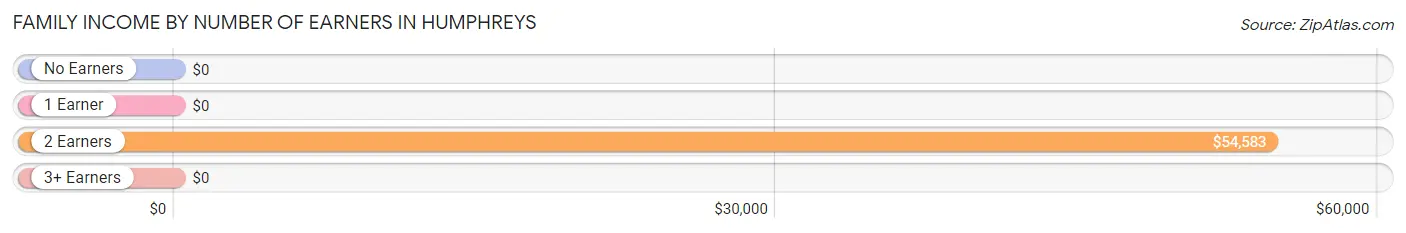
| Number of Earners | # Families | Median Income |
| No Earners | 6 (42.9%) | $0 |
| 1 Earner | 1 (7.1%) | $0 |
| 2 Earners | 7 (50.0%) | $54,583 |
| 3+ Earners | 0 (0.0%) | $0 |
| Total | 14 (100.0%) | $0 |
Household Income in Humphreys
Household Income Brackets in Humphreys
With 11 households falling in the category, the $50,000 to $74,999 income range is the most frequent in Humphreys, accounting for 39.3% of all households.
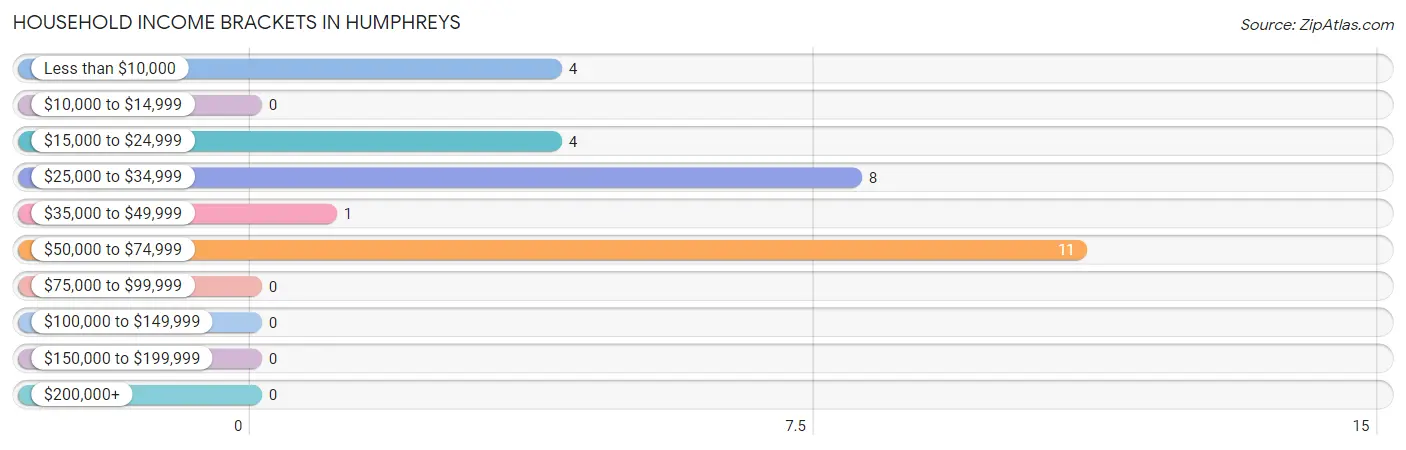
| Income Bracket | # Households | % Households |
| Less than $10,000 | 4 | 14.3% |
| $10,000 to $14,999 | 0 | 0.0% |
| $15,000 to $24,999 | 4 | 14.3% |
| $25,000 to $34,999 | 8 | 28.6% |
| $35,000 to $49,999 | 1 | 3.6% |
| $50,000 to $74,999 | 11 | 39.3% |
| $75,000 to $99,999 | 0 | 0.0% |
| $100,000 to $149,999 | 0 | 0.0% |
| $150,000 to $199,999 | 0 | 0.0% |
| $200,000+ | 0 | 0.0% |
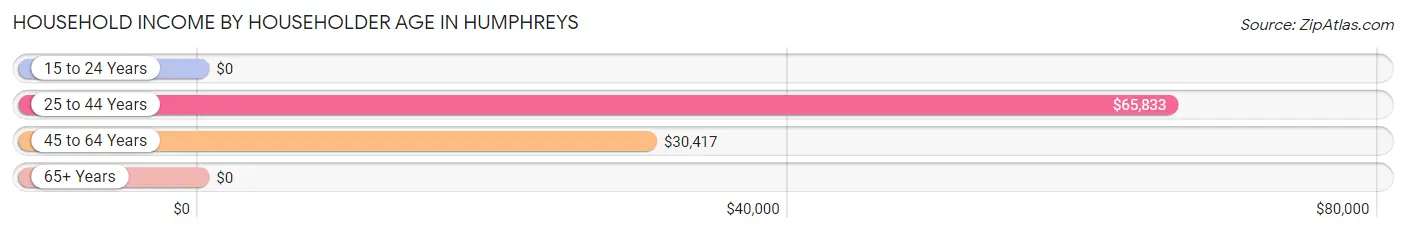
Household Income by Householder Age in Humphreys
The median household income in Humphreys is $31,667, with the highest median household income of $65,833 found in the 25 to 44 years age bracket for the primary householder. A total of 10 households (35.7%) fall into this category. Meanwhile, the 15 to 24 years age bracket for the primary householder has the lowest median household income of $0, with 1 households (3.6%) in this group.
| Income Bracket | # Households | Median Income |
| 15 to 24 Years | 1 (3.6%) | $0 |
| 25 to 44 Years | 10 (35.7%) | $65,833 |
| 45 to 64 Years | 11 (39.3%) | $30,417 |
| 65+ Years | 6 (21.4%) | $0 |
| Total | 28 (100.0%) | $31,667 |
Poverty in Humphreys
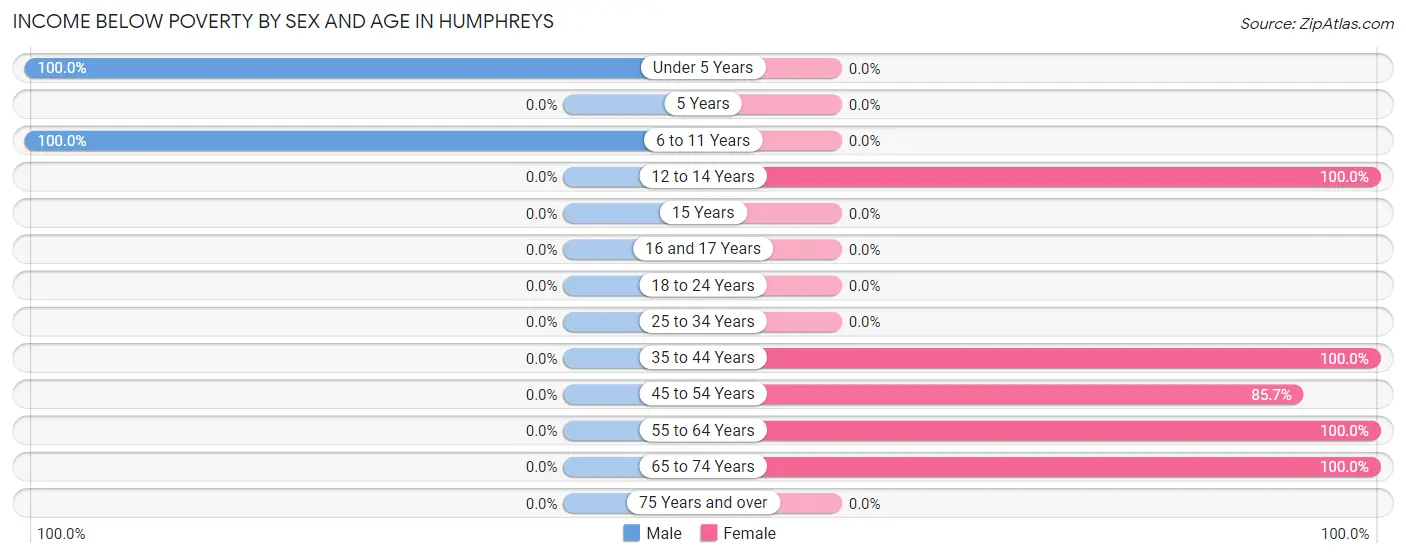
Income Below Poverty by Sex and Age in Humphreys
With 25.0% poverty level for males and 69.4% for females among the residents of Humphreys, under 5 year old males and 12 to 14 year old females are the most vulnerable to poverty, with 6 males (100.0%) and 1 females (100.0%) in their respective age groups living below the poverty level.
| Age Bracket | Male | Female |
| Under 5 Years | 6 (100.0%) | 0 (0.0%) |
| 5 Years | 0 (0.0%) | 0 (0.0%) |
| 6 to 11 Years | 3 (100.0%) | 0 (0.0%) |
| 12 to 14 Years | 0 (0.0%) | 1 (100.0%) |
| 15 Years | 0 (0.0%) | 0 (0.0%) |
| 16 and 17 Years | 0 (0.0%) | 0 (0.0%) |
| 18 to 24 Years | 0 (0.0%) | 0 (0.0%) |
| 25 to 34 Years | 0 (0.0%) | 0 (0.0%) |
| 35 to 44 Years | 0 (0.0%) | 4 (100.0%) |
| 45 to 54 Years | 0 (0.0%) | 6 (85.7%) |
| 55 to 64 Years | 0 (0.0%) | 21 (100.0%) |
| 65 to 74 Years | 0 (0.0%) | 2 (100.0%) |
| 75 Years and over | 0 (0.0%) | 0 (0.0%) |
| Total | 9 (25.0%) | 34 (69.4%) |
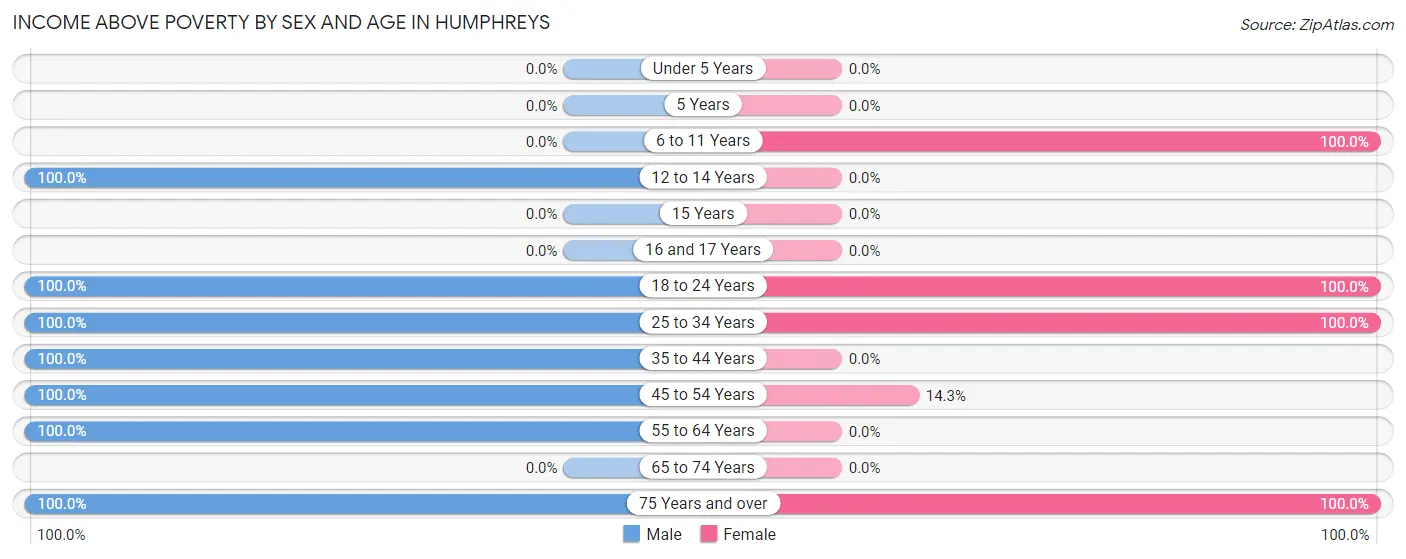
Income Above Poverty by Sex and Age in Humphreys
According to the poverty statistics in Humphreys, males aged 12 to 14 years and females aged 6 to 11 years are the age groups that are most secure financially, with 100.0% of males and 100.0% of females in these age groups living above the poverty line.
| Age Bracket | Male | Female |
| Under 5 Years | 0 (0.0%) | 0 (0.0%) |
| 5 Years | 0 (0.0%) | 0 (0.0%) |
| 6 to 11 Years | 0 (0.0%) | 4 (100.0%) |
| 12 to 14 Years | 5 (100.0%) | 0 (0.0%) |
| 15 Years | 0 (0.0%) | 0 (0.0%) |
| 16 and 17 Years | 0 (0.0%) | 0 (0.0%) |
| 18 to 24 Years | 1 (100.0%) | 1 (100.0%) |
| 25 to 34 Years | 6 (100.0%) | 5 (100.0%) |
| 35 to 44 Years | 2 (100.0%) | 0 (0.0%) |
| 45 to 54 Years | 8 (100.0%) | 1 (14.3%) |
| 55 to 64 Years | 2 (100.0%) | 0 (0.0%) |
| 65 to 74 Years | 0 (0.0%) | 0 (0.0%) |
| 75 Years and over | 3 (100.0%) | 4 (100.0%) |
| Total | 27 (75.0%) | 15 (30.6%) |
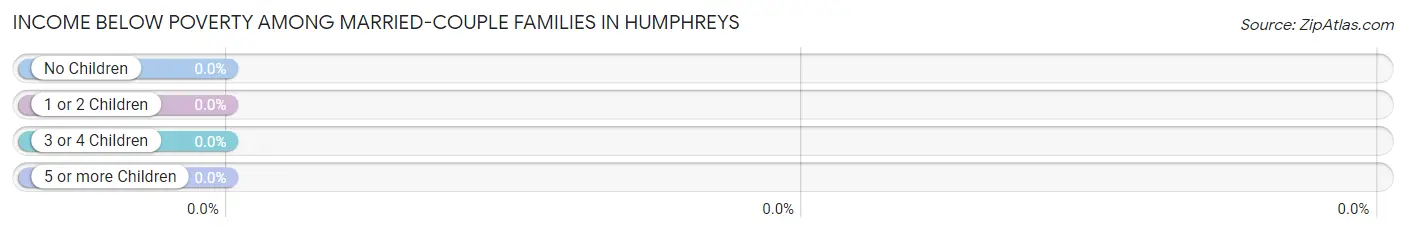
Income Below Poverty Among Married-Couple Families in Humphreys
| Children | Above Poverty | Below Poverty |
| No Children | 8 (100.0%) | 0 (0.0%) |
| 1 or 2 Children | 2 (100.0%) | 0 (0.0%) |
| 3 or 4 Children | 0 (0.0%) | 0 (0.0%) |
| 5 or more Children | 0 (0.0%) | 0 (0.0%) |
| Total | 10 (100.0%) | 0 (0.0%) |
Income Below Poverty Among Single-Parent Households in Humphreys
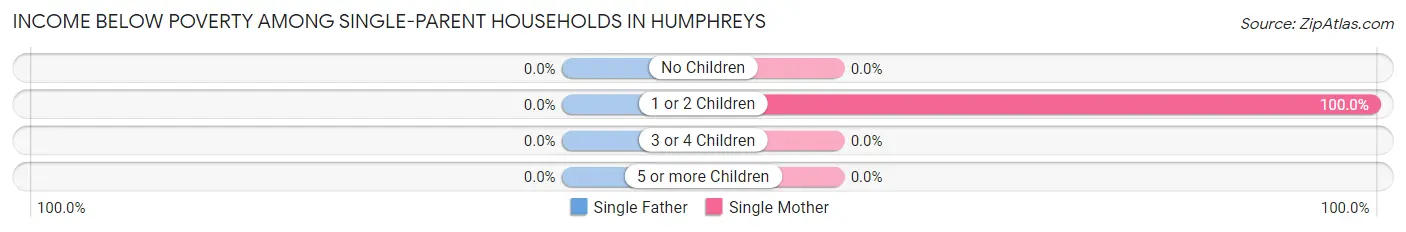
| Children | Single Father | Single Mother |
| No Children | 0 (0.0%) | 0 (0.0%) |
| 1 or 2 Children | 0 (0.0%) | 4 (100.0%) |
| 3 or 4 Children | 0 (0.0%) | 0 (0.0%) |
| 5 or more Children | 0 (0.0%) | 0 (0.0%) |
| Total | 0 (0.0%) | 4 (100.0%) |
Income Below Poverty Among Married-Couple vs Single-Parent Households in Humphreys
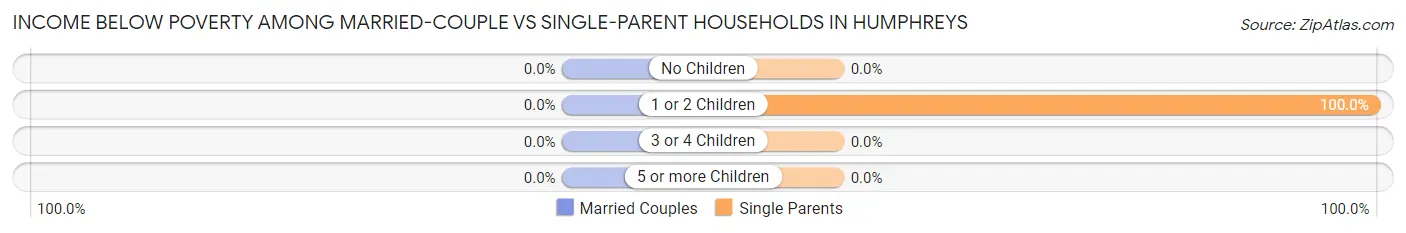
| Children | Married-Couple Families | Single-Parent Households |
| No Children | 0 (0.0%) | 0 (0.0%) |
| 1 or 2 Children | 0 (0.0%) | 4 (100.0%) |
| 3 or 4 Children | 0 (0.0%) | 0 (0.0%) |
| 5 or more Children | 0 (0.0%) | 0 (0.0%) |
| Total | 0 (0.0%) | 4 (100.0%) |
Race in Humphreys
The most populous races in Humphreys are , and White / Caucasian (85 | 100.0%).
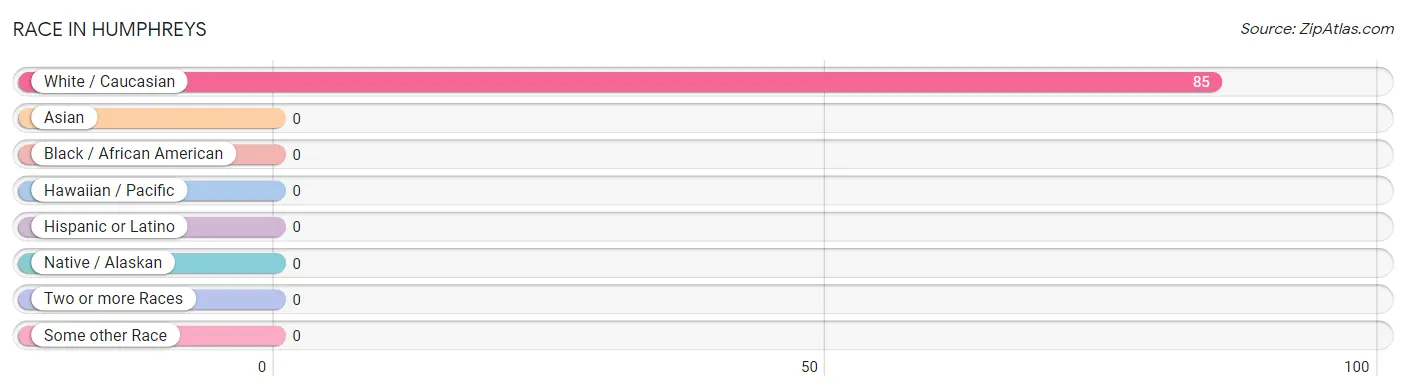
| Race | # Population | % Population |
| Asian | 0 | 0.0% |
| Black / African American | 0 | 0.0% |
| Hawaiian / Pacific | 0 | 0.0% |
| Hispanic or Latino | 0 | 0.0% |
| Native / Alaskan | 0 | 0.0% |
| White / Caucasian | 85 | 100.0% |
| Two or more Races | 0 | 0.0% |
| Some other Race | 0 | 0.0% |
| Total | 85 | 100.0% |
Ancestry in Humphreys
The most populous ancestries reported in Humphreys are American (37 | 43.5%), German (2 | 2.4%), Scottish (2 | 2.4%), Swedish (2 | 2.4%), and Welsh (2 | 2.4%), together accounting for 52.9% of all Humphreys residents.
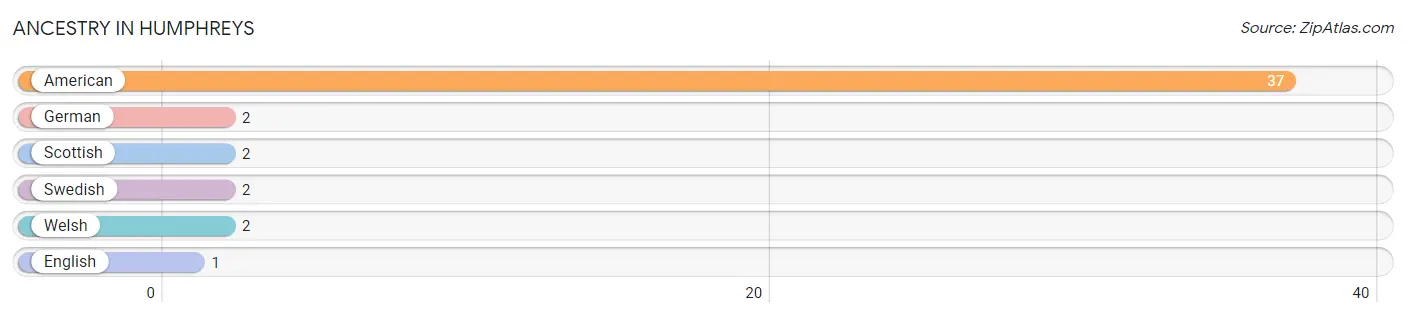
| Ancestry | # Population | % Population |
| American | 37 | 43.5% |
| English | 1 | 1.2% |
| German | 2 | 2.4% |
| Scottish | 2 | 2.4% |
| Swedish | 2 | 2.4% |
| Welsh | 2 | 2.4% | View All 6 Rows |
Immigrants in Humphreys

| Immigration Origin | # Population | % Population | View All 0 Rows |
Sex and Age in Humphreys
Sex and Age in Humphreys
The most populous age groups in Humphreys are 50 to 54 Years (7 | 19.4%) for men and 55 to 59 Years (21 | 42.9%) for women.
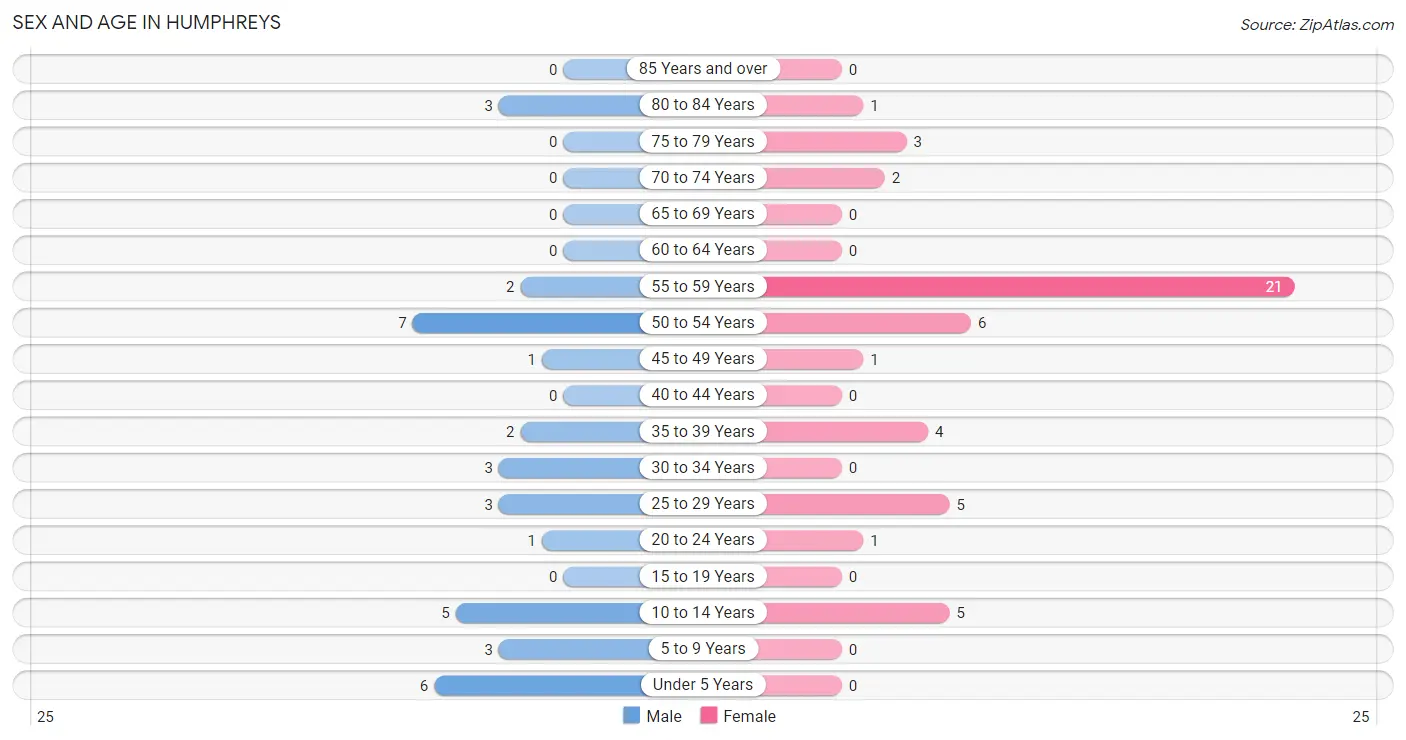
| Age Bracket | Male | Female |
| Under 5 Years | 6 (16.7%) | 0 (0.0%) |
| 5 to 9 Years | 3 (8.3%) | 0 (0.0%) |
| 10 to 14 Years | 5 (13.9%) | 5 (10.2%) |
| 15 to 19 Years | 0 (0.0%) | 0 (0.0%) |
| 20 to 24 Years | 1 (2.8%) | 1 (2.0%) |
| 25 to 29 Years | 3 (8.3%) | 5 (10.2%) |
| 30 to 34 Years | 3 (8.3%) | 0 (0.0%) |
| 35 to 39 Years | 2 (5.6%) | 4 (8.2%) |
| 40 to 44 Years | 0 (0.0%) | 0 (0.0%) |
| 45 to 49 Years | 1 (2.8%) | 1 (2.0%) |
| 50 to 54 Years | 7 (19.4%) | 6 (12.2%) |
| 55 to 59 Years | 2 (5.6%) | 21 (42.9%) |
| 60 to 64 Years | 0 (0.0%) | 0 (0.0%) |
| 65 to 69 Years | 0 (0.0%) | 0 (0.0%) |
| 70 to 74 Years | 0 (0.0%) | 2 (4.1%) |
| 75 to 79 Years | 0 (0.0%) | 3 (6.1%) |
| 80 to 84 Years | 3 (8.3%) | 1 (2.0%) |
| 85 Years and over | 0 (0.0%) | 0 (0.0%) |
| Total | 36 (100.0%) | 49 (100.0%) |
Families and Households in Humphreys
Median Family Size in Humphreys
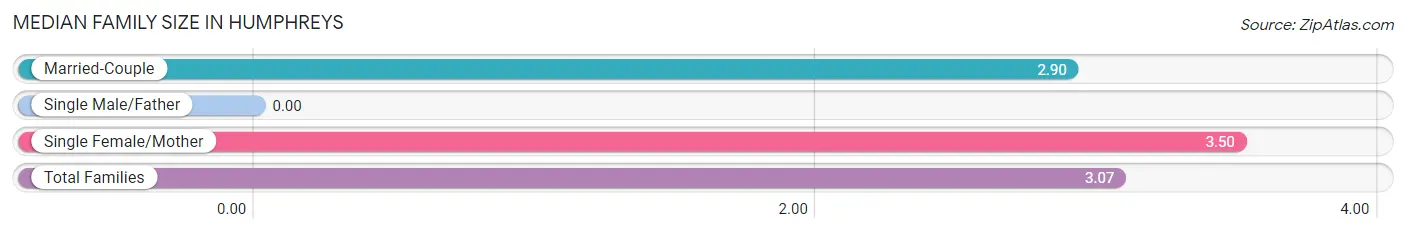
| Family Type | # Families | Family Size |
| Married-Couple | 10 (71.4%) | 2.90 |
| Single Male/Father | 0 (0.0%) | - |
| Single Female/Mother | 4 (28.6%) | 3.50 |
| Total Families | 14 (100.0%) | 3.07 |
Median Household Size in Humphreys
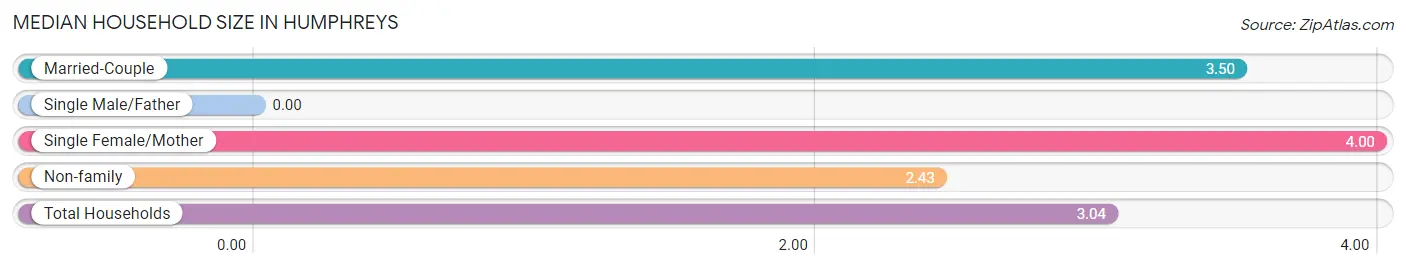
| Household Type | # Households | Household Size |
| Married-Couple | 10 (35.7%) | 3.50 |
| Single Male/Father | 0 (0.0%) | - |
| Single Female/Mother | 4 (14.3%) | 4.00 |
| Non-family | 14 (50.0%) | 2.43 |
| Total Households | 28 (100.0%) | 3.04 |
Household Size by Marriage Status in Humphreys
Out of a total of 28 households in Humphreys, 14 (50.0%) are family households, while 14 (50.0%) are nonfamily households. The most numerous type of family households are 2-person households, comprising 8, and the most common type of nonfamily households are 1-person households, comprising 11.
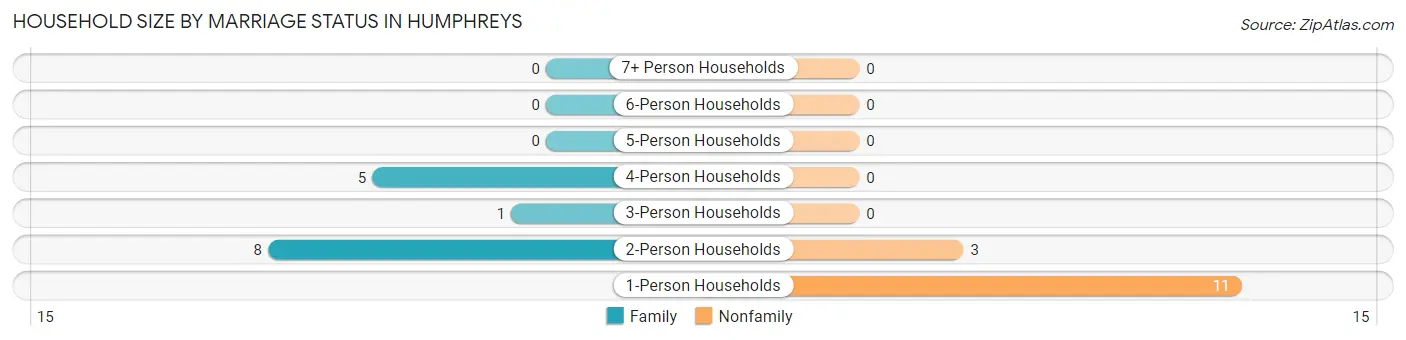
| Household Size | Family Households | Nonfamily Households |
| 1-Person Households | - | 11 (39.3%) |
| 2-Person Households | 8 (28.6%) | 3 (10.7%) |
| 3-Person Households | 1 (3.6%) | 0 (0.0%) |
| 4-Person Households | 5 (17.9%) | 0 (0.0%) |
| 5-Person Households | 0 (0.0%) | 0 (0.0%) |
| 6-Person Households | 0 (0.0%) | 0 (0.0%) |
| 7+ Person Households | 0 (0.0%) | 0 (0.0%) |
| Total | 14 (50.0%) | 14 (50.0%) |
Female Fertility in Humphreys
Fertility by Age in Humphreys
| Age Bracket | Women with Births | Births / 1,000 Women |
| 15 to 19 years | 0 (0.0%) | 0.0 |
| 20 to 34 years | 0 (0.0%) | 0.0 |
| 35 to 50 years | 0 (0.0%) | 0.0 |
| Total | 0 (0.0%) | 0.0 |
Fertility by Age by Marriage Status in Humphreys
| Age Bracket | Married | Unmarried |
| 15 to 19 years | 0 (0.0%) | 0 (0.0%) |
| 20 to 34 years | 0 (0.0%) | 0 (0.0%) |
| 35 to 50 years | 0 (0.0%) | 0 (0.0%) |
| Total | 0 (0.0%) | 0 (0.0%) |
Fertility by Education in Humphreys
| Educational Attainment | Women with Births | Births / 1,000 Women |
| Less than High School | 0 (0.0%) | 0.0 |
| High School Diploma | 0 (0.0%) | 0.0 |
| College or Associate's Degree | 0 (0.0%) | 0.0 |
| Bachelor's Degree | 0 (0.0%) | 0.0 |
| Graduate Degree | 0 (0.0%) | 0.0 |
| Total | 0 (0.0%) | 0.0 |
Fertility by Education by Marriage Status in Humphreys
| Educational Attainment | Married | Unmarried |
| Less than High School | 0 (0.0%) | 0 (0.0%) |
| High School Diploma | 0 (0.0%) | 0 (0.0%) |
| College or Associate's Degree | 0 (0.0%) | 0 (0.0%) |
| Bachelor's Degree | 0 (0.0%) | 0 (0.0%) |
| Graduate Degree | 0 (0.0%) | 0 (0.0%) |
| Total | 0 (0.0%) | 0 (0.0%) |
Employment Characteristics in Humphreys
Employment by Class of Employer in Humphreys
Among the 15 employed individuals in Humphreys, private company employees (14 | 93.3%), and not-for-profit organizations (1 | 6.7%) make up the most common classes of employment.
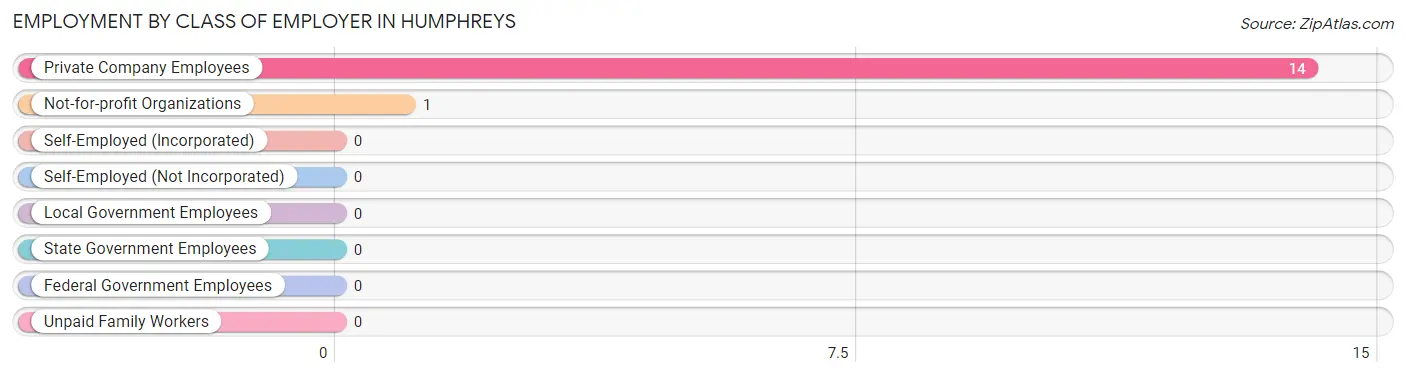
| Employer Class | # Employees | % Employees |
| Private Company Employees | 14 | 93.3% |
| Self-Employed (Incorporated) | 0 | 0.0% |
| Self-Employed (Not Incorporated) | 0 | 0.0% |
| Not-for-profit Organizations | 1 | 6.7% |
| Local Government Employees | 0 | 0.0% |
| State Government Employees | 0 | 0.0% |
| Federal Government Employees | 0 | 0.0% |
| Unpaid Family Workers | 0 | 0.0% |
| Total | 15 | 100.0% |
Employment Status by Age in Humphreys
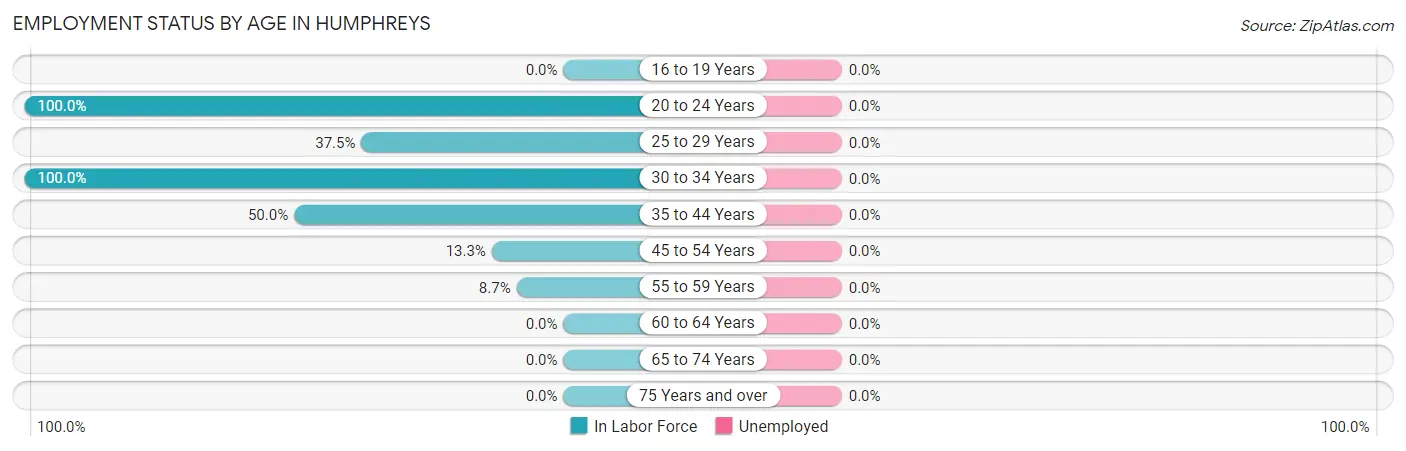
| Age Bracket | In Labor Force | Unemployed |
| 16 to 19 Years | 0 (0.0%) | 0 (0.0%) |
| 20 to 24 Years | 2 (100.0%) | 0 (0.0%) |
| 25 to 29 Years | 3 (37.5%) | 0 (0.0%) |
| 30 to 34 Years | 3 (100.0%) | 0 (0.0%) |
| 35 to 44 Years | 3 (50.0%) | 0 (0.0%) |
| 45 to 54 Years | 2 (13.3%) | 0 (0.0%) |
| 55 to 59 Years | 2 (8.7%) | 0 (0.0%) |
| 60 to 64 Years | 0 (0.0%) | 0 (0.0%) |
| 65 to 74 Years | 0 (0.0%) | 0 (0.0%) |
| 75 Years and over | 0 (0.0%) | 0 (0.0%) |
| Total | 15 (22.7%) | 0 (0.0%) |
Employment Status by Educational Attainment in Humphreys
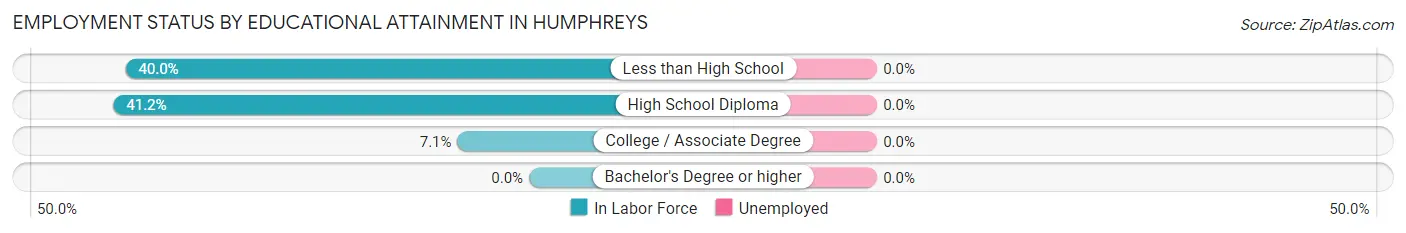
| Educational Attainment | In Labor Force | Unemployed |
| Less than High School | 4 (40.0%) | 0 (0.0%) |
| High School Diploma | 7 (41.2%) | 0 (0.0%) |
| College / Associate Degree | 2 (7.1%) | 0 (0.0%) |
| Bachelor's Degree or higher | 0 (0.0%) | 0 (0.0%) |
| Total | 13 (23.6%) | 0 (0.0%) |
Employment Occupations by Sex in Humphreys
Management, Business, Science and Arts Occupations
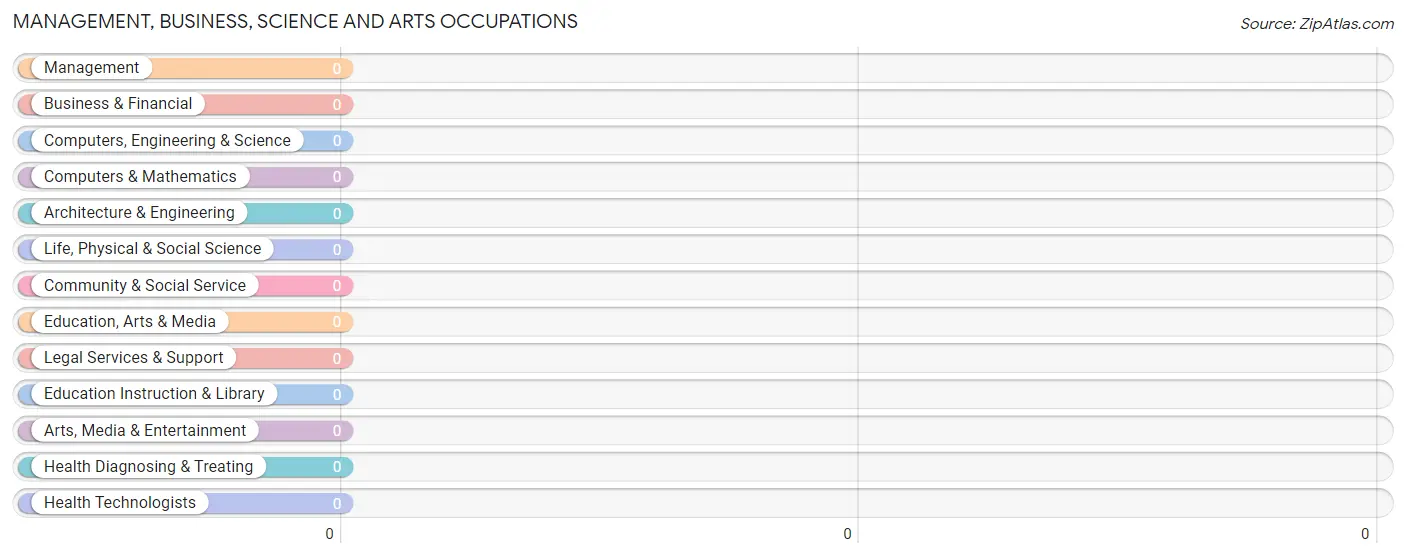
Management, Business, Science and Arts Occupations by Sex
| Occupation | Male | Female |
| Management | 0 (0.0%) | 0 (0.0%) |
| Business & Financial | 0 (0.0%) | 0 (0.0%) |
| Computers, Engineering & Science | 0 (0.0%) | 0 (0.0%) |
| Computers & Mathematics | 0 (0.0%) | 0 (0.0%) |
| Architecture & Engineering | 0 (0.0%) | 0 (0.0%) |
| Life, Physical & Social Science | 0 (0.0%) | 0 (0.0%) |
| Community & Social Service | 0 (0.0%) | 0 (0.0%) |
| Education, Arts & Media | 0 (0.0%) | 0 (0.0%) |
| Legal Services & Support | 0 (0.0%) | 0 (0.0%) |
| Education Instruction & Library | 0 (0.0%) | 0 (0.0%) |
| Arts, Media & Entertainment | 0 (0.0%) | 0 (0.0%) |
| Health Diagnosing & Treating | 0 (0.0%) | 0 (0.0%) |
| Health Technologists | 0 (0.0%) | 0 (0.0%) |
| Total (Category) | 0 (0.0%) | 0 (0.0%) |
| Total (Overall) | 12 (80.0%) | 3 (20.0%) |
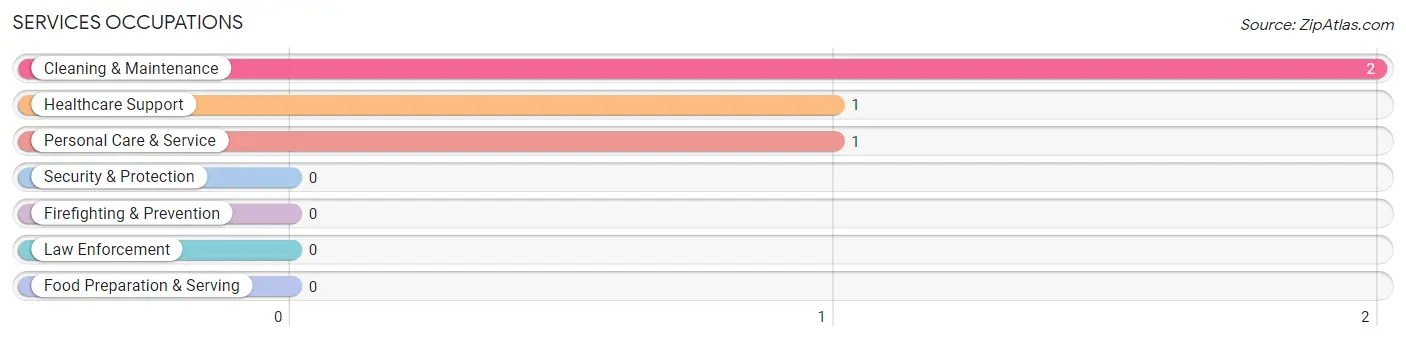
Services Occupations
The most common Services occupations in Humphreys are Cleaning & Maintenance (2 | 13.3%), Healthcare Support (1 | 6.7%), and Personal Care & Service (1 | 6.7%).
Services Occupations by Sex
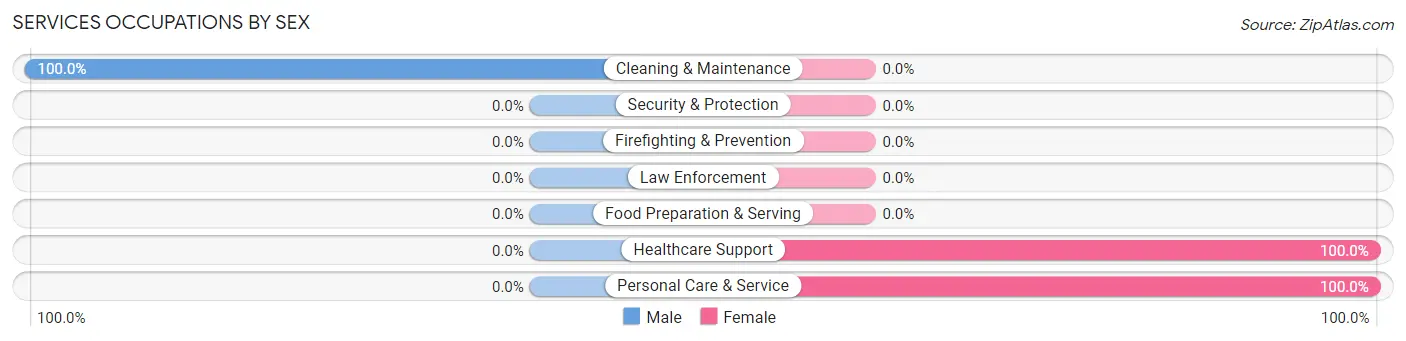
| Occupation | Male | Female |
| Healthcare Support | 0 (0.0%) | 1 (100.0%) |
| Security & Protection | 0 (0.0%) | 0 (0.0%) |
| Firefighting & Prevention | 0 (0.0%) | 0 (0.0%) |
| Law Enforcement | 0 (0.0%) | 0 (0.0%) |
| Food Preparation & Serving | 0 (0.0%) | 0 (0.0%) |
| Cleaning & Maintenance | 2 (100.0%) | 0 (0.0%) |
| Personal Care & Service | 0 (0.0%) | 1 (100.0%) |
| Total (Category) | 2 (50.0%) | 2 (50.0%) |
| Total (Overall) | 12 (80.0%) | 3 (20.0%) |
Sales and Office Occupations
The most common Sales and Office occupations in Humphreys are , and Office & Administration (1 | 6.7%).
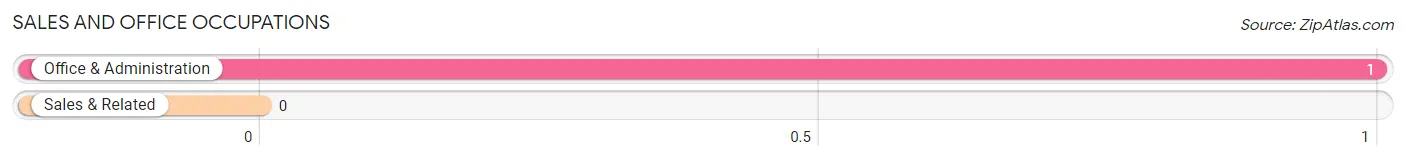
Sales and Office Occupations by Sex
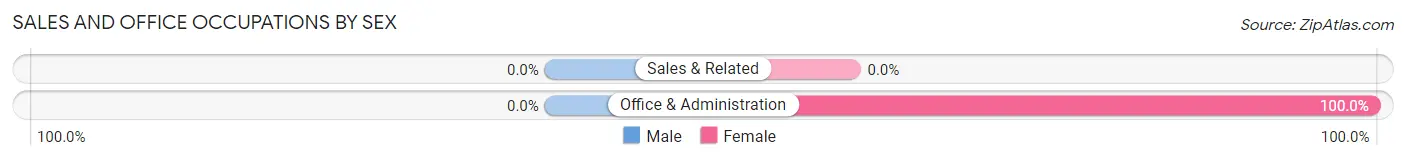
| Occupation | Male | Female |
| Sales & Related | 0 (0.0%) | 0 (0.0%) |
| Office & Administration | 0 (0.0%) | 1 (100.0%) |
| Total (Category) | 0 (0.0%) | 1 (100.0%) |
| Total (Overall) | 12 (80.0%) | 3 (20.0%) |
Natural Resources, Construction and Maintenance Occupations
The most common Natural Resources, Construction and Maintenance occupations in Humphreys are , and Installation, Maintenance & Repair (7 | 46.7%).
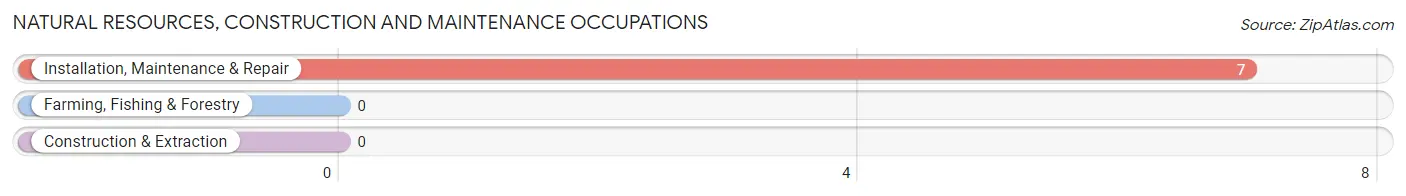
Natural Resources, Construction and Maintenance Occupations by Sex
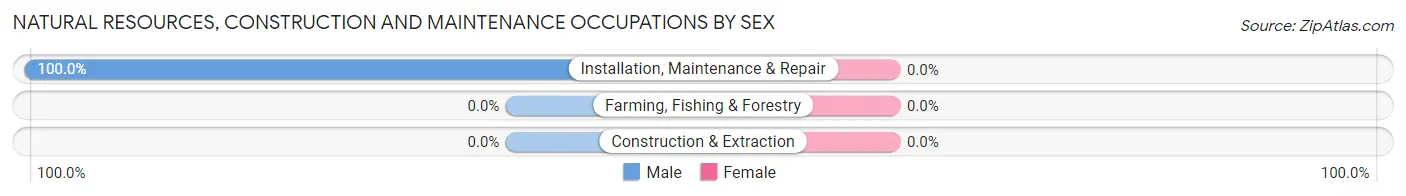
| Occupation | Male | Female |
| Farming, Fishing & Forestry | 0 (0.0%) | 0 (0.0%) |
| Construction & Extraction | 0 (0.0%) | 0 (0.0%) |
| Installation, Maintenance & Repair | 7 (100.0%) | 0 (0.0%) |
| Total (Category) | 7 (100.0%) | 0 (0.0%) |
| Total (Overall) | 12 (80.0%) | 3 (20.0%) |
Production, Transportation and Moving Occupations
The most common Production, Transportation and Moving occupations in Humphreys are Material Moving (2 | 13.3%), and Production (1 | 6.7%).
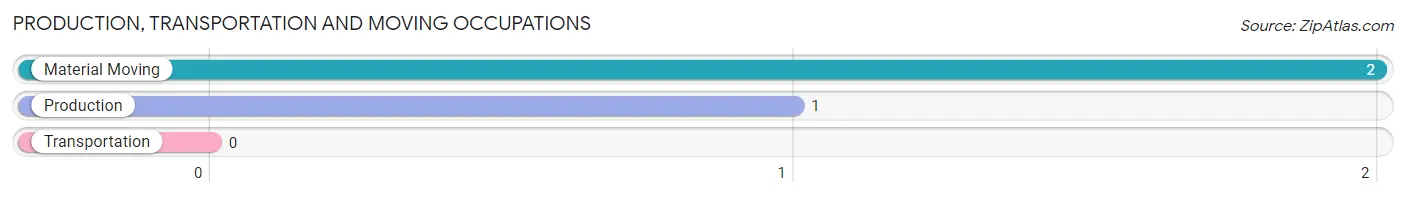
Production, Transportation and Moving Occupations by Sex
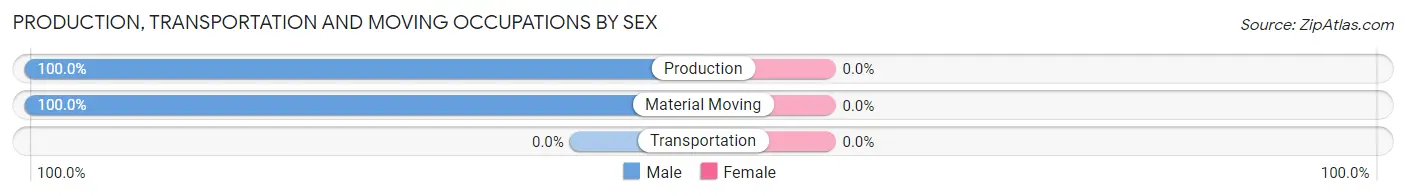
| Occupation | Male | Female |
| Production | 1 (100.0%) | 0 (0.0%) |
| Transportation | 0 (0.0%) | 0 (0.0%) |
| Material Moving | 2 (100.0%) | 0 (0.0%) |
| Total (Category) | 3 (100.0%) | 0 (0.0%) |
| Total (Overall) | 12 (80.0%) | 3 (20.0%) |
Employment Industries by Sex in Humphreys
Employment Industries in Humphreys
The major employment industries in Humphreys include Manufacturing (5 | 33.3%), Retail Trade (5 | 33.3%), Health Care & Social Assistance (2 | 13.3%), and Construction (1 | 6.7%).

Employment Industries by Sex in Humphreys
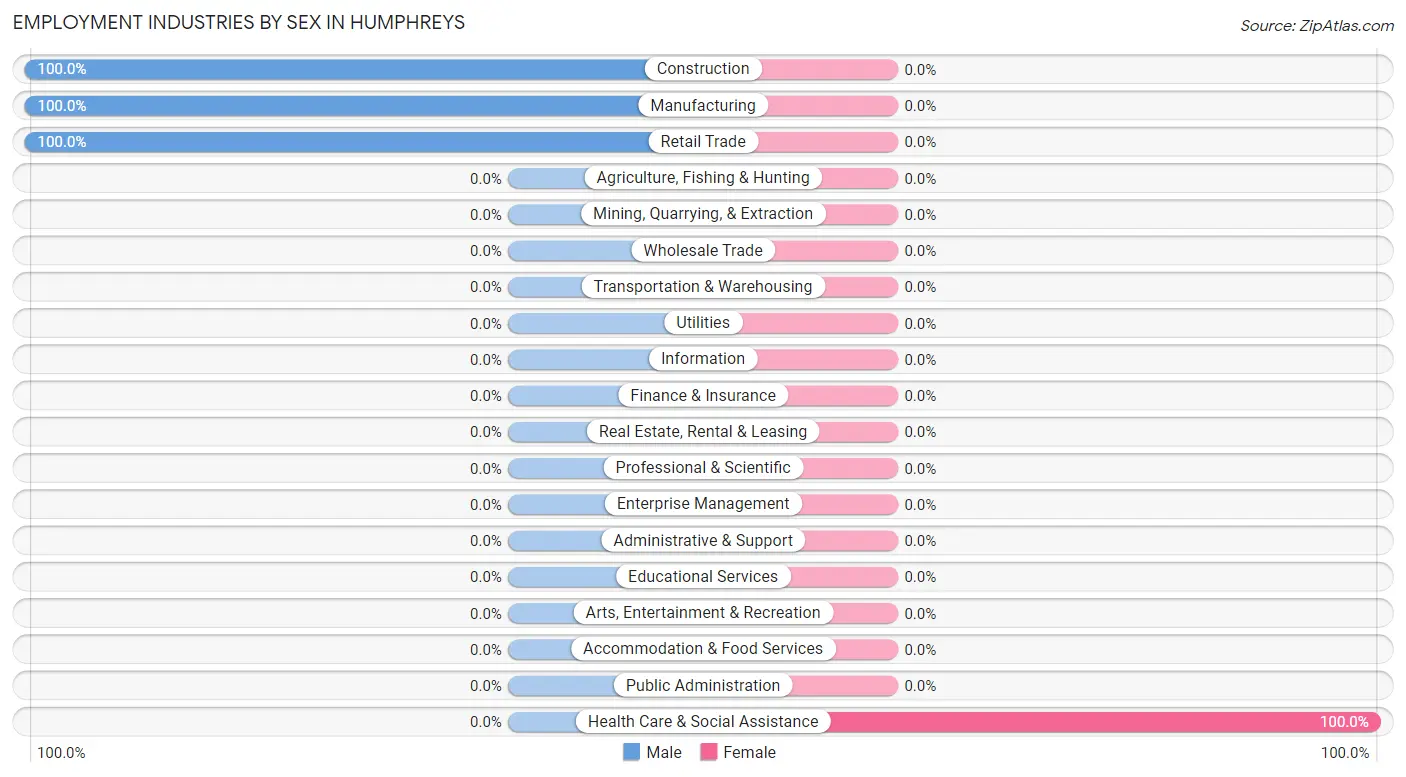
| Industry | Male | Female |
| Agriculture, Fishing & Hunting | 0 (0.0%) | 0 (0.0%) |
| Mining, Quarrying, & Extraction | 0 (0.0%) | 0 (0.0%) |
| Construction | 1 (100.0%) | 0 (0.0%) |
| Manufacturing | 5 (100.0%) | 0 (0.0%) |
| Wholesale Trade | 0 (0.0%) | 0 (0.0%) |
| Retail Trade | 5 (100.0%) | 0 (0.0%) |
| Transportation & Warehousing | 0 (0.0%) | 0 (0.0%) |
| Utilities | 0 (0.0%) | 0 (0.0%) |
| Information | 0 (0.0%) | 0 (0.0%) |
| Finance & Insurance | 0 (0.0%) | 0 (0.0%) |
| Real Estate, Rental & Leasing | 0 (0.0%) | 0 (0.0%) |
| Professional & Scientific | 0 (0.0%) | 0 (0.0%) |
| Enterprise Management | 0 (0.0%) | 0 (0.0%) |
| Administrative & Support | 0 (0.0%) | 0 (0.0%) |
| Educational Services | 0 (0.0%) | 0 (0.0%) |
| Health Care & Social Assistance | 0 (0.0%) | 2 (100.0%) |
| Arts, Entertainment & Recreation | 0 (0.0%) | 0 (0.0%) |
| Accommodation & Food Services | 0 (0.0%) | 0 (0.0%) |
| Public Administration | 0 (0.0%) | 0 (0.0%) |
| Total | 12 (80.0%) | 3 (20.0%) |
Education in Humphreys
School Enrollment in Humphreys
The most common levels of schooling among the 14 students in Humphreys are elementary school (7 | 50.0%), middle school (6 | 42.9%), and college / undergraduate (1 | 7.1%).
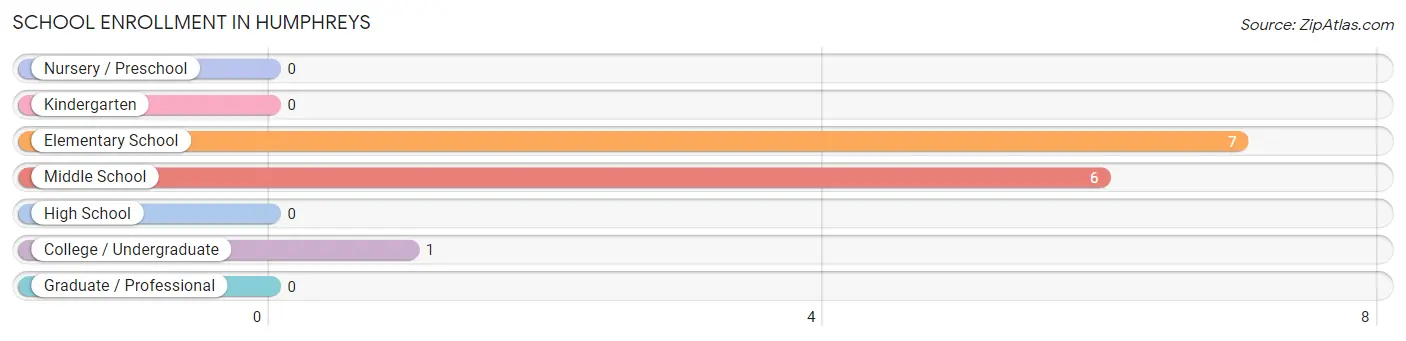
| School Level | # Students | % Students |
| Nursery / Preschool | 0 | 0.0% |
| Kindergarten | 0 | 0.0% |
| Elementary School | 7 | 50.0% |
| Middle School | 6 | 42.9% |
| High School | 0 | 0.0% |
| College / Undergraduate | 1 | 7.1% |
| Graduate / Professional | 0 | 0.0% |
| Total | 14 | 100.0% |
School Enrollment by Age by Funding Source in Humphreys
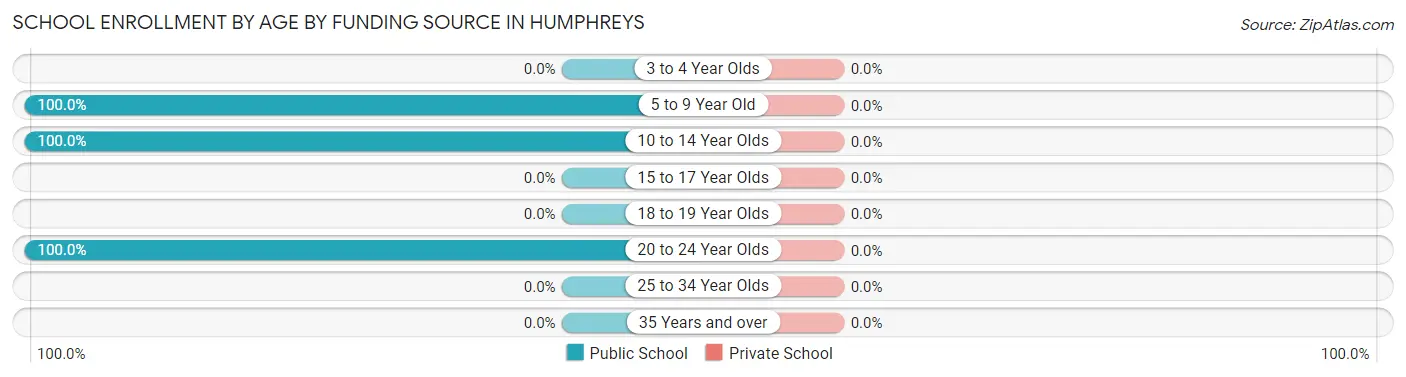
| Age Bracket | Public School | Private School |
| 3 to 4 Year Olds | 0 (0.0%) | 0 (0.0%) |
| 5 to 9 Year Old | 3 (100.0%) | 0 (0.0%) |
| 10 to 14 Year Olds | 10 (100.0%) | 0 (0.0%) |
| 15 to 17 Year Olds | 0 (0.0%) | 0 (0.0%) |
| 18 to 19 Year Olds | 0 (0.0%) | 0 (0.0%) |
| 20 to 24 Year Olds | 1 (100.0%) | 0 (0.0%) |
| 25 to 34 Year Olds | 0 (0.0%) | 0 (0.0%) |
| 35 Years and over | 0 (0.0%) | 0 (0.0%) |
| Total | 14 (100.0%) | 0 (0.0%) |
Educational Attainment by Field of Study in Humphreys
| Field of Study | # Graduates | % Graduates |
| Computers & Mathematics | 0 | 0.0% |
| Bio, Nature & Agricultural | 0 | 0.0% |
| Physical & Health Sciences | 0 | 0.0% |
| Psychology | 0 | 0.0% |
| Social Sciences | 0 | 0.0% |
| Engineering | 0 | 0.0% |
| Multidisciplinary Studies | 0 | 0.0% |
| Science & Technology | 0 | 0.0% |
| Business | 0 | 0.0% |
| Education | 0 | 0.0% |
| Literature & Languages | 0 | 0.0% |
| Liberal Arts & History | 0 | 0.0% |
| Visual & Performing Arts | 0 | 0.0% |
| Communications | 0 | 0.0% |
| Arts & Humanities | 0 | 0.0% |
| Total | 0 | 0.0% |
Transportation & Commute in Humphreys
Vehicle Availability by Sex in Humphreys
The most prevalent vehicle ownership categories in Humphreys are males with 2 vehicles (7, accounting for 58.3%) and females with 2 vehicles (2, making up 233.3%).
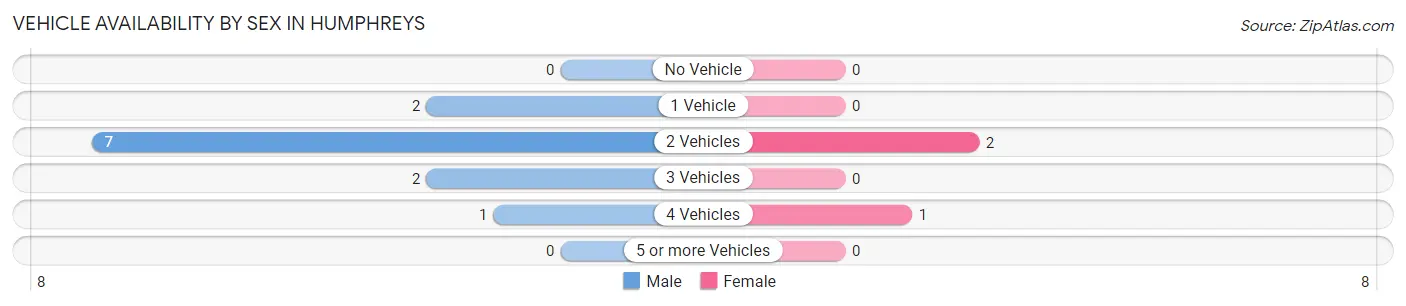
| Vehicles Available | Male | Female |
| No Vehicle | 0 (0.0%) | 0 (0.0%) |
| 1 Vehicle | 2 (16.7%) | 0 (0.0%) |
| 2 Vehicles | 7 (58.3%) | 2 (66.7%) |
| 3 Vehicles | 2 (16.7%) | 0 (0.0%) |
| 4 Vehicles | 1 (8.3%) | 1 (33.3%) |
| 5 or more Vehicles | 0 (0.0%) | 0 (0.0%) |
| Total | 12 (100.0%) | 3 (100.0%) |
Commute Time in Humphreys
The most frequently occuring commute durations in Humphreys are 20 to 24 minutes (6 commuters, 42.9%), 25 to 29 minutes (5 commuters, 35.7%), and 30 to 34 minutes (3 commuters, 21.4%).
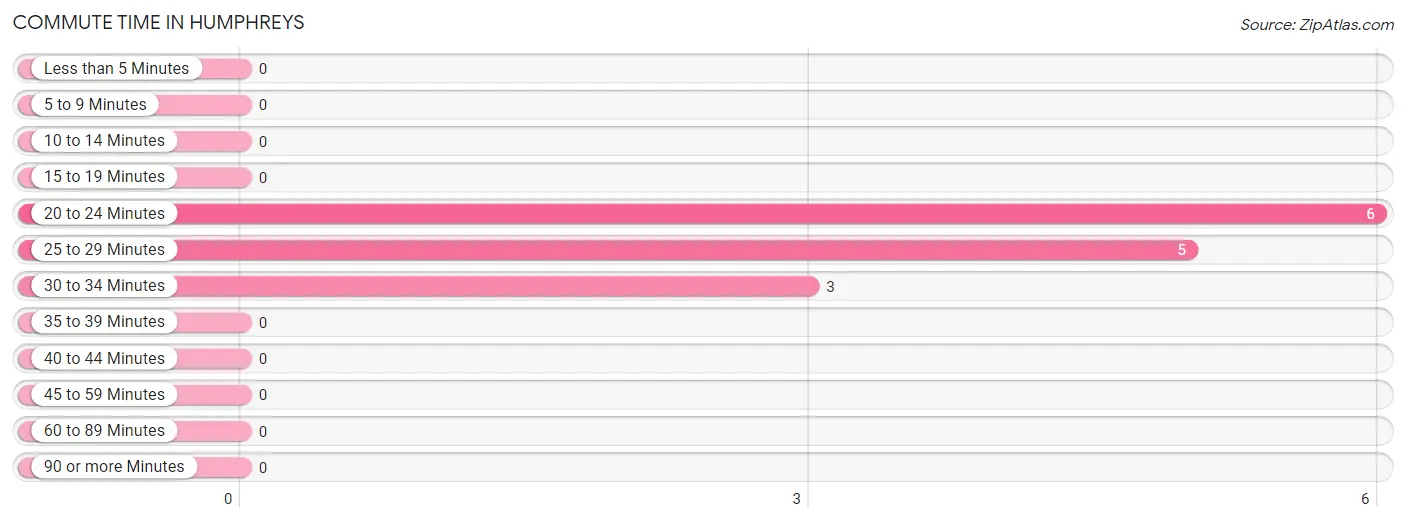
| Commute Time | # Commuters | % Commuters |
| Less than 5 Minutes | 0 | 0.0% |
| 5 to 9 Minutes | 0 | 0.0% |
| 10 to 14 Minutes | 0 | 0.0% |
| 15 to 19 Minutes | 0 | 0.0% |
| 20 to 24 Minutes | 6 | 42.9% |
| 25 to 29 Minutes | 5 | 35.7% |
| 30 to 34 Minutes | 3 | 21.4% |
| 35 to 39 Minutes | 0 | 0.0% |
| 40 to 44 Minutes | 0 | 0.0% |
| 45 to 59 Minutes | 0 | 0.0% |
| 60 to 89 Minutes | 0 | 0.0% |
| 90 or more Minutes | 0 | 0.0% |
Commute Time by Sex in Humphreys
The most common commute times in Humphreys are 20 to 24 minutes (5 commuters, 41.7%) for males and 20 to 24 minutes (1 commuters, 50.0%) for females.
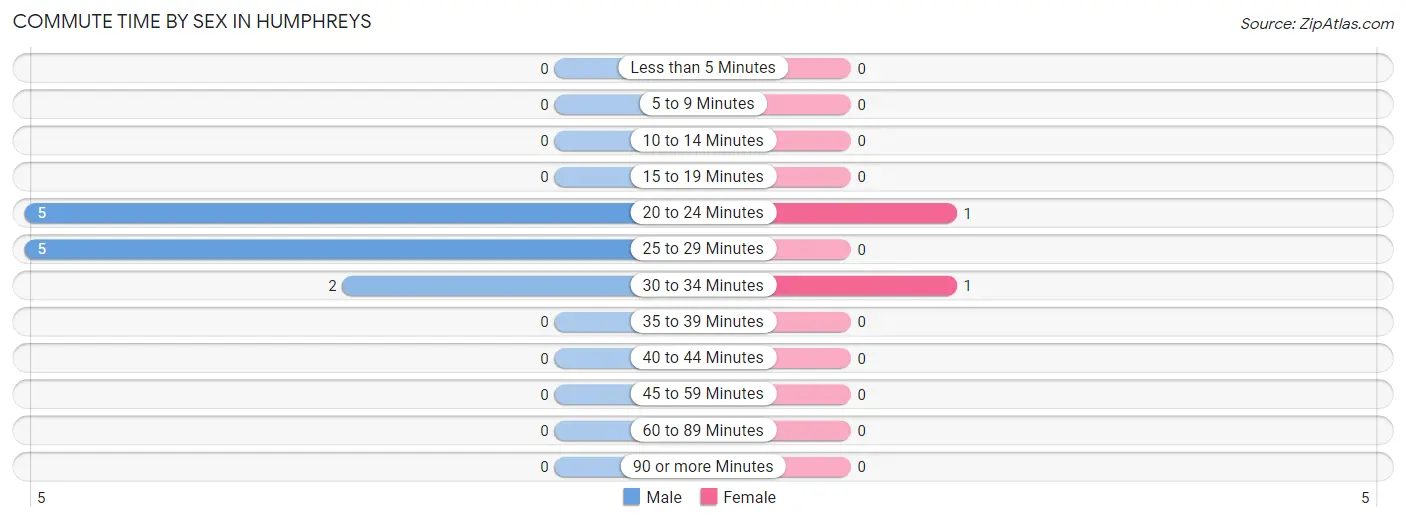
| Commute Time | Male | Female |
| Less than 5 Minutes | 0 (0.0%) | 0 (0.0%) |
| 5 to 9 Minutes | 0 (0.0%) | 0 (0.0%) |
| 10 to 14 Minutes | 0 (0.0%) | 0 (0.0%) |
| 15 to 19 Minutes | 0 (0.0%) | 0 (0.0%) |
| 20 to 24 Minutes | 5 (41.7%) | 1 (50.0%) |
| 25 to 29 Minutes | 5 (41.7%) | 0 (0.0%) |
| 30 to 34 Minutes | 2 (16.7%) | 1 (50.0%) |
| 35 to 39 Minutes | 0 (0.0%) | 0 (0.0%) |
| 40 to 44 Minutes | 0 (0.0%) | 0 (0.0%) |
| 45 to 59 Minutes | 0 (0.0%) | 0 (0.0%) |
| 60 to 89 Minutes | 0 (0.0%) | 0 (0.0%) |
| 90 or more Minutes | 0 (0.0%) | 0 (0.0%) |
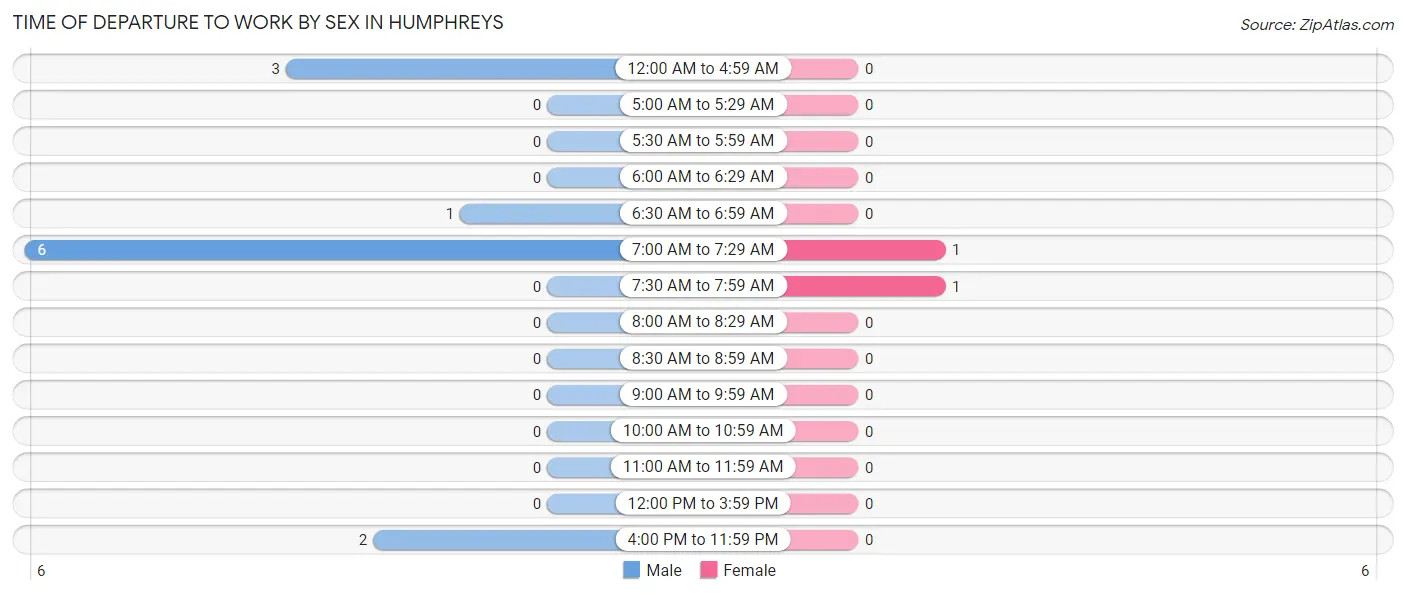
Time of Departure to Work by Sex in Humphreys
The most frequent times of departure to work in Humphreys are 7:00 AM to 7:29 AM (6, 50.0%) for males and 7:00 AM to 7:29 AM (1, 50.0%) for females.
| Time of Departure | Male | Female |
| 12:00 AM to 4:59 AM | 3 (25.0%) | 0 (0.0%) |
| 5:00 AM to 5:29 AM | 0 (0.0%) | 0 (0.0%) |
| 5:30 AM to 5:59 AM | 0 (0.0%) | 0 (0.0%) |
| 6:00 AM to 6:29 AM | 0 (0.0%) | 0 (0.0%) |
| 6:30 AM to 6:59 AM | 1 (8.3%) | 0 (0.0%) |
| 7:00 AM to 7:29 AM | 6 (50.0%) | 1 (50.0%) |
| 7:30 AM to 7:59 AM | 0 (0.0%) | 1 (50.0%) |
| 8:00 AM to 8:29 AM | 0 (0.0%) | 0 (0.0%) |
| 8:30 AM to 8:59 AM | 0 (0.0%) | 0 (0.0%) |
| 9:00 AM to 9:59 AM | 0 (0.0%) | 0 (0.0%) |
| 10:00 AM to 10:59 AM | 0 (0.0%) | 0 (0.0%) |
| 11:00 AM to 11:59 AM | 0 (0.0%) | 0 (0.0%) |
| 12:00 PM to 3:59 PM | 0 (0.0%) | 0 (0.0%) |
| 4:00 PM to 11:59 PM | 2 (16.7%) | 0 (0.0%) |
| Total | 12 (100.0%) | 2 (100.0%) |
Housing Occupancy in Humphreys
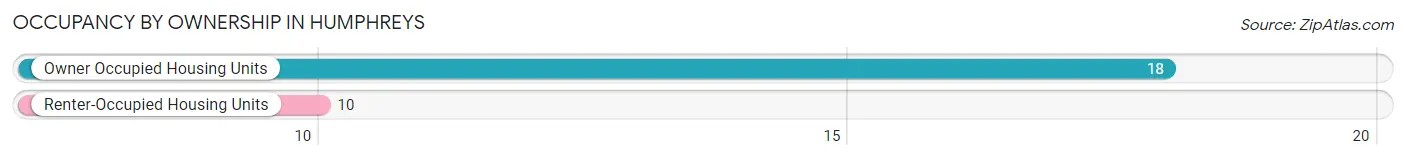
Occupancy by Ownership in Humphreys
Of the total 28 dwellings in Humphreys, owner-occupied units account for 18 (64.3%), while renter-occupied units make up 10 (35.7%).
| Occupancy | # Housing Units | % Housing Units |
| Owner Occupied Housing Units | 18 | 64.3% |
| Renter-Occupied Housing Units | 10 | 35.7% |
| Total Occupied Housing Units | 28 | 100.0% |
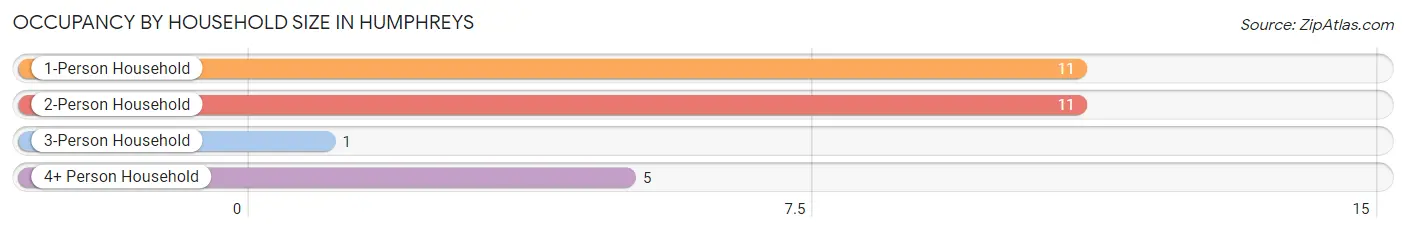
Occupancy by Household Size in Humphreys
| Household Size | # Housing Units | % Housing Units |
| 1-Person Household | 11 | 39.3% |
| 2-Person Household | 11 | 39.3% |
| 3-Person Household | 1 | 3.6% |
| 4+ Person Household | 5 | 17.9% |
| Total Housing Units | 28 | 100.0% |
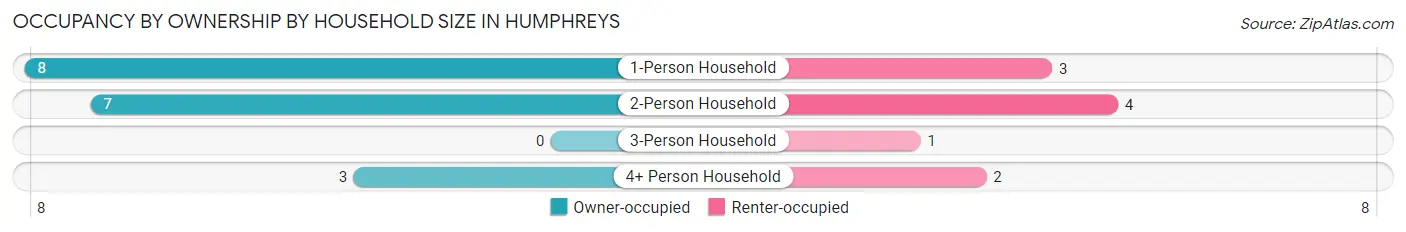
Occupancy by Ownership by Household Size in Humphreys
| Household Size | Owner-occupied | Renter-occupied |
| 1-Person Household | 8 (72.7%) | 3 (27.3%) |
| 2-Person Household | 7 (63.6%) | 4 (36.4%) |
| 3-Person Household | 0 (0.0%) | 1 (100.0%) |
| 4+ Person Household | 3 (60.0%) | 2 (40.0%) |
| Total Housing Units | 18 (64.3%) | 10 (35.7%) |
Occupancy by Educational Attainment in Humphreys
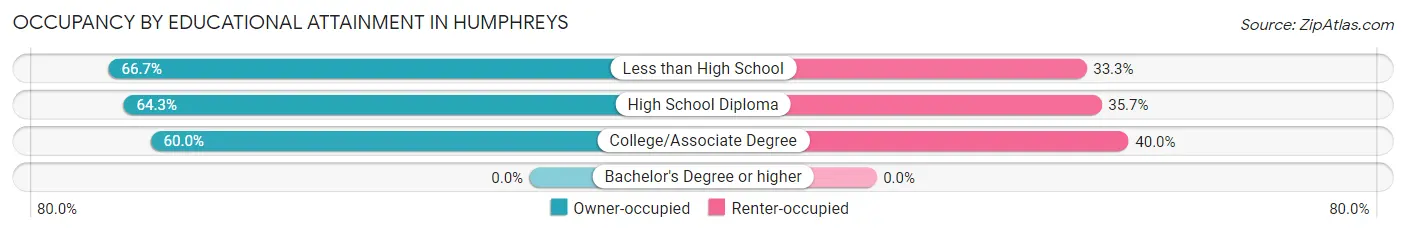
| Household Size | Owner-occupied | Renter-occupied |
| Less than High School | 6 (66.7%) | 3 (33.3%) |
| High School Diploma | 9 (64.3%) | 5 (35.7%) |
| College/Associate Degree | 3 (60.0%) | 2 (40.0%) |
| Bachelor's Degree or higher | 0 (0.0%) | 0 (0.0%) |
Occupancy by Age of Householder in Humphreys
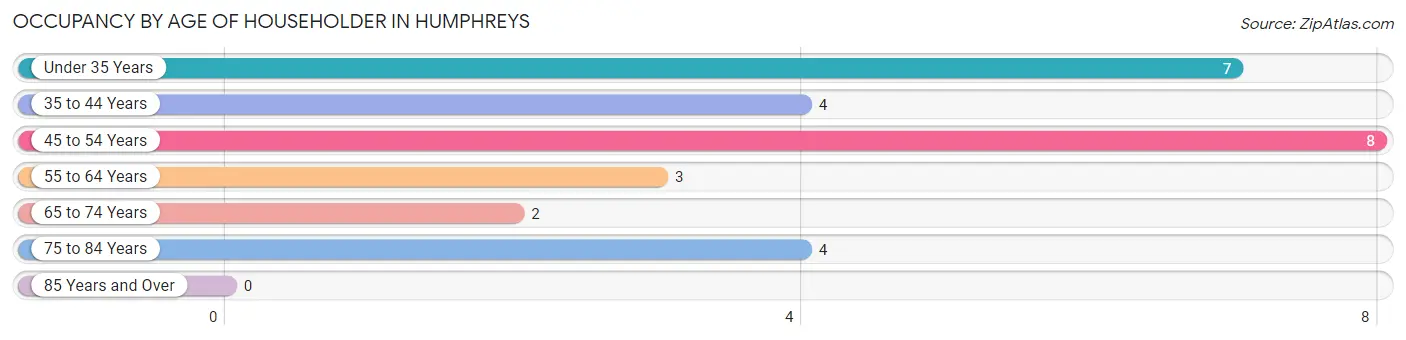
| Age Bracket | # Households | % Households |
| Under 35 Years | 7 | 25.0% |
| 35 to 44 Years | 4 | 14.3% |
| 45 to 54 Years | 8 | 28.6% |
| 55 to 64 Years | 3 | 10.7% |
| 65 to 74 Years | 2 | 7.1% |
| 75 to 84 Years | 4 | 14.3% |
| 85 Years and Over | 0 | 0.0% |
| Total | 28 | 100.0% |
Housing Finances in Humphreys
Median Income by Occupancy in Humphreys
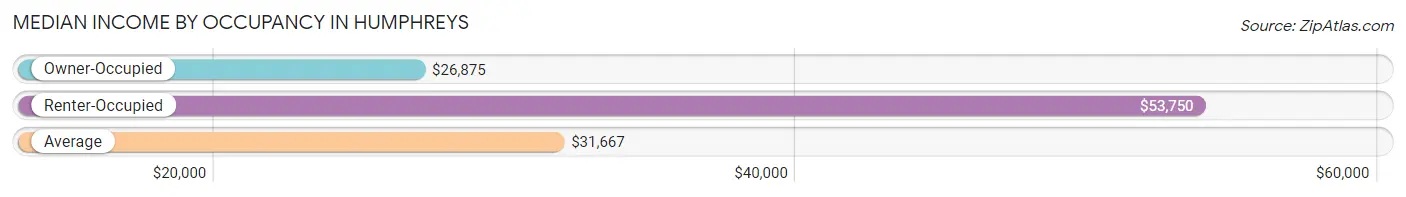
| Occupancy Type | # Households | Median Income |
| Owner-Occupied | 18 (64.3%) | $26,875 |
| Renter-Occupied | 10 (35.7%) | $53,750 |
| Average | 28 (100.0%) | $31,667 |
Occupancy by Householder Income Bracket in Humphreys
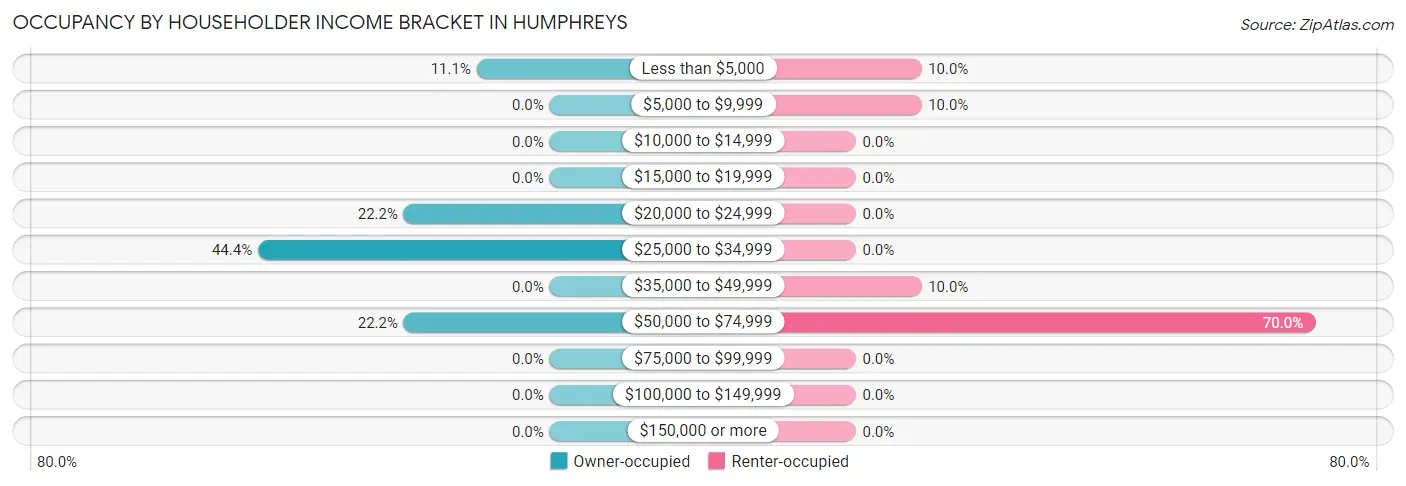
| Income Bracket | Owner-occupied | Renter-occupied |
| Less than $5,000 | 2 (11.1%) | 1 (10.0%) |
| $5,000 to $9,999 | 0 (0.0%) | 1 (10.0%) |
| $10,000 to $14,999 | 0 (0.0%) | 0 (0.0%) |
| $15,000 to $19,999 | 0 (0.0%) | 0 (0.0%) |
| $20,000 to $24,999 | 4 (22.2%) | 0 (0.0%) |
| $25,000 to $34,999 | 8 (44.4%) | 0 (0.0%) |
| $35,000 to $49,999 | 0 (0.0%) | 1 (10.0%) |
| $50,000 to $74,999 | 4 (22.2%) | 7 (70.0%) |
| $75,000 to $99,999 | 0 (0.0%) | 0 (0.0%) |
| $100,000 to $149,999 | 0 (0.0%) | 0 (0.0%) |
| $150,000 or more | 0 (0.0%) | 0 (0.0%) |
| Total | 18 (100.0%) | 10 (100.0%) |
Monthly Housing Cost Tiers in Humphreys
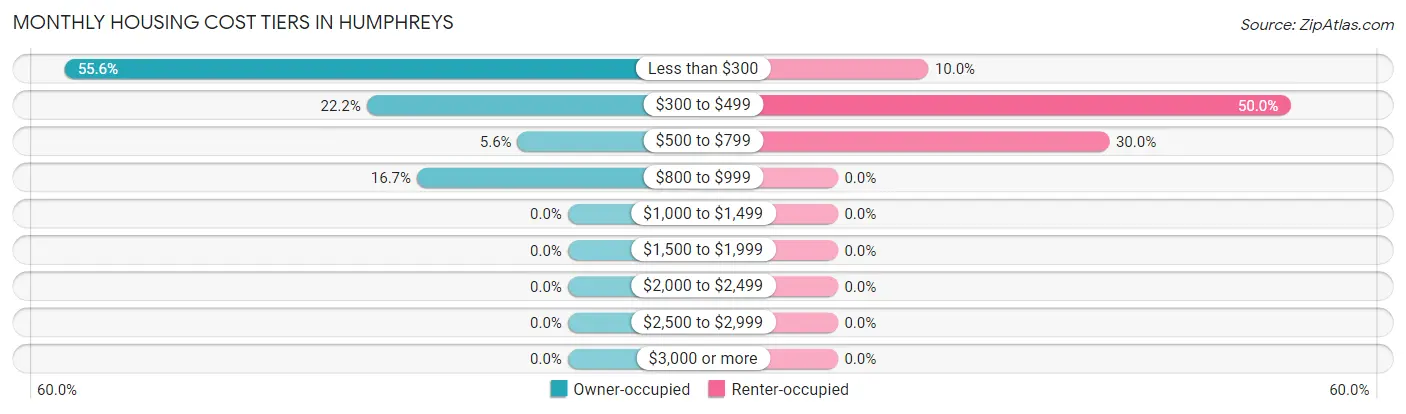
| Monthly Cost | Owner-occupied | Renter-occupied |
| Less than $300 | 10 (55.6%) | 1 (10.0%) |
| $300 to $499 | 4 (22.2%) | 5 (50.0%) |
| $500 to $799 | 1 (5.6%) | 3 (30.0%) |
| $800 to $999 | 3 (16.7%) | 0 (0.0%) |
| $1,000 to $1,499 | 0 (0.0%) | 0 (0.0%) |
| $1,500 to $1,999 | 0 (0.0%) | 0 (0.0%) |
| $2,000 to $2,499 | 0 (0.0%) | 0 (0.0%) |
| $2,500 to $2,999 | 0 (0.0%) | 0 (0.0%) |
| $3,000 or more | 0 (0.0%) | 0 (0.0%) |
| Total | 18 (100.0%) | 10 (100.0%) |
Physical Housing Characteristics in Humphreys
Housing Structures in Humphreys
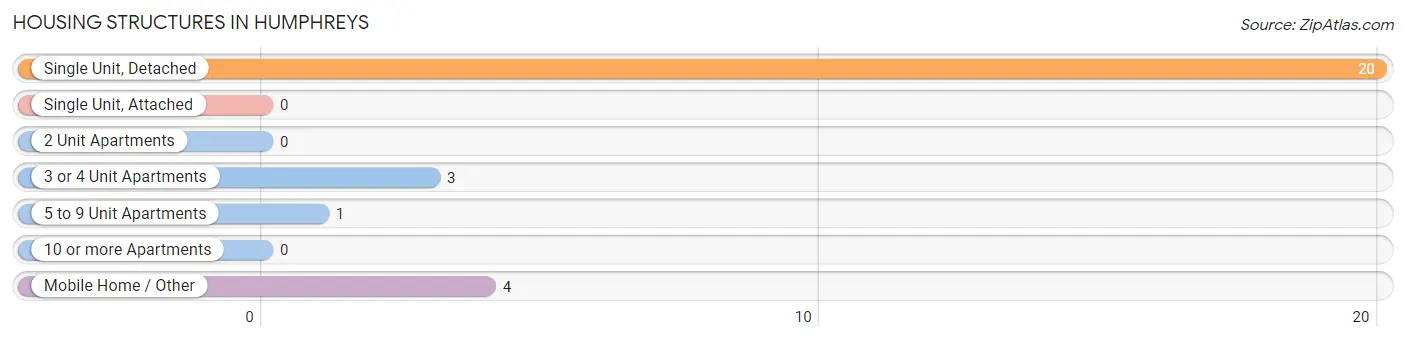
| Structure Type | # Housing Units | % Housing Units |
| Single Unit, Detached | 20 | 71.4% |
| Single Unit, Attached | 0 | 0.0% |
| 2 Unit Apartments | 0 | 0.0% |
| 3 or 4 Unit Apartments | 3 | 10.7% |
| 5 to 9 Unit Apartments | 1 | 3.6% |
| 10 or more Apartments | 0 | 0.0% |
| Mobile Home / Other | 4 | 14.3% |
| Total | 28 | 100.0% |
Housing Structures by Occupancy in Humphreys
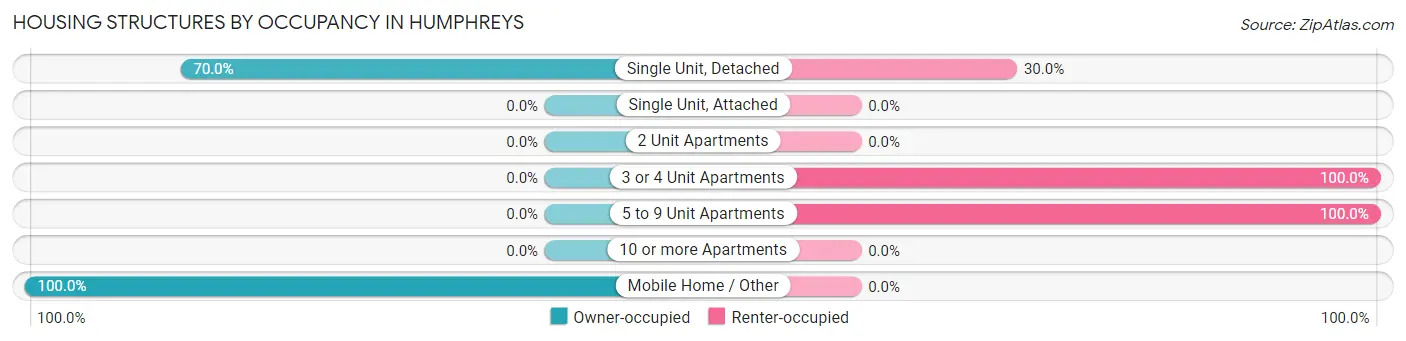
| Structure Type | Owner-occupied | Renter-occupied |
| Single Unit, Detached | 14 (70.0%) | 6 (30.0%) |
| Single Unit, Attached | 0 (0.0%) | 0 (0.0%) |
| 2 Unit Apartments | 0 (0.0%) | 0 (0.0%) |
| 3 or 4 Unit Apartments | 0 (0.0%) | 3 (100.0%) |
| 5 to 9 Unit Apartments | 0 (0.0%) | 1 (100.0%) |
| 10 or more Apartments | 0 (0.0%) | 0 (0.0%) |
| Mobile Home / Other | 4 (100.0%) | 0 (0.0%) |
| Total | 18 (64.3%) | 10 (35.7%) |
Housing Structures by Number of Rooms in Humphreys
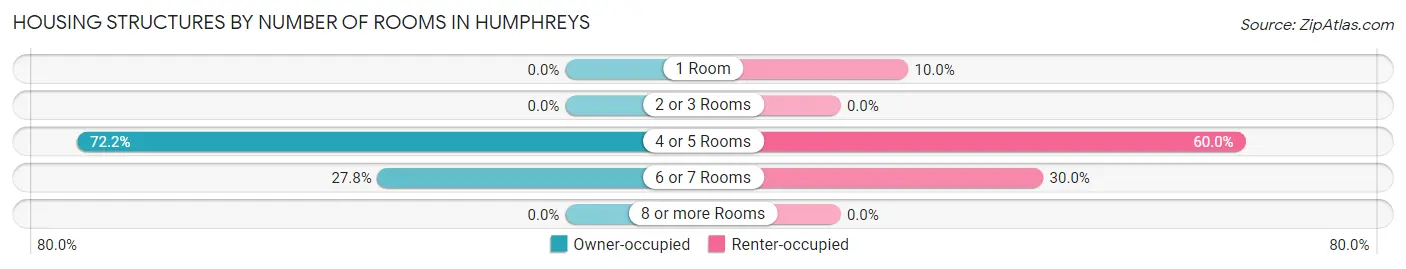
| Number of Rooms | Owner-occupied | Renter-occupied |
| 1 Room | 0 (0.0%) | 1 (10.0%) |
| 2 or 3 Rooms | 0 (0.0%) | 0 (0.0%) |
| 4 or 5 Rooms | 13 (72.2%) | 6 (60.0%) |
| 6 or 7 Rooms | 5 (27.8%) | 3 (30.0%) |
| 8 or more Rooms | 0 (0.0%) | 0 (0.0%) |
| Total | 18 (100.0%) | 10 (100.0%) |
Housing Structure by Heating Type in Humphreys
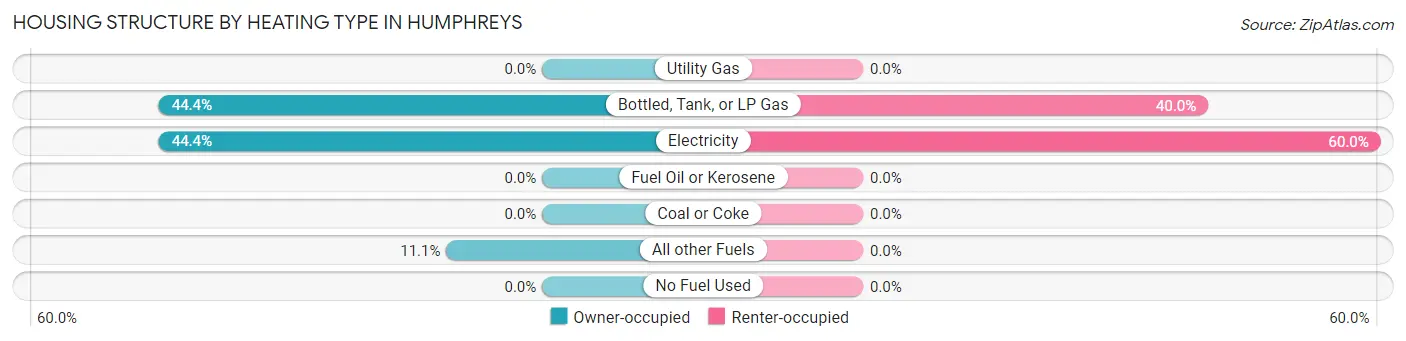
| Heating Type | Owner-occupied | Renter-occupied |
| Utility Gas | 0 (0.0%) | 0 (0.0%) |
| Bottled, Tank, or LP Gas | 8 (44.4%) | 4 (40.0%) |
| Electricity | 8 (44.4%) | 6 (60.0%) |
| Fuel Oil or Kerosene | 0 (0.0%) | 0 (0.0%) |
| Coal or Coke | 0 (0.0%) | 0 (0.0%) |
| All other Fuels | 2 (11.1%) | 0 (0.0%) |
| No Fuel Used | 0 (0.0%) | 0 (0.0%) |
| Total | 18 (100.0%) | 10 (100.0%) |
Household Vehicle Usage in Humphreys
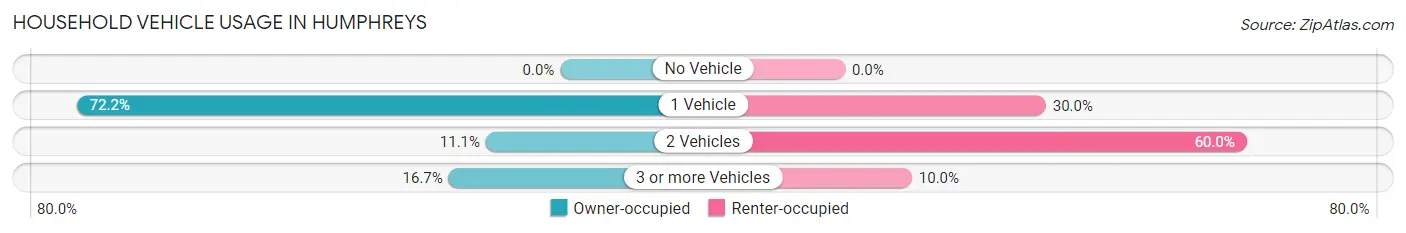
| Vehicles per Household | Owner-occupied | Renter-occupied |
| No Vehicle | 0 (0.0%) | 0 (0.0%) |
| 1 Vehicle | 13 (72.2%) | 3 (30.0%) |
| 2 Vehicles | 2 (11.1%) | 6 (60.0%) |
| 3 or more Vehicles | 3 (16.7%) | 1 (10.0%) |
| Total | 18 (100.0%) | 10 (100.0%) |
Real Estate & Mortgages in Humphreys
Real Estate and Mortgage Overview in Humphreys
| Characteristic | Without Mortgage | With Mortgage |
| Housing Units | 15 | 3 |
| Median Property Value | $17,500 | $0 |
| Median Household Income | $25,938 | $0 |
| Monthly Housing Costs | $275 | $0 |
| Real Estate Taxes | $250 | $0 |
Property Value by Mortgage Status in Humphreys
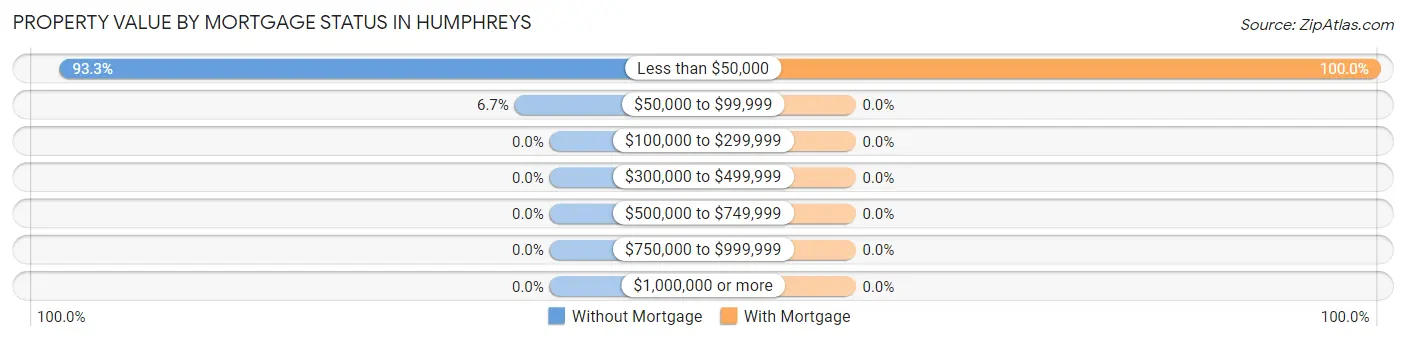
| Property Value | Without Mortgage | With Mortgage |
| Less than $50,000 | 14 (93.3%) | 3 (100.0%) |
| $50,000 to $99,999 | 1 (6.7%) | 0 (0.0%) |
| $100,000 to $299,999 | 0 (0.0%) | 0 (0.0%) |
| $300,000 to $499,999 | 0 (0.0%) | 0 (0.0%) |
| $500,000 to $749,999 | 0 (0.0%) | 0 (0.0%) |
| $750,000 to $999,999 | 0 (0.0%) | 0 (0.0%) |
| $1,000,000 or more | 0 (0.0%) | 0 (0.0%) |
| Total | 15 (100.0%) | 3 (100.0%) |
Household Income by Mortgage Status in Humphreys
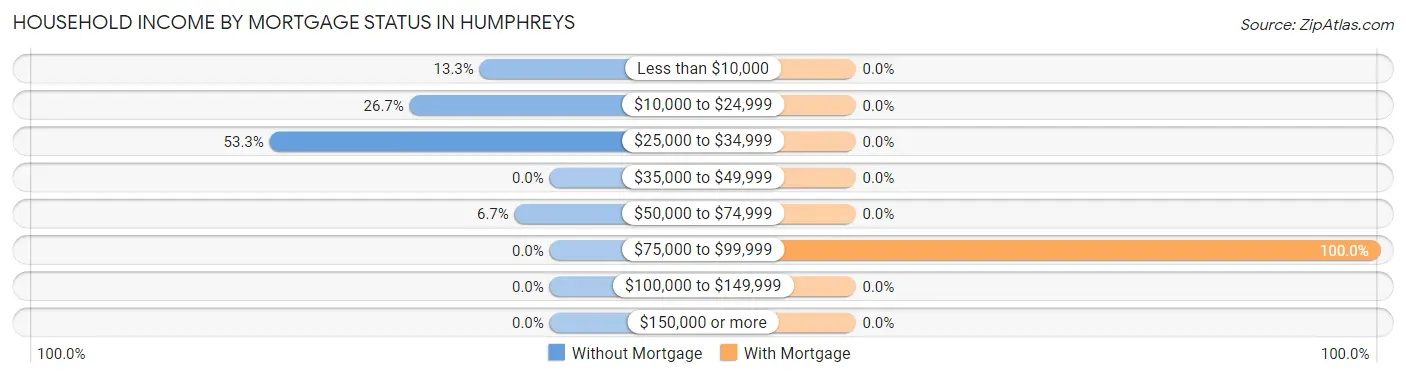
| Household Income | Without Mortgage | With Mortgage |
| Less than $10,000 | 2 (13.3%) | 0 (0.0%) |
| $10,000 to $24,999 | 4 (26.7%) | 0 (0.0%) |
| $25,000 to $34,999 | 8 (53.3%) | 0 (0.0%) |
| $35,000 to $49,999 | 0 (0.0%) | 0 (0.0%) |
| $50,000 to $74,999 | 1 (6.7%) | 0 (0.0%) |
| $75,000 to $99,999 | 0 (0.0%) | 3 (100.0%) |
| $100,000 to $149,999 | 0 (0.0%) | 0 (0.0%) |
| $150,000 or more | 0 (0.0%) | 0 (0.0%) |
| Total | 15 (100.0%) | 3 (100.0%) |
Property Value to Household Income Ratio in Humphreys
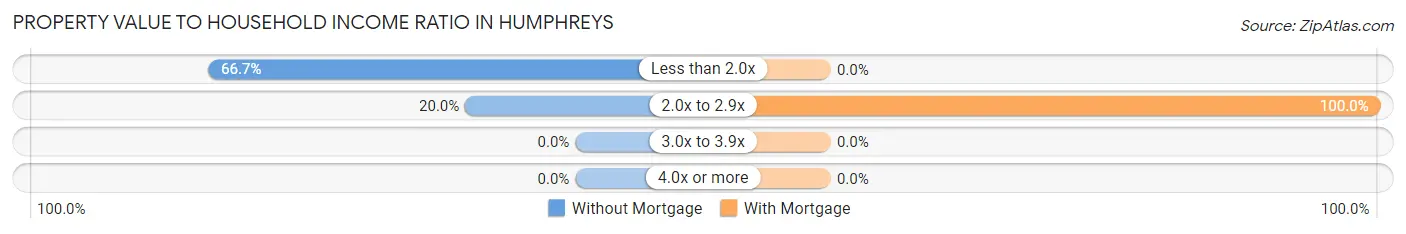
| Value-to-Income Ratio | Without Mortgage | With Mortgage |
| Less than 2.0x | 10 (66.7%) | 0 (0.0%) |
| 2.0x to 2.9x | 3 (20.0%) | 3 (100.0%) |
| 3.0x to 3.9x | 0 (0.0%) | 0 (0.0%) |
| 4.0x or more | 0 (0.0%) | 0 (0.0%) |
| Total | 15 (100.0%) | 3 (100.0%) |
Real Estate Taxes by Mortgage Status in Humphreys
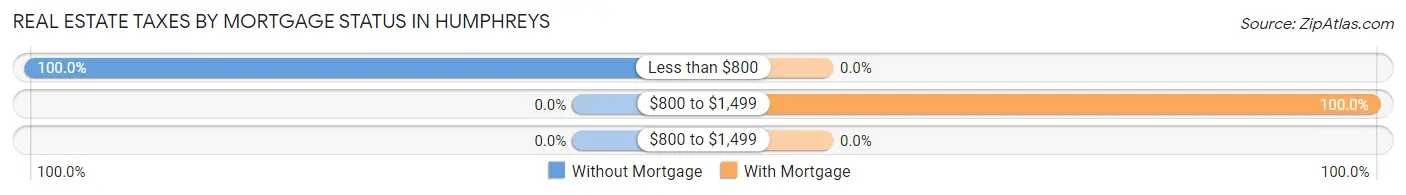
| Property Taxes | Without Mortgage | With Mortgage |
| Less than $800 | 15 (100.0%) | 0 (0.0%) |
| $800 to $1,499 | 0 (0.0%) | 3 (100.0%) |
| $800 to $1,499 | 0 (0.0%) | 0 (0.0%) |
| Total | 15 (100.0%) | 3 (100.0%) |
Health & Disability in Humphreys
Health Insurance Coverage by Age in Humphreys
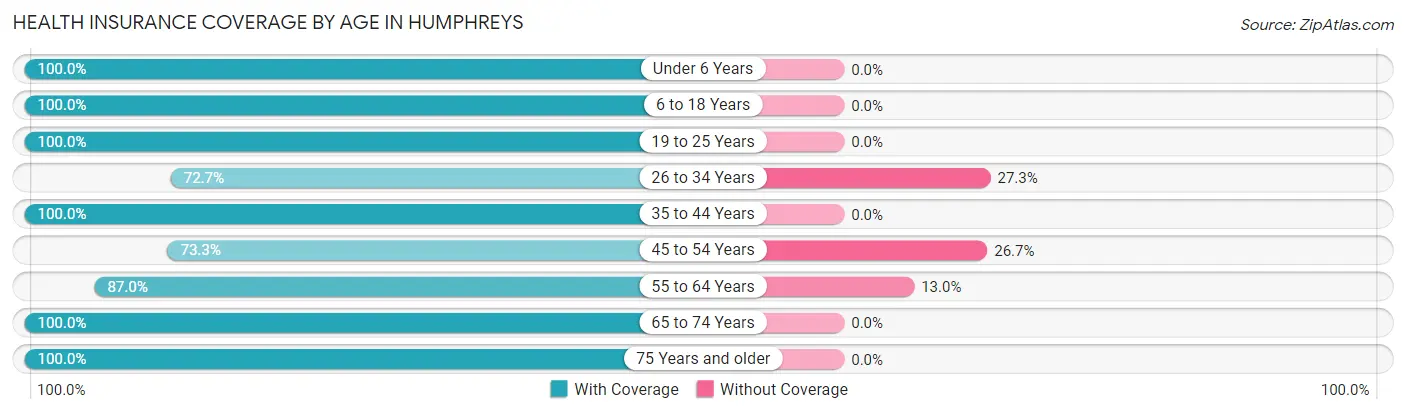
| Age Bracket | With Coverage | Without Coverage |
| Under 6 Years | 6 (100.0%) | 0 (0.0%) |
| 6 to 18 Years | 13 (100.0%) | 0 (0.0%) |
| 19 to 25 Years | 2 (100.0%) | 0 (0.0%) |
| 26 to 34 Years | 8 (72.7%) | 3 (27.3%) |
| 35 to 44 Years | 6 (100.0%) | 0 (0.0%) |
| 45 to 54 Years | 11 (73.3%) | 4 (26.7%) |
| 55 to 64 Years | 20 (87.0%) | 3 (13.0%) |
| 65 to 74 Years | 2 (100.0%) | 0 (0.0%) |
| 75 Years and older | 7 (100.0%) | 0 (0.0%) |
| Total | 75 (88.2%) | 10 (11.8%) |
Health Insurance Coverage by Citizenship Status in Humphreys
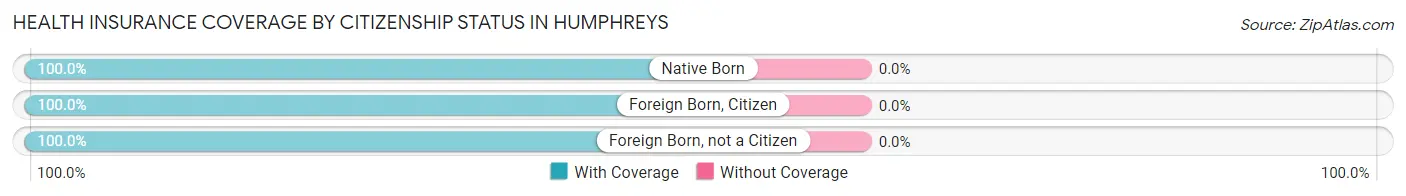
| Citizenship Status | With Coverage | Without Coverage |
| Native Born | 6 (100.0%) | 0 (0.0%) |
| Foreign Born, Citizen | 13 (100.0%) | 0 (0.0%) |
| Foreign Born, not a Citizen | 2 (100.0%) | 0 (0.0%) |
Health Insurance Coverage by Household Income in Humphreys
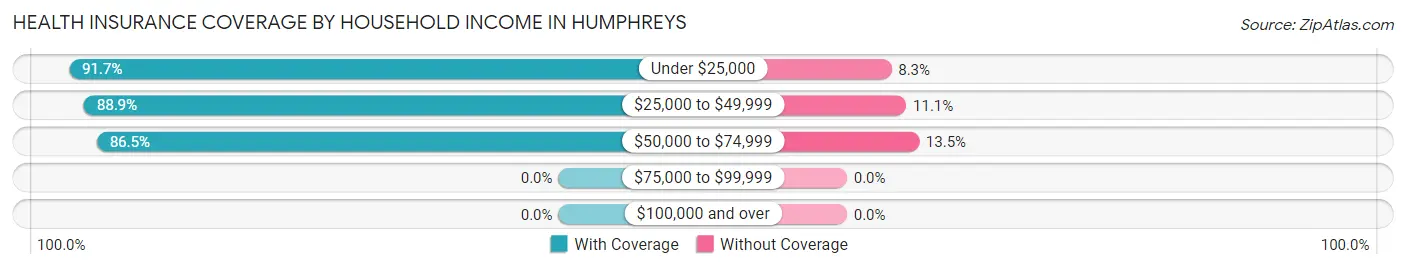
| Household Income | With Coverage | Without Coverage |
| Under $25,000 | 11 (91.7%) | 1 (8.3%) |
| $25,000 to $49,999 | 32 (88.9%) | 4 (11.1%) |
| $50,000 to $74,999 | 32 (86.5%) | 5 (13.5%) |
| $75,000 to $99,999 | 0 (0.0%) | 0 (0.0%) |
| $100,000 and over | 0 (0.0%) | 0 (0.0%) |
Public vs Private Health Insurance Coverage by Age in Humphreys
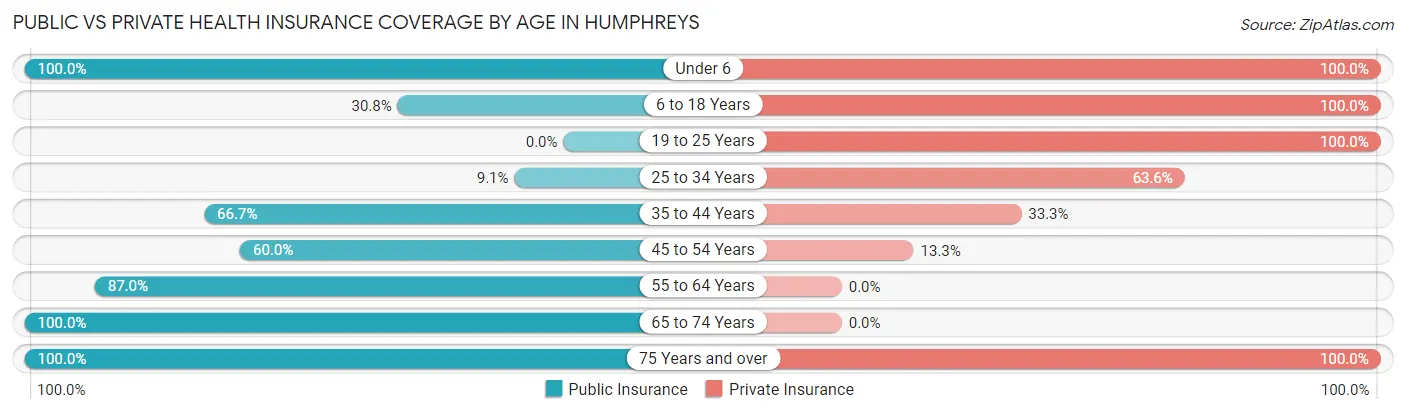
| Age Bracket | Public Insurance | Private Insurance |
| Under 6 | 6 (100.0%) | 6 (100.0%) |
| 6 to 18 Years | 4 (30.8%) | 13 (100.0%) |
| 19 to 25 Years | 0 (0.0%) | 2 (100.0%) |
| 25 to 34 Years | 1 (9.1%) | 7 (63.6%) |
| 35 to 44 Years | 4 (66.7%) | 2 (33.3%) |
| 45 to 54 Years | 9 (60.0%) | 2 (13.3%) |
| 55 to 64 Years | 20 (87.0%) | 0 (0.0%) |
| 65 to 74 Years | 2 (100.0%) | 0 (0.0%) |
| 75 Years and over | 7 (100.0%) | 7 (100.0%) |
| Total | 53 (62.4%) | 39 (45.9%) |
Disability Status by Sex by Age in Humphreys
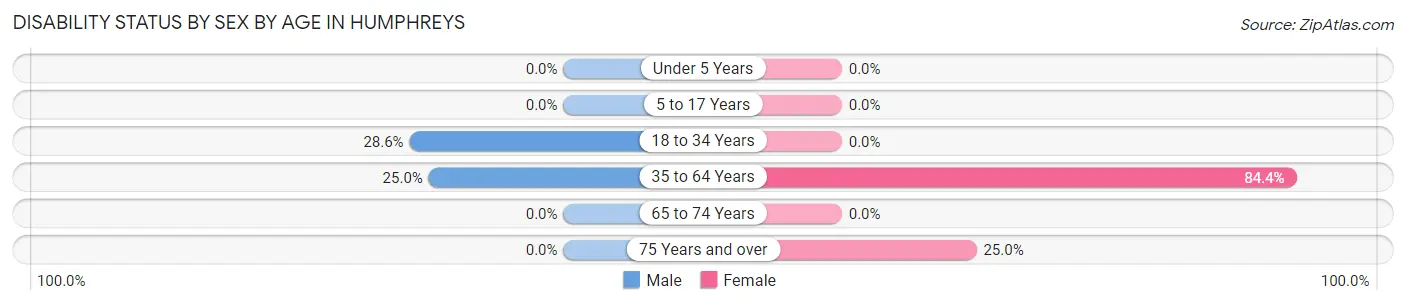
| Age Bracket | Male | Female |
| Under 5 Years | 0 (0.0%) | 0 (0.0%) |
| 5 to 17 Years | 0 (0.0%) | 0 (0.0%) |
| 18 to 34 Years | 2 (28.6%) | 0 (0.0%) |
| 35 to 64 Years | 3 (25.0%) | 27 (84.4%) |
| 65 to 74 Years | 0 (0.0%) | 0 (0.0%) |
| 75 Years and over | 0 (0.0%) | 1 (25.0%) |
Disability Class by Sex by Age in Humphreys
Disability Class: Hearing Difficulty
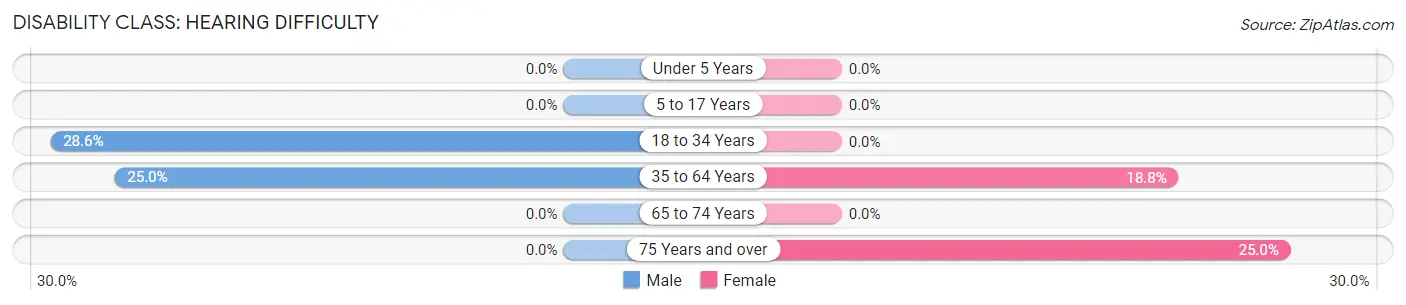
| Age Bracket | Male | Female |
| Under 5 Years | 0 (0.0%) | 0 (0.0%) |
| 5 to 17 Years | 0 (0.0%) | 0 (0.0%) |
| 18 to 34 Years | 2 (28.6%) | 0 (0.0%) |
| 35 to 64 Years | 3 (25.0%) | 6 (18.8%) |
| 65 to 74 Years | 0 (0.0%) | 0 (0.0%) |
| 75 Years and over | 0 (0.0%) | 1 (25.0%) |
Disability Class: Vision Difficulty
| Age Bracket | Male | Female |
| Under 5 Years | 0 (0.0%) | 0 (0.0%) |
| 5 to 17 Years | 0 (0.0%) | 0 (0.0%) |
| 18 to 34 Years | 0 (0.0%) | 0 (0.0%) |
| 35 to 64 Years | 0 (0.0%) | 0 (0.0%) |
| 65 to 74 Years | 0 (0.0%) | 0 (0.0%) |
| 75 Years and over | 0 (0.0%) | 0 (0.0%) |
Disability Class: Cognitive Difficulty
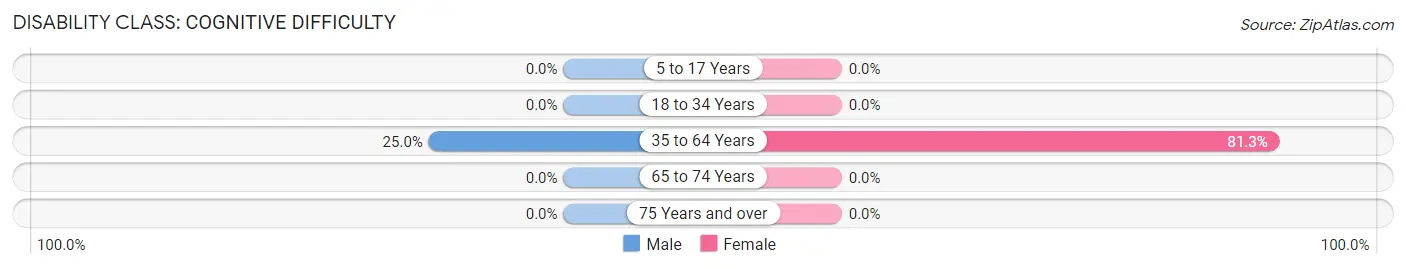
| Age Bracket | Male | Female |
| 5 to 17 Years | 0 (0.0%) | 0 (0.0%) |
| 18 to 34 Years | 0 (0.0%) | 0 (0.0%) |
| 35 to 64 Years | 3 (25.0%) | 26 (81.2%) |
| 65 to 74 Years | 0 (0.0%) | 0 (0.0%) |
| 75 Years and over | 0 (0.0%) | 0 (0.0%) |
Disability Class: Ambulatory Difficulty
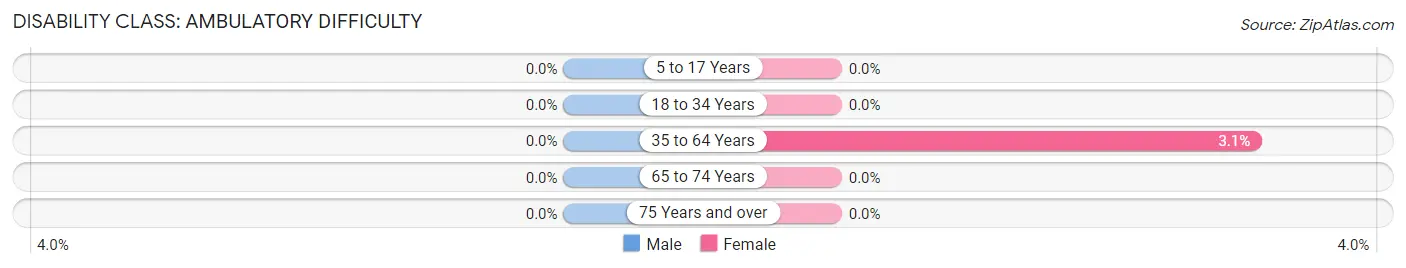
| Age Bracket | Male | Female |
| 5 to 17 Years | 0 (0.0%) | 0 (0.0%) |
| 18 to 34 Years | 0 (0.0%) | 0 (0.0%) |
| 35 to 64 Years | 0 (0.0%) | 1 (3.1%) |
| 65 to 74 Years | 0 (0.0%) | 0 (0.0%) |
| 75 Years and over | 0 (0.0%) | 0 (0.0%) |
Disability Class: Self-Care Difficulty
| Age Bracket | Male | Female |
| 5 to 17 Years | 0 (0.0%) | 0 (0.0%) |
| 18 to 34 Years | 0 (0.0%) | 0 (0.0%) |
| 35 to 64 Years | 0 (0.0%) | 0 (0.0%) |
| 65 to 74 Years | 0 (0.0%) | 0 (0.0%) |
| 75 Years and over | 0 (0.0%) | 0 (0.0%) |
Technology Access in Humphreys
Computing Device Access in Humphreys
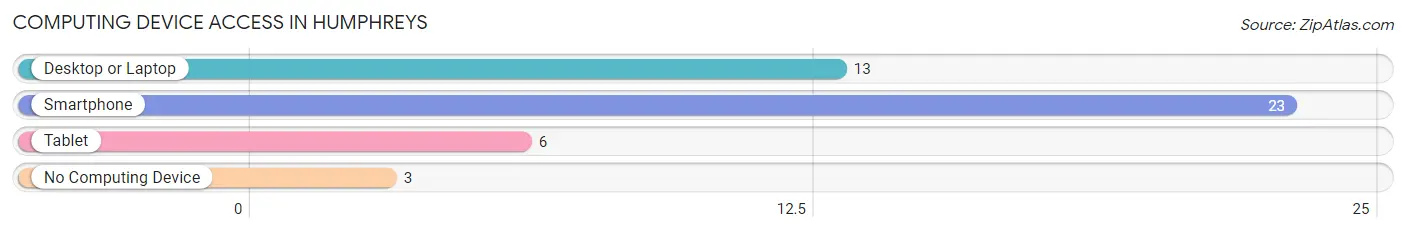
| Device Type | # Households | % Households |
| Desktop or Laptop | 13 | 46.4% |
| Smartphone | 23 | 82.1% |
| Tablet | 6 | 21.4% |
| No Computing Device | 3 | 10.7% |
| Total | 28 | 100.0% |
Internet Access in Humphreys
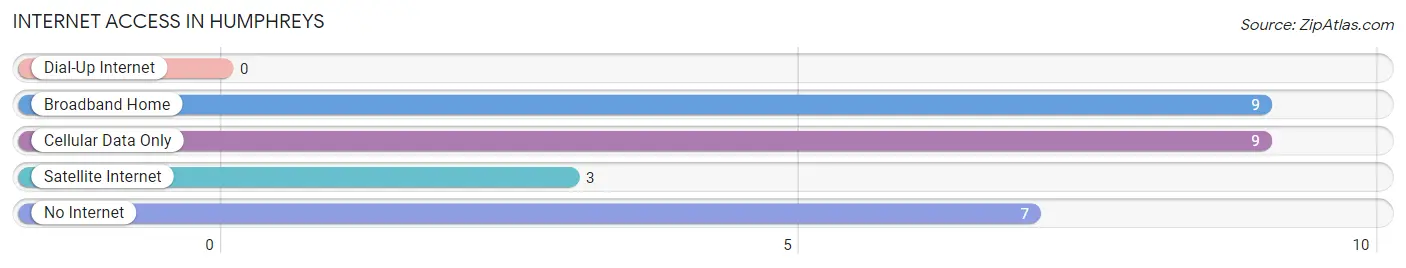
| Internet Type | # Households | % Households |
| Dial-Up Internet | 0 | 0.0% |
| Broadband Home | 9 | 32.1% |
| Cellular Data Only | 9 | 32.1% |
| Satellite Internet | 3 | 10.7% |
| No Internet | 7 | 25.0% |
| Total | 28 | 100.0% |
Humphreys Summary
Humphreys, Missouri is a small town located in the southeastern corner of the state, in Stoddard County. It is situated on the banks of the St. Francis River, and is surrounded by rolling hills and farmland. The town was founded in 1883, and has a population of just over 500 people.
Humphreys is a rural community, with a strong agricultural base. The town is home to several farms, as well as a few small businesses. The main industries in the area are farming, timber, and manufacturing. The town is also home to a few small restaurants and shops.
The town is served by the Stoddard County School District, which includes two elementary schools, one middle school, and one high school. The town also has a library, a post office, and a few churches.
Humphreys is located in a region of Missouri known as the Bootheel. This region is known for its rich soil and abundant wildlife. The area is also home to a variety of outdoor activities, such as fishing, hunting, and camping.
The town has a humid subtropical climate, with hot summers and mild winters. The average temperature in the summer is around 80 degrees Fahrenheit, and the average temperature in the winter is around 40 degrees Fahrenheit. The town receives an average of 40 inches of rain per year.
The population of Humphreys is predominantly white, with a small percentage of African Americans and Hispanics. The median household income is around $30,000, and the median home value is around $90,000. The town has a low unemployment rate, and the poverty rate is below the national average.
Humphreys is a small town with a rich history and a strong sense of community. The town is home to a variety of businesses, churches, and schools, and is a great place to raise a family. The town is also home to a variety of outdoor activities, and is a great place to enjoy the beauty of nature.
Common Questions
What is Per Capita Income in Humphreys?
Per Capita income in Humphreys is $13,298.
What is the Median Household income in Humphreys?
Median Household Income in Humphreys is $31,667.
What is Inequality or Gini Index in Humphreys?
Inequality or Gini Index in Humphreys is 0.33.
What is the Total Population of Humphreys?
Total Population of Humphreys is 85.
What is the Total Male Population of Humphreys?
Total Male Population of Humphreys is 36.
What is the Total Female Population of Humphreys?
Total Female Population of Humphreys is 49.
What is the Ratio of Males per 100 Females in Humphreys?
There are 73.47 Males per 100 Females in Humphreys.
What is the Ratio of Females per 100 Males in Humphreys?
There are 136.11 Females per 100 Males in Humphreys.
What is the Median Population Age in Humphreys?
Median Population Age in Humphreys is 50.6 Years.
What is the Average Family Size in Humphreys
Average Family Size in Humphreys is 3.1 People.
What is the Average Household Size in Humphreys
Average Household Size in Humphreys is 3.0 People.
How Large is the Labor Force in Humphreys?
There are 15 People in the Labor Forcein in Humphreys.
What is the Percentage of People in the Labor Force in Humphreys?
22.7% of People are in the Labor Force in Humphreys.