El Combate, PR Map & Demographics
El Combate Map
El Combate Overview
$15,844
PER CAPITA INCOME
$43,796
AVG FAMILY INCOME
$20,556
AVG HOUSEHOLD INCOME
0.48
INEQUALITY / GINI INDEX
357
TOTAL POPULATION
113
MALE POPULATION
244
FEMALE POPULATION
46.31
MALES / 100 FEMALES
215.93
FEMALES / 100 MALES
66.4
MEDIAN AGE
2.5
AVG FAMILY SIZE
1.8
AVG HOUSEHOLD SIZE
141
LABOR FORCE [ PEOPLE ]
39.5%
PERCENT IN LABOR FORCE
72.3%
UNEMPLOYMENT RATE
Income in El Combate
Income Overview in El Combate
Per Capita Income in El Combate is $15,844, while median incomes of families and households are $43,796 and $20,556 respectively.
| Characteristic | Number | Measure |
| Per Capita Income | 357 | $15,844 |
| Median Family Income | 106 | $43,796 |
| Mean Family Income | 106 | $45,394 |
| Median Household Income | 200 | $20,556 |
| Mean Household Income | 200 | $27,762 |
| Income Deficit | 106 | $0 |
| Wage / Income Gap (%) | 357 | 0.00% |
| Wage / Income Gap ($) | 357 | 100.00¢ per $1 |
| Gini / Inequality Index | 357 | 0.48 |
Earnings by Sex in El Combate
| Sex | Number | Average Earnings |
| Male | 23 (59.0%) | $0 |
| Female | 16 (41.0%) | $0 |
| Total | 39 (100.0%) | $0 |
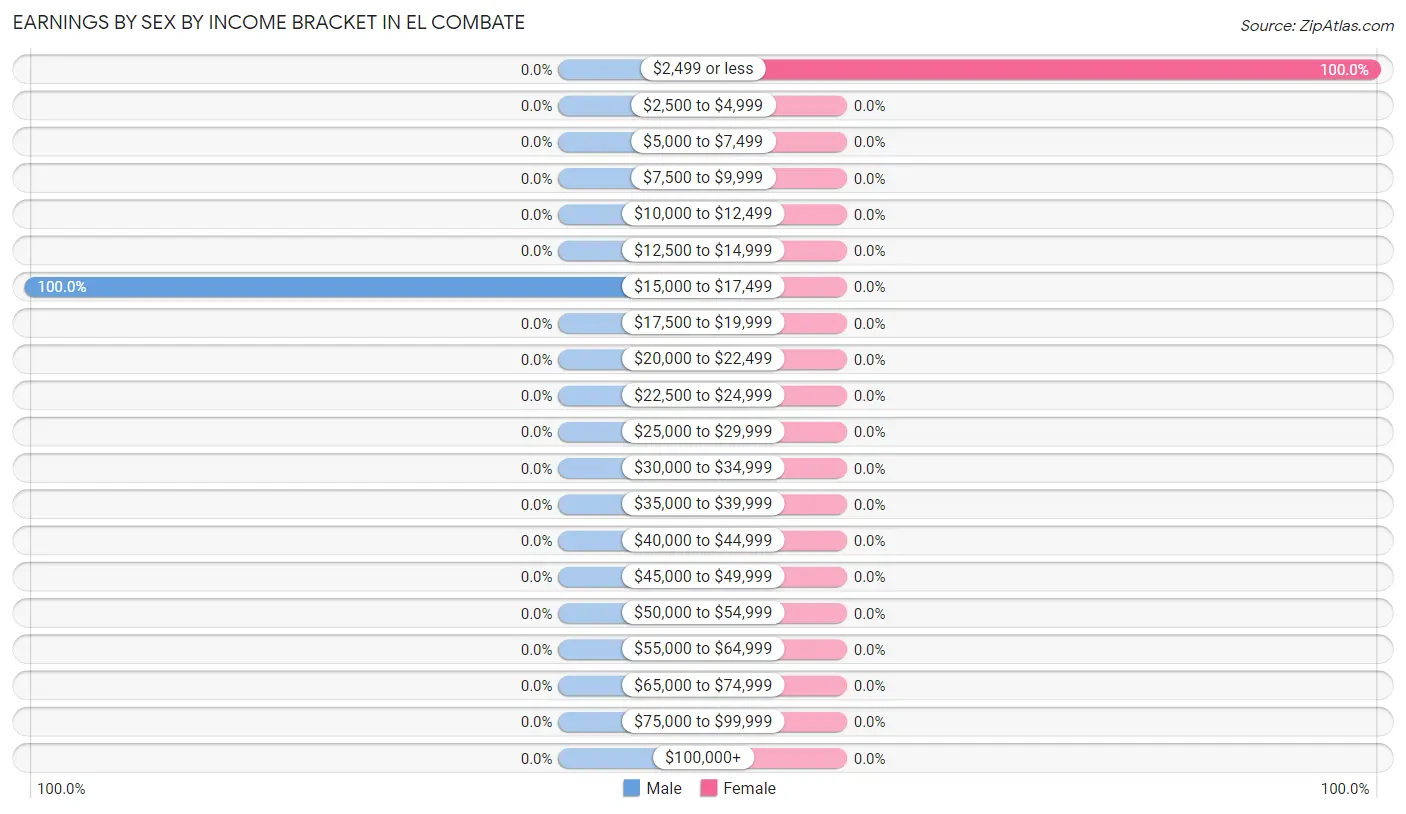
Earnings by Sex by Income Bracket in El Combate
The most common earnings brackets in El Combate are $15,000 to $17,499 for men (23 | 100.0%) and $2,499 or less for women (16 | 100.0%).
| Income | Male | Female |
| $2,499 or less | 0 (0.0%) | 16 (100.0%) |
| $2,500 to $4,999 | 0 (0.0%) | 0 (0.0%) |
| $5,000 to $7,499 | 0 (0.0%) | 0 (0.0%) |
| $7,500 to $9,999 | 0 (0.0%) | 0 (0.0%) |
| $10,000 to $12,499 | 0 (0.0%) | 0 (0.0%) |
| $12,500 to $14,999 | 0 (0.0%) | 0 (0.0%) |
| $15,000 to $17,499 | 23 (100.0%) | 0 (0.0%) |
| $17,500 to $19,999 | 0 (0.0%) | 0 (0.0%) |
| $20,000 to $22,499 | 0 (0.0%) | 0 (0.0%) |
| $22,500 to $24,999 | 0 (0.0%) | 0 (0.0%) |
| $25,000 to $29,999 | 0 (0.0%) | 0 (0.0%) |
| $30,000 to $34,999 | 0 (0.0%) | 0 (0.0%) |
| $35,000 to $39,999 | 0 (0.0%) | 0 (0.0%) |
| $40,000 to $44,999 | 0 (0.0%) | 0 (0.0%) |
| $45,000 to $49,999 | 0 (0.0%) | 0 (0.0%) |
| $50,000 to $54,999 | 0 (0.0%) | 0 (0.0%) |
| $55,000 to $64,999 | 0 (0.0%) | 0 (0.0%) |
| $65,000 to $74,999 | 0 (0.0%) | 0 (0.0%) |
| $75,000 to $99,999 | 0 (0.0%) | 0 (0.0%) |
| $100,000+ | 0 (0.0%) | 0 (0.0%) |
| Total | 23 (100.0%) | 16 (100.0%) |
Earnings by Sex by Educational Attainment in El Combate
| Educational Attainment | Male Income | Female Income |
| Less than High School | - | - |
| High School Diploma | - | - |
| College or Associate's Degree | - | - |
| Bachelor's Degree | - | - |
| Graduate Degree | - | - |
| Total | - | - |
Family Income in El Combate
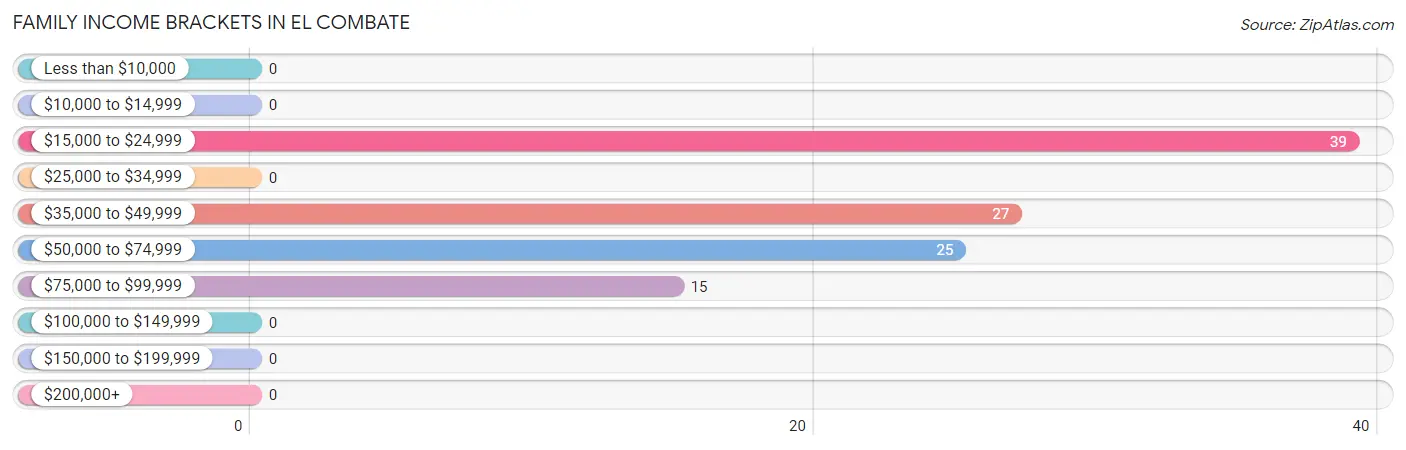
Family Income Brackets in El Combate
According to the El Combate family income data, there are 39 families falling into the $15,000 to $24,999 income range, which is the most common income bracket and makes up 36.8% of all families.
| Income Bracket | # Families | % Families |
| Less than $10,000 | 0 | 0.0% |
| $10,000 to $14,999 | 0 | 0.0% |
| $15,000 to $24,999 | 39 | 36.8% |
| $25,000 to $34,999 | 0 | 0.0% |
| $35,000 to $49,999 | 27 | 25.5% |
| $50,000 to $74,999 | 25 | 23.6% |
| $75,000 to $99,999 | 15 | 14.2% |
| $100,000 to $149,999 | 0 | 0.0% |
| $150,000 to $199,999 | 0 | 0.0% |
| $200,000+ | 0 | 0.0% |
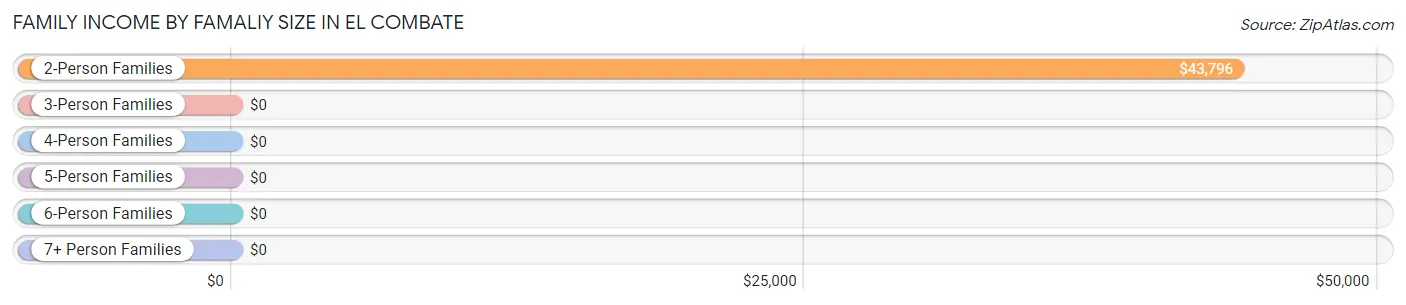
Family Income by Famaliy Size in El Combate
2-person families (106 | 100.0%) account for the highest median family income in El Combate with $43,796 per family, while 2-person families (106 | 100.0%) have the highest median income of $21,898 per family member.
| Income Bracket | # Families | Median Income |
| 2-Person Families | 106 (100.0%) | $43,796 |
| 3-Person Families | 0 (0.0%) | $0 |
| 4-Person Families | 0 (0.0%) | $0 |
| 5-Person Families | 0 (0.0%) | $0 |
| 6-Person Families | 0 (0.0%) | $0 |
| 7+ Person Families | 0 (0.0%) | $0 |
| Total | 106 (100.0%) | $43,796 |
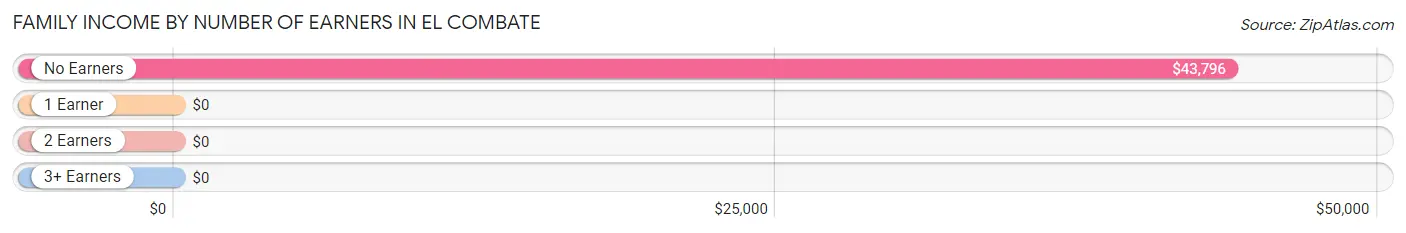
Family Income by Number of Earners in El Combate
| Number of Earners | # Families | Median Income |
| No Earners | 106 (100.0%) | $43,796 |
| 1 Earner | 0 (0.0%) | $0 |
| 2 Earners | 0 (0.0%) | $0 |
| 3+ Earners | 0 (0.0%) | $0 |
| Total | 106 (100.0%) | $43,796 |
Household Income in El Combate
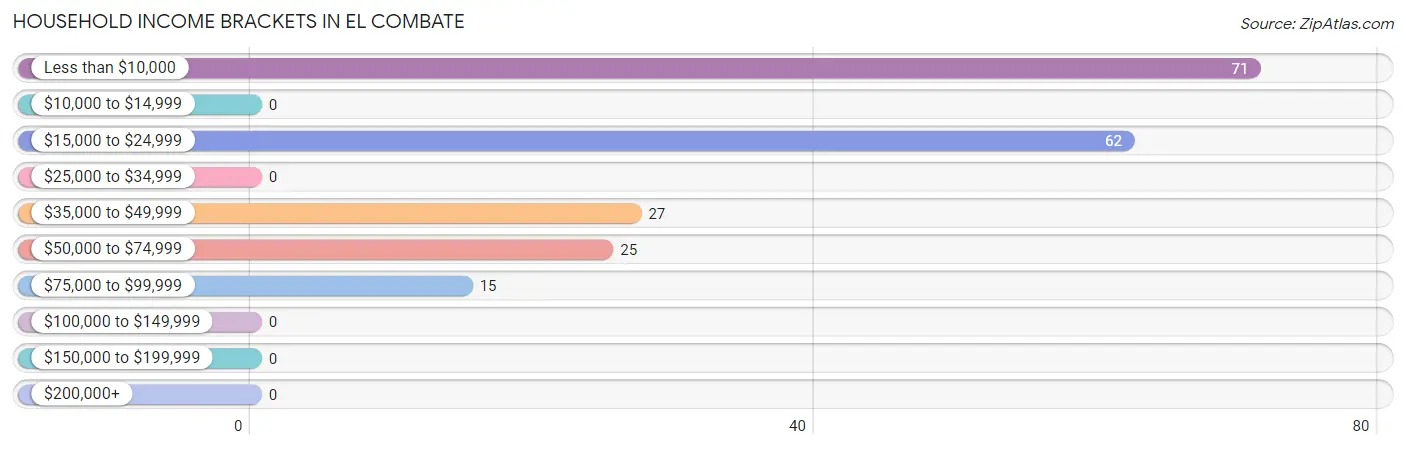
Household Income Brackets in El Combate
With 71 households falling in the category, the less than $10,000 income range is the most frequent in El Combate, accounting for 35.5% of all households.
| Income Bracket | # Households | % Households |
| Less than $10,000 | 71 | 35.5% |
| $10,000 to $14,999 | 0 | 0.0% |
| $15,000 to $24,999 | 62 | 31.0% |
| $25,000 to $34,999 | 0 | 0.0% |
| $35,000 to $49,999 | 27 | 13.5% |
| $50,000 to $74,999 | 25 | 12.5% |
| $75,000 to $99,999 | 15 | 7.5% |
| $100,000 to $149,999 | 0 | 0.0% |
| $150,000 to $199,999 | 0 | 0.0% |
| $200,000+ | 0 | 0.0% |
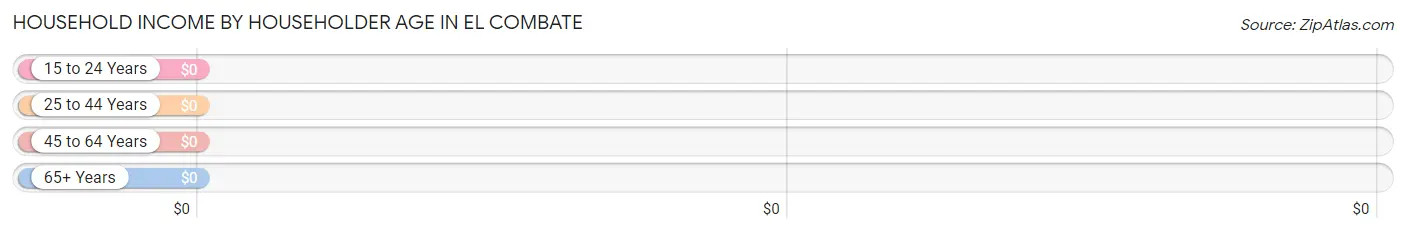
Household Income by Householder Age in El Combate
| Income Bracket | # Households | Median Income |
| 15 to 24 Years | 22 (11.0%) | $0 |
| 25 to 44 Years | 23 (11.5%) | $0 |
| 45 to 64 Years | 16 (8.0%) | $0 |
| 65+ Years | 139 (69.5%) | $0 |
| Total | 200 (100.0%) | $20,556 |
Poverty in El Combate
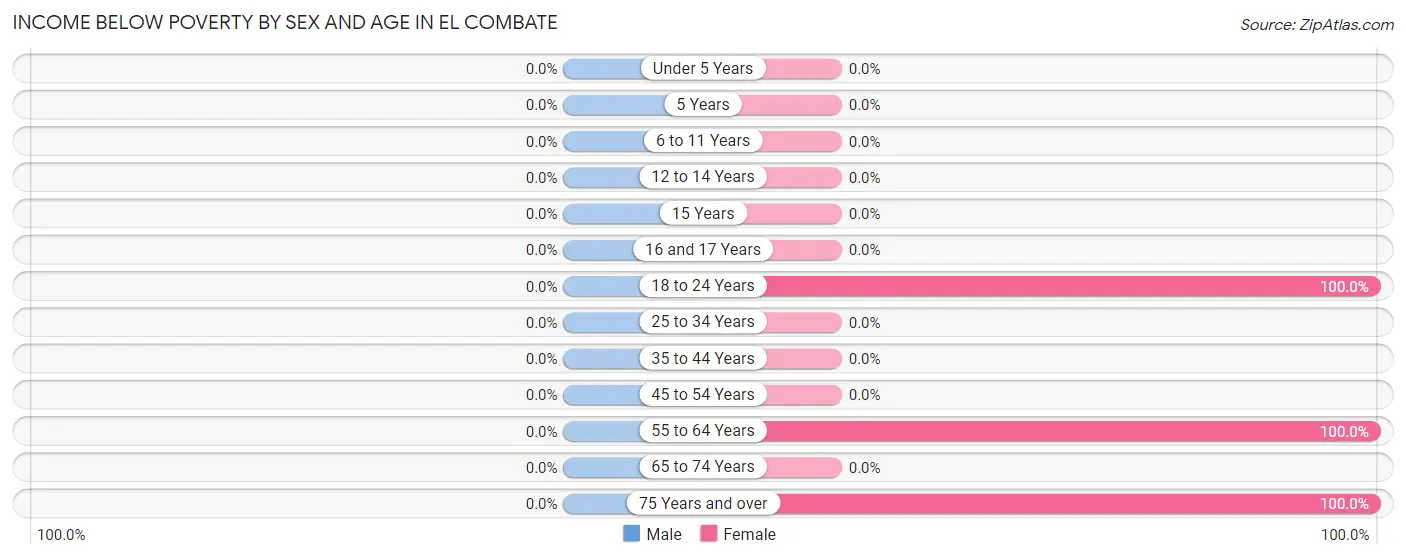
Income Below Poverty by Sex and Age in El Combate
| Age Bracket | Male | Female |
| Under 5 Years | 0 (0.0%) | 0 (0.0%) |
| 5 Years | 0 (0.0%) | 0 (0.0%) |
| 6 to 11 Years | 0 (0.0%) | 0 (0.0%) |
| 12 to 14 Years | 0 (0.0%) | 0 (0.0%) |
| 15 Years | 0 (0.0%) | 0 (0.0%) |
| 16 and 17 Years | 0 (0.0%) | 0 (0.0%) |
| 18 to 24 Years | 0 (0.0%) | 22 (100.0%) |
| 25 to 34 Years | 0 (0.0%) | 0 (0.0%) |
| 35 to 44 Years | 0 (0.0%) | 0 (0.0%) |
| 45 to 54 Years | 0 (0.0%) | 0 (0.0%) |
| 55 to 64 Years | 0 (0.0%) | 16 (100.0%) |
| 65 to 74 Years | 0 (0.0%) | 0 (0.0%) |
| 75 Years and over | 0 (0.0%) | 33 (100.0%) |
| Total | 0 (0.0%) | 71 (29.1%) |
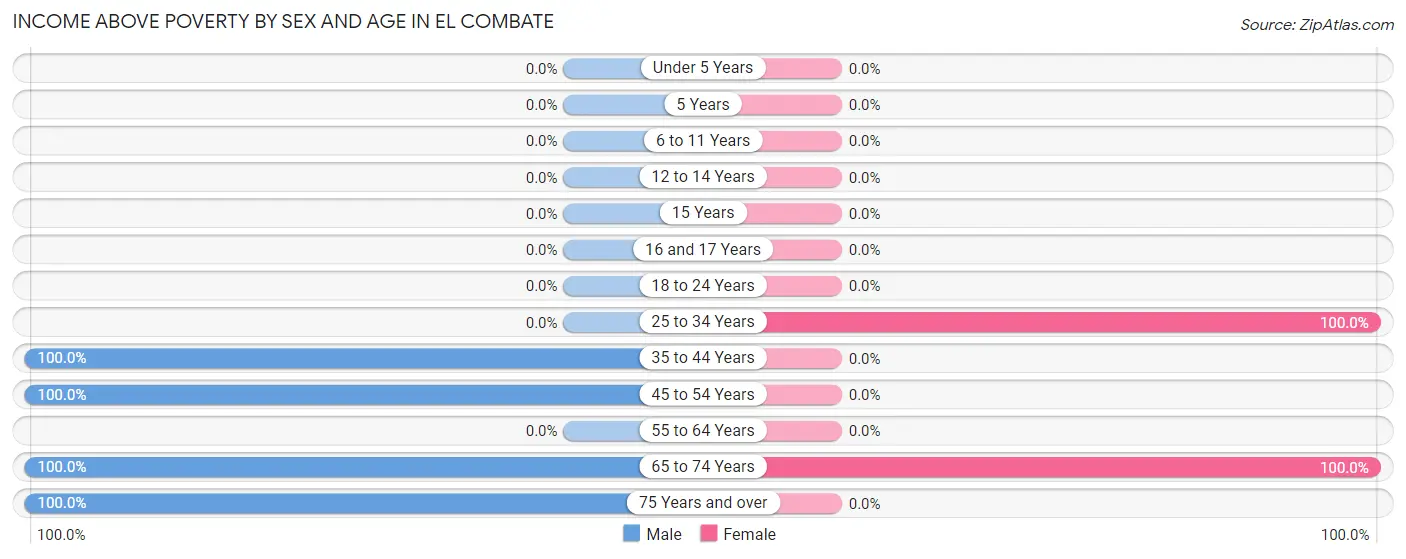
Income Above Poverty by Sex and Age in El Combate
According to the poverty statistics in El Combate, males aged 35 to 44 years and females aged 25 to 34 years are the age groups that are most secure financially, with 100.0% of males and 100.0% of females in these age groups living above the poverty line.
| Age Bracket | Male | Female |
| Under 5 Years | 0 (0.0%) | 0 (0.0%) |
| 5 Years | 0 (0.0%) | 0 (0.0%) |
| 6 to 11 Years | 0 (0.0%) | 0 (0.0%) |
| 12 to 14 Years | 0 (0.0%) | 0 (0.0%) |
| 15 Years | 0 (0.0%) | 0 (0.0%) |
| 16 and 17 Years | 0 (0.0%) | 0 (0.0%) |
| 18 to 24 Years | 0 (0.0%) | 0 (0.0%) |
| 25 to 34 Years | 0 (0.0%) | 69 (100.0%) |
| 35 to 44 Years | 23 (100.0%) | 0 (0.0%) |
| 45 to 54 Years | 33 (100.0%) | 0 (0.0%) |
| 55 to 64 Years | 0 (0.0%) | 0 (0.0%) |
| 65 to 74 Years | 41 (100.0%) | 104 (100.0%) |
| 75 Years and over | 16 (100.0%) | 0 (0.0%) |
| Total | 113 (100.0%) | 173 (70.9%) |
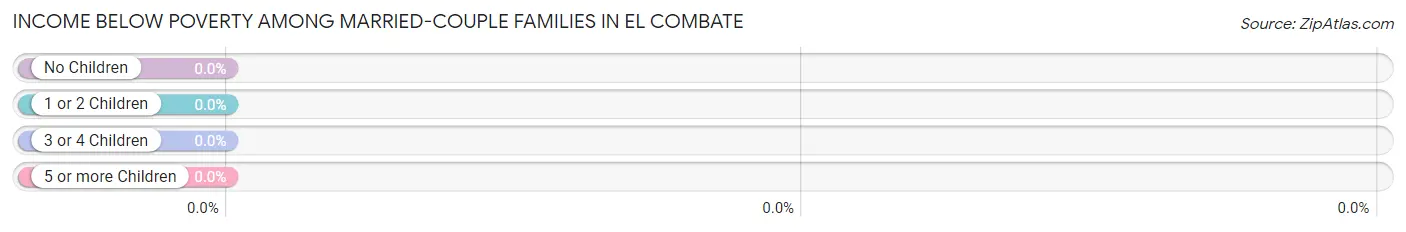
Income Below Poverty Among Married-Couple Families in El Combate
| Children | Above Poverty | Below Poverty |
| No Children | 79 (100.0%) | 0 (0.0%) |
| 1 or 2 Children | 0 (0.0%) | 0 (0.0%) |
| 3 or 4 Children | 0 (0.0%) | 0 (0.0%) |
| 5 or more Children | 0 (0.0%) | 0 (0.0%) |
| Total | 79 (100.0%) | 0 (0.0%) |
Income Below Poverty Among Single-Parent Households in El Combate
| Children | Single Father | Single Mother |
| No Children | 0 (0.0%) | 0 (0.0%) |
| 1 or 2 Children | 0 (0.0%) | 0 (0.0%) |
| 3 or 4 Children | 0 (0.0%) | 0 (0.0%) |
| 5 or more Children | 0 (0.0%) | 0 (0.0%) |
| Total | 0 (0.0%) | 0 (0.0%) |
Income Below Poverty Among Married-Couple vs Single-Parent Households in El Combate
| Children | Married-Couple Families | Single-Parent Households |
| No Children | 0 (0.0%) | 0 (0.0%) |
| 1 or 2 Children | 0 (0.0%) | 0 (0.0%) |
| 3 or 4 Children | 0 (0.0%) | 0 (0.0%) |
| 5 or more Children | 0 (0.0%) | 0 (0.0%) |
| Total | 0 (0.0%) | 0 (0.0%) |
Race in El Combate
The most populous races in El Combate are Hispanic or Latino (357 | 100.0%), White / Caucasian (156 | 43.7%), and Some other Race (141 | 39.5%).
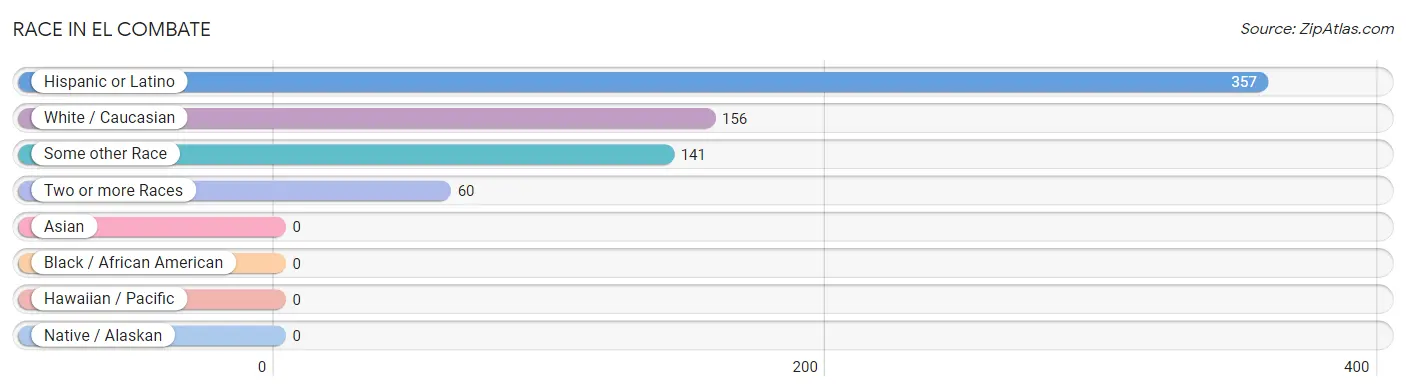
| Race | # Population | % Population |
| Asian | 0 | 0.0% |
| Black / African American | 0 | 0.0% |
| Hawaiian / Pacific | 0 | 0.0% |
| Hispanic or Latino | 357 | 100.0% |
| Native / Alaskan | 0 | 0.0% |
| White / Caucasian | 156 | 43.7% |
| Two or more Races | 60 | 16.8% |
| Some other Race | 141 | 39.5% |
| Total | 357 | 100.0% |
Ancestry in El Combate
The most populous ancestries reported in El Combate are Puerto Rican (324 | 90.8%), Central American (33 | 9.2%), Panamanian (33 | 9.2%), and Central American Indian (27 | 7.6%), together accounting for 116.8% of all El Combate residents.
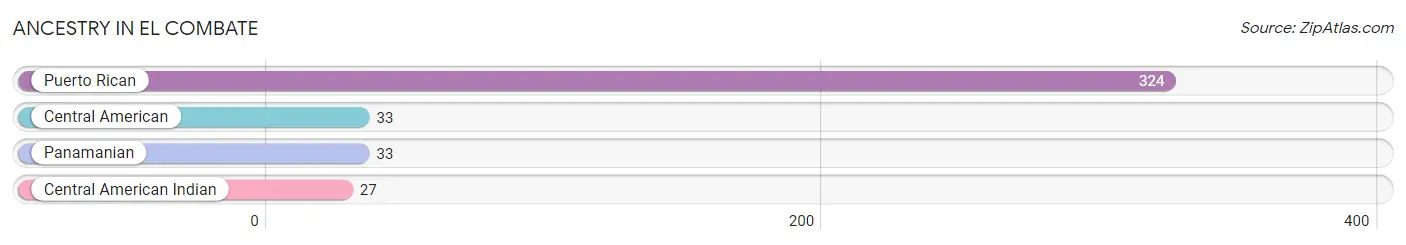
| Ancestry | # Population | % Population |
| Central American | 33 | 9.2% |
| Central American Indian | 27 | 7.6% |
| Panamanian | 33 | 9.2% |
| Puerto Rican | 324 | 90.8% | View All 4 Rows |
Immigrants in El Combate

| Immigration Origin | # Population | % Population | View All 0 Rows |
Sex and Age in El Combate
Sex and Age in El Combate
The most populous age groups in El Combate are 50 to 54 Years (33 | 29.2%) for men and 65 to 69 Years (89 | 36.5%) for women.
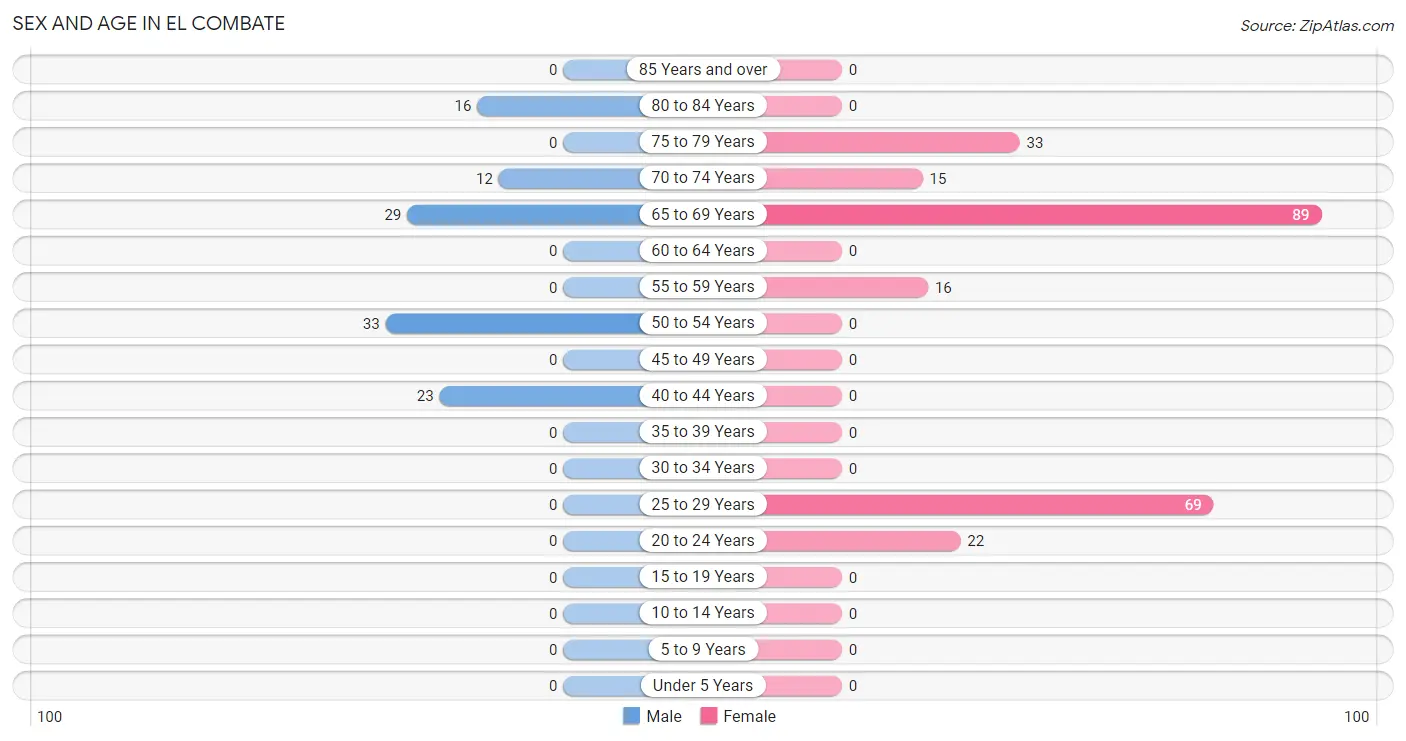
| Age Bracket | Male | Female |
| Under 5 Years | 0 (0.0%) | 0 (0.0%) |
| 5 to 9 Years | 0 (0.0%) | 0 (0.0%) |
| 10 to 14 Years | 0 (0.0%) | 0 (0.0%) |
| 15 to 19 Years | 0 (0.0%) | 0 (0.0%) |
| 20 to 24 Years | 0 (0.0%) | 22 (9.0%) |
| 25 to 29 Years | 0 (0.0%) | 69 (28.3%) |
| 30 to 34 Years | 0 (0.0%) | 0 (0.0%) |
| 35 to 39 Years | 0 (0.0%) | 0 (0.0%) |
| 40 to 44 Years | 23 (20.3%) | 0 (0.0%) |
| 45 to 49 Years | 0 (0.0%) | 0 (0.0%) |
| 50 to 54 Years | 33 (29.2%) | 0 (0.0%) |
| 55 to 59 Years | 0 (0.0%) | 16 (6.6%) |
| 60 to 64 Years | 0 (0.0%) | 0 (0.0%) |
| 65 to 69 Years | 29 (25.7%) | 89 (36.5%) |
| 70 to 74 Years | 12 (10.6%) | 15 (6.1%) |
| 75 to 79 Years | 0 (0.0%) | 33 (13.5%) |
| 80 to 84 Years | 16 (14.2%) | 0 (0.0%) |
| 85 Years and over | 0 (0.0%) | 0 (0.0%) |
| Total | 113 (100.0%) | 244 (100.0%) |
Families and Households in El Combate
Median Family Size in El Combate
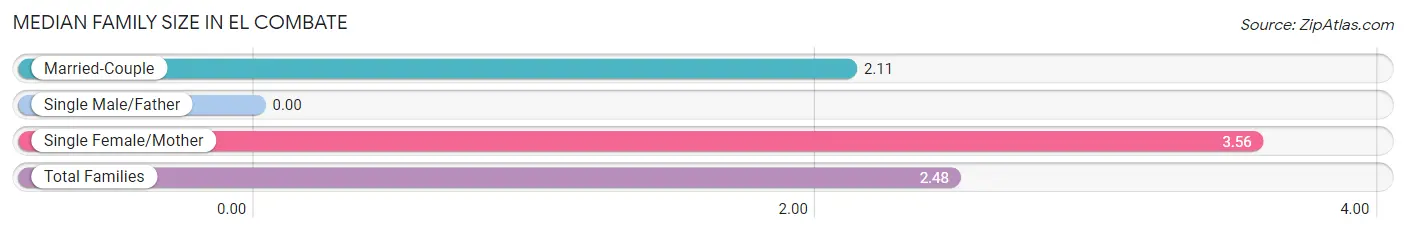
| Family Type | # Families | Family Size |
| Married-Couple | 79 (74.5%) | 2.11 |
| Single Male/Father | 0 (0.0%) | - |
| Single Female/Mother | 27 (25.5%) | 3.56 |
| Total Families | 106 (100.0%) | 2.48 |
Median Household Size in El Combate
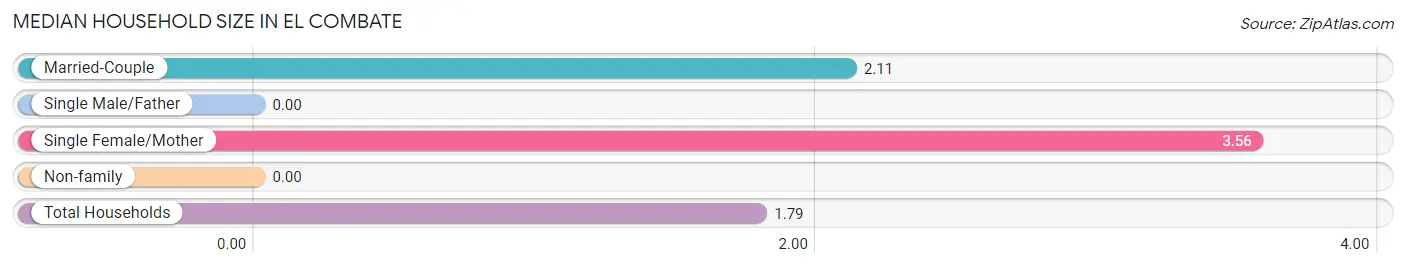
| Household Type | # Households | Household Size |
| Married-Couple | 79 (39.5%) | 2.11 |
| Single Male/Father | 0 (0.0%) | - |
| Single Female/Mother | 27 (13.5%) | 3.56 |
| Non-family | 94 (47.0%) | - |
| Total Households | 200 (100.0%) | 1.79 |
Household Size by Marriage Status in El Combate
Out of a total of 200 households in El Combate, 106 (53.0%) are family households, while 94 (47.0%) are nonfamily households. The most numerous type of family households are 2-person households, comprising 106, and the most common type of nonfamily households are 1-person households, comprising 94.
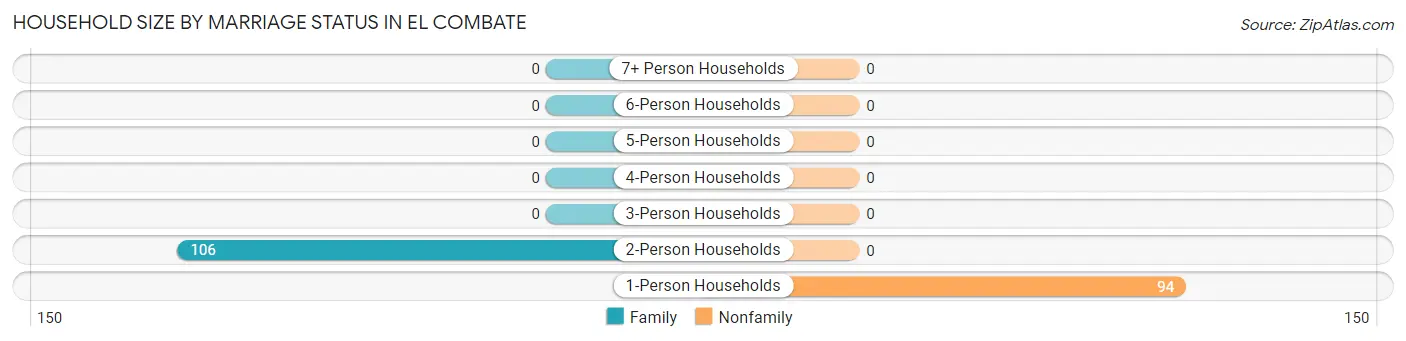
| Household Size | Family Households | Nonfamily Households |
| 1-Person Households | - | 94 (47.0%) |
| 2-Person Households | 106 (53.0%) | 0 (0.0%) |
| 3-Person Households | 0 (0.0%) | 0 (0.0%) |
| 4-Person Households | 0 (0.0%) | 0 (0.0%) |
| 5-Person Households | 0 (0.0%) | 0 (0.0%) |
| 6-Person Households | 0 (0.0%) | 0 (0.0%) |
| 7+ Person Households | 0 (0.0%) | 0 (0.0%) |
| Total | 106 (53.0%) | 94 (47.0%) |
Female Fertility in El Combate
Fertility by Age in El Combate
| Age Bracket | Women with Births | Births / 1,000 Women |
| 15 to 19 years | 0 (0.0%) | 0.0 |
| 20 to 34 years | 0 (0.0%) | 0.0 |
| 35 to 50 years | 0 (0.0%) | 0.0 |
| Total | 0 (0.0%) | 0.0 |
Fertility by Age by Marriage Status in El Combate
| Age Bracket | Married | Unmarried |
| 15 to 19 years | 0 (0.0%) | 0 (0.0%) |
| 20 to 34 years | 0 (0.0%) | 0 (0.0%) |
| 35 to 50 years | 0 (0.0%) | 0 (0.0%) |
| Total | 0 (0.0%) | 0 (0.0%) |
Fertility by Education in El Combate
| Educational Attainment | Women with Births | Births / 1,000 Women |
| Less than High School | 0 (0.0%) | 0.0 |
| High School Diploma | 0 (0.0%) | 0.0 |
| College or Associate's Degree | 0 (0.0%) | 0.0 |
| Bachelor's Degree | 0 (0.0%) | 0.0 |
| Graduate Degree | 0 (0.0%) | 0.0 |
| Total | 0 (0.0%) | 0.0 |
Fertility by Education by Marriage Status in El Combate
| Educational Attainment | Married | Unmarried |
| Less than High School | 0 (0.0%) | 0 (0.0%) |
| High School Diploma | 0 (0.0%) | 0 (0.0%) |
| College or Associate's Degree | 0 (0.0%) | 0 (0.0%) |
| Bachelor's Degree | 0 (0.0%) | 0 (0.0%) |
| Graduate Degree | 0 (0.0%) | 0 (0.0%) |
| Total | 0 (0.0%) | 0 (0.0%) |
Employment Characteristics in El Combate
Employment by Class of Employer in El Combate
Among the 23 employed individuals in El Combate, , and self-employed (not incorporated) (23 | 100.0%) make up the most common classes of employment.
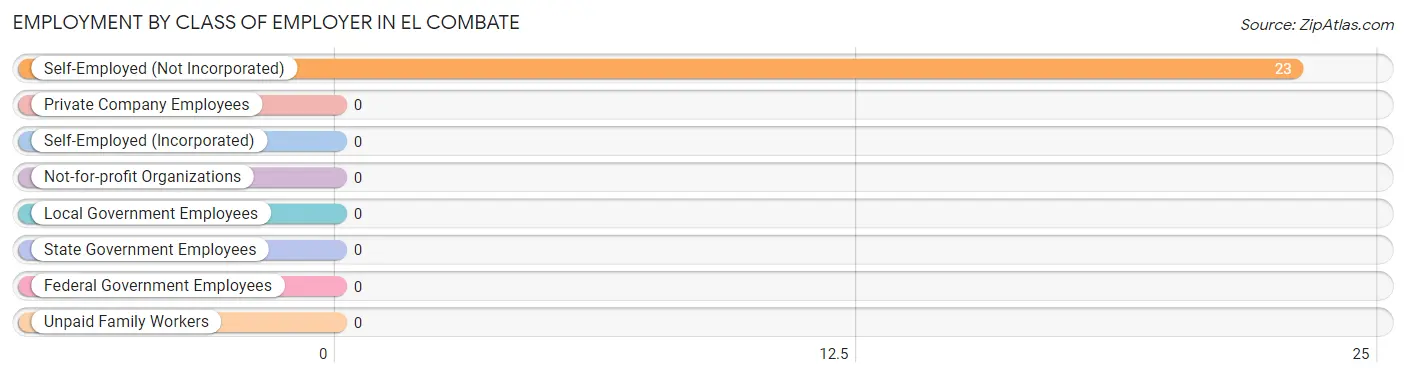
| Employer Class | # Employees | % Employees |
| Private Company Employees | 0 | 0.0% |
| Self-Employed (Incorporated) | 0 | 0.0% |
| Self-Employed (Not Incorporated) | 23 | 100.0% |
| Not-for-profit Organizations | 0 | 0.0% |
| Local Government Employees | 0 | 0.0% |
| State Government Employees | 0 | 0.0% |
| Federal Government Employees | 0 | 0.0% |
| Unpaid Family Workers | 0 | 0.0% |
| Total | 23 | 100.0% |
Employment Status by Age in El Combate
According to the labor force statistics for El Combate, out of the total population over 16 years of age (357), 39.5% or 141 individuals are in the labor force, with 72.3% or 102 of them unemployed. The age group with the highest labor force participation rate is 25 to 29 years, with 100.0% or 69 individuals in the labor force. Within the labor force, the 25 to 29 years age range has the highest percentage of unemployed individuals, with 100.0% or 69 of them being unemployed.
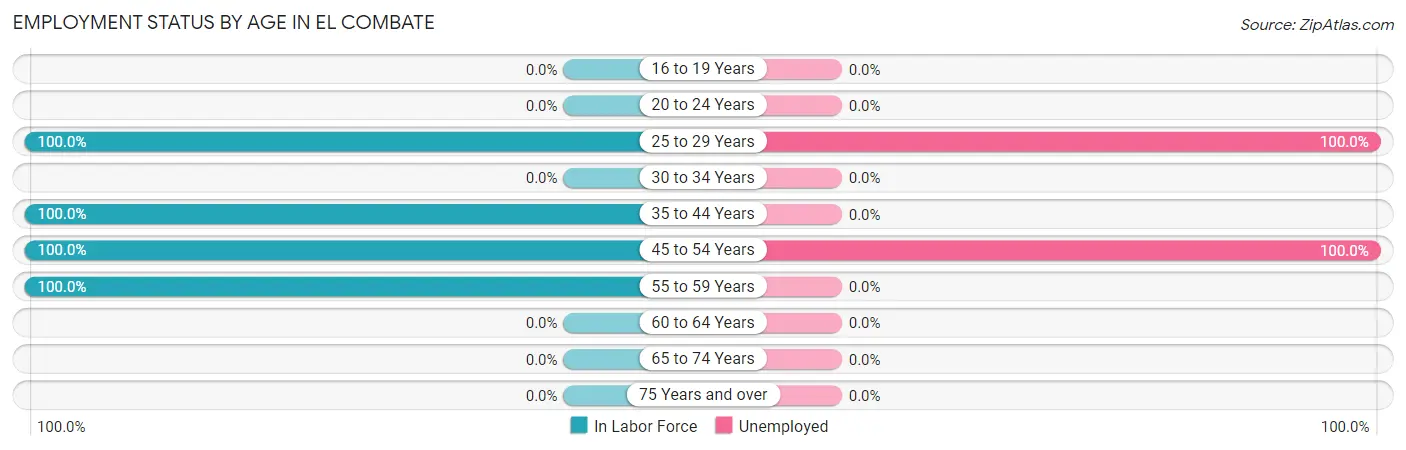
| Age Bracket | In Labor Force | Unemployed |
| 16 to 19 Years | 0 (0.0%) | 0 (0.0%) |
| 20 to 24 Years | 0 (0.0%) | 0 (0.0%) |
| 25 to 29 Years | 69 (100.0%) | 69 (100.0%) |
| 30 to 34 Years | 0 (0.0%) | 0 (0.0%) |
| 35 to 44 Years | 23 (100.0%) | 0 (0.0%) |
| 45 to 54 Years | 33 (100.0%) | 33 (100.0%) |
| 55 to 59 Years | 16 (100.0%) | 0 (0.0%) |
| 60 to 64 Years | 0 (0.0%) | 0 (0.0%) |
| 65 to 74 Years | 0 (0.0%) | 0 (0.0%) |
| 75 Years and over | 0 (0.0%) | 0 (0.0%) |
| Total | 141 (39.5%) | 102 (72.3%) |
Employment Status by Educational Attainment in El Combate
According to labor force statistics for El Combate, 100.0% of individuals (141) out of the total population between 25 and 64 years of age (141) are in the labor force, with 72.3% or 102 of them being unemployed. The group with the highest labor force participation rate are those with the educational attainment of high school diploma, with 100.0% or 33 individuals in the labor force. Within the labor force, individuals with high school diploma education have the highest percentage of unemployment, with 100.0% or 33 of them being unemployed.
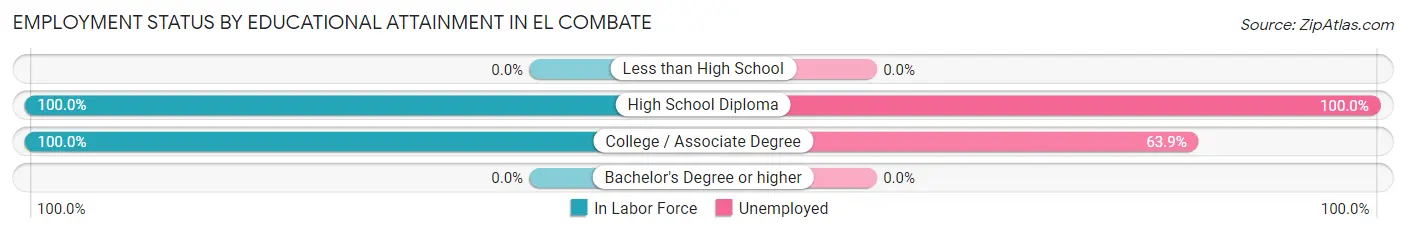
| Educational Attainment | In Labor Force | Unemployed |
| Less than High School | 0 (0.0%) | 0 (0.0%) |
| High School Diploma | 33 (100.0%) | 33 (100.0%) |
| College / Associate Degree | 108 (100.0%) | 69 (63.9%) |
| Bachelor's Degree or higher | 0 (0.0%) | 0 (0.0%) |
| Total | 141 (100.0%) | 102 (72.3%) |
Employment Occupations by Sex in El Combate
Management, Business, Science and Arts Occupations
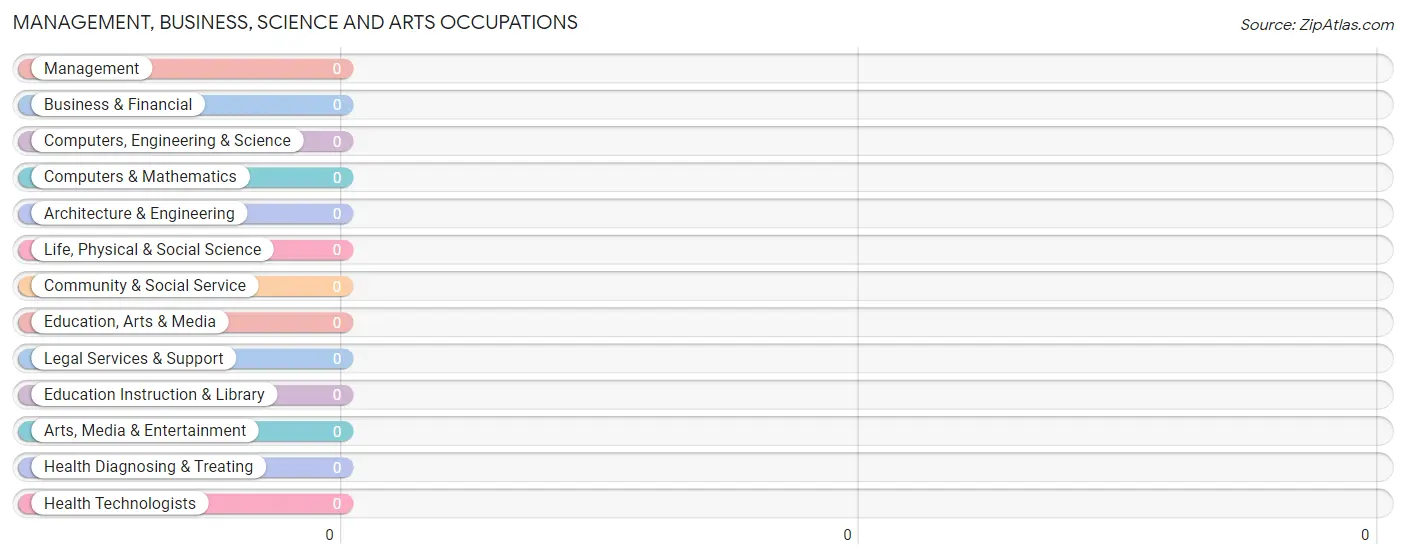
Management, Business, Science and Arts Occupations by Sex
| Occupation | Male | Female |
| Management | 0 (0.0%) | 0 (0.0%) |
| Business & Financial | 0 (0.0%) | 0 (0.0%) |
| Computers, Engineering & Science | 0 (0.0%) | 0 (0.0%) |
| Computers & Mathematics | 0 (0.0%) | 0 (0.0%) |
| Architecture & Engineering | 0 (0.0%) | 0 (0.0%) |
| Life, Physical & Social Science | 0 (0.0%) | 0 (0.0%) |
| Community & Social Service | 0 (0.0%) | 0 (0.0%) |
| Education, Arts & Media | 0 (0.0%) | 0 (0.0%) |
| Legal Services & Support | 0 (0.0%) | 0 (0.0%) |
| Education Instruction & Library | 0 (0.0%) | 0 (0.0%) |
| Arts, Media & Entertainment | 0 (0.0%) | 0 (0.0%) |
| Health Diagnosing & Treating | 0 (0.0%) | 0 (0.0%) |
| Health Technologists | 0 (0.0%) | 0 (0.0%) |
| Total (Category) | 0 (0.0%) | 0 (0.0%) |
| Total (Overall) | 23 (59.0%) | 16 (41.0%) |
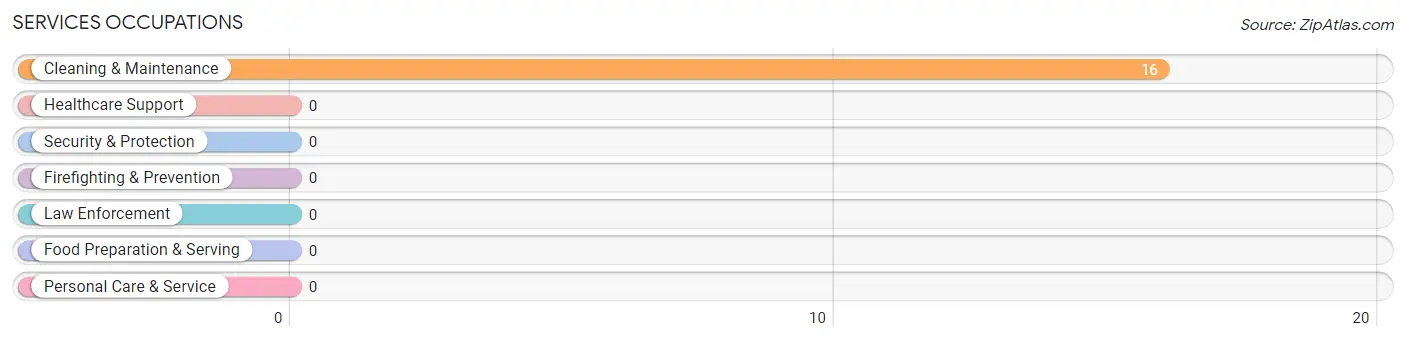
Services Occupations
The most common Services occupations in El Combate are , and Cleaning & Maintenance (16 | 41.0%).
Services Occupations by Sex
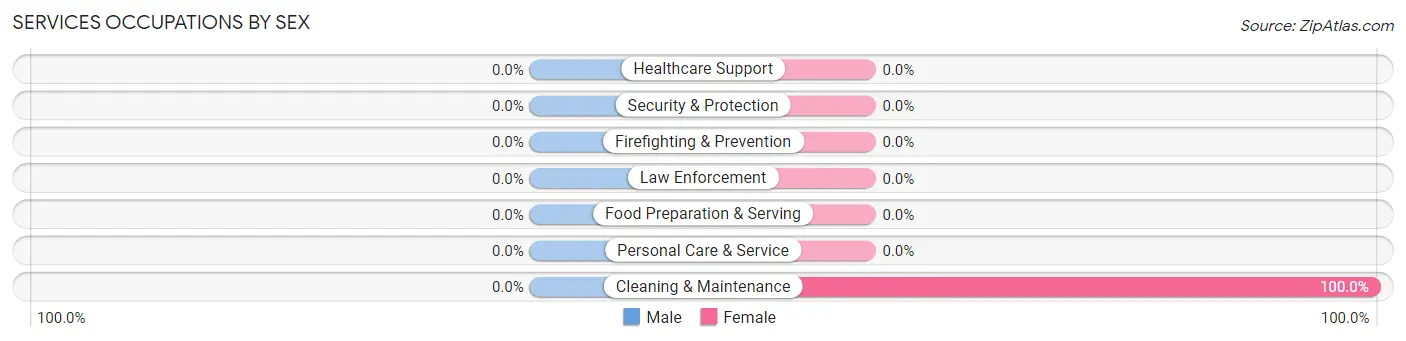
| Occupation | Male | Female |
| Healthcare Support | 0 (0.0%) | 0 (0.0%) |
| Security & Protection | 0 (0.0%) | 0 (0.0%) |
| Firefighting & Prevention | 0 (0.0%) | 0 (0.0%) |
| Law Enforcement | 0 (0.0%) | 0 (0.0%) |
| Food Preparation & Serving | 0 (0.0%) | 0 (0.0%) |
| Cleaning & Maintenance | 0 (0.0%) | 16 (100.0%) |
| Personal Care & Service | 0 (0.0%) | 0 (0.0%) |
| Total (Category) | 0 (0.0%) | 16 (100.0%) |
| Total (Overall) | 23 (59.0%) | 16 (41.0%) |
Sales and Office Occupations

Sales and Office Occupations by Sex

| Occupation | Male | Female |
| Sales & Related | 0 (0.0%) | 0 (0.0%) |
| Office & Administration | 0 (0.0%) | 0 (0.0%) |
| Total (Category) | 0 (0.0%) | 0 (0.0%) |
| Total (Overall) | 23 (59.0%) | 16 (41.0%) |
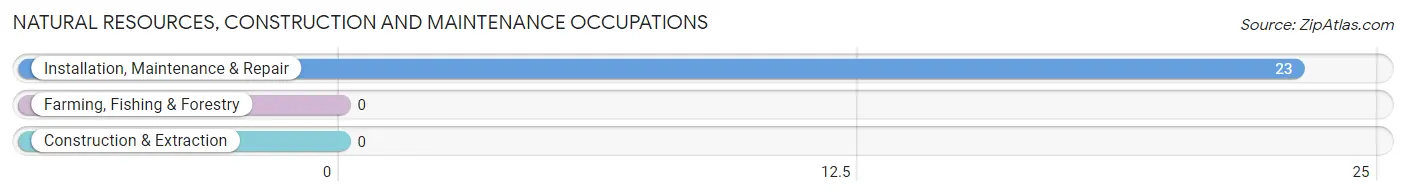
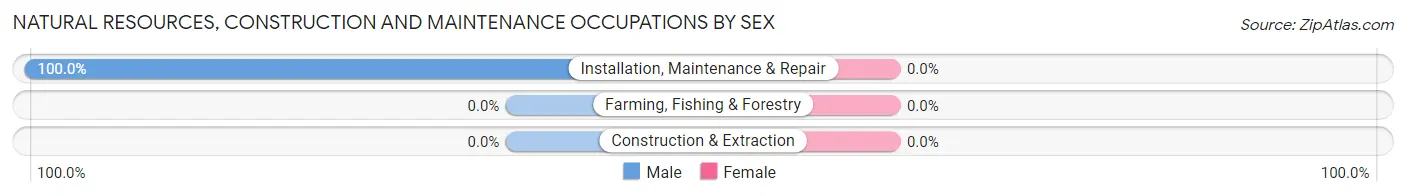
Natural Resources, Construction and Maintenance Occupations
The most common Natural Resources, Construction and Maintenance occupations in El Combate are , and Installation, Maintenance & Repair (23 | 59.0%).
Natural Resources, Construction and Maintenance Occupations by Sex
| Occupation | Male | Female |
| Farming, Fishing & Forestry | 0 (0.0%) | 0 (0.0%) |
| Construction & Extraction | 0 (0.0%) | 0 (0.0%) |
| Installation, Maintenance & Repair | 23 (100.0%) | 0 (0.0%) |
| Total (Category) | 23 (100.0%) | 0 (0.0%) |
| Total (Overall) | 23 (59.0%) | 16 (41.0%) |
Production, Transportation and Moving Occupations
Production, Transportation and Moving Occupations by Sex
| Occupation | Male | Female |
| Production | 0 (0.0%) | 0 (0.0%) |
| Transportation | 0 (0.0%) | 0 (0.0%) |
| Material Moving | 0 (0.0%) | 0 (0.0%) |
| Total (Category) | 0 (0.0%) | 0 (0.0%) |
| Total (Overall) | 23 (59.0%) | 16 (41.0%) |
Employment Industries by Sex in El Combate
Employment Industries in El Combate
The major employment industries in El Combate include , and Administrative & Support (16 | 41.0%).

Employment Industries by Sex in El Combate
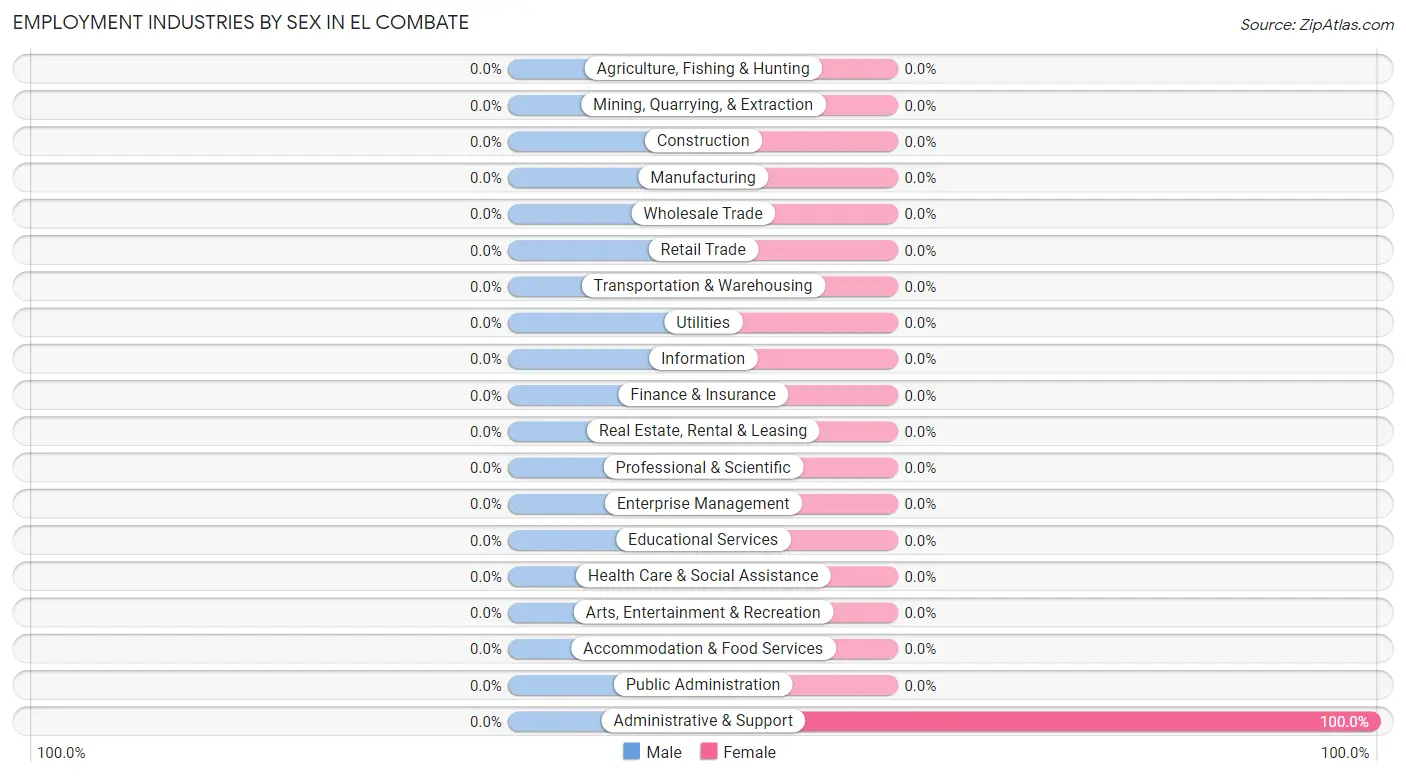
| Industry | Male | Female |
| Agriculture, Fishing & Hunting | 0 (0.0%) | 0 (0.0%) |
| Mining, Quarrying, & Extraction | 0 (0.0%) | 0 (0.0%) |
| Construction | 0 (0.0%) | 0 (0.0%) |
| Manufacturing | 0 (0.0%) | 0 (0.0%) |
| Wholesale Trade | 0 (0.0%) | 0 (0.0%) |
| Retail Trade | 0 (0.0%) | 0 (0.0%) |
| Transportation & Warehousing | 0 (0.0%) | 0 (0.0%) |
| Utilities | 0 (0.0%) | 0 (0.0%) |
| Information | 0 (0.0%) | 0 (0.0%) |
| Finance & Insurance | 0 (0.0%) | 0 (0.0%) |
| Real Estate, Rental & Leasing | 0 (0.0%) | 0 (0.0%) |
| Professional & Scientific | 0 (0.0%) | 0 (0.0%) |
| Enterprise Management | 0 (0.0%) | 0 (0.0%) |
| Administrative & Support | 0 (0.0%) | 16 (100.0%) |
| Educational Services | 0 (0.0%) | 0 (0.0%) |
| Health Care & Social Assistance | 0 (0.0%) | 0 (0.0%) |
| Arts, Entertainment & Recreation | 0 (0.0%) | 0 (0.0%) |
| Accommodation & Food Services | 0 (0.0%) | 0 (0.0%) |
| Public Administration | 0 (0.0%) | 0 (0.0%) |
| Total | 23 (59.0%) | 16 (41.0%) |
Education in El Combate
School Enrollment in El Combate
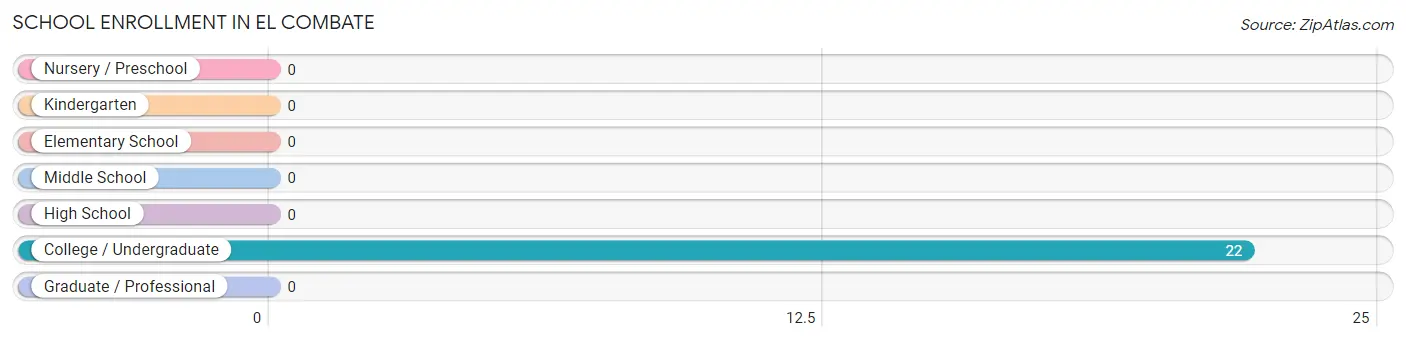
| School Level | # Students | % Students |
| Nursery / Preschool | 0 | 0.0% |
| Kindergarten | 0 | 0.0% |
| Elementary School | 0 | 0.0% |
| Middle School | 0 | 0.0% |
| High School | 0 | 0.0% |
| College / Undergraduate | 22 | 100.0% |
| Graduate / Professional | 0 | 0.0% |
| Total | 22 | 100.0% |
School Enrollment by Age by Funding Source in El Combate
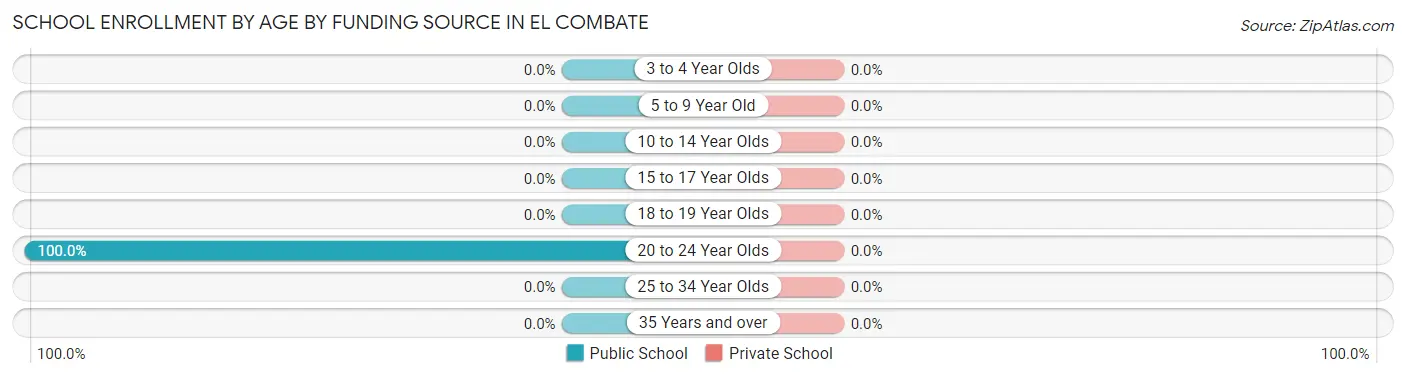
| Age Bracket | Public School | Private School |
| 3 to 4 Year Olds | 0 (0.0%) | 0 (0.0%) |
| 5 to 9 Year Old | 0 (0.0%) | 0 (0.0%) |
| 10 to 14 Year Olds | 0 (0.0%) | 0 (0.0%) |
| 15 to 17 Year Olds | 0 (0.0%) | 0 (0.0%) |
| 18 to 19 Year Olds | 0 (0.0%) | 0 (0.0%) |
| 20 to 24 Year Olds | 22 (100.0%) | 0 (0.0%) |
| 25 to 34 Year Olds | 0 (0.0%) | 0 (0.0%) |
| 35 Years and over | 0 (0.0%) | 0 (0.0%) |
| Total | 22 (100.0%) | 0 (0.0%) |
Educational Attainment by Field of Study in El Combate
Business (56 | 41.8%), social sciences (35 | 26.1%), education (27 | 20.2%), and engineering (16 | 11.9%) are the most common fields of study among 134 individuals in El Combate who have obtained a bachelor's degree or higher.
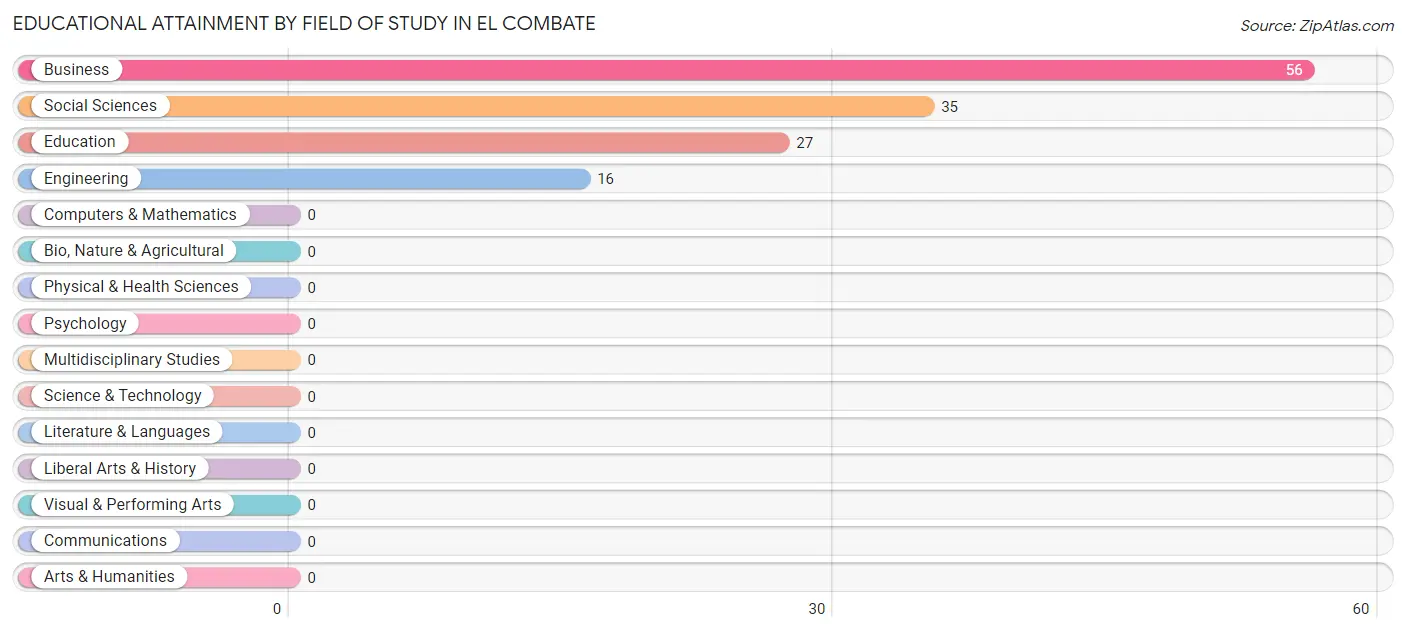
| Field of Study | # Graduates | % Graduates |
| Computers & Mathematics | 0 | 0.0% |
| Bio, Nature & Agricultural | 0 | 0.0% |
| Physical & Health Sciences | 0 | 0.0% |
| Psychology | 0 | 0.0% |
| Social Sciences | 35 | 26.1% |
| Engineering | 16 | 11.9% |
| Multidisciplinary Studies | 0 | 0.0% |
| Science & Technology | 0 | 0.0% |
| Business | 56 | 41.8% |
| Education | 27 | 20.2% |
| Literature & Languages | 0 | 0.0% |
| Liberal Arts & History | 0 | 0.0% |
| Visual & Performing Arts | 0 | 0.0% |
| Communications | 0 | 0.0% |
| Arts & Humanities | 0 | 0.0% |
| Total | 134 | 100.0% |
Transportation & Commute in El Combate
Vehicle Availability by Sex in El Combate
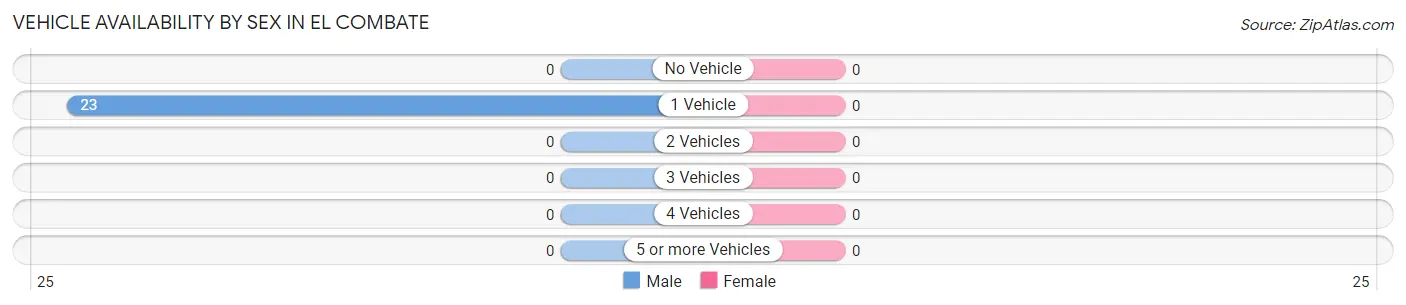
| Vehicles Available | Male | Female |
| No Vehicle | 0 (0.0%) | 0 (0.0%) |
| 1 Vehicle | 23 (100.0%) | 0 (0.0%) |
| 2 Vehicles | 0 (0.0%) | 0 (0.0%) |
| 3 Vehicles | 0 (0.0%) | 0 (0.0%) |
| 4 Vehicles | 0 (0.0%) | 0 (0.0%) |
| 5 or more Vehicles | 0 (0.0%) | 0 (0.0%) |
| Total | 23 (100.0%) | 0 (0.0%) |
Commute Time in El Combate
The most frequently occuring commute durations in El Combate are 60 to 89 minutes (23 commuters, 100.0%), less than 5 minutes (0 commuters, 0.0%), and 5 to 9 minutes (0 commuters, 0.0%).
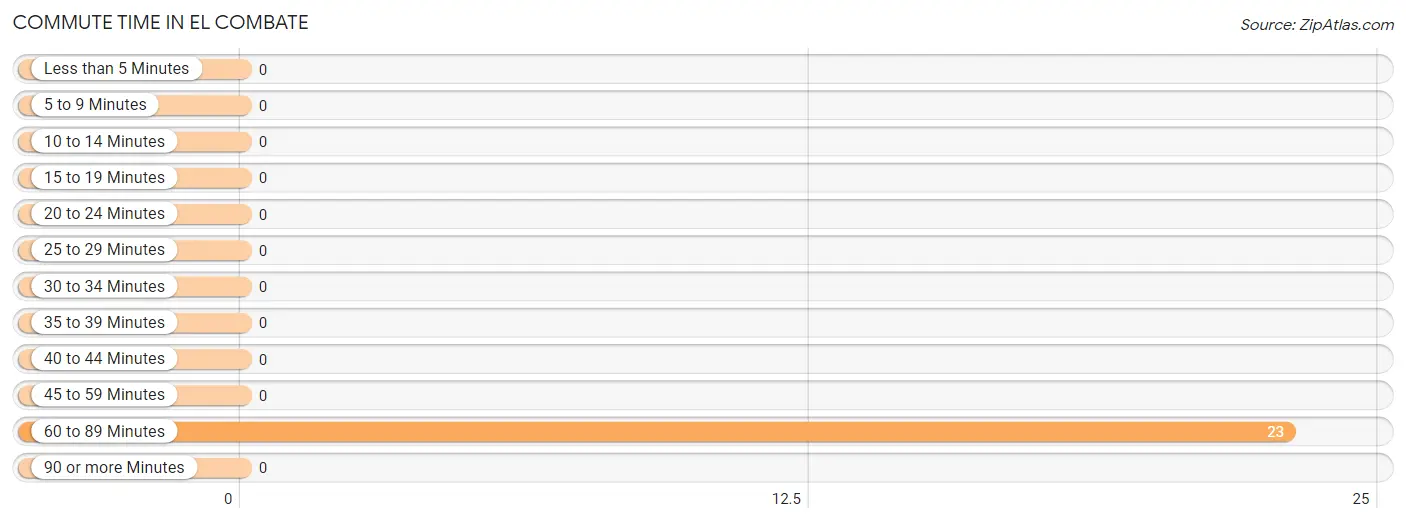
| Commute Time | # Commuters | % Commuters |
| Less than 5 Minutes | 0 | 0.0% |
| 5 to 9 Minutes | 0 | 0.0% |
| 10 to 14 Minutes | 0 | 0.0% |
| 15 to 19 Minutes | 0 | 0.0% |
| 20 to 24 Minutes | 0 | 0.0% |
| 25 to 29 Minutes | 0 | 0.0% |
| 30 to 34 Minutes | 0 | 0.0% |
| 35 to 39 Minutes | 0 | 0.0% |
| 40 to 44 Minutes | 0 | 0.0% |
| 45 to 59 Minutes | 0 | 0.0% |
| 60 to 89 Minutes | 23 | 100.0% |
| 90 or more Minutes | 0 | 0.0% |
Commute Time by Sex in El Combate
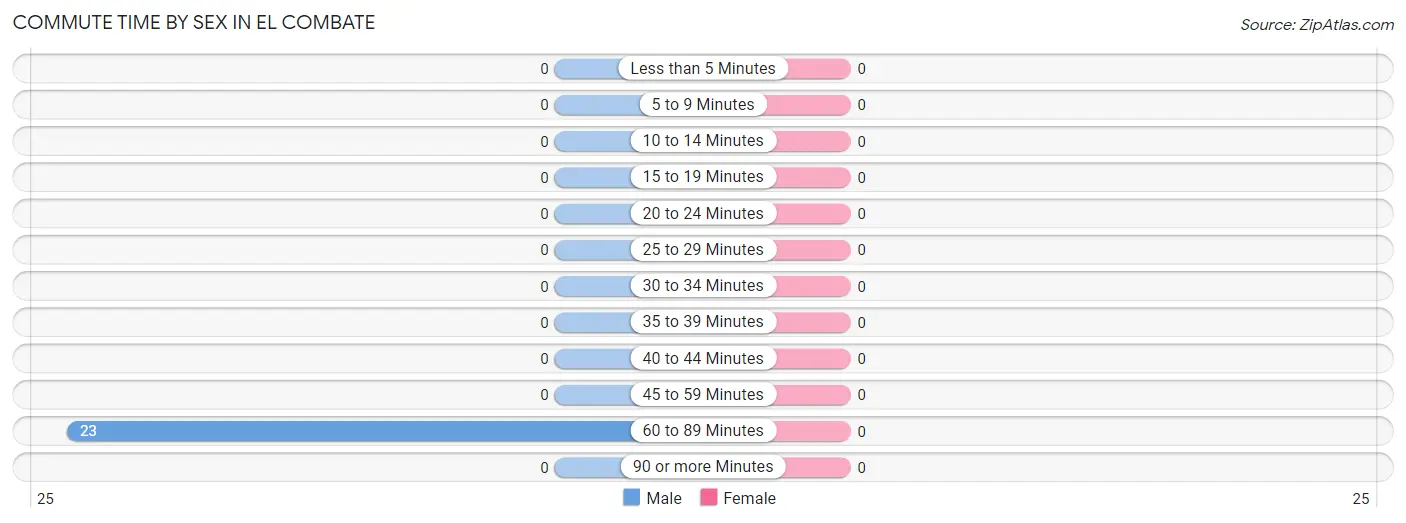
| Commute Time | Male | Female |
| Less than 5 Minutes | 0 (0.0%) | 0 (0.0%) |
| 5 to 9 Minutes | 0 (0.0%) | 0 (0.0%) |
| 10 to 14 Minutes | 0 (0.0%) | 0 (0.0%) |
| 15 to 19 Minutes | 0 (0.0%) | 0 (0.0%) |
| 20 to 24 Minutes | 0 (0.0%) | 0 (0.0%) |
| 25 to 29 Minutes | 0 (0.0%) | 0 (0.0%) |
| 30 to 34 Minutes | 0 (0.0%) | 0 (0.0%) |
| 35 to 39 Minutes | 0 (0.0%) | 0 (0.0%) |
| 40 to 44 Minutes | 0 (0.0%) | 0 (0.0%) |
| 45 to 59 Minutes | 0 (0.0%) | 0 (0.0%) |
| 60 to 89 Minutes | 23 (100.0%) | 0 (0.0%) |
| 90 or more Minutes | 0 (0.0%) | 0 (0.0%) |
Time of Departure to Work by Sex in El Combate
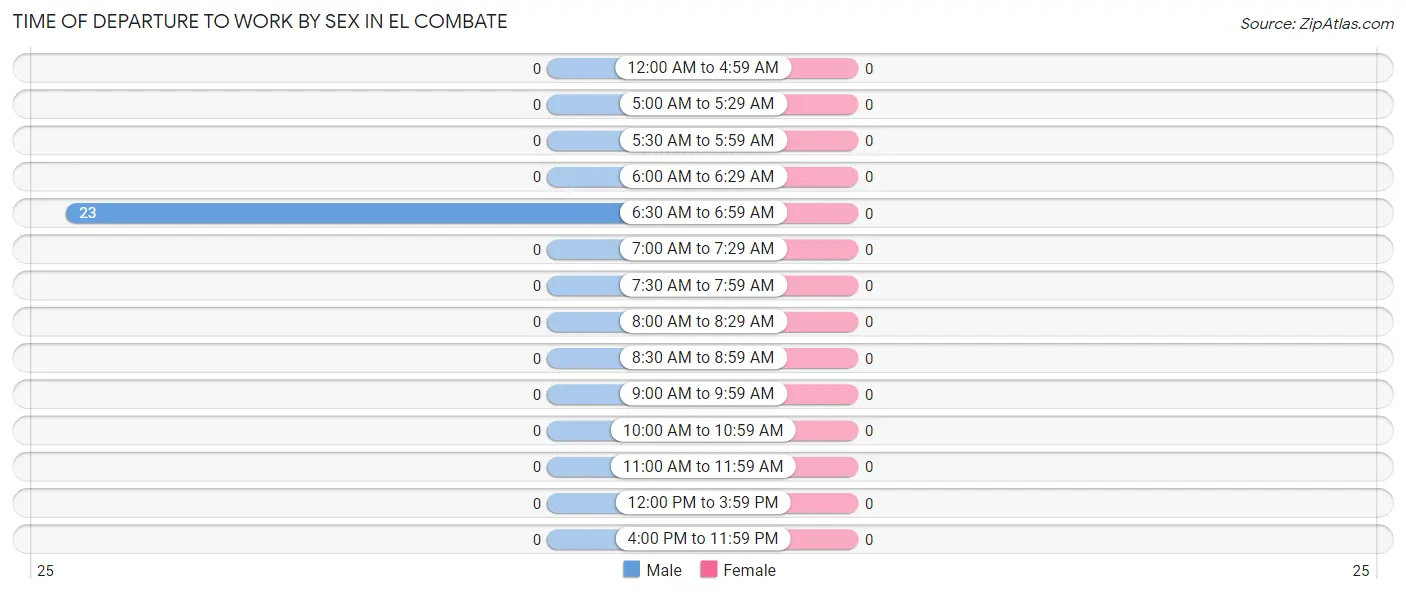
| Time of Departure | Male | Female |
| 12:00 AM to 4:59 AM | 0 (0.0%) | 0 (0.0%) |
| 5:00 AM to 5:29 AM | 0 (0.0%) | 0 (0.0%) |
| 5:30 AM to 5:59 AM | 0 (0.0%) | 0 (0.0%) |
| 6:00 AM to 6:29 AM | 0 (0.0%) | 0 (0.0%) |
| 6:30 AM to 6:59 AM | 23 (100.0%) | 0 (0.0%) |
| 7:00 AM to 7:29 AM | 0 (0.0%) | 0 (0.0%) |
| 7:30 AM to 7:59 AM | 0 (0.0%) | 0 (0.0%) |
| 8:00 AM to 8:29 AM | 0 (0.0%) | 0 (0.0%) |
| 8:30 AM to 8:59 AM | 0 (0.0%) | 0 (0.0%) |
| 9:00 AM to 9:59 AM | 0 (0.0%) | 0 (0.0%) |
| 10:00 AM to 10:59 AM | 0 (0.0%) | 0 (0.0%) |
| 11:00 AM to 11:59 AM | 0 (0.0%) | 0 (0.0%) |
| 12:00 PM to 3:59 PM | 0 (0.0%) | 0 (0.0%) |
| 4:00 PM to 11:59 PM | 0 (0.0%) | 0 (0.0%) |
| Total | 23 (100.0%) | 0 (0.0%) |
Housing Occupancy in El Combate
Occupancy by Ownership in El Combate
Of the total 200 dwellings in El Combate, owner-occupied units account for 184 (92.0%), while renter-occupied units make up 16 (8.0%).
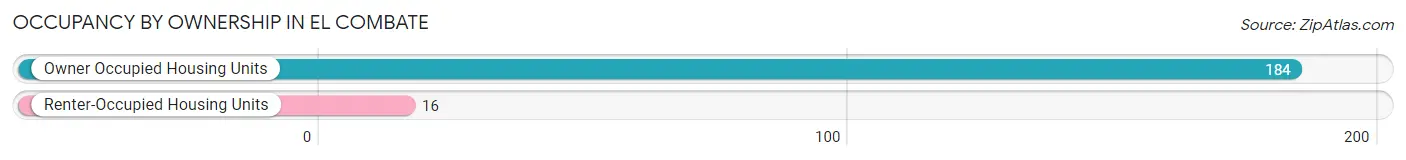
| Occupancy | # Housing Units | % Housing Units |
| Owner Occupied Housing Units | 184 | 92.0% |
| Renter-Occupied Housing Units | 16 | 8.0% |
| Total Occupied Housing Units | 200 | 100.0% |
Occupancy by Household Size in El Combate
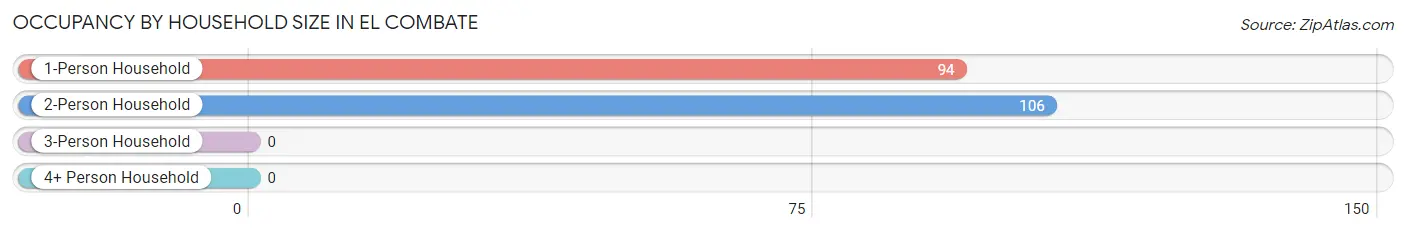
| Household Size | # Housing Units | % Housing Units |
| 1-Person Household | 94 | 47.0% |
| 2-Person Household | 106 | 53.0% |
| 3-Person Household | 0 | 0.0% |
| 4+ Person Household | 0 | 0.0% |
| Total Housing Units | 200 | 100.0% |
Occupancy by Ownership by Household Size in El Combate
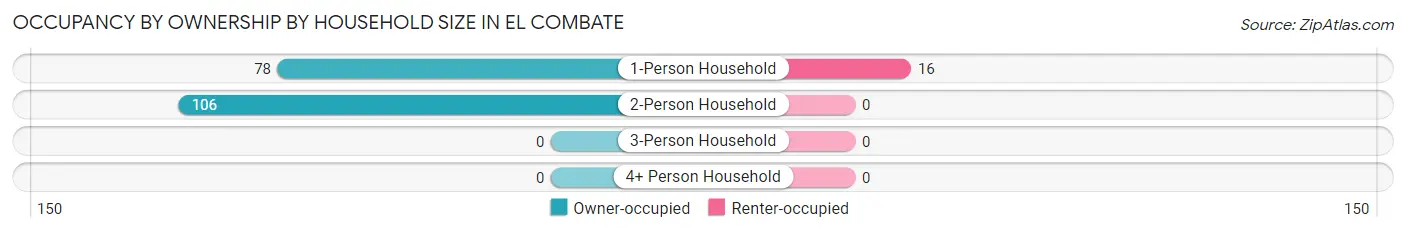
| Household Size | Owner-occupied | Renter-occupied |
| 1-Person Household | 78 (83.0%) | 16 (17.0%) |
| 2-Person Household | 106 (100.0%) | 0 (0.0%) |
| 3-Person Household | 0 (0.0%) | 0 (0.0%) |
| 4+ Person Household | 0 (0.0%) | 0 (0.0%) |
| Total Housing Units | 184 (92.0%) | 16 (8.0%) |
Occupancy by Educational Attainment in El Combate
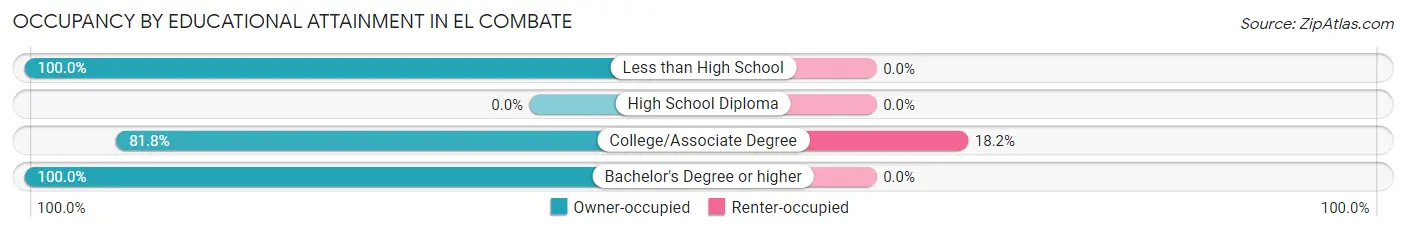
| Household Size | Owner-occupied | Renter-occupied |
| Less than High School | 33 (100.0%) | 0 (0.0%) |
| High School Diploma | 0 (0.0%) | 0 (0.0%) |
| College/Associate Degree | 72 (81.8%) | 16 (18.2%) |
| Bachelor's Degree or higher | 79 (100.0%) | 0 (0.0%) |
Occupancy by Age of Householder in El Combate
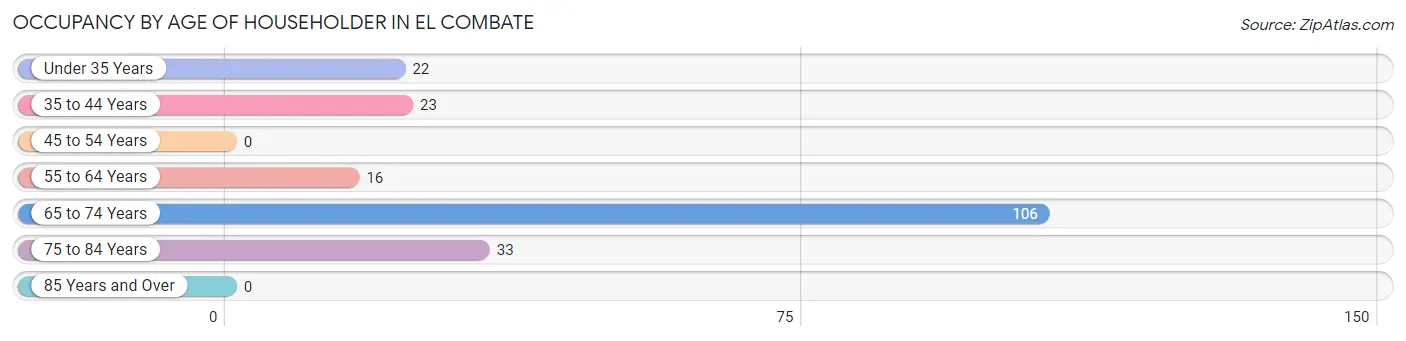
| Age Bracket | # Households | % Households |
| Under 35 Years | 22 | 11.0% |
| 35 to 44 Years | 23 | 11.5% |
| 45 to 54 Years | 0 | 0.0% |
| 55 to 64 Years | 16 | 8.0% |
| 65 to 74 Years | 106 | 53.0% |
| 75 to 84 Years | 33 | 16.5% |
| 85 Years and Over | 0 | 0.0% |
| Total | 200 | 100.0% |
Housing Finances in El Combate
Median Income by Occupancy in El Combate
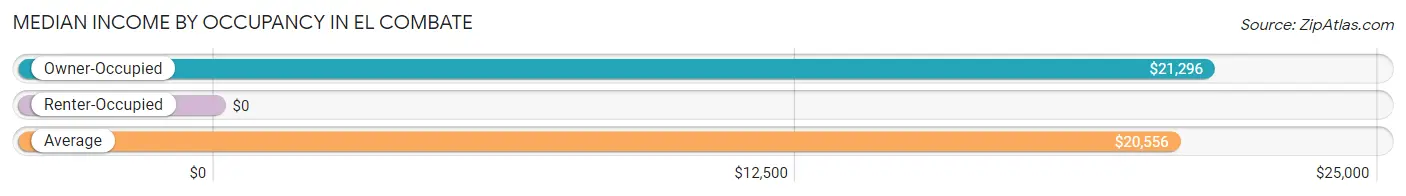
| Occupancy Type | # Households | Median Income |
| Owner-Occupied | 184 (92.0%) | $21,296 |
| Renter-Occupied | 16 (8.0%) | $0 |
| Average | 200 (100.0%) | $20,556 |
Occupancy by Householder Income Bracket in El Combate
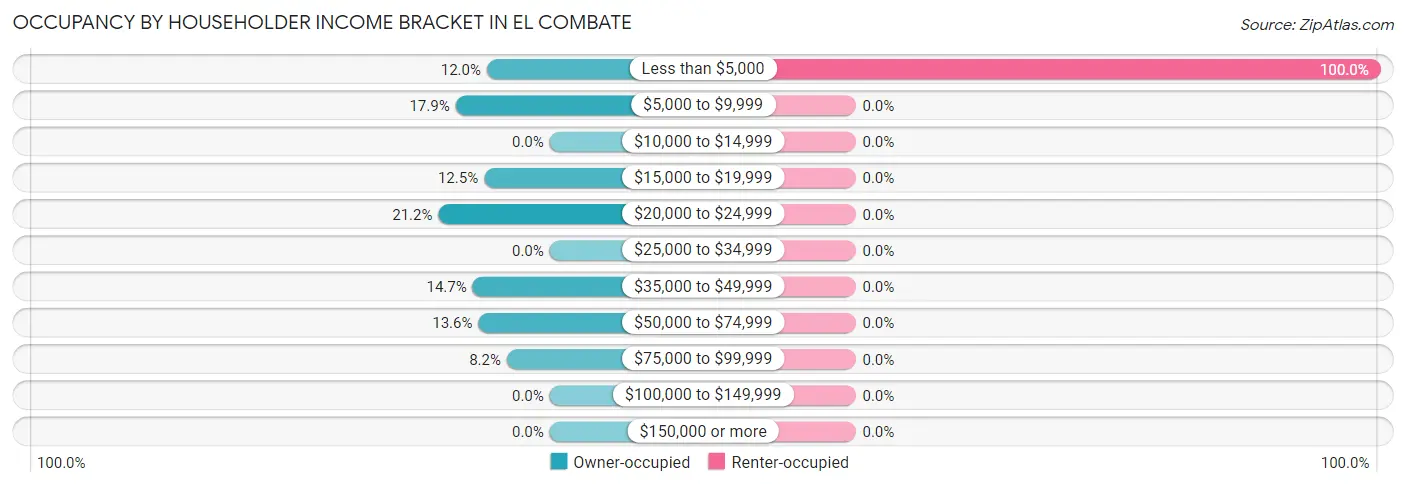
| Income Bracket | Owner-occupied | Renter-occupied |
| Less than $5,000 | 22 (12.0%) | 16 (100.0%) |
| $5,000 to $9,999 | 33 (17.9%) | 0 (0.0%) |
| $10,000 to $14,999 | 0 (0.0%) | 0 (0.0%) |
| $15,000 to $19,999 | 23 (12.5%) | 0 (0.0%) |
| $20,000 to $24,999 | 39 (21.2%) | 0 (0.0%) |
| $25,000 to $34,999 | 0 (0.0%) | 0 (0.0%) |
| $35,000 to $49,999 | 27 (14.7%) | 0 (0.0%) |
| $50,000 to $74,999 | 25 (13.6%) | 0 (0.0%) |
| $75,000 to $99,999 | 15 (8.2%) | 0 (0.0%) |
| $100,000 to $149,999 | 0 (0.0%) | 0 (0.0%) |
| $150,000 or more | 0 (0.0%) | 0 (0.0%) |
| Total | 184 (100.0%) | 16 (100.0%) |
Monthly Housing Cost Tiers in El Combate
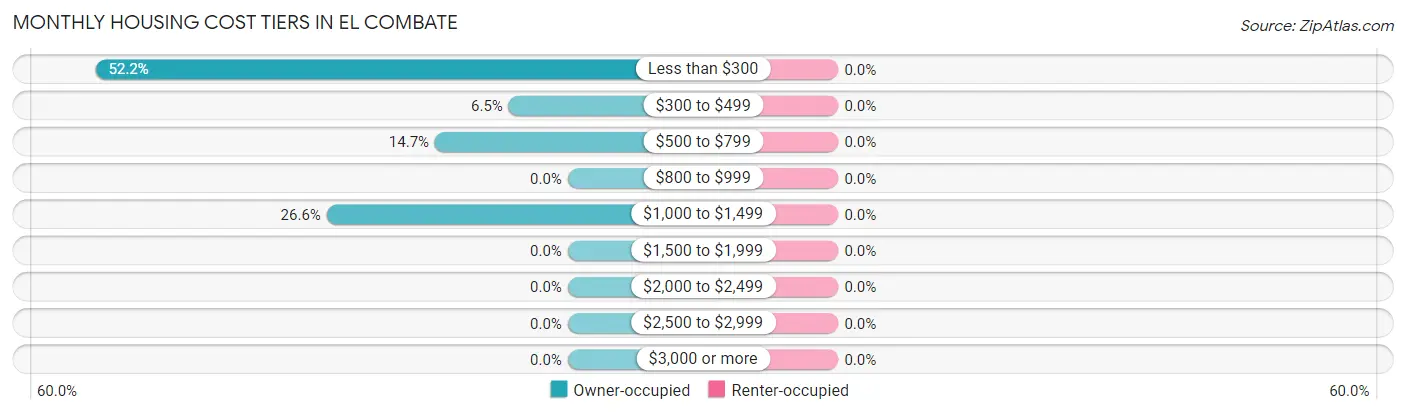
| Monthly Cost | Owner-occupied | Renter-occupied |
| Less than $300 | 96 (52.2%) | 0 (0.0%) |
| $300 to $499 | 12 (6.5%) | 0 (0.0%) |
| $500 to $799 | 27 (14.7%) | 0 (0.0%) |
| $800 to $999 | 0 (0.0%) | 0 (0.0%) |
| $1,000 to $1,499 | 49 (26.6%) | 0 (0.0%) |
| $1,500 to $1,999 | 0 (0.0%) | 0 (0.0%) |
| $2,000 to $2,499 | 0 (0.0%) | 0 (0.0%) |
| $2,500 to $2,999 | 0 (0.0%) | 0 (0.0%) |
| $3,000 or more | 0 (0.0%) | 0 (0.0%) |
| Total | 184 (100.0%) | 16 (100.0%) |
Physical Housing Characteristics in El Combate
Housing Structures in El Combate
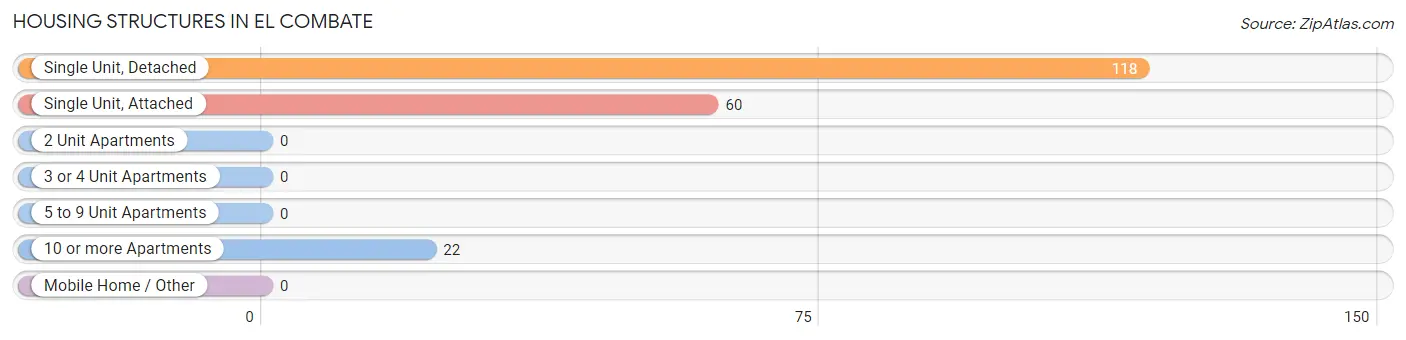
| Structure Type | # Housing Units | % Housing Units |
| Single Unit, Detached | 118 | 59.0% |
| Single Unit, Attached | 60 | 30.0% |
| 2 Unit Apartments | 0 | 0.0% |
| 3 or 4 Unit Apartments | 0 | 0.0% |
| 5 to 9 Unit Apartments | 0 | 0.0% |
| 10 or more Apartments | 22 | 11.0% |
| Mobile Home / Other | 0 | 0.0% |
| Total | 200 | 100.0% |
Housing Structures by Occupancy in El Combate
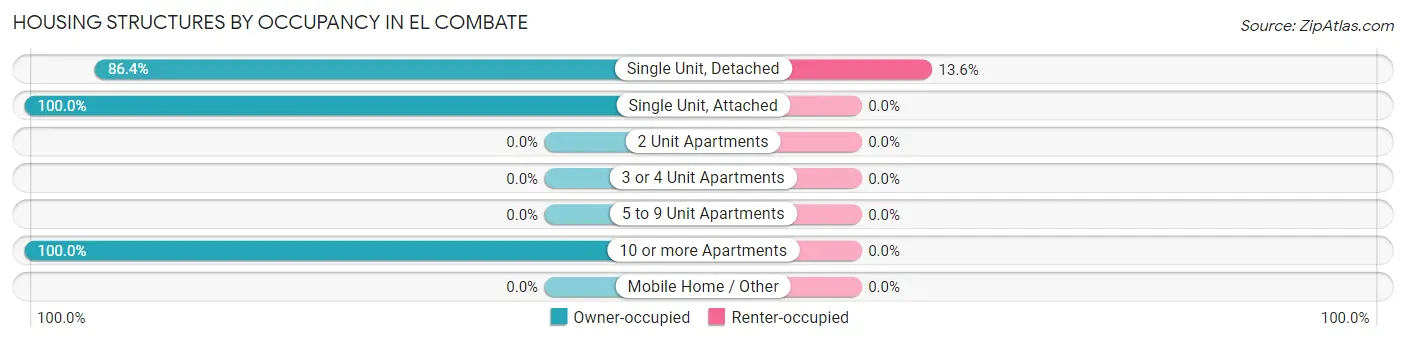
| Structure Type | Owner-occupied | Renter-occupied |
| Single Unit, Detached | 102 (86.4%) | 16 (13.6%) |
| Single Unit, Attached | 60 (100.0%) | 0 (0.0%) |
| 2 Unit Apartments | 0 (0.0%) | 0 (0.0%) |
| 3 or 4 Unit Apartments | 0 (0.0%) | 0 (0.0%) |
| 5 to 9 Unit Apartments | 0 (0.0%) | 0 (0.0%) |
| 10 or more Apartments | 22 (100.0%) | 0 (0.0%) |
| Mobile Home / Other | 0 (0.0%) | 0 (0.0%) |
| Total | 184 (92.0%) | 16 (8.0%) |
Housing Structures by Number of Rooms in El Combate
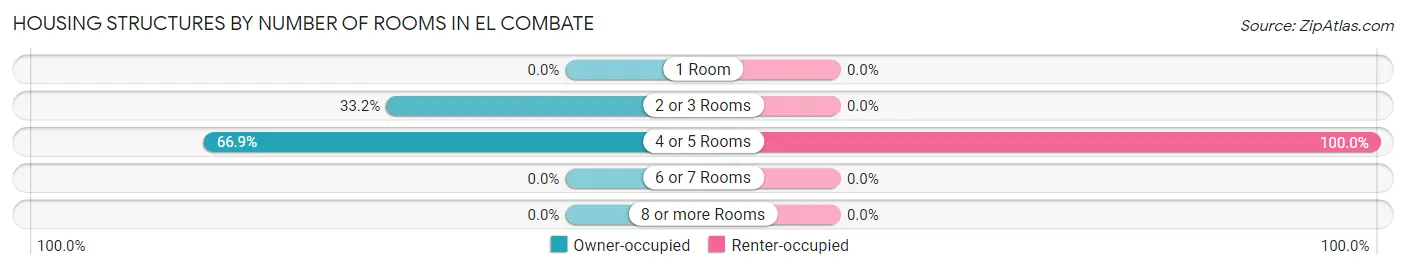
| Number of Rooms | Owner-occupied | Renter-occupied |
| 1 Room | 0 (0.0%) | 0 (0.0%) |
| 2 or 3 Rooms | 61 (33.2%) | 0 (0.0%) |
| 4 or 5 Rooms | 123 (66.8%) | 16 (100.0%) |
| 6 or 7 Rooms | 0 (0.0%) | 0 (0.0%) |
| 8 or more Rooms | 0 (0.0%) | 0 (0.0%) |
| Total | 184 (100.0%) | 16 (100.0%) |
Housing Structure by Heating Type in El Combate
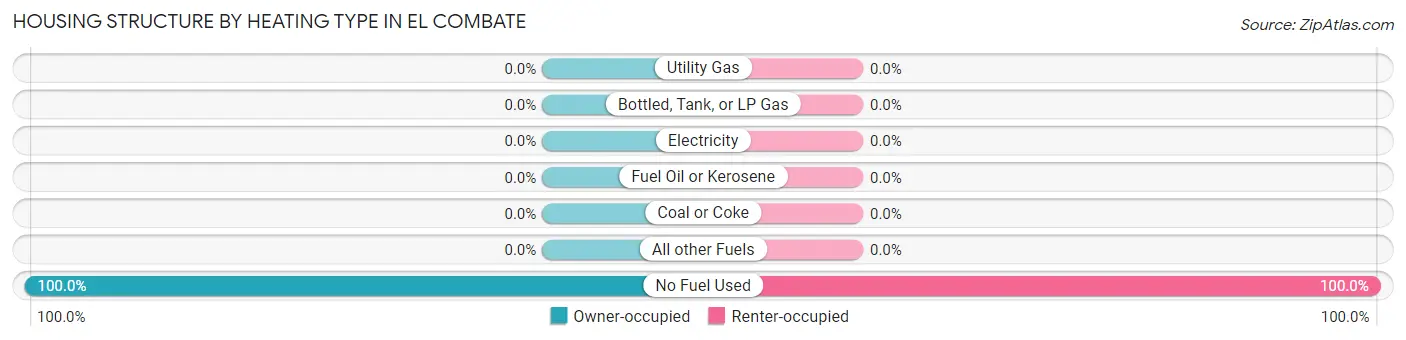
| Heating Type | Owner-occupied | Renter-occupied |
| Utility Gas | 0 (0.0%) | 0 (0.0%) |
| Bottled, Tank, or LP Gas | 0 (0.0%) | 0 (0.0%) |
| Electricity | 0 (0.0%) | 0 (0.0%) |
| Fuel Oil or Kerosene | 0 (0.0%) | 0 (0.0%) |
| Coal or Coke | 0 (0.0%) | 0 (0.0%) |
| All other Fuels | 0 (0.0%) | 0 (0.0%) |
| No Fuel Used | 184 (100.0%) | 16 (100.0%) |
| Total | 184 (100.0%) | 16 (100.0%) |
Household Vehicle Usage in El Combate
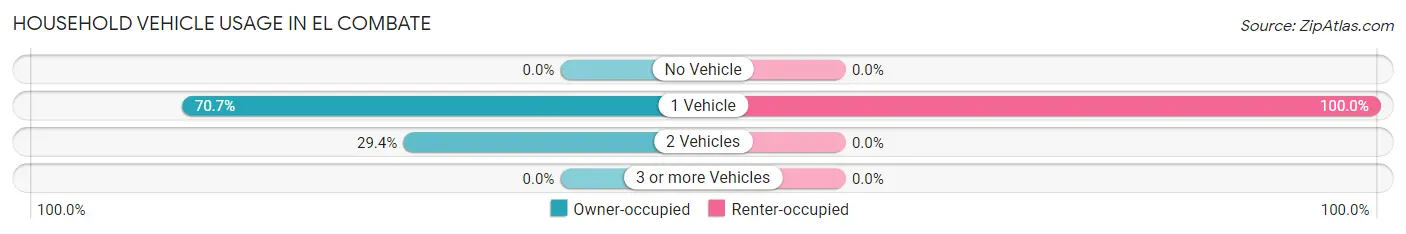
| Vehicles per Household | Owner-occupied | Renter-occupied |
| No Vehicle | 0 (0.0%) | 0 (0.0%) |
| 1 Vehicle | 130 (70.7%) | 16 (100.0%) |
| 2 Vehicles | 54 (29.3%) | 0 (0.0%) |
| 3 or more Vehicles | 0 (0.0%) | 0 (0.0%) |
| Total | 184 (100.0%) | 16 (100.0%) |
Real Estate & Mortgages in El Combate
Real Estate and Mortgage Overview in El Combate
| Characteristic | Without Mortgage | With Mortgage |
| Housing Units | 135 | 49 |
| Median Property Value | $236,100 | $0 |
| Median Household Income | - | - |
| Monthly Housing Costs | $213 | $0 |
| Real Estate Taxes | - | - |
Property Value by Mortgage Status in El Combate
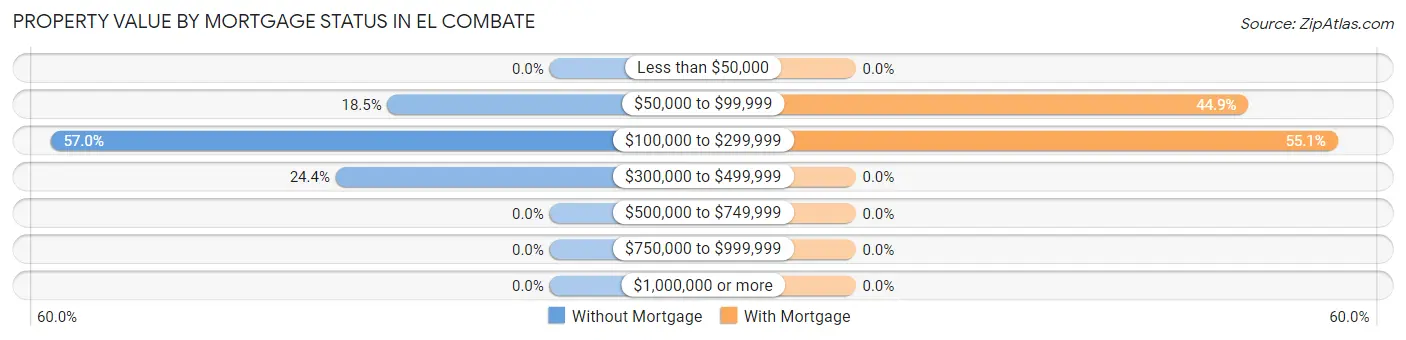
| Property Value | Without Mortgage | With Mortgage |
| Less than $50,000 | 0 (0.0%) | 0 (0.0%) |
| $50,000 to $99,999 | 25 (18.5%) | 22 (44.9%) |
| $100,000 to $299,999 | 77 (57.0%) | 27 (55.1%) |
| $300,000 to $499,999 | 33 (24.4%) | 0 (0.0%) |
| $500,000 to $749,999 | 0 (0.0%) | 0 (0.0%) |
| $750,000 to $999,999 | 0 (0.0%) | 0 (0.0%) |
| $1,000,000 or more | 0 (0.0%) | 0 (0.0%) |
| Total | 135 (100.0%) | 49 (100.0%) |
Household Income by Mortgage Status in El Combate
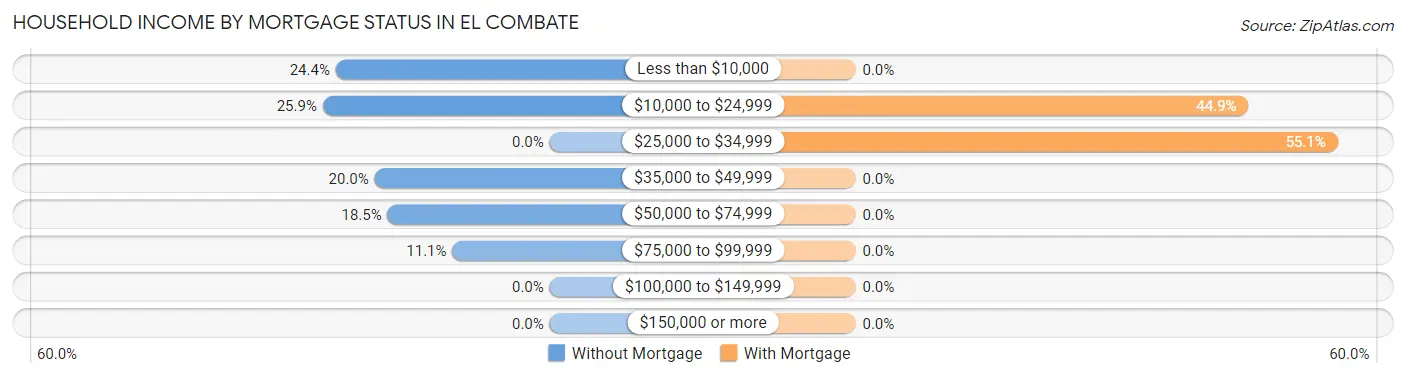
| Household Income | Without Mortgage | With Mortgage |
| Less than $10,000 | 33 (24.4%) | 0 (0.0%) |
| $10,000 to $24,999 | 35 (25.9%) | 22 (44.9%) |
| $25,000 to $34,999 | 0 (0.0%) | 27 (55.1%) |
| $35,000 to $49,999 | 27 (20.0%) | 0 (0.0%) |
| $50,000 to $74,999 | 25 (18.5%) | 0 (0.0%) |
| $75,000 to $99,999 | 15 (11.1%) | 0 (0.0%) |
| $100,000 to $149,999 | 0 (0.0%) | 0 (0.0%) |
| $150,000 or more | 0 (0.0%) | 0 (0.0%) |
| Total | 135 (100.0%) | 49 (100.0%) |
Property Value to Household Income Ratio in El Combate
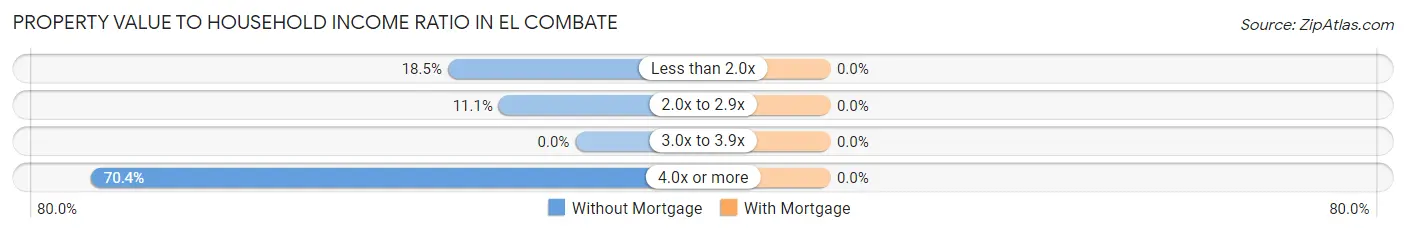
| Value-to-Income Ratio | Without Mortgage | With Mortgage |
| Less than 2.0x | 25 (18.5%) | 0 (0.0%) |
| 2.0x to 2.9x | 15 (11.1%) | 0 (0.0%) |
| 3.0x to 3.9x | 0 (0.0%) | 0 (0.0%) |
| 4.0x or more | 95 (70.4%) | 0 (0.0%) |
| Total | 135 (100.0%) | 49 (100.0%) |
Real Estate Taxes by Mortgage Status in El Combate
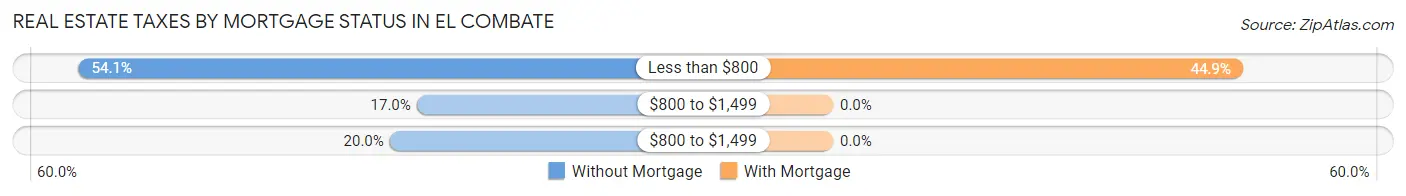
| Property Taxes | Without Mortgage | With Mortgage |
| Less than $800 | 73 (54.1%) | 22 (44.9%) |
| $800 to $1,499 | 23 (17.0%) | 0 (0.0%) |
| $800 to $1,499 | 27 (20.0%) | 0 (0.0%) |
| Total | 135 (100.0%) | 49 (100.0%) |
Health & Disability in El Combate
Health Insurance Coverage by Age in El Combate
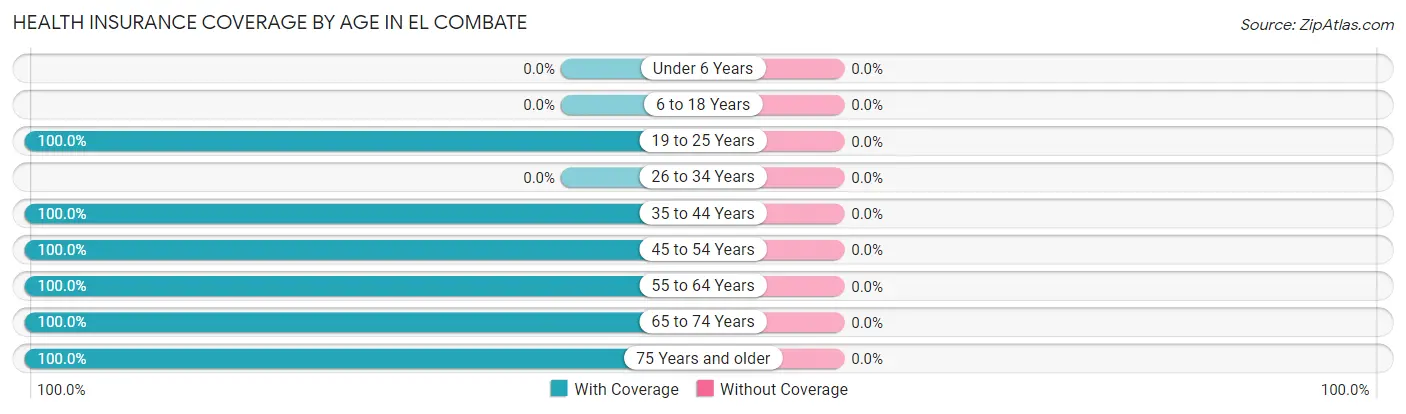
| Age Bracket | With Coverage | Without Coverage |
| Under 6 Years | 0 (0.0%) | 0 (0.0%) |
| 6 to 18 Years | 0 (0.0%) | 0 (0.0%) |
| 19 to 25 Years | 91 (100.0%) | 0 (0.0%) |
| 26 to 34 Years | 0 (0.0%) | 0 (0.0%) |
| 35 to 44 Years | 23 (100.0%) | 0 (0.0%) |
| 45 to 54 Years | 33 (100.0%) | 0 (0.0%) |
| 55 to 64 Years | 16 (100.0%) | 0 (0.0%) |
| 65 to 74 Years | 145 (100.0%) | 0 (0.0%) |
| 75 Years and older | 49 (100.0%) | 0 (0.0%) |
| Total | 357 (100.0%) | 0 (0.0%) |
Health Insurance Coverage by Citizenship Status in El Combate

| Citizenship Status | With Coverage | Without Coverage |
| Native Born | 0 (0.0%) | 0 (0.0%) |
| Foreign Born, Citizen | 0 (0.0%) | 0 (0.0%) |
| Foreign Born, not a Citizen | 91 (100.0%) | 0 (0.0%) |
Health Insurance Coverage by Household Income in El Combate
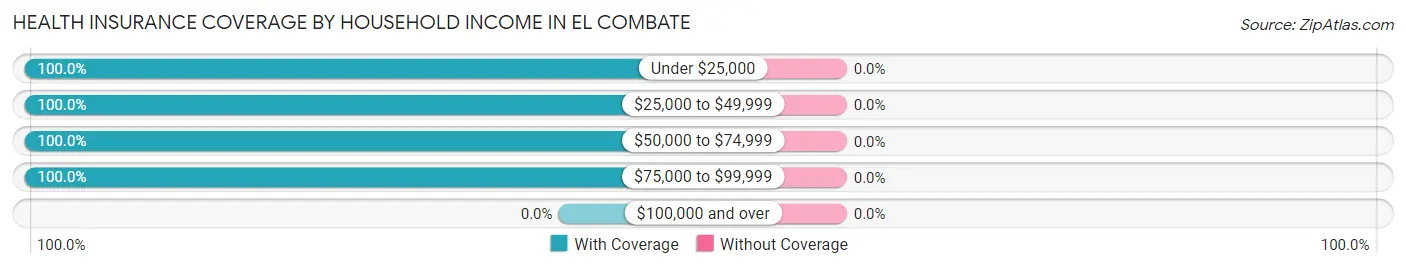
| Household Income | With Coverage | Without Coverage |
| Under $25,000 | 212 (100.0%) | 0 (0.0%) |
| $25,000 to $49,999 | 60 (100.0%) | 0 (0.0%) |
| $50,000 to $74,999 | 54 (100.0%) | 0 (0.0%) |
| $75,000 to $99,999 | 31 (100.0%) | 0 (0.0%) |
| $100,000 and over | 0 (0.0%) | 0 (0.0%) |
Public vs Private Health Insurance Coverage by Age in El Combate
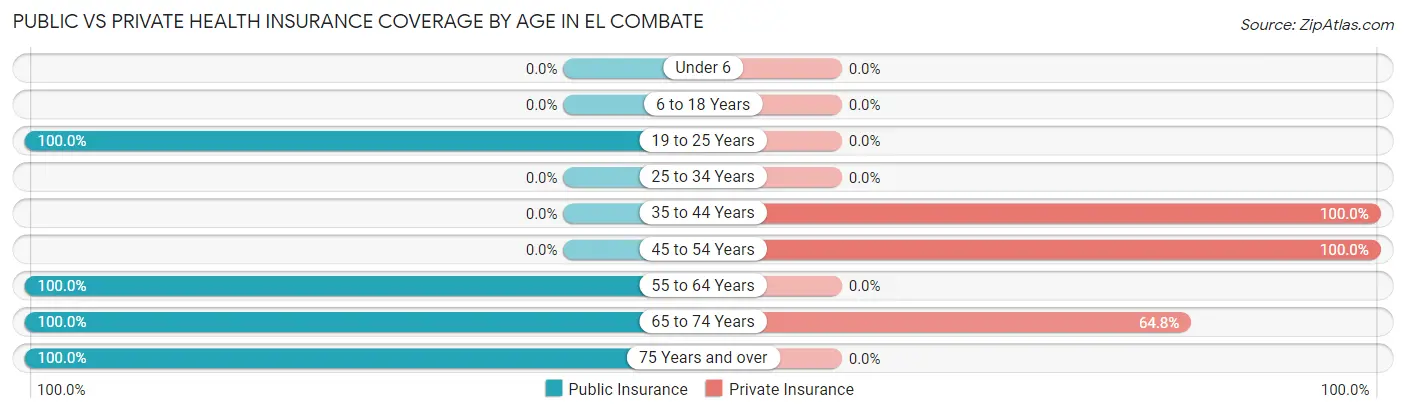
| Age Bracket | Public Insurance | Private Insurance |
| Under 6 | 0 (0.0%) | 0 (0.0%) |
| 6 to 18 Years | 0 (0.0%) | 0 (0.0%) |
| 19 to 25 Years | 91 (100.0%) | 0 (0.0%) |
| 25 to 34 Years | 0 (0.0%) | 0 (0.0%) |
| 35 to 44 Years | 0 (0.0%) | 23 (100.0%) |
| 45 to 54 Years | 0 (0.0%) | 33 (100.0%) |
| 55 to 64 Years | 16 (100.0%) | 0 (0.0%) |
| 65 to 74 Years | 145 (100.0%) | 94 (64.8%) |
| 75 Years and over | 49 (100.0%) | 0 (0.0%) |
| Total | 301 (84.3%) | 150 (42.0%) |
Disability Status by Sex by Age in El Combate
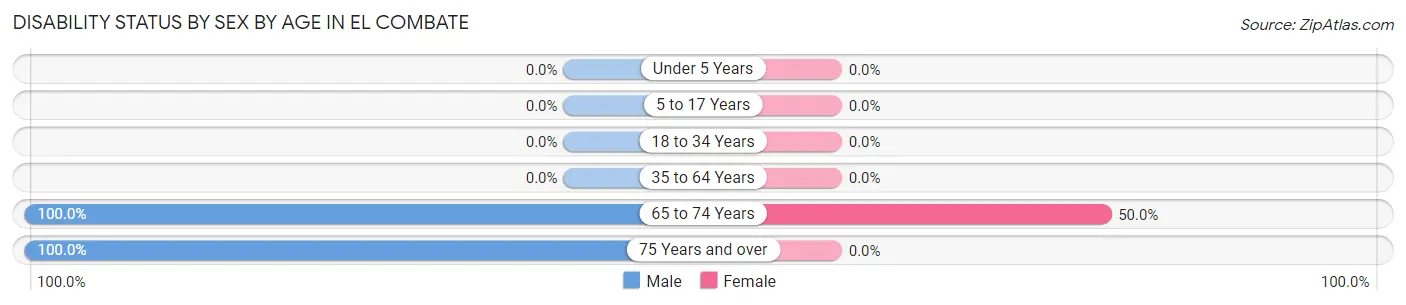
| Age Bracket | Male | Female |
| Under 5 Years | 0 (0.0%) | 0 (0.0%) |
| 5 to 17 Years | 0 (0.0%) | 0 (0.0%) |
| 18 to 34 Years | 0 (0.0%) | 0 (0.0%) |
| 35 to 64 Years | 0 (0.0%) | 0 (0.0%) |
| 65 to 74 Years | 41 (100.0%) | 52 (50.0%) |
| 75 Years and over | 16 (100.0%) | 0 (0.0%) |
Disability Class by Sex by Age in El Combate
Disability Class: Hearing Difficulty
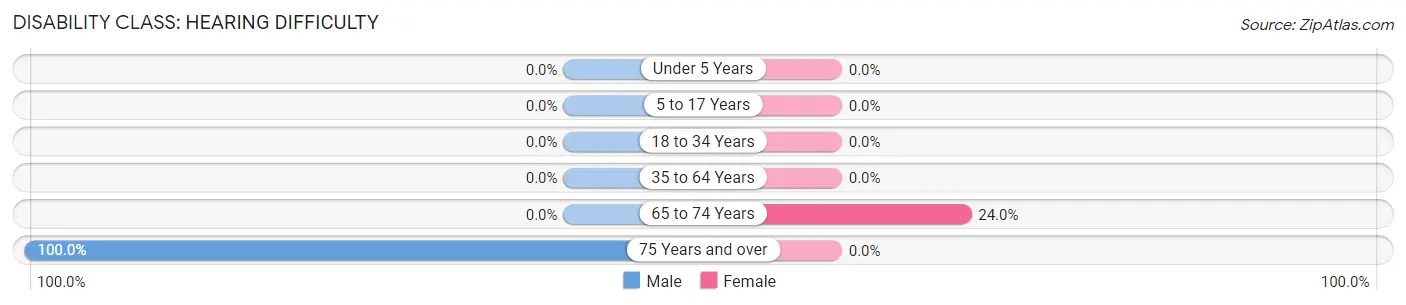
| Age Bracket | Male | Female |
| Under 5 Years | 0 (0.0%) | 0 (0.0%) |
| 5 to 17 Years | 0 (0.0%) | 0 (0.0%) |
| 18 to 34 Years | 0 (0.0%) | 0 (0.0%) |
| 35 to 64 Years | 0 (0.0%) | 0 (0.0%) |
| 65 to 74 Years | 0 (0.0%) | 25 (24.0%) |
| 75 Years and over | 16 (100.0%) | 0 (0.0%) |
Disability Class: Vision Difficulty
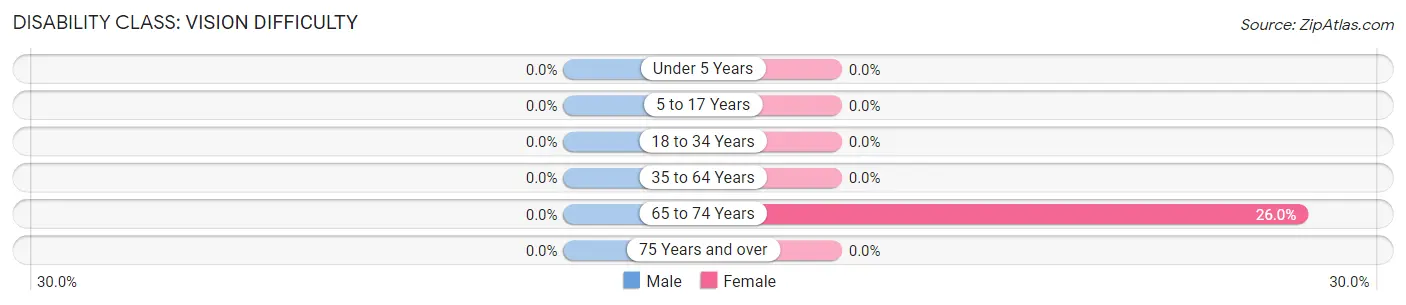
| Age Bracket | Male | Female |
| Under 5 Years | 0 (0.0%) | 0 (0.0%) |
| 5 to 17 Years | 0 (0.0%) | 0 (0.0%) |
| 18 to 34 Years | 0 (0.0%) | 0 (0.0%) |
| 35 to 64 Years | 0 (0.0%) | 0 (0.0%) |
| 65 to 74 Years | 0 (0.0%) | 27 (26.0%) |
| 75 Years and over | 0 (0.0%) | 0 (0.0%) |
Disability Class: Cognitive Difficulty
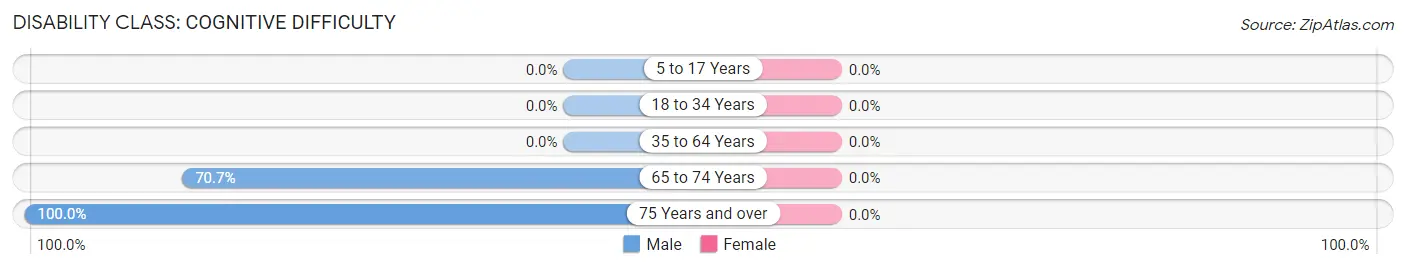
| Age Bracket | Male | Female |
| 5 to 17 Years | 0 (0.0%) | 0 (0.0%) |
| 18 to 34 Years | 0 (0.0%) | 0 (0.0%) |
| 35 to 64 Years | 0 (0.0%) | 0 (0.0%) |
| 65 to 74 Years | 29 (70.7%) | 0 (0.0%) |
| 75 Years and over | 16 (100.0%) | 0 (0.0%) |
Disability Class: Ambulatory Difficulty
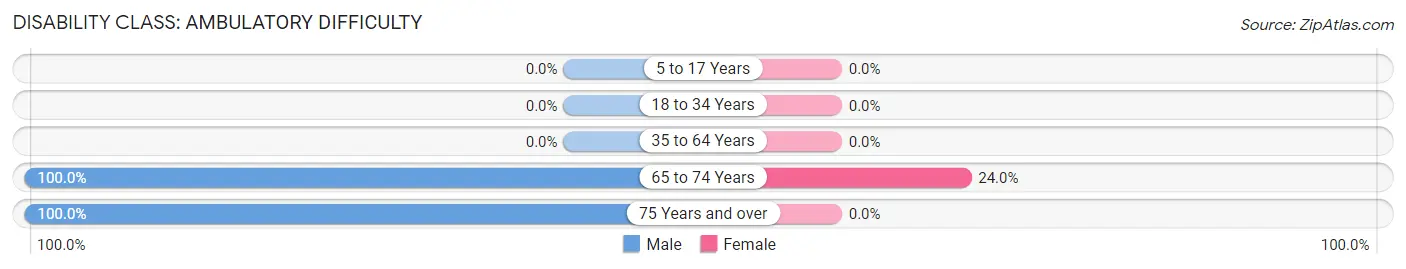
| Age Bracket | Male | Female |
| 5 to 17 Years | 0 (0.0%) | 0 (0.0%) |
| 18 to 34 Years | 0 (0.0%) | 0 (0.0%) |
| 35 to 64 Years | 0 (0.0%) | 0 (0.0%) |
| 65 to 74 Years | 41 (100.0%) | 25 (24.0%) |
| 75 Years and over | 16 (100.0%) | 0 (0.0%) |
Disability Class: Self-Care Difficulty
| Age Bracket | Male | Female |
| 5 to 17 Years | 0 (0.0%) | 0 (0.0%) |
| 18 to 34 Years | 0 (0.0%) | 0 (0.0%) |
| 35 to 64 Years | 0 (0.0%) | 0 (0.0%) |
| 65 to 74 Years | 0 (0.0%) | 0 (0.0%) |
| 75 Years and over | 0 (0.0%) | 0 (0.0%) |
Technology Access in El Combate
Computing Device Access in El Combate
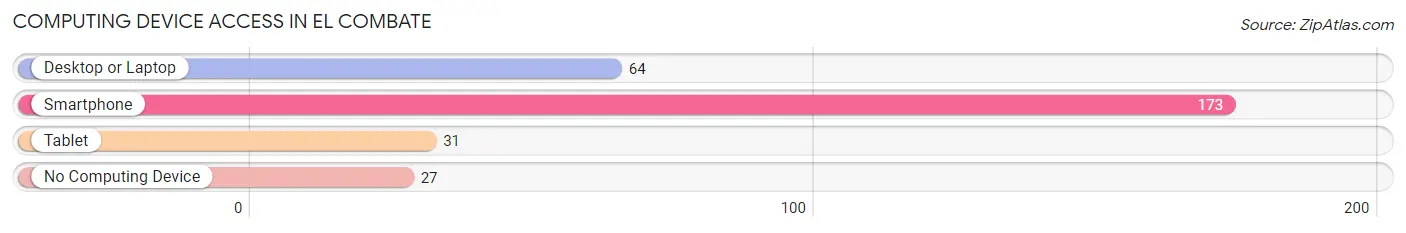
| Device Type | # Households | % Households |
| Desktop or Laptop | 64 | 32.0% |
| Smartphone | 173 | 86.5% |
| Tablet | 31 | 15.5% |
| No Computing Device | 27 | 13.5% |
| Total | 200 | 100.0% |
Internet Access in El Combate
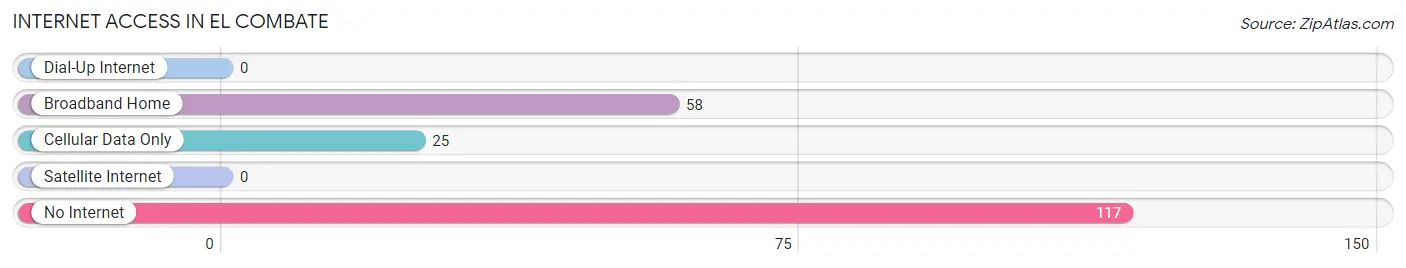
| Internet Type | # Households | % Households |
| Dial-Up Internet | 0 | 0.0% |
| Broadband Home | 58 | 29.0% |
| Cellular Data Only | 25 | 12.5% |
| Satellite Internet | 0 | 0.0% |
| No Internet | 117 | 58.5% |
| Total | 200 | 100.0% |
El Combate Summary
The municipality of El Combate is located in the western region of Puerto Rico, in the municipality of Mayagüez. It is bordered by the municipalities of San Germán, Maricao, and Las Marías. El Combate is a small rural town with a population of 2,845 people, according to the 2010 census.
Geography
El Combate is located in the western region of Puerto Rico, in the municipality of Mayagüez. It is bordered by the municipalities of San Germán, Maricao, and Las Marías. El Combate is a small rural town with a population of 2,845 people, according to the 2010 census. The town is located in the foothills of the Cordillera Central mountain range, and is surrounded by lush vegetation and rolling hills. The town is located at an elevation of 1,000 feet above sea level.
The climate in El Combate is tropical, with temperatures ranging from the mid-70s to the mid-80s Fahrenheit. The town receives an average of 60 inches of rain per year, and is prone to hurricanes and tropical storms.
History
El Combate was founded in 1845 by a group of settlers from the nearby town of San Germán. The town was originally called “El Combate de San Germán”, but the name was eventually shortened to El Combate. The town was officially incorporated in 1848.
The town was originally a small agricultural community, with the main crops being coffee, sugar cane, and tobacco. In the late 19th century, the town began to grow and develop, and by the early 20th century, it had become a thriving commercial center.
Economy
The economy of El Combate is largely based on agriculture and tourism. The main crops grown in the area are coffee, sugar cane, and tobacco. The town is also home to several small businesses, including restaurants, shops, and hotels.
Tourism is an important part of the local economy, as the town is home to several popular attractions, including the El Combate Beach, the El Combate Waterfall, and the El Combate Cave.
Demographics
According to the 2010 census, the population of El Combate was 2,845 people. The population is predominantly of Hispanic descent, with a small percentage of African-American and other ethnicities. The median age of the population is 33 years old, and the median household income is $17,000.
The town is served by the El Combate Public School System, which consists of two elementary schools, one middle school, and one high school. The town also has a public library and a community center.
Conclusion
El Combate is a small rural town located in the western region of Puerto Rico. The town has a population of 2,845 people, and is largely dependent on agriculture and tourism for its economy. The town is home to several popular attractions, including the El Combate Beach, the El Combate Waterfall, and the El Combate Cave. The town is served by the El Combate Public School System, and has a public library and a community center.
Common Questions
What is Per Capita Income in El Combate?
Per Capita income in El Combate is $15,844.
What is the Median Family Income in El Combate?
Median Family Income in El Combate is $43,796.
What is the Median Household income in El Combate?
Median Household Income in El Combate is $20,556.
What is Inequality or Gini Index in El Combate?
Inequality or Gini Index in El Combate is 0.48.
What is the Total Population of El Combate?
Total Population of El Combate is 357.
What is the Total Male Population of El Combate?
Total Male Population of El Combate is 113.
What is the Total Female Population of El Combate?
Total Female Population of El Combate is 244.
What is the Ratio of Males per 100 Females in El Combate?
There are 46.31 Males per 100 Females in El Combate.
What is the Ratio of Females per 100 Males in El Combate?
There are 215.93 Females per 100 Males in El Combate.
What is the Median Population Age in El Combate?
Median Population Age in El Combate is 66.4 Years.
What is the Average Family Size in El Combate
Average Family Size in El Combate is 2.5 People.
What is the Average Household Size in El Combate
Average Household Size in El Combate is 1.8 People.
How Large is the Labor Force in El Combate?
There are 141 People in the Labor Forcein in El Combate.
What is the Percentage of People in the Labor Force in El Combate?
39.5% of People are in the Labor Force in El Combate.
What is the Unemployment Rate in El Combate?
Unemployment Rate in El Combate is 72.3%.