Atomic City, ID Map & Demographics
Atomic City Map
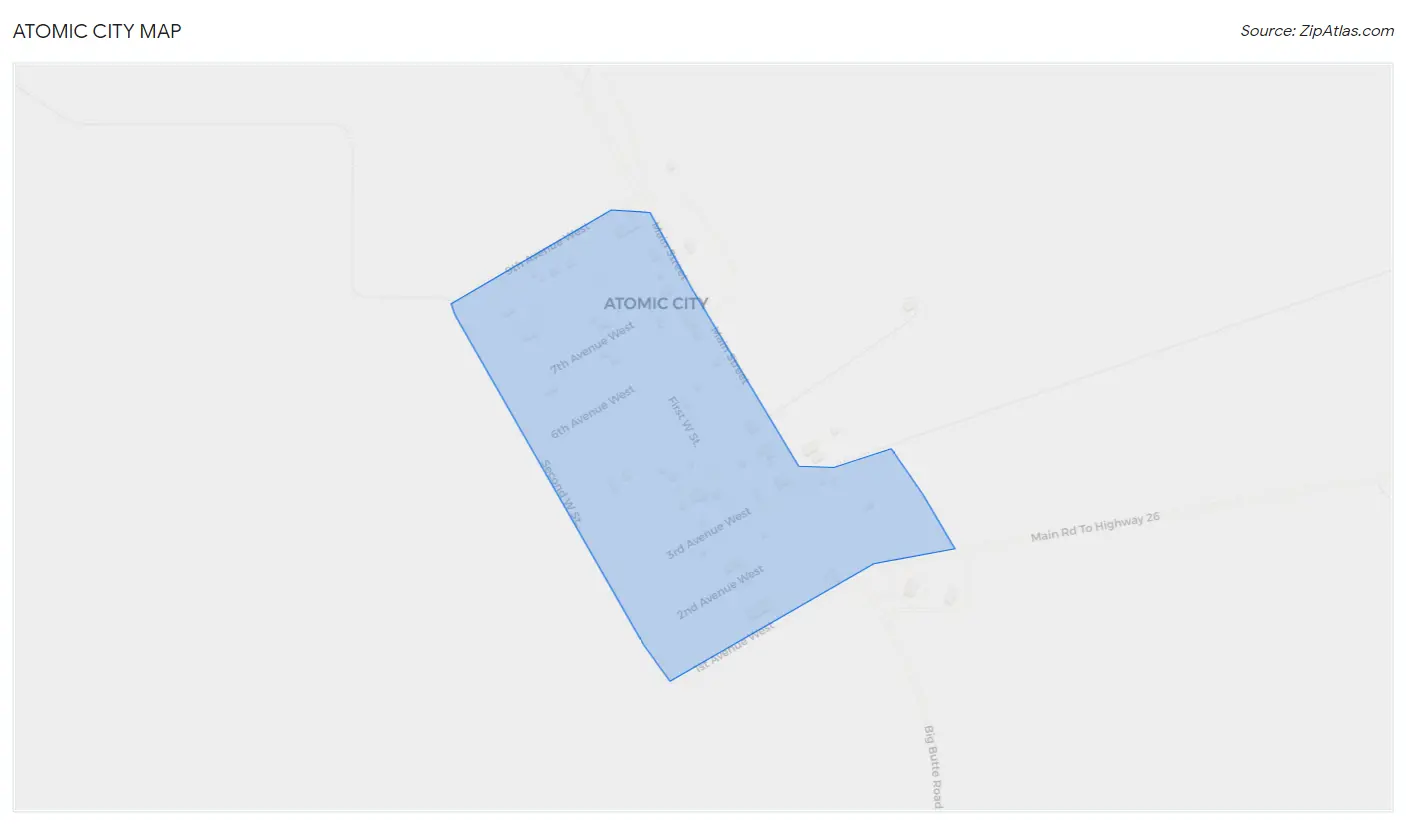
Atomic City Overview
$30,910
PER CAPITA INCOME
0.49
INEQUALITY / GINI INDEX
21
TOTAL POPULATION
11
MALE POPULATION
10
FEMALE POPULATION
110.00
MALES / 100 FEMALES
90.91
FEMALES / 100 MALES
62.5
MEDIAN AGE
3.5
AVG FAMILY SIZE
1.3
AVG HOUSEHOLD SIZE
5
LABOR FORCE [ PEOPLE ]
27.8%
PERCENT IN LABOR FORCE
Atomic City Zip Codes
Atomic City Area Codes
Income in Atomic City
Income Overview in Atomic City
| Characteristic | Number | Measure |
| Per Capita Income | 21 | $30,910 |
| Median Family Income | 2 | $0 |
| Mean Family Income | 2 | $0 |
| Median Household Income | 16 | $0 |
| Mean Household Income | 16 | $40,569 |
| Income Deficit | 2 | $0 |
| Wage / Income Gap (%) | 21 | 0.00% |
| Wage / Income Gap ($) | 21 | 100.00¢ per $1 |
| Gini / Inequality Index | 21 | 0.49 |
Earnings by Sex in Atomic City
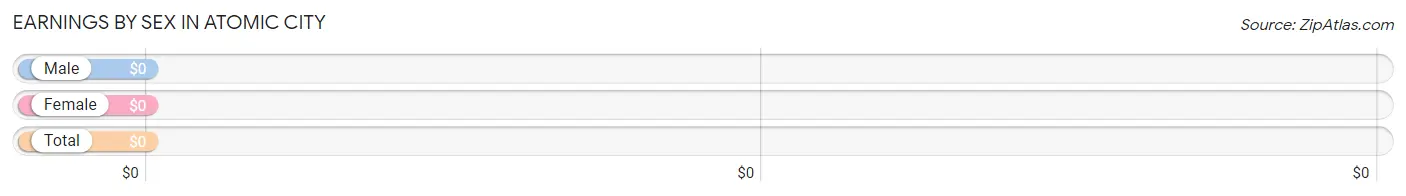
| Sex | Number | Average Earnings |
| Male | 5 (83.3%) | $0 |
| Female | 1 (16.7%) | $0 |
| Total | 6 (100.0%) | $0 |
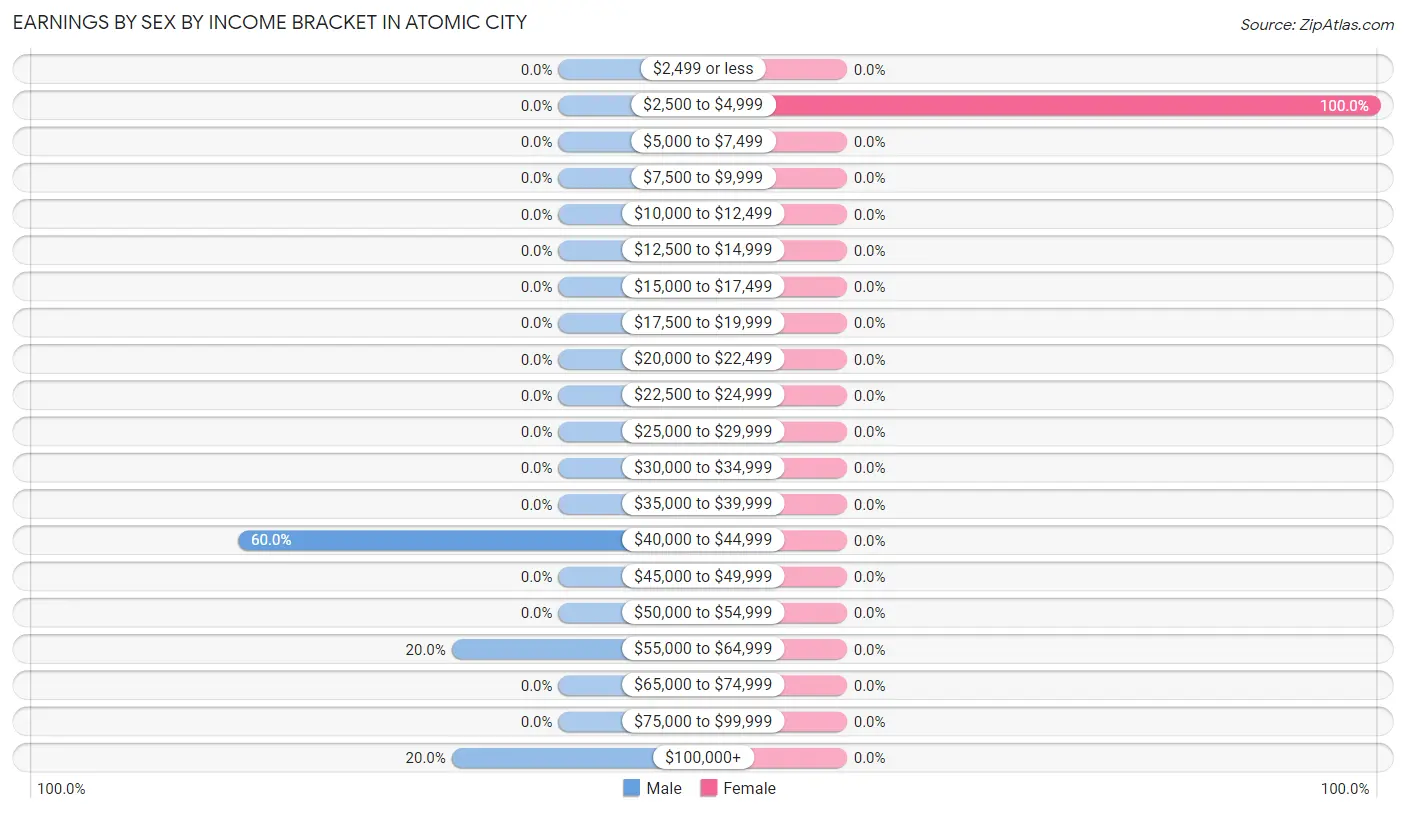
Earnings by Sex by Income Bracket in Atomic City
The most common earnings brackets in Atomic City are $40,000 to $44,999 for men (3 | 60.0%) and $2,500 to $4,999 for women (1 | 100.0%).
| Income | Male | Female |
| $2,499 or less | 0 (0.0%) | 0 (0.0%) |
| $2,500 to $4,999 | 0 (0.0%) | 1 (100.0%) |
| $5,000 to $7,499 | 0 (0.0%) | 0 (0.0%) |
| $7,500 to $9,999 | 0 (0.0%) | 0 (0.0%) |
| $10,000 to $12,499 | 0 (0.0%) | 0 (0.0%) |
| $12,500 to $14,999 | 0 (0.0%) | 0 (0.0%) |
| $15,000 to $17,499 | 0 (0.0%) | 0 (0.0%) |
| $17,500 to $19,999 | 0 (0.0%) | 0 (0.0%) |
| $20,000 to $22,499 | 0 (0.0%) | 0 (0.0%) |
| $22,500 to $24,999 | 0 (0.0%) | 0 (0.0%) |
| $25,000 to $29,999 | 0 (0.0%) | 0 (0.0%) |
| $30,000 to $34,999 | 0 (0.0%) | 0 (0.0%) |
| $35,000 to $39,999 | 0 (0.0%) | 0 (0.0%) |
| $40,000 to $44,999 | 3 (60.0%) | 0 (0.0%) |
| $45,000 to $49,999 | 0 (0.0%) | 0 (0.0%) |
| $50,000 to $54,999 | 0 (0.0%) | 0 (0.0%) |
| $55,000 to $64,999 | 1 (20.0%) | 0 (0.0%) |
| $65,000 to $74,999 | 0 (0.0%) | 0 (0.0%) |
| $75,000 to $99,999 | 0 (0.0%) | 0 (0.0%) |
| $100,000+ | 1 (20.0%) | 0 (0.0%) |
| Total | 5 (100.0%) | 1 (100.0%) |
Earnings by Sex by Educational Attainment in Atomic City
| Educational Attainment | Male Income | Female Income |
| Less than High School | - | - |
| High School Diploma | - | - |
| College or Associate's Degree | - | - |
| Bachelor's Degree | - | - |
| Graduate Degree | - | - |
| Total | - | - |
Family Income in Atomic City
Family Income Brackets in Atomic City
According to the Atomic City family income data, there are 1 families falling into the $50,000 to $74,999 income range, which is the most common income bracket and makes up 50.0% of all families.
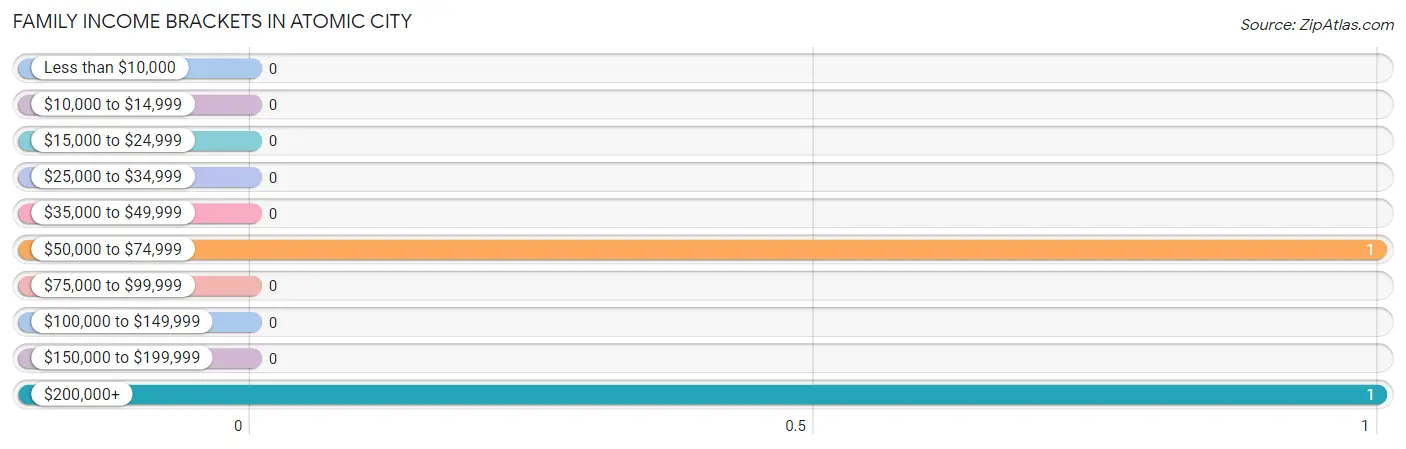
| Income Bracket | # Families | % Families |
| Less than $10,000 | 0 | 0.0% |
| $10,000 to $14,999 | 0 | 0.0% |
| $15,000 to $24,999 | 0 | 0.0% |
| $25,000 to $34,999 | 0 | 0.0% |
| $35,000 to $49,999 | 0 | 0.0% |
| $50,000 to $74,999 | 1 | 50.0% |
| $75,000 to $99,999 | 0 | 0.0% |
| $100,000 to $149,999 | 0 | 0.0% |
| $150,000 to $199,999 | 0 | 0.0% |
| $200,000+ | 1 | 50.0% |
Family Income by Famaliy Size in Atomic City
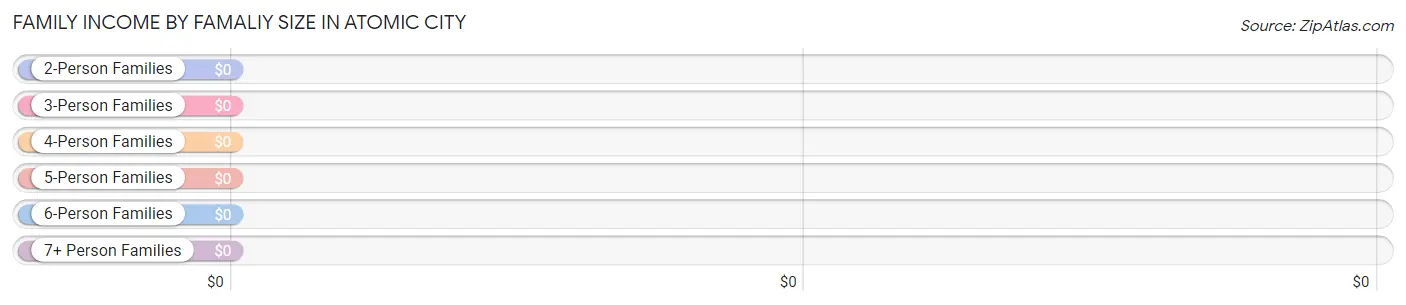
| Income Bracket | # Families | Median Income |
| 2-Person Families | 1 (50.0%) | $0 |
| 3-Person Families | 1 (50.0%) | $0 |
| 4-Person Families | 0 (0.0%) | $0 |
| 5-Person Families | 0 (0.0%) | $0 |
| 6-Person Families | 0 (0.0%) | $0 |
| 7+ Person Families | 0 (0.0%) | $0 |
| Total | 2 (100.0%) | $0 |
Family Income by Number of Earners in Atomic City
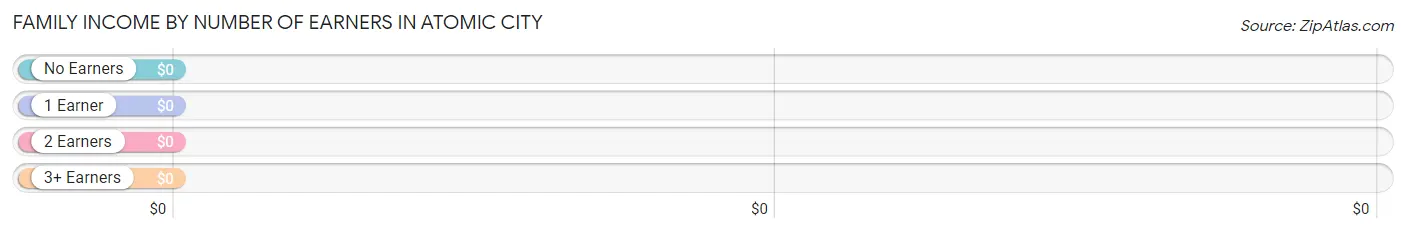
| Number of Earners | # Families | Median Income |
| No Earners | 0 (0.0%) | $0 |
| 1 Earner | 1 (50.0%) | $0 |
| 2 Earners | 1 (50.0%) | $0 |
| 3+ Earners | 0 (0.0%) | $0 |
| Total | 2 (100.0%) | $0 |
Household Income in Atomic City
Household Income Brackets in Atomic City
With 6 households falling in the category, the $35,000 to $49,999 income range is the most frequent in Atomic City, accounting for 37.5% of all households.
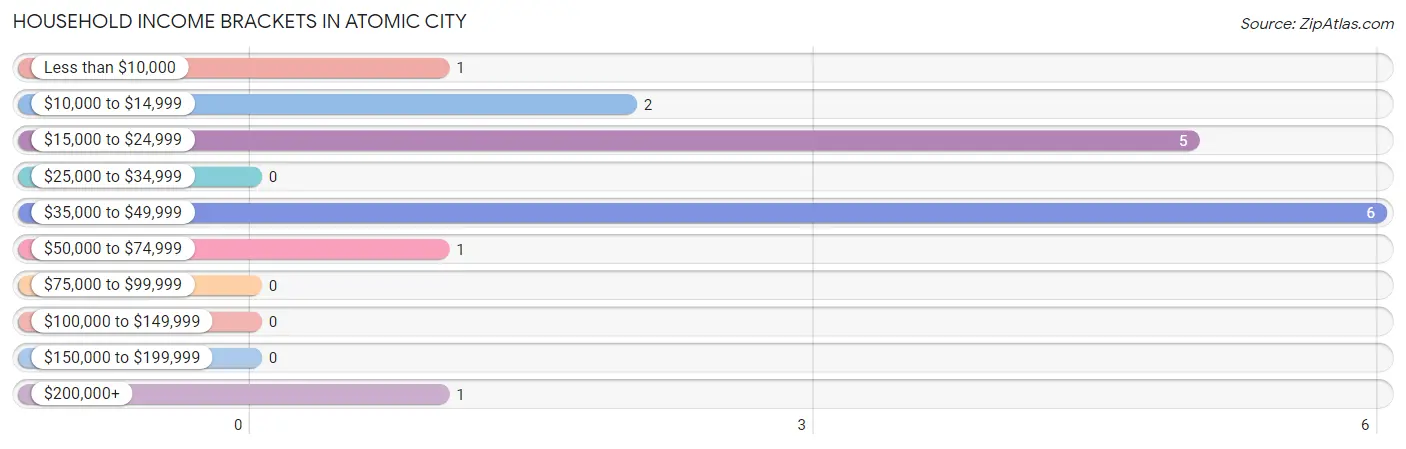
| Income Bracket | # Households | % Households |
| Less than $10,000 | 1 | 6.3% |
| $10,000 to $14,999 | 2 | 12.5% |
| $15,000 to $24,999 | 5 | 31.3% |
| $25,000 to $34,999 | 0 | 0.0% |
| $35,000 to $49,999 | 6 | 37.5% |
| $50,000 to $74,999 | 1 | 6.3% |
| $75,000 to $99,999 | 0 | 0.0% |
| $100,000 to $149,999 | 0 | 0.0% |
| $150,000 to $199,999 | 0 | 0.0% |
| $200,000+ | 1 | 6.3% |
Household Income by Householder Age in Atomic City
| Income Bracket | # Households | Median Income |
| 15 to 24 Years | 0 (0.0%) | $0 |
| 25 to 44 Years | 0 (0.0%) | $0 |
| 45 to 64 Years | 14 (87.5%) | $0 |
| 65+ Years | 2 (12.5%) | $0 |
| Total | 16 (100.0%) | $0 |
Poverty in Atomic City
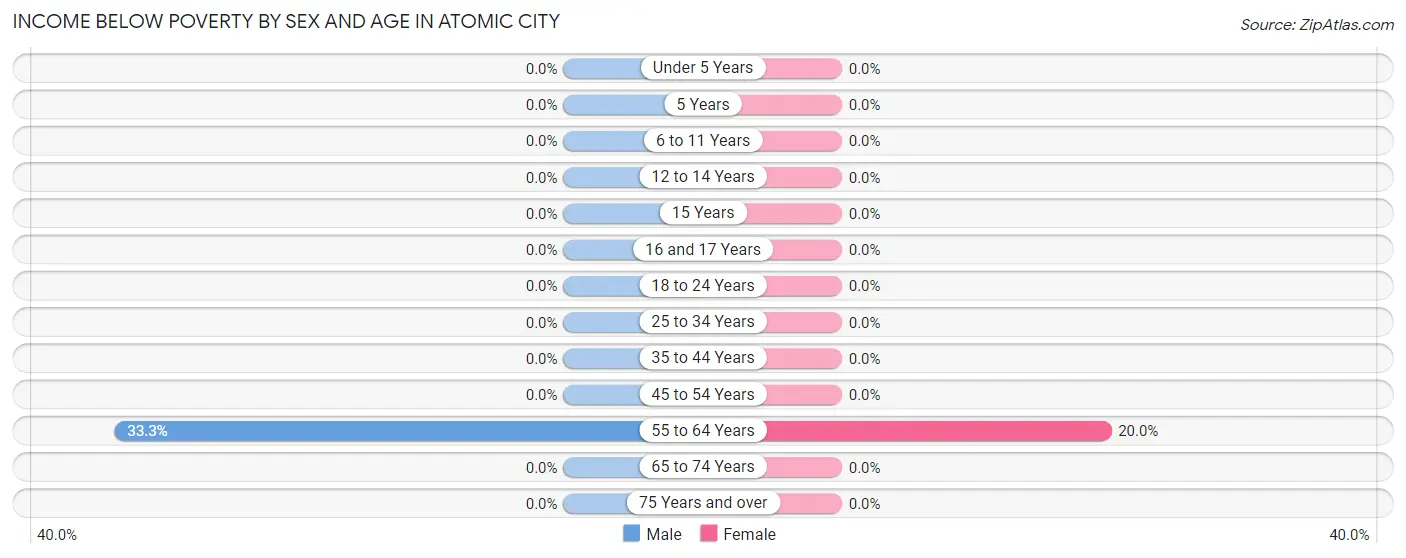
Income Below Poverty by Sex and Age in Atomic City
With 18.2% poverty level for males and 10.0% for females among the residents of Atomic City, 55 to 64 year old males and 55 to 64 year old females are the most vulnerable to poverty, with 2 males (33.3%) and 1 females (20.0%) in their respective age groups living below the poverty level.
| Age Bracket | Male | Female |
| Under 5 Years | 0 (0.0%) | 0 (0.0%) |
| 5 Years | 0 (0.0%) | 0 (0.0%) |
| 6 to 11 Years | 0 (0.0%) | 0 (0.0%) |
| 12 to 14 Years | 0 (0.0%) | 0 (0.0%) |
| 15 Years | 0 (0.0%) | 0 (0.0%) |
| 16 and 17 Years | 0 (0.0%) | 0 (0.0%) |
| 18 to 24 Years | 0 (0.0%) | 0 (0.0%) |
| 25 to 34 Years | 0 (0.0%) | 0 (0.0%) |
| 35 to 44 Years | 0 (0.0%) | 0 (0.0%) |
| 45 to 54 Years | 0 (0.0%) | 0 (0.0%) |
| 55 to 64 Years | 2 (33.3%) | 1 (20.0%) |
| 65 to 74 Years | 0 (0.0%) | 0 (0.0%) |
| 75 Years and over | 0 (0.0%) | 0 (0.0%) |
| Total | 2 (18.2%) | 1 (10.0%) |
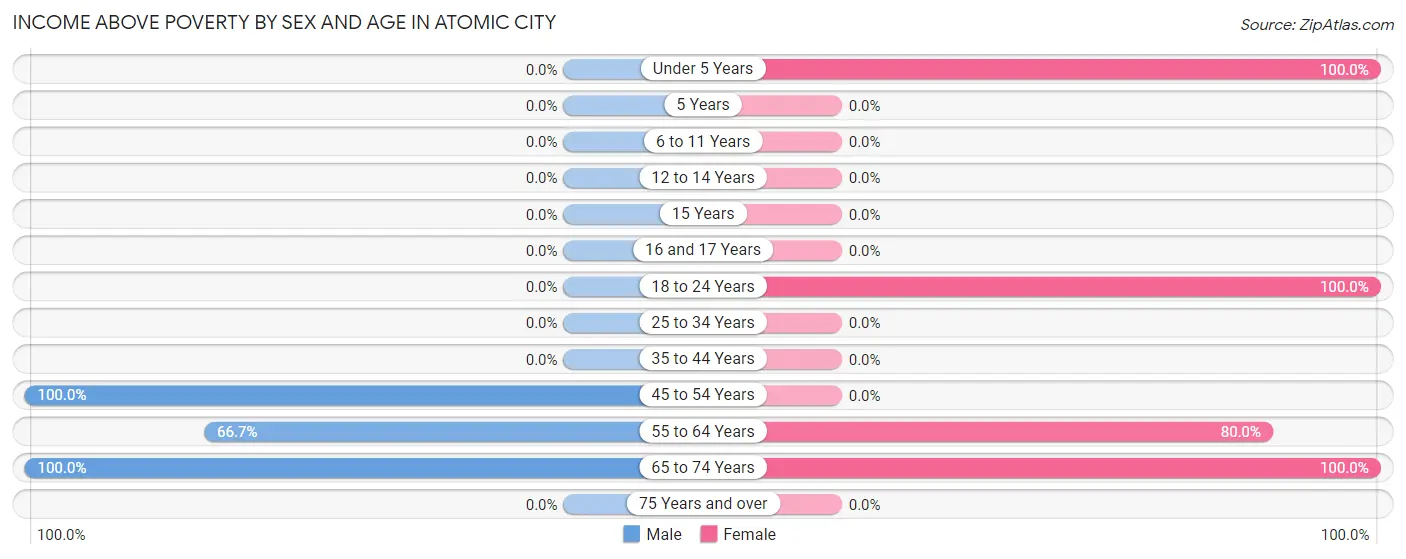
Income Above Poverty by Sex and Age in Atomic City
According to the poverty statistics in Atomic City, males aged 45 to 54 years and females aged under 5 years are the age groups that are most secure financially, with 100.0% of males and 100.0% of females in these age groups living above the poverty line.
| Age Bracket | Male | Female |
| Under 5 Years | 0 (0.0%) | 3 (100.0%) |
| 5 Years | 0 (0.0%) | 0 (0.0%) |
| 6 to 11 Years | 0 (0.0%) | 0 (0.0%) |
| 12 to 14 Years | 0 (0.0%) | 0 (0.0%) |
| 15 Years | 0 (0.0%) | 0 (0.0%) |
| 16 and 17 Years | 0 (0.0%) | 0 (0.0%) |
| 18 to 24 Years | 0 (0.0%) | 1 (100.0%) |
| 25 to 34 Years | 0 (0.0%) | 0 (0.0%) |
| 35 to 44 Years | 0 (0.0%) | 0 (0.0%) |
| 45 to 54 Years | 3 (100.0%) | 0 (0.0%) |
| 55 to 64 Years | 4 (66.7%) | 4 (80.0%) |
| 65 to 74 Years | 2 (100.0%) | 1 (100.0%) |
| 75 Years and over | 0 (0.0%) | 0 (0.0%) |
| Total | 9 (81.8%) | 9 (90.0%) |
Income Below Poverty Among Married-Couple Families in Atomic City
| Children | Above Poverty | Below Poverty |
| No Children | 1 (100.0%) | 0 (0.0%) |
| 1 or 2 Children | 0 (0.0%) | 0 (0.0%) |
| 3 or 4 Children | 0 (0.0%) | 0 (0.0%) |
| 5 or more Children | 0 (0.0%) | 0 (0.0%) |
| Total | 1 (100.0%) | 0 (0.0%) |
Income Below Poverty Among Single-Parent Households in Atomic City
| Children | Single Father | Single Mother |
| No Children | 0 (0.0%) | 0 (0.0%) |
| 1 or 2 Children | 0 (0.0%) | 0 (0.0%) |
| 3 or 4 Children | 0 (0.0%) | 0 (0.0%) |
| 5 or more Children | 0 (0.0%) | 0 (0.0%) |
| Total | 0 (0.0%) | 0 (0.0%) |
Income Below Poverty Among Married-Couple vs Single-Parent Households in Atomic City
| Children | Married-Couple Families | Single-Parent Households |
| No Children | 0 (0.0%) | 0 (0.0%) |
| 1 or 2 Children | 0 (0.0%) | 0 (0.0%) |
| 3 or 4 Children | 0 (0.0%) | 0 (0.0%) |
| 5 or more Children | 0 (0.0%) | 0 (0.0%) |
| Total | 0 (0.0%) | 0 (0.0%) |
Race in Atomic City
The most populous races in Atomic City are , and White / Caucasian (21 | 100.0%).
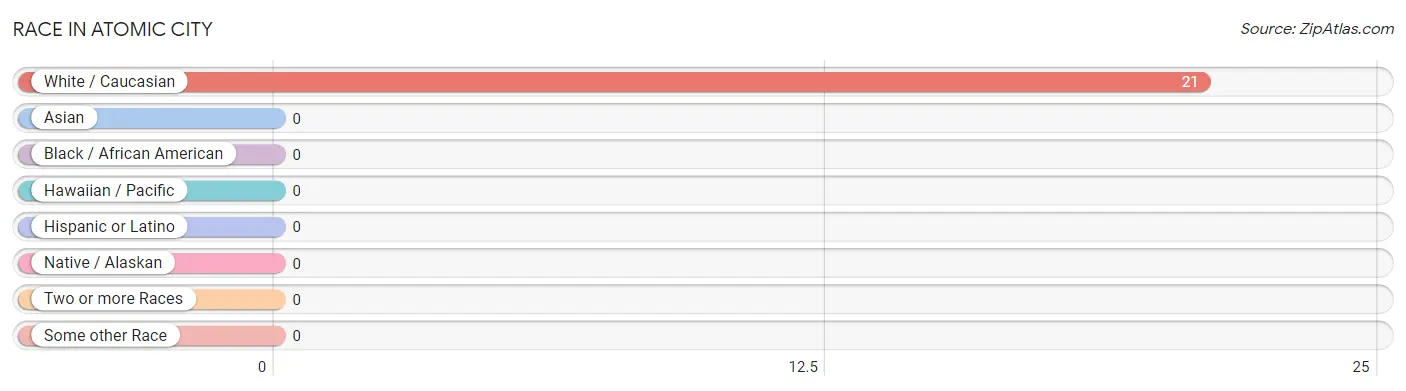
| Race | # Population | % Population |
| Asian | 0 | 0.0% |
| Black / African American | 0 | 0.0% |
| Hawaiian / Pacific | 0 | 0.0% |
| Hispanic or Latino | 0 | 0.0% |
| Native / Alaskan | 0 | 0.0% |
| White / Caucasian | 21 | 100.0% |
| Two or more Races | 0 | 0.0% |
| Some other Race | 0 | 0.0% |
| Total | 21 | 100.0% |
Ancestry in Atomic City
The most populous ancestries reported in Atomic City are German (8 | 38.1%), English (5 | 23.8%), and Scotch-Irish (2 | 9.5%), together accounting for 71.4% of all Atomic City residents.
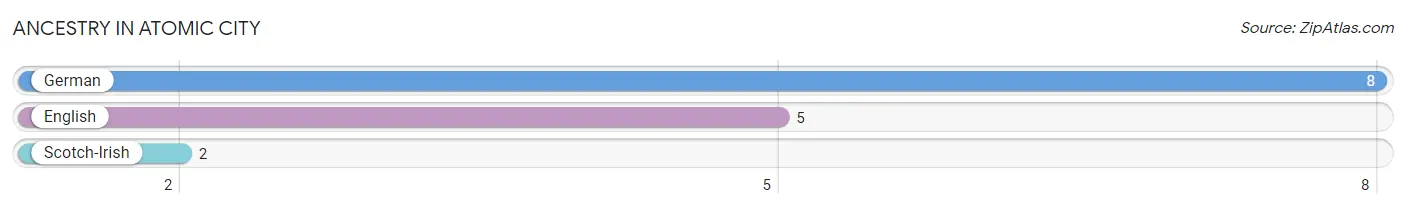
| Ancestry | # Population | % Population |
| English | 5 | 23.8% |
| German | 8 | 38.1% |
| Scotch-Irish | 2 | 9.5% | View All 3 Rows |
Immigrants in Atomic City

| Immigration Origin | # Population | % Population | View All 0 Rows |
Sex and Age in Atomic City
Sex and Age in Atomic City
The most populous age groups in Atomic City are 45 to 49 Years (3 | 27.3%) for men and 60 to 64 Years (5 | 50.0%) for women.

| Age Bracket | Male | Female |
| Under 5 Years | 0 (0.0%) | 3 (30.0%) |
| 5 to 9 Years | 0 (0.0%) | 0 (0.0%) |
| 10 to 14 Years | 0 (0.0%) | 0 (0.0%) |
| 15 to 19 Years | 0 (0.0%) | 1 (10.0%) |
| 20 to 24 Years | 0 (0.0%) | 0 (0.0%) |
| 25 to 29 Years | 0 (0.0%) | 0 (0.0%) |
| 30 to 34 Years | 0 (0.0%) | 0 (0.0%) |
| 35 to 39 Years | 0 (0.0%) | 0 (0.0%) |
| 40 to 44 Years | 0 (0.0%) | 0 (0.0%) |
| 45 to 49 Years | 3 (27.3%) | 0 (0.0%) |
| 50 to 54 Years | 0 (0.0%) | 0 (0.0%) |
| 55 to 59 Years | 3 (27.3%) | 0 (0.0%) |
| 60 to 64 Years | 3 (27.3%) | 5 (50.0%) |
| 65 to 69 Years | 0 (0.0%) | 1 (10.0%) |
| 70 to 74 Years | 2 (18.2%) | 0 (0.0%) |
| 75 to 79 Years | 0 (0.0%) | 0 (0.0%) |
| 80 to 84 Years | 0 (0.0%) | 0 (0.0%) |
| 85 Years and over | 0 (0.0%) | 0 (0.0%) |
| Total | 11 (100.0%) | 10 (100.0%) |
Families and Households in Atomic City
Median Family Size in Atomic City
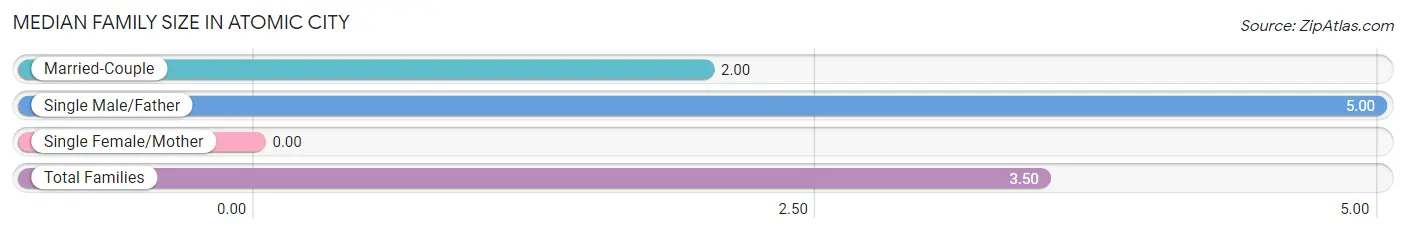
| Family Type | # Families | Family Size |
| Married-Couple | 1 (50.0%) | 2.00 |
| Single Male/Father | 1 (50.0%) | 5.00 |
| Single Female/Mother | 0 (0.0%) | - |
| Total Families | 2 (100.0%) | 3.50 |
Median Household Size in Atomic City
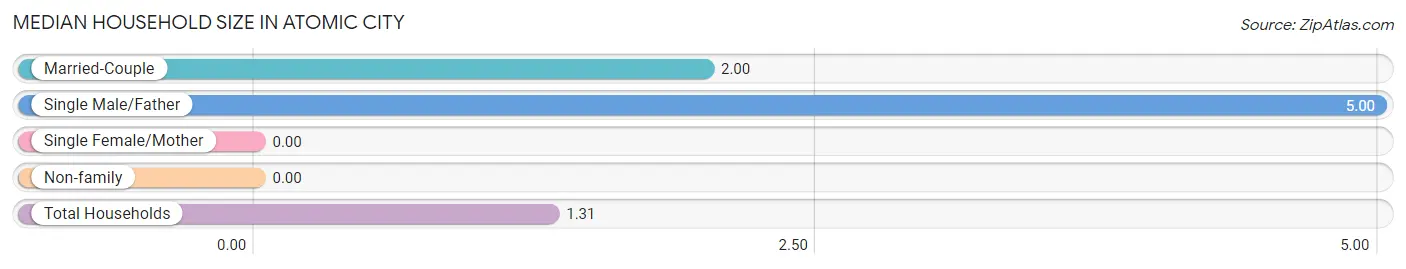
| Household Type | # Households | Household Size |
| Married-Couple | 1 (6.2%) | 2.00 |
| Single Male/Father | 1 (6.2%) | 5.00 |
| Single Female/Mother | 0 (0.0%) | - |
| Non-family | 14 (87.5%) | - |
| Total Households | 16 (100.0%) | 1.31 |
Household Size by Marriage Status in Atomic City
Out of a total of 16 households in Atomic City, 2 (12.5%) are family households, while 14 (87.5%) are nonfamily households. The most numerous type of family households are 2-person households, comprising 1, and the most common type of nonfamily households are 1-person households, comprising 14.
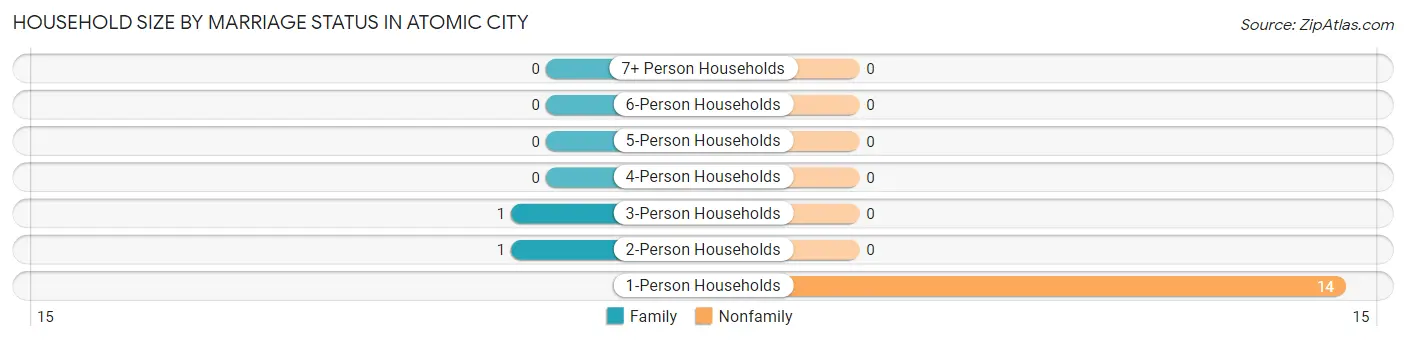
| Household Size | Family Households | Nonfamily Households |
| 1-Person Households | - | 14 (87.5%) |
| 2-Person Households | 1 (6.2%) | 0 (0.0%) |
| 3-Person Households | 1 (6.2%) | 0 (0.0%) |
| 4-Person Households | 0 (0.0%) | 0 (0.0%) |
| 5-Person Households | 0 (0.0%) | 0 (0.0%) |
| 6-Person Households | 0 (0.0%) | 0 (0.0%) |
| 7+ Person Households | 0 (0.0%) | 0 (0.0%) |
| Total | 2 (12.5%) | 14 (87.5%) |
Female Fertility in Atomic City
Fertility by Age in Atomic City
Average fertility rate in Atomic City is 1,000.0 births per 1,000 women. Women in the age bracket of 15 to 19 years have the highest fertility rate with 1,000.0 births per 1,000 women. Women in the age bracket of 15 to 19 years acount for 100.0% of all women with births.
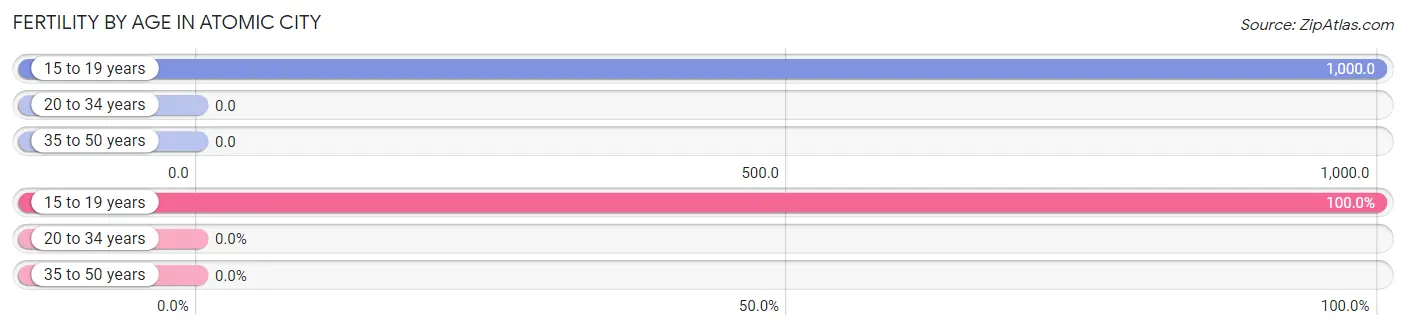
| Age Bracket | Women with Births | Births / 1,000 Women |
| 15 to 19 years | 1 (100.0%) | 1,000.0 |
| 20 to 34 years | 0 (0.0%) | 0.0 |
| 35 to 50 years | 0 (0.0%) | 0.0 |
| Total | 1 (100.0%) | 1,000.0 |
Fertility by Age by Marriage Status in Atomic City
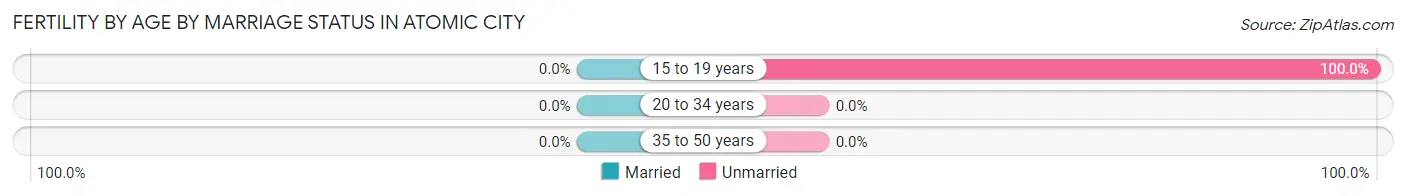
| Age Bracket | Married | Unmarried |
| 15 to 19 years | 0 (0.0%) | 1 (100.0%) |
| 20 to 34 years | 0 (0.0%) | 0 (0.0%) |
| 35 to 50 years | 0 (0.0%) | 0 (0.0%) |
| Total | 0 (0.0%) | 1 (100.0%) |
Fertility by Education in Atomic City
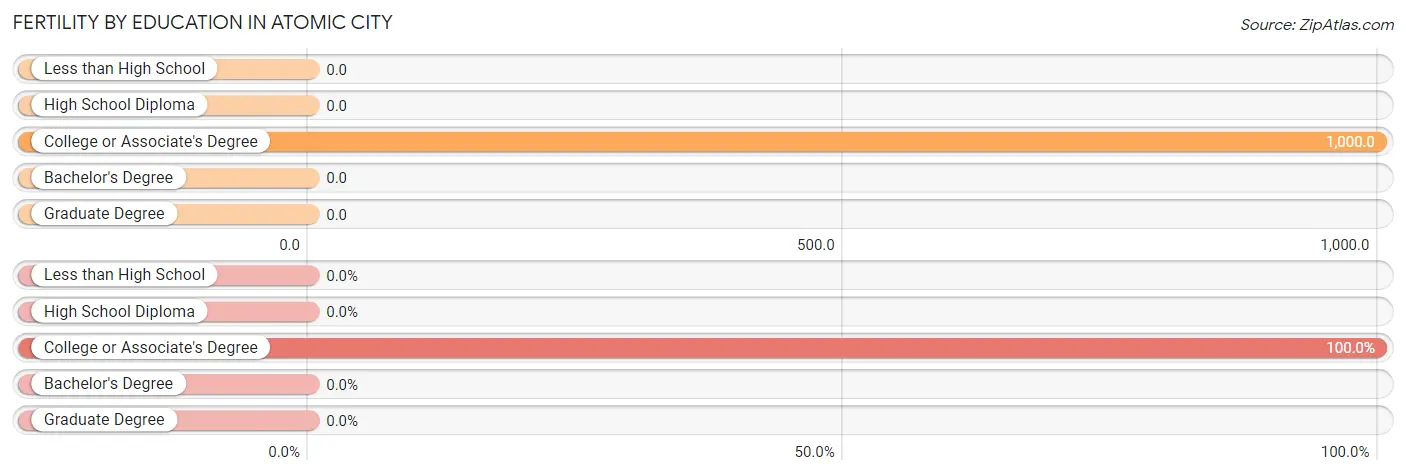
| Educational Attainment | Women with Births | Births / 1,000 Women |
| Less than High School | 0 (0.0%) | 0.0 |
| High School Diploma | 0 (0.0%) | 0.0 |
| College or Associate's Degree | 1 (100.0%) | 1,000.0 |
| Bachelor's Degree | 0 (0.0%) | 0.0 |
| Graduate Degree | 0 (0.0%) | 0.0 |
| Total | 1 (100.0%) | 1,000.0 |
Fertility by Education by Marriage Status in Atomic City
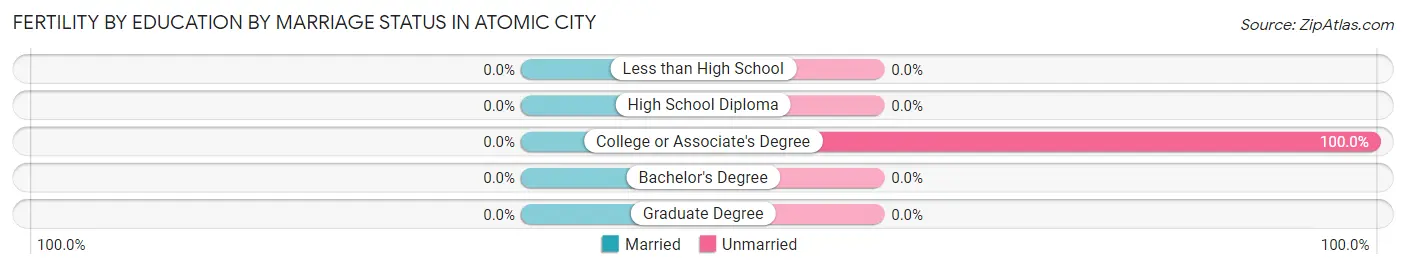
| Educational Attainment | Married | Unmarried |
| Less than High School | 0 (0.0%) | 0 (0.0%) |
| High School Diploma | 0 (0.0%) | 0 (0.0%) |
| College or Associate's Degree | 0 (0.0%) | 1 (100.0%) |
| Bachelor's Degree | 0 (0.0%) | 0 (0.0%) |
| Graduate Degree | 0 (0.0%) | 0 (0.0%) |
| Total | 0 (0.0%) | 1 (100.0%) |
Employment Characteristics in Atomic City
Employment by Class of Employer in Atomic City
Among the 5 employed individuals in Atomic City, private company employees (3 | 60.0%), self-employed (not incorporated) (1 | 20.0%), and federal government employees (1 | 20.0%) make up the most common classes of employment.
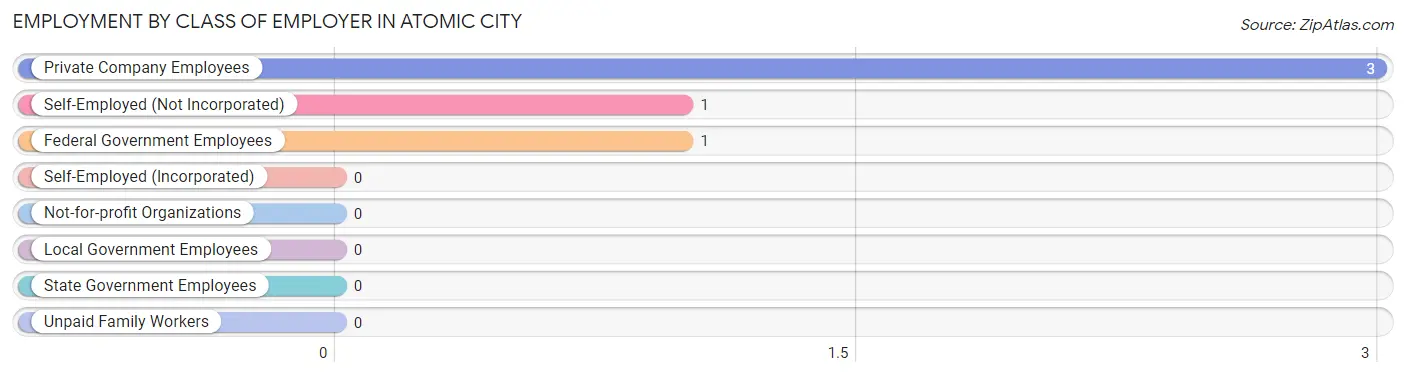
| Employer Class | # Employees | % Employees |
| Private Company Employees | 3 | 60.0% |
| Self-Employed (Incorporated) | 0 | 0.0% |
| Self-Employed (Not Incorporated) | 1 | 20.0% |
| Not-for-profit Organizations | 0 | 0.0% |
| Local Government Employees | 0 | 0.0% |
| State Government Employees | 0 | 0.0% |
| Federal Government Employees | 1 | 20.0% |
| Unpaid Family Workers | 0 | 0.0% |
| Total | 5 | 100.0% |
Employment Status by Age in Atomic City
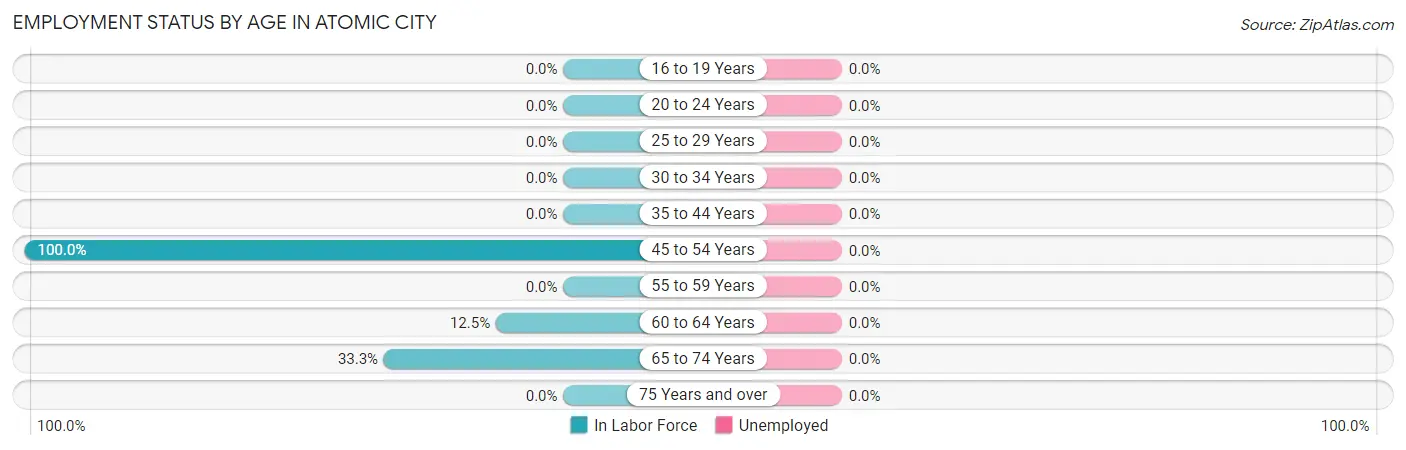
| Age Bracket | In Labor Force | Unemployed |
| 16 to 19 Years | 0 (0.0%) | 0 (0.0%) |
| 20 to 24 Years | 0 (0.0%) | 0 (0.0%) |
| 25 to 29 Years | 0 (0.0%) | 0 (0.0%) |
| 30 to 34 Years | 0 (0.0%) | 0 (0.0%) |
| 35 to 44 Years | 0 (0.0%) | 0 (0.0%) |
| 45 to 54 Years | 3 (100.0%) | 0 (0.0%) |
| 55 to 59 Years | 0 (0.0%) | 0 (0.0%) |
| 60 to 64 Years | 1 (12.5%) | 0 (0.0%) |
| 65 to 74 Years | 1 (33.3%) | 0 (0.0%) |
| 75 Years and over | 0 (0.0%) | 0 (0.0%) |
| Total | 5 (27.8%) | 0 (0.0%) |
Employment Status by Educational Attainment in Atomic City
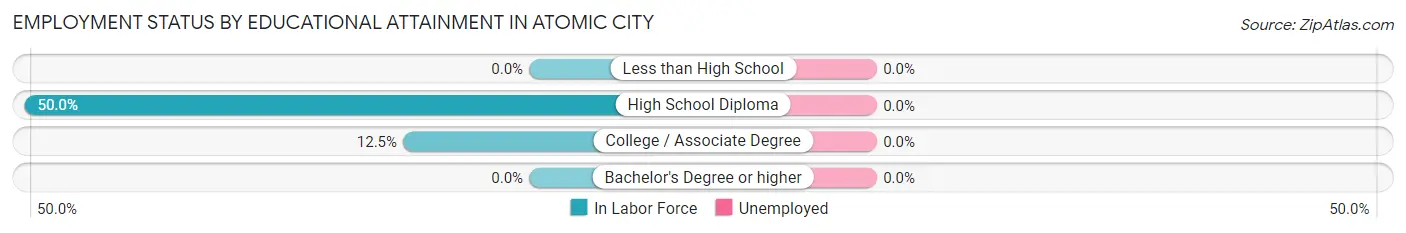
| Educational Attainment | In Labor Force | Unemployed |
| Less than High School | 0 (0.0%) | 0 (0.0%) |
| High School Diploma | 3 (50.0%) | 0 (0.0%) |
| College / Associate Degree | 1 (12.5%) | 0 (0.0%) |
| Bachelor's Degree or higher | 0 (0.0%) | 0 (0.0%) |
| Total | 4 (28.6%) | 0 (0.0%) |
Employment Occupations by Sex in Atomic City
Management, Business, Science and Arts Occupations
Management, Business, Science and Arts Occupations by Sex
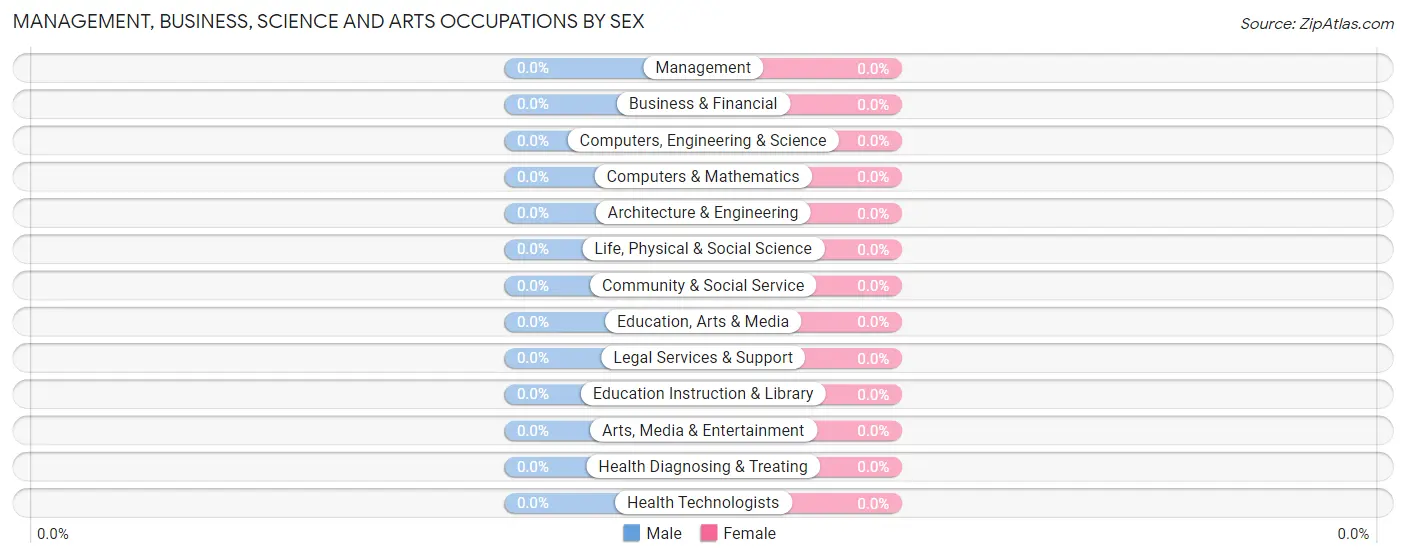
| Occupation | Male | Female |
| Management | 0 (0.0%) | 0 (0.0%) |
| Business & Financial | 0 (0.0%) | 0 (0.0%) |
| Computers, Engineering & Science | 0 (0.0%) | 0 (0.0%) |
| Computers & Mathematics | 0 (0.0%) | 0 (0.0%) |
| Architecture & Engineering | 0 (0.0%) | 0 (0.0%) |
| Life, Physical & Social Science | 0 (0.0%) | 0 (0.0%) |
| Community & Social Service | 0 (0.0%) | 0 (0.0%) |
| Education, Arts & Media | 0 (0.0%) | 0 (0.0%) |
| Legal Services & Support | 0 (0.0%) | 0 (0.0%) |
| Education Instruction & Library | 0 (0.0%) | 0 (0.0%) |
| Arts, Media & Entertainment | 0 (0.0%) | 0 (0.0%) |
| Health Diagnosing & Treating | 0 (0.0%) | 0 (0.0%) |
| Health Technologists | 0 (0.0%) | 0 (0.0%) |
| Total (Category) | 0 (0.0%) | 0 (0.0%) |
| Total (Overall) | 5 (100.0%) | 0 (0.0%) |
Services Occupations
Services Occupations by Sex
| Occupation | Male | Female |
| Healthcare Support | 0 (0.0%) | 0 (0.0%) |
| Security & Protection | 0 (0.0%) | 0 (0.0%) |
| Firefighting & Prevention | 0 (0.0%) | 0 (0.0%) |
| Law Enforcement | 0 (0.0%) | 0 (0.0%) |
| Food Preparation & Serving | 0 (0.0%) | 0 (0.0%) |
| Cleaning & Maintenance | 0 (0.0%) | 0 (0.0%) |
| Personal Care & Service | 0 (0.0%) | 0 (0.0%) |
| Total (Category) | 0 (0.0%) | 0 (0.0%) |
| Total (Overall) | 5 (100.0%) | 0 (0.0%) |
Sales and Office Occupations
The most common Sales and Office occupations in Atomic City are Sales & Related (1 | 20.0%), and Office & Administration (1 | 20.0%).
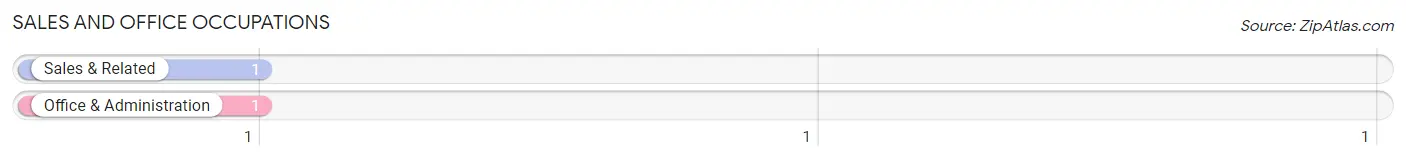
Sales and Office Occupations by Sex
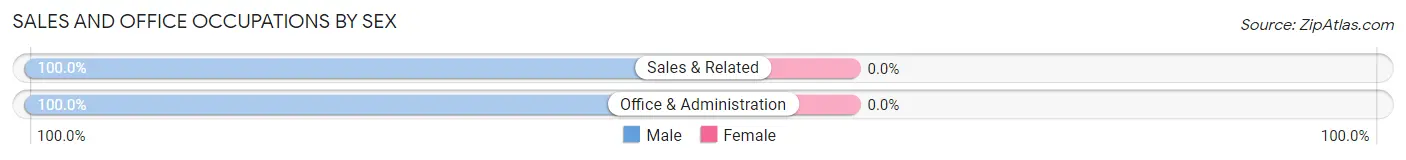
| Occupation | Male | Female |
| Sales & Related | 1 (100.0%) | 0 (0.0%) |
| Office & Administration | 1 (100.0%) | 0 (0.0%) |
| Total (Category) | 2 (100.0%) | 0 (0.0%) |
| Total (Overall) | 5 (100.0%) | 0 (0.0%) |
Natural Resources, Construction and Maintenance Occupations
The most common Natural Resources, Construction and Maintenance occupations in Atomic City are , and Installation, Maintenance & Repair (3 | 60.0%).
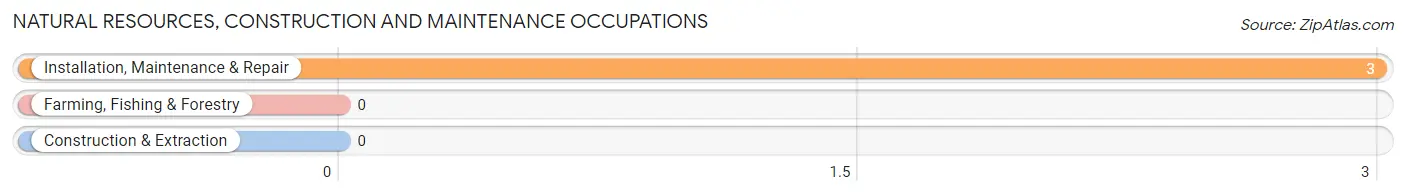
Natural Resources, Construction and Maintenance Occupations by Sex
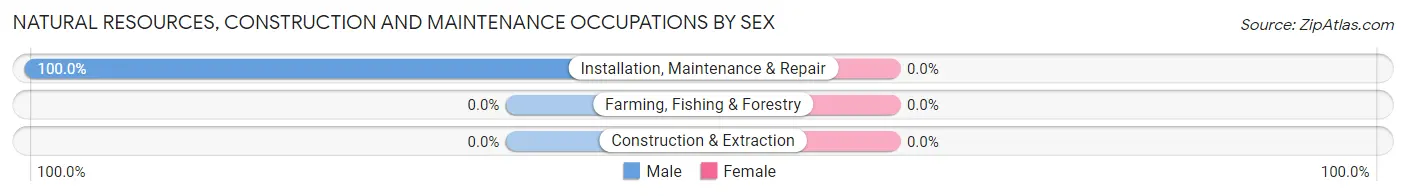
| Occupation | Male | Female |
| Farming, Fishing & Forestry | 0 (0.0%) | 0 (0.0%) |
| Construction & Extraction | 0 (0.0%) | 0 (0.0%) |
| Installation, Maintenance & Repair | 3 (100.0%) | 0 (0.0%) |
| Total (Category) | 3 (100.0%) | 0 (0.0%) |
| Total (Overall) | 5 (100.0%) | 0 (0.0%) |
Production, Transportation and Moving Occupations
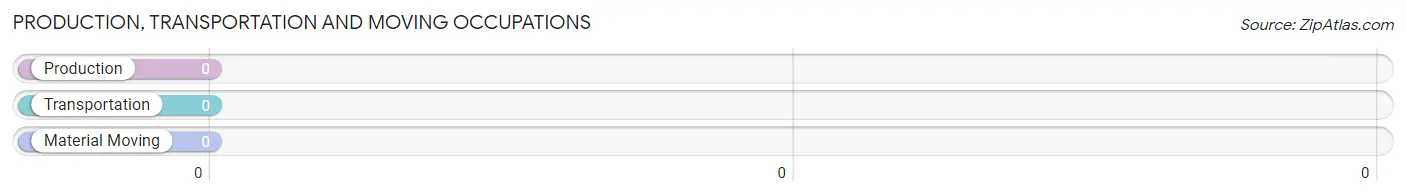
Production, Transportation and Moving Occupations by Sex
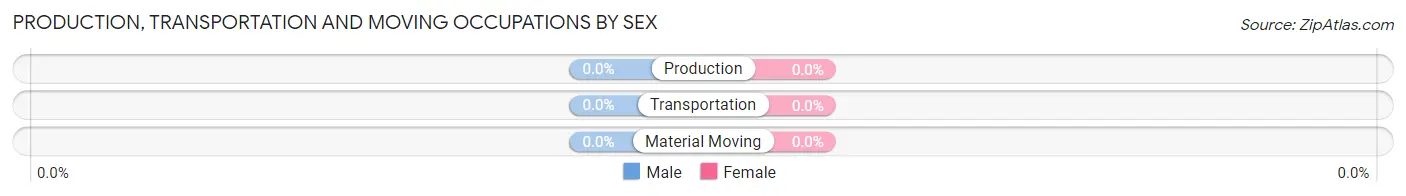
| Occupation | Male | Female |
| Production | 0 (0.0%) | 0 (0.0%) |
| Transportation | 0 (0.0%) | 0 (0.0%) |
| Material Moving | 0 (0.0%) | 0 (0.0%) |
| Total (Category) | 0 (0.0%) | 0 (0.0%) |
| Total (Overall) | 5 (100.0%) | 0 (0.0%) |
Employment Industries by Sex in Atomic City
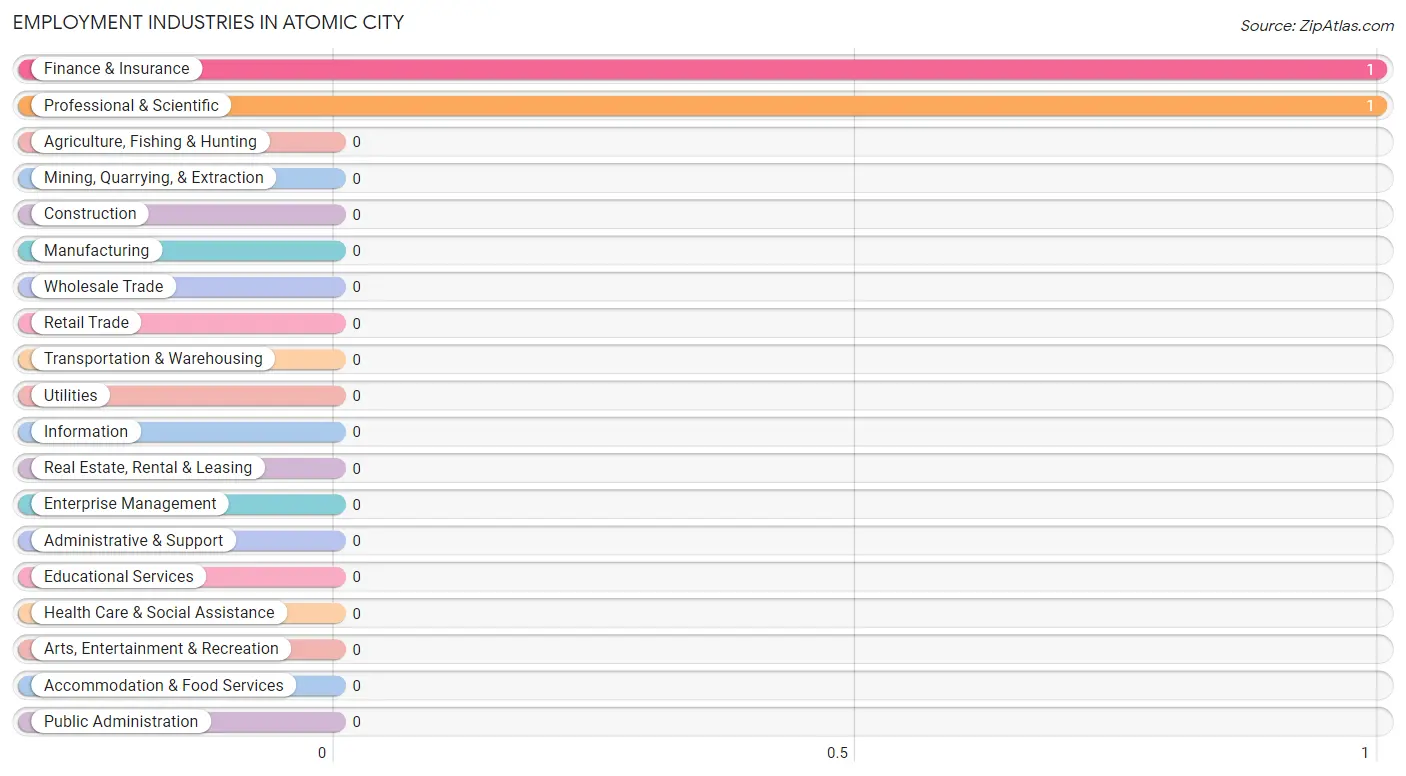
Employment Industries in Atomic City
The major employment industries in Atomic City include Finance & Insurance (1 | 20.0%), and Professional & Scientific (1 | 20.0%).
Employment Industries by Sex in Atomic City
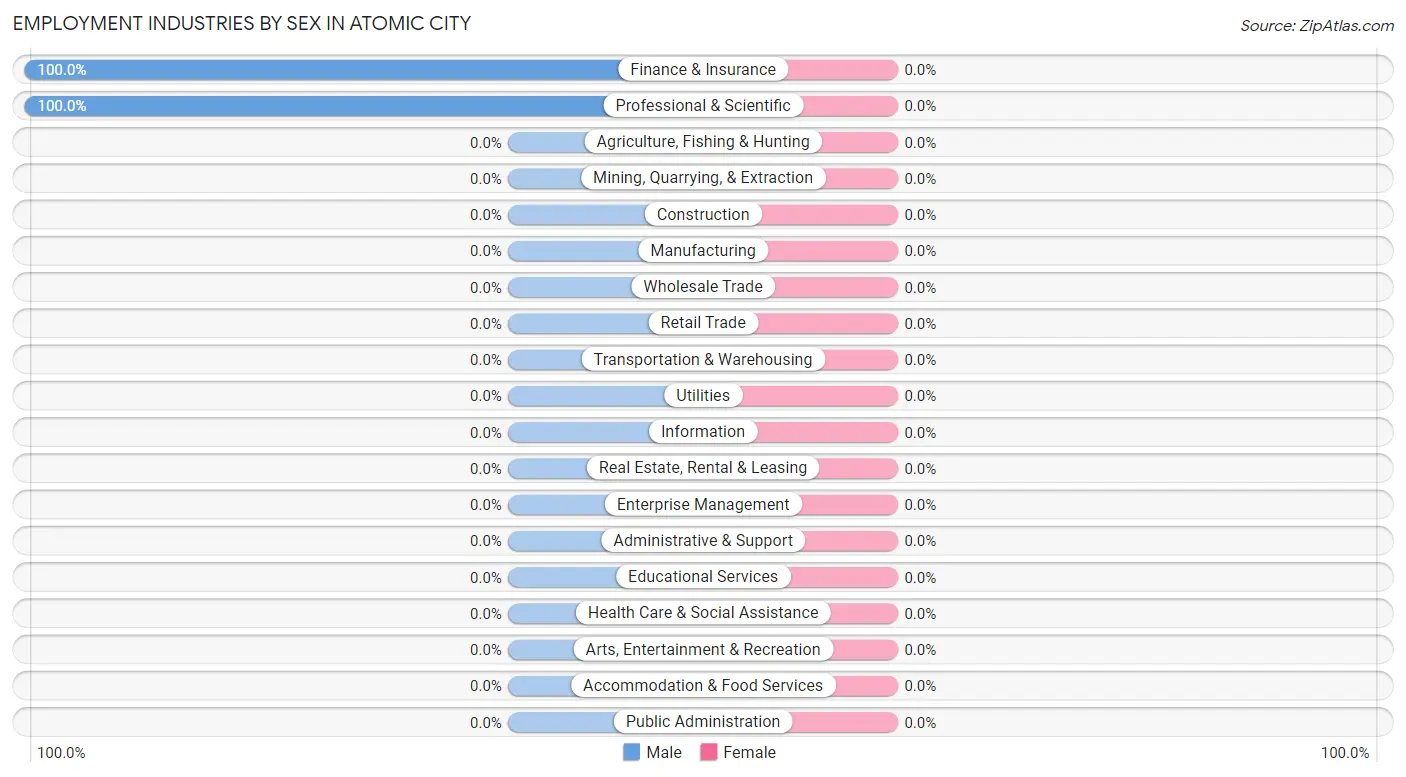
| Industry | Male | Female |
| Agriculture, Fishing & Hunting | 0 (0.0%) | 0 (0.0%) |
| Mining, Quarrying, & Extraction | 0 (0.0%) | 0 (0.0%) |
| Construction | 0 (0.0%) | 0 (0.0%) |
| Manufacturing | 0 (0.0%) | 0 (0.0%) |
| Wholesale Trade | 0 (0.0%) | 0 (0.0%) |
| Retail Trade | 0 (0.0%) | 0 (0.0%) |
| Transportation & Warehousing | 0 (0.0%) | 0 (0.0%) |
| Utilities | 0 (0.0%) | 0 (0.0%) |
| Information | 0 (0.0%) | 0 (0.0%) |
| Finance & Insurance | 1 (100.0%) | 0 (0.0%) |
| Real Estate, Rental & Leasing | 0 (0.0%) | 0 (0.0%) |
| Professional & Scientific | 1 (100.0%) | 0 (0.0%) |
| Enterprise Management | 0 (0.0%) | 0 (0.0%) |
| Administrative & Support | 0 (0.0%) | 0 (0.0%) |
| Educational Services | 0 (0.0%) | 0 (0.0%) |
| Health Care & Social Assistance | 0 (0.0%) | 0 (0.0%) |
| Arts, Entertainment & Recreation | 0 (0.0%) | 0 (0.0%) |
| Accommodation & Food Services | 0 (0.0%) | 0 (0.0%) |
| Public Administration | 0 (0.0%) | 0 (0.0%) |
| Total | 5 (100.0%) | 0 (0.0%) |
Education in Atomic City
School Enrollment in Atomic City
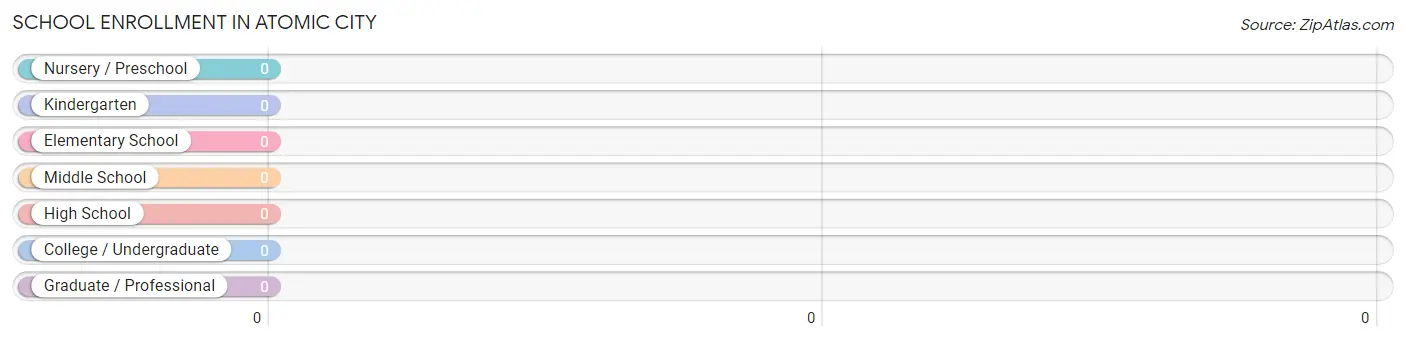
| School Level | # Students | % Students |
| Nursery / Preschool | 0 | 0.0% |
| Kindergarten | 0 | 0.0% |
| Elementary School | 0 | 0.0% |
| Middle School | 0 | 0.0% |
| High School | 0 | 0.0% |
| College / Undergraduate | 0 | 0.0% |
| Graduate / Professional | 0 | 0.0% |
| Total | 0 | 0.0% |
School Enrollment by Age by Funding Source in Atomic City
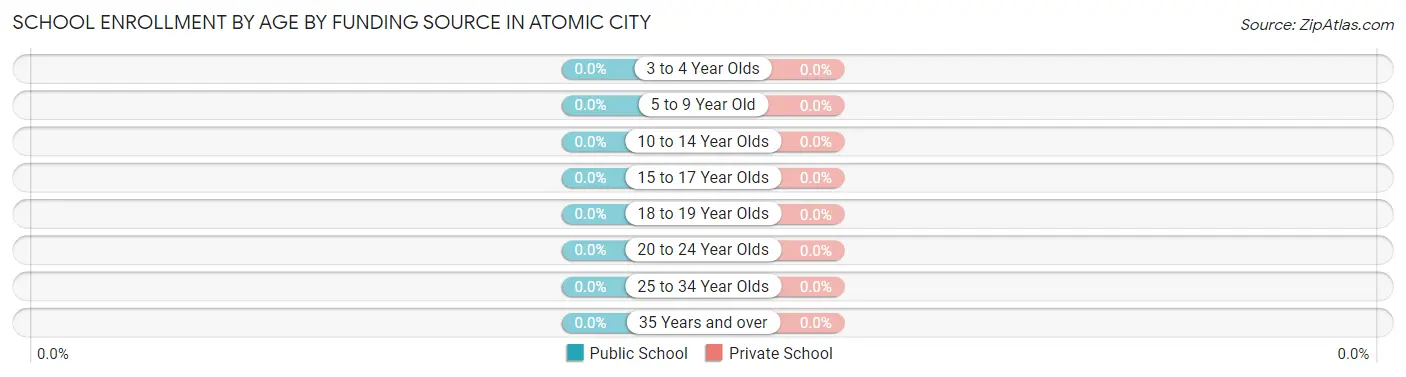
| Age Bracket | Public School | Private School |
| 3 to 4 Year Olds | 0 (0.0%) | 0 (0.0%) |
| 5 to 9 Year Old | 0 (0.0%) | 0 (0.0%) |
| 10 to 14 Year Olds | 0 (0.0%) | 0 (0.0%) |
| 15 to 17 Year Olds | 0 (0.0%) | 0 (0.0%) |
| 18 to 19 Year Olds | 0 (0.0%) | 0 (0.0%) |
| 20 to 24 Year Olds | 0 (0.0%) | 0 (0.0%) |
| 25 to 34 Year Olds | 0 (0.0%) | 0 (0.0%) |
| 35 Years and over | 0 (0.0%) | 0 (0.0%) |
| Total | 0 (0.0%) | 0 (0.0%) |
Educational Attainment by Field of Study in Atomic City
| Field of Study | # Graduates | % Graduates |
| Computers & Mathematics | 0 | 0.0% |
| Bio, Nature & Agricultural | 0 | 0.0% |
| Physical & Health Sciences | 0 | 0.0% |
| Psychology | 0 | 0.0% |
| Social Sciences | 0 | 0.0% |
| Engineering | 0 | 0.0% |
| Multidisciplinary Studies | 0 | 0.0% |
| Science & Technology | 0 | 0.0% |
| Business | 0 | 0.0% |
| Education | 0 | 0.0% |
| Literature & Languages | 0 | 0.0% |
| Liberal Arts & History | 0 | 0.0% |
| Visual & Performing Arts | 0 | 0.0% |
| Communications | 0 | 0.0% |
| Arts & Humanities | 0 | 0.0% |
| Total | 0 | 0.0% |
Transportation & Commute in Atomic City
Vehicle Availability by Sex in Atomic City
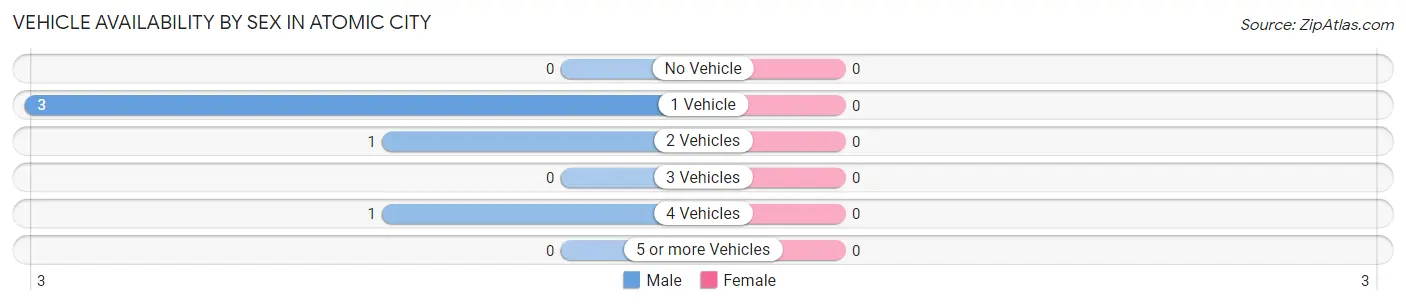
| Vehicles Available | Male | Female |
| No Vehicle | 0 (0.0%) | 0 (0.0%) |
| 1 Vehicle | 3 (60.0%) | 0 (0.0%) |
| 2 Vehicles | 1 (20.0%) | 0 (0.0%) |
| 3 Vehicles | 0 (0.0%) | 0 (0.0%) |
| 4 Vehicles | 1 (20.0%) | 0 (0.0%) |
| 5 or more Vehicles | 0 (0.0%) | 0 (0.0%) |
| Total | 5 (100.0%) | 0 (0.0%) |
Commute Time in Atomic City
The most frequently occuring commute durations in Atomic City are 45 to 59 minutes (3 commuters, 60.0%), 20 to 24 minutes (1 commuters, 20.0%), and 40 to 44 minutes (1 commuters, 20.0%).
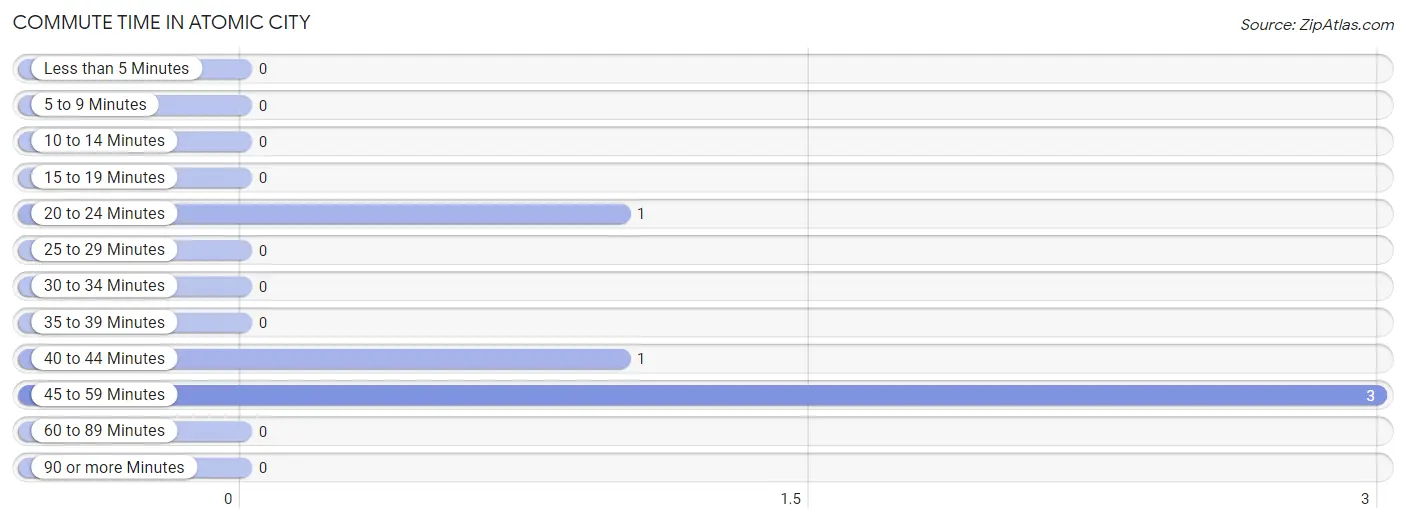
| Commute Time | # Commuters | % Commuters |
| Less than 5 Minutes | 0 | 0.0% |
| 5 to 9 Minutes | 0 | 0.0% |
| 10 to 14 Minutes | 0 | 0.0% |
| 15 to 19 Minutes | 0 | 0.0% |
| 20 to 24 Minutes | 1 | 20.0% |
| 25 to 29 Minutes | 0 | 0.0% |
| 30 to 34 Minutes | 0 | 0.0% |
| 35 to 39 Minutes | 0 | 0.0% |
| 40 to 44 Minutes | 1 | 20.0% |
| 45 to 59 Minutes | 3 | 60.0% |
| 60 to 89 Minutes | 0 | 0.0% |
| 90 or more Minutes | 0 | 0.0% |
Commute Time by Sex in Atomic City
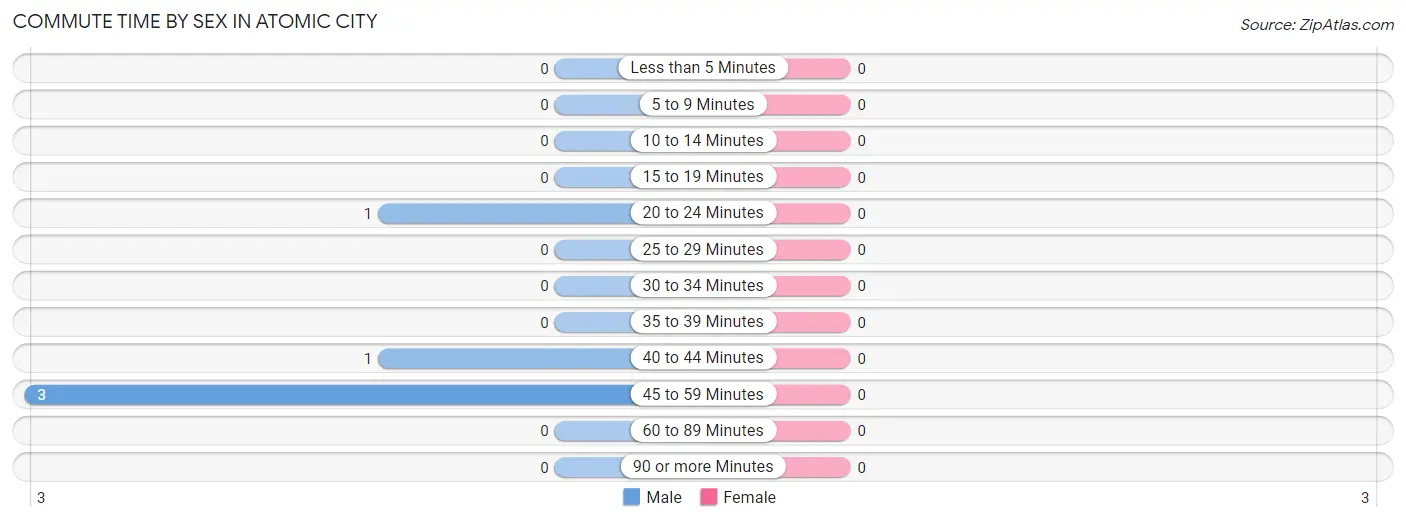
| Commute Time | Male | Female |
| Less than 5 Minutes | 0 (0.0%) | 0 (0.0%) |
| 5 to 9 Minutes | 0 (0.0%) | 0 (0.0%) |
| 10 to 14 Minutes | 0 (0.0%) | 0 (0.0%) |
| 15 to 19 Minutes | 0 (0.0%) | 0 (0.0%) |
| 20 to 24 Minutes | 1 (20.0%) | 0 (0.0%) |
| 25 to 29 Minutes | 0 (0.0%) | 0 (0.0%) |
| 30 to 34 Minutes | 0 (0.0%) | 0 (0.0%) |
| 35 to 39 Minutes | 0 (0.0%) | 0 (0.0%) |
| 40 to 44 Minutes | 1 (20.0%) | 0 (0.0%) |
| 45 to 59 Minutes | 3 (60.0%) | 0 (0.0%) |
| 60 to 89 Minutes | 0 (0.0%) | 0 (0.0%) |
| 90 or more Minutes | 0 (0.0%) | 0 (0.0%) |
Time of Departure to Work by Sex in Atomic City
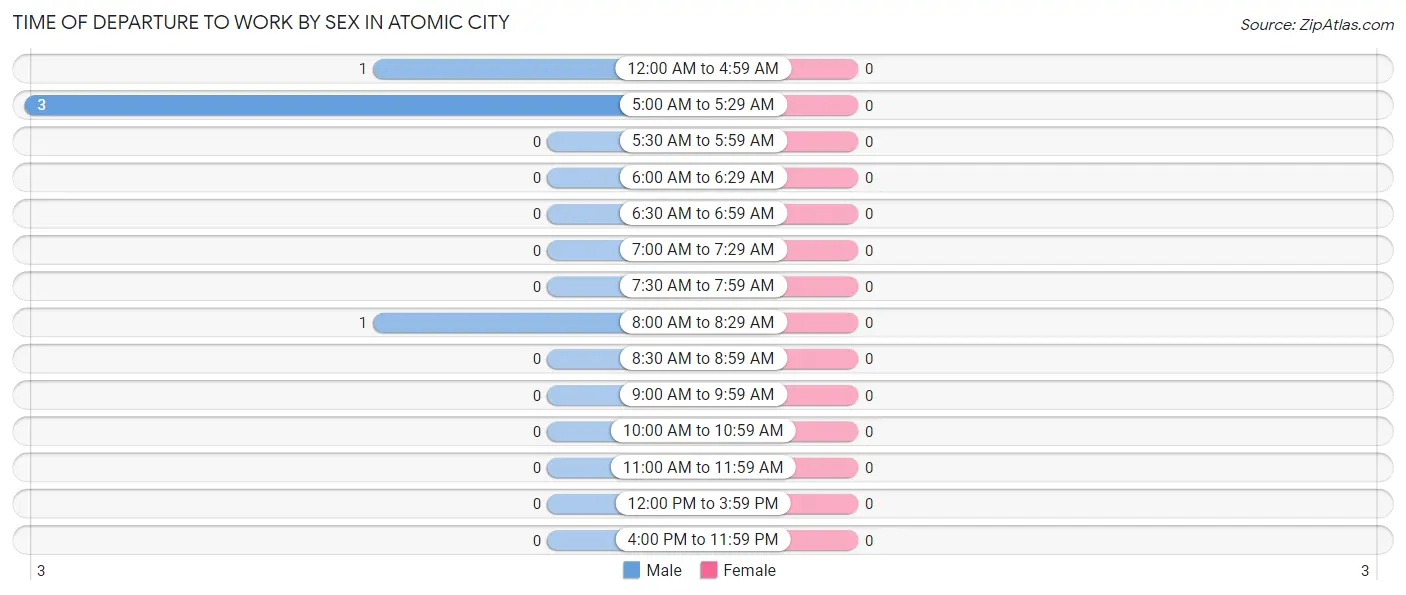
| Time of Departure | Male | Female |
| 12:00 AM to 4:59 AM | 1 (20.0%) | 0 (0.0%) |
| 5:00 AM to 5:29 AM | 3 (60.0%) | 0 (0.0%) |
| 5:30 AM to 5:59 AM | 0 (0.0%) | 0 (0.0%) |
| 6:00 AM to 6:29 AM | 0 (0.0%) | 0 (0.0%) |
| 6:30 AM to 6:59 AM | 0 (0.0%) | 0 (0.0%) |
| 7:00 AM to 7:29 AM | 0 (0.0%) | 0 (0.0%) |
| 7:30 AM to 7:59 AM | 0 (0.0%) | 0 (0.0%) |
| 8:00 AM to 8:29 AM | 1 (20.0%) | 0 (0.0%) |
| 8:30 AM to 8:59 AM | 0 (0.0%) | 0 (0.0%) |
| 9:00 AM to 9:59 AM | 0 (0.0%) | 0 (0.0%) |
| 10:00 AM to 10:59 AM | 0 (0.0%) | 0 (0.0%) |
| 11:00 AM to 11:59 AM | 0 (0.0%) | 0 (0.0%) |
| 12:00 PM to 3:59 PM | 0 (0.0%) | 0 (0.0%) |
| 4:00 PM to 11:59 PM | 0 (0.0%) | 0 (0.0%) |
| Total | 5 (100.0%) | 0 (0.0%) |
Housing Occupancy in Atomic City
Occupancy by Ownership in Atomic City
Of the total 16 dwellings in Atomic City, owner-occupied units account for 14 (87.5%), while renter-occupied units make up 2 (12.5%).
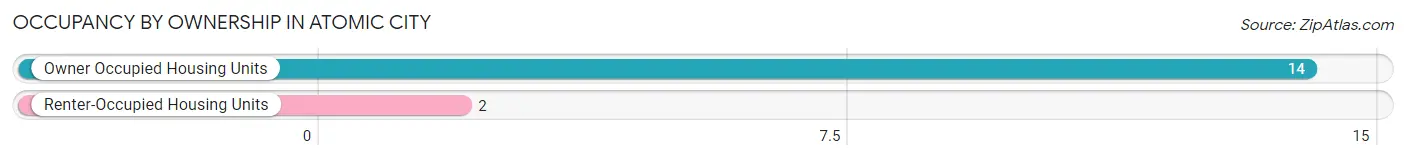
| Occupancy | # Housing Units | % Housing Units |
| Owner Occupied Housing Units | 14 | 87.5% |
| Renter-Occupied Housing Units | 2 | 12.5% |
| Total Occupied Housing Units | 16 | 100.0% |
Occupancy by Household Size in Atomic City
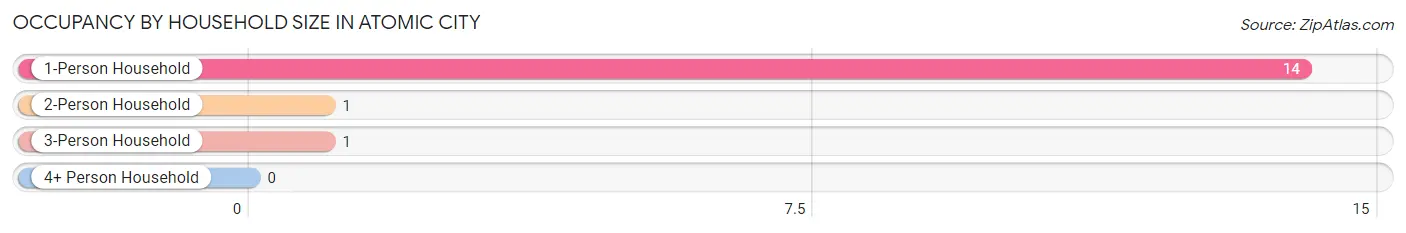
| Household Size | # Housing Units | % Housing Units |
| 1-Person Household | 14 | 87.5% |
| 2-Person Household | 1 | 6.2% |
| 3-Person Household | 1 | 6.2% |
| 4+ Person Household | 0 | 0.0% |
| Total Housing Units | 16 | 100.0% |
Occupancy by Ownership by Household Size in Atomic City
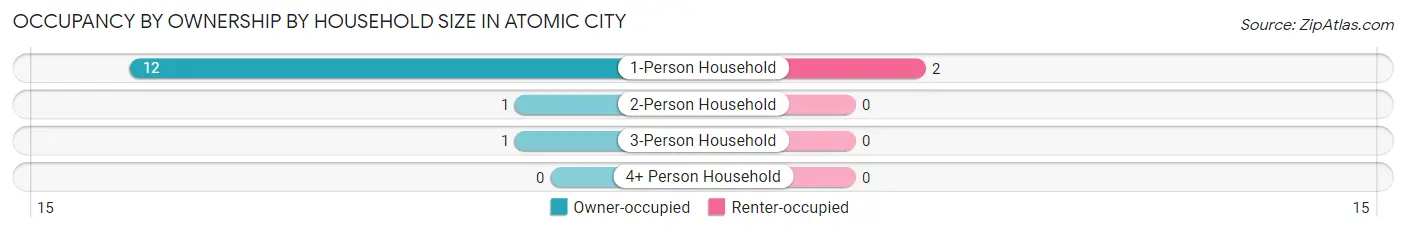
| Household Size | Owner-occupied | Renter-occupied |
| 1-Person Household | 12 (85.7%) | 2 (14.3%) |
| 2-Person Household | 1 (100.0%) | 0 (0.0%) |
| 3-Person Household | 1 (100.0%) | 0 (0.0%) |
| 4+ Person Household | 0 (0.0%) | 0 (0.0%) |
| Total Housing Units | 14 (87.5%) | 2 (12.5%) |
Occupancy by Educational Attainment in Atomic City
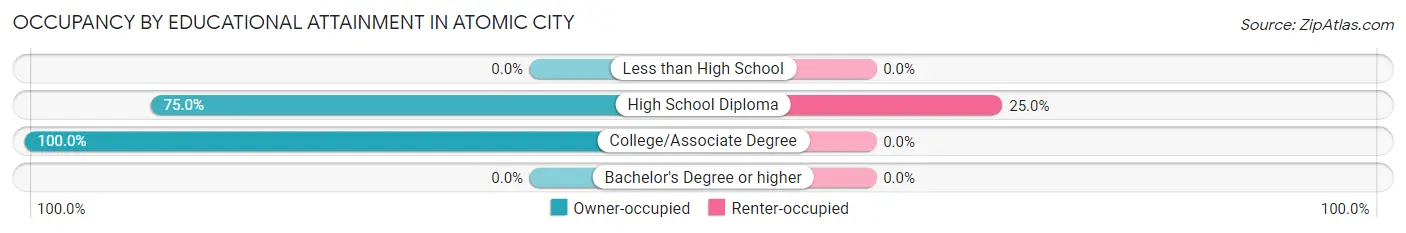
| Household Size | Owner-occupied | Renter-occupied |
| Less than High School | 0 (0.0%) | 0 (0.0%) |
| High School Diploma | 6 (75.0%) | 2 (25.0%) |
| College/Associate Degree | 8 (100.0%) | 0 (0.0%) |
| Bachelor's Degree or higher | 0 (0.0%) | 0 (0.0%) |
Occupancy by Age of Householder in Atomic City
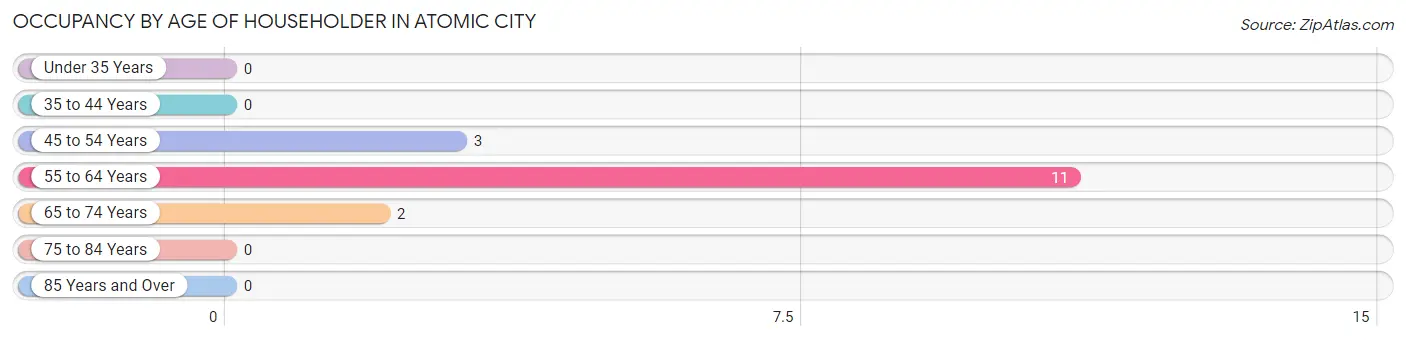
| Age Bracket | # Households | % Households |
| Under 35 Years | 0 | 0.0% |
| 35 to 44 Years | 0 | 0.0% |
| 45 to 54 Years | 3 | 18.8% |
| 55 to 64 Years | 11 | 68.8% |
| 65 to 74 Years | 2 | 12.5% |
| 75 to 84 Years | 0 | 0.0% |
| 85 Years and Over | 0 | 0.0% |
| Total | 16 | 100.0% |
Housing Finances in Atomic City
Median Income by Occupancy in Atomic City
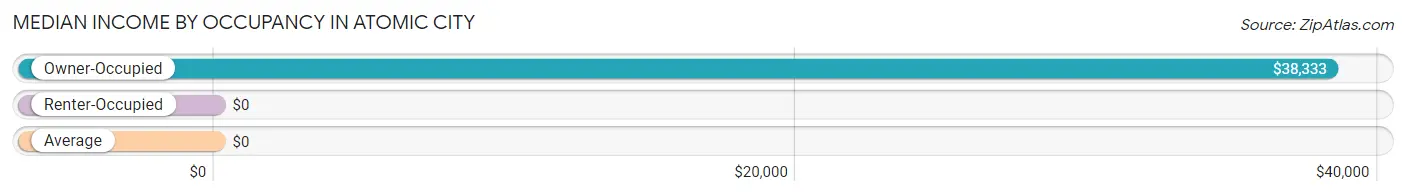
| Occupancy Type | # Households | Median Income |
| Owner-Occupied | 14 (87.5%) | $38,333 |
| Renter-Occupied | 2 (12.5%) | $0 |
| Average | 16 (100.0%) | $0 |
Occupancy by Householder Income Bracket in Atomic City
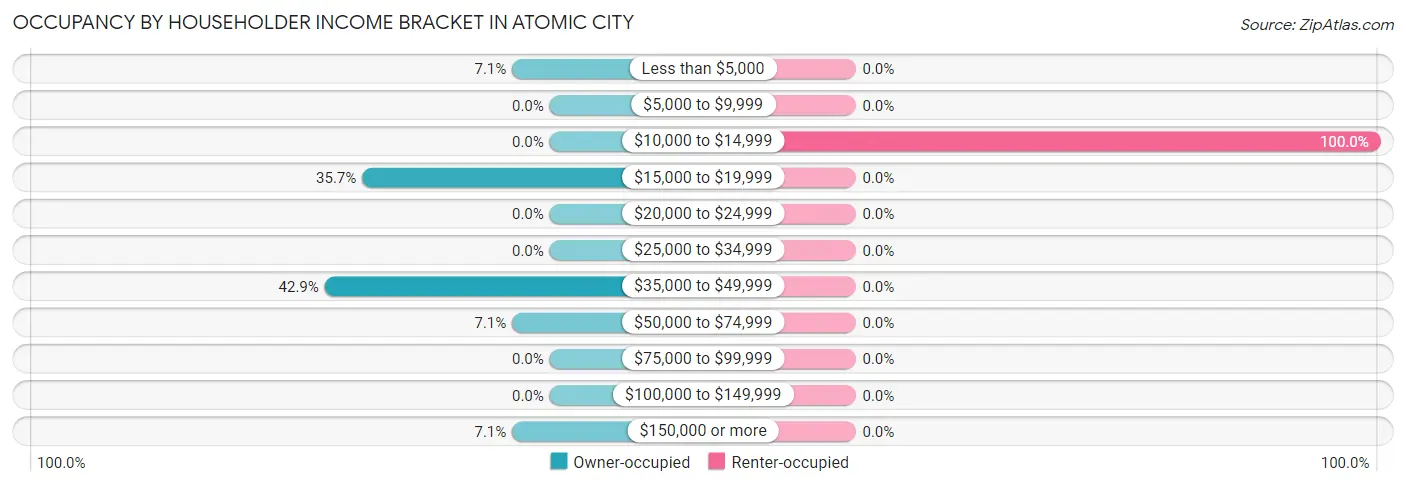
| Income Bracket | Owner-occupied | Renter-occupied |
| Less than $5,000 | 1 (7.1%) | 0 (0.0%) |
| $5,000 to $9,999 | 0 (0.0%) | 0 (0.0%) |
| $10,000 to $14,999 | 0 (0.0%) | 2 (100.0%) |
| $15,000 to $19,999 | 5 (35.7%) | 0 (0.0%) |
| $20,000 to $24,999 | 0 (0.0%) | 0 (0.0%) |
| $25,000 to $34,999 | 0 (0.0%) | 0 (0.0%) |
| $35,000 to $49,999 | 6 (42.9%) | 0 (0.0%) |
| $50,000 to $74,999 | 1 (7.1%) | 0 (0.0%) |
| $75,000 to $99,999 | 0 (0.0%) | 0 (0.0%) |
| $100,000 to $149,999 | 0 (0.0%) | 0 (0.0%) |
| $150,000 or more | 1 (7.1%) | 0 (0.0%) |
| Total | 14 (100.0%) | 2 (100.0%) |
Monthly Housing Cost Tiers in Atomic City
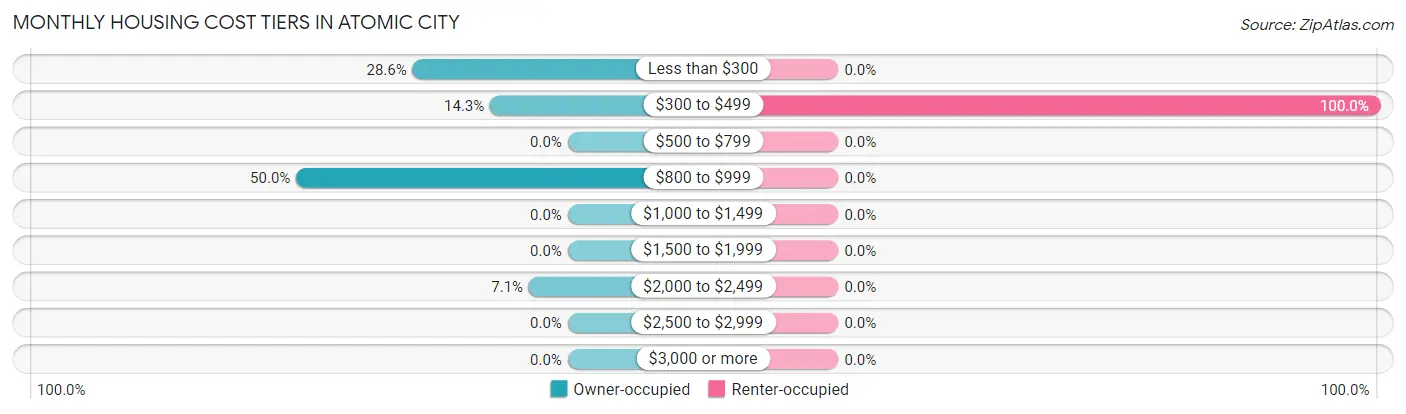
| Monthly Cost | Owner-occupied | Renter-occupied |
| Less than $300 | 4 (28.6%) | 0 (0.0%) |
| $300 to $499 | 2 (14.3%) | 2 (100.0%) |
| $500 to $799 | 0 (0.0%) | 0 (0.0%) |
| $800 to $999 | 7 (50.0%) | 0 (0.0%) |
| $1,000 to $1,499 | 0 (0.0%) | 0 (0.0%) |
| $1,500 to $1,999 | 0 (0.0%) | 0 (0.0%) |
| $2,000 to $2,499 | 1 (7.1%) | 0 (0.0%) |
| $2,500 to $2,999 | 0 (0.0%) | 0 (0.0%) |
| $3,000 or more | 0 (0.0%) | 0 (0.0%) |
| Total | 14 (100.0%) | 2 (100.0%) |
Physical Housing Characteristics in Atomic City
Housing Structures in Atomic City
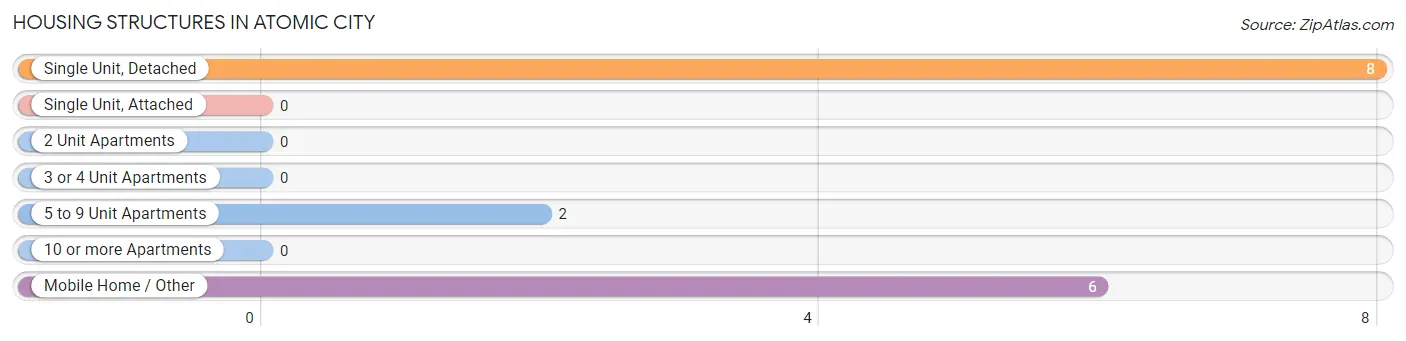
| Structure Type | # Housing Units | % Housing Units |
| Single Unit, Detached | 8 | 50.0% |
| Single Unit, Attached | 0 | 0.0% |
| 2 Unit Apartments | 0 | 0.0% |
| 3 or 4 Unit Apartments | 0 | 0.0% |
| 5 to 9 Unit Apartments | 2 | 12.5% |
| 10 or more Apartments | 0 | 0.0% |
| Mobile Home / Other | 6 | 37.5% |
| Total | 16 | 100.0% |
Housing Structures by Occupancy in Atomic City
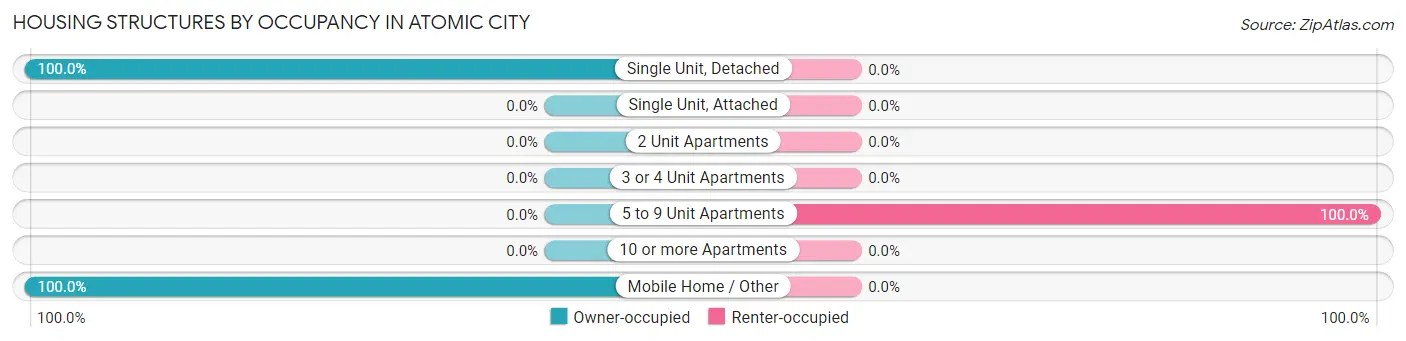
| Structure Type | Owner-occupied | Renter-occupied |
| Single Unit, Detached | 8 (100.0%) | 0 (0.0%) |
| Single Unit, Attached | 0 (0.0%) | 0 (0.0%) |
| 2 Unit Apartments | 0 (0.0%) | 0 (0.0%) |
| 3 or 4 Unit Apartments | 0 (0.0%) | 0 (0.0%) |
| 5 to 9 Unit Apartments | 0 (0.0%) | 2 (100.0%) |
| 10 or more Apartments | 0 (0.0%) | 0 (0.0%) |
| Mobile Home / Other | 6 (100.0%) | 0 (0.0%) |
| Total | 14 (87.5%) | 2 (12.5%) |
Housing Structures by Number of Rooms in Atomic City
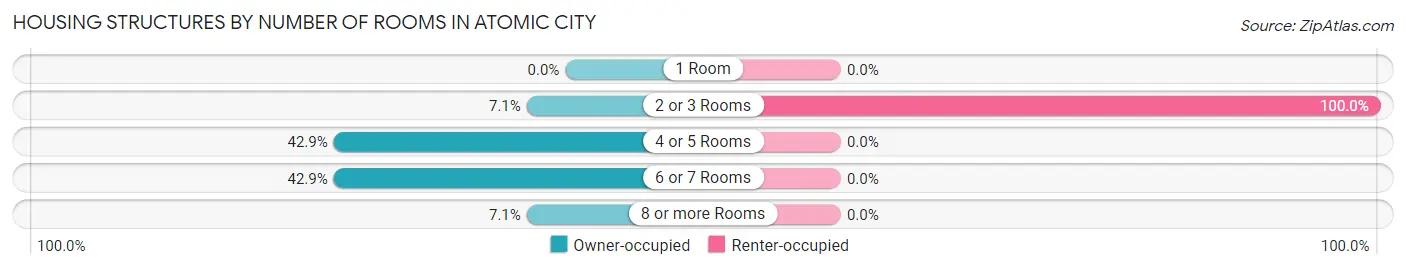
| Number of Rooms | Owner-occupied | Renter-occupied |
| 1 Room | 0 (0.0%) | 0 (0.0%) |
| 2 or 3 Rooms | 1 (7.1%) | 2 (100.0%) |
| 4 or 5 Rooms | 6 (42.9%) | 0 (0.0%) |
| 6 or 7 Rooms | 6 (42.9%) | 0 (0.0%) |
| 8 or more Rooms | 1 (7.1%) | 0 (0.0%) |
| Total | 14 (100.0%) | 2 (100.0%) |
Housing Structure by Heating Type in Atomic City
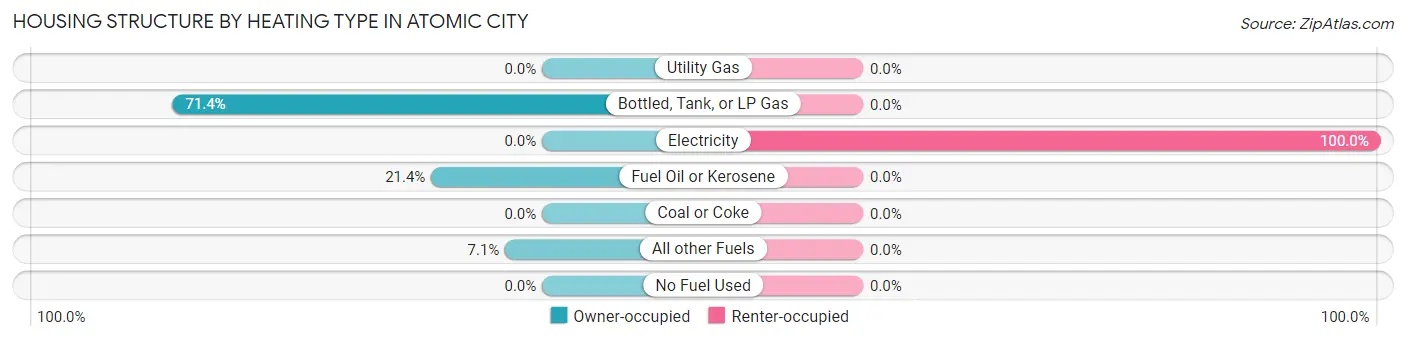
| Heating Type | Owner-occupied | Renter-occupied |
| Utility Gas | 0 (0.0%) | 0 (0.0%) |
| Bottled, Tank, or LP Gas | 10 (71.4%) | 0 (0.0%) |
| Electricity | 0 (0.0%) | 2 (100.0%) |
| Fuel Oil or Kerosene | 3 (21.4%) | 0 (0.0%) |
| Coal or Coke | 0 (0.0%) | 0 (0.0%) |
| All other Fuels | 1 (7.1%) | 0 (0.0%) |
| No Fuel Used | 0 (0.0%) | 0 (0.0%) |
| Total | 14 (100.0%) | 2 (100.0%) |
Household Vehicle Usage in Atomic City
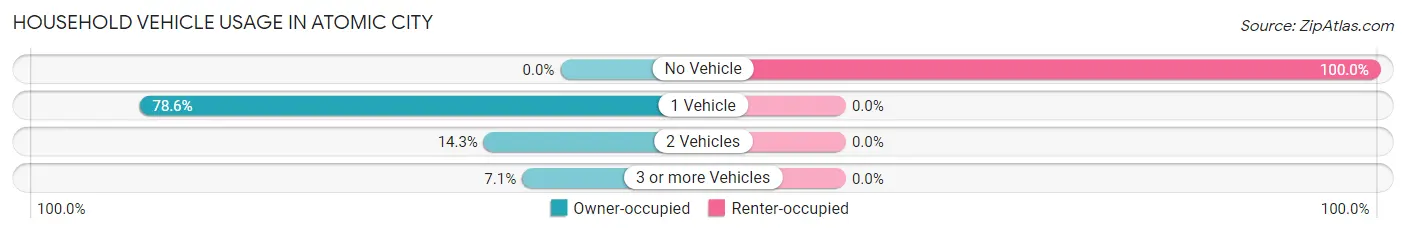
| Vehicles per Household | Owner-occupied | Renter-occupied |
| No Vehicle | 0 (0.0%) | 2 (100.0%) |
| 1 Vehicle | 11 (78.6%) | 0 (0.0%) |
| 2 Vehicles | 2 (14.3%) | 0 (0.0%) |
| 3 or more Vehicles | 1 (7.1%) | 0 (0.0%) |
| Total | 14 (100.0%) | 2 (100.0%) |
Real Estate & Mortgages in Atomic City
Real Estate and Mortgage Overview in Atomic City
| Characteristic | Without Mortgage | With Mortgage |
| Housing Units | 5 | 9 |
| Median Property Value | $9,999 | $0 |
| Median Household Income | - | - |
| Monthly Housing Costs | $231 | $0 |
| Real Estate Taxes | $199 | $0 |
Property Value by Mortgage Status in Atomic City
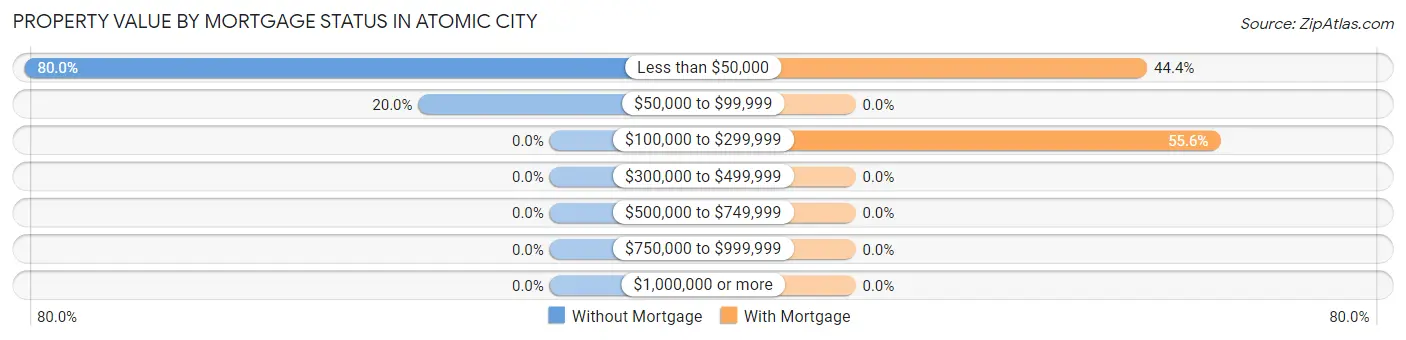
| Property Value | Without Mortgage | With Mortgage |
| Less than $50,000 | 4 (80.0%) | 4 (44.4%) |
| $50,000 to $99,999 | 1 (20.0%) | 0 (0.0%) |
| $100,000 to $299,999 | 0 (0.0%) | 5 (55.6%) |
| $300,000 to $499,999 | 0 (0.0%) | 0 (0.0%) |
| $500,000 to $749,999 | 0 (0.0%) | 0 (0.0%) |
| $750,000 to $999,999 | 0 (0.0%) | 0 (0.0%) |
| $1,000,000 or more | 0 (0.0%) | 0 (0.0%) |
| Total | 5 (100.0%) | 9 (100.0%) |
Household Income by Mortgage Status in Atomic City
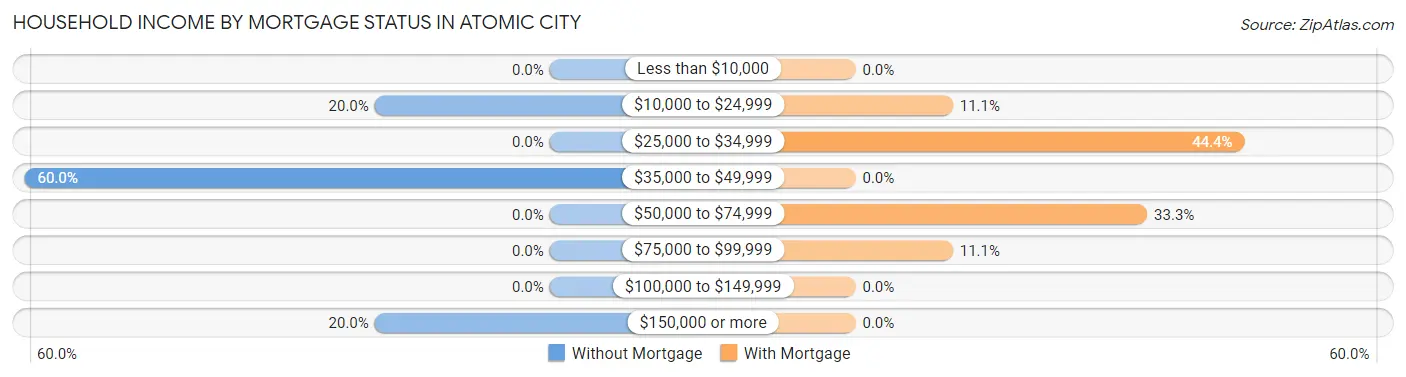
| Household Income | Without Mortgage | With Mortgage |
| Less than $10,000 | 0 (0.0%) | 0 (0.0%) |
| $10,000 to $24,999 | 1 (20.0%) | 1 (11.1%) |
| $25,000 to $34,999 | 0 (0.0%) | 4 (44.4%) |
| $35,000 to $49,999 | 3 (60.0%) | 0 (0.0%) |
| $50,000 to $74,999 | 0 (0.0%) | 3 (33.3%) |
| $75,000 to $99,999 | 0 (0.0%) | 1 (11.1%) |
| $100,000 to $149,999 | 0 (0.0%) | 0 (0.0%) |
| $150,000 or more | 1 (20.0%) | 0 (0.0%) |
| Total | 5 (100.0%) | 9 (100.0%) |
Property Value to Household Income Ratio in Atomic City
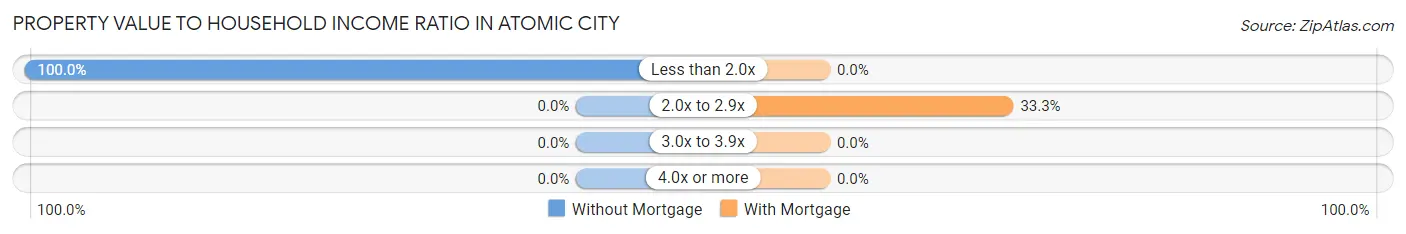
| Value-to-Income Ratio | Without Mortgage | With Mortgage |
| Less than 2.0x | 5 (100.0%) | 0 (0.0%) |
| 2.0x to 2.9x | 0 (0.0%) | 3 (33.3%) |
| 3.0x to 3.9x | 0 (0.0%) | 0 (0.0%) |
| 4.0x or more | 0 (0.0%) | 0 (0.0%) |
| Total | 5 (100.0%) | 9 (100.0%) |
Real Estate Taxes by Mortgage Status in Atomic City
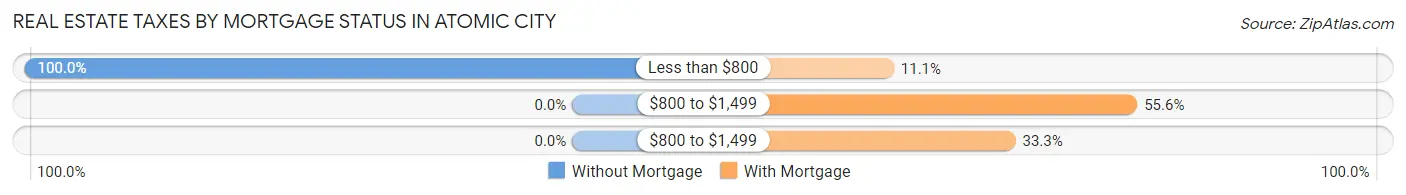
| Property Taxes | Without Mortgage | With Mortgage |
| Less than $800 | 5 (100.0%) | 1 (11.1%) |
| $800 to $1,499 | 0 (0.0%) | 5 (55.6%) |
| $800 to $1,499 | 0 (0.0%) | 3 (33.3%) |
| Total | 5 (100.0%) | 9 (100.0%) |
Health & Disability in Atomic City
Health Insurance Coverage by Age in Atomic City
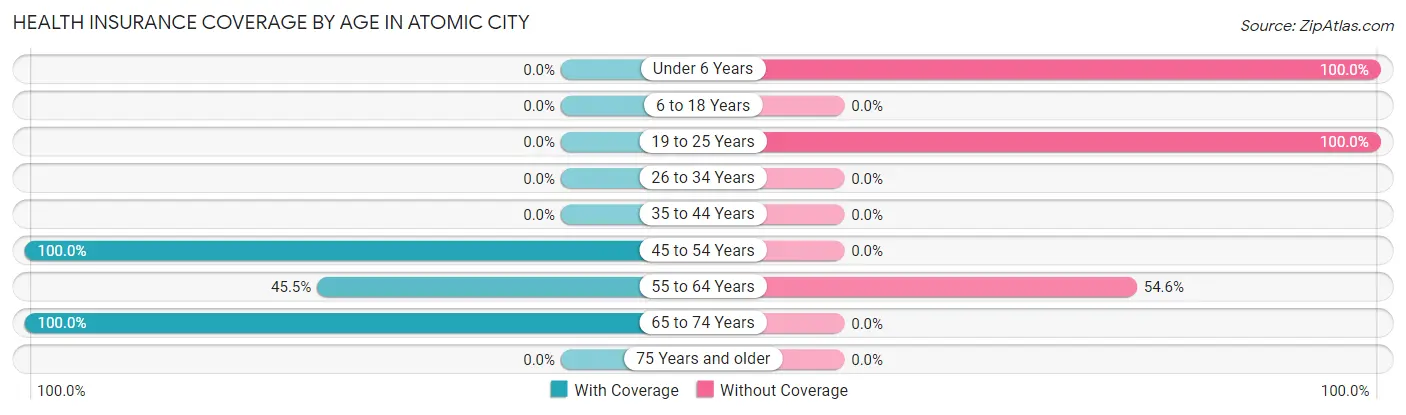
| Age Bracket | With Coverage | Without Coverage |
| Under 6 Years | 0 (0.0%) | 3 (100.0%) |
| 6 to 18 Years | 0 (0.0%) | 0 (0.0%) |
| 19 to 25 Years | 0 (0.0%) | 1 (100.0%) |
| 26 to 34 Years | 0 (0.0%) | 0 (0.0%) |
| 35 to 44 Years | 0 (0.0%) | 0 (0.0%) |
| 45 to 54 Years | 3 (100.0%) | 0 (0.0%) |
| 55 to 64 Years | 5 (45.5%) | 6 (54.5%) |
| 65 to 74 Years | 3 (100.0%) | 0 (0.0%) |
| 75 Years and older | 0 (0.0%) | 0 (0.0%) |
| Total | 11 (52.4%) | 10 (47.6%) |
Health Insurance Coverage by Citizenship Status in Atomic City
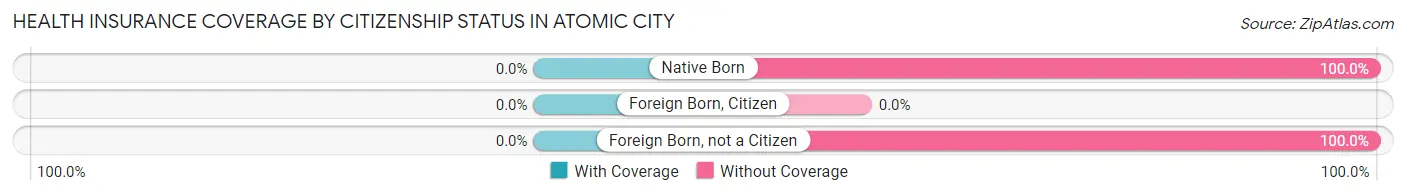
| Citizenship Status | With Coverage | Without Coverage |
| Native Born | 0 (0.0%) | 3 (100.0%) |
| Foreign Born, Citizen | 0 (0.0%) | 0 (0.0%) |
| Foreign Born, not a Citizen | 0 (0.0%) | 1 (100.0%) |
Health Insurance Coverage by Household Income in Atomic City
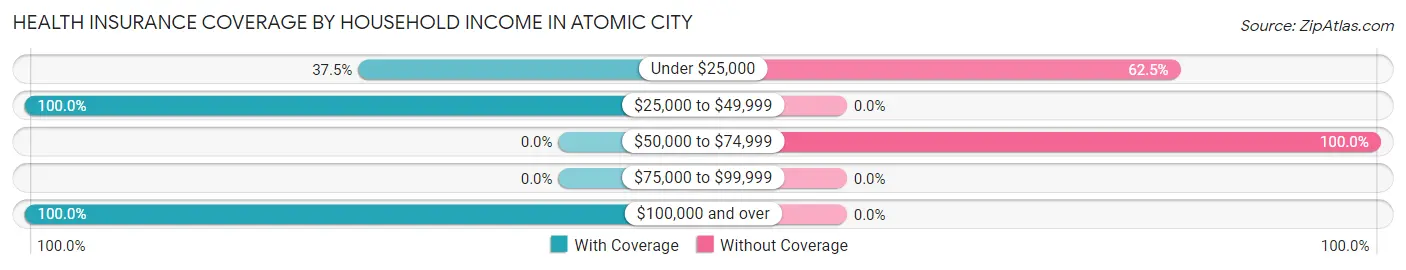
| Household Income | With Coverage | Without Coverage |
| Under $25,000 | 3 (37.5%) | 5 (62.5%) |
| $25,000 to $49,999 | 6 (100.0%) | 0 (0.0%) |
| $50,000 to $74,999 | 0 (0.0%) | 5 (100.0%) |
| $75,000 to $99,999 | 0 (0.0%) | 0 (0.0%) |
| $100,000 and over | 2 (100.0%) | 0 (0.0%) |
Public vs Private Health Insurance Coverage by Age in Atomic City
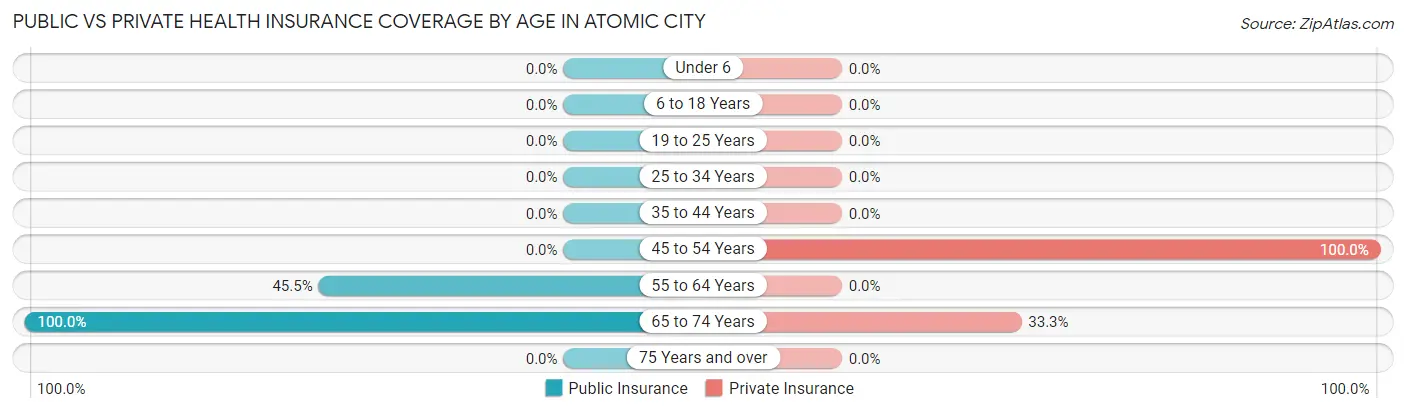
| Age Bracket | Public Insurance | Private Insurance |
| Under 6 | 0 (0.0%) | 0 (0.0%) |
| 6 to 18 Years | 0 (0.0%) | 0 (0.0%) |
| 19 to 25 Years | 0 (0.0%) | 0 (0.0%) |
| 25 to 34 Years | 0 (0.0%) | 0 (0.0%) |
| 35 to 44 Years | 0 (0.0%) | 0 (0.0%) |
| 45 to 54 Years | 0 (0.0%) | 3 (100.0%) |
| 55 to 64 Years | 5 (45.5%) | 0 (0.0%) |
| 65 to 74 Years | 3 (100.0%) | 1 (33.3%) |
| 75 Years and over | 0 (0.0%) | 0 (0.0%) |
| Total | 8 (38.1%) | 4 (19.1%) |
Disability Status by Sex by Age in Atomic City
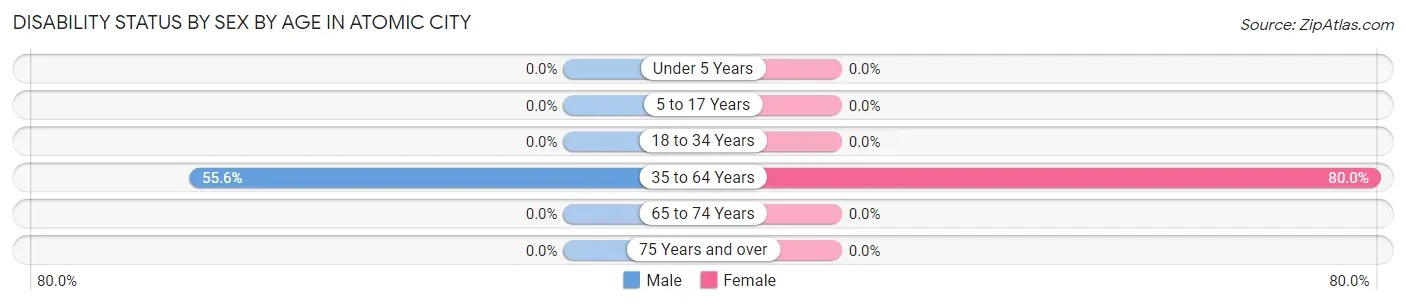
| Age Bracket | Male | Female |
| Under 5 Years | 0 (0.0%) | 0 (0.0%) |
| 5 to 17 Years | 0 (0.0%) | 0 (0.0%) |
| 18 to 34 Years | 0 (0.0%) | 0 (0.0%) |
| 35 to 64 Years | 5 (55.6%) | 4 (80.0%) |
| 65 to 74 Years | 0 (0.0%) | 0 (0.0%) |
| 75 Years and over | 0 (0.0%) | 0 (0.0%) |
Disability Class by Sex by Age in Atomic City
Disability Class: Hearing Difficulty
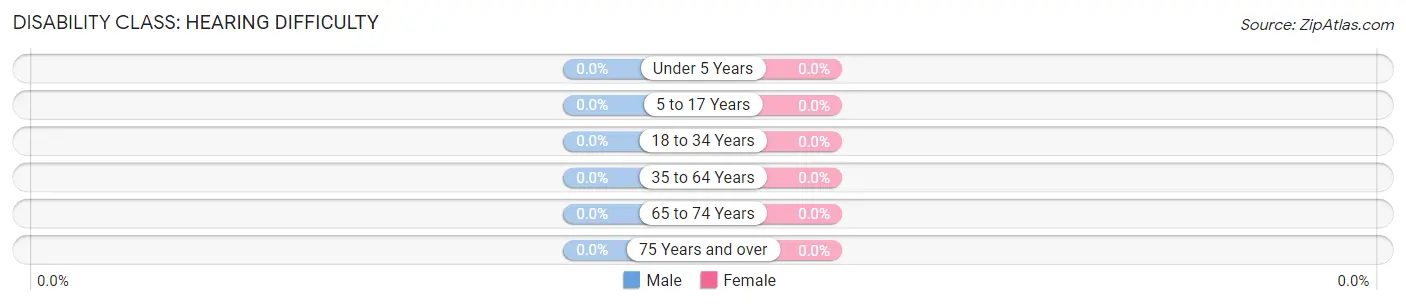
| Age Bracket | Male | Female |
| Under 5 Years | 0 (0.0%) | 0 (0.0%) |
| 5 to 17 Years | 0 (0.0%) | 0 (0.0%) |
| 18 to 34 Years | 0 (0.0%) | 0 (0.0%) |
| 35 to 64 Years | 0 (0.0%) | 0 (0.0%) |
| 65 to 74 Years | 0 (0.0%) | 0 (0.0%) |
| 75 Years and over | 0 (0.0%) | 0 (0.0%) |
Disability Class: Vision Difficulty
| Age Bracket | Male | Female |
| Under 5 Years | 0 (0.0%) | 0 (0.0%) |
| 5 to 17 Years | 0 (0.0%) | 0 (0.0%) |
| 18 to 34 Years | 0 (0.0%) | 0 (0.0%) |
| 35 to 64 Years | 0 (0.0%) | 0 (0.0%) |
| 65 to 74 Years | 0 (0.0%) | 0 (0.0%) |
| 75 Years and over | 0 (0.0%) | 0 (0.0%) |
Disability Class: Cognitive Difficulty
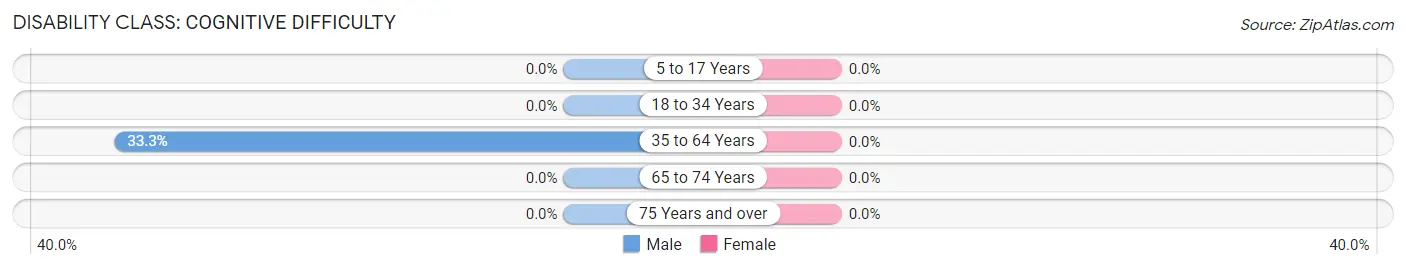
| Age Bracket | Male | Female |
| 5 to 17 Years | 0 (0.0%) | 0 (0.0%) |
| 18 to 34 Years | 0 (0.0%) | 0 (0.0%) |
| 35 to 64 Years | 3 (33.3%) | 0 (0.0%) |
| 65 to 74 Years | 0 (0.0%) | 0 (0.0%) |
| 75 Years and over | 0 (0.0%) | 0 (0.0%) |
Disability Class: Ambulatory Difficulty
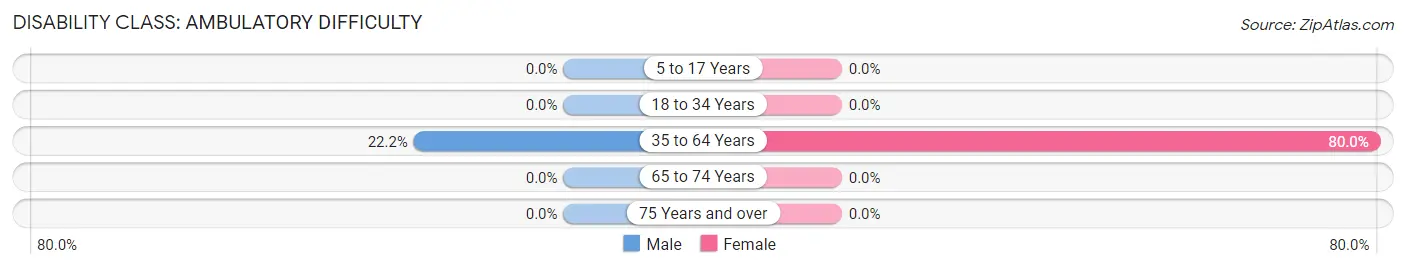
| Age Bracket | Male | Female |
| 5 to 17 Years | 0 (0.0%) | 0 (0.0%) |
| 18 to 34 Years | 0 (0.0%) | 0 (0.0%) |
| 35 to 64 Years | 2 (22.2%) | 4 (80.0%) |
| 65 to 74 Years | 0 (0.0%) | 0 (0.0%) |
| 75 Years and over | 0 (0.0%) | 0 (0.0%) |
Disability Class: Self-Care Difficulty
| Age Bracket | Male | Female |
| 5 to 17 Years | 0 (0.0%) | 0 (0.0%) |
| 18 to 34 Years | 0 (0.0%) | 0 (0.0%) |
| 35 to 64 Years | 0 (0.0%) | 0 (0.0%) |
| 65 to 74 Years | 0 (0.0%) | 0 (0.0%) |
| 75 Years and over | 0 (0.0%) | 0 (0.0%) |
Technology Access in Atomic City
Computing Device Access in Atomic City
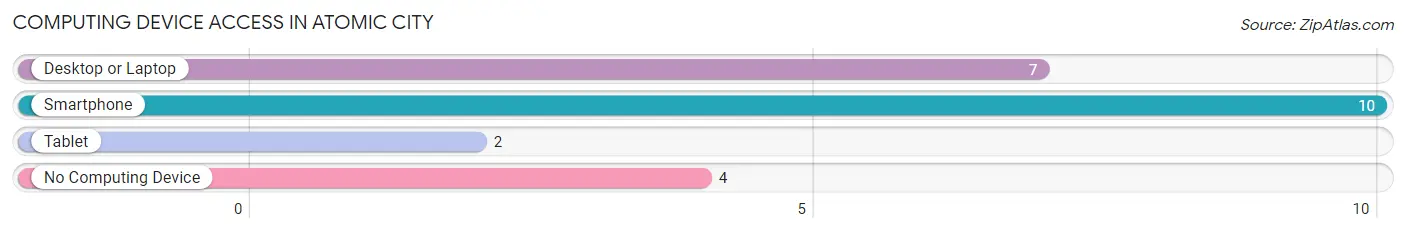
| Device Type | # Households | % Households |
| Desktop or Laptop | 7 | 43.8% |
| Smartphone | 10 | 62.5% |
| Tablet | 2 | 12.5% |
| No Computing Device | 4 | 25.0% |
| Total | 16 | 100.0% |
Internet Access in Atomic City
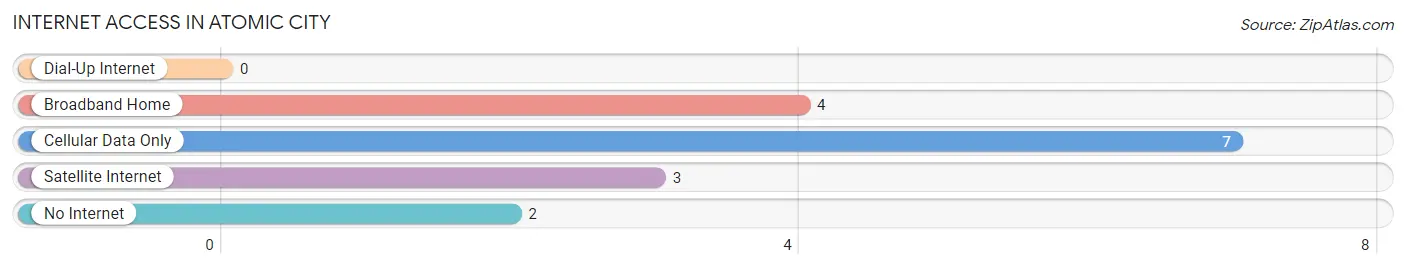
| Internet Type | # Households | % Households |
| Dial-Up Internet | 0 | 0.0% |
| Broadband Home | 4 | 25.0% |
| Cellular Data Only | 7 | 43.8% |
| Satellite Internet | 3 | 18.8% |
| No Internet | 2 | 12.5% |
| Total | 16 | 100.0% |
Atomic City Summary
Atomic City, Idaho is a small town located in the southeastern corner of the state, near the Utah border. It is part of the Idaho Falls metropolitan area and is home to a population of just over 500 people. The town was founded in the late 1800s and was originally known as “Atomic” due to its proximity to the nearby Idaho National Laboratory.
History
Atomic City was founded in 1883 by a group of settlers from Utah. The town was originally known as “Atomic” due to its proximity to the nearby Idaho National Laboratory. The laboratory was established in 1949 and is the largest nuclear research facility in the United States. The town was officially incorporated in 1951 and was renamed “Atomic City” in 1953.
Atomic City has a long history of uranium mining and processing. The town was home to the Atomic Energy Commission’s first uranium processing plant, which operated from 1951 to 1964. The plant was responsible for processing uranium ore from the nearby Idaho National Laboratory. The plant was eventually closed due to safety concerns and the town’s population declined significantly.
Geography
Atomic City is located in the southeastern corner of Idaho, near the Utah border. The town is situated in the Snake River Plain, a large flat area of land that stretches across the state. The town is located at an elevation of 4,890 feet and is surrounded by mountains and hills. The nearby Idaho National Laboratory is located just to the north of the town.
Economy
Atomic City’s economy is largely based on agriculture and tourism. The town is home to several farms and ranches that produce a variety of crops, including potatoes, wheat, and hay. The town is also home to several tourist attractions, including the Atomic City Museum and the Atomic City Speedway.
Demographics
As of the 2010 census, Atomic City had a population of 514 people. The town is predominantly white, with 94.3% of the population identifying as such. The town also has a small Hispanic population, with 4.3% of the population identifying as Hispanic or Latino. The median household income in Atomic City is $41,250, and the median home value is $117,500.
Atomic City is a small town with a rich history and a unique culture. The town is home to a diverse population and a vibrant economy. The town is also home to the Idaho National Laboratory, which is the largest nuclear research facility in the United States. Atomic City is a great place to live and work, and it is a great place to visit.
Common Questions
What is Per Capita Income in Atomic City?
Per Capita income in Atomic City is $30,910.
What is Inequality or Gini Index in Atomic City?
Inequality or Gini Index in Atomic City is 0.49.
What is the Total Population of Atomic City?
Total Population of Atomic City is 21.
What is the Total Male Population of Atomic City?
Total Male Population of Atomic City is 11.
What is the Total Female Population of Atomic City?
Total Female Population of Atomic City is 10.
What is the Ratio of Males per 100 Females in Atomic City?
There are 110.00 Males per 100 Females in Atomic City.
What is the Ratio of Females per 100 Males in Atomic City?
There are 90.91 Females per 100 Males in Atomic City.
What is the Median Population Age in Atomic City?
Median Population Age in Atomic City is 62.5 Years.
What is the Average Family Size in Atomic City
Average Family Size in Atomic City is 3.5 People.
What is the Average Household Size in Atomic City
Average Household Size in Atomic City is 1.3 People.
How Large is the Labor Force in Atomic City?
There are 5 People in the Labor Forcein in Atomic City.
What is the Percentage of People in the Labor Force in Atomic City?
27.8% of People are in the Labor Force in Atomic City.