Placedo, TX Map & Demographics
Placedo Map
Placedo Overview
$13,851
PER CAPITA INCOME
$22,395
AVG HOUSEHOLD INCOME
0.30
INEQUALITY / GINI INDEX
516
TOTAL POPULATION
366
MALE POPULATION
150
FEMALE POPULATION
244.00
MALES / 100 FEMALES
40.98
FEMALES / 100 MALES
40.3
MEDIAN AGE
4.0
AVG FAMILY SIZE
2.3
AVG HOUSEHOLD SIZE
203
LABOR FORCE [ PEOPLE ]
50.6%
PERCENT IN LABOR FORCE
Placedo Zip Codes
Placedo Area Codes
Income in Placedo
Income Overview in Placedo
| Characteristic | Number | Measure |
| Per Capita Income | 516 | $13,851 |
| Median Family Income | 83 | $0 |
| Mean Family Income | 83 | $55,133 |
| Median Household Income | 228 | $22,395 |
| Mean Household Income | 228 | $34,690 |
| Income Deficit | 83 | $0 |
| Wage / Income Gap (%) | 516 | 0.00% |
| Wage / Income Gap ($) | 516 | 100.00¢ per $1 |
| Gini / Inequality Index | 516 | 0.30 |
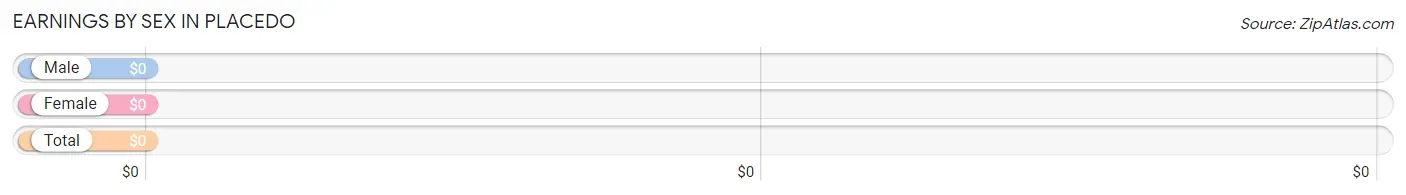
Earnings by Sex in Placedo
| Sex | Number | Average Earnings |
| Male | 168 (70.0%) | $0 |
| Female | 72 (30.0%) | $0 |
| Total | 240 (100.0%) | $0 |
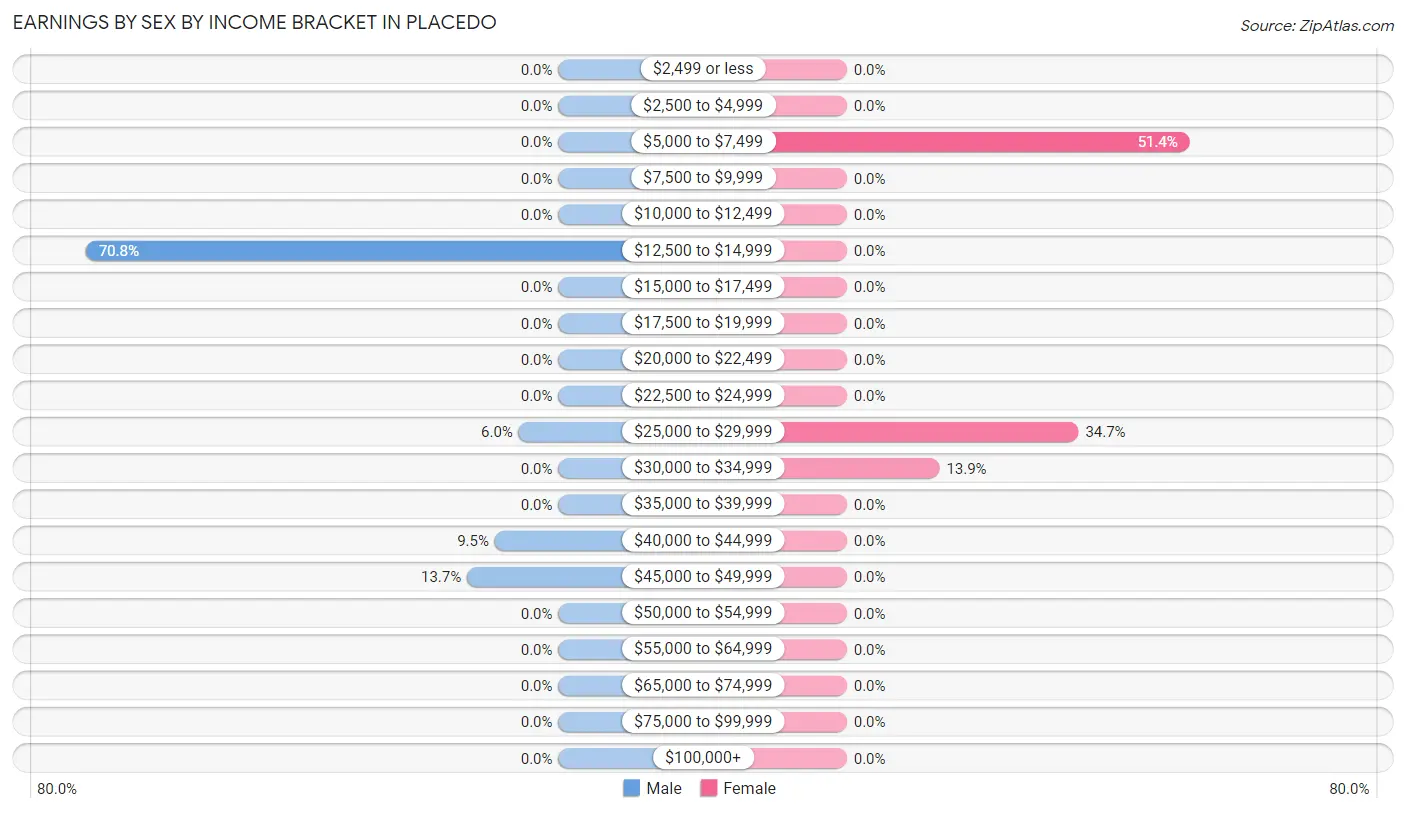
Earnings by Sex by Income Bracket in Placedo
The most common earnings brackets in Placedo are $12,500 to $14,999 for men (119 | 70.8%) and $5,000 to $7,499 for women (37 | 51.4%).
| Income | Male | Female |
| $2,499 or less | 0 (0.0%) | 0 (0.0%) |
| $2,500 to $4,999 | 0 (0.0%) | 0 (0.0%) |
| $5,000 to $7,499 | 0 (0.0%) | 37 (51.4%) |
| $7,500 to $9,999 | 0 (0.0%) | 0 (0.0%) |
| $10,000 to $12,499 | 0 (0.0%) | 0 (0.0%) |
| $12,500 to $14,999 | 119 (70.8%) | 0 (0.0%) |
| $15,000 to $17,499 | 0 (0.0%) | 0 (0.0%) |
| $17,500 to $19,999 | 0 (0.0%) | 0 (0.0%) |
| $20,000 to $22,499 | 0 (0.0%) | 0 (0.0%) |
| $22,500 to $24,999 | 0 (0.0%) | 0 (0.0%) |
| $25,000 to $29,999 | 10 (5.9%) | 25 (34.7%) |
| $30,000 to $34,999 | 0 (0.0%) | 10 (13.9%) |
| $35,000 to $39,999 | 0 (0.0%) | 0 (0.0%) |
| $40,000 to $44,999 | 16 (9.5%) | 0 (0.0%) |
| $45,000 to $49,999 | 23 (13.7%) | 0 (0.0%) |
| $50,000 to $54,999 | 0 (0.0%) | 0 (0.0%) |
| $55,000 to $64,999 | 0 (0.0%) | 0 (0.0%) |
| $65,000 to $74,999 | 0 (0.0%) | 0 (0.0%) |
| $75,000 to $99,999 | 0 (0.0%) | 0 (0.0%) |
| $100,000+ | 0 (0.0%) | 0 (0.0%) |
| Total | 168 (100.0%) | 72 (100.0%) |
Earnings by Sex by Educational Attainment in Placedo
| Educational Attainment | Male Income | Female Income |
| Less than High School | - | - |
| High School Diploma | - | - |
| College or Associate's Degree | - | - |
| Bachelor's Degree | - | - |
| Graduate Degree | - | - |
| Total | - | - |
Family Income in Placedo
Family Income Brackets in Placedo
According to the Placedo family income data, there are 41 families falling into the $75,000 to $99,999 income range, which is the most common income bracket and makes up 49.4% of all families.
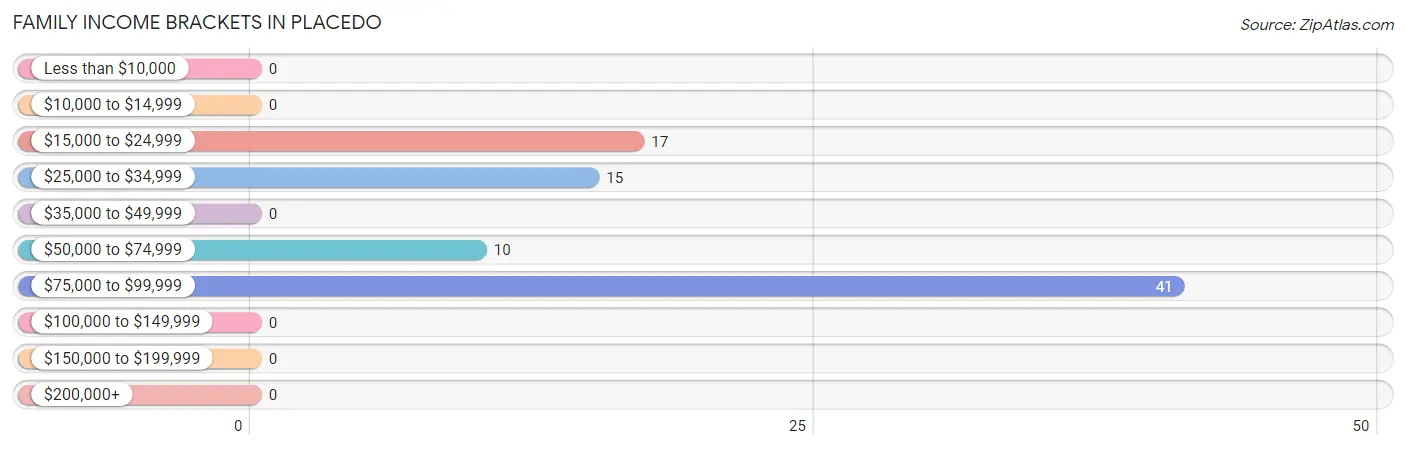
| Income Bracket | # Families | % Families |
| Less than $10,000 | 0 | 0.0% |
| $10,000 to $14,999 | 0 | 0.0% |
| $15,000 to $24,999 | 17 | 20.5% |
| $25,000 to $34,999 | 15 | 18.1% |
| $35,000 to $49,999 | 0 | 0.0% |
| $50,000 to $74,999 | 10 | 12.0% |
| $75,000 to $99,999 | 41 | 49.4% |
| $100,000 to $149,999 | 0 | 0.0% |
| $150,000 to $199,999 | 0 | 0.0% |
| $200,000+ | 0 | 0.0% |
Family Income by Famaliy Size in Placedo
2-person families (42 | 50.6%) account for the highest median family income in Placedo with $25,667 per family, while 2-person families (42 | 50.6%) have the highest median income of $12,834 per family member.
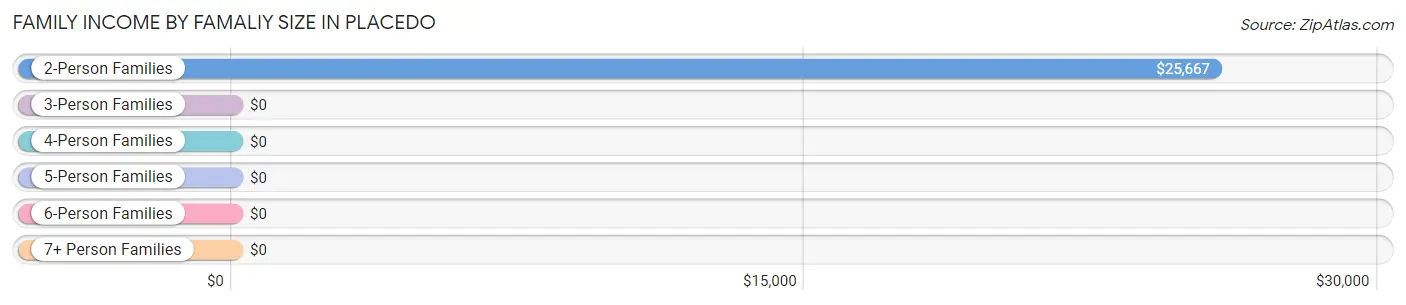
| Income Bracket | # Families | Median Income |
| 2-Person Families | 42 (50.6%) | $25,667 |
| 3-Person Families | 16 (19.3%) | $0 |
| 4-Person Families | 0 (0.0%) | $0 |
| 5-Person Families | 0 (0.0%) | $0 |
| 6-Person Families | 25 (30.1%) | $0 |
| 7+ Person Families | 0 (0.0%) | $0 |
| Total | 83 (100.0%) | $0 |
Family Income by Number of Earners in Placedo
| Number of Earners | # Families | Median Income |
| No Earners | 32 (38.6%) | $0 |
| 1 Earner | 10 (12.0%) | $0 |
| 2 Earners | 41 (49.4%) | $0 |
| 3+ Earners | 0 (0.0%) | $0 |
| Total | 83 (100.0%) | $0 |
Household Income in Placedo
Household Income Brackets in Placedo
With 136 households falling in the category, the $15,000 to $24,999 income range is the most frequent in Placedo, accounting for 59.7% of all households.
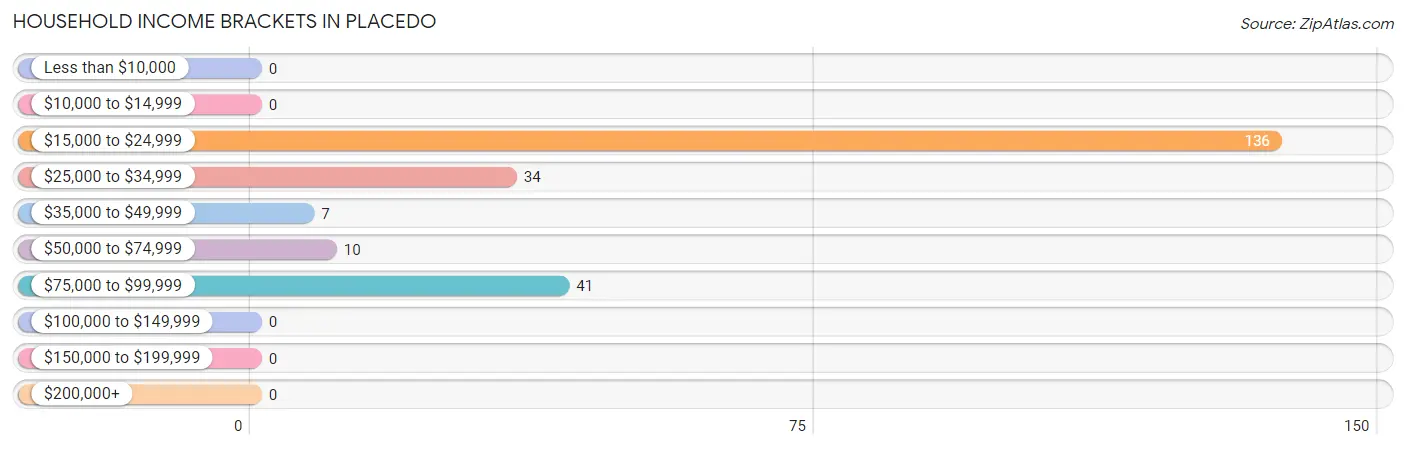
| Income Bracket | # Households | % Households |
| Less than $10,000 | 0 | 0.0% |
| $10,000 to $14,999 | 0 | 0.0% |
| $15,000 to $24,999 | 136 | 59.6% |
| $25,000 to $34,999 | 34 | 14.9% |
| $35,000 to $49,999 | 7 | 3.1% |
| $50,000 to $74,999 | 10 | 4.4% |
| $75,000 to $99,999 | 41 | 18.0% |
| $100,000 to $149,999 | 0 | 0.0% |
| $150,000 to $199,999 | 0 | 0.0% |
| $200,000+ | 0 | 0.0% |
Household Income by Householder Age in Placedo
The median household income in Placedo is $22,395, with the highest median household income of $33,092 found in the 65+ years age bracket for the primary householder. A total of 43 households (18.9%) fall into this category.
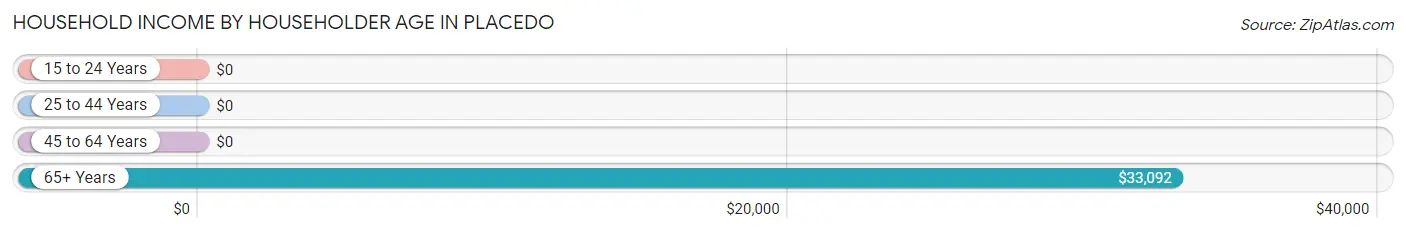
| Income Bracket | # Households | Median Income |
| 15 to 24 Years | 0 (0.0%) | $0 |
| 25 to 44 Years | 160 (70.2%) | $0 |
| 45 to 64 Years | 25 (11.0%) | $0 |
| 65+ Years | 43 (18.9%) | $33,092 |
| Total | 228 (100.0%) | $22,395 |
Poverty in Placedo
Income Below Poverty by Sex and Age in Placedo
With 32.5% poverty level for males and 24.7% for females among the residents of Placedo, 35 to 44 year old males and 45 to 54 year old females are the most vulnerable to poverty, with 119 males (100.0%) and 37 females (57.8%) in their respective age groups living below the poverty level.
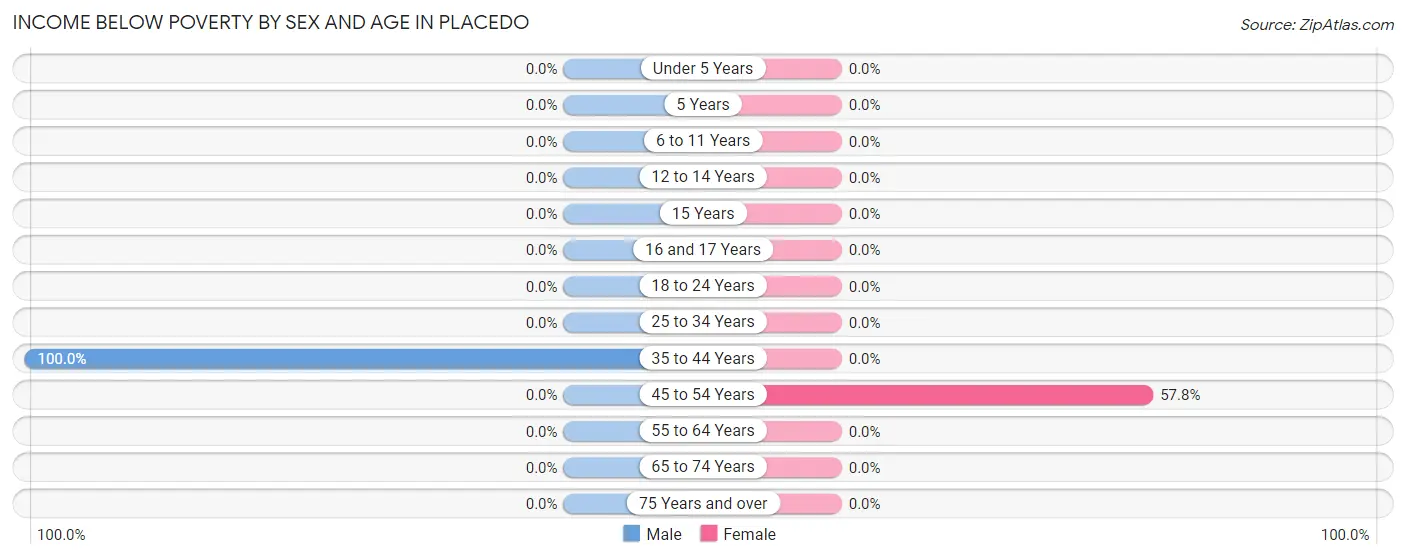
| Age Bracket | Male | Female |
| Under 5 Years | 0 (0.0%) | 0 (0.0%) |
| 5 Years | 0 (0.0%) | 0 (0.0%) |
| 6 to 11 Years | 0 (0.0%) | 0 (0.0%) |
| 12 to 14 Years | 0 (0.0%) | 0 (0.0%) |
| 15 Years | 0 (0.0%) | 0 (0.0%) |
| 16 and 17 Years | 0 (0.0%) | 0 (0.0%) |
| 18 to 24 Years | 0 (0.0%) | 0 (0.0%) |
| 25 to 34 Years | 0 (0.0%) | 0 (0.0%) |
| 35 to 44 Years | 119 (100.0%) | 0 (0.0%) |
| 45 to 54 Years | 0 (0.0%) | 37 (57.8%) |
| 55 to 64 Years | 0 (0.0%) | 0 (0.0%) |
| 65 to 74 Years | 0 (0.0%) | 0 (0.0%) |
| 75 Years and over | 0 (0.0%) | 0 (0.0%) |
| Total | 119 (32.5%) | 37 (24.7%) |
Income Above Poverty by Sex and Age in Placedo
According to the poverty statistics in Placedo, males aged 6 to 11 years and females aged 25 to 34 years are the age groups that are most secure financially, with 100.0% of males and 100.0% of females in these age groups living above the poverty line.
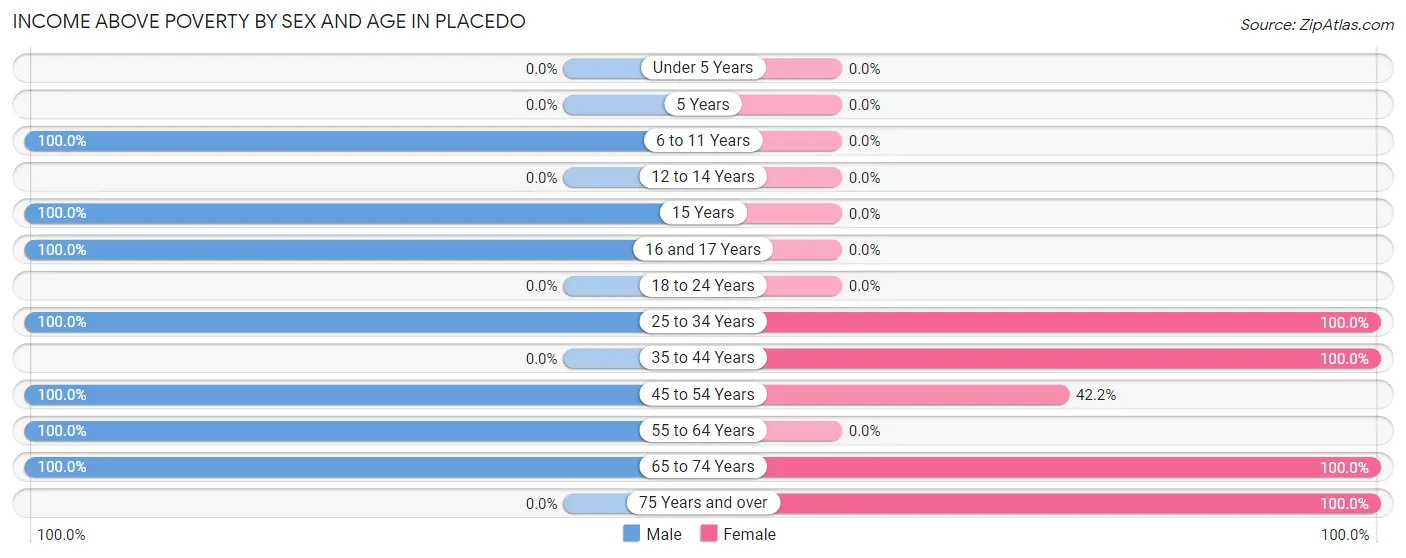
| Age Bracket | Male | Female |
| Under 5 Years | 0 (0.0%) | 0 (0.0%) |
| 5 Years | 0 (0.0%) | 0 (0.0%) |
| 6 to 11 Years | 64 (100.0%) | 0 (0.0%) |
| 12 to 14 Years | 0 (0.0%) | 0 (0.0%) |
| 15 Years | 51 (100.0%) | 0 (0.0%) |
| 16 and 17 Years | 51 (100.0%) | 0 (0.0%) |
| 18 to 24 Years | 0 (0.0%) | 0 (0.0%) |
| 25 to 34 Years | 16 (100.0%) | 10 (100.0%) |
| 35 to 44 Years | 0 (0.0%) | 25 (100.0%) |
| 45 to 54 Years | 23 (100.0%) | 27 (42.2%) |
| 55 to 64 Years | 25 (100.0%) | 0 (0.0%) |
| 65 to 74 Years | 17 (100.0%) | 43 (100.0%) |
| 75 Years and over | 0 (0.0%) | 8 (100.0%) |
| Total | 247 (67.5%) | 113 (75.3%) |
Income Below Poverty Among Married-Couple Families in Placedo
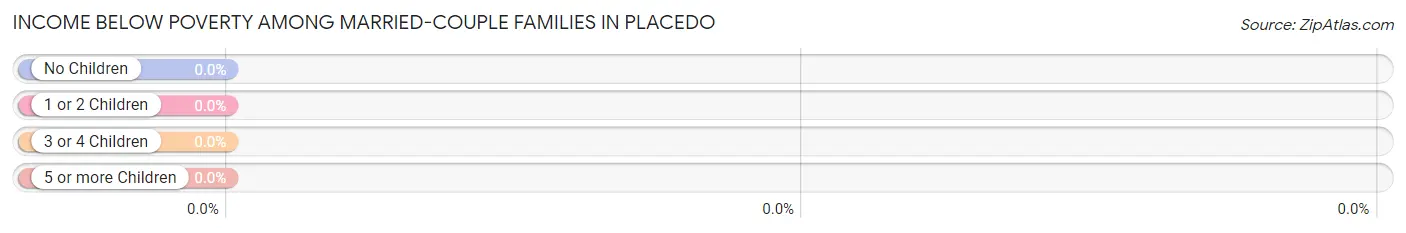
| Children | Above Poverty | Below Poverty |
| No Children | 17 (100.0%) | 0 (0.0%) |
| 1 or 2 Children | 16 (100.0%) | 0 (0.0%) |
| 3 or 4 Children | 25 (100.0%) | 0 (0.0%) |
| 5 or more Children | 0 (0.0%) | 0 (0.0%) |
| Total | 58 (100.0%) | 0 (0.0%) |
Income Below Poverty Among Single-Parent Households in Placedo
| Children | Single Father | Single Mother |
| No Children | 0 (0.0%) | 0 (0.0%) |
| 1 or 2 Children | 0 (0.0%) | 0 (0.0%) |
| 3 or 4 Children | 0 (0.0%) | 0 (0.0%) |
| 5 or more Children | 0 (0.0%) | 0 (0.0%) |
| Total | 0 (0.0%) | 0 (0.0%) |
Income Below Poverty Among Married-Couple vs Single-Parent Households in Placedo
| Children | Married-Couple Families | Single-Parent Households |
| No Children | 0 (0.0%) | 0 (0.0%) |
| 1 or 2 Children | 0 (0.0%) | 0 (0.0%) |
| 3 or 4 Children | 0 (0.0%) | 0 (0.0%) |
| 5 or more Children | 0 (0.0%) | 0 (0.0%) |
| Total | 0 (0.0%) | 0 (0.0%) |
Race in Placedo
The most populous races in Placedo are White / Caucasian (315 | 61.1%), Hispanic or Latino (218 | 42.2%), and Black / African American (119 | 23.1%).
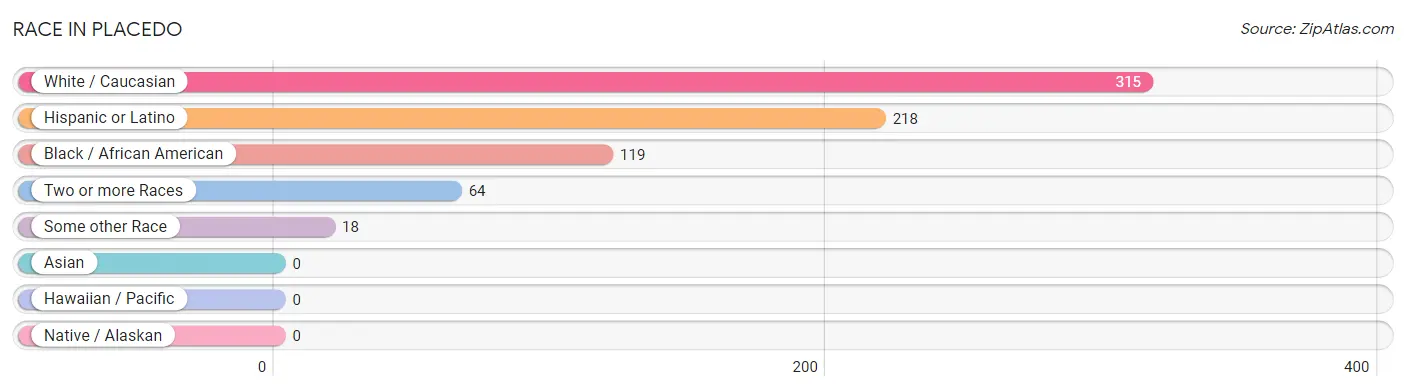
| Race | # Population | % Population |
| Asian | 0 | 0.0% |
| Black / African American | 119 | 23.1% |
| Hawaiian / Pacific | 0 | 0.0% |
| Hispanic or Latino | 218 | 42.2% |
| Native / Alaskan | 0 | 0.0% |
| White / Caucasian | 315 | 61.1% |
| Two or more Races | 64 | 12.4% |
| Some other Race | 18 | 3.5% |
| Total | 516 | 100.0% |
Ancestry in Placedo
The most populous ancestries reported in Placedo are Mexican (218 | 42.2%), English (180 | 34.9%), German (79 | 15.3%), Italian (23 | 4.5%), and Scotch-Irish (19 | 3.7%), together accounting for 100.6% of all Placedo residents.
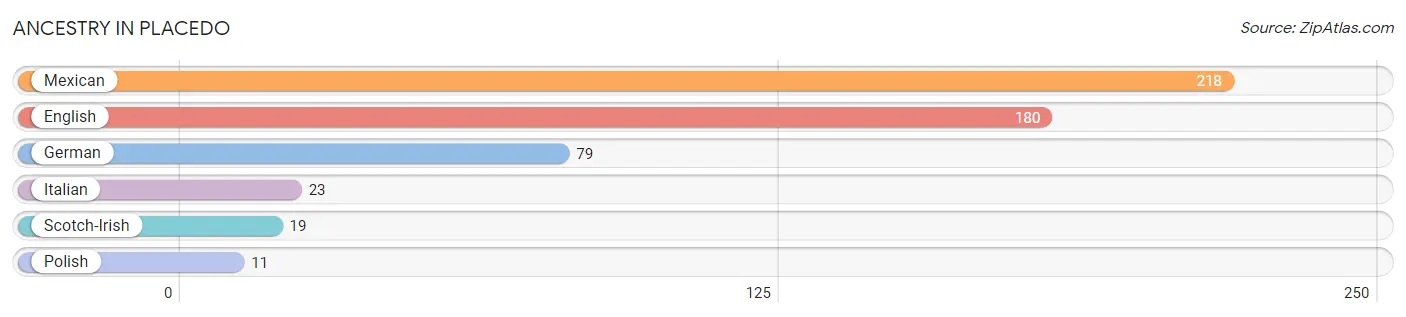
| Ancestry | # Population | % Population |
| English | 180 | 34.9% |
| German | 79 | 15.3% |
| Italian | 23 | 4.5% |
| Mexican | 218 | 42.2% |
| Polish | 11 | 2.1% |
| Scotch-Irish | 19 | 3.7% | View All 6 Rows |
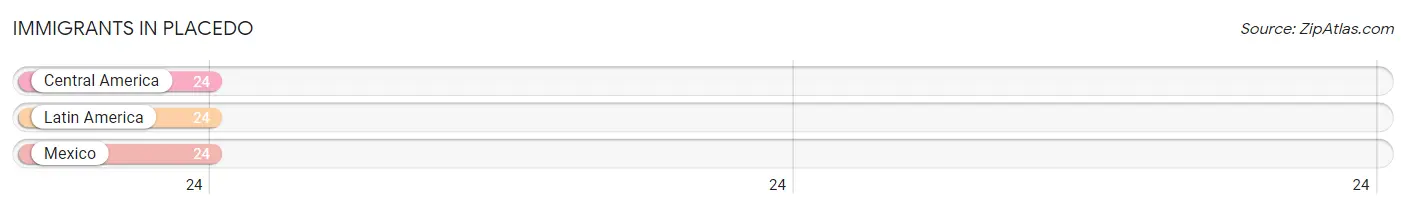
Immigrants in Placedo
The most numerous immigrant groups reported in Placedo came from Central America (24 | 4.6%), Latin America (24 | 4.6%), and Mexico (24 | 4.6%), together accounting for 14.0% of all Placedo residents.
| Immigration Origin | # Population | % Population |
| Central America | 24 | 4.6% |
| Latin America | 24 | 4.6% |
| Mexico | 24 | 4.6% | View All 3 Rows |
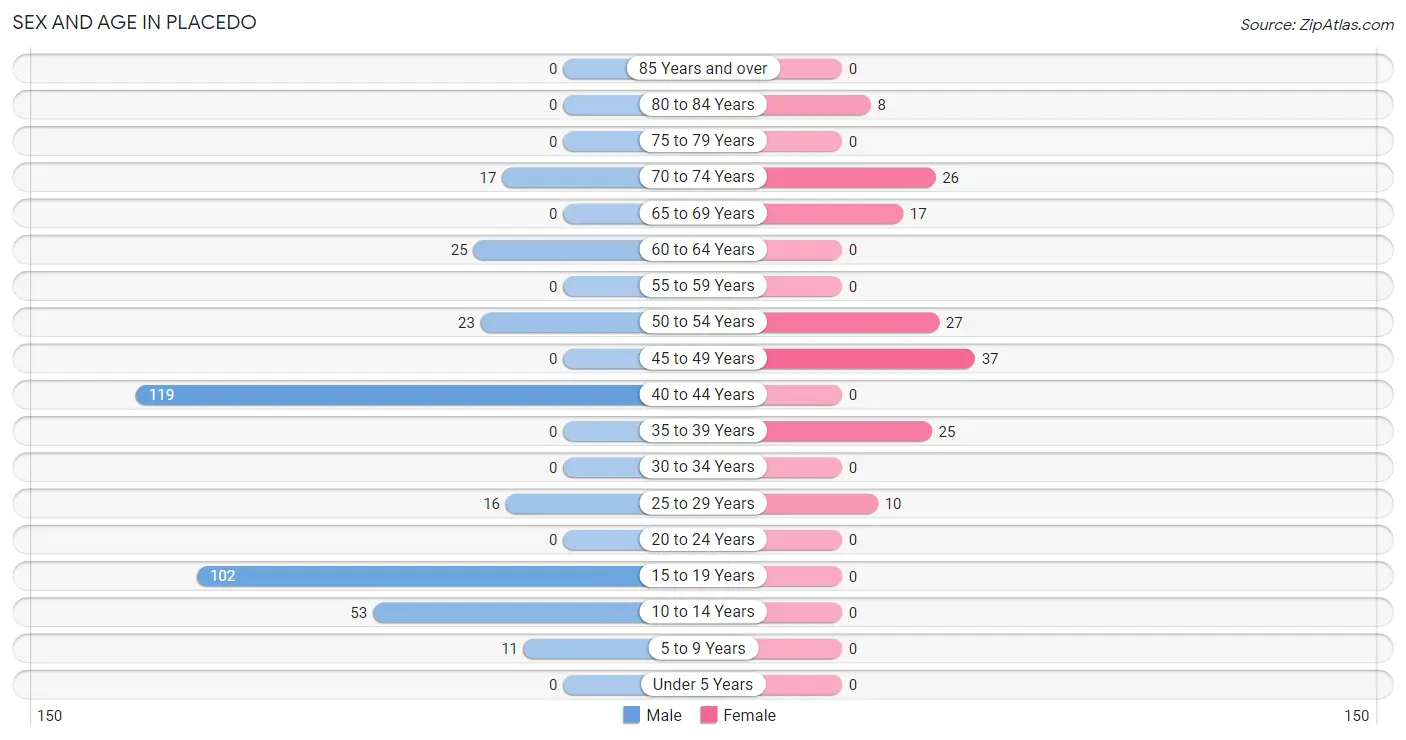
Sex and Age in Placedo
Sex and Age in Placedo
The most populous age groups in Placedo are 40 to 44 Years (119 | 32.5%) for men and 45 to 49 Years (37 | 24.7%) for women.
| Age Bracket | Male | Female |
| Under 5 Years | 0 (0.0%) | 0 (0.0%) |
| 5 to 9 Years | 11 (3.0%) | 0 (0.0%) |
| 10 to 14 Years | 53 (14.5%) | 0 (0.0%) |
| 15 to 19 Years | 102 (27.9%) | 0 (0.0%) |
| 20 to 24 Years | 0 (0.0%) | 0 (0.0%) |
| 25 to 29 Years | 16 (4.4%) | 10 (6.7%) |
| 30 to 34 Years | 0 (0.0%) | 0 (0.0%) |
| 35 to 39 Years | 0 (0.0%) | 25 (16.7%) |
| 40 to 44 Years | 119 (32.5%) | 0 (0.0%) |
| 45 to 49 Years | 0 (0.0%) | 37 (24.7%) |
| 50 to 54 Years | 23 (6.3%) | 27 (18.0%) |
| 55 to 59 Years | 0 (0.0%) | 0 (0.0%) |
| 60 to 64 Years | 25 (6.8%) | 0 (0.0%) |
| 65 to 69 Years | 0 (0.0%) | 17 (11.3%) |
| 70 to 74 Years | 17 (4.6%) | 26 (17.3%) |
| 75 to 79 Years | 0 (0.0%) | 0 (0.0%) |
| 80 to 84 Years | 0 (0.0%) | 8 (5.3%) |
| 85 Years and over | 0 (0.0%) | 0 (0.0%) |
| Total | 366 (100.0%) | 150 (100.0%) |
Families and Households in Placedo
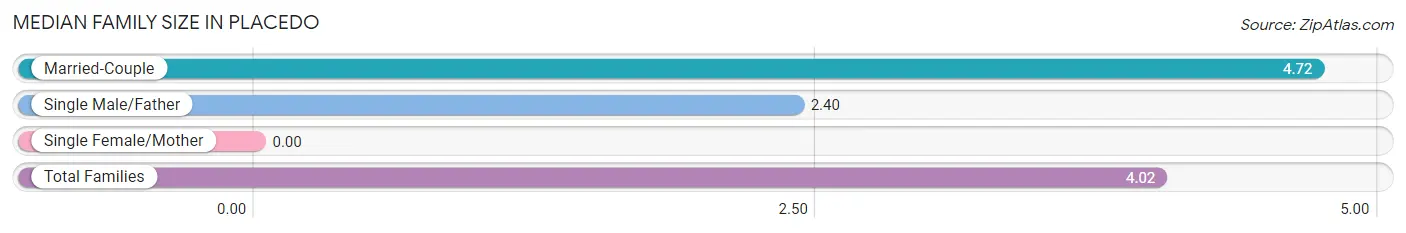
Median Family Size in Placedo
| Family Type | # Families | Family Size |
| Married-Couple | 58 (69.9%) | 4.72 |
| Single Male/Father | 25 (30.1%) | 2.40 |
| Single Female/Mother | 0 (0.0%) | - |
| Total Families | 83 (100.0%) | 4.02 |
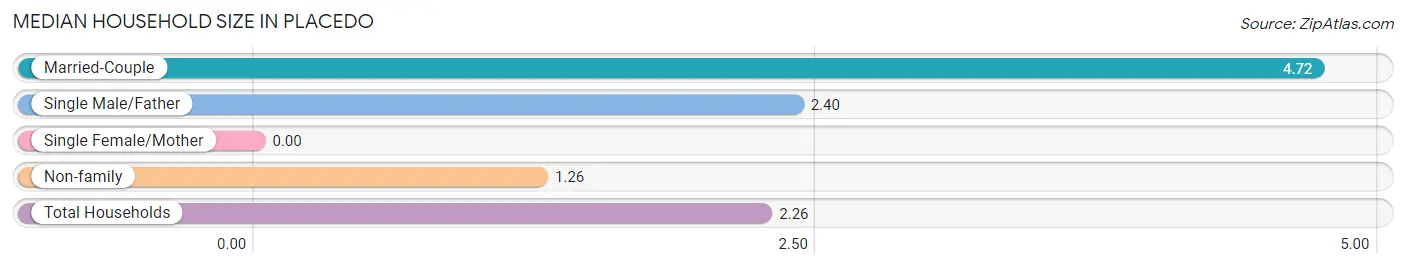
Median Household Size in Placedo
| Household Type | # Households | Household Size |
| Married-Couple | 58 (25.4%) | 4.72 |
| Single Male/Father | 25 (11.0%) | 2.40 |
| Single Female/Mother | 0 (0.0%) | - |
| Non-family | 145 (63.6%) | 1.26 |
| Total Households | 228 (100.0%) | 2.26 |
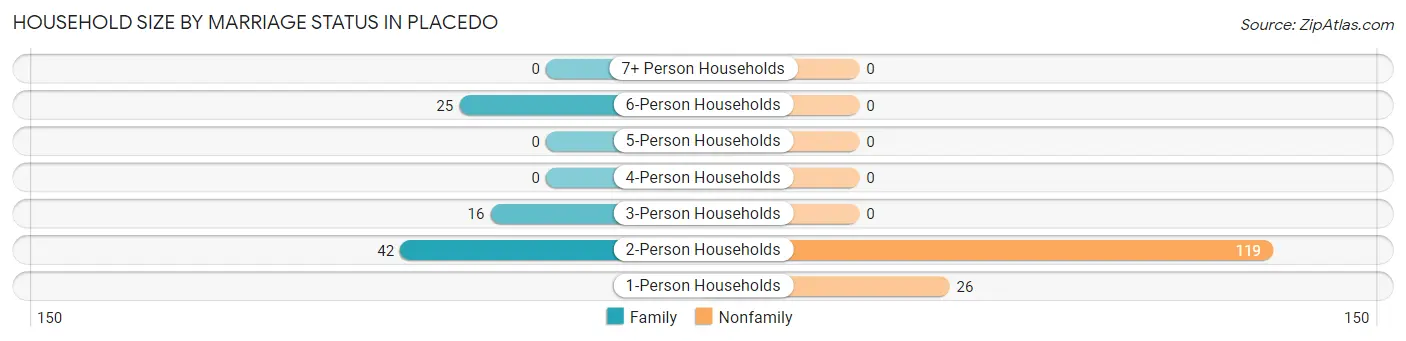
Household Size by Marriage Status in Placedo
Out of a total of 228 households in Placedo, 83 (36.4%) are family households, while 145 (63.6%) are nonfamily households. The most numerous type of family households are 2-person households, comprising 42, and the most common type of nonfamily households are 2-person households, comprising 119.
| Household Size | Family Households | Nonfamily Households |
| 1-Person Households | - | 26 (11.4%) |
| 2-Person Households | 42 (18.4%) | 119 (52.2%) |
| 3-Person Households | 16 (7.0%) | 0 (0.0%) |
| 4-Person Households | 0 (0.0%) | 0 (0.0%) |
| 5-Person Households | 0 (0.0%) | 0 (0.0%) |
| 6-Person Households | 25 (11.0%) | 0 (0.0%) |
| 7+ Person Households | 0 (0.0%) | 0 (0.0%) |
| Total | 83 (36.4%) | 145 (63.6%) |
Female Fertility in Placedo
Fertility by Age in Placedo
| Age Bracket | Women with Births | Births / 1,000 Women |
| 15 to 19 years | 0 (0.0%) | 0.0 |
| 20 to 34 years | 0 (0.0%) | 0.0 |
| 35 to 50 years | 0 (0.0%) | 0.0 |
| Total | 0 (0.0%) | 0.0 |
Fertility by Age by Marriage Status in Placedo
| Age Bracket | Married | Unmarried |
| 15 to 19 years | 0 (0.0%) | 0 (0.0%) |
| 20 to 34 years | 0 (0.0%) | 0 (0.0%) |
| 35 to 50 years | 0 (0.0%) | 0 (0.0%) |
| Total | 0 (0.0%) | 0 (0.0%) |
Fertility by Education in Placedo
| Educational Attainment | Women with Births | Births / 1,000 Women |
| Less than High School | 0 (0.0%) | 0.0 |
| High School Diploma | 0 (0.0%) | 0.0 |
| College or Associate's Degree | 0 (0.0%) | 0.0 |
| Bachelor's Degree | 0 (0.0%) | 0.0 |
| Graduate Degree | 0 (0.0%) | 0.0 |
| Total | 0 (0.0%) | 0.0 |
Fertility by Education by Marriage Status in Placedo
| Educational Attainment | Married | Unmarried |
| Less than High School | 0 (0.0%) | 0 (0.0%) |
| High School Diploma | 0 (0.0%) | 0 (0.0%) |
| College or Associate's Degree | 0 (0.0%) | 0 (0.0%) |
| Bachelor's Degree | 0 (0.0%) | 0 (0.0%) |
| Graduate Degree | 0 (0.0%) | 0 (0.0%) |
| Total | 0 (0.0%) | 0 (0.0%) |
Employment Characteristics in Placedo
Employment by Class of Employer in Placedo
Among the 203 employed individuals in Placedo, local government employees (145 | 71.4%), and private company employees (58 | 28.6%) make up the most common classes of employment.
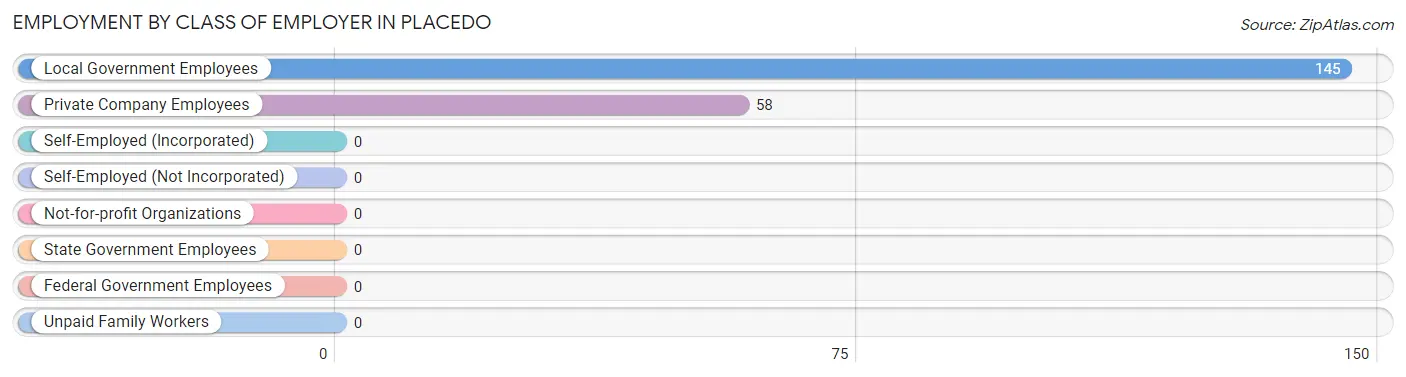
| Employer Class | # Employees | % Employees |
| Private Company Employees | 58 | 28.6% |
| Self-Employed (Incorporated) | 0 | 0.0% |
| Self-Employed (Not Incorporated) | 0 | 0.0% |
| Not-for-profit Organizations | 0 | 0.0% |
| Local Government Employees | 145 | 71.4% |
| State Government Employees | 0 | 0.0% |
| Federal Government Employees | 0 | 0.0% |
| Unpaid Family Workers | 0 | 0.0% |
| Total | 203 | 100.0% |
Employment Status by Age in Placedo
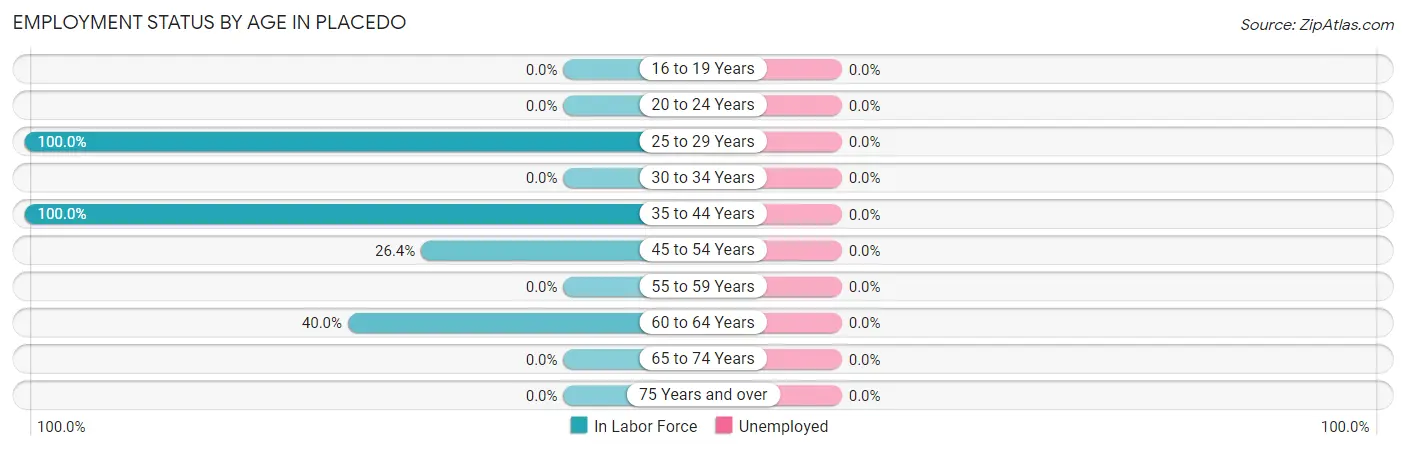
| Age Bracket | In Labor Force | Unemployed |
| 16 to 19 Years | 0 (0.0%) | 0 (0.0%) |
| 20 to 24 Years | 0 (0.0%) | 0 (0.0%) |
| 25 to 29 Years | 26 (100.0%) | 0 (0.0%) |
| 30 to 34 Years | 0 (0.0%) | 0 (0.0%) |
| 35 to 44 Years | 144 (100.0%) | 0 (0.0%) |
| 45 to 54 Years | 23 (26.4%) | 0 (0.0%) |
| 55 to 59 Years | 0 (0.0%) | 0 (0.0%) |
| 60 to 64 Years | 10 (40.0%) | 0 (0.0%) |
| 65 to 74 Years | 0 (0.0%) | 0 (0.0%) |
| 75 Years and over | 0 (0.0%) | 0 (0.0%) |
| Total | 203 (50.6%) | 0 (0.0%) |
Employment Status by Educational Attainment in Placedo
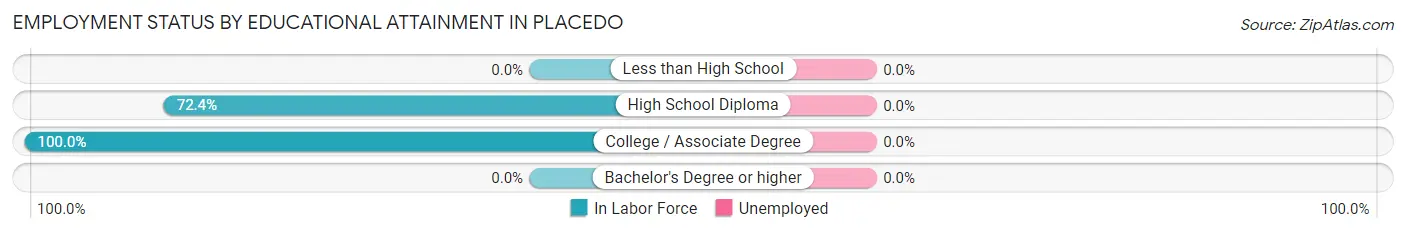
| Educational Attainment | In Labor Force | Unemployed |
| Less than High School | 0 (0.0%) | 0 (0.0%) |
| High School Diploma | 168 (72.4%) | 0 (0.0%) |
| College / Associate Degree | 35 (100.0%) | 0 (0.0%) |
| Bachelor's Degree or higher | 0 (0.0%) | 0 (0.0%) |
| Total | 203 (72.0%) | 0 (0.0%) |
Employment Occupations by Sex in Placedo
Management, Business, Science and Arts Occupations
Management, Business, Science and Arts Occupations by Sex
| Occupation | Male | Female |
| Management | 0 (0.0%) | 0 (0.0%) |
| Business & Financial | 0 (0.0%) | 0 (0.0%) |
| Computers, Engineering & Science | 0 (0.0%) | 0 (0.0%) |
| Computers & Mathematics | 0 (0.0%) | 0 (0.0%) |
| Architecture & Engineering | 0 (0.0%) | 0 (0.0%) |
| Life, Physical & Social Science | 0 (0.0%) | 0 (0.0%) |
| Community & Social Service | 0 (0.0%) | 0 (0.0%) |
| Education, Arts & Media | 0 (0.0%) | 0 (0.0%) |
| Legal Services & Support | 0 (0.0%) | 0 (0.0%) |
| Education Instruction & Library | 0 (0.0%) | 0 (0.0%) |
| Arts, Media & Entertainment | 0 (0.0%) | 0 (0.0%) |
| Health Diagnosing & Treating | 0 (0.0%) | 0 (0.0%) |
| Health Technologists | 0 (0.0%) | 0 (0.0%) |
| Total (Category) | 0 (0.0%) | 0 (0.0%) |
| Total (Overall) | 168 (82.8%) | 35 (17.2%) |
Services Occupations
Services Occupations by Sex
| Occupation | Male | Female |
| Healthcare Support | 0 (0.0%) | 0 (0.0%) |
| Security & Protection | 0 (0.0%) | 0 (0.0%) |
| Firefighting & Prevention | 0 (0.0%) | 0 (0.0%) |
| Law Enforcement | 0 (0.0%) | 0 (0.0%) |
| Food Preparation & Serving | 0 (0.0%) | 0 (0.0%) |
| Cleaning & Maintenance | 0 (0.0%) | 0 (0.0%) |
| Personal Care & Service | 0 (0.0%) | 0 (0.0%) |
| Total (Category) | 0 (0.0%) | 0 (0.0%) |
| Total (Overall) | 168 (82.8%) | 35 (17.2%) |
Sales and Office Occupations
The most common Sales and Office occupations in Placedo are , and Office & Administration (35 | 17.2%).
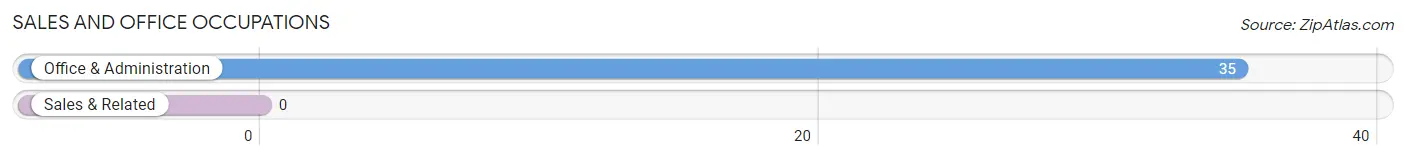
Sales and Office Occupations by Sex

| Occupation | Male | Female |
| Sales & Related | 0 (0.0%) | 0 (0.0%) |
| Office & Administration | 0 (0.0%) | 35 (100.0%) |
| Total (Category) | 0 (0.0%) | 35 (100.0%) |
| Total (Overall) | 168 (82.8%) | 35 (17.2%) |
Natural Resources, Construction and Maintenance Occupations
The most common Natural Resources, Construction and Maintenance occupations in Placedo are Installation, Maintenance & Repair (119 | 58.6%), and Farming, Fishing & Forestry (10 | 4.9%).
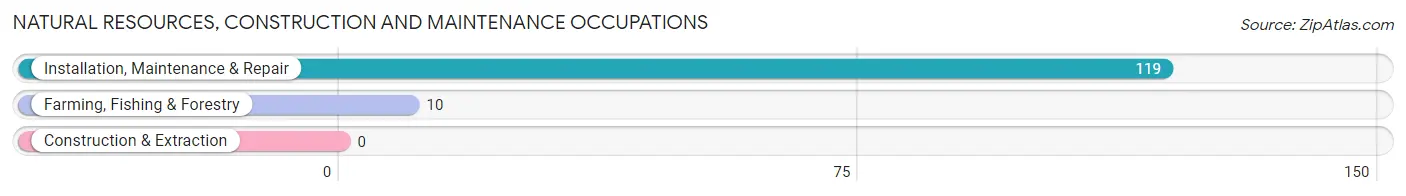
Natural Resources, Construction and Maintenance Occupations by Sex
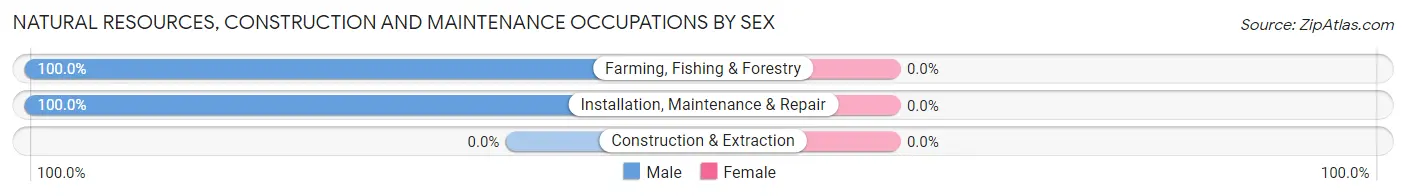
| Occupation | Male | Female |
| Farming, Fishing & Forestry | 10 (100.0%) | 0 (0.0%) |
| Construction & Extraction | 0 (0.0%) | 0 (0.0%) |
| Installation, Maintenance & Repair | 119 (100.0%) | 0 (0.0%) |
| Total (Category) | 129 (100.0%) | 0 (0.0%) |
| Total (Overall) | 168 (82.8%) | 35 (17.2%) |
Production, Transportation and Moving Occupations
The most common Production, Transportation and Moving occupations in Placedo are , and Production (39 | 19.2%).
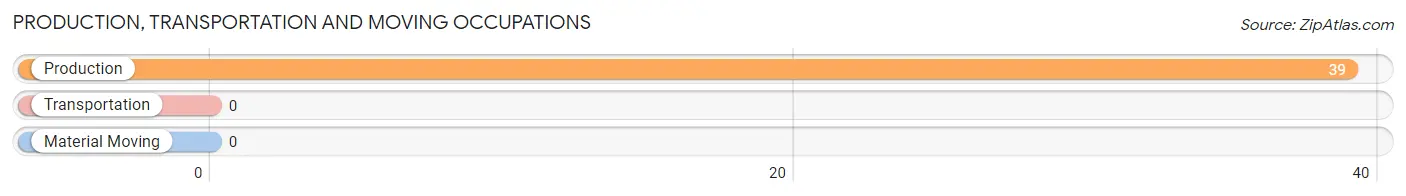
Production, Transportation and Moving Occupations by Sex
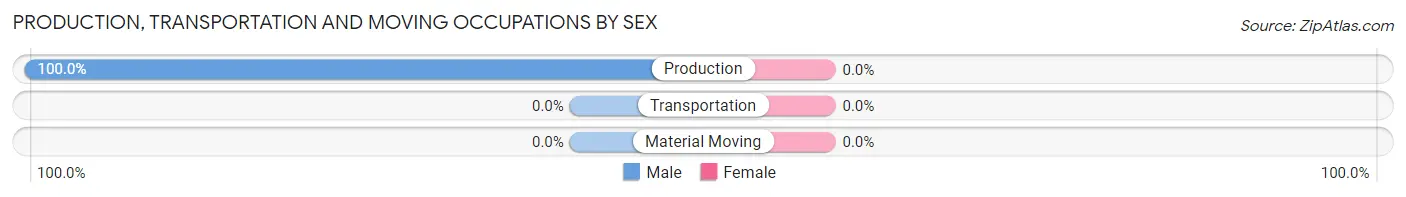
| Occupation | Male | Female |
| Production | 39 (100.0%) | 0 (0.0%) |
| Transportation | 0 (0.0%) | 0 (0.0%) |
| Material Moving | 0 (0.0%) | 0 (0.0%) |
| Total (Category) | 39 (100.0%) | 0 (0.0%) |
| Total (Overall) | 168 (82.8%) | 35 (17.2%) |
Employment Industries by Sex in Placedo
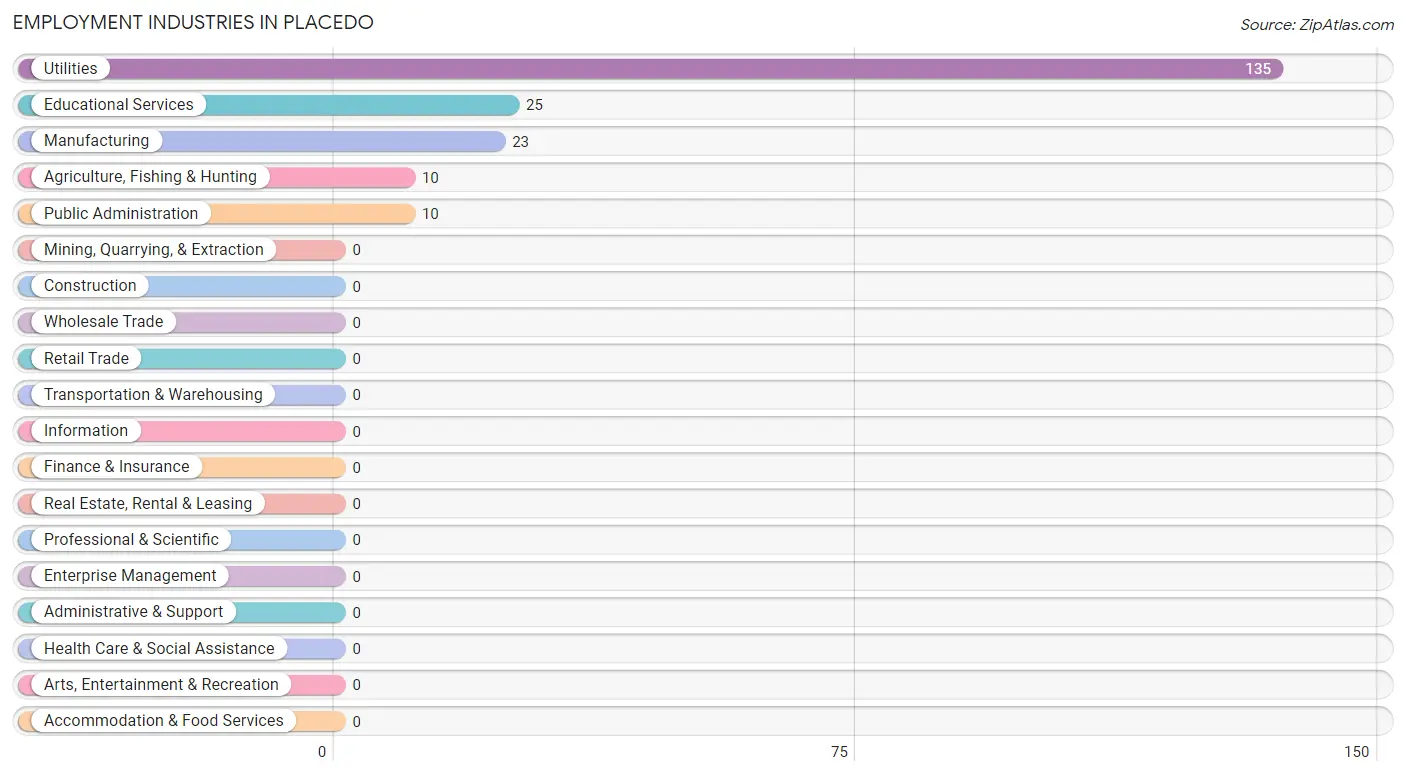
Employment Industries in Placedo
The major employment industries in Placedo include Utilities (135 | 66.5%), Educational Services (25 | 12.3%), Manufacturing (23 | 11.3%), Agriculture, Fishing & Hunting (10 | 4.9%), and Public Administration (10 | 4.9%).
Employment Industries by Sex in Placedo
The Placedo industries that see more men than women are Agriculture, Fishing & Hunting (100.0%), Manufacturing (100.0%), and Utilities (100.0%), whereas the industries that tend to have a higher number of women are Educational Services (100.0%), and Public Administration (100.0%).
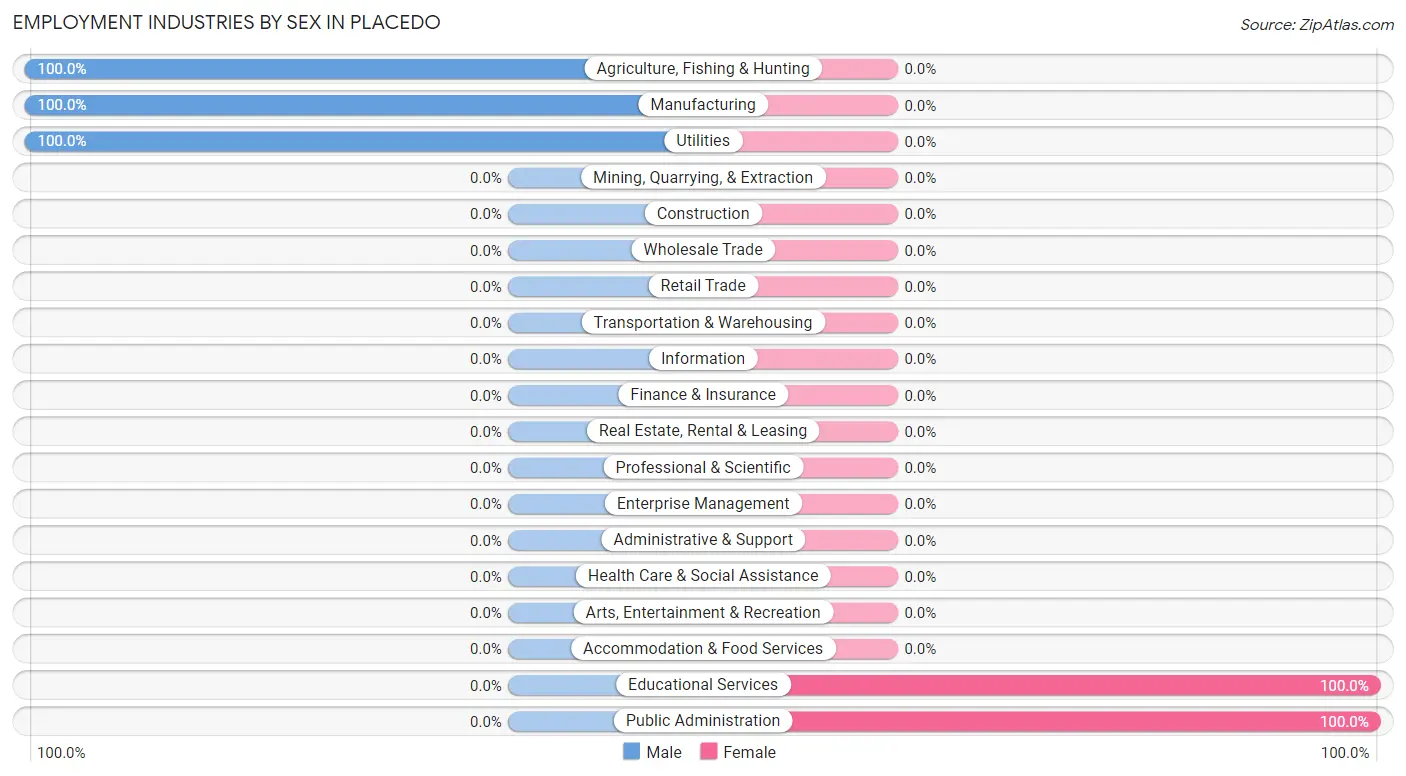
| Industry | Male | Female |
| Agriculture, Fishing & Hunting | 10 (100.0%) | 0 (0.0%) |
| Mining, Quarrying, & Extraction | 0 (0.0%) | 0 (0.0%) |
| Construction | 0 (0.0%) | 0 (0.0%) |
| Manufacturing | 23 (100.0%) | 0 (0.0%) |
| Wholesale Trade | 0 (0.0%) | 0 (0.0%) |
| Retail Trade | 0 (0.0%) | 0 (0.0%) |
| Transportation & Warehousing | 0 (0.0%) | 0 (0.0%) |
| Utilities | 135 (100.0%) | 0 (0.0%) |
| Information | 0 (0.0%) | 0 (0.0%) |
| Finance & Insurance | 0 (0.0%) | 0 (0.0%) |
| Real Estate, Rental & Leasing | 0 (0.0%) | 0 (0.0%) |
| Professional & Scientific | 0 (0.0%) | 0 (0.0%) |
| Enterprise Management | 0 (0.0%) | 0 (0.0%) |
| Administrative & Support | 0 (0.0%) | 0 (0.0%) |
| Educational Services | 0 (0.0%) | 25 (100.0%) |
| Health Care & Social Assistance | 0 (0.0%) | 0 (0.0%) |
| Arts, Entertainment & Recreation | 0 (0.0%) | 0 (0.0%) |
| Accommodation & Food Services | 0 (0.0%) | 0 (0.0%) |
| Public Administration | 0 (0.0%) | 10 (100.0%) |
| Total | 168 (82.8%) | 35 (17.2%) |
Education in Placedo
School Enrollment in Placedo
The most common levels of schooling among the 166 students in Placedo are high school (102 | 61.5%), elementary school (38 | 22.9%), and middle school (26 | 15.7%).
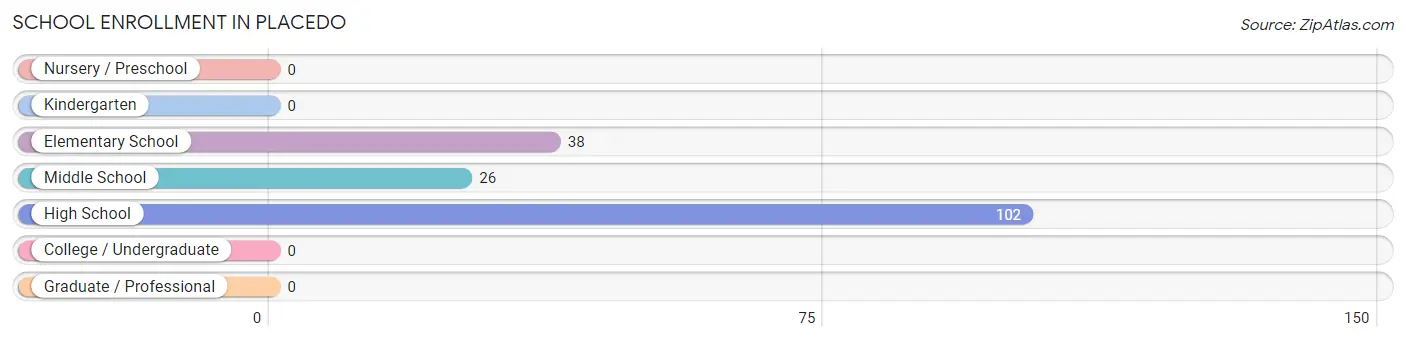
| School Level | # Students | % Students |
| Nursery / Preschool | 0 | 0.0% |
| Kindergarten | 0 | 0.0% |
| Elementary School | 38 | 22.9% |
| Middle School | 26 | 15.7% |
| High School | 102 | 61.5% |
| College / Undergraduate | 0 | 0.0% |
| Graduate / Professional | 0 | 0.0% |
| Total | 166 | 100.0% |
School Enrollment by Age by Funding Source in Placedo
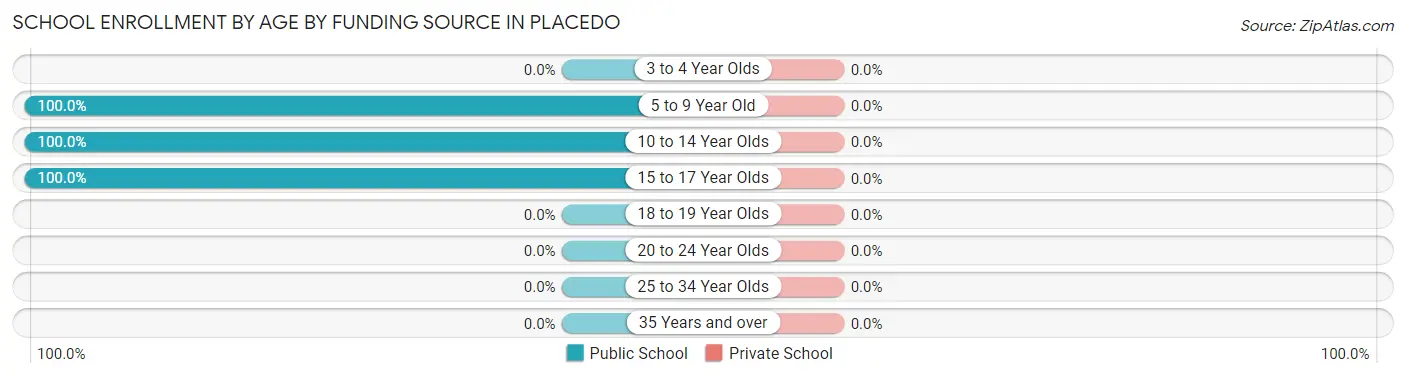
| Age Bracket | Public School | Private School |
| 3 to 4 Year Olds | 0 (0.0%) | 0 (0.0%) |
| 5 to 9 Year Old | 11 (100.0%) | 0 (0.0%) |
| 10 to 14 Year Olds | 53 (100.0%) | 0 (0.0%) |
| 15 to 17 Year Olds | 102 (100.0%) | 0 (0.0%) |
| 18 to 19 Year Olds | 0 (0.0%) | 0 (0.0%) |
| 20 to 24 Year Olds | 0 (0.0%) | 0 (0.0%) |
| 25 to 34 Year Olds | 0 (0.0%) | 0 (0.0%) |
| 35 Years and over | 0 (0.0%) | 0 (0.0%) |
| Total | 166 (100.0%) | 0 (0.0%) |
Educational Attainment by Field of Study in Placedo
, and visual & performing arts (19 | 100.0%) are the most common fields of study among 19 individuals in Placedo who have obtained a bachelor's degree or higher.
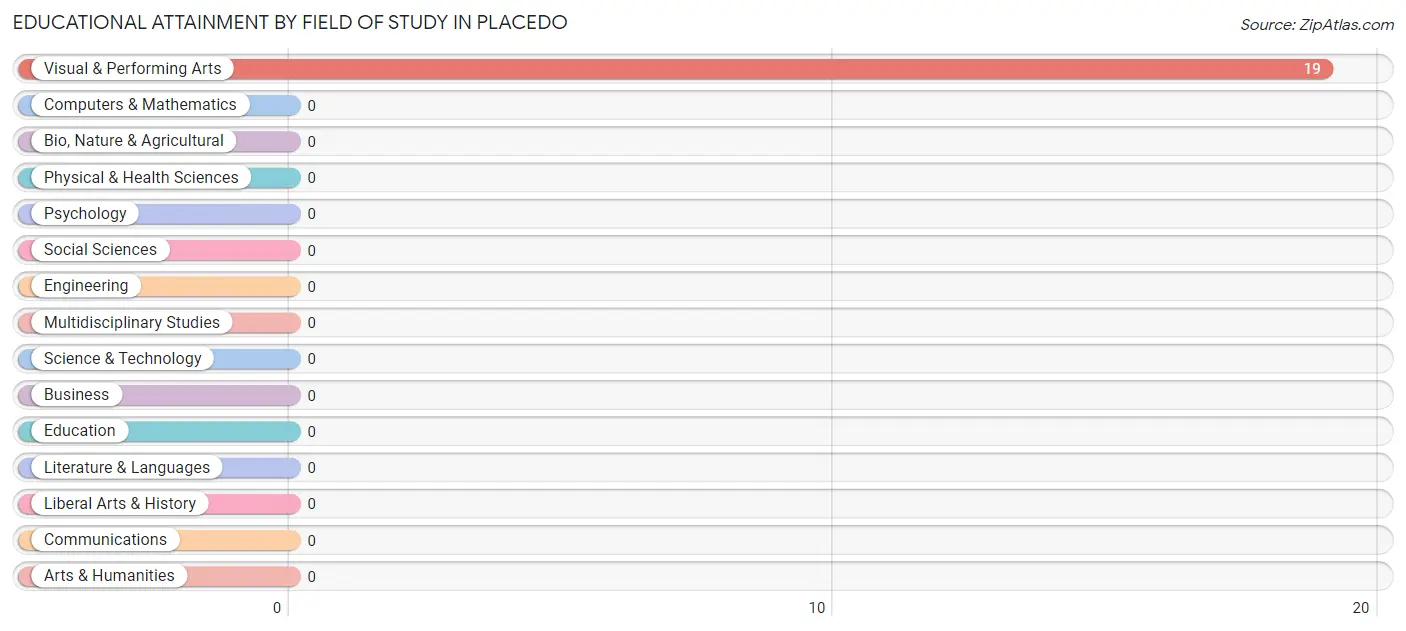
| Field of Study | # Graduates | % Graduates |
| Computers & Mathematics | 0 | 0.0% |
| Bio, Nature & Agricultural | 0 | 0.0% |
| Physical & Health Sciences | 0 | 0.0% |
| Psychology | 0 | 0.0% |
| Social Sciences | 0 | 0.0% |
| Engineering | 0 | 0.0% |
| Multidisciplinary Studies | 0 | 0.0% |
| Science & Technology | 0 | 0.0% |
| Business | 0 | 0.0% |
| Education | 0 | 0.0% |
| Literature & Languages | 0 | 0.0% |
| Liberal Arts & History | 0 | 0.0% |
| Visual & Performing Arts | 19 | 100.0% |
| Communications | 0 | 0.0% |
| Arts & Humanities | 0 | 0.0% |
| Total | 19 | 100.0% |
Transportation & Commute in Placedo
Vehicle Availability by Sex in Placedo
The most prevalent vehicle ownership categories in Placedo are males with 1 vehicle (135, accounting for 80.4%) and females with 1 vehicle (10, making up 385.7%).
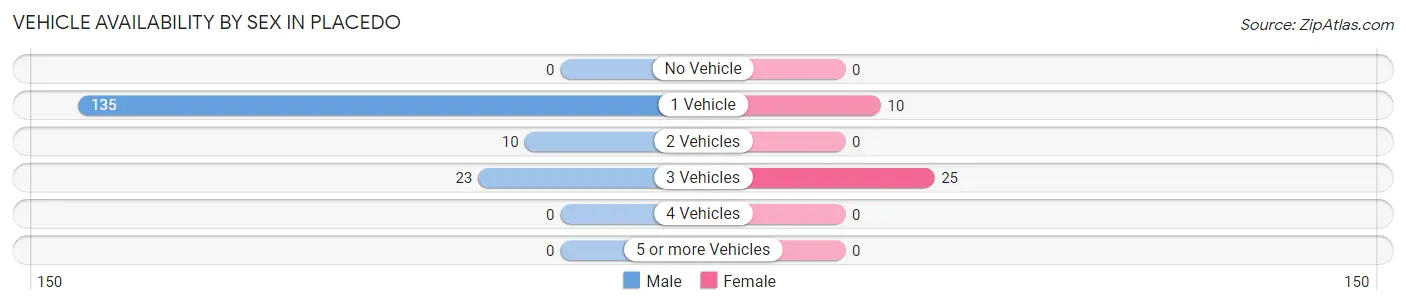
| Vehicles Available | Male | Female |
| No Vehicle | 0 (0.0%) | 0 (0.0%) |
| 1 Vehicle | 135 (80.4%) | 10 (28.6%) |
| 2 Vehicles | 10 (5.9%) | 0 (0.0%) |
| 3 Vehicles | 23 (13.7%) | 25 (71.4%) |
| 4 Vehicles | 0 (0.0%) | 0 (0.0%) |
| 5 or more Vehicles | 0 (0.0%) | 0 (0.0%) |
| Total | 168 (100.0%) | 35 (100.0%) |
Commute Time in Placedo
The most frequently occuring commute durations in Placedo are 10 to 14 minutes (119 commuters, 58.6%), 15 to 19 minutes (49 commuters, 24.1%), and less than 5 minutes (25 commuters, 12.3%).
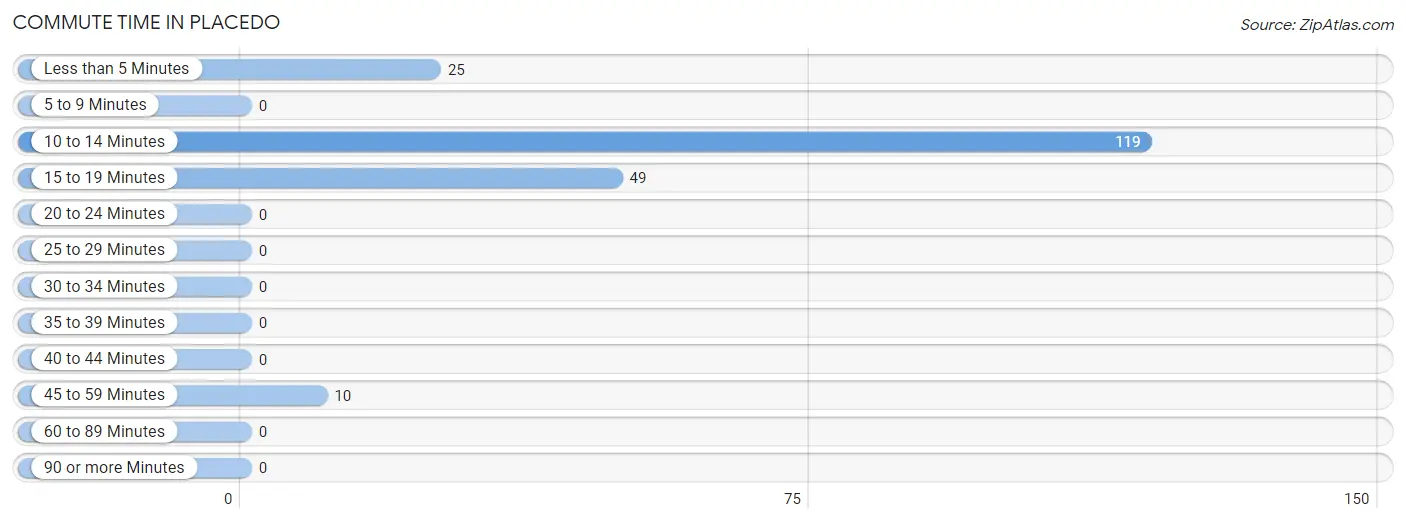
| Commute Time | # Commuters | % Commuters |
| Less than 5 Minutes | 25 | 12.3% |
| 5 to 9 Minutes | 0 | 0.0% |
| 10 to 14 Minutes | 119 | 58.6% |
| 15 to 19 Minutes | 49 | 24.1% |
| 20 to 24 Minutes | 0 | 0.0% |
| 25 to 29 Minutes | 0 | 0.0% |
| 30 to 34 Minutes | 0 | 0.0% |
| 35 to 39 Minutes | 0 | 0.0% |
| 40 to 44 Minutes | 0 | 0.0% |
| 45 to 59 Minutes | 10 | 4.9% |
| 60 to 89 Minutes | 0 | 0.0% |
| 90 or more Minutes | 0 | 0.0% |
Commute Time by Sex in Placedo
The most common commute times in Placedo are 10 to 14 minutes (119 commuters, 70.8%) for males and less than 5 minutes (25 commuters, 71.4%) for females.
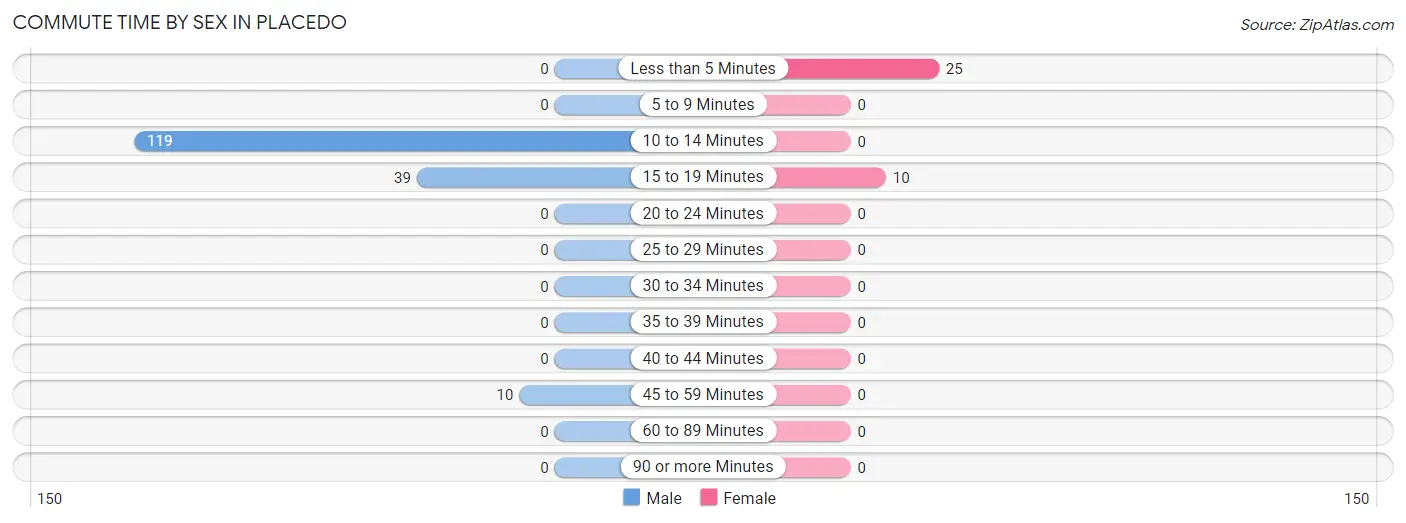
| Commute Time | Male | Female |
| Less than 5 Minutes | 0 (0.0%) | 25 (71.4%) |
| 5 to 9 Minutes | 0 (0.0%) | 0 (0.0%) |
| 10 to 14 Minutes | 119 (70.8%) | 0 (0.0%) |
| 15 to 19 Minutes | 39 (23.2%) | 10 (28.6%) |
| 20 to 24 Minutes | 0 (0.0%) | 0 (0.0%) |
| 25 to 29 Minutes | 0 (0.0%) | 0 (0.0%) |
| 30 to 34 Minutes | 0 (0.0%) | 0 (0.0%) |
| 35 to 39 Minutes | 0 (0.0%) | 0 (0.0%) |
| 40 to 44 Minutes | 0 (0.0%) | 0 (0.0%) |
| 45 to 59 Minutes | 10 (5.9%) | 0 (0.0%) |
| 60 to 89 Minutes | 0 (0.0%) | 0 (0.0%) |
| 90 or more Minutes | 0 (0.0%) | 0 (0.0%) |
Time of Departure to Work by Sex in Placedo
The most frequent times of departure to work in Placedo are 7:00 AM to 7:29 AM (145, 86.3%) for males and 6:00 AM to 6:29 AM (25, 71.4%) for females.
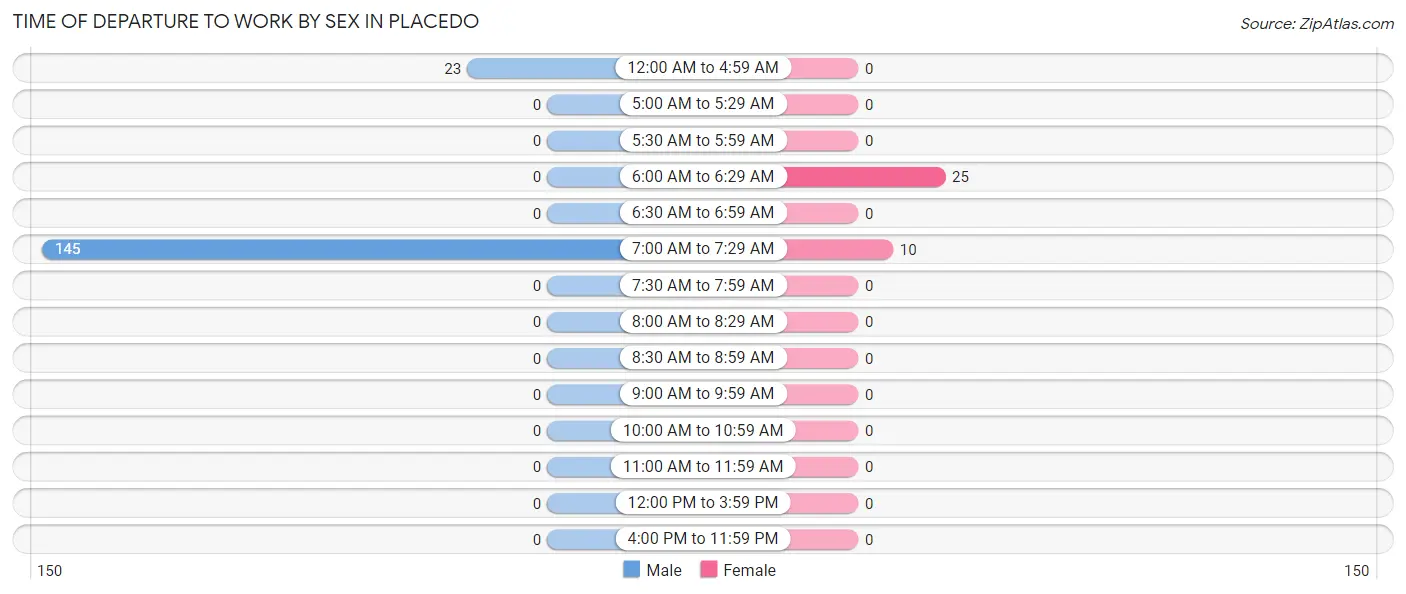
| Time of Departure | Male | Female |
| 12:00 AM to 4:59 AM | 23 (13.7%) | 0 (0.0%) |
| 5:00 AM to 5:29 AM | 0 (0.0%) | 0 (0.0%) |
| 5:30 AM to 5:59 AM | 0 (0.0%) | 0 (0.0%) |
| 6:00 AM to 6:29 AM | 0 (0.0%) | 25 (71.4%) |
| 6:30 AM to 6:59 AM | 0 (0.0%) | 0 (0.0%) |
| 7:00 AM to 7:29 AM | 145 (86.3%) | 10 (28.6%) |
| 7:30 AM to 7:59 AM | 0 (0.0%) | 0 (0.0%) |
| 8:00 AM to 8:29 AM | 0 (0.0%) | 0 (0.0%) |
| 8:30 AM to 8:59 AM | 0 (0.0%) | 0 (0.0%) |
| 9:00 AM to 9:59 AM | 0 (0.0%) | 0 (0.0%) |
| 10:00 AM to 10:59 AM | 0 (0.0%) | 0 (0.0%) |
| 11:00 AM to 11:59 AM | 0 (0.0%) | 0 (0.0%) |
| 12:00 PM to 3:59 PM | 0 (0.0%) | 0 (0.0%) |
| 4:00 PM to 11:59 PM | 0 (0.0%) | 0 (0.0%) |
| Total | 168 (100.0%) | 35 (100.0%) |
Housing Occupancy in Placedo
Occupancy by Ownership in Placedo
Of the total 228 dwellings in Placedo, owner-occupied units account for 212 (93.0%), while renter-occupied units make up 16 (7.0%).
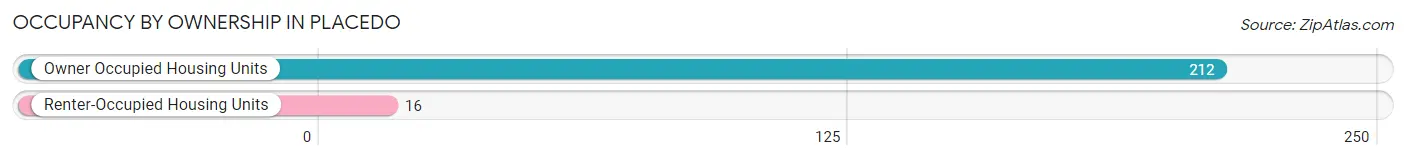
| Occupancy | # Housing Units | % Housing Units |
| Owner Occupied Housing Units | 212 | 93.0% |
| Renter-Occupied Housing Units | 16 | 7.0% |
| Total Occupied Housing Units | 228 | 100.0% |
Occupancy by Household Size in Placedo
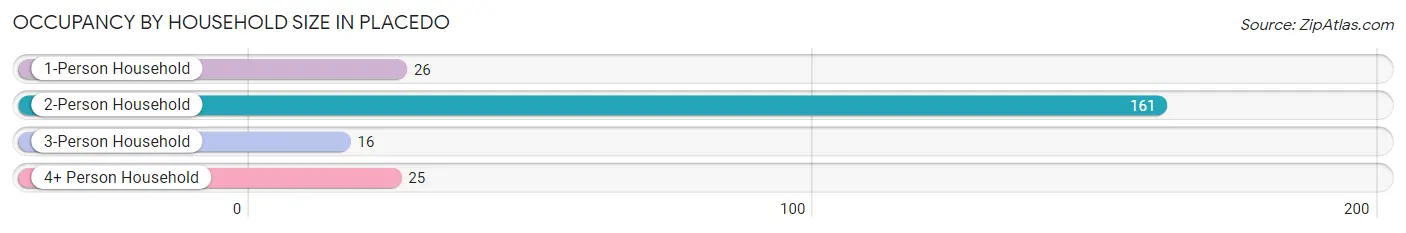
| Household Size | # Housing Units | % Housing Units |
| 1-Person Household | 26 | 11.4% |
| 2-Person Household | 161 | 70.6% |
| 3-Person Household | 16 | 7.0% |
| 4+ Person Household | 25 | 11.0% |
| Total Housing Units | 228 | 100.0% |
Occupancy by Ownership by Household Size in Placedo
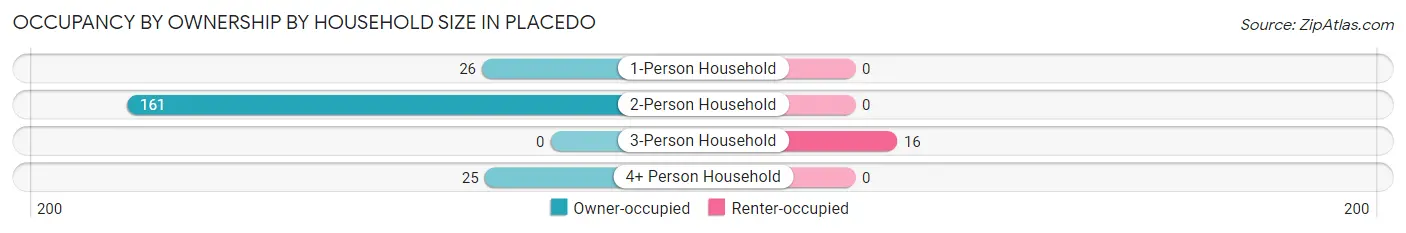
| Household Size | Owner-occupied | Renter-occupied |
| 1-Person Household | 26 (100.0%) | 0 (0.0%) |
| 2-Person Household | 161 (100.0%) | 0 (0.0%) |
| 3-Person Household | 0 (0.0%) | 16 (100.0%) |
| 4+ Person Household | 25 (100.0%) | 0 (0.0%) |
| Total Housing Units | 212 (93.0%) | 16 (7.0%) |
Occupancy by Educational Attainment in Placedo
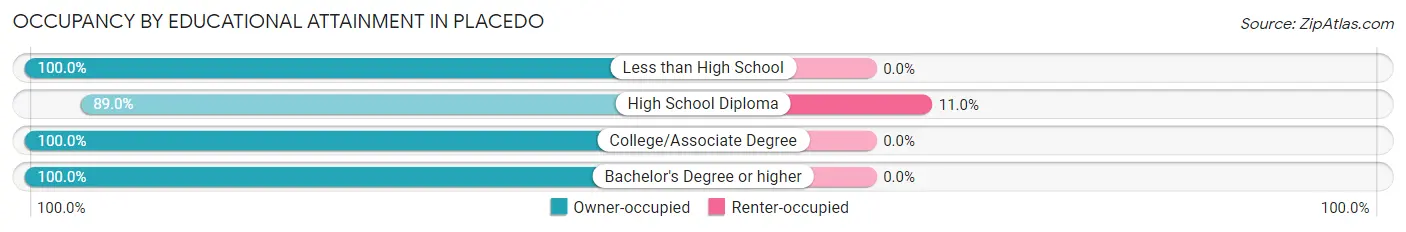
| Household Size | Owner-occupied | Renter-occupied |
| Less than High School | 39 (100.0%) | 0 (0.0%) |
| High School Diploma | 129 (89.0%) | 16 (11.0%) |
| College/Associate Degree | 25 (100.0%) | 0 (0.0%) |
| Bachelor's Degree or higher | 19 (100.0%) | 0 (0.0%) |
Occupancy by Age of Householder in Placedo
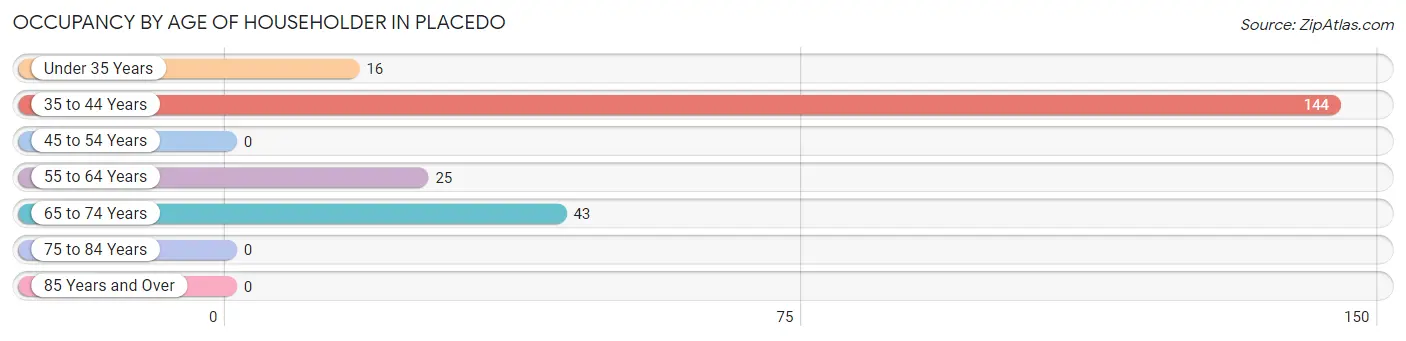
| Age Bracket | # Households | % Households |
| Under 35 Years | 16 | 7.0% |
| 35 to 44 Years | 144 | 63.2% |
| 45 to 54 Years | 0 | 0.0% |
| 55 to 64 Years | 25 | 11.0% |
| 65 to 74 Years | 43 | 18.9% |
| 75 to 84 Years | 0 | 0.0% |
| 85 Years and Over | 0 | 0.0% |
| Total | 228 | 100.0% |
Housing Finances in Placedo
Median Income by Occupancy in Placedo
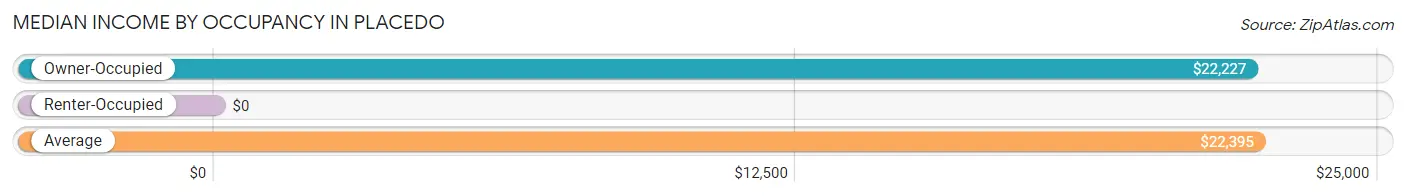
| Occupancy Type | # Households | Median Income |
| Owner-Occupied | 212 (93.0%) | $22,227 |
| Renter-Occupied | 16 (7.0%) | $0 |
| Average | 228 (100.0%) | $22,395 |
Occupancy by Householder Income Bracket in Placedo
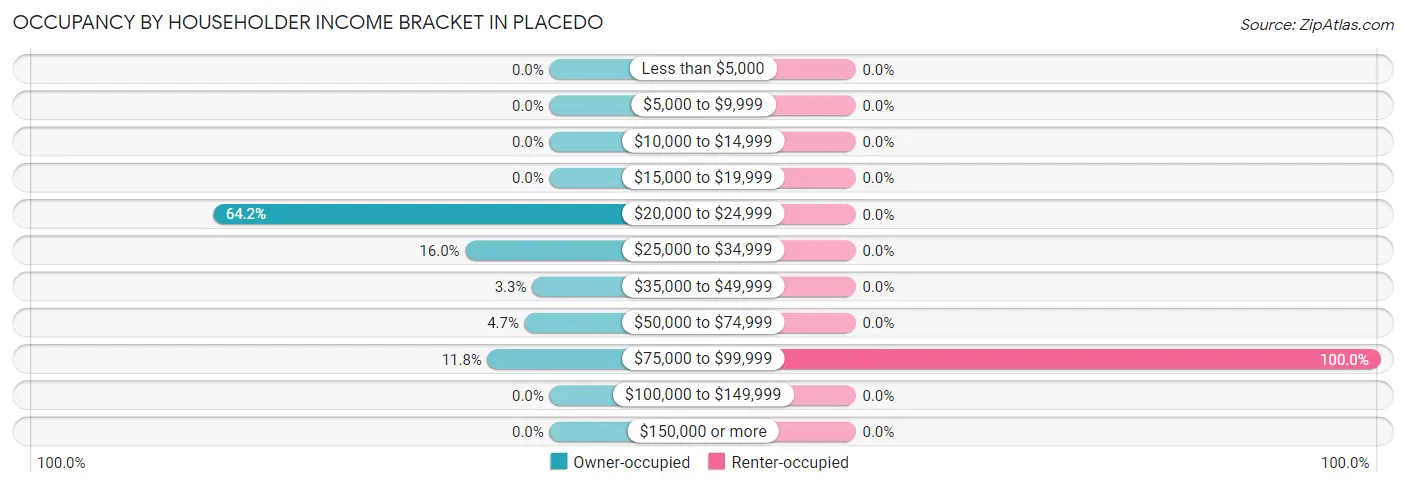
| Income Bracket | Owner-occupied | Renter-occupied |
| Less than $5,000 | 0 (0.0%) | 0 (0.0%) |
| $5,000 to $9,999 | 0 (0.0%) | 0 (0.0%) |
| $10,000 to $14,999 | 0 (0.0%) | 0 (0.0%) |
| $15,000 to $19,999 | 0 (0.0%) | 0 (0.0%) |
| $20,000 to $24,999 | 136 (64.1%) | 0 (0.0%) |
| $25,000 to $34,999 | 34 (16.0%) | 0 (0.0%) |
| $35,000 to $49,999 | 7 (3.3%) | 0 (0.0%) |
| $50,000 to $74,999 | 10 (4.7%) | 0 (0.0%) |
| $75,000 to $99,999 | 25 (11.8%) | 16 (100.0%) |
| $100,000 to $149,999 | 0 (0.0%) | 0 (0.0%) |
| $150,000 or more | 0 (0.0%) | 0 (0.0%) |
| Total | 212 (100.0%) | 16 (100.0%) |
Monthly Housing Cost Tiers in Placedo
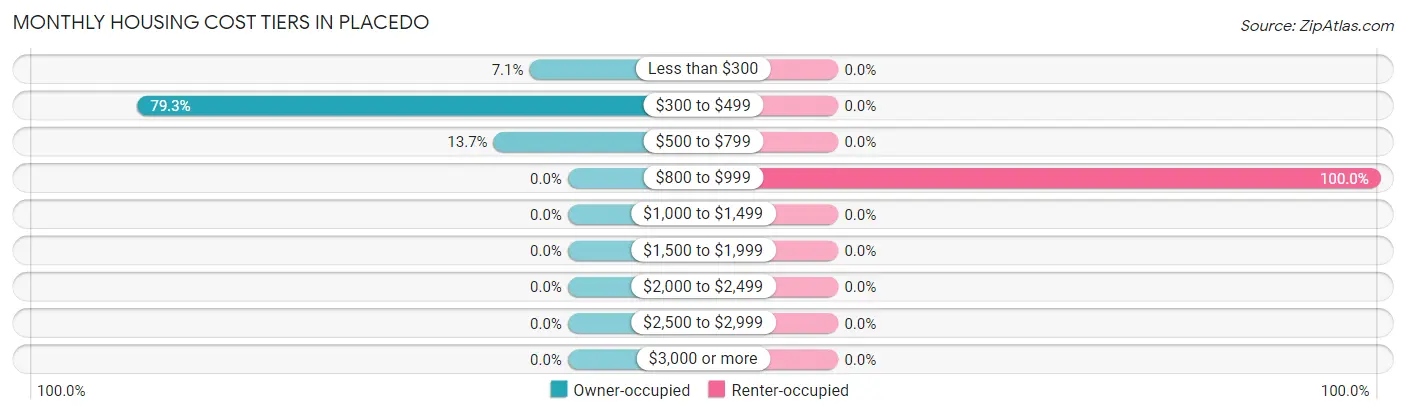
| Monthly Cost | Owner-occupied | Renter-occupied |
| Less than $300 | 15 (7.1%) | 0 (0.0%) |
| $300 to $499 | 168 (79.2%) | 0 (0.0%) |
| $500 to $799 | 29 (13.7%) | 0 (0.0%) |
| $800 to $999 | 0 (0.0%) | 16 (100.0%) |
| $1,000 to $1,499 | 0 (0.0%) | 0 (0.0%) |
| $1,500 to $1,999 | 0 (0.0%) | 0 (0.0%) |
| $2,000 to $2,499 | 0 (0.0%) | 0 (0.0%) |
| $2,500 to $2,999 | 0 (0.0%) | 0 (0.0%) |
| $3,000 or more | 0 (0.0%) | 0 (0.0%) |
| Total | 212 (100.0%) | 16 (100.0%) |
Physical Housing Characteristics in Placedo
Housing Structures in Placedo
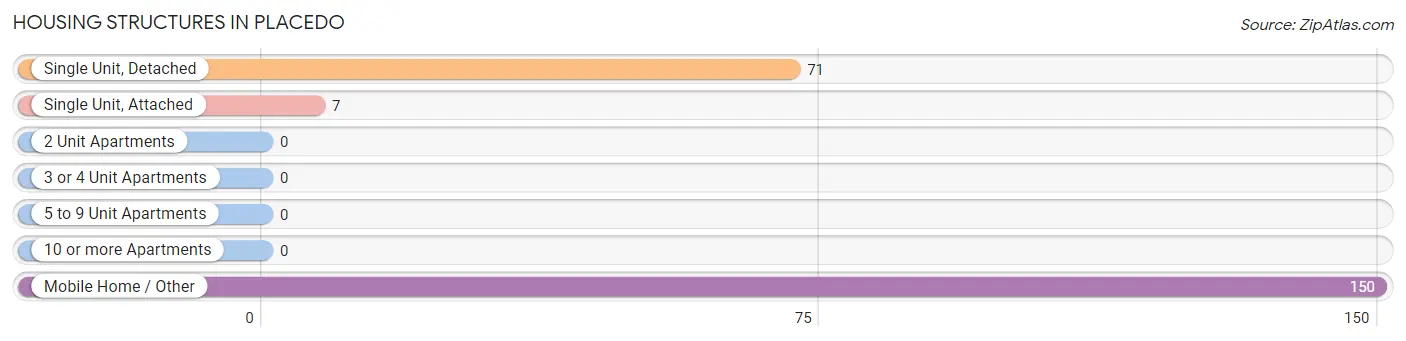
| Structure Type | # Housing Units | % Housing Units |
| Single Unit, Detached | 71 | 31.1% |
| Single Unit, Attached | 7 | 3.1% |
| 2 Unit Apartments | 0 | 0.0% |
| 3 or 4 Unit Apartments | 0 | 0.0% |
| 5 to 9 Unit Apartments | 0 | 0.0% |
| 10 or more Apartments | 0 | 0.0% |
| Mobile Home / Other | 150 | 65.8% |
| Total | 228 | 100.0% |
Housing Structures by Occupancy in Placedo
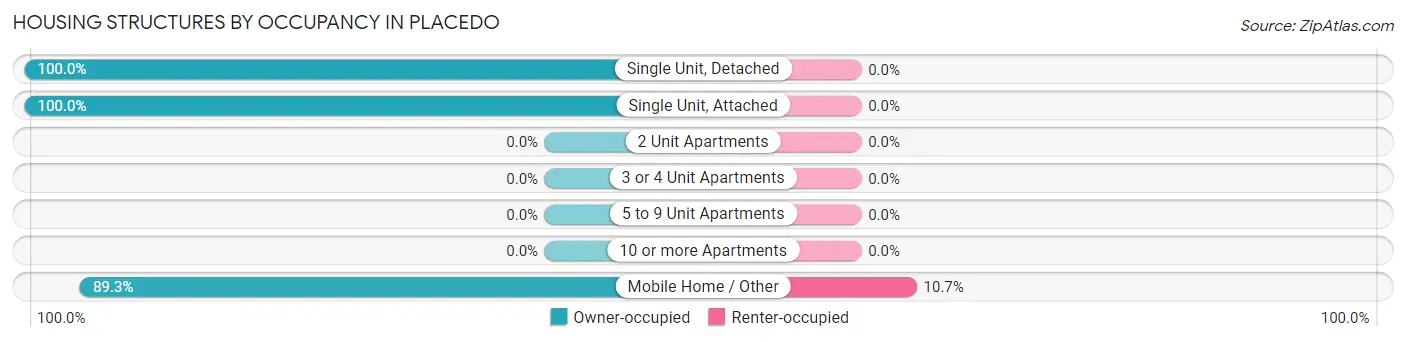
| Structure Type | Owner-occupied | Renter-occupied |
| Single Unit, Detached | 71 (100.0%) | 0 (0.0%) |
| Single Unit, Attached | 7 (100.0%) | 0 (0.0%) |
| 2 Unit Apartments | 0 (0.0%) | 0 (0.0%) |
| 3 or 4 Unit Apartments | 0 (0.0%) | 0 (0.0%) |
| 5 to 9 Unit Apartments | 0 (0.0%) | 0 (0.0%) |
| 10 or more Apartments | 0 (0.0%) | 0 (0.0%) |
| Mobile Home / Other | 134 (89.3%) | 16 (10.7%) |
| Total | 212 (93.0%) | 16 (7.0%) |
Housing Structures by Number of Rooms in Placedo
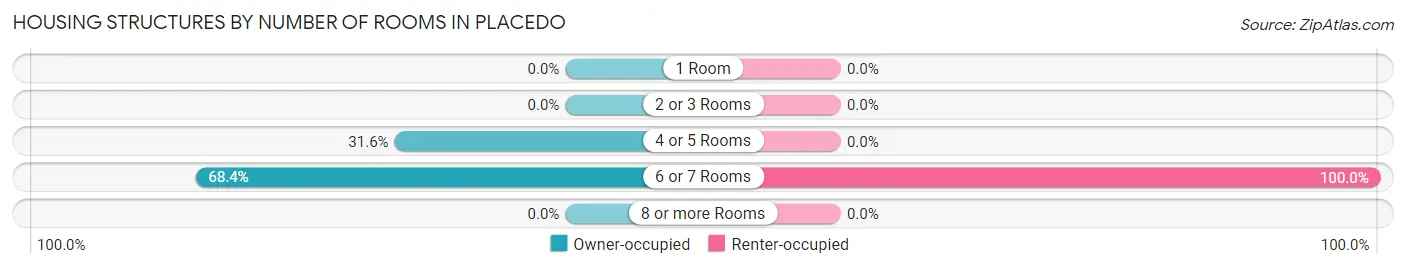
| Number of Rooms | Owner-occupied | Renter-occupied |
| 1 Room | 0 (0.0%) | 0 (0.0%) |
| 2 or 3 Rooms | 0 (0.0%) | 0 (0.0%) |
| 4 or 5 Rooms | 67 (31.6%) | 0 (0.0%) |
| 6 or 7 Rooms | 145 (68.4%) | 16 (100.0%) |
| 8 or more Rooms | 0 (0.0%) | 0 (0.0%) |
| Total | 212 (100.0%) | 16 (100.0%) |
Housing Structure by Heating Type in Placedo
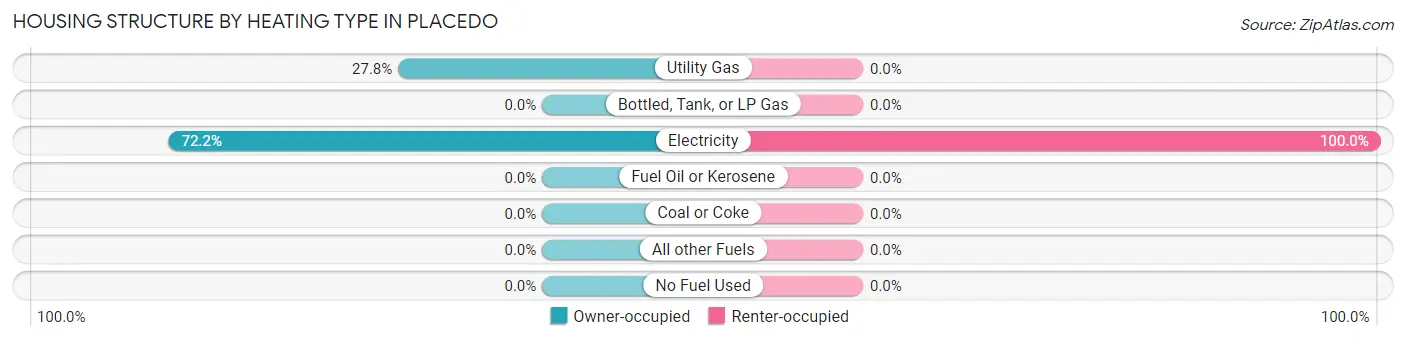
| Heating Type | Owner-occupied | Renter-occupied |
| Utility Gas | 59 (27.8%) | 0 (0.0%) |
| Bottled, Tank, or LP Gas | 0 (0.0%) | 0 (0.0%) |
| Electricity | 153 (72.2%) | 16 (100.0%) |
| Fuel Oil or Kerosene | 0 (0.0%) | 0 (0.0%) |
| Coal or Coke | 0 (0.0%) | 0 (0.0%) |
| All other Fuels | 0 (0.0%) | 0 (0.0%) |
| No Fuel Used | 0 (0.0%) | 0 (0.0%) |
| Total | 212 (100.0%) | 16 (100.0%) |
Household Vehicle Usage in Placedo
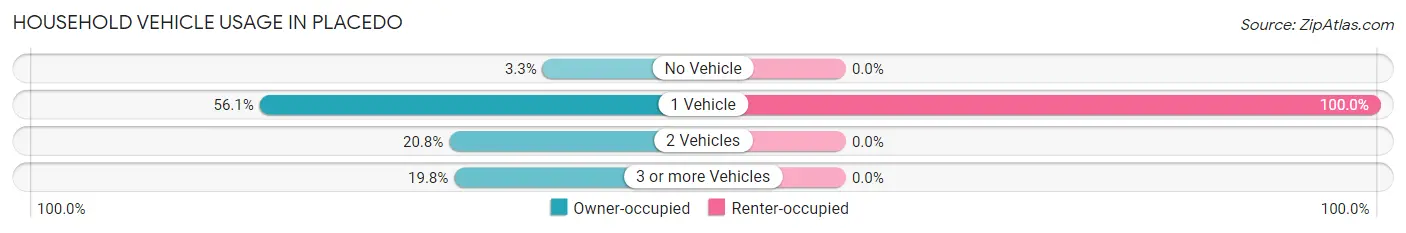
| Vehicles per Household | Owner-occupied | Renter-occupied |
| No Vehicle | 7 (3.3%) | 0 (0.0%) |
| 1 Vehicle | 119 (56.1%) | 16 (100.0%) |
| 2 Vehicles | 44 (20.7%) | 0 (0.0%) |
| 3 or more Vehicles | 42 (19.8%) | 0 (0.0%) |
| Total | 212 (100.0%) | 16 (100.0%) |
Real Estate & Mortgages in Placedo
Real Estate and Mortgage Overview in Placedo
| Characteristic | Without Mortgage | With Mortgage |
| Housing Units | 212 | 0 |
| Median Property Value | $44,100 | $0 |
| Median Household Income | $22,227 | $0 |
| Monthly Housing Costs | $332 | $0 |
| Real Estate Taxes | $199 | $0 |
Property Value by Mortgage Status in Placedo
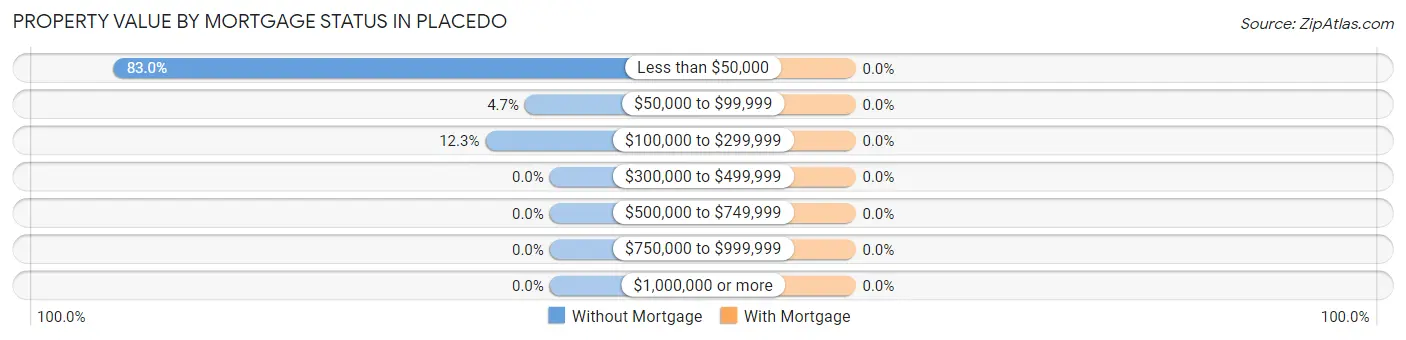
| Property Value | Without Mortgage | With Mortgage |
| Less than $50,000 | 176 (83.0%) | 0 (0.0%) |
| $50,000 to $99,999 | 10 (4.7%) | 0 (0.0%) |
| $100,000 to $299,999 | 26 (12.3%) | 0 (0.0%) |
| $300,000 to $499,999 | 0 (0.0%) | 0 (0.0%) |
| $500,000 to $749,999 | 0 (0.0%) | 0 (0.0%) |
| $750,000 to $999,999 | 0 (0.0%) | 0 (0.0%) |
| $1,000,000 or more | 0 (0.0%) | 0 (0.0%) |
| Total | 212 (100.0%) | 0 (0.0%) |
Household Income by Mortgage Status in Placedo
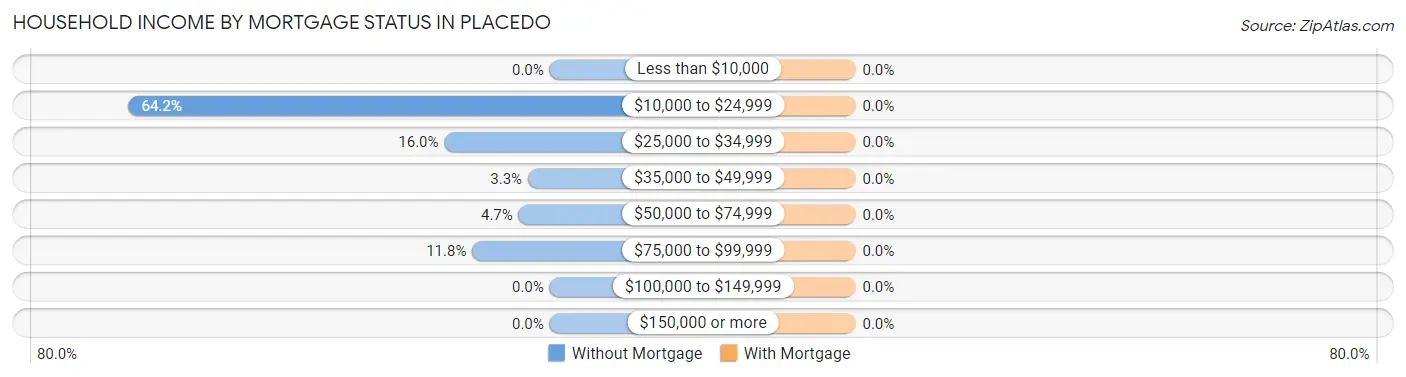
| Household Income | Without Mortgage | With Mortgage |
| Less than $10,000 | 0 (0.0%) | 0 (0.0%) |
| $10,000 to $24,999 | 136 (64.1%) | 0 (0.0%) |
| $25,000 to $34,999 | 34 (16.0%) | 0 (0.0%) |
| $35,000 to $49,999 | 7 (3.3%) | 0 (0.0%) |
| $50,000 to $74,999 | 10 (4.7%) | 0 (0.0%) |
| $75,000 to $99,999 | 25 (11.8%) | 0 (0.0%) |
| $100,000 to $149,999 | 0 (0.0%) | 0 (0.0%) |
| $150,000 or more | 0 (0.0%) | 0 (0.0%) |
| Total | 212 (100.0%) | 0 (0.0%) |
Property Value to Household Income Ratio in Placedo
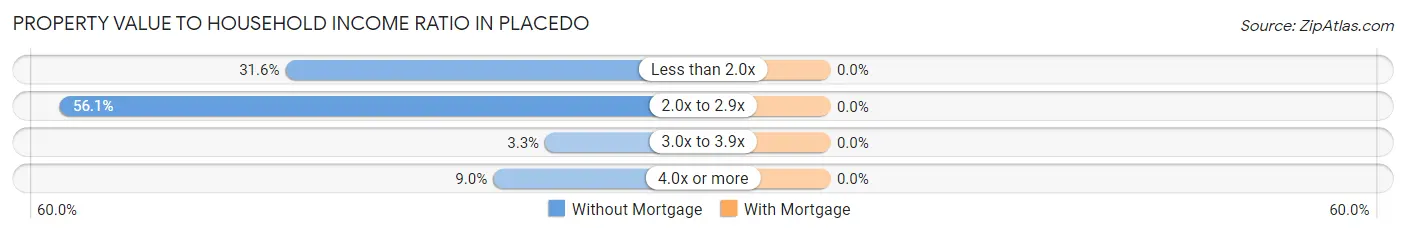
| Value-to-Income Ratio | Without Mortgage | With Mortgage |
| Less than 2.0x | 67 (31.6%) | 0 (0.0%) |
| 2.0x to 2.9x | 119 (56.1%) | 0 (0.0%) |
| 3.0x to 3.9x | 7 (3.3%) | 0 (0.0%) |
| 4.0x or more | 19 (9.0%) | 0 (0.0%) |
| Total | 212 (100.0%) | 0 (0.0%) |
Real Estate Taxes by Mortgage Status in Placedo
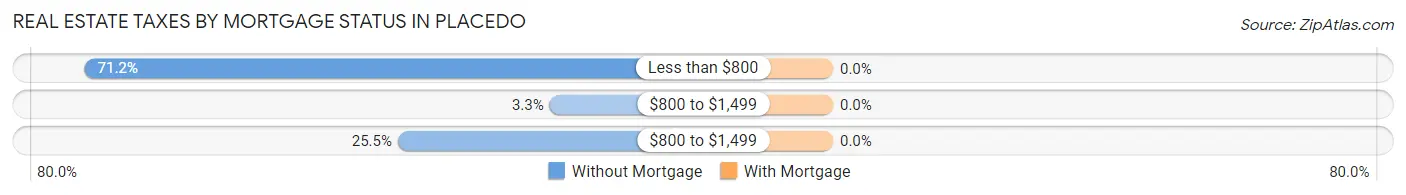
| Property Taxes | Without Mortgage | With Mortgage |
| Less than $800 | 151 (71.2%) | 0 (0.0%) |
| $800 to $1,499 | 7 (3.3%) | 0 (0.0%) |
| $800 to $1,499 | 54 (25.5%) | 0 (0.0%) |
| Total | 212 (100.0%) | 0 (0.0%) |
Health & Disability in Placedo
Health Insurance Coverage by Age in Placedo
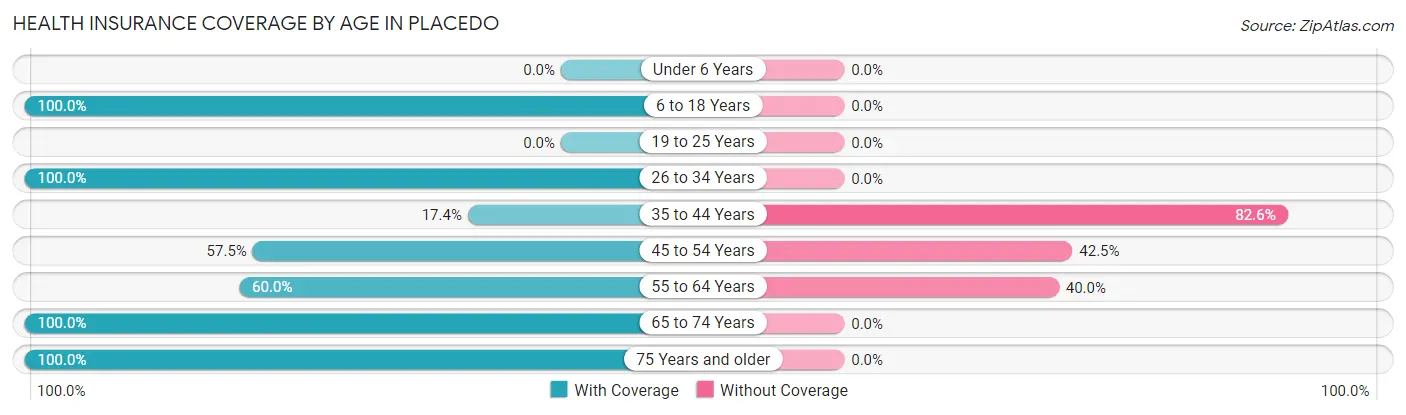
| Age Bracket | With Coverage | Without Coverage |
| Under 6 Years | 0 (0.0%) | 0 (0.0%) |
| 6 to 18 Years | 166 (100.0%) | 0 (0.0%) |
| 19 to 25 Years | 0 (0.0%) | 0 (0.0%) |
| 26 to 34 Years | 26 (100.0%) | 0 (0.0%) |
| 35 to 44 Years | 25 (17.4%) | 119 (82.6%) |
| 45 to 54 Years | 50 (57.5%) | 37 (42.5%) |
| 55 to 64 Years | 15 (60.0%) | 10 (40.0%) |
| 65 to 74 Years | 60 (100.0%) | 0 (0.0%) |
| 75 Years and older | 8 (100.0%) | 0 (0.0%) |
| Total | 350 (67.8%) | 166 (32.2%) |
Health Insurance Coverage by Citizenship Status in Placedo

| Citizenship Status | With Coverage | Without Coverage |
| Native Born | 0 (0.0%) | 0 (0.0%) |
| Foreign Born, Citizen | 166 (100.0%) | 0 (0.0%) |
| Foreign Born, not a Citizen | 0 (0.0%) | 0 (0.0%) |
Health Insurance Coverage by Household Income in Placedo
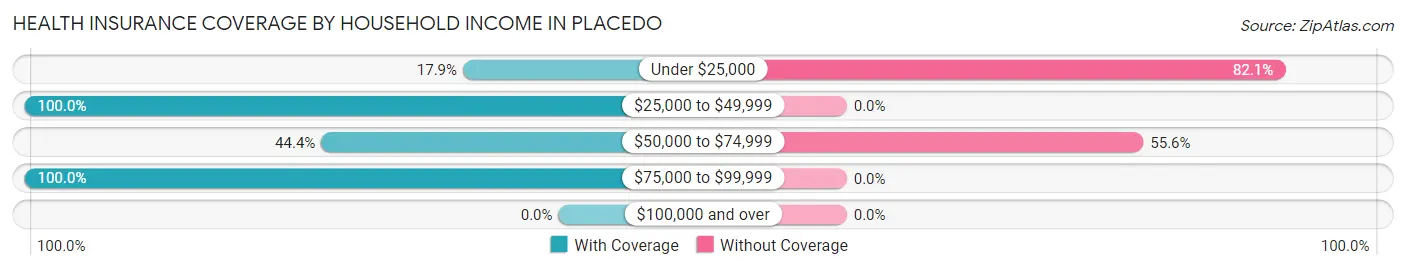
| Household Income | With Coverage | Without Coverage |
| Under $25,000 | 34 (17.9%) | 156 (82.1%) |
| $25,000 to $49,999 | 68 (100.0%) | 0 (0.0%) |
| $50,000 to $74,999 | 8 (44.4%) | 10 (55.6%) |
| $75,000 to $99,999 | 240 (100.0%) | 0 (0.0%) |
| $100,000 and over | 0 (0.0%) | 0 (0.0%) |
Public vs Private Health Insurance Coverage by Age in Placedo
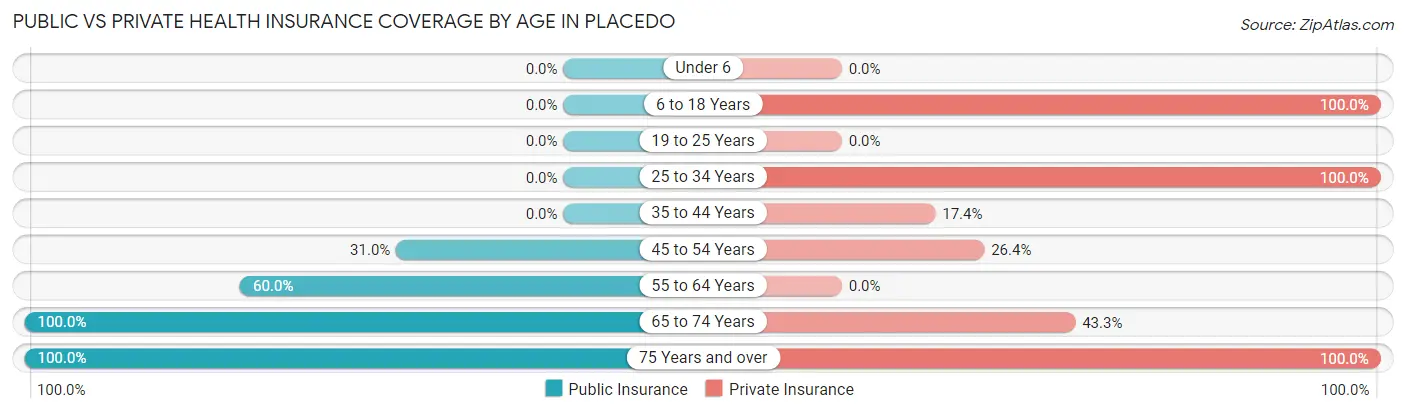
| Age Bracket | Public Insurance | Private Insurance |
| Under 6 | 0 (0.0%) | 0 (0.0%) |
| 6 to 18 Years | 0 (0.0%) | 166 (100.0%) |
| 19 to 25 Years | 0 (0.0%) | 0 (0.0%) |
| 25 to 34 Years | 0 (0.0%) | 26 (100.0%) |
| 35 to 44 Years | 0 (0.0%) | 25 (17.4%) |
| 45 to 54 Years | 27 (31.0%) | 23 (26.4%) |
| 55 to 64 Years | 15 (60.0%) | 0 (0.0%) |
| 65 to 74 Years | 60 (100.0%) | 26 (43.3%) |
| 75 Years and over | 8 (100.0%) | 8 (100.0%) |
| Total | 110 (21.3%) | 274 (53.1%) |
Disability Status by Sex by Age in Placedo
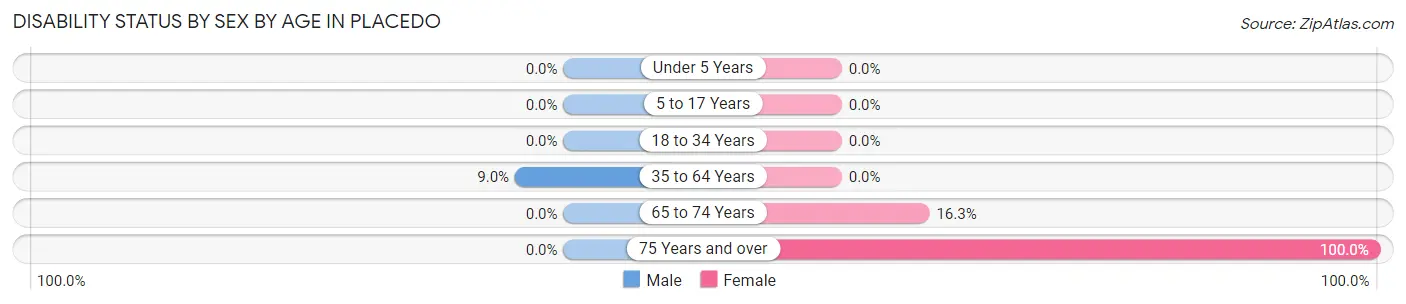
| Age Bracket | Male | Female |
| Under 5 Years | 0 (0.0%) | 0 (0.0%) |
| 5 to 17 Years | 0 (0.0%) | 0 (0.0%) |
| 18 to 34 Years | 0 (0.0%) | 0 (0.0%) |
| 35 to 64 Years | 15 (9.0%) | 0 (0.0%) |
| 65 to 74 Years | 0 (0.0%) | 7 (16.3%) |
| 75 Years and over | 0 (0.0%) | 8 (100.0%) |
Disability Class by Sex by Age in Placedo
Disability Class: Hearing Difficulty

| Age Bracket | Male | Female |
| Under 5 Years | 0 (0.0%) | 0 (0.0%) |
| 5 to 17 Years | 0 (0.0%) | 0 (0.0%) |
| 18 to 34 Years | 0 (0.0%) | 0 (0.0%) |
| 35 to 64 Years | 15 (9.0%) | 0 (0.0%) |
| 65 to 74 Years | 0 (0.0%) | 0 (0.0%) |
| 75 Years and over | 0 (0.0%) | 0 (0.0%) |
Disability Class: Vision Difficulty
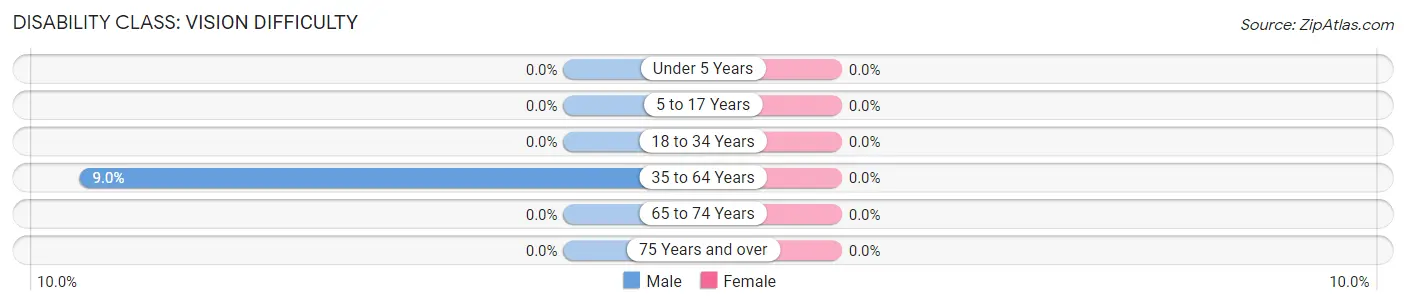
| Age Bracket | Male | Female |
| Under 5 Years | 0 (0.0%) | 0 (0.0%) |
| 5 to 17 Years | 0 (0.0%) | 0 (0.0%) |
| 18 to 34 Years | 0 (0.0%) | 0 (0.0%) |
| 35 to 64 Years | 15 (9.0%) | 0 (0.0%) |
| 65 to 74 Years | 0 (0.0%) | 0 (0.0%) |
| 75 Years and over | 0 (0.0%) | 0 (0.0%) |
Disability Class: Cognitive Difficulty
| Age Bracket | Male | Female |
| 5 to 17 Years | 0 (0.0%) | 0 (0.0%) |
| 18 to 34 Years | 0 (0.0%) | 0 (0.0%) |
| 35 to 64 Years | 0 (0.0%) | 0 (0.0%) |
| 65 to 74 Years | 0 (0.0%) | 0 (0.0%) |
| 75 Years and over | 0 (0.0%) | 0 (0.0%) |
Disability Class: Ambulatory Difficulty
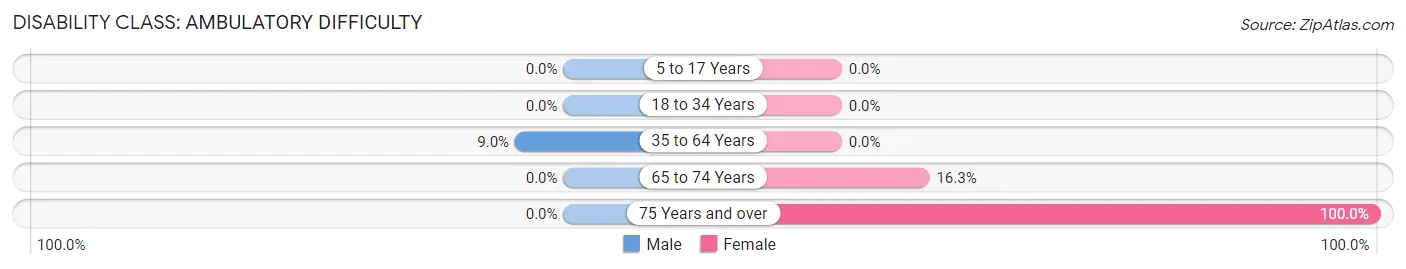
| Age Bracket | Male | Female |
| 5 to 17 Years | 0 (0.0%) | 0 (0.0%) |
| 18 to 34 Years | 0 (0.0%) | 0 (0.0%) |
| 35 to 64 Years | 15 (9.0%) | 0 (0.0%) |
| 65 to 74 Years | 0 (0.0%) | 7 (16.3%) |
| 75 Years and over | 0 (0.0%) | 8 (100.0%) |
Disability Class: Self-Care Difficulty
| Age Bracket | Male | Female |
| 5 to 17 Years | 0 (0.0%) | 0 (0.0%) |
| 18 to 34 Years | 0 (0.0%) | 0 (0.0%) |
| 35 to 64 Years | 0 (0.0%) | 0 (0.0%) |
| 65 to 74 Years | 0 (0.0%) | 0 (0.0%) |
| 75 Years and over | 0 (0.0%) | 0 (0.0%) |
Technology Access in Placedo
Computing Device Access in Placedo
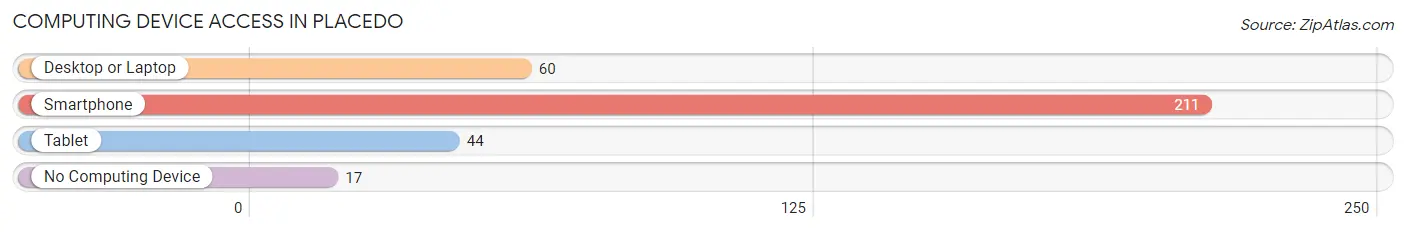
| Device Type | # Households | % Households |
| Desktop or Laptop | 60 | 26.3% |
| Smartphone | 211 | 92.5% |
| Tablet | 44 | 19.3% |
| No Computing Device | 17 | 7.5% |
| Total | 228 | 100.0% |
Internet Access in Placedo
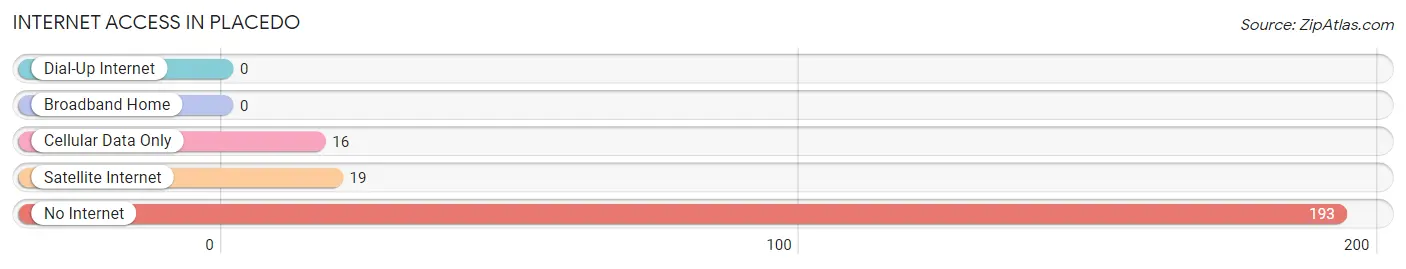
| Internet Type | # Households | % Households |
| Dial-Up Internet | 0 | 0.0% |
| Broadband Home | 0 | 0.0% |
| Cellular Data Only | 16 | 7.0% |
| Satellite Internet | 19 | 8.3% |
| No Internet | 193 | 84.7% |
| Total | 228 | 100.0% |
Placedo Summary
Placedo is a small unincorporated community located in Victoria County, Texas. It is situated about 10 miles south of Victoria, the county seat, and about 20 miles east of the city of Cuero. The population of Placedo was estimated to be 1,072 in 2019.
History
Placedo was founded in 1883 by a group of German settlers who had recently arrived in the area. The town was named after the Spanish word for “place”, and the settlers chose the name because of its proximity to the nearby town of Victoria. The first post office was established in 1884, and the town was officially incorporated in 1887.
Placedo was a thriving agricultural community in the early 20th century, with cotton, corn, and sorghum being the main crops. The town also had a number of businesses, including a general store, a blacksmith shop, and a cotton gin.
In the 1950s, the town began to decline as many of the residents moved away in search of better economic opportunities. By the 1970s, the population had dropped to just over 500.
Geography
Placedo is located in the Coastal Plains region of Texas, about 10 miles south of Victoria and 20 miles east of Cuero. The town is situated on the banks of the Guadalupe River, which flows through the area. The terrain is mostly flat, with some rolling hills in the surrounding area.
The climate in Placedo is humid subtropical, with hot summers and mild winters. The average annual temperature is around 70°F, and the average annual precipitation is around 35 inches.
Economy
The economy of Placedo is largely based on agriculture. Cotton, corn, and sorghum are the main crops grown in the area, and there are also some cattle ranches in the vicinity.
In addition, there are a number of small businesses in the town, including a general store, a gas station, and a few restaurants. There is also a small manufacturing plant in the area that produces plastic products.
Demographics
As of the 2019 census, the population of Placedo was estimated to be 1,072. The racial makeup of the town was 79.3% White, 16.2% Hispanic or Latino, 1.7% African American, 0.7% Native American, 0.3% Asian, and 2.1% from other races.
The median household income in Placedo was $37,917 in 2019, and the median home value was $90,000. The poverty rate was 17.3%, and the unemployment rate was 4.3%.
Conclusion
Placedo is a small unincorporated community located in Victoria County, Texas. It was founded in 1883 by a group of German settlers, and it was once a thriving agricultural community. Today, the economy of Placedo is largely based on agriculture, and there are also a number of small businesses in the town. The population of Placedo was estimated to be 1,072 in 2019, and the median household income was $37,917.
Common Questions
What is Per Capita Income in Placedo?
Per Capita income in Placedo is $13,851.
What is the Median Household income in Placedo?
Median Household Income in Placedo is $22,395.
What is Inequality or Gini Index in Placedo?
Inequality or Gini Index in Placedo is 0.30.
What is the Total Population of Placedo?
Total Population of Placedo is 516.
What is the Total Male Population of Placedo?
Total Male Population of Placedo is 366.
What is the Total Female Population of Placedo?
Total Female Population of Placedo is 150.
What is the Ratio of Males per 100 Females in Placedo?
There are 244.00 Males per 100 Females in Placedo.
What is the Ratio of Females per 100 Males in Placedo?
There are 40.98 Females per 100 Males in Placedo.
What is the Median Population Age in Placedo?
Median Population Age in Placedo is 40.3 Years.
What is the Average Family Size in Placedo
Average Family Size in Placedo is 4.0 People.
What is the Average Household Size in Placedo
Average Household Size in Placedo is 2.3 People.
How Large is the Labor Force in Placedo?
There are 203 People in the Labor Forcein in Placedo.
What is the Percentage of People in the Labor Force in Placedo?
50.6% of People are in the Labor Force in Placedo.