Snake Creek, OK Map & Demographics
Snake Creek Map
Snake Creek Overview
$39,289
PER CAPITA INCOME
$69,821
AVG FAMILY INCOME
$80,000
AVG HOUSEHOLD INCOME
0.37
INEQUALITY / GINI INDEX
295
TOTAL POPULATION
180
MALE POPULATION
115
FEMALE POPULATION
156.52
MALES / 100 FEMALES
63.89
FEMALES / 100 MALES
52.2
MEDIAN AGE
3.3
AVG FAMILY SIZE
3.3
AVG HOUSEHOLD SIZE
147
LABOR FORCE [ PEOPLE ]
59.3%
PERCENT IN LABOR FORCE
Income in Snake Creek
Income Overview in Snake Creek
Per Capita Income in Snake Creek is $39,289, while median incomes of families and households are $69,821 and $80,000 respectively.
| Characteristic | Number | Measure |
| Per Capita Income | 295 | $39,289 |
| Median Family Income | 89 | $69,821 |
| Mean Family Income | 89 | $93,470 |
| Median Household Income | 90 | $80,000 |
| Mean Household Income | 90 | $94,332 |
| Income Deficit | 89 | $0 |
| Wage / Income Gap (%) | 295 | 0.00% |
| Wage / Income Gap ($) | 295 | 100.00¢ per $1 |
| Gini / Inequality Index | 295 | 0.37 |
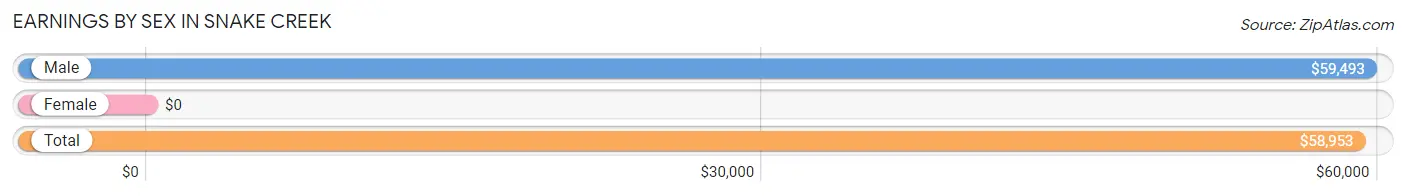
Earnings by Sex in Snake Creek
| Sex | Number | Average Earnings |
| Male | 113 (72.9%) | $59,493 |
| Female | 42 (27.1%) | $0 |
| Total | 155 (100.0%) | $58,953 |
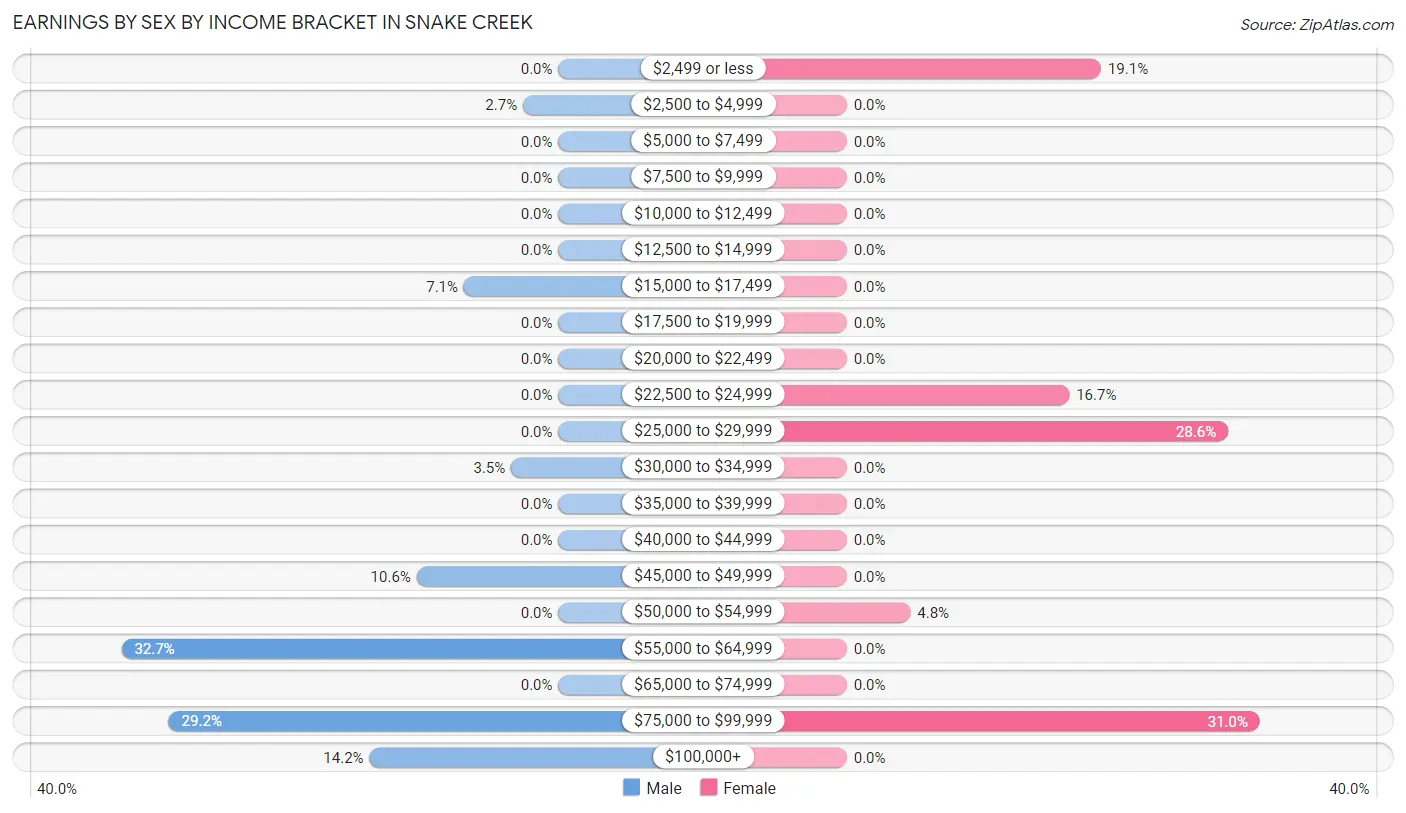
Earnings by Sex by Income Bracket in Snake Creek
The most common earnings brackets in Snake Creek are $55,000 to $64,999 for men (37 | 32.7%) and $75,000 to $99,999 for women (13 | 30.9%).
| Income | Male | Female |
| $2,499 or less | 0 (0.0%) | 8 (19.1%) |
| $2,500 to $4,999 | 3 (2.6%) | 0 (0.0%) |
| $5,000 to $7,499 | 0 (0.0%) | 0 (0.0%) |
| $7,500 to $9,999 | 0 (0.0%) | 0 (0.0%) |
| $10,000 to $12,499 | 0 (0.0%) | 0 (0.0%) |
| $12,500 to $14,999 | 0 (0.0%) | 0 (0.0%) |
| $15,000 to $17,499 | 8 (7.1%) | 0 (0.0%) |
| $17,500 to $19,999 | 0 (0.0%) | 0 (0.0%) |
| $20,000 to $22,499 | 0 (0.0%) | 0 (0.0%) |
| $22,500 to $24,999 | 0 (0.0%) | 7 (16.7%) |
| $25,000 to $29,999 | 0 (0.0%) | 12 (28.6%) |
| $30,000 to $34,999 | 4 (3.5%) | 0 (0.0%) |
| $35,000 to $39,999 | 0 (0.0%) | 0 (0.0%) |
| $40,000 to $44,999 | 0 (0.0%) | 0 (0.0%) |
| $45,000 to $49,999 | 12 (10.6%) | 0 (0.0%) |
| $50,000 to $54,999 | 0 (0.0%) | 2 (4.8%) |
| $55,000 to $64,999 | 37 (32.7%) | 0 (0.0%) |
| $65,000 to $74,999 | 0 (0.0%) | 0 (0.0%) |
| $75,000 to $99,999 | 33 (29.2%) | 13 (30.9%) |
| $100,000+ | 16 (14.2%) | 0 (0.0%) |
| Total | 113 (100.0%) | 42 (100.0%) |
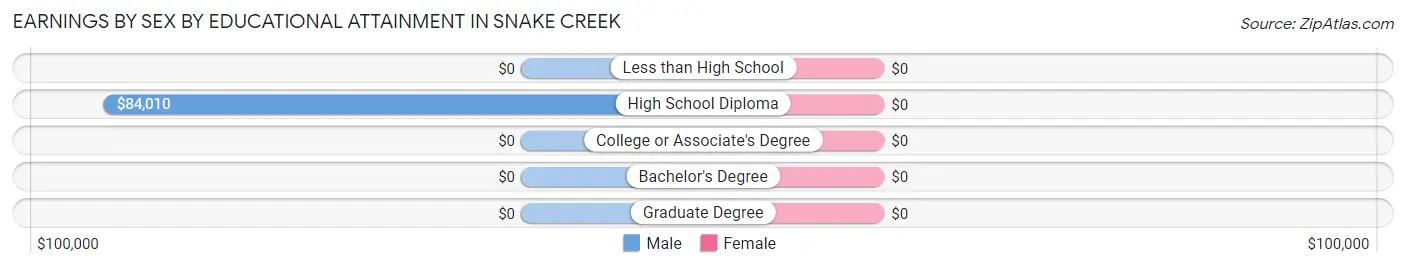
Earnings by Sex by Educational Attainment in Snake Creek
| Educational Attainment | Male Income | Female Income |
| Less than High School | - | - |
| High School Diploma | $84,010 | $0 |
| College or Associate's Degree | - | - |
| Bachelor's Degree | - | - |
| Graduate Degree | - | - |
| Total | $59,595 | $0 |
Family Income in Snake Creek
Family Income Brackets in Snake Creek
According to the Snake Creek family income data, there are 17 families falling into the $25,000 to $34,999 income range, which is the most common income bracket and makes up 19.1% of all families.
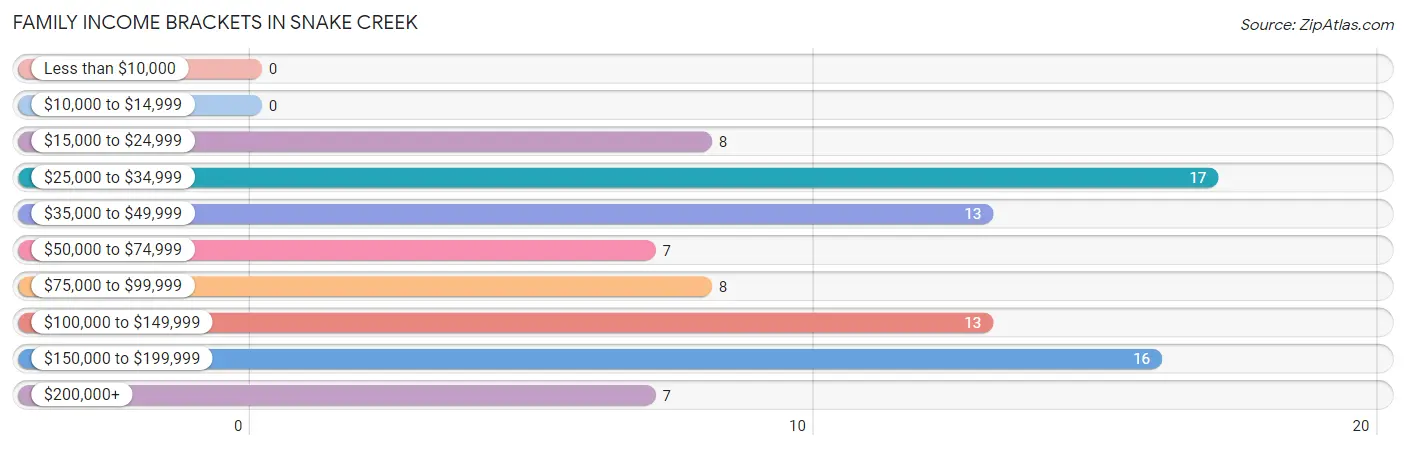
| Income Bracket | # Families | % Families |
| Less than $10,000 | 0 | 0.0% |
| $10,000 to $14,999 | 0 | 0.0% |
| $15,000 to $24,999 | 8 | 9.0% |
| $25,000 to $34,999 | 17 | 19.1% |
| $35,000 to $49,999 | 13 | 14.6% |
| $50,000 to $74,999 | 7 | 7.9% |
| $75,000 to $99,999 | 8 | 9.0% |
| $100,000 to $149,999 | 13 | 14.6% |
| $150,000 to $199,999 | 16 | 18.0% |
| $200,000+ | 7 | 7.9% |
Family Income by Famaliy Size in Snake Creek
2-person families (52 | 58.4%) account for the highest median family income in Snake Creek with $47,692 per family, while 2-person families (52 | 58.4%) have the highest median income of $23,846 per family member.
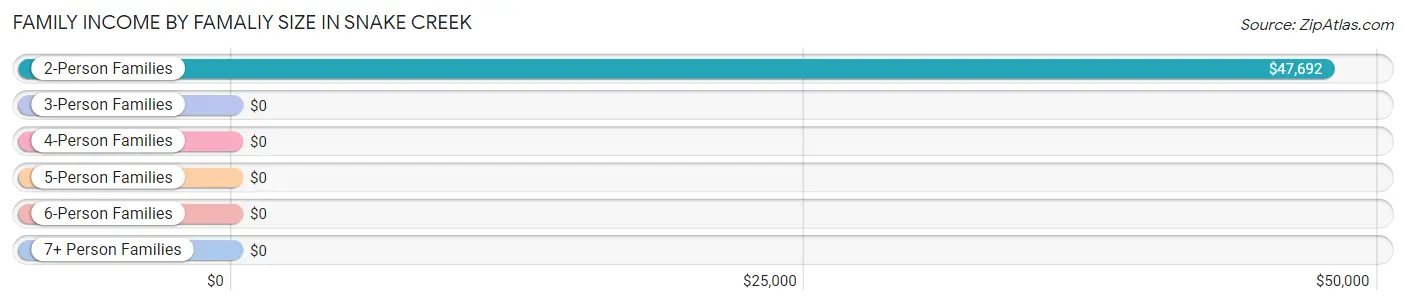
| Income Bracket | # Families | Median Income |
| 2-Person Families | 52 (58.4%) | $47,692 |
| 3-Person Families | 16 (18.0%) | $0 |
| 4-Person Families | 9 (10.1%) | $0 |
| 5-Person Families | 8 (9.0%) | $0 |
| 6-Person Families | 4 (4.5%) | $0 |
| 7+ Person Families | 0 (0.0%) | $0 |
| Total | 89 (100.0%) | $69,821 |
Family Income by Number of Earners in Snake Creek
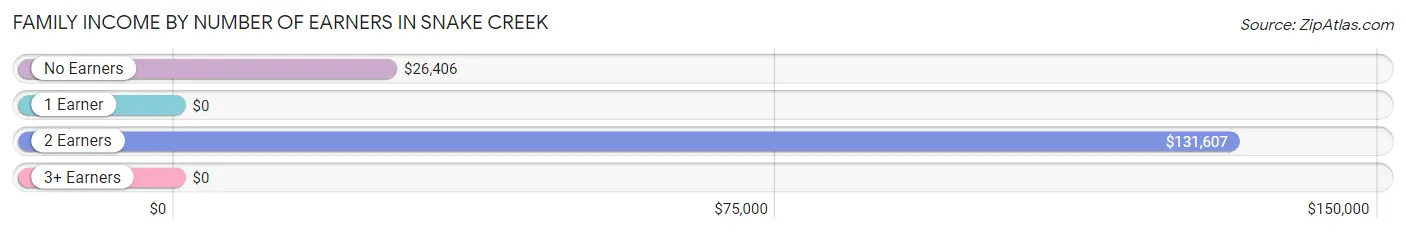
| Number of Earners | # Families | Median Income |
| No Earners | 25 (28.1%) | $26,406 |
| 1 Earner | 13 (14.6%) | $0 |
| 2 Earners | 51 (57.3%) | $131,607 |
| 3+ Earners | 0 (0.0%) | $0 |
| Total | 89 (100.0%) | $69,821 |
Household Income in Snake Creek
Household Income Brackets in Snake Creek
With 17 households falling in the category, the $25,000 to $34,999 income range is the most frequent in Snake Creek, accounting for 18.9% of all households.
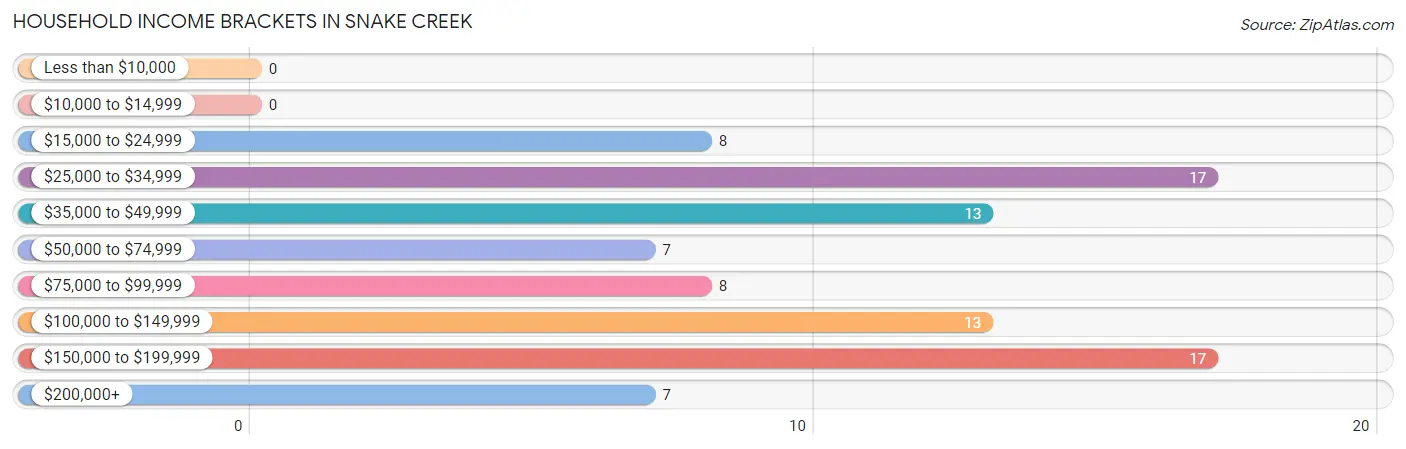
| Income Bracket | # Households | % Households |
| Less than $10,000 | 0 | 0.0% |
| $10,000 to $14,999 | 0 | 0.0% |
| $15,000 to $24,999 | 8 | 8.9% |
| $25,000 to $34,999 | 17 | 18.9% |
| $35,000 to $49,999 | 13 | 14.4% |
| $50,000 to $74,999 | 7 | 7.8% |
| $75,000 to $99,999 | 8 | 8.9% |
| $100,000 to $149,999 | 13 | 14.4% |
| $150,000 to $199,999 | 17 | 18.9% |
| $200,000+ | 7 | 7.8% |
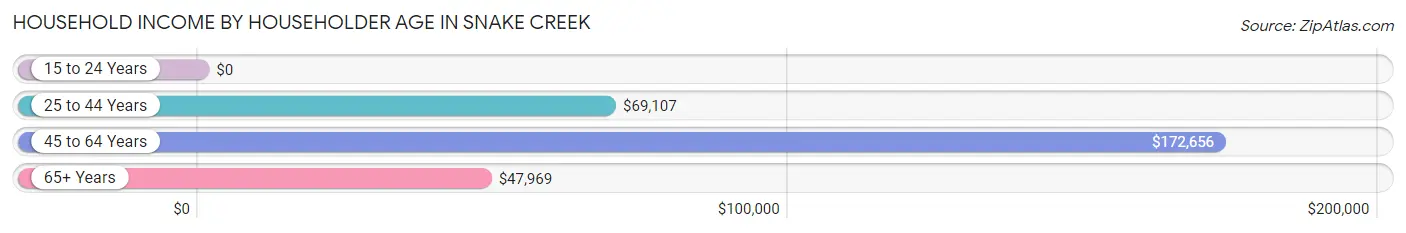
Household Income by Householder Age in Snake Creek
The median household income in Snake Creek is $80,000, with the highest median household income of $172,656 found in the 45 to 64 years age bracket for the primary householder. A total of 44 households (48.9%) fall into this category.
| Income Bracket | # Households | Median Income |
| 15 to 24 Years | 0 (0.0%) | $0 |
| 25 to 44 Years | 25 (27.8%) | $69,107 |
| 45 to 64 Years | 44 (48.9%) | $172,656 |
| 65+ Years | 21 (23.3%) | $47,969 |
| Total | 90 (100.0%) | $80,000 |
Poverty in Snake Creek
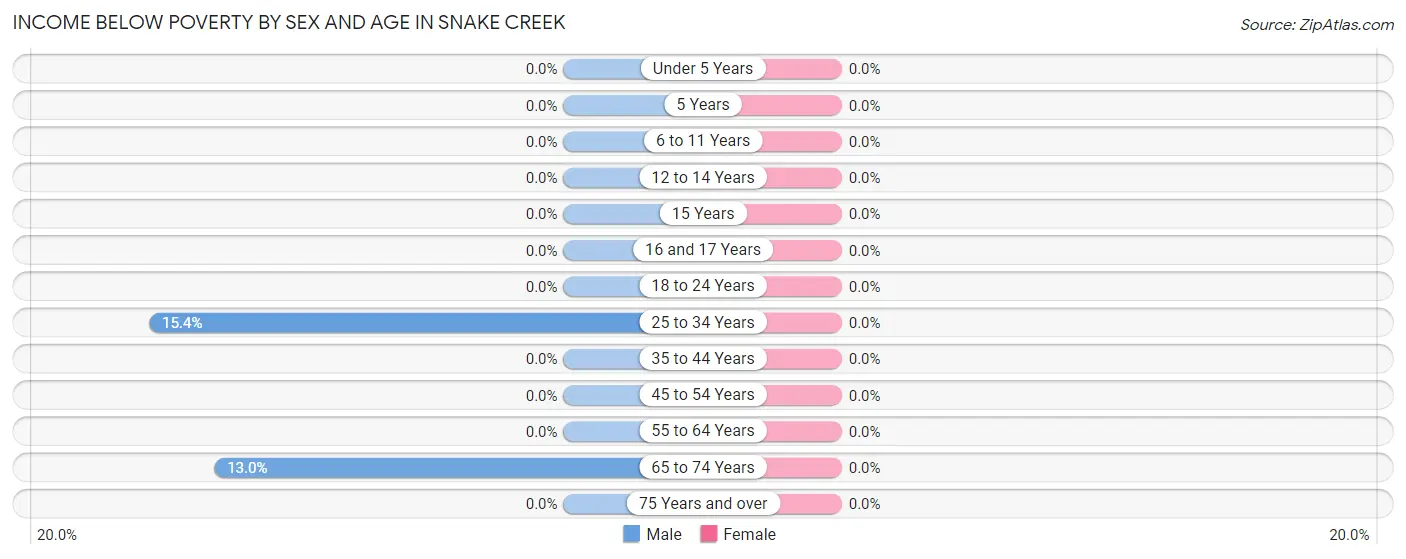
Income Below Poverty by Sex and Age in Snake Creek
| Age Bracket | Male | Female |
| Under 5 Years | 0 (0.0%) | 0 (0.0%) |
| 5 Years | 0 (0.0%) | 0 (0.0%) |
| 6 to 11 Years | 0 (0.0%) | 0 (0.0%) |
| 12 to 14 Years | 0 (0.0%) | 0 (0.0%) |
| 15 Years | 0 (0.0%) | 0 (0.0%) |
| 16 and 17 Years | 0 (0.0%) | 0 (0.0%) |
| 18 to 24 Years | 0 (0.0%) | 0 (0.0%) |
| 25 to 34 Years | 8 (15.4%) | 0 (0.0%) |
| 35 to 44 Years | 0 (0.0%) | 0 (0.0%) |
| 45 to 54 Years | 0 (0.0%) | 0 (0.0%) |
| 55 to 64 Years | 0 (0.0%) | 0 (0.0%) |
| 65 to 74 Years | 7 (13.0%) | 0 (0.0%) |
| 75 Years and over | 0 (0.0%) | 0 (0.0%) |
| Total | 15 (8.3%) | 0 (0.0%) |
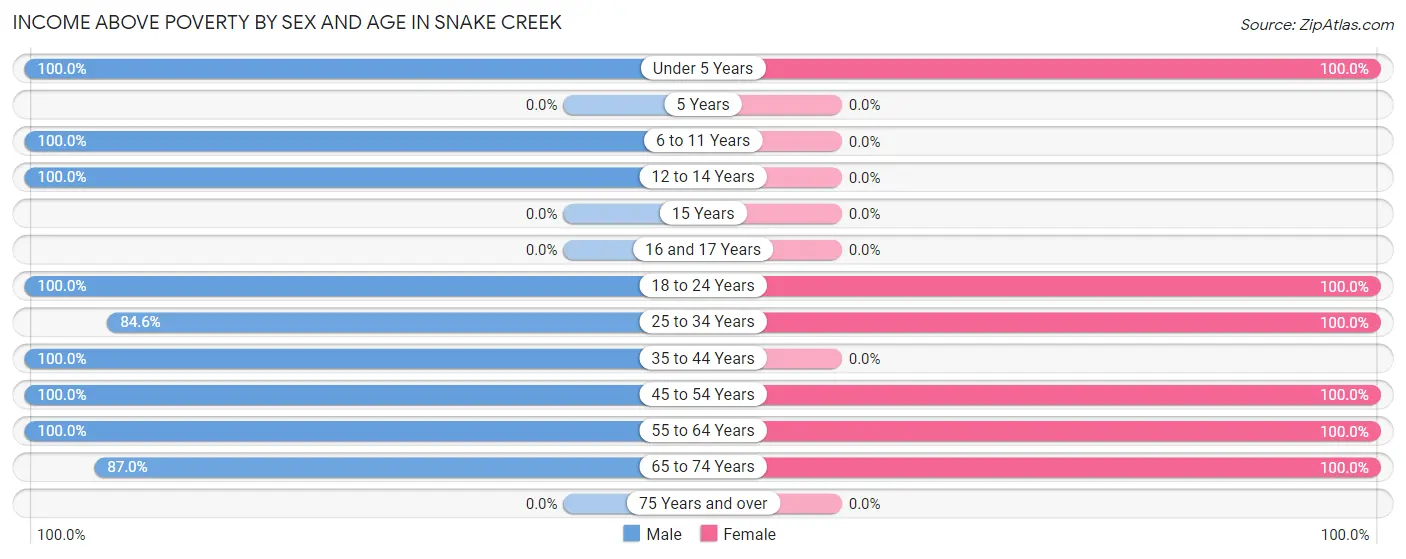
Income Above Poverty by Sex and Age in Snake Creek
According to the poverty statistics in Snake Creek, males aged under 5 years and females aged under 5 years are the age groups that are most secure financially, with 100.0% of males and 100.0% of females in these age groups living above the poverty line.
| Age Bracket | Male | Female |
| Under 5 Years | 3 (100.0%) | 23 (100.0%) |
| 5 Years | 0 (0.0%) | 0 (0.0%) |
| 6 to 11 Years | 13 (100.0%) | 0 (0.0%) |
| 12 to 14 Years | 8 (100.0%) | 0 (0.0%) |
| 15 Years | 0 (0.0%) | 0 (0.0%) |
| 16 and 17 Years | 0 (0.0%) | 0 (0.0%) |
| 18 to 24 Years | 3 (100.0%) | 5 (100.0%) |
| 25 to 34 Years | 44 (84.6%) | 17 (100.0%) |
| 35 to 44 Years | 5 (100.0%) | 0 (0.0%) |
| 45 to 54 Years | 20 (100.0%) | 25 (100.0%) |
| 55 to 64 Years | 22 (100.0%) | 22 (100.0%) |
| 65 to 74 Years | 47 (87.0%) | 23 (100.0%) |
| 75 Years and over | 0 (0.0%) | 0 (0.0%) |
| Total | 165 (91.7%) | 115 (100.0%) |
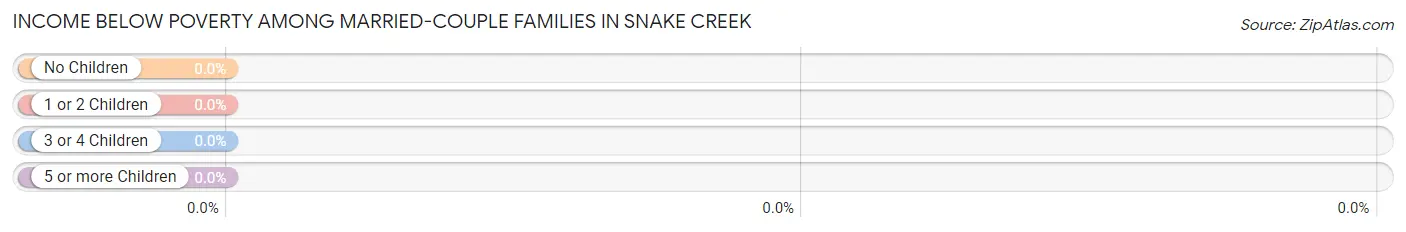
Income Below Poverty Among Married-Couple Families in Snake Creek
| Children | Above Poverty | Below Poverty |
| No Children | 51 (100.0%) | 0 (0.0%) |
| 1 or 2 Children | 13 (100.0%) | 0 (0.0%) |
| 3 or 4 Children | 8 (100.0%) | 0 (0.0%) |
| 5 or more Children | 0 (0.0%) | 0 (0.0%) |
| Total | 72 (100.0%) | 0 (0.0%) |
Income Below Poverty Among Single-Parent Households in Snake Creek
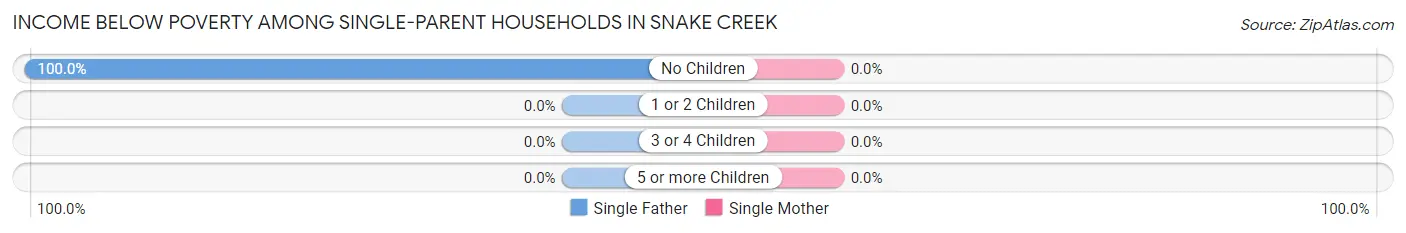
| Children | Single Father | Single Mother |
| No Children | 8 (100.0%) | 0 (0.0%) |
| 1 or 2 Children | 0 (0.0%) | 0 (0.0%) |
| 3 or 4 Children | 0 (0.0%) | 0 (0.0%) |
| 5 or more Children | 0 (0.0%) | 0 (0.0%) |
| Total | 8 (100.0%) | 0 (0.0%) |
Income Below Poverty Among Married-Couple vs Single-Parent Households in Snake Creek
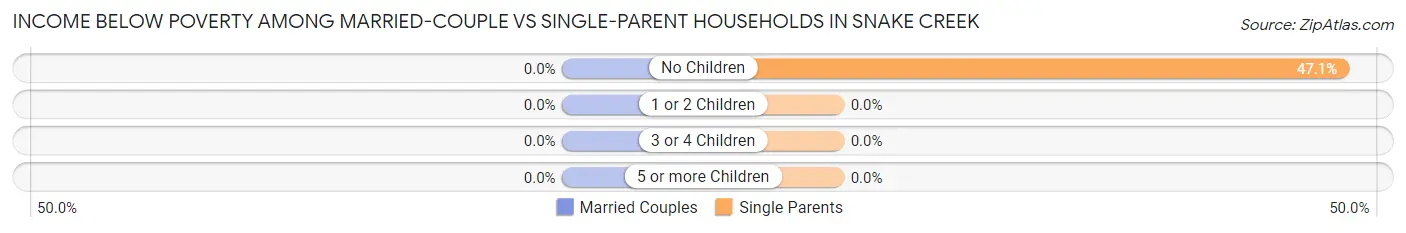
| Children | Married-Couple Families | Single-Parent Households |
| No Children | 0 (0.0%) | 8 (47.1%) |
| 1 or 2 Children | 0 (0.0%) | 0 (0.0%) |
| 3 or 4 Children | 0 (0.0%) | 0 (0.0%) |
| 5 or more Children | 0 (0.0%) | 0 (0.0%) |
| Total | 0 (0.0%) | 8 (47.1%) |
Race in Snake Creek
The most populous races in Snake Creek are Native / Alaskan (141 | 47.8%), White / Caucasian (105 | 35.6%), and Two or more Races (48 | 16.3%).
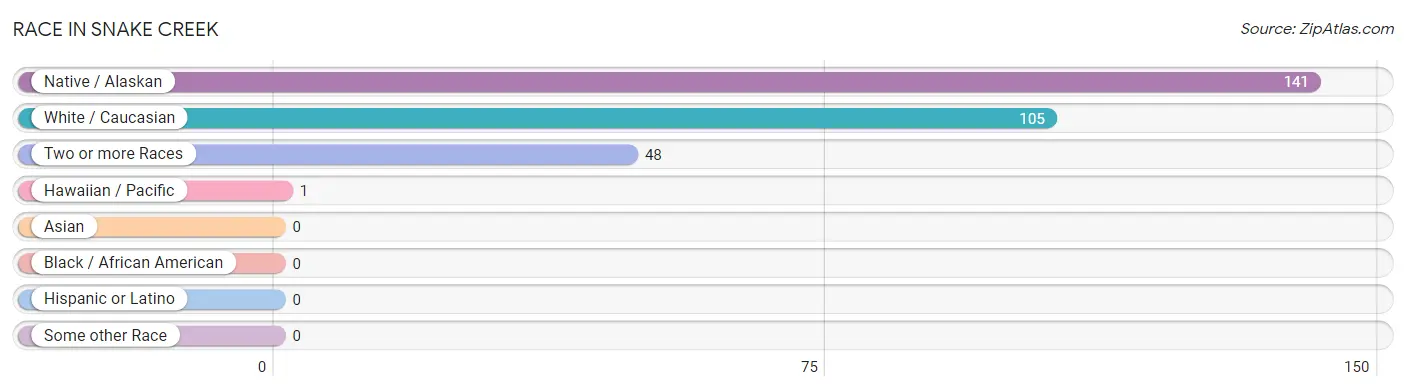
| Race | # Population | % Population |
| Asian | 0 | 0.0% |
| Black / African American | 0 | 0.0% |
| Hawaiian / Pacific | 1 | 0.3% |
| Hispanic or Latino | 0 | 0.0% |
| Native / Alaskan | 141 | 47.8% |
| White / Caucasian | 105 | 35.6% |
| Two or more Races | 48 | 16.3% |
| Some other Race | 0 | 0.0% |
| Total | 295 | 100.0% |
Ancestry in Snake Creek
The most populous ancestries reported in Snake Creek are Cherokee (78 | 26.4%), Creek (70 | 23.7%), American (37 | 12.5%), Apache (15 | 5.1%), and German (8 | 2.7%), together accounting for 70.5% of all Snake Creek residents.
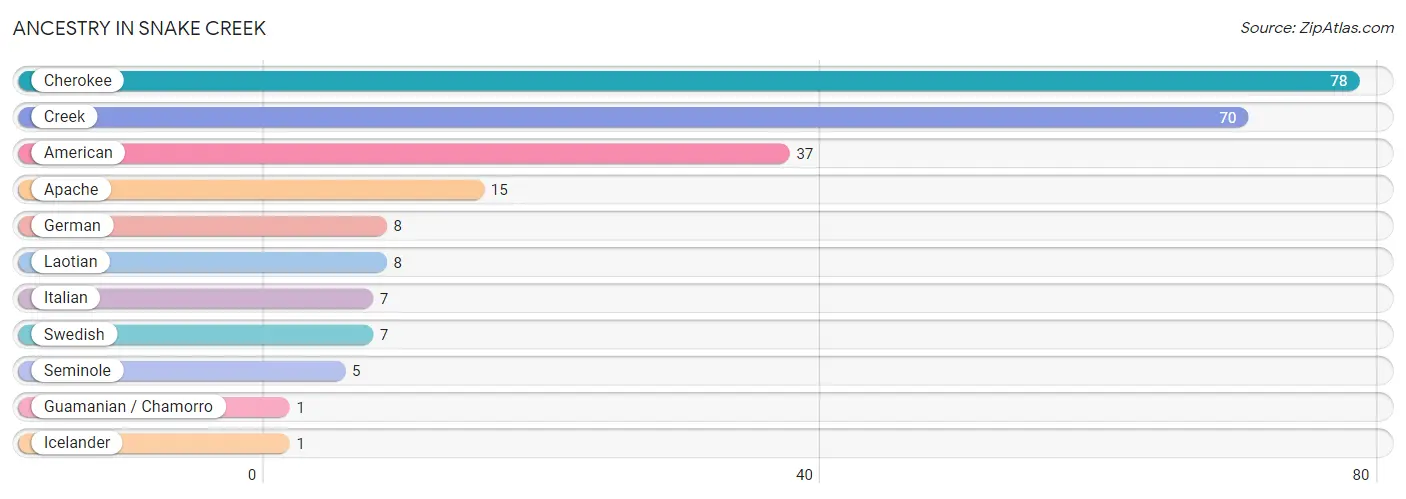
| Ancestry | # Population | % Population |
| American | 37 | 12.5% |
| Apache | 15 | 5.1% |
| Cherokee | 78 | 26.4% |
| Creek | 70 | 23.7% |
| German | 8 | 2.7% |
| Guamanian / Chamorro | 1 | 0.3% |
| Icelander | 1 | 0.3% |
| Italian | 7 | 2.4% |
| Laotian | 8 | 2.7% |
| Seminole | 5 | 1.7% |
| Swedish | 7 | 2.4% | View All 11 Rows |
Immigrants in Snake Creek
The most numerous immigrant groups reported in Snake Creek came from Asia (8 | 2.7%), Indonesia (8 | 2.7%), and South Eastern Asia (8 | 2.7%), together accounting for 8.1% of all Snake Creek residents.
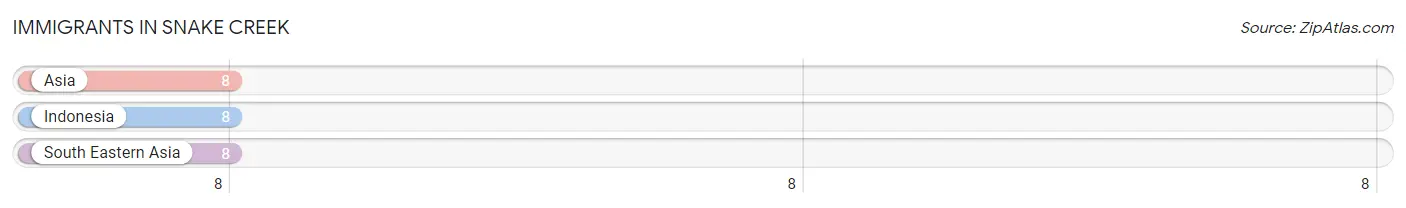
| Immigration Origin | # Population | % Population |
| Asia | 8 | 2.7% |
| Indonesia | 8 | 2.7% |
| South Eastern Asia | 8 | 2.7% | View All 3 Rows |
Sex and Age in Snake Creek
Sex and Age in Snake Creek
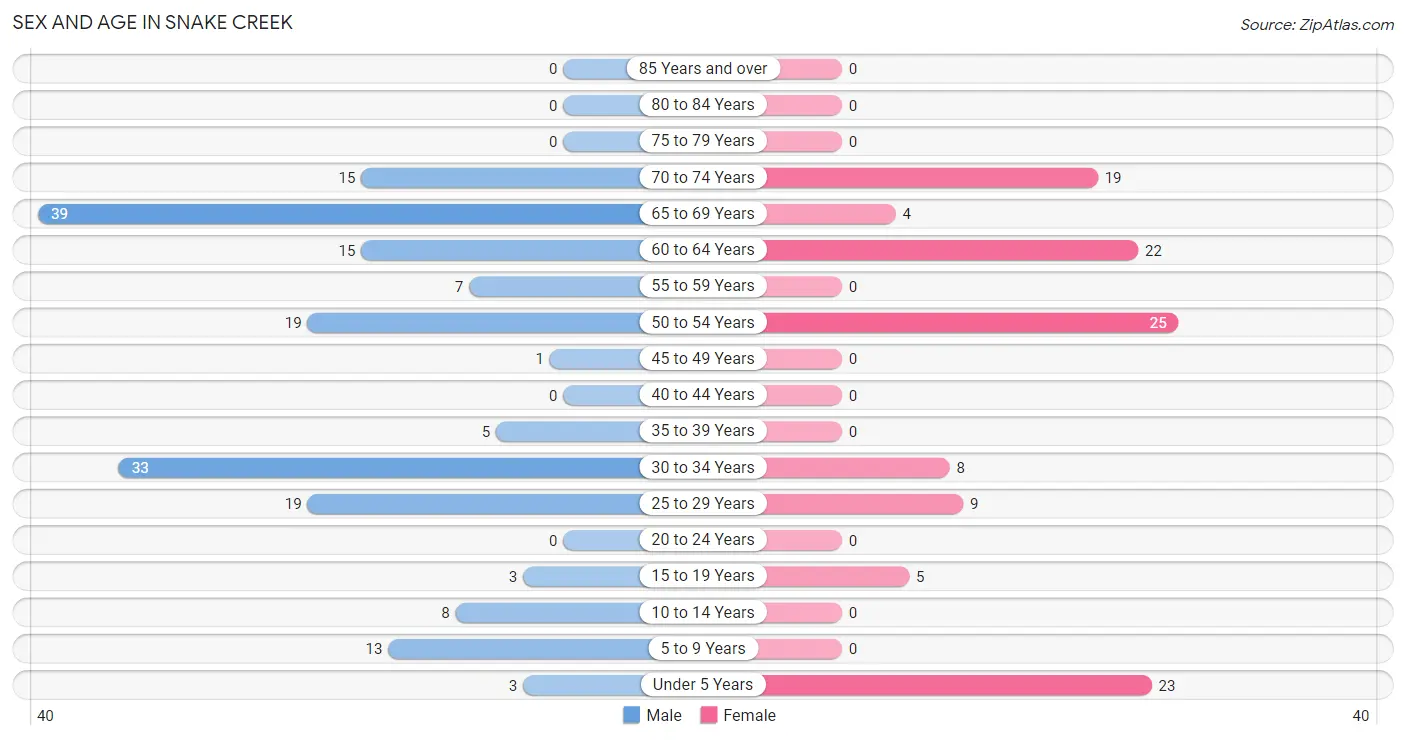
The most populous age groups in Snake Creek are 65 to 69 Years (39 | 21.7%) for men and 50 to 54 Years (25 | 21.7%) for women.
| Age Bracket | Male | Female |
| Under 5 Years | 3 (1.7%) | 23 (20.0%) |
| 5 to 9 Years | 13 (7.2%) | 0 (0.0%) |
| 10 to 14 Years | 8 (4.4%) | 0 (0.0%) |
| 15 to 19 Years | 3 (1.7%) | 5 (4.3%) |
| 20 to 24 Years | 0 (0.0%) | 0 (0.0%) |
| 25 to 29 Years | 19 (10.6%) | 9 (7.8%) |
| 30 to 34 Years | 33 (18.3%) | 8 (7.0%) |
| 35 to 39 Years | 5 (2.8%) | 0 (0.0%) |
| 40 to 44 Years | 0 (0.0%) | 0 (0.0%) |
| 45 to 49 Years | 1 (0.6%) | 0 (0.0%) |
| 50 to 54 Years | 19 (10.6%) | 25 (21.7%) |
| 55 to 59 Years | 7 (3.9%) | 0 (0.0%) |
| 60 to 64 Years | 15 (8.3%) | 22 (19.1%) |
| 65 to 69 Years | 39 (21.7%) | 4 (3.5%) |
| 70 to 74 Years | 15 (8.3%) | 19 (16.5%) |
| 75 to 79 Years | 0 (0.0%) | 0 (0.0%) |
| 80 to 84 Years | 0 (0.0%) | 0 (0.0%) |
| 85 Years and over | 0 (0.0%) | 0 (0.0%) |
| Total | 180 (100.0%) | 115 (100.0%) |
Families and Households in Snake Creek
Median Family Size in Snake Creek
The median family size in Snake Creek is 3.30 persons per family, with married-couple families (72 | 80.9%) accounting for the largest median family size of 3.6 persons per family. On the other hand, single male/father families (8 | 9.0%) represent the smallest median family size with 1.88 persons per family.
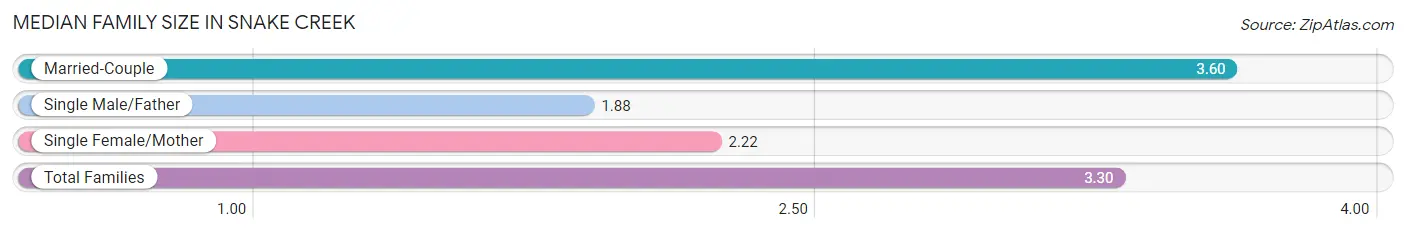
| Family Type | # Families | Family Size |
| Married-Couple | 72 (80.9%) | 3.60 |
| Single Male/Father | 8 (9.0%) | 1.88 |
| Single Female/Mother | 9 (10.1%) | 2.22 |
| Total Families | 89 (100.0%) | 3.30 |
Median Household Size in Snake Creek
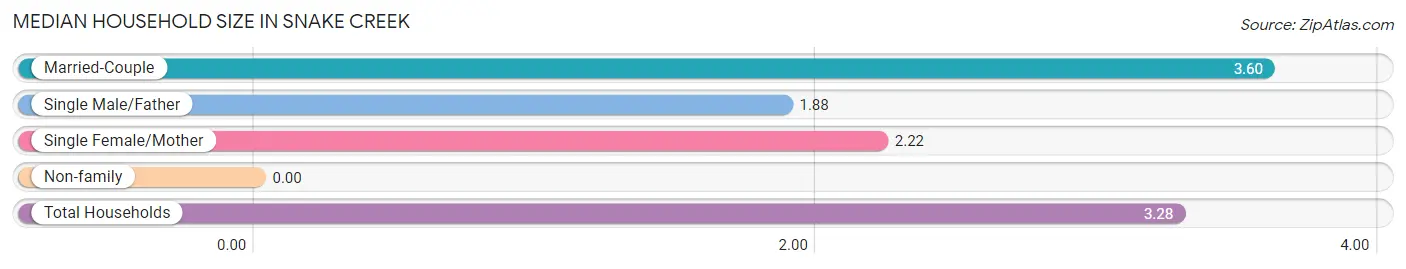
| Household Type | # Households | Household Size |
| Married-Couple | 72 (80.0%) | 3.60 |
| Single Male/Father | 8 (8.9%) | 1.88 |
| Single Female/Mother | 9 (10.0%) | 2.22 |
| Non-family | 1 (1.1%) | - |
| Total Households | 90 (100.0%) | 3.28 |
Household Size by Marriage Status in Snake Creek
Out of a total of 90 households in Snake Creek, 89 (98.9%) are family households, while 1 (1.1%) are nonfamily households. The most numerous type of family households are 2-person households, comprising 52, and the most common type of nonfamily households are 1-person households, comprising 1.
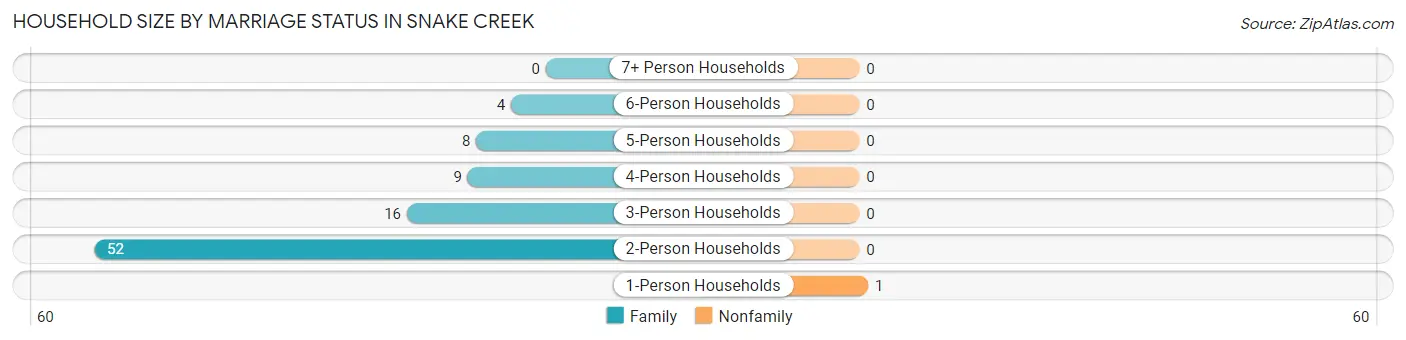
| Household Size | Family Households | Nonfamily Households |
| 1-Person Households | - | 1 (1.1%) |
| 2-Person Households | 52 (57.8%) | 0 (0.0%) |
| 3-Person Households | 16 (17.8%) | 0 (0.0%) |
| 4-Person Households | 9 (10.0%) | 0 (0.0%) |
| 5-Person Households | 8 (8.9%) | 0 (0.0%) |
| 6-Person Households | 4 (4.4%) | 0 (0.0%) |
| 7+ Person Households | 0 (0.0%) | 0 (0.0%) |
| Total | 89 (98.9%) | 1 (1.1%) |
Female Fertility in Snake Creek
Fertility by Age in Snake Creek
Average fertility rate in Snake Creek is 444.0 births per 1,000 women. Women in the age bracket of 15 to 19 years have the highest fertility rate with 1,000.0 births per 1,000 women. Women in the age bracket of 20 to 34 years acount for 58.3% of all women with births.
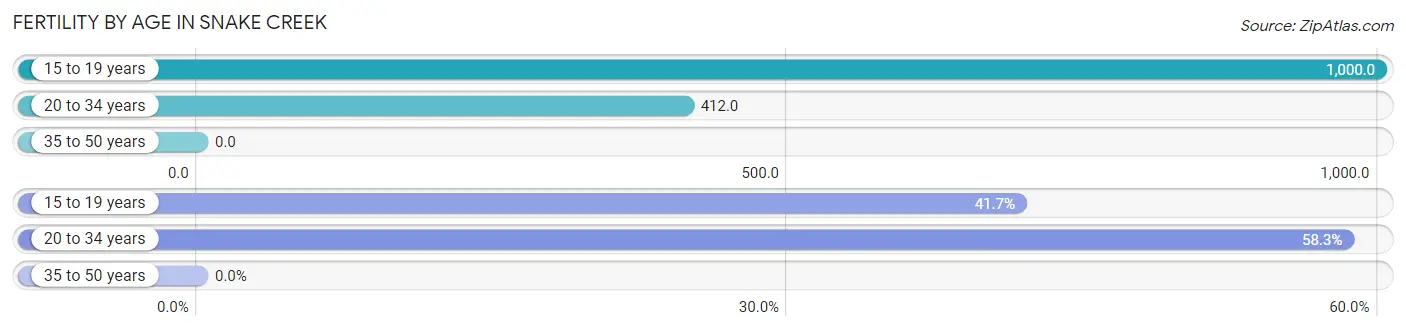
| Age Bracket | Women with Births | Births / 1,000 Women |
| 15 to 19 years | 5 (41.7%) | 1,000.0 |
| 20 to 34 years | 7 (58.3%) | 412.0 |
| 35 to 50 years | 0 (0.0%) | 0.0 |
| Total | 12 (100.0%) | 444.0 |
Fertility by Age by Marriage Status in Snake Creek
58.3% of women with births (12) in Snake Creek are married. The highest percentage of unmarried women with births falls into 15 to 19 years age bracket with 100.0% of them unmarried at the time of birth, while the lowest percentage of unmarried women with births belong to 20 to 34 years age bracket with 0.0% of them unmarried.
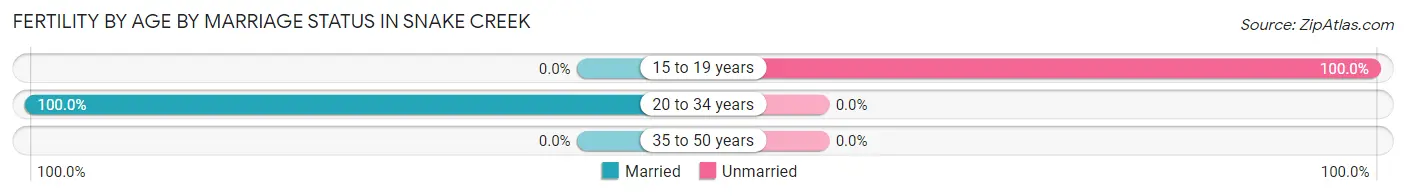
| Age Bracket | Married | Unmarried |
| 15 to 19 years | 0 (0.0%) | 5 (100.0%) |
| 20 to 34 years | 7 (100.0%) | 0 (0.0%) |
| 35 to 50 years | 0 (0.0%) | 0 (0.0%) |
| Total | 7 (58.3%) | 5 (41.7%) |
Fertility by Education in Snake Creek
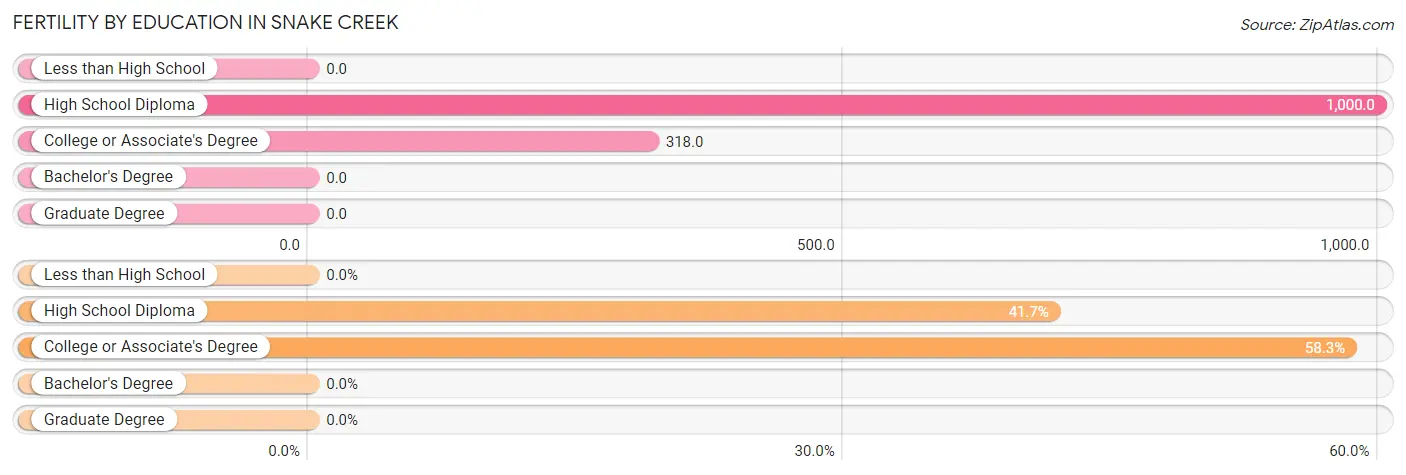
| Educational Attainment | Women with Births | Births / 1,000 Women |
| Less than High School | 0 (0.0%) | 0.0 |
| High School Diploma | 5 (41.7%) | 1,000.0 |
| College or Associate's Degree | 7 (58.3%) | 318.0 |
| Bachelor's Degree | 0 (0.0%) | 0.0 |
| Graduate Degree | 0 (0.0%) | 0.0 |
| Total | 12 (100.0%) | 444.0 |
Fertility by Education by Marriage Status in Snake Creek
41.7% of women with births in Snake Creek are unmarried. Women with the educational attainment of college or associate's degree are most likely to be married with 100.0% of them married at childbirth, while women with the educational attainment of high school diploma are least likely to be married with 100.0% of them unmarried at childbirth.
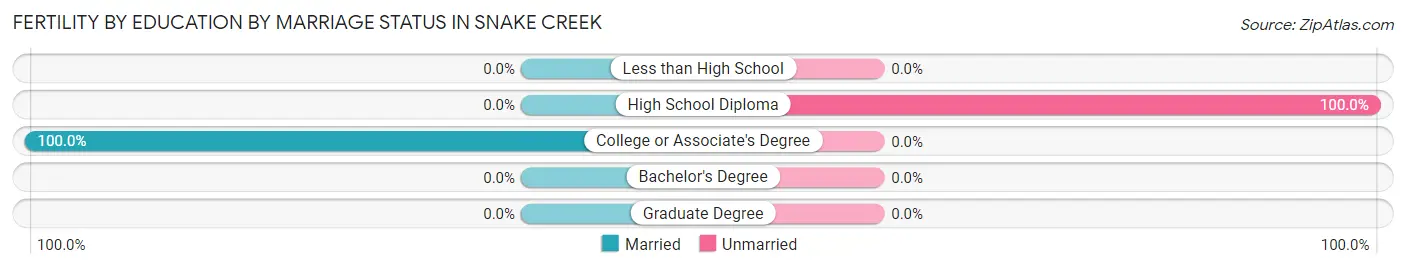
| Educational Attainment | Married | Unmarried |
| Less than High School | 0 (0.0%) | 0 (0.0%) |
| High School Diploma | 0 (0.0%) | 5 (100.0%) |
| College or Associate's Degree | 7 (100.0%) | 0 (0.0%) |
| Bachelor's Degree | 0 (0.0%) | 0 (0.0%) |
| Graduate Degree | 0 (0.0%) | 0 (0.0%) |
| Total | 7 (58.3%) | 5 (41.7%) |
Employment Characteristics in Snake Creek
Employment by Class of Employer in Snake Creek
Among the 133 employed individuals in Snake Creek, private company employees (125 | 94.0%), not-for-profit organizations (7 | 5.3%), and federal government employees (1 | 0.7%) make up the most common classes of employment.
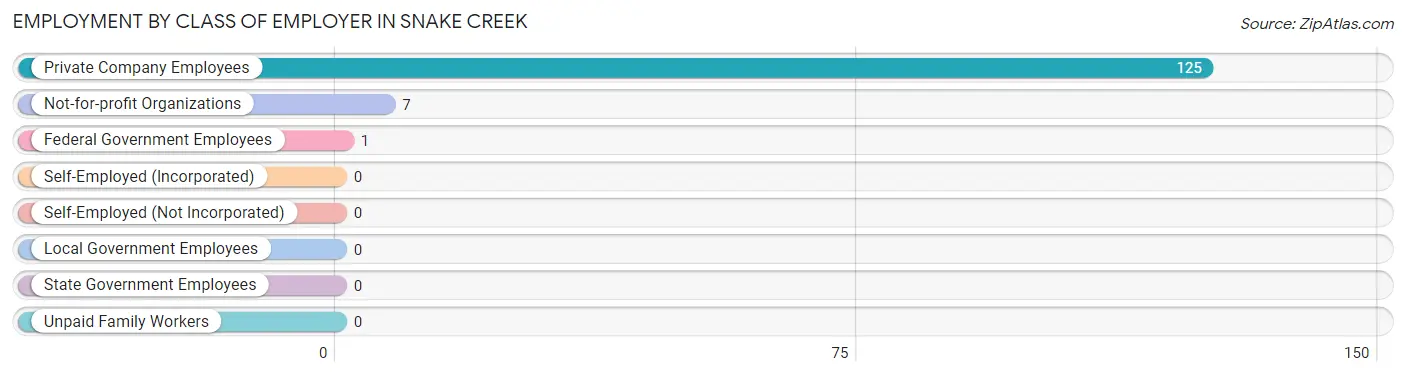
| Employer Class | # Employees | % Employees |
| Private Company Employees | 125 | 94.0% |
| Self-Employed (Incorporated) | 0 | 0.0% |
| Self-Employed (Not Incorporated) | 0 | 0.0% |
| Not-for-profit Organizations | 7 | 5.3% |
| Local Government Employees | 0 | 0.0% |
| State Government Employees | 0 | 0.0% |
| Federal Government Employees | 1 | 0.7% |
| Unpaid Family Workers | 0 | 0.0% |
| Total | 133 | 100.0% |
Employment Status by Age in Snake Creek
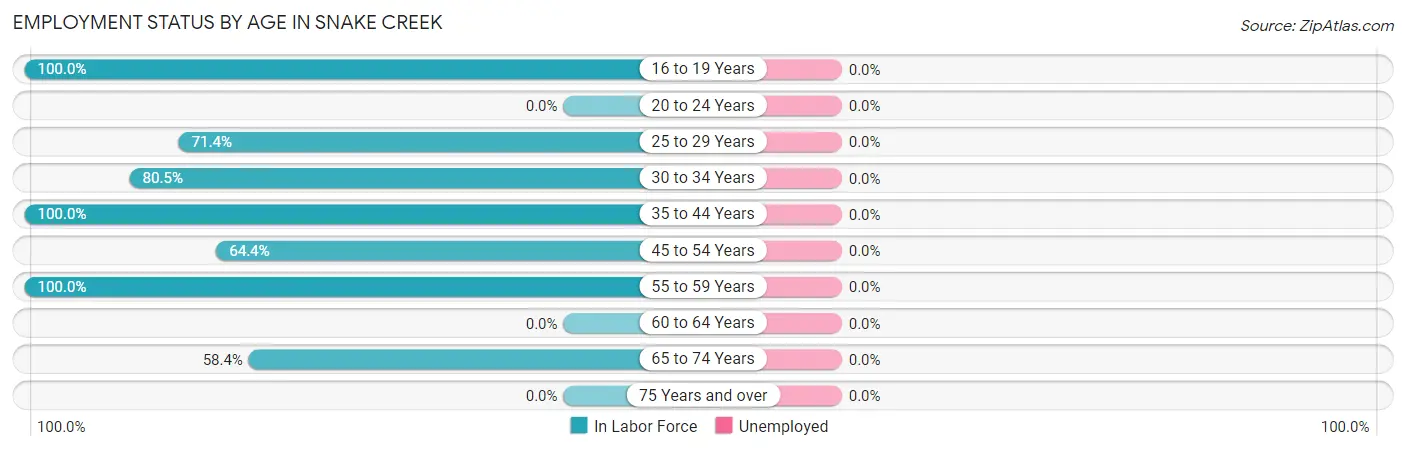
| Age Bracket | In Labor Force | Unemployed |
| 16 to 19 Years | 8 (100.0%) | 0 (0.0%) |
| 20 to 24 Years | 0 (0.0%) | 0 (0.0%) |
| 25 to 29 Years | 20 (71.4%) | 0 (0.0%) |
| 30 to 34 Years | 33 (80.5%) | 0 (0.0%) |
| 35 to 44 Years | 5 (100.0%) | 0 (0.0%) |
| 45 to 54 Years | 29 (64.4%) | 0 (0.0%) |
| 55 to 59 Years | 7 (100.0%) | 0 (0.0%) |
| 60 to 64 Years | 0 (0.0%) | 0 (0.0%) |
| 65 to 74 Years | 45 (58.4%) | 0 (0.0%) |
| 75 Years and over | 0 (0.0%) | 0 (0.0%) |
| Total | 147 (59.3%) | 0 (0.0%) |
Employment Status by Educational Attainment in Snake Creek
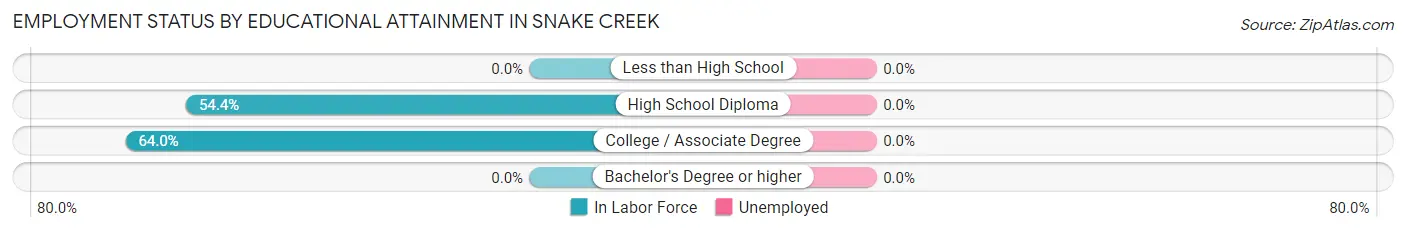
| Educational Attainment | In Labor Force | Unemployed |
| Less than High School | 0 (0.0%) | 0 (0.0%) |
| High School Diploma | 37 (54.4%) | 0 (0.0%) |
| College / Associate Degree | 57 (64.0%) | 0 (0.0%) |
| Bachelor's Degree or higher | 0 (0.0%) | 0 (0.0%) |
| Total | 94 (57.7%) | 0 (0.0%) |
Employment Occupations by Sex in Snake Creek
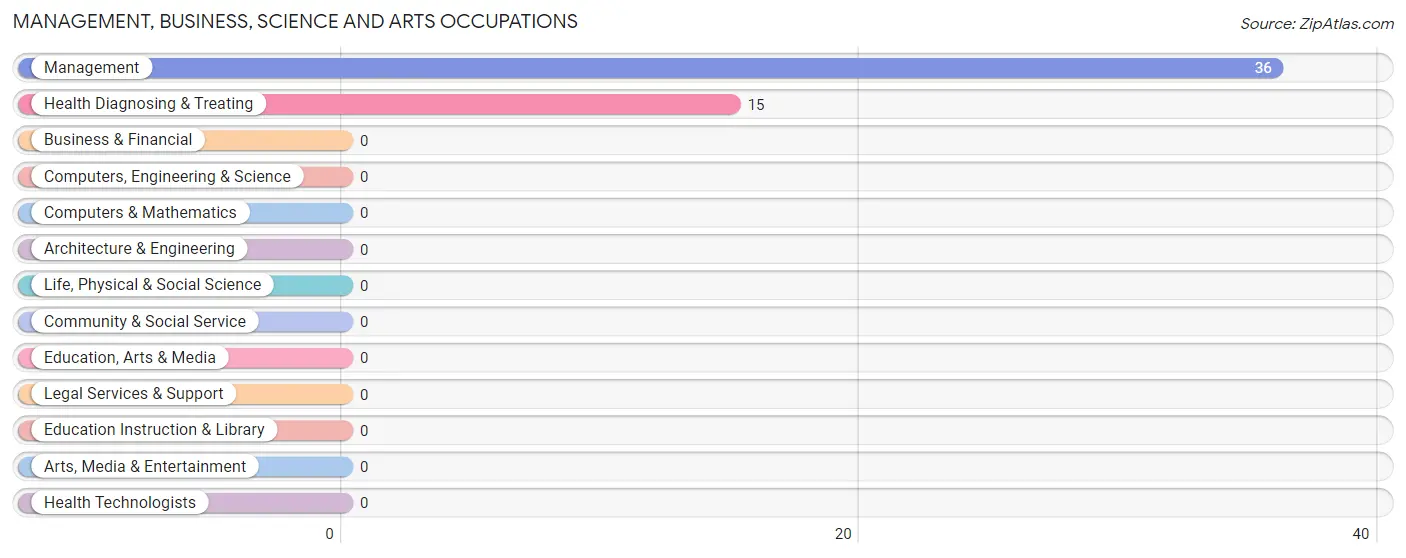
Management, Business, Science and Arts Occupations
The most common Management, Business, Science and Arts occupations in Snake Creek are Management (36 | 24.5%), and Health Diagnosing & Treating (15 | 10.2%).
Management, Business, Science and Arts Occupations by Sex
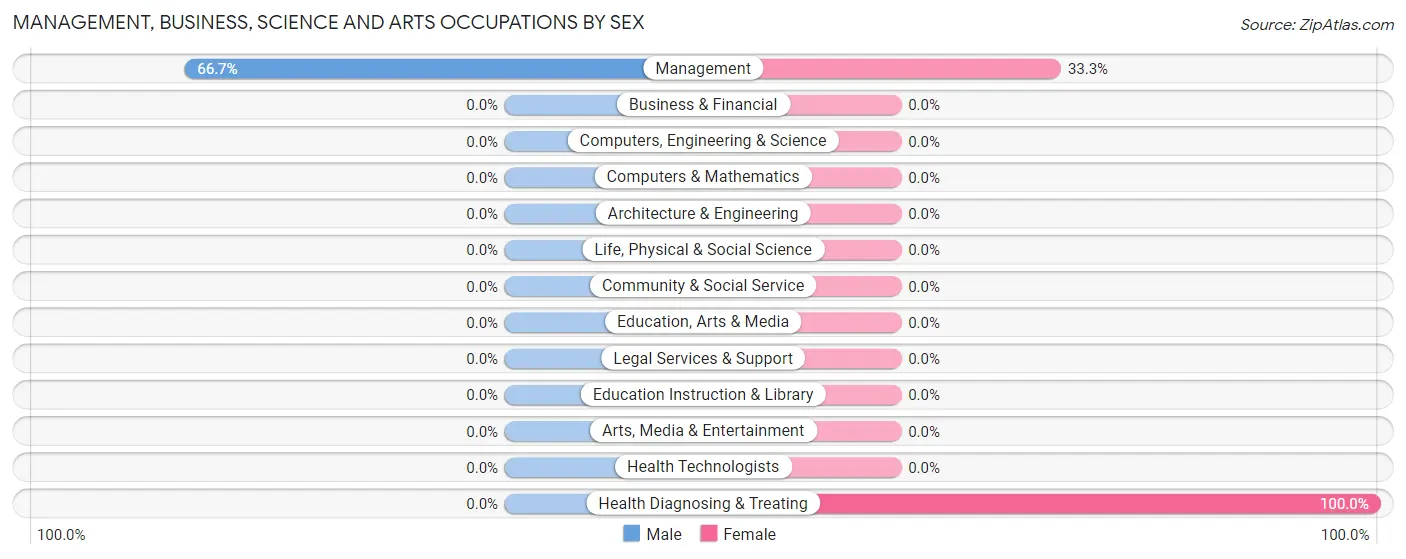
| Occupation | Male | Female |
| Management | 24 (66.7%) | 12 (33.3%) |
| Business & Financial | 0 (0.0%) | 0 (0.0%) |
| Computers, Engineering & Science | 0 (0.0%) | 0 (0.0%) |
| Computers & Mathematics | 0 (0.0%) | 0 (0.0%) |
| Architecture & Engineering | 0 (0.0%) | 0 (0.0%) |
| Life, Physical & Social Science | 0 (0.0%) | 0 (0.0%) |
| Community & Social Service | 0 (0.0%) | 0 (0.0%) |
| Education, Arts & Media | 0 (0.0%) | 0 (0.0%) |
| Legal Services & Support | 0 (0.0%) | 0 (0.0%) |
| Education Instruction & Library | 0 (0.0%) | 0 (0.0%) |
| Arts, Media & Entertainment | 0 (0.0%) | 0 (0.0%) |
| Health Diagnosing & Treating | 0 (0.0%) | 15 (100.0%) |
| Health Technologists | 0 (0.0%) | 0 (0.0%) |
| Total (Category) | 24 (47.1%) | 27 (52.9%) |
| Total (Overall) | 113 (76.9%) | 34 (23.1%) |
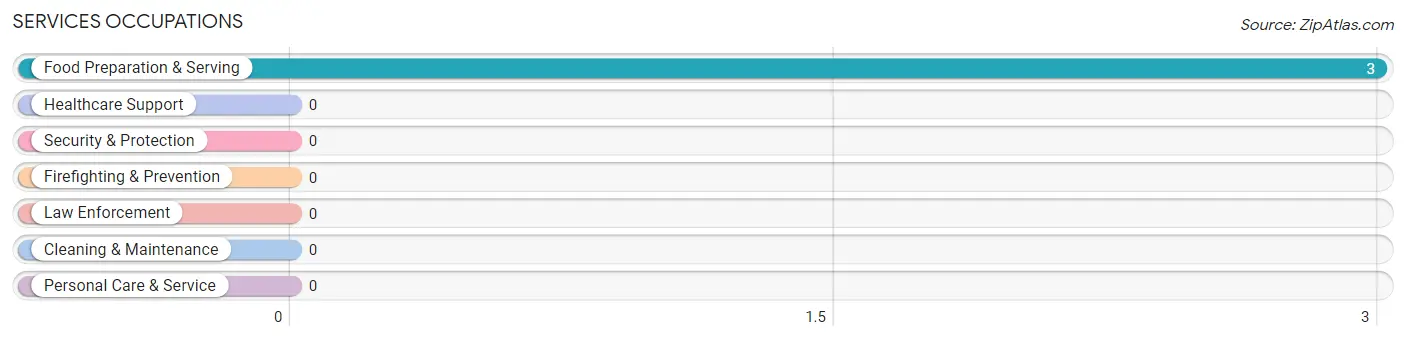
Services Occupations
The most common Services occupations in Snake Creek are , and Food Preparation & Serving (3 | 2.0%).
Services Occupations by Sex
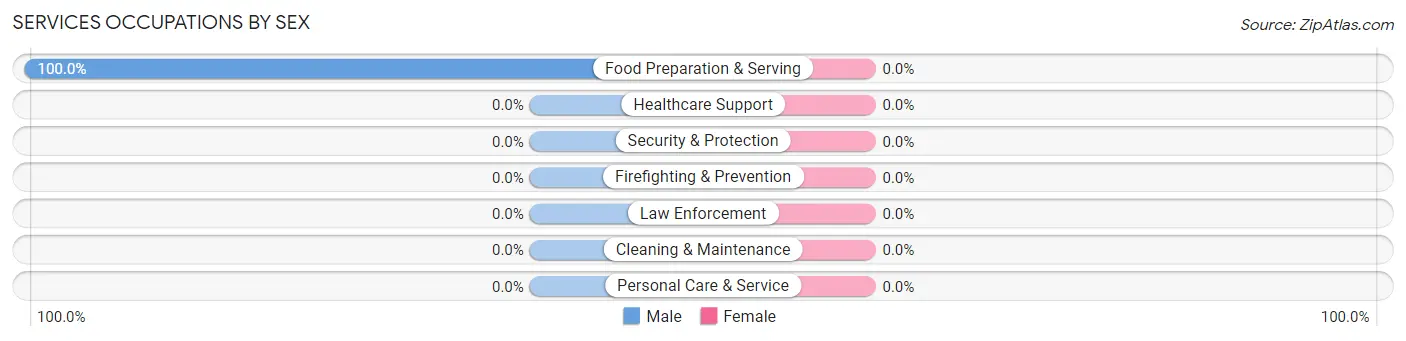
| Occupation | Male | Female |
| Healthcare Support | 0 (0.0%) | 0 (0.0%) |
| Security & Protection | 0 (0.0%) | 0 (0.0%) |
| Firefighting & Prevention | 0 (0.0%) | 0 (0.0%) |
| Law Enforcement | 0 (0.0%) | 0 (0.0%) |
| Food Preparation & Serving | 3 (100.0%) | 0 (0.0%) |
| Cleaning & Maintenance | 0 (0.0%) | 0 (0.0%) |
| Personal Care & Service | 0 (0.0%) | 0 (0.0%) |
| Total (Category) | 3 (100.0%) | 0 (0.0%) |
| Total (Overall) | 113 (76.9%) | 34 (23.1%) |
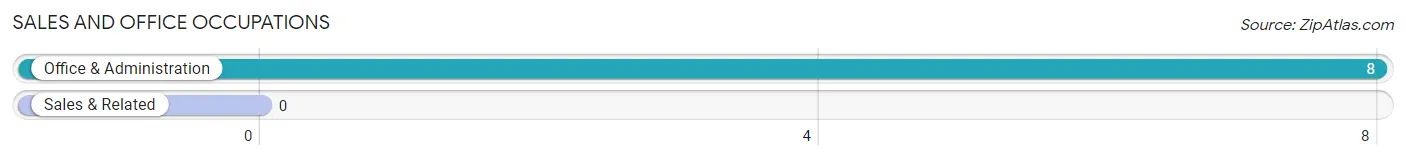
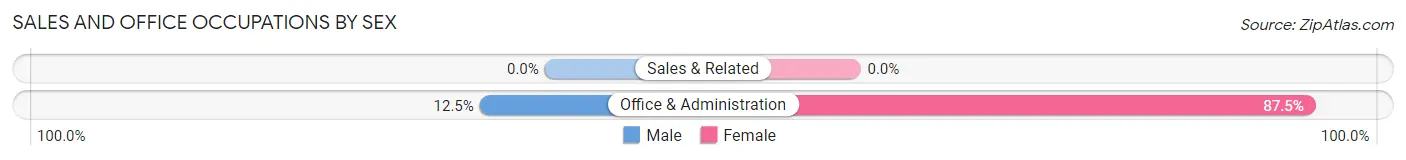
Sales and Office Occupations
The most common Sales and Office occupations in Snake Creek are , and Office & Administration (8 | 5.4%).
Sales and Office Occupations by Sex
| Occupation | Male | Female |
| Sales & Related | 0 (0.0%) | 0 (0.0%) |
| Office & Administration | 1 (12.5%) | 7 (87.5%) |
| Total (Category) | 1 (12.5%) | 7 (87.5%) |
| Total (Overall) | 113 (76.9%) | 34 (23.1%) |
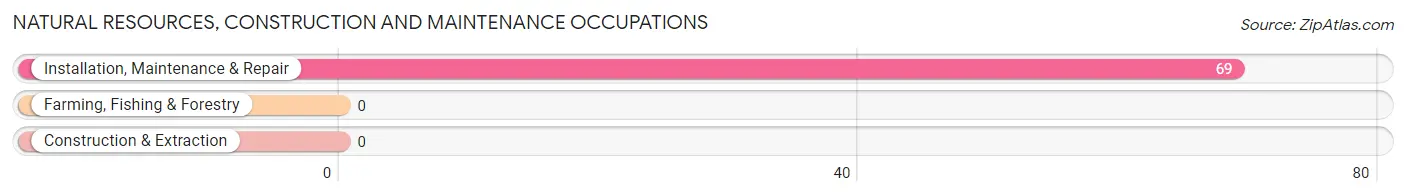
Natural Resources, Construction and Maintenance Occupations
The most common Natural Resources, Construction and Maintenance occupations in Snake Creek are , and Installation, Maintenance & Repair (69 | 46.9%).
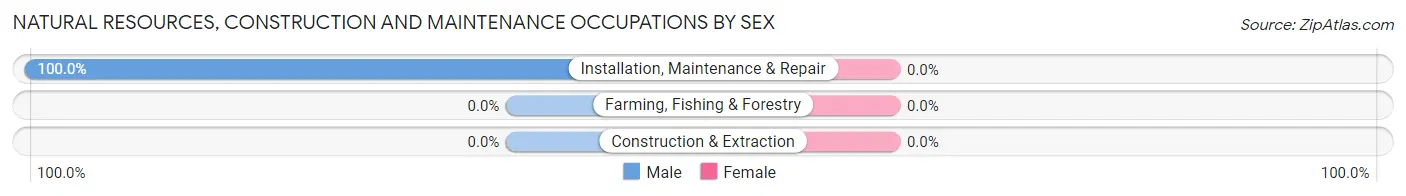
Natural Resources, Construction and Maintenance Occupations by Sex
| Occupation | Male | Female |
| Farming, Fishing & Forestry | 0 (0.0%) | 0 (0.0%) |
| Construction & Extraction | 0 (0.0%) | 0 (0.0%) |
| Installation, Maintenance & Repair | 69 (100.0%) | 0 (0.0%) |
| Total (Category) | 69 (100.0%) | 0 (0.0%) |
| Total (Overall) | 113 (76.9%) | 34 (23.1%) |
Production, Transportation and Moving Occupations
The most common Production, Transportation and Moving occupations in Snake Creek are Production (12 | 8.2%), and Material Moving (4 | 2.7%).
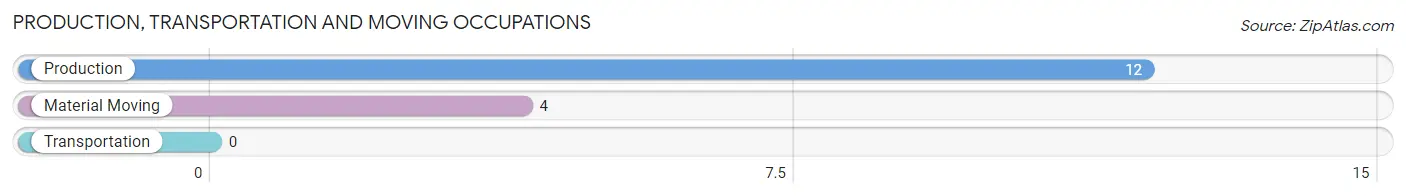
Production, Transportation and Moving Occupations by Sex
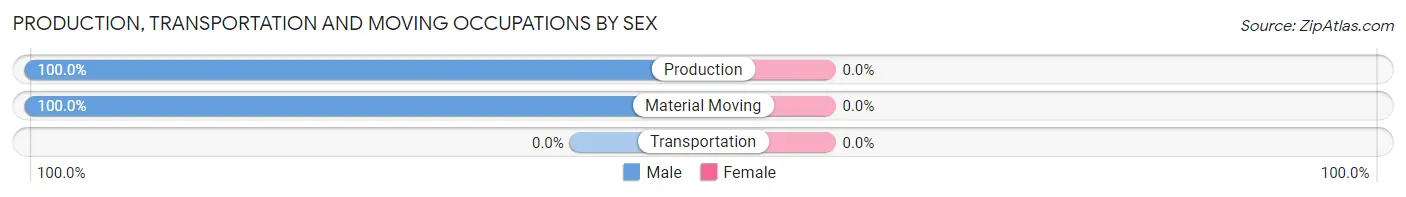
| Occupation | Male | Female |
| Production | 12 (100.0%) | 0 (0.0%) |
| Transportation | 0 (0.0%) | 0 (0.0%) |
| Material Moving | 4 (100.0%) | 0 (0.0%) |
| Total (Category) | 16 (100.0%) | 0 (0.0%) |
| Total (Overall) | 113 (76.9%) | 34 (23.1%) |
Employment Industries by Sex in Snake Creek
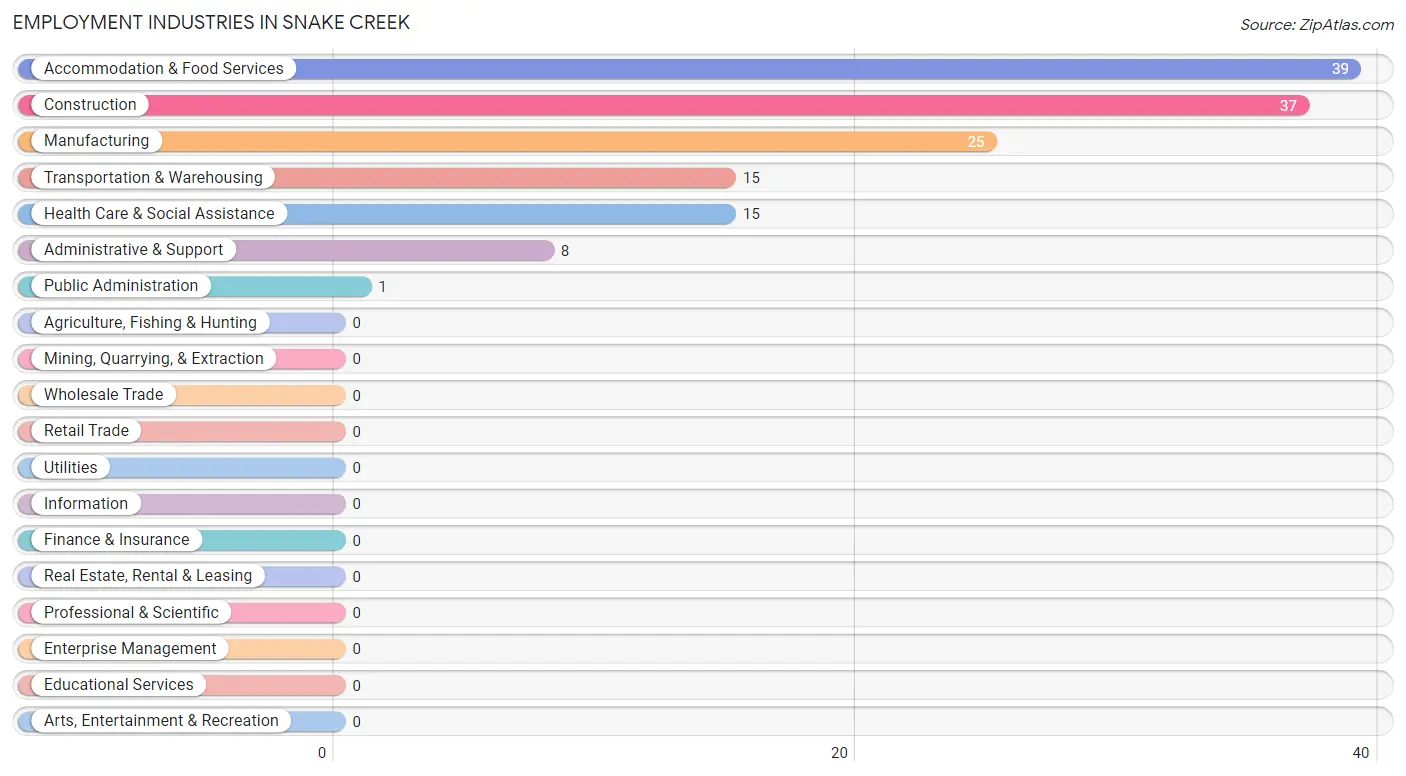
Employment Industries in Snake Creek
The major employment industries in Snake Creek include Accommodation & Food Services (39 | 26.5%), Construction (37 | 25.2%), Manufacturing (25 | 17.0%), Transportation & Warehousing (15 | 10.2%), and Health Care & Social Assistance (15 | 10.2%).
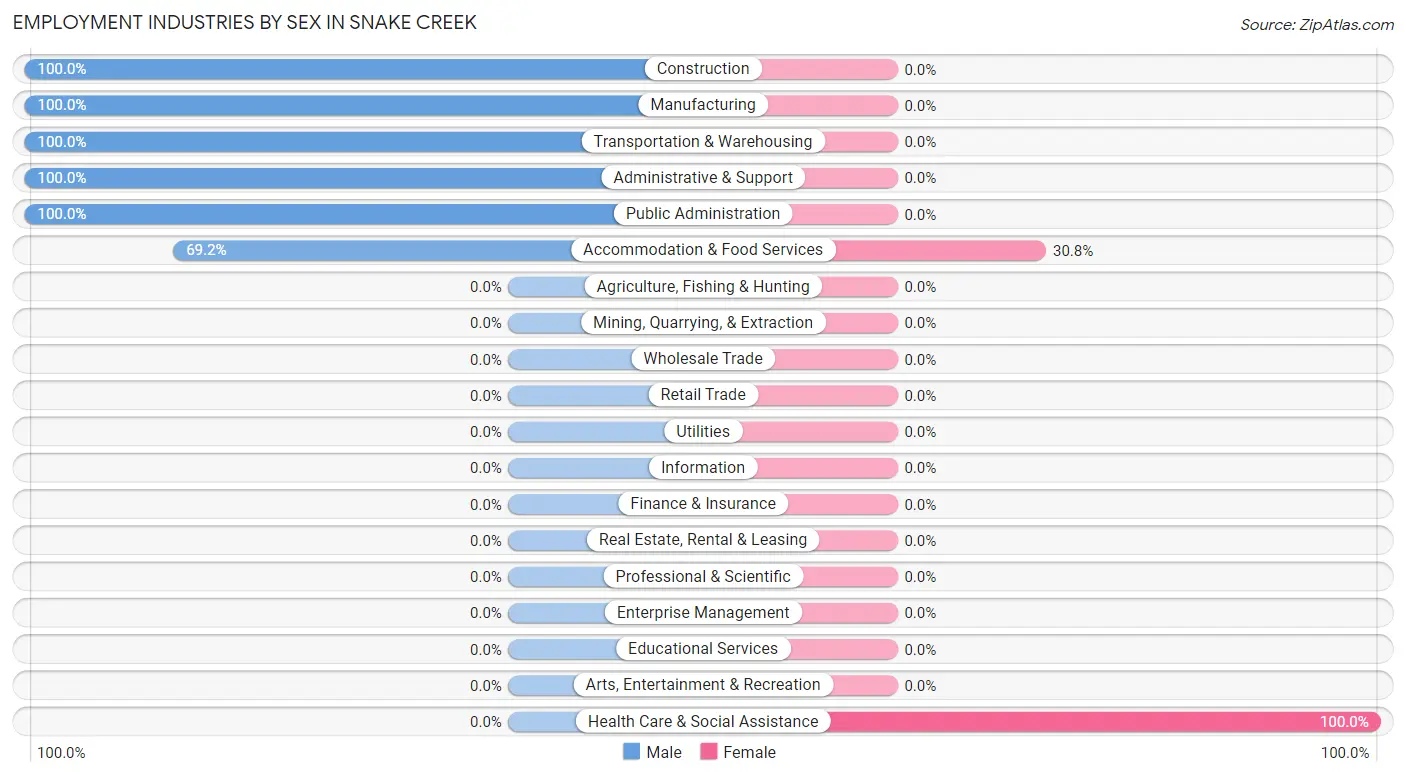
Employment Industries by Sex in Snake Creek
The Snake Creek industries that see more men than women are Construction (100.0%), Manufacturing (100.0%), and Transportation & Warehousing (100.0%), whereas the industries that tend to have a higher number of women are Health Care & Social Assistance (100.0%), and Accommodation & Food Services (30.8%).
| Industry | Male | Female |
| Agriculture, Fishing & Hunting | 0 (0.0%) | 0 (0.0%) |
| Mining, Quarrying, & Extraction | 0 (0.0%) | 0 (0.0%) |
| Construction | 37 (100.0%) | 0 (0.0%) |
| Manufacturing | 25 (100.0%) | 0 (0.0%) |
| Wholesale Trade | 0 (0.0%) | 0 (0.0%) |
| Retail Trade | 0 (0.0%) | 0 (0.0%) |
| Transportation & Warehousing | 15 (100.0%) | 0 (0.0%) |
| Utilities | 0 (0.0%) | 0 (0.0%) |
| Information | 0 (0.0%) | 0 (0.0%) |
| Finance & Insurance | 0 (0.0%) | 0 (0.0%) |
| Real Estate, Rental & Leasing | 0 (0.0%) | 0 (0.0%) |
| Professional & Scientific | 0 (0.0%) | 0 (0.0%) |
| Enterprise Management | 0 (0.0%) | 0 (0.0%) |
| Administrative & Support | 8 (100.0%) | 0 (0.0%) |
| Educational Services | 0 (0.0%) | 0 (0.0%) |
| Health Care & Social Assistance | 0 (0.0%) | 15 (100.0%) |
| Arts, Entertainment & Recreation | 0 (0.0%) | 0 (0.0%) |
| Accommodation & Food Services | 27 (69.2%) | 12 (30.8%) |
| Public Administration | 1 (100.0%) | 0 (0.0%) |
| Total | 113 (76.9%) | 34 (23.1%) |
Education in Snake Creek
School Enrollment in Snake Creek
The most common levels of schooling among the 34 students in Snake Creek are nursery / preschool (13 | 38.2%), elementary school (13 | 38.2%), and high school (8 | 23.5%).
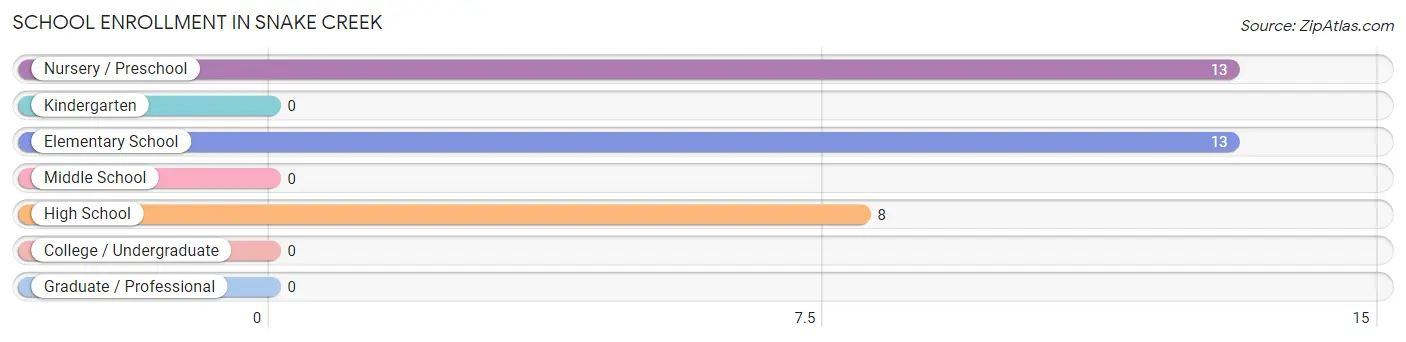
| School Level | # Students | % Students |
| Nursery / Preschool | 13 | 38.2% |
| Kindergarten | 0 | 0.0% |
| Elementary School | 13 | 38.2% |
| Middle School | 0 | 0.0% |
| High School | 8 | 23.5% |
| College / Undergraduate | 0 | 0.0% |
| Graduate / Professional | 0 | 0.0% |
| Total | 34 | 100.0% |
School Enrollment by Age by Funding Source in Snake Creek
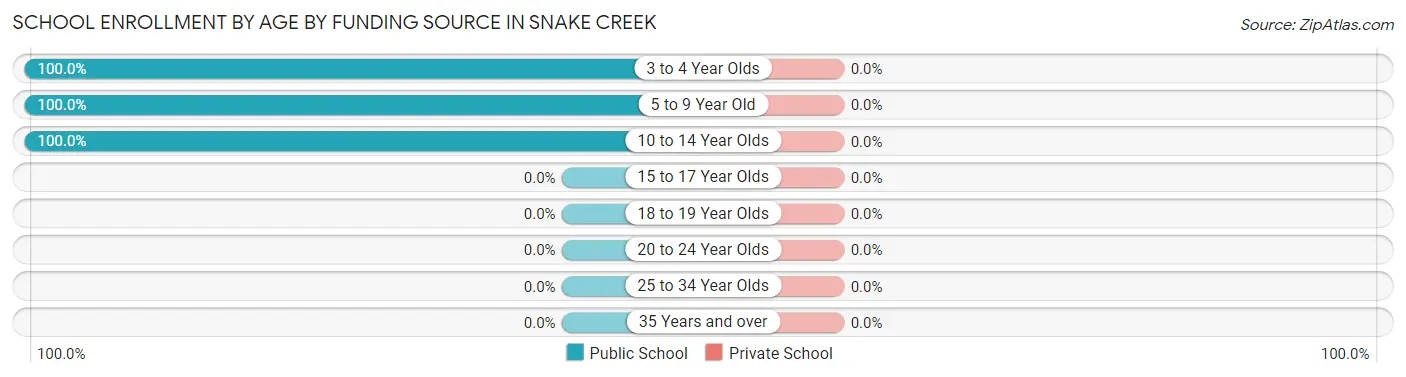
| Age Bracket | Public School | Private School |
| 3 to 4 Year Olds | 13 (100.0%) | 0 (0.0%) |
| 5 to 9 Year Old | 13 (100.0%) | 0 (0.0%) |
| 10 to 14 Year Olds | 8 (100.0%) | 0 (0.0%) |
| 15 to 17 Year Olds | 0 (0.0%) | 0 (0.0%) |
| 18 to 19 Year Olds | 0 (0.0%) | 0 (0.0%) |
| 20 to 24 Year Olds | 0 (0.0%) | 0 (0.0%) |
| 25 to 34 Year Olds | 0 (0.0%) | 0 (0.0%) |
| 35 Years and over | 0 (0.0%) | 0 (0.0%) |
| Total | 34 (100.0%) | 0 (0.0%) |
Educational Attainment by Field of Study in Snake Creek
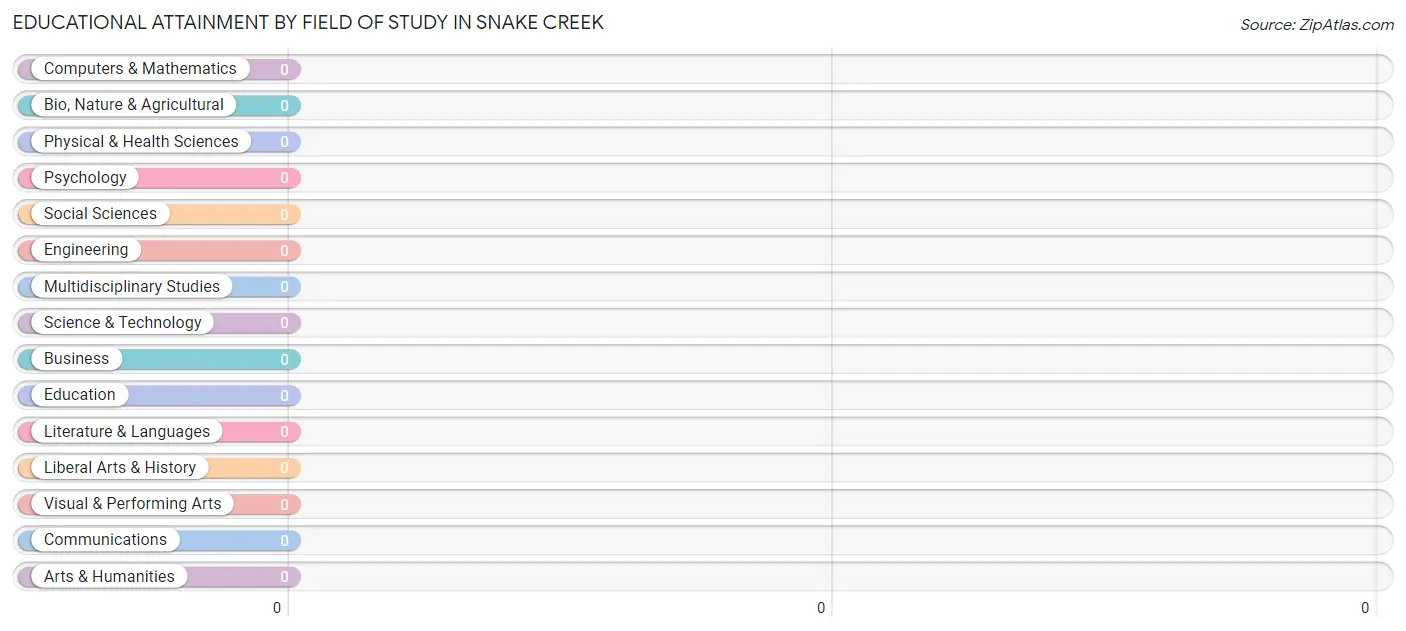
| Field of Study | # Graduates | % Graduates |
| Computers & Mathematics | 0 | 0.0% |
| Bio, Nature & Agricultural | 0 | 0.0% |
| Physical & Health Sciences | 0 | 0.0% |
| Psychology | 0 | 0.0% |
| Social Sciences | 0 | 0.0% |
| Engineering | 0 | 0.0% |
| Multidisciplinary Studies | 0 | 0.0% |
| Science & Technology | 0 | 0.0% |
| Business | 0 | 0.0% |
| Education | 0 | 0.0% |
| Literature & Languages | 0 | 0.0% |
| Liberal Arts & History | 0 | 0.0% |
| Visual & Performing Arts | 0 | 0.0% |
| Communications | 0 | 0.0% |
| Arts & Humanities | 0 | 0.0% |
| Total | 0 | 0.0% |
Transportation & Commute in Snake Creek
Vehicle Availability by Sex in Snake Creek
The most prevalent vehicle ownership categories in Snake Creek are males with 3 vehicles (80, accounting for 75.5%) and females with 3 vehicles (9, making up 296.3%).
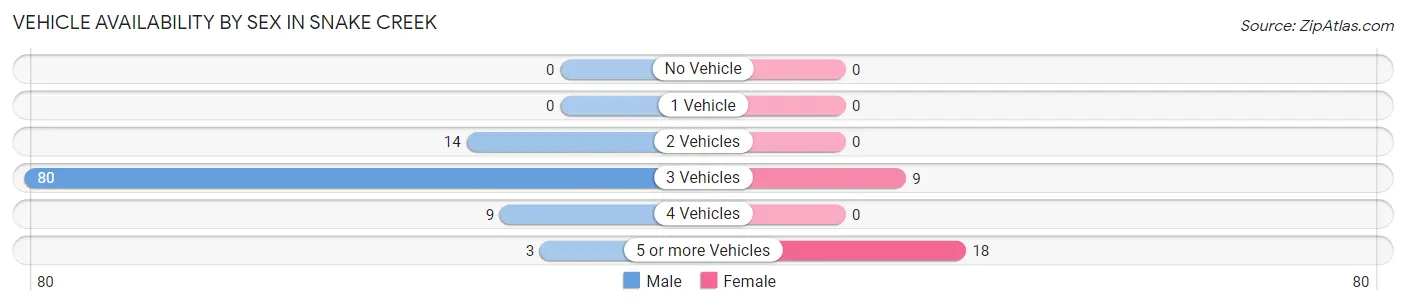
| Vehicles Available | Male | Female |
| No Vehicle | 0 (0.0%) | 0 (0.0%) |
| 1 Vehicle | 0 (0.0%) | 0 (0.0%) |
| 2 Vehicles | 14 (13.2%) | 0 (0.0%) |
| 3 Vehicles | 80 (75.5%) | 9 (33.3%) |
| 4 Vehicles | 9 (8.5%) | 0 (0.0%) |
| 5 or more Vehicles | 3 (2.8%) | 18 (66.7%) |
| Total | 106 (100.0%) | 27 (100.0%) |
Commute Time in Snake Creek
The most frequently occuring commute durations in Snake Creek are 20 to 24 minutes (48 commuters, 36.1%), 60 to 89 minutes (41 commuters, 30.8%), and 10 to 14 minutes (37 commuters, 27.8%).
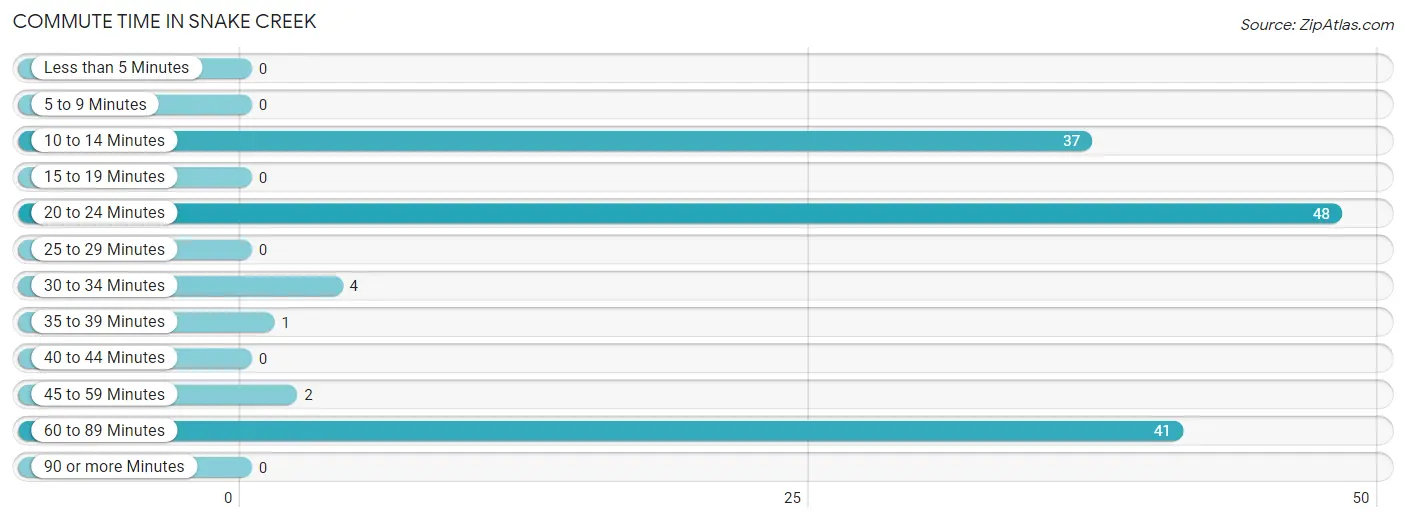
| Commute Time | # Commuters | % Commuters |
| Less than 5 Minutes | 0 | 0.0% |
| 5 to 9 Minutes | 0 | 0.0% |
| 10 to 14 Minutes | 37 | 27.8% |
| 15 to 19 Minutes | 0 | 0.0% |
| 20 to 24 Minutes | 48 | 36.1% |
| 25 to 29 Minutes | 0 | 0.0% |
| 30 to 34 Minutes | 4 | 3.0% |
| 35 to 39 Minutes | 1 | 0.7% |
| 40 to 44 Minutes | 0 | 0.0% |
| 45 to 59 Minutes | 2 | 1.5% |
| 60 to 89 Minutes | 41 | 30.8% |
| 90 or more Minutes | 0 | 0.0% |
Commute Time by Sex in Snake Creek
The most common commute times in Snake Creek are 20 to 24 minutes (43 commuters, 40.6%) for males and 60 to 89 minutes (20 commuters, 74.1%) for females.
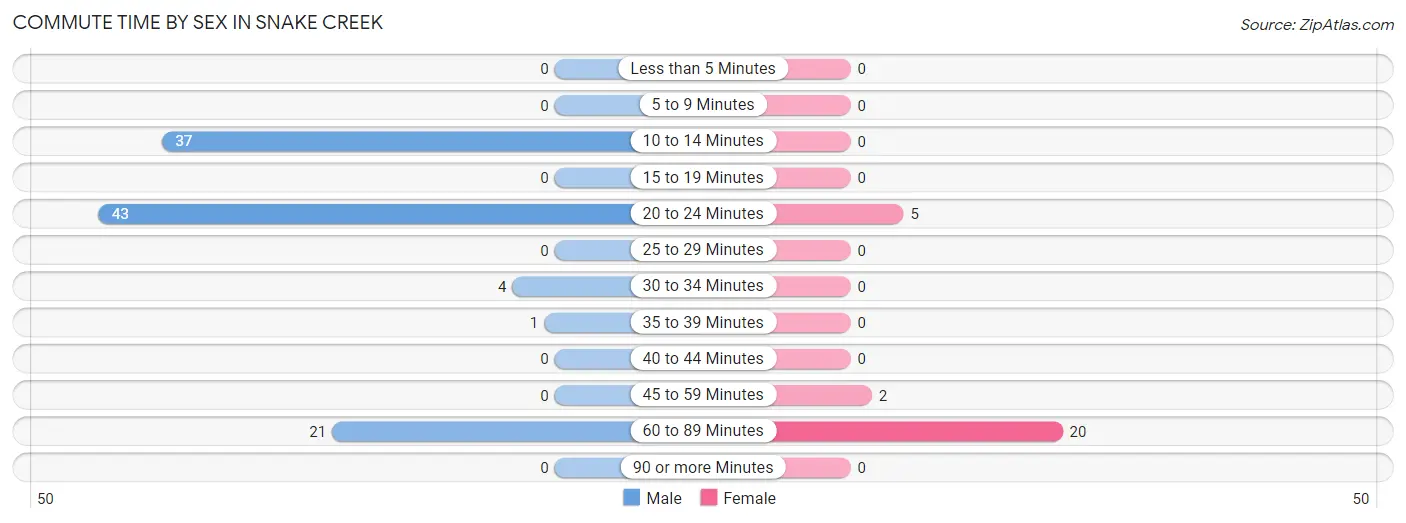
| Commute Time | Male | Female |
| Less than 5 Minutes | 0 (0.0%) | 0 (0.0%) |
| 5 to 9 Minutes | 0 (0.0%) | 0 (0.0%) |
| 10 to 14 Minutes | 37 (34.9%) | 0 (0.0%) |
| 15 to 19 Minutes | 0 (0.0%) | 0 (0.0%) |
| 20 to 24 Minutes | 43 (40.6%) | 5 (18.5%) |
| 25 to 29 Minutes | 0 (0.0%) | 0 (0.0%) |
| 30 to 34 Minutes | 4 (3.8%) | 0 (0.0%) |
| 35 to 39 Minutes | 1 (0.9%) | 0 (0.0%) |
| 40 to 44 Minutes | 0 (0.0%) | 0 (0.0%) |
| 45 to 59 Minutes | 0 (0.0%) | 2 (7.4%) |
| 60 to 89 Minutes | 21 (19.8%) | 20 (74.1%) |
| 90 or more Minutes | 0 (0.0%) | 0 (0.0%) |
Time of Departure to Work by Sex in Snake Creek
The most frequent times of departure to work in Snake Creek are 8:00 AM to 8:29 AM (38, 35.8%) for males and 4:00 PM to 11:59 PM (13, 48.1%) for females.
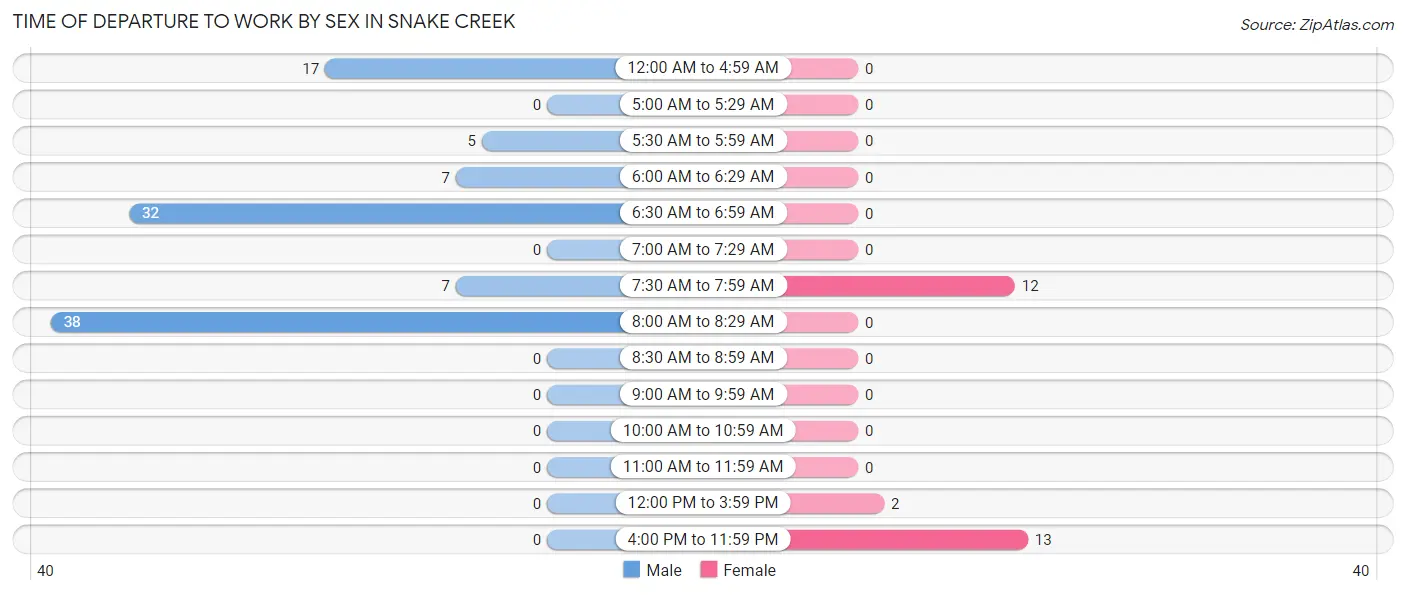
| Time of Departure | Male | Female |
| 12:00 AM to 4:59 AM | 17 (16.0%) | 0 (0.0%) |
| 5:00 AM to 5:29 AM | 0 (0.0%) | 0 (0.0%) |
| 5:30 AM to 5:59 AM | 5 (4.7%) | 0 (0.0%) |
| 6:00 AM to 6:29 AM | 7 (6.6%) | 0 (0.0%) |
| 6:30 AM to 6:59 AM | 32 (30.2%) | 0 (0.0%) |
| 7:00 AM to 7:29 AM | 0 (0.0%) | 0 (0.0%) |
| 7:30 AM to 7:59 AM | 7 (6.6%) | 12 (44.4%) |
| 8:00 AM to 8:29 AM | 38 (35.8%) | 0 (0.0%) |
| 8:30 AM to 8:59 AM | 0 (0.0%) | 0 (0.0%) |
| 9:00 AM to 9:59 AM | 0 (0.0%) | 0 (0.0%) |
| 10:00 AM to 10:59 AM | 0 (0.0%) | 0 (0.0%) |
| 11:00 AM to 11:59 AM | 0 (0.0%) | 0 (0.0%) |
| 12:00 PM to 3:59 PM | 0 (0.0%) | 2 (7.4%) |
| 4:00 PM to 11:59 PM | 0 (0.0%) | 13 (48.1%) |
| Total | 106 (100.0%) | 27 (100.0%) |
Housing Occupancy in Snake Creek
Occupancy by Ownership in Snake Creek
Of the total 90 dwellings in Snake Creek, owner-occupied units account for 68 (75.6%), while renter-occupied units make up 22 (24.4%).
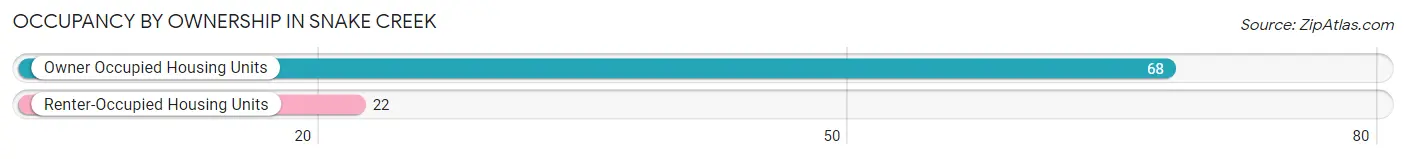
| Occupancy | # Housing Units | % Housing Units |
| Owner Occupied Housing Units | 68 | 75.6% |
| Renter-Occupied Housing Units | 22 | 24.4% |
| Total Occupied Housing Units | 90 | 100.0% |
Occupancy by Household Size in Snake Creek
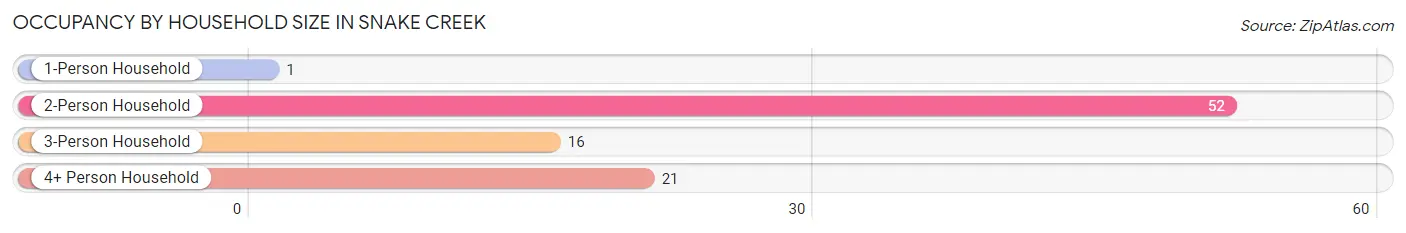
| Household Size | # Housing Units | % Housing Units |
| 1-Person Household | 1 | 1.1% |
| 2-Person Household | 52 | 57.8% |
| 3-Person Household | 16 | 17.8% |
| 4+ Person Household | 21 | 23.3% |
| Total Housing Units | 90 | 100.0% |
Occupancy by Ownership by Household Size in Snake Creek
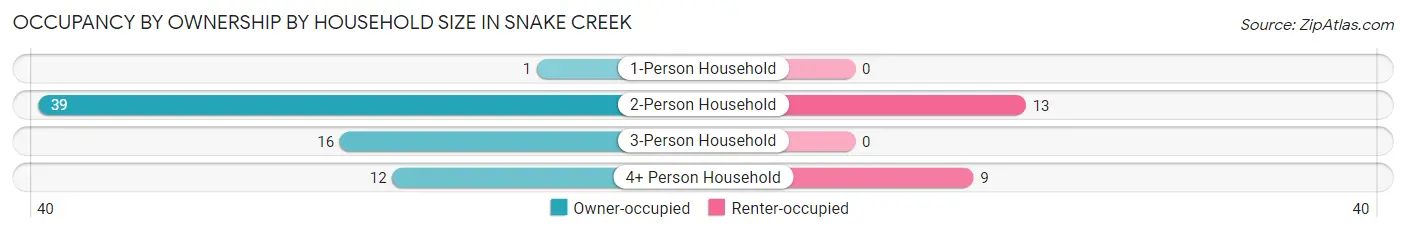
| Household Size | Owner-occupied | Renter-occupied |
| 1-Person Household | 1 (100.0%) | 0 (0.0%) |
| 2-Person Household | 39 (75.0%) | 13 (25.0%) |
| 3-Person Household | 16 (100.0%) | 0 (0.0%) |
| 4+ Person Household | 12 (57.1%) | 9 (42.9%) |
| Total Housing Units | 68 (75.6%) | 22 (24.4%) |
Occupancy by Educational Attainment in Snake Creek
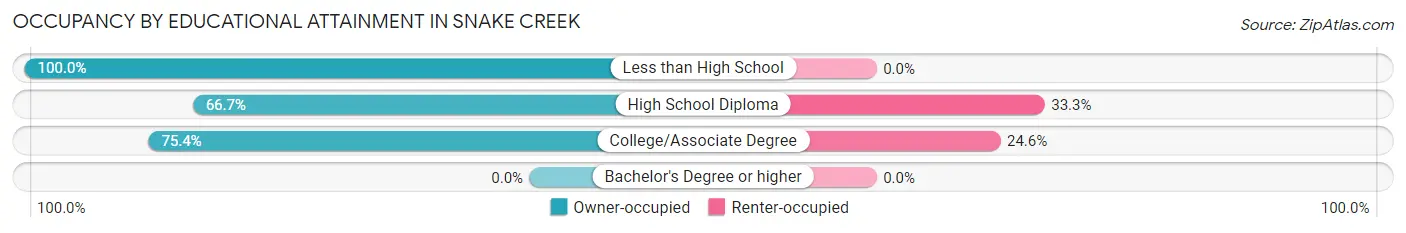
| Household Size | Owner-occupied | Renter-occupied |
| Less than High School | 9 (100.0%) | 0 (0.0%) |
| High School Diploma | 16 (66.7%) | 8 (33.3%) |
| College/Associate Degree | 43 (75.4%) | 14 (24.6%) |
| Bachelor's Degree or higher | 0 (0.0%) | 0 (0.0%) |
Occupancy by Age of Householder in Snake Creek
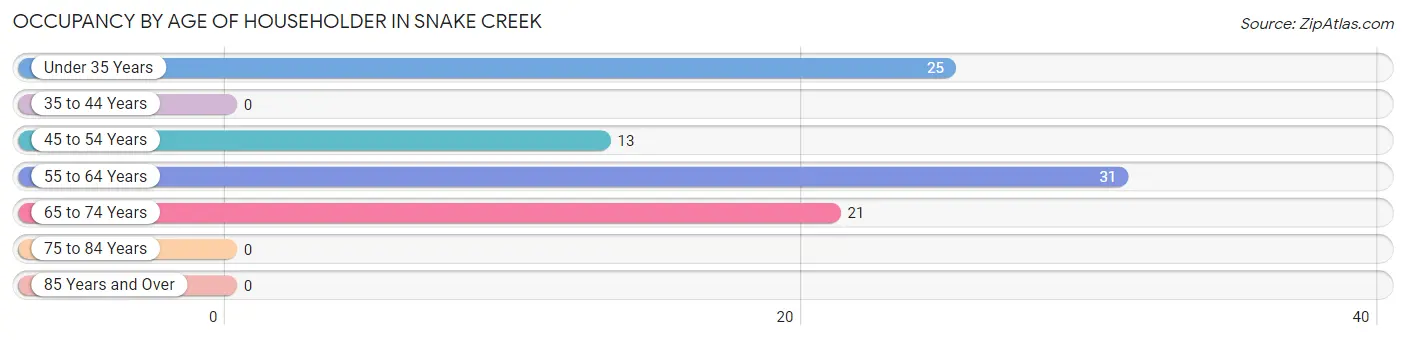
| Age Bracket | # Households | % Households |
| Under 35 Years | 25 | 27.8% |
| 35 to 44 Years | 0 | 0.0% |
| 45 to 54 Years | 13 | 14.4% |
| 55 to 64 Years | 31 | 34.4% |
| 65 to 74 Years | 21 | 23.3% |
| 75 to 84 Years | 0 | 0.0% |
| 85 Years and Over | 0 | 0.0% |
| Total | 90 | 100.0% |
Housing Finances in Snake Creek
Median Income by Occupancy in Snake Creek
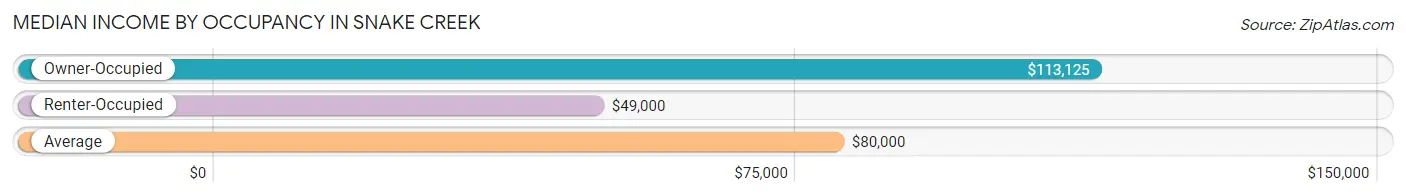
| Occupancy Type | # Households | Median Income |
| Owner-Occupied | 68 (75.6%) | $113,125 |
| Renter-Occupied | 22 (24.4%) | $49,000 |
| Average | 90 (100.0%) | $80,000 |
Occupancy by Householder Income Bracket in Snake Creek
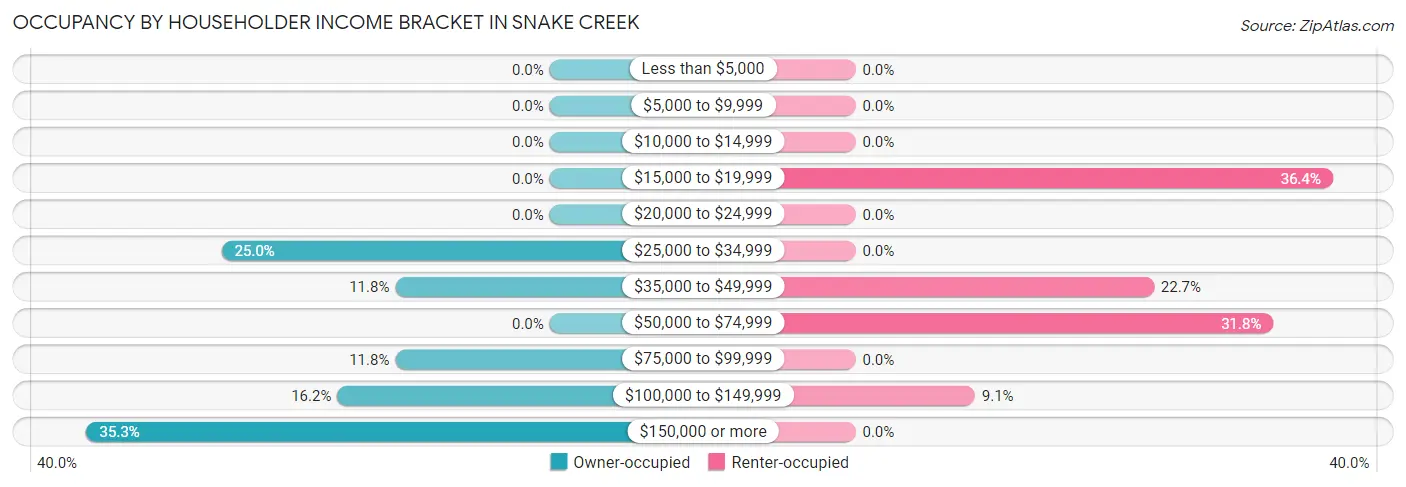
| Income Bracket | Owner-occupied | Renter-occupied |
| Less than $5,000 | 0 (0.0%) | 0 (0.0%) |
| $5,000 to $9,999 | 0 (0.0%) | 0 (0.0%) |
| $10,000 to $14,999 | 0 (0.0%) | 0 (0.0%) |
| $15,000 to $19,999 | 0 (0.0%) | 8 (36.4%) |
| $20,000 to $24,999 | 0 (0.0%) | 0 (0.0%) |
| $25,000 to $34,999 | 17 (25.0%) | 0 (0.0%) |
| $35,000 to $49,999 | 8 (11.8%) | 5 (22.7%) |
| $50,000 to $74,999 | 0 (0.0%) | 7 (31.8%) |
| $75,000 to $99,999 | 8 (11.8%) | 0 (0.0%) |
| $100,000 to $149,999 | 11 (16.2%) | 2 (9.1%) |
| $150,000 or more | 24 (35.3%) | 0 (0.0%) |
| Total | 68 (100.0%) | 22 (100.0%) |
Monthly Housing Cost Tiers in Snake Creek
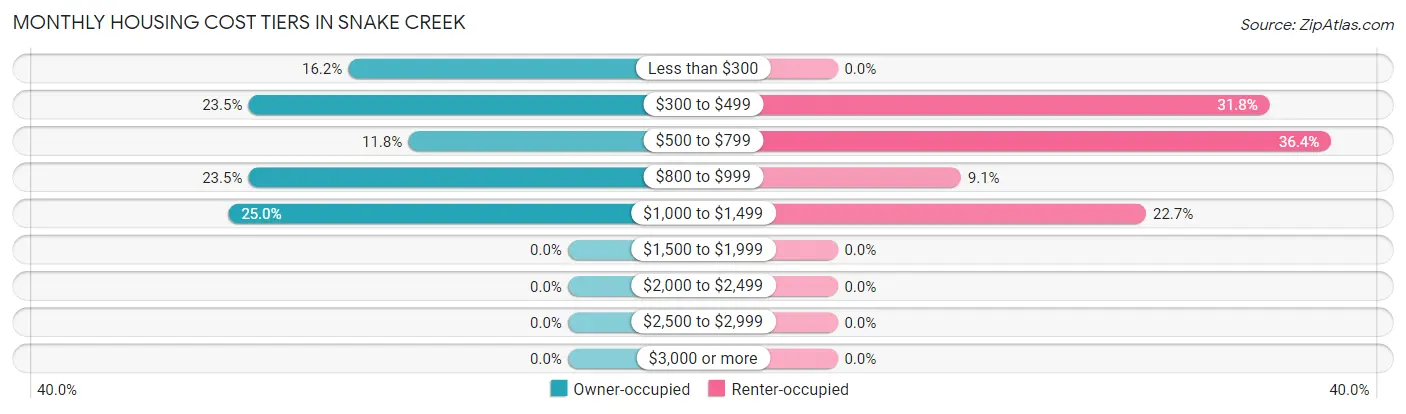
| Monthly Cost | Owner-occupied | Renter-occupied |
| Less than $300 | 11 (16.2%) | 0 (0.0%) |
| $300 to $499 | 16 (23.5%) | 7 (31.8%) |
| $500 to $799 | 8 (11.8%) | 8 (36.4%) |
| $800 to $999 | 16 (23.5%) | 2 (9.1%) |
| $1,000 to $1,499 | 17 (25.0%) | 5 (22.7%) |
| $1,500 to $1,999 | 0 (0.0%) | 0 (0.0%) |
| $2,000 to $2,499 | 0 (0.0%) | 0 (0.0%) |
| $2,500 to $2,999 | 0 (0.0%) | 0 (0.0%) |
| $3,000 or more | 0 (0.0%) | 0 (0.0%) |
| Total | 68 (100.0%) | 22 (100.0%) |
Physical Housing Characteristics in Snake Creek
Housing Structures in Snake Creek
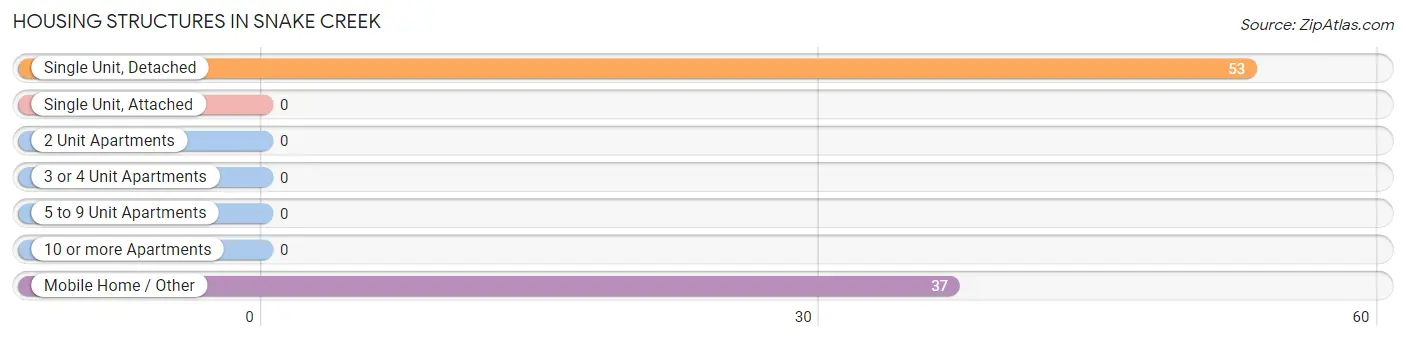
| Structure Type | # Housing Units | % Housing Units |
| Single Unit, Detached | 53 | 58.9% |
| Single Unit, Attached | 0 | 0.0% |
| 2 Unit Apartments | 0 | 0.0% |
| 3 or 4 Unit Apartments | 0 | 0.0% |
| 5 to 9 Unit Apartments | 0 | 0.0% |
| 10 or more Apartments | 0 | 0.0% |
| Mobile Home / Other | 37 | 41.1% |
| Total | 90 | 100.0% |
Housing Structures by Occupancy in Snake Creek
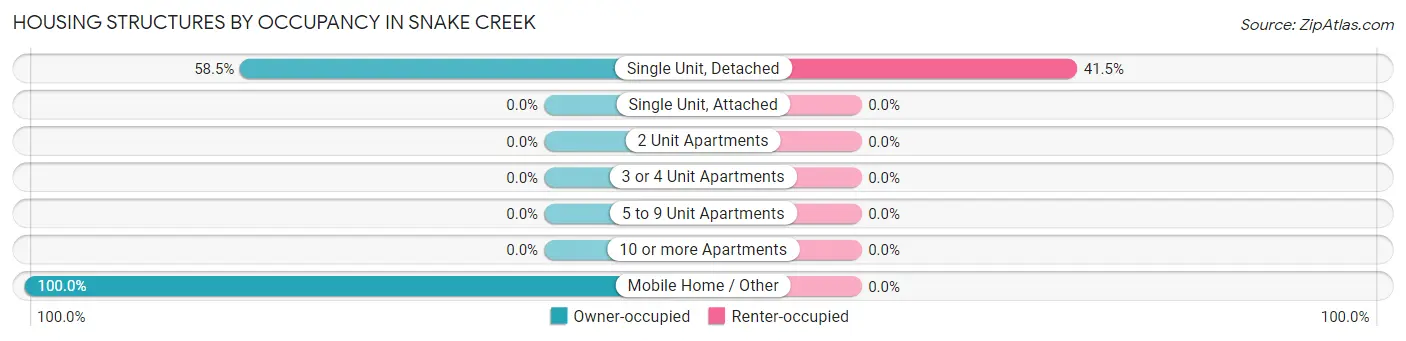
| Structure Type | Owner-occupied | Renter-occupied |
| Single Unit, Detached | 31 (58.5%) | 22 (41.5%) |
| Single Unit, Attached | 0 (0.0%) | 0 (0.0%) |
| 2 Unit Apartments | 0 (0.0%) | 0 (0.0%) |
| 3 or 4 Unit Apartments | 0 (0.0%) | 0 (0.0%) |
| 5 to 9 Unit Apartments | 0 (0.0%) | 0 (0.0%) |
| 10 or more Apartments | 0 (0.0%) | 0 (0.0%) |
| Mobile Home / Other | 37 (100.0%) | 0 (0.0%) |
| Total | 68 (75.6%) | 22 (24.4%) |
Housing Structures by Number of Rooms in Snake Creek
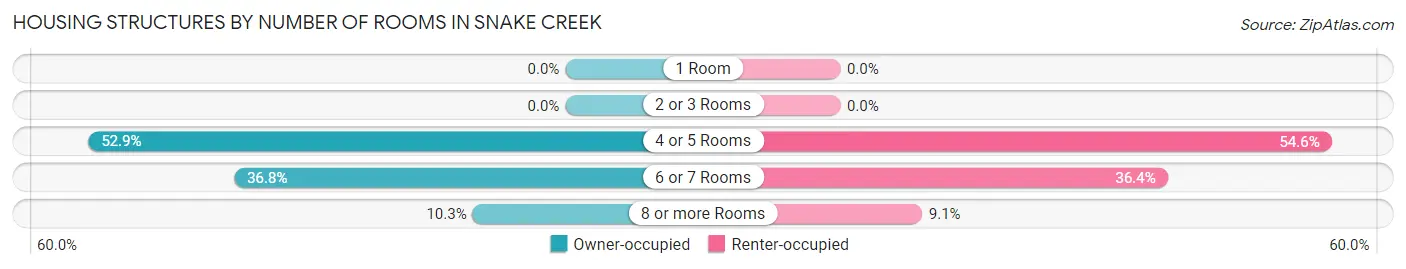
| Number of Rooms | Owner-occupied | Renter-occupied |
| 1 Room | 0 (0.0%) | 0 (0.0%) |
| 2 or 3 Rooms | 0 (0.0%) | 0 (0.0%) |
| 4 or 5 Rooms | 36 (52.9%) | 12 (54.5%) |
| 6 or 7 Rooms | 25 (36.8%) | 8 (36.4%) |
| 8 or more Rooms | 7 (10.3%) | 2 (9.1%) |
| Total | 68 (100.0%) | 22 (100.0%) |
Housing Structure by Heating Type in Snake Creek
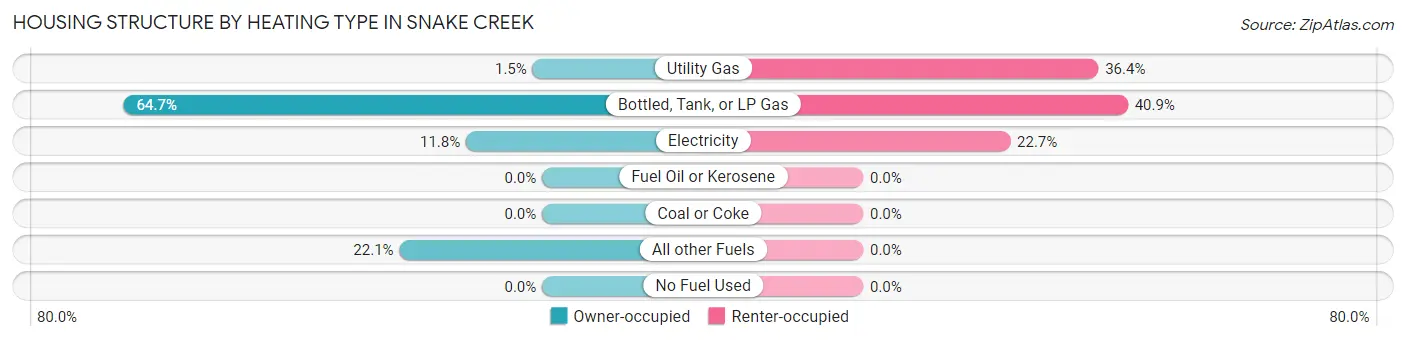
| Heating Type | Owner-occupied | Renter-occupied |
| Utility Gas | 1 (1.5%) | 8 (36.4%) |
| Bottled, Tank, or LP Gas | 44 (64.7%) | 9 (40.9%) |
| Electricity | 8 (11.8%) | 5 (22.7%) |
| Fuel Oil or Kerosene | 0 (0.0%) | 0 (0.0%) |
| Coal or Coke | 0 (0.0%) | 0 (0.0%) |
| All other Fuels | 15 (22.1%) | 0 (0.0%) |
| No Fuel Used | 0 (0.0%) | 0 (0.0%) |
| Total | 68 (100.0%) | 22 (100.0%) |
Household Vehicle Usage in Snake Creek
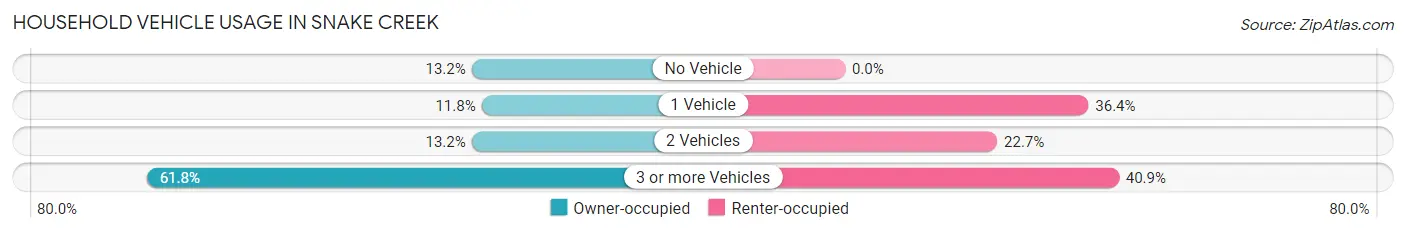
| Vehicles per Household | Owner-occupied | Renter-occupied |
| No Vehicle | 9 (13.2%) | 0 (0.0%) |
| 1 Vehicle | 8 (11.8%) | 8 (36.4%) |
| 2 Vehicles | 9 (13.2%) | 5 (22.7%) |
| 3 or more Vehicles | 42 (61.8%) | 9 (40.9%) |
| Total | 68 (100.0%) | 22 (100.0%) |
Real Estate & Mortgages in Snake Creek
Real Estate and Mortgage Overview in Snake Creek
| Characteristic | Without Mortgage | With Mortgage |
| Housing Units | 35 | 33 |
| Median Property Value | - | - |
| Median Household Income | $131,964 | $8 |
| Monthly Housing Costs | $441 | $0 |
| Real Estate Taxes | - | - |
Property Value by Mortgage Status in Snake Creek
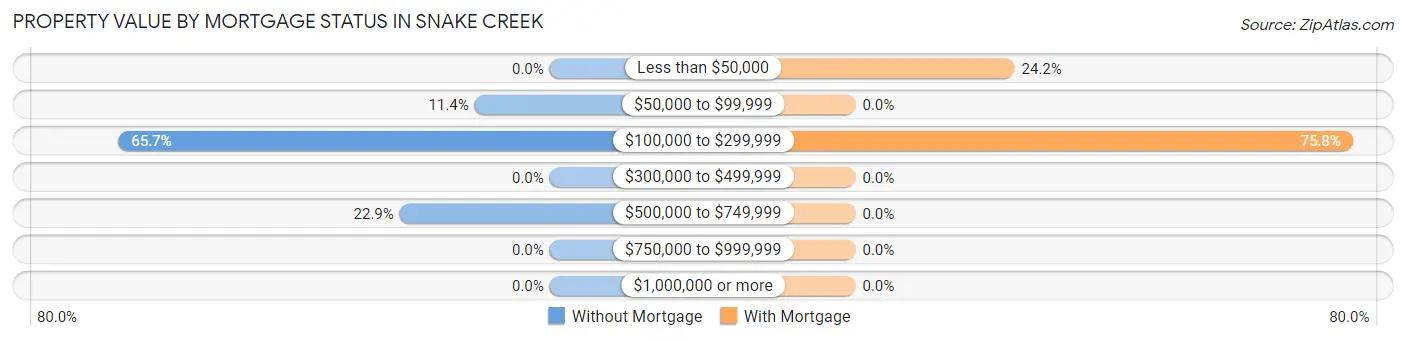
| Property Value | Without Mortgage | With Mortgage |
| Less than $50,000 | 0 (0.0%) | 8 (24.2%) |
| $50,000 to $99,999 | 4 (11.4%) | 0 (0.0%) |
| $100,000 to $299,999 | 23 (65.7%) | 25 (75.8%) |
| $300,000 to $499,999 | 0 (0.0%) | 0 (0.0%) |
| $500,000 to $749,999 | 8 (22.9%) | 0 (0.0%) |
| $750,000 to $999,999 | 0 (0.0%) | 0 (0.0%) |
| $1,000,000 or more | 0 (0.0%) | 0 (0.0%) |
| Total | 35 (100.0%) | 33 (100.0%) |
Household Income by Mortgage Status in Snake Creek
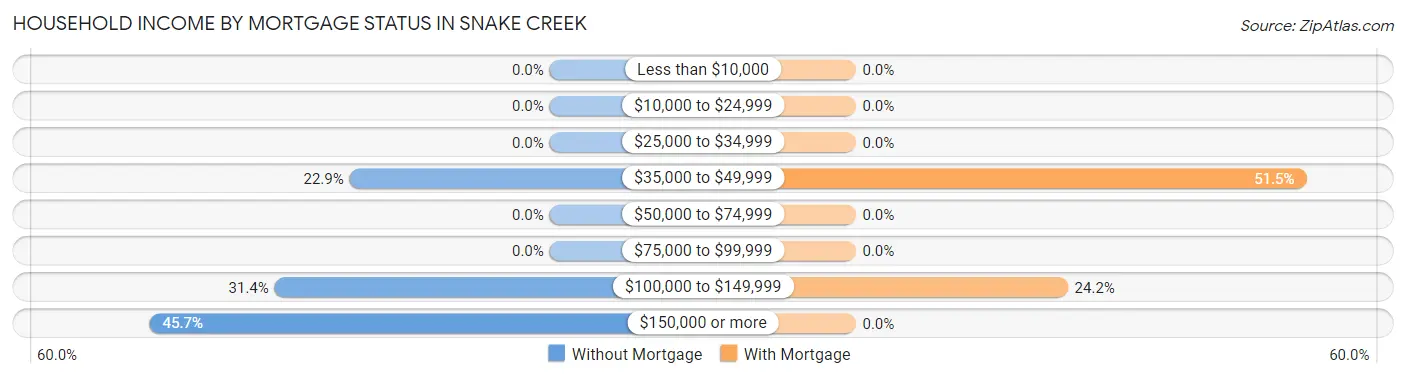
| Household Income | Without Mortgage | With Mortgage |
| Less than $10,000 | 0 (0.0%) | 0 (0.0%) |
| $10,000 to $24,999 | 0 (0.0%) | 0 (0.0%) |
| $25,000 to $34,999 | 0 (0.0%) | 0 (0.0%) |
| $35,000 to $49,999 | 8 (22.9%) | 17 (51.5%) |
| $50,000 to $74,999 | 0 (0.0%) | 0 (0.0%) |
| $75,000 to $99,999 | 0 (0.0%) | 0 (0.0%) |
| $100,000 to $149,999 | 11 (31.4%) | 8 (24.2%) |
| $150,000 or more | 16 (45.7%) | 0 (0.0%) |
| Total | 35 (100.0%) | 33 (100.0%) |
Property Value to Household Income Ratio in Snake Creek
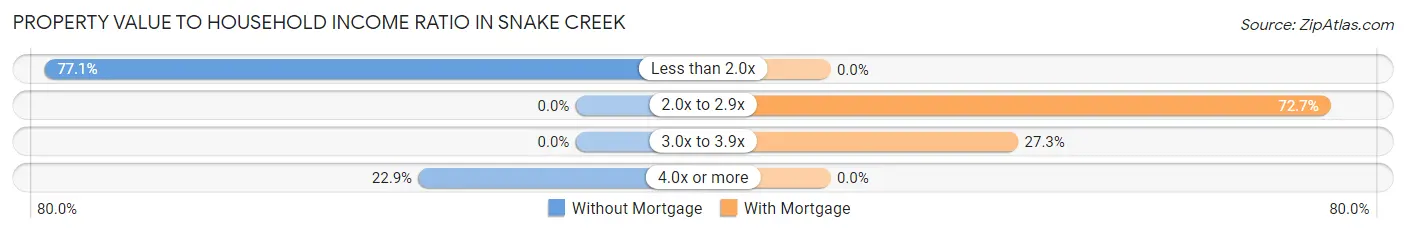
| Value-to-Income Ratio | Without Mortgage | With Mortgage |
| Less than 2.0x | 27 (77.1%) | 0 (0.0%) |
| 2.0x to 2.9x | 0 (0.0%) | 24 (72.7%) |
| 3.0x to 3.9x | 0 (0.0%) | 9 (27.3%) |
| 4.0x or more | 8 (22.9%) | 0 (0.0%) |
| Total | 35 (100.0%) | 33 (100.0%) |
Real Estate Taxes by Mortgage Status in Snake Creek
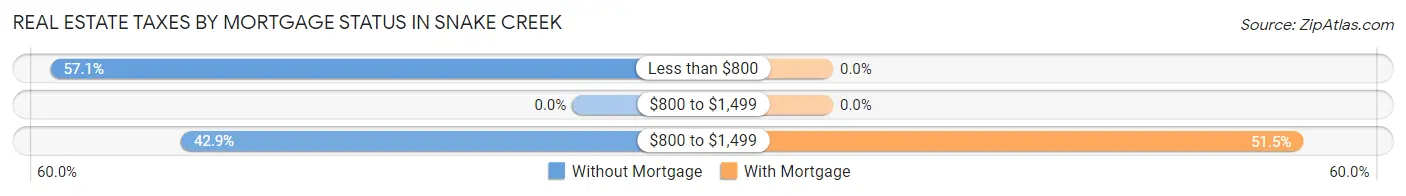
| Property Taxes | Without Mortgage | With Mortgage |
| Less than $800 | 20 (57.1%) | 0 (0.0%) |
| $800 to $1,499 | 0 (0.0%) | 0 (0.0%) |
| $800 to $1,499 | 15 (42.9%) | 17 (51.5%) |
| Total | 35 (100.0%) | 33 (100.0%) |
Health & Disability in Snake Creek
Health Insurance Coverage by Age in Snake Creek
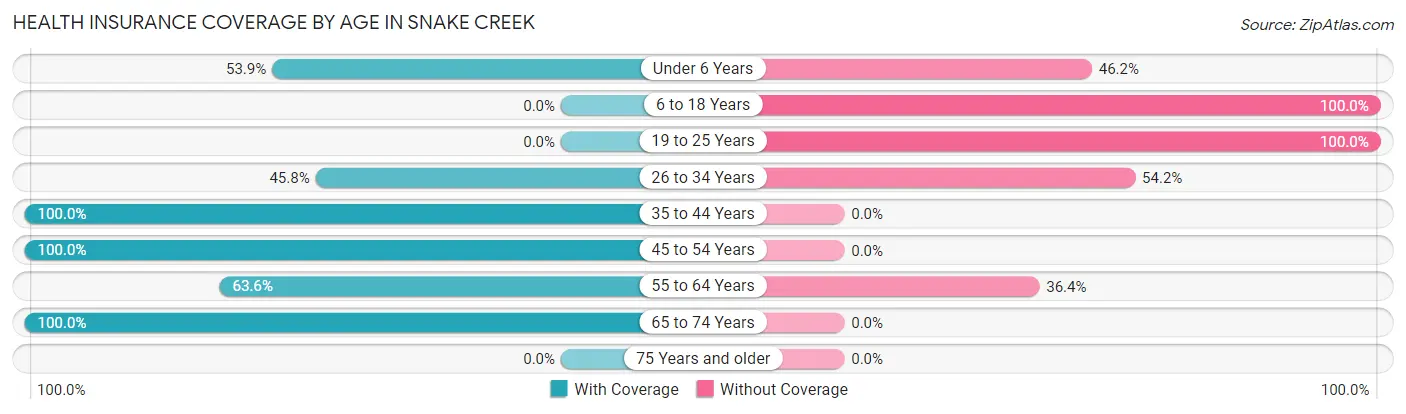
| Age Bracket | With Coverage | Without Coverage |
| Under 6 Years | 14 (53.8%) | 12 (46.2%) |
| 6 to 18 Years | 0 (0.0%) | 21 (100.0%) |
| 19 to 25 Years | 0 (0.0%) | 18 (100.0%) |
| 26 to 34 Years | 27 (45.8%) | 32 (54.2%) |
| 35 to 44 Years | 5 (100.0%) | 0 (0.0%) |
| 45 to 54 Years | 45 (100.0%) | 0 (0.0%) |
| 55 to 64 Years | 28 (63.6%) | 16 (36.4%) |
| 65 to 74 Years | 77 (100.0%) | 0 (0.0%) |
| 75 Years and older | 0 (0.0%) | 0 (0.0%) |
| Total | 196 (66.4%) | 99 (33.6%) |
Health Insurance Coverage by Citizenship Status in Snake Creek
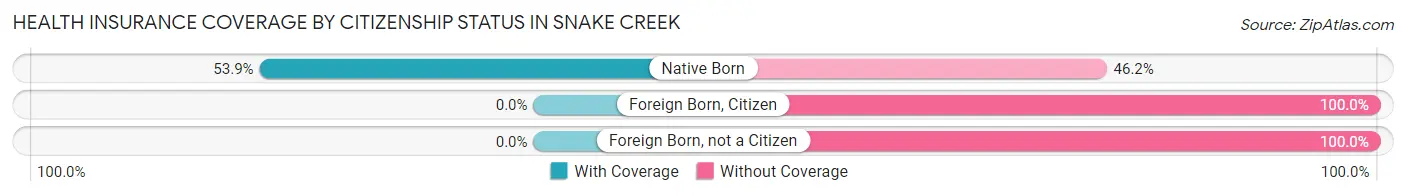
| Citizenship Status | With Coverage | Without Coverage |
| Native Born | 14 (53.8%) | 12 (46.2%) |
| Foreign Born, Citizen | 0 (0.0%) | 21 (100.0%) |
| Foreign Born, not a Citizen | 0 (0.0%) | 18 (100.0%) |
Health Insurance Coverage by Household Income in Snake Creek
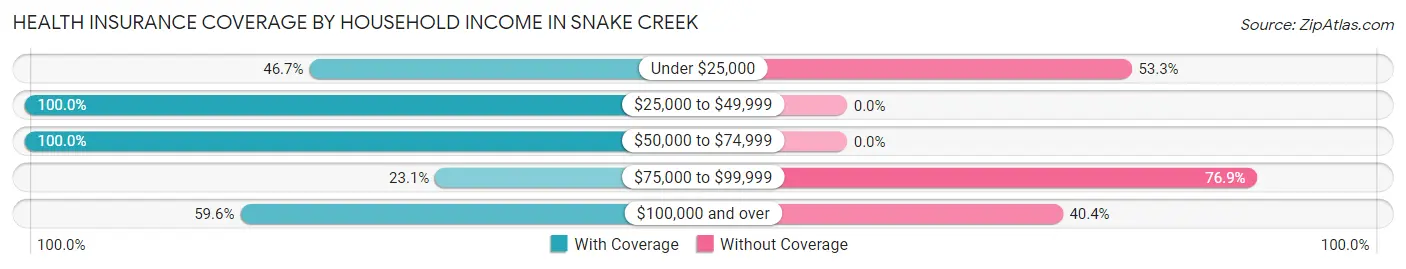
| Household Income | With Coverage | Without Coverage |
| Under $25,000 | 7 (46.7%) | 8 (53.3%) |
| $25,000 to $49,999 | 62 (100.0%) | 0 (0.0%) |
| $50,000 to $74,999 | 28 (100.0%) | 0 (0.0%) |
| $75,000 to $99,999 | 9 (23.1%) | 30 (76.9%) |
| $100,000 and over | 90 (59.6%) | 61 (40.4%) |
Public vs Private Health Insurance Coverage by Age in Snake Creek
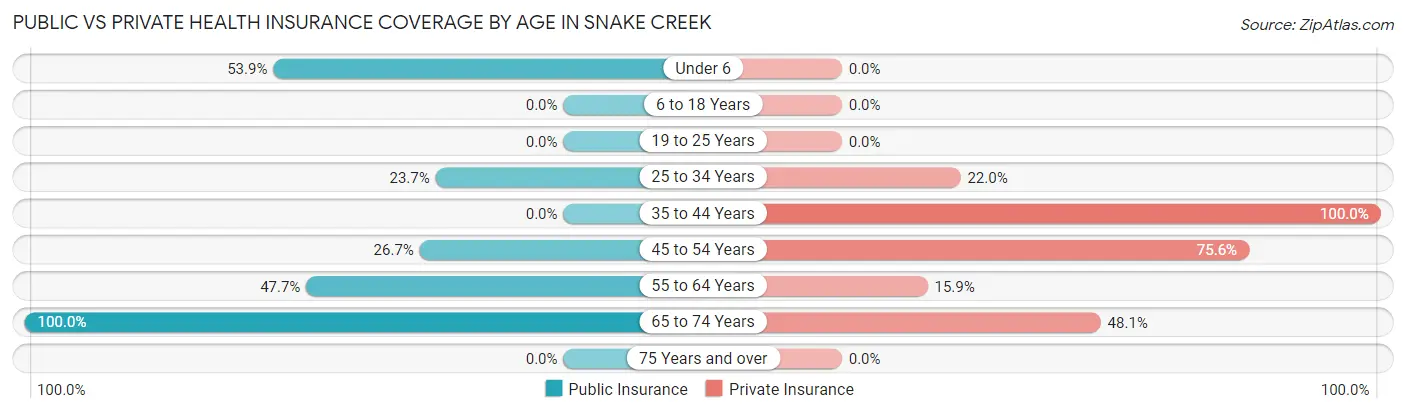
| Age Bracket | Public Insurance | Private Insurance |
| Under 6 | 14 (53.8%) | 0 (0.0%) |
| 6 to 18 Years | 0 (0.0%) | 0 (0.0%) |
| 19 to 25 Years | 0 (0.0%) | 0 (0.0%) |
| 25 to 34 Years | 14 (23.7%) | 13 (22.0%) |
| 35 to 44 Years | 0 (0.0%) | 5 (100.0%) |
| 45 to 54 Years | 12 (26.7%) | 34 (75.6%) |
| 55 to 64 Years | 21 (47.7%) | 7 (15.9%) |
| 65 to 74 Years | 77 (100.0%) | 37 (48.0%) |
| 75 Years and over | 0 (0.0%) | 0 (0.0%) |
| Total | 138 (46.8%) | 96 (32.5%) |
Disability Status by Sex by Age in Snake Creek
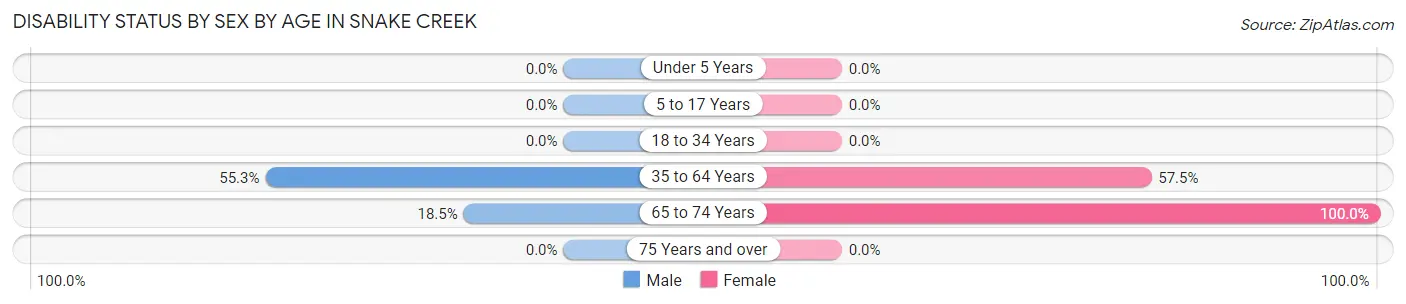
| Age Bracket | Male | Female |
| Under 5 Years | 0 (0.0%) | 0 (0.0%) |
| 5 to 17 Years | 0 (0.0%) | 0 (0.0%) |
| 18 to 34 Years | 0 (0.0%) | 0 (0.0%) |
| 35 to 64 Years | 26 (55.3%) | 27 (57.5%) |
| 65 to 74 Years | 10 (18.5%) | 23 (100.0%) |
| 75 Years and over | 0 (0.0%) | 0 (0.0%) |
Disability Class by Sex by Age in Snake Creek
Disability Class: Hearing Difficulty
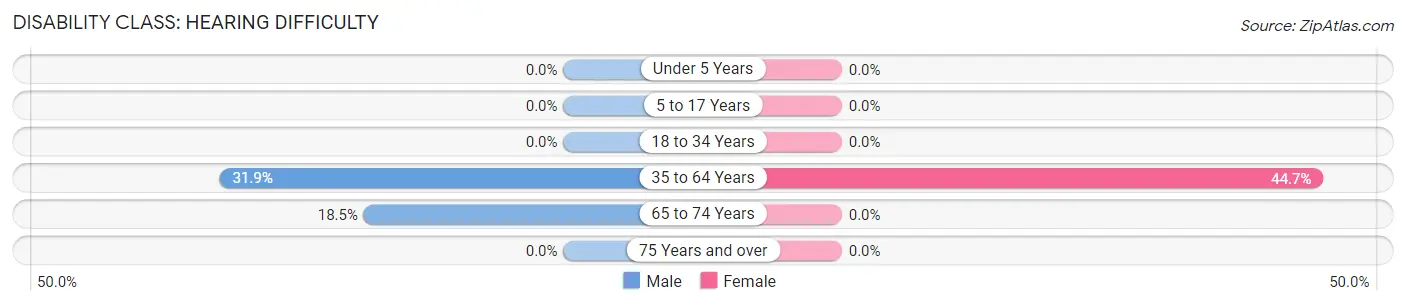
| Age Bracket | Male | Female |
| Under 5 Years | 0 (0.0%) | 0 (0.0%) |
| 5 to 17 Years | 0 (0.0%) | 0 (0.0%) |
| 18 to 34 Years | 0 (0.0%) | 0 (0.0%) |
| 35 to 64 Years | 15 (31.9%) | 21 (44.7%) |
| 65 to 74 Years | 10 (18.5%) | 0 (0.0%) |
| 75 Years and over | 0 (0.0%) | 0 (0.0%) |
Disability Class: Vision Difficulty
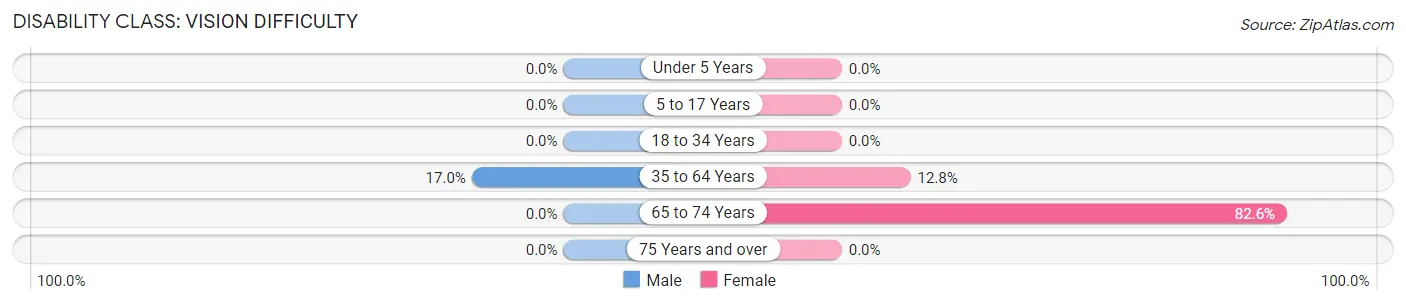
| Age Bracket | Male | Female |
| Under 5 Years | 0 (0.0%) | 0 (0.0%) |
| 5 to 17 Years | 0 (0.0%) | 0 (0.0%) |
| 18 to 34 Years | 0 (0.0%) | 0 (0.0%) |
| 35 to 64 Years | 8 (17.0%) | 6 (12.8%) |
| 65 to 74 Years | 0 (0.0%) | 19 (82.6%) |
| 75 Years and over | 0 (0.0%) | 0 (0.0%) |
Disability Class: Cognitive Difficulty
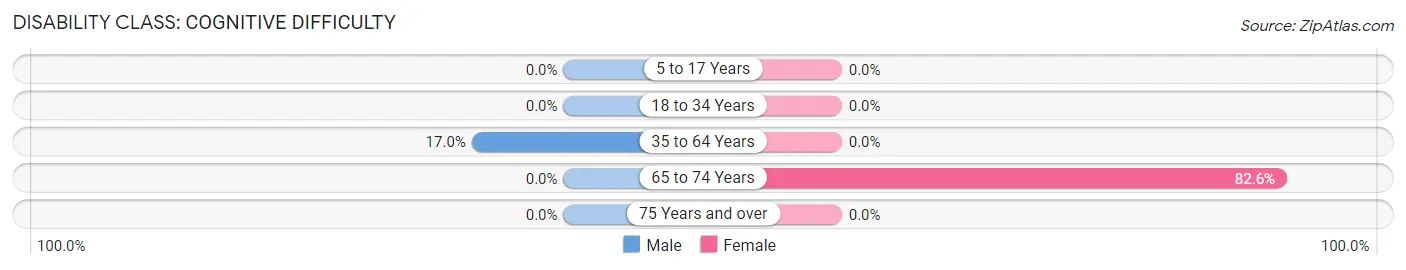
| Age Bracket | Male | Female |
| 5 to 17 Years | 0 (0.0%) | 0 (0.0%) |
| 18 to 34 Years | 0 (0.0%) | 0 (0.0%) |
| 35 to 64 Years | 8 (17.0%) | 0 (0.0%) |
| 65 to 74 Years | 0 (0.0%) | 19 (82.6%) |
| 75 Years and over | 0 (0.0%) | 0 (0.0%) |
Disability Class: Ambulatory Difficulty
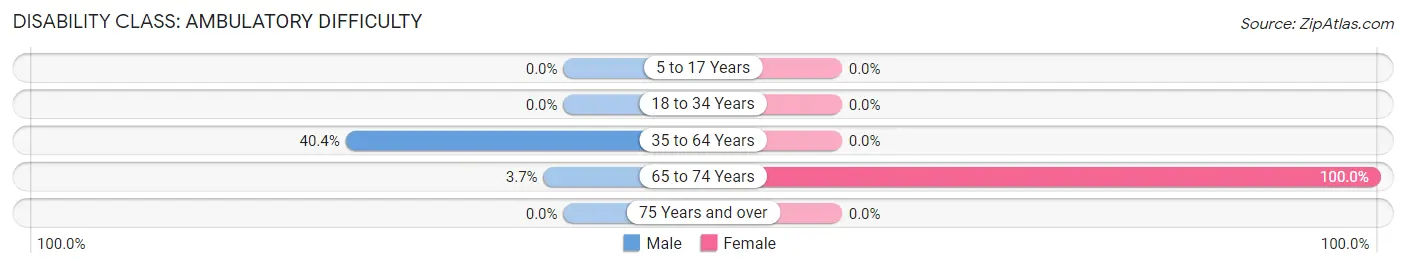
| Age Bracket | Male | Female |
| 5 to 17 Years | 0 (0.0%) | 0 (0.0%) |
| 18 to 34 Years | 0 (0.0%) | 0 (0.0%) |
| 35 to 64 Years | 19 (40.4%) | 0 (0.0%) |
| 65 to 74 Years | 2 (3.7%) | 23 (100.0%) |
| 75 Years and over | 0 (0.0%) | 0 (0.0%) |
Disability Class: Self-Care Difficulty
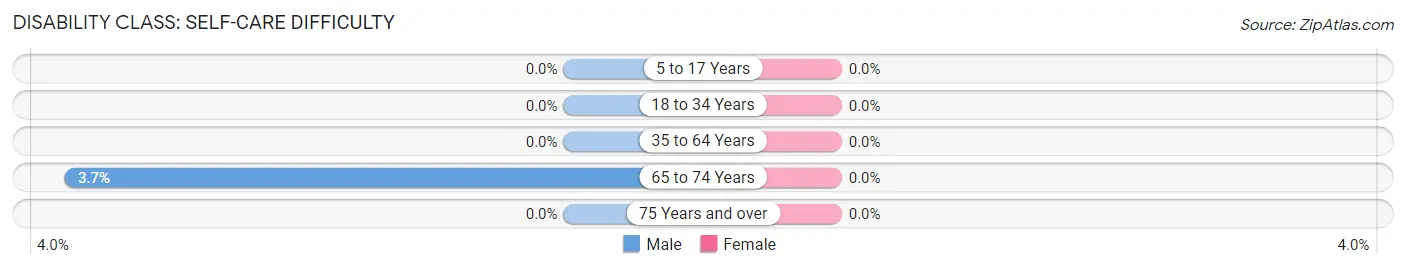
| Age Bracket | Male | Female |
| 5 to 17 Years | 0 (0.0%) | 0 (0.0%) |
| 18 to 34 Years | 0 (0.0%) | 0 (0.0%) |
| 35 to 64 Years | 0 (0.0%) | 0 (0.0%) |
| 65 to 74 Years | 2 (3.7%) | 0 (0.0%) |
| 75 Years and over | 0 (0.0%) | 0 (0.0%) |
Technology Access in Snake Creek
Computing Device Access in Snake Creek
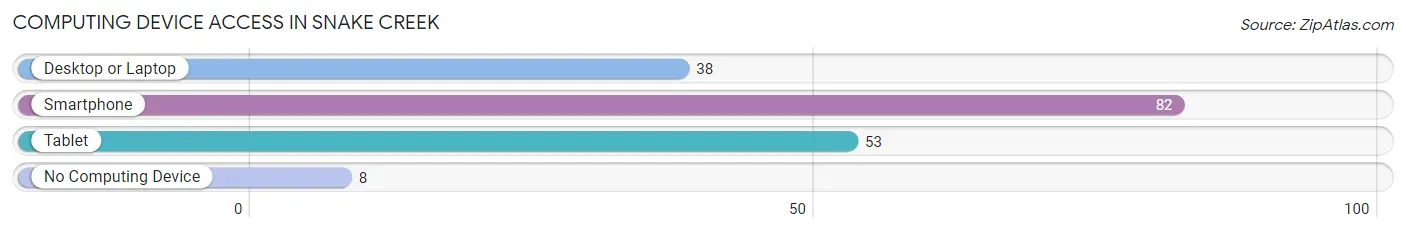
| Device Type | # Households | % Households |
| Desktop or Laptop | 38 | 42.2% |
| Smartphone | 82 | 91.1% |
| Tablet | 53 | 58.9% |
| No Computing Device | 8 | 8.9% |
| Total | 90 | 100.0% |
Internet Access in Snake Creek
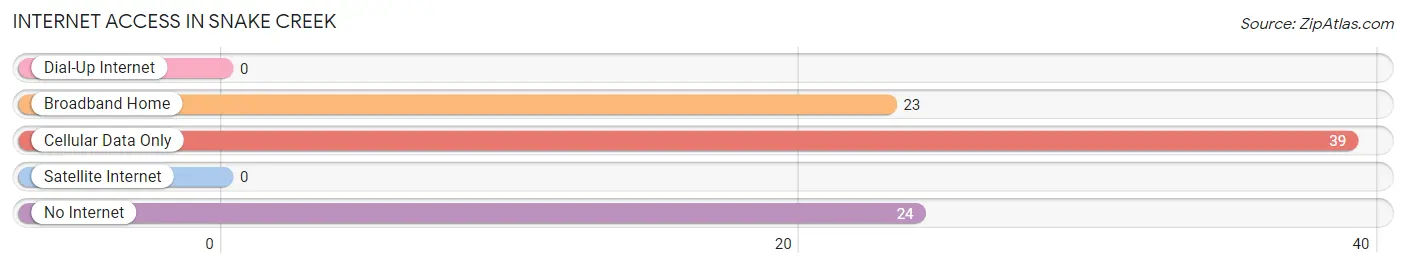
| Internet Type | # Households | % Households |
| Dial-Up Internet | 0 | 0.0% |
| Broadband Home | 23 | 25.6% |
| Cellular Data Only | 39 | 43.3% |
| Satellite Internet | 0 | 0.0% |
| No Internet | 24 | 26.7% |
| Total | 90 | 100.0% |
Snake Creek Summary
Creek
Situated in the rolling hills of southeastern Oklahoma, Creek is a small town located in Pittsburg County. The town was founded in 1872 and was named after the nearby Snake Creek, which is a tributary of the Kiamichi River. The town was originally a trading post for the Choctaw Nation, and it was also a stop on the Missouri, Kansas and Texas Railroad.
Geography
Creek is located in the southeastern corner of Oklahoma, about 20 miles south of McAlester and about 40 miles north of the Texas border. The town is situated in the foothills of the Ouachita Mountains, and the surrounding area is mostly rural. The town is located on the banks of Snake Creek, which is a tributary of the Kiamichi River. The town is also located near the Talimena Scenic Drive, which is a popular tourist destination.
The climate in Creek is humid subtropical, with hot summers and mild winters. The average annual temperature is around 65 degrees Fahrenheit, and the average annual precipitation is around 45 inches.
History
Creek was founded in 1872 by the Choctaw Nation, and it was originally a trading post. The town was also a stop on the Missouri, Kansas and Texas Railroad. In the early 1900s, the town began to grow and develop, and it became a popular destination for tourists.
In the 1920s, the town was home to a number of businesses, including a hotel, a bank, a movie theater, and a number of stores. The town also had a school, a post office, and a number of churches.
In the 1950s, the town began to decline, and many of the businesses closed. The town was also affected by the construction of the nearby Lake Eufaula, which flooded much of the surrounding area.
Economy
Creek is a small town with a population of around 500 people. The town is mostly rural, and the economy is based on agriculture and tourism. The town is home to a number of small businesses, including a grocery store, a hardware store, and a few restaurants.
The town is also home to a number of tourist attractions, including the Talimena Scenic Drive, which is a popular destination for tourists. The town also hosts a number of festivals and events throughout the year, including the Snake Creek Festival, which is held in the summer.
Demographics
As of the 2010 census, the population of Creek was 498 people. The racial makeup of the town was 95.2% White, 0.2% African American, 0.4% Native American, 0.2% Asian, 0.2% from other races, and 3.8% from two or more races. The median household income was $30,000, and the median family income was $35,000.
Conclusion
Creek is a small town located in southeastern Oklahoma. The town was founded in 1872 and was originally a trading post for the Choctaw Nation. The town is situated in the foothills of the Ouachita Mountains, and the surrounding area is mostly rural. The town is home to a number of small businesses, and the economy is based on agriculture and tourism. The population of Creek is around 500 people, and the racial makeup of the town is mostly White.
Common Questions
What is Per Capita Income in Snake Creek?
Per Capita income in Snake Creek is $39,289.
What is the Median Family Income in Snake Creek?
Median Family Income in Snake Creek is $69,821.
What is the Median Household income in Snake Creek?
Median Household Income in Snake Creek is $80,000.
What is Inequality or Gini Index in Snake Creek?
Inequality or Gini Index in Snake Creek is 0.37.
What is the Total Population of Snake Creek?
Total Population of Snake Creek is 295.
What is the Total Male Population of Snake Creek?
Total Male Population of Snake Creek is 180.
What is the Total Female Population of Snake Creek?
Total Female Population of Snake Creek is 115.
What is the Ratio of Males per 100 Females in Snake Creek?
There are 156.52 Males per 100 Females in Snake Creek.
What is the Ratio of Females per 100 Males in Snake Creek?
There are 63.89 Females per 100 Males in Snake Creek.
What is the Median Population Age in Snake Creek?
Median Population Age in Snake Creek is 52.2 Years.
What is the Average Family Size in Snake Creek
Average Family Size in Snake Creek is 3.3 People.
What is the Average Household Size in Snake Creek
Average Household Size in Snake Creek is 3.3 People.
How Large is the Labor Force in Snake Creek?
There are 147 People in the Labor Forcein in Snake Creek.
What is the Percentage of People in the Labor Force in Snake Creek?
59.3% of People are in the Labor Force in Snake Creek.