Ratliff City, OK Map & Demographics
Ratliff City Map
Ratliff City Overview
$102,309
PER CAPITA INCOME
0.51
INEQUALITY / GINI INDEX
101
TOTAL POPULATION
79
MALE POPULATION
22
FEMALE POPULATION
359.09
MALES / 100 FEMALES
27.85
FEMALES / 100 MALES
84.1
MEDIAN AGE
7.4
AVG FAMILY SIZE
4.2
AVG HOUSEHOLD SIZE
71
LABOR FORCE [ PEOPLE ]
74.0%
PERCENT IN LABOR FORCE
1.4%
UNEMPLOYMENT RATE
Ratliff City Zip Codes
Ratliff City Area Codes
Income in Ratliff City
Income Overview in Ratliff City
| Characteristic | Number | Measure |
| Per Capita Income | 101 | $102,309 |
| Median Family Income | 12 | $0 |
| Mean Family Income | 12 | $44,258 |
| Median Household Income | 24 | $0 |
| Mean Household Income | 24 | $40,271 |
| Income Deficit | 12 | $0 |
| Wage / Income Gap (%) | 101 | 0.00% |
| Wage / Income Gap ($) | 101 | 100.00¢ per $1 |
| Gini / Inequality Index | 101 | 0.51 |
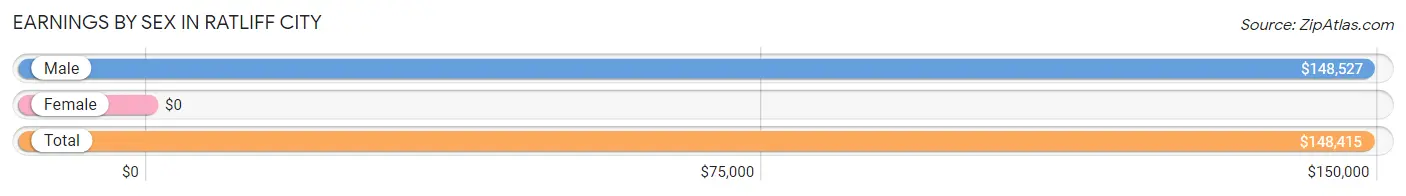
Earnings by Sex in Ratliff City
| Sex | Number | Average Earnings |
| Male | 66 (93.0%) | $148,527 |
| Female | 5 (7.0%) | $0 |
| Total | 71 (100.0%) | $148,415 |
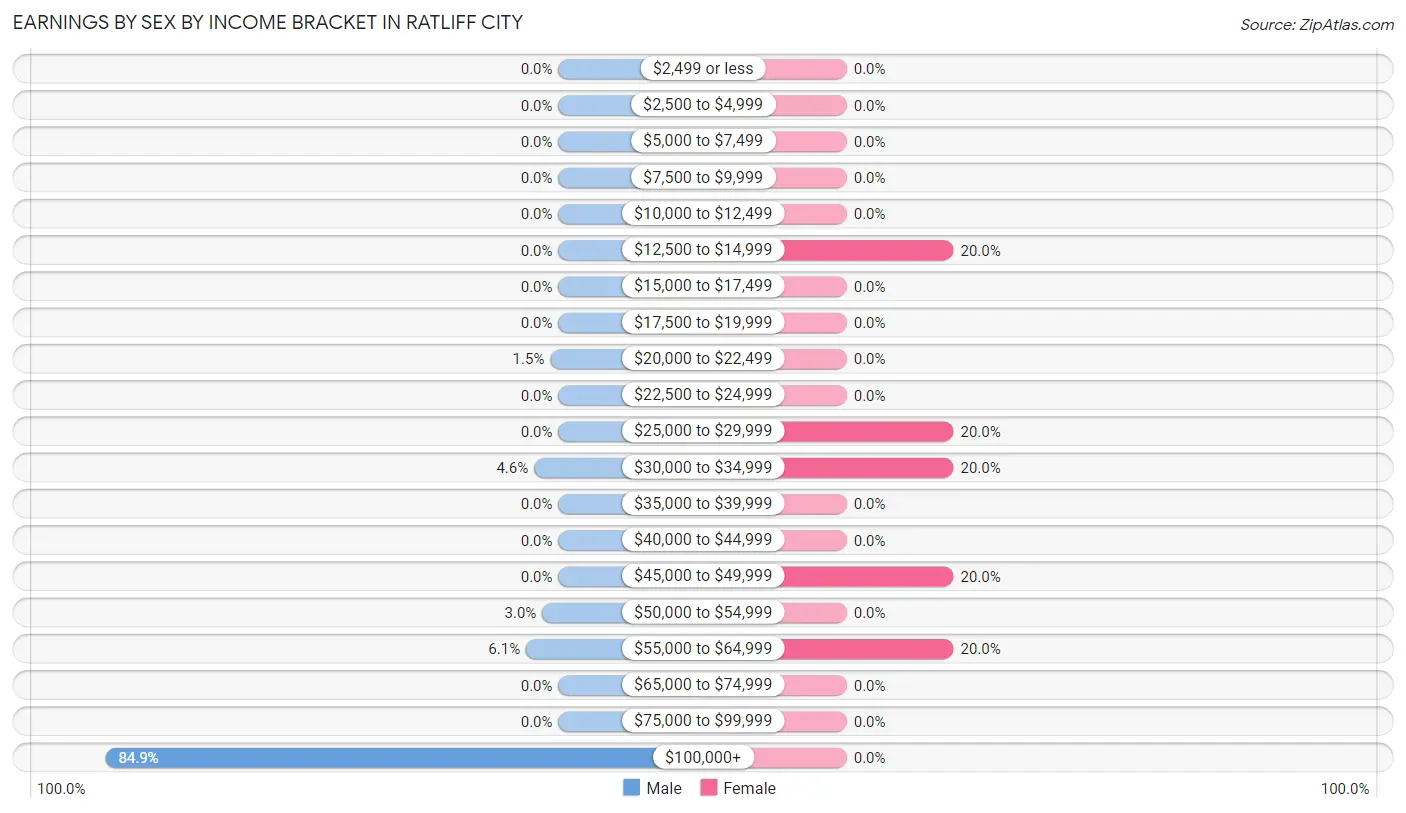
Earnings by Sex by Income Bracket in Ratliff City
The most common earnings brackets in Ratliff City are $100,000+ for men (56 | 84.9%) and $12,500 to $14,999 for women (1 | 20.0%).
| Income | Male | Female |
| $2,499 or less | 0 (0.0%) | 0 (0.0%) |
| $2,500 to $4,999 | 0 (0.0%) | 0 (0.0%) |
| $5,000 to $7,499 | 0 (0.0%) | 0 (0.0%) |
| $7,500 to $9,999 | 0 (0.0%) | 0 (0.0%) |
| $10,000 to $12,499 | 0 (0.0%) | 0 (0.0%) |
| $12,500 to $14,999 | 0 (0.0%) | 1 (20.0%) |
| $15,000 to $17,499 | 0 (0.0%) | 0 (0.0%) |
| $17,500 to $19,999 | 0 (0.0%) | 0 (0.0%) |
| $20,000 to $22,499 | 1 (1.5%) | 0 (0.0%) |
| $22,500 to $24,999 | 0 (0.0%) | 0 (0.0%) |
| $25,000 to $29,999 | 0 (0.0%) | 1 (20.0%) |
| $30,000 to $34,999 | 3 (4.5%) | 1 (20.0%) |
| $35,000 to $39,999 | 0 (0.0%) | 0 (0.0%) |
| $40,000 to $44,999 | 0 (0.0%) | 0 (0.0%) |
| $45,000 to $49,999 | 0 (0.0%) | 1 (20.0%) |
| $50,000 to $54,999 | 2 (3.0%) | 0 (0.0%) |
| $55,000 to $64,999 | 4 (6.1%) | 1 (20.0%) |
| $65,000 to $74,999 | 0 (0.0%) | 0 (0.0%) |
| $75,000 to $99,999 | 0 (0.0%) | 0 (0.0%) |
| $100,000+ | 56 (84.9%) | 0 (0.0%) |
| Total | 66 (100.0%) | 5 (100.0%) |
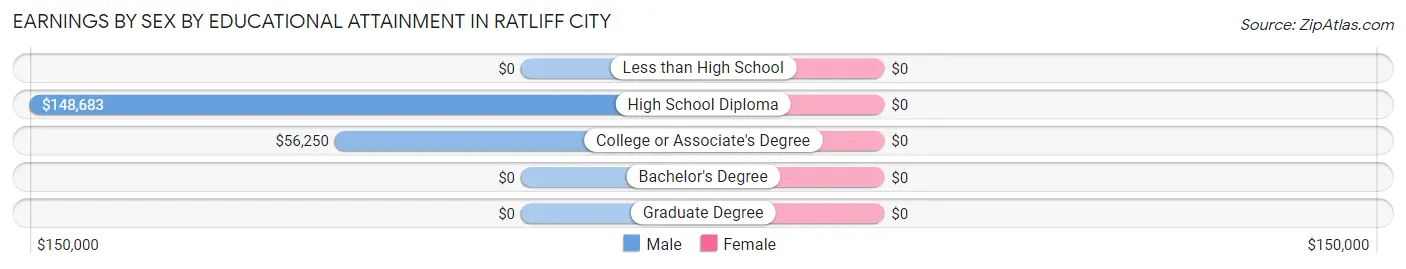
Earnings by Sex by Educational Attainment in Ratliff City
| Educational Attainment | Male Income | Female Income |
| Less than High School | - | - |
| High School Diploma | $148,683 | $0 |
| College or Associate's Degree | $56,250 | $0 |
| Bachelor's Degree | - | - |
| Graduate Degree | - | - |
| Total | $148,594 | $0 |
Family Income in Ratliff City
Family Income Brackets in Ratliff City
According to the Ratliff City family income data, there are 4 families falling into the $15,000 to $24,999 income range, which is the most common income bracket and makes up 33.3% of all families.
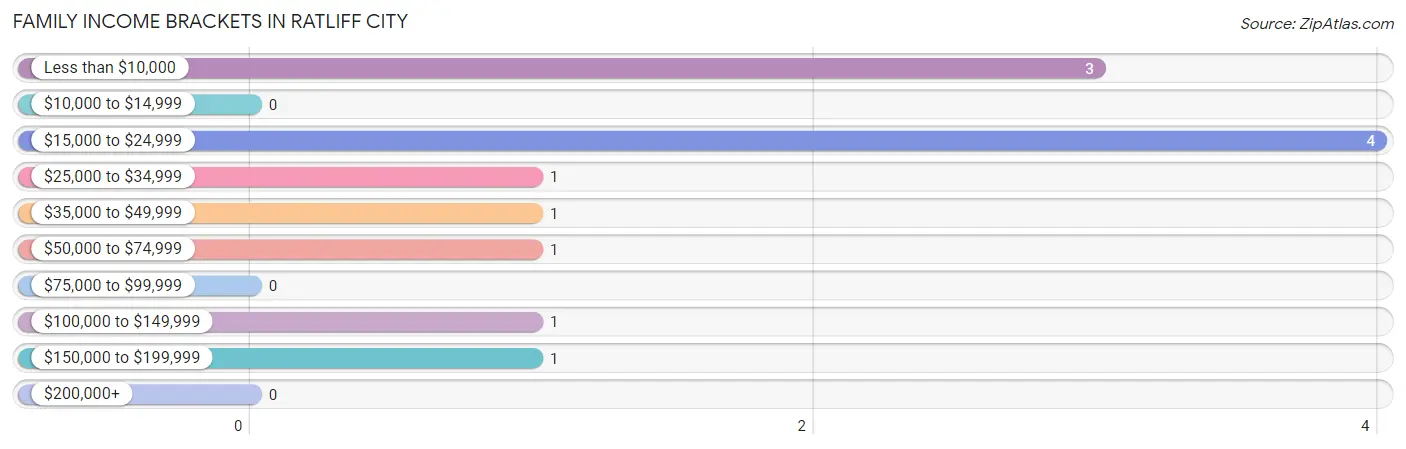
| Income Bracket | # Families | % Families |
| Less than $10,000 | 3 | 25.0% |
| $10,000 to $14,999 | 0 | 0.0% |
| $15,000 to $24,999 | 4 | 33.3% |
| $25,000 to $34,999 | 1 | 8.3% |
| $35,000 to $49,999 | 1 | 8.3% |
| $50,000 to $74,999 | 1 | 8.3% |
| $75,000 to $99,999 | 0 | 0.0% |
| $100,000 to $149,999 | 1 | 8.3% |
| $150,000 to $199,999 | 1 | 8.3% |
| $200,000+ | 0 | 0.0% |
Family Income by Famaliy Size in Ratliff City
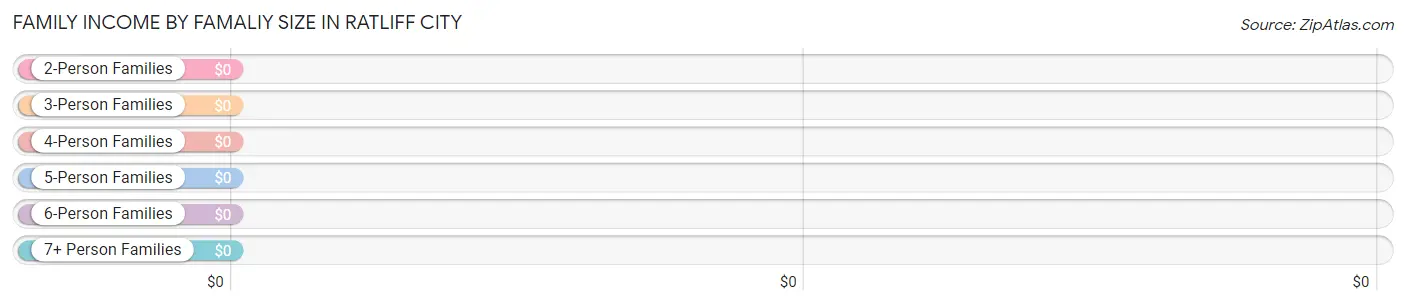
| Income Bracket | # Families | Median Income |
| 2-Person Families | 8 (66.7%) | $0 |
| 3-Person Families | 2 (16.7%) | $0 |
| 4-Person Families | 2 (16.7%) | $0 |
| 5-Person Families | 0 (0.0%) | $0 |
| 6-Person Families | 0 (0.0%) | $0 |
| 7+ Person Families | 0 (0.0%) | $0 |
| Total | 12 (100.0%) | $0 |
Family Income by Number of Earners in Ratliff City
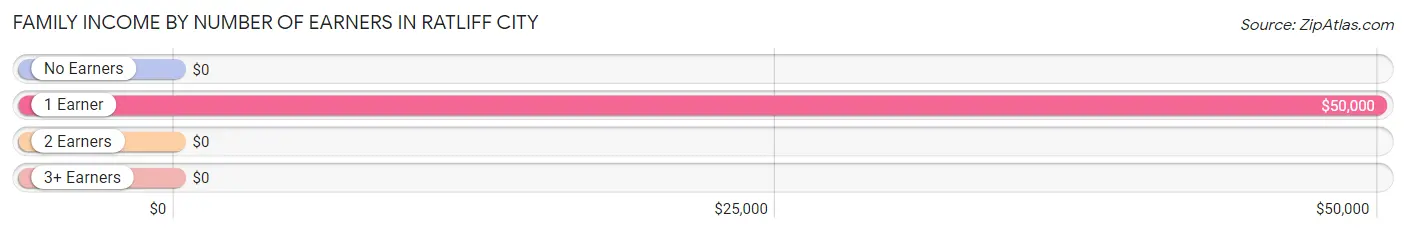
| Number of Earners | # Families | Median Income |
| No Earners | 7 (58.3%) | $0 |
| 1 Earner | 4 (33.3%) | $50,000 |
| 2 Earners | 0 (0.0%) | $0 |
| 3+ Earners | 1 (8.3%) | $0 |
| Total | 12 (100.0%) | $0 |
Household Income in Ratliff City
Household Income Brackets in Ratliff City
With 6 households falling in the category, the $50,000 to $74,999 income range is the most frequent in Ratliff City, accounting for 25.0% of all households.
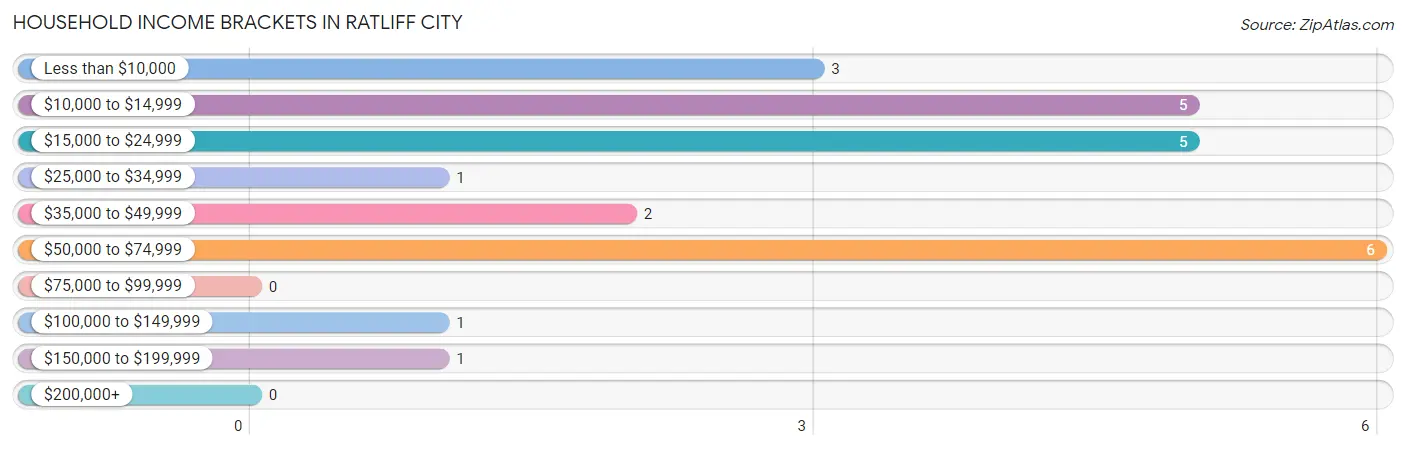
| Income Bracket | # Households | % Households |
| Less than $10,000 | 3 | 12.5% |
| $10,000 to $14,999 | 5 | 20.8% |
| $15,000 to $24,999 | 5 | 20.8% |
| $25,000 to $34,999 | 1 | 4.2% |
| $35,000 to $49,999 | 2 | 8.3% |
| $50,000 to $74,999 | 6 | 25.0% |
| $75,000 to $99,999 | 0 | 0.0% |
| $100,000 to $149,999 | 1 | 4.2% |
| $150,000 to $199,999 | 1 | 4.2% |
| $200,000+ | 0 | 0.0% |
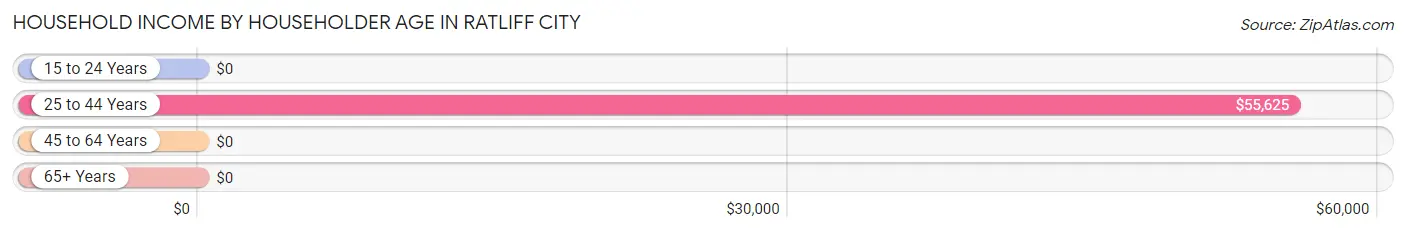
Household Income by Householder Age in Ratliff City
The median household income in Ratliff City is $0, with the highest median household income of $55,625 found in the 25 to 44 years age bracket for the primary householder. A total of 7 households (29.2%) fall into this category.
| Income Bracket | # Households | Median Income |
| 15 to 24 Years | 0 (0.0%) | $0 |
| 25 to 44 Years | 7 (29.2%) | $55,625 |
| 45 to 64 Years | 3 (12.5%) | $0 |
| 65+ Years | 14 (58.3%) | $0 |
| Total | 24 (100.0%) | $0 |
Poverty in Ratliff City
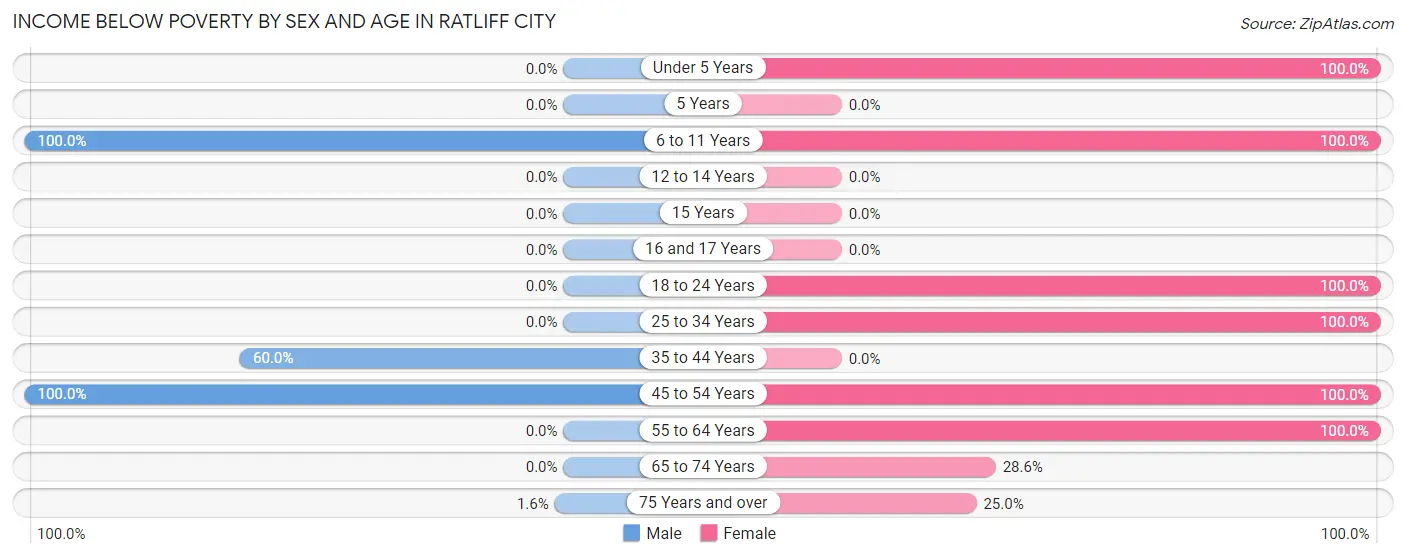
Income Below Poverty by Sex and Age in Ratliff City
With 7.6% poverty level for males and 54.5% for females among the residents of Ratliff City, 6 to 11 year old males and under 5 year old females are the most vulnerable to poverty, with 1 males (100.0%) and 2 females (100.0%) in their respective age groups living below the poverty level.
| Age Bracket | Male | Female |
| Under 5 Years | 0 (0.0%) | 2 (100.0%) |
| 5 Years | 0 (0.0%) | 0 (0.0%) |
| 6 to 11 Years | 1 (100.0%) | 1 (100.0%) |
| 12 to 14 Years | 0 (0.0%) | 0 (0.0%) |
| 15 Years | 0 (0.0%) | 0 (0.0%) |
| 16 and 17 Years | 0 (0.0%) | 0 (0.0%) |
| 18 to 24 Years | 0 (0.0%) | 2 (100.0%) |
| 25 to 34 Years | 0 (0.0%) | 2 (100.0%) |
| 35 to 44 Years | 3 (60.0%) | 0 (0.0%) |
| 45 to 54 Years | 1 (100.0%) | 1 (100.0%) |
| 55 to 64 Years | 0 (0.0%) | 1 (100.0%) |
| 65 to 74 Years | 0 (0.0%) | 2 (28.6%) |
| 75 Years and over | 1 (1.6%) | 1 (25.0%) |
| Total | 6 (7.6%) | 12 (54.5%) |
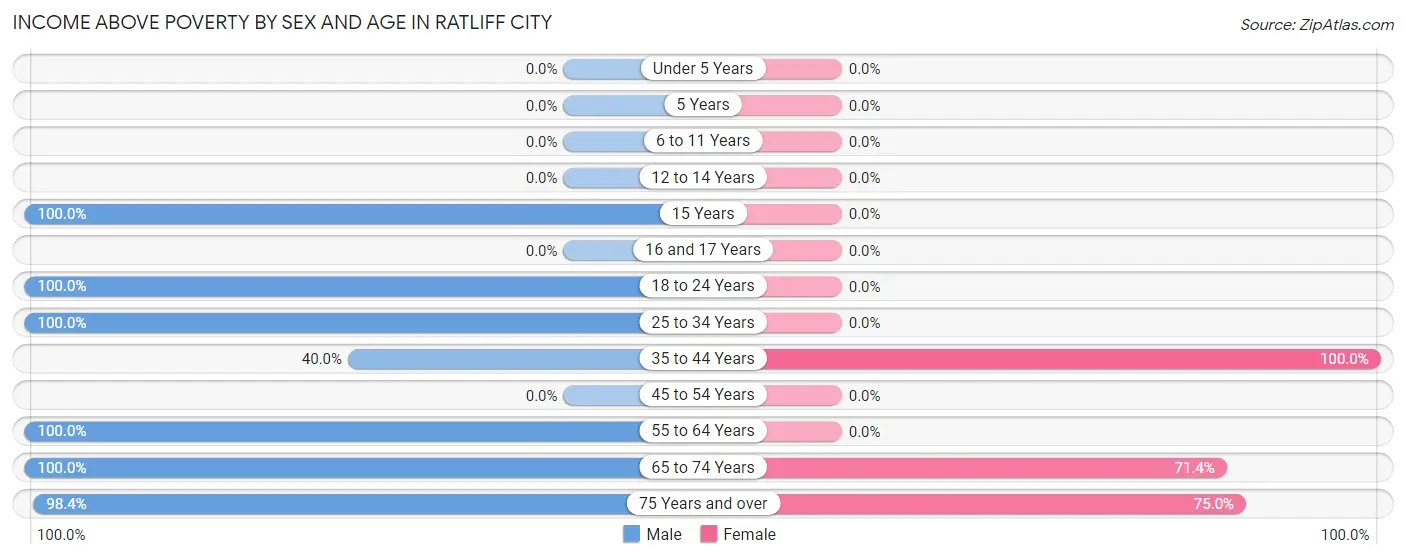
Income Above Poverty by Sex and Age in Ratliff City
According to the poverty statistics in Ratliff City, males aged 15 years and females aged 35 to 44 years are the age groups that are most secure financially, with 100.0% of males and 100.0% of females in these age groups living above the poverty line.
| Age Bracket | Male | Female |
| Under 5 Years | 0 (0.0%) | 0 (0.0%) |
| 5 Years | 0 (0.0%) | 0 (0.0%) |
| 6 to 11 Years | 0 (0.0%) | 0 (0.0%) |
| 12 to 14 Years | 0 (0.0%) | 0 (0.0%) |
| 15 Years | 1 (100.0%) | 0 (0.0%) |
| 16 and 17 Years | 0 (0.0%) | 0 (0.0%) |
| 18 to 24 Years | 3 (100.0%) | 0 (0.0%) |
| 25 to 34 Years | 3 (100.0%) | 0 (0.0%) |
| 35 to 44 Years | 2 (40.0%) | 2 (100.0%) |
| 45 to 54 Years | 0 (0.0%) | 0 (0.0%) |
| 55 to 64 Years | 2 (100.0%) | 0 (0.0%) |
| 65 to 74 Years | 2 (100.0%) | 5 (71.4%) |
| 75 Years and over | 60 (98.4%) | 3 (75.0%) |
| Total | 73 (92.4%) | 10 (45.5%) |
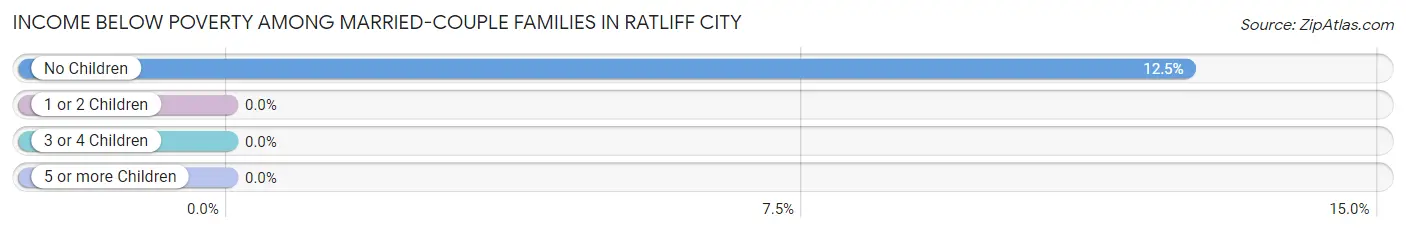
Income Below Poverty Among Married-Couple Families in Ratliff City
The poverty statistics for married-couple families in Ratliff City show that 12.5% or 1 of the total 8 families live below the poverty line. Families with no children have the highest poverty rate of 12.5%, comprising of 1 families. On the other hand, families with no children have the lowest poverty rate of 12.5%, which includes 1 families.
| Children | Above Poverty | Below Poverty |
| No Children | 7 (87.5%) | 1 (12.5%) |
| 1 or 2 Children | 0 (0.0%) | 0 (0.0%) |
| 3 or 4 Children | 0 (0.0%) | 0 (0.0%) |
| 5 or more Children | 0 (0.0%) | 0 (0.0%) |
| Total | 7 (87.5%) | 1 (12.5%) |
Income Below Poverty Among Single-Parent Households in Ratliff City
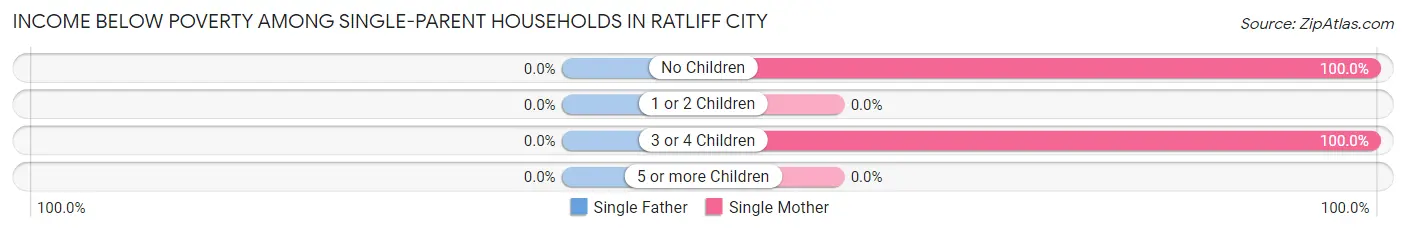
| Children | Single Father | Single Mother |
| No Children | 0 (0.0%) | 1 (100.0%) |
| 1 or 2 Children | 0 (0.0%) | 0 (0.0%) |
| 3 or 4 Children | 0 (0.0%) | 2 (100.0%) |
| 5 or more Children | 0 (0.0%) | 0 (0.0%) |
| Total | 0 (0.0%) | 3 (75.0%) |
Income Below Poverty Among Married-Couple vs Single-Parent Households in Ratliff City
The poverty data for Ratliff City shows that 1 of the married-couple family households (12.5%) and 3 of the single-parent households (75.0%) are living below the poverty level. Within the married-couple family households, those with no children have the highest poverty rate, with 1 households (12.5%) falling below the poverty line. Among the single-parent households, those with no children have the highest poverty rate, with 1 household (100.0%) living below poverty.
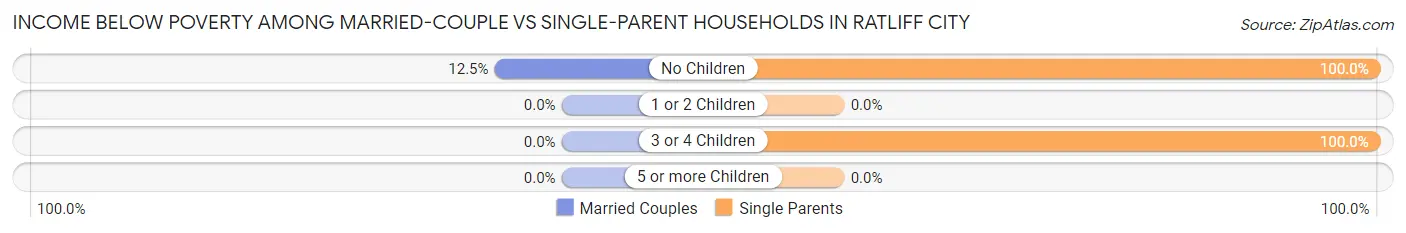
| Children | Married-Couple Families | Single-Parent Households |
| No Children | 1 (12.5%) | 1 (100.0%) |
| 1 or 2 Children | 0 (0.0%) | 0 (0.0%) |
| 3 or 4 Children | 0 (0.0%) | 2 (100.0%) |
| 5 or more Children | 0 (0.0%) | 0 (0.0%) |
| Total | 1 (12.5%) | 3 (75.0%) |
Race in Ratliff City
The most populous races in Ratliff City are White / Caucasian (95 | 94.1%), Two or more Races (5 | 5.0%), and Black / African American (1 | 1.0%).
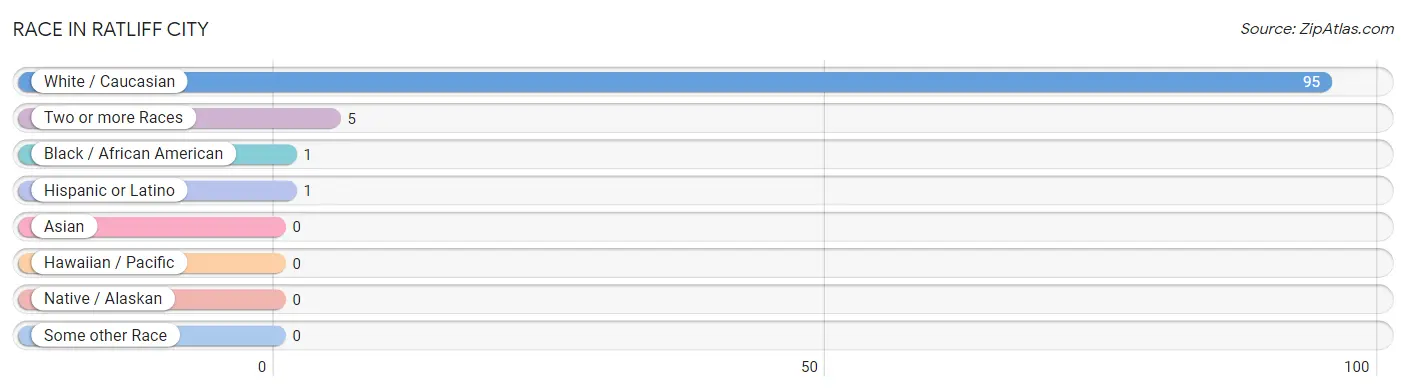
| Race | # Population | % Population |
| Asian | 0 | 0.0% |
| Black / African American | 1 | 1.0% |
| Hawaiian / Pacific | 0 | 0.0% |
| Hispanic or Latino | 1 | 1.0% |
| Native / Alaskan | 0 | 0.0% |
| White / Caucasian | 95 | 94.1% |
| Two or more Races | 5 | 5.0% |
| Some other Race | 0 | 0.0% |
| Total | 101 | 100.0% |
Ancestry in Ratliff City
The most populous ancestries reported in Ratliff City are American (74 | 73.3%), Scottish (6 | 5.9%), Chickasaw (4 | 4.0%), English (2 | 2.0%), and Norwegian (2 | 2.0%), together accounting for 87.1% of all Ratliff City residents.
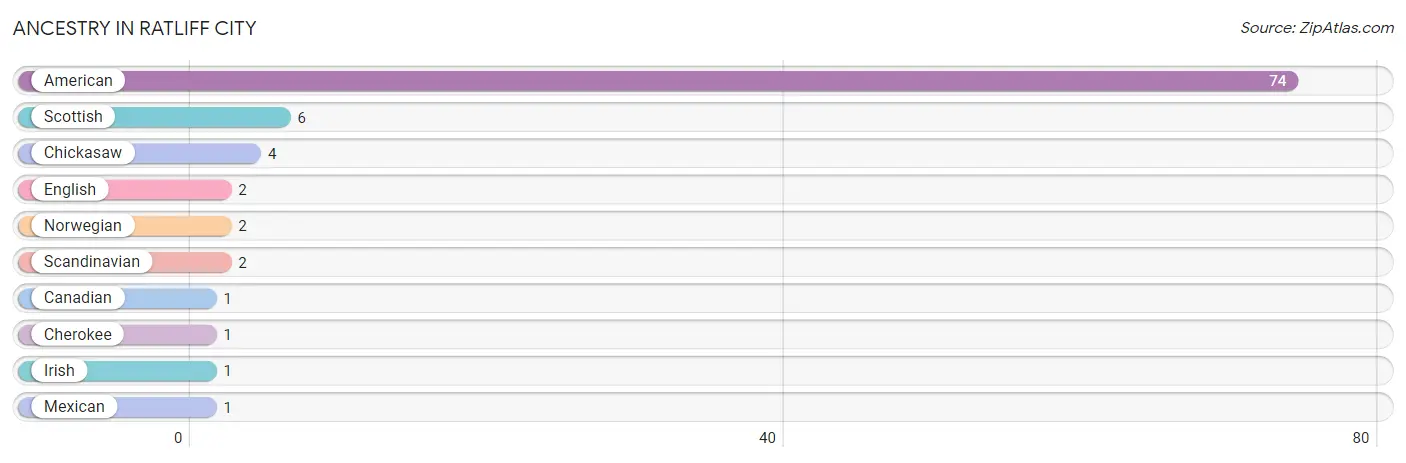
| Ancestry | # Population | % Population |
| American | 74 | 73.3% |
| Canadian | 1 | 1.0% |
| Cherokee | 1 | 1.0% |
| Chickasaw | 4 | 4.0% |
| English | 2 | 2.0% |
| Irish | 1 | 1.0% |
| Mexican | 1 | 1.0% |
| Norwegian | 2 | 2.0% |
| Scandinavian | 2 | 2.0% |
| Scottish | 6 | 5.9% | View All 10 Rows |
Immigrants in Ratliff City

| Immigration Origin | # Population | % Population | View All 0 Rows |
Sex and Age in Ratliff City
Sex and Age in Ratliff City
The most populous age groups in Ratliff City are 80 to 84 Years (56 | 70.9%) for men and 65 to 69 Years (6 | 27.3%) for women.
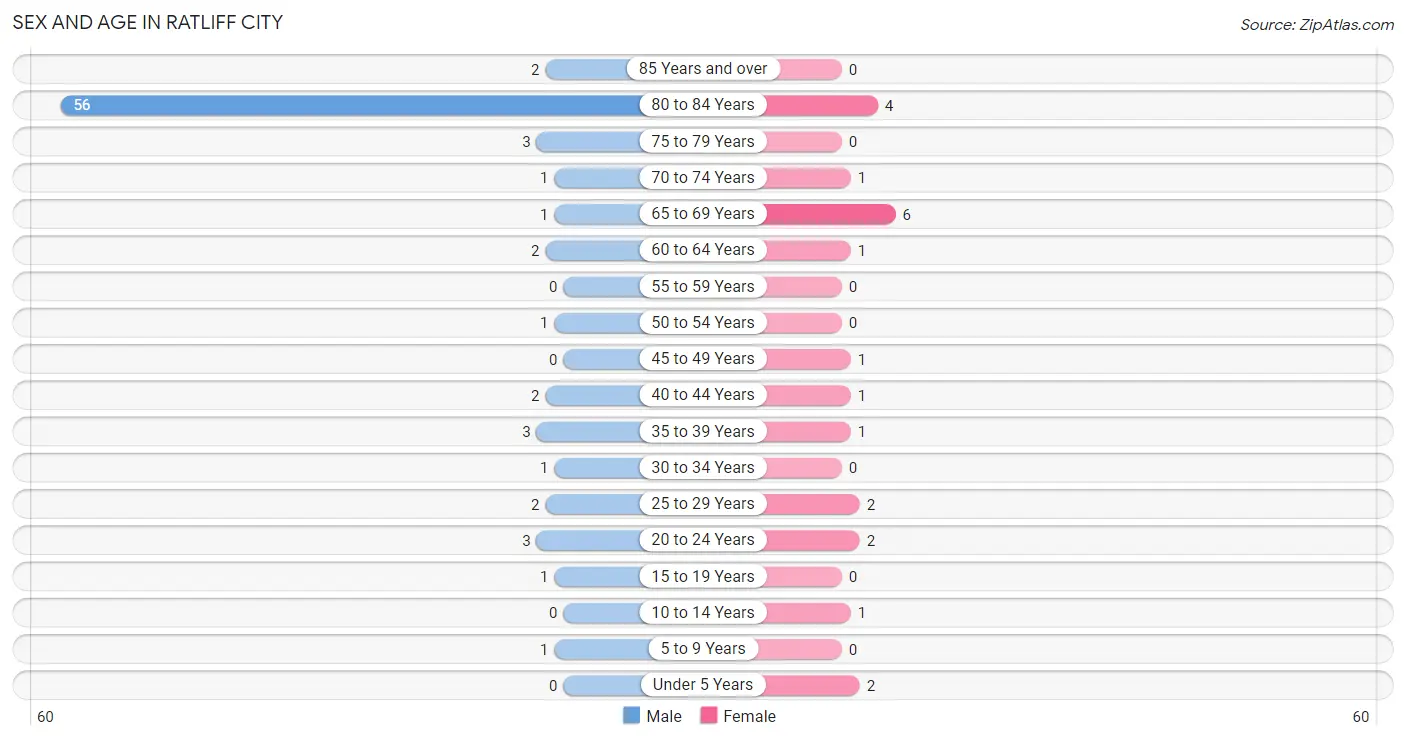
| Age Bracket | Male | Female |
| Under 5 Years | 0 (0.0%) | 2 (9.1%) |
| 5 to 9 Years | 1 (1.3%) | 0 (0.0%) |
| 10 to 14 Years | 0 (0.0%) | 1 (4.5%) |
| 15 to 19 Years | 1 (1.3%) | 0 (0.0%) |
| 20 to 24 Years | 3 (3.8%) | 2 (9.1%) |
| 25 to 29 Years | 2 (2.5%) | 2 (9.1%) |
| 30 to 34 Years | 1 (1.3%) | 0 (0.0%) |
| 35 to 39 Years | 3 (3.8%) | 1 (4.5%) |
| 40 to 44 Years | 2 (2.5%) | 1 (4.5%) |
| 45 to 49 Years | 0 (0.0%) | 1 (4.5%) |
| 50 to 54 Years | 1 (1.3%) | 0 (0.0%) |
| 55 to 59 Years | 0 (0.0%) | 0 (0.0%) |
| 60 to 64 Years | 2 (2.5%) | 1 (4.5%) |
| 65 to 69 Years | 1 (1.3%) | 6 (27.3%) |
| 70 to 74 Years | 1 (1.3%) | 1 (4.5%) |
| 75 to 79 Years | 3 (3.8%) | 0 (0.0%) |
| 80 to 84 Years | 56 (70.9%) | 4 (18.2%) |
| 85 Years and over | 2 (2.5%) | 0 (0.0%) |
| Total | 79 (100.0%) | 22 (100.0%) |
Families and Households in Ratliff City
Median Family Size in Ratliff City
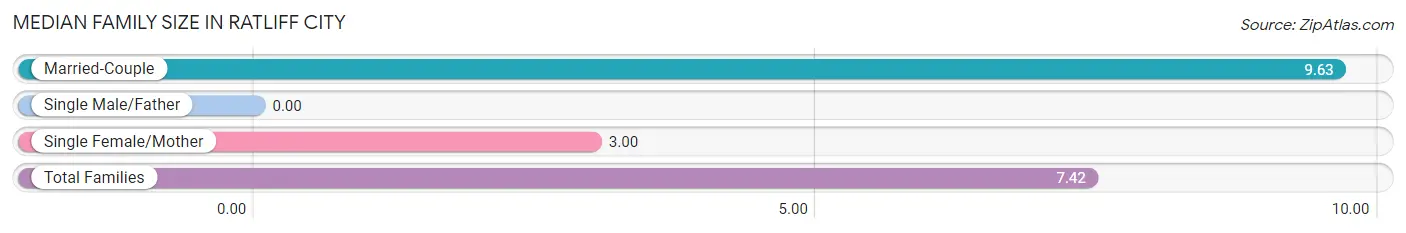
| Family Type | # Families | Family Size |
| Married-Couple | 8 (66.7%) | 9.63 |
| Single Male/Father | 0 (0.0%) | - |
| Single Female/Mother | 4 (33.3%) | 3.00 |
| Total Families | 12 (100.0%) | 7.42 |
Median Household Size in Ratliff City
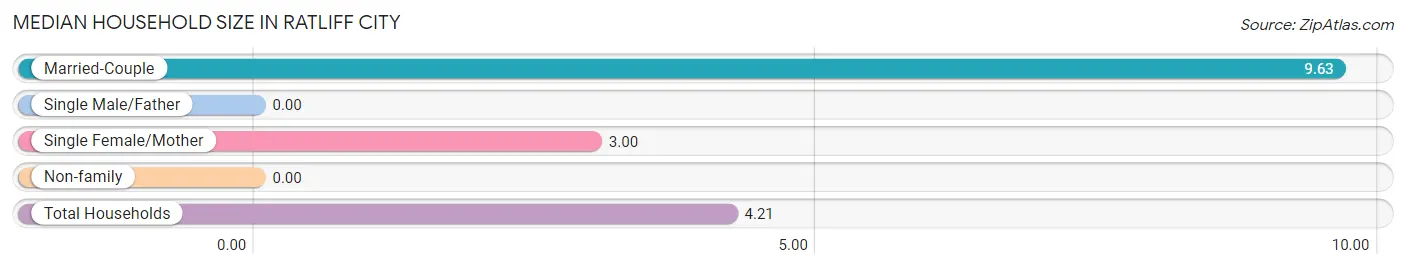
| Household Type | # Households | Household Size |
| Married-Couple | 8 (33.3%) | 9.63 |
| Single Male/Father | 0 (0.0%) | - |
| Single Female/Mother | 4 (16.7%) | 3.00 |
| Non-family | 12 (50.0%) | - |
| Total Households | 24 (100.0%) | 4.21 |
Household Size by Marriage Status in Ratliff City
Out of a total of 24 households in Ratliff City, 12 (50.0%) are family households, while 12 (50.0%) are nonfamily households. The most numerous type of family households are 2-person households, comprising 8, and the most common type of nonfamily households are 1-person households, comprising 12.
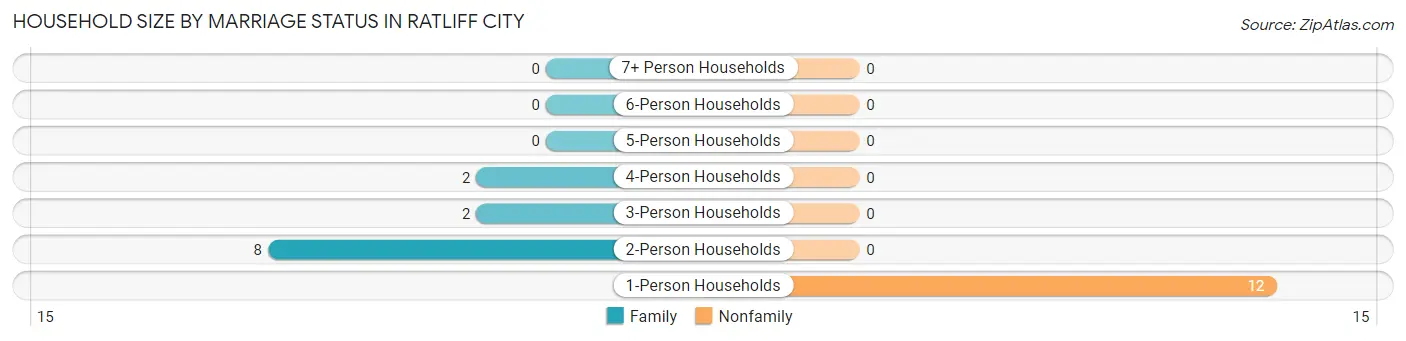
| Household Size | Family Households | Nonfamily Households |
| 1-Person Households | - | 12 (50.0%) |
| 2-Person Households | 8 (33.3%) | 0 (0.0%) |
| 3-Person Households | 2 (8.3%) | 0 (0.0%) |
| 4-Person Households | 2 (8.3%) | 0 (0.0%) |
| 5-Person Households | 0 (0.0%) | 0 (0.0%) |
| 6-Person Households | 0 (0.0%) | 0 (0.0%) |
| 7+ Person Households | 0 (0.0%) | 0 (0.0%) |
| Total | 12 (50.0%) | 12 (50.0%) |
Female Fertility in Ratliff City
Fertility by Age in Ratliff City
| Age Bracket | Women with Births | Births / 1,000 Women |
| 15 to 19 years | 0 (0.0%) | 0.0 |
| 20 to 34 years | 0 (0.0%) | 0.0 |
| 35 to 50 years | 0 (0.0%) | 0.0 |
| Total | 0 (0.0%) | 0.0 |
Fertility by Age by Marriage Status in Ratliff City
| Age Bracket | Married | Unmarried |
| 15 to 19 years | 0 (0.0%) | 0 (0.0%) |
| 20 to 34 years | 0 (0.0%) | 0 (0.0%) |
| 35 to 50 years | 0 (0.0%) | 0 (0.0%) |
| Total | 0 (0.0%) | 0 (0.0%) |
Fertility by Education in Ratliff City
| Educational Attainment | Women with Births | Births / 1,000 Women |
| Less than High School | 0 (0.0%) | 0.0 |
| High School Diploma | 0 (0.0%) | 0.0 |
| College or Associate's Degree | 0 (0.0%) | 0.0 |
| Bachelor's Degree | 0 (0.0%) | 0.0 |
| Graduate Degree | 0 (0.0%) | 0.0 |
| Total | 0 (0.0%) | 0.0 |
Fertility by Education by Marriage Status in Ratliff City
| Educational Attainment | Married | Unmarried |
| Less than High School | 0 (0.0%) | 0 (0.0%) |
| High School Diploma | 0 (0.0%) | 0 (0.0%) |
| College or Associate's Degree | 0 (0.0%) | 0 (0.0%) |
| Bachelor's Degree | 0 (0.0%) | 0 (0.0%) |
| Graduate Degree | 0 (0.0%) | 0 (0.0%) |
| Total | 0 (0.0%) | 0 (0.0%) |
Employment Characteristics in Ratliff City
Employment by Class of Employer in Ratliff City
Among the 70 employed individuals in Ratliff City, unpaid family workers (56 | 80.0%), private company employees (10 | 14.3%), and local government employees (3 | 4.3%) make up the most common classes of employment.
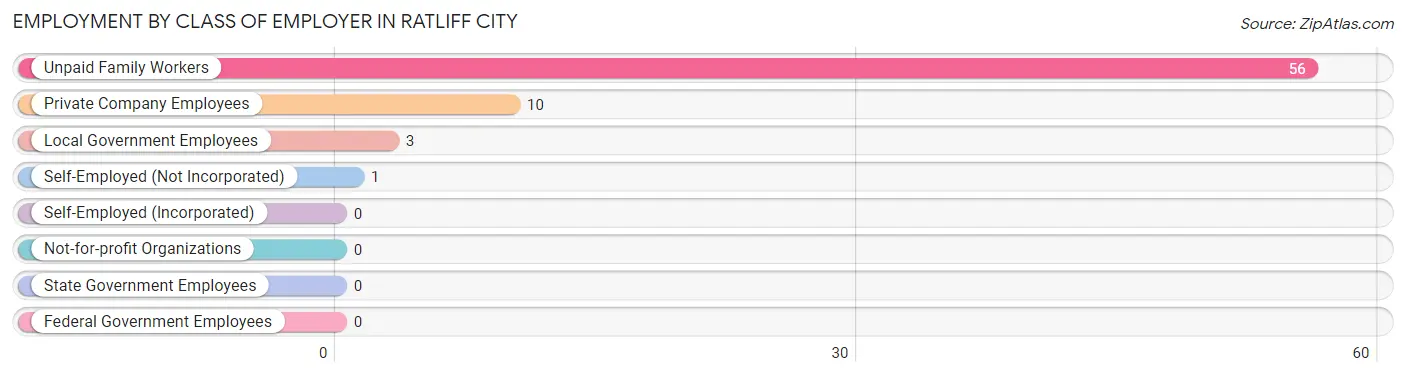
| Employer Class | # Employees | % Employees |
| Private Company Employees | 10 | 14.3% |
| Self-Employed (Incorporated) | 0 | 0.0% |
| Self-Employed (Not Incorporated) | 1 | 1.4% |
| Not-for-profit Organizations | 0 | 0.0% |
| Local Government Employees | 3 | 4.3% |
| State Government Employees | 0 | 0.0% |
| Federal Government Employees | 0 | 0.0% |
| Unpaid Family Workers | 56 | 80.0% |
| Total | 70 | 100.0% |
Employment Status by Age in Ratliff City
According to the labor force statistics for Ratliff City, out of the total population over 16 years of age (96), 74.0% or 71 individuals are in the labor force, with 1.4% or 1 of them unemployed. The age group with the highest labor force participation rate is 30 to 34 years, with 100.0% or 1 individuals in the labor force. Within the labor force, the 65 to 74 years age range has the highest percentage of unemployed individuals, with 50.0% or 1 of them being unemployed.
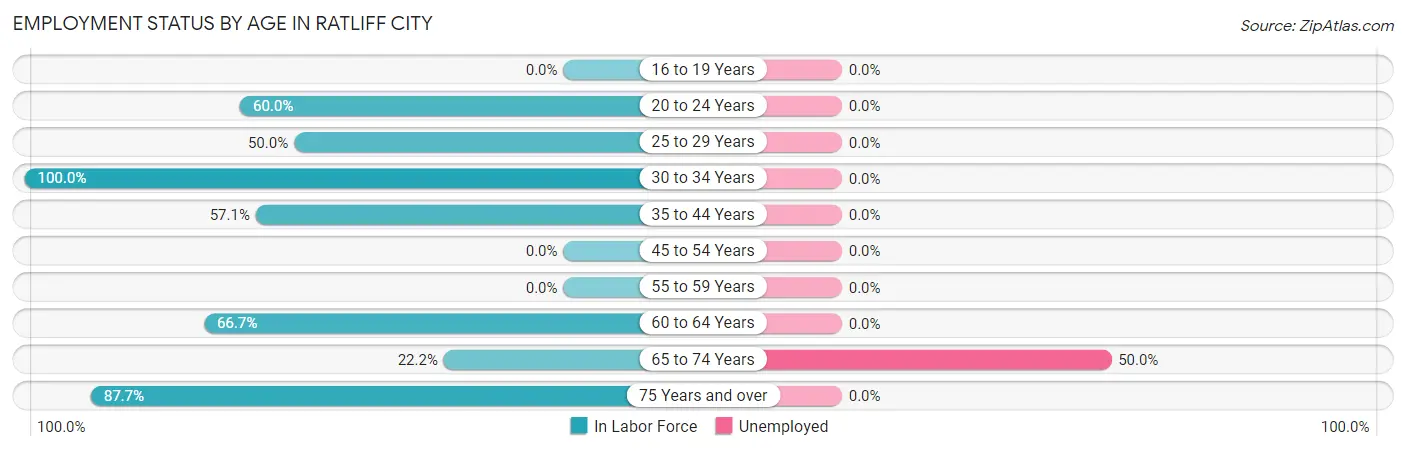
| Age Bracket | In Labor Force | Unemployed |
| 16 to 19 Years | 0 (0.0%) | 0 (0.0%) |
| 20 to 24 Years | 3 (60.0%) | 0 (0.0%) |
| 25 to 29 Years | 2 (50.0%) | 0 (0.0%) |
| 30 to 34 Years | 1 (100.0%) | 0 (0.0%) |
| 35 to 44 Years | 4 (57.1%) | 0 (0.0%) |
| 45 to 54 Years | 0 (0.0%) | 0 (0.0%) |
| 55 to 59 Years | 0 (0.0%) | 0 (0.0%) |
| 60 to 64 Years | 2 (66.7%) | 0 (0.0%) |
| 65 to 74 Years | 2 (22.2%) | 1 (50.0%) |
| 75 Years and over | 57 (87.7%) | 0 (0.0%) |
| Total | 71 (74.0%) | 1 (1.4%) |
Employment Status by Educational Attainment in Ratliff City
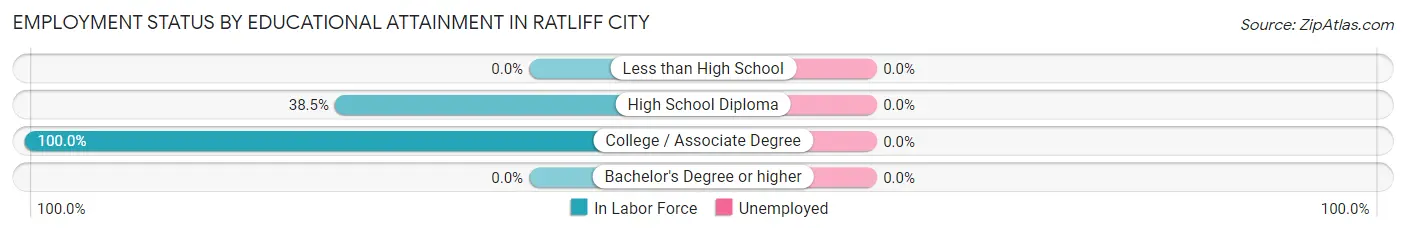
| Educational Attainment | In Labor Force | Unemployed |
| Less than High School | 0 (0.0%) | 0 (0.0%) |
| High School Diploma | 5 (38.5%) | 0 (0.0%) |
| College / Associate Degree | 4 (100.0%) | 0 (0.0%) |
| Bachelor's Degree or higher | 0 (0.0%) | 0 (0.0%) |
| Total | 9 (52.9%) | 0 (0.0%) |
Employment Occupations by Sex in Ratliff City
Management, Business, Science and Arts Occupations
The most common Management, Business, Science and Arts occupations in Ratliff City are , and Management (1 | 1.4%).
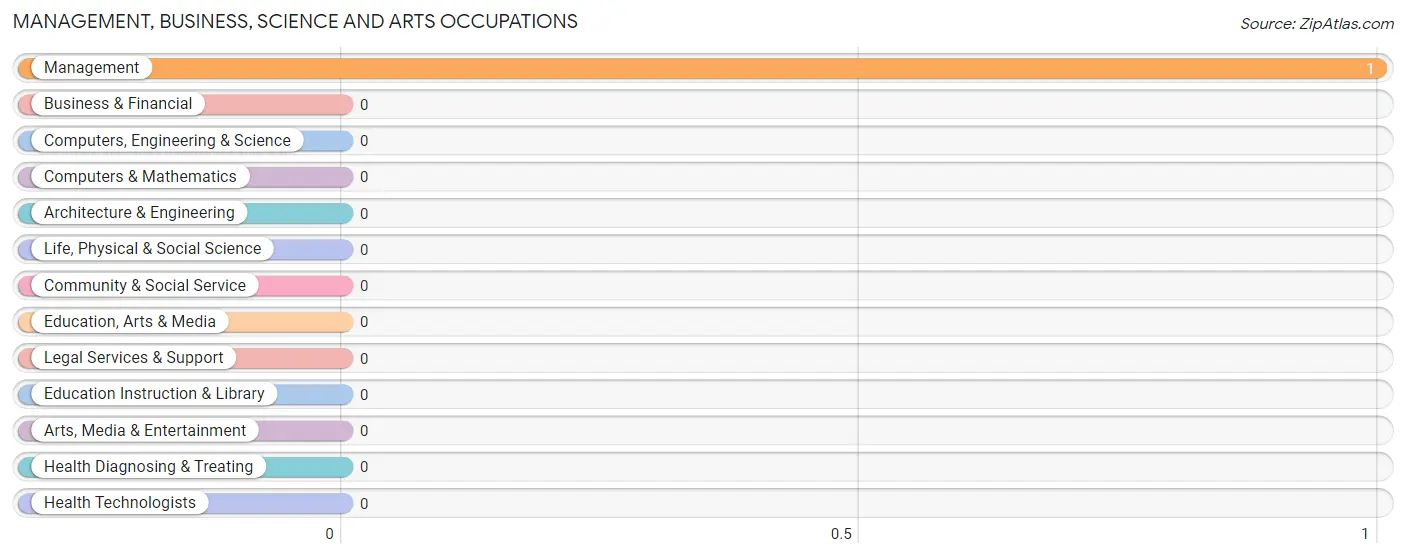
Management, Business, Science and Arts Occupations by Sex
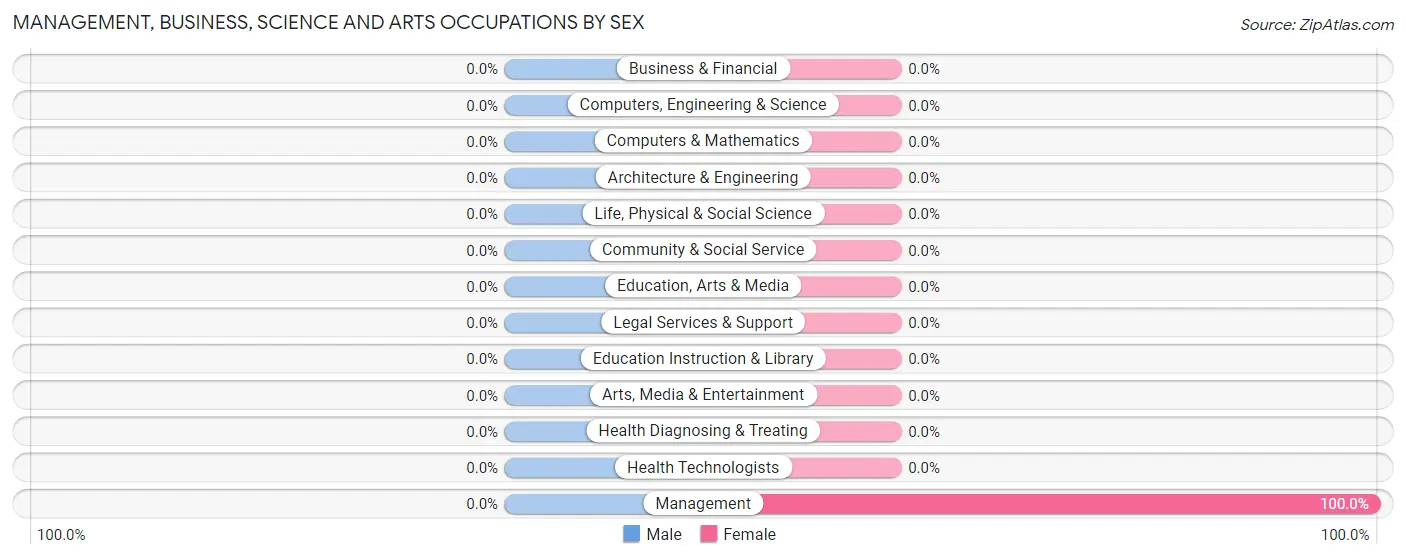
| Occupation | Male | Female |
| Management | 0 (0.0%) | 1 (100.0%) |
| Business & Financial | 0 (0.0%) | 0 (0.0%) |
| Computers, Engineering & Science | 0 (0.0%) | 0 (0.0%) |
| Computers & Mathematics | 0 (0.0%) | 0 (0.0%) |
| Architecture & Engineering | 0 (0.0%) | 0 (0.0%) |
| Life, Physical & Social Science | 0 (0.0%) | 0 (0.0%) |
| Community & Social Service | 0 (0.0%) | 0 (0.0%) |
| Education, Arts & Media | 0 (0.0%) | 0 (0.0%) |
| Legal Services & Support | 0 (0.0%) | 0 (0.0%) |
| Education Instruction & Library | 0 (0.0%) | 0 (0.0%) |
| Arts, Media & Entertainment | 0 (0.0%) | 0 (0.0%) |
| Health Diagnosing & Treating | 0 (0.0%) | 0 (0.0%) |
| Health Technologists | 0 (0.0%) | 0 (0.0%) |
| Total (Category) | 0 (0.0%) | 1 (100.0%) |
| Total (Overall) | 66 (94.3%) | 4 (5.7%) |
Services Occupations
Services Occupations by Sex
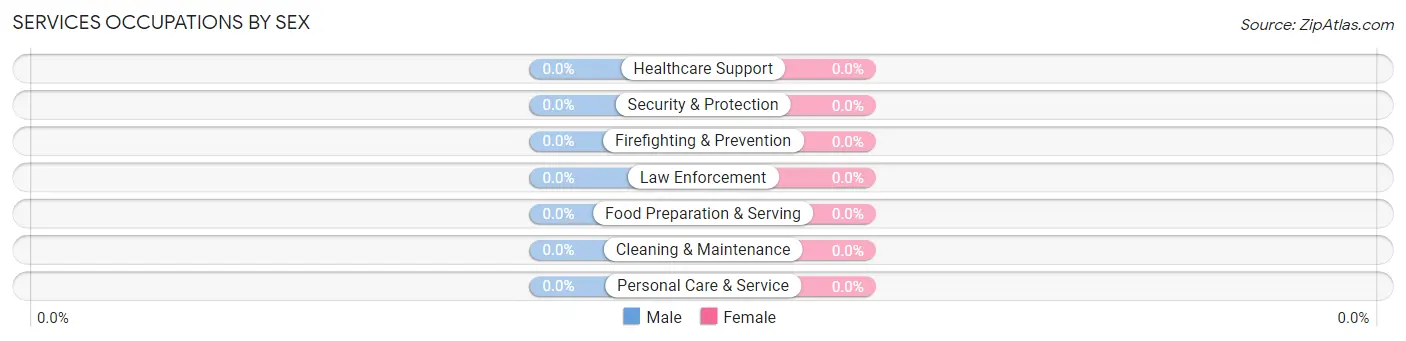
| Occupation | Male | Female |
| Healthcare Support | 0 (0.0%) | 0 (0.0%) |
| Security & Protection | 0 (0.0%) | 0 (0.0%) |
| Firefighting & Prevention | 0 (0.0%) | 0 (0.0%) |
| Law Enforcement | 0 (0.0%) | 0 (0.0%) |
| Food Preparation & Serving | 0 (0.0%) | 0 (0.0%) |
| Cleaning & Maintenance | 0 (0.0%) | 0 (0.0%) |
| Personal Care & Service | 0 (0.0%) | 0 (0.0%) |
| Total (Category) | 0 (0.0%) | 0 (0.0%) |
| Total (Overall) | 66 (94.3%) | 4 (5.7%) |
Sales and Office Occupations
The most common Sales and Office occupations in Ratliff City are Office & Administration (3 | 4.3%), and Sales & Related (1 | 1.4%).
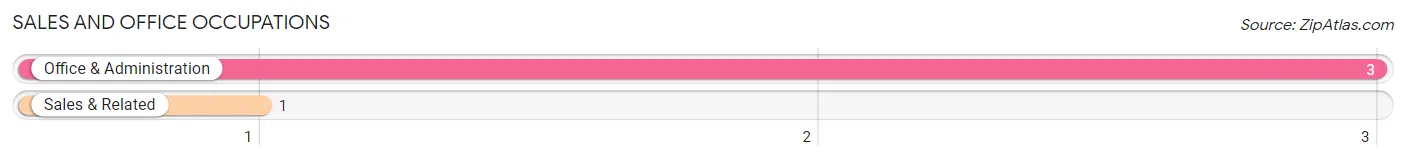
Sales and Office Occupations by Sex
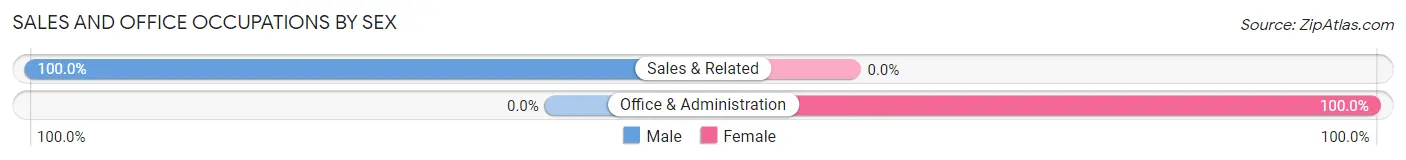
| Occupation | Male | Female |
| Sales & Related | 1 (100.0%) | 0 (0.0%) |
| Office & Administration | 0 (0.0%) | 3 (100.0%) |
| Total (Category) | 1 (25.0%) | 3 (75.0%) |
| Total (Overall) | 66 (94.3%) | 4 (5.7%) |
Natural Resources, Construction and Maintenance Occupations
The most common Natural Resources, Construction and Maintenance occupations in Ratliff City are Installation, Maintenance & Repair (59 | 84.3%), and Construction & Extraction (3 | 4.3%).
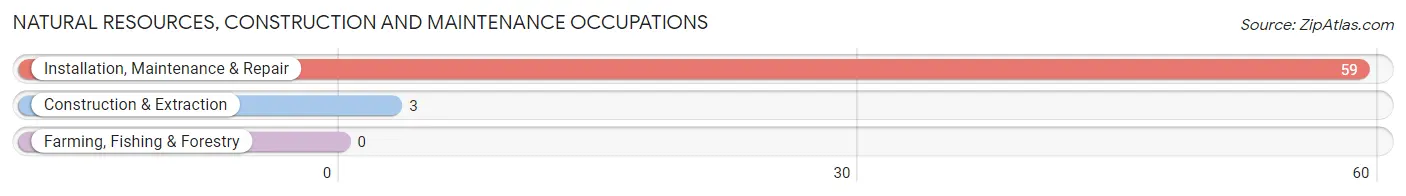
Natural Resources, Construction and Maintenance Occupations by Sex
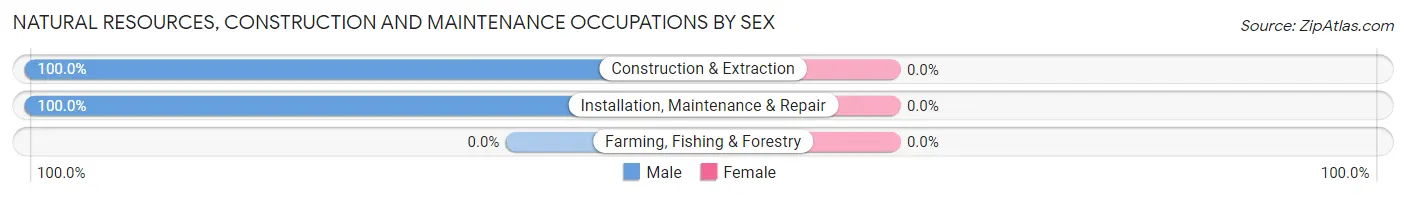
| Occupation | Male | Female |
| Farming, Fishing & Forestry | 0 (0.0%) | 0 (0.0%) |
| Construction & Extraction | 3 (100.0%) | 0 (0.0%) |
| Installation, Maintenance & Repair | 59 (100.0%) | 0 (0.0%) |
| Total (Category) | 62 (100.0%) | 0 (0.0%) |
| Total (Overall) | 66 (94.3%) | 4 (5.7%) |
Production, Transportation and Moving Occupations
The most common Production, Transportation and Moving occupations in Ratliff City are , and Production (3 | 4.3%).
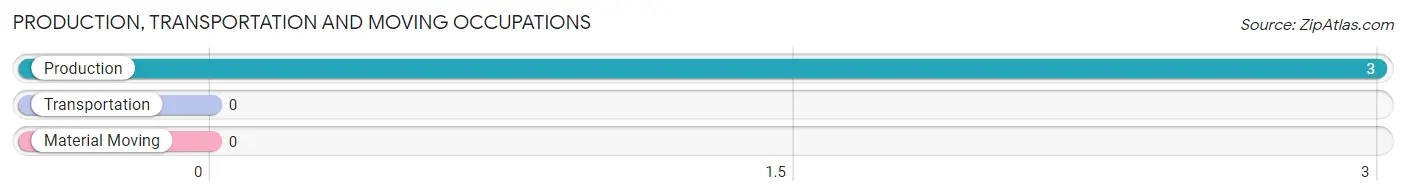
Production, Transportation and Moving Occupations by Sex
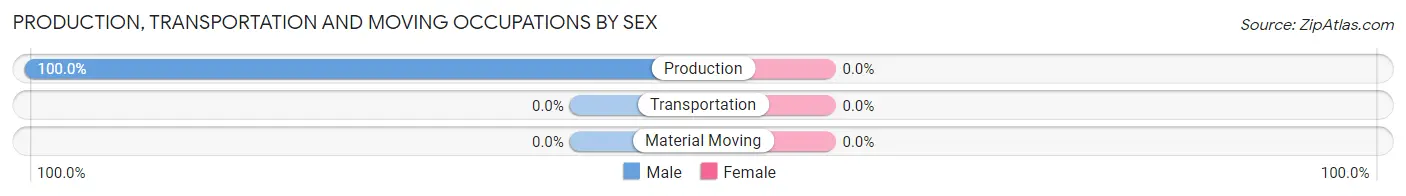
| Occupation | Male | Female |
| Production | 3 (100.0%) | 0 (0.0%) |
| Transportation | 0 (0.0%) | 0 (0.0%) |
| Material Moving | 0 (0.0%) | 0 (0.0%) |
| Total (Category) | 3 (100.0%) | 0 (0.0%) |
| Total (Overall) | 66 (94.3%) | 4 (5.7%) |
Employment Industries by Sex in Ratliff City
Employment Industries in Ratliff City
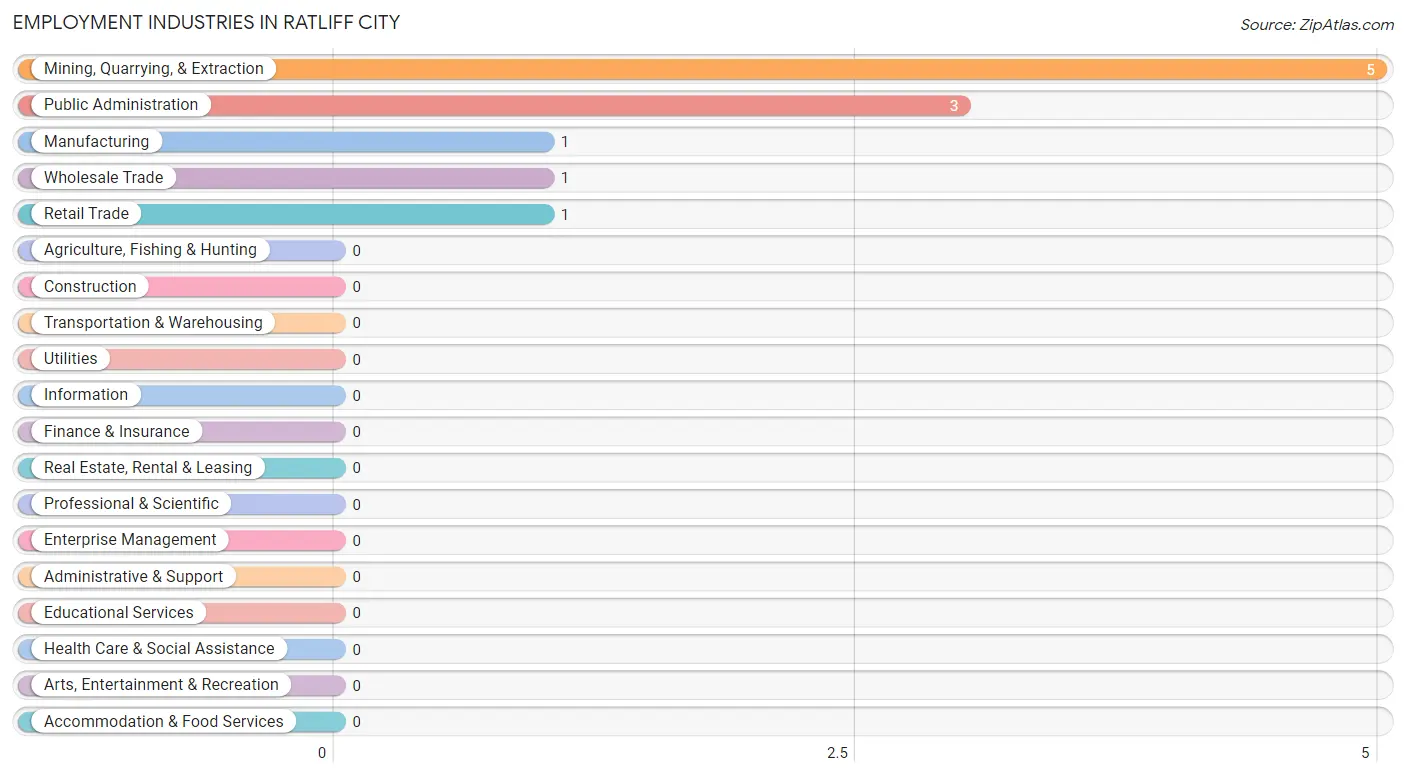
The major employment industries in Ratliff City include Mining, Quarrying, & Extraction (5 | 7.1%), Public Administration (3 | 4.3%), Manufacturing (1 | 1.4%), Wholesale Trade (1 | 1.4%), and Retail Trade (1 | 1.4%).
Employment Industries by Sex in Ratliff City
The Ratliff City industries that see more men than women are Manufacturing (100.0%), Retail Trade (100.0%), and Public Administration (66.7%), whereas the industries that tend to have a higher number of women are Wholesale Trade (100.0%), Mining, Quarrying, & Extraction (40.0%), and Public Administration (33.3%).
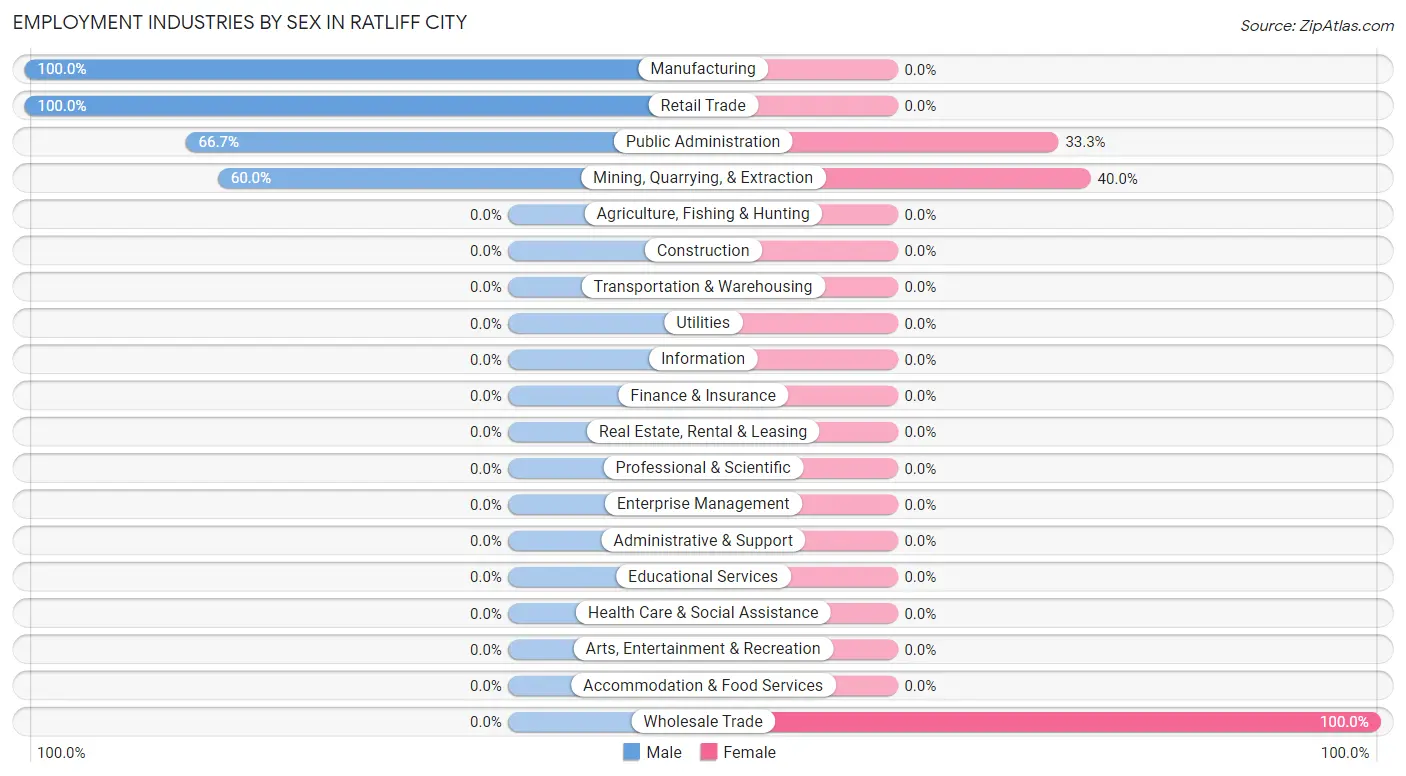
| Industry | Male | Female |
| Agriculture, Fishing & Hunting | 0 (0.0%) | 0 (0.0%) |
| Mining, Quarrying, & Extraction | 3 (60.0%) | 2 (40.0%) |
| Construction | 0 (0.0%) | 0 (0.0%) |
| Manufacturing | 1 (100.0%) | 0 (0.0%) |
| Wholesale Trade | 0 (0.0%) | 1 (100.0%) |
| Retail Trade | 1 (100.0%) | 0 (0.0%) |
| Transportation & Warehousing | 0 (0.0%) | 0 (0.0%) |
| Utilities | 0 (0.0%) | 0 (0.0%) |
| Information | 0 (0.0%) | 0 (0.0%) |
| Finance & Insurance | 0 (0.0%) | 0 (0.0%) |
| Real Estate, Rental & Leasing | 0 (0.0%) | 0 (0.0%) |
| Professional & Scientific | 0 (0.0%) | 0 (0.0%) |
| Enterprise Management | 0 (0.0%) | 0 (0.0%) |
| Administrative & Support | 0 (0.0%) | 0 (0.0%) |
| Educational Services | 0 (0.0%) | 0 (0.0%) |
| Health Care & Social Assistance | 0 (0.0%) | 0 (0.0%) |
| Arts, Entertainment & Recreation | 0 (0.0%) | 0 (0.0%) |
| Accommodation & Food Services | 0 (0.0%) | 0 (0.0%) |
| Public Administration | 2 (66.7%) | 1 (33.3%) |
| Total | 66 (94.3%) | 4 (5.7%) |
Education in Ratliff City
School Enrollment in Ratliff City
The most common levels of schooling among the 3 students in Ratliff City are elementary school (2 | 66.7%), and high school (1 | 33.3%).
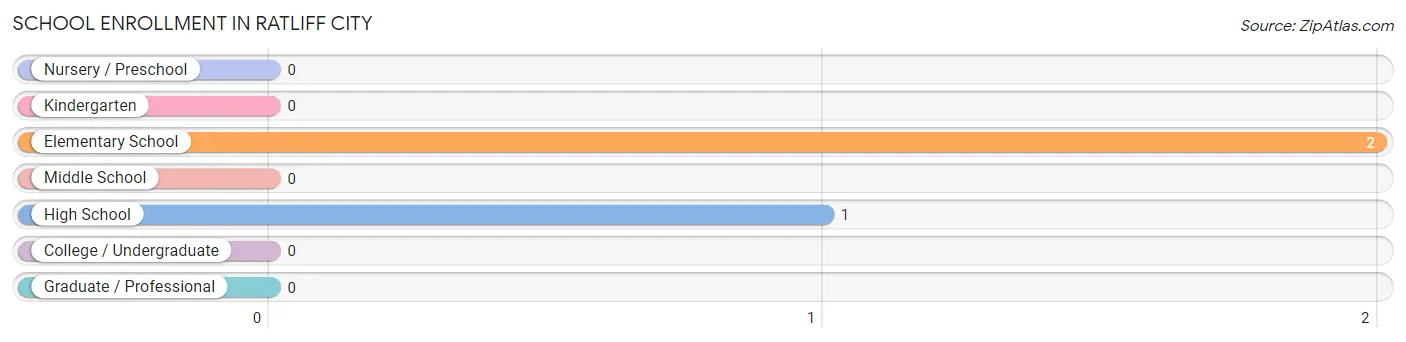
| School Level | # Students | % Students |
| Nursery / Preschool | 0 | 0.0% |
| Kindergarten | 0 | 0.0% |
| Elementary School | 2 | 66.7% |
| Middle School | 0 | 0.0% |
| High School | 1 | 33.3% |
| College / Undergraduate | 0 | 0.0% |
| Graduate / Professional | 0 | 0.0% |
| Total | 3 | 100.0% |
School Enrollment by Age by Funding Source in Ratliff City
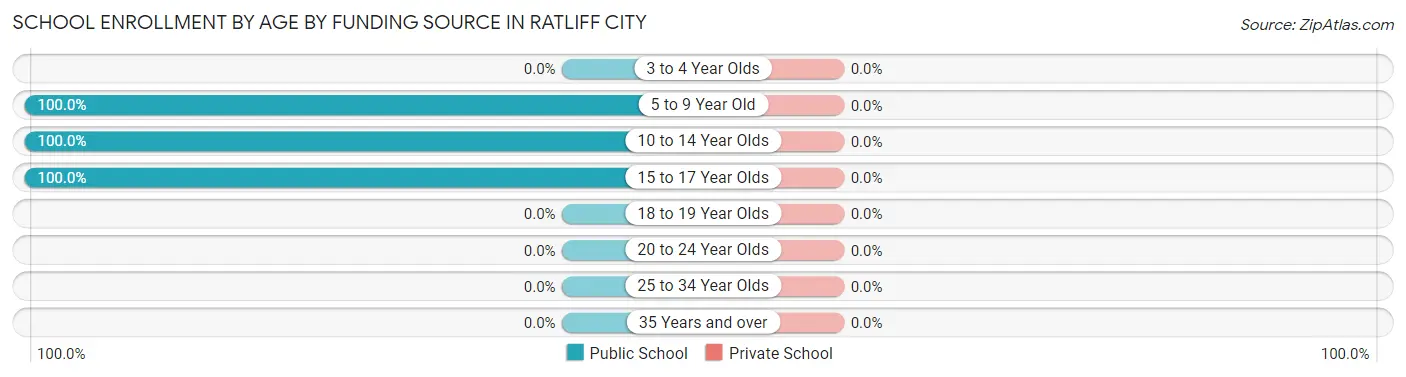
| Age Bracket | Public School | Private School |
| 3 to 4 Year Olds | 0 (0.0%) | 0 (0.0%) |
| 5 to 9 Year Old | 1 (100.0%) | 0 (0.0%) |
| 10 to 14 Year Olds | 1 (100.0%) | 0 (0.0%) |
| 15 to 17 Year Olds | 1 (100.0%) | 0 (0.0%) |
| 18 to 19 Year Olds | 0 (0.0%) | 0 (0.0%) |
| 20 to 24 Year Olds | 0 (0.0%) | 0 (0.0%) |
| 25 to 34 Year Olds | 0 (0.0%) | 0 (0.0%) |
| 35 Years and over | 0 (0.0%) | 0 (0.0%) |
| Total | 3 (100.0%) | 0 (0.0%) |
Educational Attainment by Field of Study in Ratliff City
, and education (1 | 100.0%) are the most common fields of study among 1 individuals in Ratliff City who have obtained a bachelor's degree or higher.
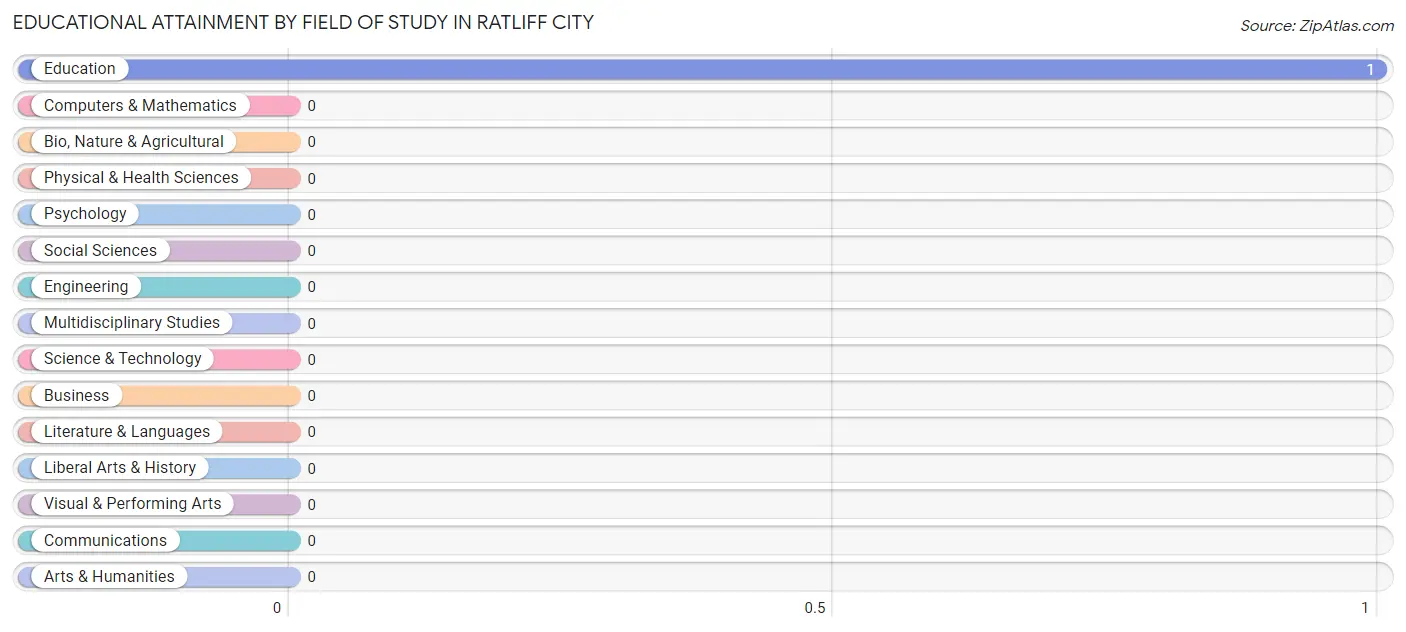
| Field of Study | # Graduates | % Graduates |
| Computers & Mathematics | 0 | 0.0% |
| Bio, Nature & Agricultural | 0 | 0.0% |
| Physical & Health Sciences | 0 | 0.0% |
| Psychology | 0 | 0.0% |
| Social Sciences | 0 | 0.0% |
| Engineering | 0 | 0.0% |
| Multidisciplinary Studies | 0 | 0.0% |
| Science & Technology | 0 | 0.0% |
| Business | 0 | 0.0% |
| Education | 1 | 100.0% |
| Literature & Languages | 0 | 0.0% |
| Liberal Arts & History | 0 | 0.0% |
| Visual & Performing Arts | 0 | 0.0% |
| Communications | 0 | 0.0% |
| Arts & Humanities | 0 | 0.0% |
| Total | 1 | 100.0% |
Transportation & Commute in Ratliff City
Vehicle Availability by Sex in Ratliff City
The most prevalent vehicle ownership categories in Ratliff City are males with 3 vehicles (62, accounting for 93.9%) and females with 3 vehicles (1, making up 1,550.0%).
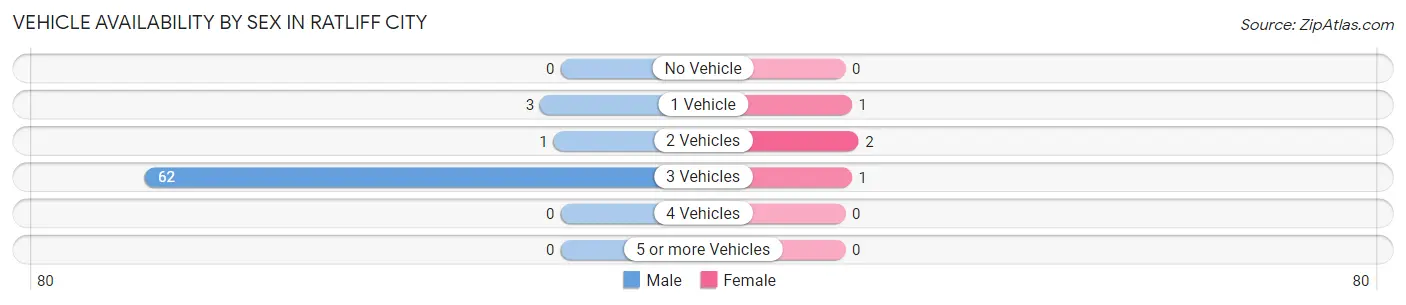
| Vehicles Available | Male | Female |
| No Vehicle | 0 (0.0%) | 0 (0.0%) |
| 1 Vehicle | 3 (4.5%) | 1 (25.0%) |
| 2 Vehicles | 1 (1.5%) | 2 (50.0%) |
| 3 Vehicles | 62 (93.9%) | 1 (25.0%) |
| 4 Vehicles | 0 (0.0%) | 0 (0.0%) |
| 5 or more Vehicles | 0 (0.0%) | 0 (0.0%) |
| Total | 66 (100.0%) | 4 (100.0%) |
Commute Time in Ratliff City
The most frequently occuring commute durations in Ratliff City are 10 to 14 minutes (59 commuters, 84.3%), less than 5 minutes (4 commuters, 5.7%), and 5 to 9 minutes (3 commuters, 4.3%).
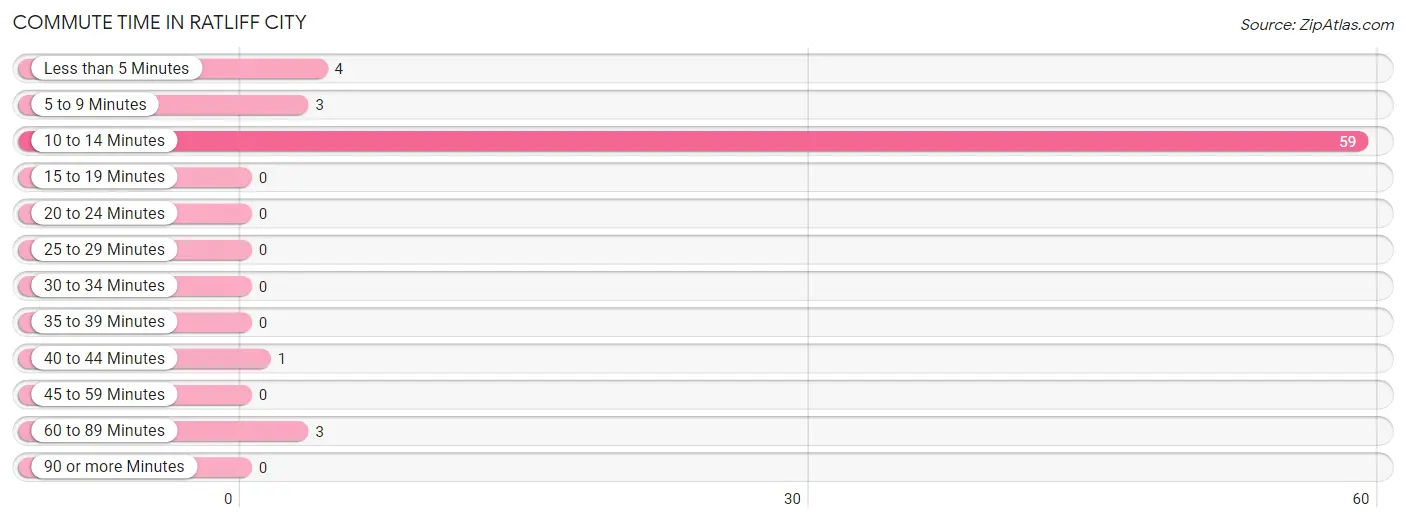
| Commute Time | # Commuters | % Commuters |
| Less than 5 Minutes | 4 | 5.7% |
| 5 to 9 Minutes | 3 | 4.3% |
| 10 to 14 Minutes | 59 | 84.3% |
| 15 to 19 Minutes | 0 | 0.0% |
| 20 to 24 Minutes | 0 | 0.0% |
| 25 to 29 Minutes | 0 | 0.0% |
| 30 to 34 Minutes | 0 | 0.0% |
| 35 to 39 Minutes | 0 | 0.0% |
| 40 to 44 Minutes | 1 | 1.4% |
| 45 to 59 Minutes | 0 | 0.0% |
| 60 to 89 Minutes | 3 | 4.3% |
| 90 or more Minutes | 0 | 0.0% |
Commute Time by Sex in Ratliff City
The most common commute times in Ratliff City are 10 to 14 minutes (57 commuters, 86.4%) for males and less than 5 minutes (2 commuters, 50.0%) for females.
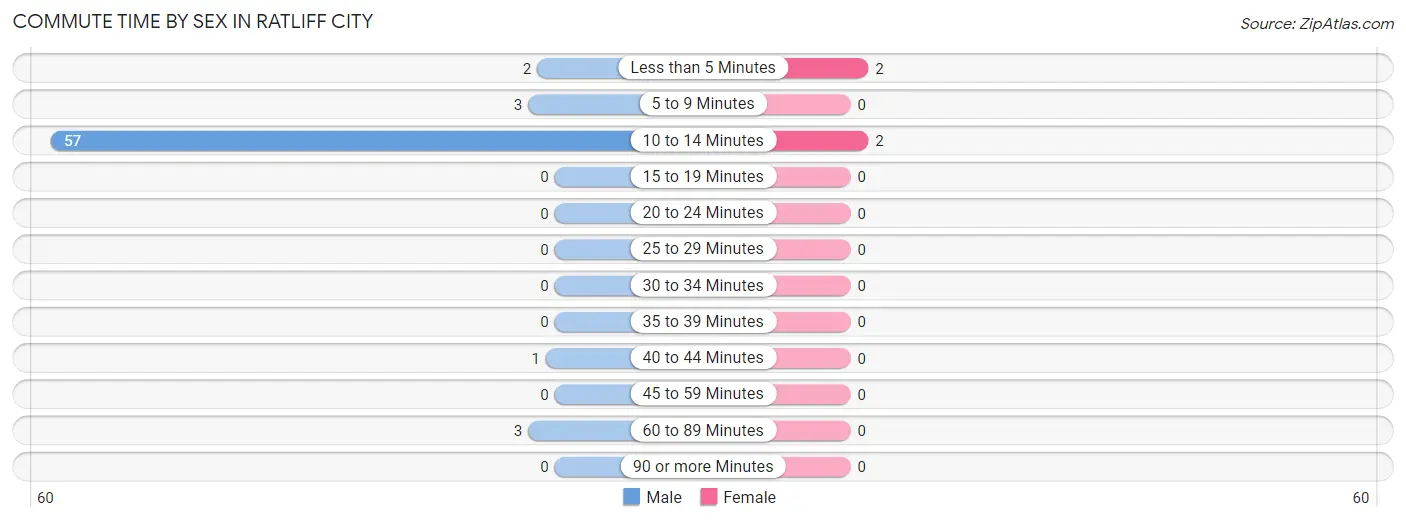
| Commute Time | Male | Female |
| Less than 5 Minutes | 2 (3.0%) | 2 (50.0%) |
| 5 to 9 Minutes | 3 (4.5%) | 0 (0.0%) |
| 10 to 14 Minutes | 57 (86.4%) | 2 (50.0%) |
| 15 to 19 Minutes | 0 (0.0%) | 0 (0.0%) |
| 20 to 24 Minutes | 0 (0.0%) | 0 (0.0%) |
| 25 to 29 Minutes | 0 (0.0%) | 0 (0.0%) |
| 30 to 34 Minutes | 0 (0.0%) | 0 (0.0%) |
| 35 to 39 Minutes | 0 (0.0%) | 0 (0.0%) |
| 40 to 44 Minutes | 1 (1.5%) | 0 (0.0%) |
| 45 to 59 Minutes | 0 (0.0%) | 0 (0.0%) |
| 60 to 89 Minutes | 3 (4.5%) | 0 (0.0%) |
| 90 or more Minutes | 0 (0.0%) | 0 (0.0%) |
Time of Departure to Work by Sex in Ratliff City
The most frequent times of departure to work in Ratliff City are 6:00 AM to 6:29 AM (59, 89.4%) for males and 7:30 AM to 7:59 AM (2, 50.0%) for females.
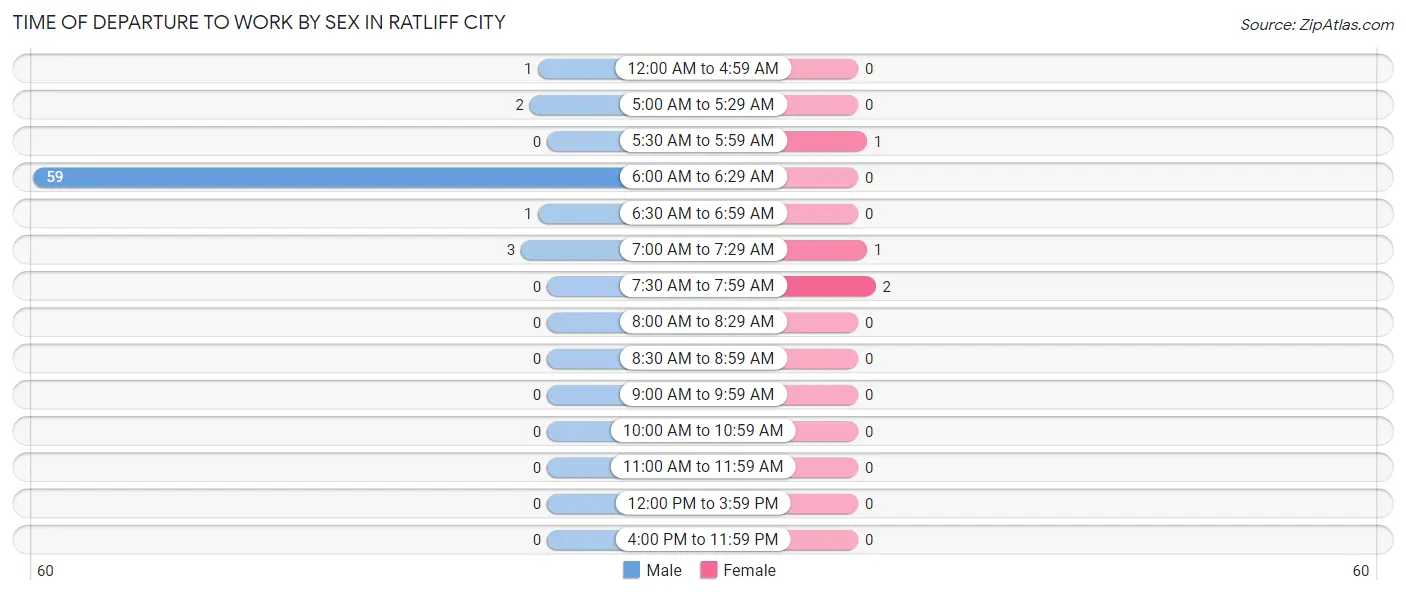
| Time of Departure | Male | Female |
| 12:00 AM to 4:59 AM | 1 (1.5%) | 0 (0.0%) |
| 5:00 AM to 5:29 AM | 2 (3.0%) | 0 (0.0%) |
| 5:30 AM to 5:59 AM | 0 (0.0%) | 1 (25.0%) |
| 6:00 AM to 6:29 AM | 59 (89.4%) | 0 (0.0%) |
| 6:30 AM to 6:59 AM | 1 (1.5%) | 0 (0.0%) |
| 7:00 AM to 7:29 AM | 3 (4.5%) | 1 (25.0%) |
| 7:30 AM to 7:59 AM | 0 (0.0%) | 2 (50.0%) |
| 8:00 AM to 8:29 AM | 0 (0.0%) | 0 (0.0%) |
| 8:30 AM to 8:59 AM | 0 (0.0%) | 0 (0.0%) |
| 9:00 AM to 9:59 AM | 0 (0.0%) | 0 (0.0%) |
| 10:00 AM to 10:59 AM | 0 (0.0%) | 0 (0.0%) |
| 11:00 AM to 11:59 AM | 0 (0.0%) | 0 (0.0%) |
| 12:00 PM to 3:59 PM | 0 (0.0%) | 0 (0.0%) |
| 4:00 PM to 11:59 PM | 0 (0.0%) | 0 (0.0%) |
| Total | 66 (100.0%) | 4 (100.0%) |
Housing Occupancy in Ratliff City
Occupancy by Ownership in Ratliff City
Of the total 24 dwellings in Ratliff City, owner-occupied units account for 16 (66.7%), while renter-occupied units make up 8 (33.3%).
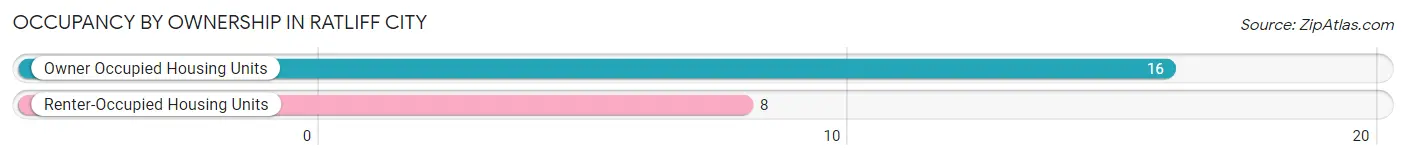
| Occupancy | # Housing Units | % Housing Units |
| Owner Occupied Housing Units | 16 | 66.7% |
| Renter-Occupied Housing Units | 8 | 33.3% |
| Total Occupied Housing Units | 24 | 100.0% |
Occupancy by Household Size in Ratliff City
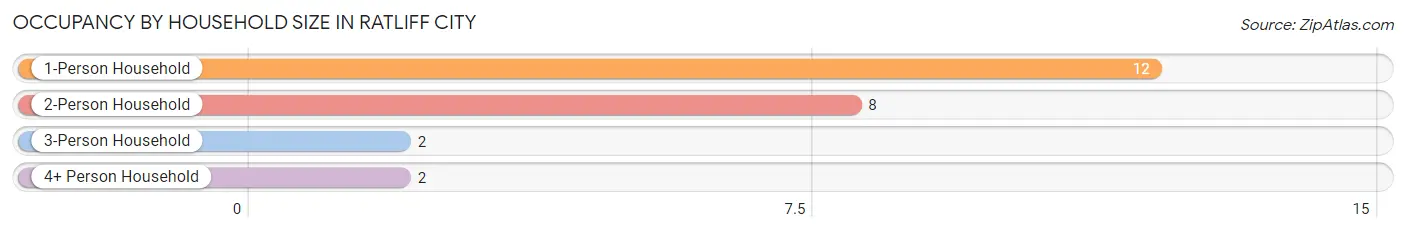
| Household Size | # Housing Units | % Housing Units |
| 1-Person Household | 12 | 50.0% |
| 2-Person Household | 8 | 33.3% |
| 3-Person Household | 2 | 8.3% |
| 4+ Person Household | 2 | 8.3% |
| Total Housing Units | 24 | 100.0% |
Occupancy by Ownership by Household Size in Ratliff City
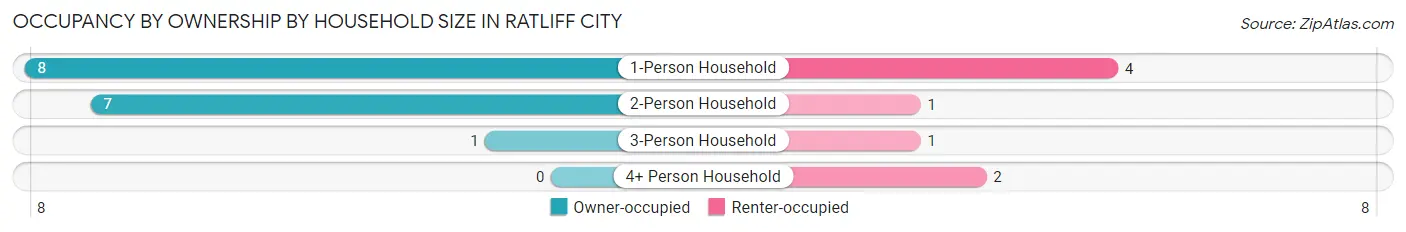
| Household Size | Owner-occupied | Renter-occupied |
| 1-Person Household | 8 (66.7%) | 4 (33.3%) |
| 2-Person Household | 7 (87.5%) | 1 (12.5%) |
| 3-Person Household | 1 (50.0%) | 1 (50.0%) |
| 4+ Person Household | 0 (0.0%) | 2 (100.0%) |
| Total Housing Units | 16 (66.7%) | 8 (33.3%) |
Occupancy by Educational Attainment in Ratliff City
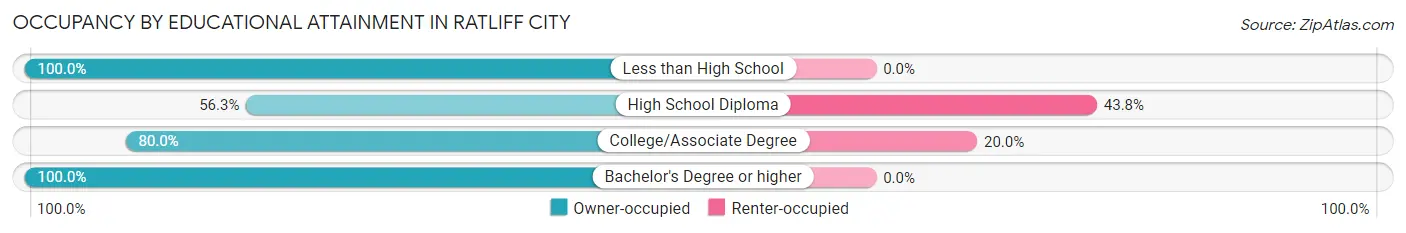
| Household Size | Owner-occupied | Renter-occupied |
| Less than High School | 2 (100.0%) | 0 (0.0%) |
| High School Diploma | 9 (56.2%) | 7 (43.8%) |
| College/Associate Degree | 4 (80.0%) | 1 (20.0%) |
| Bachelor's Degree or higher | 1 (100.0%) | 0 (0.0%) |
Occupancy by Age of Householder in Ratliff City
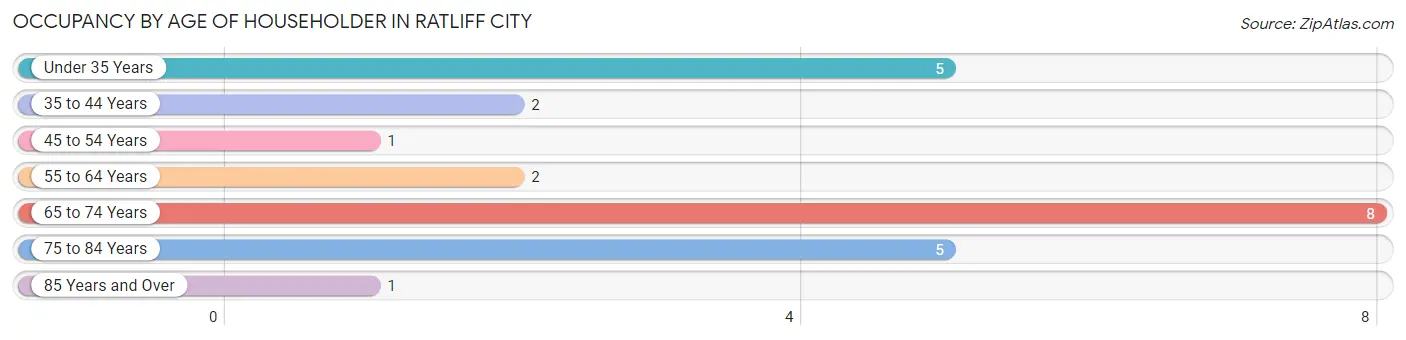
| Age Bracket | # Households | % Households |
| Under 35 Years | 5 | 20.8% |
| 35 to 44 Years | 2 | 8.3% |
| 45 to 54 Years | 1 | 4.2% |
| 55 to 64 Years | 2 | 8.3% |
| 65 to 74 Years | 8 | 33.3% |
| 75 to 84 Years | 5 | 20.8% |
| 85 Years and Over | 1 | 4.2% |
| Total | 24 | 100.0% |
Housing Finances in Ratliff City
Median Income by Occupancy in Ratliff City
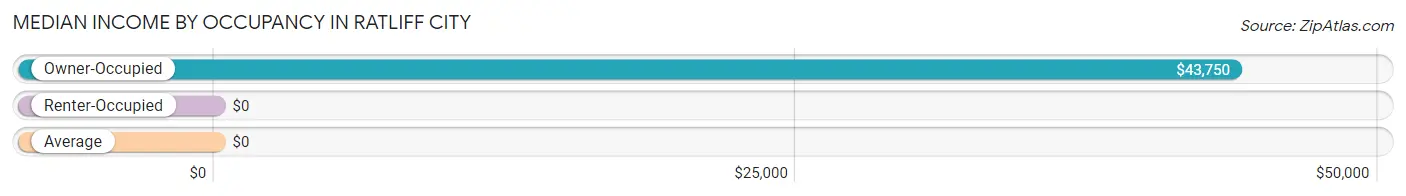
| Occupancy Type | # Households | Median Income |
| Owner-Occupied | 16 (66.7%) | $43,750 |
| Renter-Occupied | 8 (33.3%) | $0 |
| Average | 24 (100.0%) | $0 |
Occupancy by Householder Income Bracket in Ratliff City
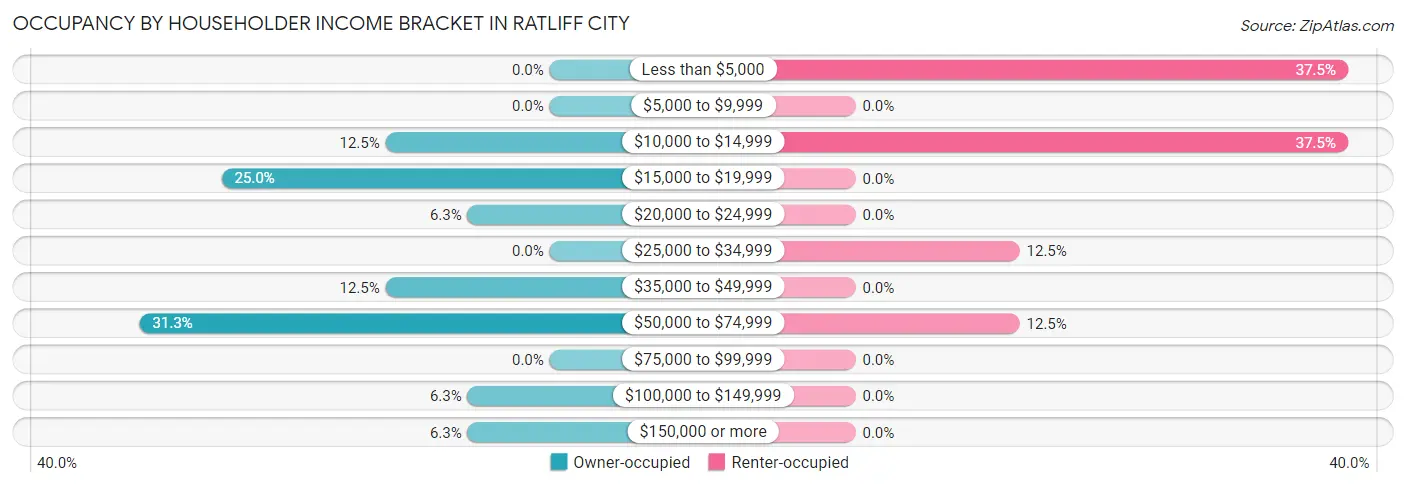
| Income Bracket | Owner-occupied | Renter-occupied |
| Less than $5,000 | 0 (0.0%) | 3 (37.5%) |
| $5,000 to $9,999 | 0 (0.0%) | 0 (0.0%) |
| $10,000 to $14,999 | 2 (12.5%) | 3 (37.5%) |
| $15,000 to $19,999 | 4 (25.0%) | 0 (0.0%) |
| $20,000 to $24,999 | 1 (6.2%) | 0 (0.0%) |
| $25,000 to $34,999 | 0 (0.0%) | 1 (12.5%) |
| $35,000 to $49,999 | 2 (12.5%) | 0 (0.0%) |
| $50,000 to $74,999 | 5 (31.2%) | 1 (12.5%) |
| $75,000 to $99,999 | 0 (0.0%) | 0 (0.0%) |
| $100,000 to $149,999 | 1 (6.2%) | 0 (0.0%) |
| $150,000 or more | 1 (6.2%) | 0 (0.0%) |
| Total | 16 (100.0%) | 8 (100.0%) |
Monthly Housing Cost Tiers in Ratliff City
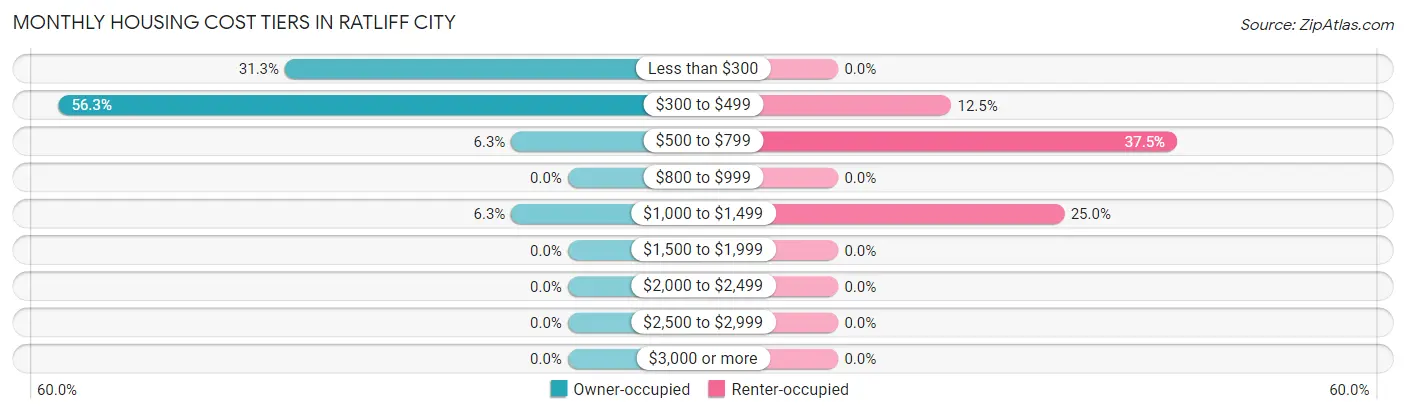
| Monthly Cost | Owner-occupied | Renter-occupied |
| Less than $300 | 5 (31.2%) | 0 (0.0%) |
| $300 to $499 | 9 (56.2%) | 1 (12.5%) |
| $500 to $799 | 1 (6.2%) | 3 (37.5%) |
| $800 to $999 | 0 (0.0%) | 0 (0.0%) |
| $1,000 to $1,499 | 1 (6.2%) | 2 (25.0%) |
| $1,500 to $1,999 | 0 (0.0%) | 0 (0.0%) |
| $2,000 to $2,499 | 0 (0.0%) | 0 (0.0%) |
| $2,500 to $2,999 | 0 (0.0%) | 0 (0.0%) |
| $3,000 or more | 0 (0.0%) | 0 (0.0%) |
| Total | 16 (100.0%) | 8 (100.0%) |
Physical Housing Characteristics in Ratliff City
Housing Structures in Ratliff City
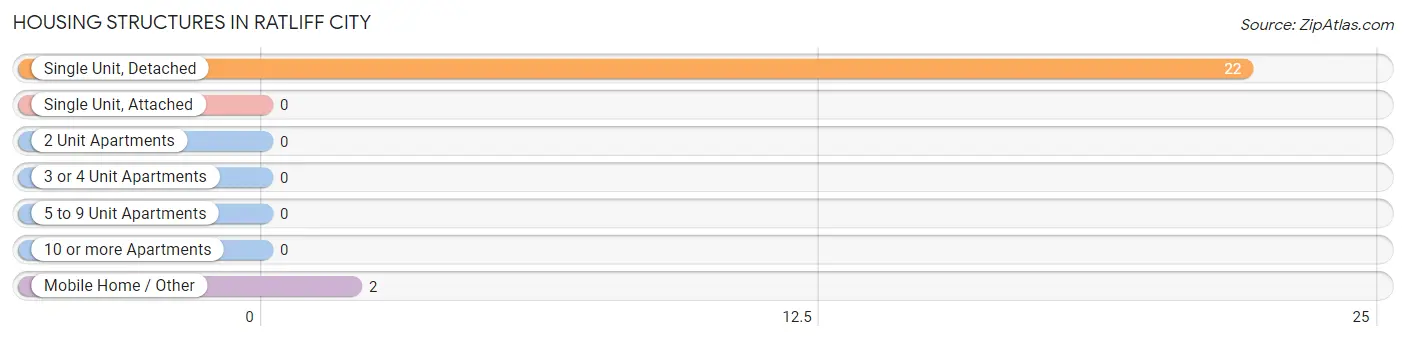
| Structure Type | # Housing Units | % Housing Units |
| Single Unit, Detached | 22 | 91.7% |
| Single Unit, Attached | 0 | 0.0% |
| 2 Unit Apartments | 0 | 0.0% |
| 3 or 4 Unit Apartments | 0 | 0.0% |
| 5 to 9 Unit Apartments | 0 | 0.0% |
| 10 or more Apartments | 0 | 0.0% |
| Mobile Home / Other | 2 | 8.3% |
| Total | 24 | 100.0% |
Housing Structures by Occupancy in Ratliff City
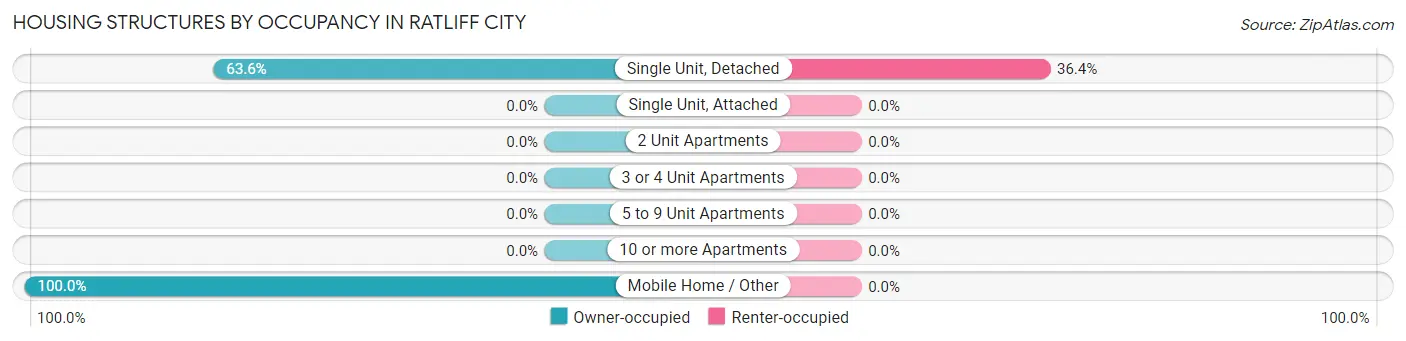
| Structure Type | Owner-occupied | Renter-occupied |
| Single Unit, Detached | 14 (63.6%) | 8 (36.4%) |
| Single Unit, Attached | 0 (0.0%) | 0 (0.0%) |
| 2 Unit Apartments | 0 (0.0%) | 0 (0.0%) |
| 3 or 4 Unit Apartments | 0 (0.0%) | 0 (0.0%) |
| 5 to 9 Unit Apartments | 0 (0.0%) | 0 (0.0%) |
| 10 or more Apartments | 0 (0.0%) | 0 (0.0%) |
| Mobile Home / Other | 2 (100.0%) | 0 (0.0%) |
| Total | 16 (66.7%) | 8 (33.3%) |
Housing Structures by Number of Rooms in Ratliff City
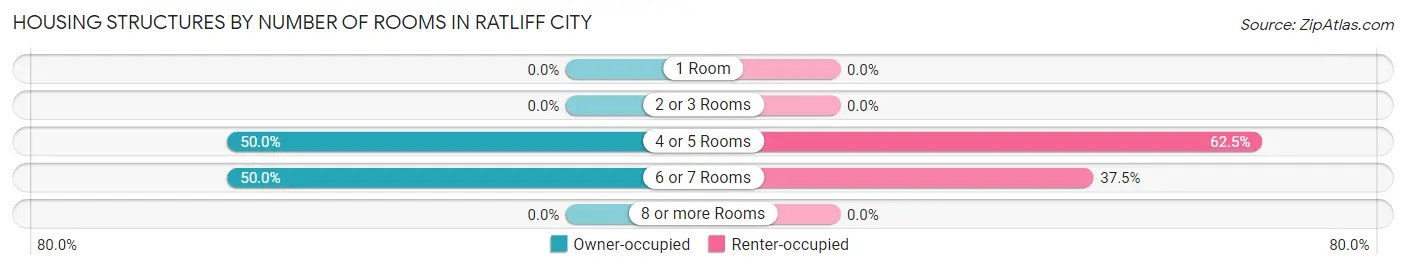
| Number of Rooms | Owner-occupied | Renter-occupied |
| 1 Room | 0 (0.0%) | 0 (0.0%) |
| 2 or 3 Rooms | 0 (0.0%) | 0 (0.0%) |
| 4 or 5 Rooms | 8 (50.0%) | 5 (62.5%) |
| 6 or 7 Rooms | 8 (50.0%) | 3 (37.5%) |
| 8 or more Rooms | 0 (0.0%) | 0 (0.0%) |
| Total | 16 (100.0%) | 8 (100.0%) |
Housing Structure by Heating Type in Ratliff City
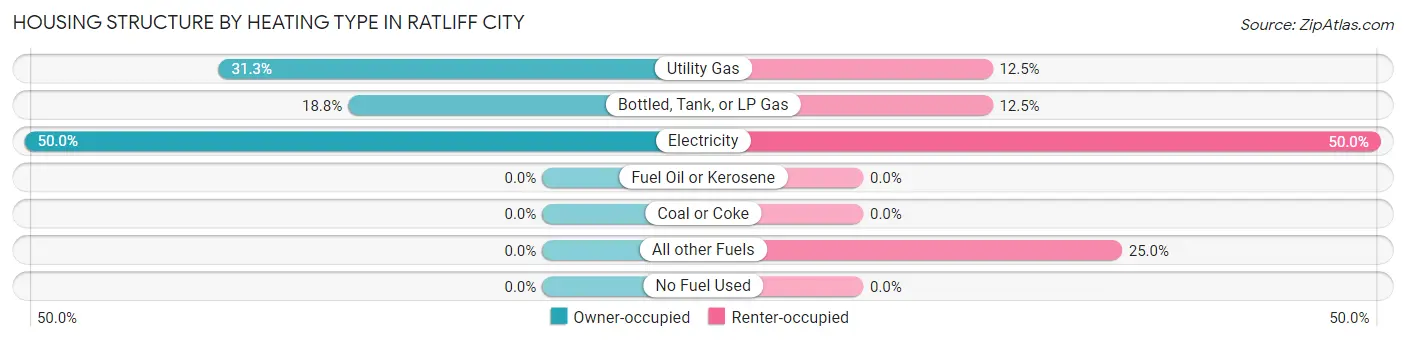
| Heating Type | Owner-occupied | Renter-occupied |
| Utility Gas | 5 (31.2%) | 1 (12.5%) |
| Bottled, Tank, or LP Gas | 3 (18.8%) | 1 (12.5%) |
| Electricity | 8 (50.0%) | 4 (50.0%) |
| Fuel Oil or Kerosene | 0 (0.0%) | 0 (0.0%) |
| Coal or Coke | 0 (0.0%) | 0 (0.0%) |
| All other Fuels | 0 (0.0%) | 2 (25.0%) |
| No Fuel Used | 0 (0.0%) | 0 (0.0%) |
| Total | 16 (100.0%) | 8 (100.0%) |
Household Vehicle Usage in Ratliff City
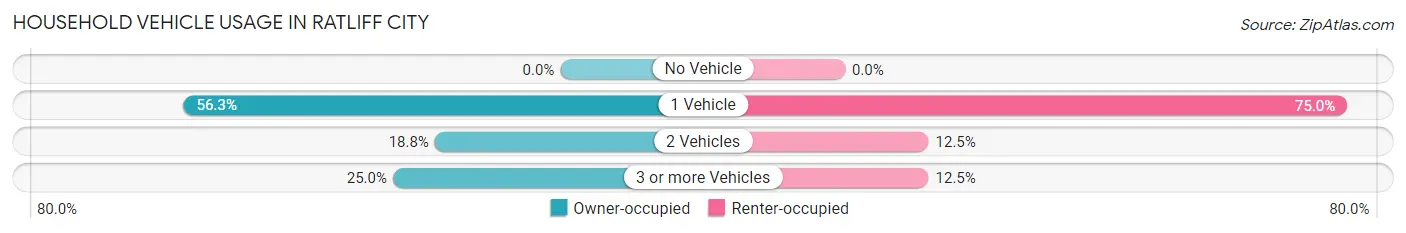
| Vehicles per Household | Owner-occupied | Renter-occupied |
| No Vehicle | 0 (0.0%) | 0 (0.0%) |
| 1 Vehicle | 9 (56.2%) | 6 (75.0%) |
| 2 Vehicles | 3 (18.8%) | 1 (12.5%) |
| 3 or more Vehicles | 4 (25.0%) | 1 (12.5%) |
| Total | 16 (100.0%) | 8 (100.0%) |
Real Estate & Mortgages in Ratliff City
Real Estate and Mortgage Overview in Ratliff City
| Characteristic | Without Mortgage | With Mortgage |
| Housing Units | 14 | 2 |
| Median Property Value | $55,000 | $0 |
| Median Household Income | $43,750 | $0 |
| Monthly Housing Costs | $400 | $0 |
| Real Estate Taxes | $367 | $0 |
Property Value by Mortgage Status in Ratliff City
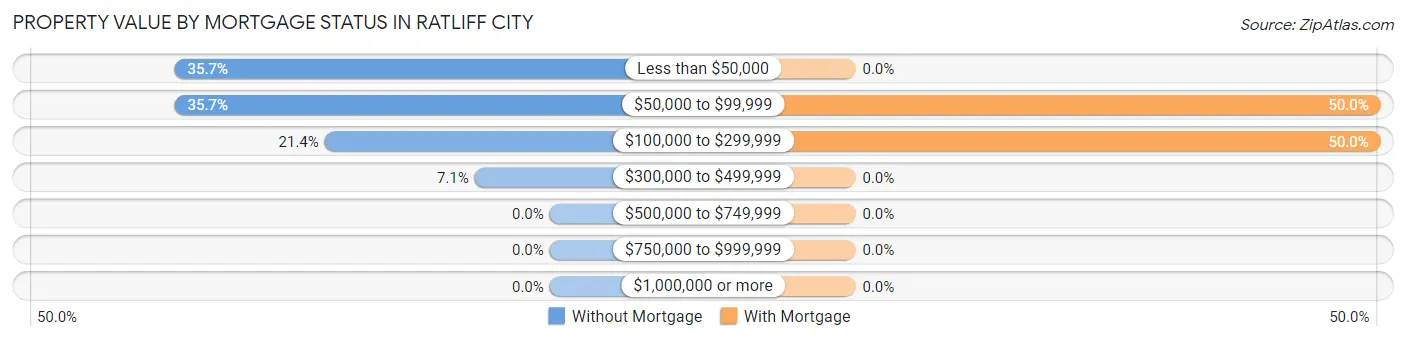
| Property Value | Without Mortgage | With Mortgage |
| Less than $50,000 | 5 (35.7%) | 0 (0.0%) |
| $50,000 to $99,999 | 5 (35.7%) | 1 (50.0%) |
| $100,000 to $299,999 | 3 (21.4%) | 1 (50.0%) |
| $300,000 to $499,999 | 1 (7.1%) | 0 (0.0%) |
| $500,000 to $749,999 | 0 (0.0%) | 0 (0.0%) |
| $750,000 to $999,999 | 0 (0.0%) | 0 (0.0%) |
| $1,000,000 or more | 0 (0.0%) | 0 (0.0%) |
| Total | 14 (100.0%) | 2 (100.0%) |
Household Income by Mortgage Status in Ratliff City
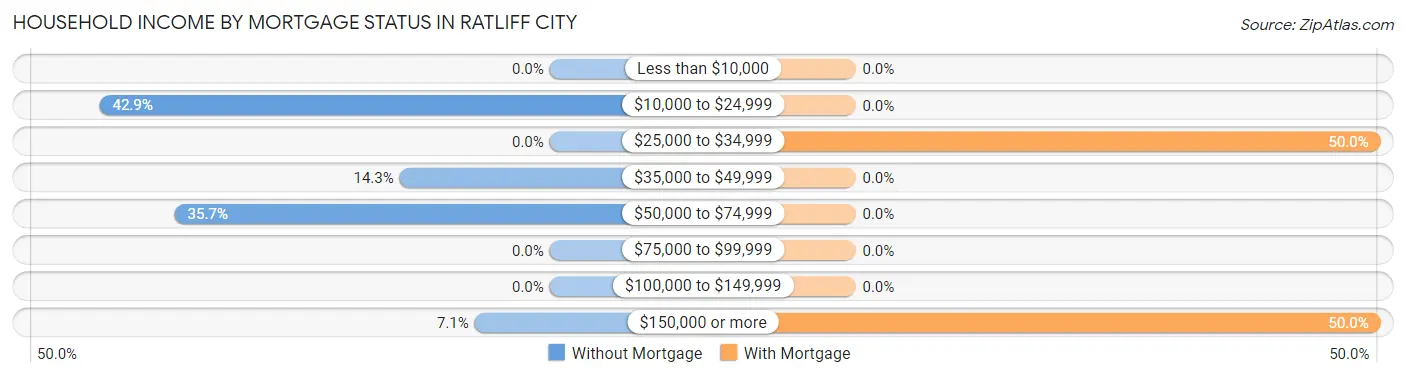
| Household Income | Without Mortgage | With Mortgage |
| Less than $10,000 | 0 (0.0%) | 0 (0.0%) |
| $10,000 to $24,999 | 6 (42.9%) | 0 (0.0%) |
| $25,000 to $34,999 | 0 (0.0%) | 1 (50.0%) |
| $35,000 to $49,999 | 2 (14.3%) | 0 (0.0%) |
| $50,000 to $74,999 | 5 (35.7%) | 0 (0.0%) |
| $75,000 to $99,999 | 0 (0.0%) | 0 (0.0%) |
| $100,000 to $149,999 | 0 (0.0%) | 0 (0.0%) |
| $150,000 or more | 1 (7.1%) | 1 (50.0%) |
| Total | 14 (100.0%) | 2 (100.0%) |
Property Value to Household Income Ratio in Ratliff City
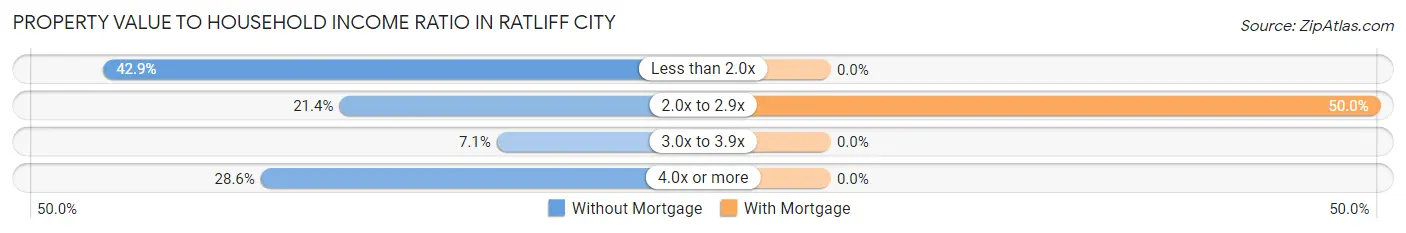
| Value-to-Income Ratio | Without Mortgage | With Mortgage |
| Less than 2.0x | 6 (42.9%) | 0 (0.0%) |
| 2.0x to 2.9x | 3 (21.4%) | 1 (50.0%) |
| 3.0x to 3.9x | 1 (7.1%) | 0 (0.0%) |
| 4.0x or more | 4 (28.6%) | 0 (0.0%) |
| Total | 14 (100.0%) | 2 (100.0%) |
Real Estate Taxes by Mortgage Status in Ratliff City
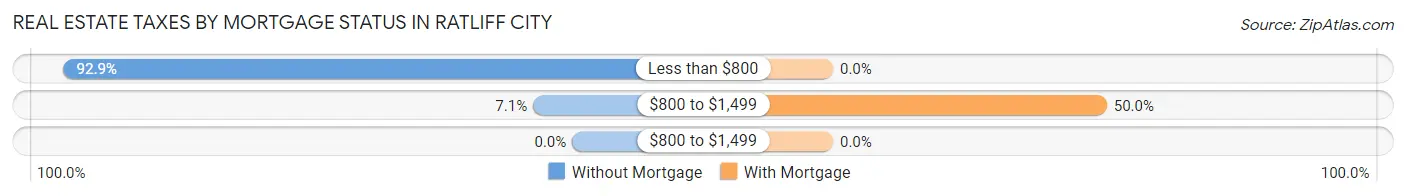
| Property Taxes | Without Mortgage | With Mortgage |
| Less than $800 | 13 (92.9%) | 0 (0.0%) |
| $800 to $1,499 | 1 (7.1%) | 1 (50.0%) |
| $800 to $1,499 | 0 (0.0%) | 0 (0.0%) |
| Total | 14 (100.0%) | 2 (100.0%) |
Health & Disability in Ratliff City
Health Insurance Coverage by Age in Ratliff City
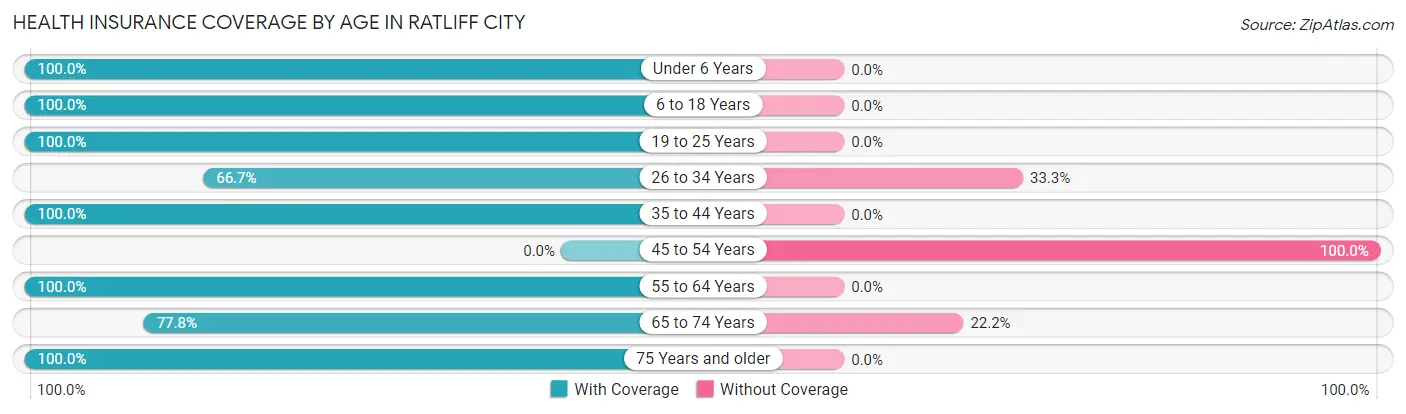
| Age Bracket | With Coverage | Without Coverage |
| Under 6 Years | 2 (100.0%) | 0 (0.0%) |
| 6 to 18 Years | 3 (100.0%) | 0 (0.0%) |
| 19 to 25 Years | 7 (100.0%) | 0 (0.0%) |
| 26 to 34 Years | 2 (66.7%) | 1 (33.3%) |
| 35 to 44 Years | 7 (100.0%) | 0 (0.0%) |
| 45 to 54 Years | 0 (0.0%) | 2 (100.0%) |
| 55 to 64 Years | 3 (100.0%) | 0 (0.0%) |
| 65 to 74 Years | 7 (77.8%) | 2 (22.2%) |
| 75 Years and older | 65 (100.0%) | 0 (0.0%) |
| Total | 96 (95.1%) | 5 (5.0%) |
Health Insurance Coverage by Citizenship Status in Ratliff City
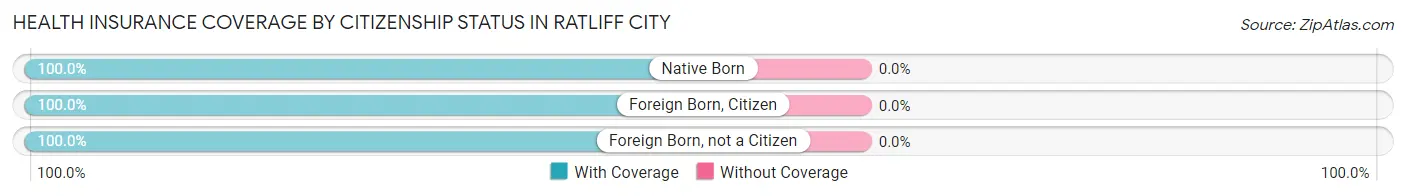
| Citizenship Status | With Coverage | Without Coverage |
| Native Born | 2 (100.0%) | 0 (0.0%) |
| Foreign Born, Citizen | 3 (100.0%) | 0 (0.0%) |
| Foreign Born, not a Citizen | 7 (100.0%) | 0 (0.0%) |
Health Insurance Coverage by Household Income in Ratliff City
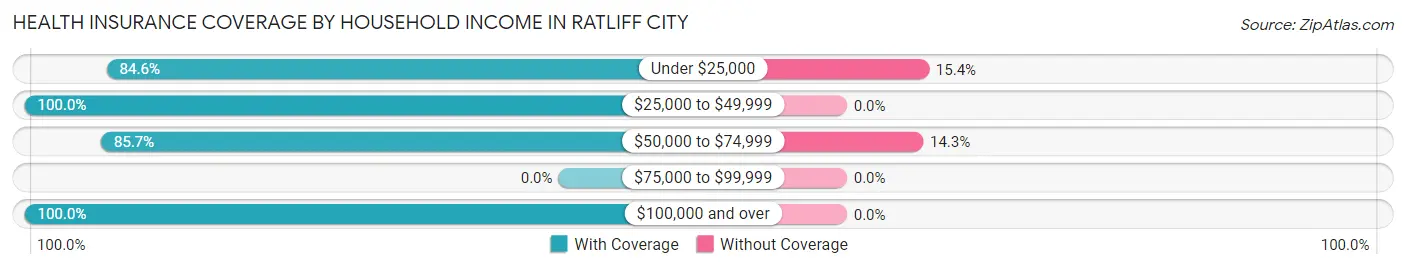
| Household Income | With Coverage | Without Coverage |
| Under $25,000 | 22 (84.6%) | 4 (15.4%) |
| $25,000 to $49,999 | 5 (100.0%) | 0 (0.0%) |
| $50,000 to $74,999 | 6 (85.7%) | 1 (14.3%) |
| $75,000 to $99,999 | 0 (0.0%) | 0 (0.0%) |
| $100,000 and over | 63 (100.0%) | 0 (0.0%) |
Public vs Private Health Insurance Coverage by Age in Ratliff City
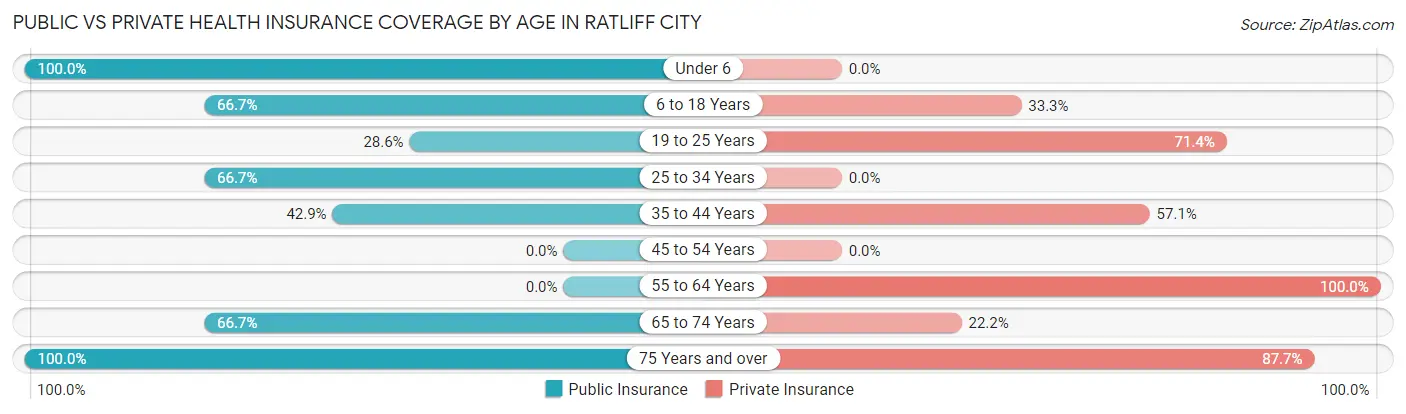
| Age Bracket | Public Insurance | Private Insurance |
| Under 6 | 2 (100.0%) | 0 (0.0%) |
| 6 to 18 Years | 2 (66.7%) | 1 (33.3%) |
| 19 to 25 Years | 2 (28.6%) | 5 (71.4%) |
| 25 to 34 Years | 2 (66.7%) | 0 (0.0%) |
| 35 to 44 Years | 3 (42.9%) | 4 (57.1%) |
| 45 to 54 Years | 0 (0.0%) | 0 (0.0%) |
| 55 to 64 Years | 0 (0.0%) | 3 (100.0%) |
| 65 to 74 Years | 6 (66.7%) | 2 (22.2%) |
| 75 Years and over | 65 (100.0%) | 57 (87.7%) |
| Total | 82 (81.2%) | 72 (71.3%) |
Disability Status by Sex by Age in Ratliff City
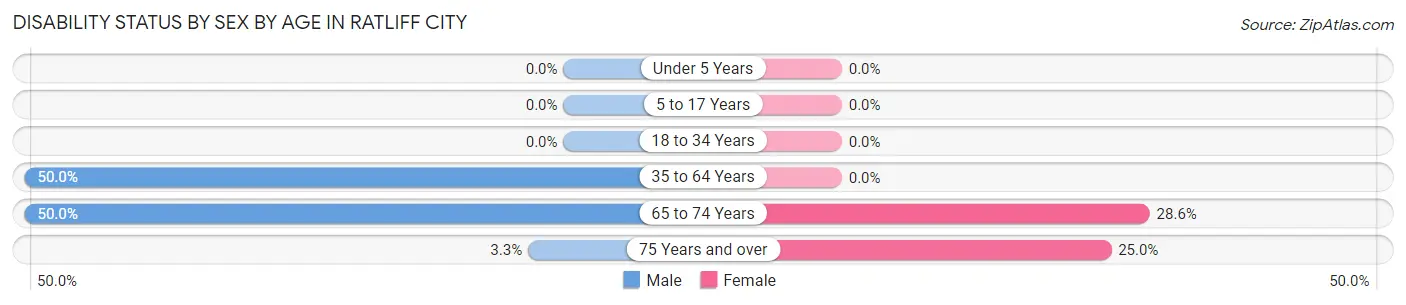
| Age Bracket | Male | Female |
| Under 5 Years | 0 (0.0%) | 0 (0.0%) |
| 5 to 17 Years | 0 (0.0%) | 0 (0.0%) |
| 18 to 34 Years | 0 (0.0%) | 0 (0.0%) |
| 35 to 64 Years | 4 (50.0%) | 0 (0.0%) |
| 65 to 74 Years | 1 (50.0%) | 2 (28.6%) |
| 75 Years and over | 2 (3.3%) | 1 (25.0%) |
Disability Class by Sex by Age in Ratliff City
Disability Class: Hearing Difficulty
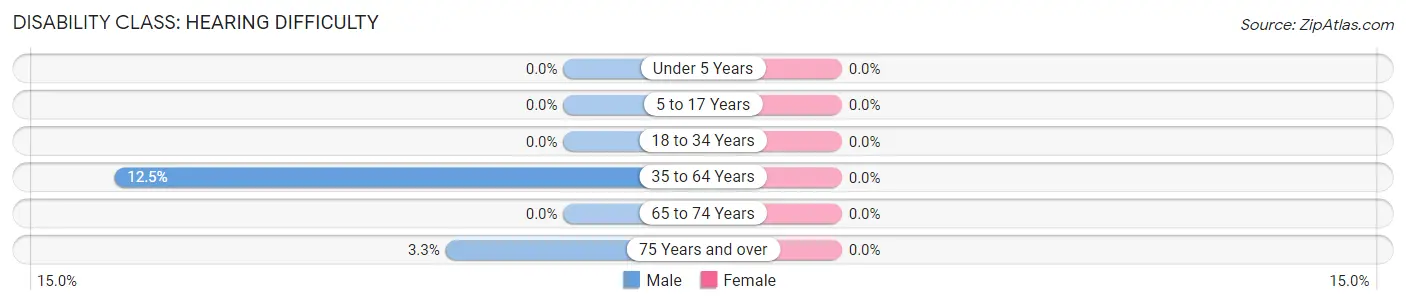
| Age Bracket | Male | Female |
| Under 5 Years | 0 (0.0%) | 0 (0.0%) |
| 5 to 17 Years | 0 (0.0%) | 0 (0.0%) |
| 18 to 34 Years | 0 (0.0%) | 0 (0.0%) |
| 35 to 64 Years | 1 (12.5%) | 0 (0.0%) |
| 65 to 74 Years | 0 (0.0%) | 0 (0.0%) |
| 75 Years and over | 2 (3.3%) | 0 (0.0%) |
Disability Class: Vision Difficulty
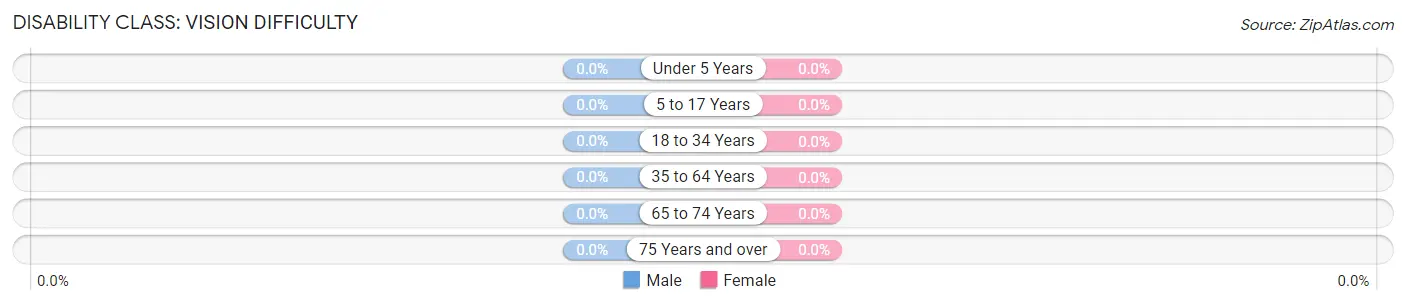
| Age Bracket | Male | Female |
| Under 5 Years | 0 (0.0%) | 0 (0.0%) |
| 5 to 17 Years | 0 (0.0%) | 0 (0.0%) |
| 18 to 34 Years | 0 (0.0%) | 0 (0.0%) |
| 35 to 64 Years | 0 (0.0%) | 0 (0.0%) |
| 65 to 74 Years | 0 (0.0%) | 0 (0.0%) |
| 75 Years and over | 0 (0.0%) | 0 (0.0%) |
Disability Class: Cognitive Difficulty
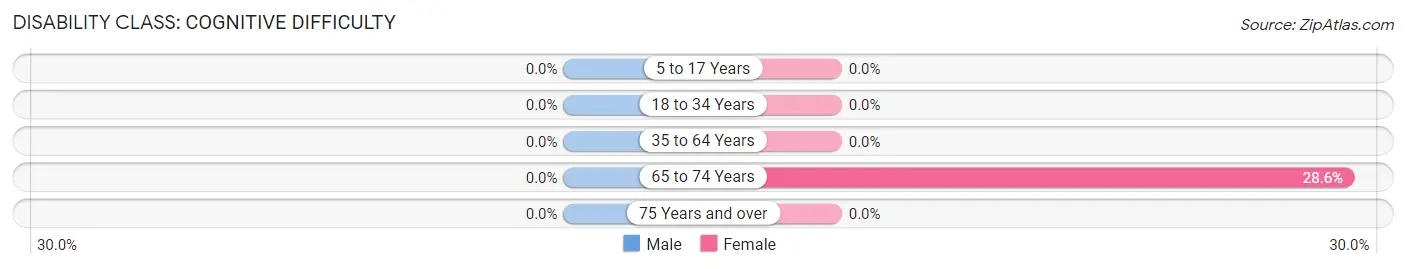
| Age Bracket | Male | Female |
| 5 to 17 Years | 0 (0.0%) | 0 (0.0%) |
| 18 to 34 Years | 0 (0.0%) | 0 (0.0%) |
| 35 to 64 Years | 0 (0.0%) | 0 (0.0%) |
| 65 to 74 Years | 0 (0.0%) | 2 (28.6%) |
| 75 Years and over | 0 (0.0%) | 0 (0.0%) |
Disability Class: Ambulatory Difficulty
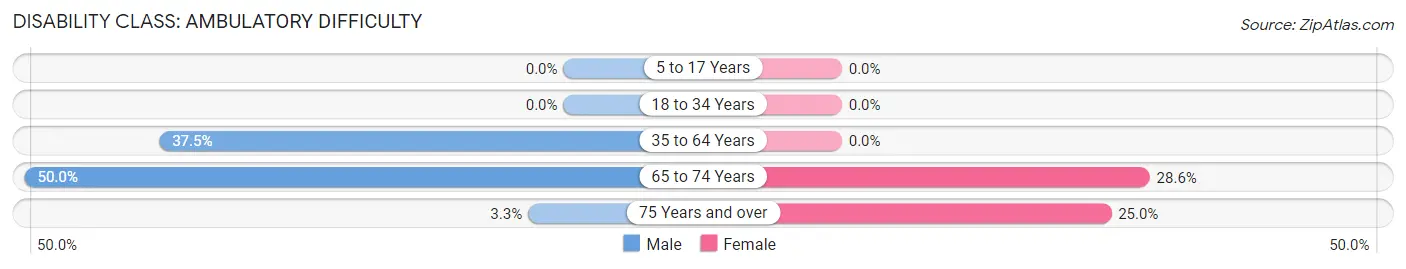
| Age Bracket | Male | Female |
| 5 to 17 Years | 0 (0.0%) | 0 (0.0%) |
| 18 to 34 Years | 0 (0.0%) | 0 (0.0%) |
| 35 to 64 Years | 3 (37.5%) | 0 (0.0%) |
| 65 to 74 Years | 1 (50.0%) | 2 (28.6%) |
| 75 Years and over | 2 (3.3%) | 1 (25.0%) |
Disability Class: Self-Care Difficulty
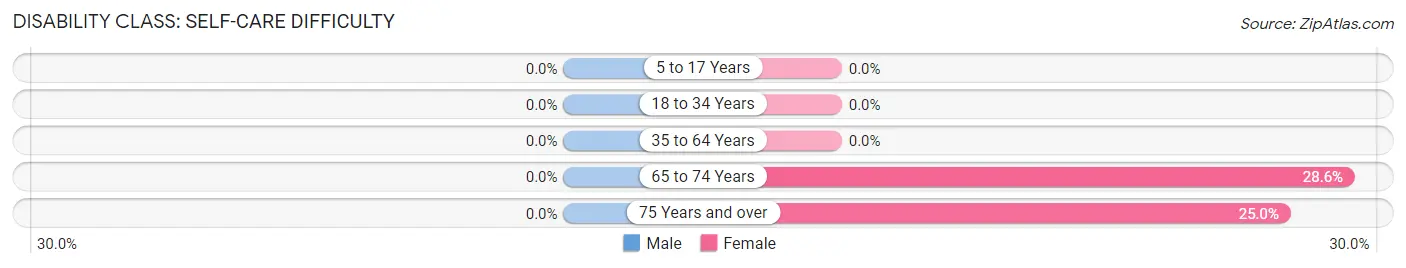
| Age Bracket | Male | Female |
| 5 to 17 Years | 0 (0.0%) | 0 (0.0%) |
| 18 to 34 Years | 0 (0.0%) | 0 (0.0%) |
| 35 to 64 Years | 0 (0.0%) | 0 (0.0%) |
| 65 to 74 Years | 0 (0.0%) | 2 (28.6%) |
| 75 Years and over | 0 (0.0%) | 1 (25.0%) |
Technology Access in Ratliff City
Computing Device Access in Ratliff City
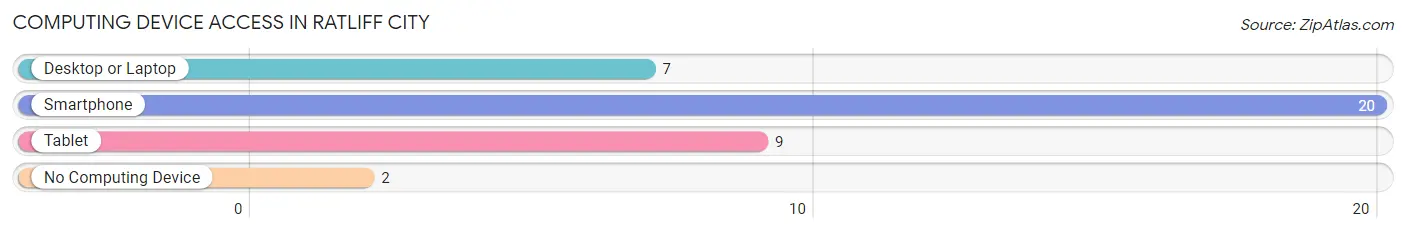
| Device Type | # Households | % Households |
| Desktop or Laptop | 7 | 29.2% |
| Smartphone | 20 | 83.3% |
| Tablet | 9 | 37.5% |
| No Computing Device | 2 | 8.3% |
| Total | 24 | 100.0% |
Internet Access in Ratliff City
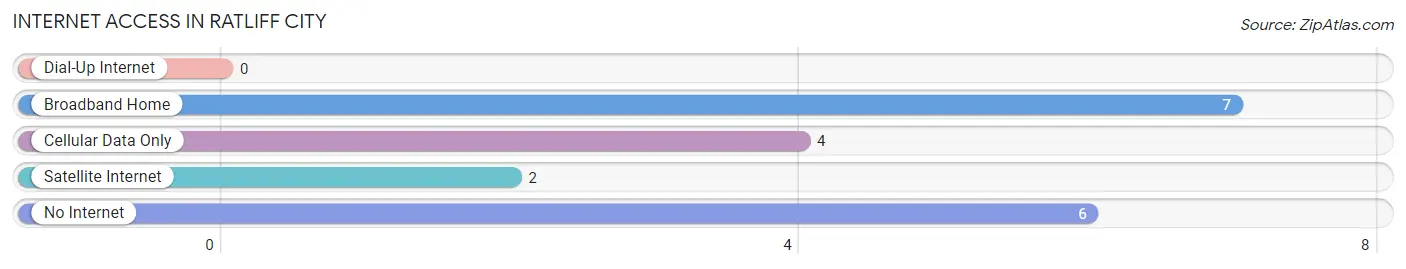
| Internet Type | # Households | % Households |
| Dial-Up Internet | 0 | 0.0% |
| Broadband Home | 7 | 29.2% |
| Cellular Data Only | 4 | 16.7% |
| Satellite Internet | 2 | 8.3% |
| No Internet | 6 | 25.0% |
| Total | 24 | 100.0% |
Ratliff City Summary
Ratliff City is a small town located in Jefferson County, Oklahoma. It is situated on the banks of the Red River, approximately 20 miles south of the Oklahoma-Texas border. The town was founded in 1891 and named after the Ratliff family, who were among the first settlers in the area. The population of Ratliff City was estimated to be around 500 in 2020.
Geography
Ratliff City is located in the southeastern corner of Oklahoma, near the Red River. The town is situated on a flat plain, with the Red River to the east and the Washita River to the west. The town is surrounded by rolling hills and wooded areas, with the nearest major city being Ardmore, Oklahoma, located about 30 miles to the north.
Climate
Ratliff City has a humid subtropical climate, with hot summers and mild winters. The average high temperature in the summer is around 90°F, while the average low temperature in the winter is around 30°F. The town receives an average of 40 inches of precipitation per year, with most of it falling in the spring and summer months.
Demographics
As of the 2010 census, Ratliff City had a population of 498 people. The racial makeup of the town was 95.2% White, 0.2% African American, 0.4% Native American, 0.2% Asian, 0.2% from other races, and 3.8% from two or more races. Hispanic or Latino of any race were 1.2% of the population.
Economy
Ratliff City is a small, rural town with a limited economy. The town is home to a few small businesses, including a grocery store, a gas station, and a few restaurants. The town also has a few small manufacturing companies, which produce items such as furniture and clothing. The town is also home to a few farms, which produce crops such as corn, wheat, and soybeans.
History
Ratliff City was founded in 1891 by the Ratliff family, who were among the first settlers in the area. The town was originally known as Ratliff's Crossing, and was a popular stop for travelers on the Red River. In the early 1900s, the town was home to a number of businesses, including a hotel, a general store, and a blacksmith shop.
In the 1920s, the town began to decline as the railroad bypassed Ratliff City in favor of larger towns. The town's population dwindled, and by the 1950s, the town was nearly abandoned. In the late 1970s, the town began to experience a resurgence, as new businesses opened and the population began to grow. Today, Ratliff City is a small, rural town with a population of around 500 people.
Common Questions
What is Per Capita Income in Ratliff City?
Per Capita income in Ratliff City is $102,309.
What is Inequality or Gini Index in Ratliff City?
Inequality or Gini Index in Ratliff City is 0.51.
What is the Total Population of Ratliff City?
Total Population of Ratliff City is 101.
What is the Total Male Population of Ratliff City?
Total Male Population of Ratliff City is 79.
What is the Total Female Population of Ratliff City?
Total Female Population of Ratliff City is 22.
What is the Ratio of Males per 100 Females in Ratliff City?
There are 359.09 Males per 100 Females in Ratliff City.
What is the Ratio of Females per 100 Males in Ratliff City?
There are 27.85 Females per 100 Males in Ratliff City.
What is the Median Population Age in Ratliff City?
Median Population Age in Ratliff City is 84.1 Years.
What is the Average Family Size in Ratliff City
Average Family Size in Ratliff City is 7.4 People.
What is the Average Household Size in Ratliff City
Average Household Size in Ratliff City is 4.2 People.
How Large is the Labor Force in Ratliff City?
There are 71 People in the Labor Forcein in Ratliff City.
What is the Percentage of People in the Labor Force in Ratliff City?
74.0% of People are in the Labor Force in Ratliff City.
What is the Unemployment Rate in Ratliff City?
Unemployment Rate in Ratliff City is 1.4%.