Wellton Hills, AZ Map & Demographics
Wellton Hills Map
Wellton Hills Overview
$24,007
PER CAPITA INCOME
0.20
INEQUALITY / GINI INDEX
193
TOTAL POPULATION
123
MALE POPULATION
70
FEMALE POPULATION
175.71
MALES / 100 FEMALES
56.91
FEMALES / 100 MALES
43.3
MEDIAN AGE
2.3
AVG FAMILY SIZE
2.9
AVG HOUSEHOLD SIZE
93
LABOR FORCE [ PEOPLE ]
62.4%
PERCENT IN LABOR FORCE
6.5%
UNEMPLOYMENT RATE
Income in Wellton Hills
Income Overview in Wellton Hills
| Characteristic | Number | Measure |
| Per Capita Income | 193 | $24,007 |
| Median Family Income | 66 | $0 |
| Mean Family Income | 66 | $76,662 |
| Median Household Income | 66 | $0 |
| Mean Household Income | 66 | $82,736 |
| Income Deficit | 66 | $0 |
| Wage / Income Gap (%) | 193 | 0.00% |
| Wage / Income Gap ($) | 193 | 100.00¢ per $1 |
| Gini / Inequality Index | 193 | 0.20 |
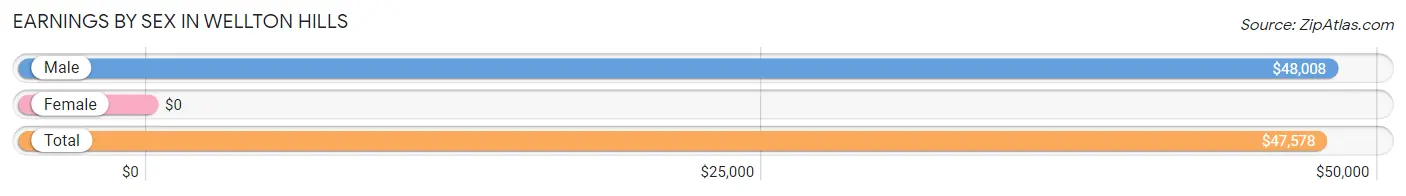
Earnings by Sex in Wellton Hills
| Sex | Number | Average Earnings |
| Male | 93 (89.4%) | $48,008 |
| Female | 11 (10.6%) | $0 |
| Total | 104 (100.0%) | $47,578 |
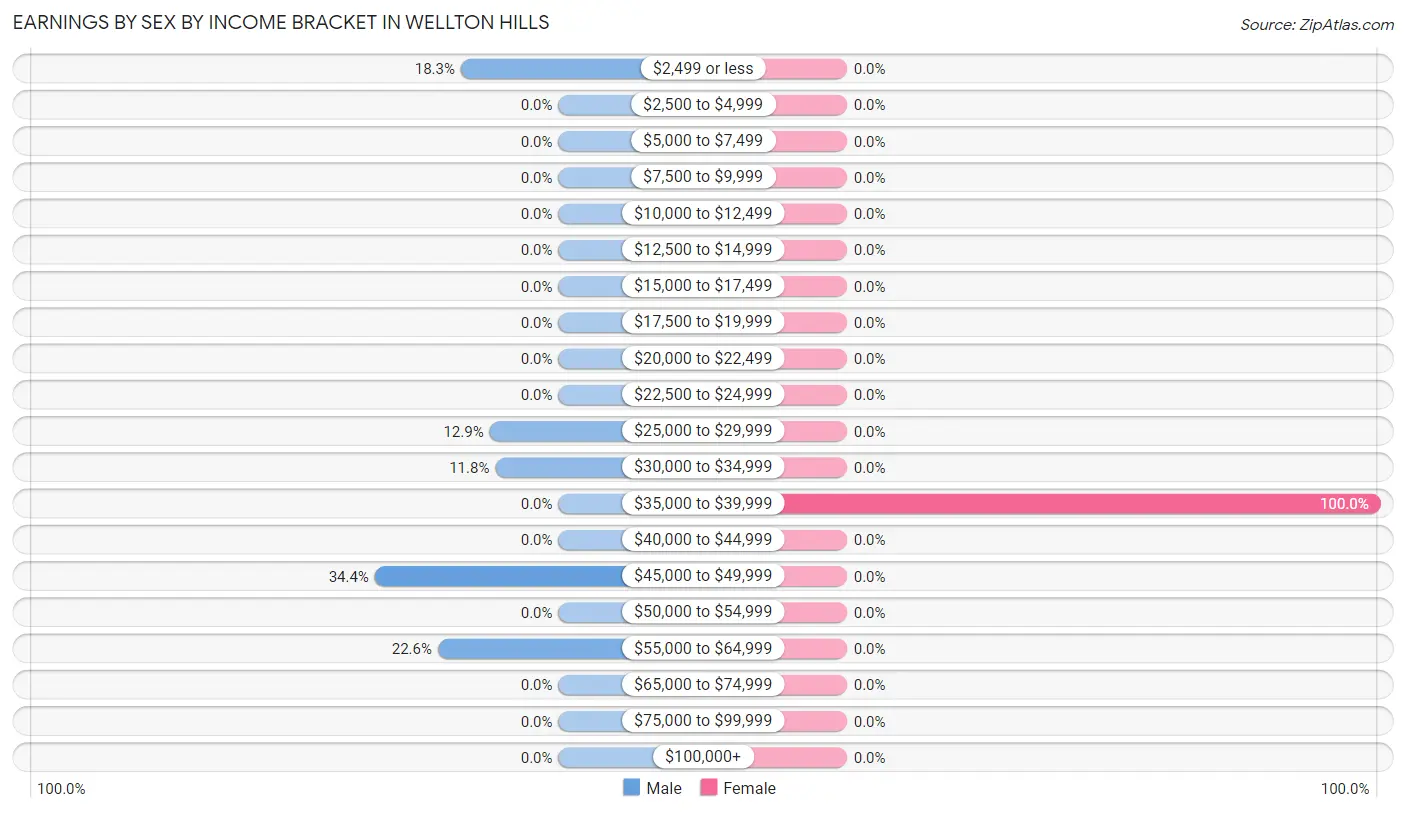
Earnings by Sex by Income Bracket in Wellton Hills
The most common earnings brackets in Wellton Hills are $45,000 to $49,999 for men (32 | 34.4%) and $35,000 to $39,999 for women (11 | 100.0%).
| Income | Male | Female |
| $2,499 or less | 17 (18.3%) | 0 (0.0%) |
| $2,500 to $4,999 | 0 (0.0%) | 0 (0.0%) |
| $5,000 to $7,499 | 0 (0.0%) | 0 (0.0%) |
| $7,500 to $9,999 | 0 (0.0%) | 0 (0.0%) |
| $10,000 to $12,499 | 0 (0.0%) | 0 (0.0%) |
| $12,500 to $14,999 | 0 (0.0%) | 0 (0.0%) |
| $15,000 to $17,499 | 0 (0.0%) | 0 (0.0%) |
| $17,500 to $19,999 | 0 (0.0%) | 0 (0.0%) |
| $20,000 to $22,499 | 0 (0.0%) | 0 (0.0%) |
| $22,500 to $24,999 | 0 (0.0%) | 0 (0.0%) |
| $25,000 to $29,999 | 12 (12.9%) | 0 (0.0%) |
| $30,000 to $34,999 | 11 (11.8%) | 0 (0.0%) |
| $35,000 to $39,999 | 0 (0.0%) | 11 (100.0%) |
| $40,000 to $44,999 | 0 (0.0%) | 0 (0.0%) |
| $45,000 to $49,999 | 32 (34.4%) | 0 (0.0%) |
| $50,000 to $54,999 | 0 (0.0%) | 0 (0.0%) |
| $55,000 to $64,999 | 21 (22.6%) | 0 (0.0%) |
| $65,000 to $74,999 | 0 (0.0%) | 0 (0.0%) |
| $75,000 to $99,999 | 0 (0.0%) | 0 (0.0%) |
| $100,000+ | 0 (0.0%) | 0 (0.0%) |
| Total | 93 (100.0%) | 11 (100.0%) |
Earnings by Sex by Educational Attainment in Wellton Hills
| Educational Attainment | Male Income | Female Income |
| Less than High School | - | - |
| High School Diploma | - | - |
| College or Associate's Degree | - | - |
| Bachelor's Degree | - | - |
| Graduate Degree | - | - |
| Total | $48,672 | $0 |
Family Income in Wellton Hills
Family Income Brackets in Wellton Hills
According to the Wellton Hills family income data, there are 32 families falling into the $100,000 to $149,999 income range, which is the most common income bracket and makes up 48.5% of all families.
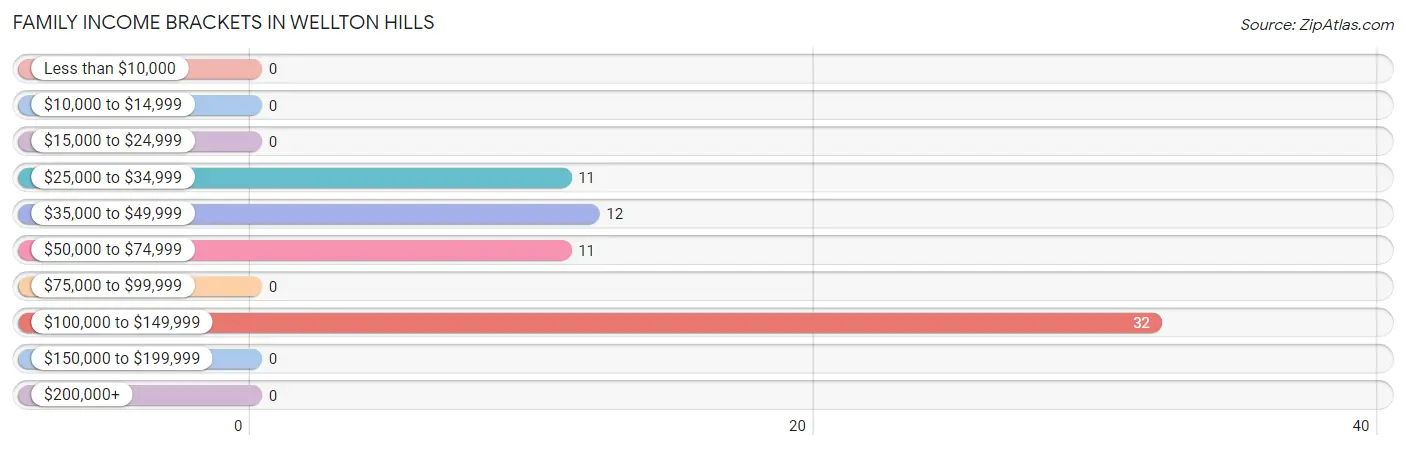
| Income Bracket | # Families | % Families |
| Less than $10,000 | 0 | 0.0% |
| $10,000 to $14,999 | 0 | 0.0% |
| $15,000 to $24,999 | 0 | 0.0% |
| $25,000 to $34,999 | 11 | 16.7% |
| $35,000 to $49,999 | 12 | 18.2% |
| $50,000 to $74,999 | 11 | 16.7% |
| $75,000 to $99,999 | 0 | 0.0% |
| $100,000 to $149,999 | 32 | 48.5% |
| $150,000 to $199,999 | 0 | 0.0% |
| $200,000+ | 0 | 0.0% |
Family Income by Famaliy Size in Wellton Hills
2-person families (54 | 81.8%) account for the highest median family income in Wellton Hills with $110,391 per family, while 2-person families (54 | 81.8%) have the highest median income of $55,196 per family member.
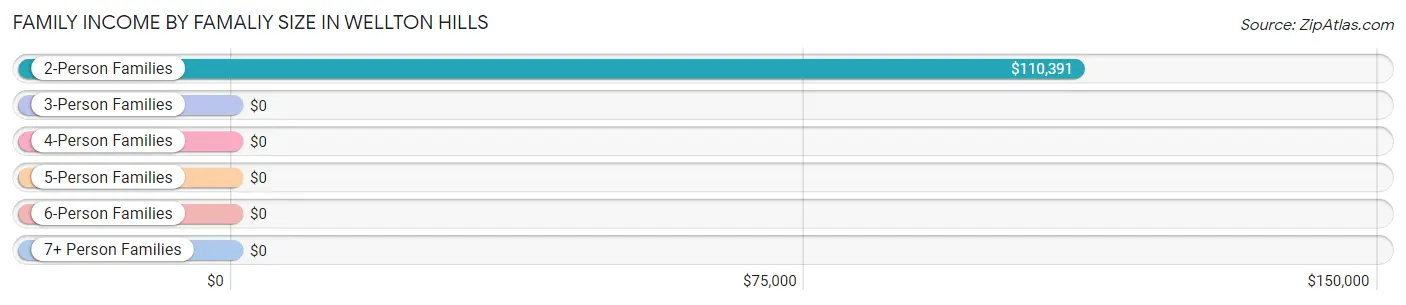
| Income Bracket | # Families | Median Income |
| 2-Person Families | 54 (81.8%) | $110,391 |
| 3-Person Families | 0 (0.0%) | $0 |
| 4-Person Families | 0 (0.0%) | $0 |
| 5-Person Families | 12 (18.2%) | $0 |
| 6-Person Families | 0 (0.0%) | $0 |
| 7+ Person Families | 0 (0.0%) | $0 |
| Total | 66 (100.0%) | $0 |
Family Income by Number of Earners in Wellton Hills
| Number of Earners | # Families | Median Income |
| No Earners | 11 (16.7%) | $0 |
| 1 Earner | 11 (16.7%) | $0 |
| 2 Earners | 44 (66.7%) | $0 |
| 3+ Earners | 0 (0.0%) | $0 |
| Total | 66 (100.0%) | $0 |
Household Income in Wellton Hills
Household Income Brackets in Wellton Hills
With 32 households falling in the category, the $100,000 to $149,999 income range is the most frequent in Wellton Hills, accounting for 48.5% of all households.
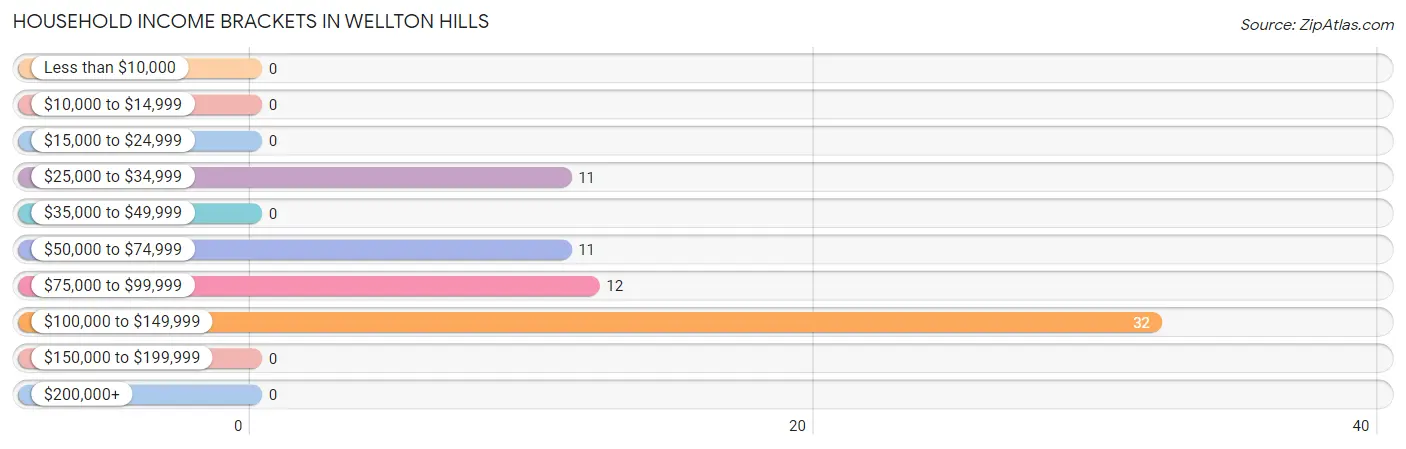
| Income Bracket | # Households | % Households |
| Less than $10,000 | 0 | 0.0% |
| $10,000 to $14,999 | 0 | 0.0% |
| $15,000 to $24,999 | 0 | 0.0% |
| $25,000 to $34,999 | 11 | 16.7% |
| $35,000 to $49,999 | 0 | 0.0% |
| $50,000 to $74,999 | 11 | 16.7% |
| $75,000 to $99,999 | 12 | 18.2% |
| $100,000 to $149,999 | 32 | 48.5% |
| $150,000 to $199,999 | 0 | 0.0% |
| $200,000+ | 0 | 0.0% |
Household Income by Householder Age in Wellton Hills
The median household income in Wellton Hills is $0, with the highest median household income of $110,391 found in the 45 to 64 years age bracket for the primary householder. A total of 54 households (81.8%) fall into this category.
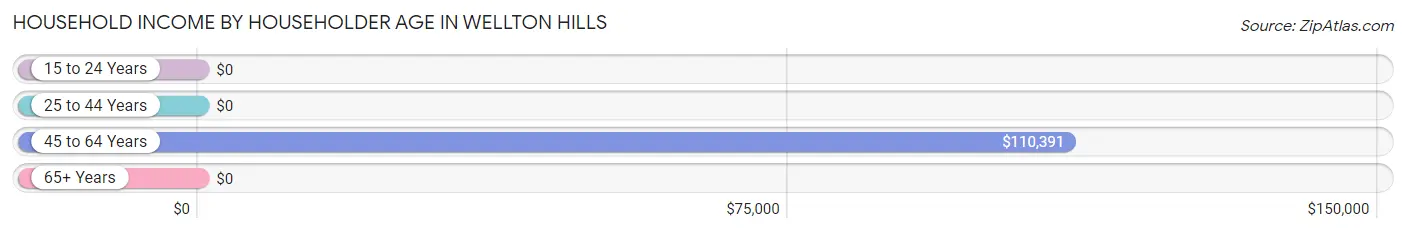
| Income Bracket | # Households | Median Income |
| 15 to 24 Years | 0 (0.0%) | $0 |
| 25 to 44 Years | 12 (18.2%) | $0 |
| 45 to 64 Years | 54 (81.8%) | $110,391 |
| 65+ Years | 0 (0.0%) | $0 |
| Total | 66 (100.0%) | $0 |
Poverty in Wellton Hills
Income Below Poverty by Sex and Age in Wellton Hills
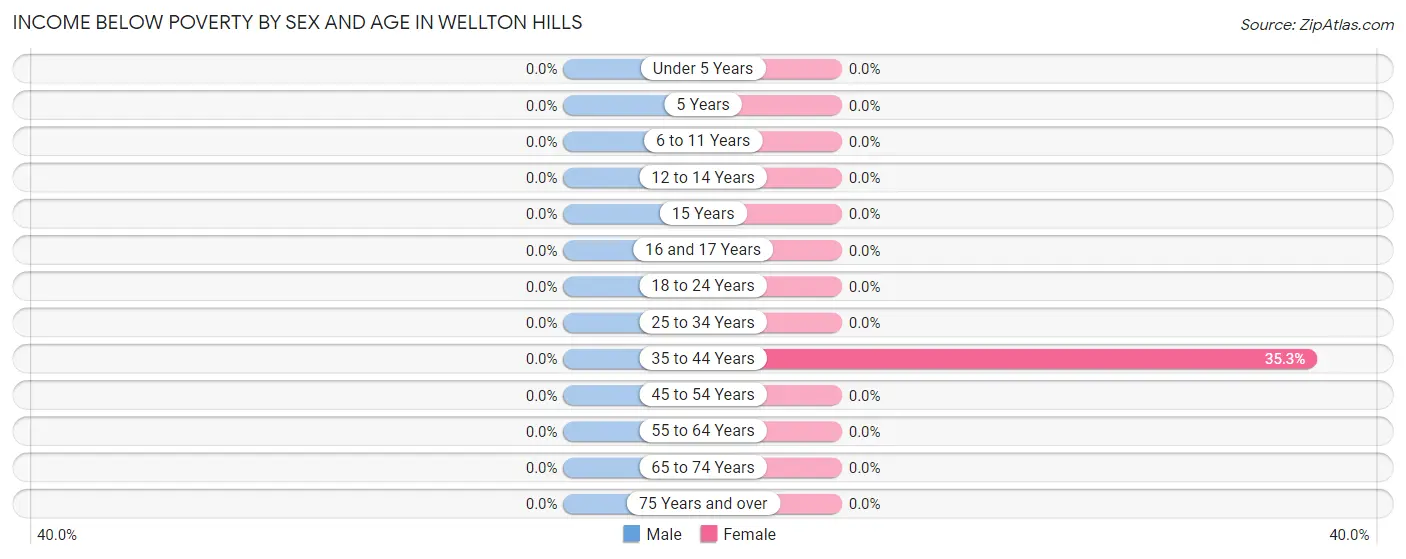
| Age Bracket | Male | Female |
| Under 5 Years | 0 (0.0%) | 0 (0.0%) |
| 5 Years | 0 (0.0%) | 0 (0.0%) |
| 6 to 11 Years | 0 (0.0%) | 0 (0.0%) |
| 12 to 14 Years | 0 (0.0%) | 0 (0.0%) |
| 15 Years | 0 (0.0%) | 0 (0.0%) |
| 16 and 17 Years | 0 (0.0%) | 0 (0.0%) |
| 18 to 24 Years | 0 (0.0%) | 0 (0.0%) |
| 25 to 34 Years | 0 (0.0%) | 0 (0.0%) |
| 35 to 44 Years | 0 (0.0%) | 6 (35.3%) |
| 45 to 54 Years | 0 (0.0%) | 0 (0.0%) |
| 55 to 64 Years | 0 (0.0%) | 0 (0.0%) |
| 65 to 74 Years | 0 (0.0%) | 0 (0.0%) |
| 75 Years and over | 0 (0.0%) | 0 (0.0%) |
| Total | 0 (0.0%) | 6 (12.5%) |
Income Above Poverty by Sex and Age in Wellton Hills
According to the poverty statistics in Wellton Hills, males aged 6 to 11 years and females aged 6 to 11 years are the age groups that are most secure financially, with 100.0% of males and 100.0% of females in these age groups living above the poverty line.
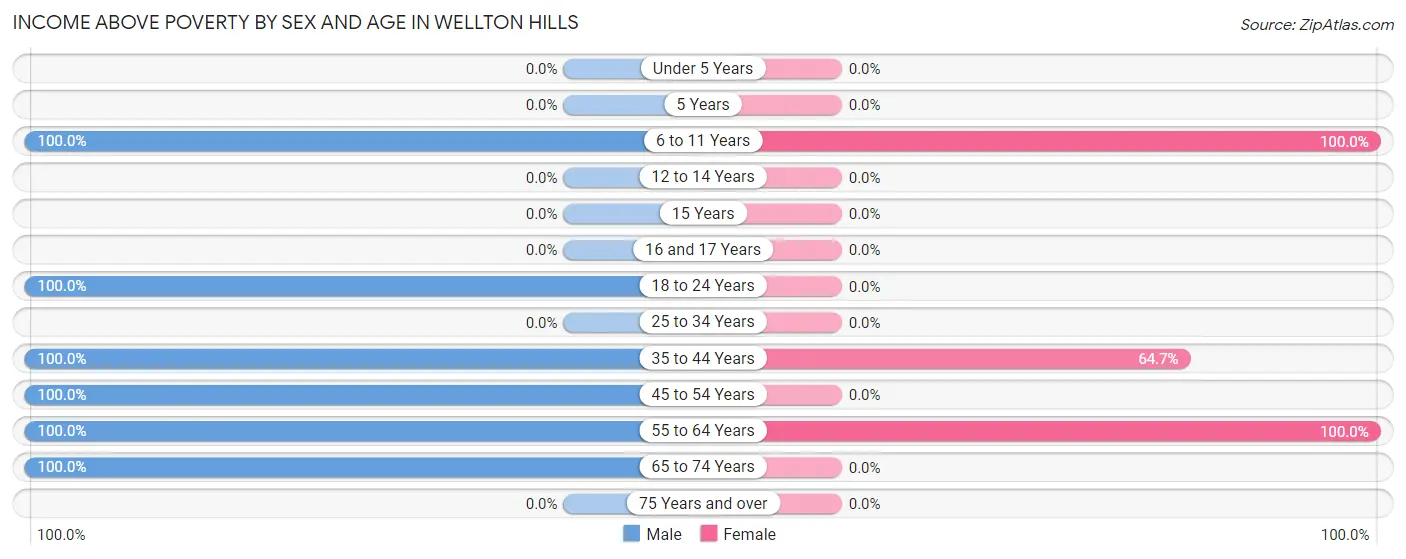
| Age Bracket | Male | Female |
| Under 5 Years | 0 (0.0%) | 0 (0.0%) |
| 5 Years | 0 (0.0%) | 0 (0.0%) |
| 6 to 11 Years | 10 (100.0%) | 12 (100.0%) |
| 12 to 14 Years | 0 (0.0%) | 0 (0.0%) |
| 15 Years | 0 (0.0%) | 0 (0.0%) |
| 16 and 17 Years | 0 (0.0%) | 0 (0.0%) |
| 18 to 24 Years | 17 (100.0%) | 0 (0.0%) |
| 25 to 34 Years | 0 (0.0%) | 0 (0.0%) |
| 35 to 44 Years | 23 (100.0%) | 11 (64.7%) |
| 45 to 54 Years | 53 (100.0%) | 0 (0.0%) |
| 55 to 64 Years | 11 (100.0%) | 19 (100.0%) |
| 65 to 74 Years | 9 (100.0%) | 0 (0.0%) |
| 75 Years and over | 0 (0.0%) | 0 (0.0%) |
| Total | 123 (100.0%) | 42 (87.5%) |
Income Below Poverty Among Married-Couple Families in Wellton Hills
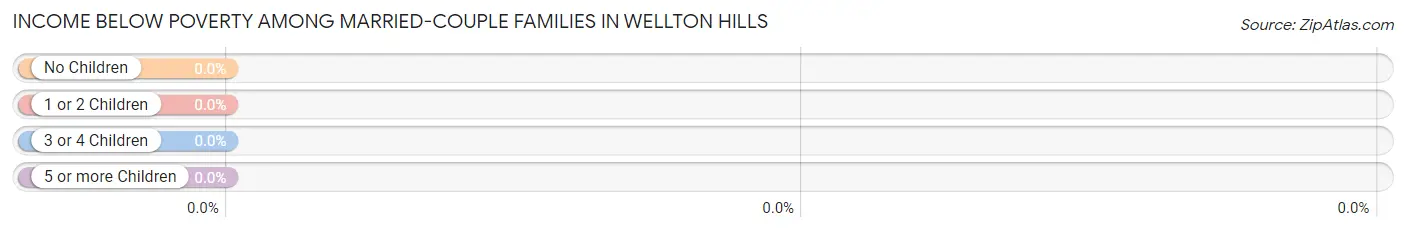
| Children | Above Poverty | Below Poverty |
| No Children | 22 (100.0%) | 0 (0.0%) |
| 1 or 2 Children | 12 (100.0%) | 0 (0.0%) |
| 3 or 4 Children | 0 (0.0%) | 0 (0.0%) |
| 5 or more Children | 0 (0.0%) | 0 (0.0%) |
| Total | 34 (100.0%) | 0 (0.0%) |
Income Below Poverty Among Single-Parent Households in Wellton Hills
| Children | Single Father | Single Mother |
| No Children | 0 (0.0%) | 0 (0.0%) |
| 1 or 2 Children | 0 (0.0%) | 0 (0.0%) |
| 3 or 4 Children | 0 (0.0%) | 0 (0.0%) |
| 5 or more Children | 0 (0.0%) | 0 (0.0%) |
| Total | 0 (0.0%) | 0 (0.0%) |
Income Below Poverty Among Married-Couple vs Single-Parent Households in Wellton Hills
| Children | Married-Couple Families | Single-Parent Households |
| No Children | 0 (0.0%) | 0 (0.0%) |
| 1 or 2 Children | 0 (0.0%) | 0 (0.0%) |
| 3 or 4 Children | 0 (0.0%) | 0 (0.0%) |
| 5 or more Children | 0 (0.0%) | 0 (0.0%) |
| Total | 0 (0.0%) | 0 (0.0%) |
Race in Wellton Hills
The most populous races in Wellton Hills are White / Caucasian (182 | 94.3%), Hispanic or Latino (11 | 5.7%), and Some other Race (11 | 5.7%).
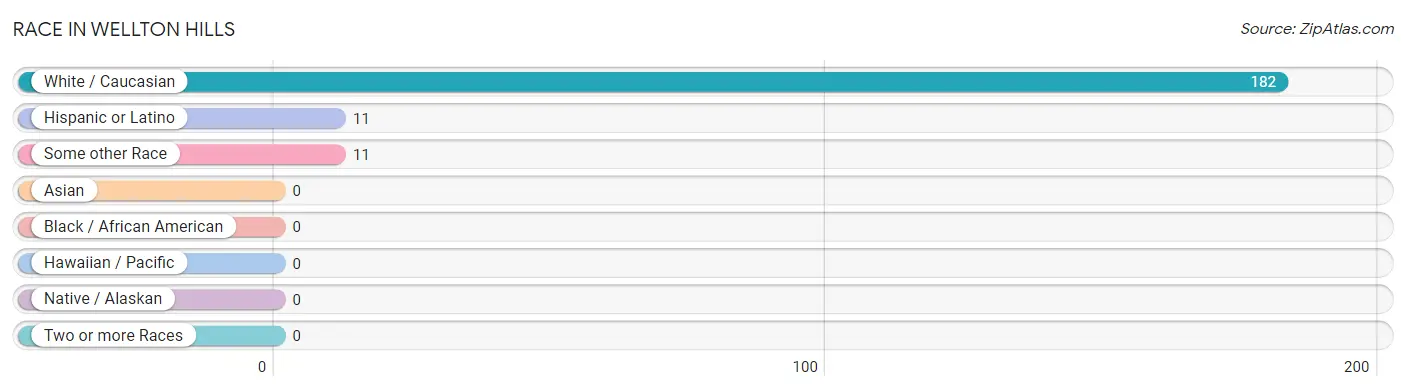
| Race | # Population | % Population |
| Asian | 0 | 0.0% |
| Black / African American | 0 | 0.0% |
| Hawaiian / Pacific | 0 | 0.0% |
| Hispanic or Latino | 11 | 5.7% |
| Native / Alaskan | 0 | 0.0% |
| White / Caucasian | 182 | 94.3% |
| Two or more Races | 0 | 0.0% |
| Some other Race | 11 | 5.7% |
| Total | 193 | 100.0% |
Ancestry in Wellton Hills
The most populous ancestries reported in Wellton Hills are English (20 | 10.4%), Irish (11 | 5.7%), and Mexican (11 | 5.7%), together accounting for 21.8% of all Wellton Hills residents.
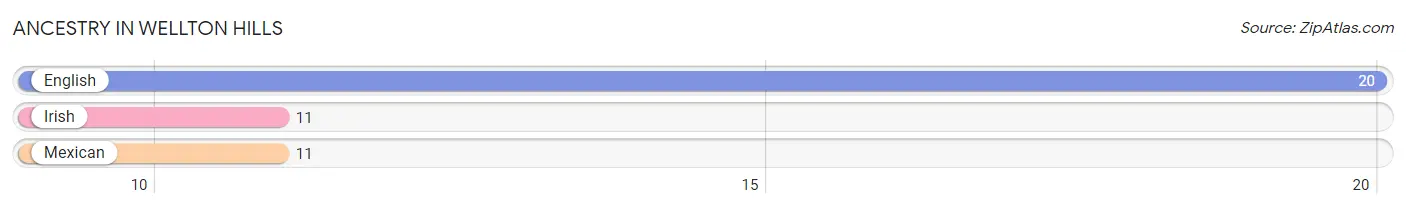
| Ancestry | # Population | % Population |
| English | 20 | 10.4% |
| Irish | 11 | 5.7% |
| Mexican | 11 | 5.7% | View All 3 Rows |
Immigrants in Wellton Hills
The most numerous immigrant groups reported in Wellton Hills came from Central America (11 | 5.7%), Latin America (11 | 5.7%), and Mexico (11 | 5.7%), together accounting for 17.1% of all Wellton Hills residents.
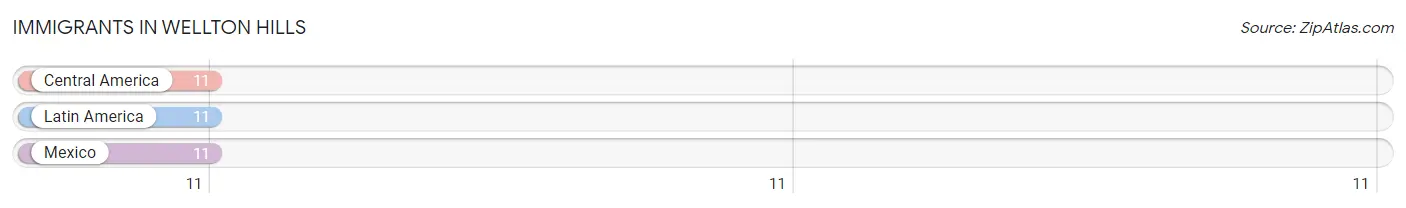
| Immigration Origin | # Population | % Population |
| Central America | 11 | 5.7% |
| Latin America | 11 | 5.7% |
| Mexico | 11 | 5.7% | View All 3 Rows |
Sex and Age in Wellton Hills
Sex and Age in Wellton Hills
The most populous age groups in Wellton Hills are 50 to 54 Years (53 | 43.1%) for men and 5 to 9 Years (23 | 32.9%) for women.
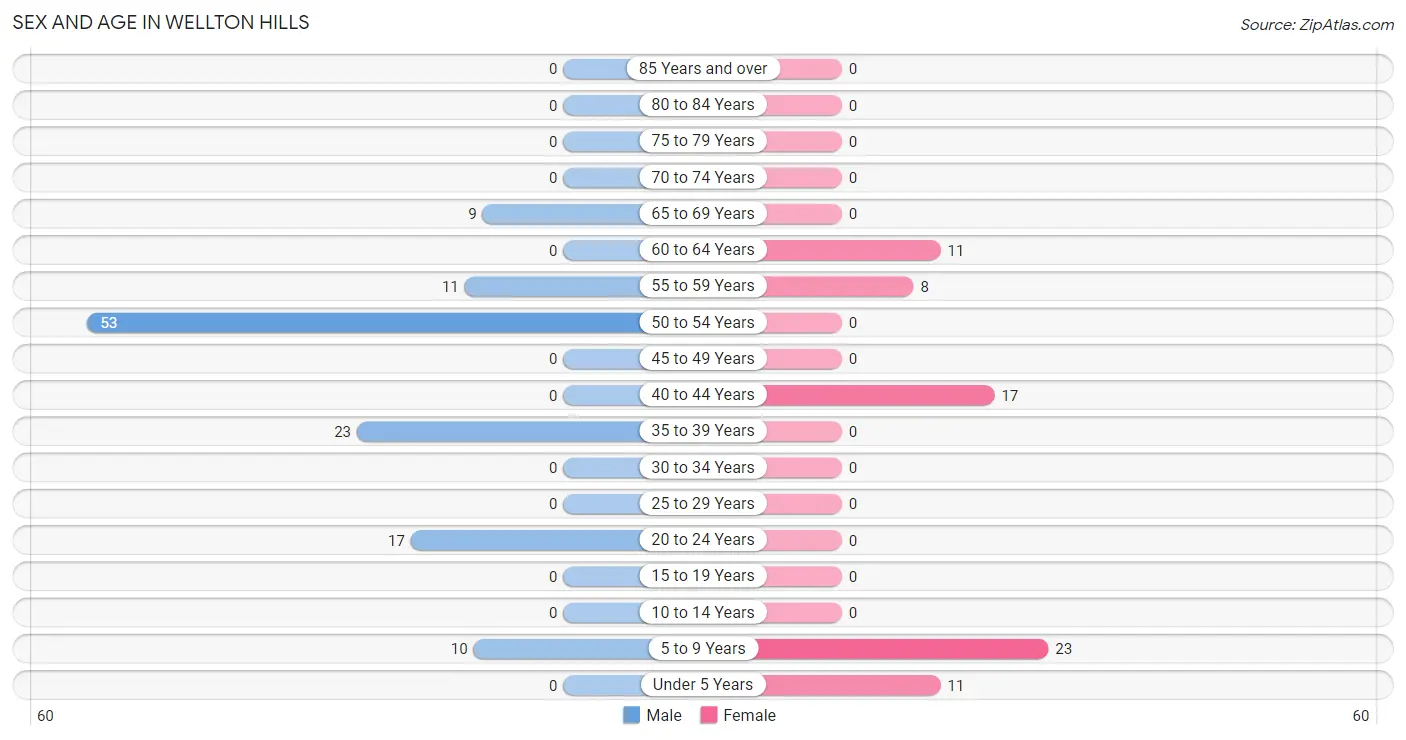
| Age Bracket | Male | Female |
| Under 5 Years | 0 (0.0%) | 11 (15.7%) |
| 5 to 9 Years | 10 (8.1%) | 23 (32.9%) |
| 10 to 14 Years | 0 (0.0%) | 0 (0.0%) |
| 15 to 19 Years | 0 (0.0%) | 0 (0.0%) |
| 20 to 24 Years | 17 (13.8%) | 0 (0.0%) |
| 25 to 29 Years | 0 (0.0%) | 0 (0.0%) |
| 30 to 34 Years | 0 (0.0%) | 0 (0.0%) |
| 35 to 39 Years | 23 (18.7%) | 0 (0.0%) |
| 40 to 44 Years | 0 (0.0%) | 17 (24.3%) |
| 45 to 49 Years | 0 (0.0%) | 0 (0.0%) |
| 50 to 54 Years | 53 (43.1%) | 0 (0.0%) |
| 55 to 59 Years | 11 (8.9%) | 8 (11.4%) |
| 60 to 64 Years | 0 (0.0%) | 11 (15.7%) |
| 65 to 69 Years | 9 (7.3%) | 0 (0.0%) |
| 70 to 74 Years | 0 (0.0%) | 0 (0.0%) |
| 75 to 79 Years | 0 (0.0%) | 0 (0.0%) |
| 80 to 84 Years | 0 (0.0%) | 0 (0.0%) |
| 85 Years and over | 0 (0.0%) | 0 (0.0%) |
| Total | 123 (100.0%) | 70 (100.0%) |
Families and Households in Wellton Hills
Median Family Size in Wellton Hills
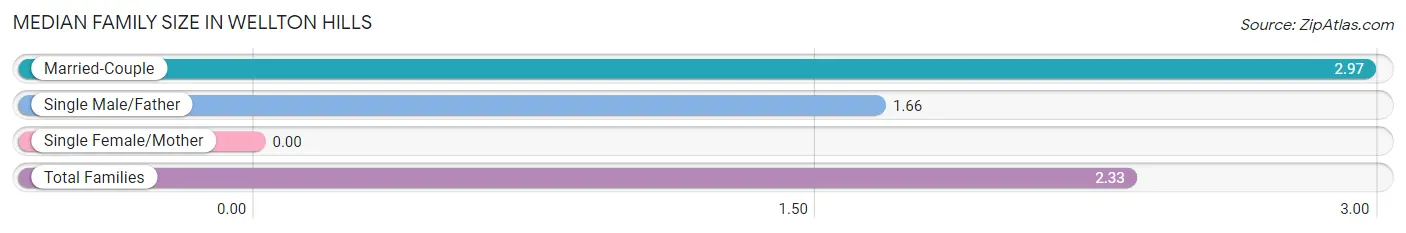
| Family Type | # Families | Family Size |
| Married-Couple | 34 (51.5%) | 2.97 |
| Single Male/Father | 32 (48.5%) | 1.66 |
| Single Female/Mother | 0 (0.0%) | - |
| Total Families | 66 (100.0%) | 2.33 |
Median Household Size in Wellton Hills
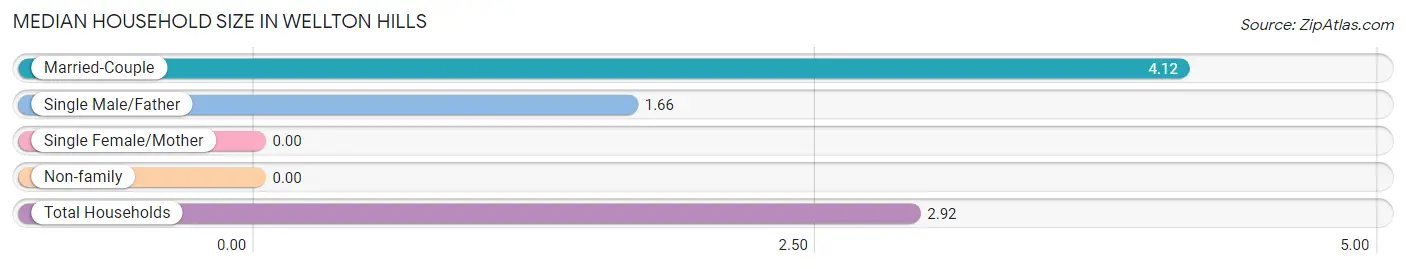
| Household Type | # Households | Household Size |
| Married-Couple | 34 (51.5%) | 4.12 |
| Single Male/Father | 32 (48.5%) | 1.66 |
| Single Female/Mother | 0 (0.0%) | - |
| Non-family | 0 (0.0%) | - |
| Total Households | 66 (100.0%) | 2.92 |
Household Size by Marriage Status in Wellton Hills
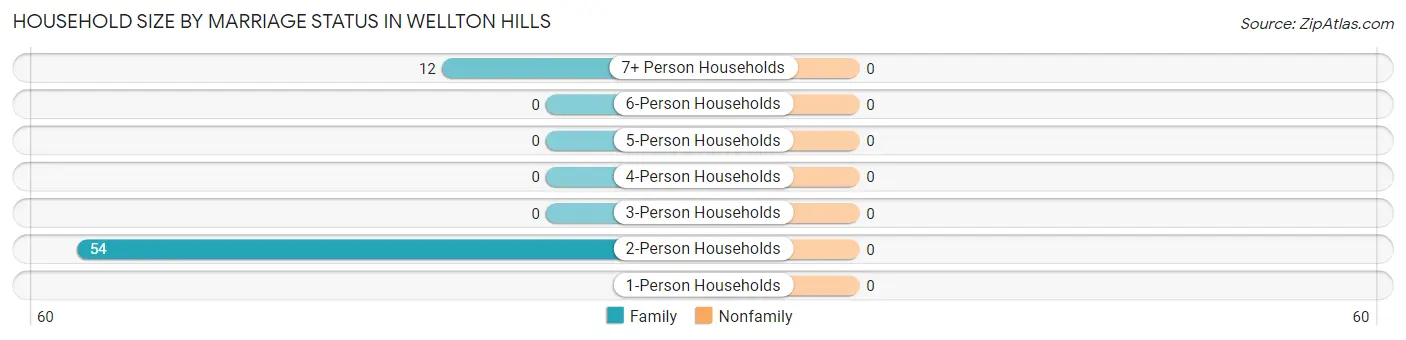
| Household Size | Family Households | Nonfamily Households |
| 1-Person Households | - | 0 (0.0%) |
| 2-Person Households | 54 (81.8%) | 0 (0.0%) |
| 3-Person Households | 0 (0.0%) | 0 (0.0%) |
| 4-Person Households | 0 (0.0%) | 0 (0.0%) |
| 5-Person Households | 0 (0.0%) | 0 (0.0%) |
| 6-Person Households | 0 (0.0%) | 0 (0.0%) |
| 7+ Person Households | 12 (18.2%) | 0 (0.0%) |
| Total | 66 (100.0%) | 0 (0.0%) |
Female Fertility in Wellton Hills
Fertility by Age in Wellton Hills
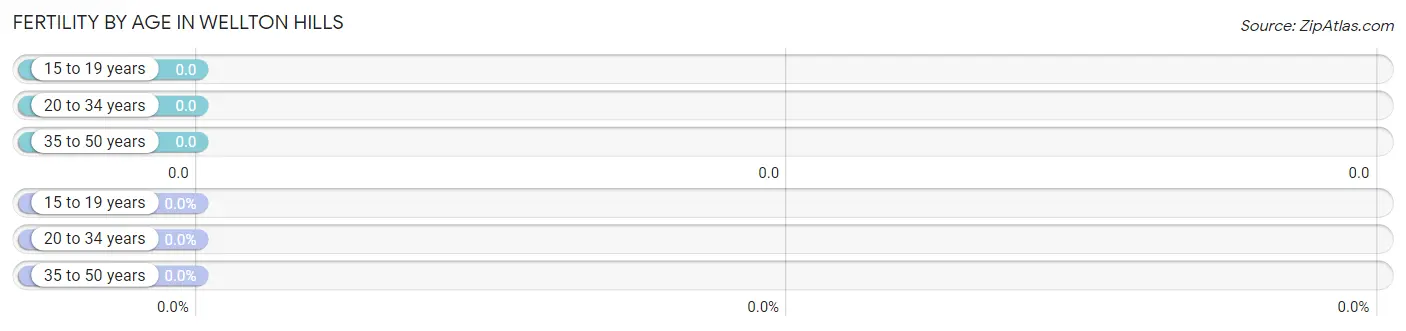
| Age Bracket | Women with Births | Births / 1,000 Women |
| 15 to 19 years | 0 (0.0%) | 0.0 |
| 20 to 34 years | 0 (0.0%) | 0.0 |
| 35 to 50 years | 0 (0.0%) | 0.0 |
| Total | 0 (0.0%) | 0.0 |
Fertility by Age by Marriage Status in Wellton Hills
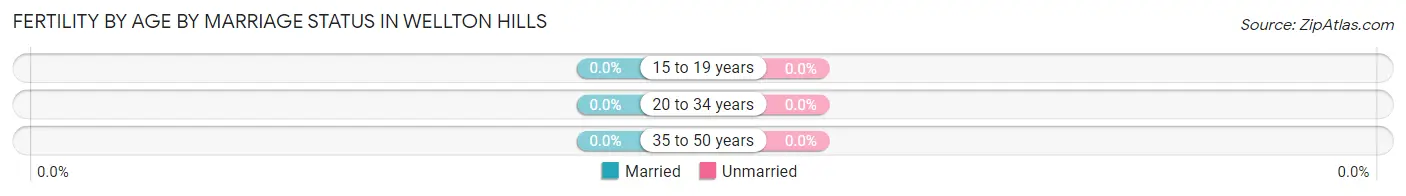
| Age Bracket | Married | Unmarried |
| 15 to 19 years | 0 (0.0%) | 0 (0.0%) |
| 20 to 34 years | 0 (0.0%) | 0 (0.0%) |
| 35 to 50 years | 0 (0.0%) | 0 (0.0%) |
| Total | 0 (0.0%) | 0 (0.0%) |
Fertility by Education in Wellton Hills
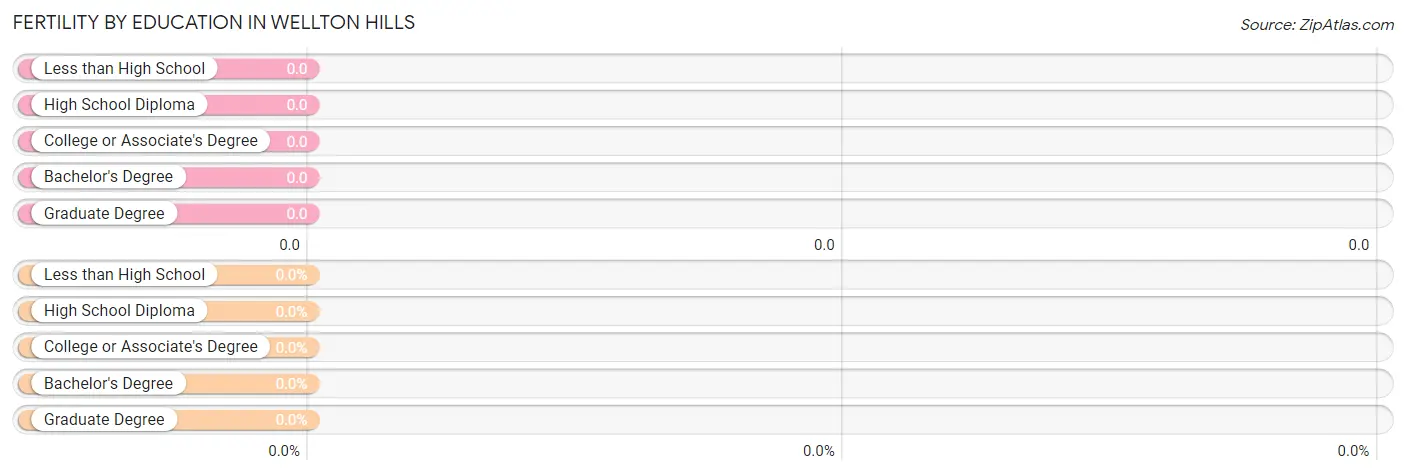
| Educational Attainment | Women with Births | Births / 1,000 Women |
| Less than High School | 0 (0.0%) | 0.0 |
| High School Diploma | 0 (0.0%) | 0.0 |
| College or Associate's Degree | 0 (0.0%) | 0.0 |
| Bachelor's Degree | 0 (0.0%) | 0.0 |
| Graduate Degree | 0 (0.0%) | 0.0 |
| Total | 0 (0.0%) | 0.0 |
Fertility by Education by Marriage Status in Wellton Hills
| Educational Attainment | Married | Unmarried |
| Less than High School | 0 (0.0%) | 0 (0.0%) |
| High School Diploma | 0 (0.0%) | 0 (0.0%) |
| College or Associate's Degree | 0 (0.0%) | 0 (0.0%) |
| Bachelor's Degree | 0 (0.0%) | 0 (0.0%) |
| Graduate Degree | 0 (0.0%) | 0 (0.0%) |
| Total | 0 (0.0%) | 0 (0.0%) |
Employment Characteristics in Wellton Hills
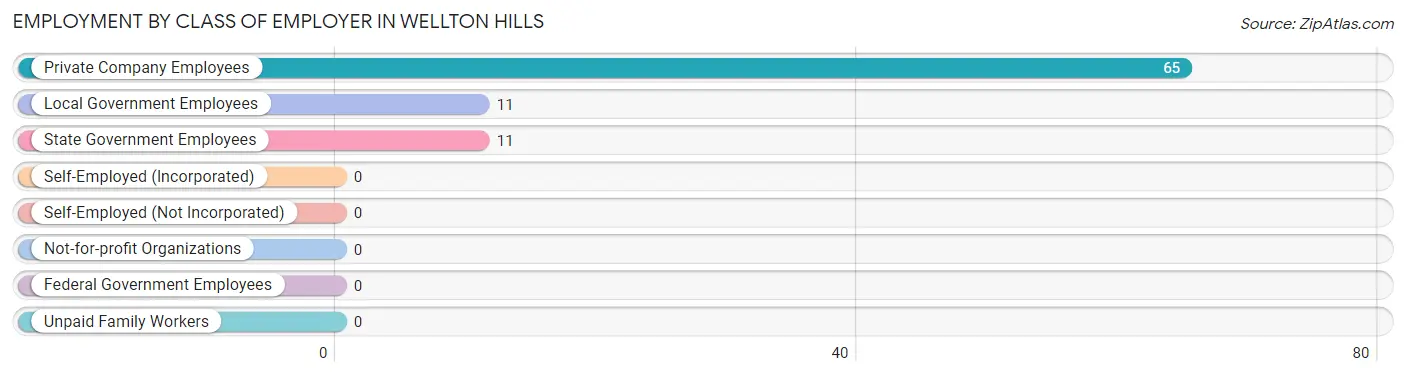
Employment by Class of Employer in Wellton Hills
Among the 87 employed individuals in Wellton Hills, private company employees (65 | 74.7%), local government employees (11 | 12.6%), and state government employees (11 | 12.6%) make up the most common classes of employment.
| Employer Class | # Employees | % Employees |
| Private Company Employees | 65 | 74.7% |
| Self-Employed (Incorporated) | 0 | 0.0% |
| Self-Employed (Not Incorporated) | 0 | 0.0% |
| Not-for-profit Organizations | 0 | 0.0% |
| Local Government Employees | 11 | 12.6% |
| State Government Employees | 11 | 12.6% |
| Federal Government Employees | 0 | 0.0% |
| Unpaid Family Workers | 0 | 0.0% |
| Total | 87 | 100.0% |
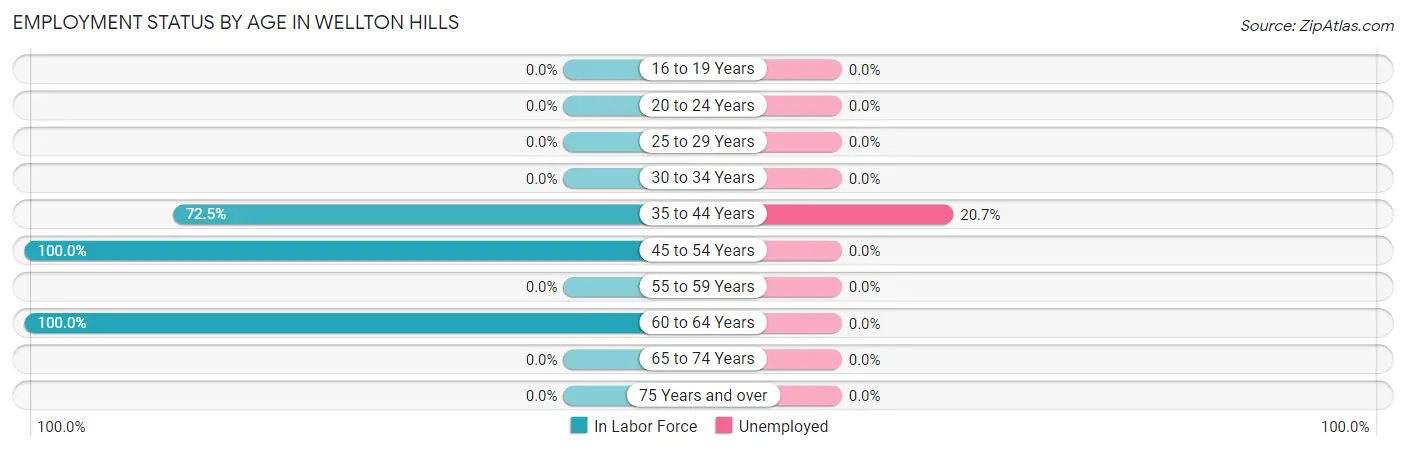
Employment Status by Age in Wellton Hills
According to the labor force statistics for Wellton Hills, out of the total population over 16 years of age (149), 62.4% or 93 individuals are in the labor force, with 6.5% or 6 of them unemployed. The age group with the highest labor force participation rate is 45 to 54 years, with 100.0% or 53 individuals in the labor force. Within the labor force, the 35 to 44 years age range has the highest percentage of unemployed individuals, with 20.7% or 6 of them being unemployed.
| Age Bracket | In Labor Force | Unemployed |
| 16 to 19 Years | 0 (0.0%) | 0 (0.0%) |
| 20 to 24 Years | 0 (0.0%) | 0 (0.0%) |
| 25 to 29 Years | 0 (0.0%) | 0 (0.0%) |
| 30 to 34 Years | 0 (0.0%) | 0 (0.0%) |
| 35 to 44 Years | 29 (72.5%) | 6 (20.7%) |
| 45 to 54 Years | 53 (100.0%) | 0 (0.0%) |
| 55 to 59 Years | 0 (0.0%) | 0 (0.0%) |
| 60 to 64 Years | 11 (100.0%) | 0 (0.0%) |
| 65 to 74 Years | 0 (0.0%) | 0 (0.0%) |
| 75 Years and over | 0 (0.0%) | 0 (0.0%) |
| Total | 93 (62.4%) | 6 (6.5%) |
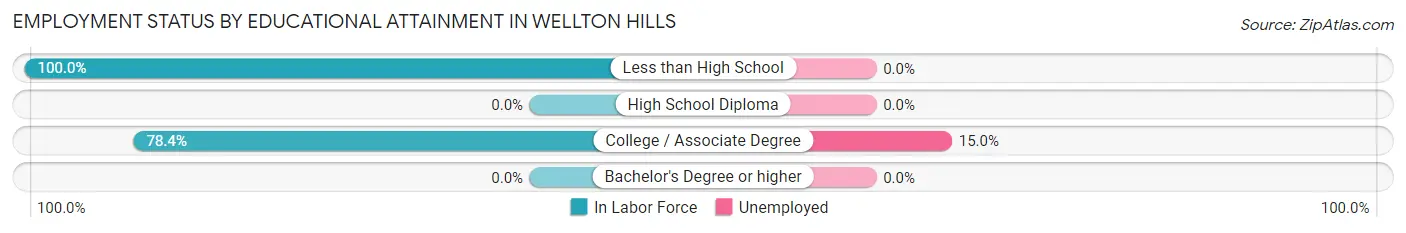
Employment Status by Educational Attainment in Wellton Hills
According to labor force statistics for Wellton Hills, 75.6% of individuals (93) out of the total population between 25 and 64 years of age (123) are in the labor force, with 6.5% or 6 of them being unemployed. The group with the highest labor force participation rate are those with the educational attainment of less than high school, with 100.0% or 53 individuals in the labor force. Within the labor force, individuals with college / associate degree education have the highest percentage of unemployment, with 15.0% or 6 of them being unemployed.
| Educational Attainment | In Labor Force | Unemployed |
| Less than High School | 53 (100.0%) | 0 (0.0%) |
| High School Diploma | 0 (0.0%) | 0 (0.0%) |
| College / Associate Degree | 40 (78.4%) | 8 (15.0%) |
| Bachelor's Degree or higher | 0 (0.0%) | 0 (0.0%) |
| Total | 93 (75.6%) | 8 (6.5%) |
Employment Occupations by Sex in Wellton Hills
Management, Business, Science and Arts Occupations
Management, Business, Science and Arts Occupations by Sex
| Occupation | Male | Female |
| Management | 0 (0.0%) | 0 (0.0%) |
| Business & Financial | 0 (0.0%) | 0 (0.0%) |
| Computers, Engineering & Science | 0 (0.0%) | 0 (0.0%) |
| Computers & Mathematics | 0 (0.0%) | 0 (0.0%) |
| Architecture & Engineering | 0 (0.0%) | 0 (0.0%) |
| Life, Physical & Social Science | 0 (0.0%) | 0 (0.0%) |
| Community & Social Service | 0 (0.0%) | 0 (0.0%) |
| Education, Arts & Media | 0 (0.0%) | 0 (0.0%) |
| Legal Services & Support | 0 (0.0%) | 0 (0.0%) |
| Education Instruction & Library | 0 (0.0%) | 0 (0.0%) |
| Arts, Media & Entertainment | 0 (0.0%) | 0 (0.0%) |
| Health Diagnosing & Treating | 0 (0.0%) | 0 (0.0%) |
| Health Technologists | 0 (0.0%) | 0 (0.0%) |
| Total (Category) | 0 (0.0%) | 0 (0.0%) |
| Total (Overall) | 76 (87.4%) | 11 (12.6%) |
Services Occupations
Services Occupations by Sex
| Occupation | Male | Female |
| Healthcare Support | 0 (0.0%) | 0 (0.0%) |
| Security & Protection | 0 (0.0%) | 0 (0.0%) |
| Firefighting & Prevention | 0 (0.0%) | 0 (0.0%) |
| Law Enforcement | 0 (0.0%) | 0 (0.0%) |
| Food Preparation & Serving | 0 (0.0%) | 0 (0.0%) |
| Cleaning & Maintenance | 0 (0.0%) | 0 (0.0%) |
| Personal Care & Service | 0 (0.0%) | 0 (0.0%) |
| Total (Category) | 0 (0.0%) | 0 (0.0%) |
| Total (Overall) | 76 (87.4%) | 11 (12.6%) |
Sales and Office Occupations
The most common Sales and Office occupations in Wellton Hills are , and Sales & Related (12 | 13.8%).
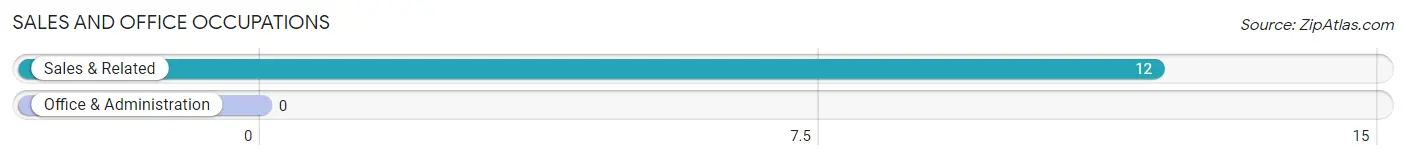
Sales and Office Occupations by Sex
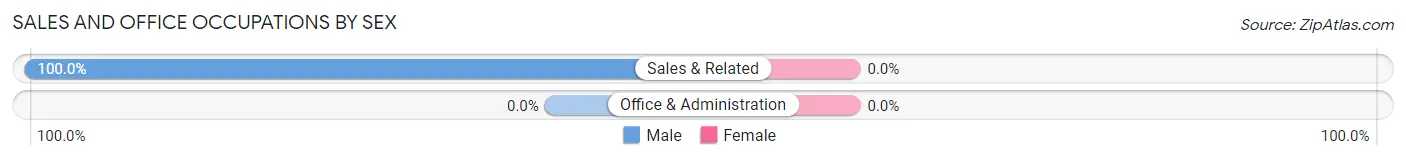
| Occupation | Male | Female |
| Sales & Related | 12 (100.0%) | 0 (0.0%) |
| Office & Administration | 0 (0.0%) | 0 (0.0%) |
| Total (Category) | 12 (100.0%) | 0 (0.0%) |
| Total (Overall) | 76 (87.4%) | 11 (12.6%) |
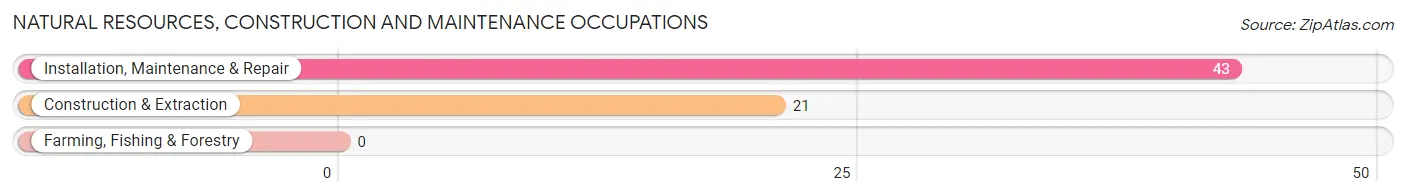
Natural Resources, Construction and Maintenance Occupations
The most common Natural Resources, Construction and Maintenance occupations in Wellton Hills are Installation, Maintenance & Repair (43 | 49.4%), and Construction & Extraction (21 | 24.1%).
Natural Resources, Construction and Maintenance Occupations by Sex
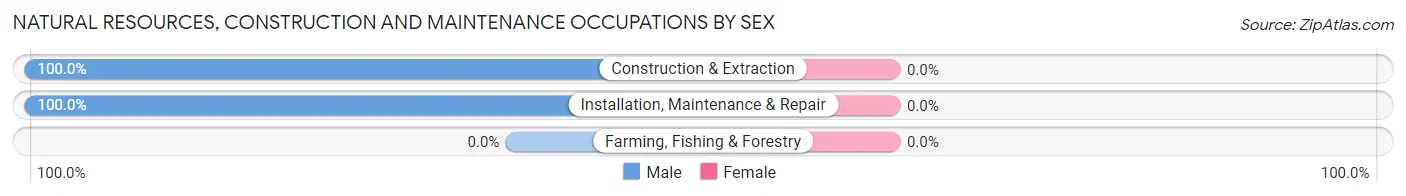
| Occupation | Male | Female |
| Farming, Fishing & Forestry | 0 (0.0%) | 0 (0.0%) |
| Construction & Extraction | 21 (100.0%) | 0 (0.0%) |
| Installation, Maintenance & Repair | 43 (100.0%) | 0 (0.0%) |
| Total (Category) | 64 (100.0%) | 0 (0.0%) |
| Total (Overall) | 76 (87.4%) | 11 (12.6%) |
Production, Transportation and Moving Occupations
The most common Production, Transportation and Moving occupations in Wellton Hills are , and Transportation (11 | 12.6%).
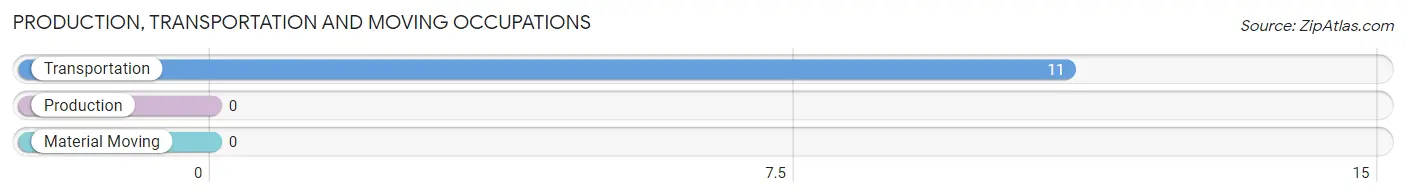
Production, Transportation and Moving Occupations by Sex
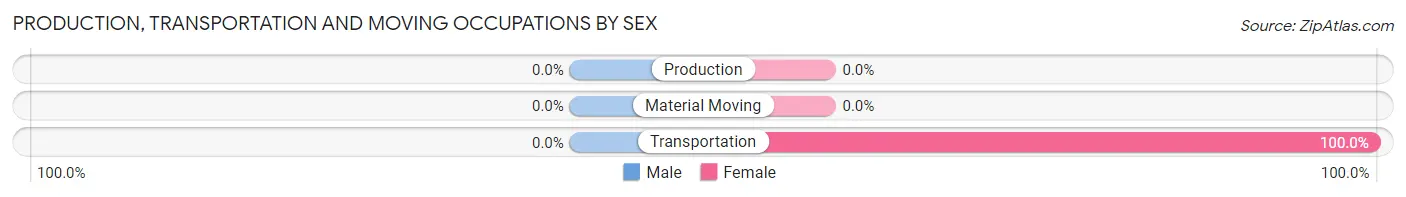
| Occupation | Male | Female |
| Production | 0 (0.0%) | 0 (0.0%) |
| Transportation | 0 (0.0%) | 11 (100.0%) |
| Material Moving | 0 (0.0%) | 0 (0.0%) |
| Total (Category) | 0 (0.0%) | 11 (100.0%) |
| Total (Overall) | 76 (87.4%) | 11 (12.6%) |
Employment Industries by Sex in Wellton Hills
Employment Industries in Wellton Hills
The major employment industries in Wellton Hills include Transportation & Warehousing (32 | 36.8%), Educational Services (22 | 25.3%), Construction (21 | 24.1%), and Retail Trade (12 | 13.8%).
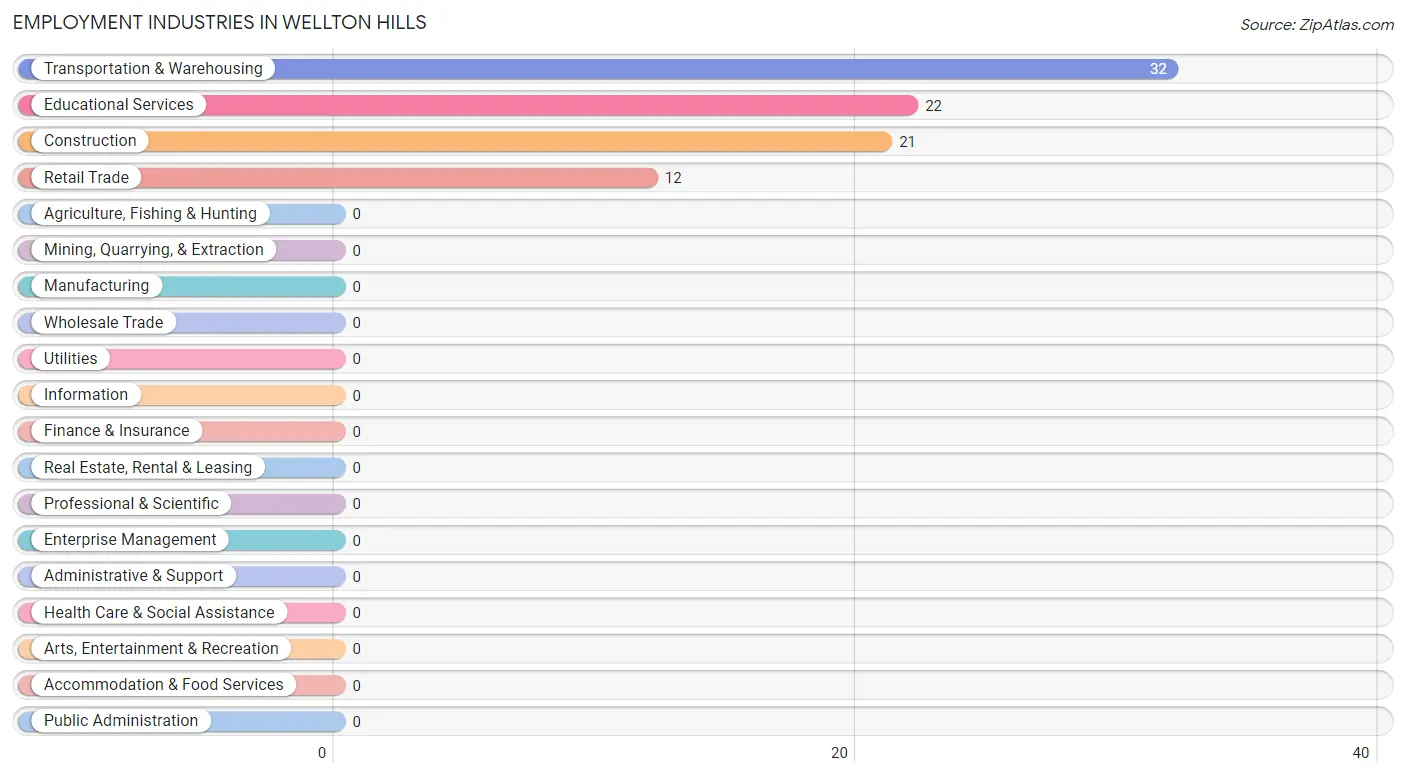
Employment Industries by Sex in Wellton Hills
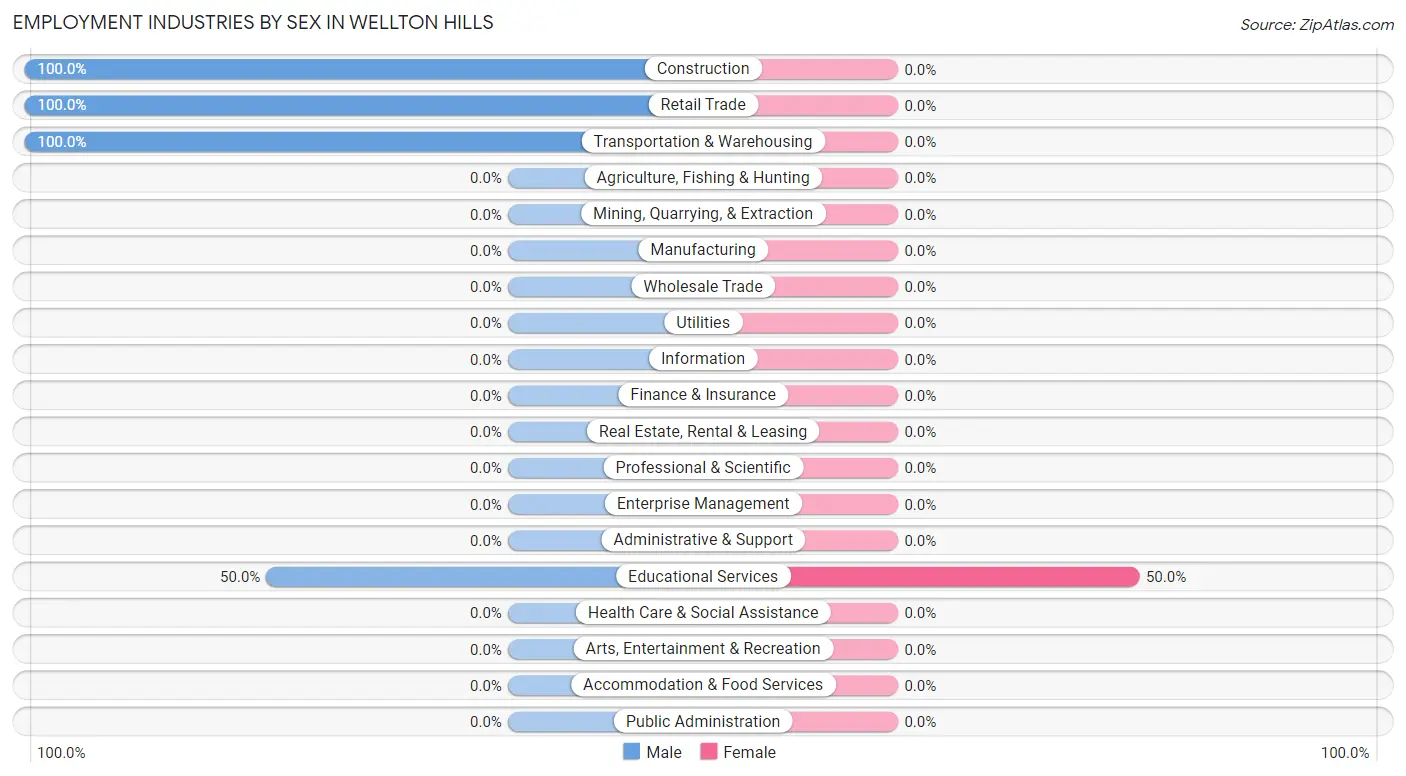
| Industry | Male | Female |
| Agriculture, Fishing & Hunting | 0 (0.0%) | 0 (0.0%) |
| Mining, Quarrying, & Extraction | 0 (0.0%) | 0 (0.0%) |
| Construction | 21 (100.0%) | 0 (0.0%) |
| Manufacturing | 0 (0.0%) | 0 (0.0%) |
| Wholesale Trade | 0 (0.0%) | 0 (0.0%) |
| Retail Trade | 12 (100.0%) | 0 (0.0%) |
| Transportation & Warehousing | 32 (100.0%) | 0 (0.0%) |
| Utilities | 0 (0.0%) | 0 (0.0%) |
| Information | 0 (0.0%) | 0 (0.0%) |
| Finance & Insurance | 0 (0.0%) | 0 (0.0%) |
| Real Estate, Rental & Leasing | 0 (0.0%) | 0 (0.0%) |
| Professional & Scientific | 0 (0.0%) | 0 (0.0%) |
| Enterprise Management | 0 (0.0%) | 0 (0.0%) |
| Administrative & Support | 0 (0.0%) | 0 (0.0%) |
| Educational Services | 11 (50.0%) | 11 (50.0%) |
| Health Care & Social Assistance | 0 (0.0%) | 0 (0.0%) |
| Arts, Entertainment & Recreation | 0 (0.0%) | 0 (0.0%) |
| Accommodation & Food Services | 0 (0.0%) | 0 (0.0%) |
| Public Administration | 0 (0.0%) | 0 (0.0%) |
| Total | 76 (87.4%) | 11 (12.6%) |
Education in Wellton Hills
School Enrollment in Wellton Hills
The most common levels of schooling among the 33 students in Wellton Hills are elementary school (22 | 66.7%), and nursery / preschool (11 | 33.3%).
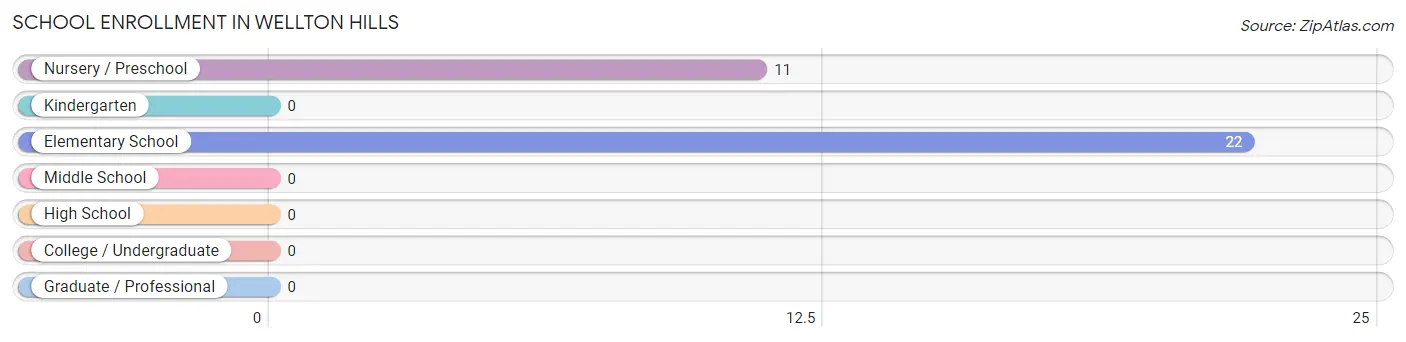
| School Level | # Students | % Students |
| Nursery / Preschool | 11 | 33.3% |
| Kindergarten | 0 | 0.0% |
| Elementary School | 22 | 66.7% |
| Middle School | 0 | 0.0% |
| High School | 0 | 0.0% |
| College / Undergraduate | 0 | 0.0% |
| Graduate / Professional | 0 | 0.0% |
| Total | 33 | 100.0% |
School Enrollment by Age by Funding Source in Wellton Hills
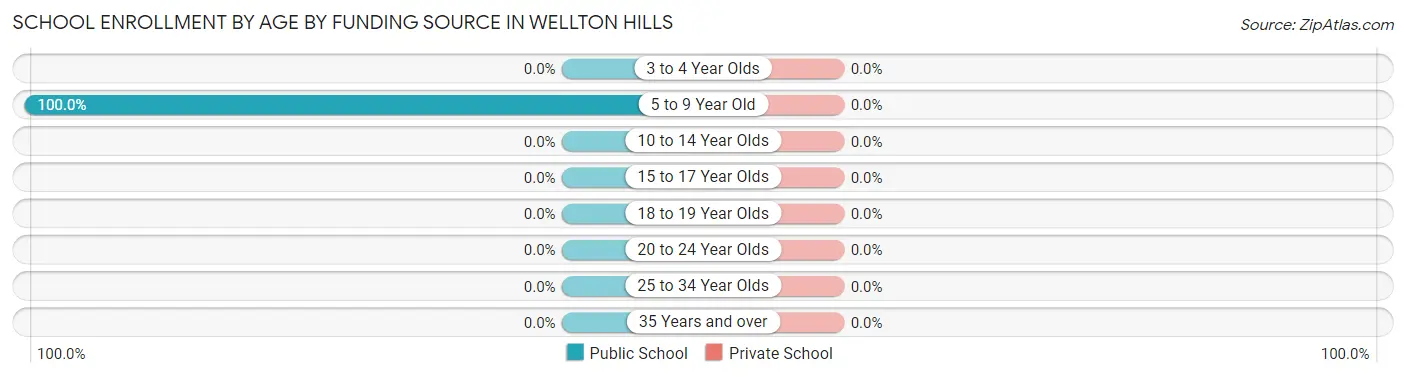
| Age Bracket | Public School | Private School |
| 3 to 4 Year Olds | 0 (0.0%) | 0 (0.0%) |
| 5 to 9 Year Old | 33 (100.0%) | 0 (0.0%) |
| 10 to 14 Year Olds | 0 (0.0%) | 0 (0.0%) |
| 15 to 17 Year Olds | 0 (0.0%) | 0 (0.0%) |
| 18 to 19 Year Olds | 0 (0.0%) | 0 (0.0%) |
| 20 to 24 Year Olds | 0 (0.0%) | 0 (0.0%) |
| 25 to 34 Year Olds | 0 (0.0%) | 0 (0.0%) |
| 35 Years and over | 0 (0.0%) | 0 (0.0%) |
| Total | 33 (100.0%) | 0 (0.0%) |
Educational Attainment by Field of Study in Wellton Hills
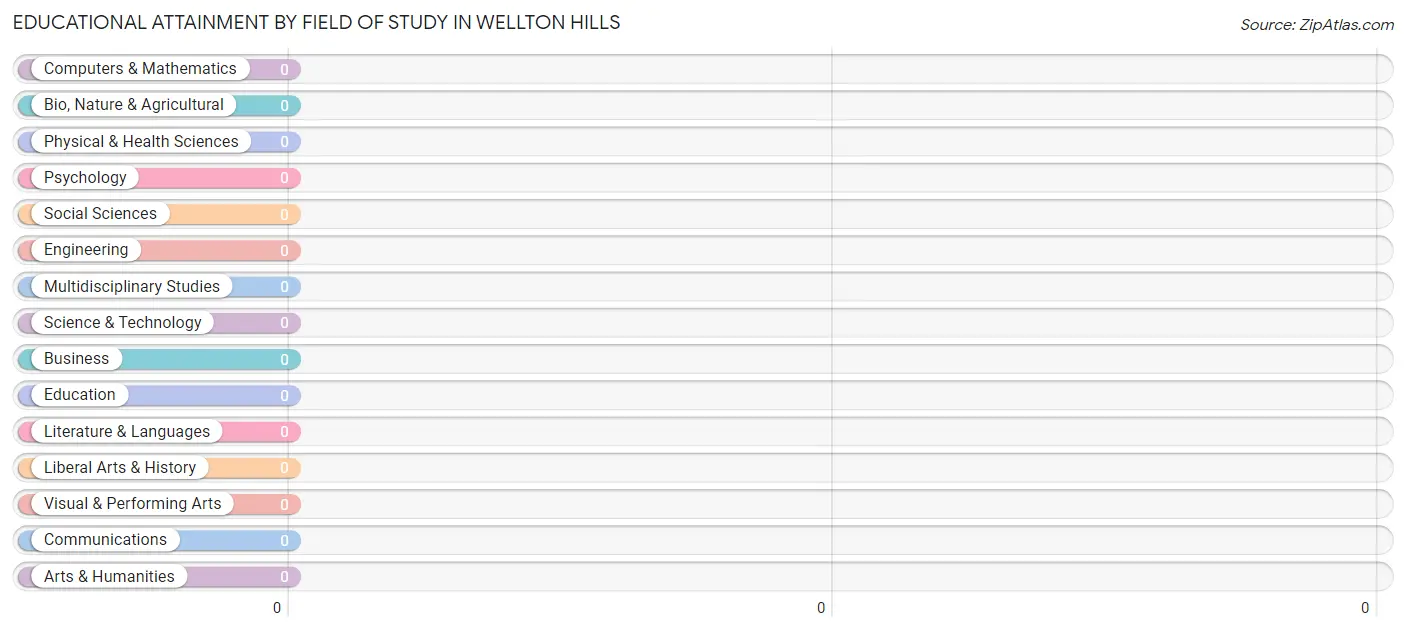
| Field of Study | # Graduates | % Graduates |
| Computers & Mathematics | 0 | 0.0% |
| Bio, Nature & Agricultural | 0 | 0.0% |
| Physical & Health Sciences | 0 | 0.0% |
| Psychology | 0 | 0.0% |
| Social Sciences | 0 | 0.0% |
| Engineering | 0 | 0.0% |
| Multidisciplinary Studies | 0 | 0.0% |
| Science & Technology | 0 | 0.0% |
| Business | 0 | 0.0% |
| Education | 0 | 0.0% |
| Literature & Languages | 0 | 0.0% |
| Liberal Arts & History | 0 | 0.0% |
| Visual & Performing Arts | 0 | 0.0% |
| Communications | 0 | 0.0% |
| Arts & Humanities | 0 | 0.0% |
| Total | 0 | 0.0% |
Transportation & Commute in Wellton Hills
Vehicle Availability by Sex in Wellton Hills
The most prevalent vehicle ownership categories in Wellton Hills are males with 2 vehicles (53, accounting for 69.7%) and females with 2 vehicles (11, making up 481.8%).
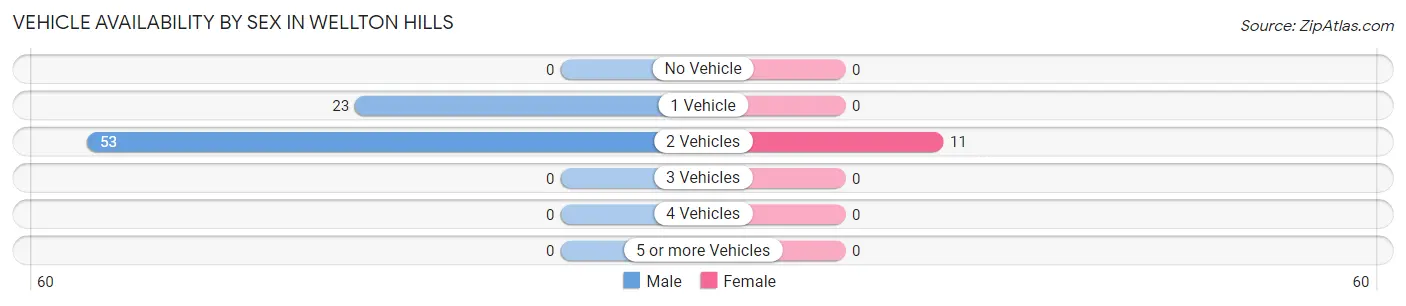
| Vehicles Available | Male | Female |
| No Vehicle | 0 (0.0%) | 0 (0.0%) |
| 1 Vehicle | 23 (30.3%) | 0 (0.0%) |
| 2 Vehicles | 53 (69.7%) | 11 (100.0%) |
| 3 Vehicles | 0 (0.0%) | 0 (0.0%) |
| 4 Vehicles | 0 (0.0%) | 0 (0.0%) |
| 5 or more Vehicles | 0 (0.0%) | 0 (0.0%) |
| Total | 76 (100.0%) | 11 (100.0%) |
Commute Time in Wellton Hills
The most frequently occuring commute durations in Wellton Hills are 15 to 19 minutes (44 commuters, 50.6%), 40 to 44 minutes (32 commuters, 36.8%), and 10 to 14 minutes (11 commuters, 12.6%).
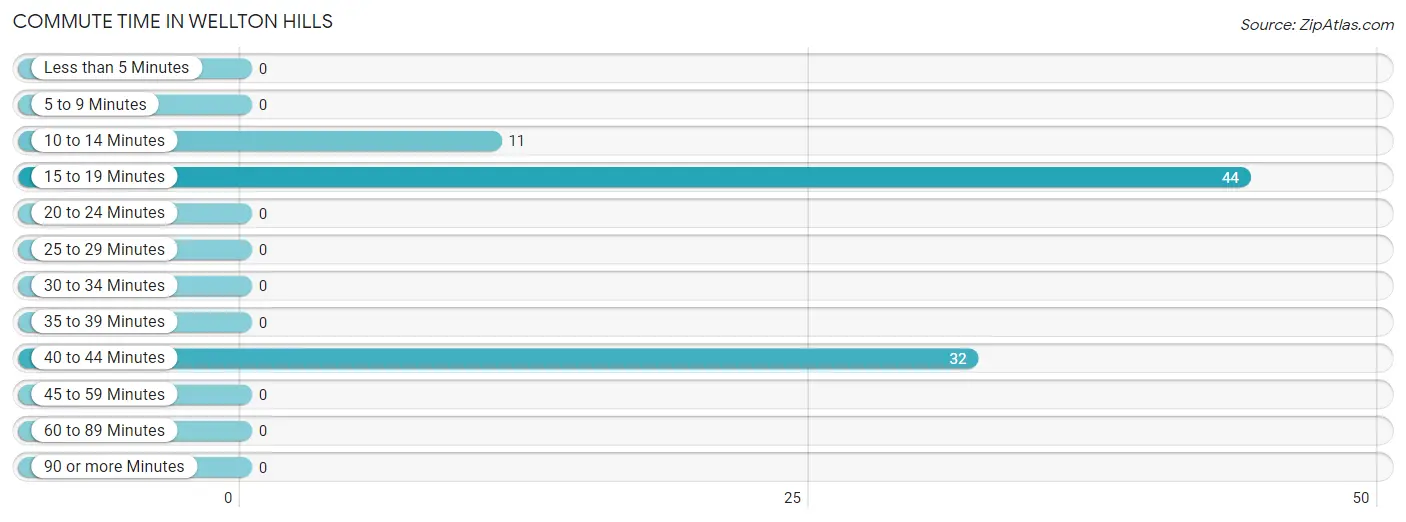
| Commute Time | # Commuters | % Commuters |
| Less than 5 Minutes | 0 | 0.0% |
| 5 to 9 Minutes | 0 | 0.0% |
| 10 to 14 Minutes | 11 | 12.6% |
| 15 to 19 Minutes | 44 | 50.6% |
| 20 to 24 Minutes | 0 | 0.0% |
| 25 to 29 Minutes | 0 | 0.0% |
| 30 to 34 Minutes | 0 | 0.0% |
| 35 to 39 Minutes | 0 | 0.0% |
| 40 to 44 Minutes | 32 | 36.8% |
| 45 to 59 Minutes | 0 | 0.0% |
| 60 to 89 Minutes | 0 | 0.0% |
| 90 or more Minutes | 0 | 0.0% |
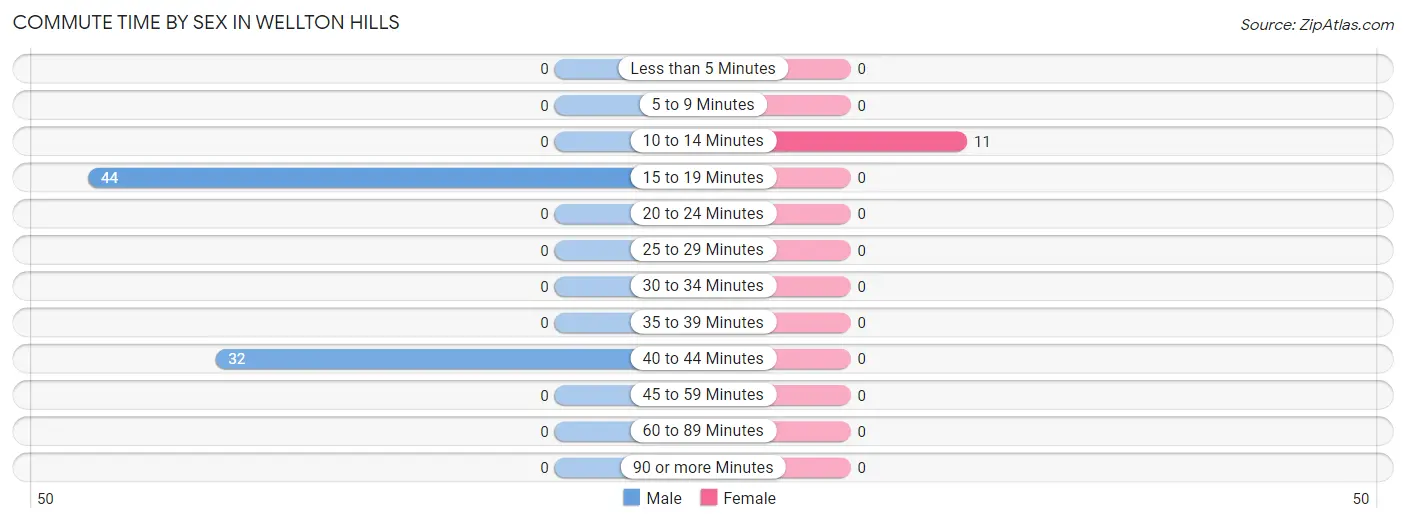
Commute Time by Sex in Wellton Hills
The most common commute times in Wellton Hills are 15 to 19 minutes (44 commuters, 57.9%) for males and 10 to 14 minutes (11 commuters, 100.0%) for females.
| Commute Time | Male | Female |
| Less than 5 Minutes | 0 (0.0%) | 0 (0.0%) |
| 5 to 9 Minutes | 0 (0.0%) | 0 (0.0%) |
| 10 to 14 Minutes | 0 (0.0%) | 11 (100.0%) |
| 15 to 19 Minutes | 44 (57.9%) | 0 (0.0%) |
| 20 to 24 Minutes | 0 (0.0%) | 0 (0.0%) |
| 25 to 29 Minutes | 0 (0.0%) | 0 (0.0%) |
| 30 to 34 Minutes | 0 (0.0%) | 0 (0.0%) |
| 35 to 39 Minutes | 0 (0.0%) | 0 (0.0%) |
| 40 to 44 Minutes | 32 (42.1%) | 0 (0.0%) |
| 45 to 59 Minutes | 0 (0.0%) | 0 (0.0%) |
| 60 to 89 Minutes | 0 (0.0%) | 0 (0.0%) |
| 90 or more Minutes | 0 (0.0%) | 0 (0.0%) |
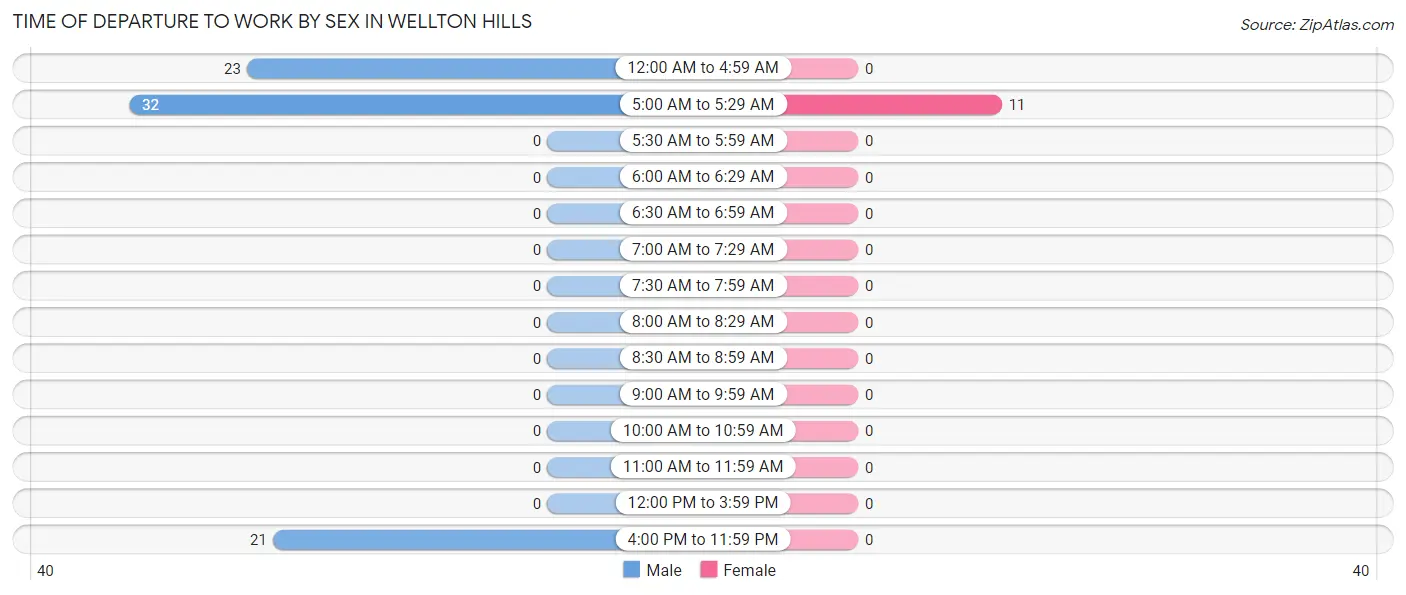
Time of Departure to Work by Sex in Wellton Hills
The most frequent times of departure to work in Wellton Hills are 5:00 AM to 5:29 AM (32, 42.1%) for males and 5:00 AM to 5:29 AM (11, 100.0%) for females.
| Time of Departure | Male | Female |
| 12:00 AM to 4:59 AM | 23 (30.3%) | 0 (0.0%) |
| 5:00 AM to 5:29 AM | 32 (42.1%) | 11 (100.0%) |
| 5:30 AM to 5:59 AM | 0 (0.0%) | 0 (0.0%) |
| 6:00 AM to 6:29 AM | 0 (0.0%) | 0 (0.0%) |
| 6:30 AM to 6:59 AM | 0 (0.0%) | 0 (0.0%) |
| 7:00 AM to 7:29 AM | 0 (0.0%) | 0 (0.0%) |
| 7:30 AM to 7:59 AM | 0 (0.0%) | 0 (0.0%) |
| 8:00 AM to 8:29 AM | 0 (0.0%) | 0 (0.0%) |
| 8:30 AM to 8:59 AM | 0 (0.0%) | 0 (0.0%) |
| 9:00 AM to 9:59 AM | 0 (0.0%) | 0 (0.0%) |
| 10:00 AM to 10:59 AM | 0 (0.0%) | 0 (0.0%) |
| 11:00 AM to 11:59 AM | 0 (0.0%) | 0 (0.0%) |
| 12:00 PM to 3:59 PM | 0 (0.0%) | 0 (0.0%) |
| 4:00 PM to 11:59 PM | 21 (27.6%) | 0 (0.0%) |
| Total | 76 (100.0%) | 11 (100.0%) |
Housing Occupancy in Wellton Hills
Occupancy by Ownership in Wellton Hills
Of the total 66 dwellings in Wellton Hills, owner-occupied units account for 55 (83.3%), while renter-occupied units make up 11 (16.7%).
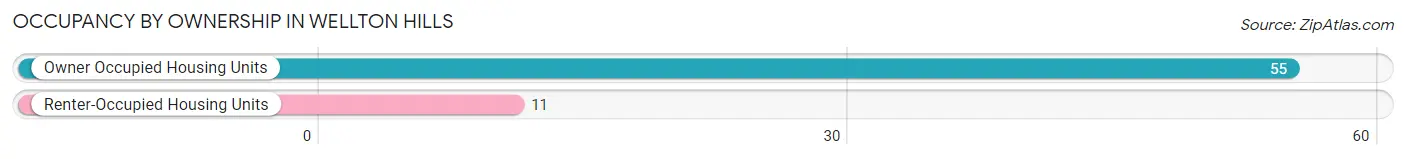
| Occupancy | # Housing Units | % Housing Units |
| Owner Occupied Housing Units | 55 | 83.3% |
| Renter-Occupied Housing Units | 11 | 16.7% |
| Total Occupied Housing Units | 66 | 100.0% |
Occupancy by Household Size in Wellton Hills
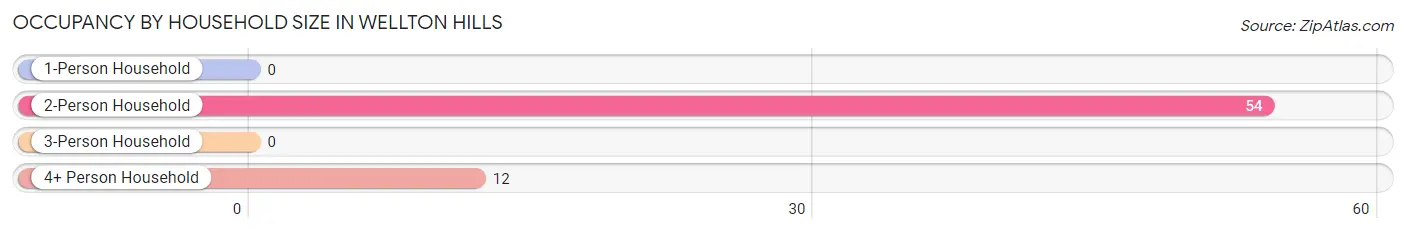
| Household Size | # Housing Units | % Housing Units |
| 1-Person Household | 0 | 0.0% |
| 2-Person Household | 54 | 81.8% |
| 3-Person Household | 0 | 0.0% |
| 4+ Person Household | 12 | 18.2% |
| Total Housing Units | 66 | 100.0% |
Occupancy by Ownership by Household Size in Wellton Hills
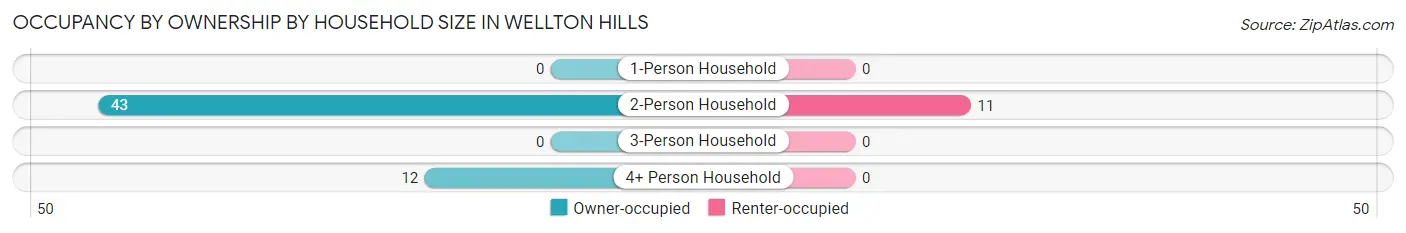
| Household Size | Owner-occupied | Renter-occupied |
| 1-Person Household | 0 (0.0%) | 0 (0.0%) |
| 2-Person Household | 43 (79.6%) | 11 (20.4%) |
| 3-Person Household | 0 (0.0%) | 0 (0.0%) |
| 4+ Person Household | 12 (100.0%) | 0 (0.0%) |
| Total Housing Units | 55 (83.3%) | 11 (16.7%) |
Occupancy by Educational Attainment in Wellton Hills
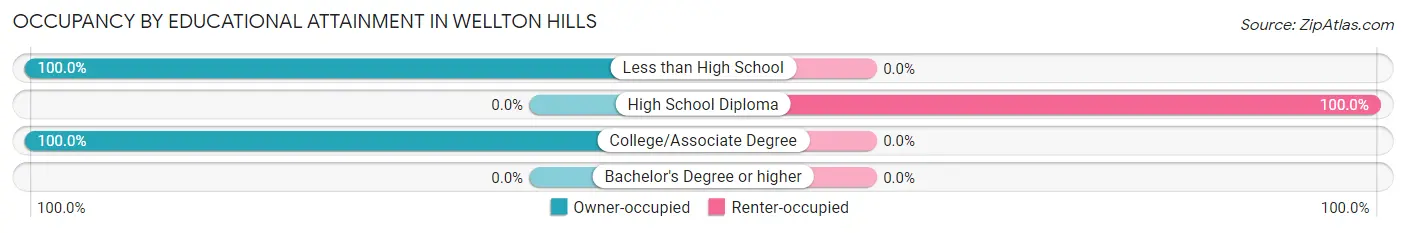
| Household Size | Owner-occupied | Renter-occupied |
| Less than High School | 32 (100.0%) | 0 (0.0%) |
| High School Diploma | 0 (0.0%) | 11 (100.0%) |
| College/Associate Degree | 23 (100.0%) | 0 (0.0%) |
| Bachelor's Degree or higher | 0 (0.0%) | 0 (0.0%) |
Occupancy by Age of Householder in Wellton Hills
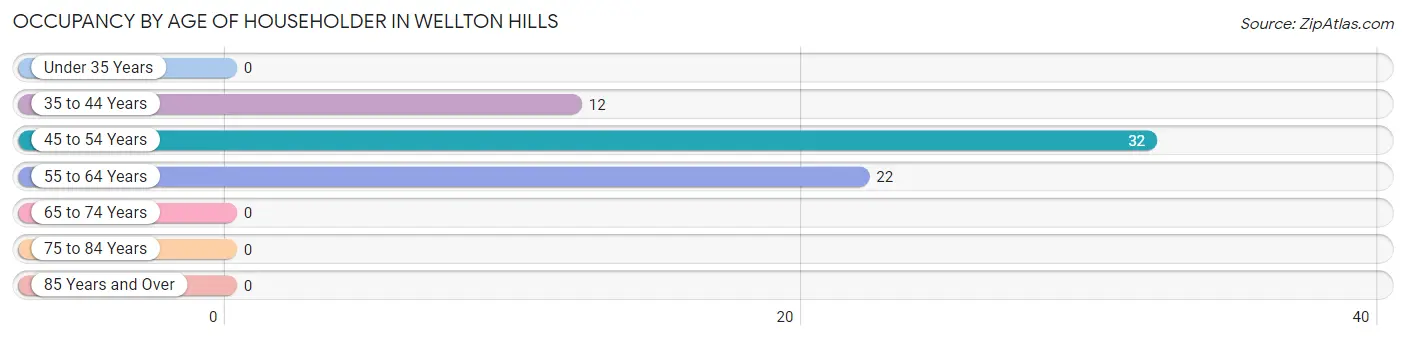
| Age Bracket | # Households | % Households |
| Under 35 Years | 0 | 0.0% |
| 35 to 44 Years | 12 | 18.2% |
| 45 to 54 Years | 32 | 48.5% |
| 55 to 64 Years | 22 | 33.3% |
| 65 to 74 Years | 0 | 0.0% |
| 75 to 84 Years | 0 | 0.0% |
| 85 Years and Over | 0 | 0.0% |
| Total | 66 | 100.0% |
Housing Finances in Wellton Hills
Median Income by Occupancy in Wellton Hills
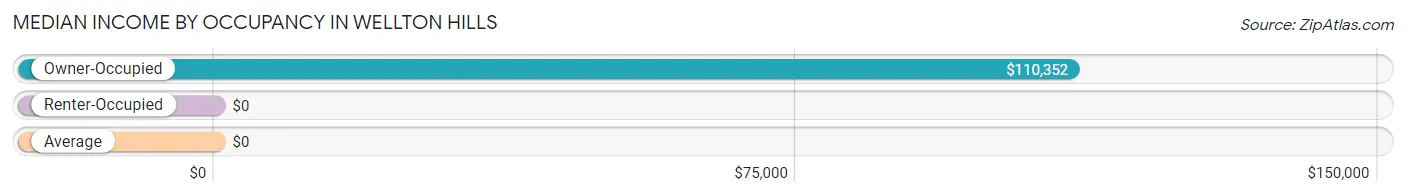
| Occupancy Type | # Households | Median Income |
| Owner-Occupied | 55 (83.3%) | $110,352 |
| Renter-Occupied | 11 (16.7%) | $0 |
| Average | 66 (100.0%) | $0 |
Occupancy by Householder Income Bracket in Wellton Hills
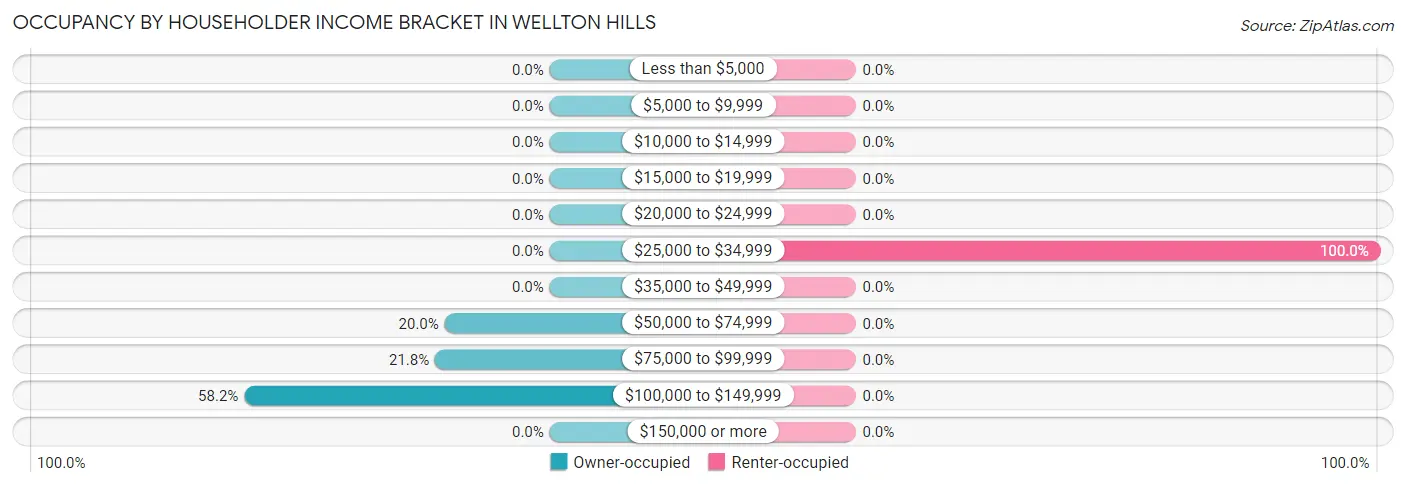
| Income Bracket | Owner-occupied | Renter-occupied |
| Less than $5,000 | 0 (0.0%) | 0 (0.0%) |
| $5,000 to $9,999 | 0 (0.0%) | 0 (0.0%) |
| $10,000 to $14,999 | 0 (0.0%) | 0 (0.0%) |
| $15,000 to $19,999 | 0 (0.0%) | 0 (0.0%) |
| $20,000 to $24,999 | 0 (0.0%) | 0 (0.0%) |
| $25,000 to $34,999 | 0 (0.0%) | 11 (100.0%) |
| $35,000 to $49,999 | 0 (0.0%) | 0 (0.0%) |
| $50,000 to $74,999 | 11 (20.0%) | 0 (0.0%) |
| $75,000 to $99,999 | 12 (21.8%) | 0 (0.0%) |
| $100,000 to $149,999 | 32 (58.2%) | 0 (0.0%) |
| $150,000 or more | 0 (0.0%) | 0 (0.0%) |
| Total | 55 (100.0%) | 11 (100.0%) |
Monthly Housing Cost Tiers in Wellton Hills
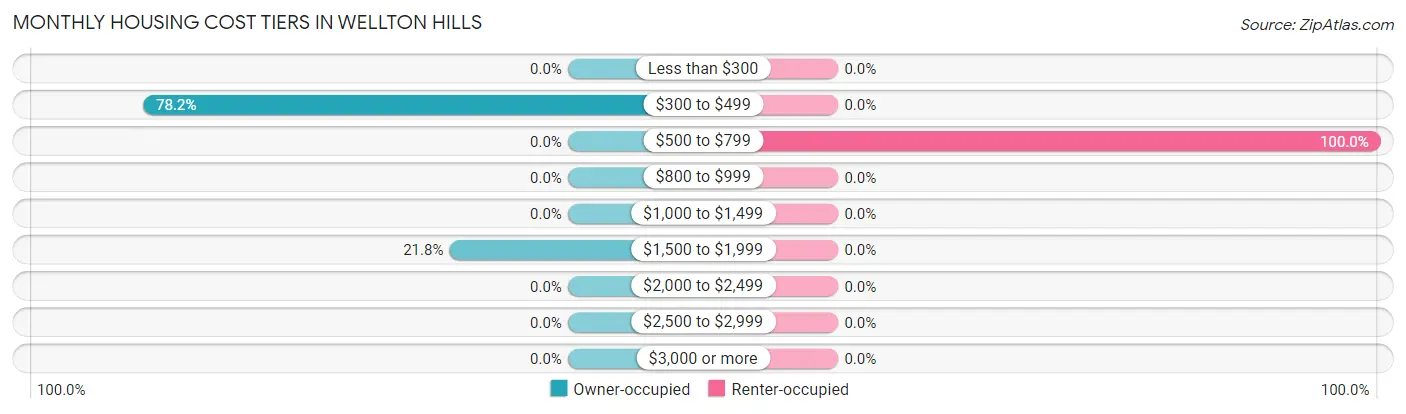
| Monthly Cost | Owner-occupied | Renter-occupied |
| Less than $300 | 0 (0.0%) | 0 (0.0%) |
| $300 to $499 | 43 (78.2%) | 0 (0.0%) |
| $500 to $799 | 0 (0.0%) | 11 (100.0%) |
| $800 to $999 | 0 (0.0%) | 0 (0.0%) |
| $1,000 to $1,499 | 0 (0.0%) | 0 (0.0%) |
| $1,500 to $1,999 | 12 (21.8%) | 0 (0.0%) |
| $2,000 to $2,499 | 0 (0.0%) | 0 (0.0%) |
| $2,500 to $2,999 | 0 (0.0%) | 0 (0.0%) |
| $3,000 or more | 0 (0.0%) | 0 (0.0%) |
| Total | 55 (100.0%) | 11 (100.0%) |
Physical Housing Characteristics in Wellton Hills
Housing Structures in Wellton Hills
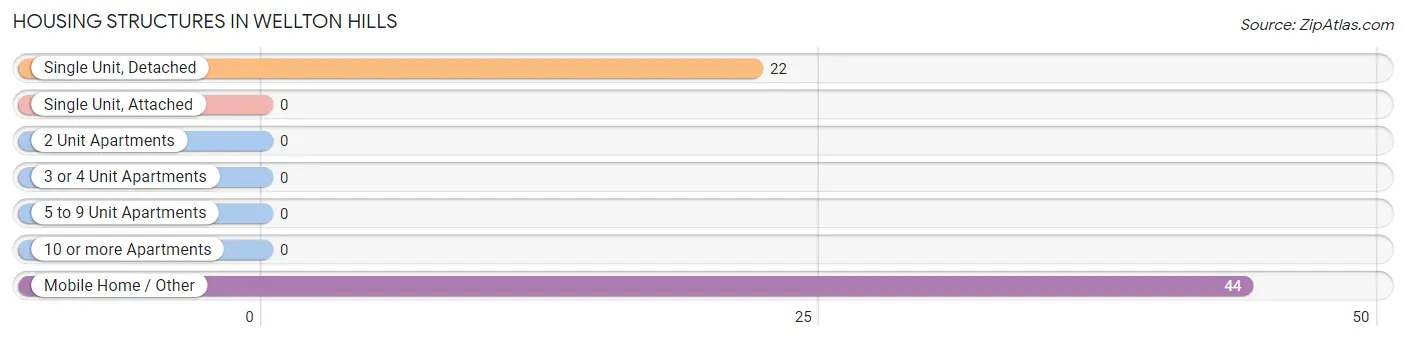
| Structure Type | # Housing Units | % Housing Units |
| Single Unit, Detached | 22 | 33.3% |
| Single Unit, Attached | 0 | 0.0% |
| 2 Unit Apartments | 0 | 0.0% |
| 3 or 4 Unit Apartments | 0 | 0.0% |
| 5 to 9 Unit Apartments | 0 | 0.0% |
| 10 or more Apartments | 0 | 0.0% |
| Mobile Home / Other | 44 | 66.7% |
| Total | 66 | 100.0% |
Housing Structures by Occupancy in Wellton Hills
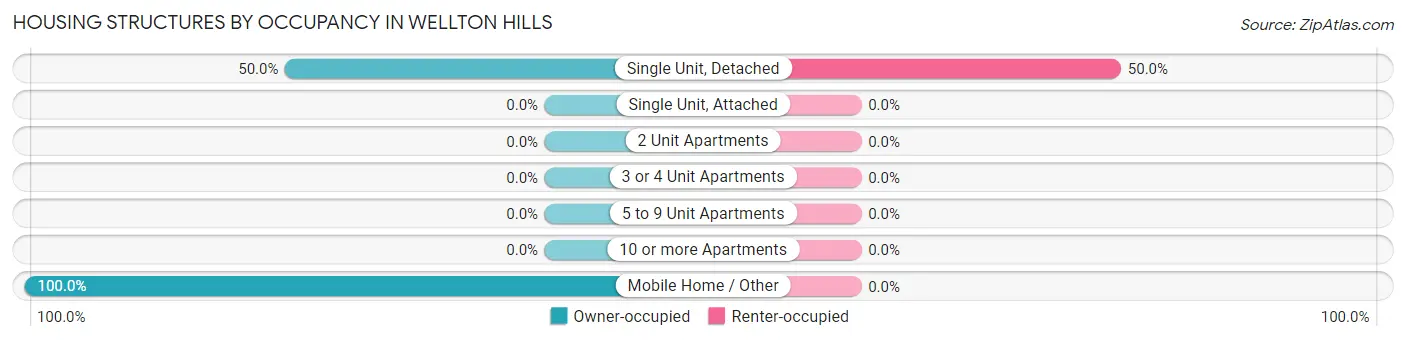
| Structure Type | Owner-occupied | Renter-occupied |
| Single Unit, Detached | 11 (50.0%) | 11 (50.0%) |
| Single Unit, Attached | 0 (0.0%) | 0 (0.0%) |
| 2 Unit Apartments | 0 (0.0%) | 0 (0.0%) |
| 3 or 4 Unit Apartments | 0 (0.0%) | 0 (0.0%) |
| 5 to 9 Unit Apartments | 0 (0.0%) | 0 (0.0%) |
| 10 or more Apartments | 0 (0.0%) | 0 (0.0%) |
| Mobile Home / Other | 44 (100.0%) | 0 (0.0%) |
| Total | 55 (83.3%) | 11 (16.7%) |
Housing Structures by Number of Rooms in Wellton Hills
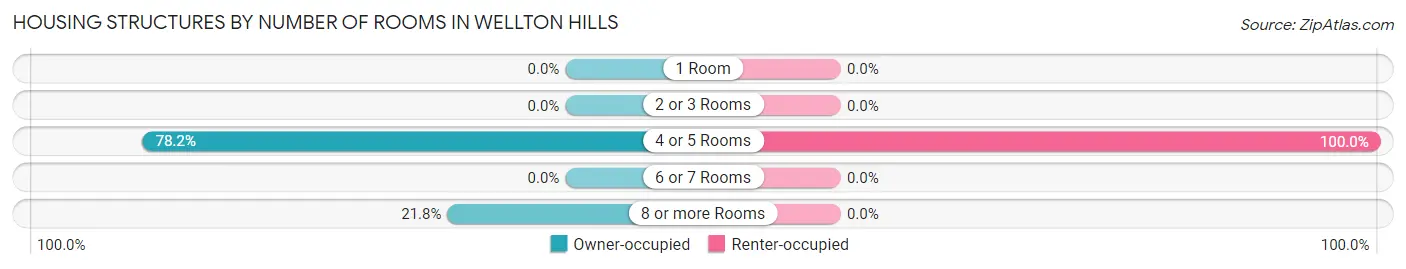
| Number of Rooms | Owner-occupied | Renter-occupied |
| 1 Room | 0 (0.0%) | 0 (0.0%) |
| 2 or 3 Rooms | 0 (0.0%) | 0 (0.0%) |
| 4 or 5 Rooms | 43 (78.2%) | 11 (100.0%) |
| 6 or 7 Rooms | 0 (0.0%) | 0 (0.0%) |
| 8 or more Rooms | 12 (21.8%) | 0 (0.0%) |
| Total | 55 (100.0%) | 11 (100.0%) |
Housing Structure by Heating Type in Wellton Hills
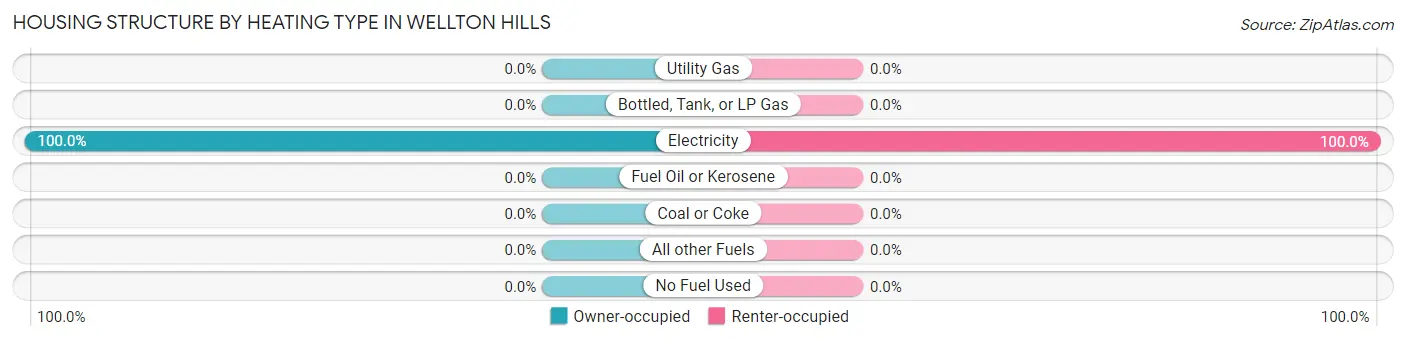
| Heating Type | Owner-occupied | Renter-occupied |
| Utility Gas | 0 (0.0%) | 0 (0.0%) |
| Bottled, Tank, or LP Gas | 0 (0.0%) | 0 (0.0%) |
| Electricity | 55 (100.0%) | 11 (100.0%) |
| Fuel Oil or Kerosene | 0 (0.0%) | 0 (0.0%) |
| Coal or Coke | 0 (0.0%) | 0 (0.0%) |
| All other Fuels | 0 (0.0%) | 0 (0.0%) |
| No Fuel Used | 0 (0.0%) | 0 (0.0%) |
| Total | 55 (100.0%) | 11 (100.0%) |
Household Vehicle Usage in Wellton Hills
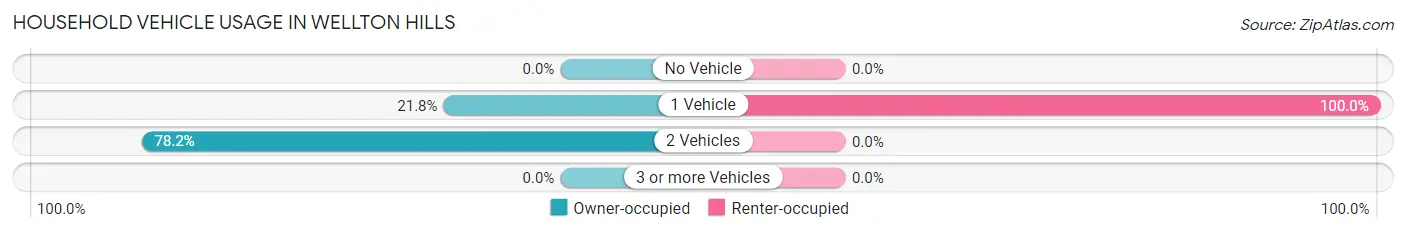
| Vehicles per Household | Owner-occupied | Renter-occupied |
| No Vehicle | 0 (0.0%) | 0 (0.0%) |
| 1 Vehicle | 12 (21.8%) | 11 (100.0%) |
| 2 Vehicles | 43 (78.2%) | 0 (0.0%) |
| 3 or more Vehicles | 0 (0.0%) | 0 (0.0%) |
| Total | 55 (100.0%) | 11 (100.0%) |
Real Estate & Mortgages in Wellton Hills
Real Estate and Mortgage Overview in Wellton Hills
| Characteristic | Without Mortgage | With Mortgage |
| Housing Units | 43 | 12 |
| Median Property Value | - | - |
| Median Household Income | - | - |
| Monthly Housing Costs | - | - |
| Real Estate Taxes | - | - |
Property Value by Mortgage Status in Wellton Hills
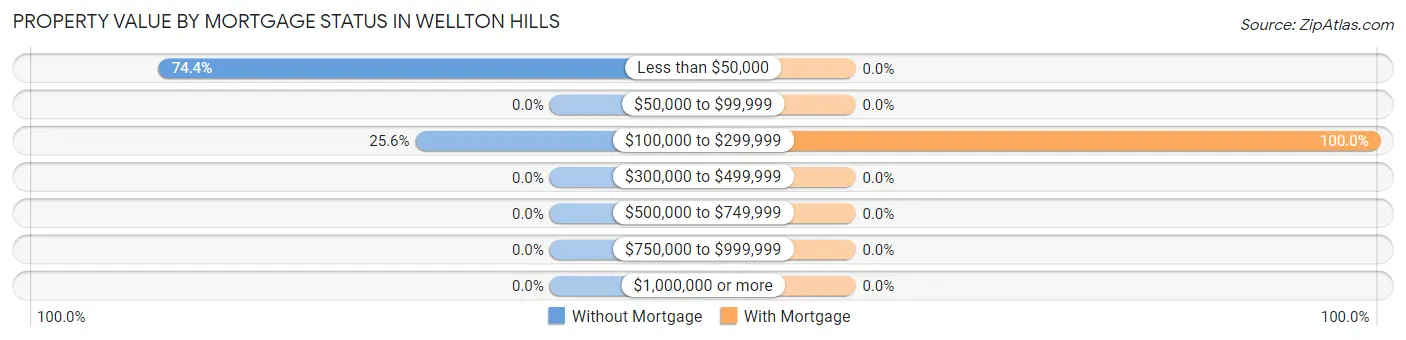
| Property Value | Without Mortgage | With Mortgage |
| Less than $50,000 | 32 (74.4%) | 0 (0.0%) |
| $50,000 to $99,999 | 0 (0.0%) | 0 (0.0%) |
| $100,000 to $299,999 | 11 (25.6%) | 12 (100.0%) |
| $300,000 to $499,999 | 0 (0.0%) | 0 (0.0%) |
| $500,000 to $749,999 | 0 (0.0%) | 0 (0.0%) |
| $750,000 to $999,999 | 0 (0.0%) | 0 (0.0%) |
| $1,000,000 or more | 0 (0.0%) | 0 (0.0%) |
| Total | 43 (100.0%) | 12 (100.0%) |
Household Income by Mortgage Status in Wellton Hills
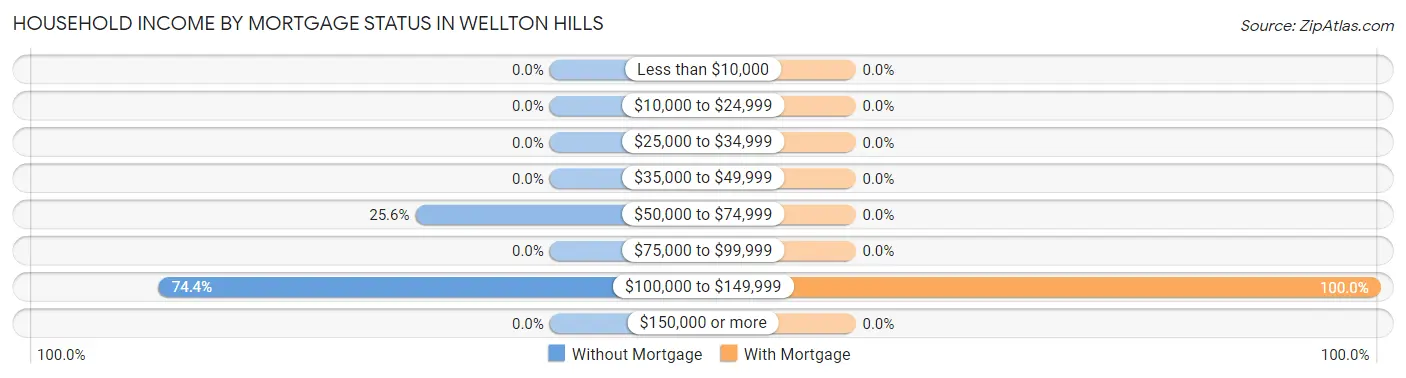
| Household Income | Without Mortgage | With Mortgage |
| Less than $10,000 | 0 (0.0%) | 0 (0.0%) |
| $10,000 to $24,999 | 0 (0.0%) | 0 (0.0%) |
| $25,000 to $34,999 | 0 (0.0%) | 0 (0.0%) |
| $35,000 to $49,999 | 0 (0.0%) | 0 (0.0%) |
| $50,000 to $74,999 | 11 (25.6%) | 0 (0.0%) |
| $75,000 to $99,999 | 0 (0.0%) | 0 (0.0%) |
| $100,000 to $149,999 | 32 (74.4%) | 12 (100.0%) |
| $150,000 or more | 0 (0.0%) | 0 (0.0%) |
| Total | 43 (100.0%) | 12 (100.0%) |
Property Value to Household Income Ratio in Wellton Hills
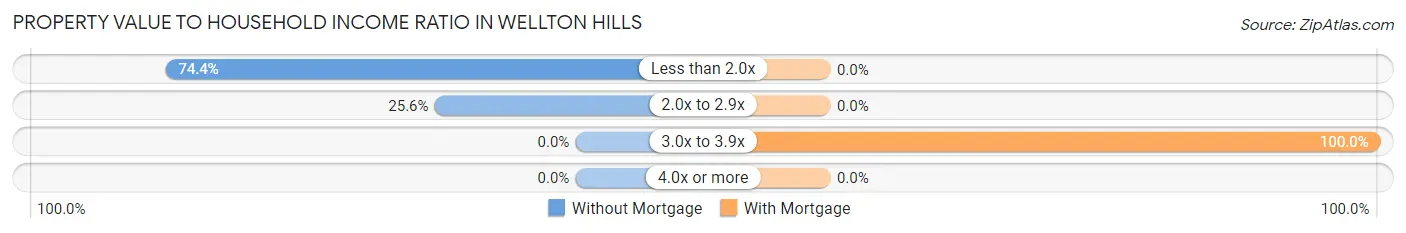
| Value-to-Income Ratio | Without Mortgage | With Mortgage |
| Less than 2.0x | 32 (74.4%) | 0 (0.0%) |
| 2.0x to 2.9x | 11 (25.6%) | 0 (0.0%) |
| 3.0x to 3.9x | 0 (0.0%) | 12 (100.0%) |
| 4.0x or more | 0 (0.0%) | 0 (0.0%) |
| Total | 43 (100.0%) | 12 (100.0%) |
Real Estate Taxes by Mortgage Status in Wellton Hills
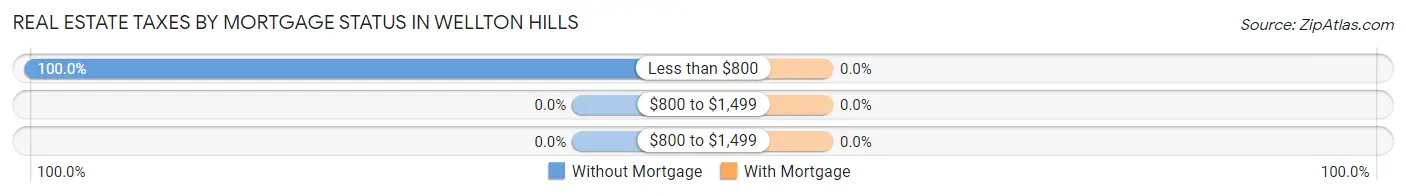
| Property Taxes | Without Mortgage | With Mortgage |
| Less than $800 | 43 (100.0%) | 0 (0.0%) |
| $800 to $1,499 | 0 (0.0%) | 0 (0.0%) |
| $800 to $1,499 | 0 (0.0%) | 0 (0.0%) |
| Total | 43 (100.0%) | 12 (100.0%) |
Health & Disability in Wellton Hills
Health Insurance Coverage by Age in Wellton Hills
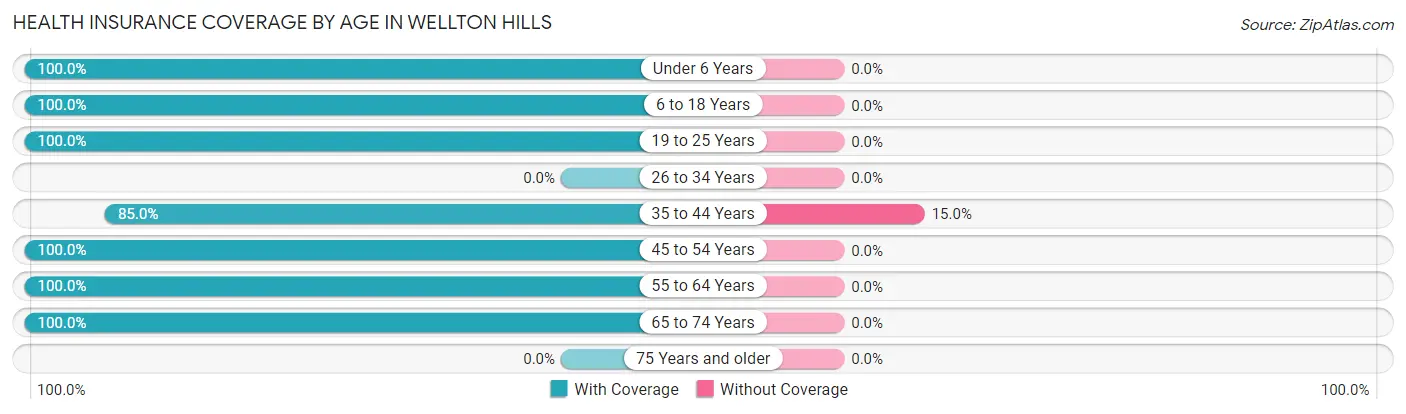
| Age Bracket | With Coverage | Without Coverage |
| Under 6 Years | 22 (100.0%) | 0 (0.0%) |
| 6 to 18 Years | 22 (100.0%) | 0 (0.0%) |
| 19 to 25 Years | 17 (100.0%) | 0 (0.0%) |
| 26 to 34 Years | 0 (0.0%) | 0 (0.0%) |
| 35 to 44 Years | 34 (85.0%) | 6 (15.0%) |
| 45 to 54 Years | 53 (100.0%) | 0 (0.0%) |
| 55 to 64 Years | 30 (100.0%) | 0 (0.0%) |
| 65 to 74 Years | 9 (100.0%) | 0 (0.0%) |
| 75 Years and older | 0 (0.0%) | 0 (0.0%) |
| Total | 187 (96.9%) | 6 (3.1%) |
Health Insurance Coverage by Citizenship Status in Wellton Hills
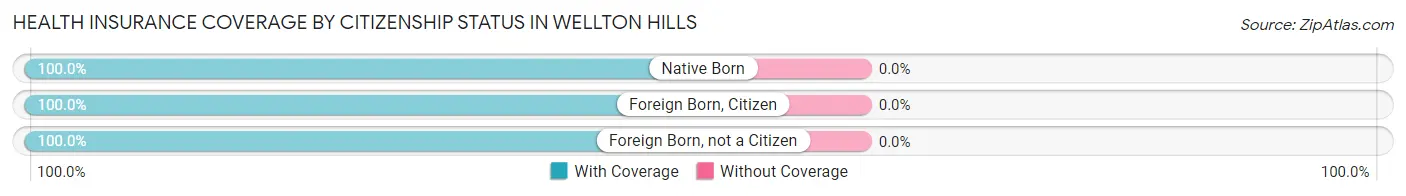
| Citizenship Status | With Coverage | Without Coverage |
| Native Born | 22 (100.0%) | 0 (0.0%) |
| Foreign Born, Citizen | 22 (100.0%) | 0 (0.0%) |
| Foreign Born, not a Citizen | 17 (100.0%) | 0 (0.0%) |
Health Insurance Coverage by Household Income in Wellton Hills
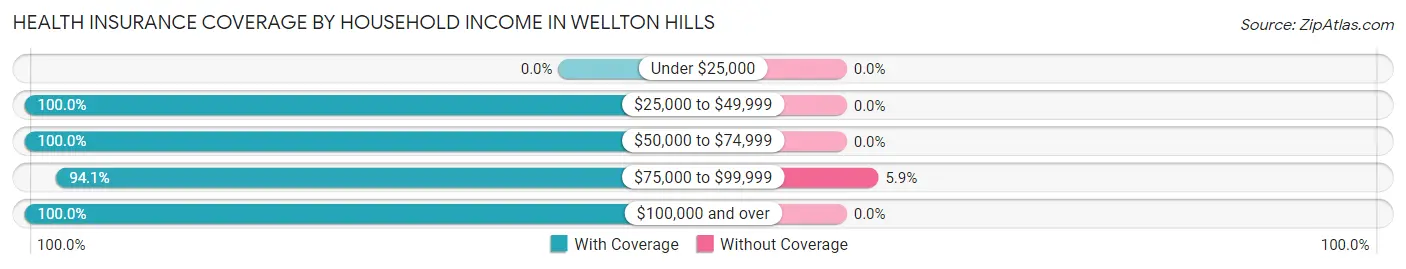
| Household Income | With Coverage | Without Coverage |
| Under $25,000 | 0 (0.0%) | 0 (0.0%) |
| $25,000 to $49,999 | 19 (100.0%) | 0 (0.0%) |
| $50,000 to $74,999 | 20 (100.0%) | 0 (0.0%) |
| $75,000 to $99,999 | 95 (94.1%) | 6 (5.9%) |
| $100,000 and over | 53 (100.0%) | 0 (0.0%) |
Public vs Private Health Insurance Coverage by Age in Wellton Hills
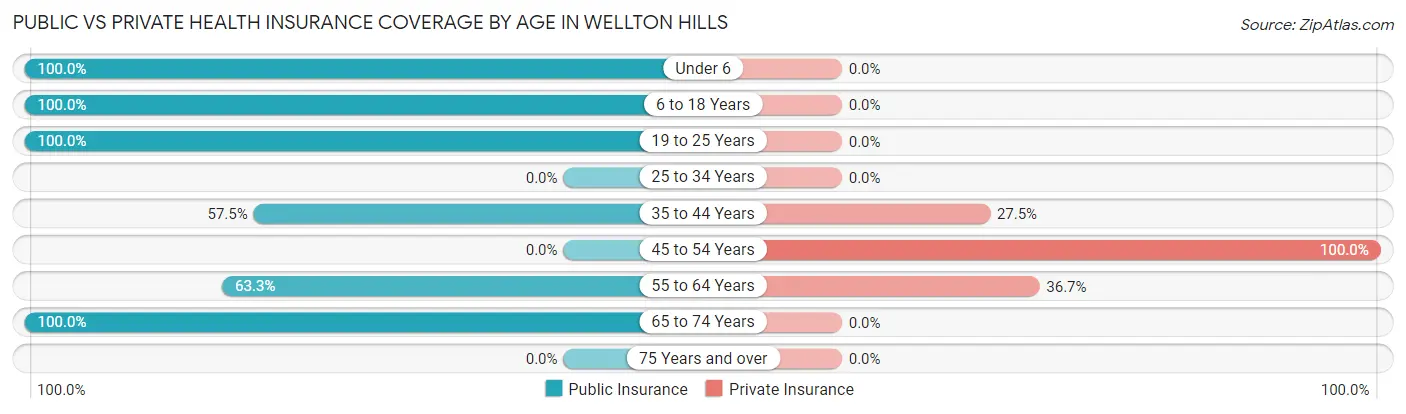
| Age Bracket | Public Insurance | Private Insurance |
| Under 6 | 22 (100.0%) | 0 (0.0%) |
| 6 to 18 Years | 22 (100.0%) | 0 (0.0%) |
| 19 to 25 Years | 17 (100.0%) | 0 (0.0%) |
| 25 to 34 Years | 0 (0.0%) | 0 (0.0%) |
| 35 to 44 Years | 23 (57.5%) | 11 (27.5%) |
| 45 to 54 Years | 0 (0.0%) | 53 (100.0%) |
| 55 to 64 Years | 19 (63.3%) | 11 (36.7%) |
| 65 to 74 Years | 9 (100.0%) | 0 (0.0%) |
| 75 Years and over | 0 (0.0%) | 0 (0.0%) |
| Total | 112 (58.0%) | 75 (38.9%) |
Disability Status by Sex by Age in Wellton Hills
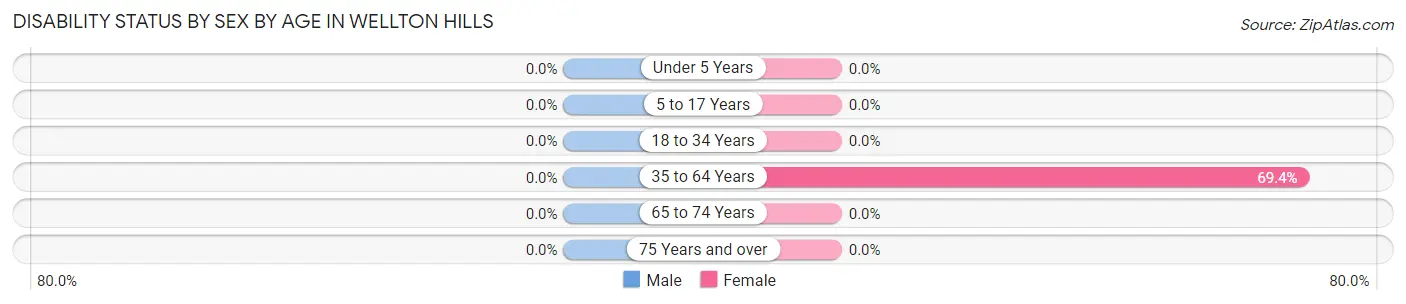
| Age Bracket | Male | Female |
| Under 5 Years | 0 (0.0%) | 0 (0.0%) |
| 5 to 17 Years | 0 (0.0%) | 0 (0.0%) |
| 18 to 34 Years | 0 (0.0%) | 0 (0.0%) |
| 35 to 64 Years | 0 (0.0%) | 25 (69.4%) |
| 65 to 74 Years | 0 (0.0%) | 0 (0.0%) |
| 75 Years and over | 0 (0.0%) | 0 (0.0%) |
Disability Class by Sex by Age in Wellton Hills
Disability Class: Hearing Difficulty
| Age Bracket | Male | Female |
| Under 5 Years | 0 (0.0%) | 0 (0.0%) |
| 5 to 17 Years | 0 (0.0%) | 0 (0.0%) |
| 18 to 34 Years | 0 (0.0%) | 0 (0.0%) |
| 35 to 64 Years | 0 (0.0%) | 0 (0.0%) |
| 65 to 74 Years | 0 (0.0%) | 0 (0.0%) |
| 75 Years and over | 0 (0.0%) | 0 (0.0%) |
Disability Class: Vision Difficulty
| Age Bracket | Male | Female |
| Under 5 Years | 0 (0.0%) | 0 (0.0%) |
| 5 to 17 Years | 0 (0.0%) | 0 (0.0%) |
| 18 to 34 Years | 0 (0.0%) | 0 (0.0%) |
| 35 to 64 Years | 0 (0.0%) | 0 (0.0%) |
| 65 to 74 Years | 0 (0.0%) | 0 (0.0%) |
| 75 Years and over | 0 (0.0%) | 0 (0.0%) |
Disability Class: Cognitive Difficulty
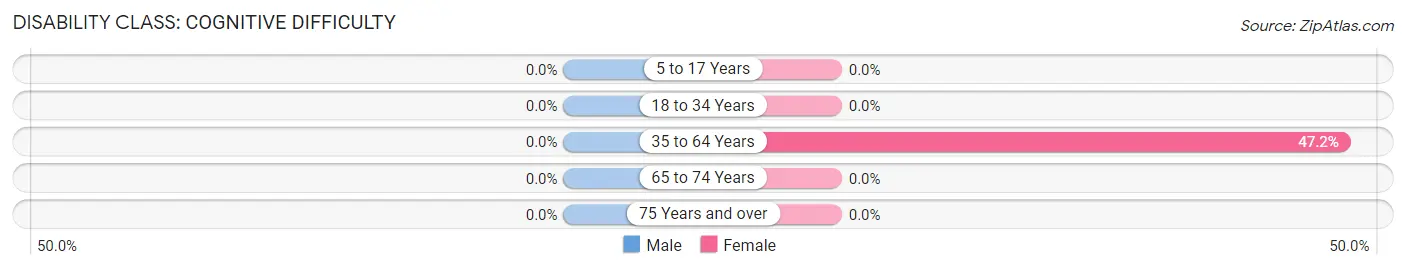
| Age Bracket | Male | Female |
| 5 to 17 Years | 0 (0.0%) | 0 (0.0%) |
| 18 to 34 Years | 0 (0.0%) | 0 (0.0%) |
| 35 to 64 Years | 0 (0.0%) | 17 (47.2%) |
| 65 to 74 Years | 0 (0.0%) | 0 (0.0%) |
| 75 Years and over | 0 (0.0%) | 0 (0.0%) |
Disability Class: Ambulatory Difficulty
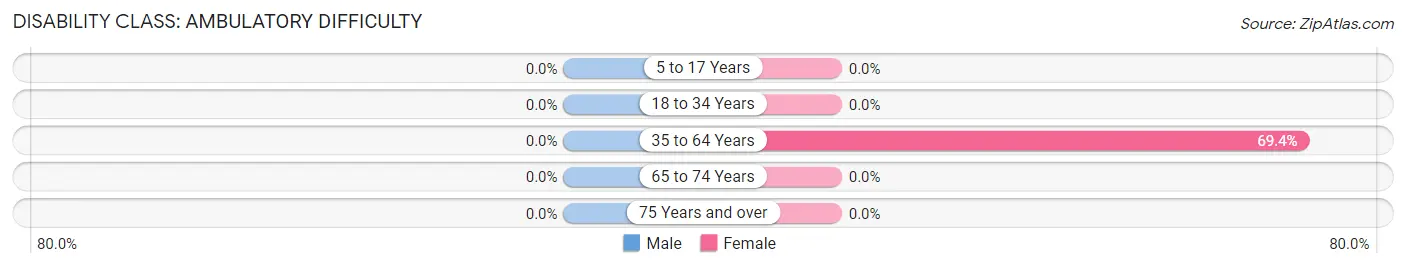
| Age Bracket | Male | Female |
| 5 to 17 Years | 0 (0.0%) | 0 (0.0%) |
| 18 to 34 Years | 0 (0.0%) | 0 (0.0%) |
| 35 to 64 Years | 0 (0.0%) | 25 (69.4%) |
| 65 to 74 Years | 0 (0.0%) | 0 (0.0%) |
| 75 Years and over | 0 (0.0%) | 0 (0.0%) |
Disability Class: Self-Care Difficulty
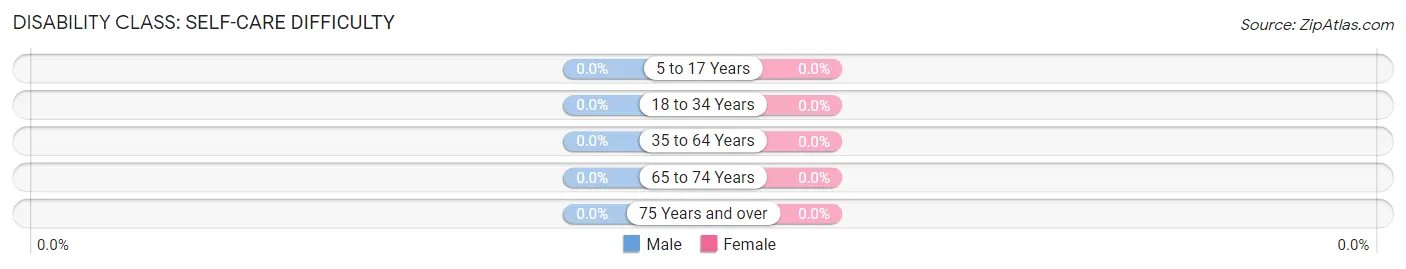
| Age Bracket | Male | Female |
| 5 to 17 Years | 0 (0.0%) | 0 (0.0%) |
| 18 to 34 Years | 0 (0.0%) | 0 (0.0%) |
| 35 to 64 Years | 0 (0.0%) | 0 (0.0%) |
| 65 to 74 Years | 0 (0.0%) | 0 (0.0%) |
| 75 Years and over | 0 (0.0%) | 0 (0.0%) |
Technology Access in Wellton Hills
Computing Device Access in Wellton Hills
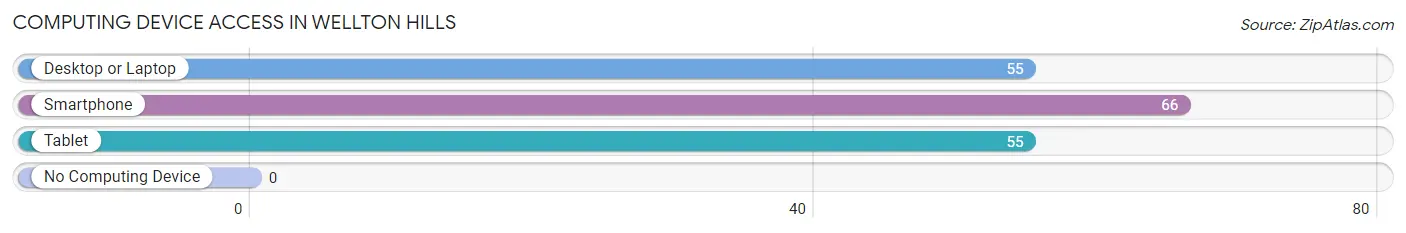
| Device Type | # Households | % Households |
| Desktop or Laptop | 55 | 83.3% |
| Smartphone | 66 | 100.0% |
| Tablet | 55 | 83.3% |
| No Computing Device | 0 | 0.0% |
| Total | 66 | 100.0% |
Internet Access in Wellton Hills
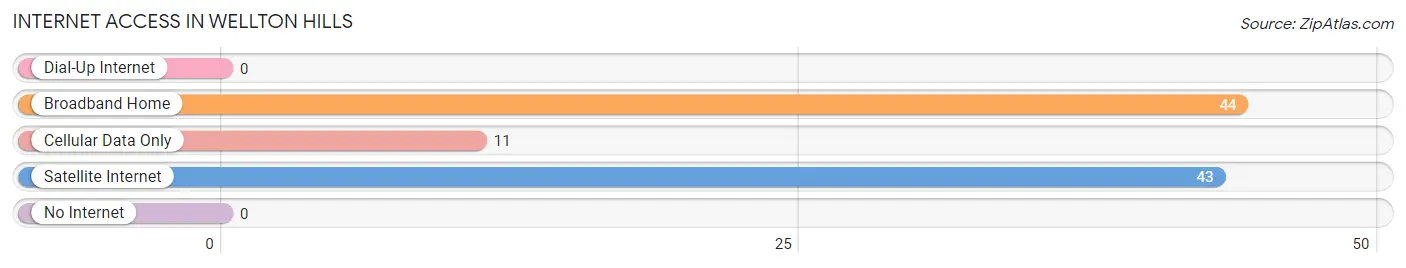
| Internet Type | # Households | % Households |
| Dial-Up Internet | 0 | 0.0% |
| Broadband Home | 44 | 66.7% |
| Cellular Data Only | 11 | 16.7% |
| Satellite Internet | 43 | 65.1% |
| No Internet | 0 | 0.0% |
| Total | 66 | 100.0% |
Wellton Hills Summary
Wellton Hills, Arizona is a small town located in Yuma County, Arizona. It is situated in the southwestern corner of the state, near the border with California and Mexico. The town is located in the Sonoran Desert, and is surrounded by the Gila and Colorado Rivers. The population of Wellton Hills was 1,845 in the 2010 census.
Geography
Wellton Hills is located in the Sonoran Desert, and is surrounded by the Gila and Colorado Rivers. The town is situated at an elevation of 1,845 feet above sea level. The climate in Wellton Hills is hot and dry, with temperatures ranging from the mid-90s in the summer to the mid-50s in the winter. The town receives an average of 8.5 inches of precipitation annually.
The town is located in the Yuma County, which is the fourth largest county in Arizona. The county is home to a variety of wildlife, including coyotes, bobcats, and javelinas. The area is also home to a variety of plant life, including cacti, mesquite, and creosote bush.
Economy
The economy of Wellton Hills is largely based on agriculture. The town is home to a variety of farms, including cotton, alfalfa, and wheat. The town is also home to a number of small businesses, including restaurants, convenience stores, and auto repair shops.
The town is also home to a number of manufacturing companies, including a plastics factory and a metal fabrication plant. The town is also home to a number of government offices, including the Yuma County Sheriff's Office and the Yuma County Courthouse.
Demographics
As of the 2010 census, the population of Wellton Hills was 1,845. The racial makeup of the town was 75.3% White, 0.7% African American, 0.3% Native American, 0.2% Asian, 0.1% Pacific Islander, 21.2% from other races, and 2.4% from two or more races. Hispanic or Latino of any race were 43.2% of the population.
The median income for a household in Wellton Hills was $30,938, and the median income for a family was $35,625. The per capita income for the town was $14,945. About 18.2% of families and 22.2% of the population were below the poverty line, including 28.3% of those under age 18 and 10.2% of those age 65 or over.
Conclusion
Wellton Hills, Arizona is a small town located in Yuma County, Arizona. It is situated in the southwestern corner of the state, near the border with California and Mexico. The town is located in the Sonoran Desert, and is surrounded by the Gila and Colorado Rivers. The population of Wellton Hills was 1,845 in the 2010 census. The economy of Wellton Hills is largely based on agriculture, and the town is home to a variety of small businesses. The racial makeup of the town was 75.3% White, 0.7% African American, 0.3% Native American, 0.2% Asian, 0.1% Pacific Islander, 21.2% from other races, and 2.4% from two or more races. The median income for a household in Wellton Hills was $30,938, and the median income for a family was $35,625. About 18.2% of families and 22.2% of the population were below the poverty line.
Common Questions
What is Per Capita Income in Wellton Hills?
Per Capita income in Wellton Hills is $24,007.
What is Inequality or Gini Index in Wellton Hills?
Inequality or Gini Index in Wellton Hills is 0.20.
What is the Total Population of Wellton Hills?
Total Population of Wellton Hills is 193.
What is the Total Male Population of Wellton Hills?
Total Male Population of Wellton Hills is 123.
What is the Total Female Population of Wellton Hills?
Total Female Population of Wellton Hills is 70.
What is the Ratio of Males per 100 Females in Wellton Hills?
There are 175.71 Males per 100 Females in Wellton Hills.
What is the Ratio of Females per 100 Males in Wellton Hills?
There are 56.91 Females per 100 Males in Wellton Hills.
What is the Median Population Age in Wellton Hills?
Median Population Age in Wellton Hills is 43.3 Years.
What is the Average Family Size in Wellton Hills
Average Family Size in Wellton Hills is 2.3 People.
What is the Average Household Size in Wellton Hills
Average Household Size in Wellton Hills is 2.9 People.
How Large is the Labor Force in Wellton Hills?
There are 93 People in the Labor Forcein in Wellton Hills.
What is the Percentage of People in the Labor Force in Wellton Hills?
62.4% of People are in the Labor Force in Wellton Hills.
What is the Unemployment Rate in Wellton Hills?
Unemployment Rate in Wellton Hills is 6.5%.