Pajarito Mesa, NM Map & Demographics
Pajarito Mesa Map
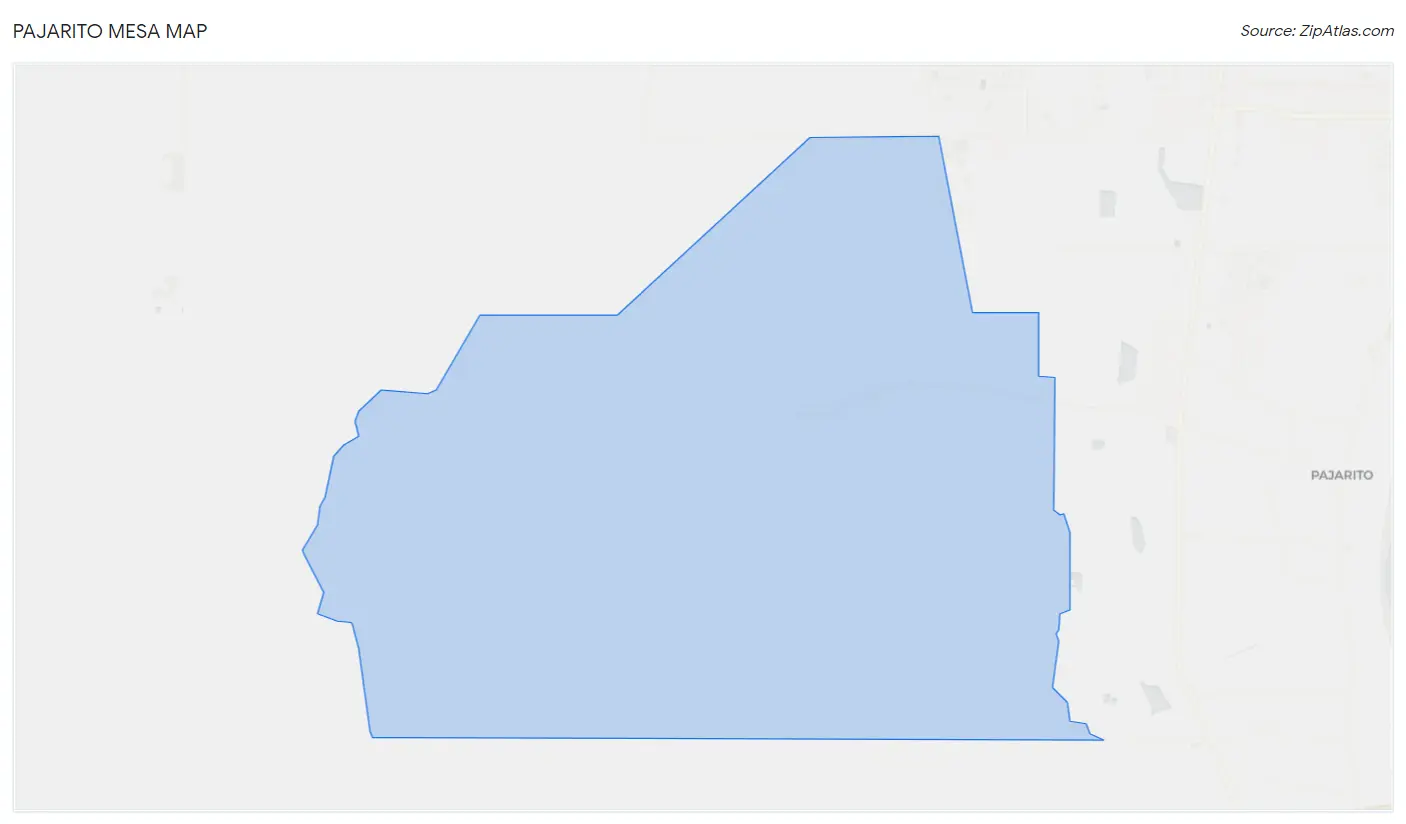
Pajarito Mesa Overview
$5,003
PER CAPITA INCOME
$11,036
AVG HOUSEHOLD INCOME
0.26
INEQUALITY / GINI INDEX
225
TOTAL POPULATION
133
MALE POPULATION
92
FEMALE POPULATION
144.57
MALES / 100 FEMALES
69.17
FEMALES / 100 MALES
44.7
MEDIAN AGE
2.8
AVG FAMILY SIZE
2.0
AVG HOUSEHOLD SIZE
118
LABOR FORCE [ PEOPLE ]
65.2%
PERCENT IN LABOR FORCE
50.8%
UNEMPLOYMENT RATE
Income in Pajarito Mesa
Income Overview in Pajarito Mesa
| Characteristic | Number | Measure |
| Per Capita Income | 225 | $5,003 |
| Median Family Income | 24 | $0 |
| Mean Family Income | 24 | $0 |
| Median Household Income | 111 | $11,036 |
| Mean Household Income | 111 | $10,334 |
| Income Deficit | 24 | $0 |
| Wage / Income Gap (%) | 225 | 0.00% |
| Wage / Income Gap ($) | 225 | 100.00¢ per $1 |
| Gini / Inequality Index | 225 | 0.26 |
Earnings by Sex in Pajarito Mesa
| Sex | Number | Average Earnings |
| Male | 58 (100.0%) | $0 |
| Female | 0 (0.0%) | $0 |
| Total | 58 (100.0%) | $0 |
Earnings by Sex by Income Bracket in Pajarito Mesa
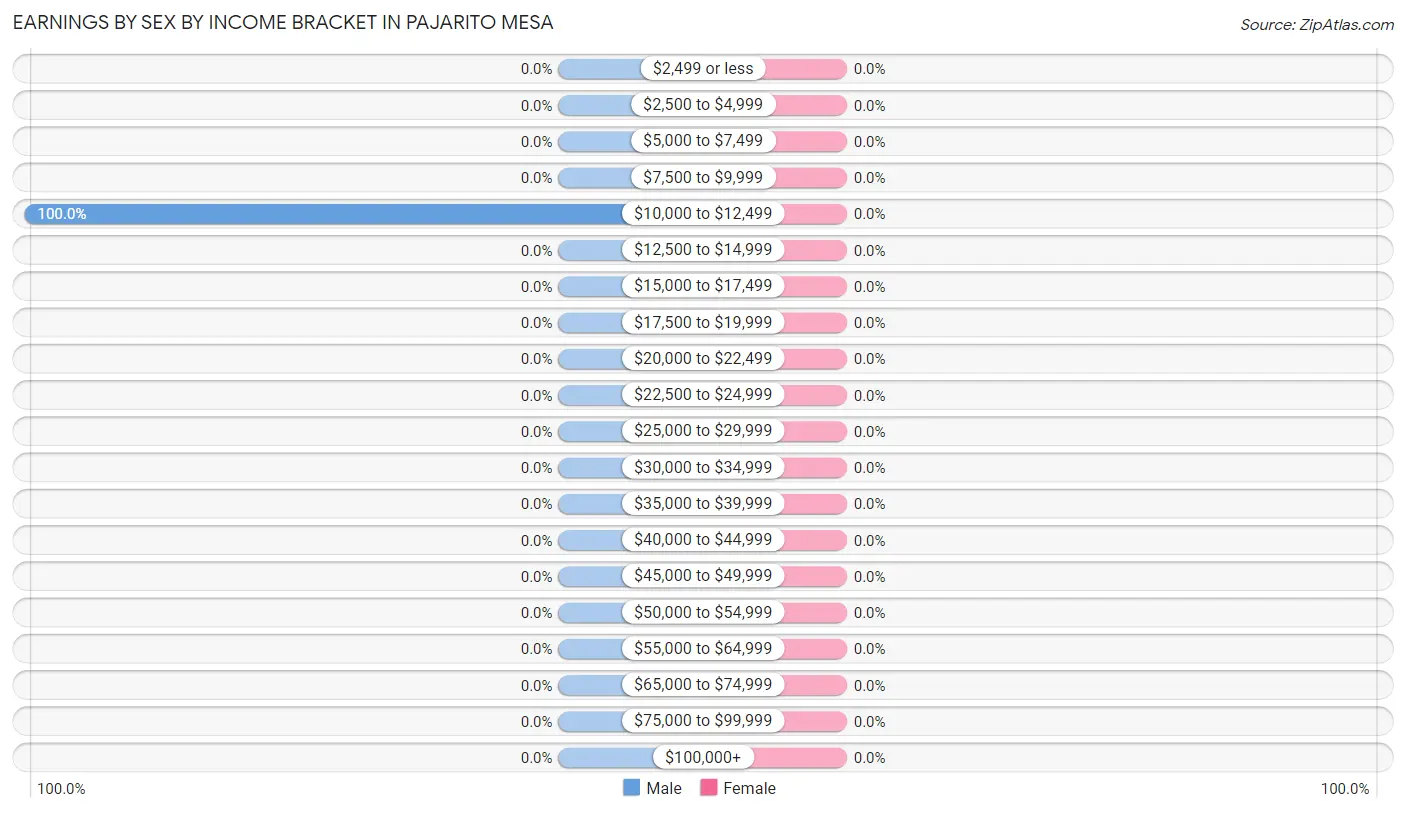
| Income | Male | Female |
| $2,499 or less | 0 (0.0%) | 0 (0.0%) |
| $2,500 to $4,999 | 0 (0.0%) | 0 (0.0%) |
| $5,000 to $7,499 | 0 (0.0%) | 0 (0.0%) |
| $7,500 to $9,999 | 0 (0.0%) | 0 (0.0%) |
| $10,000 to $12,499 | 58 (100.0%) | 0 (0.0%) |
| $12,500 to $14,999 | 0 (0.0%) | 0 (0.0%) |
| $15,000 to $17,499 | 0 (0.0%) | 0 (0.0%) |
| $17,500 to $19,999 | 0 (0.0%) | 0 (0.0%) |
| $20,000 to $22,499 | 0 (0.0%) | 0 (0.0%) |
| $22,500 to $24,999 | 0 (0.0%) | 0 (0.0%) |
| $25,000 to $29,999 | 0 (0.0%) | 0 (0.0%) |
| $30,000 to $34,999 | 0 (0.0%) | 0 (0.0%) |
| $35,000 to $39,999 | 0 (0.0%) | 0 (0.0%) |
| $40,000 to $44,999 | 0 (0.0%) | 0 (0.0%) |
| $45,000 to $49,999 | 0 (0.0%) | 0 (0.0%) |
| $50,000 to $54,999 | 0 (0.0%) | 0 (0.0%) |
| $55,000 to $64,999 | 0 (0.0%) | 0 (0.0%) |
| $65,000 to $74,999 | 0 (0.0%) | 0 (0.0%) |
| $75,000 to $99,999 | 0 (0.0%) | 0 (0.0%) |
| $100,000+ | 0 (0.0%) | 0 (0.0%) |
| Total | 58 (100.0%) | 0 (0.0%) |
Earnings by Sex by Educational Attainment in Pajarito Mesa
| Educational Attainment | Male Income | Female Income |
| Less than High School | - | - |
| High School Diploma | - | - |
| College or Associate's Degree | - | - |
| Bachelor's Degree | - | - |
| Graduate Degree | - | - |
| Total | - | - |
Family Income in Pajarito Mesa
Family Income Brackets in Pajarito Mesa
According to the Pajarito Mesa family income data, there are 24 families falling into the less than $10,000 income range, which is the most common income bracket and makes up 100.0% of all families.
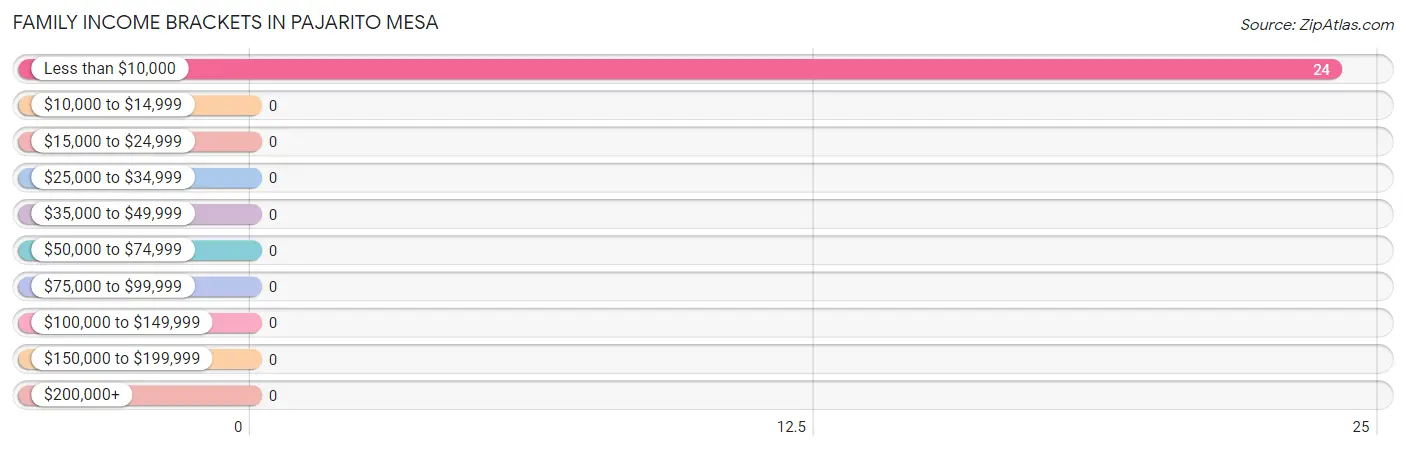
| Income Bracket | # Families | % Families |
| Less than $10,000 | 24 | 100.0% |
| $10,000 to $14,999 | 0 | 0.0% |
| $15,000 to $24,999 | 0 | 0.0% |
| $25,000 to $34,999 | 0 | 0.0% |
| $35,000 to $49,999 | 0 | 0.0% |
| $50,000 to $74,999 | 0 | 0.0% |
| $75,000 to $99,999 | 0 | 0.0% |
| $100,000 to $149,999 | 0 | 0.0% |
| $150,000 to $199,999 | 0 | 0.0% |
| $200,000+ | 0 | 0.0% |
Family Income by Famaliy Size in Pajarito Mesa
| Income Bracket | # Families | Median Income |
| 2-Person Families | 0 (0.0%) | $0 |
| 3-Person Families | 24 (100.0%) | $0 |
| 4-Person Families | 0 (0.0%) | $0 |
| 5-Person Families | 0 (0.0%) | $0 |
| 6-Person Families | 0 (0.0%) | $0 |
| 7+ Person Families | 0 (0.0%) | $0 |
| Total | 24 (100.0%) | $0 |
Family Income by Number of Earners in Pajarito Mesa
| Number of Earners | # Families | Median Income |
| No Earners | 24 (100.0%) | $0 |
| 1 Earner | 0 (0.0%) | $0 |
| 2 Earners | 0 (0.0%) | $0 |
| 3+ Earners | 0 (0.0%) | $0 |
| Total | 24 (100.0%) | $0 |
Household Income in Pajarito Mesa
Household Income Brackets in Pajarito Mesa
With 76 households falling in the category, the $10,000 to $14,999 income range is the most frequent in Pajarito Mesa, accounting for 68.5% of all households.
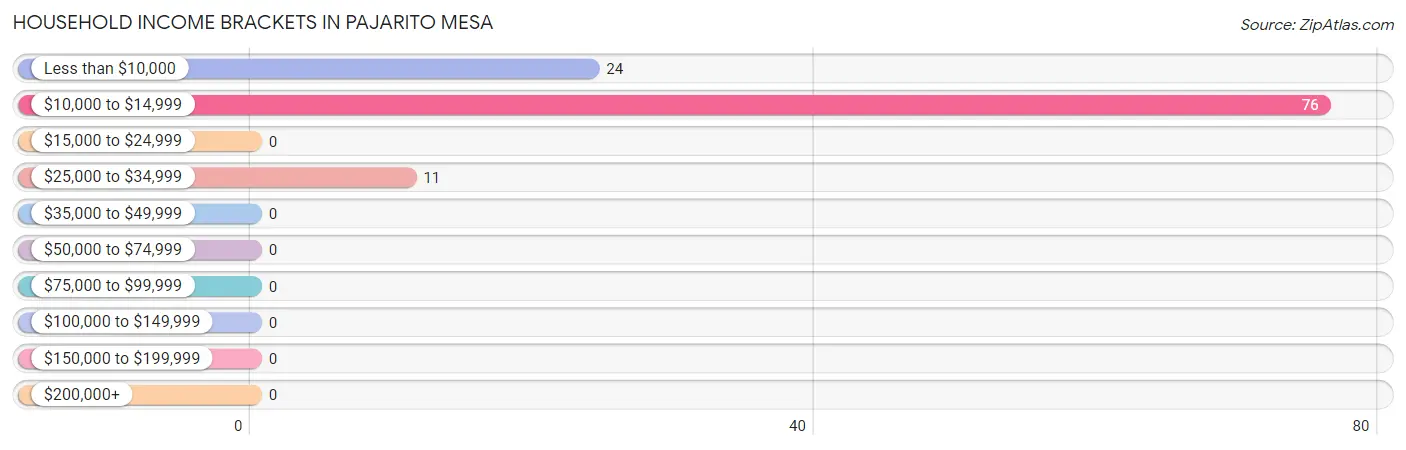
| Income Bracket | # Households | % Households |
| Less than $10,000 | 24 | 21.6% |
| $10,000 to $14,999 | 76 | 68.5% |
| $15,000 to $24,999 | 0 | 0.0% |
| $25,000 to $34,999 | 11 | 9.9% |
| $35,000 to $49,999 | 0 | 0.0% |
| $50,000 to $74,999 | 0 | 0.0% |
| $75,000 to $99,999 | 0 | 0.0% |
| $100,000 to $149,999 | 0 | 0.0% |
| $150,000 to $199,999 | 0 | 0.0% |
| $200,000+ | 0 | 0.0% |
Household Income by Householder Age in Pajarito Mesa
| Income Bracket | # Households | Median Income |
| 15 to 24 Years | 0 (0.0%) | $0 |
| 25 to 44 Years | 24 (21.6%) | $0 |
| 45 to 64 Years | 69 (62.2%) | $0 |
| 65+ Years | 18 (16.2%) | $0 |
| Total | 111 (100.0%) | $11,036 |
Poverty in Pajarito Mesa
Income Below Poverty by Sex and Age in Pajarito Mesa
With 100.0% poverty level for males and 89.1% for females among the residents of Pajarito Mesa, 12 to 14 year old males and 6 to 11 year old females are the most vulnerable to poverty, with 22 males (100.0%) and 22 females (100.0%) in their respective age groups living below the poverty level.
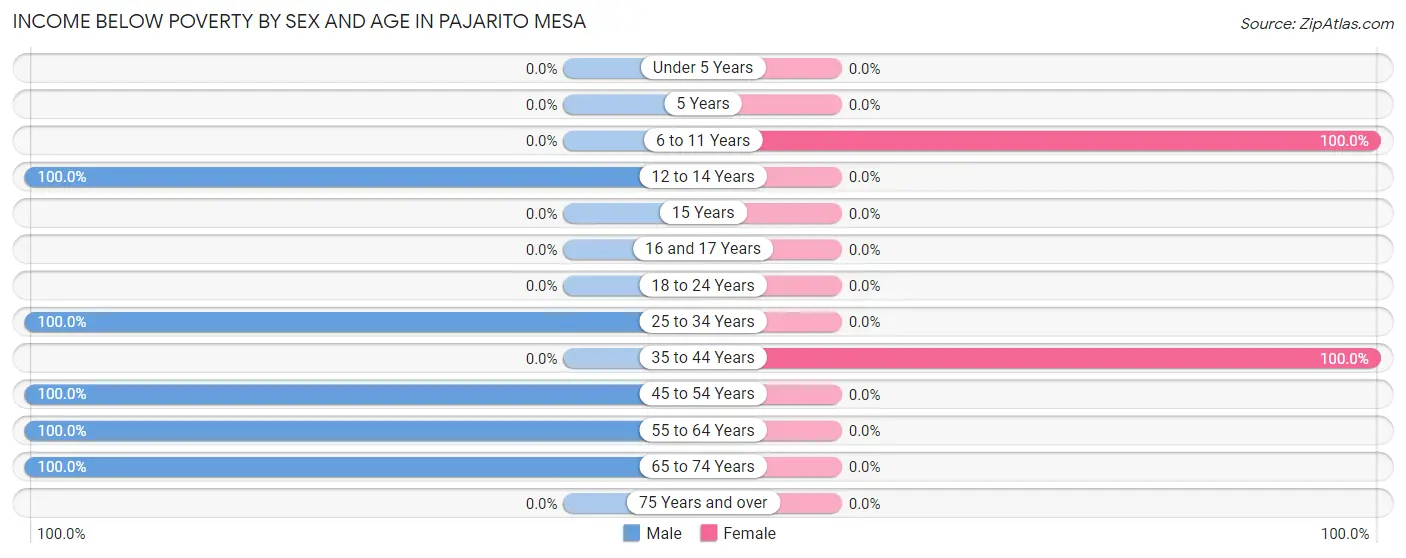
| Age Bracket | Male | Female |
| Under 5 Years | 0 (0.0%) | 0 (0.0%) |
| 5 Years | 0 (0.0%) | 0 (0.0%) |
| 6 to 11 Years | 0 (0.0%) | 22 (100.0%) |
| 12 to 14 Years | 22 (100.0%) | 0 (0.0%) |
| 15 Years | 0 (0.0%) | 0 (0.0%) |
| 16 and 17 Years | 0 (0.0%) | 0 (0.0%) |
| 18 to 24 Years | 0 (0.0%) | 0 (0.0%) |
| 25 to 34 Years | 24 (100.0%) | 0 (0.0%) |
| 35 to 44 Years | 0 (0.0%) | 60 (100.0%) |
| 45 to 54 Years | 58 (100.0%) | 0 (0.0%) |
| 55 to 64 Years | 11 (100.0%) | 0 (0.0%) |
| 65 to 74 Years | 18 (100.0%) | 0 (0.0%) |
| 75 Years and over | 0 (0.0%) | 0 (0.0%) |
| Total | 133 (100.0%) | 82 (89.1%) |
Income Above Poverty by Sex and Age in Pajarito Mesa
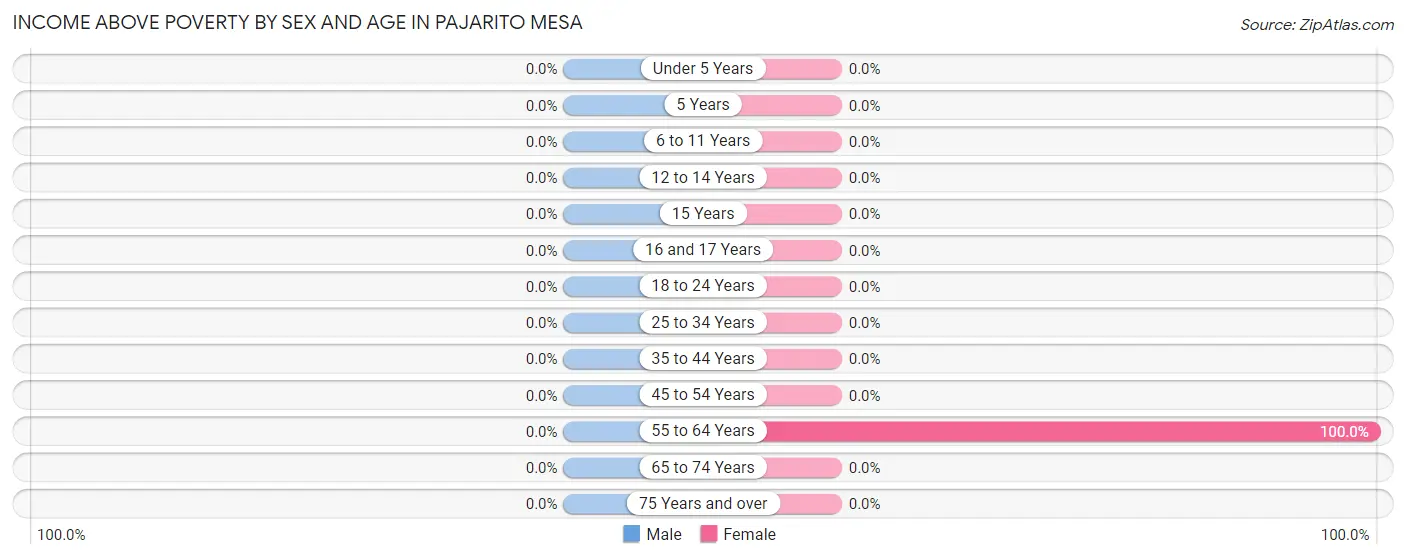
| Age Bracket | Male | Female |
| Under 5 Years | 0 (0.0%) | 0 (0.0%) |
| 5 Years | 0 (0.0%) | 0 (0.0%) |
| 6 to 11 Years | 0 (0.0%) | 0 (0.0%) |
| 12 to 14 Years | 0 (0.0%) | 0 (0.0%) |
| 15 Years | 0 (0.0%) | 0 (0.0%) |
| 16 and 17 Years | 0 (0.0%) | 0 (0.0%) |
| 18 to 24 Years | 0 (0.0%) | 0 (0.0%) |
| 25 to 34 Years | 0 (0.0%) | 0 (0.0%) |
| 35 to 44 Years | 0 (0.0%) | 0 (0.0%) |
| 45 to 54 Years | 0 (0.0%) | 0 (0.0%) |
| 55 to 64 Years | 0 (0.0%) | 10 (100.0%) |
| 65 to 74 Years | 0 (0.0%) | 0 (0.0%) |
| 75 Years and over | 0 (0.0%) | 0 (0.0%) |
| Total | 0 (0.0%) | 10 (10.9%) |
Income Below Poverty Among Married-Couple Families in Pajarito Mesa
| Children | Above Poverty | Below Poverty |
| No Children | 0 (0.0%) | 0 (0.0%) |
| 1 or 2 Children | 0 (0.0%) | 0 (0.0%) |
| 3 or 4 Children | 0 (0.0%) | 0 (0.0%) |
| 5 or more Children | 0 (0.0%) | 0 (0.0%) |
| Total | 0 (0.0%) | 0 (0.0%) |
Income Below Poverty Among Single-Parent Households in Pajarito Mesa
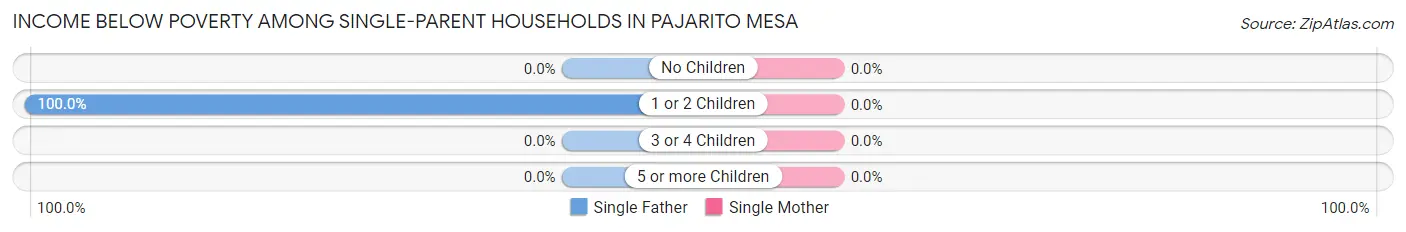
| Children | Single Father | Single Mother |
| No Children | 0 (0.0%) | 0 (0.0%) |
| 1 or 2 Children | 24 (100.0%) | 0 (0.0%) |
| 3 or 4 Children | 0 (0.0%) | 0 (0.0%) |
| 5 or more Children | 0 (0.0%) | 0 (0.0%) |
| Total | 24 (100.0%) | 0 (0.0%) |
Income Below Poverty Among Married-Couple vs Single-Parent Households in Pajarito Mesa
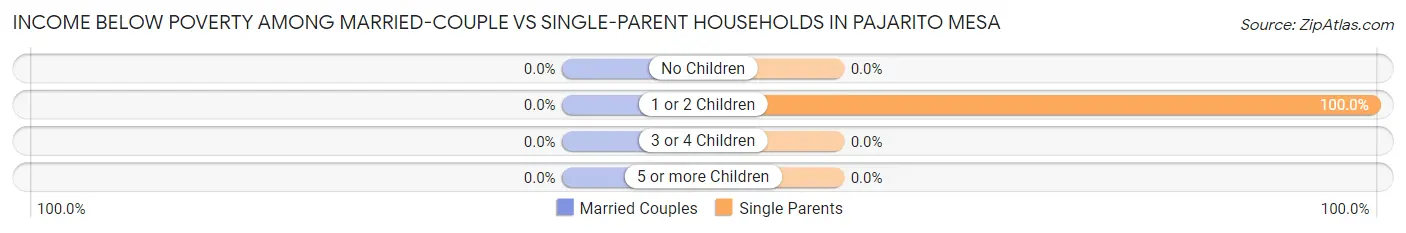
| Children | Married-Couple Families | Single-Parent Households |
| No Children | 0 (0.0%) | 0 (0.0%) |
| 1 or 2 Children | 0 (0.0%) | 24 (100.0%) |
| 3 or 4 Children | 0 (0.0%) | 0 (0.0%) |
| 5 or more Children | 0 (0.0%) | 0 (0.0%) |
| Total | 0 (0.0%) | 24 (100.0%) |
Race in Pajarito Mesa
The most populous races in Pajarito Mesa are Hispanic or Latino (215 | 95.6%), White / Caucasian (88 | 39.1%), and Some other Race (79 | 35.1%).
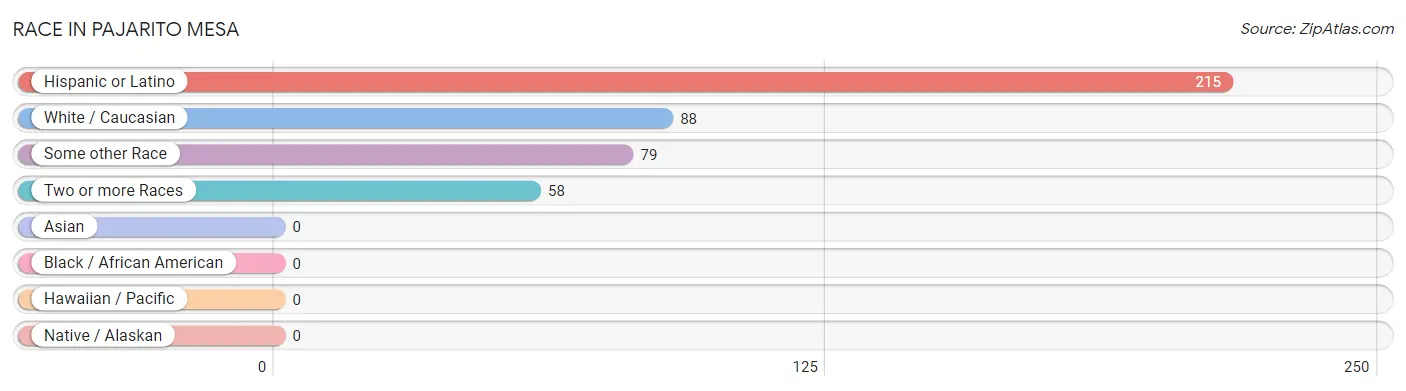
| Race | # Population | % Population |
| Asian | 0 | 0.0% |
| Black / African American | 0 | 0.0% |
| Hawaiian / Pacific | 0 | 0.0% |
| Hispanic or Latino | 215 | 95.6% |
| Native / Alaskan | 0 | 0.0% |
| White / Caucasian | 88 | 39.1% |
| Two or more Races | 58 | 25.8% |
| Some other Race | 79 | 35.1% |
| Total | 225 | 100.0% |
Ancestry in Pajarito Mesa
The most populous ancestries reported in Pajarito Mesa are Mexican (215 | 95.6%), Pueblo (58 | 25.8%), English (10 | 4.4%), and Irish (10 | 4.4%), together accounting for 130.2% of all Pajarito Mesa residents.
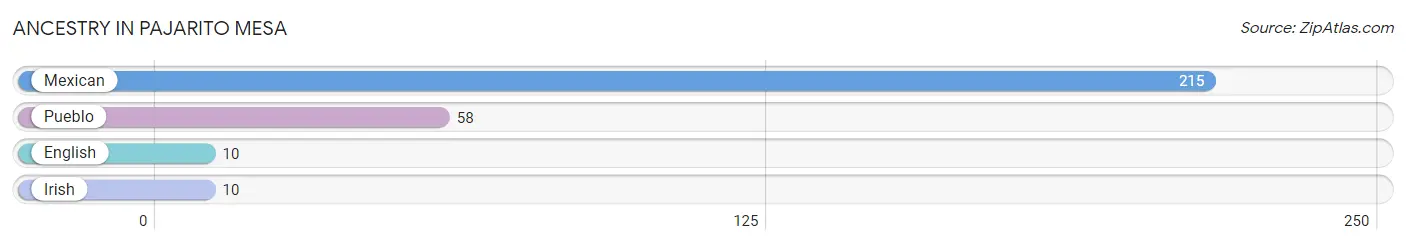
| Ancestry | # Population | % Population |
| English | 10 | 4.4% |
| Irish | 10 | 4.4% |
| Mexican | 215 | 95.6% |
| Pueblo | 58 | 25.8% | View All 4 Rows |
Immigrants in Pajarito Mesa
The most numerous immigrant groups reported in Pajarito Mesa came from Central America (42 | 18.7%), Latin America (42 | 18.7%), and Mexico (42 | 18.7%), together accounting for 56.0% of all Pajarito Mesa residents.
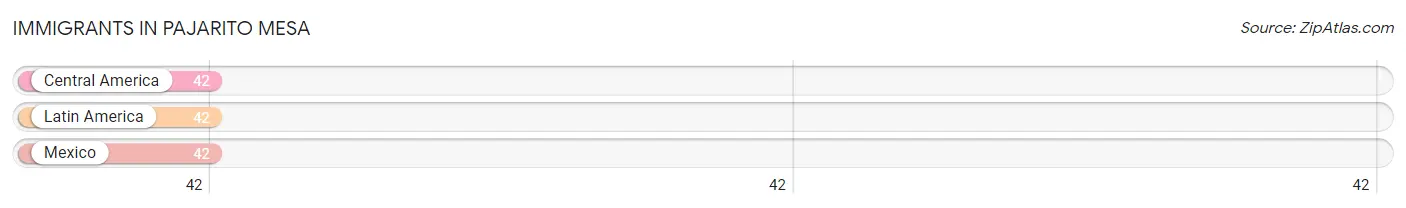
| Immigration Origin | # Population | % Population |
| Central America | 42 | 18.7% |
| Latin America | 42 | 18.7% |
| Mexico | 42 | 18.7% | View All 3 Rows |
Sex and Age in Pajarito Mesa
Sex and Age in Pajarito Mesa
The most populous age groups in Pajarito Mesa are 45 to 49 Years (58 | 43.6%) for men and 40 to 44 Years (60 | 65.2%) for women.
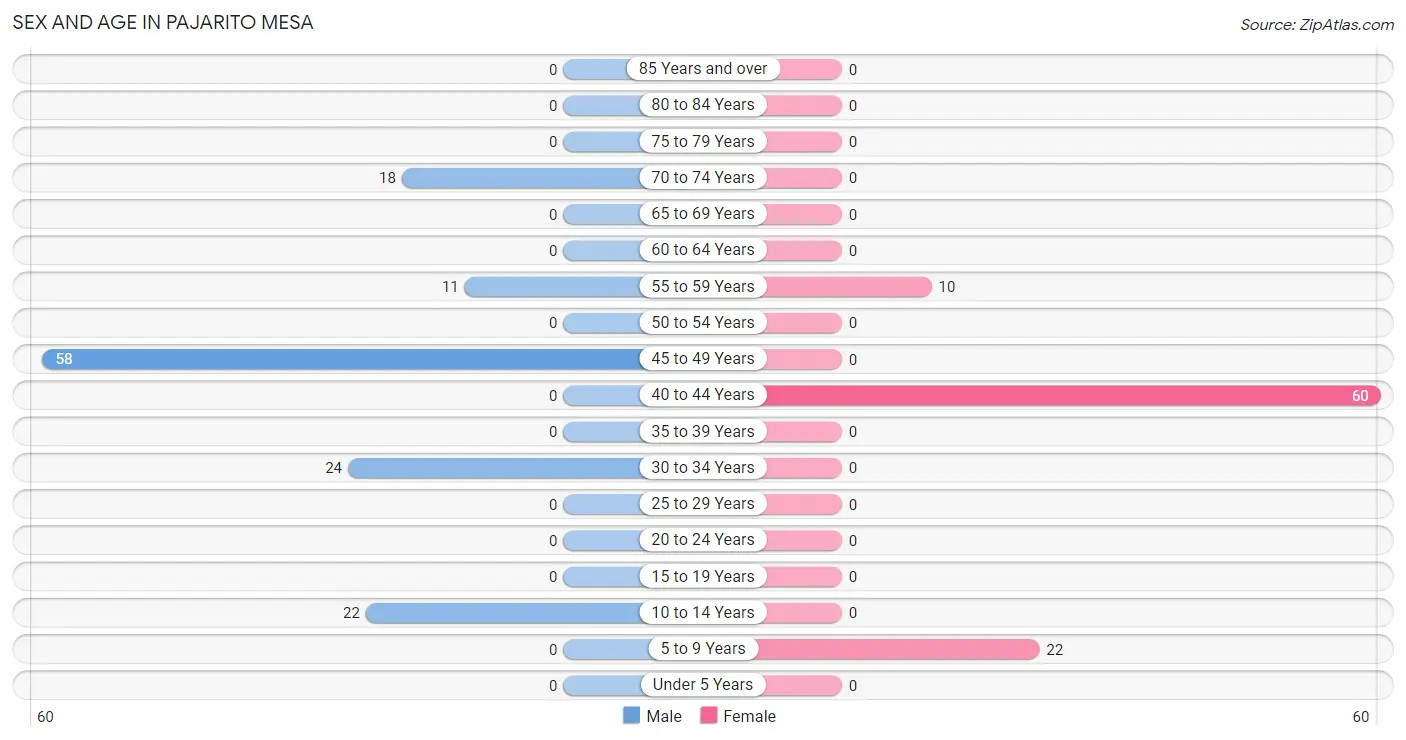
| Age Bracket | Male | Female |
| Under 5 Years | 0 (0.0%) | 0 (0.0%) |
| 5 to 9 Years | 0 (0.0%) | 22 (23.9%) |
| 10 to 14 Years | 22 (16.5%) | 0 (0.0%) |
| 15 to 19 Years | 0 (0.0%) | 0 (0.0%) |
| 20 to 24 Years | 0 (0.0%) | 0 (0.0%) |
| 25 to 29 Years | 0 (0.0%) | 0 (0.0%) |
| 30 to 34 Years | 24 (18.0%) | 0 (0.0%) |
| 35 to 39 Years | 0 (0.0%) | 0 (0.0%) |
| 40 to 44 Years | 0 (0.0%) | 60 (65.2%) |
| 45 to 49 Years | 58 (43.6%) | 0 (0.0%) |
| 50 to 54 Years | 0 (0.0%) | 0 (0.0%) |
| 55 to 59 Years | 11 (8.3%) | 10 (10.9%) |
| 60 to 64 Years | 0 (0.0%) | 0 (0.0%) |
| 65 to 69 Years | 0 (0.0%) | 0 (0.0%) |
| 70 to 74 Years | 18 (13.5%) | 0 (0.0%) |
| 75 to 79 Years | 0 (0.0%) | 0 (0.0%) |
| 80 to 84 Years | 0 (0.0%) | 0 (0.0%) |
| 85 Years and over | 0 (0.0%) | 0 (0.0%) |
| Total | 133 (100.0%) | 92 (100.0%) |
Families and Households in Pajarito Mesa
Median Family Size in Pajarito Mesa
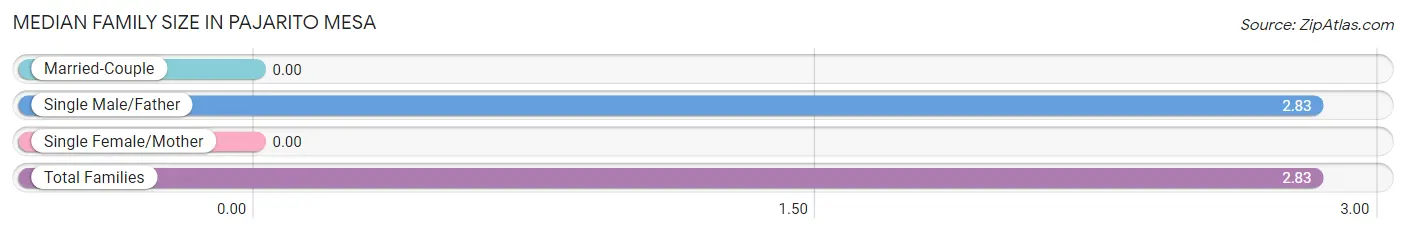
| Family Type | # Families | Family Size |
| Married-Couple | 0 (0.0%) | - |
| Single Male/Father | 24 (100.0%) | 2.83 |
| Single Female/Mother | 0 (0.0%) | - |
| Total Families | 24 (100.0%) | 2.83 |
Median Household Size in Pajarito Mesa
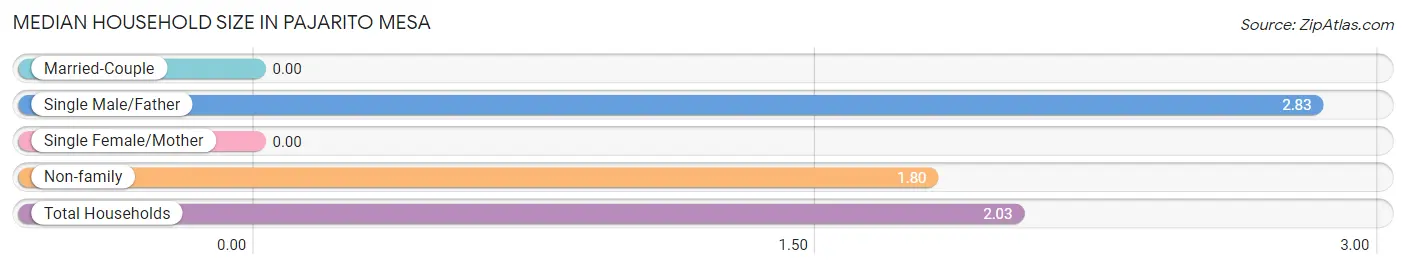
| Household Type | # Households | Household Size |
| Married-Couple | 0 (0.0%) | - |
| Single Male/Father | 24 (21.6%) | 2.83 |
| Single Female/Mother | 0 (0.0%) | - |
| Non-family | 87 (78.4%) | 1.80 |
| Total Households | 111 (100.0%) | 2.03 |
Household Size by Marriage Status in Pajarito Mesa
Out of a total of 111 households in Pajarito Mesa, 24 (21.6%) are family households, while 87 (78.4%) are nonfamily households. The most numerous type of family households are 3-person households, comprising 24, and the most common type of nonfamily households are 2-person households, comprising 69.
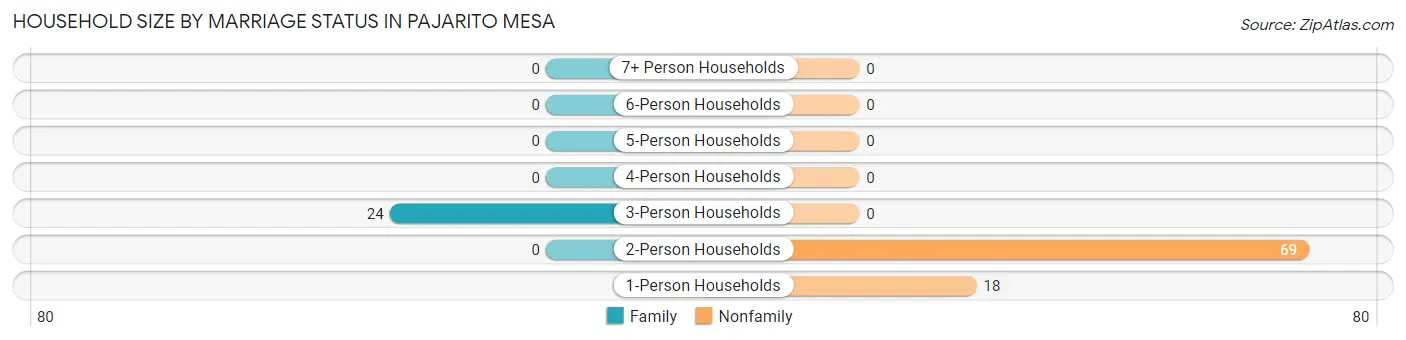
| Household Size | Family Households | Nonfamily Households |
| 1-Person Households | - | 18 (16.2%) |
| 2-Person Households | 0 (0.0%) | 69 (62.2%) |
| 3-Person Households | 24 (21.6%) | 0 (0.0%) |
| 4-Person Households | 0 (0.0%) | 0 (0.0%) |
| 5-Person Households | 0 (0.0%) | 0 (0.0%) |
| 6-Person Households | 0 (0.0%) | 0 (0.0%) |
| 7+ Person Households | 0 (0.0%) | 0 (0.0%) |
| Total | 24 (21.6%) | 87 (78.4%) |
Female Fertility in Pajarito Mesa
Fertility by Age in Pajarito Mesa
| Age Bracket | Women with Births | Births / 1,000 Women |
| 15 to 19 years | 0 (0.0%) | 0.0 |
| 20 to 34 years | 0 (0.0%) | 0.0 |
| 35 to 50 years | 0 (0.0%) | 0.0 |
| Total | 0 (0.0%) | 0.0 |
Fertility by Age by Marriage Status in Pajarito Mesa
| Age Bracket | Married | Unmarried |
| 15 to 19 years | 0 (0.0%) | 0 (0.0%) |
| 20 to 34 years | 0 (0.0%) | 0 (0.0%) |
| 35 to 50 years | 0 (0.0%) | 0 (0.0%) |
| Total | 0 (0.0%) | 0 (0.0%) |
Fertility by Education in Pajarito Mesa
| Educational Attainment | Women with Births | Births / 1,000 Women |
| Less than High School | 0 (0.0%) | 0.0 |
| High School Diploma | 0 (0.0%) | 0.0 |
| College or Associate's Degree | 0 (0.0%) | 0.0 |
| Bachelor's Degree | 0 (0.0%) | 0.0 |
| Graduate Degree | 0 (0.0%) | 0.0 |
| Total | 0 (0.0%) | 0.0 |
Fertility by Education by Marriage Status in Pajarito Mesa
| Educational Attainment | Married | Unmarried |
| Less than High School | 0 (0.0%) | 0 (0.0%) |
| High School Diploma | 0 (0.0%) | 0 (0.0%) |
| College or Associate's Degree | 0 (0.0%) | 0 (0.0%) |
| Bachelor's Degree | 0 (0.0%) | 0 (0.0%) |
| Graduate Degree | 0 (0.0%) | 0 (0.0%) |
| Total | 0 (0.0%) | 0 (0.0%) |
Employment Characteristics in Pajarito Mesa
Employment by Class of Employer in Pajarito Mesa
Among the 58 employed individuals in Pajarito Mesa, , and self-employed (not incorporated) (58 | 100.0%) make up the most common classes of employment.
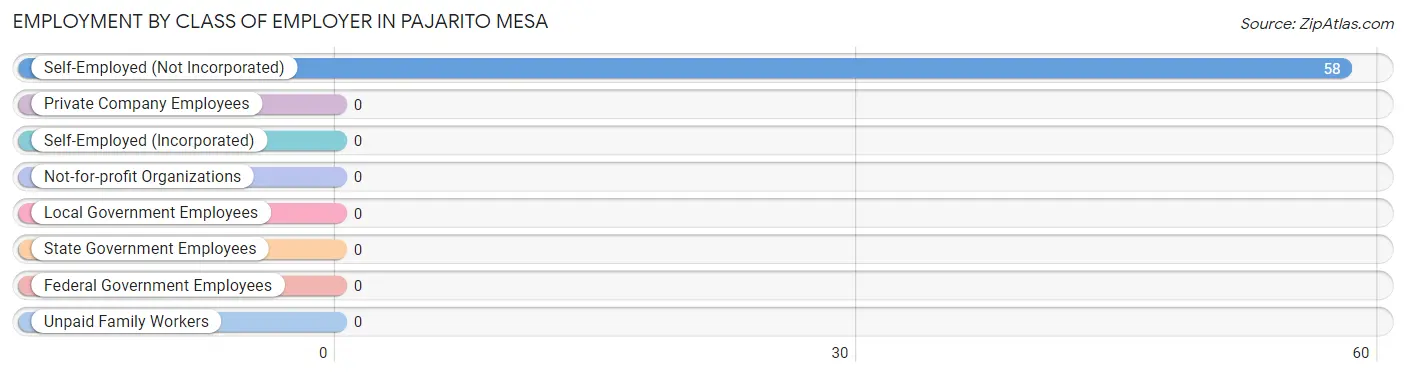
| Employer Class | # Employees | % Employees |
| Private Company Employees | 0 | 0.0% |
| Self-Employed (Incorporated) | 0 | 0.0% |
| Self-Employed (Not Incorporated) | 58 | 100.0% |
| Not-for-profit Organizations | 0 | 0.0% |
| Local Government Employees | 0 | 0.0% |
| State Government Employees | 0 | 0.0% |
| Federal Government Employees | 0 | 0.0% |
| Unpaid Family Workers | 0 | 0.0% |
| Total | 58 | 100.0% |
Employment Status by Age in Pajarito Mesa
According to the labor force statistics for Pajarito Mesa, out of the total population over 16 years of age (181), 65.2% or 118 individuals are in the labor force, with 50.8% or 60 of them unemployed. The age group with the highest labor force participation rate is 35 to 44 years, with 100.0% or 60 individuals in the labor force. Within the labor force, the 35 to 44 years age range has the highest percentage of unemployed individuals, with 100.0% or 60 of them being unemployed.
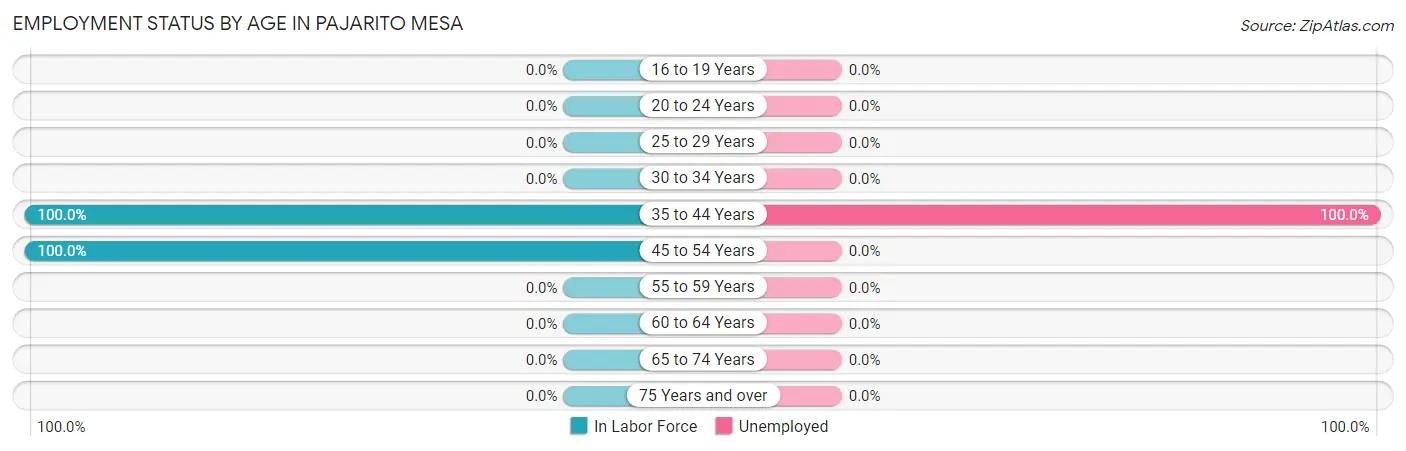
| Age Bracket | In Labor Force | Unemployed |
| 16 to 19 Years | 0 (0.0%) | 0 (0.0%) |
| 20 to 24 Years | 0 (0.0%) | 0 (0.0%) |
| 25 to 29 Years | 0 (0.0%) | 0 (0.0%) |
| 30 to 34 Years | 0 (0.0%) | 0 (0.0%) |
| 35 to 44 Years | 60 (100.0%) | 60 (100.0%) |
| 45 to 54 Years | 58 (100.0%) | 0 (0.0%) |
| 55 to 59 Years | 0 (0.0%) | 0 (0.0%) |
| 60 to 64 Years | 0 (0.0%) | 0 (0.0%) |
| 65 to 74 Years | 0 (0.0%) | 0 (0.0%) |
| 75 Years and over | 0 (0.0%) | 0 (0.0%) |
| Total | 118 (65.2%) | 60 (50.8%) |
Employment Status by Educational Attainment in Pajarito Mesa
According to labor force statistics for Pajarito Mesa, 72.4% of individuals (118) out of the total population between 25 and 64 years of age (163) are in the labor force, with 50.8% or 60 of them being unemployed. The group with the highest labor force participation rate are those with the educational attainment of high school diploma, with 85.7% or 60 individuals in the labor force. Within the labor force, individuals with high school diploma education have the highest percentage of unemployment, with 100.0% or 60 of them being unemployed.
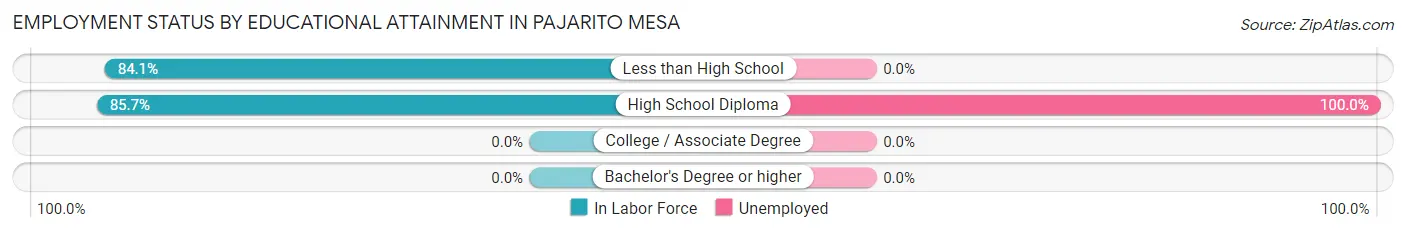
| Educational Attainment | In Labor Force | Unemployed |
| Less than High School | 58 (84.1%) | 0 (0.0%) |
| High School Diploma | 60 (85.7%) | 70 (100.0%) |
| College / Associate Degree | 0 (0.0%) | 0 (0.0%) |
| Bachelor's Degree or higher | 0 (0.0%) | 0 (0.0%) |
| Total | 118 (72.4%) | 83 (50.8%) |
Employment Occupations by Sex in Pajarito Mesa
Management, Business, Science and Arts Occupations
Management, Business, Science and Arts Occupations by Sex
| Occupation | Male | Female |
| Management | 0 (0.0%) | 0 (0.0%) |
| Business & Financial | 0 (0.0%) | 0 (0.0%) |
| Computers, Engineering & Science | 0 (0.0%) | 0 (0.0%) |
| Computers & Mathematics | 0 (0.0%) | 0 (0.0%) |
| Architecture & Engineering | 0 (0.0%) | 0 (0.0%) |
| Life, Physical & Social Science | 0 (0.0%) | 0 (0.0%) |
| Community & Social Service | 0 (0.0%) | 0 (0.0%) |
| Education, Arts & Media | 0 (0.0%) | 0 (0.0%) |
| Legal Services & Support | 0 (0.0%) | 0 (0.0%) |
| Education Instruction & Library | 0 (0.0%) | 0 (0.0%) |
| Arts, Media & Entertainment | 0 (0.0%) | 0 (0.0%) |
| Health Diagnosing & Treating | 0 (0.0%) | 0 (0.0%) |
| Health Technologists | 0 (0.0%) | 0 (0.0%) |
| Total (Category) | 0 (0.0%) | 0 (0.0%) |
| Total (Overall) | 58 (100.0%) | 0 (0.0%) |
Services Occupations
Services Occupations by Sex
| Occupation | Male | Female |
| Healthcare Support | 0 (0.0%) | 0 (0.0%) |
| Security & Protection | 0 (0.0%) | 0 (0.0%) |
| Firefighting & Prevention | 0 (0.0%) | 0 (0.0%) |
| Law Enforcement | 0 (0.0%) | 0 (0.0%) |
| Food Preparation & Serving | 0 (0.0%) | 0 (0.0%) |
| Cleaning & Maintenance | 0 (0.0%) | 0 (0.0%) |
| Personal Care & Service | 0 (0.0%) | 0 (0.0%) |
| Total (Category) | 0 (0.0%) | 0 (0.0%) |
| Total (Overall) | 58 (100.0%) | 0 (0.0%) |
Sales and Office Occupations
Sales and Office Occupations by Sex
| Occupation | Male | Female |
| Sales & Related | 0 (0.0%) | 0 (0.0%) |
| Office & Administration | 0 (0.0%) | 0 (0.0%) |
| Total (Category) | 0 (0.0%) | 0 (0.0%) |
| Total (Overall) | 58 (100.0%) | 0 (0.0%) |
Natural Resources, Construction and Maintenance Occupations
The most common Natural Resources, Construction and Maintenance occupations in Pajarito Mesa are , and Installation, Maintenance & Repair (58 | 100.0%).
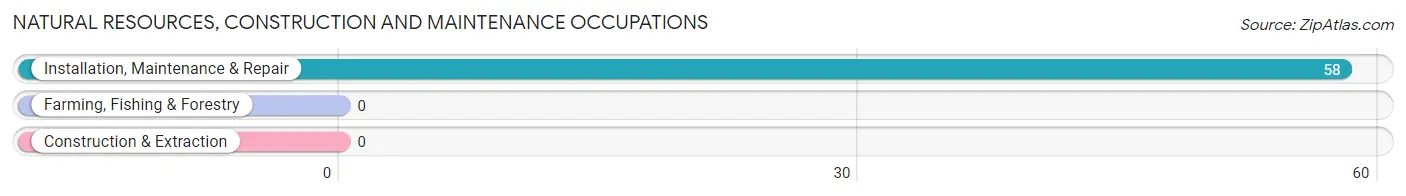
Natural Resources, Construction and Maintenance Occupations by Sex
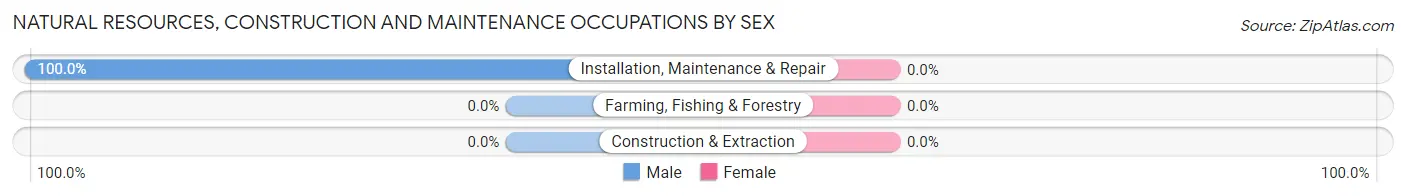
| Occupation | Male | Female |
| Farming, Fishing & Forestry | 0 (0.0%) | 0 (0.0%) |
| Construction & Extraction | 0 (0.0%) | 0 (0.0%) |
| Installation, Maintenance & Repair | 58 (100.0%) | 0 (0.0%) |
| Total (Category) | 58 (100.0%) | 0 (0.0%) |
| Total (Overall) | 58 (100.0%) | 0 (0.0%) |
Production, Transportation and Moving Occupations
Production, Transportation and Moving Occupations by Sex
| Occupation | Male | Female |
| Production | 0 (0.0%) | 0 (0.0%) |
| Transportation | 0 (0.0%) | 0 (0.0%) |
| Material Moving | 0 (0.0%) | 0 (0.0%) |
| Total (Category) | 0 (0.0%) | 0 (0.0%) |
| Total (Overall) | 58 (100.0%) | 0 (0.0%) |
Employment Industries by Sex in Pajarito Mesa
Employment Industries in Pajarito Mesa
Employment Industries by Sex in Pajarito Mesa
| Industry | Male | Female |
| Agriculture, Fishing & Hunting | 0 (0.0%) | 0 (0.0%) |
| Mining, Quarrying, & Extraction | 0 (0.0%) | 0 (0.0%) |
| Construction | 0 (0.0%) | 0 (0.0%) |
| Manufacturing | 0 (0.0%) | 0 (0.0%) |
| Wholesale Trade | 0 (0.0%) | 0 (0.0%) |
| Retail Trade | 0 (0.0%) | 0 (0.0%) |
| Transportation & Warehousing | 0 (0.0%) | 0 (0.0%) |
| Utilities | 0 (0.0%) | 0 (0.0%) |
| Information | 0 (0.0%) | 0 (0.0%) |
| Finance & Insurance | 0 (0.0%) | 0 (0.0%) |
| Real Estate, Rental & Leasing | 0 (0.0%) | 0 (0.0%) |
| Professional & Scientific | 0 (0.0%) | 0 (0.0%) |
| Enterprise Management | 0 (0.0%) | 0 (0.0%) |
| Administrative & Support | 0 (0.0%) | 0 (0.0%) |
| Educational Services | 0 (0.0%) | 0 (0.0%) |
| Health Care & Social Assistance | 0 (0.0%) | 0 (0.0%) |
| Arts, Entertainment & Recreation | 0 (0.0%) | 0 (0.0%) |
| Accommodation & Food Services | 0 (0.0%) | 0 (0.0%) |
| Public Administration | 0 (0.0%) | 0 (0.0%) |
| Total | 58 (100.0%) | 0 (0.0%) |
Education in Pajarito Mesa
School Enrollment in Pajarito Mesa
The most common levels of schooling among the 44 students in Pajarito Mesa are elementary school (22 | 50.0%), and middle school (22 | 50.0%).
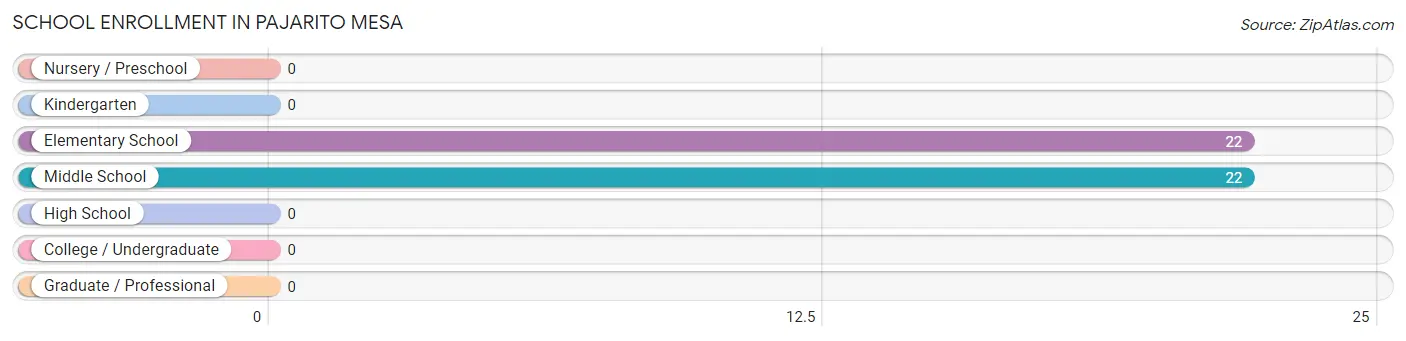
| School Level | # Students | % Students |
| Nursery / Preschool | 0 | 0.0% |
| Kindergarten | 0 | 0.0% |
| Elementary School | 22 | 50.0% |
| Middle School | 22 | 50.0% |
| High School | 0 | 0.0% |
| College / Undergraduate | 0 | 0.0% |
| Graduate / Professional | 0 | 0.0% |
| Total | 44 | 100.0% |
School Enrollment by Age by Funding Source in Pajarito Mesa
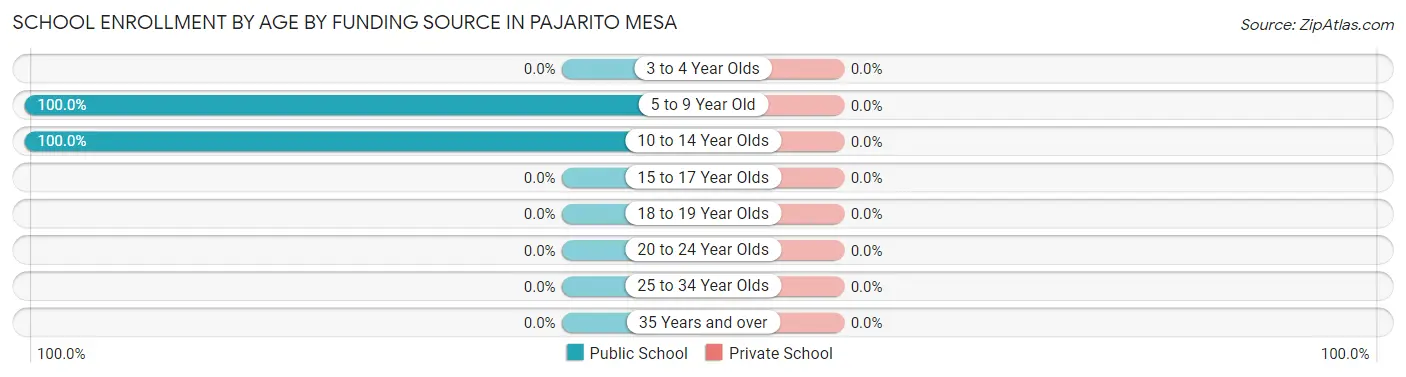
| Age Bracket | Public School | Private School |
| 3 to 4 Year Olds | 0 (0.0%) | 0 (0.0%) |
| 5 to 9 Year Old | 22 (100.0%) | 0 (0.0%) |
| 10 to 14 Year Olds | 22 (100.0%) | 0 (0.0%) |
| 15 to 17 Year Olds | 0 (0.0%) | 0 (0.0%) |
| 18 to 19 Year Olds | 0 (0.0%) | 0 (0.0%) |
| 20 to 24 Year Olds | 0 (0.0%) | 0 (0.0%) |
| 25 to 34 Year Olds | 0 (0.0%) | 0 (0.0%) |
| 35 Years and over | 0 (0.0%) | 0 (0.0%) |
| Total | 44 (100.0%) | 0 (0.0%) |
Educational Attainment by Field of Study in Pajarito Mesa
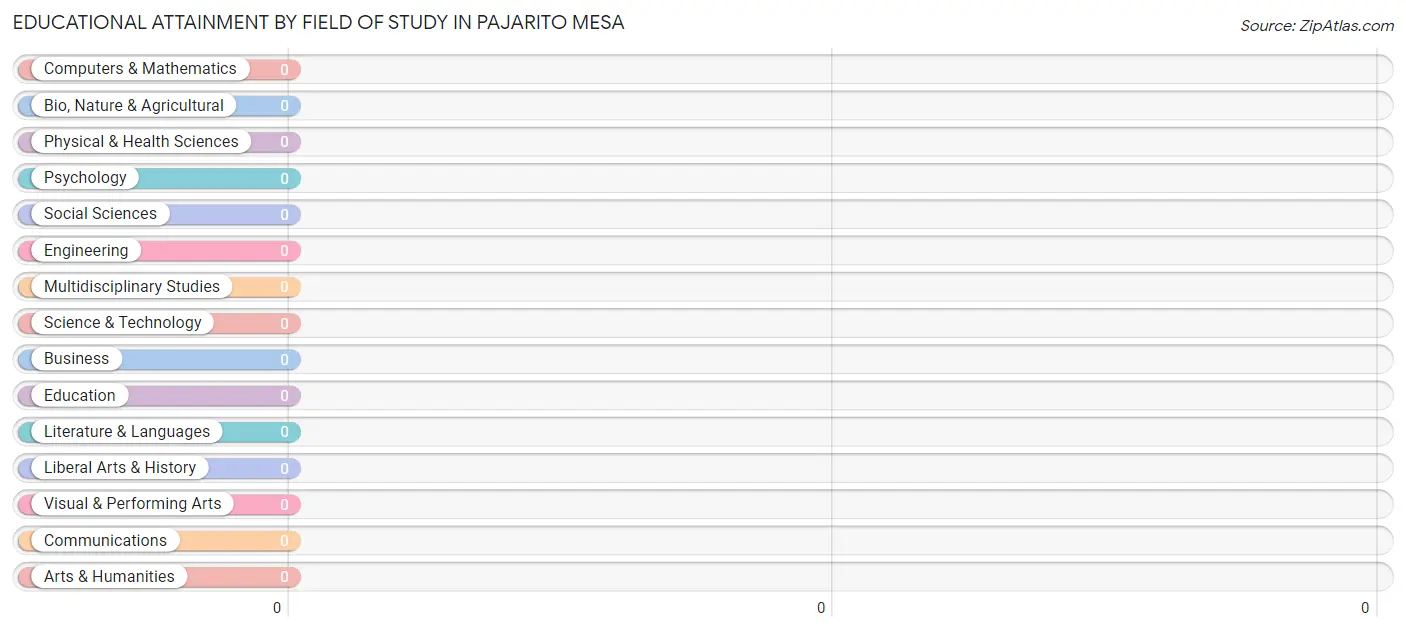
| Field of Study | # Graduates | % Graduates |
| Computers & Mathematics | 0 | 0.0% |
| Bio, Nature & Agricultural | 0 | 0.0% |
| Physical & Health Sciences | 0 | 0.0% |
| Psychology | 0 | 0.0% |
| Social Sciences | 0 | 0.0% |
| Engineering | 0 | 0.0% |
| Multidisciplinary Studies | 0 | 0.0% |
| Science & Technology | 0 | 0.0% |
| Business | 0 | 0.0% |
| Education | 0 | 0.0% |
| Literature & Languages | 0 | 0.0% |
| Liberal Arts & History | 0 | 0.0% |
| Visual & Performing Arts | 0 | 0.0% |
| Communications | 0 | 0.0% |
| Arts & Humanities | 0 | 0.0% |
| Total | 0 | 0.0% |
Transportation & Commute in Pajarito Mesa
Vehicle Availability by Sex in Pajarito Mesa
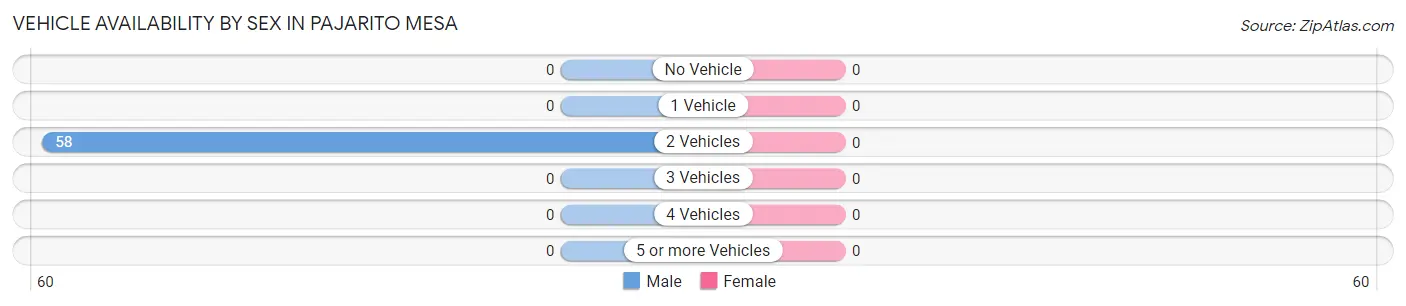
| Vehicles Available | Male | Female |
| No Vehicle | 0 (0.0%) | 0 (0.0%) |
| 1 Vehicle | 0 (0.0%) | 0 (0.0%) |
| 2 Vehicles | 58 (100.0%) | 0 (0.0%) |
| 3 Vehicles | 0 (0.0%) | 0 (0.0%) |
| 4 Vehicles | 0 (0.0%) | 0 (0.0%) |
| 5 or more Vehicles | 0 (0.0%) | 0 (0.0%) |
| Total | 58 (100.0%) | 0 (0.0%) |
Commute Time in Pajarito Mesa
| Commute Time | # Commuters | % Commuters |
| Less than 5 Minutes | 0 | 0.0% |
| 5 to 9 Minutes | 0 | 0.0% |
| 10 to 14 Minutes | 0 | 0.0% |
| 15 to 19 Minutes | 0 | 0.0% |
| 20 to 24 Minutes | 0 | 0.0% |
| 25 to 29 Minutes | 0 | 0.0% |
| 30 to 34 Minutes | 0 | 0.0% |
| 35 to 39 Minutes | 0 | 0.0% |
| 40 to 44 Minutes | 0 | 0.0% |
| 45 to 59 Minutes | 0 | 0.0% |
| 60 to 89 Minutes | 0 | 0.0% |
| 90 or more Minutes | 0 | 0.0% |
Commute Time by Sex in Pajarito Mesa
| Commute Time | Male | Female |
| Less than 5 Minutes | 0 (0.0%) | 0 (0.0%) |
| 5 to 9 Minutes | 0 (0.0%) | 0 (0.0%) |
| 10 to 14 Minutes | 0 (0.0%) | 0 (0.0%) |
| 15 to 19 Minutes | 0 (0.0%) | 0 (0.0%) |
| 20 to 24 Minutes | 0 (0.0%) | 0 (0.0%) |
| 25 to 29 Minutes | 0 (0.0%) | 0 (0.0%) |
| 30 to 34 Minutes | 0 (0.0%) | 0 (0.0%) |
| 35 to 39 Minutes | 0 (0.0%) | 0 (0.0%) |
| 40 to 44 Minutes | 0 (0.0%) | 0 (0.0%) |
| 45 to 59 Minutes | 0 (0.0%) | 0 (0.0%) |
| 60 to 89 Minutes | 0 (0.0%) | 0 (0.0%) |
| 90 or more Minutes | 0 (0.0%) | 0 (0.0%) |
Time of Departure to Work by Sex in Pajarito Mesa
| Time of Departure | Male | Female |
| 12:00 AM to 4:59 AM | 0 (0.0%) | 0 (0.0%) |
| 5:00 AM to 5:29 AM | 0 (0.0%) | 0 (0.0%) |
| 5:30 AM to 5:59 AM | 0 (0.0%) | 0 (0.0%) |
| 6:00 AM to 6:29 AM | 0 (0.0%) | 0 (0.0%) |
| 6:30 AM to 6:59 AM | 0 (0.0%) | 0 (0.0%) |
| 7:00 AM to 7:29 AM | 0 (0.0%) | 0 (0.0%) |
| 7:30 AM to 7:59 AM | 0 (0.0%) | 0 (0.0%) |
| 8:00 AM to 8:29 AM | 0 (0.0%) | 0 (0.0%) |
| 8:30 AM to 8:59 AM | 0 (0.0%) | 0 (0.0%) |
| 9:00 AM to 9:59 AM | 0 (0.0%) | 0 (0.0%) |
| 10:00 AM to 10:59 AM | 0 (0.0%) | 0 (0.0%) |
| 11:00 AM to 11:59 AM | 0 (0.0%) | 0 (0.0%) |
| 12:00 PM to 3:59 PM | 0 (0.0%) | 0 (0.0%) |
| 4:00 PM to 11:59 PM | 0 (0.0%) | 0 (0.0%) |
| Total | 0 (0.0%) | 0 (0.0%) |
Housing Occupancy in Pajarito Mesa
Occupancy by Ownership in Pajarito Mesa
Of the total 111 dwellings in Pajarito Mesa, owner-occupied units account for 111 (100.0%), while renter-occupied units make up 0 (0.0%).
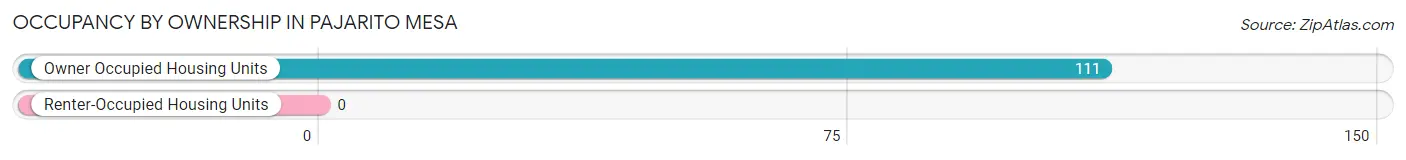
| Occupancy | # Housing Units | % Housing Units |
| Owner Occupied Housing Units | 111 | 100.0% |
| Renter-Occupied Housing Units | 0 | 0.0% |
| Total Occupied Housing Units | 111 | 100.0% |
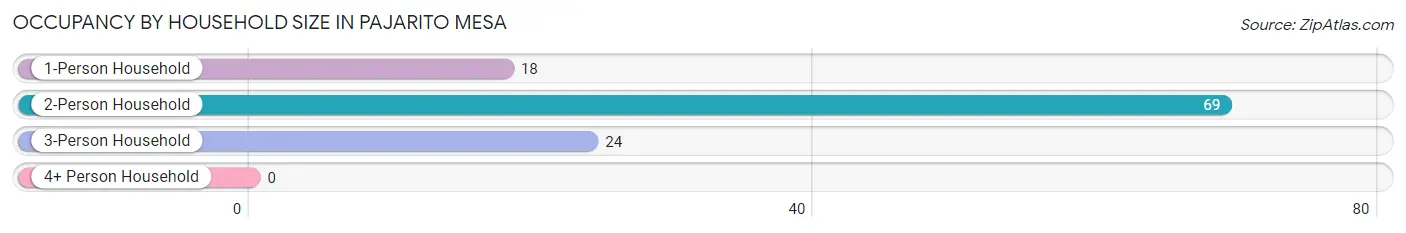
Occupancy by Household Size in Pajarito Mesa
| Household Size | # Housing Units | % Housing Units |
| 1-Person Household | 18 | 16.2% |
| 2-Person Household | 69 | 62.2% |
| 3-Person Household | 24 | 21.6% |
| 4+ Person Household | 0 | 0.0% |
| Total Housing Units | 111 | 100.0% |
Occupancy by Ownership by Household Size in Pajarito Mesa
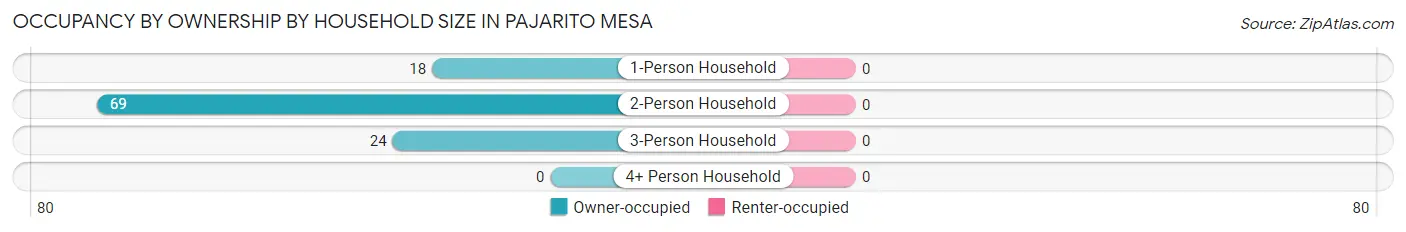
| Household Size | Owner-occupied | Renter-occupied |
| 1-Person Household | 18 (100.0%) | 0 (0.0%) |
| 2-Person Household | 69 (100.0%) | 0 (0.0%) |
| 3-Person Household | 24 (100.0%) | 0 (0.0%) |
| 4+ Person Household | 0 (0.0%) | 0 (0.0%) |
| Total Housing Units | 111 (100.0%) | 0 (0.0%) |
Occupancy by Educational Attainment in Pajarito Mesa
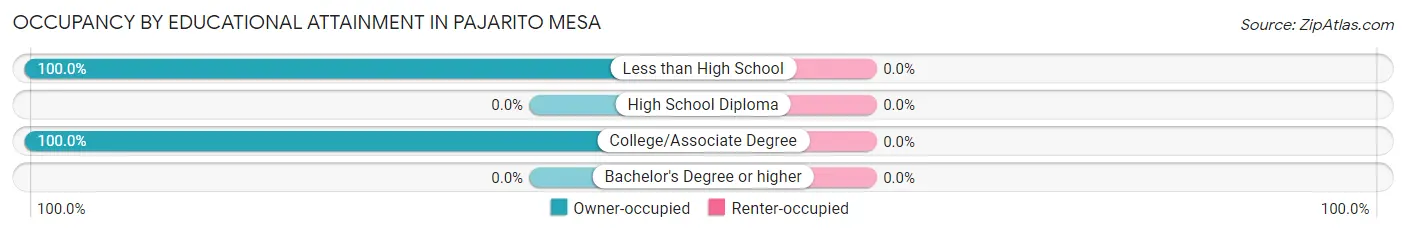
| Household Size | Owner-occupied | Renter-occupied |
| Less than High School | 87 (100.0%) | 0 (0.0%) |
| High School Diploma | 0 (0.0%) | 0 (0.0%) |
| College/Associate Degree | 24 (100.0%) | 0 (0.0%) |
| Bachelor's Degree or higher | 0 (0.0%) | 0 (0.0%) |
Occupancy by Age of Householder in Pajarito Mesa
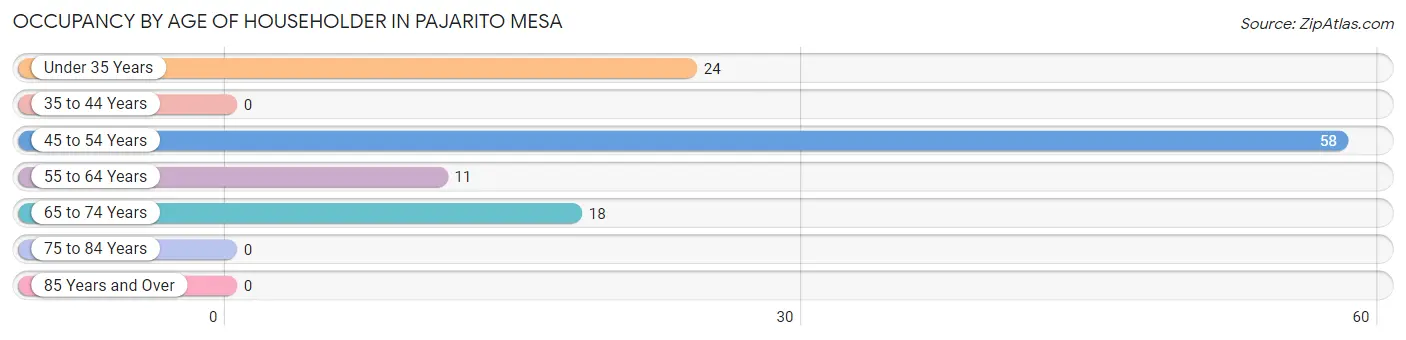
| Age Bracket | # Households | % Households |
| Under 35 Years | 24 | 21.6% |
| 35 to 44 Years | 0 | 0.0% |
| 45 to 54 Years | 58 | 52.2% |
| 55 to 64 Years | 11 | 9.9% |
| 65 to 74 Years | 18 | 16.2% |
| 75 to 84 Years | 0 | 0.0% |
| 85 Years and Over | 0 | 0.0% |
| Total | 111 | 100.0% |
Housing Finances in Pajarito Mesa
Median Income by Occupancy in Pajarito Mesa
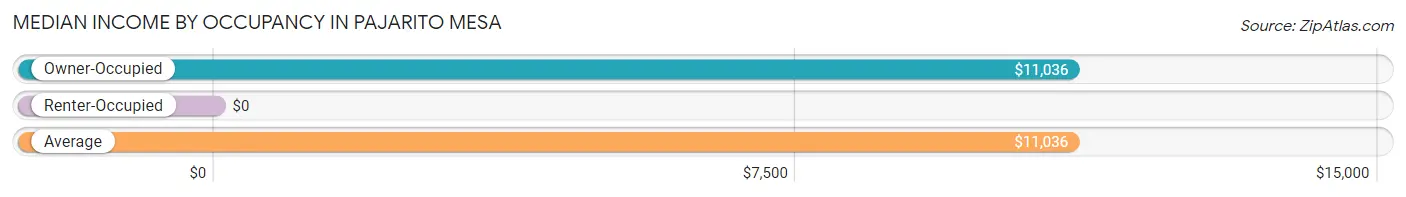
| Occupancy Type | # Households | Median Income |
| Owner-Occupied | 111 (100.0%) | $11,036 |
| Renter-Occupied | 0 (0.0%) | $0 |
| Average | 111 (100.0%) | $11,036 |
Occupancy by Householder Income Bracket in Pajarito Mesa
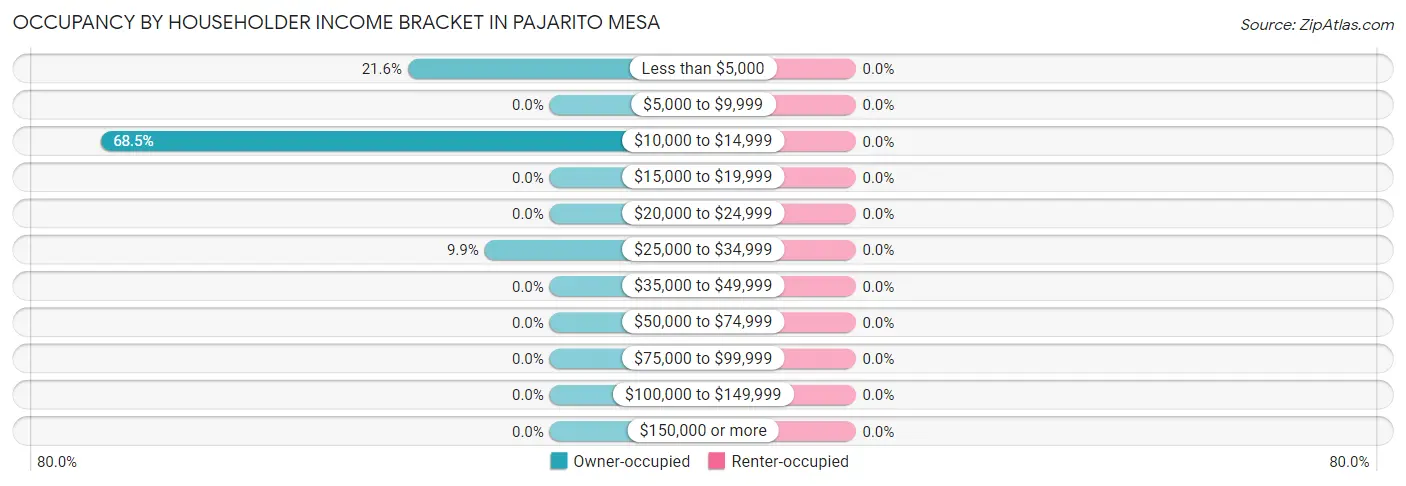
| Income Bracket | Owner-occupied | Renter-occupied |
| Less than $5,000 | 24 (21.6%) | 0 (0.0%) |
| $5,000 to $9,999 | 0 (0.0%) | 0 (0.0%) |
| $10,000 to $14,999 | 76 (68.5%) | 0 (0.0%) |
| $15,000 to $19,999 | 0 (0.0%) | 0 (0.0%) |
| $20,000 to $24,999 | 0 (0.0%) | 0 (0.0%) |
| $25,000 to $34,999 | 11 (9.9%) | 0 (0.0%) |
| $35,000 to $49,999 | 0 (0.0%) | 0 (0.0%) |
| $50,000 to $74,999 | 0 (0.0%) | 0 (0.0%) |
| $75,000 to $99,999 | 0 (0.0%) | 0 (0.0%) |
| $100,000 to $149,999 | 0 (0.0%) | 0 (0.0%) |
| $150,000 or more | 0 (0.0%) | 0 (0.0%) |
| Total | 111 (100.0%) | 0 (0.0%) |
Monthly Housing Cost Tiers in Pajarito Mesa
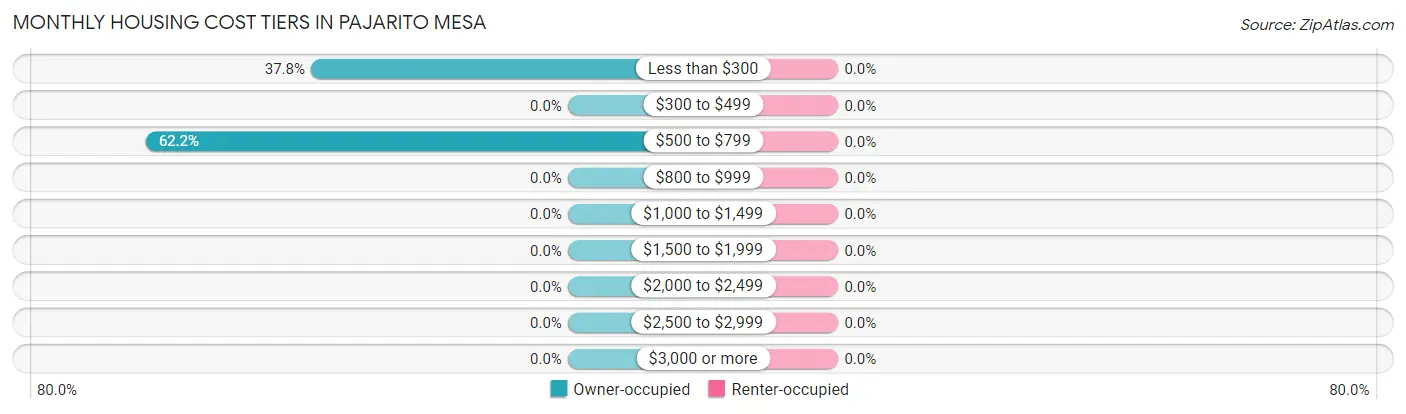
| Monthly Cost | Owner-occupied | Renter-occupied |
| Less than $300 | 42 (37.8%) | 0 (0.0%) |
| $300 to $499 | 0 (0.0%) | 0 (0.0%) |
| $500 to $799 | 69 (62.2%) | 0 (0.0%) |
| $800 to $999 | 0 (0.0%) | 0 (0.0%) |
| $1,000 to $1,499 | 0 (0.0%) | 0 (0.0%) |
| $1,500 to $1,999 | 0 (0.0%) | 0 (0.0%) |
| $2,000 to $2,499 | 0 (0.0%) | 0 (0.0%) |
| $2,500 to $2,999 | 0 (0.0%) | 0 (0.0%) |
| $3,000 or more | 0 (0.0%) | 0 (0.0%) |
| Total | 111 (100.0%) | 0 (0.0%) |
Physical Housing Characteristics in Pajarito Mesa
Housing Structures in Pajarito Mesa
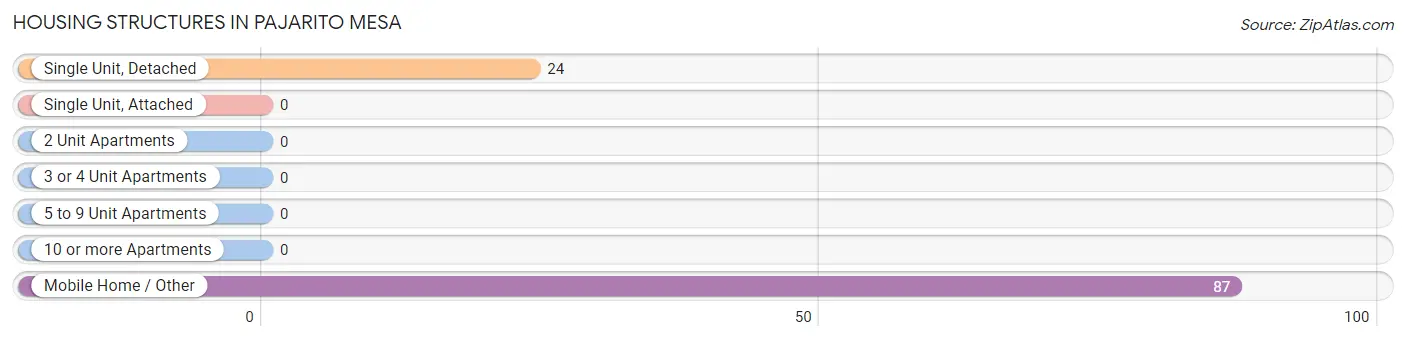
| Structure Type | # Housing Units | % Housing Units |
| Single Unit, Detached | 24 | 21.6% |
| Single Unit, Attached | 0 | 0.0% |
| 2 Unit Apartments | 0 | 0.0% |
| 3 or 4 Unit Apartments | 0 | 0.0% |
| 5 to 9 Unit Apartments | 0 | 0.0% |
| 10 or more Apartments | 0 | 0.0% |
| Mobile Home / Other | 87 | 78.4% |
| Total | 111 | 100.0% |
Housing Structures by Occupancy in Pajarito Mesa
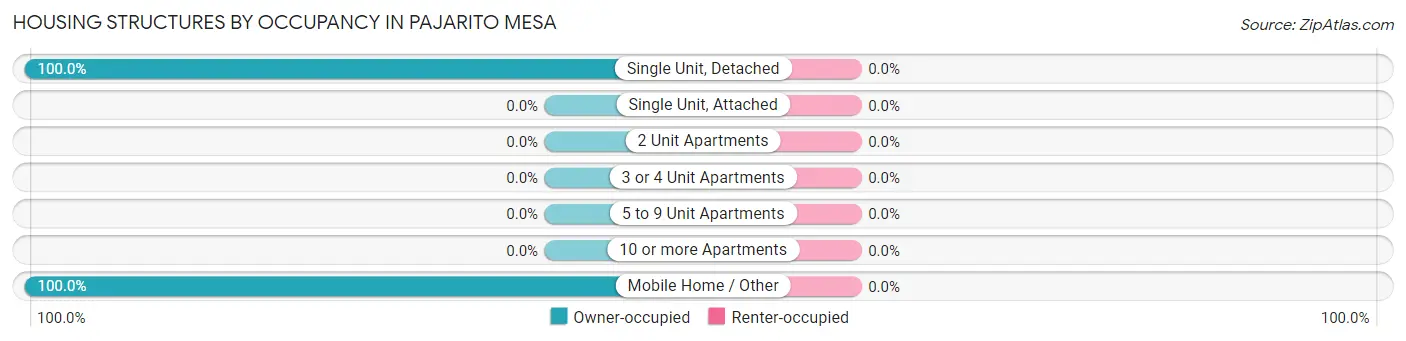
| Structure Type | Owner-occupied | Renter-occupied |
| Single Unit, Detached | 24 (100.0%) | 0 (0.0%) |
| Single Unit, Attached | 0 (0.0%) | 0 (0.0%) |
| 2 Unit Apartments | 0 (0.0%) | 0 (0.0%) |
| 3 or 4 Unit Apartments | 0 (0.0%) | 0 (0.0%) |
| 5 to 9 Unit Apartments | 0 (0.0%) | 0 (0.0%) |
| 10 or more Apartments | 0 (0.0%) | 0 (0.0%) |
| Mobile Home / Other | 87 (100.0%) | 0 (0.0%) |
| Total | 111 (100.0%) | 0 (0.0%) |
Housing Structures by Number of Rooms in Pajarito Mesa
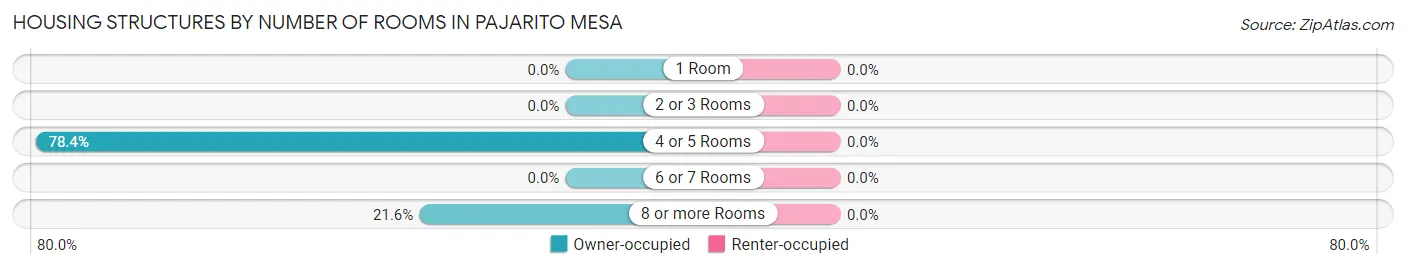
| Number of Rooms | Owner-occupied | Renter-occupied |
| 1 Room | 0 (0.0%) | 0 (0.0%) |
| 2 or 3 Rooms | 0 (0.0%) | 0 (0.0%) |
| 4 or 5 Rooms | 87 (78.4%) | 0 (0.0%) |
| 6 or 7 Rooms | 0 (0.0%) | 0 (0.0%) |
| 8 or more Rooms | 24 (21.6%) | 0 (0.0%) |
| Total | 111 (100.0%) | 0 (0.0%) |
Housing Structure by Heating Type in Pajarito Mesa
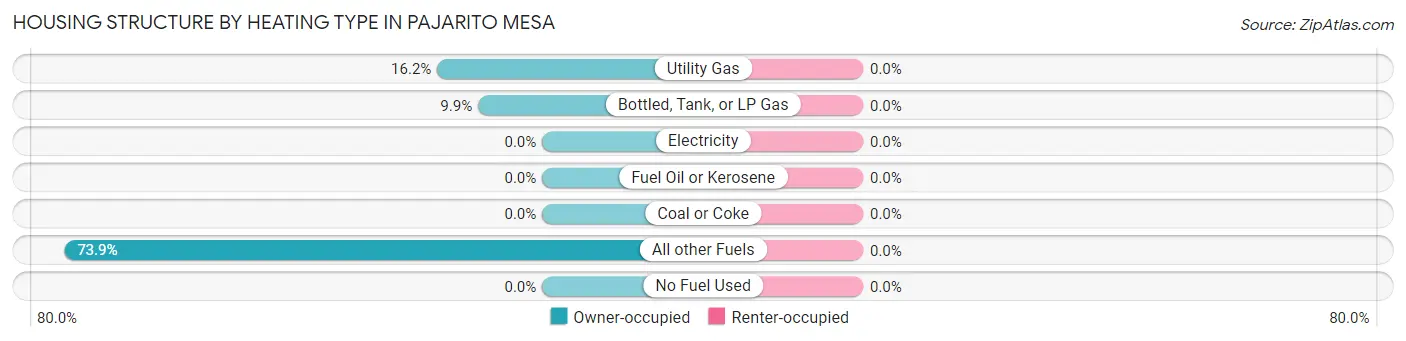
| Heating Type | Owner-occupied | Renter-occupied |
| Utility Gas | 18 (16.2%) | 0 (0.0%) |
| Bottled, Tank, or LP Gas | 11 (9.9%) | 0 (0.0%) |
| Electricity | 0 (0.0%) | 0 (0.0%) |
| Fuel Oil or Kerosene | 0 (0.0%) | 0 (0.0%) |
| Coal or Coke | 0 (0.0%) | 0 (0.0%) |
| All other Fuels | 82 (73.9%) | 0 (0.0%) |
| No Fuel Used | 0 (0.0%) | 0 (0.0%) |
| Total | 111 (100.0%) | 0 (0.0%) |
Household Vehicle Usage in Pajarito Mesa
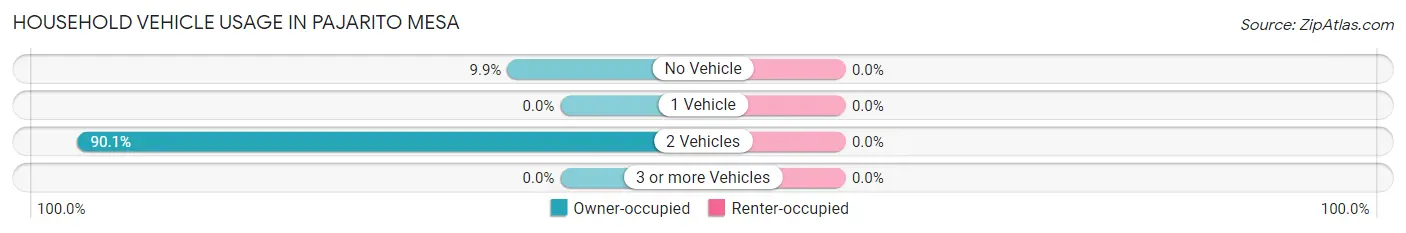
| Vehicles per Household | Owner-occupied | Renter-occupied |
| No Vehicle | 11 (9.9%) | 0 (0.0%) |
| 1 Vehicle | 0 (0.0%) | 0 (0.0%) |
| 2 Vehicles | 100 (90.1%) | 0 (0.0%) |
| 3 or more Vehicles | 0 (0.0%) | 0 (0.0%) |
| Total | 111 (100.0%) | 0 (0.0%) |
Real Estate & Mortgages in Pajarito Mesa
Real Estate and Mortgage Overview in Pajarito Mesa
| Characteristic | Without Mortgage | With Mortgage |
| Housing Units | 111 | 0 |
| Median Property Value | $55,900 | $0 |
| Median Household Income | $11,036 | $0 |
| Monthly Housing Costs | $704 | $0 |
| Real Estate Taxes | - | - |
Property Value by Mortgage Status in Pajarito Mesa
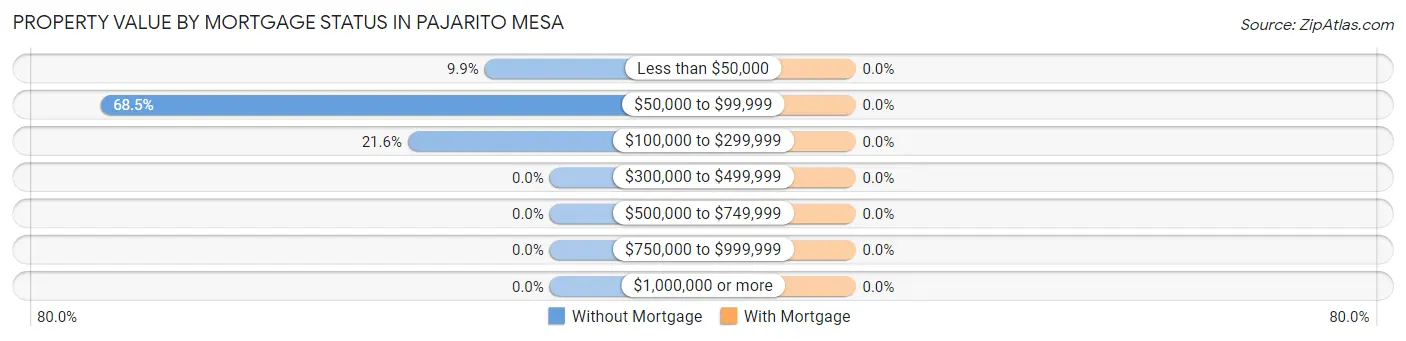
| Property Value | Without Mortgage | With Mortgage |
| Less than $50,000 | 11 (9.9%) | 0 (0.0%) |
| $50,000 to $99,999 | 76 (68.5%) | 0 (0.0%) |
| $100,000 to $299,999 | 24 (21.6%) | 0 (0.0%) |
| $300,000 to $499,999 | 0 (0.0%) | 0 (0.0%) |
| $500,000 to $749,999 | 0 (0.0%) | 0 (0.0%) |
| $750,000 to $999,999 | 0 (0.0%) | 0 (0.0%) |
| $1,000,000 or more | 0 (0.0%) | 0 (0.0%) |
| Total | 111 (100.0%) | 0 (0.0%) |
Household Income by Mortgage Status in Pajarito Mesa
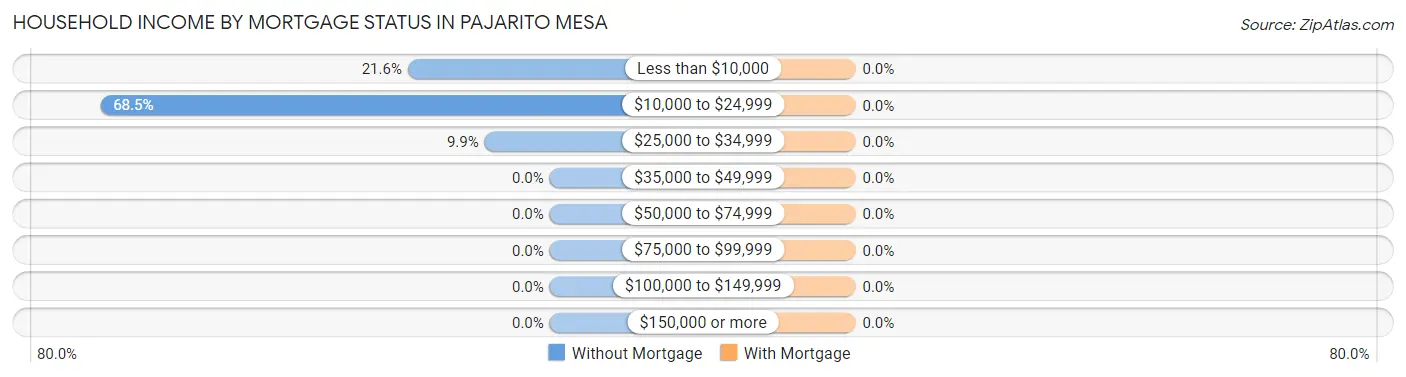
| Household Income | Without Mortgage | With Mortgage |
| Less than $10,000 | 24 (21.6%) | 0 (0.0%) |
| $10,000 to $24,999 | 76 (68.5%) | 0 (0.0%) |
| $25,000 to $34,999 | 11 (9.9%) | 0 (0.0%) |
| $35,000 to $49,999 | 0 (0.0%) | 0 (0.0%) |
| $50,000 to $74,999 | 0 (0.0%) | 0 (0.0%) |
| $75,000 to $99,999 | 0 (0.0%) | 0 (0.0%) |
| $100,000 to $149,999 | 0 (0.0%) | 0 (0.0%) |
| $150,000 or more | 0 (0.0%) | 0 (0.0%) |
| Total | 111 (100.0%) | 0 (0.0%) |
Property Value to Household Income Ratio in Pajarito Mesa
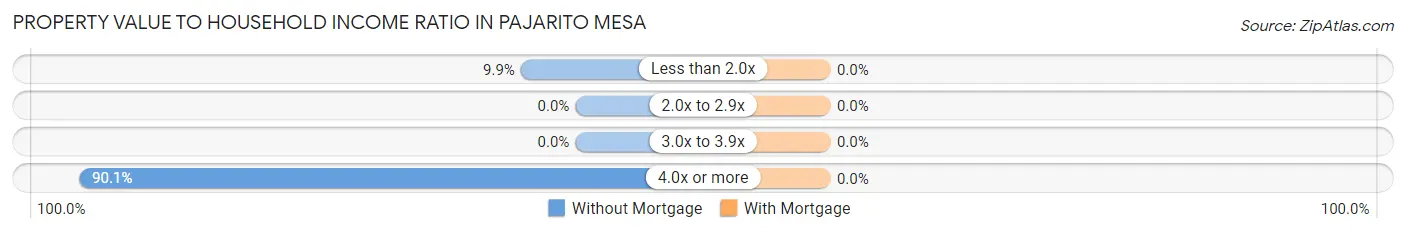
| Value-to-Income Ratio | Without Mortgage | With Mortgage |
| Less than 2.0x | 11 (9.9%) | 0 (0.0%) |
| 2.0x to 2.9x | 0 (0.0%) | 0 (0.0%) |
| 3.0x to 3.9x | 0 (0.0%) | 0 (0.0%) |
| 4.0x or more | 100 (90.1%) | 0 (0.0%) |
| Total | 111 (100.0%) | 0 (0.0%) |
Real Estate Taxes by Mortgage Status in Pajarito Mesa
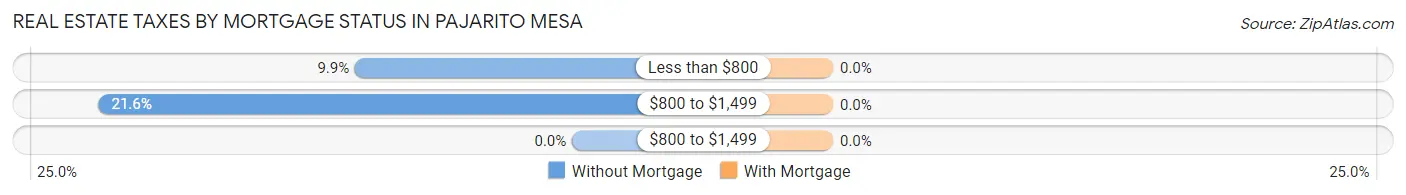
| Property Taxes | Without Mortgage | With Mortgage |
| Less than $800 | 11 (9.9%) | 0 (0.0%) |
| $800 to $1,499 | 24 (21.6%) | 0 (0.0%) |
| $800 to $1,499 | 0 (0.0%) | 0 (0.0%) |
| Total | 111 (100.0%) | 0 (0.0%) |
Health & Disability in Pajarito Mesa
Health Insurance Coverage by Age in Pajarito Mesa
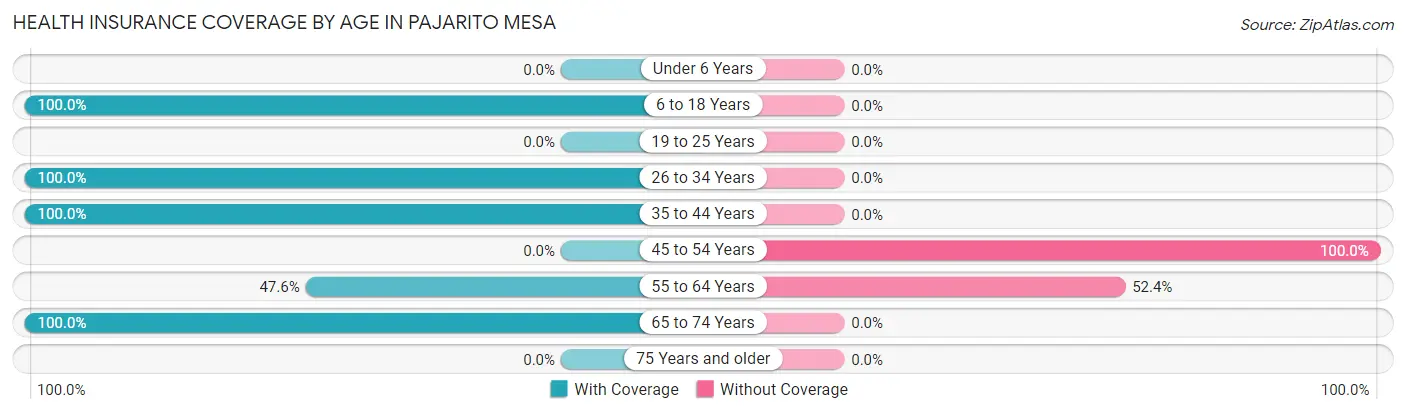
| Age Bracket | With Coverage | Without Coverage |
| Under 6 Years | 0 (0.0%) | 0 (0.0%) |
| 6 to 18 Years | 44 (100.0%) | 0 (0.0%) |
| 19 to 25 Years | 0 (0.0%) | 0 (0.0%) |
| 26 to 34 Years | 24 (100.0%) | 0 (0.0%) |
| 35 to 44 Years | 60 (100.0%) | 0 (0.0%) |
| 45 to 54 Years | 0 (0.0%) | 58 (100.0%) |
| 55 to 64 Years | 10 (47.6%) | 11 (52.4%) |
| 65 to 74 Years | 18 (100.0%) | 0 (0.0%) |
| 75 Years and older | 0 (0.0%) | 0 (0.0%) |
| Total | 156 (69.3%) | 69 (30.7%) |
Health Insurance Coverage by Citizenship Status in Pajarito Mesa

| Citizenship Status | With Coverage | Without Coverage |
| Native Born | 0 (0.0%) | 0 (0.0%) |
| Foreign Born, Citizen | 44 (100.0%) | 0 (0.0%) |
| Foreign Born, not a Citizen | 0 (0.0%) | 0 (0.0%) |
Health Insurance Coverage by Household Income in Pajarito Mesa
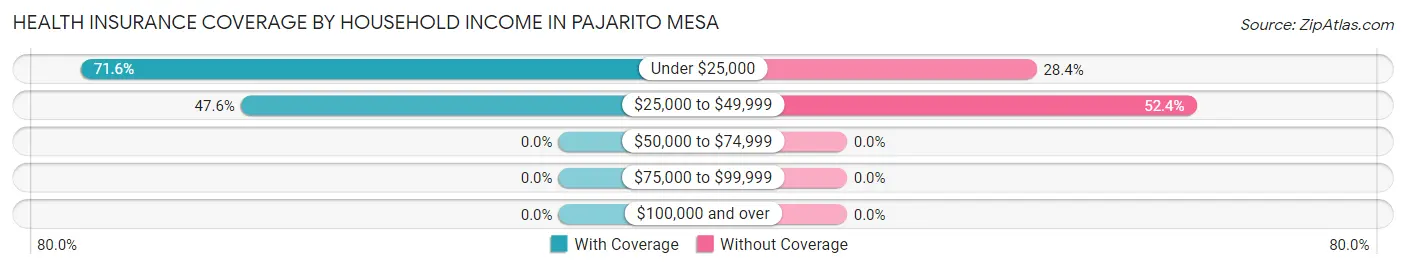
| Household Income | With Coverage | Without Coverage |
| Under $25,000 | 146 (71.6%) | 58 (28.4%) |
| $25,000 to $49,999 | 10 (47.6%) | 11 (52.4%) |
| $50,000 to $74,999 | 0 (0.0%) | 0 (0.0%) |
| $75,000 to $99,999 | 0 (0.0%) | 0 (0.0%) |
| $100,000 and over | 0 (0.0%) | 0 (0.0%) |
Public vs Private Health Insurance Coverage by Age in Pajarito Mesa
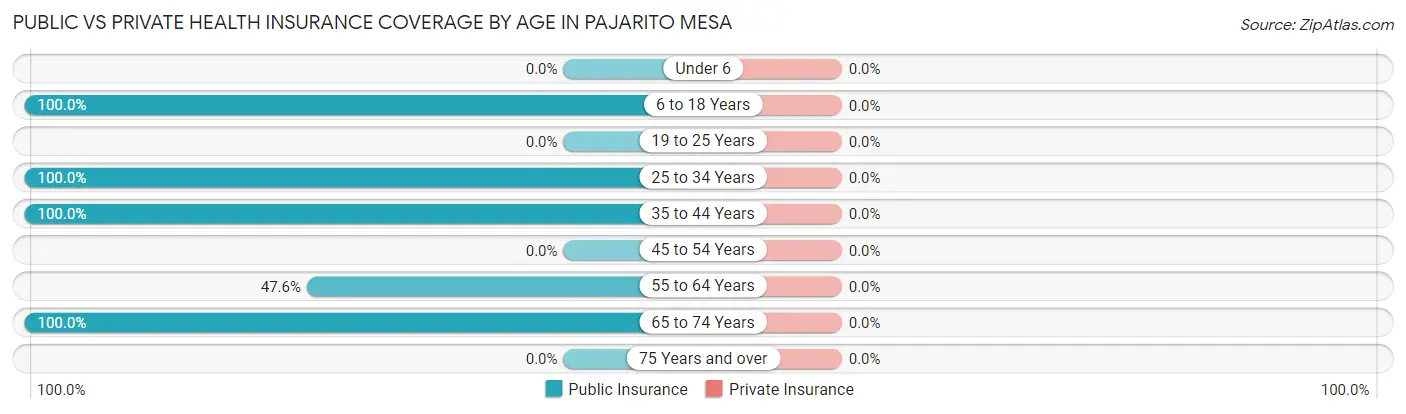
| Age Bracket | Public Insurance | Private Insurance |
| Under 6 | 0 (0.0%) | 0 (0.0%) |
| 6 to 18 Years | 44 (100.0%) | 0 (0.0%) |
| 19 to 25 Years | 0 (0.0%) | 0 (0.0%) |
| 25 to 34 Years | 24 (100.0%) | 0 (0.0%) |
| 35 to 44 Years | 60 (100.0%) | 0 (0.0%) |
| 45 to 54 Years | 0 (0.0%) | 0 (0.0%) |
| 55 to 64 Years | 10 (47.6%) | 0 (0.0%) |
| 65 to 74 Years | 18 (100.0%) | 0 (0.0%) |
| 75 Years and over | 0 (0.0%) | 0 (0.0%) |
| Total | 156 (69.3%) | 0 (0.0%) |
Disability Status by Sex by Age in Pajarito Mesa
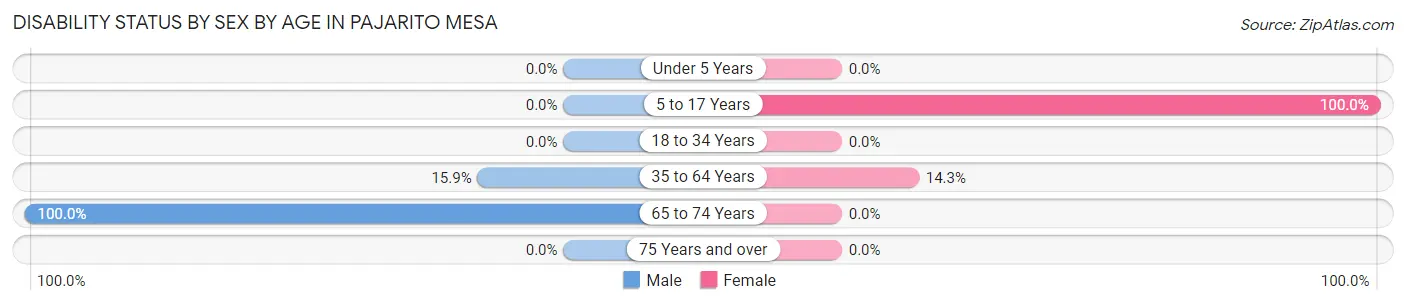
| Age Bracket | Male | Female |
| Under 5 Years | 0 (0.0%) | 0 (0.0%) |
| 5 to 17 Years | 0 (0.0%) | 22 (100.0%) |
| 18 to 34 Years | 0 (0.0%) | 0 (0.0%) |
| 35 to 64 Years | 11 (15.9%) | 10 (14.3%) |
| 65 to 74 Years | 18 (100.0%) | 0 (0.0%) |
| 75 Years and over | 0 (0.0%) | 0 (0.0%) |
Disability Class by Sex by Age in Pajarito Mesa
Disability Class: Hearing Difficulty
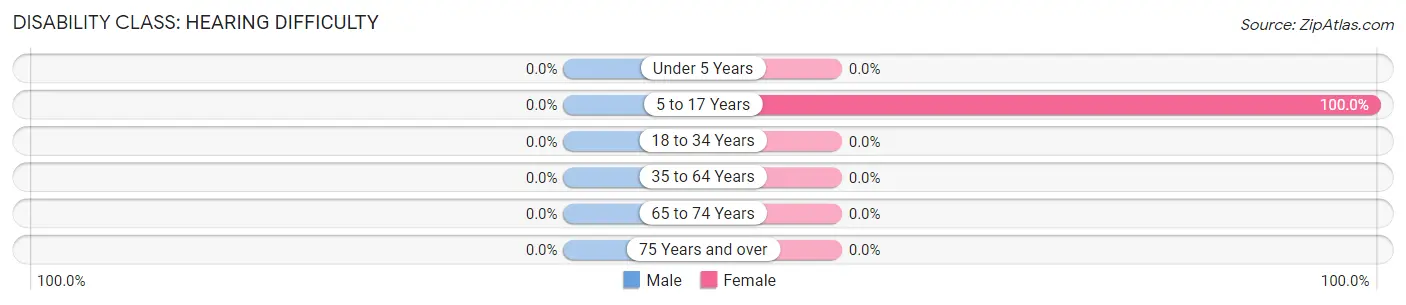
| Age Bracket | Male | Female |
| Under 5 Years | 0 (0.0%) | 0 (0.0%) |
| 5 to 17 Years | 0 (0.0%) | 22 (100.0%) |
| 18 to 34 Years | 0 (0.0%) | 0 (0.0%) |
| 35 to 64 Years | 0 (0.0%) | 0 (0.0%) |
| 65 to 74 Years | 0 (0.0%) | 0 (0.0%) |
| 75 Years and over | 0 (0.0%) | 0 (0.0%) |
Disability Class: Vision Difficulty
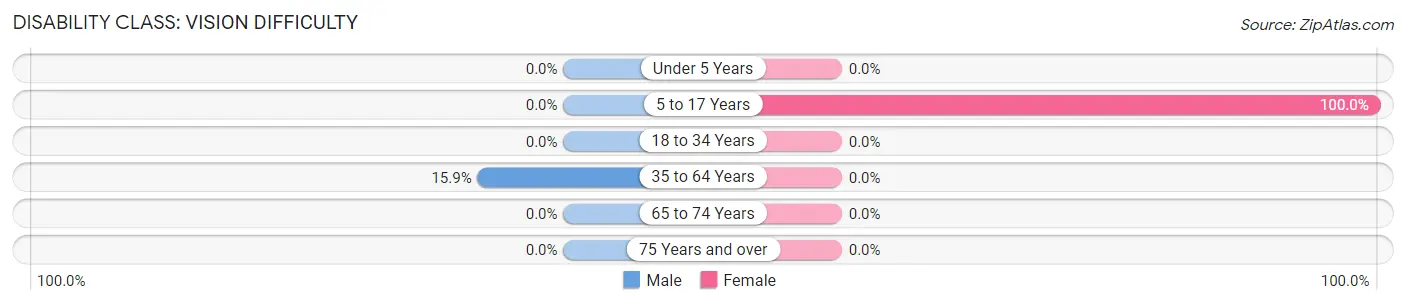
| Age Bracket | Male | Female |
| Under 5 Years | 0 (0.0%) | 0 (0.0%) |
| 5 to 17 Years | 0 (0.0%) | 22 (100.0%) |
| 18 to 34 Years | 0 (0.0%) | 0 (0.0%) |
| 35 to 64 Years | 11 (15.9%) | 0 (0.0%) |
| 65 to 74 Years | 0 (0.0%) | 0 (0.0%) |
| 75 Years and over | 0 (0.0%) | 0 (0.0%) |
Disability Class: Cognitive Difficulty
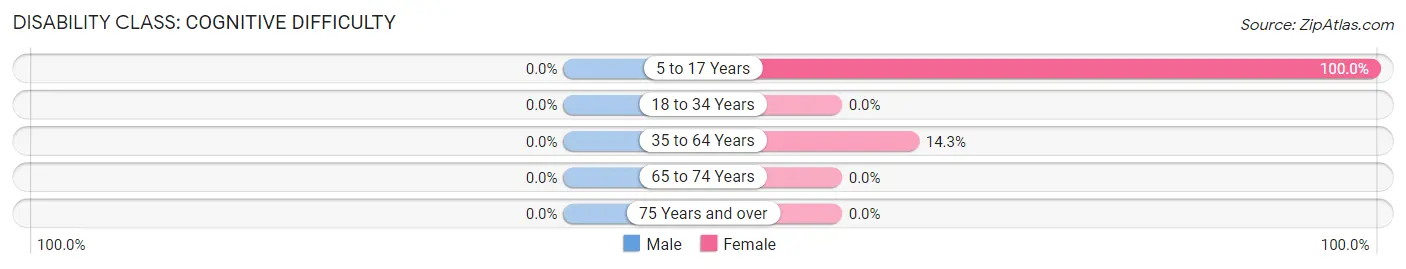
| Age Bracket | Male | Female |
| 5 to 17 Years | 0 (0.0%) | 22 (100.0%) |
| 18 to 34 Years | 0 (0.0%) | 0 (0.0%) |
| 35 to 64 Years | 0 (0.0%) | 10 (14.3%) |
| 65 to 74 Years | 0 (0.0%) | 0 (0.0%) |
| 75 Years and over | 0 (0.0%) | 0 (0.0%) |
Disability Class: Ambulatory Difficulty
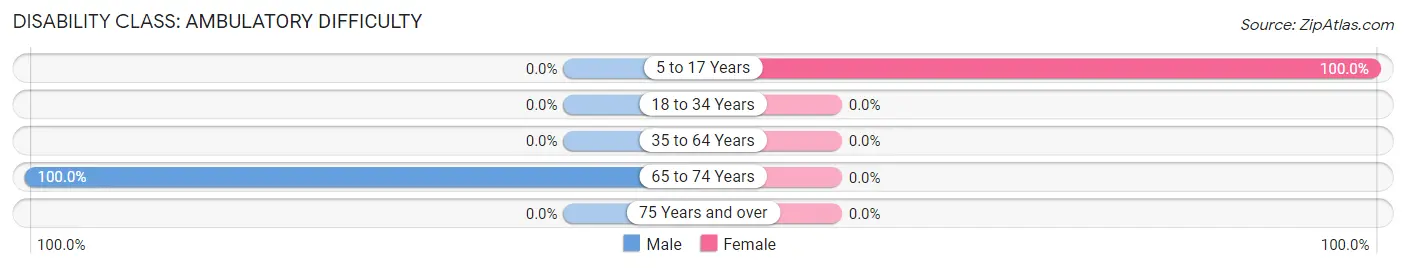
| Age Bracket | Male | Female |
| 5 to 17 Years | 0 (0.0%) | 22 (100.0%) |
| 18 to 34 Years | 0 (0.0%) | 0 (0.0%) |
| 35 to 64 Years | 0 (0.0%) | 0 (0.0%) |
| 65 to 74 Years | 18 (100.0%) | 0 (0.0%) |
| 75 Years and over | 0 (0.0%) | 0 (0.0%) |
Disability Class: Self-Care Difficulty
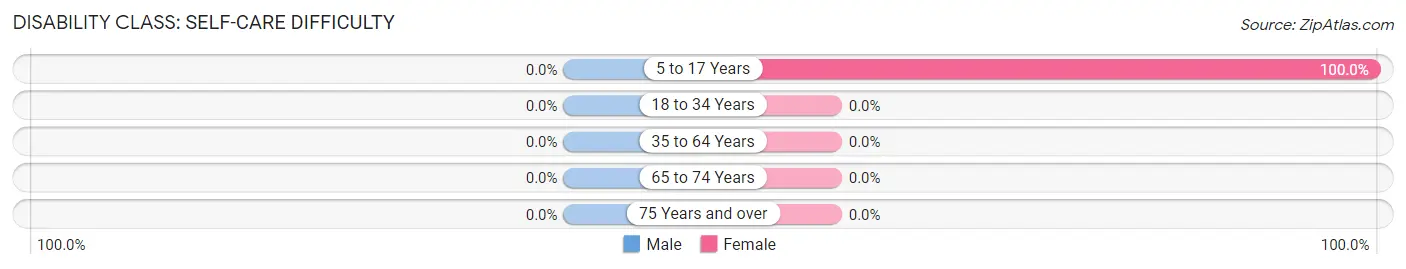
| Age Bracket | Male | Female |
| 5 to 17 Years | 0 (0.0%) | 22 (100.0%) |
| 18 to 34 Years | 0 (0.0%) | 0 (0.0%) |
| 35 to 64 Years | 0 (0.0%) | 0 (0.0%) |
| 65 to 74 Years | 0 (0.0%) | 0 (0.0%) |
| 75 Years and over | 0 (0.0%) | 0 (0.0%) |
Technology Access in Pajarito Mesa
Computing Device Access in Pajarito Mesa
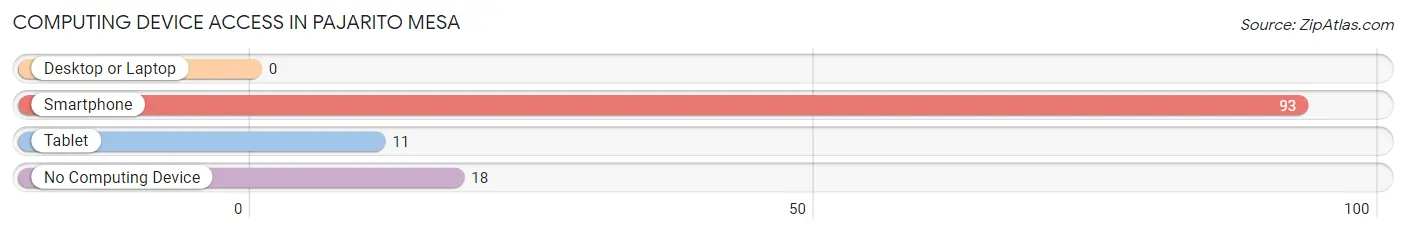
| Device Type | # Households | % Households |
| Desktop or Laptop | 0 | 0.0% |
| Smartphone | 93 | 83.8% |
| Tablet | 11 | 9.9% |
| No Computing Device | 18 | 16.2% |
| Total | 111 | 100.0% |
Internet Access in Pajarito Mesa
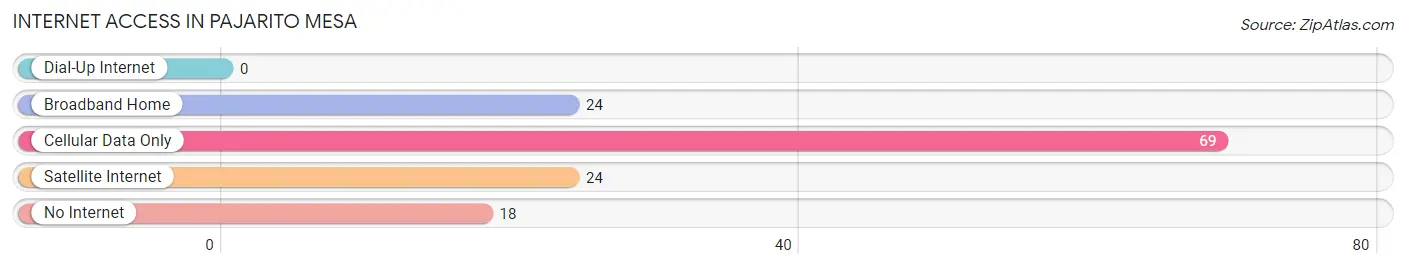
| Internet Type | # Households | % Households |
| Dial-Up Internet | 0 | 0.0% |
| Broadband Home | 24 | 21.6% |
| Cellular Data Only | 69 | 62.2% |
| Satellite Internet | 24 | 21.6% |
| No Internet | 18 | 16.2% |
| Total | 111 | 100.0% |
Pajarito Mesa Summary
Pajarito Mesa is a small, rural community located in the northern part of New Mexico. It is situated in the foothills of the Sangre de Cristo Mountains, approximately 25 miles northwest of Santa Fe. The area is known for its stunning views of the surrounding mountains and its rich cultural heritage.
History
The area now known as Pajarito Mesa has been inhabited for centuries by the Pueblo Indians. The Pueblo people have a long and rich history in the area, and their influence can still be seen in the local culture and architecture. The first European settlers arrived in the area in the late 1800s, and the town of Pajarito Mesa was officially established in 1891.
The town was originally a farming and ranching community, and the local economy was largely based on the production of wool and other agricultural products. In the early 1900s, the town began to experience a period of growth and development, and the population increased significantly. The town was also home to a number of businesses, including a general store, a hotel, and a post office.
Geography
Pajarito Mesa is located in the northern part of New Mexico, in the foothills of the Sangre de Cristo Mountains. The town is situated at an elevation of 6,000 feet, and the surrounding area is characterized by rolling hills and lush vegetation. The climate in the area is semi-arid, with hot summers and cold winters.
The town is located approximately 25 miles northwest of Santa Fe, and is accessible via State Highway 14. The nearest major cities are Albuquerque and Las Vegas, both of which are located approximately 100 miles away.
Economy
The economy of Pajarito Mesa is largely based on agriculture and tourism. The town is home to a number of small farms and ranches, and the local economy is supported by the production of wool, hay, and other agricultural products. The town is also home to a number of small businesses, including restaurants, shops, and galleries.
Tourism is an important part of the local economy, and the town is a popular destination for outdoor enthusiasts. The area is known for its stunning views of the surrounding mountains, and the town is home to a number of hiking trails, camping sites, and other recreational activities.
Demographics
As of the 2010 census, the population of Pajarito Mesa was 1,845. The town is predominantly Hispanic, with a population that is approximately 80% Hispanic. The median household income in the town is $35,000, and the median age is 37. The town is home to a number of small businesses, and the unemployment rate is approximately 5%.
Common Questions
What is Per Capita Income in Pajarito Mesa?
Per Capita income in Pajarito Mesa is $5,003.
What is the Median Household income in Pajarito Mesa?
Median Household Income in Pajarito Mesa is $11,036.
What is Inequality or Gini Index in Pajarito Mesa?
Inequality or Gini Index in Pajarito Mesa is 0.26.
What is the Total Population of Pajarito Mesa?
Total Population of Pajarito Mesa is 225.
What is the Total Male Population of Pajarito Mesa?
Total Male Population of Pajarito Mesa is 133.
What is the Total Female Population of Pajarito Mesa?
Total Female Population of Pajarito Mesa is 92.
What is the Ratio of Males per 100 Females in Pajarito Mesa?
There are 144.57 Males per 100 Females in Pajarito Mesa.
What is the Ratio of Females per 100 Males in Pajarito Mesa?
There are 69.17 Females per 100 Males in Pajarito Mesa.
What is the Median Population Age in Pajarito Mesa?
Median Population Age in Pajarito Mesa is 44.7 Years.
What is the Average Family Size in Pajarito Mesa
Average Family Size in Pajarito Mesa is 2.8 People.
What is the Average Household Size in Pajarito Mesa
Average Household Size in Pajarito Mesa is 2.0 People.
How Large is the Labor Force in Pajarito Mesa?
There are 118 People in the Labor Forcein in Pajarito Mesa.
What is the Percentage of People in the Labor Force in Pajarito Mesa?
65.2% of People are in the Labor Force in Pajarito Mesa.
What is the Unemployment Rate in Pajarito Mesa?
Unemployment Rate in Pajarito Mesa is 50.8%.