Speed, KS Map & Demographics
Speed Map
Speed Overview
$47,745
PER CAPITA INCOME
$78,125
AVG FAMILY INCOME
$59,063
AVG HOUSEHOLD INCOME
0.11
INEQUALITY / GINI INDEX
22
TOTAL POPULATION
18
MALE POPULATION
4
FEMALE POPULATION
450.00
MALES / 100 FEMALES
22.22
FEMALES / 100 MALES
64.5
MEDIAN AGE
2.0
AVG FAMILY SIZE
1.3
AVG HOUSEHOLD SIZE
19
LABOR FORCE [ PEOPLE ]
86.4%
PERCENT IN LABOR FORCE
Income in Speed
Income Overview in Speed
Per Capita Income in Speed is $47,745, while median incomes of families and households are $78,125 and $59,063 respectively.
| Characteristic | Number | Measure |
| Per Capita Income | 22 | $47,745 |
| Median Family Income | 5 | $78,125 |
| Mean Family Income | 5 | $75,220 |
| Median Household Income | 17 | $59,063 |
| Mean Household Income | 17 | $63,276 |
| Income Deficit | 5 | $0 |
| Wage / Income Gap (%) | 22 | 0.00% |
| Wage / Income Gap ($) | 22 | 100.00¢ per $1 |
| Gini / Inequality Index | 22 | 0.11 |
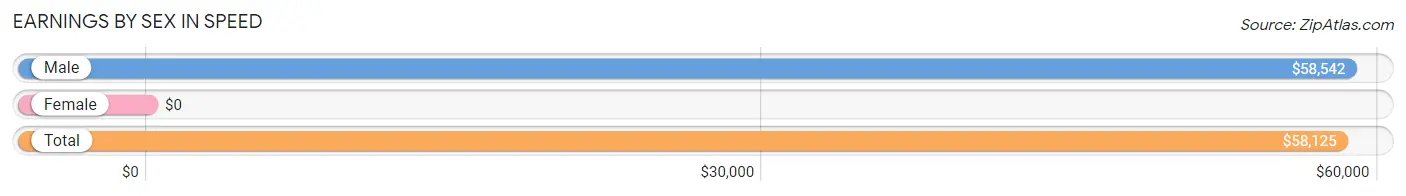
Earnings by Sex in Speed
| Sex | Number | Average Earnings |
| Male | 16 (80.0%) | $58,542 |
| Female | 4 (20.0%) | $0 |
| Total | 20 (100.0%) | $58,125 |
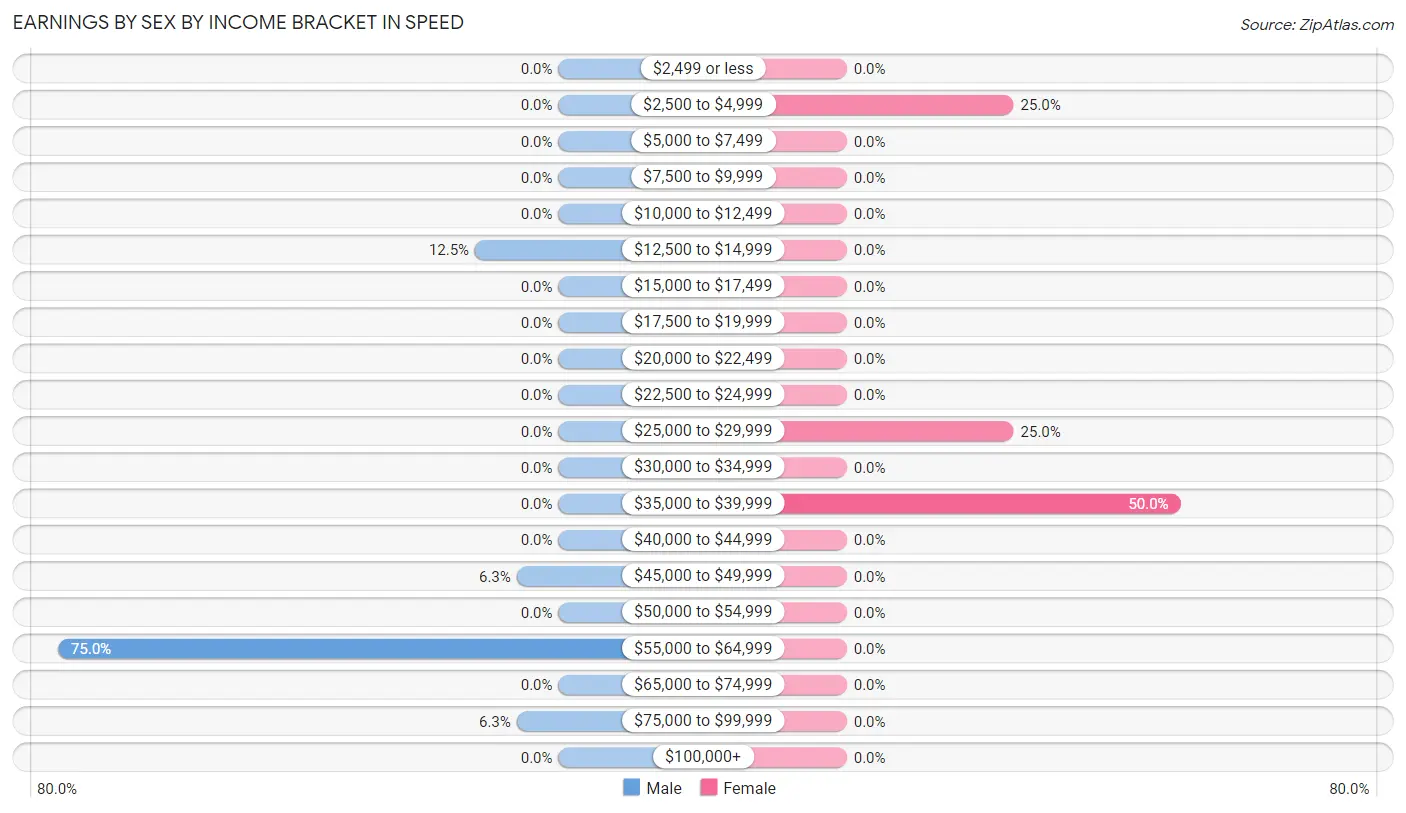
Earnings by Sex by Income Bracket in Speed
The most common earnings brackets in Speed are $55,000 to $64,999 for men (12 | 75.0%) and $35,000 to $39,999 for women (2 | 50.0%).
| Income | Male | Female |
| $2,499 or less | 0 (0.0%) | 0 (0.0%) |
| $2,500 to $4,999 | 0 (0.0%) | 1 (25.0%) |
| $5,000 to $7,499 | 0 (0.0%) | 0 (0.0%) |
| $7,500 to $9,999 | 0 (0.0%) | 0 (0.0%) |
| $10,000 to $12,499 | 0 (0.0%) | 0 (0.0%) |
| $12,500 to $14,999 | 2 (12.5%) | 0 (0.0%) |
| $15,000 to $17,499 | 0 (0.0%) | 0 (0.0%) |
| $17,500 to $19,999 | 0 (0.0%) | 0 (0.0%) |
| $20,000 to $22,499 | 0 (0.0%) | 0 (0.0%) |
| $22,500 to $24,999 | 0 (0.0%) | 0 (0.0%) |
| $25,000 to $29,999 | 0 (0.0%) | 1 (25.0%) |
| $30,000 to $34,999 | 0 (0.0%) | 0 (0.0%) |
| $35,000 to $39,999 | 0 (0.0%) | 2 (50.0%) |
| $40,000 to $44,999 | 0 (0.0%) | 0 (0.0%) |
| $45,000 to $49,999 | 1 (6.2%) | 0 (0.0%) |
| $50,000 to $54,999 | 0 (0.0%) | 0 (0.0%) |
| $55,000 to $64,999 | 12 (75.0%) | 0 (0.0%) |
| $65,000 to $74,999 | 0 (0.0%) | 0 (0.0%) |
| $75,000 to $99,999 | 1 (6.2%) | 0 (0.0%) |
| $100,000+ | 0 (0.0%) | 0 (0.0%) |
| Total | 16 (100.0%) | 4 (100.0%) |
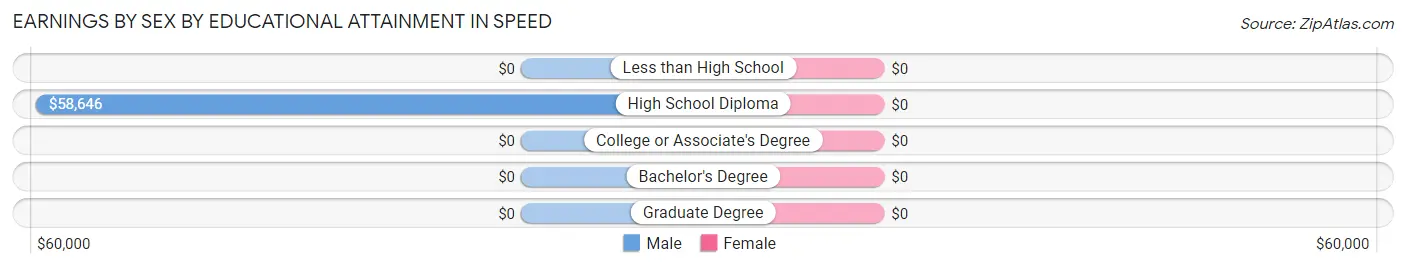
Earnings by Sex by Educational Attainment in Speed
| Educational Attainment | Male Income | Female Income |
| Less than High School | - | - |
| High School Diploma | $58,646 | $0 |
| College or Associate's Degree | - | - |
| Bachelor's Degree | - | - |
| Graduate Degree | - | - |
| Total | $58,542 | $0 |
Family Income in Speed
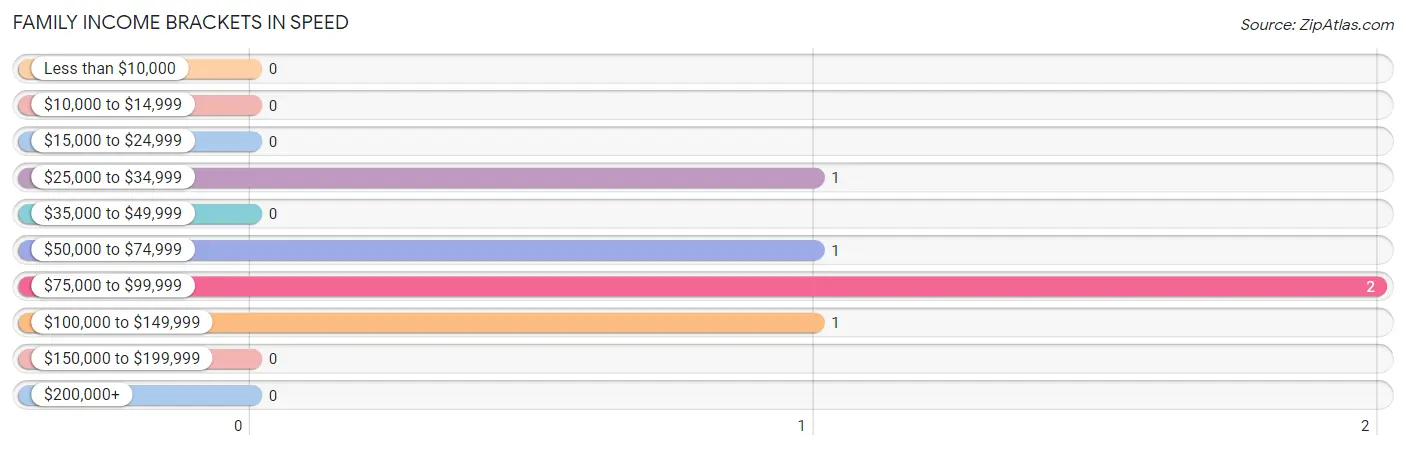
Family Income Brackets in Speed
According to the Speed family income data, there are 2 families falling into the $75,000 to $99,999 income range, which is the most common income bracket and makes up 40.0% of all families.
| Income Bracket | # Families | % Families |
| Less than $10,000 | 0 | 0.0% |
| $10,000 to $14,999 | 0 | 0.0% |
| $15,000 to $24,999 | 0 | 0.0% |
| $25,000 to $34,999 | 1 | 20.0% |
| $35,000 to $49,999 | 0 | 0.0% |
| $50,000 to $74,999 | 1 | 20.0% |
| $75,000 to $99,999 | 2 | 40.0% |
| $100,000 to $149,999 | 1 | 20.0% |
| $150,000 to $199,999 | 0 | 0.0% |
| $200,000+ | 0 | 0.0% |
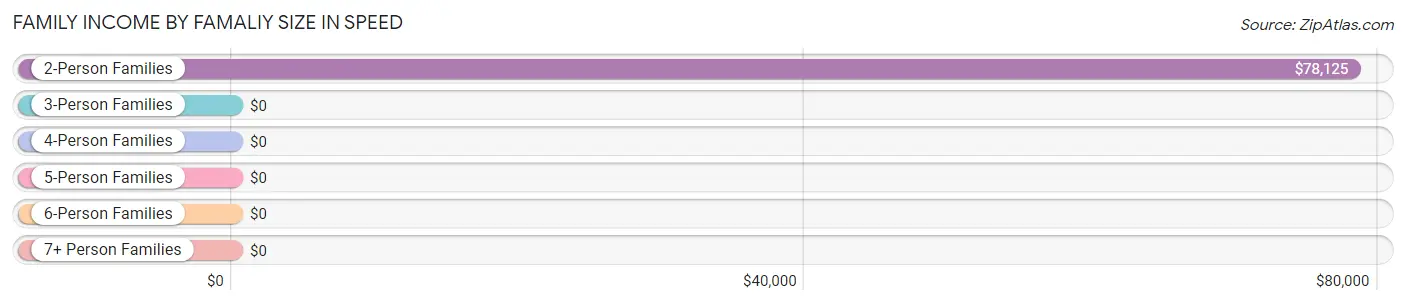
Family Income by Famaliy Size in Speed
2-person families (5 | 100.0%) account for the highest median family income in Speed with $78,125 per family, while 2-person families (5 | 100.0%) have the highest median income of $39,062 per family member.
| Income Bracket | # Families | Median Income |
| 2-Person Families | 5 (100.0%) | $78,125 |
| 3-Person Families | 0 (0.0%) | $0 |
| 4-Person Families | 0 (0.0%) | $0 |
| 5-Person Families | 0 (0.0%) | $0 |
| 6-Person Families | 0 (0.0%) | $0 |
| 7+ Person Families | 0 (0.0%) | $0 |
| Total | 5 (100.0%) | $78,125 |
Family Income by Number of Earners in Speed
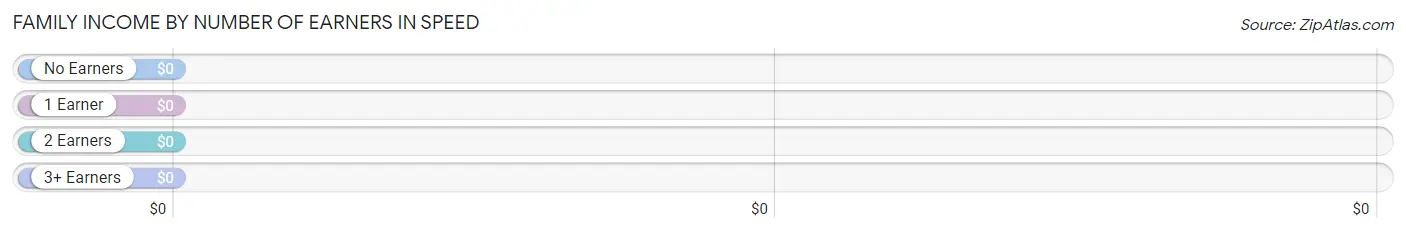
| Number of Earners | # Families | Median Income |
| No Earners | 0 (0.0%) | $0 |
| 1 Earner | 3 (60.0%) | $0 |
| 2 Earners | 2 (40.0%) | $0 |
| 3+ Earners | 0 (0.0%) | $0 |
| Total | 5 (100.0%) | $78,125 |
Household Income in Speed
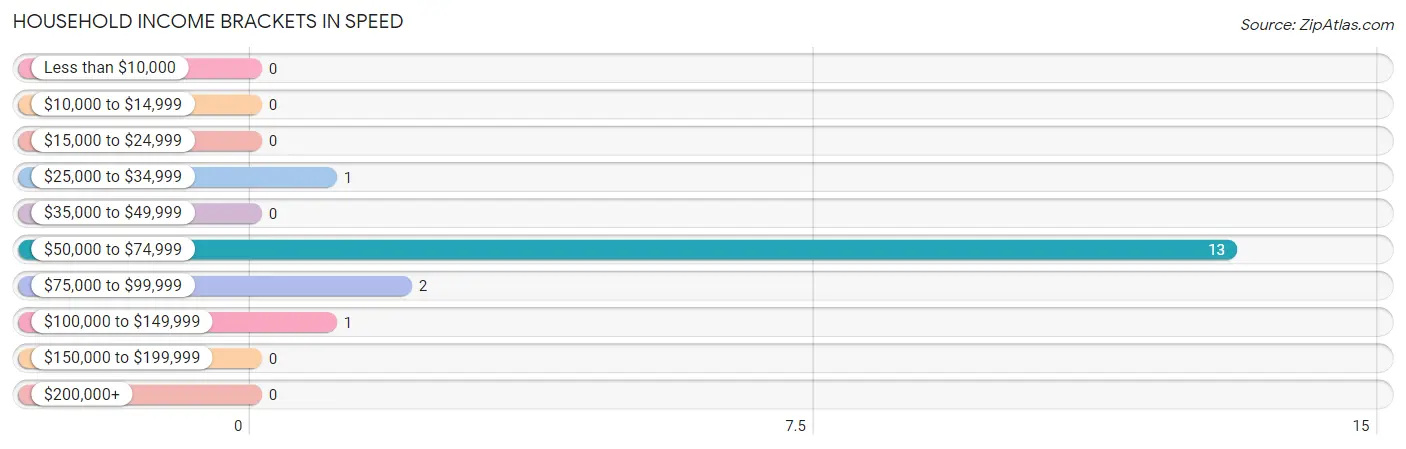
Household Income Brackets in Speed
With 13 households falling in the category, the $50,000 to $74,999 income range is the most frequent in Speed, accounting for 76.5% of all households.
| Income Bracket | # Households | % Households |
| Less than $10,000 | 0 | 0.0% |
| $10,000 to $14,999 | 0 | 0.0% |
| $15,000 to $24,999 | 0 | 0.0% |
| $25,000 to $34,999 | 1 | 5.9% |
| $35,000 to $49,999 | 0 | 0.0% |
| $50,000 to $74,999 | 13 | 76.5% |
| $75,000 to $99,999 | 2 | 11.8% |
| $100,000 to $149,999 | 1 | 5.9% |
| $150,000 to $199,999 | 0 | 0.0% |
| $200,000+ | 0 | 0.0% |
Household Income by Householder Age in Speed
The median household income in Speed is $59,063, with the highest median household income of $59,063 found in the 45 to 64 years age bracket for the primary householder. A total of 15 households (88.2%) fall into this category.
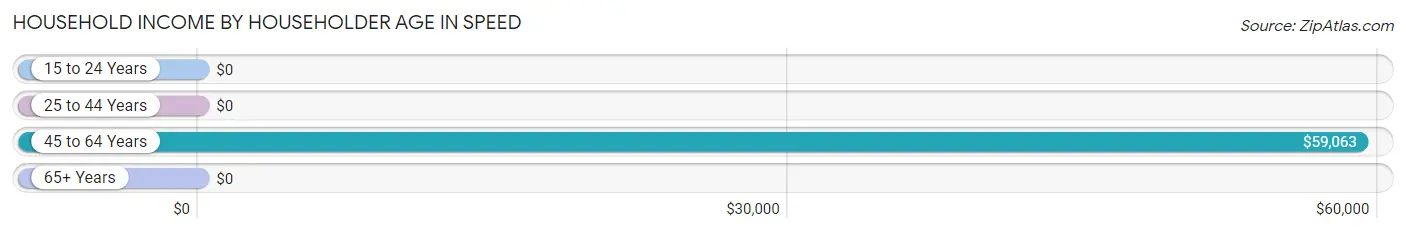
| Income Bracket | # Households | Median Income |
| 15 to 24 Years | 0 (0.0%) | $0 |
| 25 to 44 Years | 0 (0.0%) | $0 |
| 45 to 64 Years | 15 (88.2%) | $59,063 |
| 65+ Years | 2 (11.8%) | $0 |
| Total | 17 (100.0%) | $59,063 |
Poverty in Speed
Income Below Poverty by Sex and Age in Speed
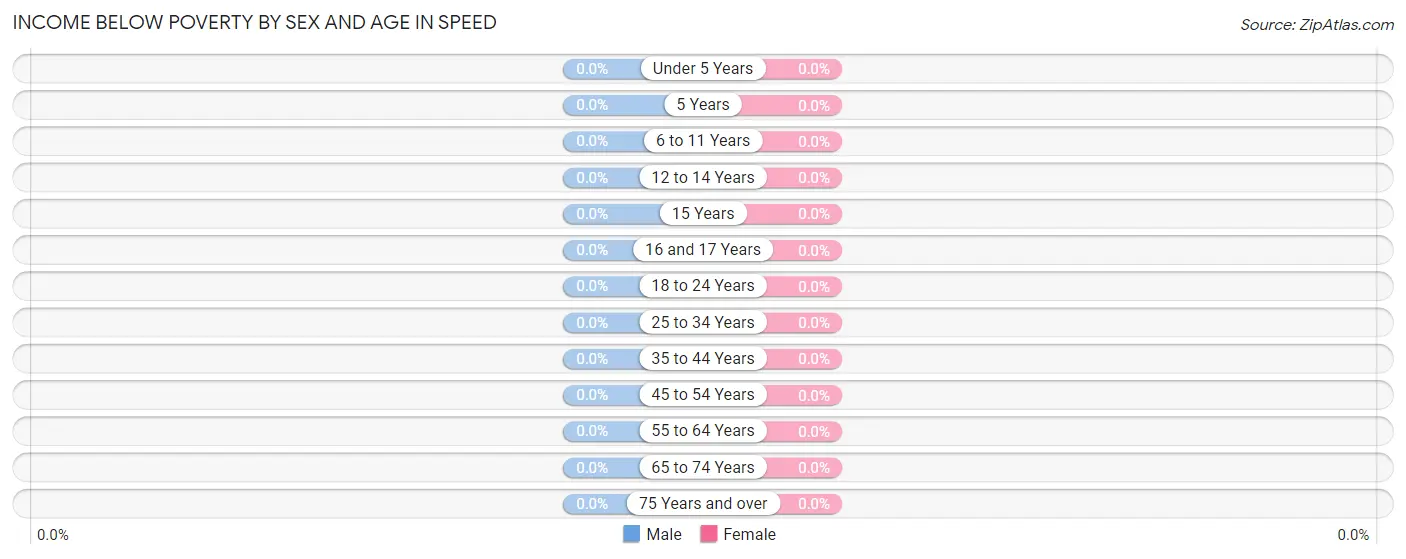
| Age Bracket | Male | Female |
| Under 5 Years | 0 (0.0%) | 0 (0.0%) |
| 5 Years | 0 (0.0%) | 0 (0.0%) |
| 6 to 11 Years | 0 (0.0%) | 0 (0.0%) |
| 12 to 14 Years | 0 (0.0%) | 0 (0.0%) |
| 15 Years | 0 (0.0%) | 0 (0.0%) |
| 16 and 17 Years | 0 (0.0%) | 0 (0.0%) |
| 18 to 24 Years | 0 (0.0%) | 0 (0.0%) |
| 25 to 34 Years | 0 (0.0%) | 0 (0.0%) |
| 35 to 44 Years | 0 (0.0%) | 0 (0.0%) |
| 45 to 54 Years | 0 (0.0%) | 0 (0.0%) |
| 55 to 64 Years | 0 (0.0%) | 0 (0.0%) |
| 65 to 74 Years | 0 (0.0%) | 0 (0.0%) |
| 75 Years and over | 0 (0.0%) | 0 (0.0%) |
| Total | 0 (0.0%) | 0 (0.0%) |
Income Above Poverty by Sex and Age in Speed
According to the poverty statistics in Speed, males aged 25 to 34 years and females aged 55 to 64 years are the age groups that are most secure financially, with 100.0% of males and 100.0% of females in these age groups living above the poverty line.
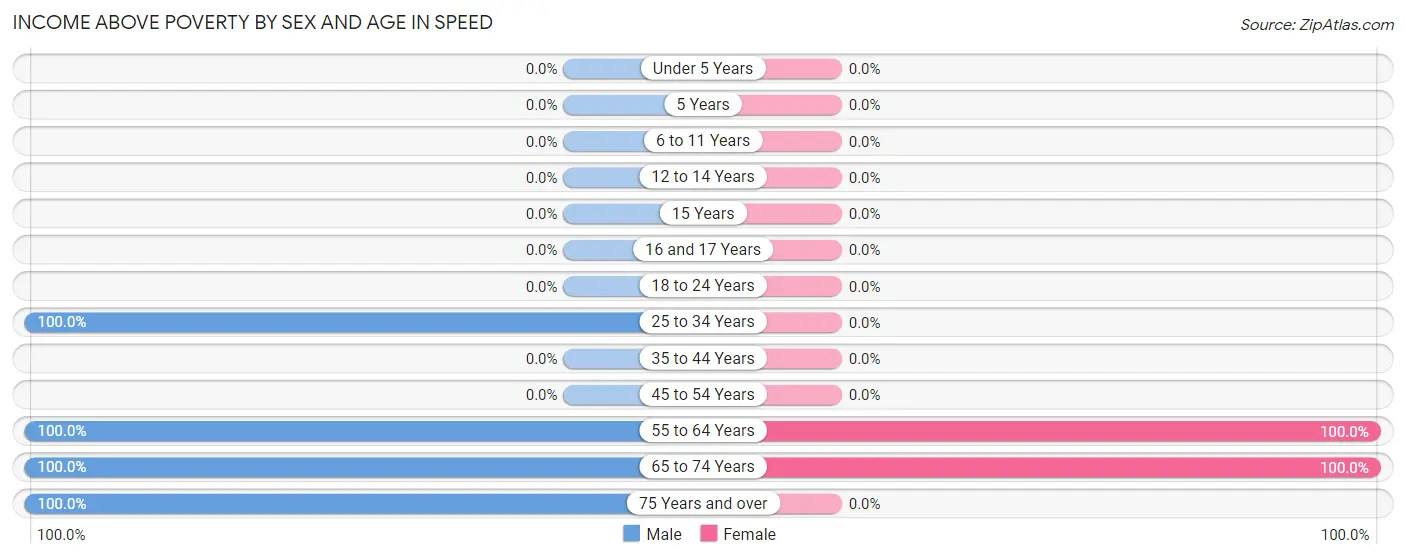
| Age Bracket | Male | Female |
| Under 5 Years | 0 (0.0%) | 0 (0.0%) |
| 5 Years | 0 (0.0%) | 0 (0.0%) |
| 6 to 11 Years | 0 (0.0%) | 0 (0.0%) |
| 12 to 14 Years | 0 (0.0%) | 0 (0.0%) |
| 15 Years | 0 (0.0%) | 0 (0.0%) |
| 16 and 17 Years | 0 (0.0%) | 0 (0.0%) |
| 18 to 24 Years | 0 (0.0%) | 0 (0.0%) |
| 25 to 34 Years | 2 (100.0%) | 0 (0.0%) |
| 35 to 44 Years | 0 (0.0%) | 0 (0.0%) |
| 45 to 54 Years | 0 (0.0%) | 0 (0.0%) |
| 55 to 64 Years | 13 (100.0%) | 3 (100.0%) |
| 65 to 74 Years | 2 (100.0%) | 1 (100.0%) |
| 75 Years and over | 1 (100.0%) | 0 (0.0%) |
| Total | 18 (100.0%) | 4 (100.0%) |
Income Below Poverty Among Married-Couple Families in Speed
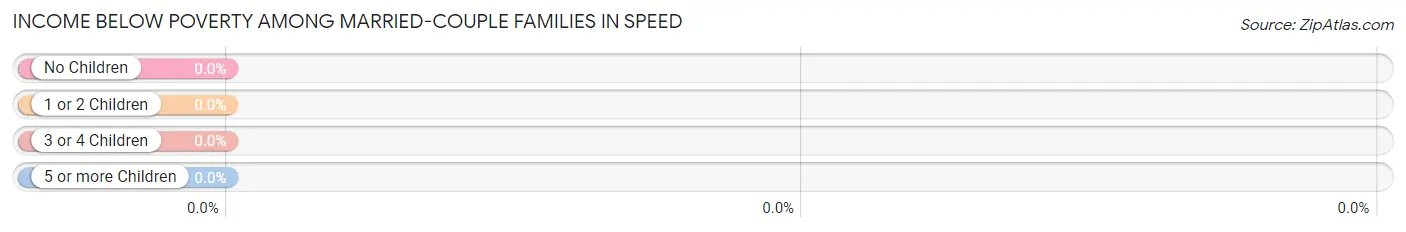
| Children | Above Poverty | Below Poverty |
| No Children | 4 (100.0%) | 0 (0.0%) |
| 1 or 2 Children | 0 (0.0%) | 0 (0.0%) |
| 3 or 4 Children | 0 (0.0%) | 0 (0.0%) |
| 5 or more Children | 0 (0.0%) | 0 (0.0%) |
| Total | 4 (100.0%) | 0 (0.0%) |
Income Below Poverty Among Single-Parent Households in Speed
| Children | Single Father | Single Mother |
| No Children | 0 (0.0%) | 0 (0.0%) |
| 1 or 2 Children | 0 (0.0%) | 0 (0.0%) |
| 3 or 4 Children | 0 (0.0%) | 0 (0.0%) |
| 5 or more Children | 0 (0.0%) | 0 (0.0%) |
| Total | 0 (0.0%) | 0 (0.0%) |
Income Below Poverty Among Married-Couple vs Single-Parent Households in Speed
| Children | Married-Couple Families | Single-Parent Households |
| No Children | 0 (0.0%) | 0 (0.0%) |
| 1 or 2 Children | 0 (0.0%) | 0 (0.0%) |
| 3 or 4 Children | 0 (0.0%) | 0 (0.0%) |
| 5 or more Children | 0 (0.0%) | 0 (0.0%) |
| Total | 0 (0.0%) | 0 (0.0%) |
Race in Speed
The most populous races in Speed are , and White / Caucasian (22 | 100.0%).
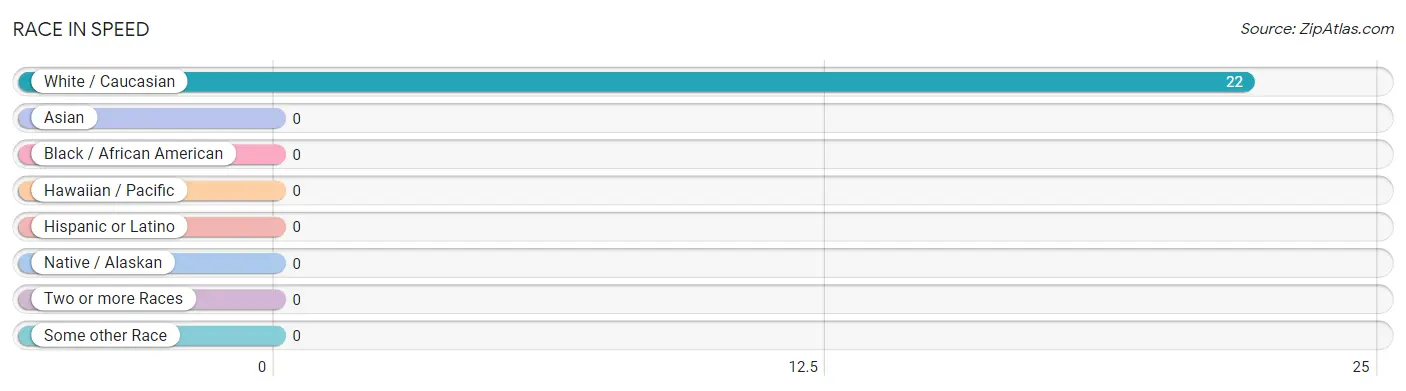
| Race | # Population | % Population |
| Asian | 0 | 0.0% |
| Black / African American | 0 | 0.0% |
| Hawaiian / Pacific | 0 | 0.0% |
| Hispanic or Latino | 0 | 0.0% |
| Native / Alaskan | 0 | 0.0% |
| White / Caucasian | 22 | 100.0% |
| Two or more Races | 0 | 0.0% |
| Some other Race | 0 | 0.0% |
| Total | 22 | 100.0% |
Ancestry in Speed
The most populous ancestries reported in Speed are American (5 | 22.7%), English (2 | 9.1%), French (1 | 4.5%), German (1 | 4.5%), and Italian (1 | 4.5%), together accounting for 45.5% of all Speed residents.
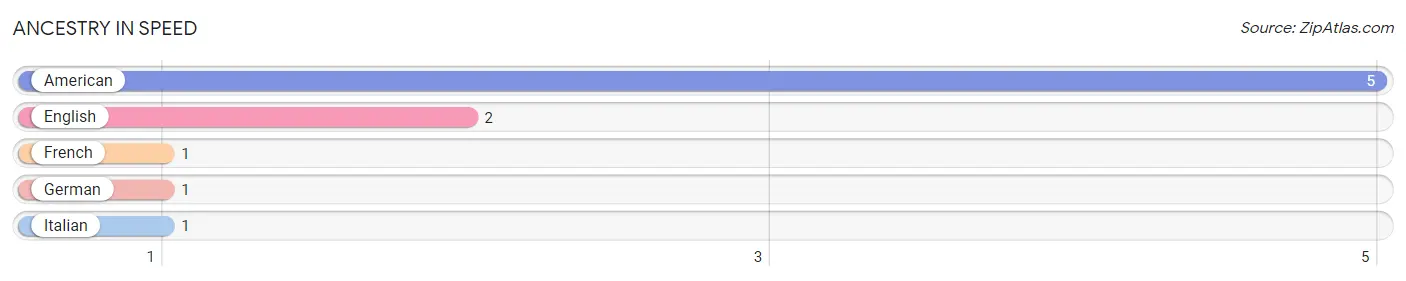
| Ancestry | # Population | % Population |
| American | 5 | 22.7% |
| English | 2 | 9.1% |
| French | 1 | 4.5% |
| German | 1 | 4.5% |
| Italian | 1 | 4.5% | View All 5 Rows |
Immigrants in Speed

| Immigration Origin | # Population | % Population | View All 0 Rows |
Sex and Age in Speed
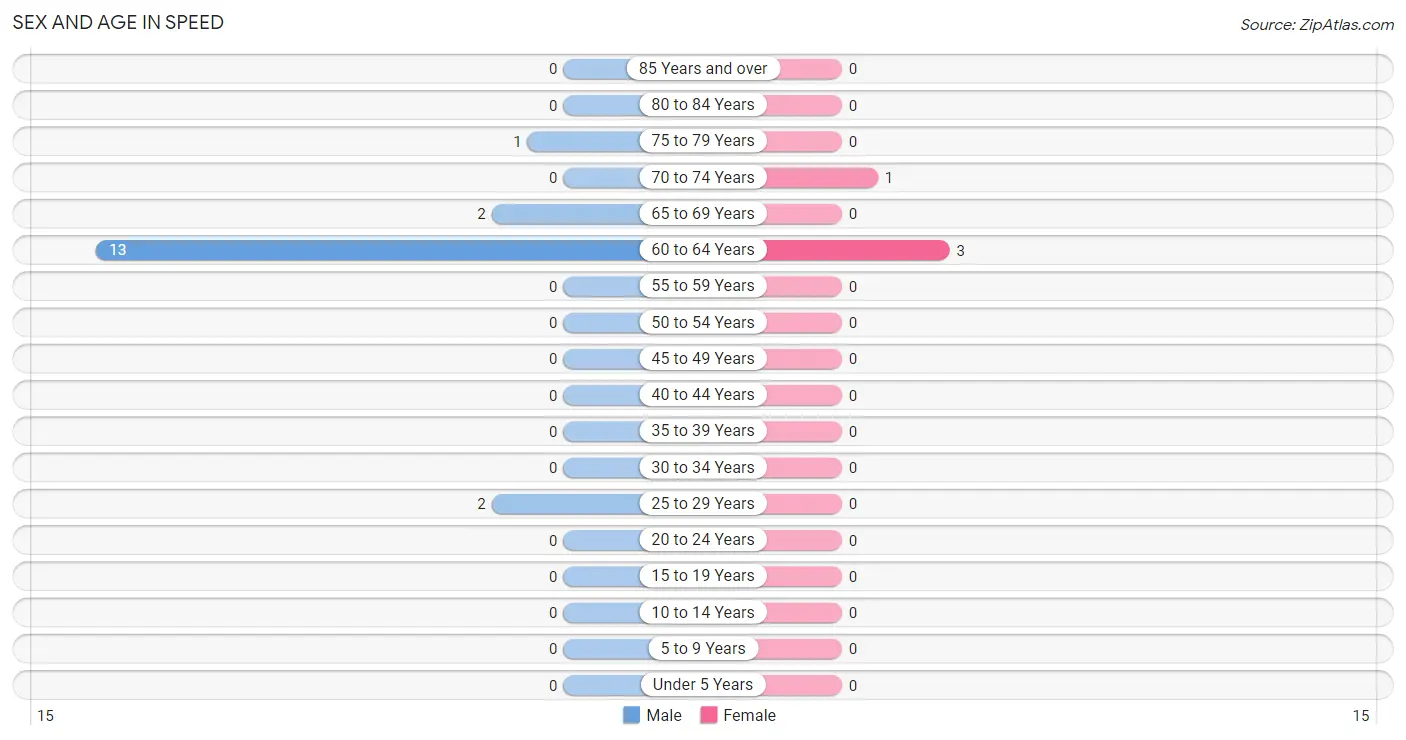
Sex and Age in Speed
The most populous age groups in Speed are 60 to 64 Years (13 | 72.2%) for men and 60 to 64 Years (3 | 75.0%) for women.
| Age Bracket | Male | Female |
| Under 5 Years | 0 (0.0%) | 0 (0.0%) |
| 5 to 9 Years | 0 (0.0%) | 0 (0.0%) |
| 10 to 14 Years | 0 (0.0%) | 0 (0.0%) |
| 15 to 19 Years | 0 (0.0%) | 0 (0.0%) |
| 20 to 24 Years | 0 (0.0%) | 0 (0.0%) |
| 25 to 29 Years | 2 (11.1%) | 0 (0.0%) |
| 30 to 34 Years | 0 (0.0%) | 0 (0.0%) |
| 35 to 39 Years | 0 (0.0%) | 0 (0.0%) |
| 40 to 44 Years | 0 (0.0%) | 0 (0.0%) |
| 45 to 49 Years | 0 (0.0%) | 0 (0.0%) |
| 50 to 54 Years | 0 (0.0%) | 0 (0.0%) |
| 55 to 59 Years | 0 (0.0%) | 0 (0.0%) |
| 60 to 64 Years | 13 (72.2%) | 3 (75.0%) |
| 65 to 69 Years | 2 (11.1%) | 0 (0.0%) |
| 70 to 74 Years | 0 (0.0%) | 1 (25.0%) |
| 75 to 79 Years | 1 (5.6%) | 0 (0.0%) |
| 80 to 84 Years | 0 (0.0%) | 0 (0.0%) |
| 85 Years and over | 0 (0.0%) | 0 (0.0%) |
| Total | 18 (100.0%) | 4 (100.0%) |
Families and Households in Speed
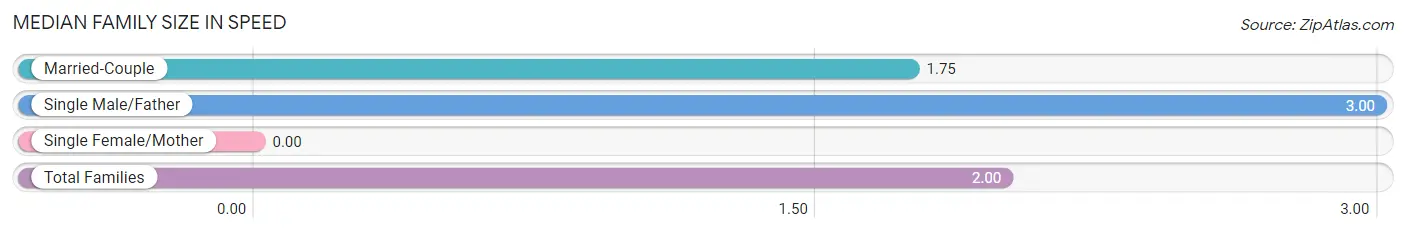
Median Family Size in Speed
| Family Type | # Families | Family Size |
| Married-Couple | 4 (80.0%) | 1.75 |
| Single Male/Father | 1 (20.0%) | 3.00 |
| Single Female/Mother | 0 (0.0%) | - |
| Total Families | 5 (100.0%) | 2.00 |
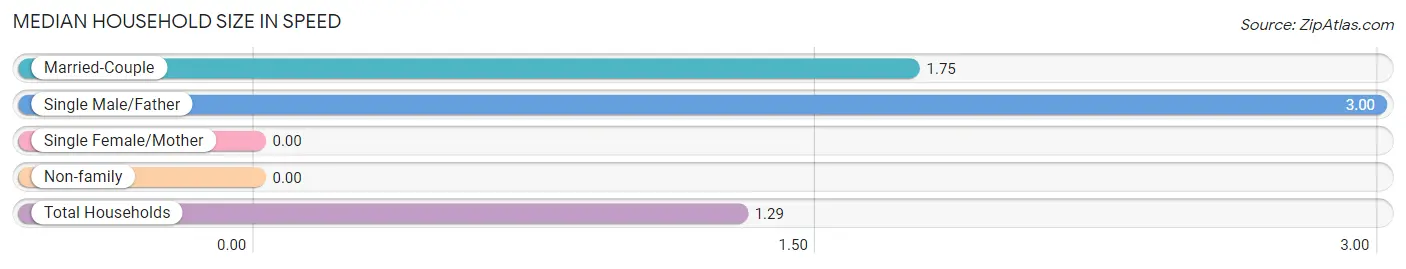
Median Household Size in Speed
| Household Type | # Households | Household Size |
| Married-Couple | 4 (23.5%) | 1.75 |
| Single Male/Father | 1 (5.9%) | 3.00 |
| Single Female/Mother | 0 (0.0%) | - |
| Non-family | 12 (70.6%) | - |
| Total Households | 17 (100.0%) | 1.29 |
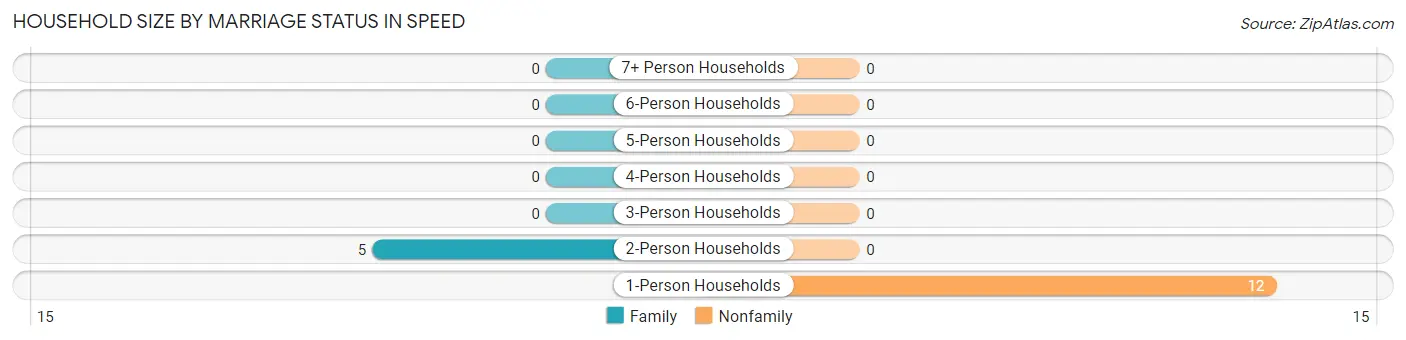
Household Size by Marriage Status in Speed
Out of a total of 17 households in Speed, 5 (29.4%) are family households, while 12 (70.6%) are nonfamily households. The most numerous type of family households are 2-person households, comprising 5, and the most common type of nonfamily households are 1-person households, comprising 12.
| Household Size | Family Households | Nonfamily Households |
| 1-Person Households | - | 12 (70.6%) |
| 2-Person Households | 5 (29.4%) | 0 (0.0%) |
| 3-Person Households | 0 (0.0%) | 0 (0.0%) |
| 4-Person Households | 0 (0.0%) | 0 (0.0%) |
| 5-Person Households | 0 (0.0%) | 0 (0.0%) |
| 6-Person Households | 0 (0.0%) | 0 (0.0%) |
| 7+ Person Households | 0 (0.0%) | 0 (0.0%) |
| Total | 5 (29.4%) | 12 (70.6%) |
Female Fertility in Speed
Fertility by Age in Speed
| Age Bracket | Women with Births | Births / 1,000 Women |
| 15 to 19 years | 0 (0.0%) | 0.0 |
| 20 to 34 years | 0 (0.0%) | 0.0 |
| 35 to 50 years | 0 (0.0%) | 0.0 |
| Total | 0 (0.0%) | 0.0 |
Fertility by Age by Marriage Status in Speed
| Age Bracket | Married | Unmarried |
| 15 to 19 years | 0 (0.0%) | 0 (0.0%) |
| 20 to 34 years | 0 (0.0%) | 0 (0.0%) |
| 35 to 50 years | 0 (0.0%) | 0 (0.0%) |
| Total | 0 (0.0%) | 0 (0.0%) |
Fertility by Education in Speed
| Educational Attainment | Women with Births | Births / 1,000 Women |
| Less than High School | 0 (0.0%) | 0.0 |
| High School Diploma | 0 (0.0%) | 0.0 |
| College or Associate's Degree | 0 (0.0%) | 0.0 |
| Bachelor's Degree | 0 (0.0%) | 0.0 |
| Graduate Degree | 0 (0.0%) | 0.0 |
| Total | 0 (0.0%) | 0.0 |
Fertility by Education by Marriage Status in Speed
| Educational Attainment | Married | Unmarried |
| Less than High School | 0 (0.0%) | 0 (0.0%) |
| High School Diploma | 0 (0.0%) | 0 (0.0%) |
| College or Associate's Degree | 0 (0.0%) | 0 (0.0%) |
| Bachelor's Degree | 0 (0.0%) | 0 (0.0%) |
| Graduate Degree | 0 (0.0%) | 0 (0.0%) |
| Total | 0 (0.0%) | 0 (0.0%) |
Employment Characteristics in Speed
Employment by Class of Employer in Speed
Among the 19 employed individuals in Speed, self-employed (not incorporated) (14 | 73.7%), private company employees (2 | 10.5%), and state government employees (2 | 10.5%) make up the most common classes of employment.
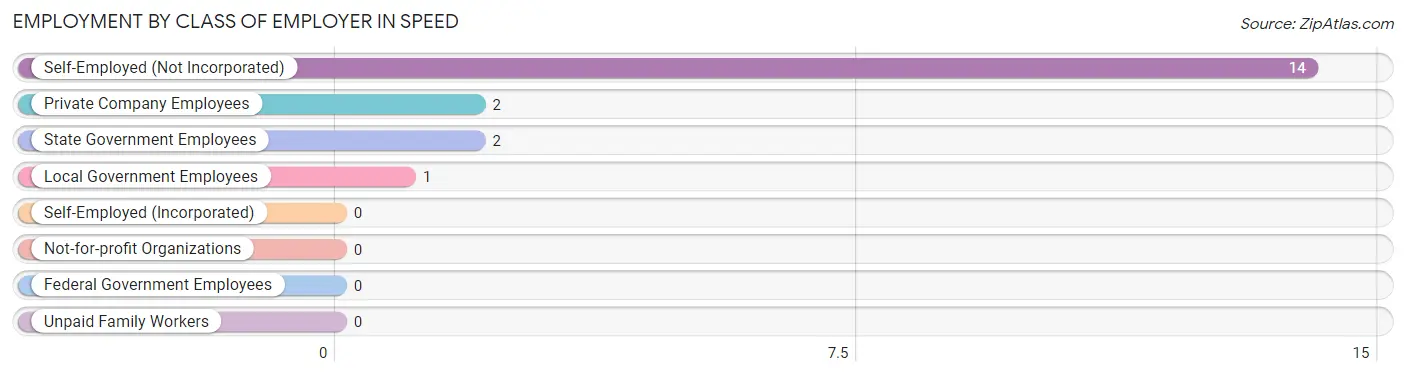
| Employer Class | # Employees | % Employees |
| Private Company Employees | 2 | 10.5% |
| Self-Employed (Incorporated) | 0 | 0.0% |
| Self-Employed (Not Incorporated) | 14 | 73.7% |
| Not-for-profit Organizations | 0 | 0.0% |
| Local Government Employees | 1 | 5.3% |
| State Government Employees | 2 | 10.5% |
| Federal Government Employees | 0 | 0.0% |
| Unpaid Family Workers | 0 | 0.0% |
| Total | 19 | 100.0% |
Employment Status by Age in Speed
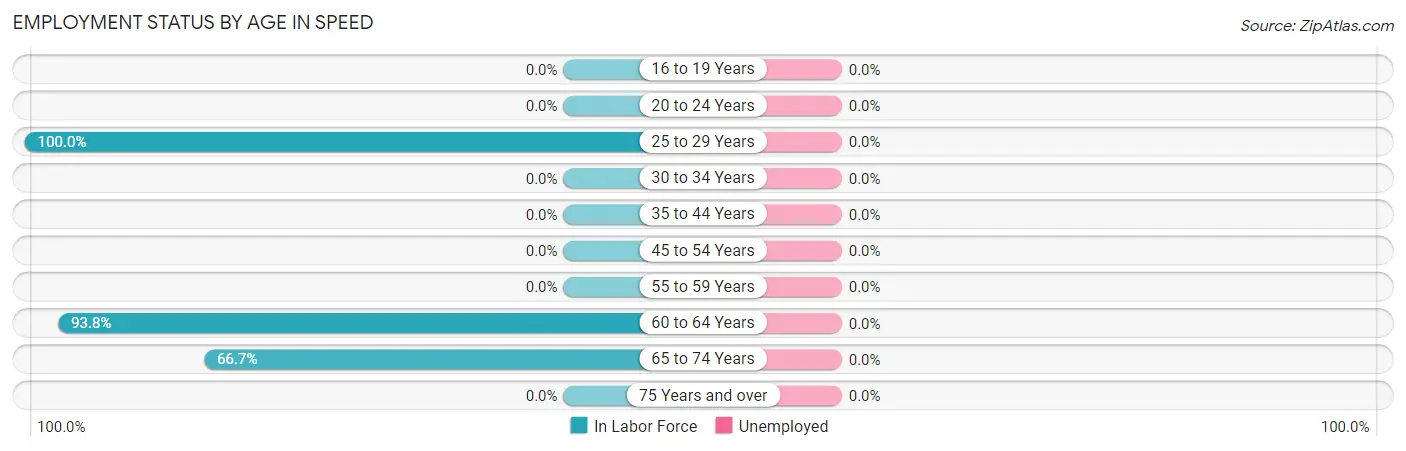
| Age Bracket | In Labor Force | Unemployed |
| 16 to 19 Years | 0 (0.0%) | 0 (0.0%) |
| 20 to 24 Years | 0 (0.0%) | 0 (0.0%) |
| 25 to 29 Years | 2 (100.0%) | 0 (0.0%) |
| 30 to 34 Years | 0 (0.0%) | 0 (0.0%) |
| 35 to 44 Years | 0 (0.0%) | 0 (0.0%) |
| 45 to 54 Years | 0 (0.0%) | 0 (0.0%) |
| 55 to 59 Years | 0 (0.0%) | 0 (0.0%) |
| 60 to 64 Years | 15 (93.8%) | 0 (0.0%) |
| 65 to 74 Years | 2 (66.7%) | 0 (0.0%) |
| 75 Years and over | 0 (0.0%) | 0 (0.0%) |
| Total | 19 (86.4%) | 0 (0.0%) |
Employment Status by Educational Attainment in Speed
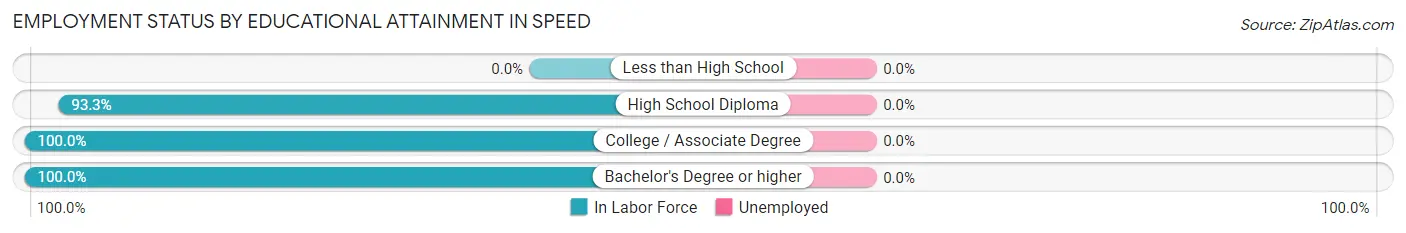
| Educational Attainment | In Labor Force | Unemployed |
| Less than High School | 0 (0.0%) | 0 (0.0%) |
| High School Diploma | 14 (93.3%) | 0 (0.0%) |
| College / Associate Degree | 2 (100.0%) | 0 (0.0%) |
| Bachelor's Degree or higher | 1 (100.0%) | 0 (0.0%) |
| Total | 17 (94.4%) | 0 (0.0%) |
Employment Occupations by Sex in Speed
Management, Business, Science and Arts Occupations
The most common Management, Business, Science and Arts occupations in Speed are Business & Financial (2 | 10.5%), Community & Social Service (1 | 5.3%), and Education Instruction & Library (1 | 5.3%).
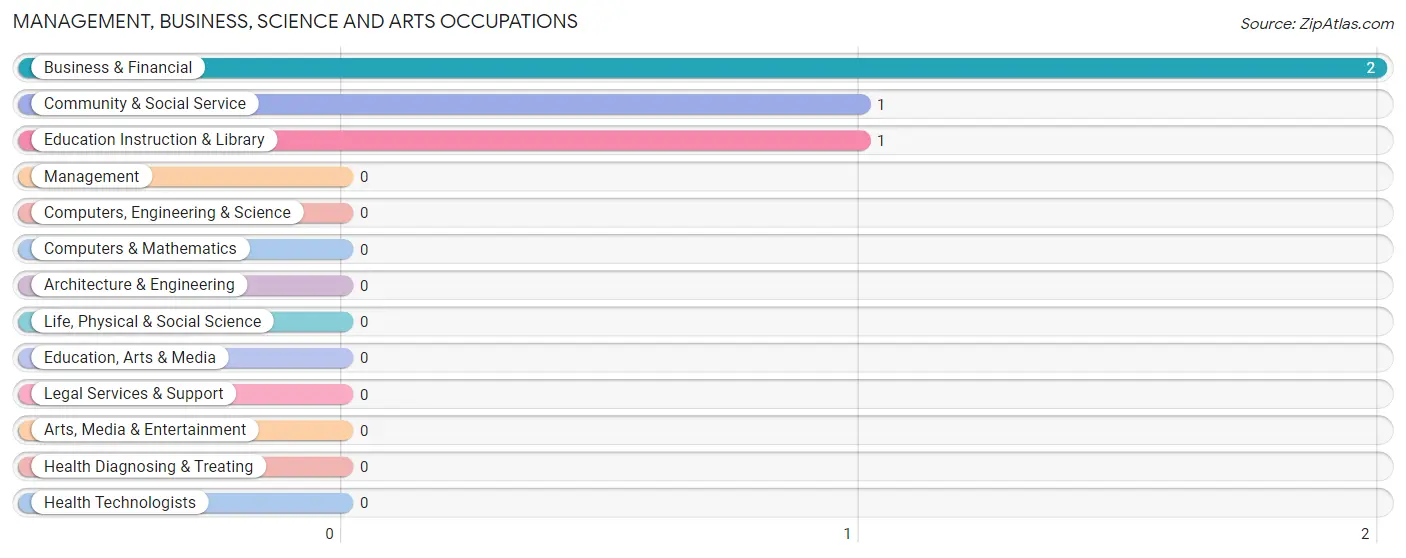
Management, Business, Science and Arts Occupations by Sex
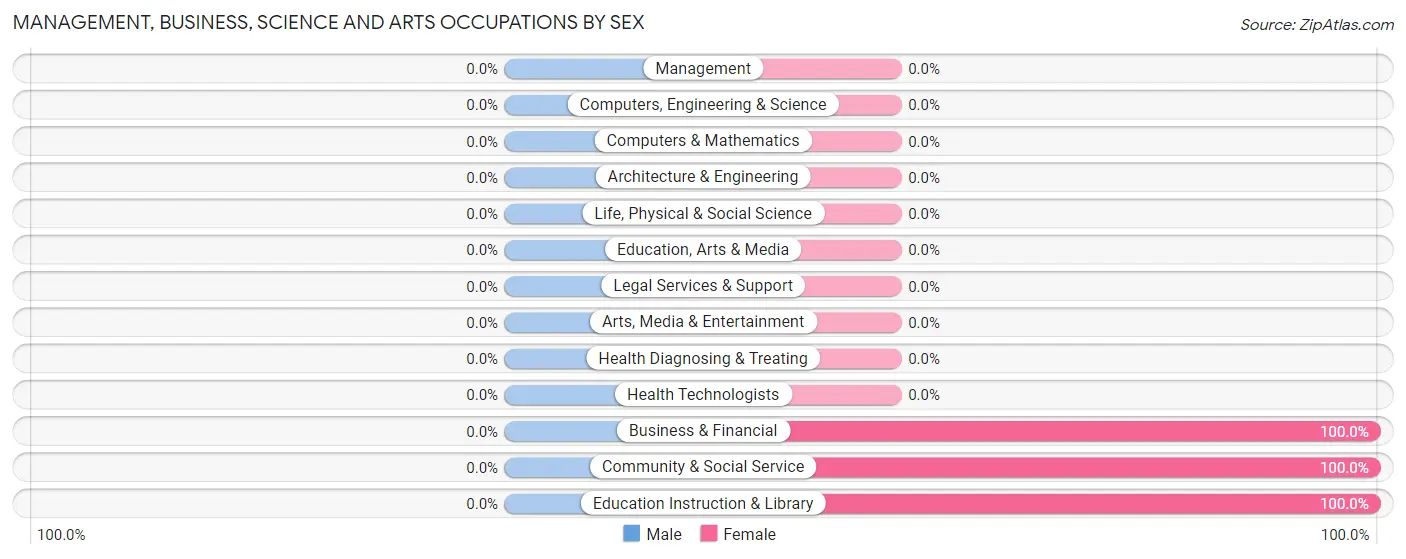
| Occupation | Male | Female |
| Management | 0 (0.0%) | 0 (0.0%) |
| Business & Financial | 0 (0.0%) | 2 (100.0%) |
| Computers, Engineering & Science | 0 (0.0%) | 0 (0.0%) |
| Computers & Mathematics | 0 (0.0%) | 0 (0.0%) |
| Architecture & Engineering | 0 (0.0%) | 0 (0.0%) |
| Life, Physical & Social Science | 0 (0.0%) | 0 (0.0%) |
| Community & Social Service | 0 (0.0%) | 1 (100.0%) |
| Education, Arts & Media | 0 (0.0%) | 0 (0.0%) |
| Legal Services & Support | 0 (0.0%) | 0 (0.0%) |
| Education Instruction & Library | 0 (0.0%) | 1 (100.0%) |
| Arts, Media & Entertainment | 0 (0.0%) | 0 (0.0%) |
| Health Diagnosing & Treating | 0 (0.0%) | 0 (0.0%) |
| Health Technologists | 0 (0.0%) | 0 (0.0%) |
| Total (Category) | 0 (0.0%) | 3 (100.0%) |
| Total (Overall) | 16 (84.2%) | 3 (15.8%) |
Services Occupations
Services Occupations by Sex
| Occupation | Male | Female |
| Healthcare Support | 0 (0.0%) | 0 (0.0%) |
| Security & Protection | 0 (0.0%) | 0 (0.0%) |
| Firefighting & Prevention | 0 (0.0%) | 0 (0.0%) |
| Law Enforcement | 0 (0.0%) | 0 (0.0%) |
| Food Preparation & Serving | 0 (0.0%) | 0 (0.0%) |
| Cleaning & Maintenance | 0 (0.0%) | 0 (0.0%) |
| Personal Care & Service | 0 (0.0%) | 0 (0.0%) |
| Total (Category) | 0 (0.0%) | 0 (0.0%) |
| Total (Overall) | 16 (84.2%) | 3 (15.8%) |
Sales and Office Occupations
Sales and Office Occupations by Sex
| Occupation | Male | Female |
| Sales & Related | 0 (0.0%) | 0 (0.0%) |
| Office & Administration | 0 (0.0%) | 0 (0.0%) |
| Total (Category) | 0 (0.0%) | 0 (0.0%) |
| Total (Overall) | 16 (84.2%) | 3 (15.8%) |
Natural Resources, Construction and Maintenance Occupations
The most common Natural Resources, Construction and Maintenance occupations in Speed are Installation, Maintenance & Repair (12 | 63.2%), and Construction & Extraction (3 | 15.8%).
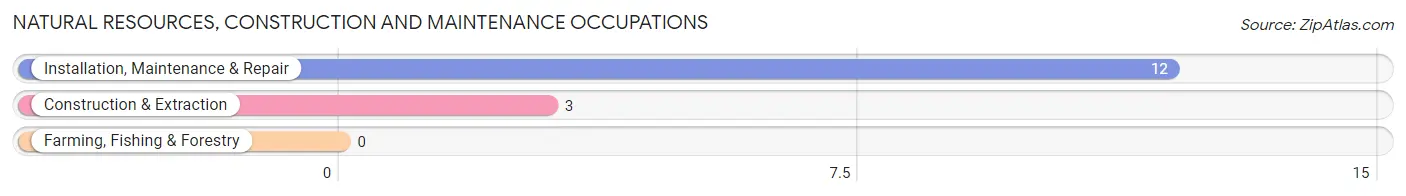
Natural Resources, Construction and Maintenance Occupations by Sex
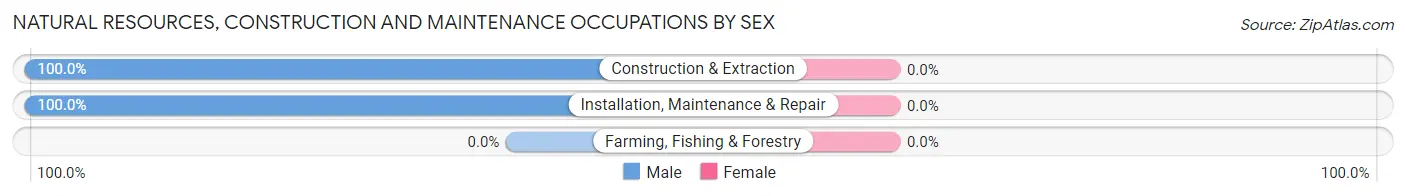
| Occupation | Male | Female |
| Farming, Fishing & Forestry | 0 (0.0%) | 0 (0.0%) |
| Construction & Extraction | 3 (100.0%) | 0 (0.0%) |
| Installation, Maintenance & Repair | 12 (100.0%) | 0 (0.0%) |
| Total (Category) | 15 (100.0%) | 0 (0.0%) |
| Total (Overall) | 16 (84.2%) | 3 (15.8%) |
Production, Transportation and Moving Occupations
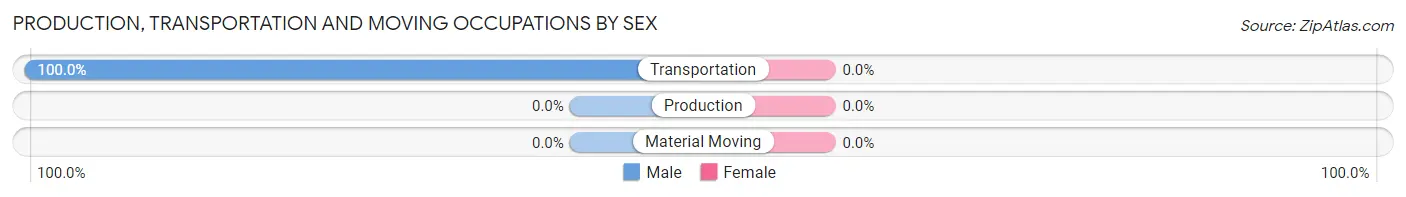
The most common Production, Transportation and Moving occupations in Speed are , and Transportation (1 | 5.3%).
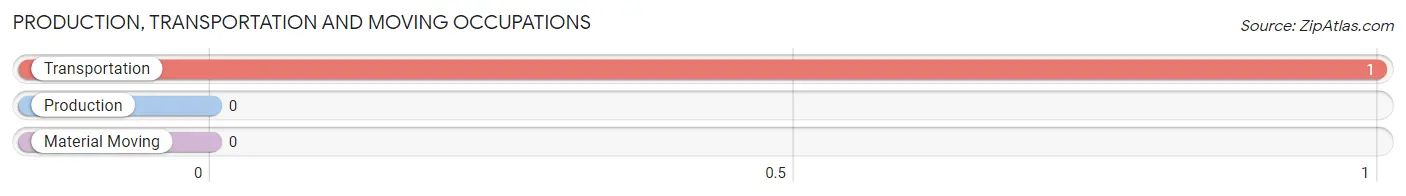
Production, Transportation and Moving Occupations by Sex
| Occupation | Male | Female |
| Production | 0 (0.0%) | 0 (0.0%) |
| Transportation | 1 (100.0%) | 0 (0.0%) |
| Material Moving | 0 (0.0%) | 0 (0.0%) |
| Total (Category) | 1 (100.0%) | 0 (0.0%) |
| Total (Overall) | 16 (84.2%) | 3 (15.8%) |
Employment Industries by Sex in Speed
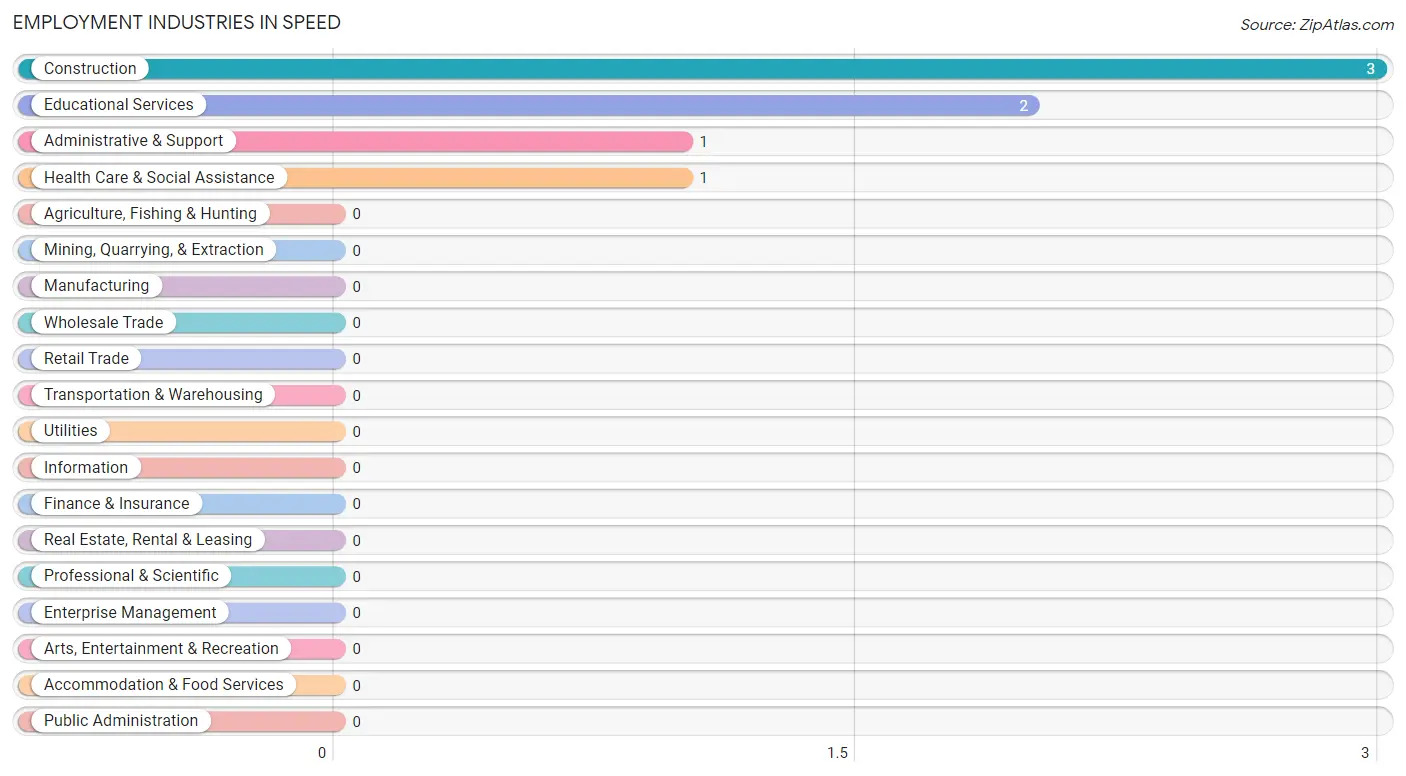
Employment Industries in Speed
The major employment industries in Speed include Construction (3 | 15.8%), Educational Services (2 | 10.5%), Administrative & Support (1 | 5.3%), and Health Care & Social Assistance (1 | 5.3%).
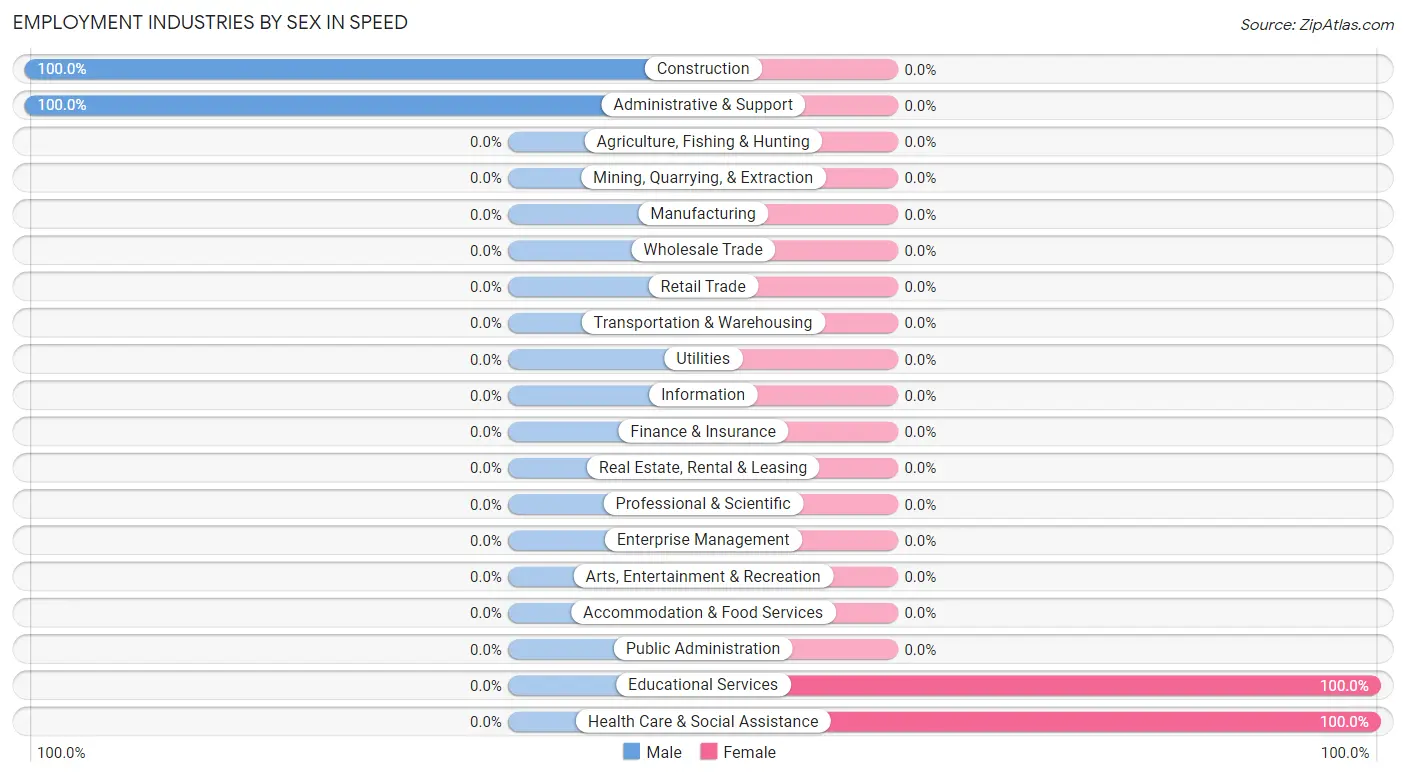
Employment Industries by Sex in Speed
The Speed industries that see more men than women are Construction (100.0%), and Administrative & Support (100.0%), whereas the industries that tend to have a higher number of women are Educational Services (100.0%), and Health Care & Social Assistance (100.0%).
| Industry | Male | Female |
| Agriculture, Fishing & Hunting | 0 (0.0%) | 0 (0.0%) |
| Mining, Quarrying, & Extraction | 0 (0.0%) | 0 (0.0%) |
| Construction | 3 (100.0%) | 0 (0.0%) |
| Manufacturing | 0 (0.0%) | 0 (0.0%) |
| Wholesale Trade | 0 (0.0%) | 0 (0.0%) |
| Retail Trade | 0 (0.0%) | 0 (0.0%) |
| Transportation & Warehousing | 0 (0.0%) | 0 (0.0%) |
| Utilities | 0 (0.0%) | 0 (0.0%) |
| Information | 0 (0.0%) | 0 (0.0%) |
| Finance & Insurance | 0 (0.0%) | 0 (0.0%) |
| Real Estate, Rental & Leasing | 0 (0.0%) | 0 (0.0%) |
| Professional & Scientific | 0 (0.0%) | 0 (0.0%) |
| Enterprise Management | 0 (0.0%) | 0 (0.0%) |
| Administrative & Support | 1 (100.0%) | 0 (0.0%) |
| Educational Services | 0 (0.0%) | 2 (100.0%) |
| Health Care & Social Assistance | 0 (0.0%) | 1 (100.0%) |
| Arts, Entertainment & Recreation | 0 (0.0%) | 0 (0.0%) |
| Accommodation & Food Services | 0 (0.0%) | 0 (0.0%) |
| Public Administration | 0 (0.0%) | 0 (0.0%) |
| Total | 16 (84.2%) | 3 (15.8%) |
Education in Speed
School Enrollment in Speed
| School Level | # Students | % Students |
| Nursery / Preschool | 0 | 0.0% |
| Kindergarten | 0 | 0.0% |
| Elementary School | 0 | 0.0% |
| Middle School | 0 | 0.0% |
| High School | 0 | 0.0% |
| College / Undergraduate | 0 | 0.0% |
| Graduate / Professional | 0 | 0.0% |
| Total | 0 | 0.0% |
School Enrollment by Age by Funding Source in Speed
| Age Bracket | Public School | Private School |
| 3 to 4 Year Olds | 0 (0.0%) | 0 (0.0%) |
| 5 to 9 Year Old | 0 (0.0%) | 0 (0.0%) |
| 10 to 14 Year Olds | 0 (0.0%) | 0 (0.0%) |
| 15 to 17 Year Olds | 0 (0.0%) | 0 (0.0%) |
| 18 to 19 Year Olds | 0 (0.0%) | 0 (0.0%) |
| 20 to 24 Year Olds | 0 (0.0%) | 0 (0.0%) |
| 25 to 34 Year Olds | 0 (0.0%) | 0 (0.0%) |
| 35 Years and over | 0 (0.0%) | 0 (0.0%) |
| Total | 0 (0.0%) | 0 (0.0%) |
Educational Attainment by Field of Study in Speed
, and education (1 | 100.0%) are the most common fields of study among 1 individuals in Speed who have obtained a bachelor's degree or higher.
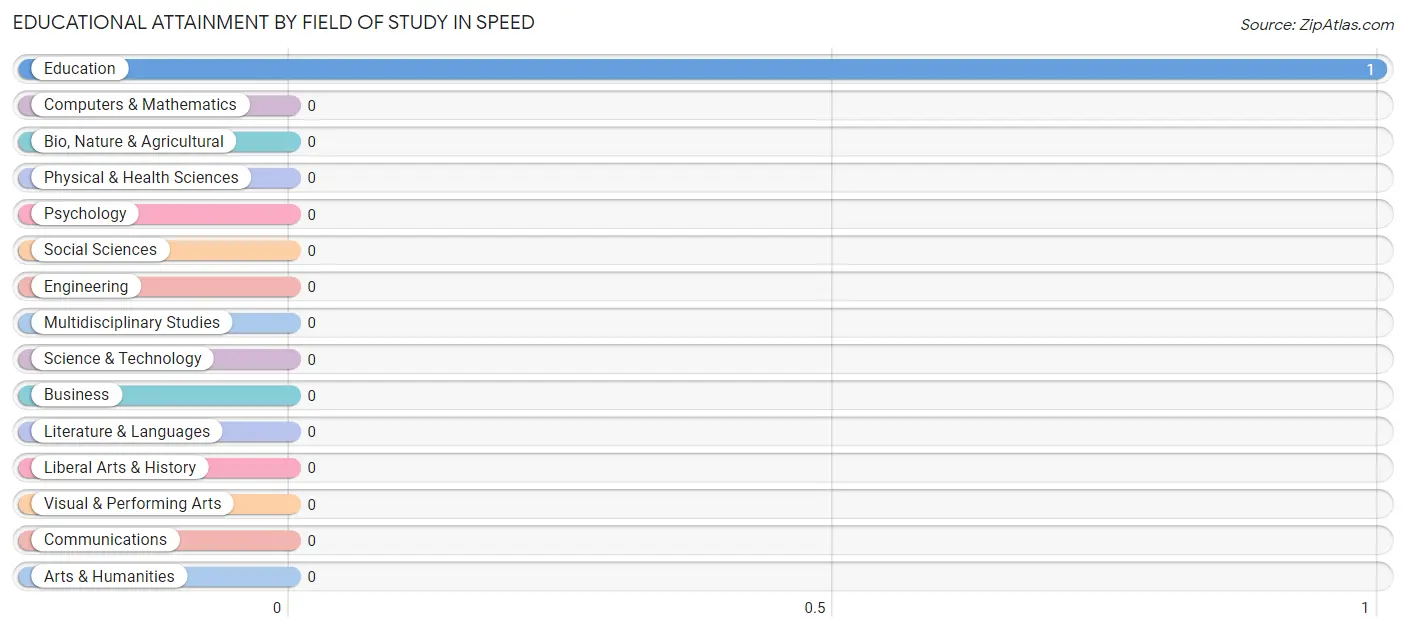
| Field of Study | # Graduates | % Graduates |
| Computers & Mathematics | 0 | 0.0% |
| Bio, Nature & Agricultural | 0 | 0.0% |
| Physical & Health Sciences | 0 | 0.0% |
| Psychology | 0 | 0.0% |
| Social Sciences | 0 | 0.0% |
| Engineering | 0 | 0.0% |
| Multidisciplinary Studies | 0 | 0.0% |
| Science & Technology | 0 | 0.0% |
| Business | 0 | 0.0% |
| Education | 1 | 100.0% |
| Literature & Languages | 0 | 0.0% |
| Liberal Arts & History | 0 | 0.0% |
| Visual & Performing Arts | 0 | 0.0% |
| Communications | 0 | 0.0% |
| Arts & Humanities | 0 | 0.0% |
| Total | 1 | 100.0% |
Transportation & Commute in Speed
Vehicle Availability by Sex in Speed
The most prevalent vehicle ownership categories in Speed are males with 3 vehicles (12, accounting for 75.0%) and females with 3 vehicles (2, making up 400.0%).
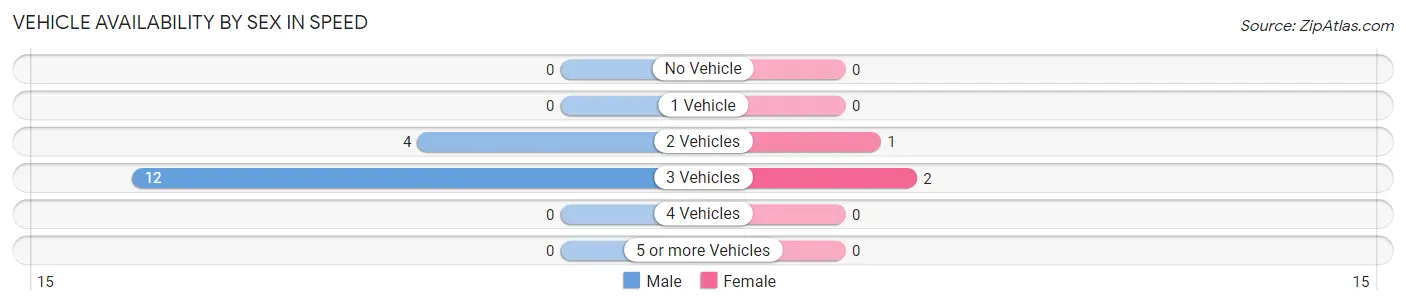
| Vehicles Available | Male | Female |
| No Vehicle | 0 (0.0%) | 0 (0.0%) |
| 1 Vehicle | 0 (0.0%) | 0 (0.0%) |
| 2 Vehicles | 4 (25.0%) | 1 (33.3%) |
| 3 Vehicles | 12 (75.0%) | 2 (66.7%) |
| 4 Vehicles | 0 (0.0%) | 0 (0.0%) |
| 5 or more Vehicles | 0 (0.0%) | 0 (0.0%) |
| Total | 16 (100.0%) | 3 (100.0%) |
Commute Time in Speed
The most frequently occuring commute durations in Speed are 30 to 34 minutes (12 commuters, 63.2%), 10 to 14 minutes (3 commuters, 15.8%), and 15 to 19 minutes (2 commuters, 10.5%).
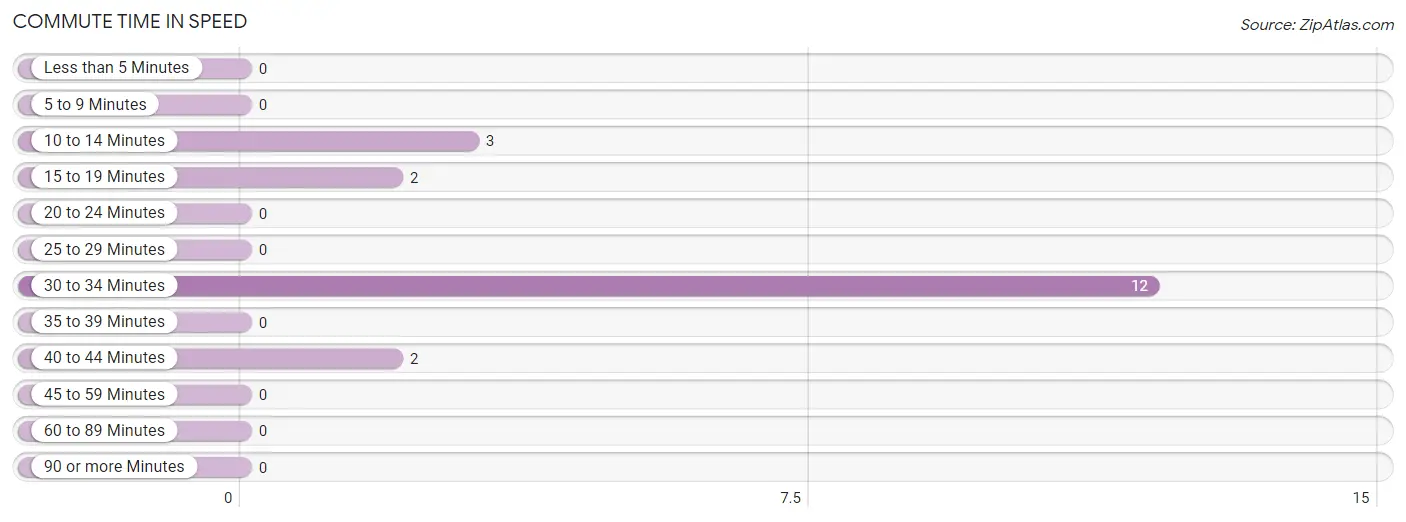
| Commute Time | # Commuters | % Commuters |
| Less than 5 Minutes | 0 | 0.0% |
| 5 to 9 Minutes | 0 | 0.0% |
| 10 to 14 Minutes | 3 | 15.8% |
| 15 to 19 Minutes | 2 | 10.5% |
| 20 to 24 Minutes | 0 | 0.0% |
| 25 to 29 Minutes | 0 | 0.0% |
| 30 to 34 Minutes | 12 | 63.2% |
| 35 to 39 Minutes | 0 | 0.0% |
| 40 to 44 Minutes | 2 | 10.5% |
| 45 to 59 Minutes | 0 | 0.0% |
| 60 to 89 Minutes | 0 | 0.0% |
| 90 or more Minutes | 0 | 0.0% |
Commute Time by Sex in Speed
The most common commute times in Speed are 30 to 34 minutes (12 commuters, 75.0%) for males and 10 to 14 minutes (2 commuters, 66.7%) for females.
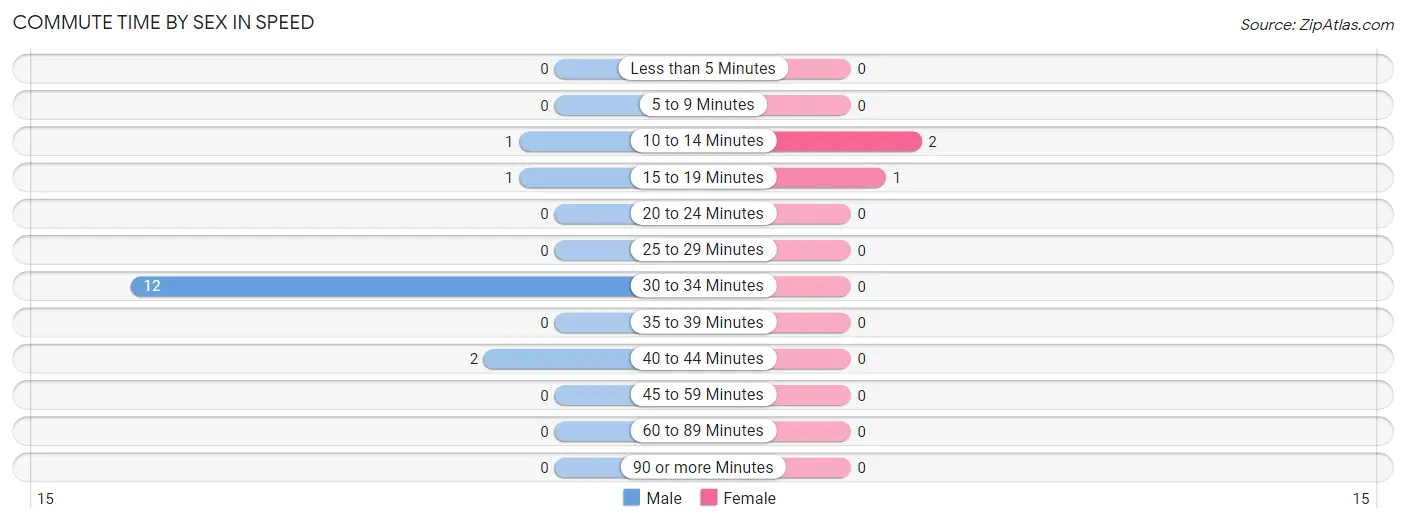
| Commute Time | Male | Female |
| Less than 5 Minutes | 0 (0.0%) | 0 (0.0%) |
| 5 to 9 Minutes | 0 (0.0%) | 0 (0.0%) |
| 10 to 14 Minutes | 1 (6.2%) | 2 (66.7%) |
| 15 to 19 Minutes | 1 (6.2%) | 1 (33.3%) |
| 20 to 24 Minutes | 0 (0.0%) | 0 (0.0%) |
| 25 to 29 Minutes | 0 (0.0%) | 0 (0.0%) |
| 30 to 34 Minutes | 12 (75.0%) | 0 (0.0%) |
| 35 to 39 Minutes | 0 (0.0%) | 0 (0.0%) |
| 40 to 44 Minutes | 2 (12.5%) | 0 (0.0%) |
| 45 to 59 Minutes | 0 (0.0%) | 0 (0.0%) |
| 60 to 89 Minutes | 0 (0.0%) | 0 (0.0%) |
| 90 or more Minutes | 0 (0.0%) | 0 (0.0%) |
Time of Departure to Work by Sex in Speed
The most frequent times of departure to work in Speed are 7:00 AM to 7:29 AM (12, 75.0%) for males and 7:30 AM to 7:59 AM (3, 100.0%) for females.
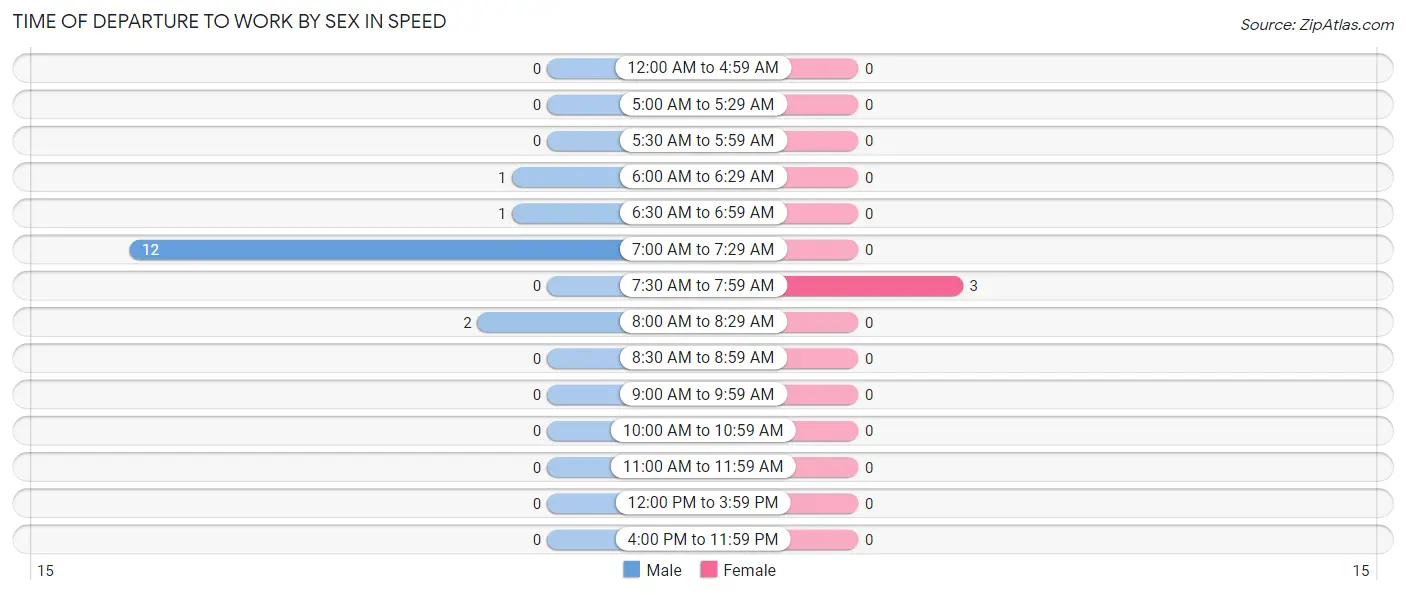
| Time of Departure | Male | Female |
| 12:00 AM to 4:59 AM | 0 (0.0%) | 0 (0.0%) |
| 5:00 AM to 5:29 AM | 0 (0.0%) | 0 (0.0%) |
| 5:30 AM to 5:59 AM | 0 (0.0%) | 0 (0.0%) |
| 6:00 AM to 6:29 AM | 1 (6.2%) | 0 (0.0%) |
| 6:30 AM to 6:59 AM | 1 (6.2%) | 0 (0.0%) |
| 7:00 AM to 7:29 AM | 12 (75.0%) | 0 (0.0%) |
| 7:30 AM to 7:59 AM | 0 (0.0%) | 3 (100.0%) |
| 8:00 AM to 8:29 AM | 2 (12.5%) | 0 (0.0%) |
| 8:30 AM to 8:59 AM | 0 (0.0%) | 0 (0.0%) |
| 9:00 AM to 9:59 AM | 0 (0.0%) | 0 (0.0%) |
| 10:00 AM to 10:59 AM | 0 (0.0%) | 0 (0.0%) |
| 11:00 AM to 11:59 AM | 0 (0.0%) | 0 (0.0%) |
| 12:00 PM to 3:59 PM | 0 (0.0%) | 0 (0.0%) |
| 4:00 PM to 11:59 PM | 0 (0.0%) | 0 (0.0%) |
| Total | 16 (100.0%) | 3 (100.0%) |
Housing Occupancy in Speed
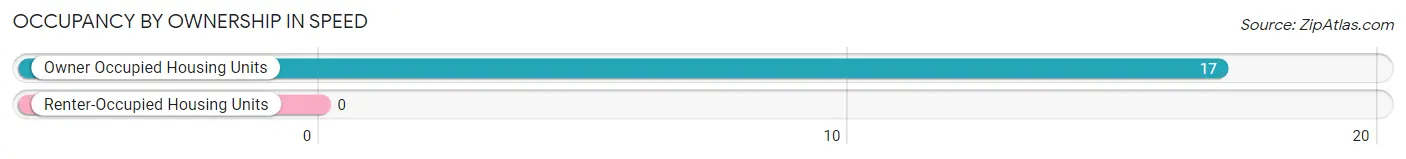
Occupancy by Ownership in Speed
Of the total 17 dwellings in Speed, owner-occupied units account for 17 (100.0%), while renter-occupied units make up 0 (0.0%).
| Occupancy | # Housing Units | % Housing Units |
| Owner Occupied Housing Units | 17 | 100.0% |
| Renter-Occupied Housing Units | 0 | 0.0% |
| Total Occupied Housing Units | 17 | 100.0% |
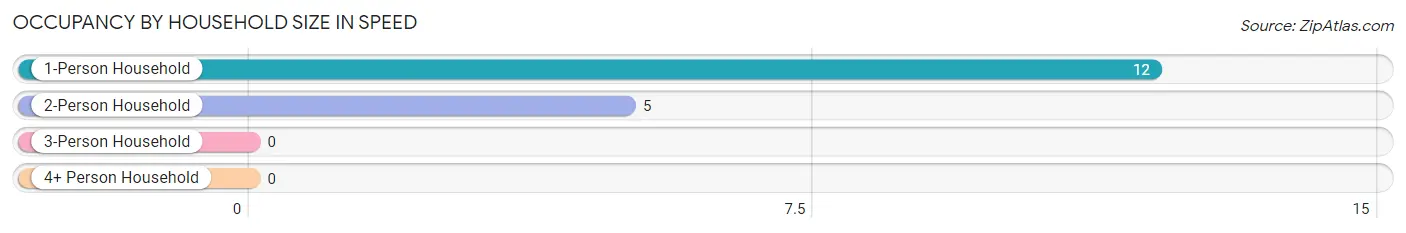
Occupancy by Household Size in Speed
| Household Size | # Housing Units | % Housing Units |
| 1-Person Household | 12 | 70.6% |
| 2-Person Household | 5 | 29.4% |
| 3-Person Household | 0 | 0.0% |
| 4+ Person Household | 0 | 0.0% |
| Total Housing Units | 17 | 100.0% |
Occupancy by Ownership by Household Size in Speed
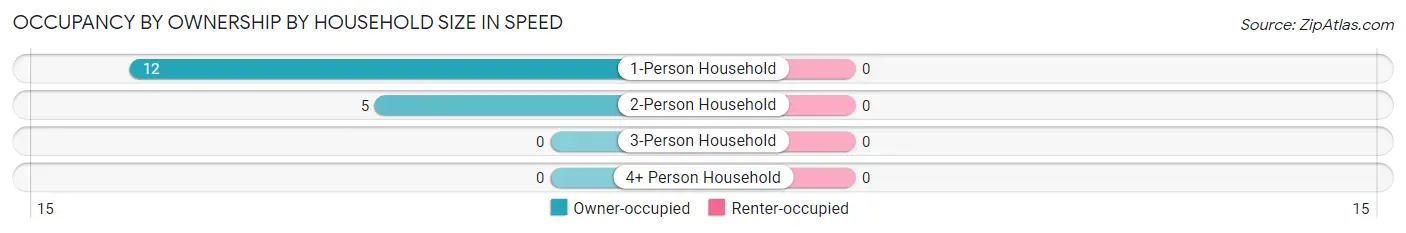
| Household Size | Owner-occupied | Renter-occupied |
| 1-Person Household | 12 (100.0%) | 0 (0.0%) |
| 2-Person Household | 5 (100.0%) | 0 (0.0%) |
| 3-Person Household | 0 (0.0%) | 0 (0.0%) |
| 4+ Person Household | 0 (0.0%) | 0 (0.0%) |
| Total Housing Units | 17 (100.0%) | 0 (0.0%) |
Occupancy by Educational Attainment in Speed
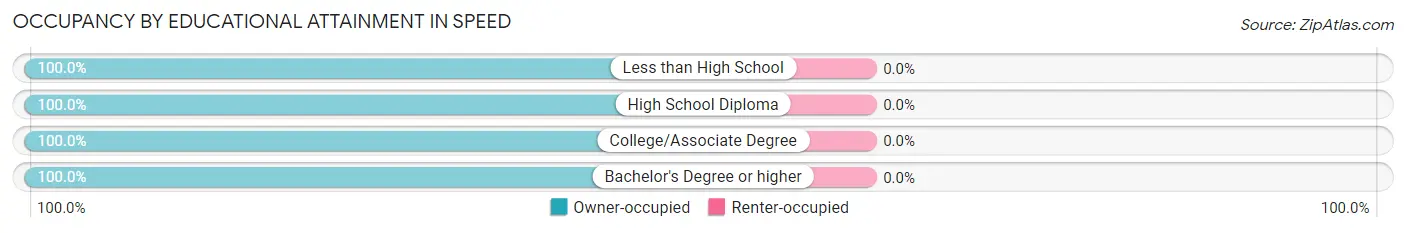
| Household Size | Owner-occupied | Renter-occupied |
| Less than High School | 1 (100.0%) | 0 (0.0%) |
| High School Diploma | 13 (100.0%) | 0 (0.0%) |
| College/Associate Degree | 2 (100.0%) | 0 (0.0%) |
| Bachelor's Degree or higher | 1 (100.0%) | 0 (0.0%) |
Occupancy by Age of Householder in Speed
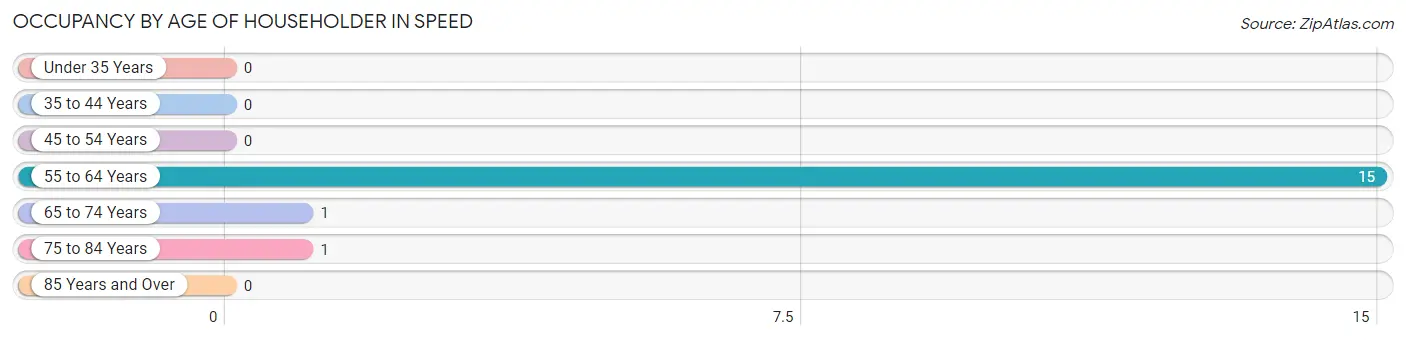
| Age Bracket | # Households | % Households |
| Under 35 Years | 0 | 0.0% |
| 35 to 44 Years | 0 | 0.0% |
| 45 to 54 Years | 0 | 0.0% |
| 55 to 64 Years | 15 | 88.2% |
| 65 to 74 Years | 1 | 5.9% |
| 75 to 84 Years | 1 | 5.9% |
| 85 Years and Over | 0 | 0.0% |
| Total | 17 | 100.0% |
Housing Finances in Speed
Median Income by Occupancy in Speed
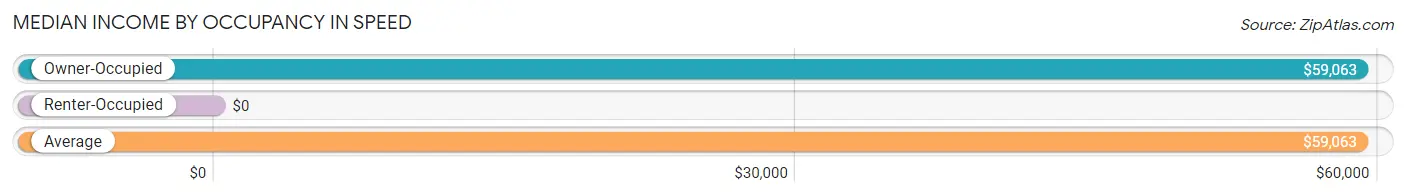
| Occupancy Type | # Households | Median Income |
| Owner-Occupied | 17 (100.0%) | $59,063 |
| Renter-Occupied | 0 (0.0%) | $0 |
| Average | 17 (100.0%) | $59,063 |
Occupancy by Householder Income Bracket in Speed
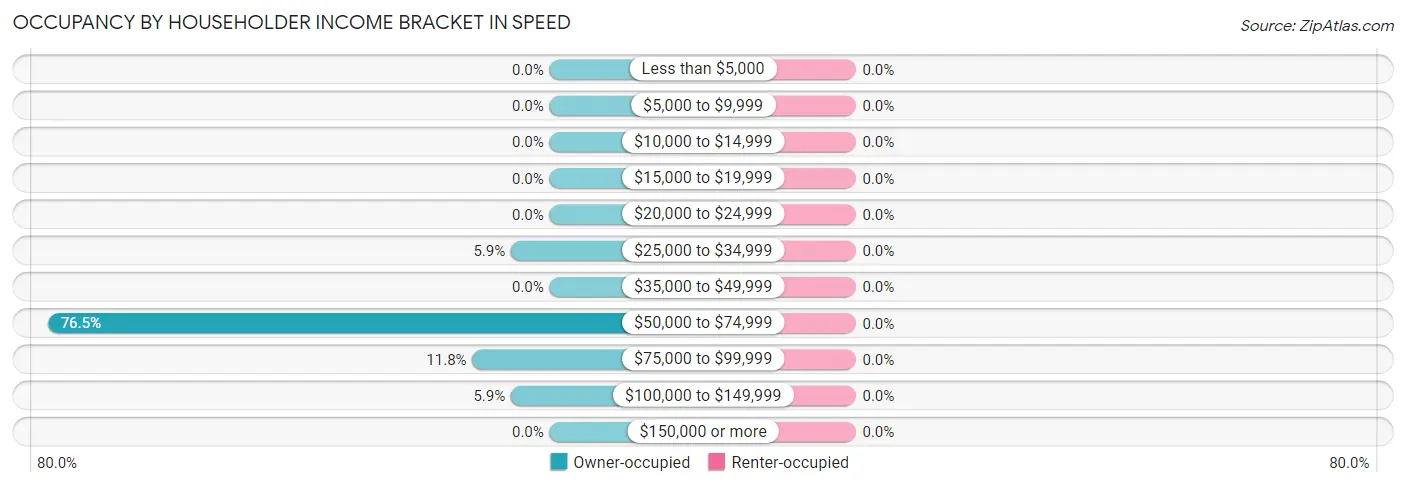
| Income Bracket | Owner-occupied | Renter-occupied |
| Less than $5,000 | 0 (0.0%) | 0 (0.0%) |
| $5,000 to $9,999 | 0 (0.0%) | 0 (0.0%) |
| $10,000 to $14,999 | 0 (0.0%) | 0 (0.0%) |
| $15,000 to $19,999 | 0 (0.0%) | 0 (0.0%) |
| $20,000 to $24,999 | 0 (0.0%) | 0 (0.0%) |
| $25,000 to $34,999 | 1 (5.9%) | 0 (0.0%) |
| $35,000 to $49,999 | 0 (0.0%) | 0 (0.0%) |
| $50,000 to $74,999 | 13 (76.5%) | 0 (0.0%) |
| $75,000 to $99,999 | 2 (11.8%) | 0 (0.0%) |
| $100,000 to $149,999 | 1 (5.9%) | 0 (0.0%) |
| $150,000 or more | 0 (0.0%) | 0 (0.0%) |
| Total | 17 (100.0%) | 0 (0.0%) |
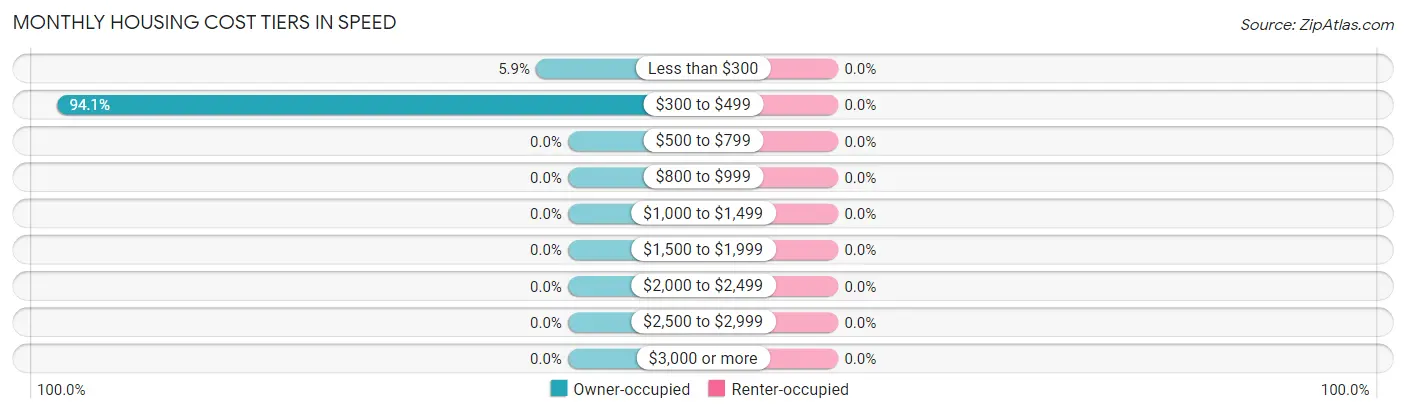
Monthly Housing Cost Tiers in Speed
| Monthly Cost | Owner-occupied | Renter-occupied |
| Less than $300 | 1 (5.9%) | 0 (0.0%) |
| $300 to $499 | 16 (94.1%) | 0 (0.0%) |
| $500 to $799 | 0 (0.0%) | 0 (0.0%) |
| $800 to $999 | 0 (0.0%) | 0 (0.0%) |
| $1,000 to $1,499 | 0 (0.0%) | 0 (0.0%) |
| $1,500 to $1,999 | 0 (0.0%) | 0 (0.0%) |
| $2,000 to $2,499 | 0 (0.0%) | 0 (0.0%) |
| $2,500 to $2,999 | 0 (0.0%) | 0 (0.0%) |
| $3,000 or more | 0 (0.0%) | 0 (0.0%) |
| Total | 17 (100.0%) | 0 (0.0%) |
Physical Housing Characteristics in Speed
Housing Structures in Speed
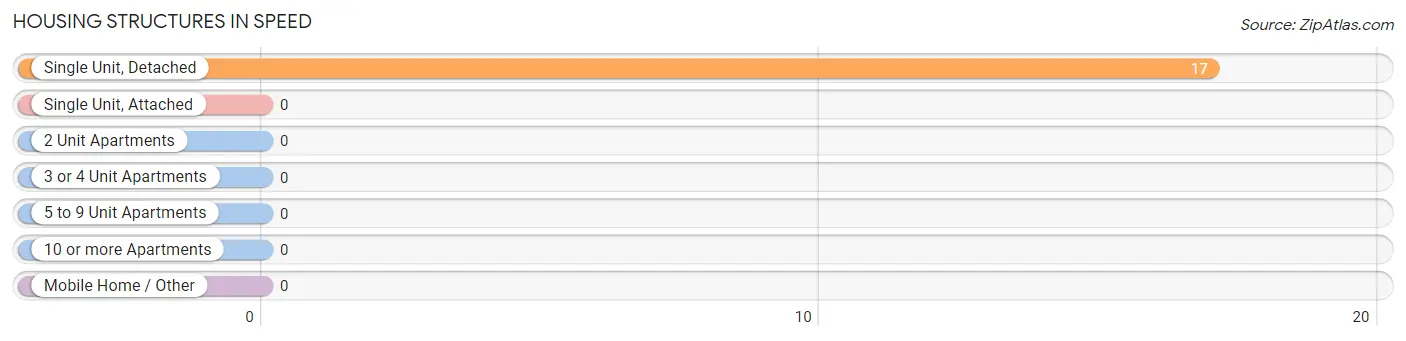
| Structure Type | # Housing Units | % Housing Units |
| Single Unit, Detached | 17 | 100.0% |
| Single Unit, Attached | 0 | 0.0% |
| 2 Unit Apartments | 0 | 0.0% |
| 3 or 4 Unit Apartments | 0 | 0.0% |
| 5 to 9 Unit Apartments | 0 | 0.0% |
| 10 or more Apartments | 0 | 0.0% |
| Mobile Home / Other | 0 | 0.0% |
| Total | 17 | 100.0% |
Housing Structures by Occupancy in Speed
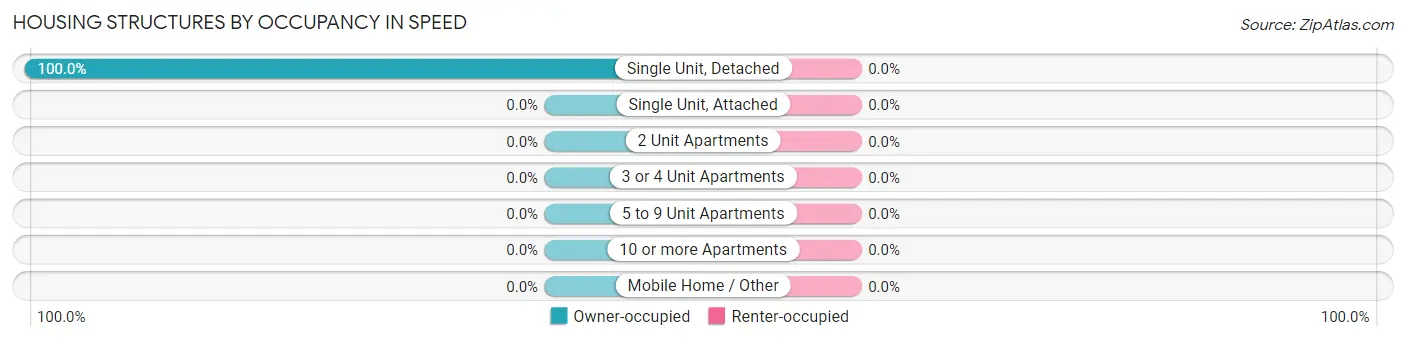
| Structure Type | Owner-occupied | Renter-occupied |
| Single Unit, Detached | 17 (100.0%) | 0 (0.0%) |
| Single Unit, Attached | 0 (0.0%) | 0 (0.0%) |
| 2 Unit Apartments | 0 (0.0%) | 0 (0.0%) |
| 3 or 4 Unit Apartments | 0 (0.0%) | 0 (0.0%) |
| 5 to 9 Unit Apartments | 0 (0.0%) | 0 (0.0%) |
| 10 or more Apartments | 0 (0.0%) | 0 (0.0%) |
| Mobile Home / Other | 0 (0.0%) | 0 (0.0%) |
| Total | 17 (100.0%) | 0 (0.0%) |
Housing Structures by Number of Rooms in Speed
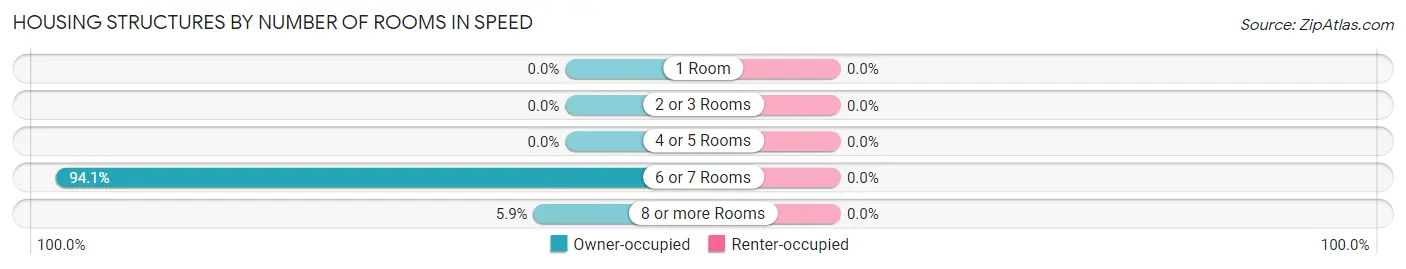
| Number of Rooms | Owner-occupied | Renter-occupied |
| 1 Room | 0 (0.0%) | 0 (0.0%) |
| 2 or 3 Rooms | 0 (0.0%) | 0 (0.0%) |
| 4 or 5 Rooms | 0 (0.0%) | 0 (0.0%) |
| 6 or 7 Rooms | 16 (94.1%) | 0 (0.0%) |
| 8 or more Rooms | 1 (5.9%) | 0 (0.0%) |
| Total | 17 (100.0%) | 0 (0.0%) |
Housing Structure by Heating Type in Speed
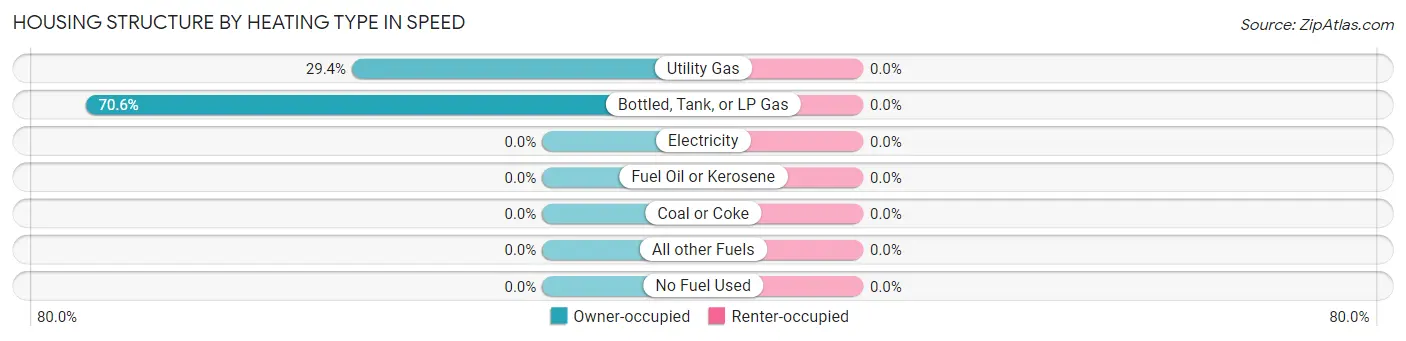
| Heating Type | Owner-occupied | Renter-occupied |
| Utility Gas | 5 (29.4%) | 0 (0.0%) |
| Bottled, Tank, or LP Gas | 12 (70.6%) | 0 (0.0%) |
| Electricity | 0 (0.0%) | 0 (0.0%) |
| Fuel Oil or Kerosene | 0 (0.0%) | 0 (0.0%) |
| Coal or Coke | 0 (0.0%) | 0 (0.0%) |
| All other Fuels | 0 (0.0%) | 0 (0.0%) |
| No Fuel Used | 0 (0.0%) | 0 (0.0%) |
| Total | 17 (100.0%) | 0 (0.0%) |
Household Vehicle Usage in Speed
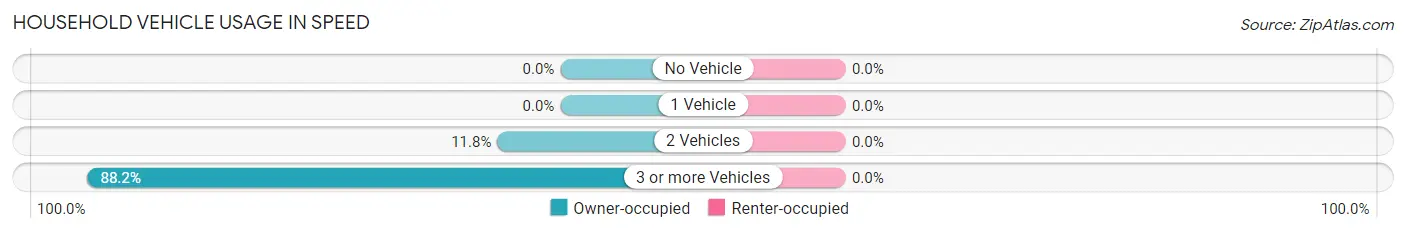
| Vehicles per Household | Owner-occupied | Renter-occupied |
| No Vehicle | 0 (0.0%) | 0 (0.0%) |
| 1 Vehicle | 0 (0.0%) | 0 (0.0%) |
| 2 Vehicles | 2 (11.8%) | 0 (0.0%) |
| 3 or more Vehicles | 15 (88.2%) | 0 (0.0%) |
| Total | 17 (100.0%) | 0 (0.0%) |
Real Estate & Mortgages in Speed
Real Estate and Mortgage Overview in Speed
| Characteristic | Without Mortgage | With Mortgage |
| Housing Units | 17 | 0 |
| Median Property Value | $28,100 | $0 |
| Median Household Income | $59,063 | $0 |
| Monthly Housing Costs | $447 | $0 |
| Real Estate Taxes | $271 | $0 |
Property Value by Mortgage Status in Speed
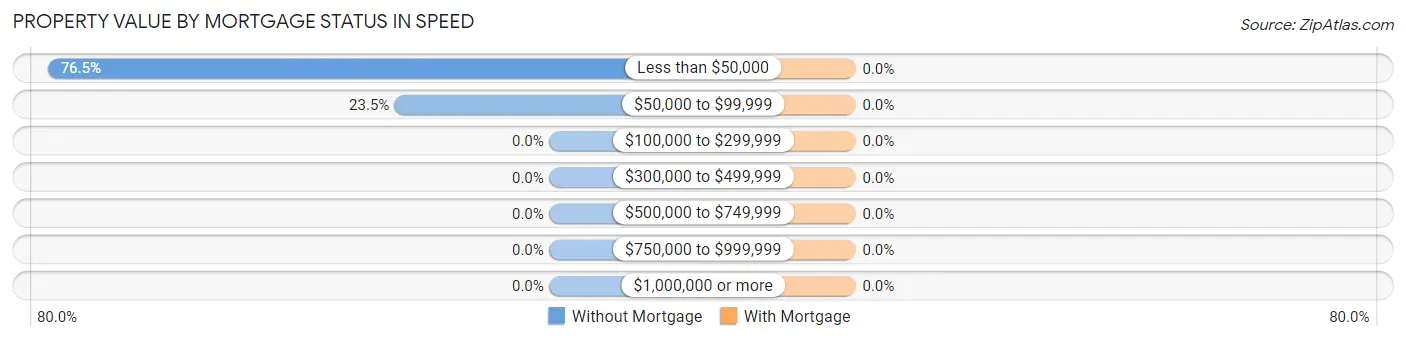
| Property Value | Without Mortgage | With Mortgage |
| Less than $50,000 | 13 (76.5%) | 0 (0.0%) |
| $50,000 to $99,999 | 4 (23.5%) | 0 (0.0%) |
| $100,000 to $299,999 | 0 (0.0%) | 0 (0.0%) |
| $300,000 to $499,999 | 0 (0.0%) | 0 (0.0%) |
| $500,000 to $749,999 | 0 (0.0%) | 0 (0.0%) |
| $750,000 to $999,999 | 0 (0.0%) | 0 (0.0%) |
| $1,000,000 or more | 0 (0.0%) | 0 (0.0%) |
| Total | 17 (100.0%) | 0 (0.0%) |
Household Income by Mortgage Status in Speed
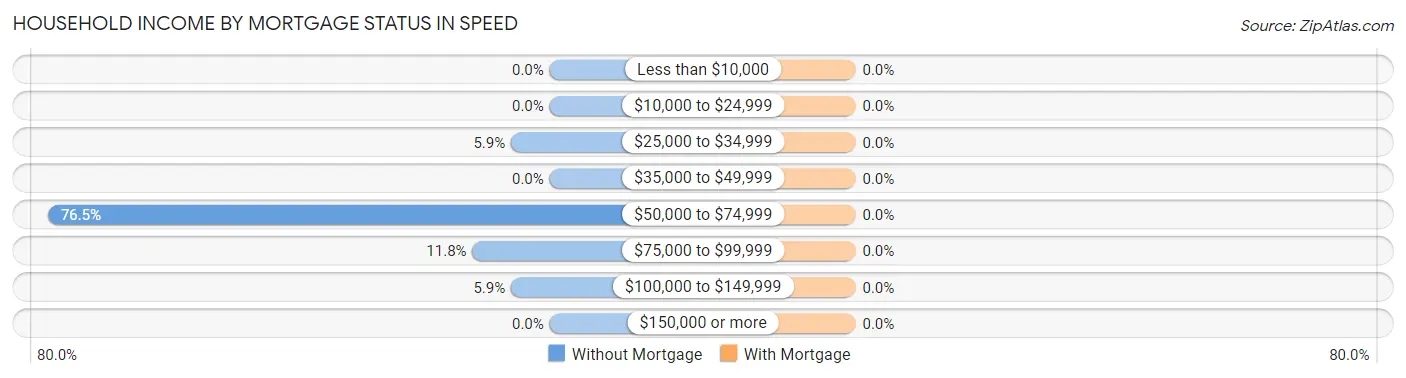
| Household Income | Without Mortgage | With Mortgage |
| Less than $10,000 | 0 (0.0%) | 0 (0.0%) |
| $10,000 to $24,999 | 0 (0.0%) | 0 (0.0%) |
| $25,000 to $34,999 | 1 (5.9%) | 0 (0.0%) |
| $35,000 to $49,999 | 0 (0.0%) | 0 (0.0%) |
| $50,000 to $74,999 | 13 (76.5%) | 0 (0.0%) |
| $75,000 to $99,999 | 2 (11.8%) | 0 (0.0%) |
| $100,000 to $149,999 | 1 (5.9%) | 0 (0.0%) |
| $150,000 or more | 0 (0.0%) | 0 (0.0%) |
| Total | 17 (100.0%) | 0 (0.0%) |
Property Value to Household Income Ratio in Speed
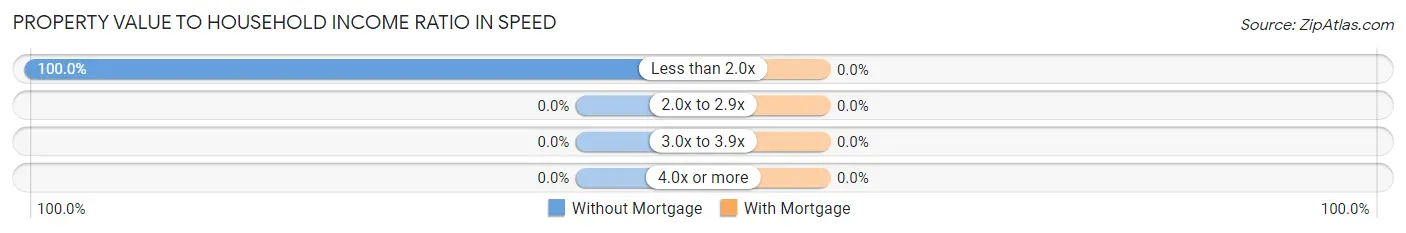
| Value-to-Income Ratio | Without Mortgage | With Mortgage |
| Less than 2.0x | 17 (100.0%) | 0 (0.0%) |
| 2.0x to 2.9x | 0 (0.0%) | 0 (0.0%) |
| 3.0x to 3.9x | 0 (0.0%) | 0 (0.0%) |
| 4.0x or more | 0 (0.0%) | 0 (0.0%) |
| Total | 17 (100.0%) | 0 (0.0%) |
Real Estate Taxes by Mortgage Status in Speed
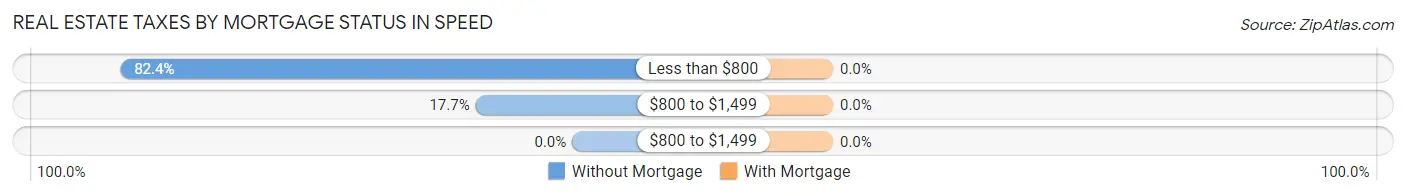
| Property Taxes | Without Mortgage | With Mortgage |
| Less than $800 | 14 (82.4%) | 0 (0.0%) |
| $800 to $1,499 | 3 (17.6%) | 0 (0.0%) |
| $800 to $1,499 | 0 (0.0%) | 0 (0.0%) |
| Total | 17 (100.0%) | 0 (0.0%) |
Health & Disability in Speed
Health Insurance Coverage by Age in Speed
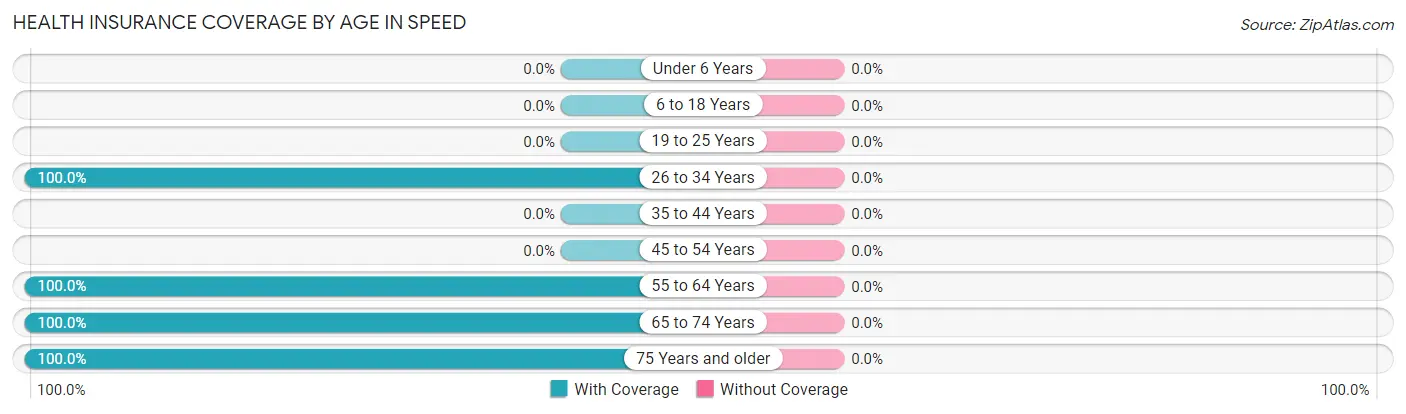
| Age Bracket | With Coverage | Without Coverage |
| Under 6 Years | 0 (0.0%) | 0 (0.0%) |
| 6 to 18 Years | 0 (0.0%) | 0 (0.0%) |
| 19 to 25 Years | 0 (0.0%) | 0 (0.0%) |
| 26 to 34 Years | 2 (100.0%) | 0 (0.0%) |
| 35 to 44 Years | 0 (0.0%) | 0 (0.0%) |
| 45 to 54 Years | 0 (0.0%) | 0 (0.0%) |
| 55 to 64 Years | 16 (100.0%) | 0 (0.0%) |
| 65 to 74 Years | 3 (100.0%) | 0 (0.0%) |
| 75 Years and older | 1 (100.0%) | 0 (0.0%) |
| Total | 22 (100.0%) | 0 (0.0%) |
Health Insurance Coverage by Citizenship Status in Speed
| Citizenship Status | With Coverage | Without Coverage |
| Native Born | 0 (0.0%) | 0 (0.0%) |
| Foreign Born, Citizen | 0 (0.0%) | 0 (0.0%) |
| Foreign Born, not a Citizen | 0 (0.0%) | 0 (0.0%) |
Health Insurance Coverage by Household Income in Speed
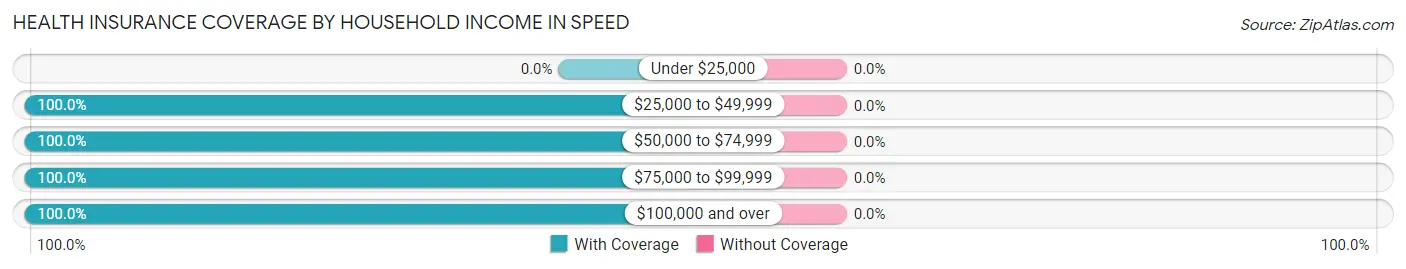
| Household Income | With Coverage | Without Coverage |
| Under $25,000 | 0 (0.0%) | 0 (0.0%) |
| $25,000 to $49,999 | 2 (100.0%) | 0 (0.0%) |
| $50,000 to $74,999 | 14 (100.0%) | 0 (0.0%) |
| $75,000 to $99,999 | 3 (100.0%) | 0 (0.0%) |
| $100,000 and over | 3 (100.0%) | 0 (0.0%) |
Public vs Private Health Insurance Coverage by Age in Speed
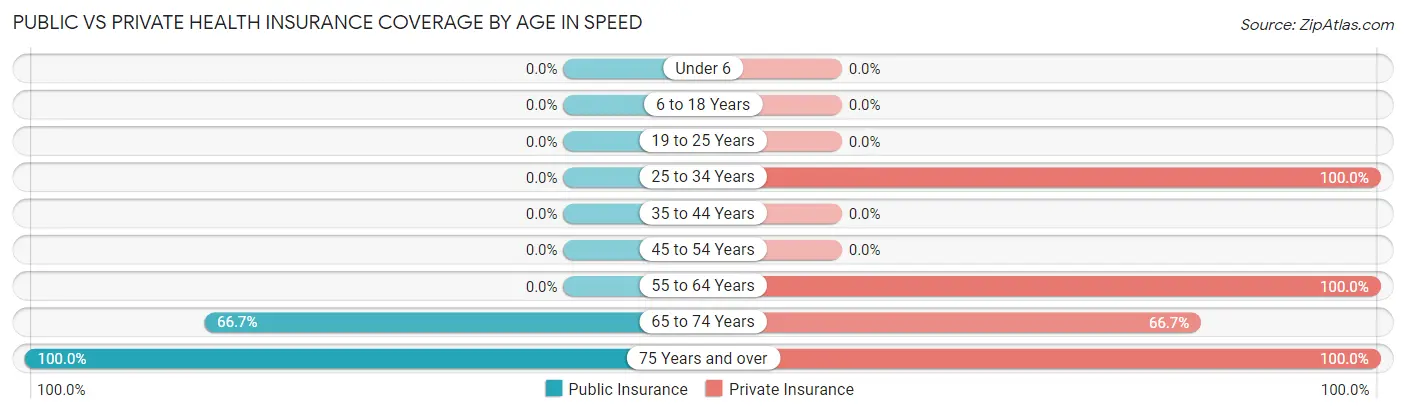
| Age Bracket | Public Insurance | Private Insurance |
| Under 6 | 0 (0.0%) | 0 (0.0%) |
| 6 to 18 Years | 0 (0.0%) | 0 (0.0%) |
| 19 to 25 Years | 0 (0.0%) | 0 (0.0%) |
| 25 to 34 Years | 0 (0.0%) | 2 (100.0%) |
| 35 to 44 Years | 0 (0.0%) | 0 (0.0%) |
| 45 to 54 Years | 0 (0.0%) | 0 (0.0%) |
| 55 to 64 Years | 0 (0.0%) | 16 (100.0%) |
| 65 to 74 Years | 2 (66.7%) | 2 (66.7%) |
| 75 Years and over | 1 (100.0%) | 1 (100.0%) |
| Total | 3 (13.6%) | 21 (95.5%) |
Disability Status by Sex by Age in Speed
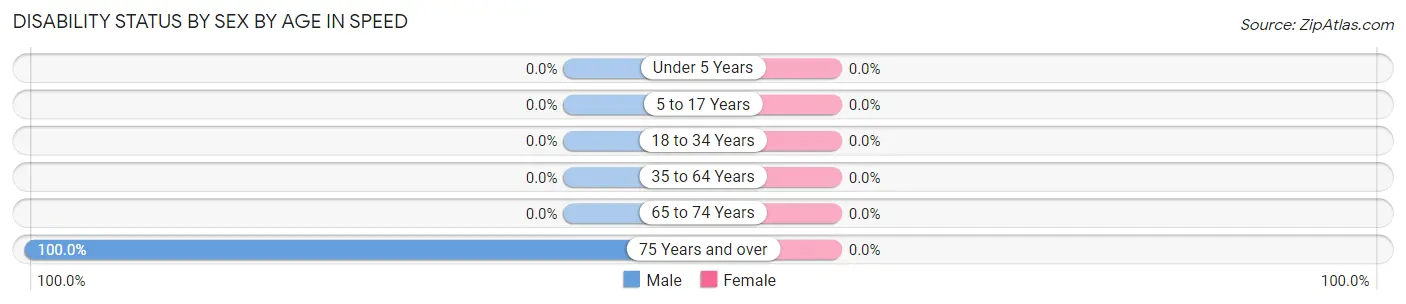
| Age Bracket | Male | Female |
| Under 5 Years | 0 (0.0%) | 0 (0.0%) |
| 5 to 17 Years | 0 (0.0%) | 0 (0.0%) |
| 18 to 34 Years | 0 (0.0%) | 0 (0.0%) |
| 35 to 64 Years | 0 (0.0%) | 0 (0.0%) |
| 65 to 74 Years | 0 (0.0%) | 0 (0.0%) |
| 75 Years and over | 1 (100.0%) | 0 (0.0%) |
Disability Class by Sex by Age in Speed
Disability Class: Hearing Difficulty
| Age Bracket | Male | Female |
| Under 5 Years | 0 (0.0%) | 0 (0.0%) |
| 5 to 17 Years | 0 (0.0%) | 0 (0.0%) |
| 18 to 34 Years | 0 (0.0%) | 0 (0.0%) |
| 35 to 64 Years | 0 (0.0%) | 0 (0.0%) |
| 65 to 74 Years | 0 (0.0%) | 0 (0.0%) |
| 75 Years and over | 1 (100.0%) | 0 (0.0%) |
Disability Class: Vision Difficulty
| Age Bracket | Male | Female |
| Under 5 Years | 0 (0.0%) | 0 (0.0%) |
| 5 to 17 Years | 0 (0.0%) | 0 (0.0%) |
| 18 to 34 Years | 0 (0.0%) | 0 (0.0%) |
| 35 to 64 Years | 0 (0.0%) | 0 (0.0%) |
| 65 to 74 Years | 0 (0.0%) | 0 (0.0%) |
| 75 Years and over | 1 (100.0%) | 0 (0.0%) |
Disability Class: Cognitive Difficulty
| Age Bracket | Male | Female |
| 5 to 17 Years | 0 (0.0%) | 0 (0.0%) |
| 18 to 34 Years | 0 (0.0%) | 0 (0.0%) |
| 35 to 64 Years | 0 (0.0%) | 0 (0.0%) |
| 65 to 74 Years | 0 (0.0%) | 0 (0.0%) |
| 75 Years and over | 0 (0.0%) | 0 (0.0%) |
Disability Class: Ambulatory Difficulty
| Age Bracket | Male | Female |
| 5 to 17 Years | 0 (0.0%) | 0 (0.0%) |
| 18 to 34 Years | 0 (0.0%) | 0 (0.0%) |
| 35 to 64 Years | 0 (0.0%) | 0 (0.0%) |
| 65 to 74 Years | 0 (0.0%) | 0 (0.0%) |
| 75 Years and over | 0 (0.0%) | 0 (0.0%) |
Disability Class: Self-Care Difficulty
| Age Bracket | Male | Female |
| 5 to 17 Years | 0 (0.0%) | 0 (0.0%) |
| 18 to 34 Years | 0 (0.0%) | 0 (0.0%) |
| 35 to 64 Years | 0 (0.0%) | 0 (0.0%) |
| 65 to 74 Years | 0 (0.0%) | 0 (0.0%) |
| 75 Years and over | 0 (0.0%) | 0 (0.0%) |
Technology Access in Speed
Computing Device Access in Speed
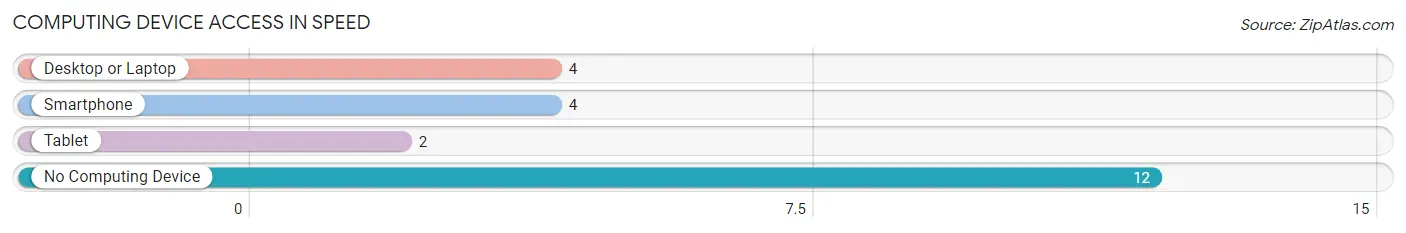
| Device Type | # Households | % Households |
| Desktop or Laptop | 4 | 23.5% |
| Smartphone | 4 | 23.5% |
| Tablet | 2 | 11.8% |
| No Computing Device | 12 | 70.6% |
| Total | 17 | 100.0% |
Internet Access in Speed
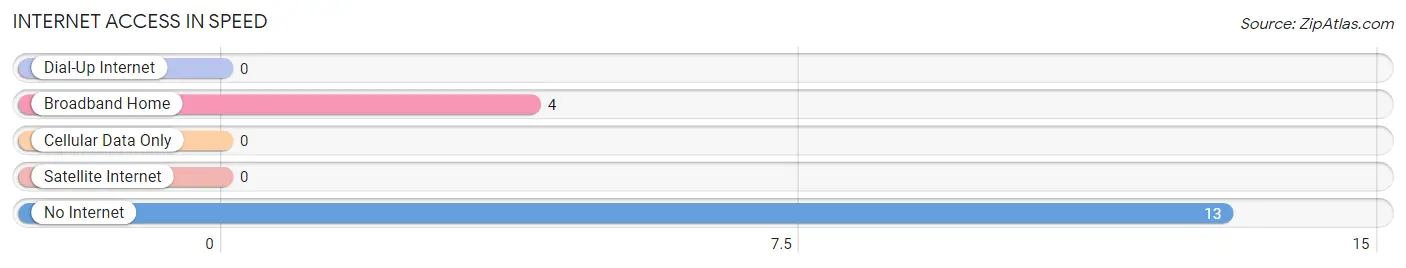
| Internet Type | # Households | % Households |
| Dial-Up Internet | 0 | 0.0% |
| Broadband Home | 4 | 23.5% |
| Cellular Data Only | 0 | 0.0% |
| Satellite Internet | 0 | 0.0% |
| No Internet | 13 | 76.5% |
| Total | 17 | 100.0% |
Speed Summary
Kansas is a state located in the Midwestern United States. It is bordered by Nebraska to the north, Missouri to the east, Oklahoma to the south, and Colorado to the west. Kansas is the 15th most populous state in the United States, with an estimated population of 2,913,314 in 2019. The capital of Kansas is Topeka, and its largest city is Wichita.
Geography
Kansas is located in the Great Plains region of the United States. It is the 15th largest state in the country, with an area of 82,278 square miles. The state is divided into 105 counties and 628 cities. The highest point in Kansas is Mount Sunflower, which has an elevation of 4,041 feet. The state is home to several rivers, including the Arkansas, Kansas, Missouri, and Republican.
The climate of Kansas is generally continental, with hot summers and cold winters. The average annual temperature is 54°F, and the average annual precipitation is 28 inches.
History
Kansas was first inhabited by Native American tribes, including the Kansa, Osage, and Pawnee. The first Europeans to explore the area were French fur traders, who arrived in the late 17th century. In 1803, the United States acquired the area as part of the Louisiana Purchase.
In 1854, the Kansas-Nebraska Act was passed, which allowed settlers to decide whether Kansas would become a free or slave state. This led to a period of violence known as “Bleeding Kansas”, as pro-slavery and anti-slavery forces clashed. In 1861, Kansas was admitted to the Union as a free state.
During the American Civil War, Kansas was a major supplier of troops and supplies to the Union Army. After the war, the state experienced a period of rapid growth and development. In the late 19th century, Kansas became a major producer of wheat and other grains.
Economy
Kansas has a diverse economy, with major industries including agriculture, manufacturing, energy, and services. The state is a major producer of wheat, corn, sorghum, and soybeans. Other important agricultural products include cattle, hogs, dairy products, and eggs.
Manufacturing is also an important part of the state’s economy. Major products include aircraft, transportation equipment, machinery, food products, and chemicals. The energy sector is also important, with the state producing oil, natural gas, and coal.
The services sector is the largest part of the state’s economy, accounting for over half of the state’s GDP. Major services include finance, insurance, real estate, health care, and tourism.
Demographics
As of 2019, the population of Kansas was estimated to be 2,913,314. The state has a population density of 35.3 people per square mile. The largest racial group in the state is white, making up 79.2% of the population. Other racial groups include African American (7.2%), Hispanic or Latino (7.7%), and Asian (3.2%).
The median household income in Kansas is $56,422, and the median home value is $153,400. The state’s poverty rate is 11.2%, and the unemployment rate is 3.7%.
Conclusion
Kansas is a state located in the Midwestern United States. It is bordered by Nebraska to the north, Missouri to the east, Oklahoma to the south, and Colorado to the west. The state has a diverse economy, with major industries including agriculture, manufacturing, energy, and services. The population of Kansas is estimated to be 2,913,314, with a median household income of $56,422 and a median home value of $153,400.
Common Questions
What is Per Capita Income in Speed?
Per Capita income in Speed is $47,745.
What is the Median Family Income in Speed?
Median Family Income in Speed is $78,125.
What is the Median Household income in Speed?
Median Household Income in Speed is $59,063.
What is Inequality or Gini Index in Speed?
Inequality or Gini Index in Speed is 0.11.
What is the Total Population of Speed?
Total Population of Speed is 22.
What is the Total Male Population of Speed?
Total Male Population of Speed is 18.
What is the Total Female Population of Speed?
Total Female Population of Speed is 4.
What is the Ratio of Males per 100 Females in Speed?
There are 450.00 Males per 100 Females in Speed.
What is the Ratio of Females per 100 Males in Speed?
There are 22.22 Females per 100 Males in Speed.
What is the Median Population Age in Speed?
Median Population Age in Speed is 64.5 Years.
What is the Average Family Size in Speed
Average Family Size in Speed is 2.0 People.
What is the Average Household Size in Speed
Average Household Size in Speed is 1.3 People.
How Large is the Labor Force in Speed?
There are 19 People in the Labor Forcein in Speed.
What is the Percentage of People in the Labor Force in Speed?
86.4% of People are in the Labor Force in Speed.