Vann Crossroads, NC Map & Demographics
Vann Crossroads Map
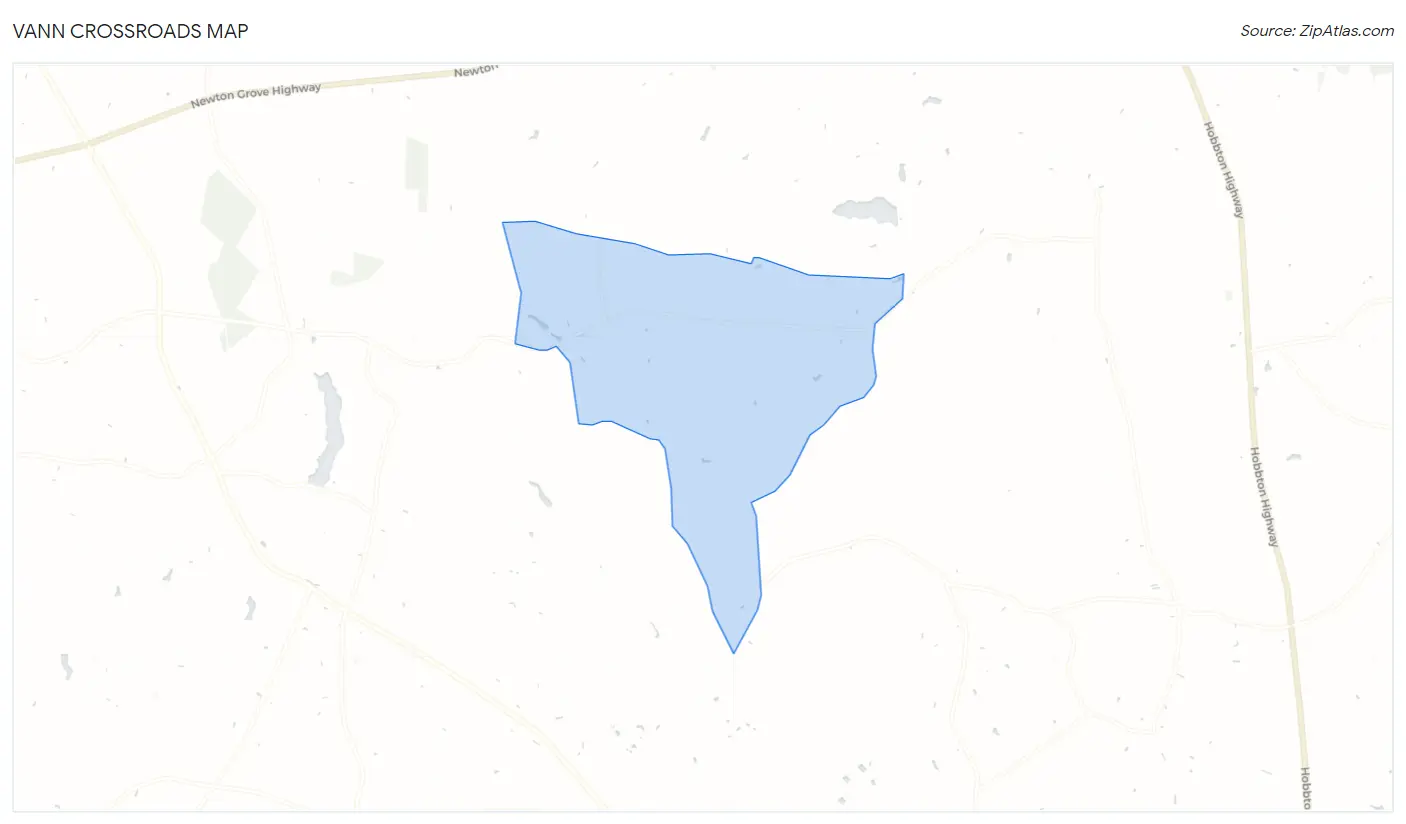
Vann Crossroads Overview
$19,759
PER CAPITA INCOME
$65,613
AVG FAMILY INCOME
0.31
INEQUALITY / GINI INDEX
266
TOTAL POPULATION
112
MALE POPULATION
154
FEMALE POPULATION
72.73
MALES / 100 FEMALES
137.50
FEMALES / 100 MALES
46.0
MEDIAN AGE
2.3
AVG FAMILY SIZE
2.1
AVG HOUSEHOLD SIZE
107
LABOR FORCE [ PEOPLE ]
43.9%
PERCENT IN LABOR FORCE
Income in Vann Crossroads
Income Overview in Vann Crossroads
| Characteristic | Number | Measure |
| Per Capita Income | 266 | $19,759 |
| Median Family Income | 104 | $65,613 |
| Mean Family Income | 104 | $46,690 |
| Median Household Income | 124 | $0 |
| Mean Household Income | 124 | $43,193 |
| Income Deficit | 104 | $0 |
| Wage / Income Gap (%) | 266 | 0.00% |
| Wage / Income Gap ($) | 266 | 100.00¢ per $1 |
| Gini / Inequality Index | 266 | 0.31 |
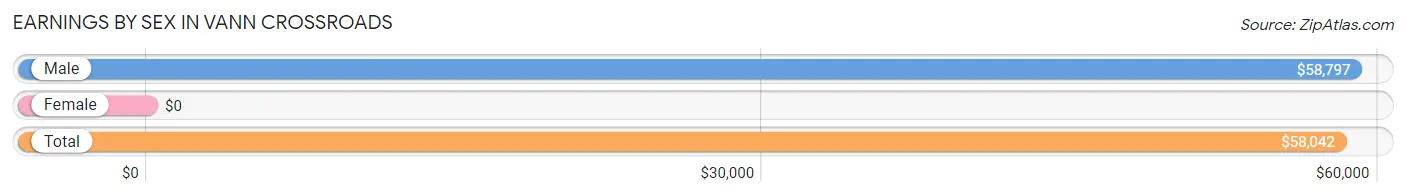
Earnings by Sex in Vann Crossroads
| Sex | Number | Average Earnings |
| Male | 75 (70.1%) | $58,797 |
| Female | 32 (29.9%) | $0 |
| Total | 107 (100.0%) | $58,042 |
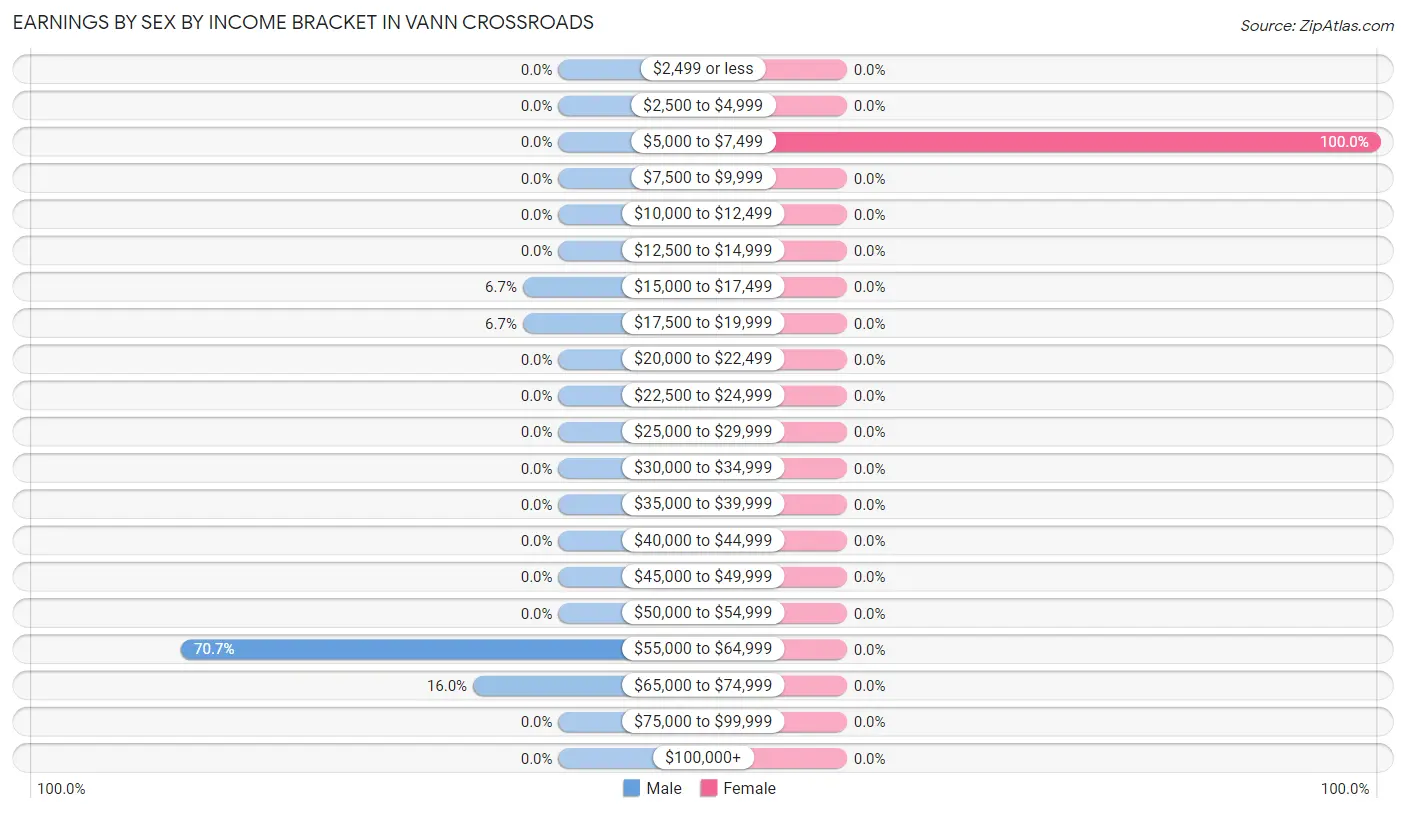
Earnings by Sex by Income Bracket in Vann Crossroads
The most common earnings brackets in Vann Crossroads are $55,000 to $64,999 for men (53 | 70.7%) and $5,000 to $7,499 for women (32 | 100.0%).
| Income | Male | Female |
| $2,499 or less | 0 (0.0%) | 0 (0.0%) |
| $2,500 to $4,999 | 0 (0.0%) | 0 (0.0%) |
| $5,000 to $7,499 | 0 (0.0%) | 32 (100.0%) |
| $7,500 to $9,999 | 0 (0.0%) | 0 (0.0%) |
| $10,000 to $12,499 | 0 (0.0%) | 0 (0.0%) |
| $12,500 to $14,999 | 0 (0.0%) | 0 (0.0%) |
| $15,000 to $17,499 | 5 (6.7%) | 0 (0.0%) |
| $17,500 to $19,999 | 5 (6.7%) | 0 (0.0%) |
| $20,000 to $22,499 | 0 (0.0%) | 0 (0.0%) |
| $22,500 to $24,999 | 0 (0.0%) | 0 (0.0%) |
| $25,000 to $29,999 | 0 (0.0%) | 0 (0.0%) |
| $30,000 to $34,999 | 0 (0.0%) | 0 (0.0%) |
| $35,000 to $39,999 | 0 (0.0%) | 0 (0.0%) |
| $40,000 to $44,999 | 0 (0.0%) | 0 (0.0%) |
| $45,000 to $49,999 | 0 (0.0%) | 0 (0.0%) |
| $50,000 to $54,999 | 0 (0.0%) | 0 (0.0%) |
| $55,000 to $64,999 | 53 (70.7%) | 0 (0.0%) |
| $65,000 to $74,999 | 12 (16.0%) | 0 (0.0%) |
| $75,000 to $99,999 | 0 (0.0%) | 0 (0.0%) |
| $100,000+ | 0 (0.0%) | 0 (0.0%) |
| Total | 75 (100.0%) | 32 (100.0%) |
Earnings by Sex by Educational Attainment in Vann Crossroads
| Educational Attainment | Male Income | Female Income |
| Less than High School | - | - |
| High School Diploma | - | - |
| College or Associate's Degree | - | - |
| Bachelor's Degree | - | - |
| Graduate Degree | - | - |
| Total | $58,797 | $0 |
Family Income in Vann Crossroads
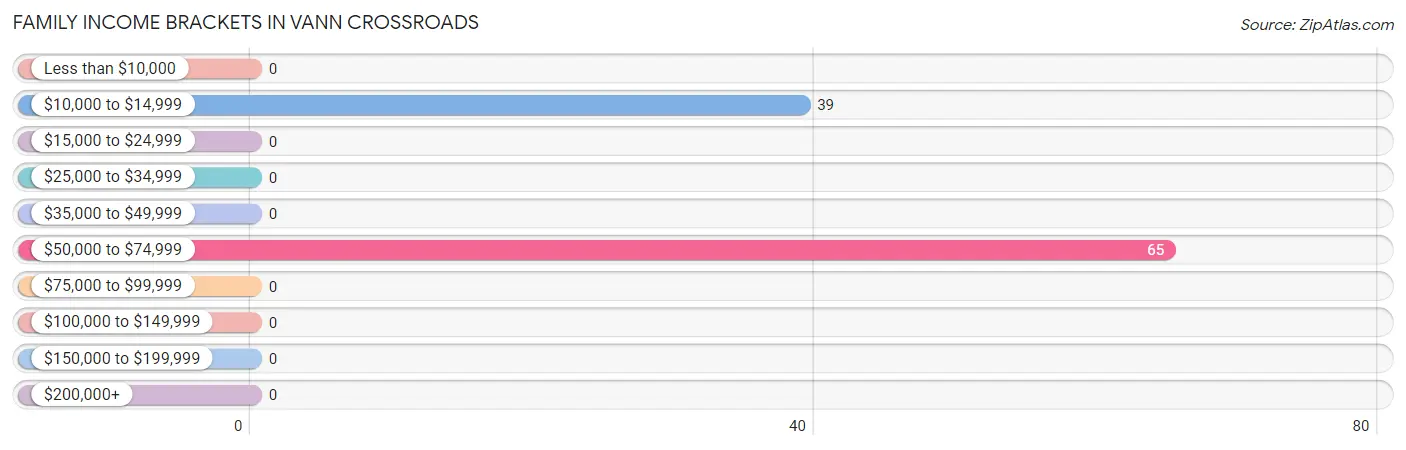
Family Income Brackets in Vann Crossroads
According to the Vann Crossroads family income data, there are 65 families falling into the $50,000 to $74,999 income range, which is the most common income bracket and makes up 62.5% of all families.
| Income Bracket | # Families | % Families |
| Less than $10,000 | 0 | 0.0% |
| $10,000 to $14,999 | 39 | 37.5% |
| $15,000 to $24,999 | 0 | 0.0% |
| $25,000 to $34,999 | 0 | 0.0% |
| $35,000 to $49,999 | 0 | 0.0% |
| $50,000 to $74,999 | 65 | 62.5% |
| $75,000 to $99,999 | 0 | 0.0% |
| $100,000 to $149,999 | 0 | 0.0% |
| $150,000 to $199,999 | 0 | 0.0% |
| $200,000+ | 0 | 0.0% |
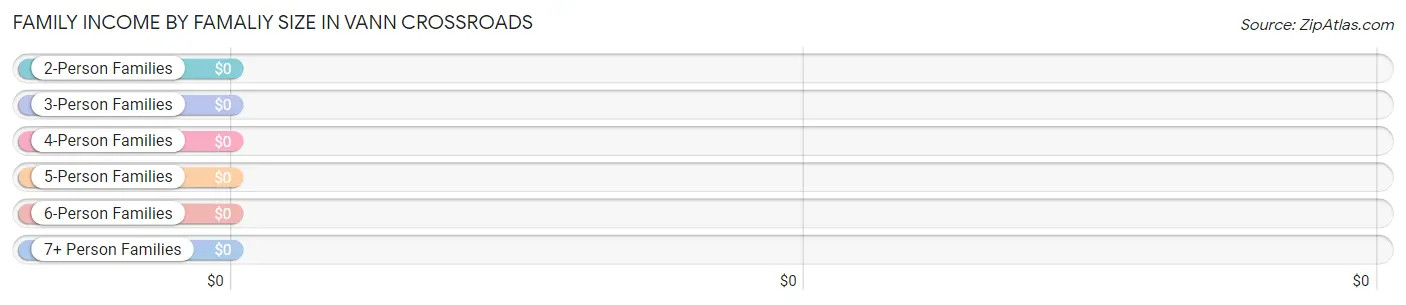
Family Income by Famaliy Size in Vann Crossroads
| Income Bracket | # Families | Median Income |
| 2-Person Families | 51 (49.0%) | $0 |
| 3-Person Families | 53 (51.0%) | $0 |
| 4-Person Families | 0 (0.0%) | $0 |
| 5-Person Families | 0 (0.0%) | $0 |
| 6-Person Families | 0 (0.0%) | $0 |
| 7+ Person Families | 0 (0.0%) | $0 |
| Total | 104 (100.0%) | $65,613 |
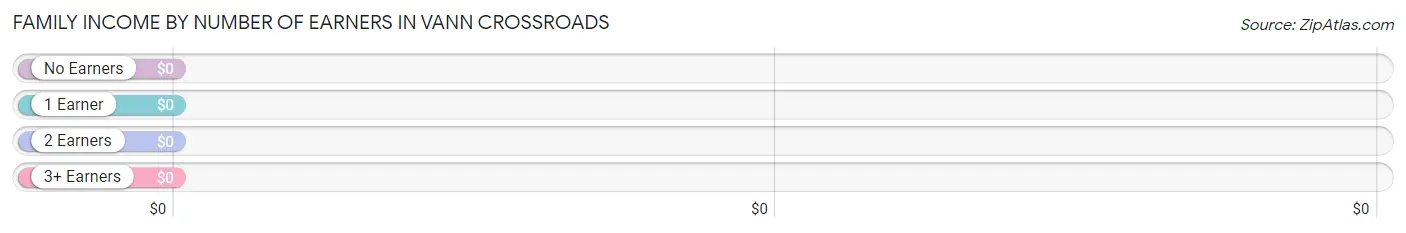
Family Income by Number of Earners in Vann Crossroads
| Number of Earners | # Families | Median Income |
| No Earners | 39 (37.5%) | $0 |
| 1 Earner | 12 (11.5%) | $0 |
| 2 Earners | 53 (51.0%) | $0 |
| 3+ Earners | 0 (0.0%) | $0 |
| Total | 104 (100.0%) | $65,613 |
Household Income in Vann Crossroads
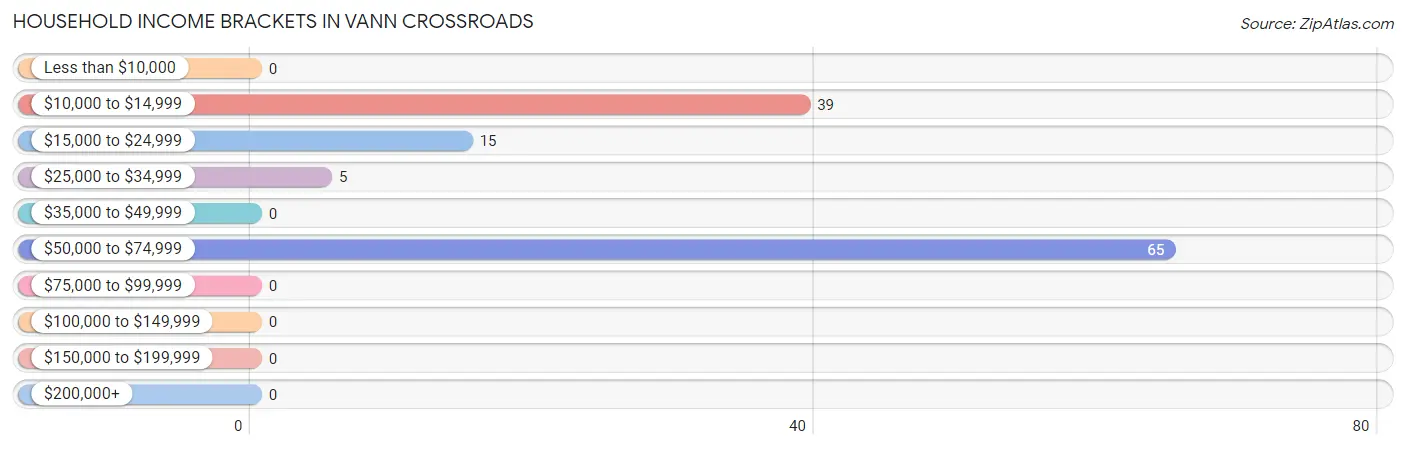
Household Income Brackets in Vann Crossroads
With 65 households falling in the category, the $50,000 to $74,999 income range is the most frequent in Vann Crossroads, accounting for 52.4% of all households.
| Income Bracket | # Households | % Households |
| Less than $10,000 | 0 | 0.0% |
| $10,000 to $14,999 | 39 | 31.5% |
| $15,000 to $24,999 | 15 | 12.1% |
| $25,000 to $34,999 | 5 | 4.0% |
| $35,000 to $49,999 | 0 | 0.0% |
| $50,000 to $74,999 | 65 | 52.4% |
| $75,000 to $99,999 | 0 | 0.0% |
| $100,000 to $149,999 | 0 | 0.0% |
| $150,000 to $199,999 | 0 | 0.0% |
| $200,000+ | 0 | 0.0% |
Household Income by Householder Age in Vann Crossroads
The median household income in Vann Crossroads is $0, with the highest median household income of $66,415 found in the 45 to 64 years age bracket for the primary householder. A total of 70 households (56.5%) fall into this category.
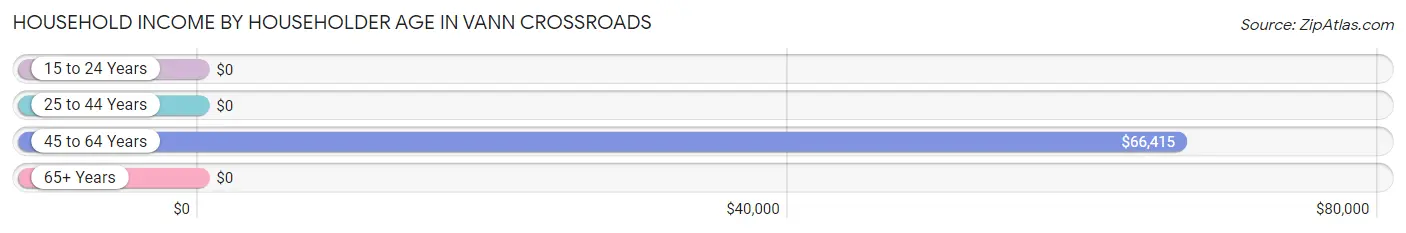
| Income Bracket | # Households | Median Income |
| 15 to 24 Years | 0 (0.0%) | $0 |
| 25 to 44 Years | 0 (0.0%) | $0 |
| 45 to 64 Years | 70 (56.5%) | $66,415 |
| 65+ Years | 54 (43.5%) | $0 |
| Total | 124 (100.0%) | $0 |
Poverty in Vann Crossroads
Income Below Poverty by Sex and Age in Vann Crossroads
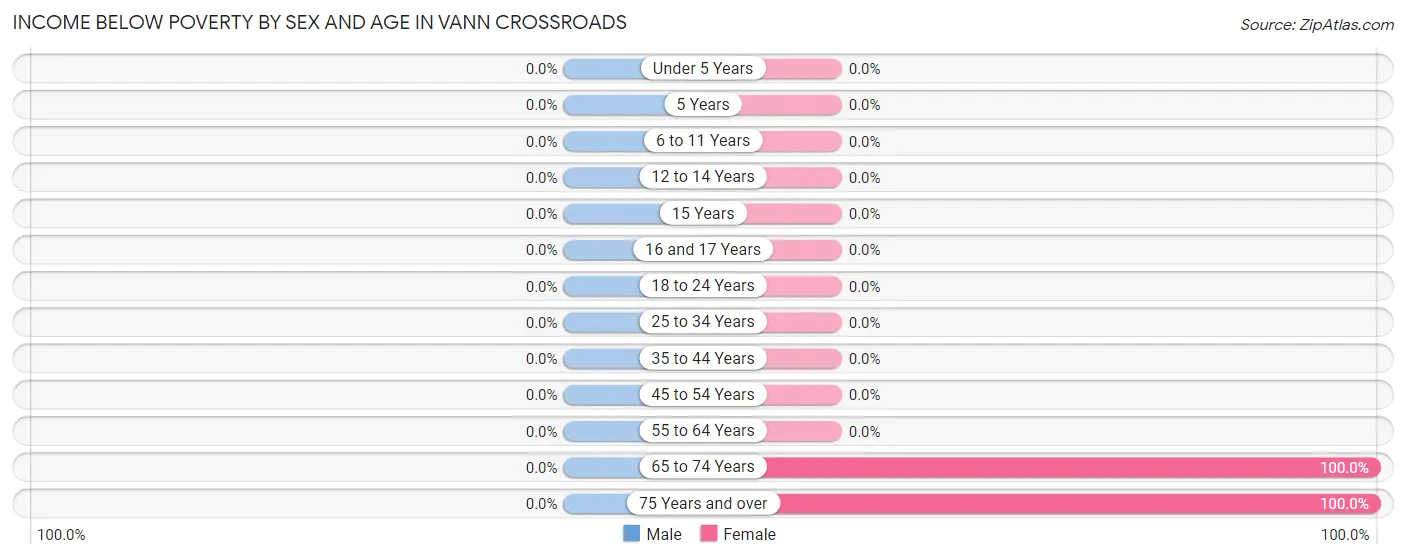
| Age Bracket | Male | Female |
| Under 5 Years | 0 (0.0%) | 0 (0.0%) |
| 5 Years | 0 (0.0%) | 0 (0.0%) |
| 6 to 11 Years | 0 (0.0%) | 0 (0.0%) |
| 12 to 14 Years | 0 (0.0%) | 0 (0.0%) |
| 15 Years | 0 (0.0%) | 0 (0.0%) |
| 16 and 17 Years | 0 (0.0%) | 0 (0.0%) |
| 18 to 24 Years | 0 (0.0%) | 0 (0.0%) |
| 25 to 34 Years | 0 (0.0%) | 0 (0.0%) |
| 35 to 44 Years | 0 (0.0%) | 0 (0.0%) |
| 45 to 54 Years | 0 (0.0%) | 0 (0.0%) |
| 55 to 64 Years | 0 (0.0%) | 0 (0.0%) |
| 65 to 74 Years | 0 (0.0%) | 61 (100.0%) |
| 75 Years and over | 0 (0.0%) | 39 (100.0%) |
| Total | 0 (0.0%) | 100 (64.9%) |
Income Above Poverty by Sex and Age in Vann Crossroads
According to the poverty statistics in Vann Crossroads, males aged 6 to 11 years and females aged 16 and 17 years are the age groups that are most secure financially, with 100.0% of males and 100.0% of females in these age groups living above the poverty line.
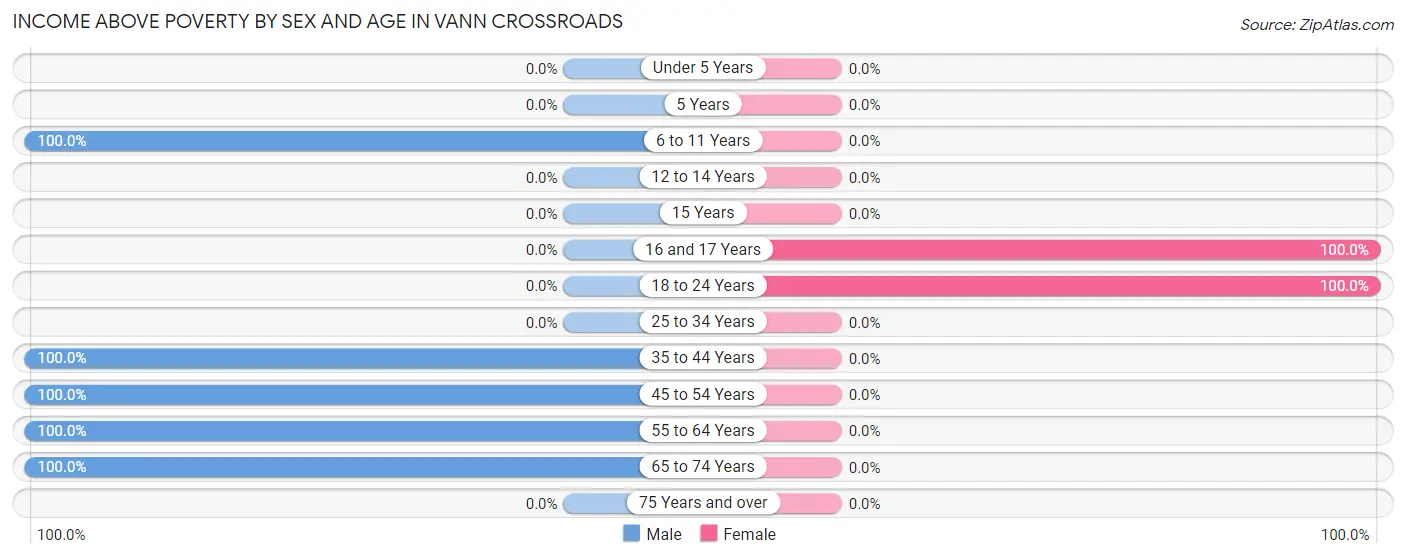
| Age Bracket | Male | Female |
| Under 5 Years | 0 (0.0%) | 0 (0.0%) |
| 5 Years | 0 (0.0%) | 0 (0.0%) |
| 6 to 11 Years | 22 (100.0%) | 0 (0.0%) |
| 12 to 14 Years | 0 (0.0%) | 0 (0.0%) |
| 15 Years | 0 (0.0%) | 0 (0.0%) |
| 16 and 17 Years | 0 (0.0%) | 22 (100.0%) |
| 18 to 24 Years | 0 (0.0%) | 32 (100.0%) |
| 25 to 34 Years | 0 (0.0%) | 0 (0.0%) |
| 35 to 44 Years | 5 (100.0%) | 0 (0.0%) |
| 45 to 54 Years | 53 (100.0%) | 0 (0.0%) |
| 55 to 64 Years | 17 (100.0%) | 0 (0.0%) |
| 65 to 74 Years | 15 (100.0%) | 0 (0.0%) |
| 75 Years and over | 0 (0.0%) | 0 (0.0%) |
| Total | 112 (100.0%) | 54 (35.1%) |
Income Below Poverty Among Married-Couple Families in Vann Crossroads
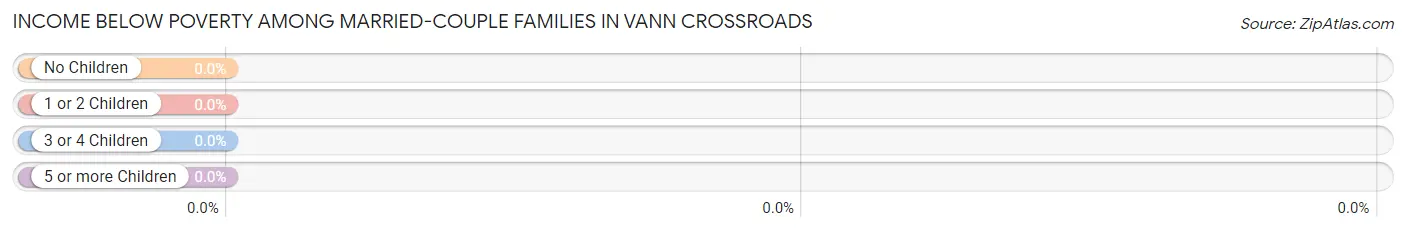
| Children | Above Poverty | Below Poverty |
| No Children | 0 (0.0%) | 0 (0.0%) |
| 1 or 2 Children | 0 (0.0%) | 0 (0.0%) |
| 3 or 4 Children | 0 (0.0%) | 0 (0.0%) |
| 5 or more Children | 0 (0.0%) | 0 (0.0%) |
| Total | 0 (0.0%) | 0 (0.0%) |
Income Below Poverty Among Single-Parent Households in Vann Crossroads
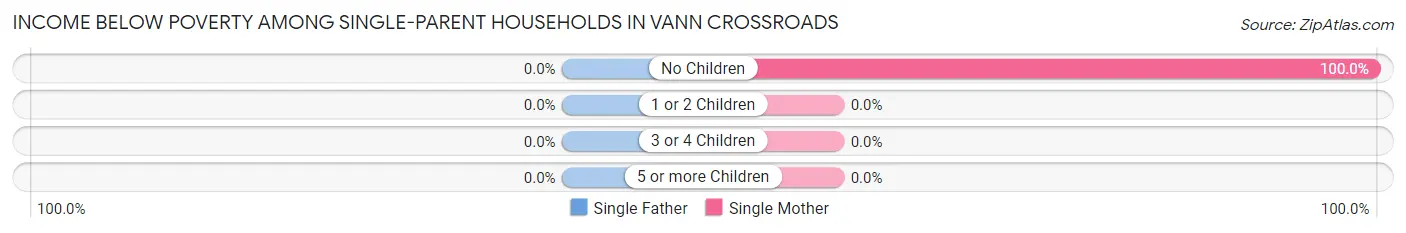
| Children | Single Father | Single Mother |
| No Children | 0 (0.0%) | 39 (100.0%) |
| 1 or 2 Children | 0 (0.0%) | 0 (0.0%) |
| 3 or 4 Children | 0 (0.0%) | 0 (0.0%) |
| 5 or more Children | 0 (0.0%) | 0 (0.0%) |
| Total | 0 (0.0%) | 39 (100.0%) |
Income Below Poverty Among Married-Couple vs Single-Parent Households in Vann Crossroads
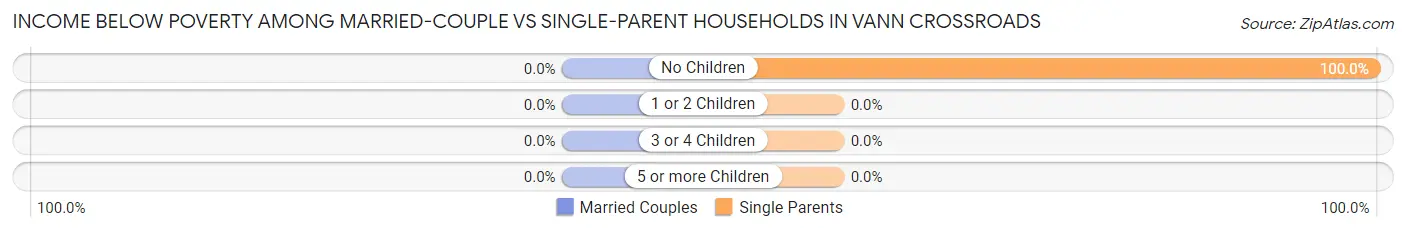
| Children | Married-Couple Families | Single-Parent Households |
| No Children | 0 (0.0%) | 39 (100.0%) |
| 1 or 2 Children | 0 (0.0%) | 0 (0.0%) |
| 3 or 4 Children | 0 (0.0%) | 0 (0.0%) |
| 5 or more Children | 0 (0.0%) | 0 (0.0%) |
| Total | 0 (0.0%) | 39 (37.5%) |
Race in Vann Crossroads
The most populous races in Vann Crossroads are White / Caucasian (244 | 91.7%), and Two or more Races (22 | 8.3%).
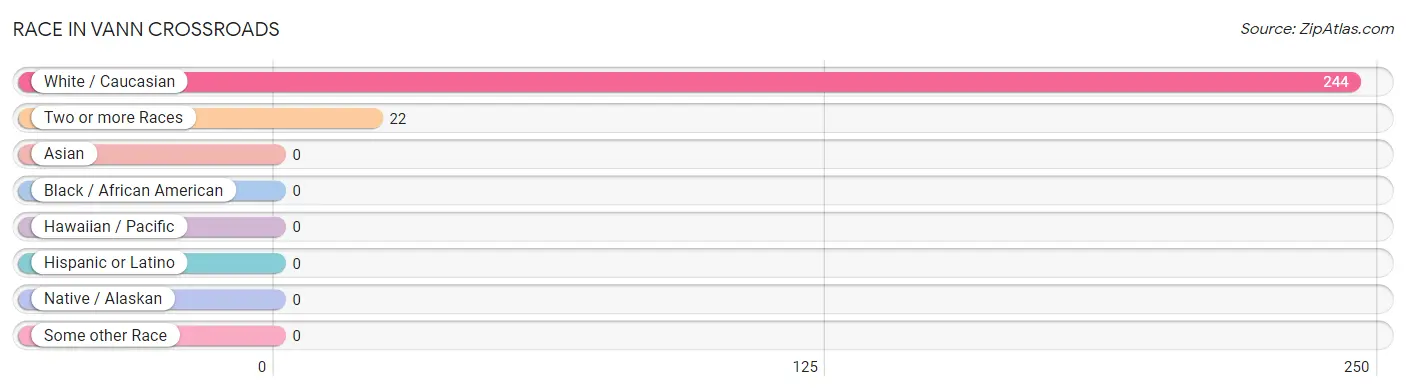
| Race | # Population | % Population |
| Asian | 0 | 0.0% |
| Black / African American | 0 | 0.0% |
| Hawaiian / Pacific | 0 | 0.0% |
| Hispanic or Latino | 0 | 0.0% |
| Native / Alaskan | 0 | 0.0% |
| White / Caucasian | 244 | 91.7% |
| Two or more Races | 22 | 8.3% |
| Some other Race | 0 | 0.0% |
| Total | 266 | 100.0% |
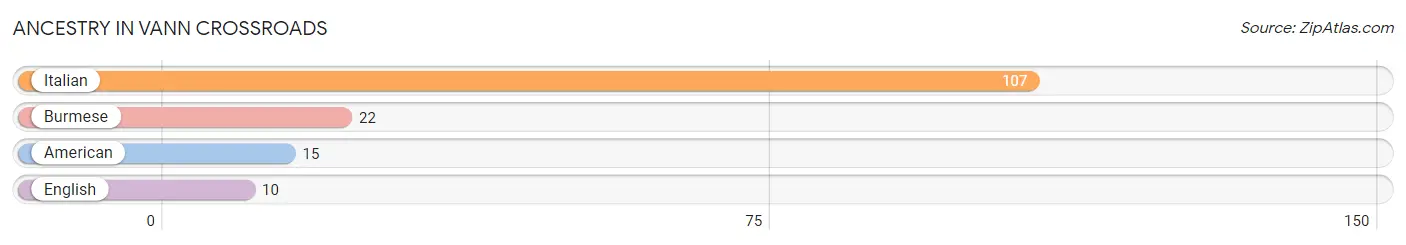
Ancestry in Vann Crossroads
The most populous ancestries reported in Vann Crossroads are Italian (107 | 40.2%), Burmese (22 | 8.3%), American (15 | 5.6%), and English (10 | 3.8%), together accounting for 57.9% of all Vann Crossroads residents.
| Ancestry | # Population | % Population |
| American | 15 | 5.6% |
| Burmese | 22 | 8.3% |
| English | 10 | 3.8% |
| Italian | 107 | 40.2% | View All 4 Rows |
Immigrants in Vann Crossroads

| Immigration Origin | # Population | % Population | View All 0 Rows |
Sex and Age in Vann Crossroads
Sex and Age in Vann Crossroads
The most populous age groups in Vann Crossroads are 45 to 49 Years (53 | 47.3%) for men and 65 to 69 Years (61 | 39.6%) for women.
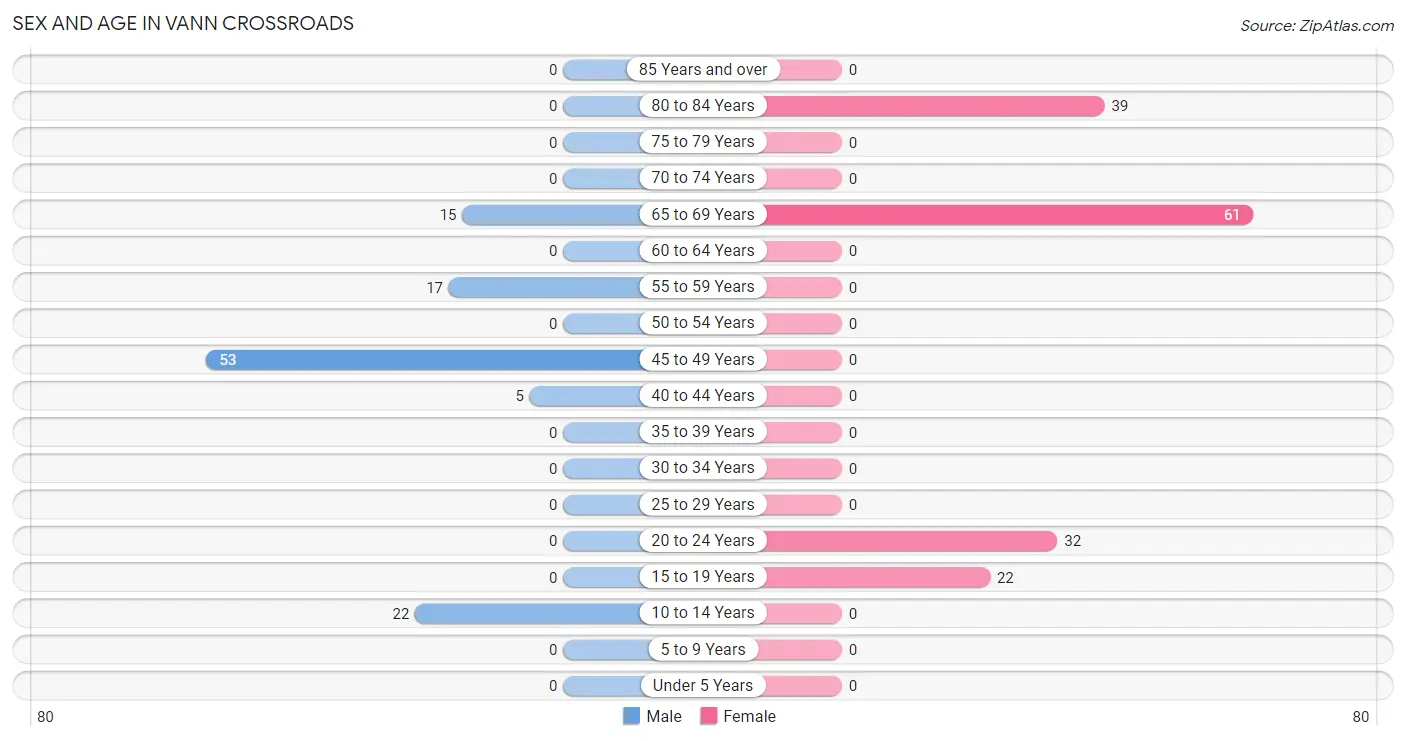
| Age Bracket | Male | Female |
| Under 5 Years | 0 (0.0%) | 0 (0.0%) |
| 5 to 9 Years | 0 (0.0%) | 0 (0.0%) |
| 10 to 14 Years | 22 (19.6%) | 0 (0.0%) |
| 15 to 19 Years | 0 (0.0%) | 22 (14.3%) |
| 20 to 24 Years | 0 (0.0%) | 32 (20.8%) |
| 25 to 29 Years | 0 (0.0%) | 0 (0.0%) |
| 30 to 34 Years | 0 (0.0%) | 0 (0.0%) |
| 35 to 39 Years | 0 (0.0%) | 0 (0.0%) |
| 40 to 44 Years | 5 (4.5%) | 0 (0.0%) |
| 45 to 49 Years | 53 (47.3%) | 0 (0.0%) |
| 50 to 54 Years | 0 (0.0%) | 0 (0.0%) |
| 55 to 59 Years | 17 (15.2%) | 0 (0.0%) |
| 60 to 64 Years | 0 (0.0%) | 0 (0.0%) |
| 65 to 69 Years | 15 (13.4%) | 61 (39.6%) |
| 70 to 74 Years | 0 (0.0%) | 0 (0.0%) |
| 75 to 79 Years | 0 (0.0%) | 0 (0.0%) |
| 80 to 84 Years | 0 (0.0%) | 39 (25.3%) |
| 85 Years and over | 0 (0.0%) | 0 (0.0%) |
| Total | 112 (100.0%) | 154 (100.0%) |
Families and Households in Vann Crossroads
Median Family Size in Vann Crossroads
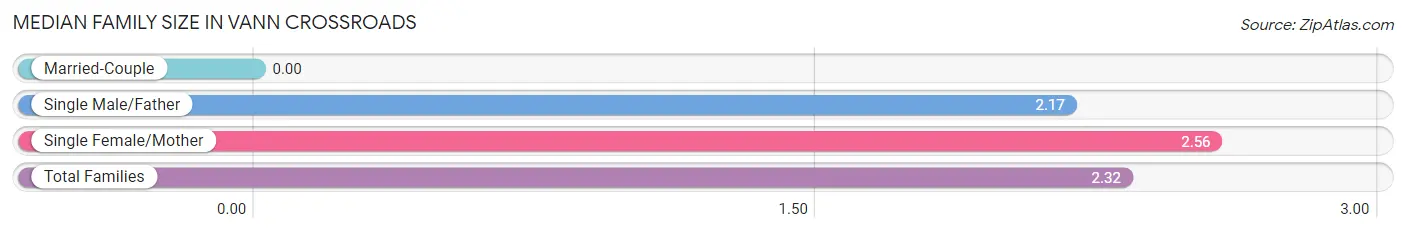
| Family Type | # Families | Family Size |
| Married-Couple | 0 (0.0%) | - |
| Single Male/Father | 65 (62.5%) | 2.17 |
| Single Female/Mother | 39 (37.5%) | 2.56 |
| Total Families | 104 (100.0%) | 2.32 |
Median Household Size in Vann Crossroads
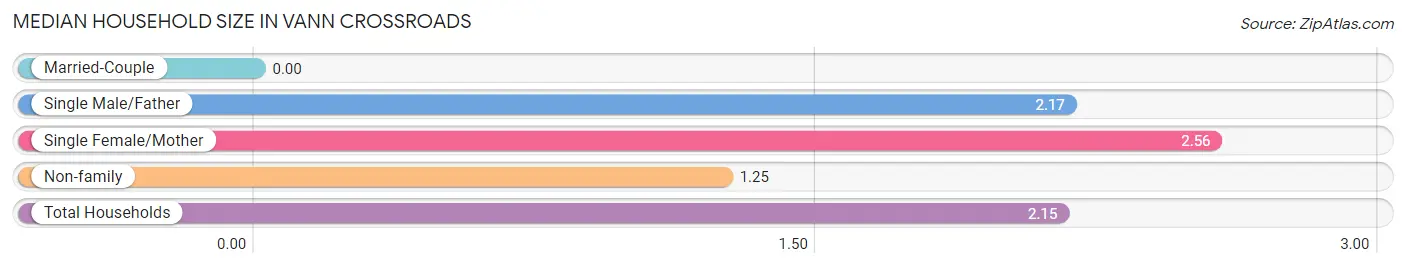
| Household Type | # Households | Household Size |
| Married-Couple | 0 (0.0%) | - |
| Single Male/Father | 65 (52.4%) | 2.17 |
| Single Female/Mother | 39 (31.5%) | 2.56 |
| Non-family | 20 (16.1%) | 1.25 |
| Total Households | 124 (100.0%) | 2.15 |
Household Size by Marriage Status in Vann Crossroads
Out of a total of 124 households in Vann Crossroads, 104 (83.9%) are family households, while 20 (16.1%) are nonfamily households. The most numerous type of family households are 3-person households, comprising 53, and the most common type of nonfamily households are 1-person households, comprising 15.
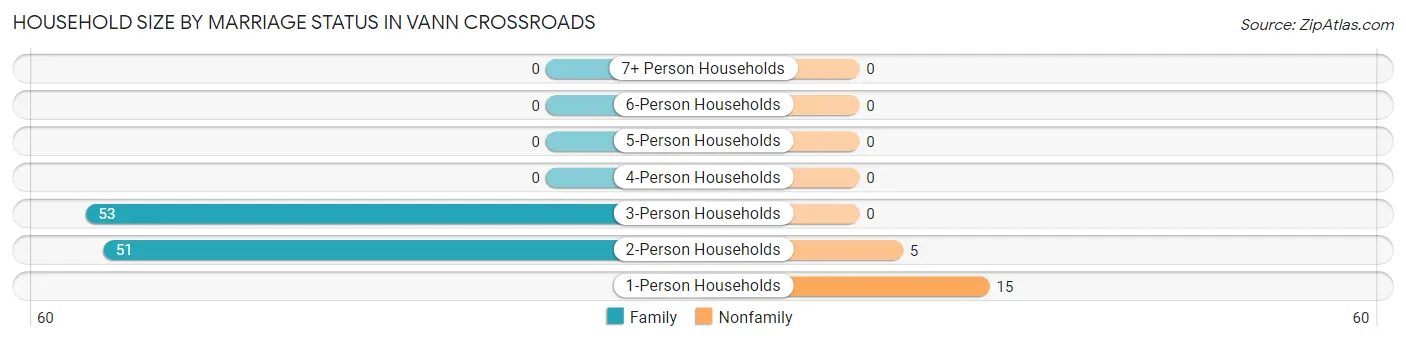
| Household Size | Family Households | Nonfamily Households |
| 1-Person Households | - | 15 (12.1%) |
| 2-Person Households | 51 (41.1%) | 5 (4.0%) |
| 3-Person Households | 53 (42.7%) | 0 (0.0%) |
| 4-Person Households | 0 (0.0%) | 0 (0.0%) |
| 5-Person Households | 0 (0.0%) | 0 (0.0%) |
| 6-Person Households | 0 (0.0%) | 0 (0.0%) |
| 7+ Person Households | 0 (0.0%) | 0 (0.0%) |
| Total | 104 (83.9%) | 20 (16.1%) |
Female Fertility in Vann Crossroads
Fertility by Age in Vann Crossroads
| Age Bracket | Women with Births | Births / 1,000 Women |
| 15 to 19 years | 0 (0.0%) | 0.0 |
| 20 to 34 years | 0 (0.0%) | 0.0 |
| 35 to 50 years | 0 (0.0%) | 0.0 |
| Total | 0 (0.0%) | 0.0 |
Fertility by Age by Marriage Status in Vann Crossroads
| Age Bracket | Married | Unmarried |
| 15 to 19 years | 0 (0.0%) | 0 (0.0%) |
| 20 to 34 years | 0 (0.0%) | 0 (0.0%) |
| 35 to 50 years | 0 (0.0%) | 0 (0.0%) |
| Total | 0 (0.0%) | 0 (0.0%) |
Fertility by Education in Vann Crossroads
| Educational Attainment | Women with Births | Births / 1,000 Women |
| Less than High School | 0 (0.0%) | 0.0 |
| High School Diploma | 0 (0.0%) | 0.0 |
| College or Associate's Degree | 0 (0.0%) | 0.0 |
| Bachelor's Degree | 0 (0.0%) | 0.0 |
| Graduate Degree | 0 (0.0%) | 0.0 |
| Total | 0 (0.0%) | 0.0 |
Fertility by Education by Marriage Status in Vann Crossroads
| Educational Attainment | Married | Unmarried |
| Less than High School | 0 (0.0%) | 0 (0.0%) |
| High School Diploma | 0 (0.0%) | 0 (0.0%) |
| College or Associate's Degree | 0 (0.0%) | 0 (0.0%) |
| Bachelor's Degree | 0 (0.0%) | 0 (0.0%) |
| Graduate Degree | 0 (0.0%) | 0 (0.0%) |
| Total | 0 (0.0%) | 0 (0.0%) |
Employment Characteristics in Vann Crossroads
Employment by Class of Employer in Vann Crossroads
Among the 107 employed individuals in Vann Crossroads, state government employees (53 | 49.5%), local government employees (32 | 29.9%), and private company employees (12 | 11.2%) make up the most common classes of employment.
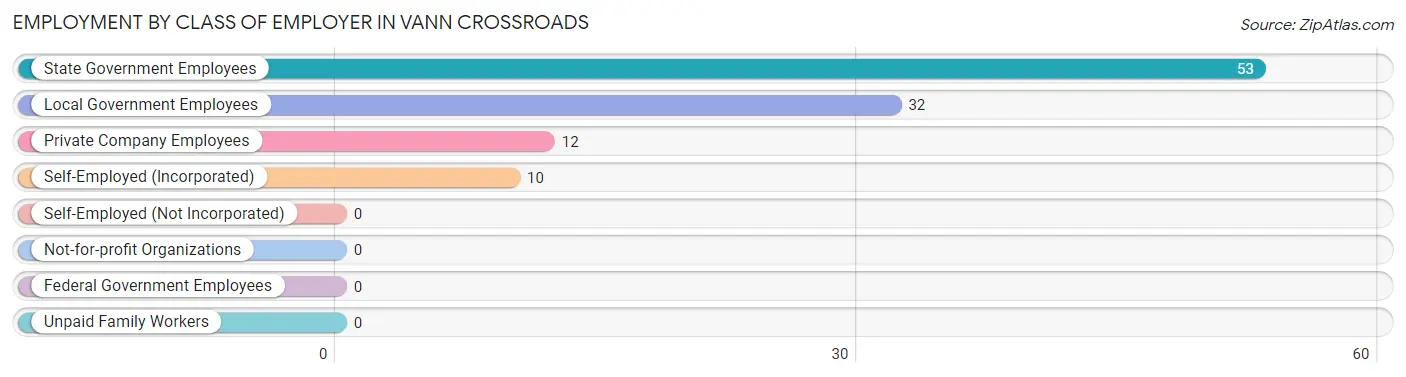
| Employer Class | # Employees | % Employees |
| Private Company Employees | 12 | 11.2% |
| Self-Employed (Incorporated) | 10 | 9.3% |
| Self-Employed (Not Incorporated) | 0 | 0.0% |
| Not-for-profit Organizations | 0 | 0.0% |
| Local Government Employees | 32 | 29.9% |
| State Government Employees | 53 | 49.5% |
| Federal Government Employees | 0 | 0.0% |
| Unpaid Family Workers | 0 | 0.0% |
| Total | 107 | 100.0% |
Employment Status by Age in Vann Crossroads
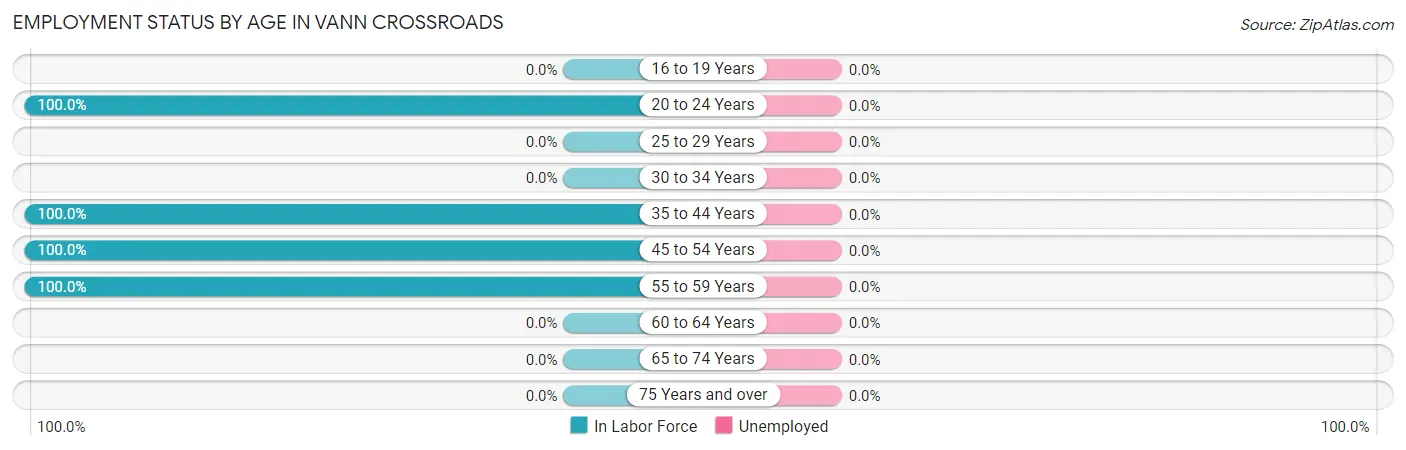
| Age Bracket | In Labor Force | Unemployed |
| 16 to 19 Years | 0 (0.0%) | 0 (0.0%) |
| 20 to 24 Years | 32 (100.0%) | 0 (0.0%) |
| 25 to 29 Years | 0 (0.0%) | 0 (0.0%) |
| 30 to 34 Years | 0 (0.0%) | 0 (0.0%) |
| 35 to 44 Years | 5 (100.0%) | 0 (0.0%) |
| 45 to 54 Years | 53 (100.0%) | 0 (0.0%) |
| 55 to 59 Years | 17 (100.0%) | 0 (0.0%) |
| 60 to 64 Years | 0 (0.0%) | 0 (0.0%) |
| 65 to 74 Years | 0 (0.0%) | 0 (0.0%) |
| 75 Years and over | 0 (0.0%) | 0 (0.0%) |
| Total | 107 (43.9%) | 0 (0.0%) |
Employment Status by Educational Attainment in Vann Crossroads
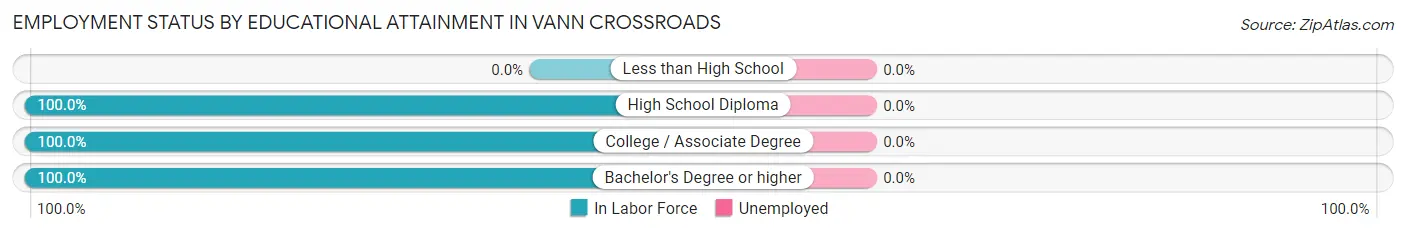
| Educational Attainment | In Labor Force | Unemployed |
| Less than High School | 0 (0.0%) | 0 (0.0%) |
| High School Diploma | 5 (100.0%) | 0 (0.0%) |
| College / Associate Degree | 65 (100.0%) | 0 (0.0%) |
| Bachelor's Degree or higher | 5 (100.0%) | 0 (0.0%) |
| Total | 75 (100.0%) | 0 (0.0%) |
Employment Occupations by Sex in Vann Crossroads
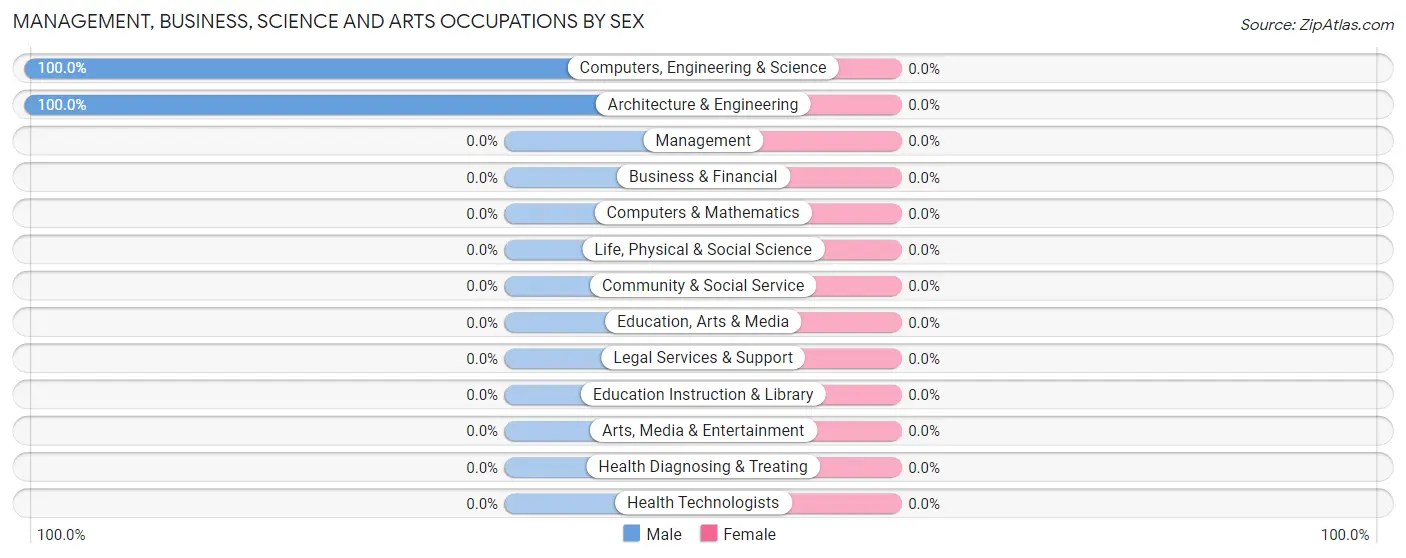
Management, Business, Science and Arts Occupations
The most common Management, Business, Science and Arts occupations in Vann Crossroads are Computers, Engineering & Science (12 | 11.2%), and Architecture & Engineering (12 | 11.2%).
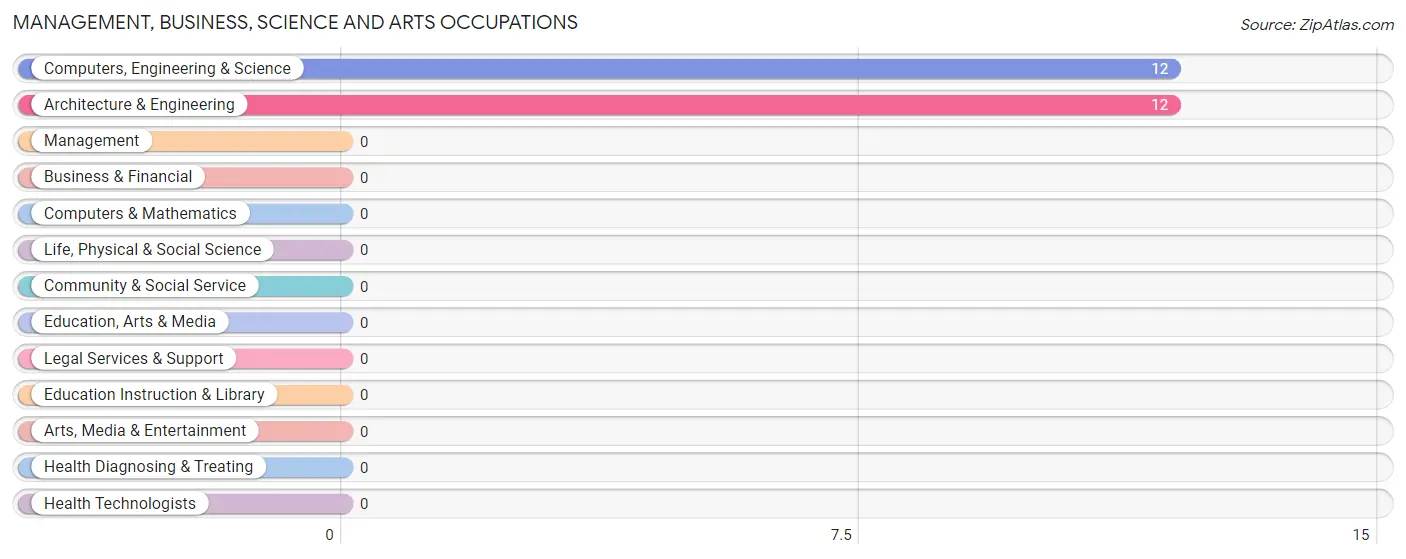
Management, Business, Science and Arts Occupations by Sex
| Occupation | Male | Female |
| Management | 0 (0.0%) | 0 (0.0%) |
| Business & Financial | 0 (0.0%) | 0 (0.0%) |
| Computers, Engineering & Science | 12 (100.0%) | 0 (0.0%) |
| Computers & Mathematics | 0 (0.0%) | 0 (0.0%) |
| Architecture & Engineering | 12 (100.0%) | 0 (0.0%) |
| Life, Physical & Social Science | 0 (0.0%) | 0 (0.0%) |
| Community & Social Service | 0 (0.0%) | 0 (0.0%) |
| Education, Arts & Media | 0 (0.0%) | 0 (0.0%) |
| Legal Services & Support | 0 (0.0%) | 0 (0.0%) |
| Education Instruction & Library | 0 (0.0%) | 0 (0.0%) |
| Arts, Media & Entertainment | 0 (0.0%) | 0 (0.0%) |
| Health Diagnosing & Treating | 0 (0.0%) | 0 (0.0%) |
| Health Technologists | 0 (0.0%) | 0 (0.0%) |
| Total (Category) | 12 (100.0%) | 0 (0.0%) |
| Total (Overall) | 75 (70.1%) | 32 (29.9%) |
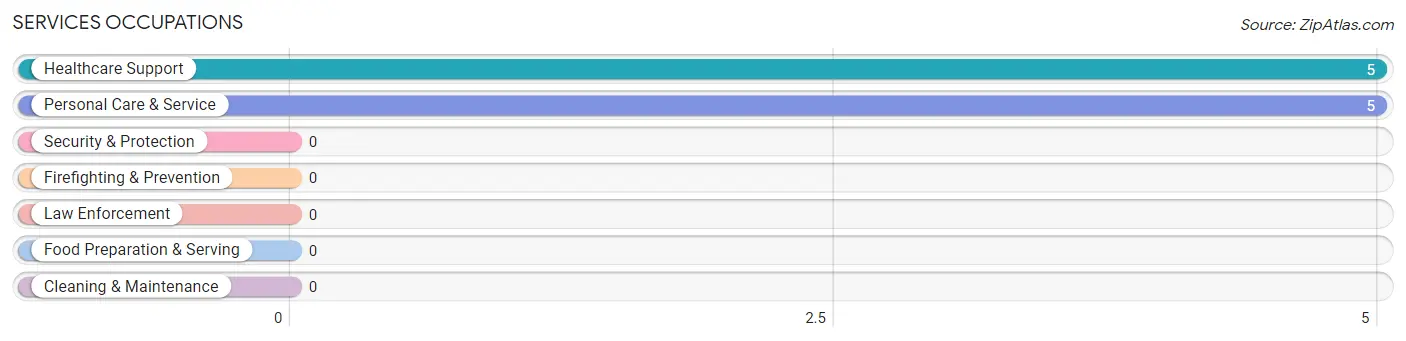
Services Occupations
The most common Services occupations in Vann Crossroads are Healthcare Support (5 | 4.7%), and Personal Care & Service (5 | 4.7%).
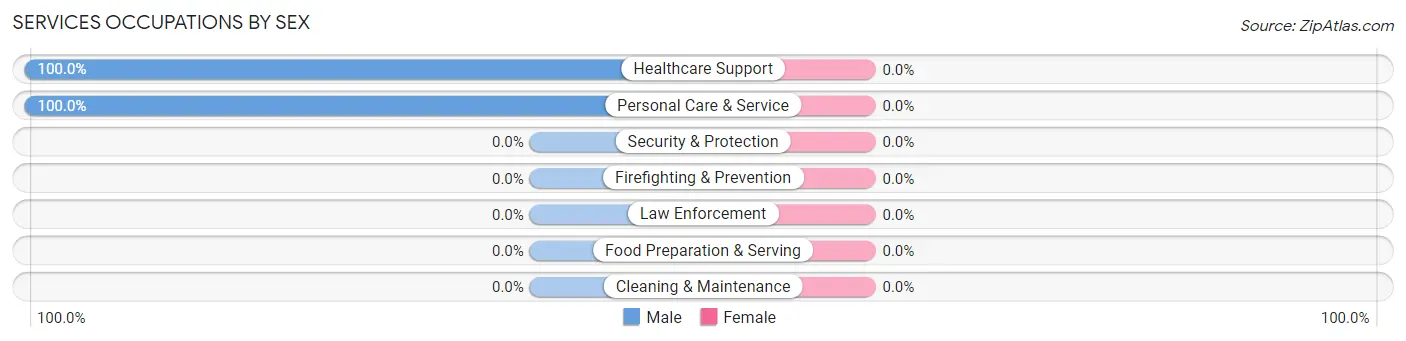
Services Occupations by Sex
| Occupation | Male | Female |
| Healthcare Support | 5 (100.0%) | 0 (0.0%) |
| Security & Protection | 0 (0.0%) | 0 (0.0%) |
| Firefighting & Prevention | 0 (0.0%) | 0 (0.0%) |
| Law Enforcement | 0 (0.0%) | 0 (0.0%) |
| Food Preparation & Serving | 0 (0.0%) | 0 (0.0%) |
| Cleaning & Maintenance | 0 (0.0%) | 0 (0.0%) |
| Personal Care & Service | 5 (100.0%) | 0 (0.0%) |
| Total (Category) | 10 (100.0%) | 0 (0.0%) |
| Total (Overall) | 75 (70.1%) | 32 (29.9%) |
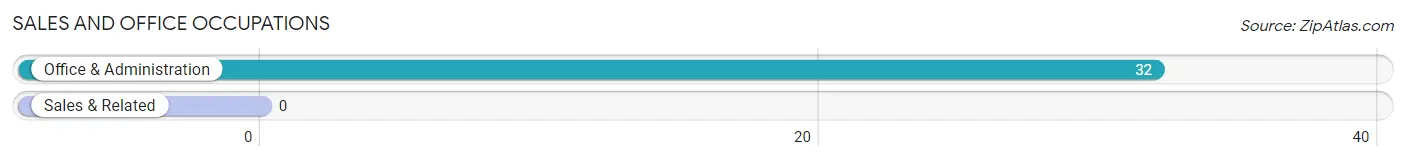
Sales and Office Occupations
The most common Sales and Office occupations in Vann Crossroads are , and Office & Administration (32 | 29.9%).
Sales and Office Occupations by Sex
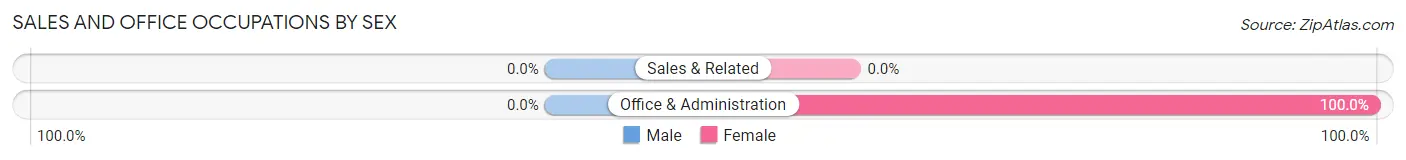
| Occupation | Male | Female |
| Sales & Related | 0 (0.0%) | 0 (0.0%) |
| Office & Administration | 0 (0.0%) | 32 (100.0%) |
| Total (Category) | 0 (0.0%) | 32 (100.0%) |
| Total (Overall) | 75 (70.1%) | 32 (29.9%) |
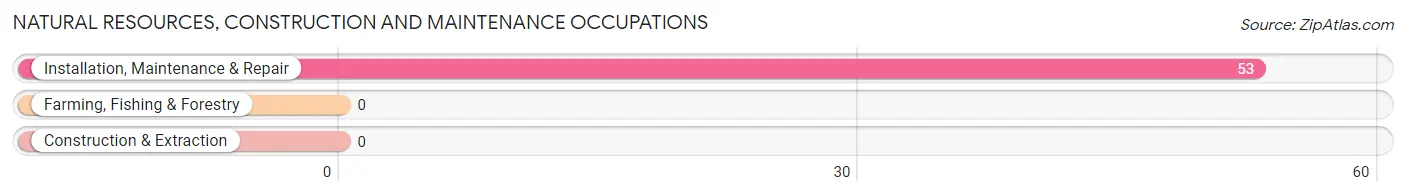
Natural Resources, Construction and Maintenance Occupations
The most common Natural Resources, Construction and Maintenance occupations in Vann Crossroads are , and Installation, Maintenance & Repair (53 | 49.5%).
Natural Resources, Construction and Maintenance Occupations by Sex
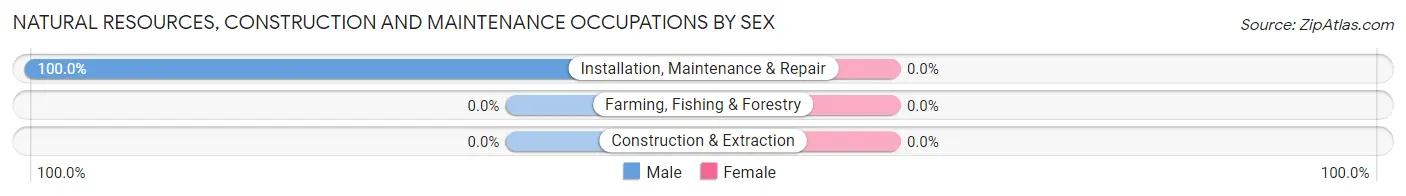
| Occupation | Male | Female |
| Farming, Fishing & Forestry | 0 (0.0%) | 0 (0.0%) |
| Construction & Extraction | 0 (0.0%) | 0 (0.0%) |
| Installation, Maintenance & Repair | 53 (100.0%) | 0 (0.0%) |
| Total (Category) | 53 (100.0%) | 0 (0.0%) |
| Total (Overall) | 75 (70.1%) | 32 (29.9%) |
Production, Transportation and Moving Occupations
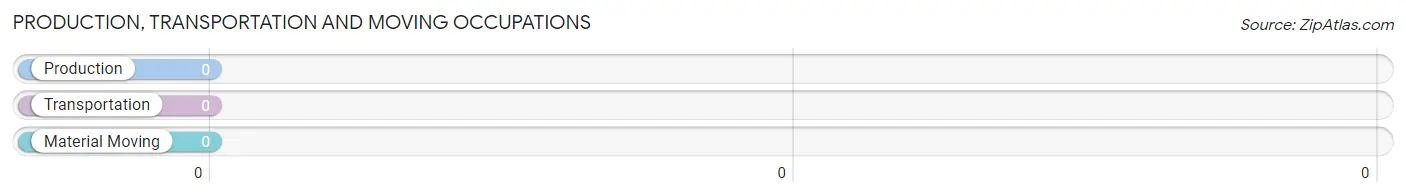
Production, Transportation and Moving Occupations by Sex
| Occupation | Male | Female |
| Production | 0 (0.0%) | 0 (0.0%) |
| Transportation | 0 (0.0%) | 0 (0.0%) |
| Material Moving | 0 (0.0%) | 0 (0.0%) |
| Total (Category) | 0 (0.0%) | 0 (0.0%) |
| Total (Overall) | 75 (70.1%) | 32 (29.9%) |
Employment Industries by Sex in Vann Crossroads
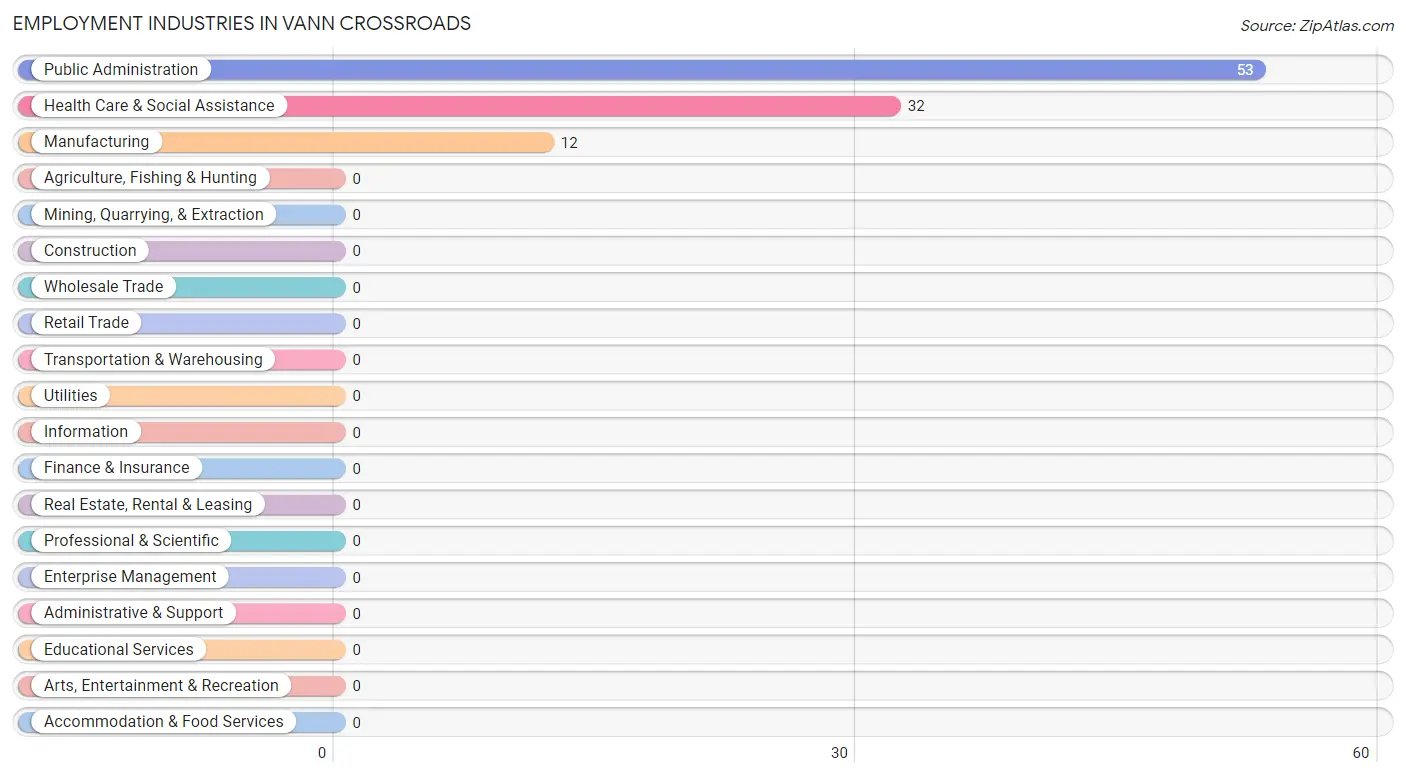
Employment Industries in Vann Crossroads
The major employment industries in Vann Crossroads include Public Administration (53 | 49.5%), Health Care & Social Assistance (32 | 29.9%), and Manufacturing (12 | 11.2%).
Employment Industries by Sex in Vann Crossroads
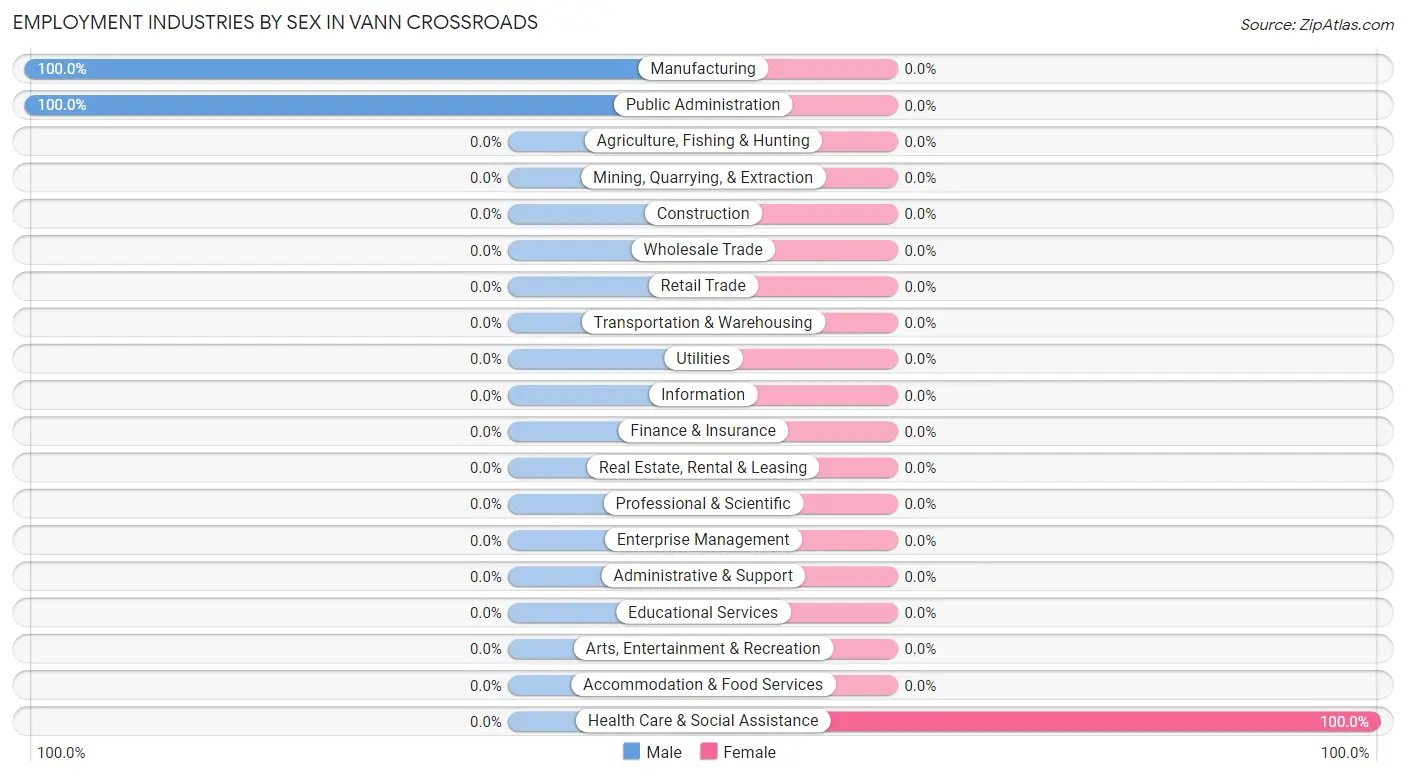
| Industry | Male | Female |
| Agriculture, Fishing & Hunting | 0 (0.0%) | 0 (0.0%) |
| Mining, Quarrying, & Extraction | 0 (0.0%) | 0 (0.0%) |
| Construction | 0 (0.0%) | 0 (0.0%) |
| Manufacturing | 12 (100.0%) | 0 (0.0%) |
| Wholesale Trade | 0 (0.0%) | 0 (0.0%) |
| Retail Trade | 0 (0.0%) | 0 (0.0%) |
| Transportation & Warehousing | 0 (0.0%) | 0 (0.0%) |
| Utilities | 0 (0.0%) | 0 (0.0%) |
| Information | 0 (0.0%) | 0 (0.0%) |
| Finance & Insurance | 0 (0.0%) | 0 (0.0%) |
| Real Estate, Rental & Leasing | 0 (0.0%) | 0 (0.0%) |
| Professional & Scientific | 0 (0.0%) | 0 (0.0%) |
| Enterprise Management | 0 (0.0%) | 0 (0.0%) |
| Administrative & Support | 0 (0.0%) | 0 (0.0%) |
| Educational Services | 0 (0.0%) | 0 (0.0%) |
| Health Care & Social Assistance | 0 (0.0%) | 32 (100.0%) |
| Arts, Entertainment & Recreation | 0 (0.0%) | 0 (0.0%) |
| Accommodation & Food Services | 0 (0.0%) | 0 (0.0%) |
| Public Administration | 53 (100.0%) | 0 (0.0%) |
| Total | 75 (70.1%) | 32 (29.9%) |
Education in Vann Crossroads
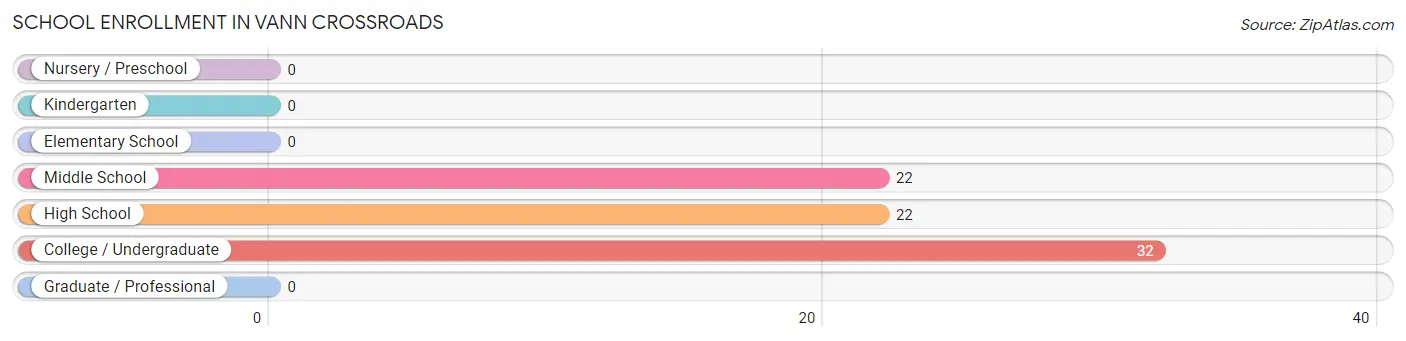
School Enrollment in Vann Crossroads
The most common levels of schooling among the 76 students in Vann Crossroads are college / undergraduate (32 | 42.1%), middle school (22 | 28.9%), and high school (22 | 28.9%).
| School Level | # Students | % Students |
| Nursery / Preschool | 0 | 0.0% |
| Kindergarten | 0 | 0.0% |
| Elementary School | 0 | 0.0% |
| Middle School | 22 | 28.9% |
| High School | 22 | 28.9% |
| College / Undergraduate | 32 | 42.1% |
| Graduate / Professional | 0 | 0.0% |
| Total | 76 | 100.0% |
School Enrollment by Age by Funding Source in Vann Crossroads
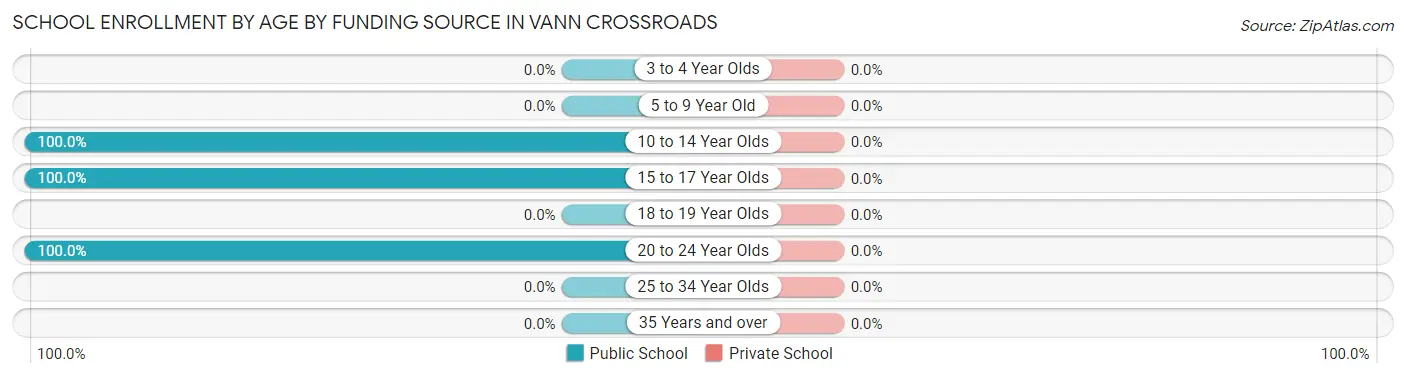
| Age Bracket | Public School | Private School |
| 3 to 4 Year Olds | 0 (0.0%) | 0 (0.0%) |
| 5 to 9 Year Old | 0 (0.0%) | 0 (0.0%) |
| 10 to 14 Year Olds | 22 (100.0%) | 0 (0.0%) |
| 15 to 17 Year Olds | 22 (100.0%) | 0 (0.0%) |
| 18 to 19 Year Olds | 0 (0.0%) | 0 (0.0%) |
| 20 to 24 Year Olds | 32 (100.0%) | 0 (0.0%) |
| 25 to 34 Year Olds | 0 (0.0%) | 0 (0.0%) |
| 35 Years and over | 0 (0.0%) | 0 (0.0%) |
| Total | 76 (100.0%) | 0 (0.0%) |
Educational Attainment by Field of Study in Vann Crossroads
Education (61 | 92.4%), and business (5 | 7.6%) are the most common fields of study among 66 individuals in Vann Crossroads who have obtained a bachelor's degree or higher.
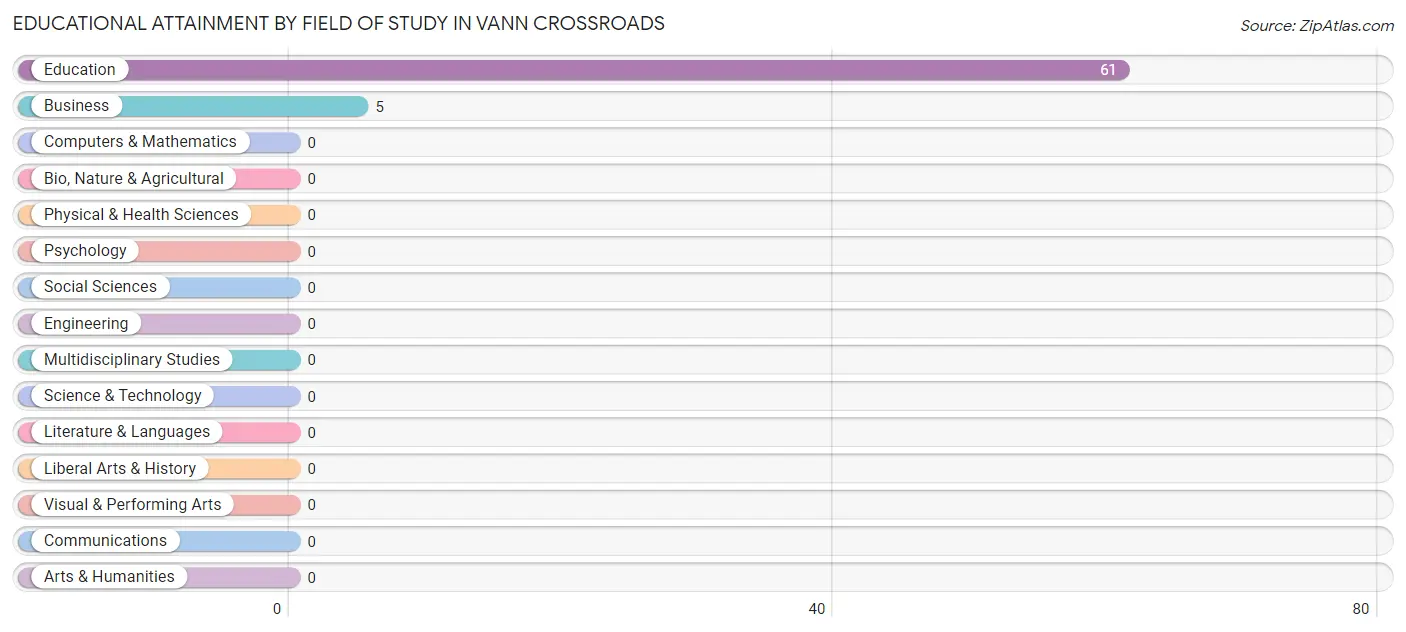
| Field of Study | # Graduates | % Graduates |
| Computers & Mathematics | 0 | 0.0% |
| Bio, Nature & Agricultural | 0 | 0.0% |
| Physical & Health Sciences | 0 | 0.0% |
| Psychology | 0 | 0.0% |
| Social Sciences | 0 | 0.0% |
| Engineering | 0 | 0.0% |
| Multidisciplinary Studies | 0 | 0.0% |
| Science & Technology | 0 | 0.0% |
| Business | 5 | 7.6% |
| Education | 61 | 92.4% |
| Literature & Languages | 0 | 0.0% |
| Liberal Arts & History | 0 | 0.0% |
| Visual & Performing Arts | 0 | 0.0% |
| Communications | 0 | 0.0% |
| Arts & Humanities | 0 | 0.0% |
| Total | 66 | 100.0% |
Transportation & Commute in Vann Crossroads
Vehicle Availability by Sex in Vann Crossroads
The most prevalent vehicle ownership categories in Vann Crossroads are males with 5 or more vehicles (53, accounting for 70.7%) and females with 5 or more vehicles (32, making up 165.6%).
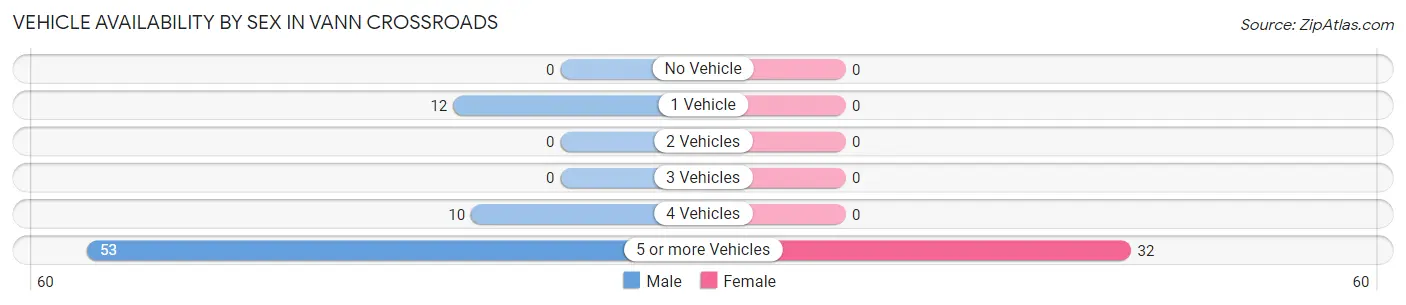
| Vehicles Available | Male | Female |
| No Vehicle | 0 (0.0%) | 0 (0.0%) |
| 1 Vehicle | 12 (16.0%) | 0 (0.0%) |
| 2 Vehicles | 0 (0.0%) | 0 (0.0%) |
| 3 Vehicles | 0 (0.0%) | 0 (0.0%) |
| 4 Vehicles | 10 (13.3%) | 0 (0.0%) |
| 5 or more Vehicles | 53 (70.7%) | 32 (100.0%) |
| Total | 75 (100.0%) | 32 (100.0%) |
Commute Time in Vann Crossroads
The most frequently occuring commute durations in Vann Crossroads are 15 to 19 minutes (53 commuters, 49.5%), 40 to 44 minutes (32 commuters, 29.9%), and 45 to 59 minutes (12 commuters, 11.2%).
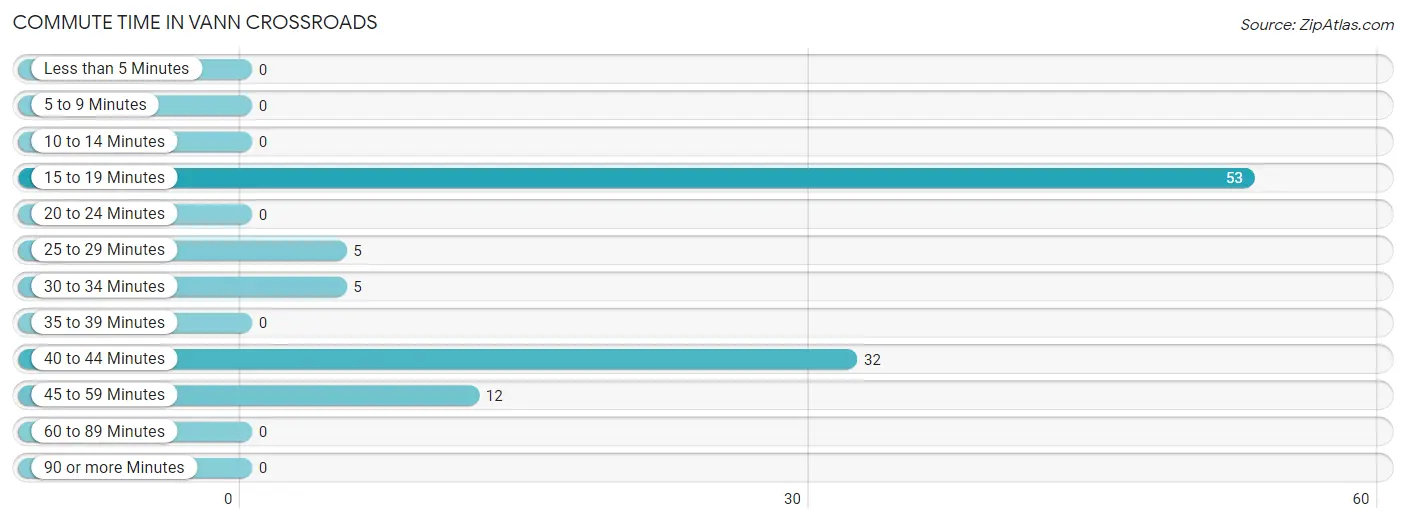
| Commute Time | # Commuters | % Commuters |
| Less than 5 Minutes | 0 | 0.0% |
| 5 to 9 Minutes | 0 | 0.0% |
| 10 to 14 Minutes | 0 | 0.0% |
| 15 to 19 Minutes | 53 | 49.5% |
| 20 to 24 Minutes | 0 | 0.0% |
| 25 to 29 Minutes | 5 | 4.7% |
| 30 to 34 Minutes | 5 | 4.7% |
| 35 to 39 Minutes | 0 | 0.0% |
| 40 to 44 Minutes | 32 | 29.9% |
| 45 to 59 Minutes | 12 | 11.2% |
| 60 to 89 Minutes | 0 | 0.0% |
| 90 or more Minutes | 0 | 0.0% |
Commute Time by Sex in Vann Crossroads
The most common commute times in Vann Crossroads are 15 to 19 minutes (53 commuters, 70.7%) for males and 40 to 44 minutes (32 commuters, 100.0%) for females.
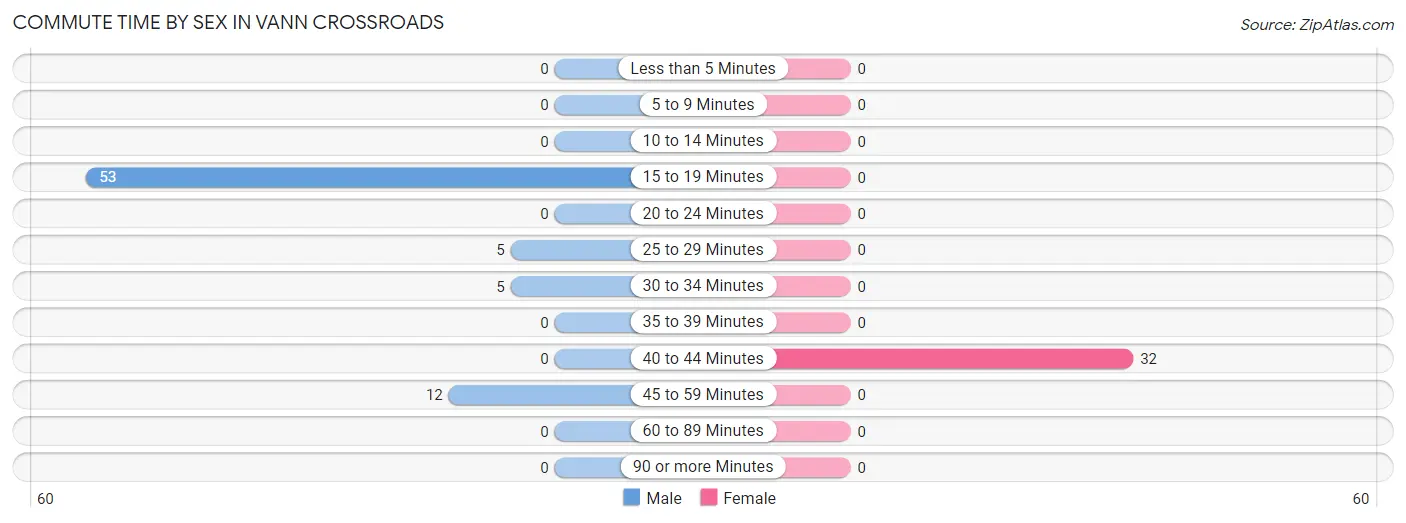
| Commute Time | Male | Female |
| Less than 5 Minutes | 0 (0.0%) | 0 (0.0%) |
| 5 to 9 Minutes | 0 (0.0%) | 0 (0.0%) |
| 10 to 14 Minutes | 0 (0.0%) | 0 (0.0%) |
| 15 to 19 Minutes | 53 (70.7%) | 0 (0.0%) |
| 20 to 24 Minutes | 0 (0.0%) | 0 (0.0%) |
| 25 to 29 Minutes | 5 (6.7%) | 0 (0.0%) |
| 30 to 34 Minutes | 5 (6.7%) | 0 (0.0%) |
| 35 to 39 Minutes | 0 (0.0%) | 0 (0.0%) |
| 40 to 44 Minutes | 0 (0.0%) | 32 (100.0%) |
| 45 to 59 Minutes | 12 (16.0%) | 0 (0.0%) |
| 60 to 89 Minutes | 0 (0.0%) | 0 (0.0%) |
| 90 or more Minutes | 0 (0.0%) | 0 (0.0%) |
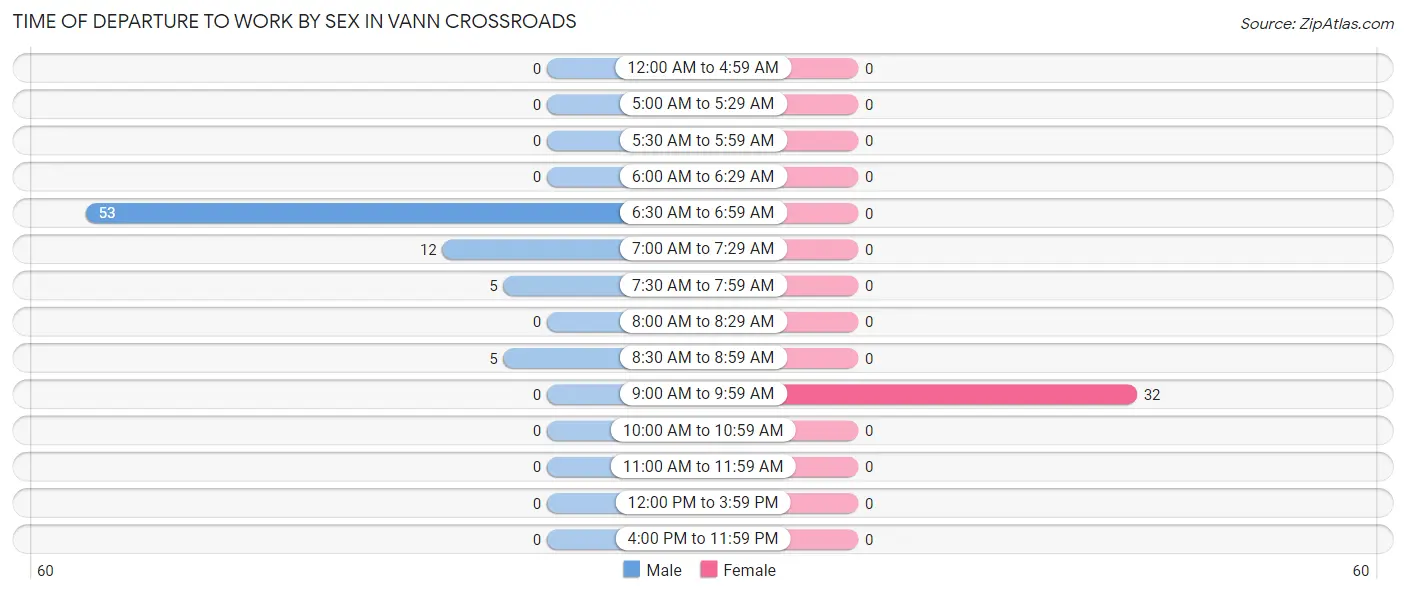
Time of Departure to Work by Sex in Vann Crossroads
The most frequent times of departure to work in Vann Crossroads are 6:30 AM to 6:59 AM (53, 70.7%) for males and 9:00 AM to 9:59 AM (32, 100.0%) for females.
| Time of Departure | Male | Female |
| 12:00 AM to 4:59 AM | 0 (0.0%) | 0 (0.0%) |
| 5:00 AM to 5:29 AM | 0 (0.0%) | 0 (0.0%) |
| 5:30 AM to 5:59 AM | 0 (0.0%) | 0 (0.0%) |
| 6:00 AM to 6:29 AM | 0 (0.0%) | 0 (0.0%) |
| 6:30 AM to 6:59 AM | 53 (70.7%) | 0 (0.0%) |
| 7:00 AM to 7:29 AM | 12 (16.0%) | 0 (0.0%) |
| 7:30 AM to 7:59 AM | 5 (6.7%) | 0 (0.0%) |
| 8:00 AM to 8:29 AM | 0 (0.0%) | 0 (0.0%) |
| 8:30 AM to 8:59 AM | 5 (6.7%) | 0 (0.0%) |
| 9:00 AM to 9:59 AM | 0 (0.0%) | 32 (100.0%) |
| 10:00 AM to 10:59 AM | 0 (0.0%) | 0 (0.0%) |
| 11:00 AM to 11:59 AM | 0 (0.0%) | 0 (0.0%) |
| 12:00 PM to 3:59 PM | 0 (0.0%) | 0 (0.0%) |
| 4:00 PM to 11:59 PM | 0 (0.0%) | 0 (0.0%) |
| Total | 75 (100.0%) | 32 (100.0%) |
Housing Occupancy in Vann Crossroads
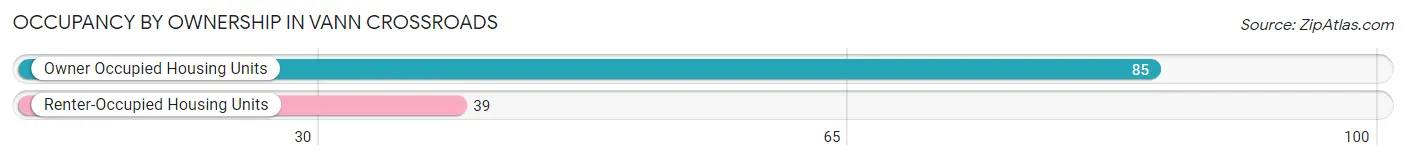
Occupancy by Ownership in Vann Crossroads
Of the total 124 dwellings in Vann Crossroads, owner-occupied units account for 85 (68.5%), while renter-occupied units make up 39 (31.5%).
| Occupancy | # Housing Units | % Housing Units |
| Owner Occupied Housing Units | 85 | 68.5% |
| Renter-Occupied Housing Units | 39 | 31.5% |
| Total Occupied Housing Units | 124 | 100.0% |
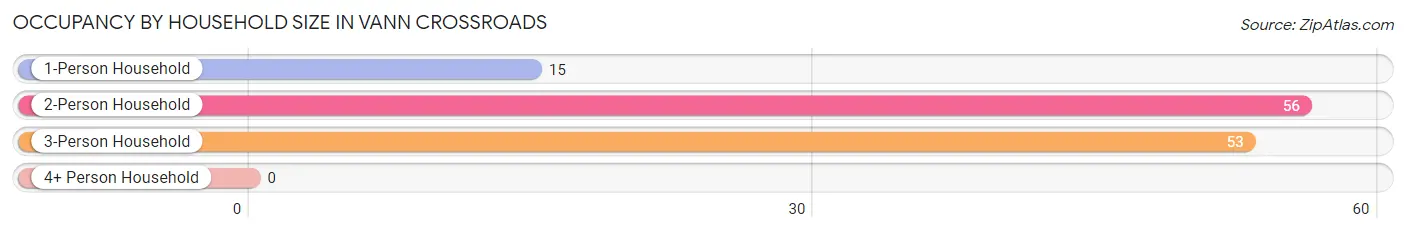
Occupancy by Household Size in Vann Crossroads
| Household Size | # Housing Units | % Housing Units |
| 1-Person Household | 15 | 12.1% |
| 2-Person Household | 56 | 45.2% |
| 3-Person Household | 53 | 42.7% |
| 4+ Person Household | 0 | 0.0% |
| Total Housing Units | 124 | 100.0% |
Occupancy by Ownership by Household Size in Vann Crossroads
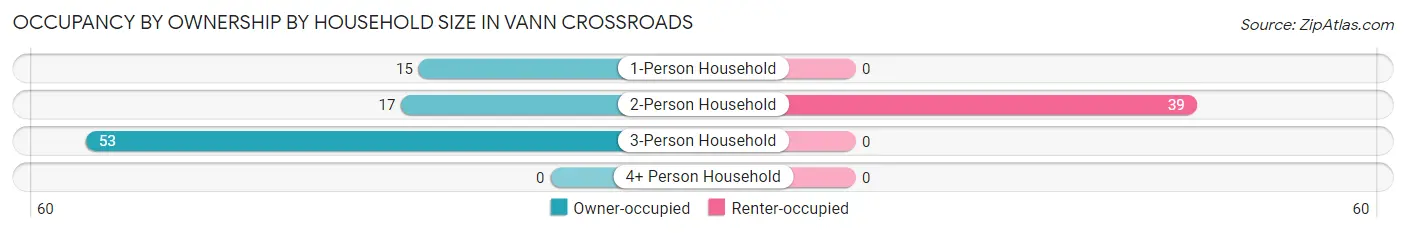
| Household Size | Owner-occupied | Renter-occupied |
| 1-Person Household | 15 (100.0%) | 0 (0.0%) |
| 2-Person Household | 17 (30.4%) | 39 (69.6%) |
| 3-Person Household | 53 (100.0%) | 0 (0.0%) |
| 4+ Person Household | 0 (0.0%) | 0 (0.0%) |
| Total Housing Units | 85 (68.5%) | 39 (31.5%) |
Occupancy by Educational Attainment in Vann Crossroads
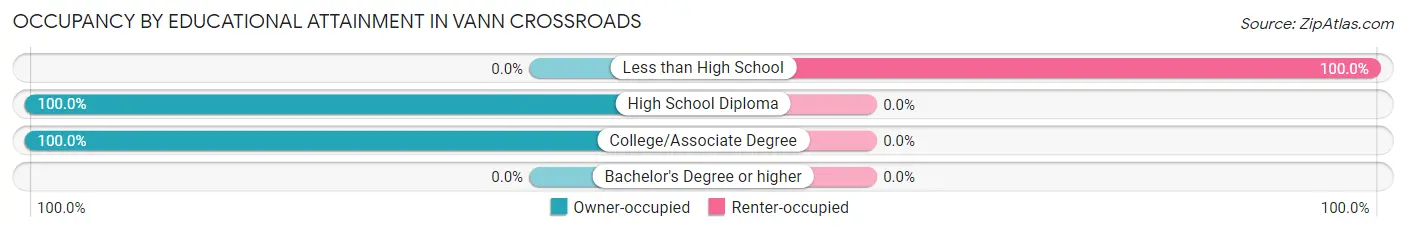
| Household Size | Owner-occupied | Renter-occupied |
| Less than High School | 0 (0.0%) | 39 (100.0%) |
| High School Diploma | 20 (100.0%) | 0 (0.0%) |
| College/Associate Degree | 65 (100.0%) | 0 (0.0%) |
| Bachelor's Degree or higher | 0 (0.0%) | 0 (0.0%) |
Occupancy by Age of Householder in Vann Crossroads
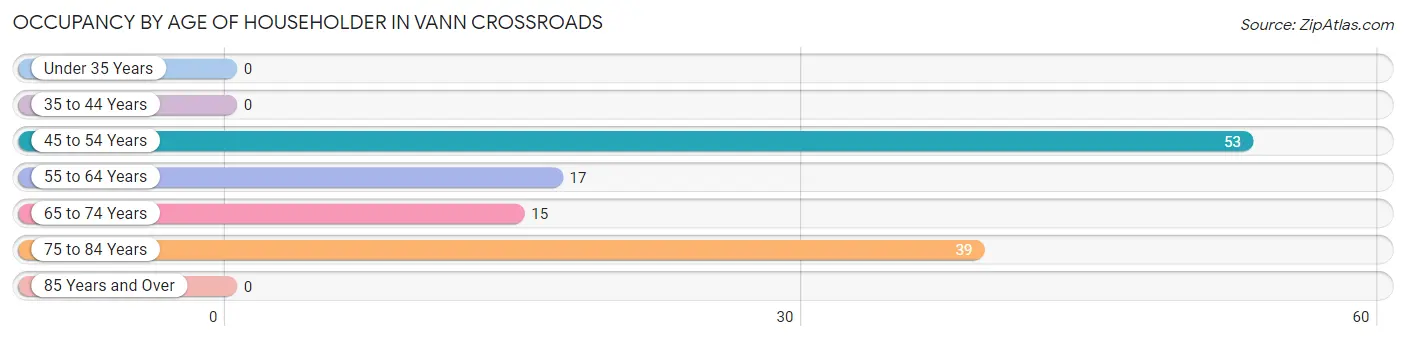
| Age Bracket | # Households | % Households |
| Under 35 Years | 0 | 0.0% |
| 35 to 44 Years | 0 | 0.0% |
| 45 to 54 Years | 53 | 42.7% |
| 55 to 64 Years | 17 | 13.7% |
| 65 to 74 Years | 15 | 12.1% |
| 75 to 84 Years | 39 | 31.5% |
| 85 Years and Over | 0 | 0.0% |
| Total | 124 | 100.0% |
Housing Finances in Vann Crossroads
Median Income by Occupancy in Vann Crossroads
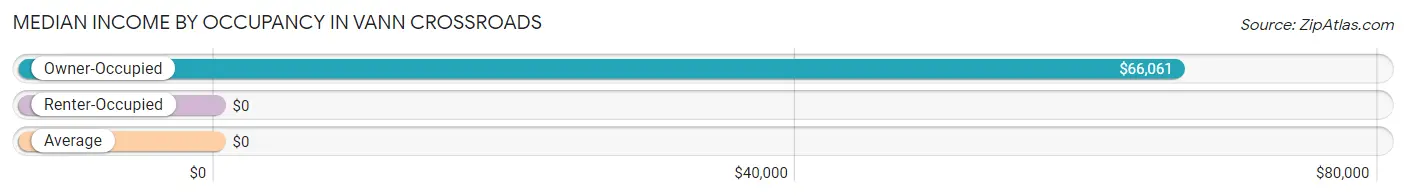
| Occupancy Type | # Households | Median Income |
| Owner-Occupied | 85 (68.5%) | $66,061 |
| Renter-Occupied | 39 (31.5%) | $0 |
| Average | 124 (100.0%) | $0 |
Occupancy by Householder Income Bracket in Vann Crossroads
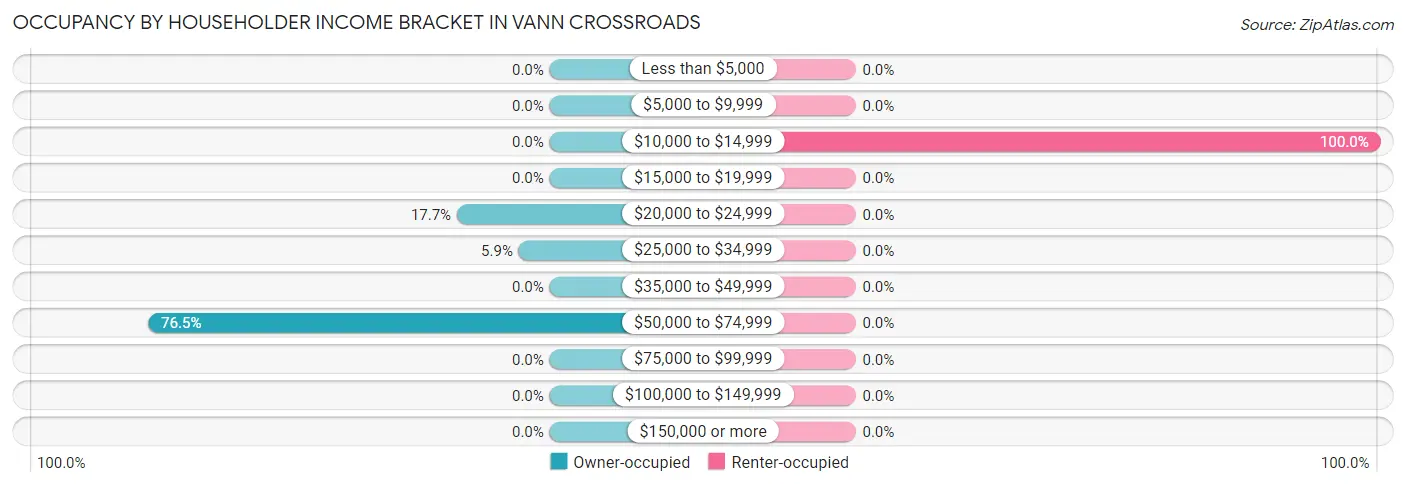
| Income Bracket | Owner-occupied | Renter-occupied |
| Less than $5,000 | 0 (0.0%) | 0 (0.0%) |
| $5,000 to $9,999 | 0 (0.0%) | 0 (0.0%) |
| $10,000 to $14,999 | 0 (0.0%) | 39 (100.0%) |
| $15,000 to $19,999 | 0 (0.0%) | 0 (0.0%) |
| $20,000 to $24,999 | 15 (17.6%) | 0 (0.0%) |
| $25,000 to $34,999 | 5 (5.9%) | 0 (0.0%) |
| $35,000 to $49,999 | 0 (0.0%) | 0 (0.0%) |
| $50,000 to $74,999 | 65 (76.5%) | 0 (0.0%) |
| $75,000 to $99,999 | 0 (0.0%) | 0 (0.0%) |
| $100,000 to $149,999 | 0 (0.0%) | 0 (0.0%) |
| $150,000 or more | 0 (0.0%) | 0 (0.0%) |
| Total | 85 (100.0%) | 39 (100.0%) |
Monthly Housing Cost Tiers in Vann Crossroads
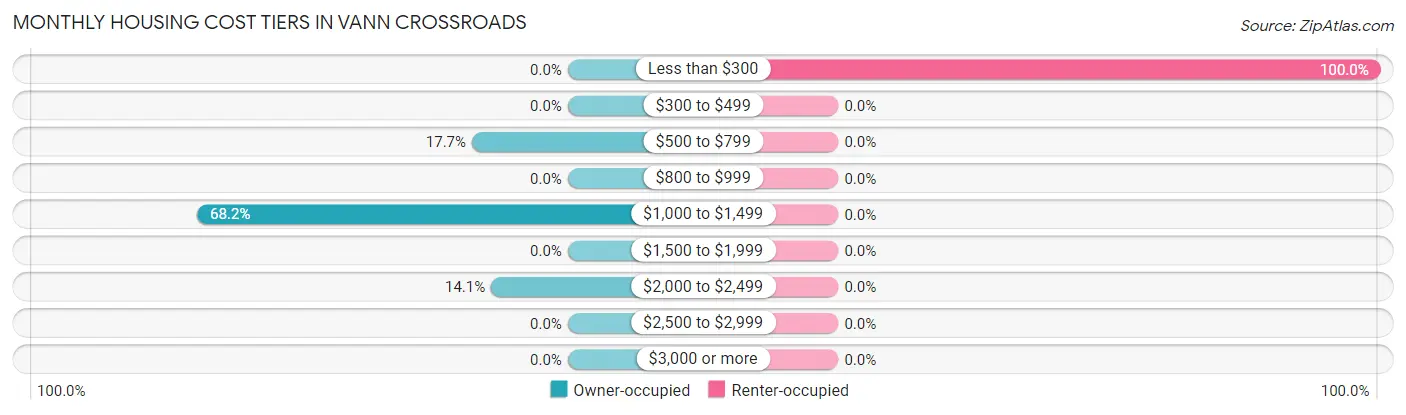
| Monthly Cost | Owner-occupied | Renter-occupied |
| Less than $300 | 0 (0.0%) | 39 (100.0%) |
| $300 to $499 | 0 (0.0%) | 0 (0.0%) |
| $500 to $799 | 15 (17.6%) | 0 (0.0%) |
| $800 to $999 | 0 (0.0%) | 0 (0.0%) |
| $1,000 to $1,499 | 58 (68.2%) | 0 (0.0%) |
| $1,500 to $1,999 | 0 (0.0%) | 0 (0.0%) |
| $2,000 to $2,499 | 12 (14.1%) | 0 (0.0%) |
| $2,500 to $2,999 | 0 (0.0%) | 0 (0.0%) |
| $3,000 or more | 0 (0.0%) | 0 (0.0%) |
| Total | 85 (100.0%) | 39 (100.0%) |
Physical Housing Characteristics in Vann Crossroads
Housing Structures in Vann Crossroads
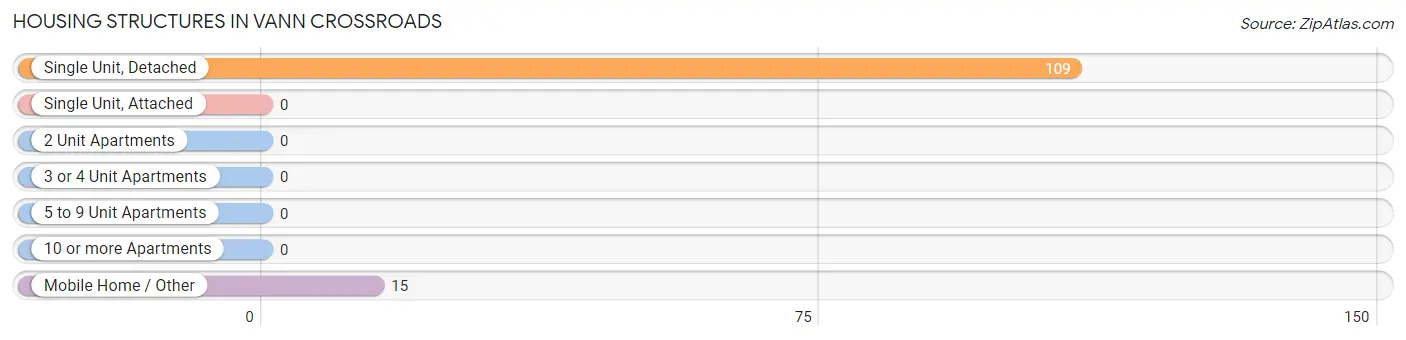
| Structure Type | # Housing Units | % Housing Units |
| Single Unit, Detached | 109 | 87.9% |
| Single Unit, Attached | 0 | 0.0% |
| 2 Unit Apartments | 0 | 0.0% |
| 3 or 4 Unit Apartments | 0 | 0.0% |
| 5 to 9 Unit Apartments | 0 | 0.0% |
| 10 or more Apartments | 0 | 0.0% |
| Mobile Home / Other | 15 | 12.1% |
| Total | 124 | 100.0% |
Housing Structures by Occupancy in Vann Crossroads
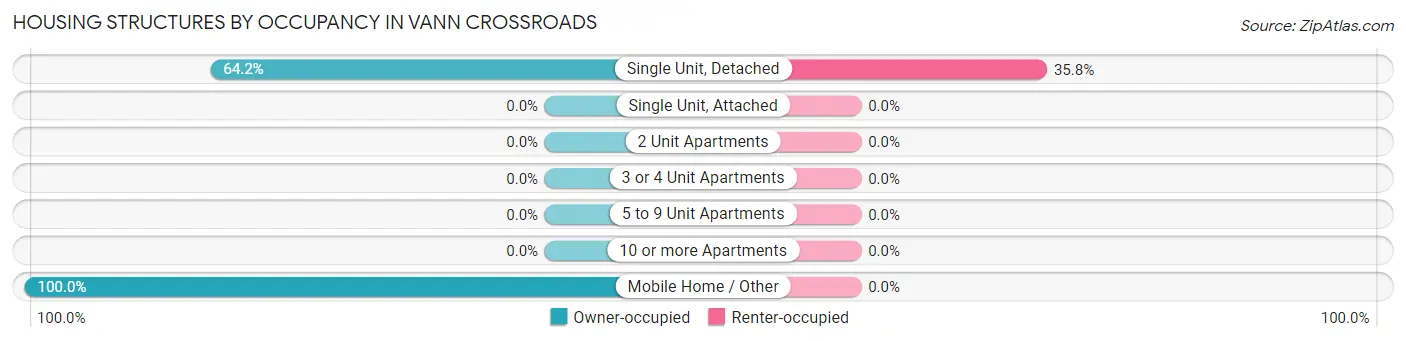
| Structure Type | Owner-occupied | Renter-occupied |
| Single Unit, Detached | 70 (64.2%) | 39 (35.8%) |
| Single Unit, Attached | 0 (0.0%) | 0 (0.0%) |
| 2 Unit Apartments | 0 (0.0%) | 0 (0.0%) |
| 3 or 4 Unit Apartments | 0 (0.0%) | 0 (0.0%) |
| 5 to 9 Unit Apartments | 0 (0.0%) | 0 (0.0%) |
| 10 or more Apartments | 0 (0.0%) | 0 (0.0%) |
| Mobile Home / Other | 15 (100.0%) | 0 (0.0%) |
| Total | 85 (68.5%) | 39 (31.5%) |
Housing Structures by Number of Rooms in Vann Crossroads
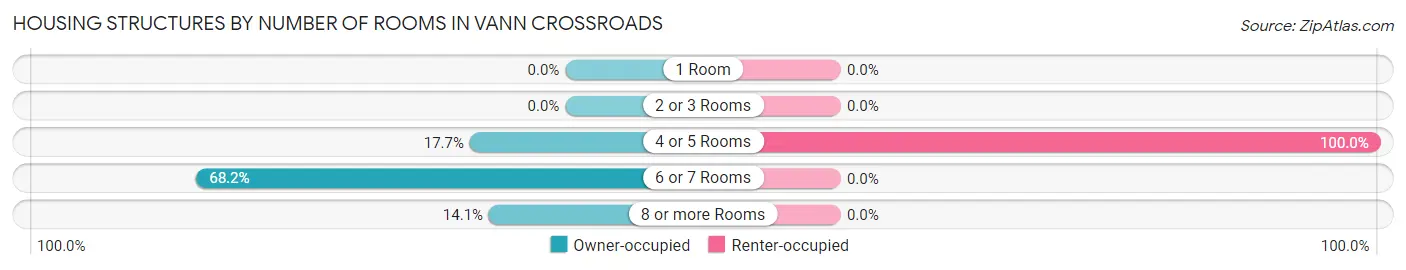
| Number of Rooms | Owner-occupied | Renter-occupied |
| 1 Room | 0 (0.0%) | 0 (0.0%) |
| 2 or 3 Rooms | 0 (0.0%) | 0 (0.0%) |
| 4 or 5 Rooms | 15 (17.6%) | 39 (100.0%) |
| 6 or 7 Rooms | 58 (68.2%) | 0 (0.0%) |
| 8 or more Rooms | 12 (14.1%) | 0 (0.0%) |
| Total | 85 (100.0%) | 39 (100.0%) |
Housing Structure by Heating Type in Vann Crossroads
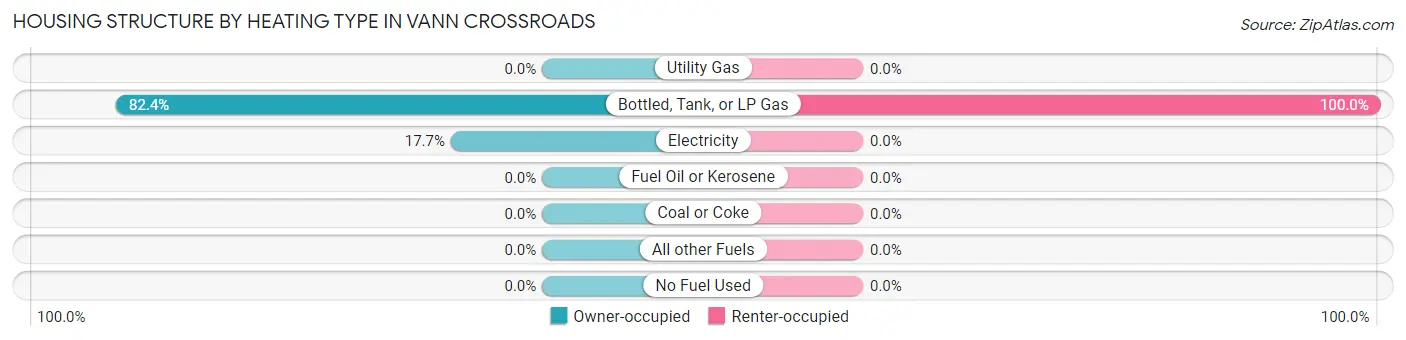
| Heating Type | Owner-occupied | Renter-occupied |
| Utility Gas | 0 (0.0%) | 0 (0.0%) |
| Bottled, Tank, or LP Gas | 70 (82.4%) | 39 (100.0%) |
| Electricity | 15 (17.6%) | 0 (0.0%) |
| Fuel Oil or Kerosene | 0 (0.0%) | 0 (0.0%) |
| Coal or Coke | 0 (0.0%) | 0 (0.0%) |
| All other Fuels | 0 (0.0%) | 0 (0.0%) |
| No Fuel Used | 0 (0.0%) | 0 (0.0%) |
| Total | 85 (100.0%) | 39 (100.0%) |
Household Vehicle Usage in Vann Crossroads
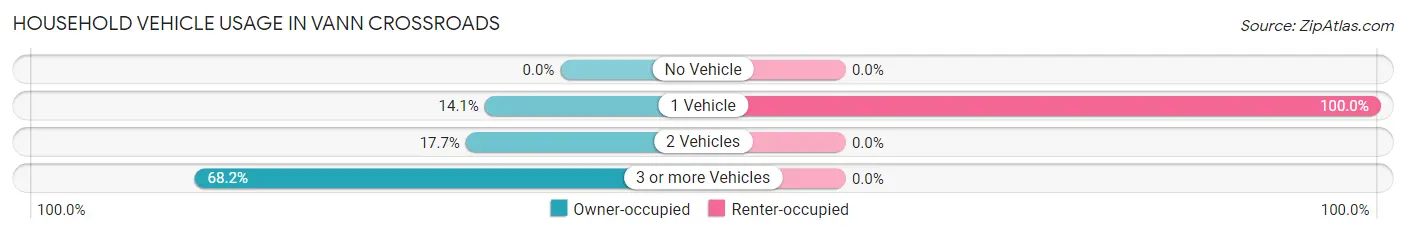
| Vehicles per Household | Owner-occupied | Renter-occupied |
| No Vehicle | 0 (0.0%) | 0 (0.0%) |
| 1 Vehicle | 12 (14.1%) | 39 (100.0%) |
| 2 Vehicles | 15 (17.6%) | 0 (0.0%) |
| 3 or more Vehicles | 58 (68.2%) | 0 (0.0%) |
| Total | 85 (100.0%) | 39 (100.0%) |
Real Estate & Mortgages in Vann Crossroads
Real Estate and Mortgage Overview in Vann Crossroads
| Characteristic | Without Mortgage | With Mortgage |
| Housing Units | 0 | 85 |
| Median Property Value | - | - |
| Median Household Income | - | - |
| Monthly Housing Costs | - | - |
| Real Estate Taxes | - | - |
Property Value by Mortgage Status in Vann Crossroads
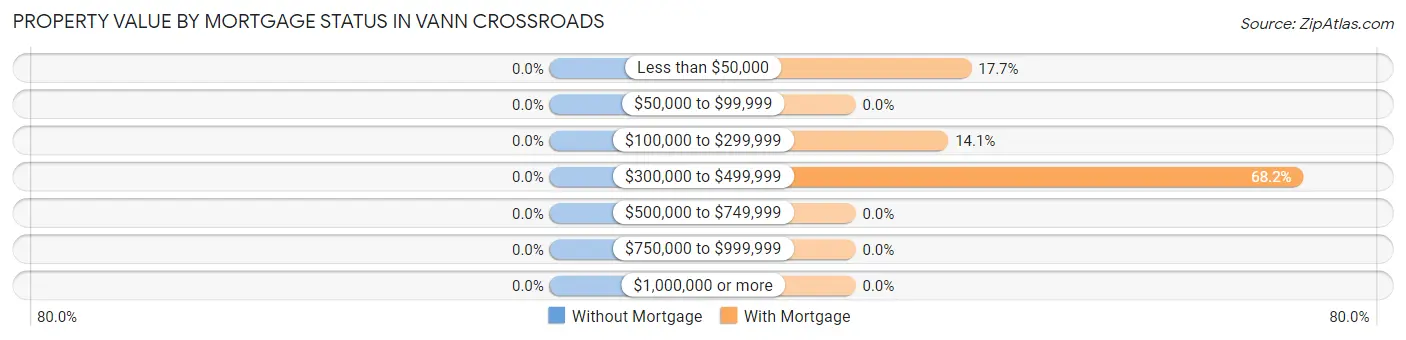
| Property Value | Without Mortgage | With Mortgage |
| Less than $50,000 | 0 (0.0%) | 15 (17.6%) |
| $50,000 to $99,999 | 0 (0.0%) | 0 (0.0%) |
| $100,000 to $299,999 | 0 (0.0%) | 12 (14.1%) |
| $300,000 to $499,999 | 0 (0.0%) | 58 (68.2%) |
| $500,000 to $749,999 | 0 (0.0%) | 0 (0.0%) |
| $750,000 to $999,999 | 0 (0.0%) | 0 (0.0%) |
| $1,000,000 or more | 0 (0.0%) | 0 (0.0%) |
| Total | 0 (0.0%) | 85 (100.0%) |
Household Income by Mortgage Status in Vann Crossroads
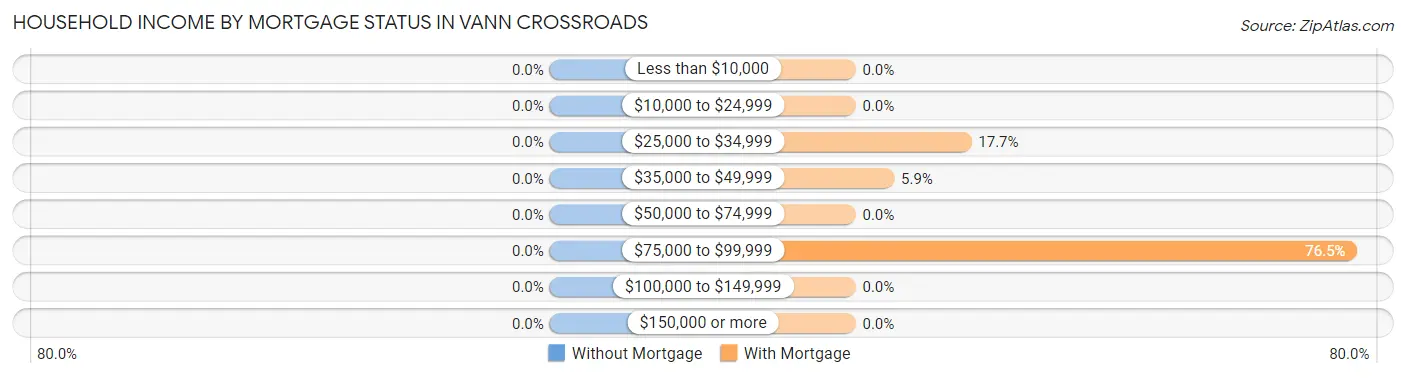
| Household Income | Without Mortgage | With Mortgage |
| Less than $10,000 | 0 (0.0%) | 0 (0.0%) |
| $10,000 to $24,999 | 0 (0.0%) | 0 (0.0%) |
| $25,000 to $34,999 | 0 (0.0%) | 15 (17.6%) |
| $35,000 to $49,999 | 0 (0.0%) | 5 (5.9%) |
| $50,000 to $74,999 | 0 (0.0%) | 0 (0.0%) |
| $75,000 to $99,999 | 0 (0.0%) | 65 (76.5%) |
| $100,000 to $149,999 | 0 (0.0%) | 0 (0.0%) |
| $150,000 or more | 0 (0.0%) | 0 (0.0%) |
| Total | 0 (0.0%) | 85 (100.0%) |
Property Value to Household Income Ratio in Vann Crossroads
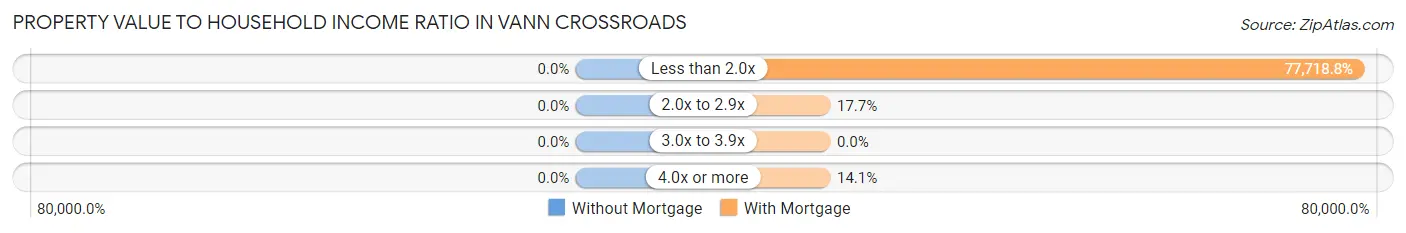
| Value-to-Income Ratio | Without Mortgage | With Mortgage |
| Less than 2.0x | 0 (0.0%) | 66,061 (77,718.8%) |
| 2.0x to 2.9x | 0 (0.0%) | 15 (17.6%) |
| 3.0x to 3.9x | 0 (0.0%) | 0 (0.0%) |
| 4.0x or more | 0 (0.0%) | 12 (14.1%) |
| Total | 0 (0.0%) | 85 (100.0%) |
Real Estate Taxes by Mortgage Status in Vann Crossroads
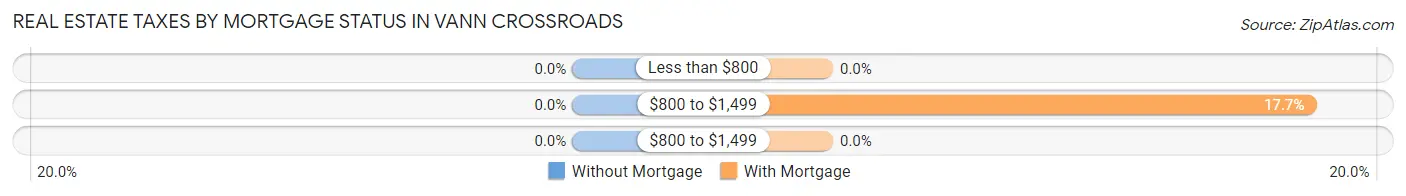
| Property Taxes | Without Mortgage | With Mortgage |
| Less than $800 | 0 (0.0%) | 0 (0.0%) |
| $800 to $1,499 | 0 (0.0%) | 15 (17.6%) |
| $800 to $1,499 | 0 (0.0%) | 0 (0.0%) |
| Total | 0 (0.0%) | 85 (100.0%) |
Health & Disability in Vann Crossroads
Health Insurance Coverage by Age in Vann Crossroads
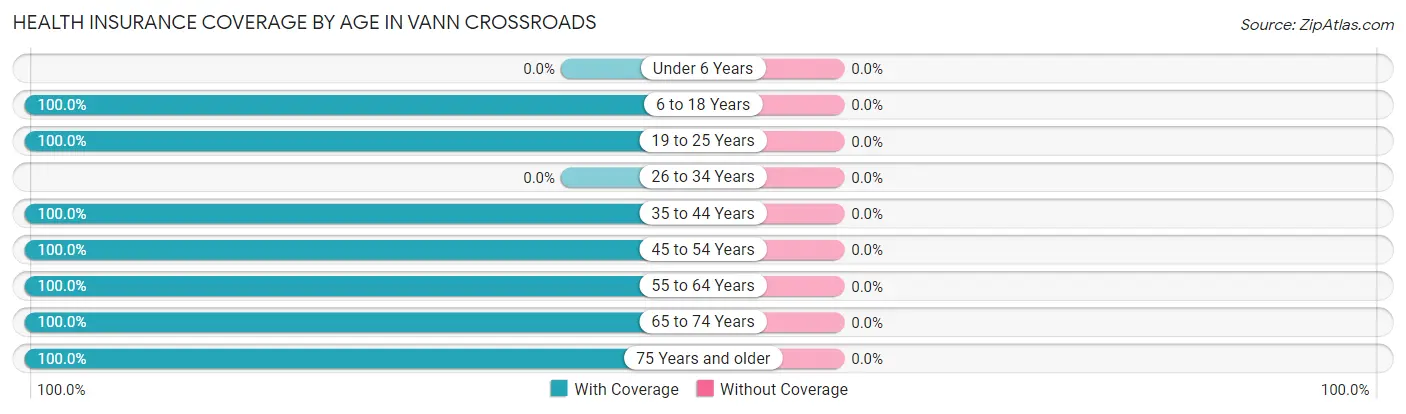
| Age Bracket | With Coverage | Without Coverage |
| Under 6 Years | 0 (0.0%) | 0 (0.0%) |
| 6 to 18 Years | 44 (100.0%) | 0 (0.0%) |
| 19 to 25 Years | 32 (100.0%) | 0 (0.0%) |
| 26 to 34 Years | 0 (0.0%) | 0 (0.0%) |
| 35 to 44 Years | 5 (100.0%) | 0 (0.0%) |
| 45 to 54 Years | 53 (100.0%) | 0 (0.0%) |
| 55 to 64 Years | 17 (100.0%) | 0 (0.0%) |
| 65 to 74 Years | 76 (100.0%) | 0 (0.0%) |
| 75 Years and older | 39 (100.0%) | 0 (0.0%) |
| Total | 266 (100.0%) | 0 (0.0%) |
Health Insurance Coverage by Citizenship Status in Vann Crossroads
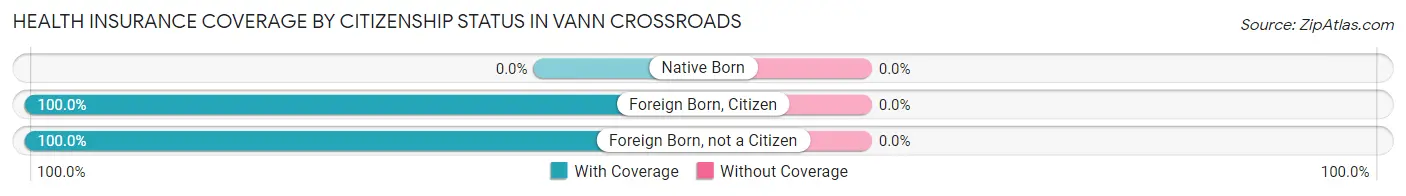
| Citizenship Status | With Coverage | Without Coverage |
| Native Born | 0 (0.0%) | 0 (0.0%) |
| Foreign Born, Citizen | 44 (100.0%) | 0 (0.0%) |
| Foreign Born, not a Citizen | 32 (100.0%) | 0 (0.0%) |
Health Insurance Coverage by Household Income in Vann Crossroads
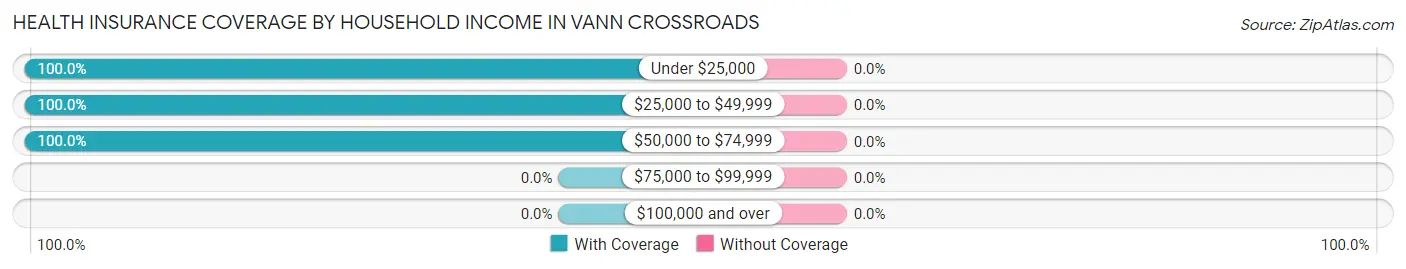
| Household Income | With Coverage | Without Coverage |
| Under $25,000 | 115 (100.0%) | 0 (0.0%) |
| $25,000 to $49,999 | 10 (100.0%) | 0 (0.0%) |
| $50,000 to $74,999 | 141 (100.0%) | 0 (0.0%) |
| $75,000 to $99,999 | 0 (0.0%) | 0 (0.0%) |
| $100,000 and over | 0 (0.0%) | 0 (0.0%) |
Public vs Private Health Insurance Coverage by Age in Vann Crossroads
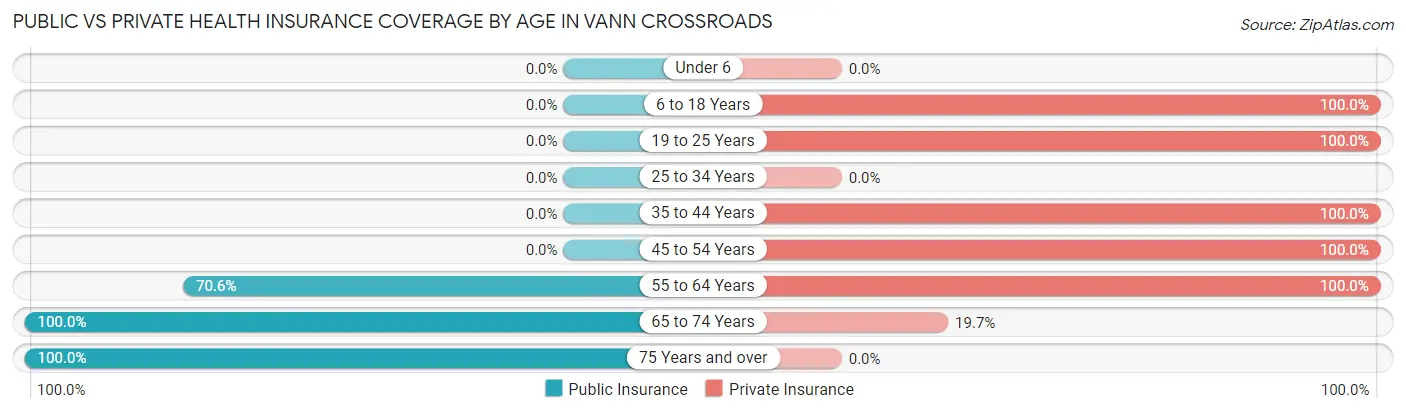
| Age Bracket | Public Insurance | Private Insurance |
| Under 6 | 0 (0.0%) | 0 (0.0%) |
| 6 to 18 Years | 0 (0.0%) | 44 (100.0%) |
| 19 to 25 Years | 0 (0.0%) | 32 (100.0%) |
| 25 to 34 Years | 0 (0.0%) | 0 (0.0%) |
| 35 to 44 Years | 0 (0.0%) | 5 (100.0%) |
| 45 to 54 Years | 0 (0.0%) | 53 (100.0%) |
| 55 to 64 Years | 12 (70.6%) | 17 (100.0%) |
| 65 to 74 Years | 76 (100.0%) | 15 (19.7%) |
| 75 Years and over | 39 (100.0%) | 0 (0.0%) |
| Total | 127 (47.7%) | 166 (62.4%) |
Disability Status by Sex by Age in Vann Crossroads
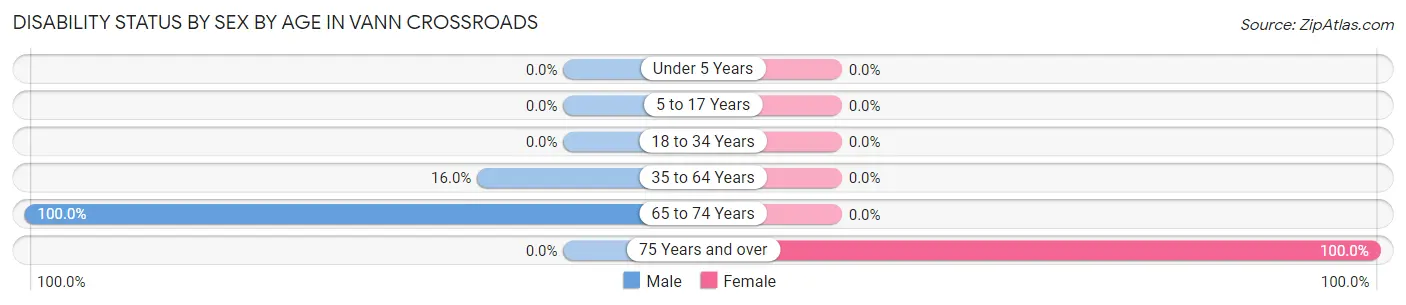
| Age Bracket | Male | Female |
| Under 5 Years | 0 (0.0%) | 0 (0.0%) |
| 5 to 17 Years | 0 (0.0%) | 0 (0.0%) |
| 18 to 34 Years | 0 (0.0%) | 0 (0.0%) |
| 35 to 64 Years | 12 (16.0%) | 0 (0.0%) |
| 65 to 74 Years | 15 (100.0%) | 0 (0.0%) |
| 75 Years and over | 0 (0.0%) | 39 (100.0%) |
Disability Class by Sex by Age in Vann Crossroads
Disability Class: Hearing Difficulty
| Age Bracket | Male | Female |
| Under 5 Years | 0 (0.0%) | 0 (0.0%) |
| 5 to 17 Years | 0 (0.0%) | 0 (0.0%) |
| 18 to 34 Years | 0 (0.0%) | 0 (0.0%) |
| 35 to 64 Years | 0 (0.0%) | 0 (0.0%) |
| 65 to 74 Years | 0 (0.0%) | 0 (0.0%) |
| 75 Years and over | 0 (0.0%) | 0 (0.0%) |
Disability Class: Vision Difficulty
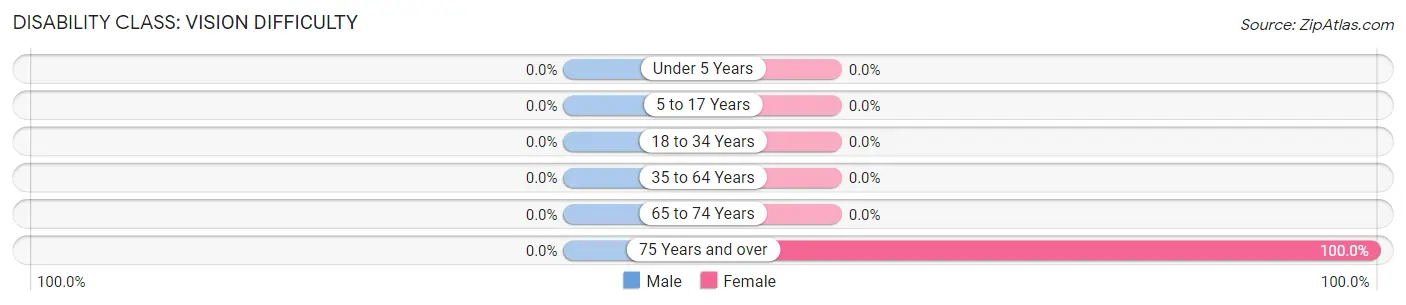
| Age Bracket | Male | Female |
| Under 5 Years | 0 (0.0%) | 0 (0.0%) |
| 5 to 17 Years | 0 (0.0%) | 0 (0.0%) |
| 18 to 34 Years | 0 (0.0%) | 0 (0.0%) |
| 35 to 64 Years | 0 (0.0%) | 0 (0.0%) |
| 65 to 74 Years | 0 (0.0%) | 0 (0.0%) |
| 75 Years and over | 0 (0.0%) | 39 (100.0%) |
Disability Class: Cognitive Difficulty
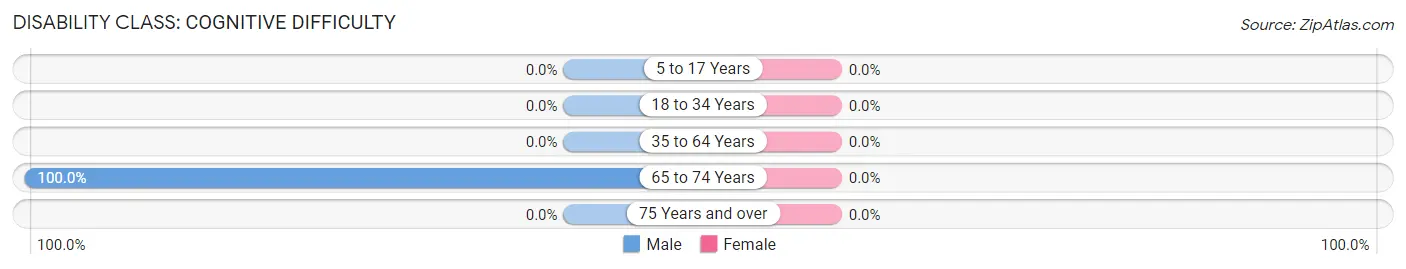
| Age Bracket | Male | Female |
| 5 to 17 Years | 0 (0.0%) | 0 (0.0%) |
| 18 to 34 Years | 0 (0.0%) | 0 (0.0%) |
| 35 to 64 Years | 0 (0.0%) | 0 (0.0%) |
| 65 to 74 Years | 15 (100.0%) | 0 (0.0%) |
| 75 Years and over | 0 (0.0%) | 0 (0.0%) |
Disability Class: Ambulatory Difficulty
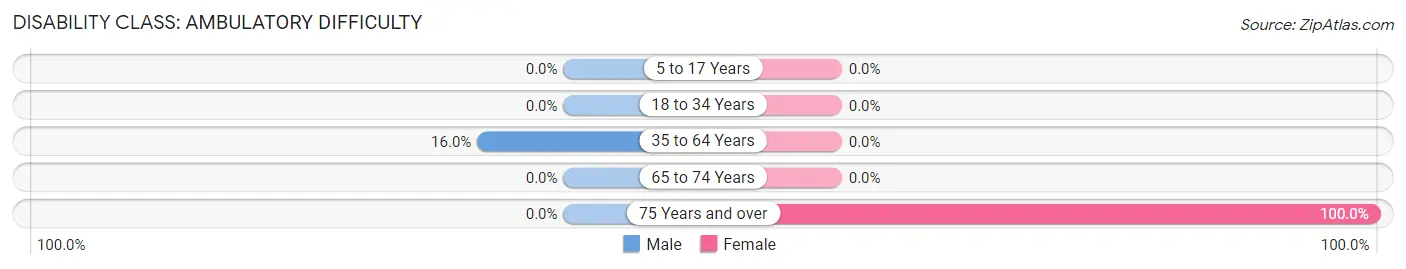
| Age Bracket | Male | Female |
| 5 to 17 Years | 0 (0.0%) | 0 (0.0%) |
| 18 to 34 Years | 0 (0.0%) | 0 (0.0%) |
| 35 to 64 Years | 12 (16.0%) | 0 (0.0%) |
| 65 to 74 Years | 0 (0.0%) | 0 (0.0%) |
| 75 Years and over | 0 (0.0%) | 39 (100.0%) |
Disability Class: Self-Care Difficulty
| Age Bracket | Male | Female |
| 5 to 17 Years | 0 (0.0%) | 0 (0.0%) |
| 18 to 34 Years | 0 (0.0%) | 0 (0.0%) |
| 35 to 64 Years | 0 (0.0%) | 0 (0.0%) |
| 65 to 74 Years | 0 (0.0%) | 0 (0.0%) |
| 75 Years and over | 0 (0.0%) | 0 (0.0%) |
Technology Access in Vann Crossroads
Computing Device Access in Vann Crossroads
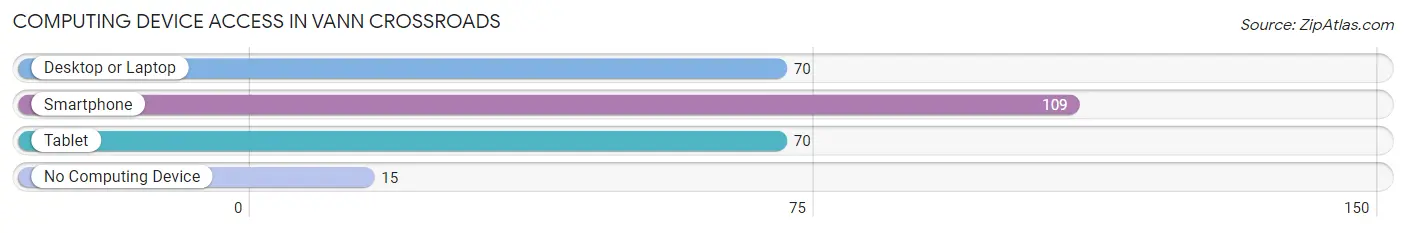
| Device Type | # Households | % Households |
| Desktop or Laptop | 70 | 56.5% |
| Smartphone | 109 | 87.9% |
| Tablet | 70 | 56.5% |
| No Computing Device | 15 | 12.1% |
| Total | 124 | 100.0% |
Internet Access in Vann Crossroads
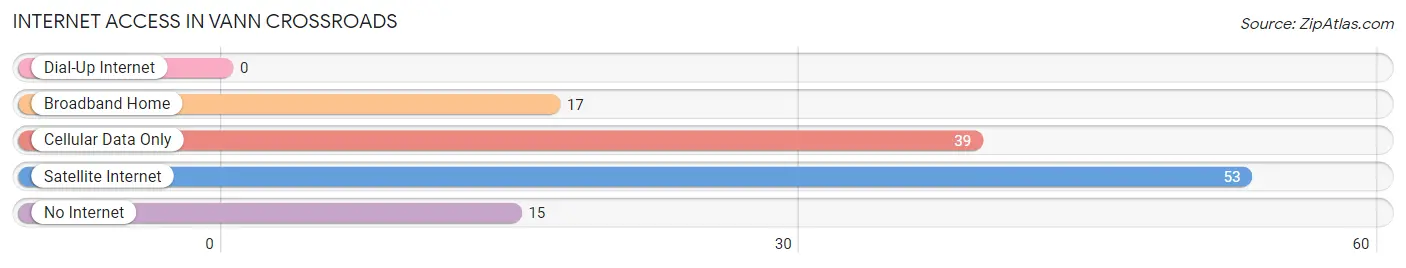
| Internet Type | # Households | % Households |
| Dial-Up Internet | 0 | 0.0% |
| Broadband Home | 17 | 13.7% |
| Cellular Data Only | 39 | 31.5% |
| Satellite Internet | 53 | 42.7% |
| No Internet | 15 | 12.1% |
| Total | 124 | 100.0% |
Vann Crossroads Summary
Vann Crossroads is a small unincorporated community located in Johnston County, North Carolina. It is situated at the intersection of NC Highway 42 and NC Highway 96, approximately 10 miles east of Smithfield and 25 miles south of Raleigh. The community is named after the Vann family, who were among the first settlers in the area.
History
The Vann family first settled in the area in the late 1700s. The family was of English descent and had migrated from Virginia. They established a small farm and built a log cabin near the intersection of NC Highway 42 and NC Highway 96. The area became known as Vann Crossroads, and the Vann family continued to live in the area for several generations.
In the early 1900s, the community began to grow as more people moved to the area. A post office was established in the community in 1910, and a general store was opened in 1912. The store served as a gathering place for the community and was a popular spot for locals to buy groceries and other supplies.
In the 1950s, the community began to decline as many of the residents moved away in search of better economic opportunities. The post office closed in the 1960s, and the general store closed in the 1970s. Today, Vann Crossroads is a small, rural community with a population of approximately 200 people.
Geography
Vann Crossroads is located in the Coastal Plain region of North Carolina. The terrain is mostly flat, with some rolling hills. The area is mostly rural, with some small farms and wooded areas. The community is located near the Neuse River, which provides a source of recreation for the locals.
The climate in Vann Crossroads is humid subtropical, with hot, humid summers and mild winters. The average annual temperature is around 70 degrees Fahrenheit, and the average annual precipitation is around 45 inches.
Economy
The economy of Vann Crossroads is largely based on agriculture. The area is home to several small farms, which produce a variety of crops, including corn, soybeans, and cotton. The community also has a few small businesses, including a convenience store, a gas station, and a few restaurants.
Demographics
As of the 2010 census, the population of Vann Crossroads was approximately 200 people. The racial makeup of the community was 97.5% White, 0.5% African American, 0.5% Native American, and 1.5% other. The median household income was $37,500, and the median home value was $125,000.
Conclusion
Vann Crossroads is a small, rural community located in Johnston County, North Carolina. The community is named after the Vann family, who were among the first settlers in the area. The economy of Vann Crossroads is largely based on agriculture, and the population is approximately 200 people. The community is a peaceful, quiet place to live, and it offers a unique glimpse into the history and culture of the area.
Common Questions
What is Per Capita Income in Vann Crossroads?
Per Capita income in Vann Crossroads is $19,759.
What is the Median Family Income in Vann Crossroads?
Median Family Income in Vann Crossroads is $65,613.
What is Inequality or Gini Index in Vann Crossroads?
Inequality or Gini Index in Vann Crossroads is 0.31.
What is the Total Population of Vann Crossroads?
Total Population of Vann Crossroads is 266.
What is the Total Male Population of Vann Crossroads?
Total Male Population of Vann Crossroads is 112.
What is the Total Female Population of Vann Crossroads?
Total Female Population of Vann Crossroads is 154.
What is the Ratio of Males per 100 Females in Vann Crossroads?
There are 72.73 Males per 100 Females in Vann Crossroads.
What is the Ratio of Females per 100 Males in Vann Crossroads?
There are 137.50 Females per 100 Males in Vann Crossroads.
What is the Median Population Age in Vann Crossroads?
Median Population Age in Vann Crossroads is 46.0 Years.
What is the Average Family Size in Vann Crossroads
Average Family Size in Vann Crossroads is 2.3 People.
What is the Average Household Size in Vann Crossroads
Average Household Size in Vann Crossroads is 2.1 People.
How Large is the Labor Force in Vann Crossroads?
There are 107 People in the Labor Forcein in Vann Crossroads.
What is the Percentage of People in the Labor Force in Vann Crossroads?
43.9% of People are in the Labor Force in Vann Crossroads.