Jefferson County, TX Map & Demographics
Jefferson County Map
Jefferson County Overview
$30,770
PER CAPITA INCOME
$70,812
AVG FAMILY INCOME
$57,294
AVG HOUSEHOLD INCOME
34.7%
WAGE / INCOME GAP [ % ]
65.3¢/ $1
WAGE / INCOME GAP [ $ ]
$12,206
FAMILY INCOME DEFICIT
0.48
INEQUALITY / GINI INDEX
254,942
TOTAL POPULATION
131,138
MALE POPULATION
123,804
FEMALE POPULATION
105.92
MALES / 100 FEMALES
94.41
FEMALES / 100 MALES
36.8
MEDIAN AGE
3.2
AVG FAMILY SIZE
2.6
AVG HOUSEHOLD SIZE
110,827
LABOR FORCE [ PEOPLE ]
55.7%
PERCENT IN LABOR FORCE
5.4%
UNEMPLOYMENT RATE
Jefferson County Area Codes
Income in Jefferson County
Income Overview in Jefferson County
Per Capita Income in Jefferson County is $30,770, while median incomes of families and households are $70,812 and $57,294 respectively.
| Characteristic | Number | Measure |
| Per Capita Income | 254,942 | $30,770 |
| Median Family Income | 60,396 | $70,812 |
| Mean Family Income | 60,396 | $94,443 |
| Median Household Income | 93,193 | $57,294 |
| Mean Household Income | 93,193 | $81,574 |
| Income Deficit | 60,396 | $12,206 |
| Wage / Income Gap (%) | 254,942 | 34.71% |
| Wage / Income Gap ($) | 254,942 | 65.29¢ per $1 |
| Gini / Inequality Index | 254,942 | 0.48 |
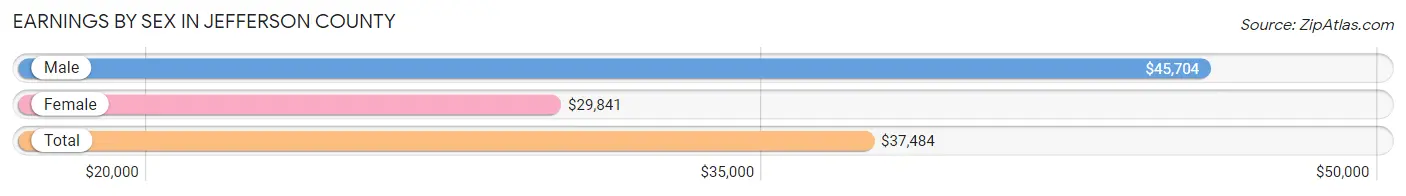
Earnings by Sex in Jefferson County
Average Earnings in Jefferson County are $37,484, $45,704 for men and $29,841 for women, a difference of 34.7%.
| Sex | Number | Average Earnings |
| Male | 65,160 (54.7%) | $45,704 |
| Female | 53,926 (45.3%) | $29,841 |
| Total | 119,086 (100.0%) | $37,484 |
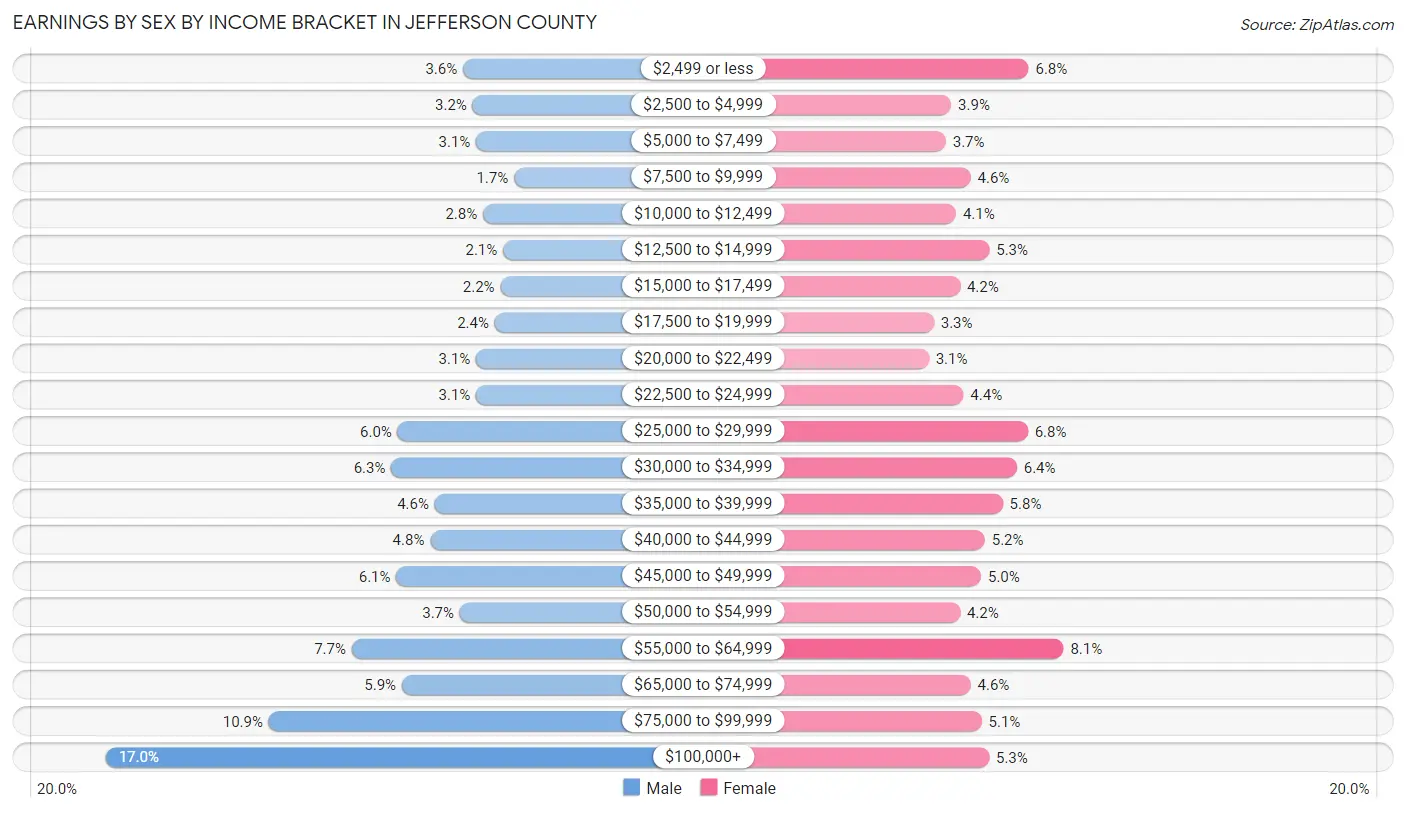
Earnings by Sex by Income Bracket in Jefferson County
The most common earnings brackets in Jefferson County are $100,000+ for men (11,048 | 17.0%) and $55,000 to $64,999 for women (4,379 | 8.1%).
| Income | Male | Female |
| $2,499 or less | 2,327 (3.6%) | 3,670 (6.8%) |
| $2,500 to $4,999 | 2,092 (3.2%) | 2,109 (3.9%) |
| $5,000 to $7,499 | 2,010 (3.1%) | 2,002 (3.7%) |
| $7,500 to $9,999 | 1,080 (1.7%) | 2,504 (4.6%) |
| $10,000 to $12,499 | 1,835 (2.8%) | 2,207 (4.1%) |
| $12,500 to $14,999 | 1,352 (2.1%) | 2,879 (5.3%) |
| $15,000 to $17,499 | 1,411 (2.2%) | 2,286 (4.2%) |
| $17,500 to $19,999 | 1,553 (2.4%) | 1,758 (3.3%) |
| $20,000 to $22,499 | 2,010 (3.1%) | 1,657 (3.1%) |
| $22,500 to $24,999 | 2,008 (3.1%) | 2,357 (4.4%) |
| $25,000 to $29,999 | 3,922 (6.0%) | 3,654 (6.8%) |
| $30,000 to $34,999 | 4,077 (6.3%) | 3,434 (6.4%) |
| $35,000 to $39,999 | 3,018 (4.6%) | 3,147 (5.8%) |
| $40,000 to $44,999 | 3,125 (4.8%) | 2,788 (5.2%) |
| $45,000 to $49,999 | 3,952 (6.1%) | 2,710 (5.0%) |
| $50,000 to $54,999 | 2,407 (3.7%) | 2,287 (4.2%) |
| $55,000 to $64,999 | 5,046 (7.7%) | 4,379 (8.1%) |
| $65,000 to $74,999 | 3,820 (5.9%) | 2,502 (4.6%) |
| $75,000 to $99,999 | 7,067 (10.8%) | 2,723 (5.1%) |
| $100,000+ | 11,048 (17.0%) | 2,873 (5.3%) |
| Total | 65,160 (100.0%) | 53,926 (100.0%) |
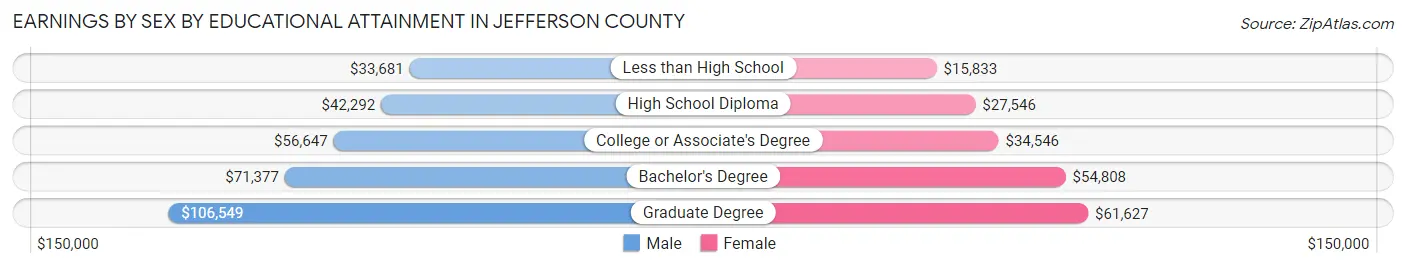
Earnings by Sex by Educational Attainment in Jefferson County
Average earnings in Jefferson County are $51,482 for men and $35,230 for women, a difference of 31.6%. Men with an educational attainment of graduate degree enjoy the highest average annual earnings of $106,549, while those with less than high school education earn the least with $33,681. Women with an educational attainment of graduate degree earn the most with the average annual earnings of $61,627, while those with less than high school education have the smallest earnings of $15,833.
| Educational Attainment | Male Income | Female Income |
| Less than High School | $33,681 | $15,833 |
| High School Diploma | $42,292 | $27,546 |
| College or Associate's Degree | $56,647 | $34,546 |
| Bachelor's Degree | $71,377 | $54,808 |
| Graduate Degree | $106,549 | $61,627 |
| Total | $51,482 | $35,230 |
Family Income in Jefferson County
Family Income Brackets in Jefferson County
According to the Jefferson County family income data, there are 10,811 families falling into the $100,000 to $149,999 income range, which is the most common income bracket and makes up 17.9% of all families. Conversely, the $10,000 to $14,999 income bracket is the least frequent group with only 1,812 families (3.0%) belonging to this category.
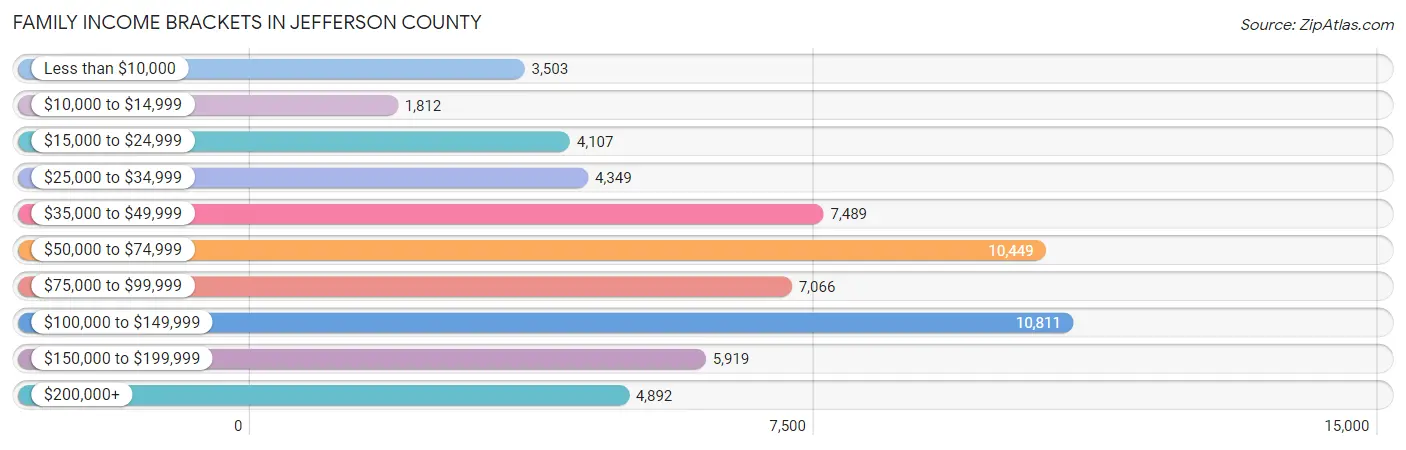
| Income Bracket | # Families | % Families |
| Less than $10,000 | 3,503 | 5.8% |
| $10,000 to $14,999 | 1,812 | 3.0% |
| $15,000 to $24,999 | 4,107 | 6.8% |
| $25,000 to $34,999 | 4,349 | 7.2% |
| $35,000 to $49,999 | 7,489 | 12.4% |
| $50,000 to $74,999 | 10,449 | 17.3% |
| $75,000 to $99,999 | 7,066 | 11.7% |
| $100,000 to $149,999 | 10,811 | 17.9% |
| $150,000 to $199,999 | 5,919 | 9.8% |
| $200,000+ | 4,892 | 8.1% |
Family Income by Famaliy Size in Jefferson County
7+ person families (901 | 1.5%) account for the highest median family income in Jefferson County with $110,709 per family, while 2-person families (28,011 | 46.4%) have the highest median income of $32,382 per family member.
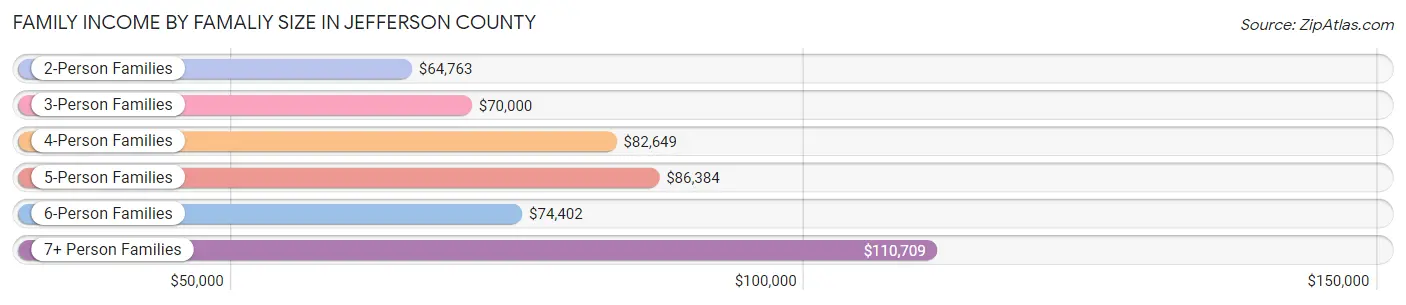
| Income Bracket | # Families | Median Income |
| 2-Person Families | 28,011 (46.4%) | $64,763 |
| 3-Person Families | 13,914 (23.0%) | $70,000 |
| 4-Person Families | 10,239 (17.0%) | $82,649 |
| 5-Person Families | 5,180 (8.6%) | $86,384 |
| 6-Person Families | 2,151 (3.6%) | $74,402 |
| 7+ Person Families | 901 (1.5%) | $110,709 |
| Total | 60,396 (100.0%) | $70,812 |
Family Income by Number of Earners in Jefferson County
The median family income in Jefferson County is $70,812, with families comprising 3+ earners (6,001) having the highest median family income of $123,068, while families with no earners (9,899) have the lowest median family income of $36,899, accounting for 9.9% and 16.4% of families, respectively.
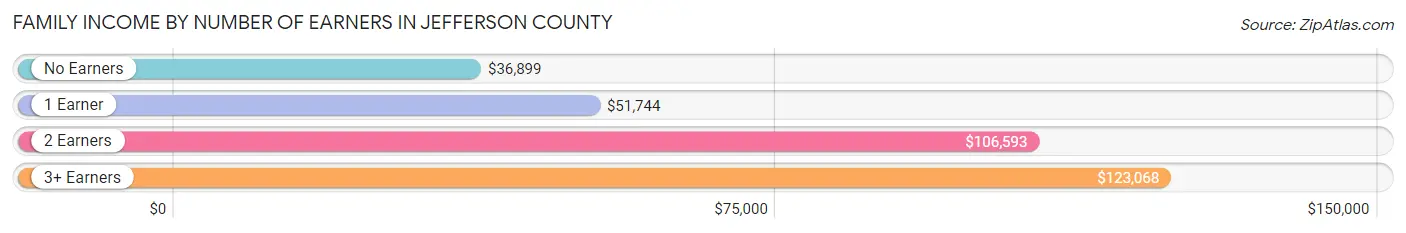
| Number of Earners | # Families | Median Income |
| No Earners | 9,899 (16.4%) | $36,899 |
| 1 Earner | 24,409 (40.4%) | $51,744 |
| 2 Earners | 20,087 (33.3%) | $106,593 |
| 3+ Earners | 6,001 (9.9%) | $123,068 |
| Total | 60,396 (100.0%) | $70,812 |
Household Income in Jefferson County
Household Income Brackets in Jefferson County
With 15,656 households falling in the category, the $50,000 to $74,999 income range is the most frequent in Jefferson County, accounting for 16.8% of all households. In contrast, only 4,939 households (5.3%) fall into the $10,000 to $14,999 income bracket, making it the least populous group.
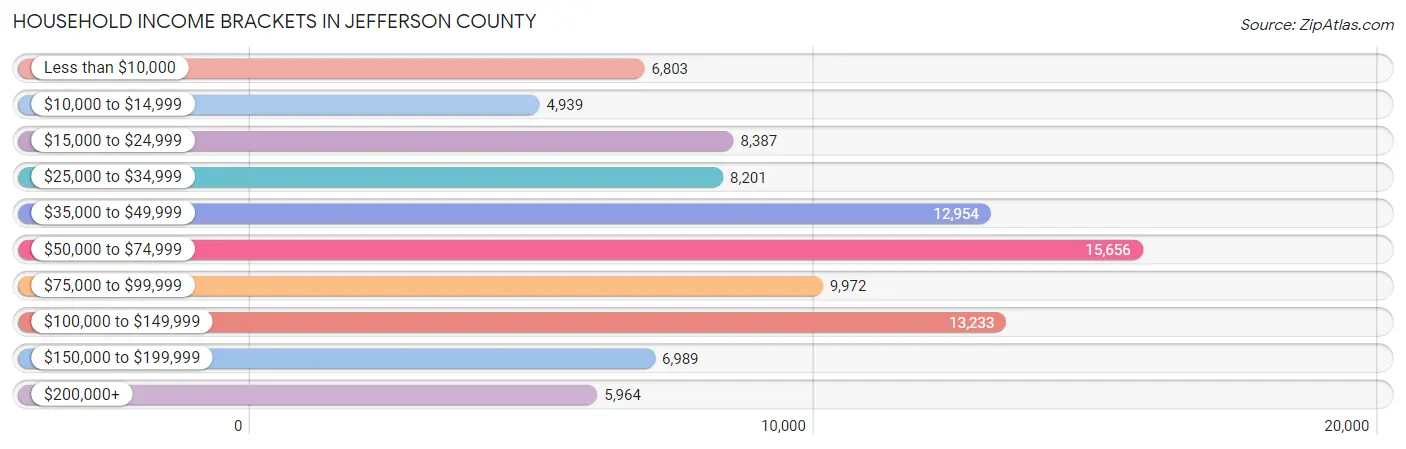
| Income Bracket | # Households | % Households |
| Less than $10,000 | 6,803 | 7.3% |
| $10,000 to $14,999 | 4,939 | 5.3% |
| $15,000 to $24,999 | 8,387 | 9.0% |
| $25,000 to $34,999 | 8,201 | 8.8% |
| $35,000 to $49,999 | 12,954 | 13.9% |
| $50,000 to $74,999 | 15,656 | 16.8% |
| $75,000 to $99,999 | 9,972 | 10.7% |
| $100,000 to $149,999 | 13,233 | 14.2% |
| $150,000 to $199,999 | 6,989 | 7.5% |
| $200,000+ | 5,964 | 6.4% |
Household Income by Householder Age in Jefferson County
The median household income in Jefferson County is $57,294, with the highest median household income of $70,315 found in the 45 to 64 years age bracket for the primary householder. A total of 33,051 households (35.5%) fall into this category. Meanwhile, the 15 to 24 years age bracket for the primary householder has the lowest median household income of $28,805, with 4,736 households (5.1%) in this group.
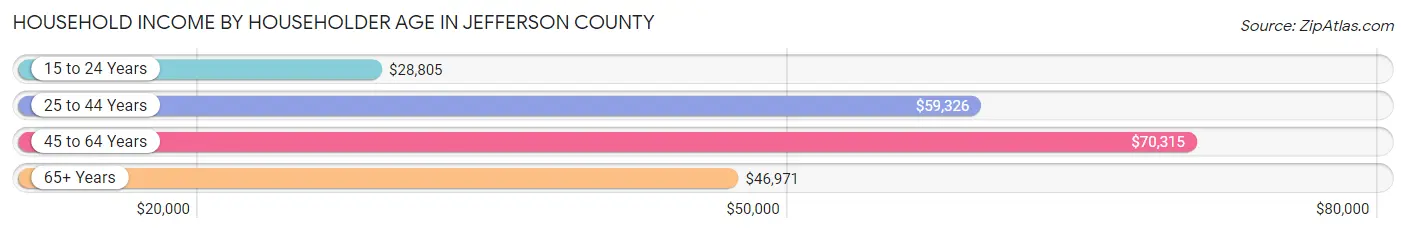
| Income Bracket | # Households | Median Income |
| 15 to 24 Years | 4,736 (5.1%) | $28,805 |
| 25 to 44 Years | 31,807 (34.1%) | $59,326 |
| 45 to 64 Years | 33,051 (35.5%) | $70,315 |
| 65+ Years | 23,599 (25.3%) | $46,971 |
| Total | 93,193 (100.0%) | $57,294 |
Poverty in Jefferson County
Income Below Poverty by Sex and Age in Jefferson County
With 15.9% poverty level for males and 20.4% for females among the residents of Jefferson County, 6 to 11 year old males and 15 year old females are the most vulnerable to poverty, with 3,127 males (30.1%) and 546 females (30.1%) in their respective age groups living below the poverty level.
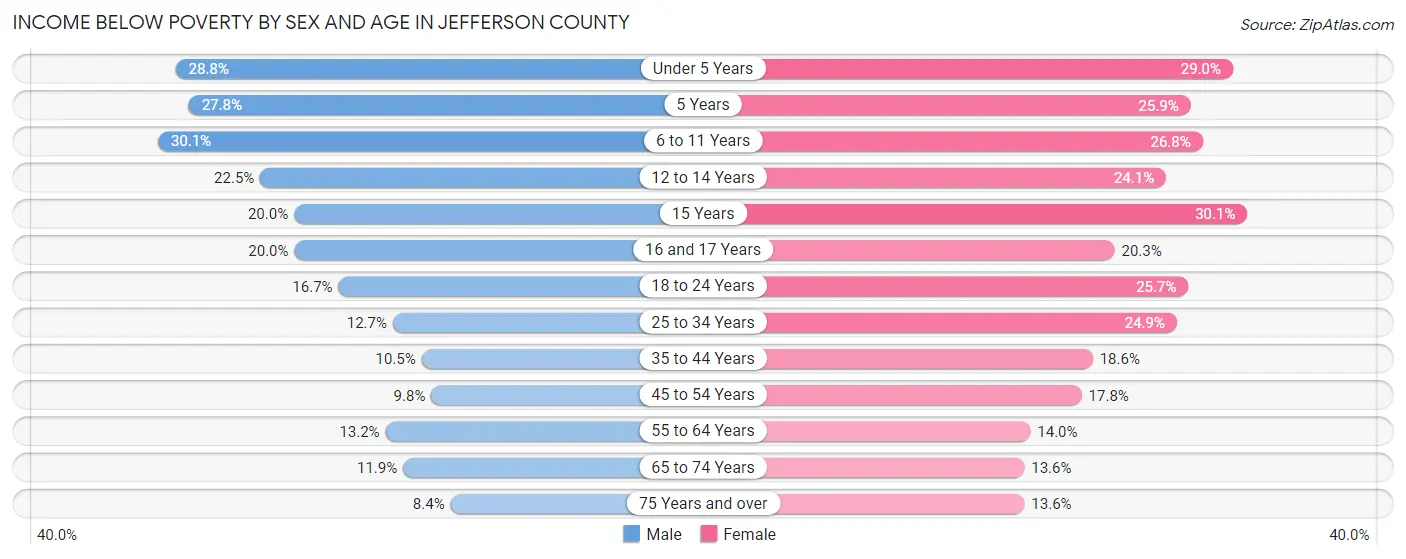
| Age Bracket | Male | Female |
| Under 5 Years | 2,450 (28.8%) | 2,296 (29.0%) |
| 5 Years | 532 (27.8%) | 444 (25.9%) |
| 6 to 11 Years | 3,127 (30.1%) | 2,723 (26.8%) |
| 12 to 14 Years | 1,182 (22.5%) | 1,199 (24.1%) |
| 15 Years | 414 (20.0%) | 546 (30.1%) |
| 16 and 17 Years | 555 (20.0%) | 620 (20.3%) |
| 18 to 24 Years | 1,818 (16.7%) | 2,584 (25.7%) |
| 25 to 34 Years | 2,146 (12.7%) | 4,059 (24.9%) |
| 35 to 44 Years | 1,567 (10.5%) | 2,842 (18.6%) |
| 45 to 54 Years | 1,328 (9.8%) | 2,483 (17.8%) |
| 55 to 64 Years | 1,903 (13.2%) | 2,217 (14.0%) |
| 65 to 74 Years | 1,200 (11.9%) | 1,536 (13.6%) |
| 75 Years and over | 509 (8.4%) | 1,218 (13.6%) |
| Total | 18,731 (15.9%) | 24,767 (20.4%) |
Income Above Poverty by Sex and Age in Jefferson County
According to the poverty statistics in Jefferson County, males aged 75 years and over and females aged 65 to 74 years are the age groups that are most secure financially, with 91.6% of males and 86.5% of females in these age groups living above the poverty line.
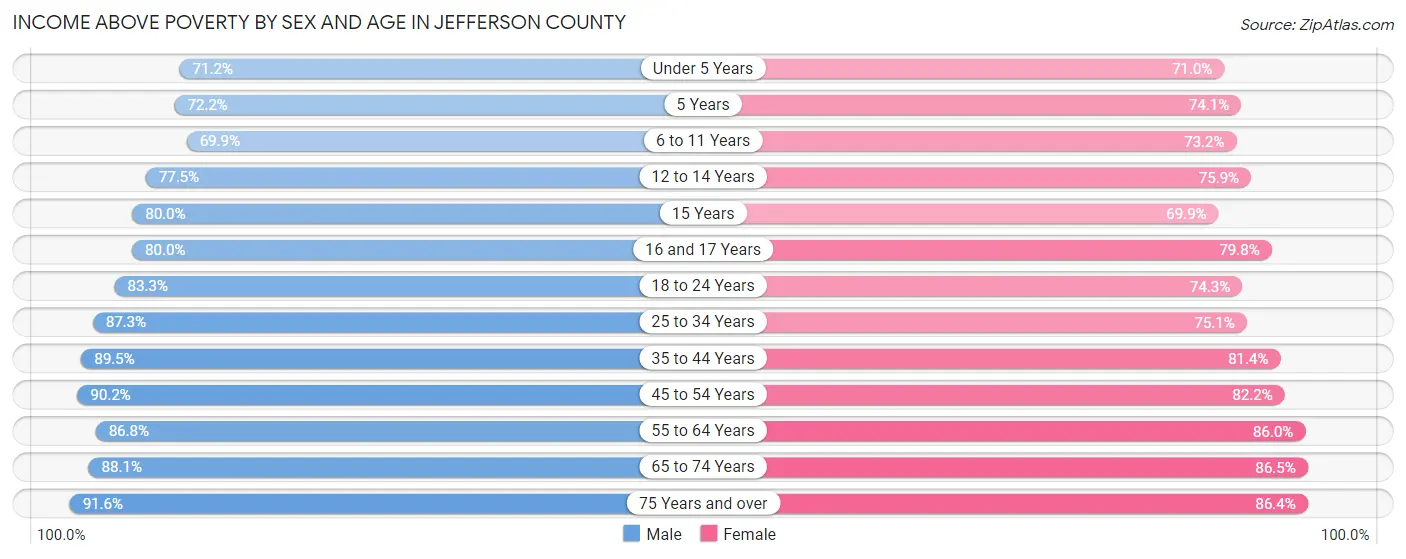
| Age Bracket | Male | Female |
| Under 5 Years | 6,059 (71.2%) | 5,613 (71.0%) |
| 5 Years | 1,381 (72.2%) | 1,270 (74.1%) |
| 6 to 11 Years | 7,260 (69.9%) | 7,445 (73.2%) |
| 12 to 14 Years | 4,070 (77.5%) | 3,782 (75.9%) |
| 15 Years | 1,656 (80.0%) | 1,268 (69.9%) |
| 16 and 17 Years | 2,224 (80.0%) | 2,441 (79.7%) |
| 18 to 24 Years | 9,065 (83.3%) | 7,461 (74.3%) |
| 25 to 34 Years | 14,810 (87.3%) | 12,265 (75.1%) |
| 35 to 44 Years | 13,312 (89.5%) | 12,413 (81.4%) |
| 45 to 54 Years | 12,203 (90.2%) | 11,457 (82.2%) |
| 55 to 64 Years | 12,508 (86.8%) | 13,619 (86.0%) |
| 65 to 74 Years | 8,884 (88.1%) | 9,796 (86.5%) |
| 75 Years and over | 5,562 (91.6%) | 7,767 (86.4%) |
| Total | 98,994 (84.1%) | 96,597 (79.6%) |
Income Below Poverty Among Married-Couple Families in Jefferson County
The poverty statistics for married-couple families in Jefferson County show that 6.4% or 2,603 of the total 40,388 families live below the poverty line. Families with 3 or 4 children have the highest poverty rate of 12.7%, comprising of 507 families. On the other hand, families with no children have the lowest poverty rate of 4.4%, which includes 1,037 families.
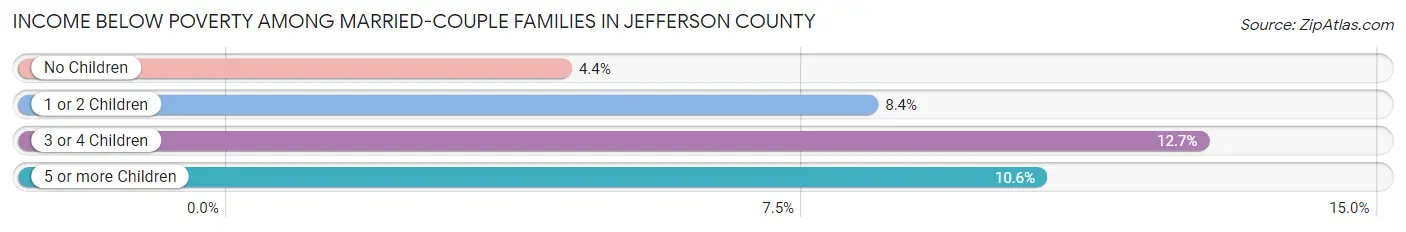
| Children | Above Poverty | Below Poverty |
| No Children | 22,767 (95.6%) | 1,037 (4.4%) |
| 1 or 2 Children | 11,255 (91.6%) | 1,027 (8.4%) |
| 3 or 4 Children | 3,492 (87.3%) | 507 (12.7%) |
| 5 or more Children | 271 (89.4%) | 32 (10.6%) |
| Total | 37,785 (93.6%) | 2,603 (6.4%) |
Income Below Poverty Among Single-Parent Households in Jefferson County
According to the poverty data in Jefferson County, 18.8% or 843 single-father households and 35.4% or 5,491 single-mother households are living below the poverty line. Among single-father households, those with 3 or 4 children have the highest poverty rate, with 261 households (64.0%) experiencing poverty. Likewise, among single-mother households, those with 5 or more children have the highest poverty rate, with 173 households (86.5%) falling below the poverty line.
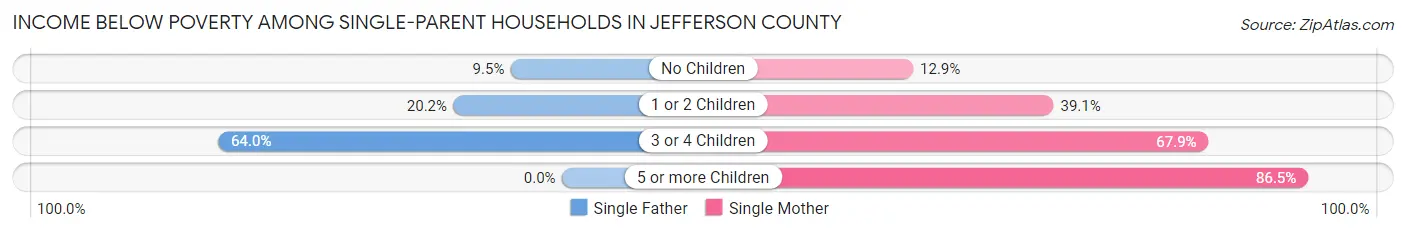
| Children | Single Father | Single Mother |
| No Children | 216 (9.5%) | 615 (12.9%) |
| 1 or 2 Children | 366 (20.2%) | 3,362 (39.1%) |
| 3 or 4 Children | 261 (64.0%) | 1,341 (67.9%) |
| 5 or more Children | 0 (0.0%) | 173 (86.5%) |
| Total | 843 (18.8%) | 5,491 (35.4%) |
Income Below Poverty Among Married-Couple vs Single-Parent Households in Jefferson County
The poverty data for Jefferson County shows that 2,603 of the married-couple family households (6.4%) and 6,334 of the single-parent households (31.7%) are living below the poverty level. Within the married-couple family households, those with 3 or 4 children have the highest poverty rate, with 507 households (12.7%) falling below the poverty line. Among the single-parent households, those with 5 or more children have the highest poverty rate, with 173 household (86.5%) living below poverty.
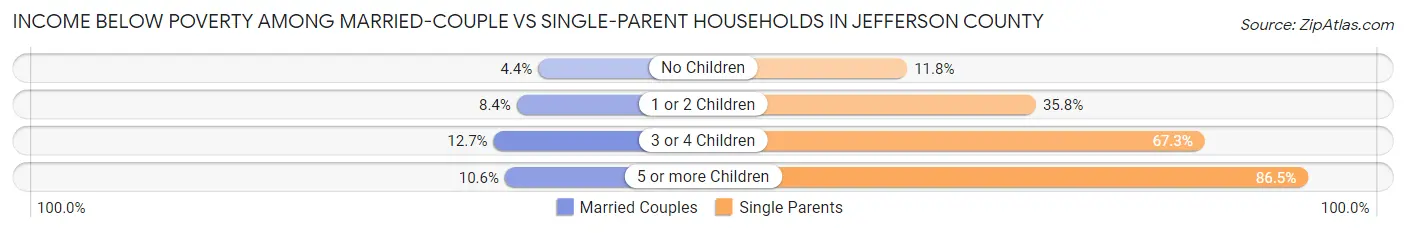
| Children | Married-Couple Families | Single-Parent Households |
| No Children | 1,037 (4.4%) | 831 (11.8%) |
| 1 or 2 Children | 1,027 (8.4%) | 3,728 (35.8%) |
| 3 or 4 Children | 507 (12.7%) | 1,602 (67.2%) |
| 5 or more Children | 32 (10.6%) | 173 (86.5%) |
| Total | 2,603 (6.4%) | 6,334 (31.7%) |
Race in Jefferson County
The most populous races in Jefferson County are White / Caucasian (121,024 | 47.5%), Black / African American (84,879 | 33.3%), and Hispanic or Latino (57,572 | 22.6%).
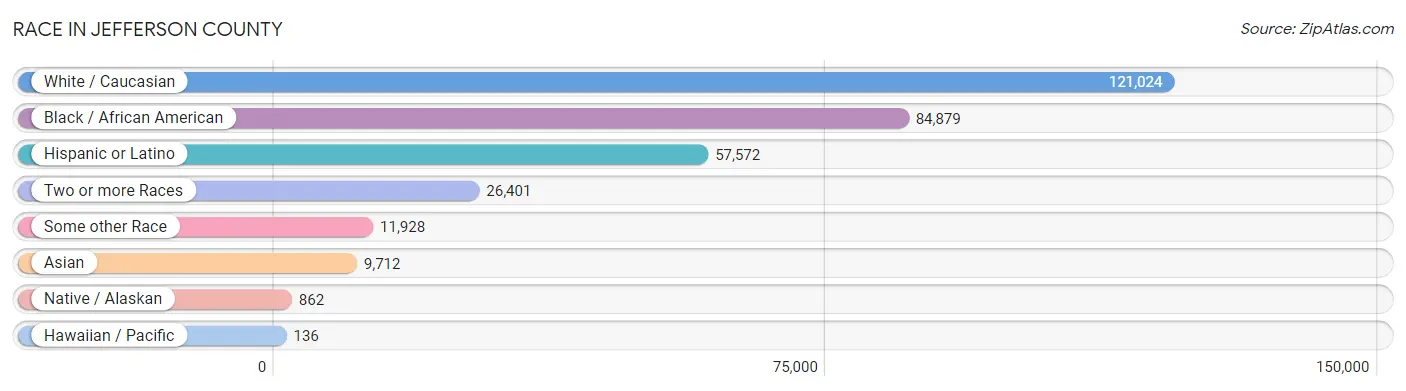
| Race | # Population | % Population |
| Asian | 9,712 | 3.8% |
| Black / African American | 84,879 | 33.3% |
| Hawaiian / Pacific | 136 | 0.1% |
| Hispanic or Latino | 57,572 | 22.6% |
| Native / Alaskan | 862 | 0.3% |
| White / Caucasian | 121,024 | 47.5% |
| Two or more Races | 26,401 | 10.4% |
| Some other Race | 11,928 | 4.7% |
| Total | 254,942 | 100.0% |
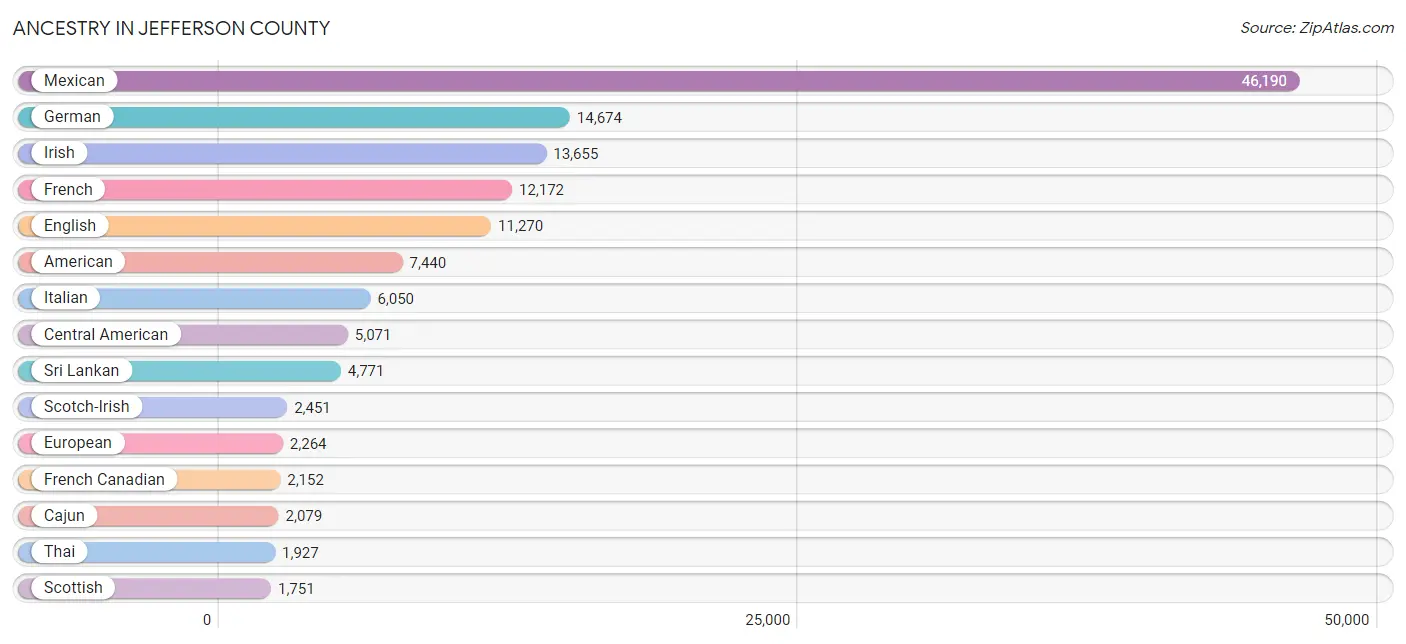
Ancestry in Jefferson County
The most populous ancestries reported in Jefferson County are Mexican (46,190 | 18.1%), German (14,674 | 5.8%), Irish (13,655 | 5.4%), French (12,172 | 4.8%), and English (11,270 | 4.4%), together accounting for 38.4% of all Jefferson County residents.
| Ancestry | # Population | % Population |
| African | 993 | 0.4% |
| Albanian | 11 | 0.0% |
| Alsatian | 7 | 0.0% |
| American | 7,440 | 2.9% |
| Apache | 22 | 0.0% |
| Arab | 566 | 0.2% |
| Argentinean | 19 | 0.0% |
| Armenian | 16 | 0.0% |
| Assyrian / Chaldean / Syriac | 64 | 0.0% |
| Austrian | 45 | 0.0% |
| Bahamian | 138 | 0.1% |
| Barbadian | 49 | 0.0% |
| Belgian | 80 | 0.0% |
| Bhutanese | 508 | 0.2% |
| Blackfeet | 2 | 0.0% |
| Bolivian | 15 | 0.0% |
| Brazilian | 157 | 0.1% |
| British | 651 | 0.3% |
| British West Indian | 11 | 0.0% |
| Burmese | 189 | 0.1% |
| Cajun | 2,079 | 0.8% |
| Canadian | 138 | 0.1% |
| Celtic | 15 | 0.0% |
| Central American | 5,071 | 2.0% |
| Central American Indian | 371 | 0.2% |
| Cherokee | 319 | 0.1% |
| Chickasaw | 22 | 0.0% |
| Chilean | 48 | 0.0% |
| Choctaw | 90 | 0.0% |
| Colombian | 310 | 0.1% |
| Costa Rican | 57 | 0.0% |
| Creek | 96 | 0.0% |
| Croatian | 63 | 0.0% |
| Cuban | 724 | 0.3% |
| Czech | 684 | 0.3% |
| Czechoslovakian | 72 | 0.0% |
| Danish | 66 | 0.0% |
| Dominican | 505 | 0.2% |
| Dutch | 1,660 | 0.6% |
| Dutch West Indian | 137 | 0.1% |
| Eastern European | 155 | 0.1% |
| Ecuadorian | 74 | 0.0% |
| English | 11,270 | 4.4% |
| Estonian | 13 | 0.0% |
| European | 2,264 | 0.9% |
| Filipino | 8 | 0.0% |
| Finnish | 61 | 0.0% |
| French | 12,172 | 4.8% |
| French American Indian | 7 | 0.0% |
| French Canadian | 2,152 | 0.8% |
| German | 14,674 | 5.8% |
| Greek | 353 | 0.1% |
| Guamanian / Chamorro | 9 | 0.0% |
| Guatemalan | 1,426 | 0.6% |
| Guyanese | 4 | 0.0% |
| Haitian | 62 | 0.0% |
| Honduran | 1,443 | 0.6% |
| Hungarian | 136 | 0.1% |
| Indian (Asian) | 565 | 0.2% |
| Indonesian | 13 | 0.0% |
| Iranian | 47 | 0.0% |
| Iraqi | 23 | 0.0% |
| Irish | 13,655 | 5.4% |
| Italian | 6,050 | 2.4% |
| Jamaican | 96 | 0.0% |
| Japanese | 258 | 0.1% |
| Kenyan | 6 | 0.0% |
| Korean | 1,201 | 0.5% |
| Lebanese | 285 | 0.1% |
| Lithuanian | 114 | 0.0% |
| Mexican | 46,190 | 18.1% |
| Mexican American Indian | 124 | 0.1% |
| Mongolian | 107 | 0.0% |
| Native Hawaiian | 76 | 0.0% |
| Navajo | 162 | 0.1% |
| Nicaraguan | 1,187 | 0.5% |
| Nigerian | 283 | 0.1% |
| Northern European | 190 | 0.1% |
| Norwegian | 834 | 0.3% |
| Osage | 1 | 0.0% |
| Paiute | 2 | 0.0% |
| Pakistani | 86 | 0.0% |
| Palestinian | 58 | 0.0% |
| Panamanian | 9 | 0.0% |
| Pennsylvania German | 6 | 0.0% |
| Peruvian | 97 | 0.0% |
| Polish | 1,034 | 0.4% |
| Portuguese | 149 | 0.1% |
| Potawatomi | 1 | 0.0% |
| Puerto Rican | 1,261 | 0.5% |
| Romanian | 35 | 0.0% |
| Russian | 492 | 0.2% |
| Salvadoran | 831 | 0.3% |
| Samoan | 13 | 0.0% |
| Scandinavian | 224 | 0.1% |
| Scotch-Irish | 2,451 | 1.0% |
| Scottish | 1,751 | 0.7% |
| Seminole | 54 | 0.0% |
| Sierra Leonean | 12 | 0.0% |
| Sioux | 73 | 0.0% |
| Slovak | 45 | 0.0% |
| Slovene | 63 | 0.0% |
| South American | 719 | 0.3% |
| South American Indian | 32 | 0.0% |
| Spaniard | 285 | 0.1% |
| Spanish | 124 | 0.1% |
| Sri Lankan | 4,771 | 1.9% |
| Subsaharan African | 1,359 | 0.5% |
| Sudanese | 10 | 0.0% |
| Swedish | 509 | 0.2% |
| Swiss | 10 | 0.0% |
| Syrian | 135 | 0.1% |
| Thai | 1,927 | 0.8% |
| Trinidadian and Tobagonian | 8 | 0.0% |
| Ukrainian | 80 | 0.0% |
| Venezuelan | 156 | 0.1% |
| Vietnamese | 116 | 0.1% |
| Welsh | 408 | 0.2% |
| Zimbabwean | 13 | 0.0% | View All 119 Rows |
Immigrants in Jefferson County
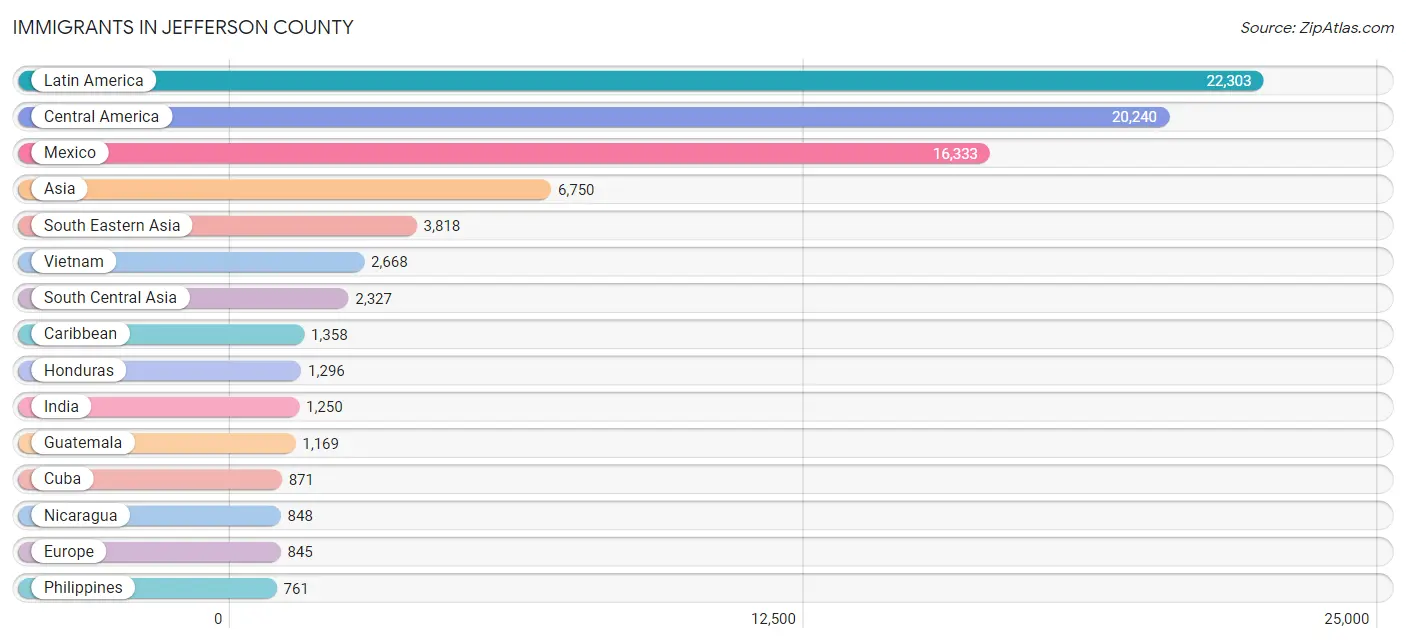
The most numerous immigrant groups reported in Jefferson County came from Latin America (22,303 | 8.7%), Central America (20,240 | 7.9%), Mexico (16,333 | 6.4%), Asia (6,750 | 2.6%), and South Eastern Asia (3,818 | 1.5%), together accounting for 27.3% of all Jefferson County residents.
| Immigration Origin | # Population | % Population |
| Africa | 591 | 0.2% |
| Albania | 11 | 0.0% |
| Argentina | 19 | 0.0% |
| Asia | 6,750 | 2.6% |
| Bahamas | 62 | 0.0% |
| Bangladesh | 116 | 0.1% |
| Barbados | 49 | 0.0% |
| Belgium | 22 | 0.0% |
| Belize | 10 | 0.0% |
| Bolivia | 15 | 0.0% |
| Brazil | 52 | 0.0% |
| Cambodia | 178 | 0.1% |
| Cameroon | 19 | 0.0% |
| Canada | 241 | 0.1% |
| Caribbean | 1,358 | 0.5% |
| Central America | 20,240 | 7.9% |
| Chile | 1 | 0.0% |
| China | 237 | 0.1% |
| Colombia | 202 | 0.1% |
| Costa Rica | 57 | 0.0% |
| Cuba | 871 | 0.3% |
| Denmark | 12 | 0.0% |
| Dominican Republic | 161 | 0.1% |
| Eastern Africa | 210 | 0.1% |
| Eastern Asia | 410 | 0.2% |
| Eastern Europe | 179 | 0.1% |
| Ecuador | 71 | 0.0% |
| El Salvador | 501 | 0.2% |
| England | 81 | 0.0% |
| Europe | 845 | 0.3% |
| Germany | 157 | 0.1% |
| Greece | 26 | 0.0% |
| Grenada | 11 | 0.0% |
| Guatemala | 1,169 | 0.5% |
| Guyana | 57 | 0.0% |
| Honduras | 1,296 | 0.5% |
| Hong Kong | 7 | 0.0% |
| India | 1,250 | 0.5% |
| Iran | 40 | 0.0% |
| Iraq | 23 | 0.0% |
| Ireland | 29 | 0.0% |
| Italy | 107 | 0.0% |
| Jamaica | 88 | 0.0% |
| Japan | 45 | 0.0% |
| Kenya | 48 | 0.0% |
| Korea | 128 | 0.1% |
| Latin America | 22,303 | 8.7% |
| Lebanon | 40 | 0.0% |
| Malaysia | 160 | 0.1% |
| Mexico | 16,333 | 6.4% |
| Micronesia | 92 | 0.0% |
| Middle Africa | 19 | 0.0% |
| Nepal | 113 | 0.0% |
| Netherlands | 68 | 0.0% |
| Nicaragua | 848 | 0.3% |
| Nigeria | 96 | 0.0% |
| Northern Africa | 10 | 0.0% |
| Northern Europe | 245 | 0.1% |
| Oceania | 92 | 0.0% |
| Pakistan | 730 | 0.3% |
| Panama | 26 | 0.0% |
| Peru | 127 | 0.1% |
| Philippines | 761 | 0.3% |
| Portugal | 1 | 0.0% |
| Romania | 10 | 0.0% |
| Russia | 158 | 0.1% |
| Scotland | 4 | 0.0% |
| Sierra Leone | 12 | 0.0% |
| Somalia | 11 | 0.0% |
| South Africa | 141 | 0.1% |
| South America | 705 | 0.3% |
| South Central Asia | 2,327 | 0.9% |
| South Eastern Asia | 3,818 | 1.5% |
| Southern Europe | 155 | 0.1% |
| Spain | 21 | 0.0% |
| Sri Lanka | 78 | 0.0% |
| Sudan | 10 | 0.0% |
| Syria | 67 | 0.0% |
| Taiwan | 46 | 0.0% |
| Thailand | 45 | 0.0% |
| Trinidad and Tobago | 79 | 0.0% |
| Venezuela | 161 | 0.1% |
| Vietnam | 2,668 | 1.1% |
| Western Africa | 108 | 0.0% |
| Western Asia | 146 | 0.1% |
| Western Europe | 247 | 0.1% |
| Zimbabwe | 46 | 0.0% | View All 87 Rows |
Sex and Age in Jefferson County
Sex and Age in Jefferson County
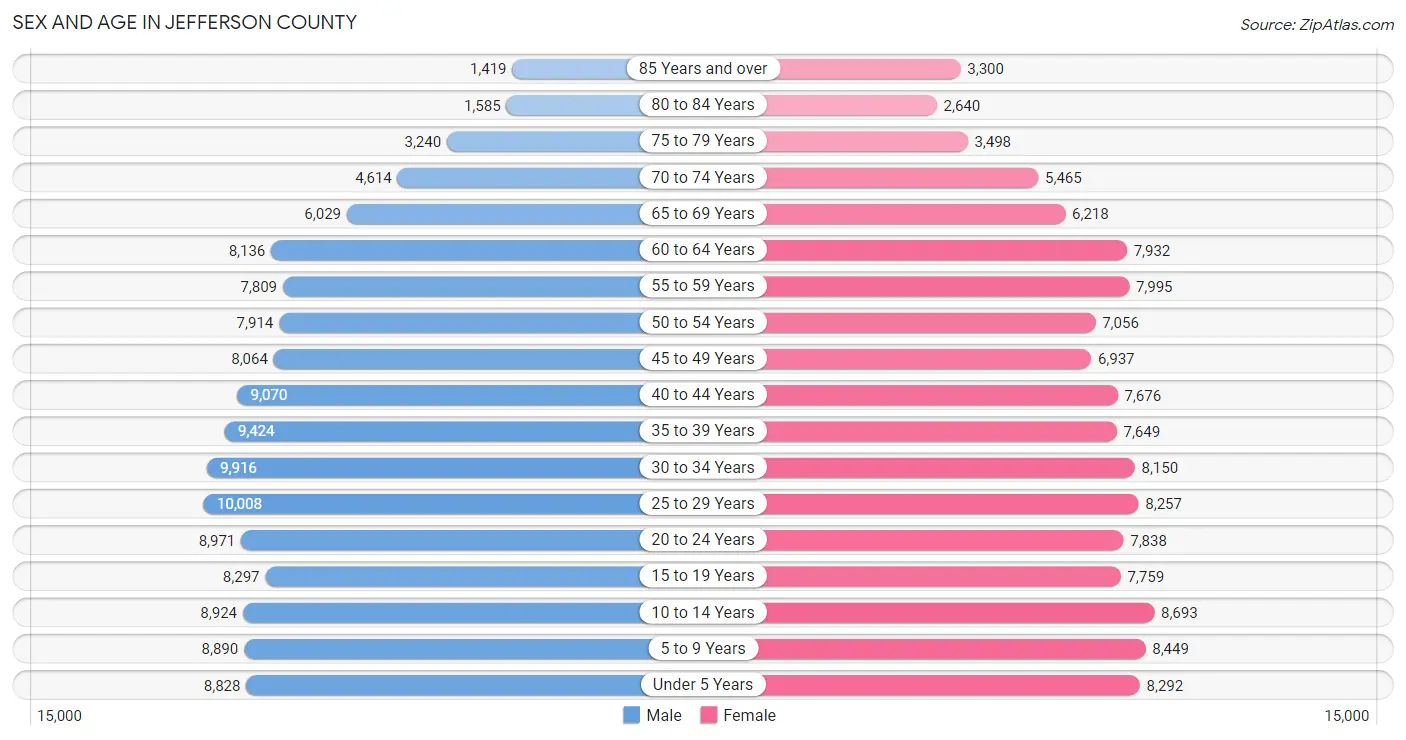
The most populous age groups in Jefferson County are 25 to 29 Years (10,008 | 7.6%) for men and 10 to 14 Years (8,693 | 7.0%) for women.
| Age Bracket | Male | Female |
| Under 5 Years | 8,828 (6.7%) | 8,292 (6.7%) |
| 5 to 9 Years | 8,890 (6.8%) | 8,449 (6.8%) |
| 10 to 14 Years | 8,924 (6.8%) | 8,693 (7.0%) |
| 15 to 19 Years | 8,297 (6.3%) | 7,759 (6.3%) |
| 20 to 24 Years | 8,971 (6.8%) | 7,838 (6.3%) |
| 25 to 29 Years | 10,008 (7.6%) | 8,257 (6.7%) |
| 30 to 34 Years | 9,916 (7.6%) | 8,150 (6.6%) |
| 35 to 39 Years | 9,424 (7.2%) | 7,649 (6.2%) |
| 40 to 44 Years | 9,070 (6.9%) | 7,676 (6.2%) |
| 45 to 49 Years | 8,064 (6.1%) | 6,937 (5.6%) |
| 50 to 54 Years | 7,914 (6.0%) | 7,056 (5.7%) |
| 55 to 59 Years | 7,809 (5.9%) | 7,995 (6.5%) |
| 60 to 64 Years | 8,136 (6.2%) | 7,932 (6.4%) |
| 65 to 69 Years | 6,029 (4.6%) | 6,218 (5.0%) |
| 70 to 74 Years | 4,614 (3.5%) | 5,465 (4.4%) |
| 75 to 79 Years | 3,240 (2.5%) | 3,498 (2.8%) |
| 80 to 84 Years | 1,585 (1.2%) | 2,640 (2.1%) |
| 85 Years and over | 1,419 (1.1%) | 3,300 (2.7%) |
| Total | 131,138 (100.0%) | 123,804 (100.0%) |
Families and Households in Jefferson County
Median Family Size in Jefferson County
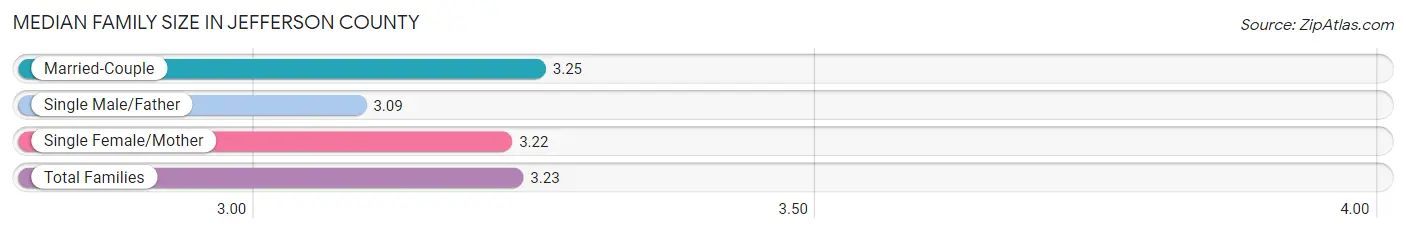
The median family size in Jefferson County is 3.23 persons per family, with married-couple families (40,388 | 66.9%) accounting for the largest median family size of 3.25 persons per family. On the other hand, single male/father families (4,482 | 7.4%) represent the smallest median family size with 3.09 persons per family.
| Family Type | # Families | Family Size |
| Married-Couple | 40,388 (66.9%) | 3.25 |
| Single Male/Father | 4,482 (7.4%) | 3.09 |
| Single Female/Mother | 15,526 (25.7%) | 3.22 |
| Total Families | 60,396 (100.0%) | 3.23 |
Median Household Size in Jefferson County
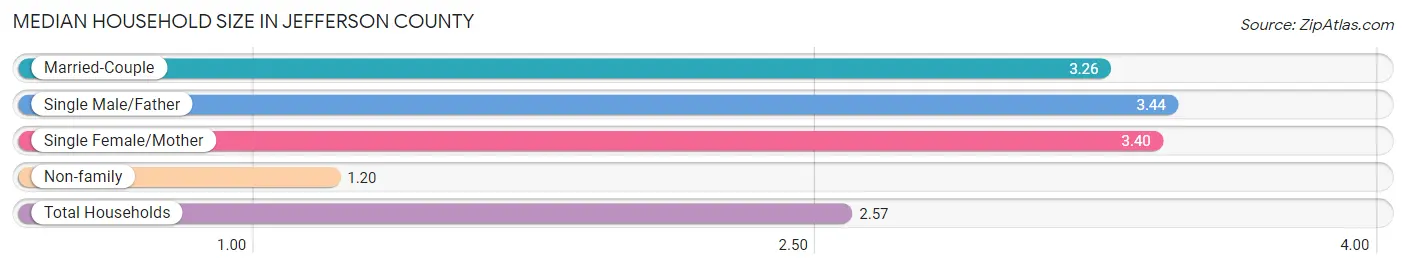
The median household size in Jefferson County is 2.57 persons per household, with single male/father households (4,482 | 4.8%) accounting for the largest median household size of 3.44 persons per household. non-family households (32,797 | 35.2%) represent the smallest median household size with 1.20 persons per household.
| Household Type | # Households | Household Size |
| Married-Couple | 40,388 (43.3%) | 3.26 |
| Single Male/Father | 4,482 (4.8%) | 3.44 |
| Single Female/Mother | 15,526 (16.7%) | 3.40 |
| Non-family | 32,797 (35.2%) | 1.20 |
| Total Households | 93,193 (100.0%) | 2.57 |
Household Size by Marriage Status in Jefferson County
Out of a total of 93,193 households in Jefferson County, 60,396 (64.8%) are family households, while 32,797 (35.2%) are nonfamily households. The most numerous type of family households are 2-person households, comprising 26,619, and the most common type of nonfamily households are 1-person households, comprising 28,088.
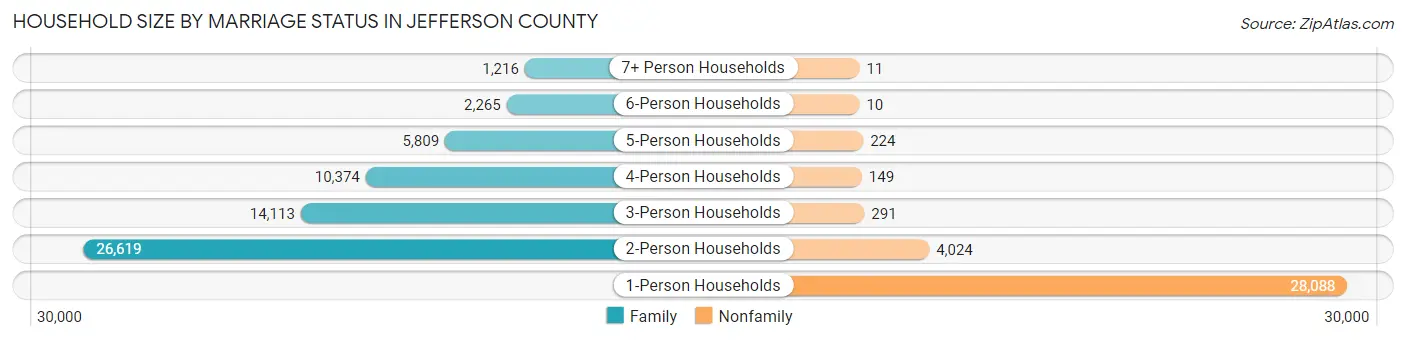
| Household Size | Family Households | Nonfamily Households |
| 1-Person Households | - | 28,088 (30.1%) |
| 2-Person Households | 26,619 (28.6%) | 4,024 (4.3%) |
| 3-Person Households | 14,113 (15.1%) | 291 (0.3%) |
| 4-Person Households | 10,374 (11.1%) | 149 (0.2%) |
| 5-Person Households | 5,809 (6.2%) | 224 (0.2%) |
| 6-Person Households | 2,265 (2.4%) | 10 (0.0%) |
| 7+ Person Households | 1,216 (1.3%) | 11 (0.0%) |
| Total | 60,396 (64.8%) | 32,797 (35.2%) |
Female Fertility in Jefferson County
Fertility by Age in Jefferson County
Average fertility rate in Jefferson County is 52.0 births per 1,000 women. Women in the age bracket of 20 to 34 years have the highest fertility rate with 89.0 births per 1,000 women. Women in the age bracket of 20 to 34 years acount for 74.9% of all women with births.
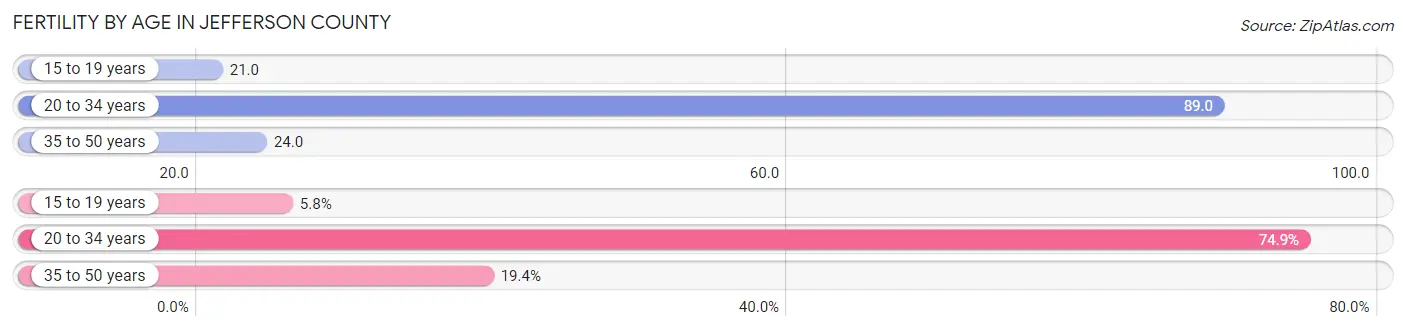
| Age Bracket | Women with Births | Births / 1,000 Women |
| 15 to 19 years | 166 (5.8%) | 21.0 |
| 20 to 34 years | 2,158 (74.9%) | 89.0 |
| 35 to 50 years | 559 (19.4%) | 24.0 |
| Total | 2,883 (100.0%) | 52.0 |
Fertility by Age by Marriage Status in Jefferson County
60.2% of women with births (2,883) in Jefferson County are married. The highest percentage of unmarried women with births falls into 15 to 19 years age bracket with 100.0% of them unmarried at the time of birth, while the lowest percentage of unmarried women with births belong to 35 to 50 years age bracket with 34.7% of them unmarried.
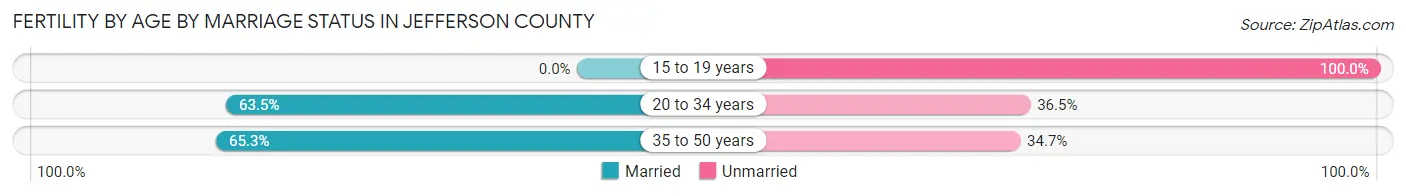
| Age Bracket | Married | Unmarried |
| 15 to 19 years | 0 (0.0%) | 166 (100.0%) |
| 20 to 34 years | 1,370 (63.5%) | 788 (36.5%) |
| 35 to 50 years | 365 (65.3%) | 194 (34.7%) |
| Total | 1,736 (60.2%) | 1,147 (39.8%) |
Fertility by Education in Jefferson County
Average fertility rate in Jefferson County is 52.0 births per 1,000 women. Women with the education attainment of bachelor's degree have the highest fertility rate of 77.0 births per 1,000 women, while women with the education attainment of college or associate's degree have the lowest fertility at 34.0 births per 1,000 women. Women with the education attainment of high school diploma represent 32.2% of all women with births.
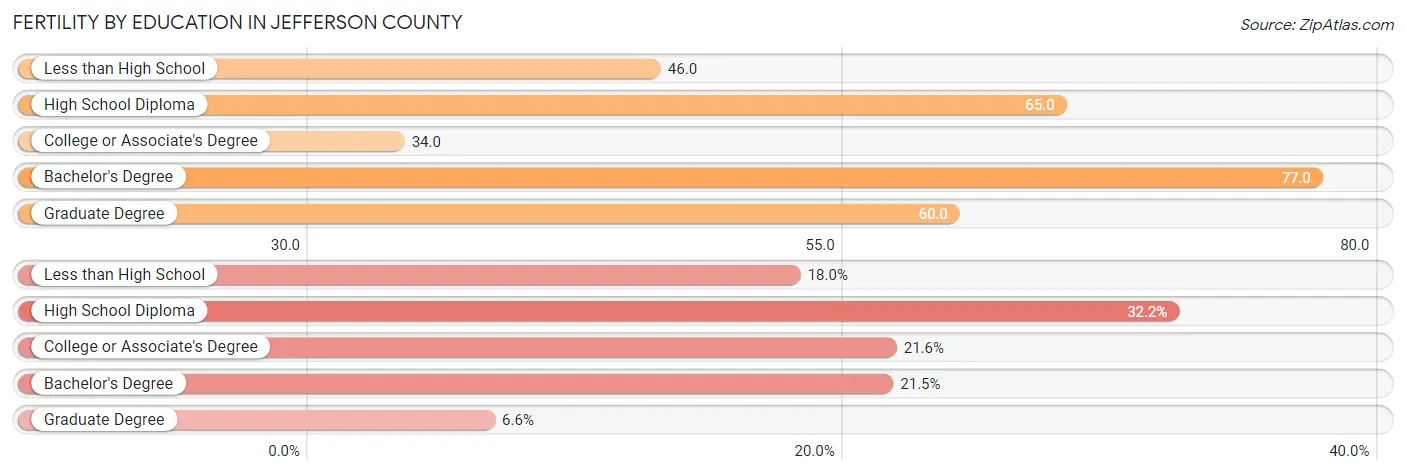
| Educational Attainment | Women with Births | Births / 1,000 Women |
| Less than High School | 520 (18.0%) | 46.0 |
| High School Diploma | 929 (32.2%) | 65.0 |
| College or Associate's Degree | 624 (21.6%) | 34.0 |
| Bachelor's Degree | 620 (21.5%) | 77.0 |
| Graduate Degree | 190 (6.6%) | 60.0 |
| Total | 2,883 (100.0%) | 52.0 |
Fertility by Education by Marriage Status in Jefferson County
39.8% of women with births in Jefferson County are unmarried. Women with the educational attainment of graduate degree are most likely to be married with 100.0% of them married at childbirth, while women with the educational attainment of high school diploma are least likely to be married with 59.6% of them unmarried at childbirth.
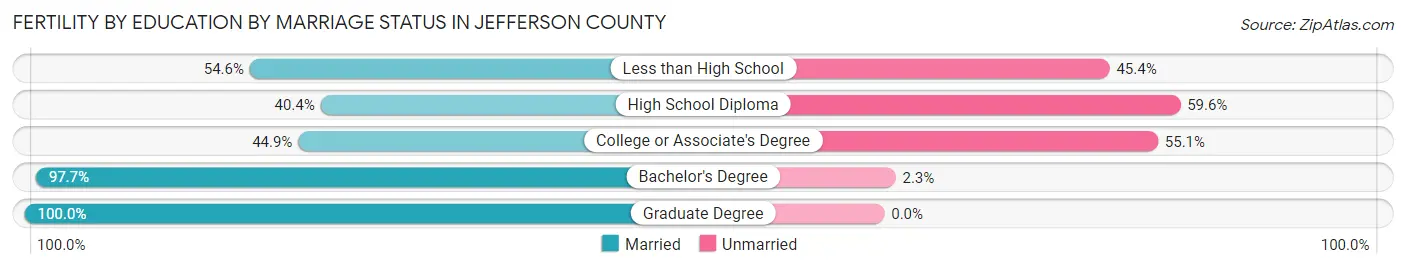
| Educational Attainment | Married | Unmarried |
| Less than High School | 284 (54.6%) | 236 (45.4%) |
| High School Diploma | 375 (40.4%) | 554 (59.6%) |
| College or Associate's Degree | 280 (44.9%) | 344 (55.1%) |
| Bachelor's Degree | 606 (97.7%) | 14 (2.3%) |
| Graduate Degree | 190 (100.0%) | 0 (0.0%) |
| Total | 1,736 (60.2%) | 1,147 (39.8%) |
Employment Characteristics in Jefferson County
Employment by Class of Employer in Jefferson County
Among the 103,041 employed individuals in Jefferson County, private company employees (75,788 | 73.6%), local government employees (7,034 | 6.8%), and state government employees (6,177 | 6.0%) make up the most common classes of employment.
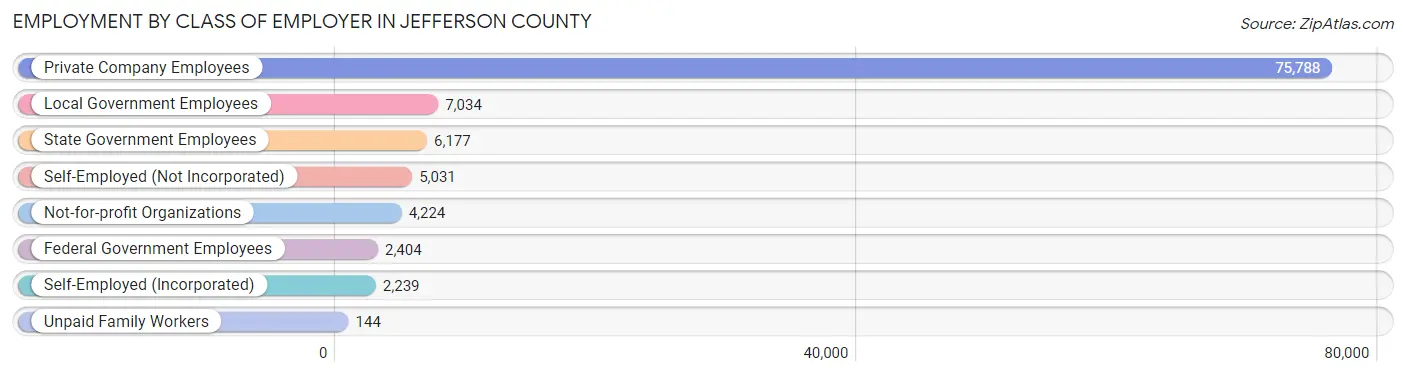
| Employer Class | # Employees | % Employees |
| Private Company Employees | 75,788 | 73.6% |
| Self-Employed (Incorporated) | 2,239 | 2.2% |
| Self-Employed (Not Incorporated) | 5,031 | 4.9% |
| Not-for-profit Organizations | 4,224 | 4.1% |
| Local Government Employees | 7,034 | 6.8% |
| State Government Employees | 6,177 | 6.0% |
| Federal Government Employees | 2,404 | 2.3% |
| Unpaid Family Workers | 144 | 0.1% |
| Total | 103,041 | 100.0% |
Employment Status by Age in Jefferson County
According to the labor force statistics for Jefferson County, out of the total population over 16 years of age (198,971), 55.7% or 110,827 individuals are in the labor force, with 5.4% or 5,985 of them unemployed. The age group with the highest labor force participation rate is 25 to 29 years, with 71.0% or 12,968 individuals in the labor force. Within the labor force, the 20 to 24 years age range has the highest percentage of unemployed individuals, with 10.5% or 1,216 of them being unemployed.
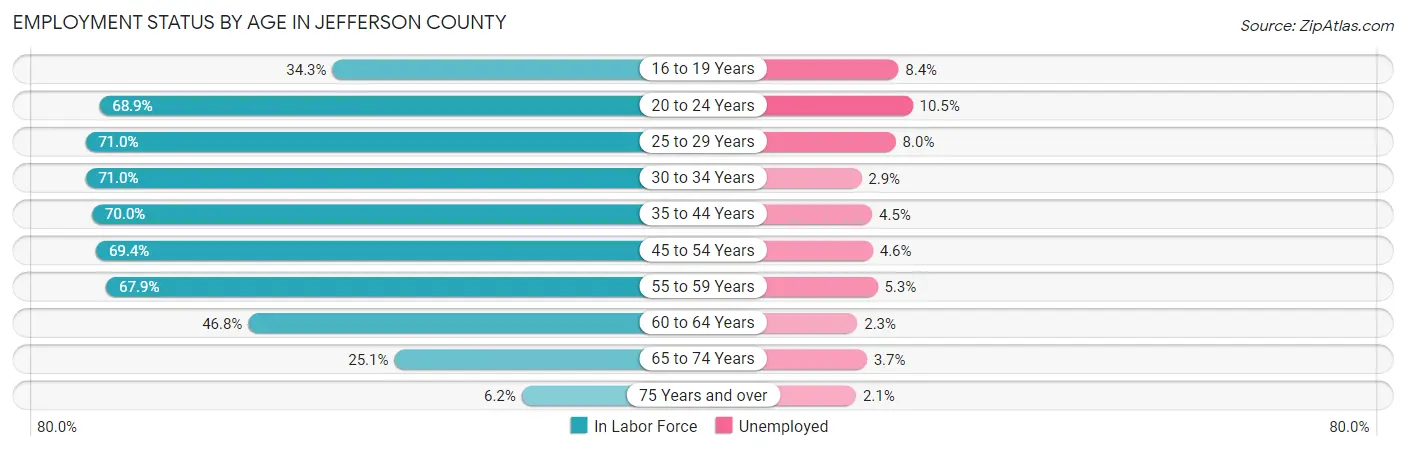
| Age Bracket | In Labor Force | Unemployed |
| 16 to 19 Years | 4,171 (34.3%) | 350 (8.4%) |
| 20 to 24 Years | 11,581 (68.9%) | 1,216 (10.5%) |
| 25 to 29 Years | 12,968 (71.0%) | 1,037 (8.0%) |
| 30 to 34 Years | 12,827 (71.0%) | 372 (2.9%) |
| 35 to 44 Years | 23,673 (70.0%) | 1,065 (4.5%) |
| 45 to 54 Years | 20,800 (69.4%) | 957 (4.6%) |
| 55 to 59 Years | 10,731 (67.9%) | 569 (5.3%) |
| 60 to 64 Years | 7,520 (46.8%) | 173 (2.3%) |
| 65 to 74 Years | 5,604 (25.1%) | 207 (3.7%) |
| 75 Years and over | 972 (6.2%) | 20 (2.1%) |
| Total | 110,827 (55.7%) | 5,985 (5.4%) |
Employment Status by Educational Attainment in Jefferson County
According to labor force statistics for Jefferson County, 67.1% of individuals (88,567) out of the total population between 25 and 64 years of age (131,993) are in the labor force, with 4.7% or 4,163 of them being unemployed. The group with the highest labor force participation rate are those with the educational attainment of bachelor's degree or higher, with 83.6% or 21,633 individuals in the labor force. Within the labor force, individuals with high school diploma education have the highest percentage of unemployment, with 6.6% or 1,653 of them being unemployed.
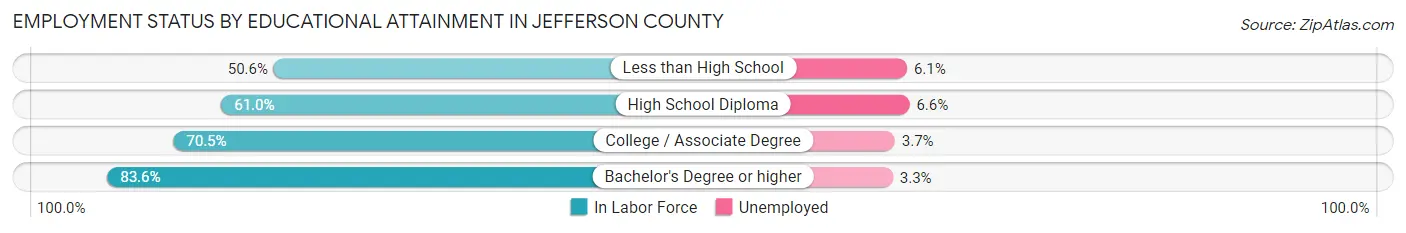
| Educational Attainment | In Labor Force | Unemployed |
| Less than High School | 10,268 (50.6%) | 1,238 (6.1%) |
| High School Diploma | 25,044 (61.0%) | 2,710 (6.6%) |
| College / Associate Degree | 31,562 (70.5%) | 1,656 (3.7%) |
| Bachelor's Degree or higher | 21,633 (83.6%) | 854 (3.3%) |
| Total | 88,567 (67.1%) | 6,204 (4.7%) |
Employment Occupations by Sex in Jefferson County
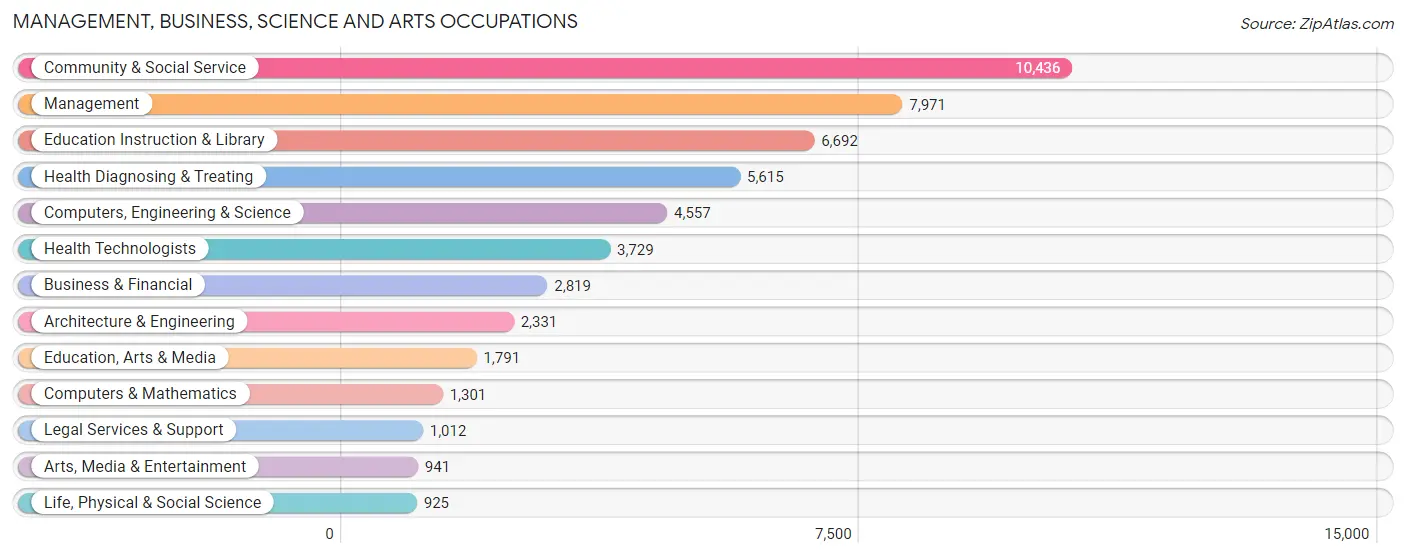
Management, Business, Science and Arts Occupations
The most common Management, Business, Science and Arts occupations in Jefferson County are Community & Social Service (10,436 | 10.0%), Management (7,971 | 7.6%), Education Instruction & Library (6,692 | 6.4%), Health Diagnosing & Treating (5,615 | 5.4%), and Computers, Engineering & Science (4,557 | 4.4%).
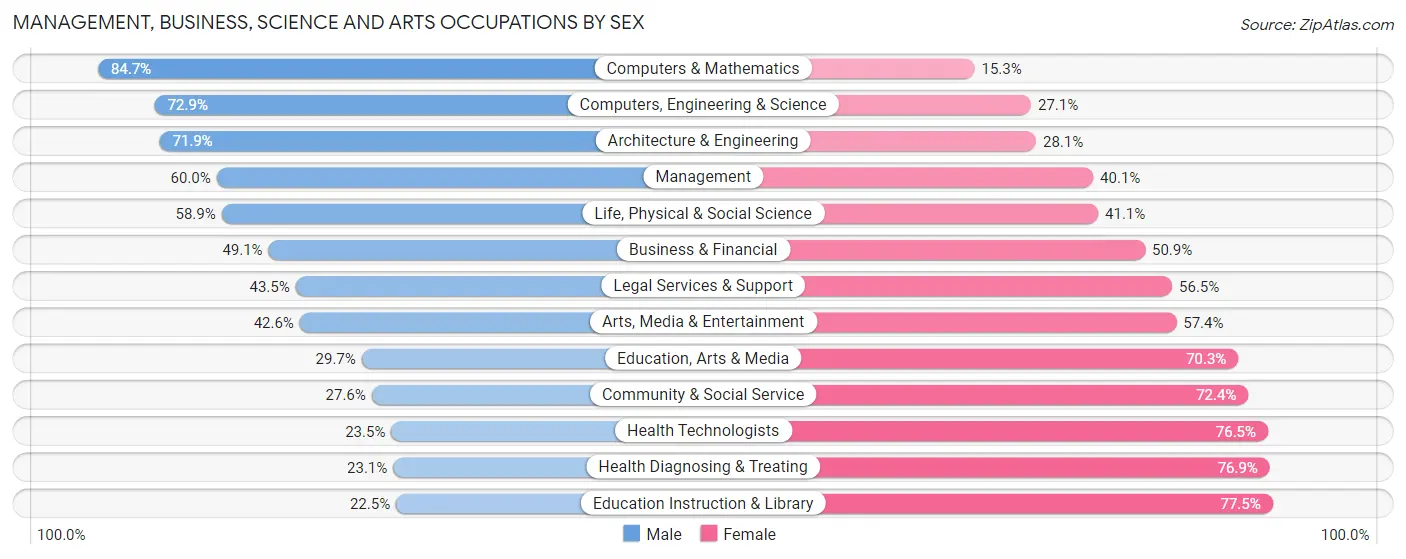
Management, Business, Science and Arts Occupations by Sex
Within the Management, Business, Science and Arts occupations in Jefferson County, the most male-oriented occupations are Computers & Mathematics (84.7%), Computers, Engineering & Science (72.9%), and Architecture & Engineering (71.9%), while the most female-oriented occupations are Education Instruction & Library (77.5%), Health Diagnosing & Treating (76.9%), and Health Technologists (76.5%).
| Occupation | Male | Female |
| Management | 4,779 (60.0%) | 3,192 (40.1%) |
| Business & Financial | 1,385 (49.1%) | 1,434 (50.9%) |
| Computers, Engineering & Science | 3,322 (72.9%) | 1,235 (27.1%) |
| Computers & Mathematics | 1,102 (84.7%) | 199 (15.3%) |
| Architecture & Engineering | 1,675 (71.9%) | 656 (28.1%) |
| Life, Physical & Social Science | 545 (58.9%) | 380 (41.1%) |
| Community & Social Service | 2,881 (27.6%) | 7,555 (72.4%) |
| Education, Arts & Media | 532 (29.7%) | 1,259 (70.3%) |
| Legal Services & Support | 440 (43.5%) | 572 (56.5%) |
| Education Instruction & Library | 1,508 (22.5%) | 5,184 (77.5%) |
| Arts, Media & Entertainment | 401 (42.6%) | 540 (57.4%) |
| Health Diagnosing & Treating | 1,299 (23.1%) | 4,316 (76.9%) |
| Health Technologists | 877 (23.5%) | 2,852 (76.5%) |
| Total (Category) | 13,666 (43.5%) | 17,732 (56.5%) |
| Total (Overall) | 56,060 (53.7%) | 48,380 (46.3%) |
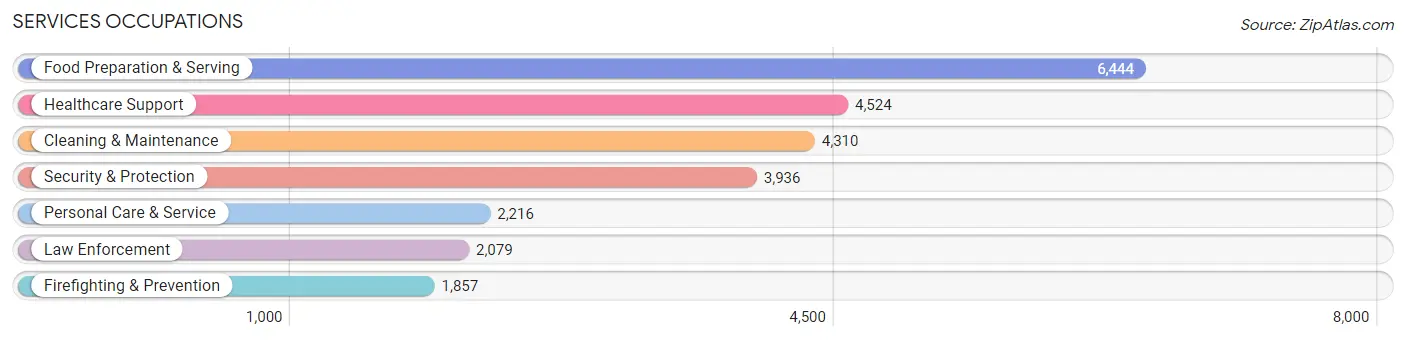
Services Occupations
The most common Services occupations in Jefferson County are Food Preparation & Serving (6,444 | 6.2%), Healthcare Support (4,524 | 4.3%), Cleaning & Maintenance (4,310 | 4.1%), Security & Protection (3,936 | 3.8%), and Personal Care & Service (2,216 | 2.1%).
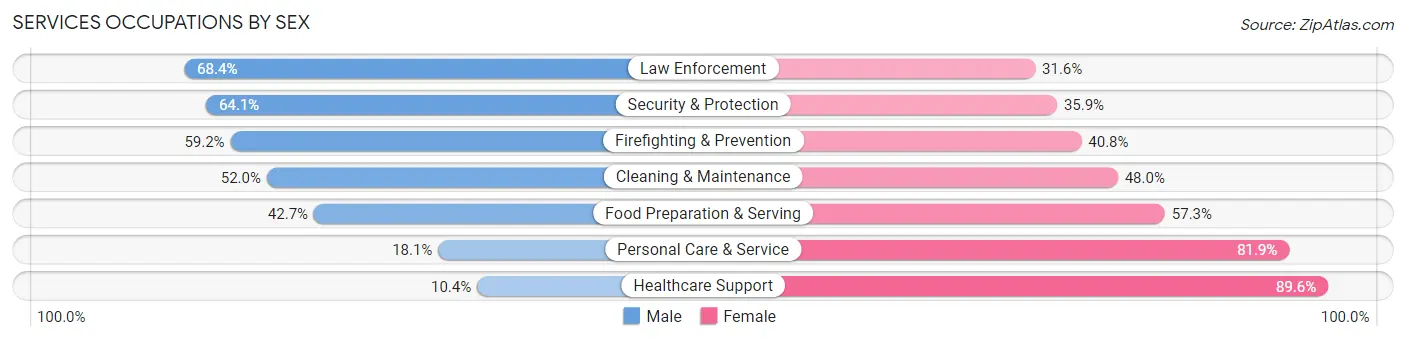
Services Occupations by Sex
Within the Services occupations in Jefferson County, the most male-oriented occupations are Law Enforcement (68.4%), Security & Protection (64.1%), and Firefighting & Prevention (59.2%), while the most female-oriented occupations are Healthcare Support (89.6%), Personal Care & Service (81.9%), and Food Preparation & Serving (57.3%).
| Occupation | Male | Female |
| Healthcare Support | 471 (10.4%) | 4,053 (89.6%) |
| Security & Protection | 2,522 (64.1%) | 1,414 (35.9%) |
| Firefighting & Prevention | 1,100 (59.2%) | 757 (40.8%) |
| Law Enforcement | 1,422 (68.4%) | 657 (31.6%) |
| Food Preparation & Serving | 2,752 (42.7%) | 3,692 (57.3%) |
| Cleaning & Maintenance | 2,243 (52.0%) | 2,067 (48.0%) |
| Personal Care & Service | 401 (18.1%) | 1,815 (81.9%) |
| Total (Category) | 8,389 (39.2%) | 13,041 (60.9%) |
| Total (Overall) | 56,060 (53.7%) | 48,380 (46.3%) |
Sales and Office Occupations
The most common Sales and Office occupations in Jefferson County are Sales & Related (12,107 | 11.6%), and Office & Administration (9,943 | 9.5%).

Sales and Office Occupations by Sex
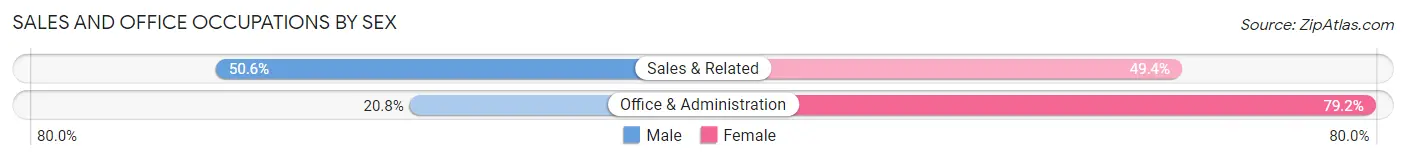
| Occupation | Male | Female |
| Sales & Related | 6,122 (50.6%) | 5,985 (49.4%) |
| Office & Administration | 2,066 (20.8%) | 7,877 (79.2%) |
| Total (Category) | 8,188 (37.1%) | 13,862 (62.9%) |
| Total (Overall) | 56,060 (53.7%) | 48,380 (46.3%) |
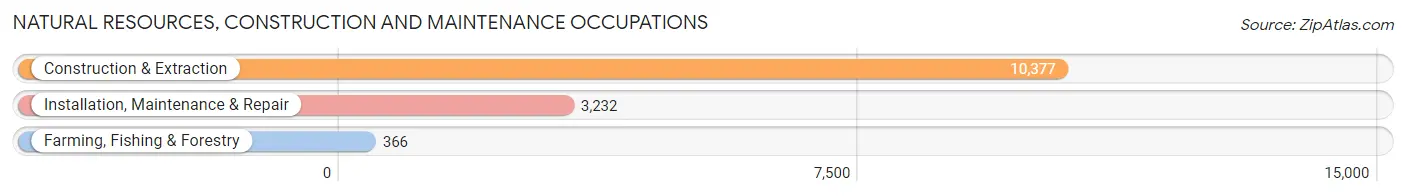
Natural Resources, Construction and Maintenance Occupations
The most common Natural Resources, Construction and Maintenance occupations in Jefferson County are Construction & Extraction (10,377 | 9.9%), Installation, Maintenance & Repair (3,232 | 3.1%), and Farming, Fishing & Forestry (366 | 0.4%).
Natural Resources, Construction and Maintenance Occupations by Sex
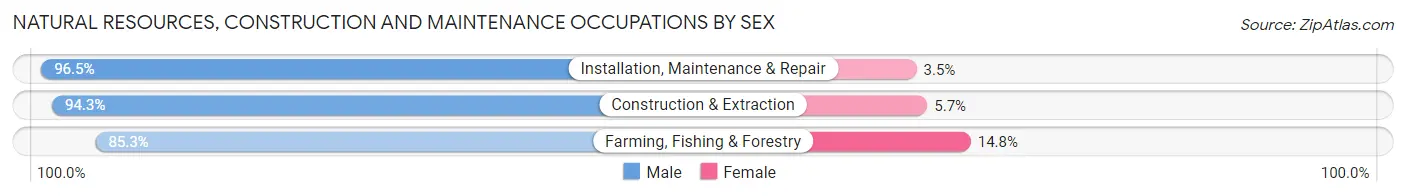
| Occupation | Male | Female |
| Farming, Fishing & Forestry | 312 (85.3%) | 54 (14.7%) |
| Construction & Extraction | 9,784 (94.3%) | 593 (5.7%) |
| Installation, Maintenance & Repair | 3,120 (96.5%) | 112 (3.5%) |
| Total (Category) | 13,216 (94.6%) | 759 (5.4%) |
| Total (Overall) | 56,060 (53.7%) | 48,380 (46.3%) |
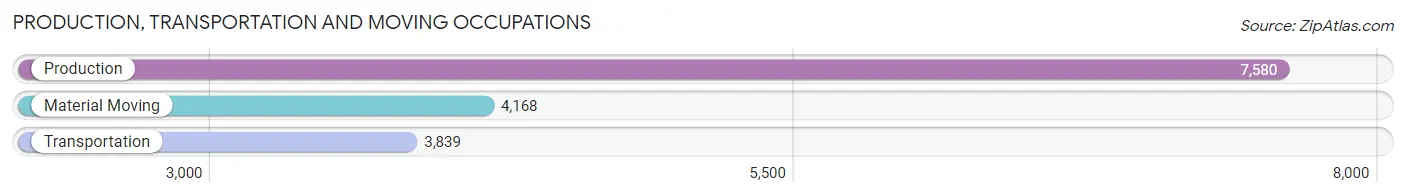
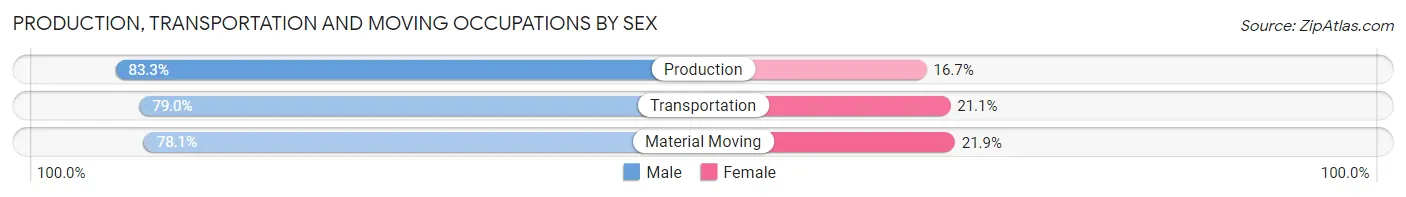
Production, Transportation and Moving Occupations
The most common Production, Transportation and Moving occupations in Jefferson County are Production (7,580 | 7.3%), Material Moving (4,168 | 4.0%), and Transportation (3,839 | 3.7%).
Production, Transportation and Moving Occupations by Sex
| Occupation | Male | Female |
| Production | 6,314 (83.3%) | 1,266 (16.7%) |
| Transportation | 3,031 (78.9%) | 808 (21.0%) |
| Material Moving | 3,256 (78.1%) | 912 (21.9%) |
| Total (Category) | 12,601 (80.8%) | 2,986 (19.2%) |
| Total (Overall) | 56,060 (53.7%) | 48,380 (46.3%) |
Employment Industries by Sex in Jefferson County
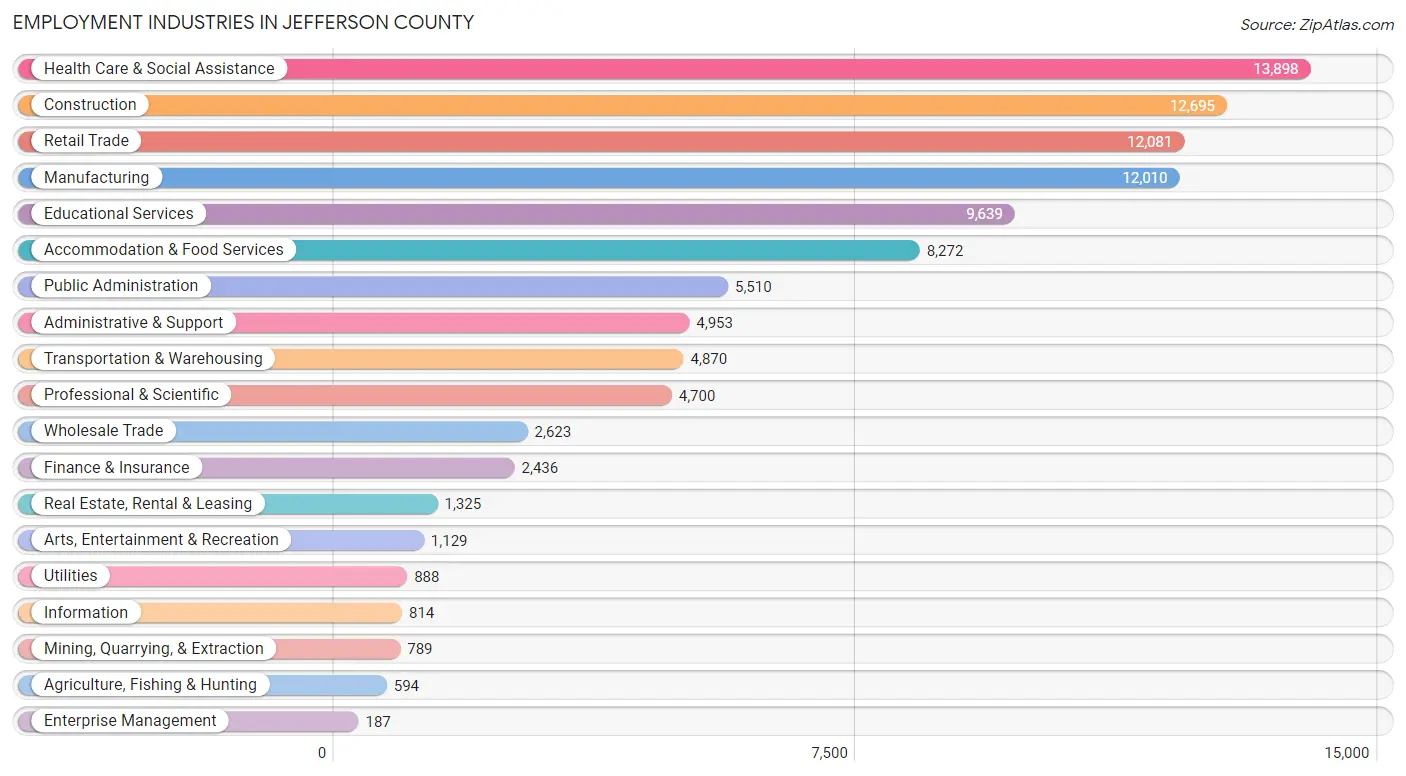
Employment Industries in Jefferson County
The major employment industries in Jefferson County include Health Care & Social Assistance (13,898 | 13.3%), Construction (12,695 | 12.2%), Retail Trade (12,081 | 11.6%), Manufacturing (12,010 | 11.5%), and Educational Services (9,639 | 9.2%).
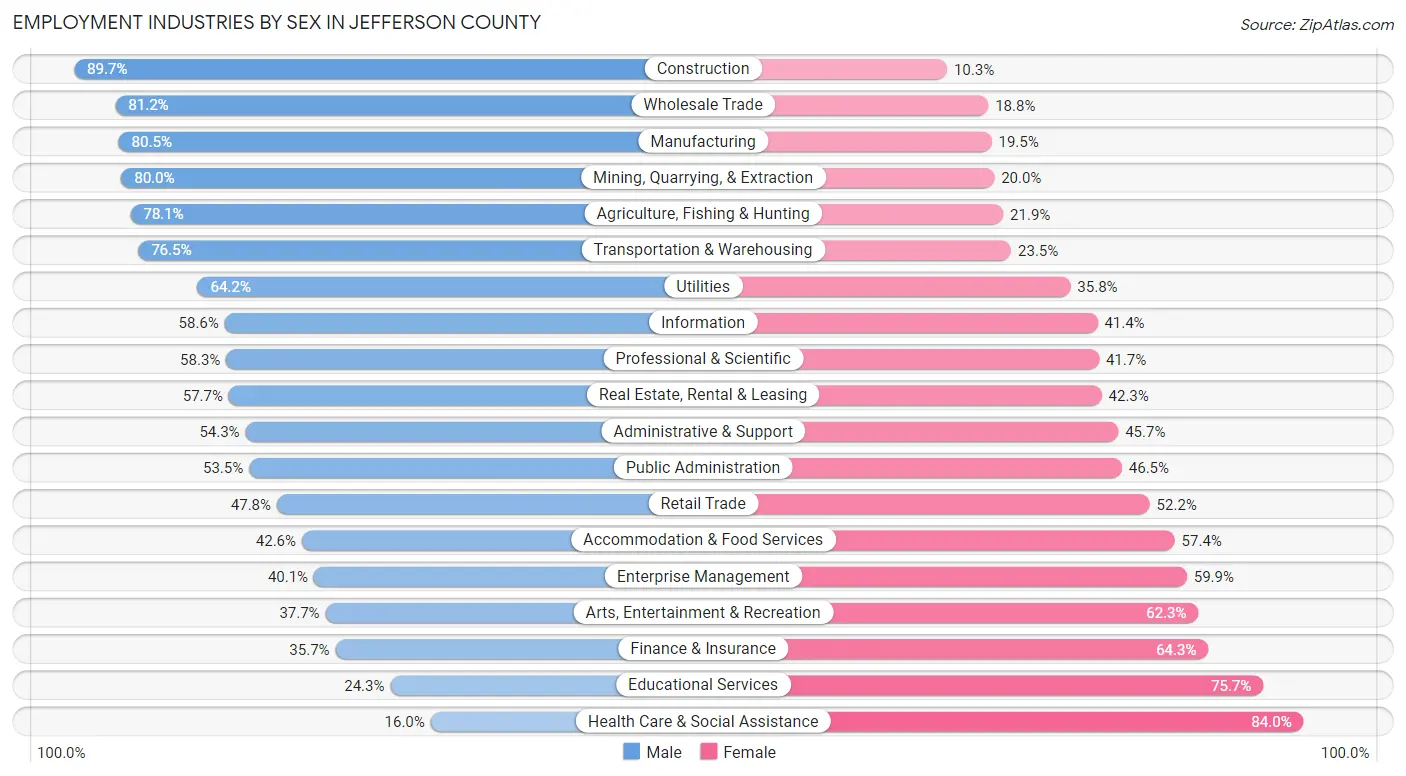
Employment Industries by Sex in Jefferson County
The Jefferson County industries that see more men than women are Construction (89.7%), Wholesale Trade (81.2%), and Manufacturing (80.5%), whereas the industries that tend to have a higher number of women are Health Care & Social Assistance (84.0%), Educational Services (75.7%), and Finance & Insurance (64.3%).
| Industry | Male | Female |
| Agriculture, Fishing & Hunting | 464 (78.1%) | 130 (21.9%) |
| Mining, Quarrying, & Extraction | 631 (80.0%) | 158 (20.0%) |
| Construction | 11,392 (89.7%) | 1,303 (10.3%) |
| Manufacturing | 9,670 (80.5%) | 2,340 (19.5%) |
| Wholesale Trade | 2,130 (81.2%) | 493 (18.8%) |
| Retail Trade | 5,774 (47.8%) | 6,307 (52.2%) |
| Transportation & Warehousing | 3,724 (76.5%) | 1,146 (23.5%) |
| Utilities | 570 (64.2%) | 318 (35.8%) |
| Information | 477 (58.6%) | 337 (41.4%) |
| Finance & Insurance | 869 (35.7%) | 1,567 (64.3%) |
| Real Estate, Rental & Leasing | 765 (57.7%) | 560 (42.3%) |
| Professional & Scientific | 2,739 (58.3%) | 1,961 (41.7%) |
| Enterprise Management | 75 (40.1%) | 112 (59.9%) |
| Administrative & Support | 2,689 (54.3%) | 2,264 (45.7%) |
| Educational Services | 2,342 (24.3%) | 7,297 (75.7%) |
| Health Care & Social Assistance | 2,218 (16.0%) | 11,680 (84.0%) |
| Arts, Entertainment & Recreation | 426 (37.7%) | 703 (62.3%) |
| Accommodation & Food Services | 3,525 (42.6%) | 4,747 (57.4%) |
| Public Administration | 2,950 (53.5%) | 2,560 (46.5%) |
| Total | 56,060 (53.7%) | 48,380 (46.3%) |
Education in Jefferson County
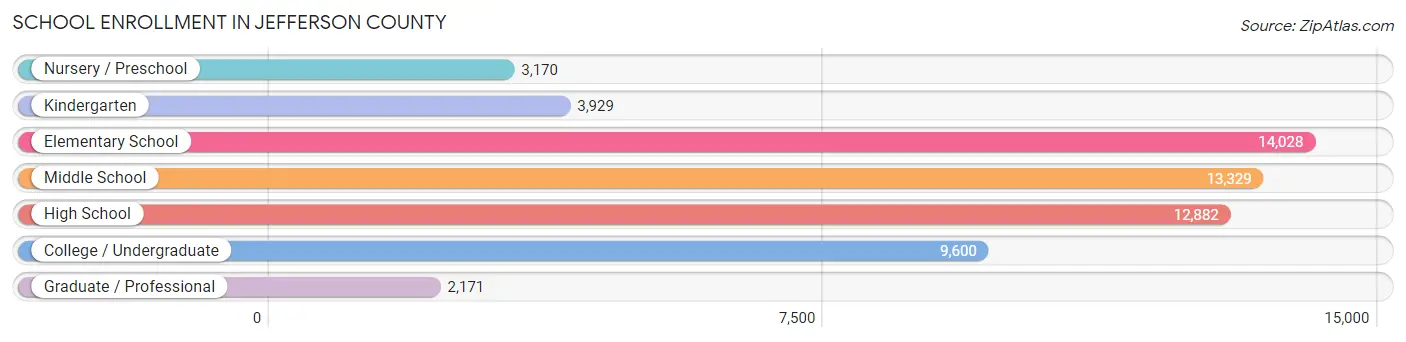
School Enrollment in Jefferson County
The most common levels of schooling among the 59,109 students in Jefferson County are elementary school (14,028 | 23.7%), middle school (13,329 | 22.6%), and high school (12,882 | 21.8%).
| School Level | # Students | % Students |
| Nursery / Preschool | 3,170 | 5.4% |
| Kindergarten | 3,929 | 6.7% |
| Elementary School | 14,028 | 23.7% |
| Middle School | 13,329 | 22.6% |
| High School | 12,882 | 21.8% |
| College / Undergraduate | 9,600 | 16.2% |
| Graduate / Professional | 2,171 | 3.7% |
| Total | 59,109 | 100.0% |
School Enrollment by Age by Funding Source in Jefferson County
Out of a total of 59,109 students who are enrolled in schools in Jefferson County, 6,029 (10.2%) attend a private institution, while the remaining 53,080 (89.8%) are enrolled in public schools. The age group of 35 years and over has the highest likelihood of being enrolled in private schools, with 550 (26.9% in the age bracket) enrolled. Conversely, the age group of 15 to 17 year olds has the lowest likelihood of being enrolled in a private school, with 8,640 (92.1% in the age bracket) attending a public institution.
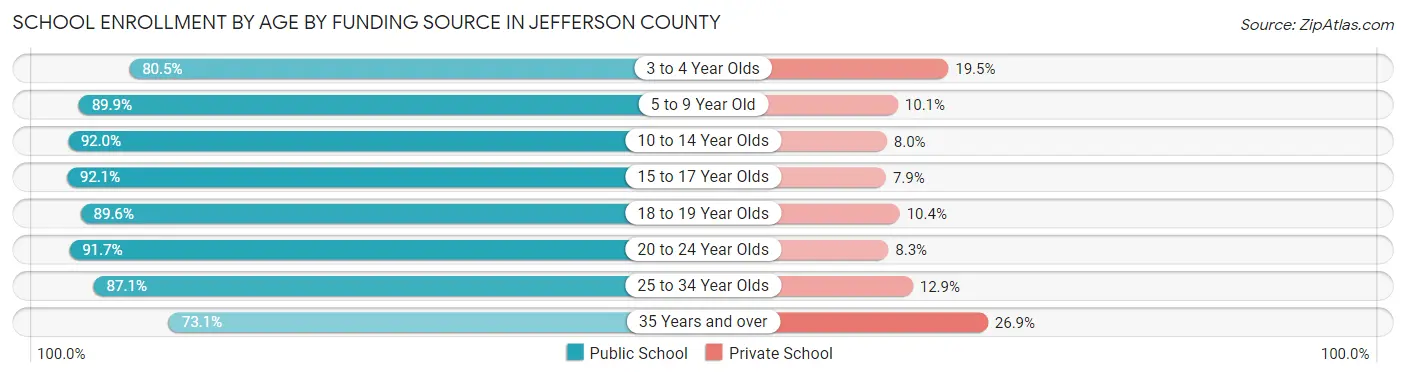
| Age Bracket | Public School | Private School |
| 3 to 4 Year Olds | 2,380 (80.5%) | 576 (19.5%) |
| 5 to 9 Year Old | 14,428 (89.9%) | 1,619 (10.1%) |
| 10 to 14 Year Olds | 15,625 (92.0%) | 1,366 (8.0%) |
| 15 to 17 Year Olds | 8,640 (92.1%) | 739 (7.9%) |
| 18 to 19 Year Olds | 3,482 (89.6%) | 406 (10.4%) |
| 20 to 24 Year Olds | 4,630 (91.7%) | 420 (8.3%) |
| 25 to 34 Year Olds | 2,396 (87.1%) | 354 (12.9%) |
| 35 Years and over | 1,498 (73.1%) | 550 (26.9%) |
| Total | 53,080 (89.8%) | 6,029 (10.2%) |
Educational Attainment by Field of Study in Jefferson County
Business (7,252 | 20.1%), education (5,400 | 15.0%), science & technology (4,749 | 13.2%), engineering (3,495 | 9.7%), and arts & humanities (2,904 | 8.1%) are the most common fields of study among 36,061 individuals in Jefferson County who have obtained a bachelor's degree or higher.
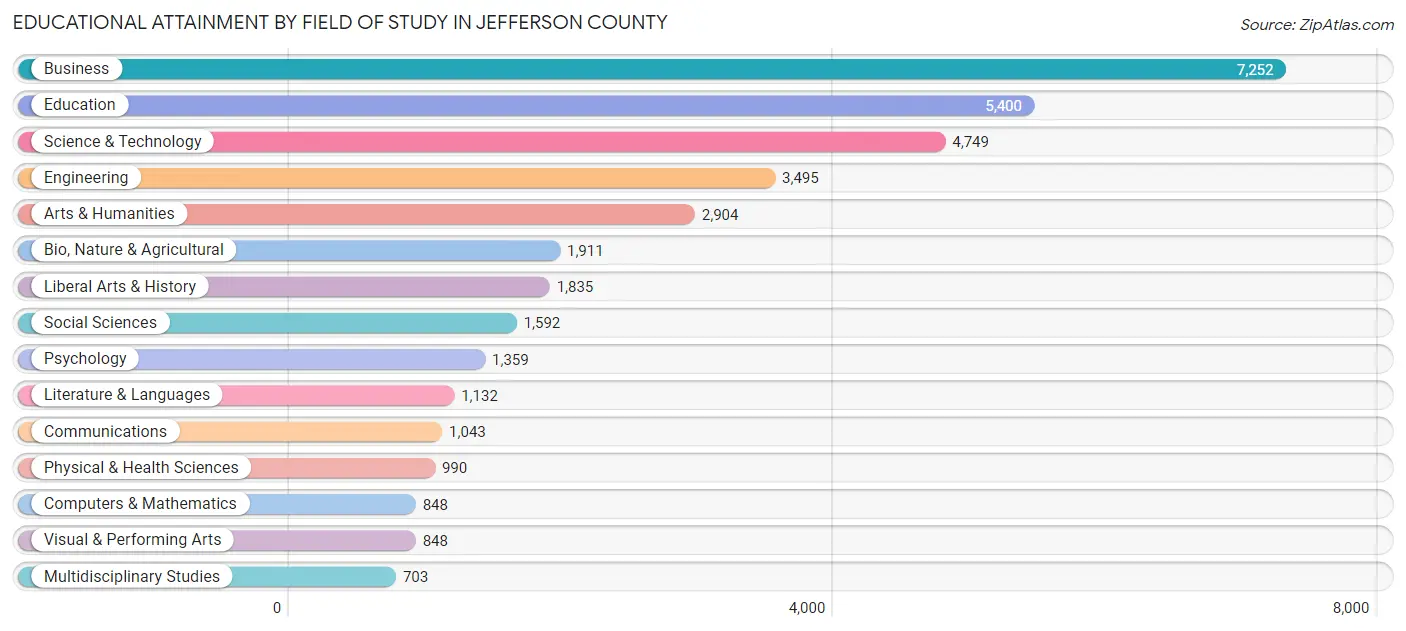
| Field of Study | # Graduates | % Graduates |
| Computers & Mathematics | 848 | 2.4% |
| Bio, Nature & Agricultural | 1,911 | 5.3% |
| Physical & Health Sciences | 990 | 2.8% |
| Psychology | 1,359 | 3.8% |
| Social Sciences | 1,592 | 4.4% |
| Engineering | 3,495 | 9.7% |
| Multidisciplinary Studies | 703 | 1.9% |
| Science & Technology | 4,749 | 13.2% |
| Business | 7,252 | 20.1% |
| Education | 5,400 | 15.0% |
| Literature & Languages | 1,132 | 3.1% |
| Liberal Arts & History | 1,835 | 5.1% |
| Visual & Performing Arts | 848 | 2.4% |
| Communications | 1,043 | 2.9% |
| Arts & Humanities | 2,904 | 8.1% |
| Total | 36,061 | 100.0% |
Transportation & Commute in Jefferson County
Vehicle Availability by Sex in Jefferson County
The most prevalent vehicle ownership categories in Jefferson County are males with 2 vehicles (25,411, accounting for 46.1%) and females with 2 vehicles (19,617, making up 53.8%).
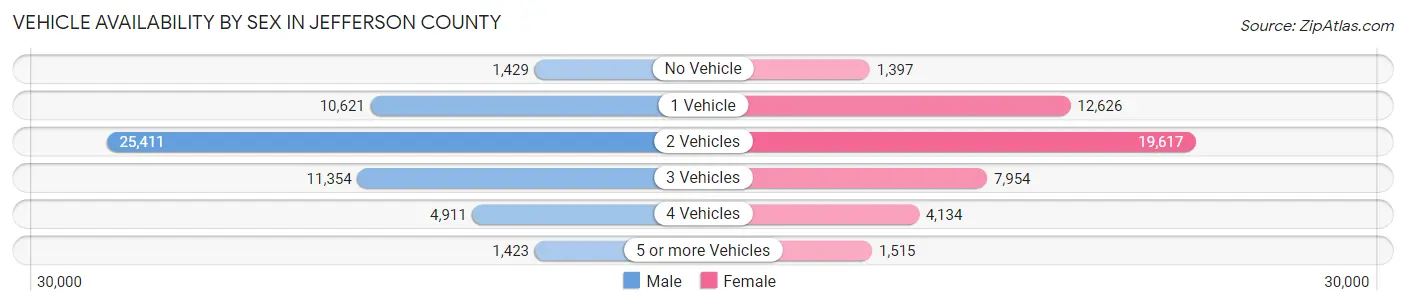
| Vehicles Available | Male | Female |
| No Vehicle | 1,429 (2.6%) | 1,397 (3.0%) |
| 1 Vehicle | 10,621 (19.3%) | 12,626 (26.7%) |
| 2 Vehicles | 25,411 (46.1%) | 19,617 (41.5%) |
| 3 Vehicles | 11,354 (20.6%) | 7,954 (16.8%) |
| 4 Vehicles | 4,911 (8.9%) | 4,134 (8.7%) |
| 5 or more Vehicles | 1,423 (2.6%) | 1,515 (3.2%) |
| Total | 55,149 (100.0%) | 47,243 (100.0%) |
Commute Time in Jefferson County
The most frequently occuring commute durations in Jefferson County are 20 to 24 minutes (21,456 commuters, 21.4%), 15 to 19 minutes (21,365 commuters, 21.3%), and 10 to 14 minutes (17,106 commuters, 17.1%).
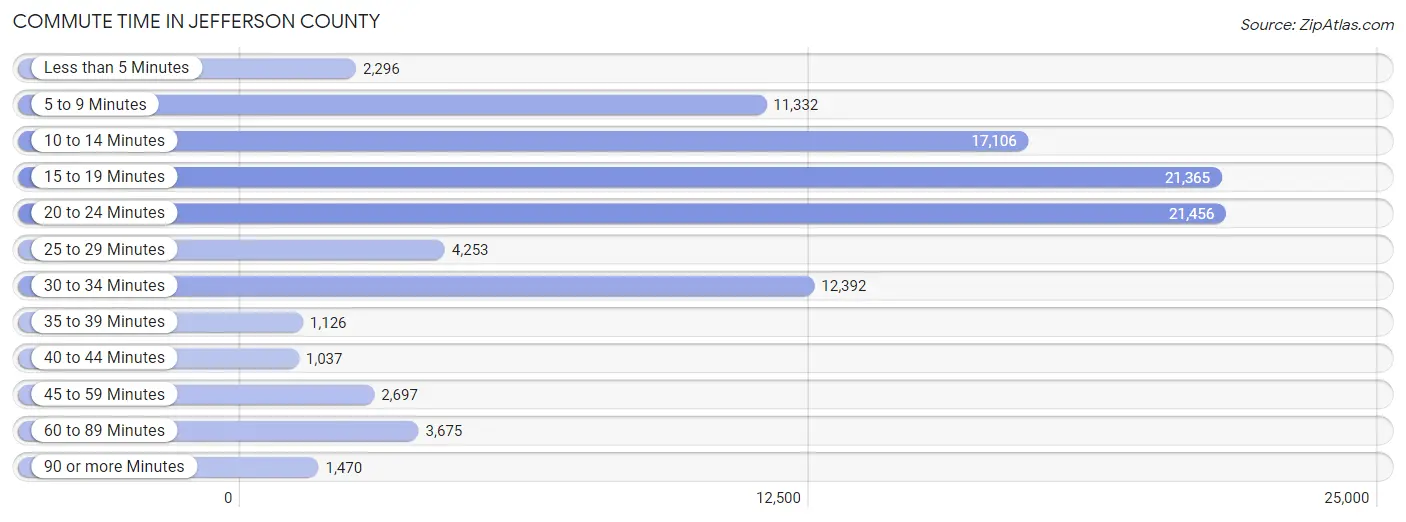
| Commute Time | # Commuters | % Commuters |
| Less than 5 Minutes | 2,296 | 2.3% |
| 5 to 9 Minutes | 11,332 | 11.3% |
| 10 to 14 Minutes | 17,106 | 17.1% |
| 15 to 19 Minutes | 21,365 | 21.3% |
| 20 to 24 Minutes | 21,456 | 21.4% |
| 25 to 29 Minutes | 4,253 | 4.2% |
| 30 to 34 Minutes | 12,392 | 12.4% |
| 35 to 39 Minutes | 1,126 | 1.1% |
| 40 to 44 Minutes | 1,037 | 1.0% |
| 45 to 59 Minutes | 2,697 | 2.7% |
| 60 to 89 Minutes | 3,675 | 3.7% |
| 90 or more Minutes | 1,470 | 1.5% |
Commute Time by Sex in Jefferson County
The most common commute times in Jefferson County are 20 to 24 minutes (12,540 commuters, 23.2%) for males and 15 to 19 minutes (10,349 commuters, 22.4%) for females.
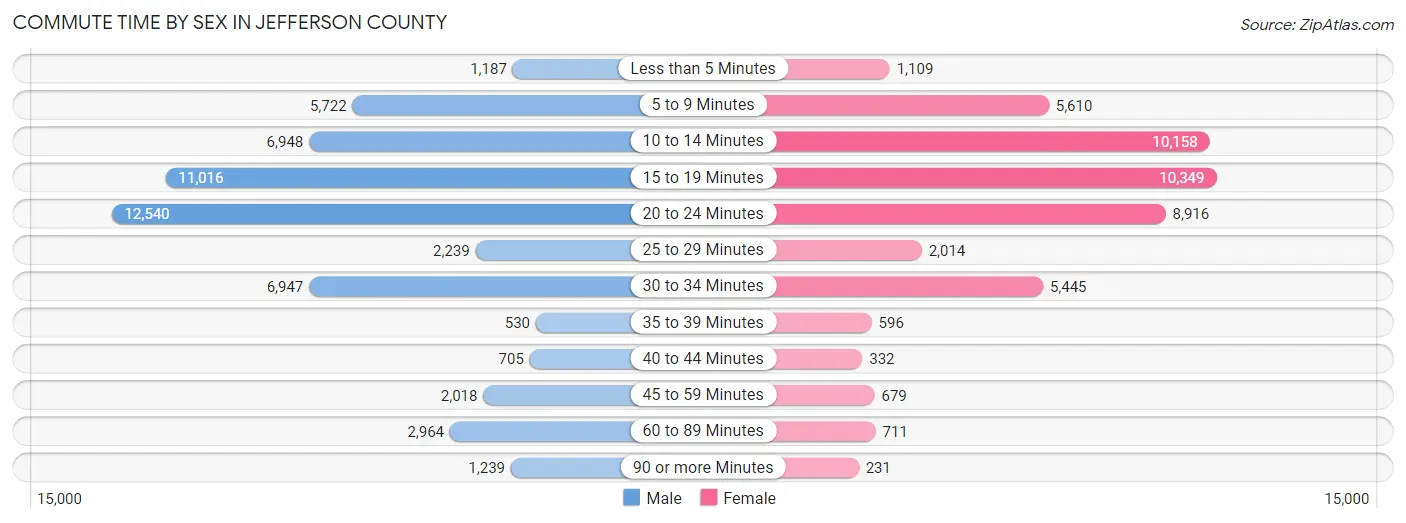
| Commute Time | Male | Female |
| Less than 5 Minutes | 1,187 (2.2%) | 1,109 (2.4%) |
| 5 to 9 Minutes | 5,722 (10.6%) | 5,610 (12.2%) |
| 10 to 14 Minutes | 6,948 (12.9%) | 10,158 (22.0%) |
| 15 to 19 Minutes | 11,016 (20.4%) | 10,349 (22.4%) |
| 20 to 24 Minutes | 12,540 (23.2%) | 8,916 (19.3%) |
| 25 to 29 Minutes | 2,239 (4.1%) | 2,014 (4.4%) |
| 30 to 34 Minutes | 6,947 (12.9%) | 5,445 (11.8%) |
| 35 to 39 Minutes | 530 (1.0%) | 596 (1.3%) |
| 40 to 44 Minutes | 705 (1.3%) | 332 (0.7%) |
| 45 to 59 Minutes | 2,018 (3.7%) | 679 (1.5%) |
| 60 to 89 Minutes | 2,964 (5.5%) | 711 (1.5%) |
| 90 or more Minutes | 1,239 (2.3%) | 231 (0.5%) |
Time of Departure to Work by Sex in Jefferson County
The most frequent times of departure to work in Jefferson County are 6:00 AM to 6:29 AM (7,025, 13.0%) for males and 7:30 AM to 7:59 AM (7,106, 15.4%) for females.
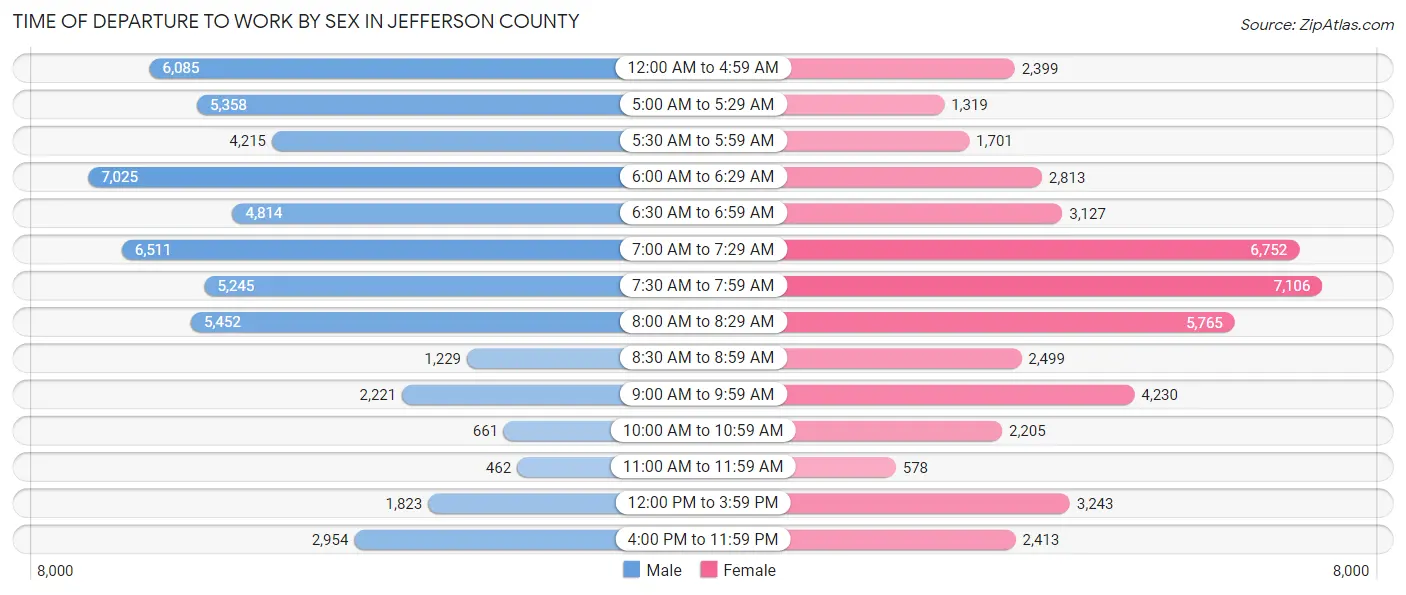
| Time of Departure | Male | Female |
| 12:00 AM to 4:59 AM | 6,085 (11.3%) | 2,399 (5.2%) |
| 5:00 AM to 5:29 AM | 5,358 (9.9%) | 1,319 (2.9%) |
| 5:30 AM to 5:59 AM | 4,215 (7.8%) | 1,701 (3.7%) |
| 6:00 AM to 6:29 AM | 7,025 (13.0%) | 2,813 (6.1%) |
| 6:30 AM to 6:59 AM | 4,814 (8.9%) | 3,127 (6.8%) |
| 7:00 AM to 7:29 AM | 6,511 (12.0%) | 6,752 (14.6%) |
| 7:30 AM to 7:59 AM | 5,245 (9.7%) | 7,106 (15.4%) |
| 8:00 AM to 8:29 AM | 5,452 (10.1%) | 5,765 (12.5%) |
| 8:30 AM to 8:59 AM | 1,229 (2.3%) | 2,499 (5.4%) |
| 9:00 AM to 9:59 AM | 2,221 (4.1%) | 4,230 (9.2%) |
| 10:00 AM to 10:59 AM | 661 (1.2%) | 2,205 (4.8%) |
| 11:00 AM to 11:59 AM | 462 (0.9%) | 578 (1.3%) |
| 12:00 PM to 3:59 PM | 1,823 (3.4%) | 3,243 (7.0%) |
| 4:00 PM to 11:59 PM | 2,954 (5.5%) | 2,413 (5.2%) |
| Total | 54,055 (100.0%) | 46,150 (100.0%) |
Housing Occupancy in Jefferson County
Occupancy by Ownership in Jefferson County
Of the total 93,193 dwellings in Jefferson County, owner-occupied units account for 57,492 (61.7%), while renter-occupied units make up 35,701 (38.3%).
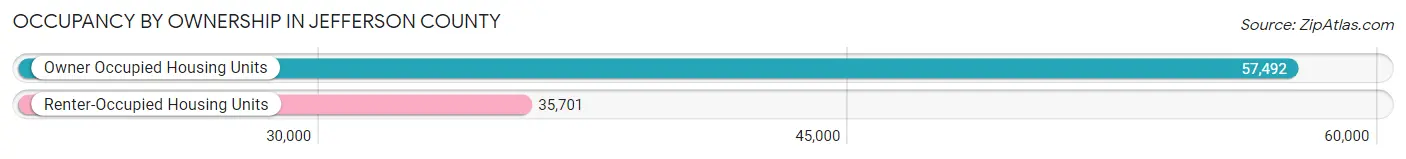
| Occupancy | # Housing Units | % Housing Units |
| Owner Occupied Housing Units | 57,492 | 61.7% |
| Renter-Occupied Housing Units | 35,701 | 38.3% |
| Total Occupied Housing Units | 93,193 | 100.0% |
Occupancy by Household Size in Jefferson County
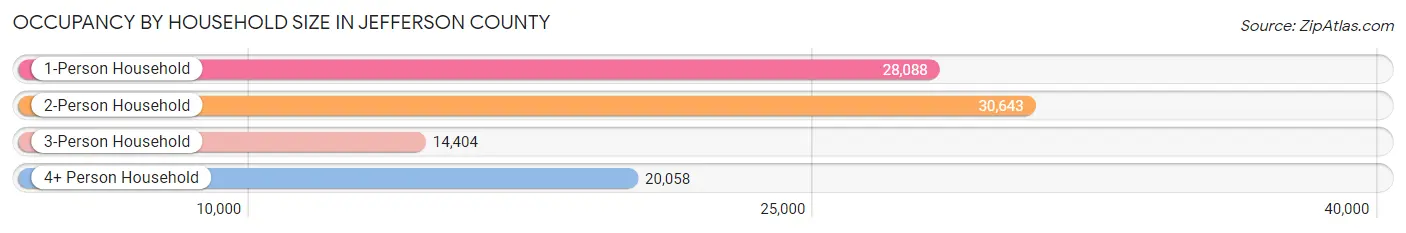
| Household Size | # Housing Units | % Housing Units |
| 1-Person Household | 28,088 | 30.1% |
| 2-Person Household | 30,643 | 32.9% |
| 3-Person Household | 14,404 | 15.5% |
| 4+ Person Household | 20,058 | 21.5% |
| Total Housing Units | 93,193 | 100.0% |
Occupancy by Ownership by Household Size in Jefferson County
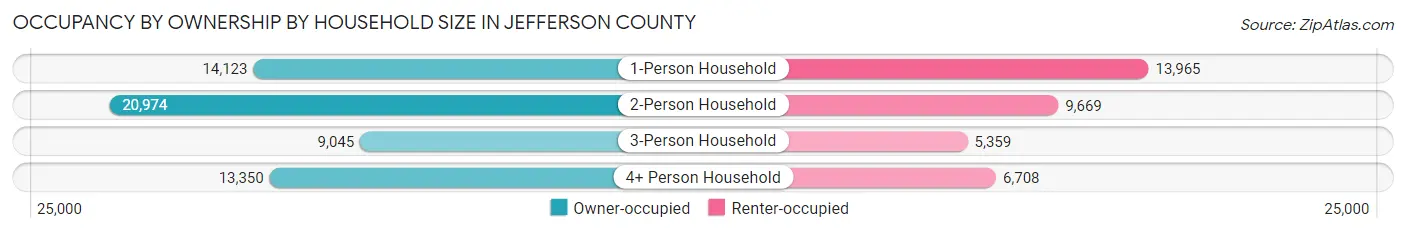
| Household Size | Owner-occupied | Renter-occupied |
| 1-Person Household | 14,123 (50.3%) | 13,965 (49.7%) |
| 2-Person Household | 20,974 (68.4%) | 9,669 (31.6%) |
| 3-Person Household | 9,045 (62.8%) | 5,359 (37.2%) |
| 4+ Person Household | 13,350 (66.6%) | 6,708 (33.4%) |
| Total Housing Units | 57,492 (61.7%) | 35,701 (38.3%) |
Occupancy by Educational Attainment in Jefferson County
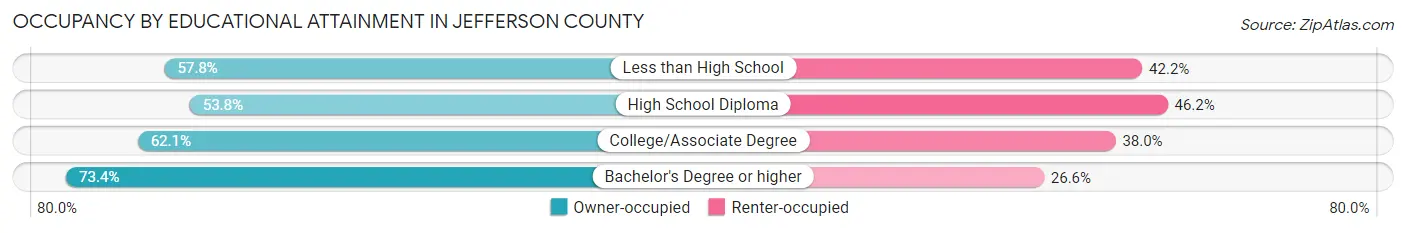
| Household Size | Owner-occupied | Renter-occupied |
| Less than High School | 6,736 (57.8%) | 4,916 (42.2%) |
| High School Diploma | 14,507 (53.8%) | 12,465 (46.2%) |
| College/Associate Degree | 20,806 (62.1%) | 12,724 (38.0%) |
| Bachelor's Degree or higher | 15,443 (73.4%) | 5,596 (26.6%) |
Occupancy by Age of Householder in Jefferson County
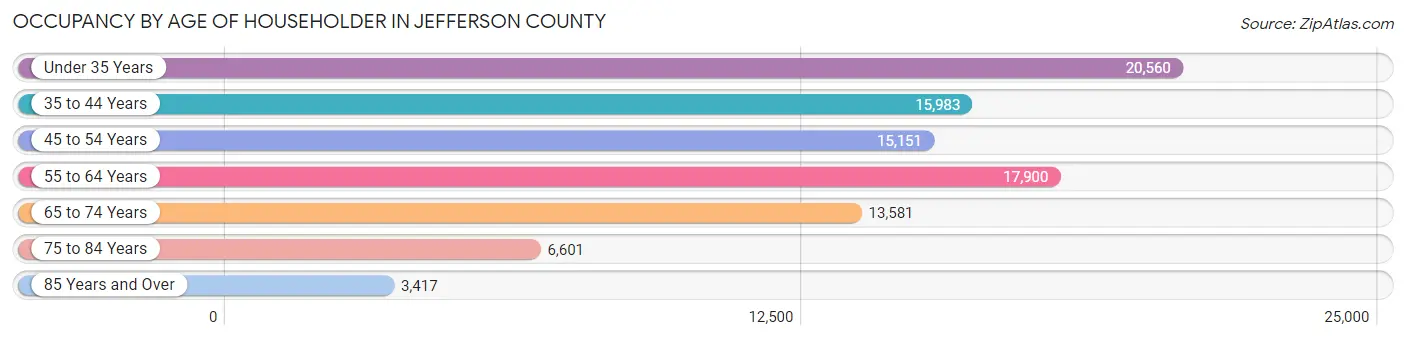
| Age Bracket | # Households | % Households |
| Under 35 Years | 20,560 | 22.1% |
| 35 to 44 Years | 15,983 | 17.2% |
| 45 to 54 Years | 15,151 | 16.3% |
| 55 to 64 Years | 17,900 | 19.2% |
| 65 to 74 Years | 13,581 | 14.6% |
| 75 to 84 Years | 6,601 | 7.1% |
| 85 Years and Over | 3,417 | 3.7% |
| Total | 93,193 | 100.0% |
Housing Finances in Jefferson County
Median Income by Occupancy in Jefferson County
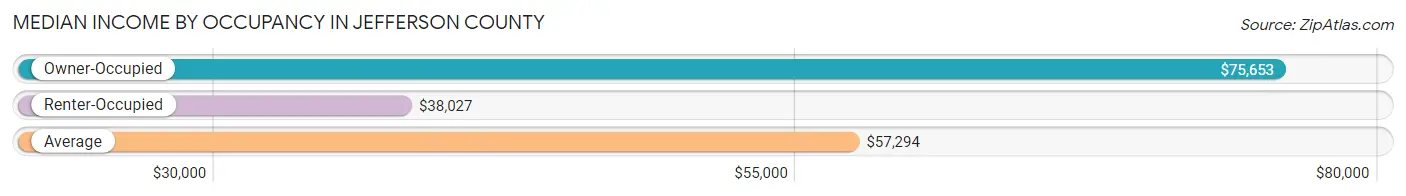
| Occupancy Type | # Households | Median Income |
| Owner-Occupied | 57,492 (61.7%) | $75,653 |
| Renter-Occupied | 35,701 (38.3%) | $38,027 |
| Average | 93,193 (100.0%) | $57,294 |
Occupancy by Householder Income Bracket in Jefferson County
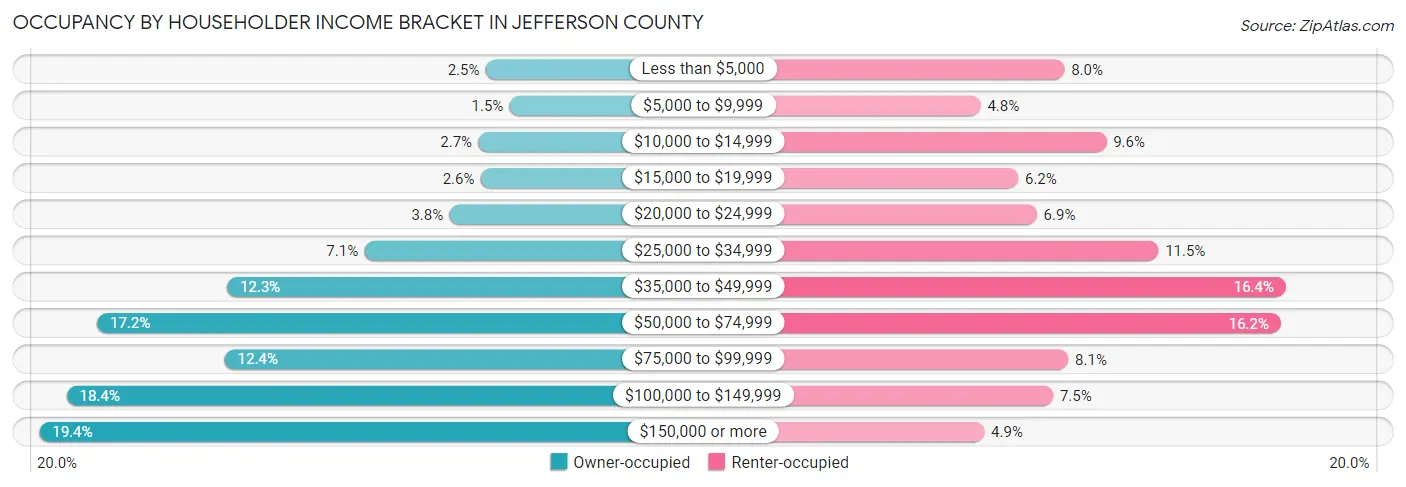
| Income Bracket | Owner-occupied | Renter-occupied |
| Less than $5,000 | 1,410 (2.5%) | 2,838 (8.0%) |
| $5,000 to $9,999 | 885 (1.5%) | 1,700 (4.8%) |
| $10,000 to $14,999 | 1,567 (2.7%) | 3,409 (9.6%) |
| $15,000 to $19,999 | 1,518 (2.6%) | 2,210 (6.2%) |
| $20,000 to $24,999 | 2,202 (3.8%) | 2,465 (6.9%) |
| $25,000 to $34,999 | 4,067 (7.1%) | 4,117 (11.5%) |
| $35,000 to $49,999 | 7,066 (12.3%) | 5,851 (16.4%) |
| $50,000 to $74,999 | 9,909 (17.2%) | 5,783 (16.2%) |
| $75,000 to $99,999 | 7,116 (12.4%) | 2,891 (8.1%) |
| $100,000 to $149,999 | 10,576 (18.4%) | 2,686 (7.5%) |
| $150,000 or more | 11,176 (19.4%) | 1,751 (4.9%) |
| Total | 57,492 (100.0%) | 35,701 (100.0%) |
Monthly Housing Cost Tiers in Jefferson County
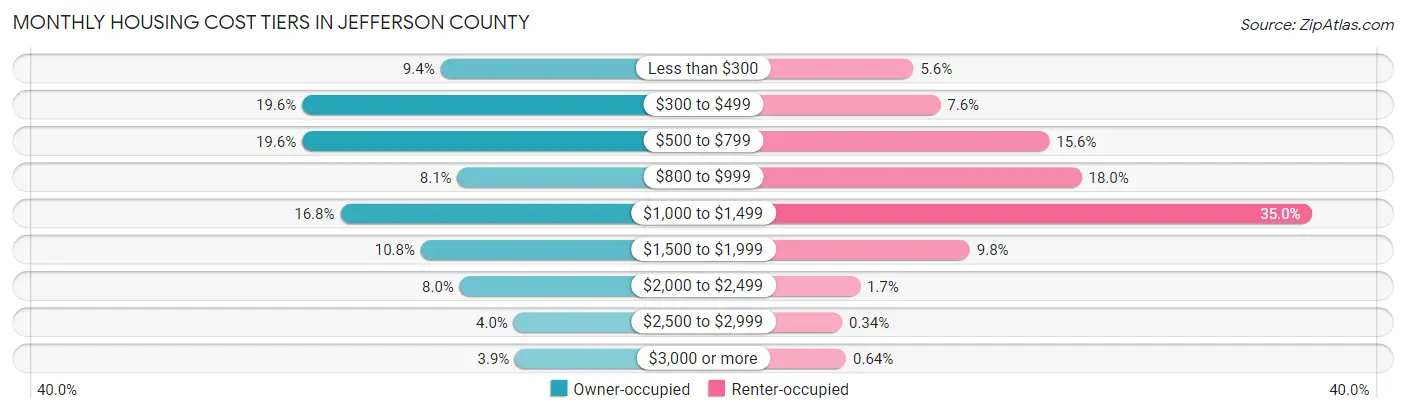
| Monthly Cost | Owner-occupied | Renter-occupied |
| Less than $300 | 5,388 (9.4%) | 2,001 (5.6%) |
| $300 to $499 | 11,247 (19.6%) | 2,707 (7.6%) |
| $500 to $799 | 11,254 (19.6%) | 5,572 (15.6%) |
| $800 to $999 | 4,670 (8.1%) | 6,418 (18.0%) |
| $1,000 to $1,499 | 9,629 (16.8%) | 12,487 (35.0%) |
| $1,500 to $1,999 | 6,220 (10.8%) | 3,480 (9.8%) |
| $2,000 to $2,499 | 4,575 (8.0%) | 592 (1.7%) |
| $2,500 to $2,999 | 2,286 (4.0%) | 122 (0.3%) |
| $3,000 or more | 2,223 (3.9%) | 230 (0.6%) |
| Total | 57,492 (100.0%) | 35,701 (100.0%) |
Physical Housing Characteristics in Jefferson County
Housing Structures in Jefferson County
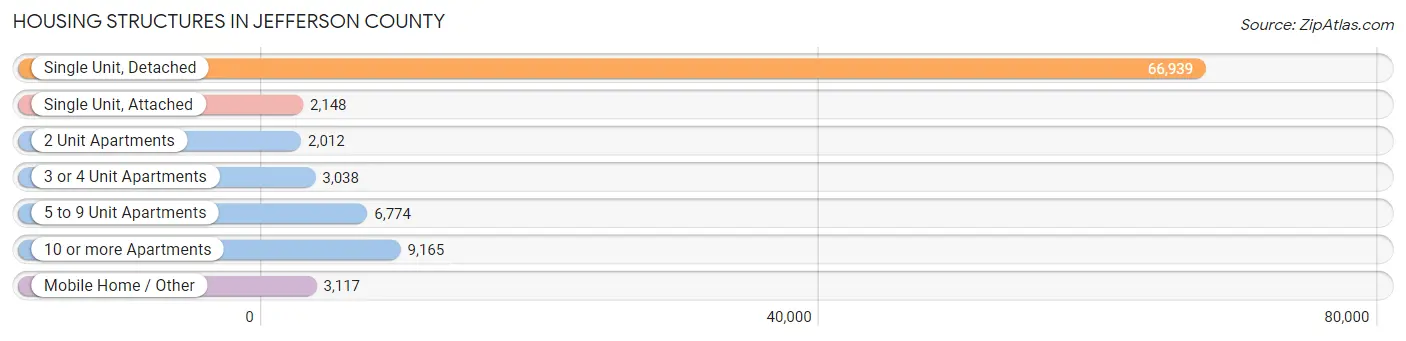
| Structure Type | # Housing Units | % Housing Units |
| Single Unit, Detached | 66,939 | 71.8% |
| Single Unit, Attached | 2,148 | 2.3% |
| 2 Unit Apartments | 2,012 | 2.2% |
| 3 or 4 Unit Apartments | 3,038 | 3.3% |
| 5 to 9 Unit Apartments | 6,774 | 7.3% |
| 10 or more Apartments | 9,165 | 9.8% |
| Mobile Home / Other | 3,117 | 3.3% |
| Total | 93,193 | 100.0% |
Housing Structures by Occupancy in Jefferson County
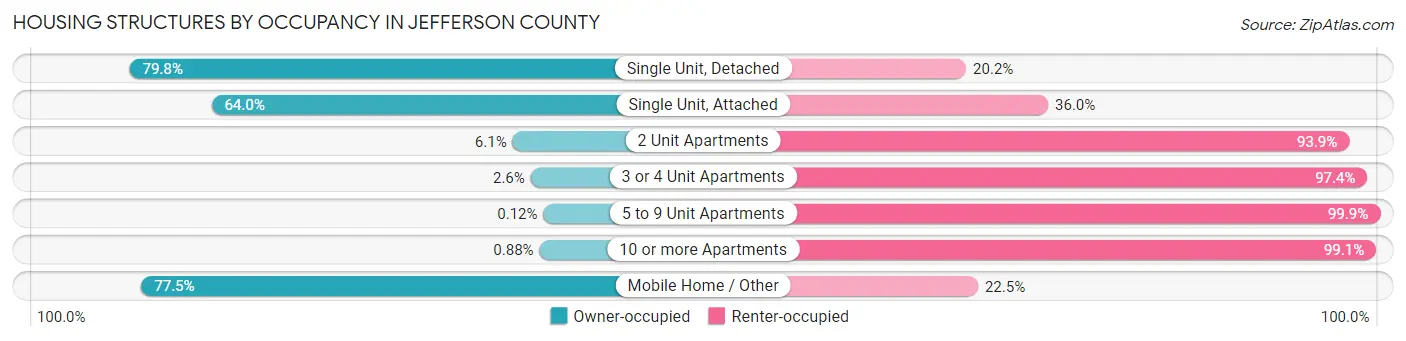
| Structure Type | Owner-occupied | Renter-occupied |
| Single Unit, Detached | 53,412 (79.8%) | 13,527 (20.2%) |
| Single Unit, Attached | 1,375 (64.0%) | 773 (36.0%) |
| 2 Unit Apartments | 122 (6.1%) | 1,890 (93.9%) |
| 3 or 4 Unit Apartments | 78 (2.6%) | 2,960 (97.4%) |
| 5 to 9 Unit Apartments | 8 (0.1%) | 6,766 (99.9%) |
| 10 or more Apartments | 81 (0.9%) | 9,084 (99.1%) |
| Mobile Home / Other | 2,416 (77.5%) | 701 (22.5%) |
| Total | 57,492 (61.7%) | 35,701 (38.3%) |
Housing Structures by Number of Rooms in Jefferson County
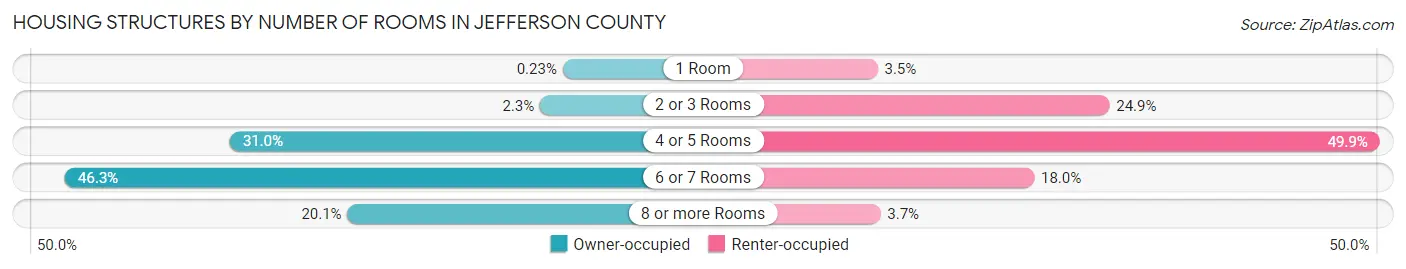
| Number of Rooms | Owner-occupied | Renter-occupied |
| 1 Room | 135 (0.2%) | 1,242 (3.5%) |
| 2 or 3 Rooms | 1,339 (2.3%) | 8,893 (24.9%) |
| 4 or 5 Rooms | 17,836 (31.0%) | 17,822 (49.9%) |
| 6 or 7 Rooms | 26,603 (46.3%) | 6,410 (17.9%) |
| 8 or more Rooms | 11,579 (20.1%) | 1,334 (3.7%) |
| Total | 57,492 (100.0%) | 35,701 (100.0%) |
Housing Structure by Heating Type in Jefferson County
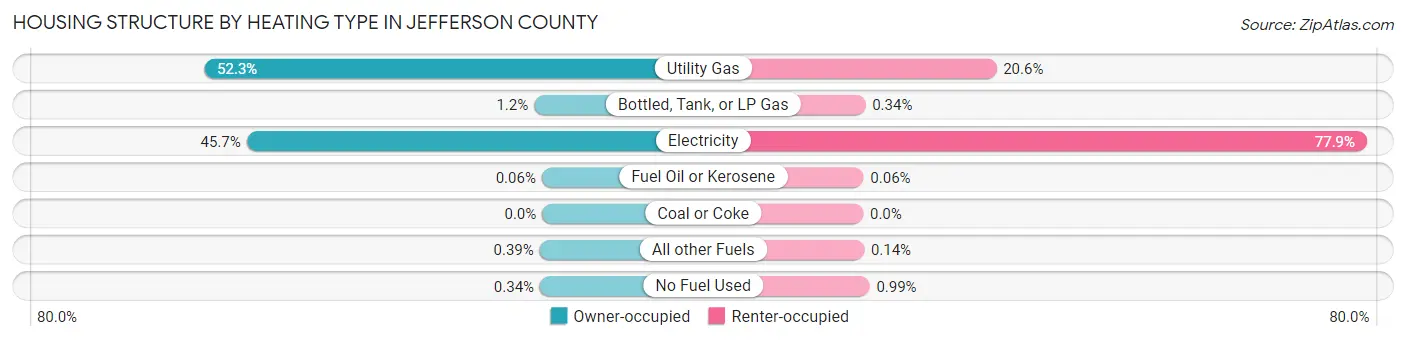
| Heating Type | Owner-occupied | Renter-occupied |
| Utility Gas | 30,053 (52.3%) | 7,351 (20.6%) |
| Bottled, Tank, or LP Gas | 714 (1.2%) | 123 (0.3%) |
| Electricity | 26,267 (45.7%) | 27,803 (77.9%) |
| Fuel Oil or Kerosene | 37 (0.1%) | 21 (0.1%) |
| Coal or Coke | 0 (0.0%) | 0 (0.0%) |
| All other Fuels | 226 (0.4%) | 51 (0.1%) |
| No Fuel Used | 195 (0.3%) | 352 (1.0%) |
| Total | 57,492 (100.0%) | 35,701 (100.0%) |
Household Vehicle Usage in Jefferson County
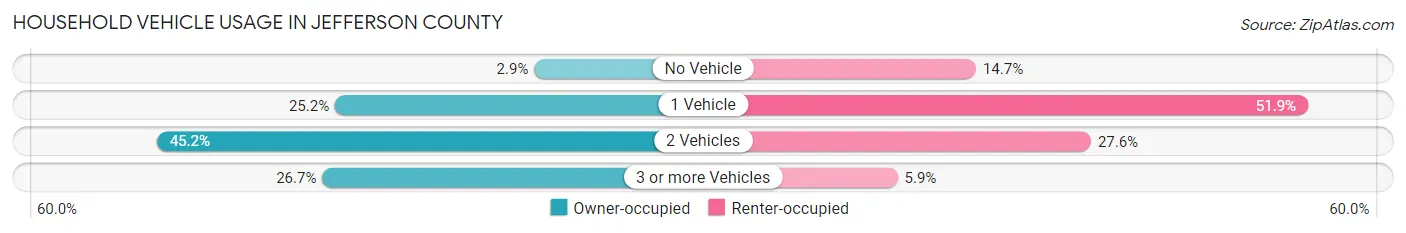
| Vehicles per Household | Owner-occupied | Renter-occupied |
| No Vehicle | 1,674 (2.9%) | 5,240 (14.7%) |
| 1 Vehicle | 14,506 (25.2%) | 18,515 (51.9%) |
| 2 Vehicles | 25,984 (45.2%) | 9,839 (27.6%) |
| 3 or more Vehicles | 15,328 (26.7%) | 2,107 (5.9%) |
| Total | 57,492 (100.0%) | 35,701 (100.0%) |
Real Estate & Mortgages in Jefferson County
Real Estate and Mortgage Overview in Jefferson County
| Characteristic | Without Mortgage | With Mortgage |
| Housing Units | 32,659 | 24,833 |
| Median Property Value | $115,400 | $187,300 |
| Median Household Income | $58,281 | $7,181 |
| Monthly Housing Costs | $497 | $2,075 |
| Real Estate Taxes | $1,653 | $1,057 |
Property Value by Mortgage Status in Jefferson County
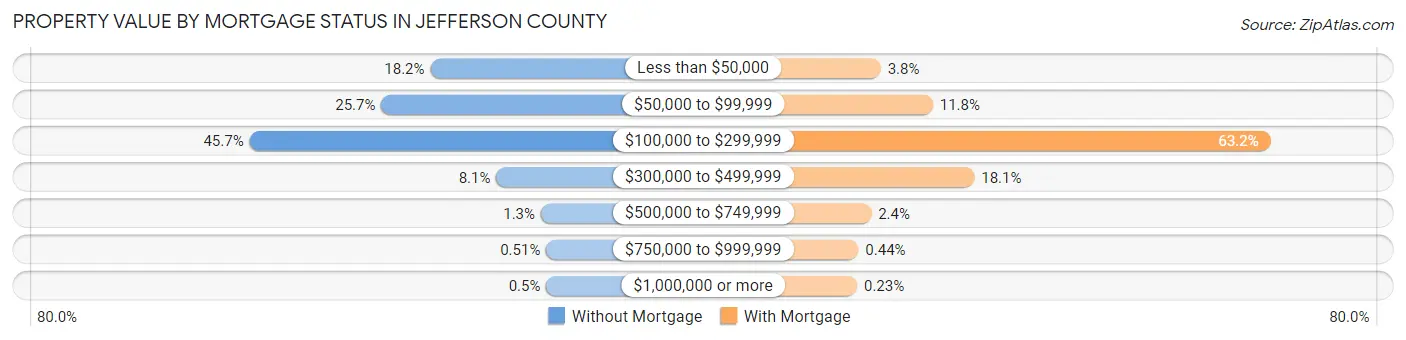
| Property Value | Without Mortgage | With Mortgage |
| Less than $50,000 | 5,934 (18.2%) | 954 (3.8%) |
| $50,000 to $99,999 | 8,377 (25.7%) | 2,924 (11.8%) |
| $100,000 to $299,999 | 14,934 (45.7%) | 15,701 (63.2%) |
| $300,000 to $499,999 | 2,651 (8.1%) | 4,494 (18.1%) |
| $500,000 to $749,999 | 435 (1.3%) | 593 (2.4%) |
| $750,000 to $999,999 | 166 (0.5%) | 110 (0.4%) |
| $1,000,000 or more | 162 (0.5%) | 57 (0.2%) |
| Total | 32,659 (100.0%) | 24,833 (100.0%) |
Household Income by Mortgage Status in Jefferson County
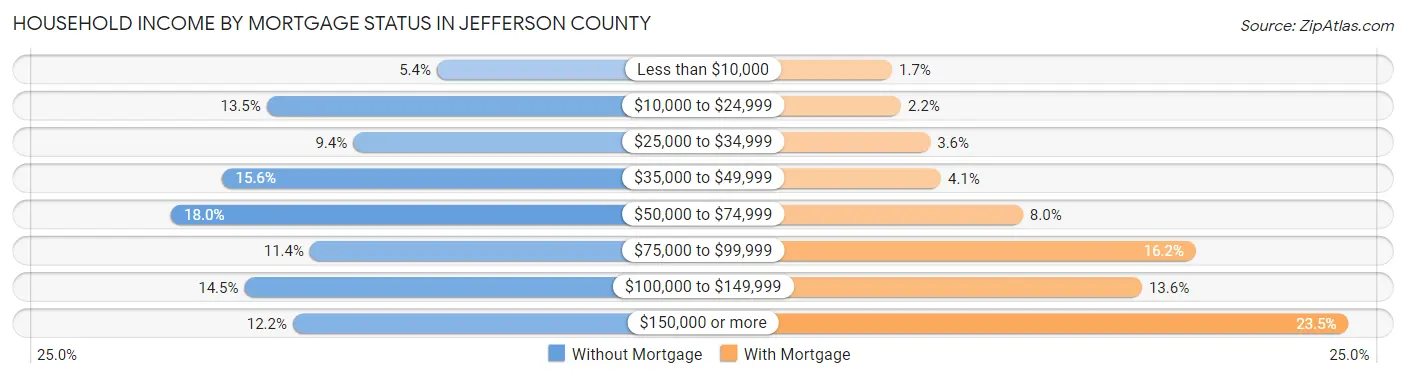
| Household Income | Without Mortgage | With Mortgage |
| Less than $10,000 | 1,755 (5.4%) | 433 (1.7%) |
| $10,000 to $24,999 | 4,404 (13.5%) | 540 (2.2%) |
| $25,000 to $34,999 | 3,056 (9.4%) | 883 (3.6%) |
| $35,000 to $49,999 | 5,086 (15.6%) | 1,011 (4.1%) |
| $50,000 to $74,999 | 5,886 (18.0%) | 1,980 (8.0%) |
| $75,000 to $99,999 | 3,730 (11.4%) | 4,023 (16.2%) |
| $100,000 to $149,999 | 4,747 (14.5%) | 3,386 (13.6%) |
| $150,000 or more | 3,995 (12.2%) | 5,829 (23.5%) |
| Total | 32,659 (100.0%) | 24,833 (100.0%) |
Property Value to Household Income Ratio in Jefferson County
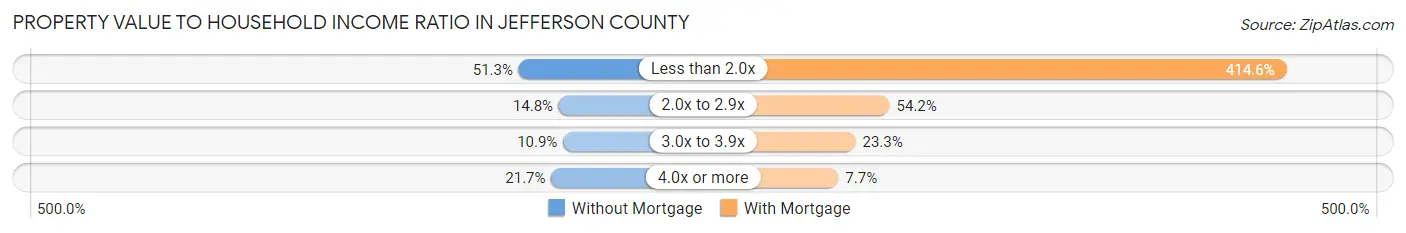
| Value-to-Income Ratio | Without Mortgage | With Mortgage |
| Less than 2.0x | 16,741 (51.3%) | 102,962 (414.6%) |
| 2.0x to 2.9x | 4,828 (14.8%) | 13,458 (54.2%) |
| 3.0x to 3.9x | 3,574 (10.9%) | 5,781 (23.3%) |
| 4.0x or more | 7,080 (21.7%) | 1,915 (7.7%) |
| Total | 32,659 (100.0%) | 24,833 (100.0%) |
Real Estate Taxes by Mortgage Status in Jefferson County
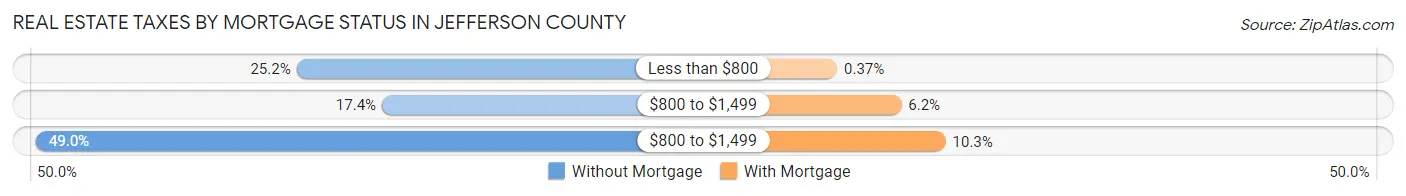
| Property Taxes | Without Mortgage | With Mortgage |
| Less than $800 | 8,219 (25.2%) | 91 (0.4%) |
| $800 to $1,499 | 5,672 (17.4%) | 1,549 (6.2%) |
| $800 to $1,499 | 15,989 (49.0%) | 2,552 (10.3%) |
| Total | 32,659 (100.0%) | 24,833 (100.0%) |
Health & Disability in Jefferson County
Health Insurance Coverage by Age in Jefferson County
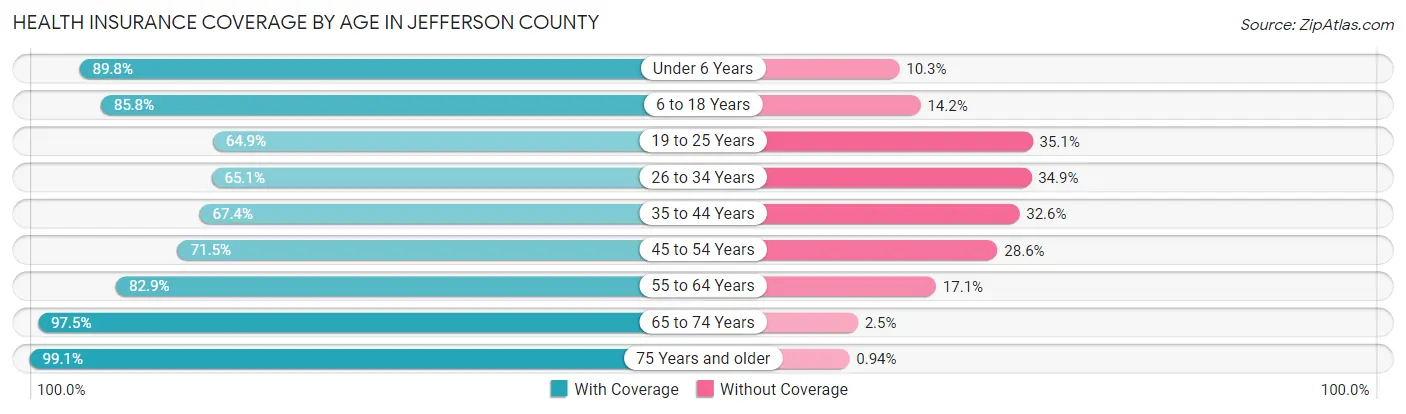
| Age Bracket | With Coverage | Without Coverage |
| Under 6 Years | 18,696 (89.7%) | 2,136 (10.2%) |
| 6 to 18 Years | 37,831 (85.8%) | 6,265 (14.2%) |
| 19 to 25 Years | 14,609 (64.9%) | 7,906 (35.1%) |
| 26 to 34 Years | 19,292 (65.1%) | 10,322 (34.9%) |
| 35 to 44 Years | 20,295 (67.4%) | 9,836 (32.6%) |
| 45 to 54 Years | 19,535 (71.5%) | 7,804 (28.5%) |
| 55 to 64 Years | 25,081 (82.9%) | 5,166 (17.1%) |
| 65 to 74 Years | 20,881 (97.5%) | 535 (2.5%) |
| 75 Years and older | 14,915 (99.1%) | 141 (0.9%) |
| Total | 191,135 (79.2%) | 50,111 (20.8%) |
Health Insurance Coverage by Citizenship Status in Jefferson County
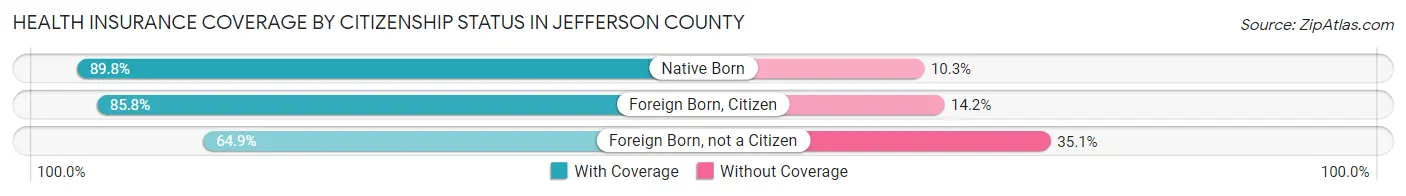
| Citizenship Status | With Coverage | Without Coverage |
| Native Born | 18,696 (89.7%) | 2,136 (10.2%) |
| Foreign Born, Citizen | 37,831 (85.8%) | 6,265 (14.2%) |
| Foreign Born, not a Citizen | 14,609 (64.9%) | 7,906 (35.1%) |
Health Insurance Coverage by Household Income in Jefferson County
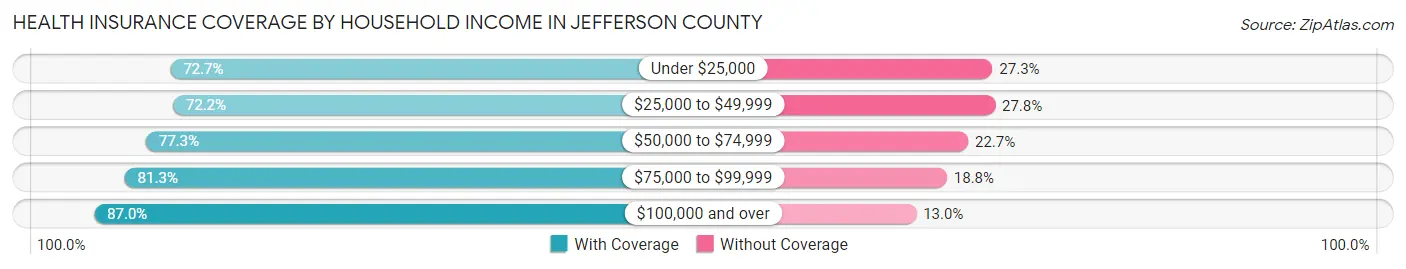
| Household Income | With Coverage | Without Coverage |
| Under $25,000 | 29,403 (72.7%) | 11,030 (27.3%) |
| $25,000 to $49,999 | 35,394 (72.2%) | 13,616 (27.8%) |
| $50,000 to $74,999 | 31,560 (77.3%) | 9,279 (22.7%) |
| $75,000 to $99,999 | 21,578 (81.2%) | 4,980 (18.8%) |
| $100,000 and over | 71,485 (87.0%) | 10,685 (13.0%) |
Public vs Private Health Insurance Coverage by Age in Jefferson County
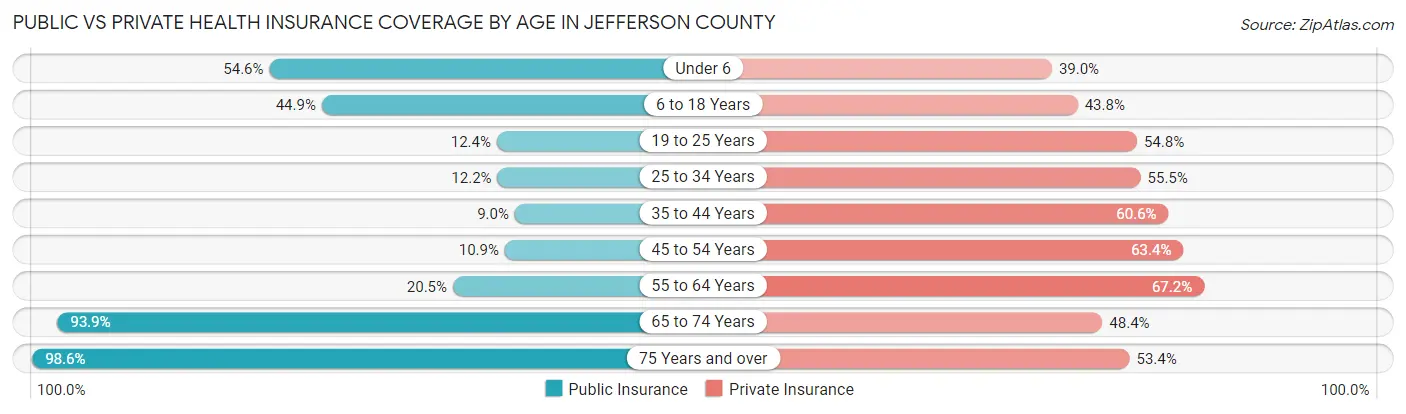
| Age Bracket | Public Insurance | Private Insurance |
| Under 6 | 11,369 (54.6%) | 8,126 (39.0%) |
| 6 to 18 Years | 19,779 (44.9%) | 19,310 (43.8%) |
| 19 to 25 Years | 2,781 (12.3%) | 12,336 (54.8%) |
| 25 to 34 Years | 3,624 (12.2%) | 16,424 (55.5%) |
| 35 to 44 Years | 2,716 (9.0%) | 18,265 (60.6%) |
| 45 to 54 Years | 2,971 (10.9%) | 17,325 (63.4%) |
| 55 to 64 Years | 6,203 (20.5%) | 20,331 (67.2%) |
| 65 to 74 Years | 20,116 (93.9%) | 10,358 (48.4%) |
| 75 Years and over | 14,842 (98.6%) | 8,042 (53.4%) |
| Total | 84,401 (35.0%) | 130,517 (54.1%) |
Disability Status by Sex by Age in Jefferson County
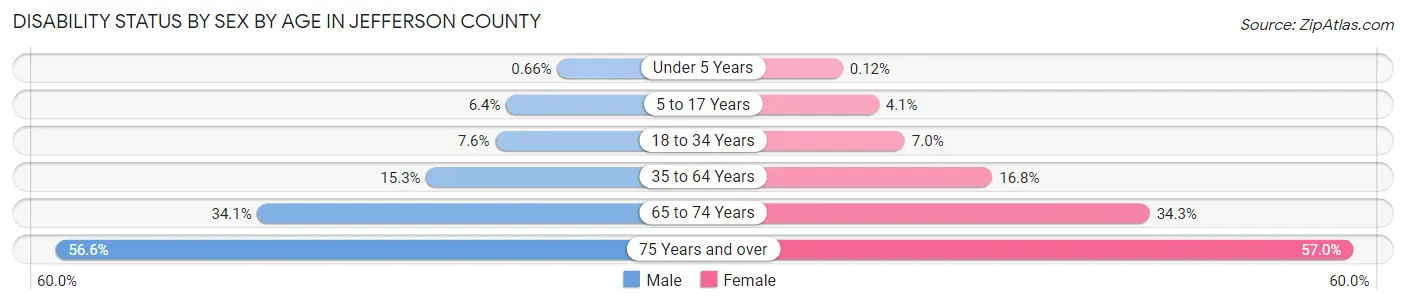
| Age Bracket | Male | Female |
| Under 5 Years | 58 (0.7%) | 10 (0.1%) |
| 5 to 17 Years | 1,437 (6.4%) | 909 (4.1%) |
| 18 to 34 Years | 2,142 (7.6%) | 1,896 (7.0%) |
| 35 to 64 Years | 6,508 (15.2%) | 7,549 (16.8%) |
| 65 to 74 Years | 3,435 (34.1%) | 3,886 (34.3%) |
| 75 Years and over | 3,434 (56.6%) | 5,119 (57.0%) |
Disability Class by Sex by Age in Jefferson County
Disability Class: Hearing Difficulty
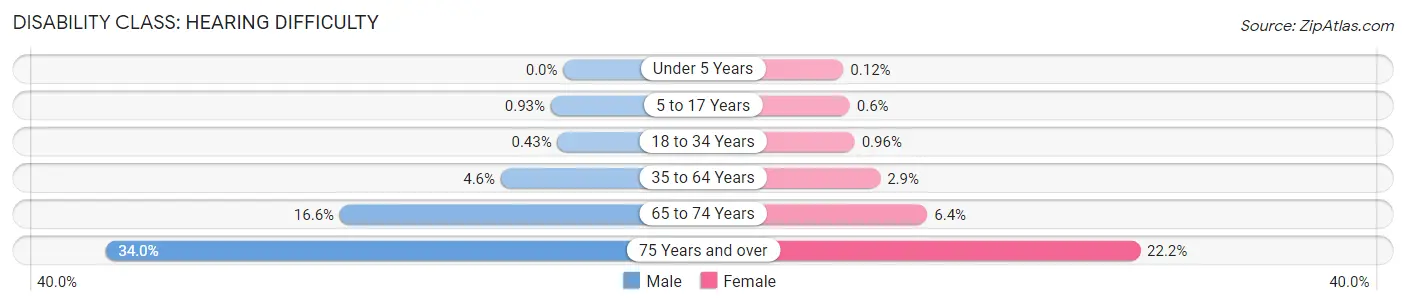
| Age Bracket | Male | Female |
| Under 5 Years | 0 (0.0%) | 10 (0.1%) |
| 5 to 17 Years | 211 (0.9%) | 133 (0.6%) |
| 18 to 34 Years | 123 (0.4%) | 260 (1.0%) |
| 35 to 64 Years | 1,980 (4.6%) | 1,284 (2.9%) |
| 65 to 74 Years | 1,673 (16.6%) | 720 (6.4%) |
| 75 Years and over | 2,064 (34.0%) | 1,990 (22.2%) |
Disability Class: Vision Difficulty
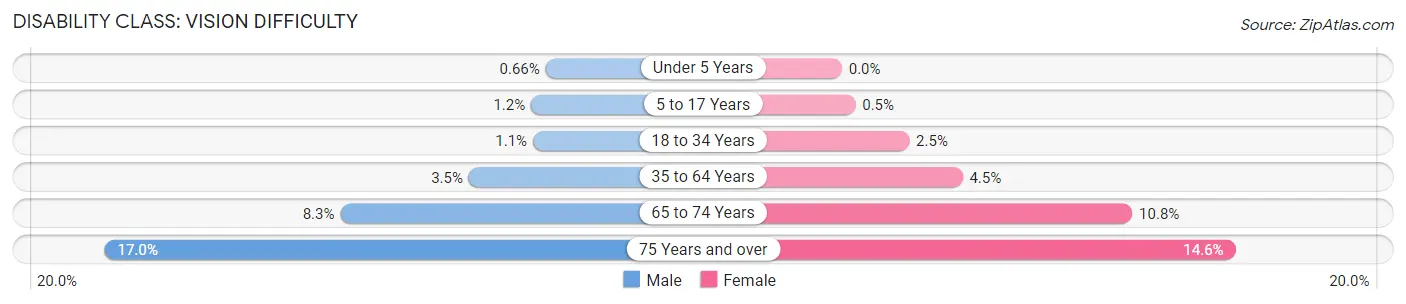
| Age Bracket | Male | Female |
| Under 5 Years | 58 (0.7%) | 0 (0.0%) |
| 5 to 17 Years | 272 (1.2%) | 111 (0.5%) |
| 18 to 34 Years | 319 (1.1%) | 673 (2.5%) |
| 35 to 64 Years | 1,498 (3.5%) | 2,018 (4.5%) |
| 65 to 74 Years | 835 (8.3%) | 1,222 (10.8%) |
| 75 Years and over | 1,034 (17.0%) | 1,313 (14.6%) |
Disability Class: Cognitive Difficulty
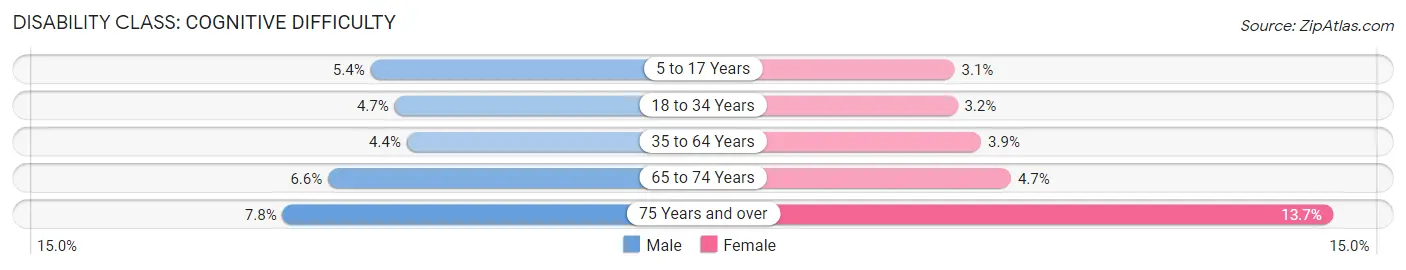
| Age Bracket | Male | Female |
| 5 to 17 Years | 1,215 (5.4%) | 691 (3.1%) |
| 18 to 34 Years | 1,328 (4.7%) | 869 (3.2%) |
| 35 to 64 Years | 1,863 (4.4%) | 1,746 (3.9%) |
| 65 to 74 Years | 661 (6.6%) | 534 (4.7%) |
| 75 Years and over | 475 (7.8%) | 1,230 (13.7%) |
Disability Class: Ambulatory Difficulty
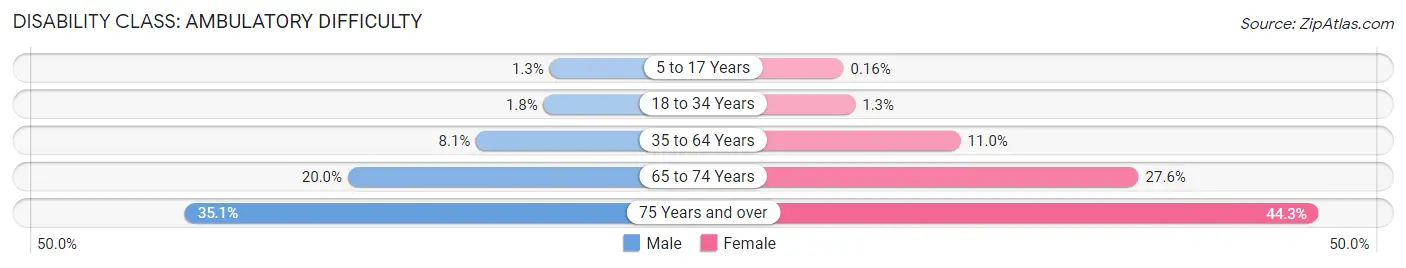
| Age Bracket | Male | Female |
| 5 to 17 Years | 290 (1.3%) | 35 (0.2%) |
| 18 to 34 Years | 520 (1.8%) | 337 (1.3%) |
| 35 to 64 Years | 3,454 (8.1%) | 4,965 (11.0%) |
| 65 to 74 Years | 2,017 (20.0%) | 3,122 (27.6%) |
| 75 Years and over | 2,133 (35.1%) | 3,976 (44.3%) |
Disability Class: Self-Care Difficulty
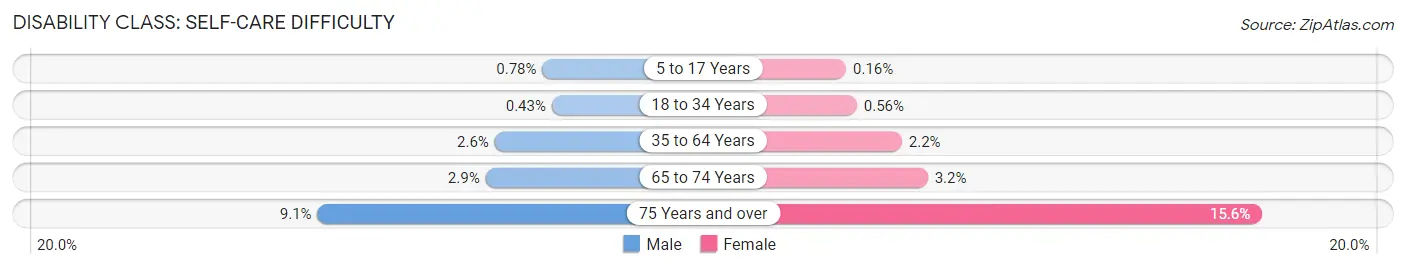
| Age Bracket | Male | Female |
| 5 to 17 Years | 176 (0.8%) | 35 (0.2%) |
| 18 to 34 Years | 123 (0.4%) | 152 (0.6%) |
| 35 to 64 Years | 1,089 (2.5%) | 1,003 (2.2%) |
| 65 to 74 Years | 291 (2.9%) | 362 (3.2%) |
| 75 Years and over | 554 (9.1%) | 1,402 (15.6%) |
Technology Access in Jefferson County
Computing Device Access in Jefferson County
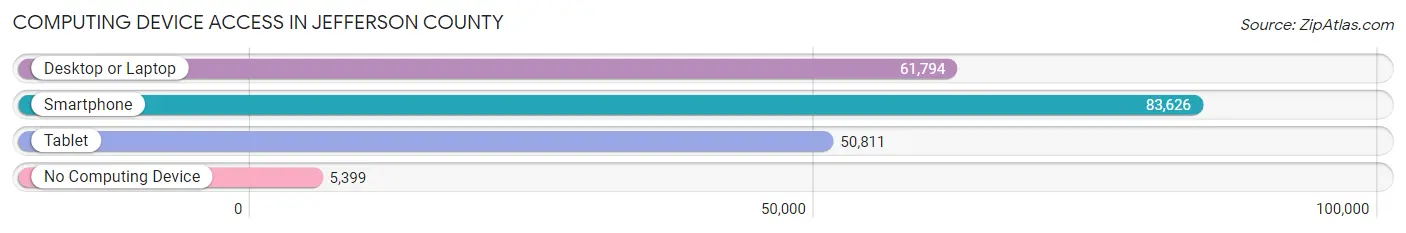
| Device Type | # Households | % Households |
| Desktop or Laptop | 61,794 | 66.3% |
| Smartphone | 83,626 | 89.7% |
| Tablet | 50,811 | 54.5% |
| No Computing Device | 5,399 | 5.8% |
| Total | 93,193 | 100.0% |
Internet Access in Jefferson County
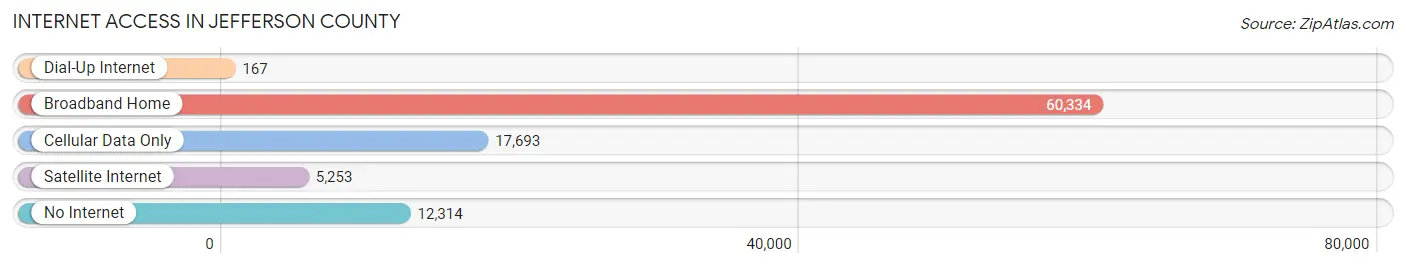
| Internet Type | # Households | % Households |
| Dial-Up Internet | 167 | 0.2% |
| Broadband Home | 60,334 | 64.7% |
| Cellular Data Only | 17,693 | 19.0% |
| Satellite Internet | 5,253 | 5.6% |
| No Internet | 12,314 | 13.2% |
| Total | 93,193 | 100.0% |
Jefferson County Summary
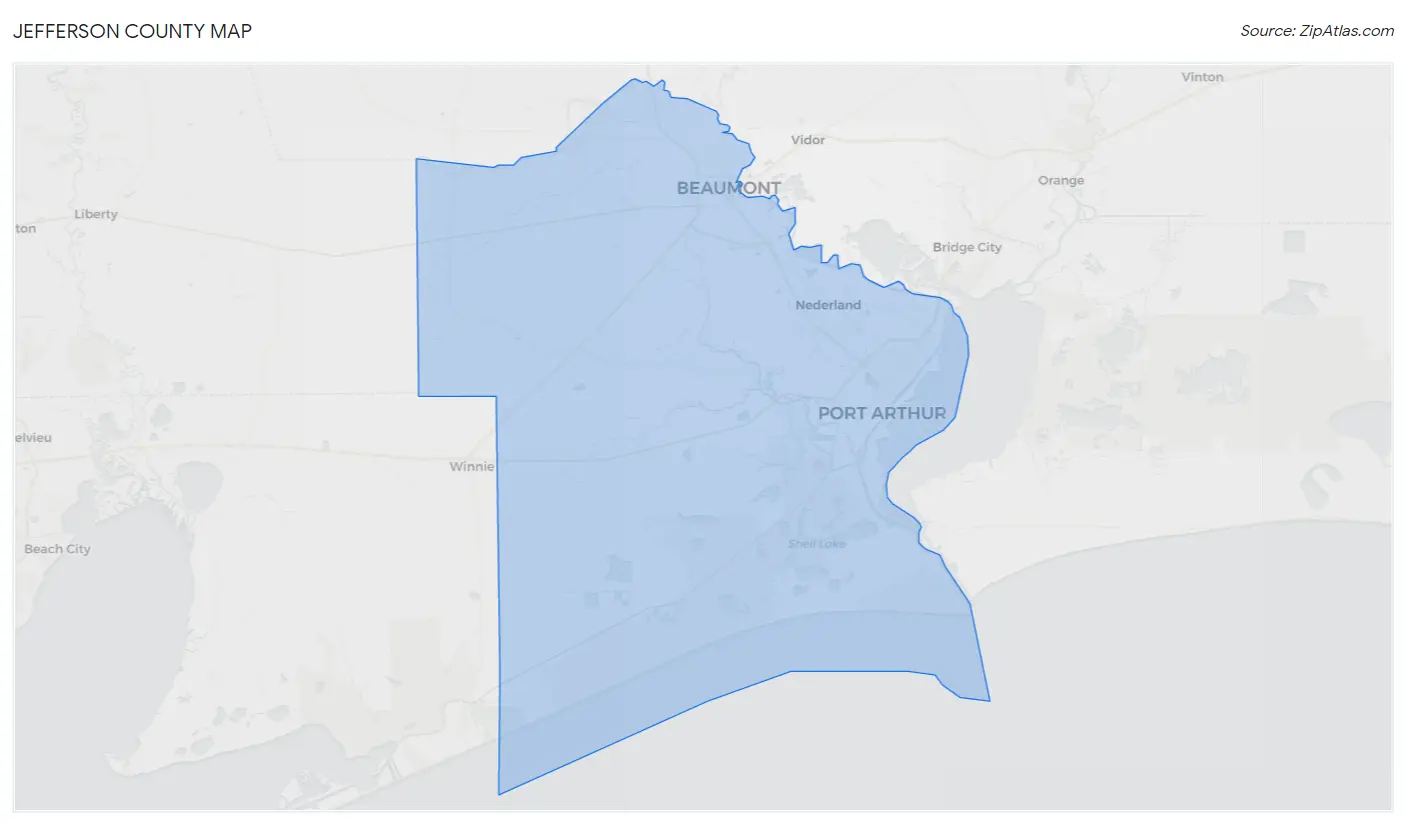
Jefferson County is located in the southeastern corner of Texas, and is bordered by Orange County to the north, Hardin County to the east, Chambers County to the south, and Galveston County to the west. The county seat is Beaumont, and the county is part of the Beaumont-Port Arthur Metropolitan Statistical Area. As of the 2010 census, the population of Jefferson County was 252,273.
History
Jefferson County was established in 1835, and was named for Thomas Jefferson, the third President of the United States. The county was originally part of the Mexican state of Coahuila y Tejas, and was part of the Republic of Texas after it declared independence from Mexico in 1836.
In the early 1900s, Jefferson County was a major center of the lumber industry, and the city of Beaumont was a major port for the shipment of lumber. The county was also a major center of the oil industry, and the discovery of oil in 1901 led to a boom in the local economy.
Geography
Jefferson County covers an area of 1,113 square miles, and is located in the southeastern corner of Texas. The county is bordered by Orange County to the north, Hardin County to the east, Chambers County to the south, and Galveston County to the west. The county is part of the Gulf Coastal Plains region, and is mostly flat with some rolling hills. The Sabine River forms the eastern border of the county, and the Neches River forms the western border.
The county is home to several state parks, including Big Thicket National Preserve, Sea Rim State Park, and Village Creek State Park.
Economy
Jefferson County has a diverse economy, with major industries including oil and gas, manufacturing, healthcare, and tourism. The county is home to several major oil and gas companies, including ExxonMobil, Chevron, and Shell. The county is also home to several major manufacturing companies, including BASF, DuPont, and Dow Chemical.
The county is home to several major healthcare providers, including Christus Southeast Texas Health System, Baptist Hospitals of Southeast Texas, and St. Elizabeth Hospital.
Tourism is also an important part of the local economy, with attractions including the Big Thicket National Preserve, the Spindletop-Gladys City Boomtown Museum, and the Beaumont Botanical Gardens.
Demographics
As of the 2010 census, the population of Jefferson County was 252,273. The racial makeup of the county was 68.3% White, 24.3% Black or African American, 0.7% Native American, 2.2% Asian, 0.1% Pacific Islander, 2.3% from other races, and 2.2% from two or more races. Hispanic or Latino of any race were 8.3% of the population.
The median household income in the county was $45,945, and the median family income was $54,945. The per capita income was $23,945. About 17.3% of the population was below the poverty line.
Common Questions
What is Per Capita Income in Jefferson County?
Per Capita income in Jefferson County is $30,770.
What is the Median Family Income in Jefferson County?
Median Family Income in Jefferson County is $70,812.
What is the Median Household income in Jefferson County?
Median Household Income in Jefferson County is $57,294.
What is Income or Wage Gap in Jefferson County?
Income or Wage Gap in Jefferson County is 34.7%.
Women in Jefferson County earn 65.3 cents for every dollar earned by a man.
What is Family Income Deficit in Jefferson County?
Family Income Deficit in Jefferson County is $12,206.
Families that are below poverty line in Jefferson County earn $12,206 less on average than the poverty threshold level.
What is Inequality or Gini Index in Jefferson County?
Inequality or Gini Index in Jefferson County is 0.48.
What is the Total Population of Jefferson County?
Total Population of Jefferson County is 254,942.
What is the Total Male Population of Jefferson County?
Total Male Population of Jefferson County is 131,138.
What is the Total Female Population of Jefferson County?
Total Female Population of Jefferson County is 123,804.
What is the Ratio of Males per 100 Females in Jefferson County?
There are 105.92 Males per 100 Females in Jefferson County.
What is the Ratio of Females per 100 Males in Jefferson County?
There are 94.41 Females per 100 Males in Jefferson County.
What is the Median Population Age in Jefferson County?
Median Population Age in Jefferson County is 36.8 Years.
What is the Average Family Size in Jefferson County
Average Family Size in Jefferson County is 3.2 People.
What is the Average Household Size in Jefferson County
Average Household Size in Jefferson County is 2.6 People.
How Large is the Labor Force in Jefferson County?
There are 110,827 People in the Labor Forcein in Jefferson County.
What is the Percentage of People in the Labor Force in Jefferson County?
55.7% of People are in the Labor Force in Jefferson County.
What is the Unemployment Rate in Jefferson County?
Unemployment Rate in Jefferson County is 5.4%.