Dallas County, TX Map & Demographics
Dallas County Map
Dallas County Overview
$39,172
PER CAPITA INCOME
$80,917
AVG FAMILY INCOME
$70,732
AVG HOUSEHOLD INCOME
23.3%
WAGE / INCOME GAP [ % ]
76.7¢/ $1
WAGE / INCOME GAP [ $ ]
$11,312
FAMILY INCOME DEFICIT
0.49
INEQUALITY / GINI INDEX
2,604,053
TOTAL POPULATION
1,294,332
MALE POPULATION
1,309,721
FEMALE POPULATION
98.83
MALES / 100 FEMALES
101.19
FEMALES / 100 MALES
33.8
MEDIAN AGE
3.4
AVG FAMILY SIZE
2.7
AVG HOUSEHOLD SIZE
1,389,858
LABOR FORCE [ PEOPLE ]
69.0%
PERCENT IN LABOR FORCE
4.9%
UNEMPLOYMENT RATE
Income in Dallas County
Income Overview in Dallas County
Per Capita Income in Dallas County is $39,172, while median incomes of families and households are $80,917 and $70,732 respectively.
| Characteristic | Number | Measure |
| Per Capita Income | 2,604,053 | $39,172 |
| Median Family Income | 606,006 | $80,917 |
| Mean Family Income | 606,006 | $119,046 |
| Median Household Income | 959,184 | $70,732 |
| Mean Household Income | 959,184 | $104,220 |
| Income Deficit | 606,006 | $11,312 |
| Wage / Income Gap (%) | 2,604,053 | 23.29% |
| Wage / Income Gap ($) | 2,604,053 | 76.71¢ per $1 |
| Gini / Inequality Index | 2,604,053 | 0.49 |
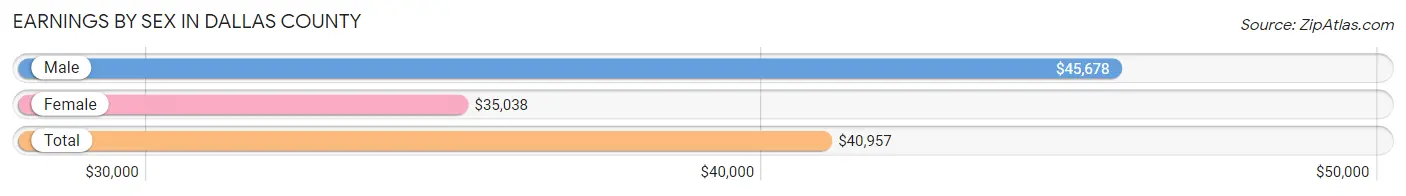
Earnings by Sex in Dallas County
Average Earnings in Dallas County are $40,957, $45,678 for men and $35,038 for women, a difference of 23.3%.
| Sex | Number | Average Earnings |
| Male | 770,458 (53.9%) | $45,678 |
| Female | 658,080 (46.1%) | $35,038 |
| Total | 1,428,538 (100.0%) | $40,957 |
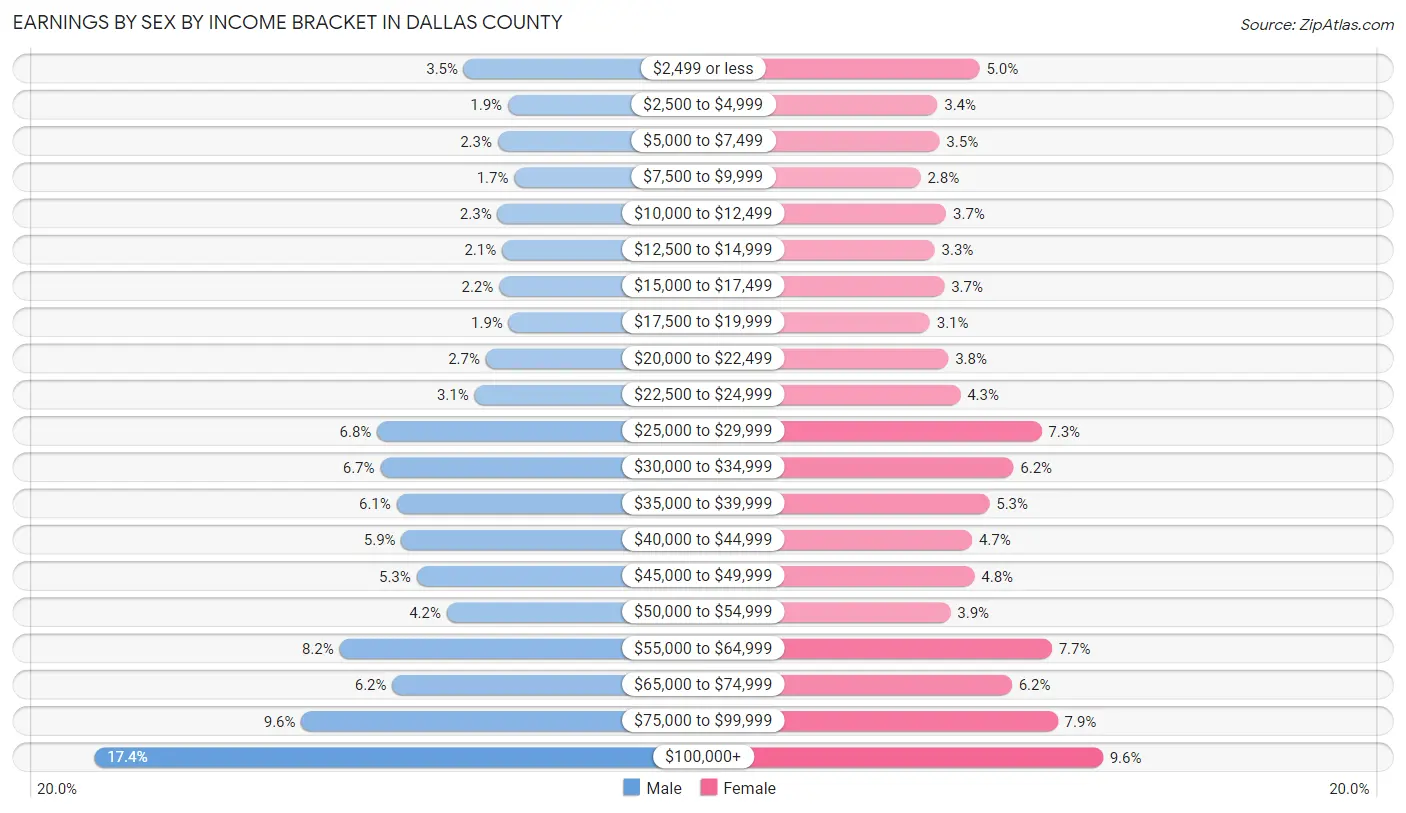
Earnings by Sex by Income Bracket in Dallas County
The most common earnings brackets in Dallas County are $100,000+ for men (134,011 | 17.4%) and $100,000+ for women (63,134 | 9.6%).
| Income | Male | Female |
| $2,499 or less | 27,248 (3.5%) | 32,710 (5.0%) |
| $2,500 to $4,999 | 14,565 (1.9%) | 22,322 (3.4%) |
| $5,000 to $7,499 | 17,462 (2.3%) | 22,864 (3.5%) |
| $7,500 to $9,999 | 12,715 (1.7%) | 18,189 (2.8%) |
| $10,000 to $12,499 | 17,539 (2.3%) | 24,502 (3.7%) |
| $12,500 to $14,999 | 16,291 (2.1%) | 21,664 (3.3%) |
| $15,000 to $17,499 | 17,081 (2.2%) | 24,022 (3.6%) |
| $17,500 to $19,999 | 14,293 (1.9%) | 20,488 (3.1%) |
| $20,000 to $22,499 | 20,987 (2.7%) | 25,017 (3.8%) |
| $22,500 to $24,999 | 24,215 (3.1%) | 27,944 (4.3%) |
| $25,000 to $29,999 | 52,279 (6.8%) | 47,962 (7.3%) |
| $30,000 to $34,999 | 51,407 (6.7%) | 41,052 (6.2%) |
| $35,000 to $39,999 | 46,661 (6.1%) | 35,139 (5.3%) |
| $40,000 to $44,999 | 45,332 (5.9%) | 30,872 (4.7%) |
| $45,000 to $49,999 | 40,916 (5.3%) | 31,438 (4.8%) |
| $50,000 to $54,999 | 32,225 (4.2%) | 25,538 (3.9%) |
| $55,000 to $64,999 | 63,152 (8.2%) | 50,552 (7.7%) |
| $65,000 to $74,999 | 47,921 (6.2%) | 40,667 (6.2%) |
| $75,000 to $99,999 | 74,158 (9.6%) | 52,004 (7.9%) |
| $100,000+ | 134,011 (17.4%) | 63,134 (9.6%) |
| Total | 770,458 (100.0%) | 658,080 (100.0%) |
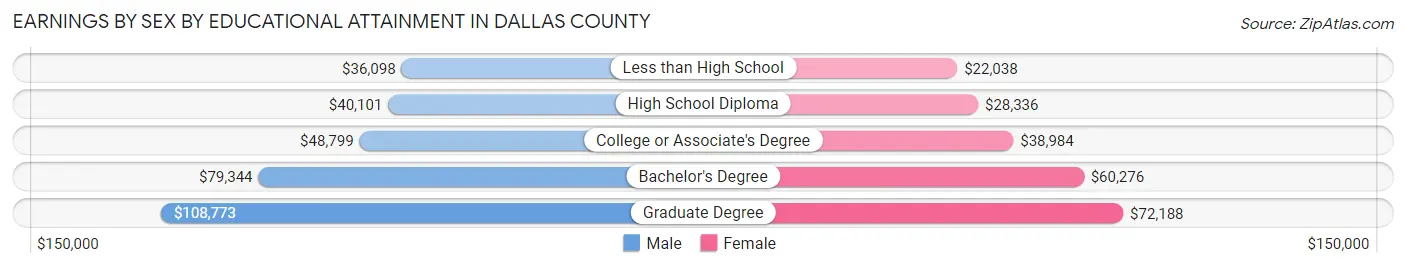
Earnings by Sex by Educational Attainment in Dallas County
Average earnings in Dallas County are $51,147 for men and $40,567 for women, a difference of 20.7%. Men with an educational attainment of graduate degree enjoy the highest average annual earnings of $108,773, while those with less than high school education earn the least with $36,098. Women with an educational attainment of graduate degree earn the most with the average annual earnings of $72,188, while those with less than high school education have the smallest earnings of $22,038.
| Educational Attainment | Male Income | Female Income |
| Less than High School | $36,098 | $22,038 |
| High School Diploma | $40,101 | $28,336 |
| College or Associate's Degree | $48,799 | $38,984 |
| Bachelor's Degree | $79,344 | $60,276 |
| Graduate Degree | $108,773 | $72,188 |
| Total | $51,147 | $40,567 |
Family Income in Dallas County
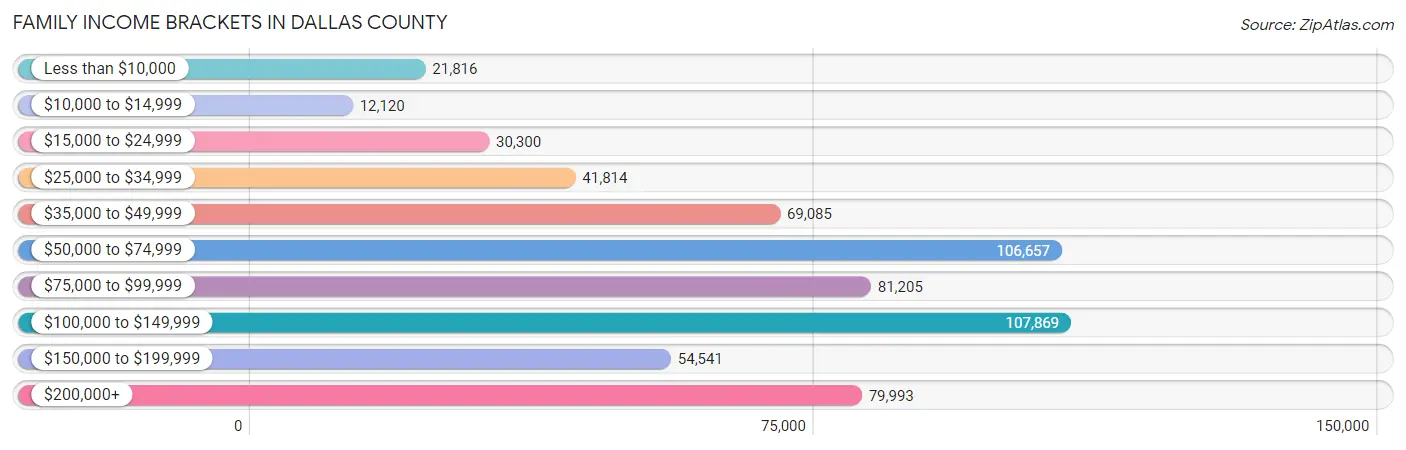
Family Income Brackets in Dallas County
According to the Dallas County family income data, there are 107,869 families falling into the $100,000 to $149,999 income range, which is the most common income bracket and makes up 17.8% of all families. Conversely, the $10,000 to $14,999 income bracket is the least frequent group with only 12,120 families (2.0%) belonging to this category.
| Income Bracket | # Families | % Families |
| Less than $10,000 | 21,816 | 3.6% |
| $10,000 to $14,999 | 12,120 | 2.0% |
| $15,000 to $24,999 | 30,300 | 5.0% |
| $25,000 to $34,999 | 41,814 | 6.9% |
| $35,000 to $49,999 | 69,085 | 11.4% |
| $50,000 to $74,999 | 106,657 | 17.6% |
| $75,000 to $99,999 | 81,205 | 13.4% |
| $100,000 to $149,999 | 107,869 | 17.8% |
| $150,000 to $199,999 | 54,541 | 9.0% |
| $200,000+ | 79,993 | 13.2% |
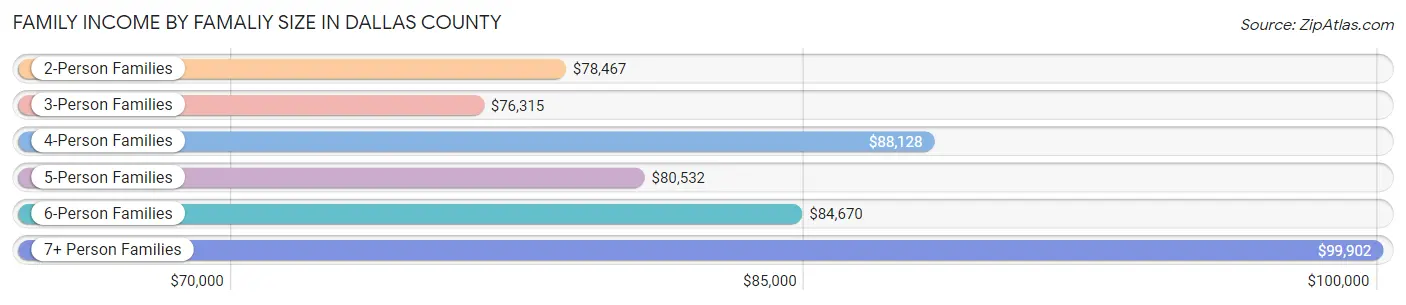
Family Income by Famaliy Size in Dallas County
7+ person families (16,353 | 2.7%) account for the highest median family income in Dallas County with $99,902 per family, while 2-person families (242,868 | 40.1%) have the highest median income of $39,234 per family member.
| Income Bracket | # Families | Median Income |
| 2-Person Families | 242,868 (40.1%) | $78,467 |
| 3-Person Families | 136,488 (22.5%) | $76,315 |
| 4-Person Families | 116,740 (19.3%) | $88,128 |
| 5-Person Families | 67,080 (11.1%) | $80,532 |
| 6-Person Families | 26,477 (4.4%) | $84,670 |
| 7+ Person Families | 16,353 (2.7%) | $99,902 |
| Total | 606,006 (100.0%) | $80,917 |
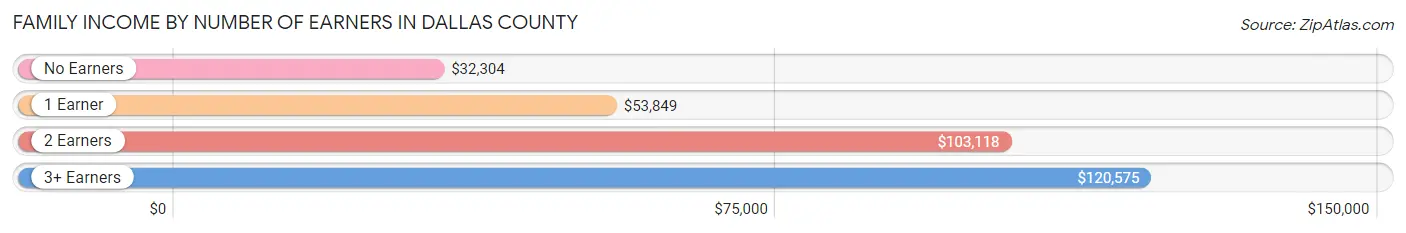
Family Income by Number of Earners in Dallas County
The median family income in Dallas County is $80,917, with families comprising 3+ earners (85,358) having the highest median family income of $120,575, while families with no earners (56,212) have the lowest median family income of $32,304, accounting for 14.1% and 9.3% of families, respectively.
| Number of Earners | # Families | Median Income |
| No Earners | 56,212 (9.3%) | $32,304 |
| 1 Earner | 207,269 (34.2%) | $53,849 |
| 2 Earners | 257,167 (42.4%) | $103,118 |
| 3+ Earners | 85,358 (14.1%) | $120,575 |
| Total | 606,006 (100.0%) | $80,917 |
Household Income in Dallas County
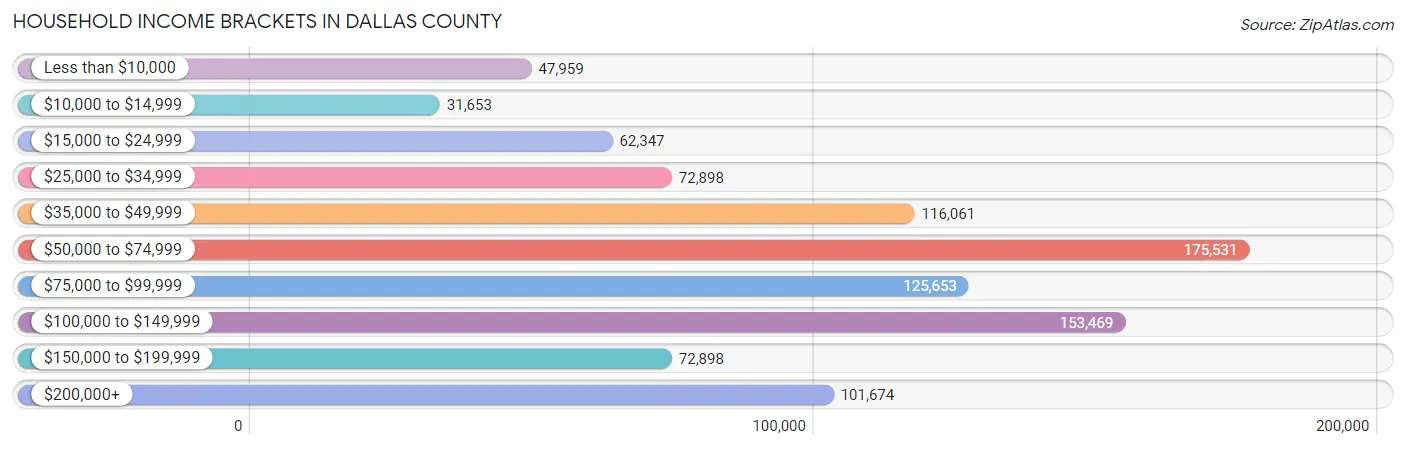
Household Income Brackets in Dallas County
With 175,531 households falling in the category, the $50,000 to $74,999 income range is the most frequent in Dallas County, accounting for 18.3% of all households. In contrast, only 31,653 households (3.3%) fall into the $10,000 to $14,999 income bracket, making it the least populous group.
| Income Bracket | # Households | % Households |
| Less than $10,000 | 47,959 | 5.0% |
| $10,000 to $14,999 | 31,653 | 3.3% |
| $15,000 to $24,999 | 62,347 | 6.5% |
| $25,000 to $34,999 | 72,898 | 7.6% |
| $35,000 to $49,999 | 116,061 | 12.1% |
| $50,000 to $74,999 | 175,531 | 18.3% |
| $75,000 to $99,999 | 125,653 | 13.1% |
| $100,000 to $149,999 | 153,469 | 16.0% |
| $150,000 to $199,999 | 72,898 | 7.6% |
| $200,000+ | 101,674 | 10.6% |
Household Income by Householder Age in Dallas County
The median household income in Dallas County is $70,732, with the highest median household income of $80,741 found in the 45 to 64 years age bracket for the primary householder. A total of 342,907 households (35.7%) fall into this category. Meanwhile, the 15 to 24 years age bracket for the primary householder has the lowest median household income of $44,237, with 47,390 households (4.9%) in this group.

| Income Bracket | # Households | Median Income |
| 15 to 24 Years | 47,390 (4.9%) | $44,237 |
| 25 to 44 Years | 393,531 (41.0%) | $73,961 |
| 45 to 64 Years | 342,907 (35.7%) | $80,741 |
| 65+ Years | 175,356 (18.3%) | $53,394 |
| Total | 959,184 (100.0%) | $70,732 |
Poverty in Dallas County
Income Below Poverty by Sex and Age in Dallas County
With 12.4% poverty level for males and 15.5% for females among the residents of Dallas County, 5 year old males and 6 to 11 year old females are the most vulnerable to poverty, with 4,068 males (23.1%) and 24,326 females (22.5%) in their respective age groups living below the poverty level.
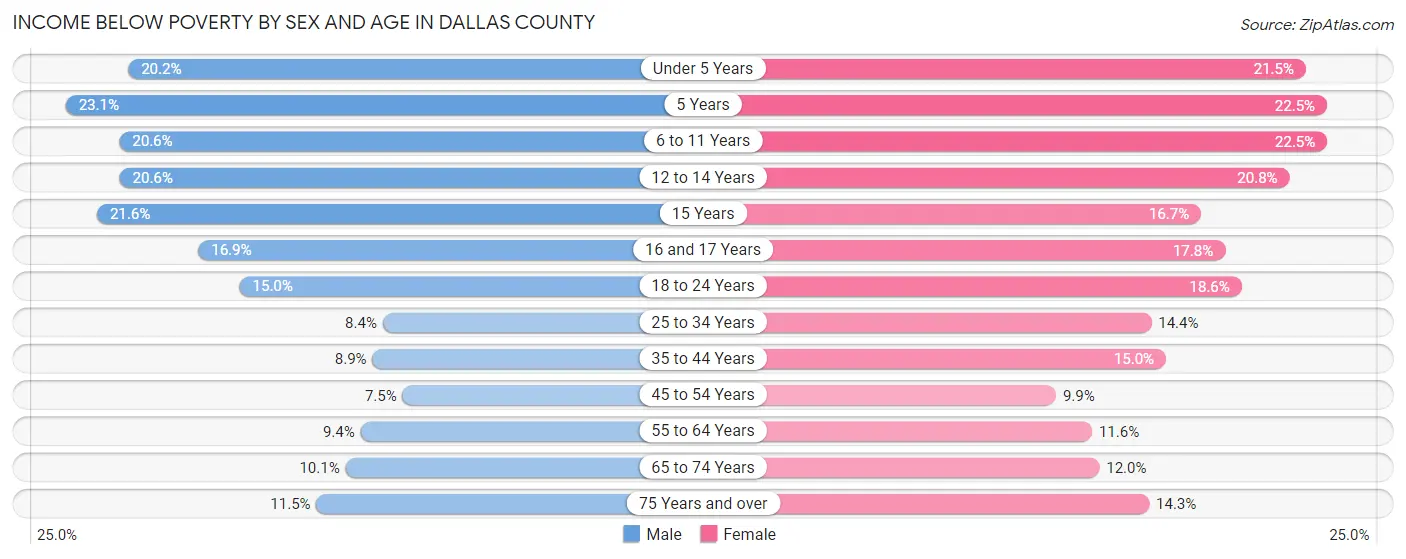
| Age Bracket | Male | Female |
| Under 5 Years | 18,591 (20.2%) | 18,913 (21.5%) |
| 5 Years | 4,068 (23.1%) | 4,123 (22.5%) |
| 6 to 11 Years | 22,941 (20.6%) | 24,326 (22.5%) |
| 12 to 14 Years | 12,128 (20.6%) | 11,236 (20.8%) |
| 15 Years | 3,849 (21.6%) | 2,945 (16.7%) |
| 16 and 17 Years | 6,546 (16.9%) | 6,569 (17.8%) |
| 18 to 24 Years | 18,890 (15.0%) | 22,803 (18.5%) |
| 25 to 34 Years | 17,854 (8.4%) | 30,321 (14.4%) |
| 35 to 44 Years | 15,804 (8.9%) | 26,672 (15.0%) |
| 45 to 54 Years | 11,755 (7.5%) | 15,898 (9.9%) |
| 55 to 64 Years | 13,203 (9.4%) | 16,676 (11.6%) |
| 65 to 74 Years | 8,261 (10.1%) | 11,512 (11.9%) |
| 75 Years and over | 4,863 (11.5%) | 9,135 (14.3%) |
| Total | 158,753 (12.4%) | 201,129 (15.5%) |
Income Above Poverty by Sex and Age in Dallas County
According to the poverty statistics in Dallas County, males aged 45 to 54 years and females aged 45 to 54 years are the age groups that are most secure financially, with 92.5% of males and 90.1% of females in these age groups living above the poverty line.
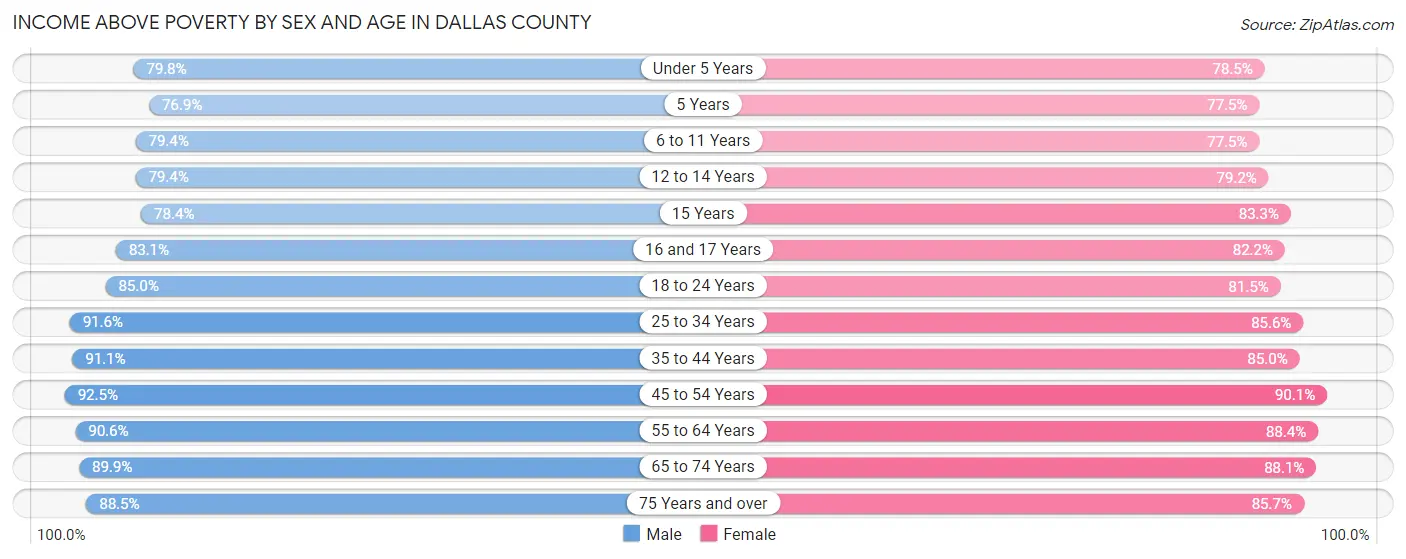
| Age Bracket | Male | Female |
| Under 5 Years | 73,490 (79.8%) | 68,942 (78.5%) |
| 5 Years | 13,549 (76.9%) | 14,190 (77.5%) |
| 6 to 11 Years | 88,421 (79.4%) | 83,710 (77.5%) |
| 12 to 14 Years | 46,771 (79.4%) | 42,864 (79.2%) |
| 15 Years | 13,937 (78.4%) | 14,725 (83.3%) |
| 16 and 17 Years | 32,096 (83.1%) | 30,383 (82.2%) |
| 18 to 24 Years | 106,880 (85.0%) | 100,111 (81.5%) |
| 25 to 34 Years | 195,121 (91.6%) | 180,841 (85.6%) |
| 35 to 44 Years | 162,509 (91.1%) | 150,667 (85.0%) |
| 45 to 54 Years | 145,815 (92.5%) | 144,083 (90.1%) |
| 55 to 64 Years | 127,118 (90.6%) | 126,920 (88.4%) |
| 65 to 74 Years | 73,465 (89.9%) | 84,829 (88.0%) |
| 75 Years and over | 37,569 (88.5%) | 54,911 (85.7%) |
| Total | 1,116,741 (87.5%) | 1,097,176 (84.5%) |
Income Below Poverty Among Married-Couple Families in Dallas County
The poverty statistics for married-couple families in Dallas County show that 6.1% or 24,934 of the total 409,484 families live below the poverty line. Families with 5 or more children have the highest poverty rate of 23.7%, comprising of 697 families. On the other hand, families with no children have the lowest poverty rate of 3.7%, which includes 7,765 families.
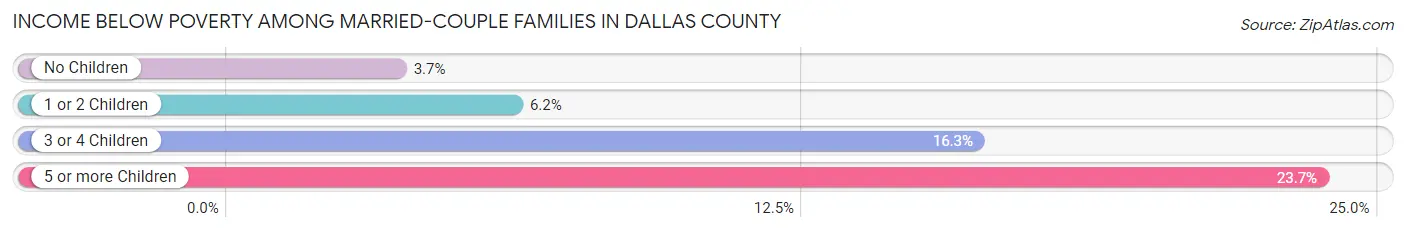
| Children | Above Poverty | Below Poverty |
| No Children | 204,035 (96.3%) | 7,765 (3.7%) |
| 1 or 2 Children | 141,626 (93.8%) | 9,361 (6.2%) |
| 3 or 4 Children | 36,650 (83.8%) | 7,111 (16.3%) |
| 5 or more Children | 2,239 (76.3%) | 697 (23.7%) |
| Total | 384,550 (93.9%) | 24,934 (6.1%) |
Income Below Poverty Among Single-Parent Households in Dallas County
According to the poverty data in Dallas County, 11.6% or 6,316 single-father households and 24.4% or 34,587 single-mother households are living below the poverty line. Among single-father households, those with 5 or more children have the highest poverty rate, with 158 households (47.6%) experiencing poverty. Likewise, among single-mother households, those with 5 or more children have the highest poverty rate, with 1,600 households (83.7%) falling below the poverty line.
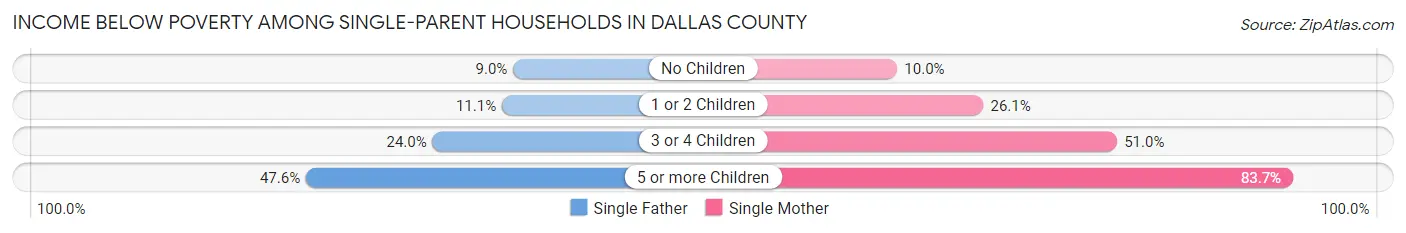
| Children | Single Father | Single Mother |
| No Children | 2,326 (9.0%) | 5,136 (10.0%) |
| 1 or 2 Children | 2,564 (11.1%) | 18,167 (26.1%) |
| 3 or 4 Children | 1,268 (24.0%) | 9,684 (51.0%) |
| 5 or more Children | 158 (47.6%) | 1,600 (83.7%) |
| Total | 6,316 (11.6%) | 34,587 (24.4%) |
Income Below Poverty Among Married-Couple vs Single-Parent Households in Dallas County
The poverty data for Dallas County shows that 24,934 of the married-couple family households (6.1%) and 40,903 of the single-parent households (20.8%) are living below the poverty level. Within the married-couple family households, those with 5 or more children have the highest poverty rate, with 697 households (23.7%) falling below the poverty line. Among the single-parent households, those with 5 or more children have the highest poverty rate, with 1,758 household (78.3%) living below poverty.
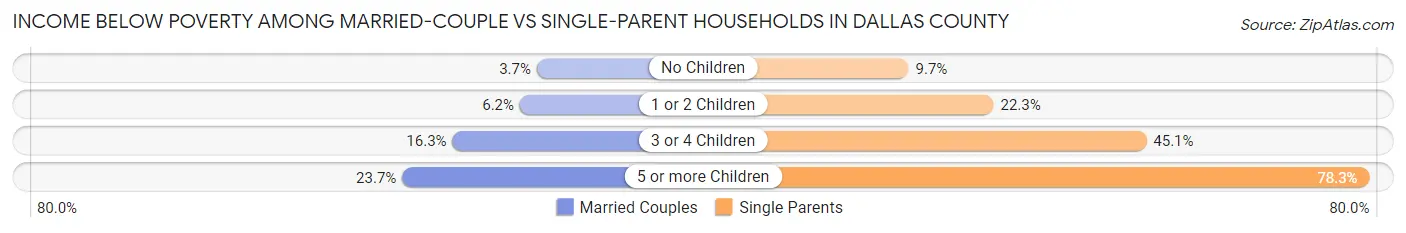
| Children | Married-Couple Families | Single-Parent Households |
| No Children | 7,765 (3.7%) | 7,462 (9.7%) |
| 1 or 2 Children | 9,361 (6.2%) | 20,731 (22.3%) |
| 3 or 4 Children | 7,111 (16.3%) | 10,952 (45.1%) |
| 5 or more Children | 697 (23.7%) | 1,758 (78.3%) |
| Total | 24,934 (6.1%) | 40,903 (20.8%) |
Race in Dallas County
The most populous races in Dallas County are White / Caucasian (1,208,531 | 46.4%), Hispanic or Latino (1,066,429 | 40.9%), and Black / African American (585,997 | 22.5%).
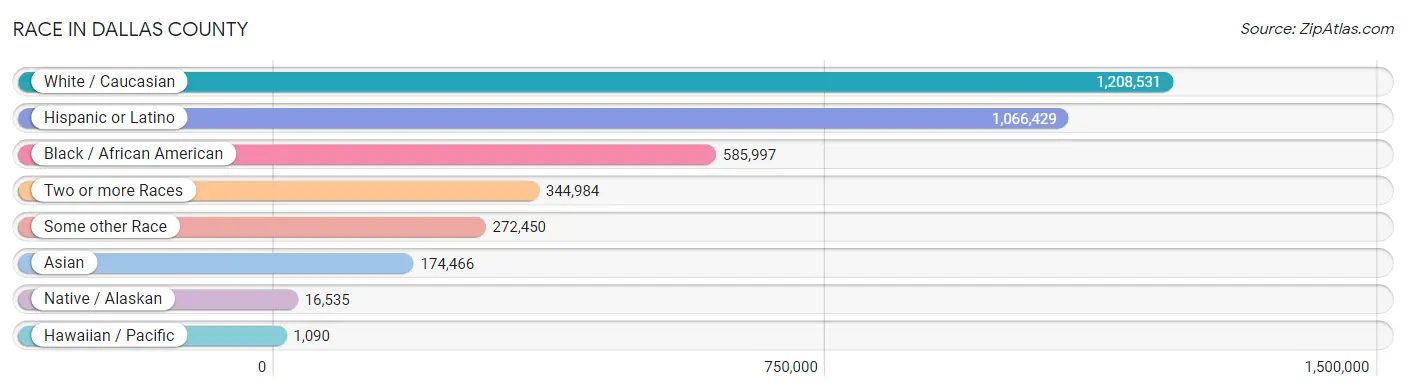
| Race | # Population | % Population |
| Asian | 174,466 | 6.7% |
| Black / African American | 585,997 | 22.5% |
| Hawaiian / Pacific | 1,090 | 0.0% |
| Hispanic or Latino | 1,066,429 | 40.9% |
| Native / Alaskan | 16,535 | 0.6% |
| White / Caucasian | 1,208,531 | 46.4% |
| Two or more Races | 344,984 | 13.3% |
| Some other Race | 272,450 | 10.5% |
| Total | 2,604,053 | 100.0% |
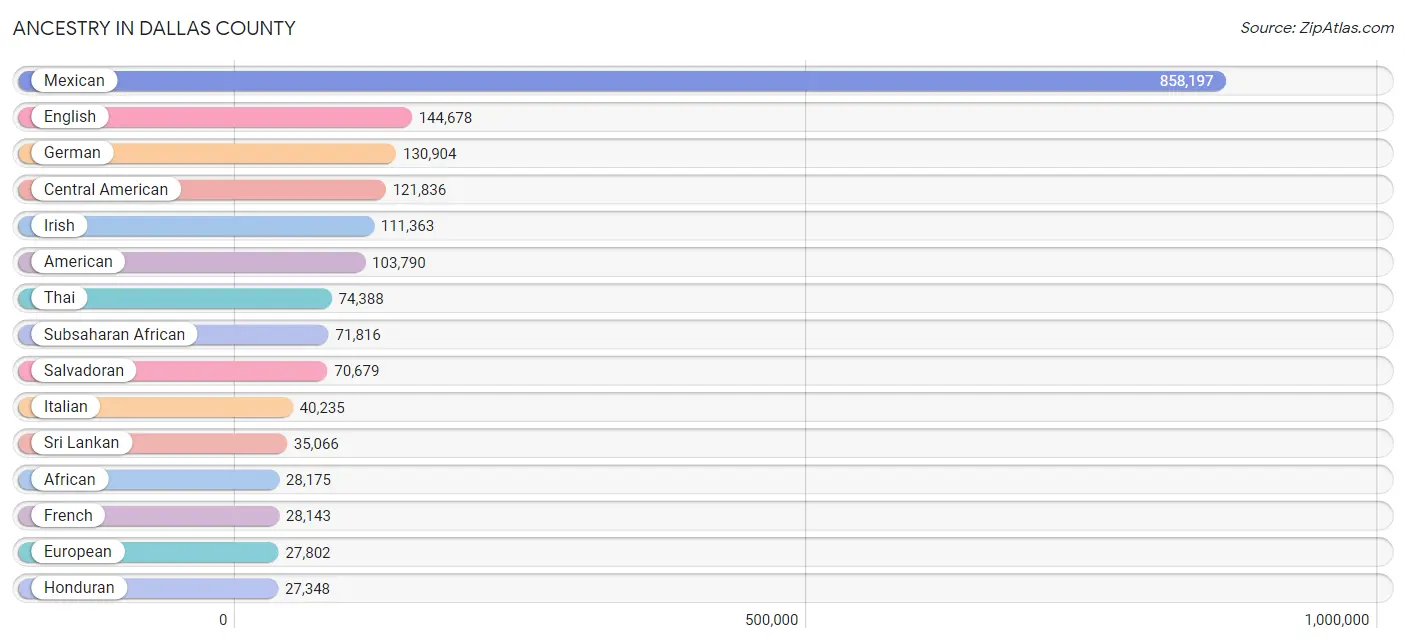
Ancestry in Dallas County
The most populous ancestries reported in Dallas County are Mexican (858,197 | 33.0%), English (144,678 | 5.6%), German (130,904 | 5.0%), Central American (121,836 | 4.7%), and Irish (111,363 | 4.3%), together accounting for 52.5% of all Dallas County residents.
| Ancestry | # Population | % Population |
| Afghan | 1,155 | 0.0% |
| African | 28,175 | 1.1% |
| Alaska Native | 49 | 0.0% |
| Albanian | 587 | 0.0% |
| Alsatian | 37 | 0.0% |
| American | 103,790 | 4.0% |
| Apache | 1,445 | 0.1% |
| Arab | 13,603 | 0.5% |
| Arapaho | 41 | 0.0% |
| Argentinean | 2,968 | 0.1% |
| Armenian | 645 | 0.0% |
| Assyrian / Chaldean / Syriac | 78 | 0.0% |
| Australian | 497 | 0.0% |
| Austrian | 2,243 | 0.1% |
| Bahamian | 75 | 0.0% |
| Bangladeshi | 240 | 0.0% |
| Barbadian | 351 | 0.0% |
| Basque | 364 | 0.0% |
| Belgian | 1,183 | 0.1% |
| Belizean | 374 | 0.0% |
| Bermudan | 15 | 0.0% |
| Bhutanese | 5,990 | 0.2% |
| Blackfeet | 877 | 0.0% |
| Bolivian | 729 | 0.0% |
| Brazilian | 2,290 | 0.1% |
| British | 11,055 | 0.4% |
| British West Indian | 332 | 0.0% |
| Bulgarian | 790 | 0.0% |
| Burmese | 10,340 | 0.4% |
| Cajun | 539 | 0.0% |
| Cambodian | 161 | 0.0% |
| Canadian | 2,148 | 0.1% |
| Cape Verdean | 73 | 0.0% |
| Celtic | 231 | 0.0% |
| Central American | 121,836 | 4.7% |
| Central American Indian | 3,153 | 0.1% |
| Cherokee | 6,259 | 0.2% |
| Cheyenne | 21 | 0.0% |
| Chickasaw | 928 | 0.0% |
| Chilean | 861 | 0.0% |
| Chinese | 59 | 0.0% |
| Chippewa | 195 | 0.0% |
| Choctaw | 3,227 | 0.1% |
| Colombian | 6,160 | 0.2% |
| Comanche | 513 | 0.0% |
| Costa Rican | 877 | 0.0% |
| Creek | 503 | 0.0% |
| Croatian | 821 | 0.0% |
| Cuban | 9,830 | 0.4% |
| Cypriot | 22 | 0.0% |
| Czech | 8,877 | 0.3% |
| Czechoslovakian | 1,213 | 0.1% |
| Danish | 3,245 | 0.1% |
| Delaware | 18 | 0.0% |
| Dominican | 2,315 | 0.1% |
| Dutch | 9,801 | 0.4% |
| Dutch West Indian | 160 | 0.0% |
| Eastern European | 3,488 | 0.1% |
| Ecuadorian | 2,013 | 0.1% |
| Egyptian | 1,376 | 0.1% |
| English | 144,678 | 5.6% |
| Estonian | 71 | 0.0% |
| Ethiopian | 13,397 | 0.5% |
| European | 27,802 | 1.1% |
| Fijian | 36 | 0.0% |
| Filipino | 1,577 | 0.1% |
| Finnish | 1,346 | 0.1% |
| French | 28,143 | 1.1% |
| French American Indian | 252 | 0.0% |
| French Canadian | 3,568 | 0.1% |
| German | 130,904 | 5.0% |
| German Russian | 93 | 0.0% |
| Ghanaian | 1,233 | 0.1% |
| Greek | 3,469 | 0.1% |
| Guamanian / Chamorro | 1,009 | 0.0% |
| Guatemalan | 17,515 | 0.7% |
| Guyanese | 218 | 0.0% |
| Haitian | 1,212 | 0.1% |
| Honduran | 27,348 | 1.1% |
| Hopi | 55 | 0.0% |
| Houma | 15 | 0.0% |
| Hungarian | 2,633 | 0.1% |
| Icelander | 168 | 0.0% |
| Indian (Asian) | 20,560 | 0.8% |
| Indonesian | 4,281 | 0.2% |
| Inupiat | 46 | 0.0% |
| Iranian | 3,545 | 0.1% |
| Iraqi | 1,642 | 0.1% |
| Irish | 111,363 | 4.3% |
| Iroquois | 142 | 0.0% |
| Israeli | 588 | 0.0% |
| Italian | 40,235 | 1.5% |
| Jamaican | 3,333 | 0.1% |
| Japanese | 2,473 | 0.1% |
| Jordanian | 946 | 0.0% |
| Kenyan | 3,652 | 0.1% |
| Kiowa | 19 | 0.0% |
| Korean | 16,031 | 0.6% |
| Laotian | 433 | 0.0% |
| Latvian | 162 | 0.0% |
| Lebanese | 3,300 | 0.1% |
| Liberian | 1,867 | 0.1% |
| Lithuanian | 1,457 | 0.1% |
| Lumbee | 57 | 0.0% |
| Luxembourger | 113 | 0.0% |
| Macedonian | 130 | 0.0% |
| Malaysian | 2,304 | 0.1% |
| Maltese | 96 | 0.0% |
| Menominee | 6 | 0.0% |
| Mexican | 858,197 | 33.0% |
| Mexican American Indian | 8,636 | 0.3% |
| Mongolian | 295 | 0.0% |
| Moroccan | 812 | 0.0% |
| Native Hawaiian | 1,316 | 0.1% |
| Navajo | 814 | 0.0% |
| New Zealander | 215 | 0.0% |
| Nicaraguan | 3,143 | 0.1% |
| Nigerian | 15,164 | 0.6% |
| Northern European | 4,043 | 0.2% |
| Norwegian | 8,909 | 0.3% |
| Okinawan | 78 | 0.0% |
| Osage | 138 | 0.0% |
| Ottawa | 142 | 0.0% |
| Pakistani | 2,702 | 0.1% |
| Palestinian | 1,226 | 0.1% |
| Panamanian | 1,379 | 0.1% |
| Paraguayan | 257 | 0.0% |
| Pennsylvania German | 187 | 0.0% |
| Peruvian | 3,912 | 0.2% |
| Polish | 18,031 | 0.7% |
| Portuguese | 3,094 | 0.1% |
| Potawatomi | 69 | 0.0% |
| Pueblo | 232 | 0.0% |
| Puerto Rican | 14,587 | 0.6% |
| Romanian | 1,601 | 0.1% |
| Russian | 6,382 | 0.3% |
| Salvadoran | 70,679 | 2.7% |
| Samoan | 784 | 0.0% |
| Scandinavian | 3,023 | 0.1% |
| Scotch-Irish | 16,353 | 0.6% |
| Scottish | 26,506 | 1.0% |
| Seminole | 560 | 0.0% |
| Senegalese | 115 | 0.0% |
| Serbian | 332 | 0.0% |
| Shoshone | 94 | 0.0% |
| Sierra Leonean | 304 | 0.0% |
| Sioux | 311 | 0.0% |
| Slavic | 367 | 0.0% |
| Slovak | 843 | 0.0% |
| Slovene | 519 | 0.0% |
| Somali | 282 | 0.0% |
| South African | 813 | 0.0% |
| South American | 22,637 | 0.9% |
| South American Indian | 65 | 0.0% |
| Spaniard | 6,465 | 0.3% |
| Spanish | 3,185 | 0.1% |
| Spanish American | 126 | 0.0% |
| Spanish American Indian | 143 | 0.0% |
| Sri Lankan | 35,066 | 1.3% |
| Subsaharan African | 71,816 | 2.8% |
| Sudanese | 554 | 0.0% |
| Swedish | 9,906 | 0.4% |
| Swiss | 2,651 | 0.1% |
| Syrian | 941 | 0.0% |
| Taiwanese | 81 | 0.0% |
| Thai | 74,388 | 2.9% |
| Tohono O'Odham | 77 | 0.0% |
| Tongan | 195 | 0.0% |
| Trinidadian and Tobagonian | 1,169 | 0.0% |
| Turkish | 1,222 | 0.1% |
| U.S. Virgin Islander | 381 | 0.0% |
| Ugandan | 255 | 0.0% |
| Ukrainian | 2,309 | 0.1% |
| Uruguayan | 231 | 0.0% |
| Ute | 47 | 0.0% |
| Venezuelan | 5,396 | 0.2% |
| Vietnamese | 2,151 | 0.1% |
| Welsh | 7,422 | 0.3% |
| West Indian | 1,378 | 0.1% |
| Yakama | 3 | 0.0% |
| Yaqui | 52 | 0.0% |
| Yugoslavian | 1,166 | 0.0% |
| Zimbabwean | 274 | 0.0% | View All 183 Rows |
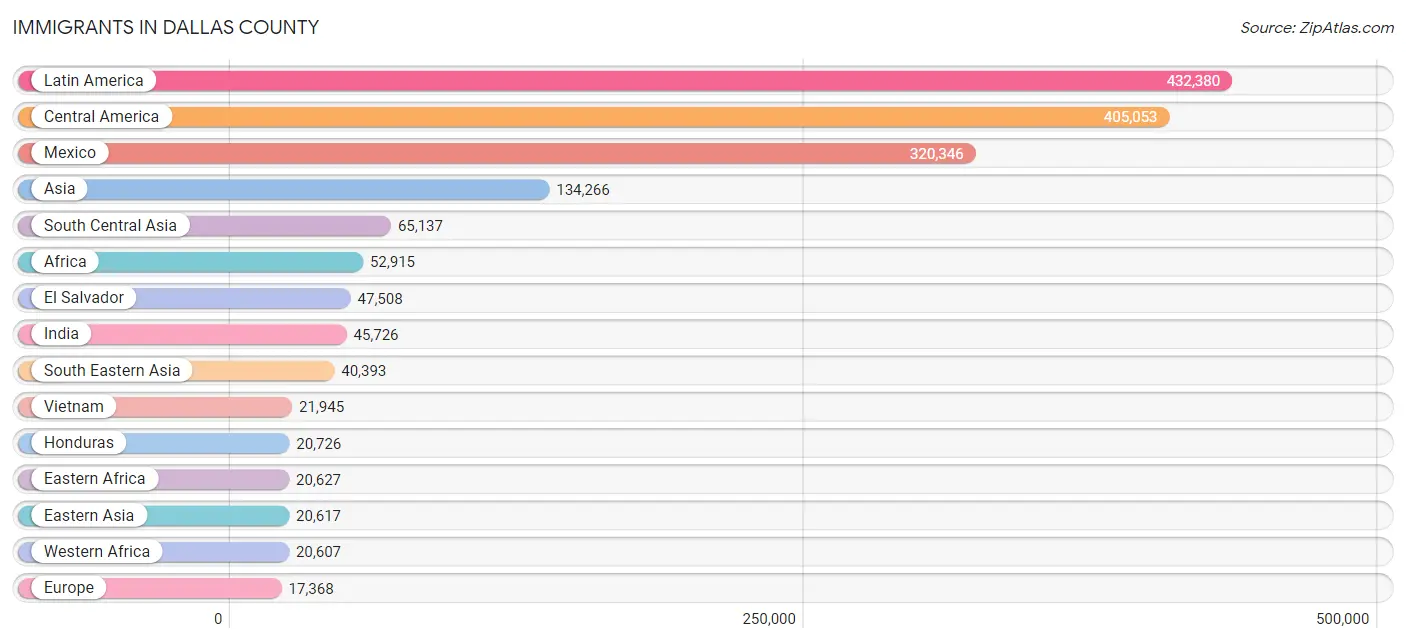
Immigrants in Dallas County
The most numerous immigrant groups reported in Dallas County came from Latin America (432,380 | 16.6%), Central America (405,053 | 15.5%), Mexico (320,346 | 12.3%), Asia (134,266 | 5.2%), and South Central Asia (65,137 | 2.5%), together accounting for 52.1% of all Dallas County residents.
| Immigration Origin | # Population | % Population |
| Afghanistan | 1,370 | 0.1% |
| Africa | 52,915 | 2.0% |
| Albania | 247 | 0.0% |
| Argentina | 1,624 | 0.1% |
| Armenia | 88 | 0.0% |
| Asia | 134,266 | 5.2% |
| Australia | 382 | 0.0% |
| Austria | 47 | 0.0% |
| Azores | 37 | 0.0% |
| Bahamas | 64 | 0.0% |
| Bangladesh | 2,856 | 0.1% |
| Barbados | 130 | 0.0% |
| Belarus | 81 | 0.0% |
| Belgium | 113 | 0.0% |
| Belize | 467 | 0.0% |
| Bolivia | 430 | 0.0% |
| Bosnia and Herzegovina | 956 | 0.0% |
| Brazil | 2,078 | 0.1% |
| Bulgaria | 553 | 0.0% |
| Cabo Verde | 35 | 0.0% |
| Cambodia | 1,192 | 0.1% |
| Cameroon | 2,517 | 0.1% |
| Canada | 3,816 | 0.2% |
| Caribbean | 10,075 | 0.4% |
| Central America | 405,053 | 15.5% |
| Chile | 581 | 0.0% |
| China | 11,969 | 0.5% |
| Colombia | 3,608 | 0.1% |
| Congo | 891 | 0.0% |
| Costa Rica | 470 | 0.0% |
| Croatia | 25 | 0.0% |
| Cuba | 5,486 | 0.2% |
| Czechoslovakia | 153 | 0.0% |
| Denmark | 93 | 0.0% |
| Dominica | 159 | 0.0% |
| Dominican Republic | 1,208 | 0.1% |
| Eastern Africa | 20,627 | 0.8% |
| Eastern Asia | 20,617 | 0.8% |
| Eastern Europe | 6,363 | 0.2% |
| Ecuador | 954 | 0.0% |
| Egypt | 835 | 0.0% |
| El Salvador | 47,508 | 1.8% |
| England | 1,488 | 0.1% |
| Eritrea | 2,105 | 0.1% |
| Ethiopia | 11,008 | 0.4% |
| Europe | 17,368 | 0.7% |
| Fiji | 139 | 0.0% |
| France | 1,424 | 0.1% |
| Germany | 1,698 | 0.1% |
| Ghana | 2,256 | 0.1% |
| Greece | 483 | 0.0% |
| Grenada | 38 | 0.0% |
| Guatemala | 12,434 | 0.5% |
| Guyana | 393 | 0.0% |
| Haiti | 394 | 0.0% |
| Honduras | 20,726 | 0.8% |
| Hong Kong | 735 | 0.0% |
| Hungary | 219 | 0.0% |
| India | 45,726 | 1.8% |
| Indonesia | 411 | 0.0% |
| Iran | 2,521 | 0.1% |
| Iraq | 2,059 | 0.1% |
| Ireland | 510 | 0.0% |
| Israel | 700 | 0.0% |
| Italy | 791 | 0.0% |
| Jamaica | 1,479 | 0.1% |
| Japan | 2,017 | 0.1% |
| Jordan | 926 | 0.0% |
| Kazakhstan | 108 | 0.0% |
| Kenya | 4,015 | 0.2% |
| Korea | 6,540 | 0.3% |
| Kuwait | 333 | 0.0% |
| Laos | 1,189 | 0.1% |
| Latin America | 432,380 | 16.6% |
| Latvia | 33 | 0.0% |
| Lebanon | 366 | 0.0% |
| Liberia | 1,341 | 0.1% |
| Lithuania | 58 | 0.0% |
| Malaysia | 949 | 0.0% |
| Mexico | 320,346 | 12.3% |
| Middle Africa | 5,096 | 0.2% |
| Moldova | 88 | 0.0% |
| Morocco | 548 | 0.0% |
| Nepal | 5,982 | 0.2% |
| Netherlands | 177 | 0.0% |
| Nicaragua | 2,312 | 0.1% |
| Nigeria | 14,277 | 0.5% |
| North Macedonia | 64 | 0.0% |
| Northern Africa | 2,453 | 0.1% |
| Northern Europe | 4,854 | 0.2% |
| Norway | 42 | 0.0% |
| Oceania | 857 | 0.0% |
| Pakistan | 5,601 | 0.2% |
| Panama | 721 | 0.0% |
| Peru | 2,454 | 0.1% |
| Philippines | 9,029 | 0.4% |
| Poland | 582 | 0.0% |
| Portugal | 237 | 0.0% |
| Romania | 686 | 0.0% |
| Russia | 1,405 | 0.1% |
| Saudi Arabia | 904 | 0.0% |
| Scotland | 379 | 0.0% |
| Senegal | 105 | 0.0% |
| Serbia | 109 | 0.0% |
| Sierra Leone | 398 | 0.0% |
| Singapore | 294 | 0.0% |
| Somalia | 305 | 0.0% |
| South Africa | 1,242 | 0.1% |
| South America | 17,252 | 0.7% |
| South Central Asia | 65,137 | 2.5% |
| South Eastern Asia | 40,393 | 1.5% |
| Southern Europe | 2,472 | 0.1% |
| Spain | 954 | 0.0% |
| Sri Lanka | 543 | 0.0% |
| St. Vincent and the Grenadines | 22 | 0.0% |
| Sudan | 765 | 0.0% |
| Sweden | 145 | 0.0% |
| Switzerland | 188 | 0.0% |
| Syria | 722 | 0.0% |
| Taiwan | 2,590 | 0.1% |
| Thailand | 2,442 | 0.1% |
| Trinidad and Tobago | 476 | 0.0% |
| Turkey | 626 | 0.0% |
| Uganda | 382 | 0.0% |
| Ukraine | 803 | 0.0% |
| Uruguay | 176 | 0.0% |
| Uzbekistan | 98 | 0.0% |
| Venezuela | 4,759 | 0.2% |
| Vietnam | 21,945 | 0.8% |
| West Indies | 125 | 0.0% |
| Western Africa | 20,607 | 0.8% |
| Western Asia | 7,476 | 0.3% |
| Western Europe | 3,647 | 0.1% |
| Yemen | 218 | 0.0% |
| Zaire | 1,137 | 0.0% |
| Zimbabwe | 837 | 0.0% | View All 136 Rows |
Sex and Age in Dallas County
Sex and Age in Dallas County
The most populous age groups in Dallas County are 25 to 29 Years (110,293 | 8.5%) for men and 25 to 29 Years (109,533 | 8.4%) for women.

| Age Bracket | Male | Female |
| Under 5 Years | 93,316 (7.2%) | 89,033 (6.8%) |
| 5 to 9 Years | 90,596 (7.0%) | 89,607 (6.8%) |
| 10 to 14 Years | 99,519 (7.7%) | 92,132 (7.0%) |
| 15 to 19 Years | 92,714 (7.2%) | 89,220 (6.8%) |
| 20 to 24 Years | 93,765 (7.2%) | 92,519 (7.1%) |
| 25 to 29 Years | 110,293 (8.5%) | 109,533 (8.4%) |
| 30 to 34 Years | 105,148 (8.1%) | 102,005 (7.8%) |
| 35 to 39 Years | 92,386 (7.1%) | 92,645 (7.1%) |
| 40 to 44 Years | 88,737 (6.9%) | 84,853 (6.5%) |
| 45 to 49 Years | 80,553 (6.2%) | 82,637 (6.3%) |
| 50 to 54 Years | 78,715 (6.1%) | 77,567 (5.9%) |
| 55 to 59 Years | 74,686 (5.8%) | 74,609 (5.7%) |
| 60 to 64 Years | 67,216 (5.2%) | 69,588 (5.3%) |
| 65 to 69 Years | 48,659 (3.8%) | 54,233 (4.1%) |
| 70 to 74 Years | 34,391 (2.7%) | 43,103 (3.3%) |
| 75 to 79 Years | 21,201 (1.6%) | 27,761 (2.1%) |
| 80 to 84 Years | 11,708 (0.9%) | 18,359 (1.4%) |
| 85 Years and over | 10,729 (0.8%) | 20,317 (1.5%) |
| Total | 1,294,332 (100.0%) | 1,309,721 (100.0%) |
Families and Households in Dallas County
Median Family Size in Dallas County
The median family size in Dallas County is 3.43 persons per family, with married-couple families (409,484 | 67.6%) accounting for the largest median family size of 3.49 persons per family. On the other hand, single male/father families (54,598 | 9.0%) represent the smallest median family size with 3.18 persons per family.
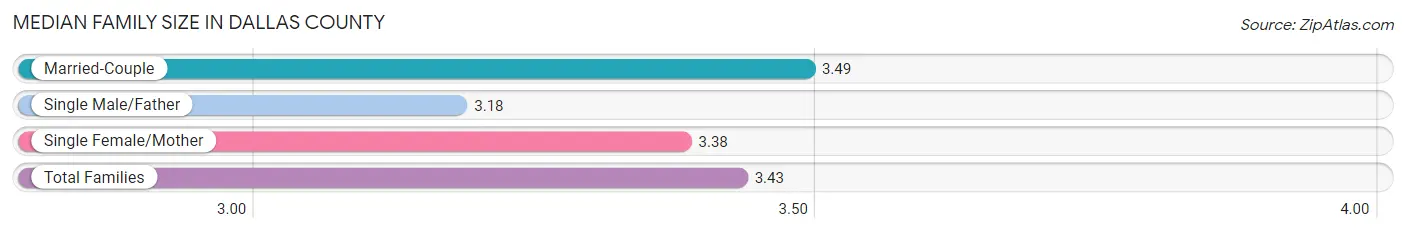
| Family Type | # Families | Family Size |
| Married-Couple | 409,484 (67.6%) | 3.49 |
| Single Male/Father | 54,598 (9.0%) | 3.18 |
| Single Female/Mother | 141,924 (23.4%) | 3.38 |
| Total Families | 606,006 (100.0%) | 3.43 |
Median Household Size in Dallas County
The median household size in Dallas County is 2.68 persons per household, with single female/mother households (141,924 | 14.8%) accounting for the largest median household size of 3.56 persons per household. non-family households (353,178 | 36.8%) represent the smallest median household size with 1.24 persons per household.
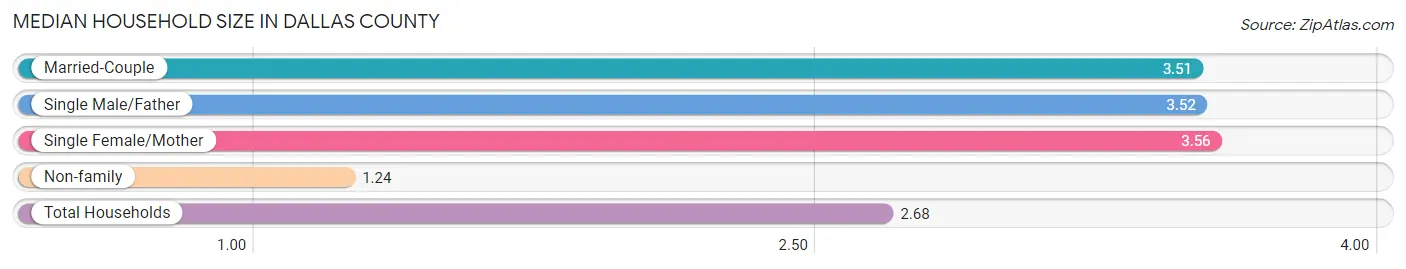
| Household Type | # Households | Household Size |
| Married-Couple | 409,484 (42.7%) | 3.51 |
| Single Male/Father | 54,598 (5.7%) | 3.52 |
| Single Female/Mother | 141,924 (14.8%) | 3.56 |
| Non-family | 353,178 (36.8%) | 1.24 |
| Total Households | 959,184 (100.0%) | 2.68 |
Household Size by Marriage Status in Dallas County
Out of a total of 959,184 households in Dallas County, 606,006 (63.2%) are family households, while 353,178 (36.8%) are nonfamily households. The most numerous type of family households are 2-person households, comprising 225,230, and the most common type of nonfamily households are 1-person households, comprising 288,520.

| Household Size | Family Households | Nonfamily Households |
| 1-Person Households | - | 288,520 (30.1%) |
| 2-Person Households | 225,230 (23.5%) | 55,718 (5.8%) |
| 3-Person Households | 140,007 (14.6%) | 5,832 (0.6%) |
| 4-Person Households | 121,367 (12.7%) | 2,258 (0.2%) |
| 5-Person Households | 71,914 (7.5%) | 569 (0.1%) |
| 6-Person Households | 28,836 (3.0%) | 227 (0.0%) |
| 7+ Person Households | 18,652 (1.9%) | 54 (0.0%) |
| Total | 606,006 (63.2%) | 353,178 (36.8%) |
Female Fertility in Dallas County
Fertility by Age in Dallas County
Average fertility rate in Dallas County is 57.0 births per 1,000 women. Women in the age bracket of 20 to 34 years have the highest fertility rate with 88.0 births per 1,000 women. Women in the age bracket of 20 to 34 years acount for 69.5% of all women with births.
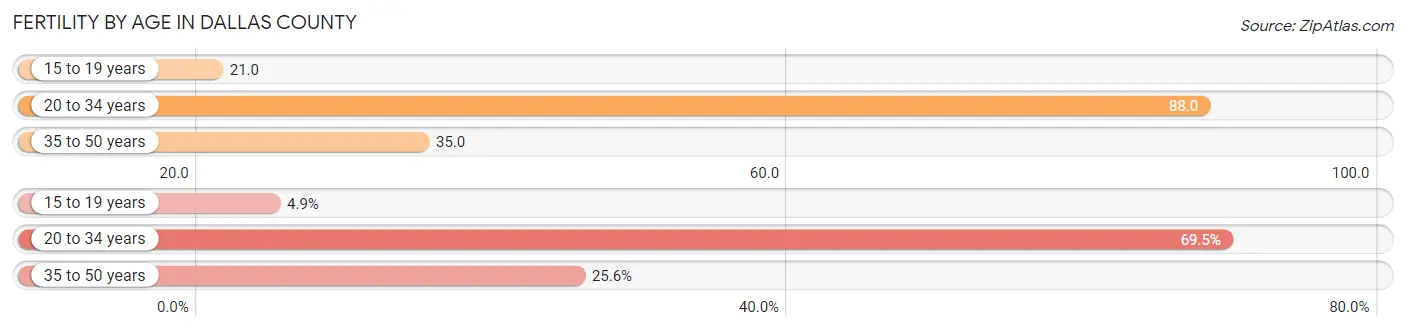
| Age Bracket | Women with Births | Births / 1,000 Women |
| 15 to 19 years | 1,877 (4.9%) | 21.0 |
| 20 to 34 years | 26,710 (69.5%) | 88.0 |
| 35 to 50 years | 9,825 (25.6%) | 35.0 |
| Total | 38,412 (100.0%) | 57.0 |
Fertility by Age by Marriage Status in Dallas County
64.9% of women with births (38,412) in Dallas County are married. The highest percentage of unmarried women with births falls into 15 to 19 years age bracket with 82.8% of them unmarried at the time of birth, while the lowest percentage of unmarried women with births belong to 35 to 50 years age bracket with 19.7% of them unmarried.
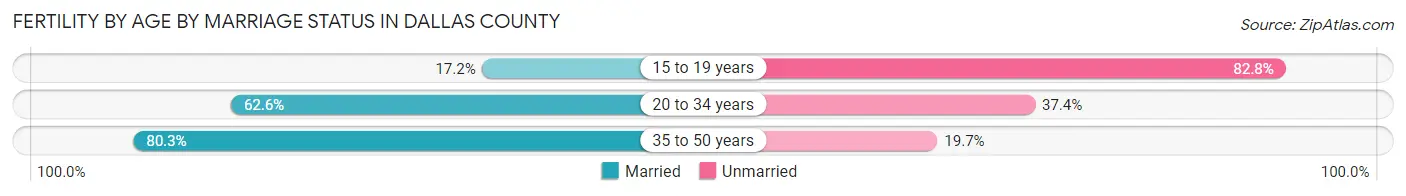
| Age Bracket | Married | Unmarried |
| 15 to 19 years | 323 (17.2%) | 1,554 (82.8%) |
| 20 to 34 years | 16,720 (62.6%) | 9,990 (37.4%) |
| 35 to 50 years | 7,889 (80.3%) | 1,936 (19.7%) |
| Total | 24,929 (64.9%) | 13,483 (35.1%) |
Fertility by Education in Dallas County
Average fertility rate in Dallas County is 57.0 births per 1,000 women. Women with the education attainment of high school diploma have the highest fertility rate of 68.0 births per 1,000 women, while women with the education attainment of less than high school have the lowest fertility at 43.0 births per 1,000 women. Women with the education attainment of high school diploma represent 25.7% of all women with births.

| Educational Attainment | Women with Births | Births / 1,000 Women |
| Less than High School | 6,336 (16.5%) | 43.0 |
| High School Diploma | 9,859 (25.7%) | 68.0 |
| College or Associate's Degree | 9,762 (25.4%) | 57.0 |
| Bachelor's Degree | 7,619 (19.8%) | 56.0 |
| Graduate Degree | 4,836 (12.6%) | 68.0 |
| Total | 38,412 (100.0%) | 57.0 |
Fertility by Education by Marriage Status in Dallas County
35.1% of women with births in Dallas County are unmarried. Women with the educational attainment of graduate degree are most likely to be married with 90.6% of them married at childbirth, while women with the educational attainment of high school diploma are least likely to be married with 51.4% of them unmarried at childbirth.
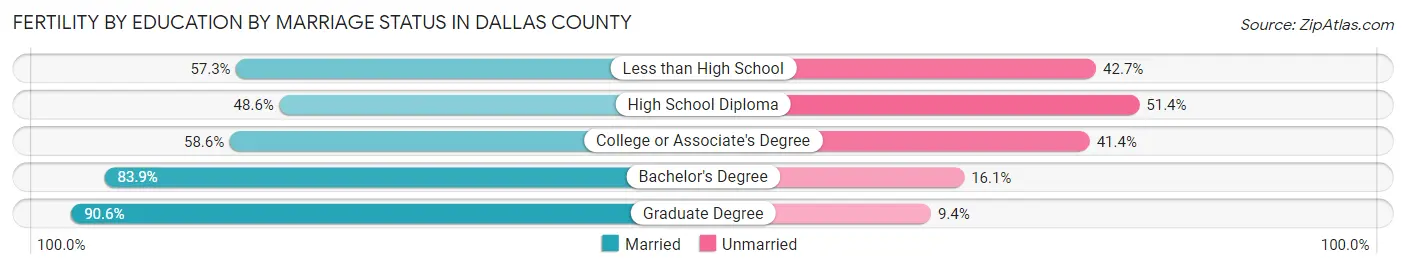
| Educational Attainment | Married | Unmarried |
| Less than High School | 3,631 (57.3%) | 2,705 (42.7%) |
| High School Diploma | 4,791 (48.6%) | 5,068 (51.4%) |
| College or Associate's Degree | 5,721 (58.6%) | 4,041 (41.4%) |
| Bachelor's Degree | 6,392 (83.9%) | 1,227 (16.1%) |
| Graduate Degree | 4,381 (90.6%) | 455 (9.4%) |
| Total | 24,929 (64.9%) | 13,483 (35.1%) |
Employment Characteristics in Dallas County
Employment by Class of Employer in Dallas County
Among the 1,292,835 employed individuals in Dallas County, private company employees (966,259 | 74.7%), self-employed (not incorporated) (85,698 | 6.6%), and not-for-profit organizations (74,477 | 5.8%) make up the most common classes of employment.
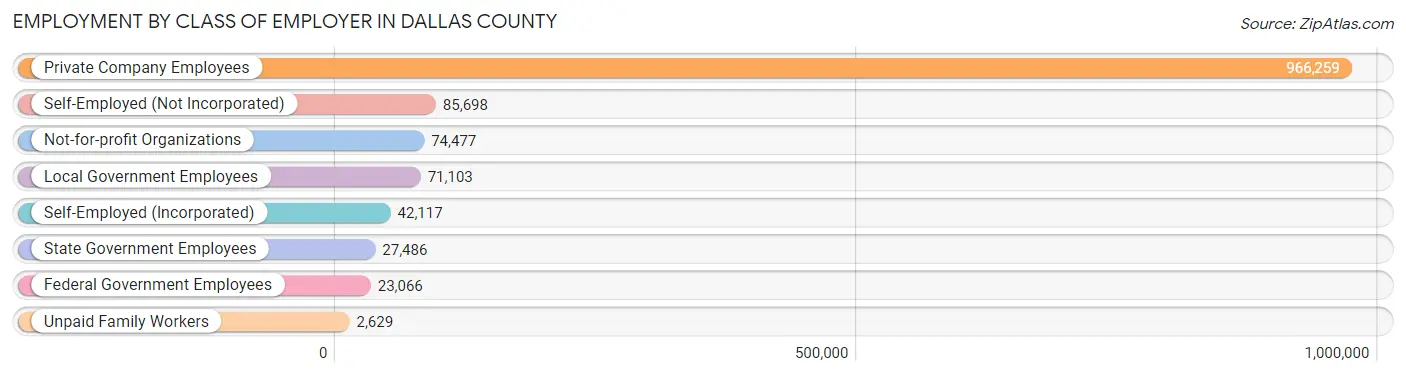
| Employer Class | # Employees | % Employees |
| Private Company Employees | 966,259 | 74.7% |
| Self-Employed (Incorporated) | 42,117 | 3.3% |
| Self-Employed (Not Incorporated) | 85,698 | 6.6% |
| Not-for-profit Organizations | 74,477 | 5.8% |
| Local Government Employees | 71,103 | 5.5% |
| State Government Employees | 27,486 | 2.1% |
| Federal Government Employees | 23,066 | 1.8% |
| Unpaid Family Workers | 2,629 | 0.2% |
| Total | 1,292,835 | 100.0% |
Employment Status by Age in Dallas County
According to the labor force statistics for Dallas County, out of the total population over 16 years of age (2,014,287), 69.0% or 1,389,858 individuals are in the labor force, with 4.9% or 68,103 of them unemployed. The age group with the highest labor force participation rate is 25 to 29 years, with 85.1% or 187,072 individuals in the labor force. Within the labor force, the 16 to 19 years age range has the highest percentage of unemployed individuals, with 14.3% or 7,242 of them being unemployed.
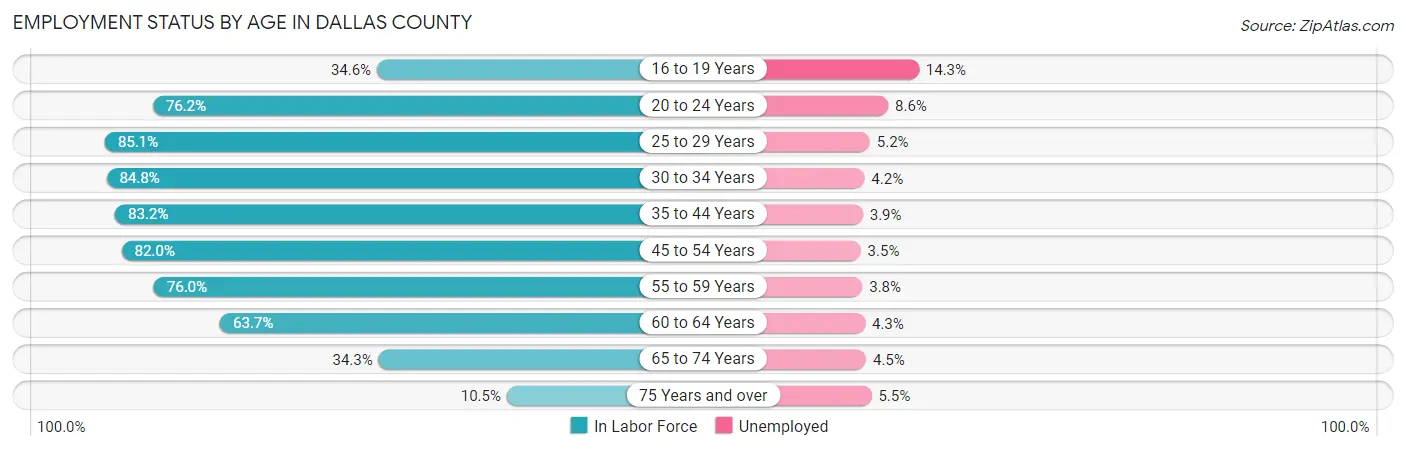
| Age Bracket | In Labor Force | Unemployed |
| 16 to 19 Years | 50,644 (34.6%) | 7,242 (14.3%) |
| 20 to 24 Years | 141,948 (76.2%) | 12,208 (8.6%) |
| 25 to 29 Years | 187,072 (85.1%) | 9,728 (5.2%) |
| 30 to 34 Years | 175,666 (84.8%) | 7,378 (4.2%) |
| 35 to 44 Years | 298,373 (83.2%) | 11,637 (3.9%) |
| 45 to 54 Years | 261,967 (82.0%) | 9,169 (3.5%) |
| 55 to 59 Years | 113,464 (76.0%) | 4,312 (3.8%) |
| 60 to 64 Years | 87,144 (63.7%) | 3,747 (4.3%) |
| 65 to 74 Years | 61,872 (34.3%) | 2,784 (4.5%) |
| 75 Years and over | 11,558 (10.5%) | 636 (5.5%) |
| Total | 1,389,858 (69.0%) | 68,103 (4.9%) |
Employment Status by Educational Attainment in Dallas County
According to labor force statistics for Dallas County, 80.8% of individuals (1,124,066) out of the total population between 25 and 64 years of age (1,391,171) are in the labor force, with 4.1% or 46,087 of them being unemployed. The group with the highest labor force participation rate are those with the educational attainment of bachelor's degree or higher, with 87.8% or 418,592 individuals in the labor force. Within the labor force, individuals with high school diploma education have the highest percentage of unemployment, with 5.7% or 13,538 of them being unemployed.
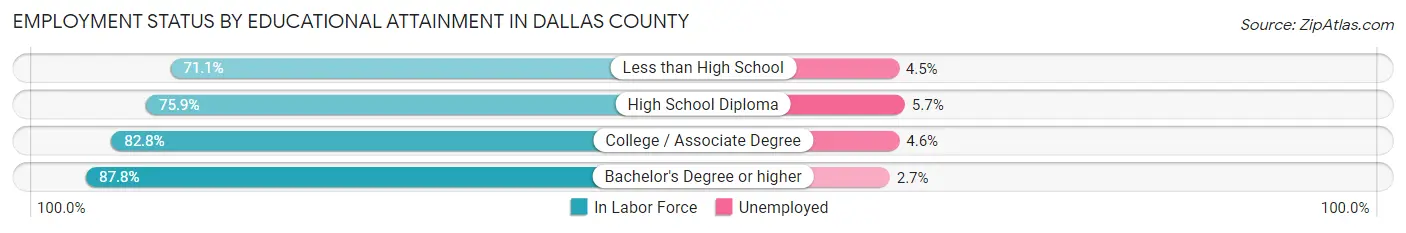
| Educational Attainment | In Labor Force | Unemployed |
| Less than High School | 185,439 (71.1%) | 11,737 (4.5%) |
| High School Diploma | 237,513 (75.9%) | 17,837 (5.7%) |
| College / Associate Degree | 282,076 (82.8%) | 15,671 (4.6%) |
| Bachelor's Degree or higher | 418,592 (87.8%) | 12,872 (2.7%) |
| Total | 1,124,066 (80.8%) | 57,038 (4.1%) |
Employment Occupations by Sex in Dallas County
Management, Business, Science and Arts Occupations
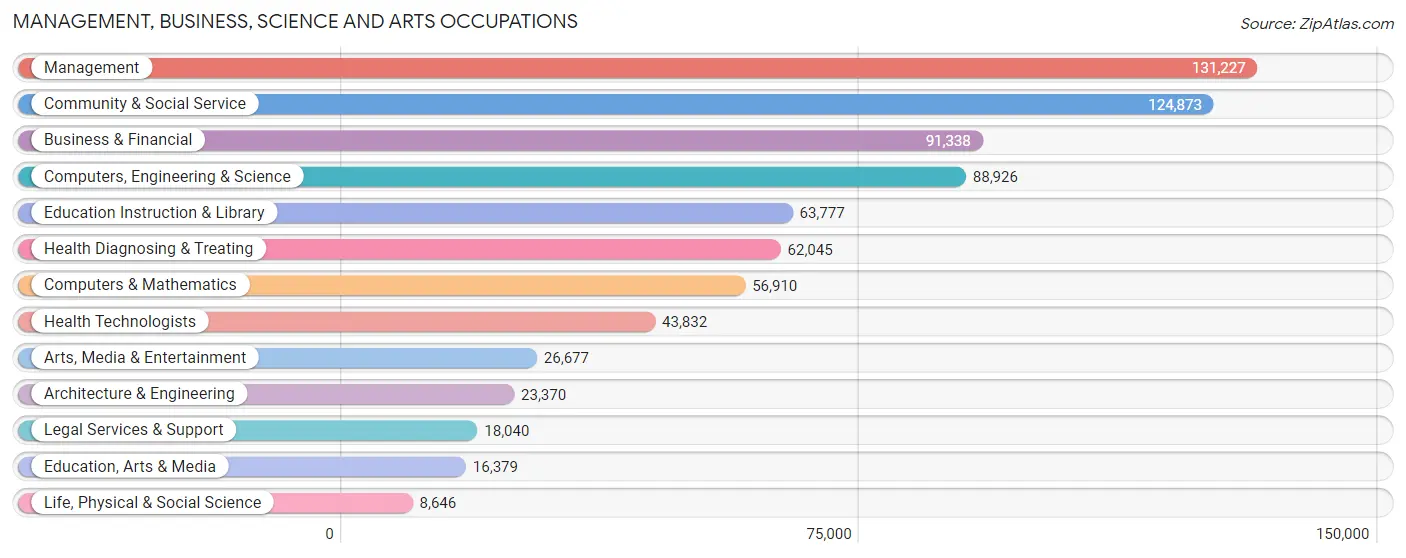
The most common Management, Business, Science and Arts occupations in Dallas County are Management (131,227 | 10.0%), Community & Social Service (124,873 | 9.5%), Business & Financial (91,338 | 6.9%), Computers, Engineering & Science (88,926 | 6.7%), and Education Instruction & Library (63,777 | 4.8%).
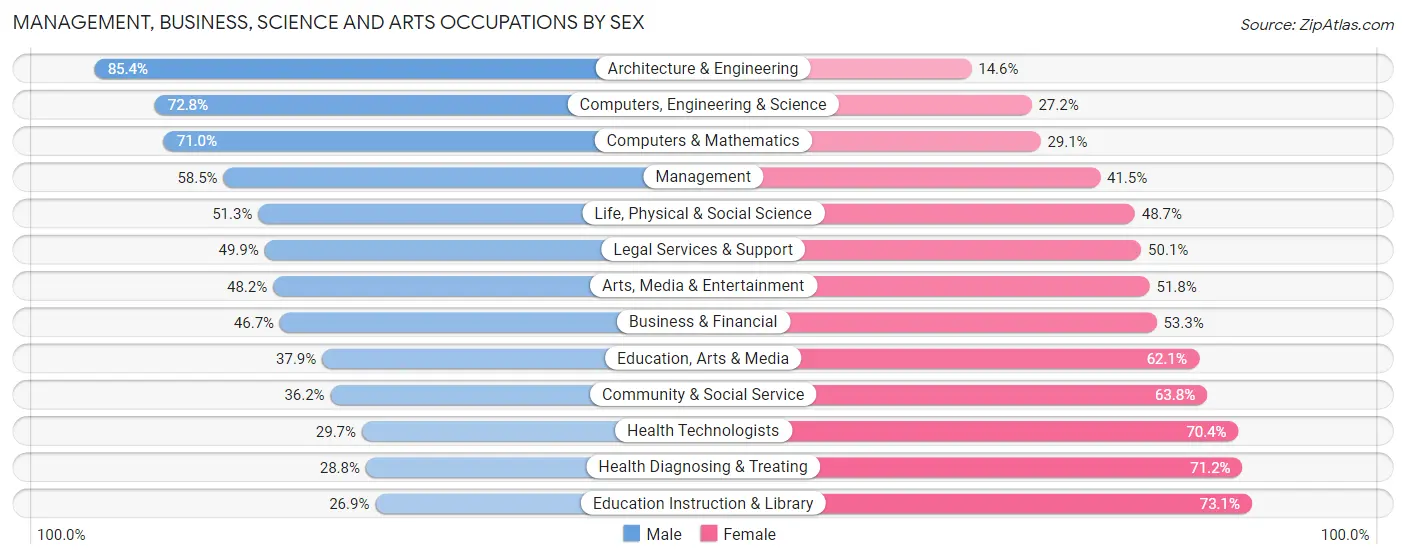
Management, Business, Science and Arts Occupations by Sex
Within the Management, Business, Science and Arts occupations in Dallas County, the most male-oriented occupations are Architecture & Engineering (85.4%), Computers, Engineering & Science (72.8%), and Computers & Mathematics (71.0%), while the most female-oriented occupations are Education Instruction & Library (73.1%), Health Diagnosing & Treating (71.2%), and Health Technologists (70.4%).
| Occupation | Male | Female |
| Management | 76,799 (58.5%) | 54,428 (41.5%) |
| Business & Financial | 42,692 (46.7%) | 48,646 (53.3%) |
| Computers, Engineering & Science | 64,757 (72.8%) | 24,169 (27.2%) |
| Computers & Mathematics | 40,375 (71.0%) | 16,535 (29.0%) |
| Architecture & Engineering | 19,950 (85.4%) | 3,420 (14.6%) |
| Life, Physical & Social Science | 4,432 (51.3%) | 4,214 (48.7%) |
| Community & Social Service | 45,205 (36.2%) | 79,668 (63.8%) |
| Education, Arts & Media | 6,215 (37.9%) | 10,164 (62.1%) |
| Legal Services & Support | 9,009 (49.9%) | 9,031 (50.1%) |
| Education Instruction & Library | 17,129 (26.9%) | 46,648 (73.1%) |
| Arts, Media & Entertainment | 12,852 (48.2%) | 13,825 (51.8%) |
| Health Diagnosing & Treating | 17,879 (28.8%) | 44,166 (71.2%) |
| Health Technologists | 12,994 (29.6%) | 30,838 (70.4%) |
| Total (Category) | 247,332 (49.6%) | 251,077 (50.4%) |
| Total (Overall) | 719,800 (54.5%) | 599,721 (45.5%) |
Services Occupations
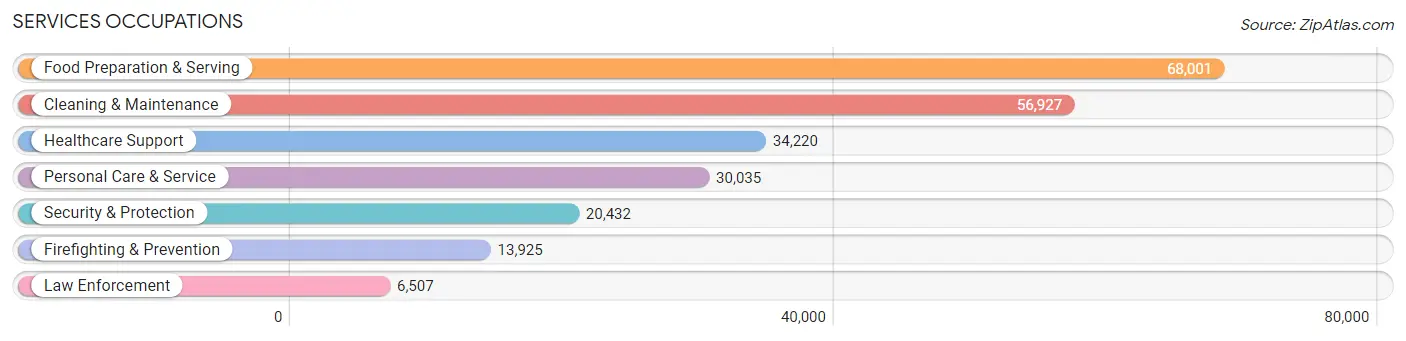
The most common Services occupations in Dallas County are Food Preparation & Serving (68,001 | 5.1%), Cleaning & Maintenance (56,927 | 4.3%), Healthcare Support (34,220 | 2.6%), Personal Care & Service (30,035 | 2.3%), and Security & Protection (20,432 | 1.5%).
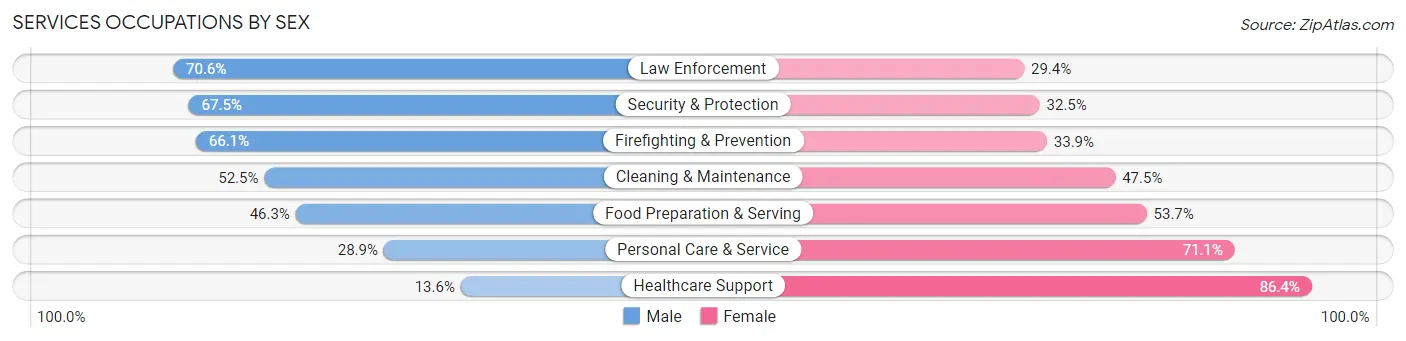
Services Occupations by Sex
Within the Services occupations in Dallas County, the most male-oriented occupations are Law Enforcement (70.6%), Security & Protection (67.5%), and Firefighting & Prevention (66.1%), while the most female-oriented occupations are Healthcare Support (86.4%), Personal Care & Service (71.1%), and Food Preparation & Serving (53.7%).
| Occupation | Male | Female |
| Healthcare Support | 4,667 (13.6%) | 29,553 (86.4%) |
| Security & Protection | 13,794 (67.5%) | 6,638 (32.5%) |
| Firefighting & Prevention | 9,201 (66.1%) | 4,724 (33.9%) |
| Law Enforcement | 4,593 (70.6%) | 1,914 (29.4%) |
| Food Preparation & Serving | 31,499 (46.3%) | 36,502 (53.7%) |
| Cleaning & Maintenance | 29,910 (52.5%) | 27,017 (47.5%) |
| Personal Care & Service | 8,670 (28.9%) | 21,365 (71.1%) |
| Total (Category) | 88,540 (42.2%) | 121,075 (57.8%) |
| Total (Overall) | 719,800 (54.5%) | 599,721 (45.5%) |
Sales and Office Occupations
The most common Sales and Office occupations in Dallas County are Office & Administration (151,391 | 11.5%), and Sales & Related (126,201 | 9.6%).
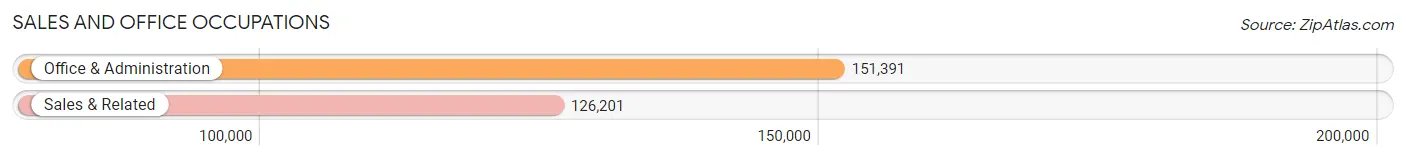
Sales and Office Occupations by Sex
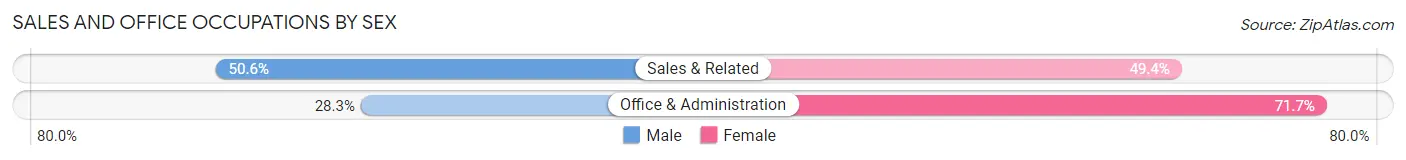
| Occupation | Male | Female |
| Sales & Related | 63,858 (50.6%) | 62,343 (49.4%) |
| Office & Administration | 42,824 (28.3%) | 108,567 (71.7%) |
| Total (Category) | 106,682 (38.4%) | 170,910 (61.6%) |
| Total (Overall) | 719,800 (54.5%) | 599,721 (45.5%) |
Natural Resources, Construction and Maintenance Occupations
The most common Natural Resources, Construction and Maintenance occupations in Dallas County are Construction & Extraction (109,647 | 8.3%), Installation, Maintenance & Repair (38,114 | 2.9%), and Farming, Fishing & Forestry (1,411 | 0.1%).
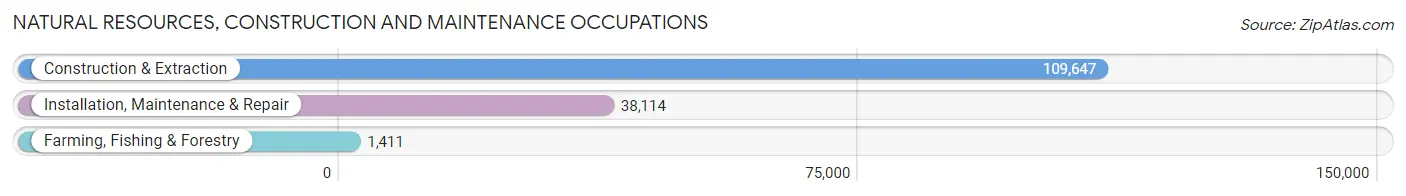
Natural Resources, Construction and Maintenance Occupations by Sex

| Occupation | Male | Female |
| Farming, Fishing & Forestry | 904 (64.1%) | 507 (35.9%) |
| Construction & Extraction | 106,577 (97.2%) | 3,070 (2.8%) |
| Installation, Maintenance & Repair | 36,188 (95.0%) | 1,926 (5.1%) |
| Total (Category) | 143,669 (96.3%) | 5,503 (3.7%) |
| Total (Overall) | 719,800 (54.5%) | 599,721 (45.5%) |
Production, Transportation and Moving Occupations
The most common Production, Transportation and Moving occupations in Dallas County are Production (65,490 | 5.0%), Material Moving (65,105 | 4.9%), and Transportation (54,138 | 4.1%).
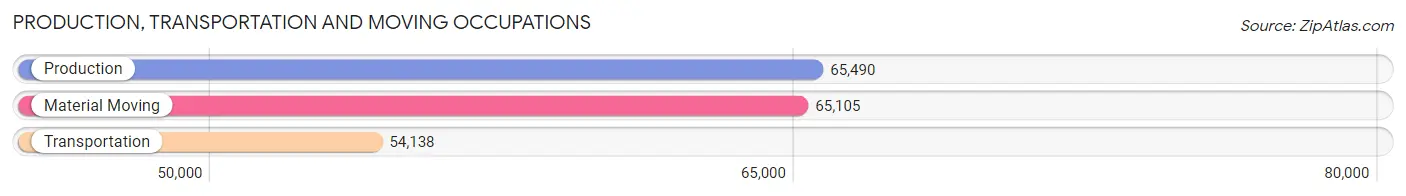
Production, Transportation and Moving Occupations by Sex
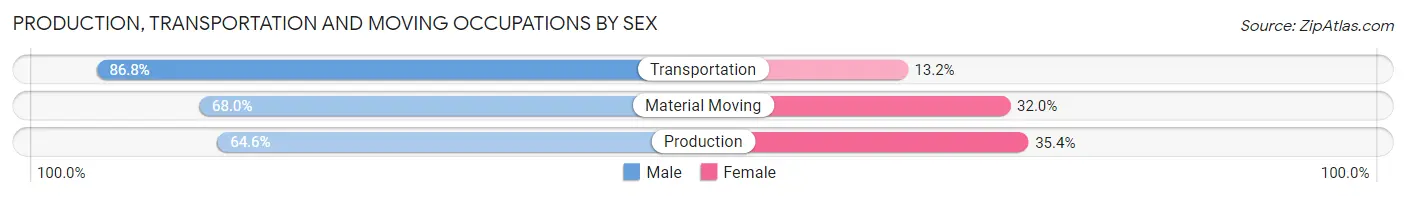
| Occupation | Male | Female |
| Production | 42,330 (64.6%) | 23,160 (35.4%) |
| Transportation | 46,996 (86.8%) | 7,142 (13.2%) |
| Material Moving | 44,251 (68.0%) | 20,854 (32.0%) |
| Total (Category) | 133,577 (72.3%) | 51,156 (27.7%) |
| Total (Overall) | 719,800 (54.5%) | 599,721 (45.5%) |
Employment Industries by Sex in Dallas County
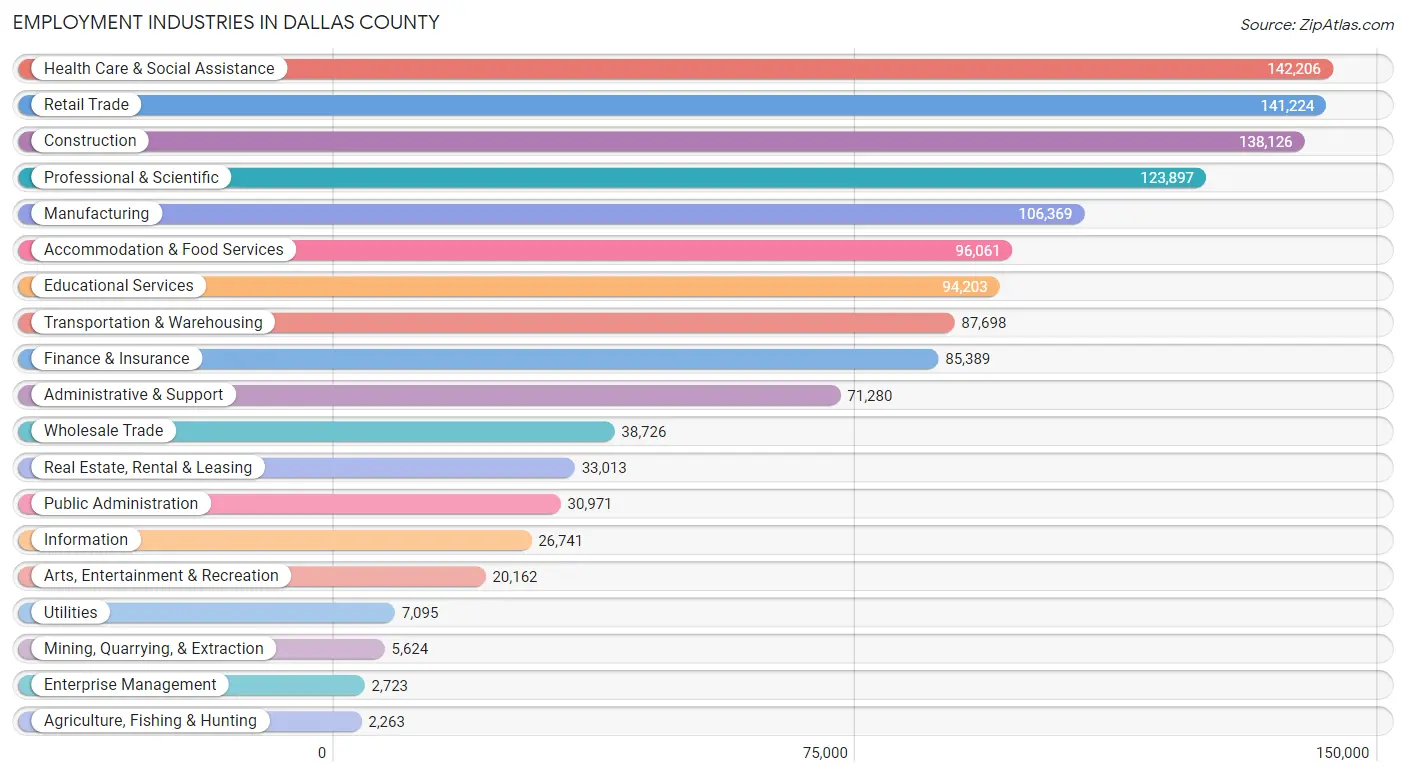
Employment Industries in Dallas County
The major employment industries in Dallas County include Health Care & Social Assistance (142,206 | 10.8%), Retail Trade (141,224 | 10.7%), Construction (138,126 | 10.5%), Professional & Scientific (123,897 | 9.4%), and Manufacturing (106,369 | 8.1%).
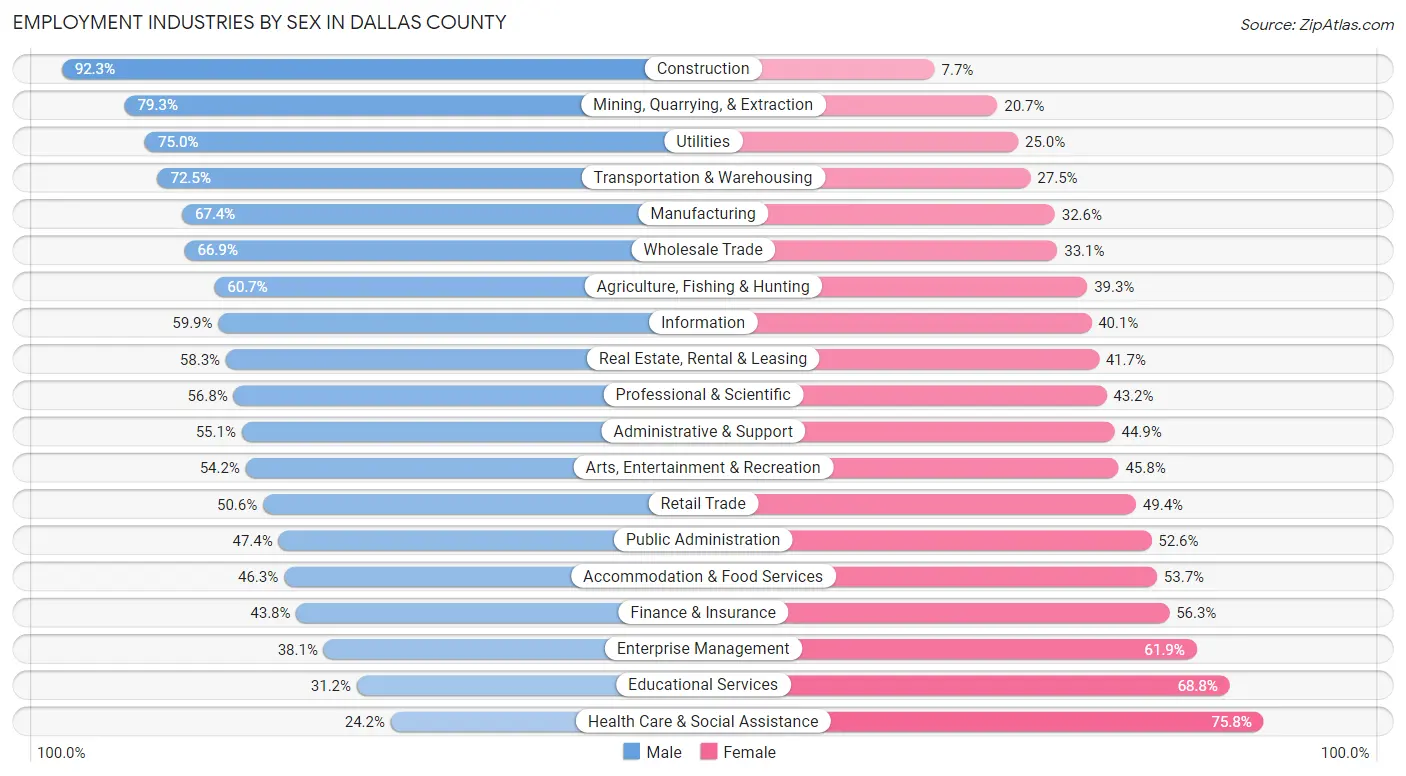
Employment Industries by Sex in Dallas County
The Dallas County industries that see more men than women are Construction (92.3%), Mining, Quarrying, & Extraction (79.3%), and Utilities (75.0%), whereas the industries that tend to have a higher number of women are Health Care & Social Assistance (75.8%), Educational Services (68.8%), and Enterprise Management (61.9%).
| Industry | Male | Female |
| Agriculture, Fishing & Hunting | 1,374 (60.7%) | 889 (39.3%) |
| Mining, Quarrying, & Extraction | 4,461 (79.3%) | 1,163 (20.7%) |
| Construction | 127,490 (92.3%) | 10,636 (7.7%) |
| Manufacturing | 71,714 (67.4%) | 34,655 (32.6%) |
| Wholesale Trade | 25,907 (66.9%) | 12,819 (33.1%) |
| Retail Trade | 71,518 (50.6%) | 69,706 (49.4%) |
| Transportation & Warehousing | 63,559 (72.5%) | 24,139 (27.5%) |
| Utilities | 5,324 (75.0%) | 1,771 (25.0%) |
| Information | 16,016 (59.9%) | 10,725 (40.1%) |
| Finance & Insurance | 37,355 (43.8%) | 48,034 (56.2%) |
| Real Estate, Rental & Leasing | 19,258 (58.3%) | 13,755 (41.7%) |
| Professional & Scientific | 70,328 (56.8%) | 53,569 (43.2%) |
| Enterprise Management | 1,037 (38.1%) | 1,686 (61.9%) |
| Administrative & Support | 39,246 (55.1%) | 32,034 (44.9%) |
| Educational Services | 29,416 (31.2%) | 64,787 (68.8%) |
| Health Care & Social Assistance | 34,417 (24.2%) | 107,789 (75.8%) |
| Arts, Entertainment & Recreation | 10,936 (54.2%) | 9,226 (45.8%) |
| Accommodation & Food Services | 44,469 (46.3%) | 51,592 (53.7%) |
| Public Administration | 14,694 (47.4%) | 16,277 (52.6%) |
| Total | 719,800 (54.5%) | 599,721 (45.5%) |
Education in Dallas County
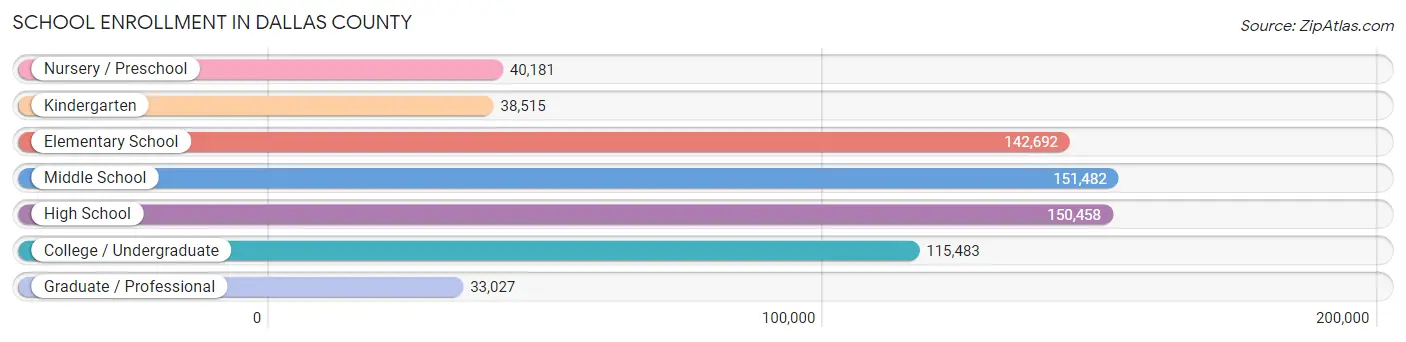
School Enrollment in Dallas County
The most common levels of schooling among the 671,838 students in Dallas County are middle school (151,482 | 22.6%), high school (150,458 | 22.4%), and elementary school (142,692 | 21.2%).
| School Level | # Students | % Students |
| Nursery / Preschool | 40,181 | 6.0% |
| Kindergarten | 38,515 | 5.7% |
| Elementary School | 142,692 | 21.2% |
| Middle School | 151,482 | 22.6% |
| High School | 150,458 | 22.4% |
| College / Undergraduate | 115,483 | 17.2% |
| Graduate / Professional | 33,027 | 4.9% |
| Total | 671,838 | 100.0% |
School Enrollment by Age by Funding Source in Dallas County
Out of a total of 671,838 students who are enrolled in schools in Dallas County, 88,683 (13.2%) attend a private institution, while the remaining 583,155 (86.8%) are enrolled in public schools. The age group of 3 to 4 year olds has the highest likelihood of being enrolled in private schools, with 10,784 (34.6% in the age bracket) enrolled. Conversely, the age group of 15 to 17 year olds has the lowest likelihood of being enrolled in a private school, with 97,829 (92.0% in the age bracket) attending a public institution.
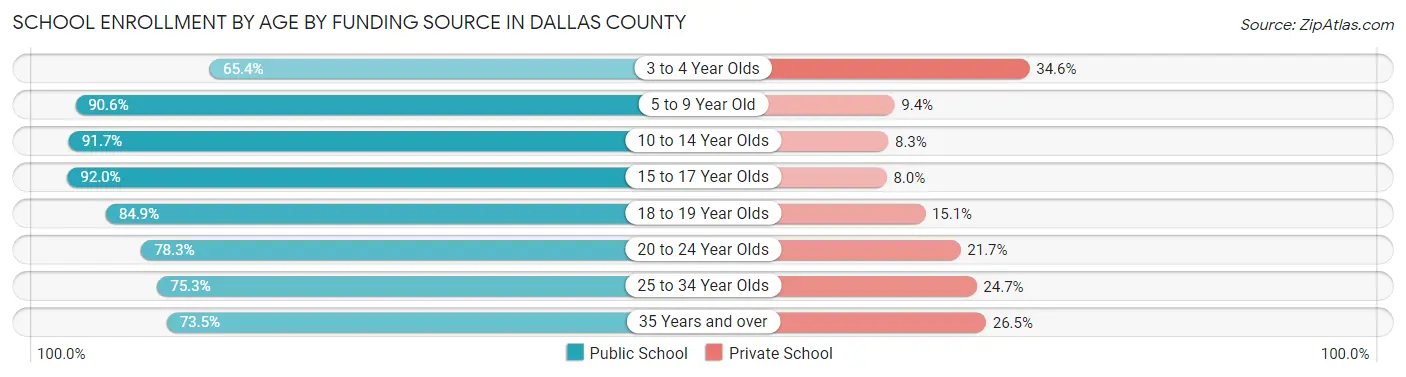
| Age Bracket | Public School | Private School |
| 3 to 4 Year Olds | 20,409 (65.4%) | 10,784 (34.6%) |
| 5 to 9 Year Old | 155,316 (90.6%) | 16,197 (9.4%) |
| 10 to 14 Year Olds | 171,342 (91.7%) | 15,424 (8.3%) |
| 15 to 17 Year Olds | 97,829 (92.0%) | 8,471 (8.0%) |
| 18 to 19 Year Olds | 40,437 (84.9%) | 7,217 (15.1%) |
| 20 to 24 Year Olds | 45,330 (78.3%) | 12,585 (21.7%) |
| 25 to 34 Year Olds | 30,523 (75.3%) | 10,023 (24.7%) |
| 35 Years and over | 22,024 (73.5%) | 7,927 (26.5%) |
| Total | 583,155 (86.8%) | 88,683 (13.2%) |
Educational Attainment by Field of Study in Dallas County
Business (157,843 | 25.9%), science & technology (53,599 | 8.8%), engineering (51,684 | 8.5%), education (48,080 | 7.9%), and social sciences (44,279 | 7.3%) are the most common fields of study among 609,770 individuals in Dallas County who have obtained a bachelor's degree or higher.
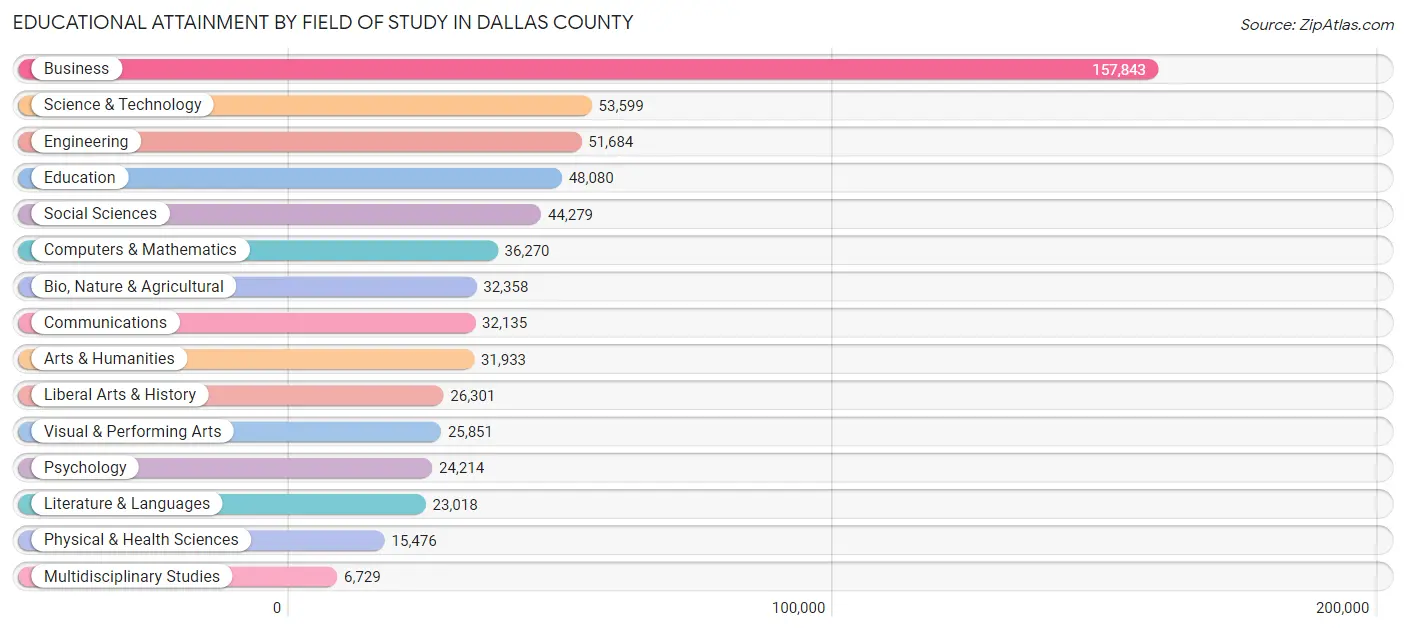
| Field of Study | # Graduates | % Graduates |
| Computers & Mathematics | 36,270 | 5.9% |
| Bio, Nature & Agricultural | 32,358 | 5.3% |
| Physical & Health Sciences | 15,476 | 2.5% |
| Psychology | 24,214 | 4.0% |
| Social Sciences | 44,279 | 7.3% |
| Engineering | 51,684 | 8.5% |
| Multidisciplinary Studies | 6,729 | 1.1% |
| Science & Technology | 53,599 | 8.8% |
| Business | 157,843 | 25.9% |
| Education | 48,080 | 7.9% |
| Literature & Languages | 23,018 | 3.8% |
| Liberal Arts & History | 26,301 | 4.3% |
| Visual & Performing Arts | 25,851 | 4.2% |
| Communications | 32,135 | 5.3% |
| Arts & Humanities | 31,933 | 5.2% |
| Total | 609,770 | 100.0% |
Transportation & Commute in Dallas County
Vehicle Availability by Sex in Dallas County
The most prevalent vehicle ownership categories in Dallas County are males with 2 vehicles (291,241, accounting for 41.2%) and females with 2 vehicles (226,495, making up 50.0%).

| Vehicles Available | Male | Female |
| No Vehicle | 22,600 (3.2%) | 18,376 (3.2%) |
| 1 Vehicle | 150,253 (21.3%) | 161,996 (27.8%) |
| 2 Vehicles | 291,241 (41.2%) | 226,495 (38.9%) |
| 3 Vehicles | 144,229 (20.4%) | 105,609 (18.1%) |
| 4 Vehicles | 67,049 (9.5%) | 48,079 (8.3%) |
| 5 or more Vehicles | 30,603 (4.3%) | 21,509 (3.7%) |
| Total | 705,975 (100.0%) | 582,064 (100.0%) |
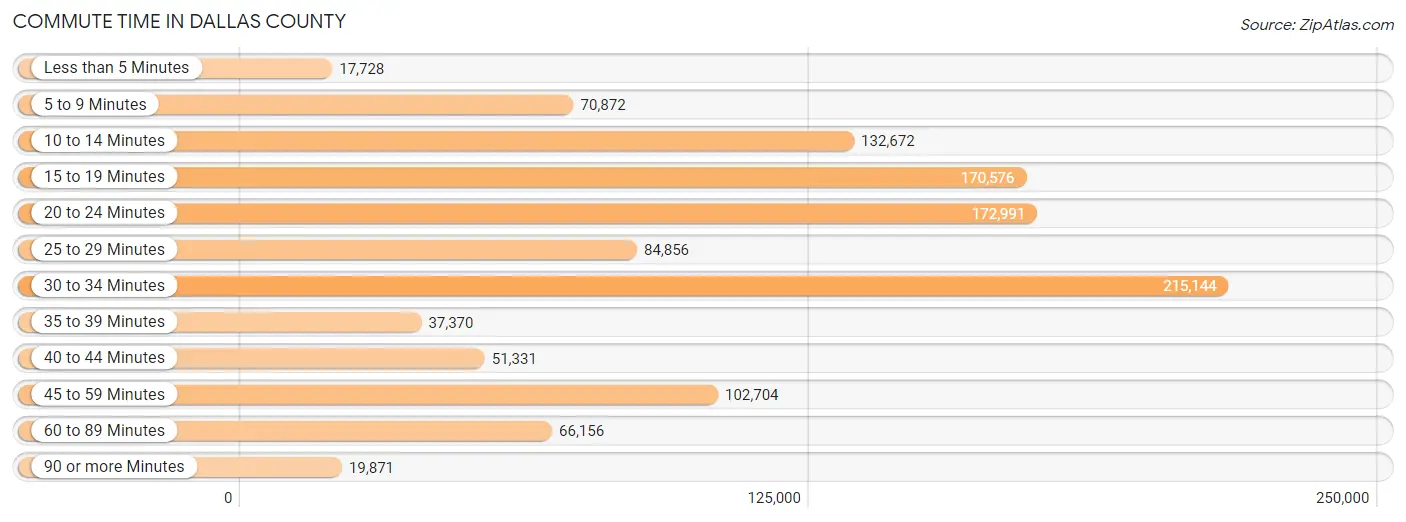
Commute Time in Dallas County
The most frequently occuring commute durations in Dallas County are 30 to 34 minutes (215,144 commuters, 18.8%), 20 to 24 minutes (172,991 commuters, 15.1%), and 15 to 19 minutes (170,576 commuters, 14.9%).
| Commute Time | # Commuters | % Commuters |
| Less than 5 Minutes | 17,728 | 1.5% |
| 5 to 9 Minutes | 70,872 | 6.2% |
| 10 to 14 Minutes | 132,672 | 11.6% |
| 15 to 19 Minutes | 170,576 | 14.9% |
| 20 to 24 Minutes | 172,991 | 15.1% |
| 25 to 29 Minutes | 84,856 | 7.4% |
| 30 to 34 Minutes | 215,144 | 18.8% |
| 35 to 39 Minutes | 37,370 | 3.3% |
| 40 to 44 Minutes | 51,331 | 4.5% |
| 45 to 59 Minutes | 102,704 | 9.0% |
| 60 to 89 Minutes | 66,156 | 5.8% |
| 90 or more Minutes | 19,871 | 1.7% |
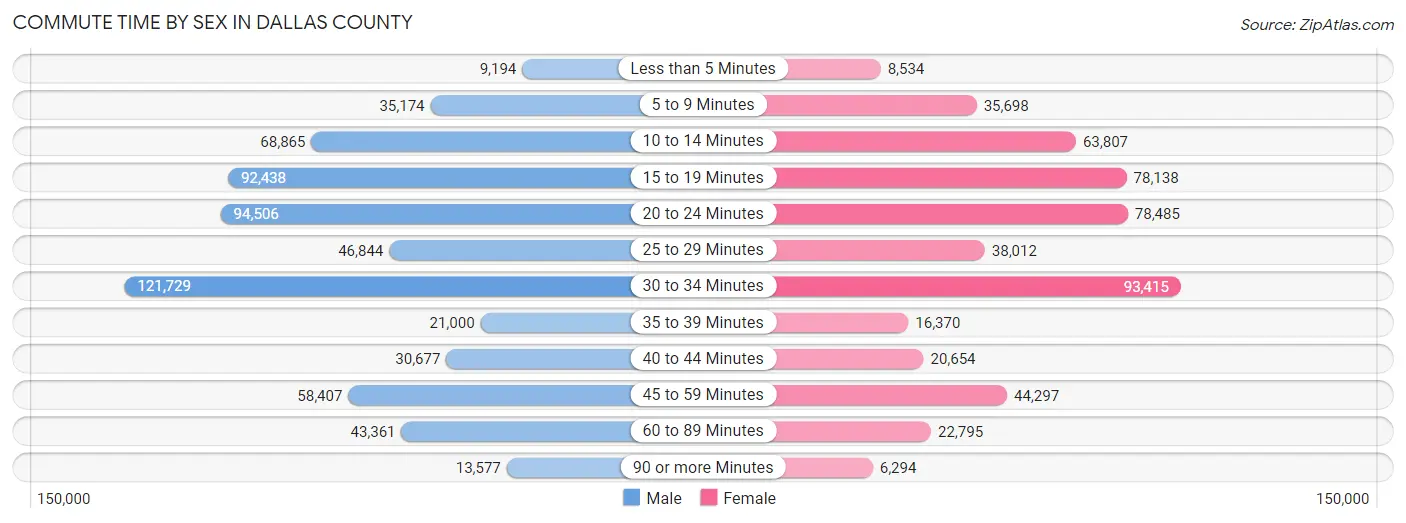
Commute Time by Sex in Dallas County
The most common commute times in Dallas County are 30 to 34 minutes (121,729 commuters, 19.2%) for males and 30 to 34 minutes (93,415 commuters, 18.4%) for females.
| Commute Time | Male | Female |
| Less than 5 Minutes | 9,194 (1.5%) | 8,534 (1.7%) |
| 5 to 9 Minutes | 35,174 (5.5%) | 35,698 (7.0%) |
| 10 to 14 Minutes | 68,865 (10.8%) | 63,807 (12.6%) |
| 15 to 19 Minutes | 92,438 (14.5%) | 78,138 (15.4%) |
| 20 to 24 Minutes | 94,506 (14.9%) | 78,485 (15.5%) |
| 25 to 29 Minutes | 46,844 (7.4%) | 38,012 (7.5%) |
| 30 to 34 Minutes | 121,729 (19.2%) | 93,415 (18.4%) |
| 35 to 39 Minutes | 21,000 (3.3%) | 16,370 (3.2%) |
| 40 to 44 Minutes | 30,677 (4.8%) | 20,654 (4.1%) |
| 45 to 59 Minutes | 58,407 (9.2%) | 44,297 (8.7%) |
| 60 to 89 Minutes | 43,361 (6.8%) | 22,795 (4.5%) |
| 90 or more Minutes | 13,577 (2.1%) | 6,294 (1.2%) |
Time of Departure to Work by Sex in Dallas County
The most frequent times of departure to work in Dallas County are 7:00 AM to 7:29 AM (90,003, 14.2%) for males and 7:00 AM to 7:29 AM (75,962, 15.0%) for females.
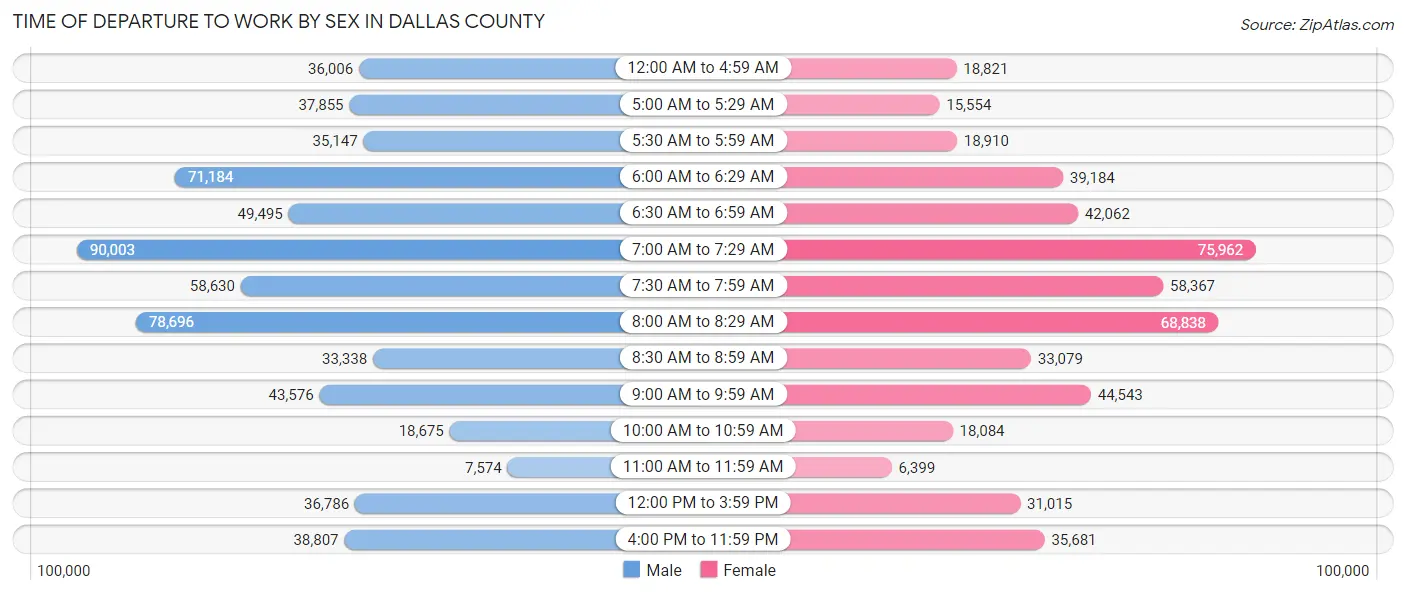
| Time of Departure | Male | Female |
| 12:00 AM to 4:59 AM | 36,006 (5.7%) | 18,821 (3.7%) |
| 5:00 AM to 5:29 AM | 37,855 (5.9%) | 15,554 (3.1%) |
| 5:30 AM to 5:59 AM | 35,147 (5.5%) | 18,910 (3.7%) |
| 6:00 AM to 6:29 AM | 71,184 (11.2%) | 39,184 (7.7%) |
| 6:30 AM to 6:59 AM | 49,495 (7.8%) | 42,062 (8.3%) |
| 7:00 AM to 7:29 AM | 90,003 (14.2%) | 75,962 (15.0%) |
| 7:30 AM to 7:59 AM | 58,630 (9.2%) | 58,367 (11.5%) |
| 8:00 AM to 8:29 AM | 78,696 (12.4%) | 68,838 (13.6%) |
| 8:30 AM to 8:59 AM | 33,338 (5.2%) | 33,079 (6.5%) |
| 9:00 AM to 9:59 AM | 43,576 (6.9%) | 44,543 (8.8%) |
| 10:00 AM to 10:59 AM | 18,675 (2.9%) | 18,084 (3.6%) |
| 11:00 AM to 11:59 AM | 7,574 (1.2%) | 6,399 (1.3%) |
| 12:00 PM to 3:59 PM | 36,786 (5.8%) | 31,015 (6.1%) |
| 4:00 PM to 11:59 PM | 38,807 (6.1%) | 35,681 (7.0%) |
| Total | 635,772 (100.0%) | 506,499 (100.0%) |
Housing Occupancy in Dallas County
Occupancy by Ownership in Dallas County
Of the total 959,184 dwellings in Dallas County, owner-occupied units account for 484,698 (50.5%), while renter-occupied units make up 474,486 (49.5%).
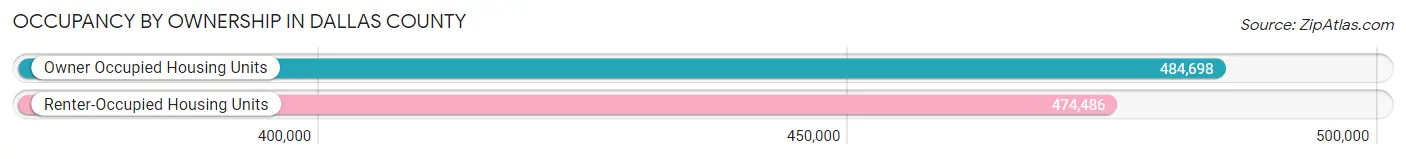
| Occupancy | # Housing Units | % Housing Units |
| Owner Occupied Housing Units | 484,698 | 50.5% |
| Renter-Occupied Housing Units | 474,486 | 49.5% |
| Total Occupied Housing Units | 959,184 | 100.0% |
Occupancy by Household Size in Dallas County

| Household Size | # Housing Units | % Housing Units |
| 1-Person Household | 288,520 | 30.1% |
| 2-Person Household | 280,948 | 29.3% |
| 3-Person Household | 145,839 | 15.2% |
| 4+ Person Household | 243,877 | 25.4% |
| Total Housing Units | 959,184 | 100.0% |
Occupancy by Ownership by Household Size in Dallas County
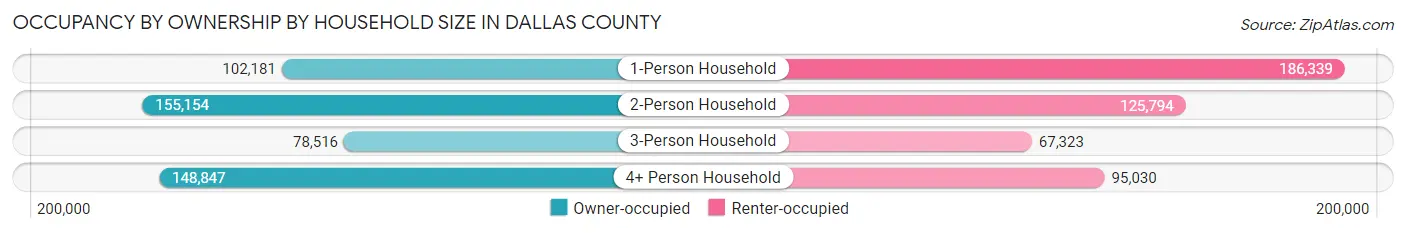
| Household Size | Owner-occupied | Renter-occupied |
| 1-Person Household | 102,181 (35.4%) | 186,339 (64.6%) |
| 2-Person Household | 155,154 (55.2%) | 125,794 (44.8%) |
| 3-Person Household | 78,516 (53.8%) | 67,323 (46.2%) |
| 4+ Person Household | 148,847 (61.0%) | 95,030 (39.0%) |
| Total Housing Units | 484,698 (50.5%) | 474,486 (49.5%) |
Occupancy by Educational Attainment in Dallas County
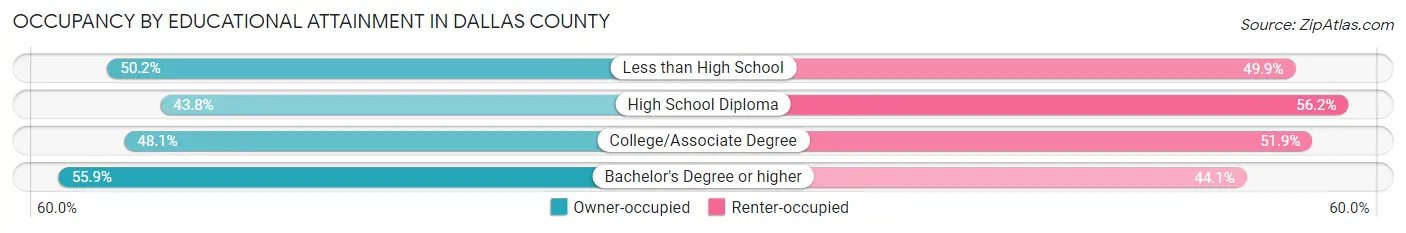
| Household Size | Owner-occupied | Renter-occupied |
| Less than High School | 75,466 (50.1%) | 75,001 (49.8%) |
| High School Diploma | 85,358 (43.8%) | 109,347 (56.2%) |
| College/Associate Degree | 120,694 (48.1%) | 130,081 (51.9%) |
| Bachelor's Degree or higher | 203,180 (55.9%) | 160,057 (44.1%) |
Occupancy by Age of Householder in Dallas County
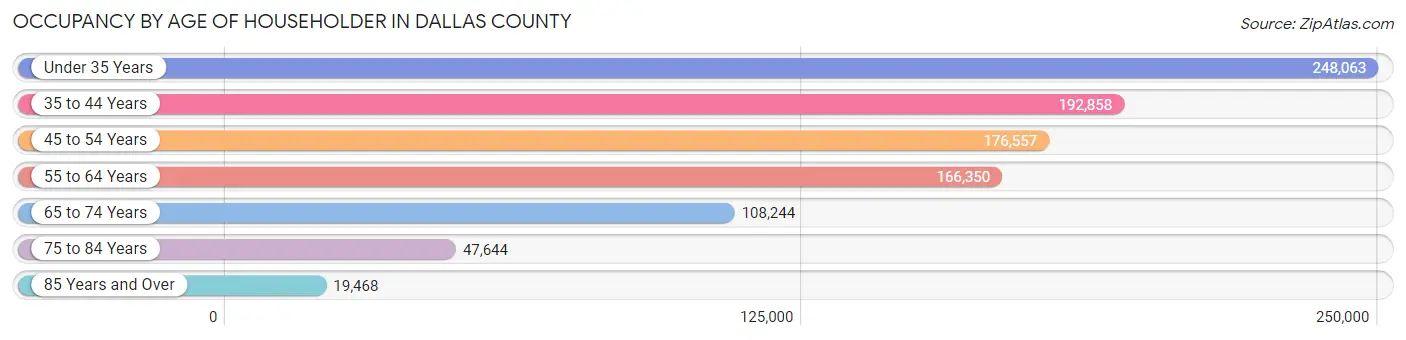
| Age Bracket | # Households | % Households |
| Under 35 Years | 248,063 | 25.9% |
| 35 to 44 Years | 192,858 | 20.1% |
| 45 to 54 Years | 176,557 | 18.4% |
| 55 to 64 Years | 166,350 | 17.3% |
| 65 to 74 Years | 108,244 | 11.3% |
| 75 to 84 Years | 47,644 | 5.0% |
| 85 Years and Over | 19,468 | 2.0% |
| Total | 959,184 | 100.0% |
Housing Finances in Dallas County
Median Income by Occupancy in Dallas County
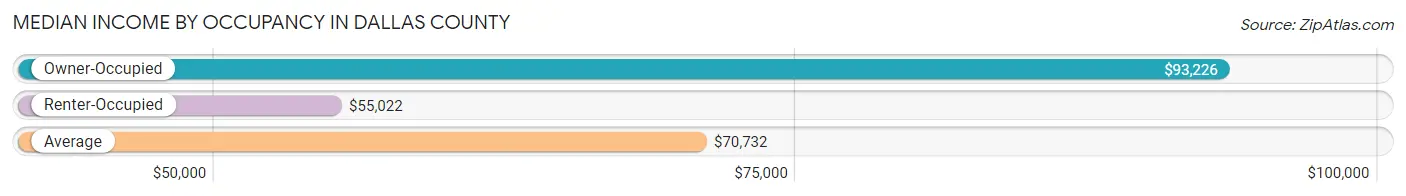
| Occupancy Type | # Households | Median Income |
| Owner-Occupied | 484,698 (50.5%) | $93,226 |
| Renter-Occupied | 474,486 (49.5%) | $55,022 |
| Average | 959,184 (100.0%) | $70,732 |
Occupancy by Householder Income Bracket in Dallas County
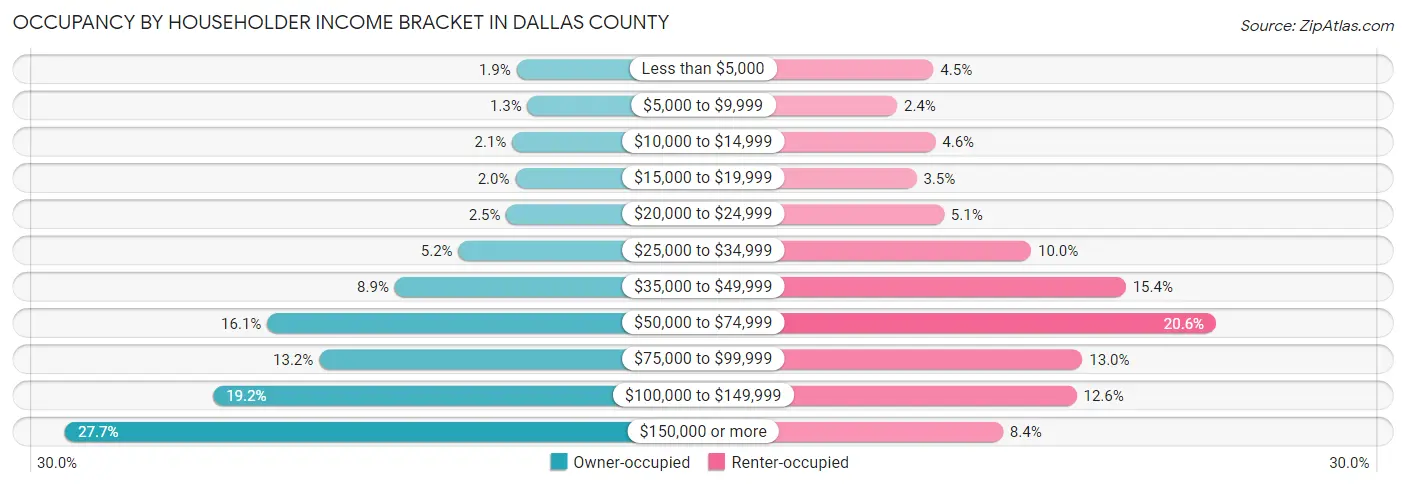
| Income Bracket | Owner-occupied | Renter-occupied |
| Less than $5,000 | 9,172 (1.9%) | 21,125 (4.4%) |
| $5,000 to $9,999 | 6,112 (1.3%) | 11,259 (2.4%) |
| $10,000 to $14,999 | 10,395 (2.1%) | 21,651 (4.6%) |
| $15,000 to $19,999 | 9,495 (2.0%) | 16,533 (3.5%) |
| $20,000 to $24,999 | 11,994 (2.5%) | 23,977 (5.1%) |
| $25,000 to $34,999 | 25,233 (5.2%) | 47,603 (10.0%) |
| $35,000 to $49,999 | 42,907 (8.8%) | 73,280 (15.4%) |
| $50,000 to $74,999 | 78,251 (16.1%) | 97,708 (20.6%) |
| $75,000 to $99,999 | 63,812 (13.2%) | 61,490 (13.0%) |
| $100,000 to $149,999 | 93,146 (19.2%) | 59,920 (12.6%) |
| $150,000 or more | 134,181 (27.7%) | 39,940 (8.4%) |
| Total | 484,698 (100.0%) | 474,486 (100.0%) |
Monthly Housing Cost Tiers in Dallas County
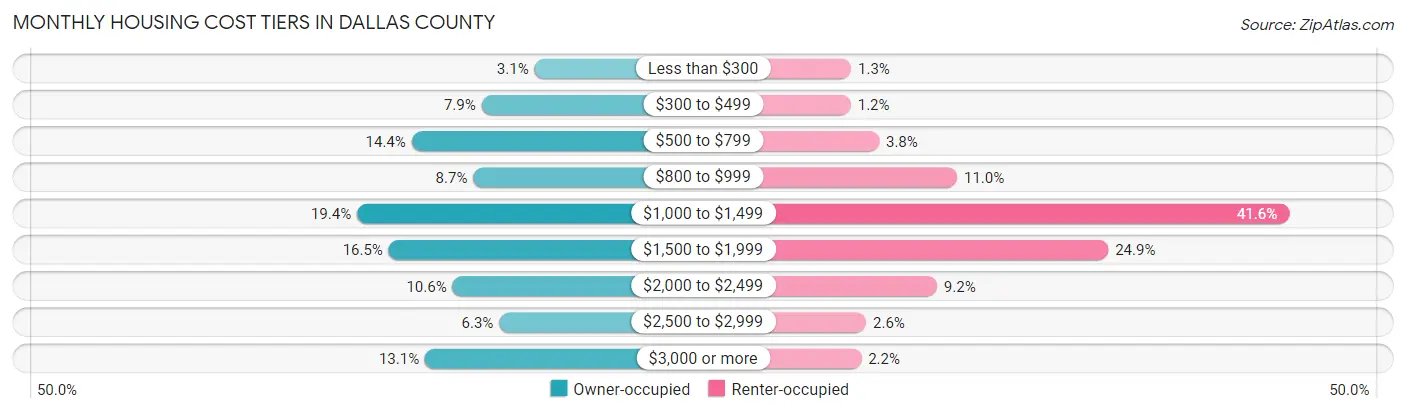
| Monthly Cost | Owner-occupied | Renter-occupied |
| Less than $300 | 14,851 (3.1%) | 5,981 (1.3%) |
| $300 to $499 | 38,425 (7.9%) | 5,846 (1.2%) |
| $500 to $799 | 69,659 (14.4%) | 18,154 (3.8%) |
| $800 to $999 | 42,171 (8.7%) | 52,225 (11.0%) |
| $1,000 to $1,499 | 94,021 (19.4%) | 197,267 (41.6%) |
| $1,500 to $1,999 | 79,880 (16.5%) | 118,288 (24.9%) |
| $2,000 to $2,499 | 51,408 (10.6%) | 43,452 (9.2%) |
| $2,500 to $2,999 | 30,599 (6.3%) | 12,543 (2.6%) |
| $3,000 or more | 63,684 (13.1%) | 10,394 (2.2%) |
| Total | 484,698 (100.0%) | 474,486 (100.0%) |
Physical Housing Characteristics in Dallas County
Housing Structures in Dallas County

| Structure Type | # Housing Units | % Housing Units |
| Single Unit, Detached | 521,702 | 54.4% |
| Single Unit, Attached | 36,917 | 3.8% |
| 2 Unit Apartments | 12,807 | 1.3% |
| 3 or 4 Unit Apartments | 42,221 | 4.4% |
| 5 to 9 Unit Apartments | 64,940 | 6.8% |
| 10 or more Apartments | 264,672 | 27.6% |
| Mobile Home / Other | 15,925 | 1.7% |
| Total | 959,184 | 100.0% |
Housing Structures by Occupancy in Dallas County
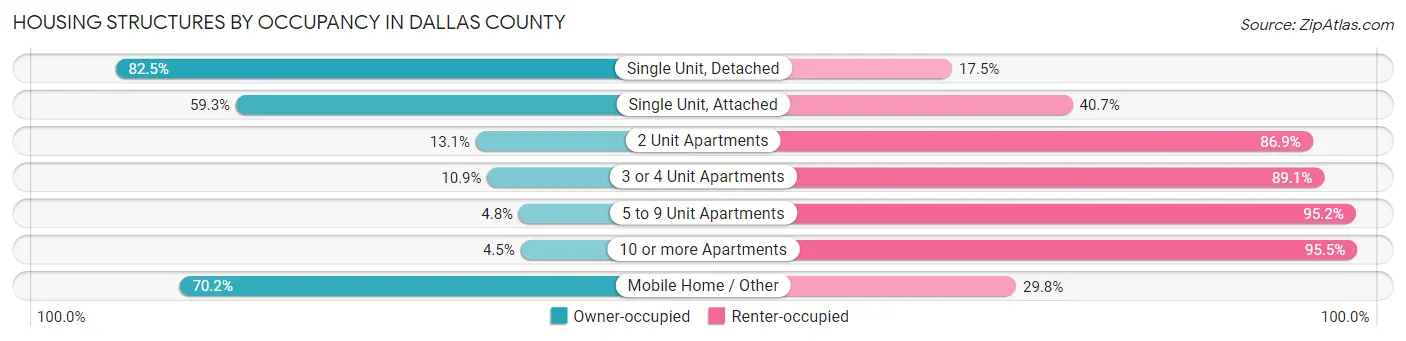
| Structure Type | Owner-occupied | Renter-occupied |
| Single Unit, Detached | 430,287 (82.5%) | 91,415 (17.5%) |
| Single Unit, Attached | 21,894 (59.3%) | 15,023 (40.7%) |
| 2 Unit Apartments | 1,679 (13.1%) | 11,128 (86.9%) |
| 3 or 4 Unit Apartments | 4,602 (10.9%) | 37,619 (89.1%) |
| 5 to 9 Unit Apartments | 3,133 (4.8%) | 61,807 (95.2%) |
| 10 or more Apartments | 11,929 (4.5%) | 252,743 (95.5%) |
| Mobile Home / Other | 11,174 (70.2%) | 4,751 (29.8%) |
| Total | 484,698 (50.5%) | 474,486 (49.5%) |
Housing Structures by Number of Rooms in Dallas County
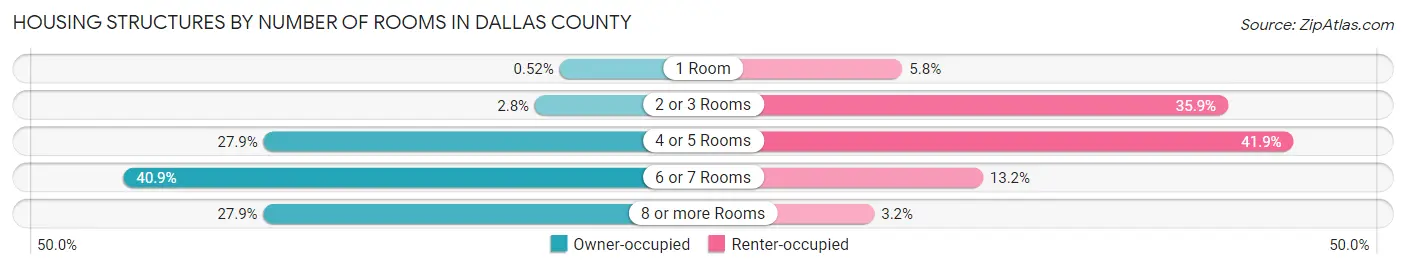
| Number of Rooms | Owner-occupied | Renter-occupied |
| 1 Room | 2,537 (0.5%) | 27,445 (5.8%) |
| 2 or 3 Rooms | 13,586 (2.8%) | 170,228 (35.9%) |
| 4 or 5 Rooms | 135,236 (27.9%) | 198,997 (41.9%) |
| 6 or 7 Rooms | 198,039 (40.9%) | 62,704 (13.2%) |
| 8 or more Rooms | 135,300 (27.9%) | 15,112 (3.2%) |
| Total | 484,698 (100.0%) | 474,486 (100.0%) |
Housing Structure by Heating Type in Dallas County
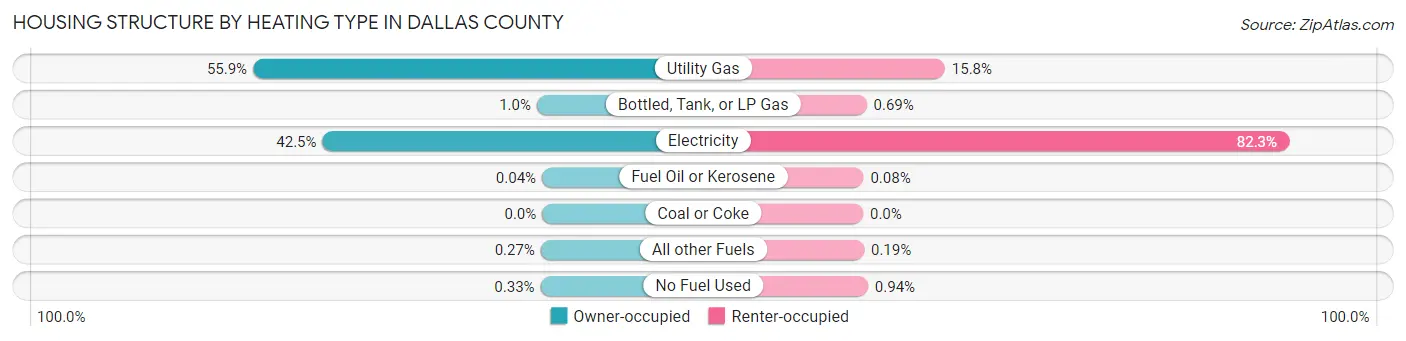
| Heating Type | Owner-occupied | Renter-occupied |
| Utility Gas | 270,860 (55.9%) | 75,016 (15.8%) |
| Bottled, Tank, or LP Gas | 4,923 (1.0%) | 3,289 (0.7%) |
| Electricity | 205,801 (42.5%) | 390,429 (82.3%) |
| Fuel Oil or Kerosene | 187 (0.0%) | 369 (0.1%) |
| Coal or Coke | 0 (0.0%) | 0 (0.0%) |
| All other Fuels | 1,318 (0.3%) | 905 (0.2%) |
| No Fuel Used | 1,609 (0.3%) | 4,478 (0.9%) |
| Total | 484,698 (100.0%) | 474,486 (100.0%) |
Household Vehicle Usage in Dallas County

| Vehicles per Household | Owner-occupied | Renter-occupied |
| No Vehicle | 11,573 (2.4%) | 52,787 (11.1%) |
| 1 Vehicle | 115,096 (23.7%) | 237,484 (50.0%) |
| 2 Vehicles | 206,705 (42.6%) | 141,697 (29.9%) |
| 3 or more Vehicles | 151,324 (31.2%) | 42,518 (9.0%) |
| Total | 484,698 (100.0%) | 474,486 (100.0%) |
Real Estate & Mortgages in Dallas County
Real Estate and Mortgage Overview in Dallas County
| Characteristic | Without Mortgage | With Mortgage |
| Housing Units | 201,217 | 283,481 |
| Median Property Value | $222,300 | $275,200 |
| Median Household Income | $73,155 | $94,295 |
| Monthly Housing Costs | $721 | $58,475 |
| Real Estate Taxes | $3,382 | $11,333 |
Property Value by Mortgage Status in Dallas County
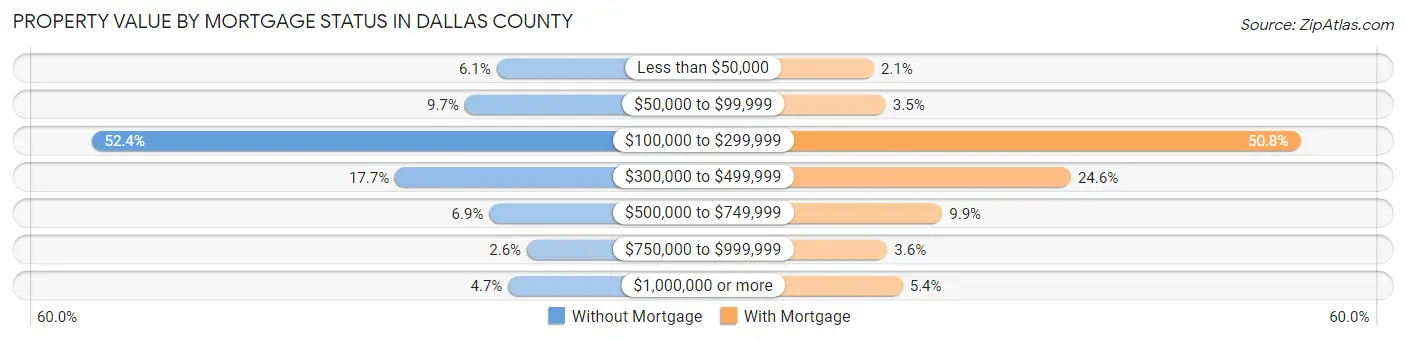
| Property Value | Without Mortgage | With Mortgage |
| Less than $50,000 | 12,189 (6.1%) | 6,007 (2.1%) |
| $50,000 to $99,999 | 19,542 (9.7%) | 9,827 (3.5%) |
| $100,000 to $299,999 | 105,328 (52.3%) | 144,097 (50.8%) |
| $300,000 to $499,999 | 35,541 (17.7%) | 69,800 (24.6%) |
| $500,000 to $749,999 | 13,888 (6.9%) | 28,130 (9.9%) |
| $750,000 to $999,999 | 5,207 (2.6%) | 10,321 (3.6%) |
| $1,000,000 or more | 9,522 (4.7%) | 15,299 (5.4%) |
| Total | 201,217 (100.0%) | 283,481 (100.0%) |
Household Income by Mortgage Status in Dallas County
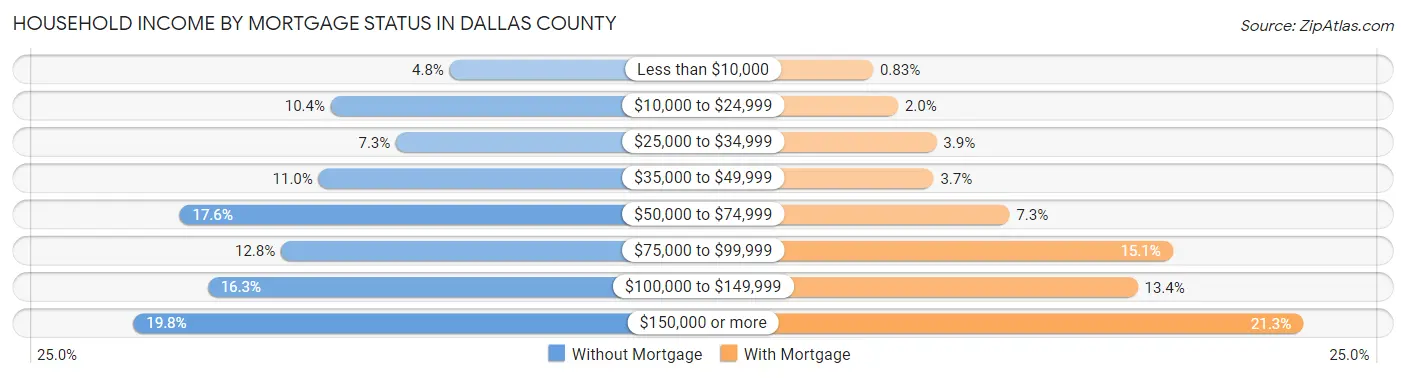
| Household Income | Without Mortgage | With Mortgage |
| Less than $10,000 | 9,571 (4.8%) | 2,341 (0.8%) |
| $10,000 to $24,999 | 20,962 (10.4%) | 5,713 (2.0%) |
| $25,000 to $34,999 | 14,712 (7.3%) | 10,922 (3.8%) |
| $35,000 to $49,999 | 22,138 (11.0%) | 10,521 (3.7%) |
| $50,000 to $74,999 | 35,455 (17.6%) | 20,769 (7.3%) |
| $75,000 to $99,999 | 25,743 (12.8%) | 42,796 (15.1%) |
| $100,000 to $149,999 | 32,750 (16.3%) | 38,069 (13.4%) |
| $150,000 or more | 39,886 (19.8%) | 60,396 (21.3%) |
| Total | 201,217 (100.0%) | 283,481 (100.0%) |
Property Value to Household Income Ratio in Dallas County
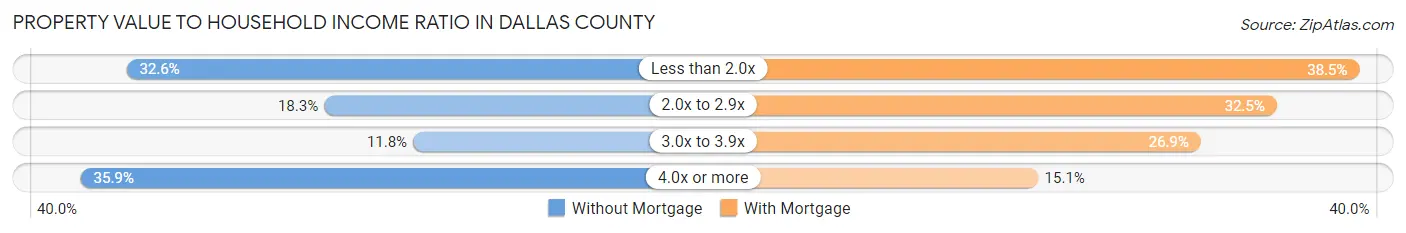
| Value-to-Income Ratio | Without Mortgage | With Mortgage |
| Less than 2.0x | 65,595 (32.6%) | 109,037 (38.5%) |
| 2.0x to 2.9x | 36,732 (18.2%) | 92,008 (32.5%) |
| 3.0x to 3.9x | 23,728 (11.8%) | 76,375 (26.9%) |
| 4.0x or more | 72,293 (35.9%) | 42,770 (15.1%) |
| Total | 201,217 (100.0%) | 283,481 (100.0%) |
Real Estate Taxes by Mortgage Status in Dallas County
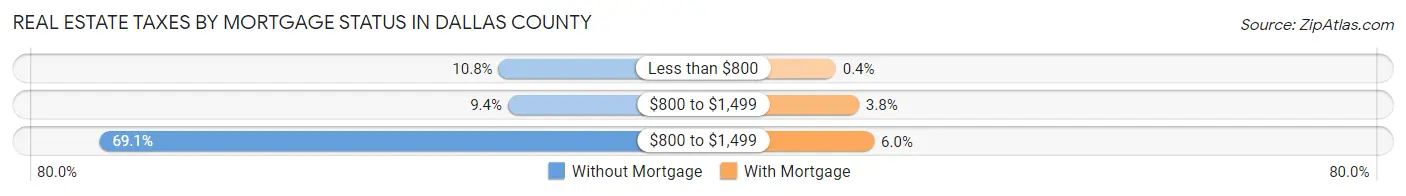
| Property Taxes | Without Mortgage | With Mortgage |
| Less than $800 | 21,670 (10.8%) | 1,143 (0.4%) |
| $800 to $1,499 | 18,915 (9.4%) | 10,705 (3.8%) |
| $800 to $1,499 | 138,933 (69.1%) | 17,048 (6.0%) |
| Total | 201,217 (100.0%) | 283,481 (100.0%) |
Health & Disability in Dallas County
Health Insurance Coverage by Age in Dallas County
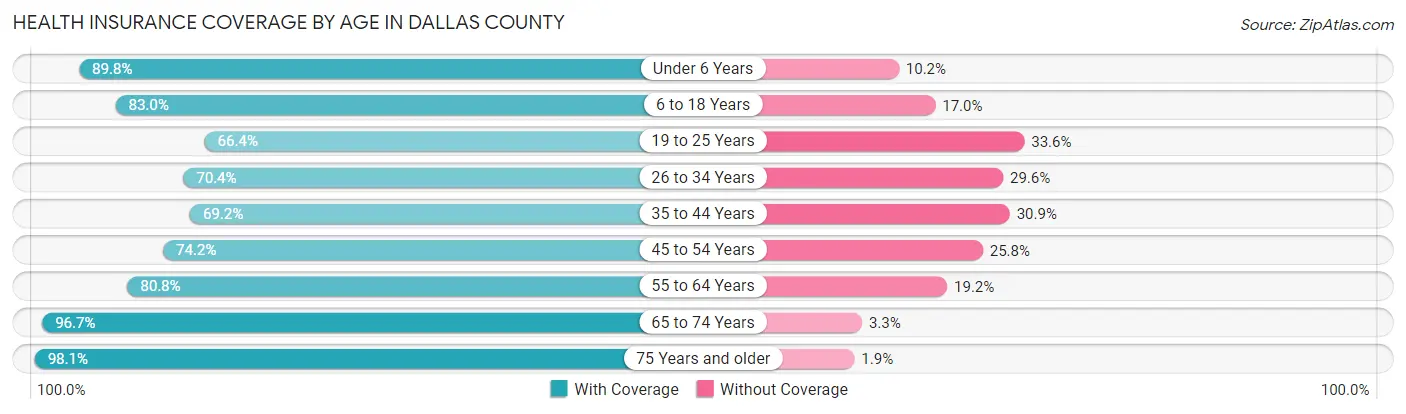
| Age Bracket | With Coverage | Without Coverage |
| Under 6 Years | 196,392 (89.8%) | 22,243 (10.2%) |
| 6 to 18 Years | 402,191 (83.0%) | 82,197 (17.0%) |
| 19 to 25 Years | 173,307 (66.4%) | 87,528 (33.6%) |
| 26 to 34 Years | 267,770 (70.4%) | 112,624 (29.6%) |
| 35 to 44 Years | 245,748 (69.2%) | 109,647 (30.8%) |
| 45 to 54 Years | 235,409 (74.2%) | 81,994 (25.8%) |
| 55 to 64 Years | 229,500 (80.8%) | 54,417 (19.2%) |
| 65 to 74 Years | 172,207 (96.7%) | 5,860 (3.3%) |
| 75 Years and older | 104,467 (98.1%) | 2,011 (1.9%) |
| Total | 2,026,991 (78.4%) | 558,521 (21.6%) |
Health Insurance Coverage by Citizenship Status in Dallas County
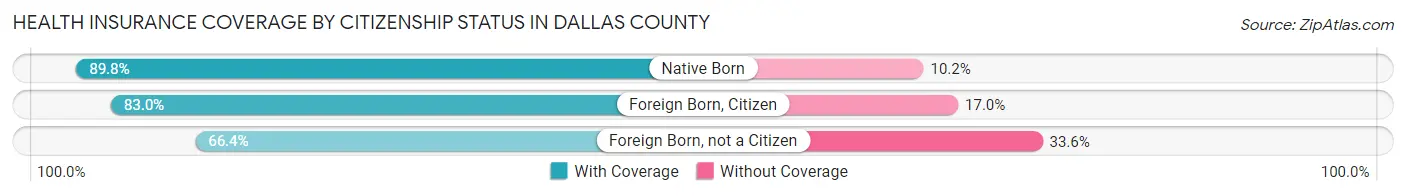
| Citizenship Status | With Coverage | Without Coverage |
| Native Born | 196,392 (89.8%) | 22,243 (10.2%) |
| Foreign Born, Citizen | 402,191 (83.0%) | 82,197 (17.0%) |
| Foreign Born, not a Citizen | 173,307 (66.4%) | 87,528 (33.6%) |
Health Insurance Coverage by Household Income in Dallas County
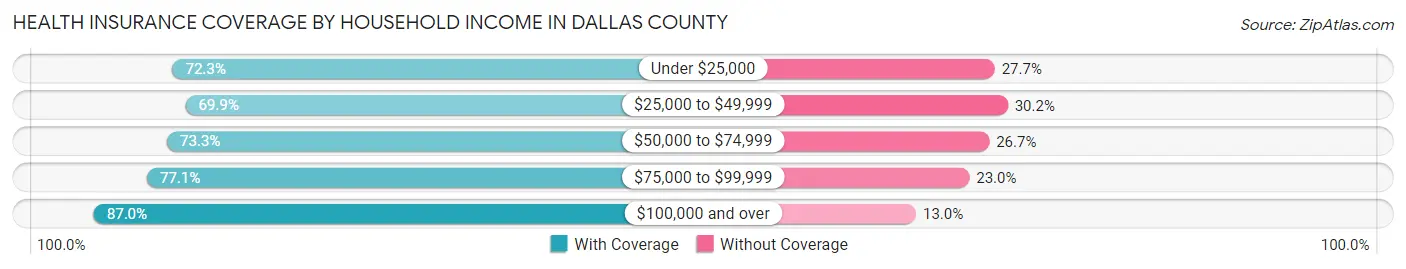
| Household Income | With Coverage | Without Coverage |
| Under $25,000 | 204,180 (72.3%) | 78,321 (27.7%) |
| $25,000 to $49,999 | 332,542 (69.9%) | 143,532 (30.1%) |
| $50,000 to $74,999 | 337,623 (73.3%) | 122,909 (26.7%) |
| $75,000 to $99,999 | 273,824 (77.0%) | 81,552 (23.0%) |
| $100,000 and over | 867,513 (87.0%) | 129,401 (13.0%) |
Public vs Private Health Insurance Coverage by Age in Dallas County
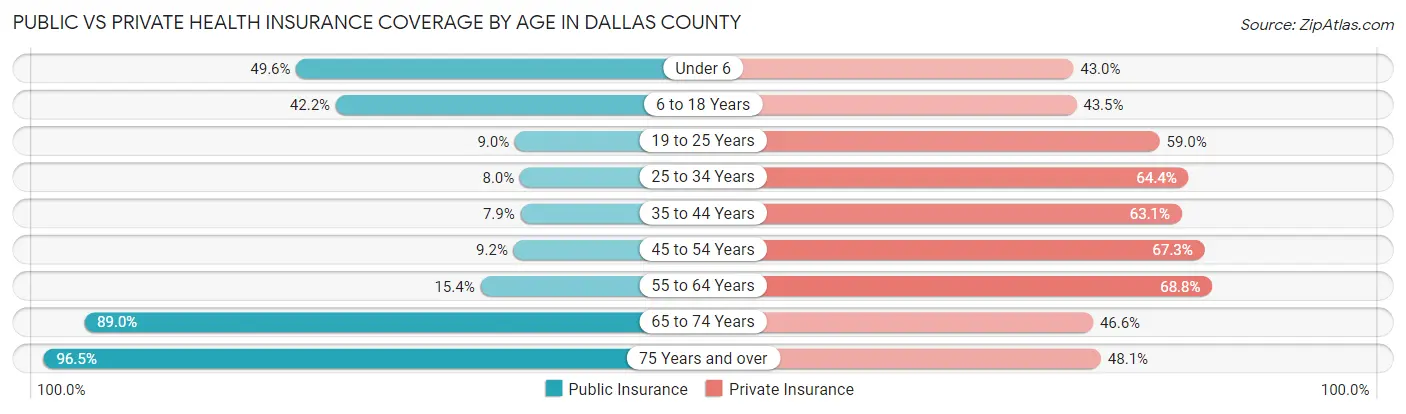
| Age Bracket | Public Insurance | Private Insurance |
| Under 6 | 108,345 (49.6%) | 93,942 (43.0%) |
| 6 to 18 Years | 204,515 (42.2%) | 210,784 (43.5%) |
| 19 to 25 Years | 23,358 (9.0%) | 153,873 (59.0%) |
| 25 to 34 Years | 30,519 (8.0%) | 244,880 (64.4%) |
| 35 to 44 Years | 28,226 (7.9%) | 224,296 (63.1%) |
| 45 to 54 Years | 29,247 (9.2%) | 213,726 (67.3%) |
| 55 to 64 Years | 43,677 (15.4%) | 195,241 (68.8%) |
| 65 to 74 Years | 158,437 (89.0%) | 83,013 (46.6%) |
| 75 Years and over | 102,741 (96.5%) | 51,219 (48.1%) |
| Total | 729,065 (28.2%) | 1,470,974 (56.9%) |
Disability Status by Sex by Age in Dallas County
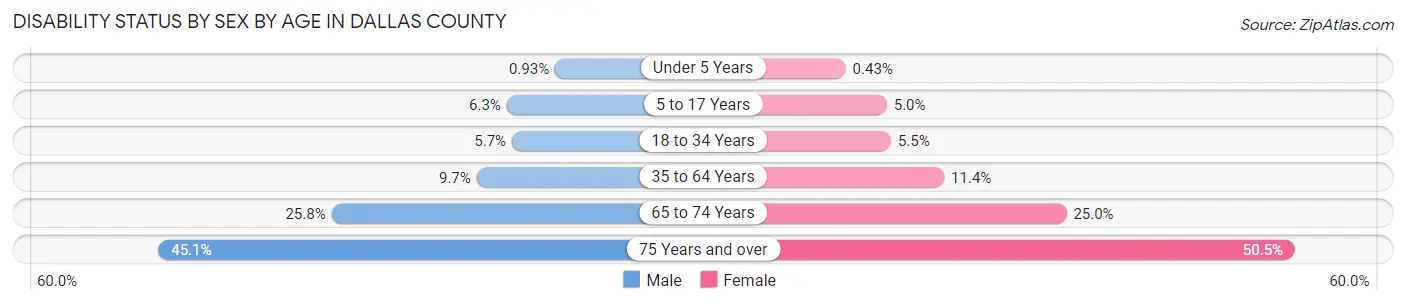
| Age Bracket | Male | Female |
| Under 5 Years | 870 (0.9%) | 386 (0.4%) |
| 5 to 17 Years | 15,558 (6.3%) | 11,838 (5.0%) |
| 18 to 34 Years | 19,549 (5.7%) | 18,538 (5.5%) |
| 35 to 64 Years | 45,977 (9.7%) | 54,807 (11.4%) |
| 65 to 74 Years | 21,104 (25.8%) | 24,105 (25.0%) |
| 75 Years and over | 19,139 (45.1%) | 32,319 (50.5%) |
Disability Class by Sex by Age in Dallas County
Disability Class: Hearing Difficulty
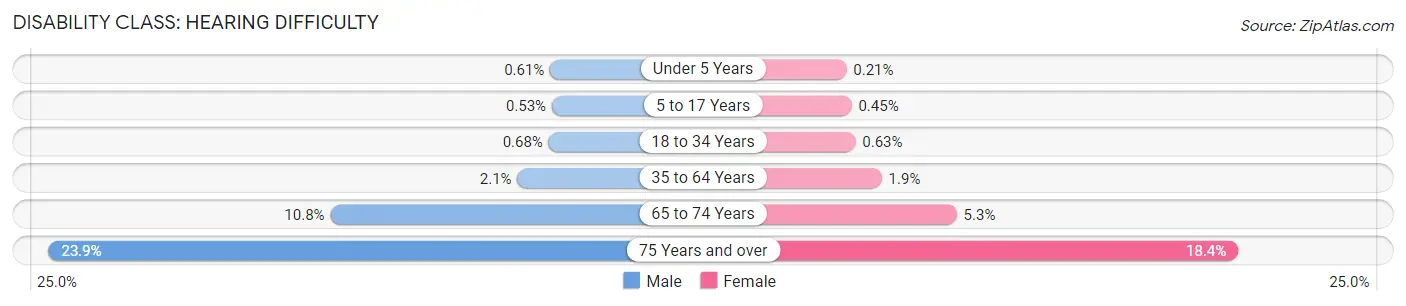
| Age Bracket | Male | Female |
| Under 5 Years | 571 (0.6%) | 191 (0.2%) |
| 5 to 17 Years | 1,302 (0.5%) | 1,054 (0.4%) |
| 18 to 34 Years | 2,309 (0.7%) | 2,117 (0.6%) |
| 35 to 64 Years | 10,139 (2.1%) | 8,892 (1.8%) |
| 65 to 74 Years | 8,831 (10.8%) | 5,132 (5.3%) |
| 75 Years and over | 10,142 (23.9%) | 11,776 (18.4%) |
Disability Class: Vision Difficulty
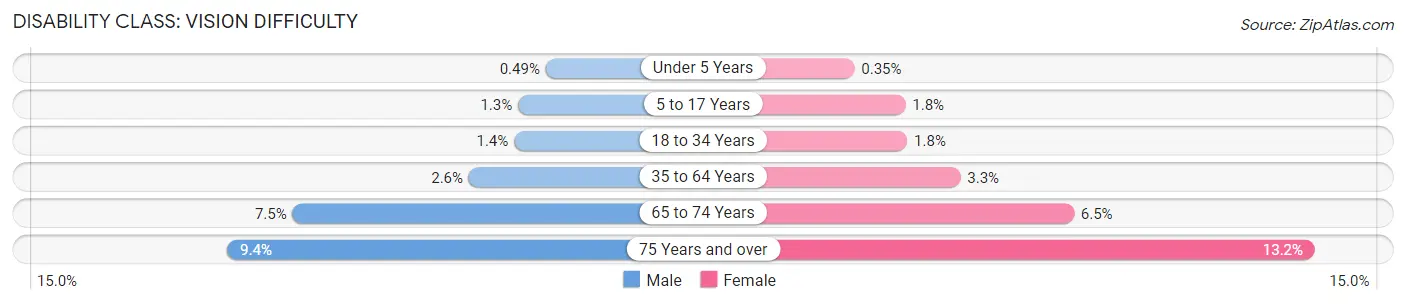
| Age Bracket | Male | Female |
| Under 5 Years | 453 (0.5%) | 311 (0.4%) |
| 5 to 17 Years | 3,095 (1.3%) | 4,192 (1.8%) |
| 18 to 34 Years | 4,675 (1.4%) | 6,151 (1.8%) |
| 35 to 64 Years | 12,512 (2.6%) | 15,869 (3.3%) |
| 65 to 74 Years | 6,161 (7.5%) | 6,221 (6.5%) |
| 75 Years and over | 3,971 (9.4%) | 8,434 (13.2%) |
Disability Class: Cognitive Difficulty
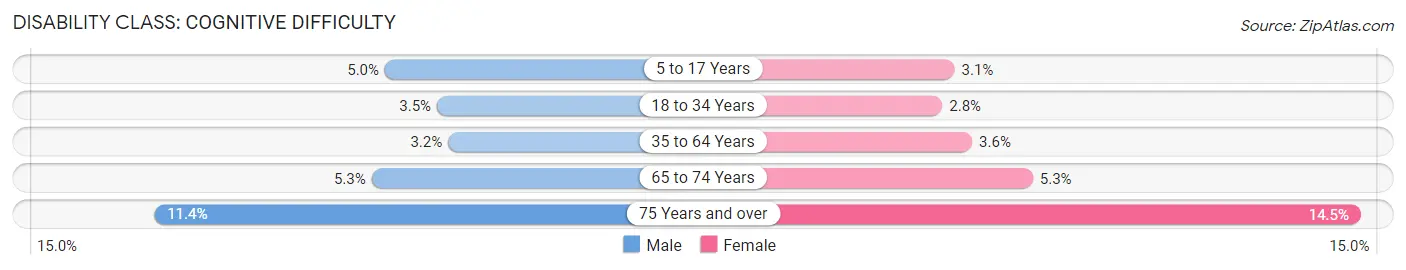
| Age Bracket | Male | Female |
| 5 to 17 Years | 12,234 (5.0%) | 7,424 (3.1%) |
| 18 to 34 Years | 11,989 (3.5%) | 9,476 (2.8%) |
| 35 to 64 Years | 15,298 (3.2%) | 17,458 (3.6%) |
| 65 to 74 Years | 4,363 (5.3%) | 5,121 (5.3%) |
| 75 Years and over | 4,834 (11.4%) | 9,253 (14.4%) |
Disability Class: Ambulatory Difficulty
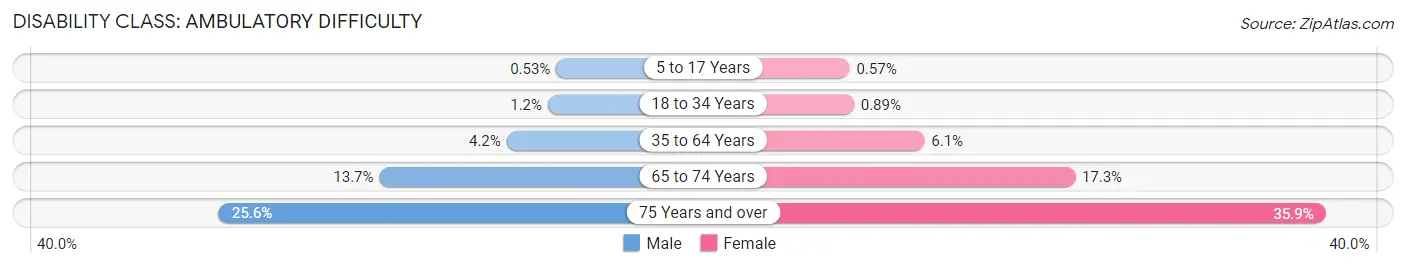
| Age Bracket | Male | Female |
| 5 to 17 Years | 1,311 (0.5%) | 1,358 (0.6%) |
| 18 to 34 Years | 3,906 (1.1%) | 2,995 (0.9%) |
| 35 to 64 Years | 20,021 (4.2%) | 29,488 (6.1%) |
| 65 to 74 Years | 11,165 (13.7%) | 16,680 (17.3%) |
| 75 Years and over | 10,851 (25.6%) | 22,997 (35.9%) |
Disability Class: Self-Care Difficulty

| Age Bracket | Male | Female |
| 5 to 17 Years | 2,886 (1.2%) | 2,024 (0.9%) |
| 18 to 34 Years | 2,394 (0.7%) | 2,209 (0.6%) |
| 35 to 64 Years | 7,758 (1.6%) | 10,887 (2.3%) |
| 65 to 74 Years | 4,159 (5.1%) | 5,326 (5.5%) |
| 75 Years and over | 4,264 (10.1%) | 10,578 (16.5%) |
Technology Access in Dallas County
Computing Device Access in Dallas County
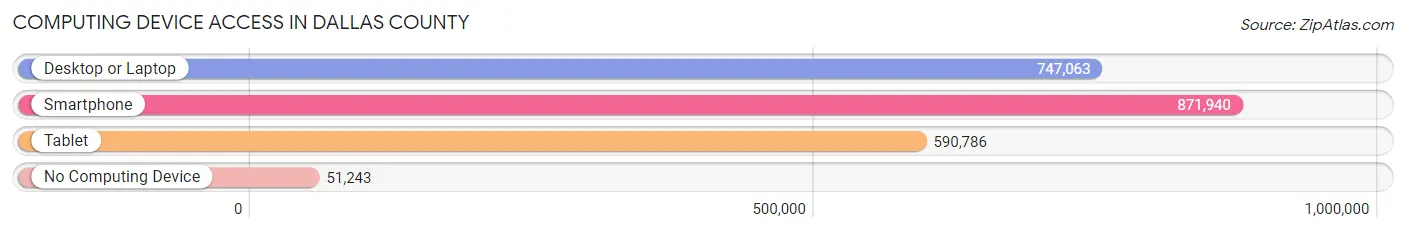
| Device Type | # Households | % Households |
| Desktop or Laptop | 747,063 | 77.9% |
| Smartphone | 871,940 | 90.9% |
| Tablet | 590,786 | 61.6% |
| No Computing Device | 51,243 | 5.3% |
| Total | 959,184 | 100.0% |
Internet Access in Dallas County

| Internet Type | # Households | % Households |
| Dial-Up Internet | 961 | 0.1% |
| Broadband Home | 691,968 | 72.1% |
| Cellular Data Only | 126,454 | 13.2% |
| Satellite Internet | 64,766 | 6.8% |
| No Internet | 112,425 | 11.7% |
| Total | 959,184 | 100.0% |
Dallas County Summary
Dallas County, Texas is located in the north-central part of the state and is part of the Dallas-Fort Worth-Arlington metropolitan area. It is the second-most populous county in Texas and the ninth-most populous county in the United States. The county seat is Dallas, the third-largest city in Texas and the ninth-largest city in the United States.
Geography
Dallas County is located in north-central Texas, and is bordered by Collin, Denton, Rockwall, Kaufman, Ellis, and Tarrant counties. It covers an area of 909 square miles, making it the second-largest county in Texas. The county is divided into four distinct regions: the Dallas-Fort Worth Metroplex, the Blackland Prairie, the Grand Prairie, and the East Texas Timberlands. The county is home to several major rivers, including the Trinity, Elm, and Trinity River.
The Dallas-Fort Worth Metroplex is the most populous region in the county, and is home to the cities of Dallas, Fort Worth, Arlington, Irving, and Grand Prairie. The Blackland Prairie is a region of rolling hills and grasslands, and is home to the cities of Mesquite, Garland, and Richardson. The Grand Prairie is a region of flat, open land, and is home to the cities of Cedar Hill, Duncanville, and DeSoto. The East Texas Timberlands is a region of dense forests and is home to the cities of Lancaster, Hutchins, and Wilmer.
Climate
Dallas County has a humid subtropical climate, with hot summers and mild winters. The average annual temperature is 68°F, and the average annual precipitation is 37.5 inches. The county is prone to severe weather, including tornadoes, thunderstorms, and hail.
Demographics
As of the 2010 census, Dallas County had a population of 2,368,139. The racial makeup of the county was 57.2% White, 25.7% Black or African American, 0.7% Native American, 5.7% Asian, 0.1% Pacific Islander, 8.3% from other races, and 2.3% from two or more races. Hispanic or Latino of any race were 24.2% of the population.
Economy
Dallas County is home to a diverse economy, with a variety of industries and businesses. The county is home to several Fortune 500 companies, including AT&T, ExxonMobil, Southwest Airlines, and Texas Instruments. The county is also home to several major universities, including the University of Texas at Dallas, Southern Methodist University, and the University of North Texas.
The county is home to several major airports, including Dallas/Fort Worth International Airport, Dallas Love Field, and Dallas Executive Airport. The county is also home to several major highways, including Interstate 20, Interstate 30, and Interstate 35.
Dallas County is home to a variety of cultural attractions, including the Dallas Museum of Art, the Dallas Zoo, and the Dallas Arboretum and Botanical Garden. The county is also home to several professional sports teams, including the Dallas Cowboys, the Dallas Mavericks, and the Texas Rangers.
Conclusion
Dallas County, Texas is a vibrant and diverse county located in north-central Texas. It is the second-most populous county in Texas and the ninth-most populous county in the United States. The county is home to a variety of industries and businesses, as well as several major universities, airports, and highways. The county is also home to a variety of cultural attractions, including museums, zoos, and professional sports teams. Dallas County is a great place to live, work, and play.
Common Questions
What is Per Capita Income in Dallas County?
Per Capita income in Dallas County is $39,172.
What is the Median Family Income in Dallas County?
Median Family Income in Dallas County is $80,917.
What is the Median Household income in Dallas County?
Median Household Income in Dallas County is $70,732.
What is Income or Wage Gap in Dallas County?
Income or Wage Gap in Dallas County is 23.3%.
Women in Dallas County earn 76.7 cents for every dollar earned by a man.
What is Family Income Deficit in Dallas County?
Family Income Deficit in Dallas County is $11,312.
Families that are below poverty line in Dallas County earn $11,312 less on average than the poverty threshold level.
What is Inequality or Gini Index in Dallas County?
Inequality or Gini Index in Dallas County is 0.49.
What is the Total Population of Dallas County?
Total Population of Dallas County is 2,604,053.
What is the Total Male Population of Dallas County?
Total Male Population of Dallas County is 1,294,332.
What is the Total Female Population of Dallas County?
Total Female Population of Dallas County is 1,309,721.
What is the Ratio of Males per 100 Females in Dallas County?
There are 98.83 Males per 100 Females in Dallas County.
What is the Ratio of Females per 100 Males in Dallas County?
There are 101.19 Females per 100 Males in Dallas County.
What is the Median Population Age in Dallas County?
Median Population Age in Dallas County is 33.8 Years.
What is the Average Family Size in Dallas County
Average Family Size in Dallas County is 3.4 People.
What is the Average Household Size in Dallas County
Average Household Size in Dallas County is 2.7 People.
How Large is the Labor Force in Dallas County?
There are 1,389,858 People in the Labor Forcein in Dallas County.
What is the Percentage of People in the Labor Force in Dallas County?
69.0% of People are in the Labor Force in Dallas County.
What is the Unemployment Rate in Dallas County?
Unemployment Rate in Dallas County is 4.9%.