Ector County, TX Map & Demographics
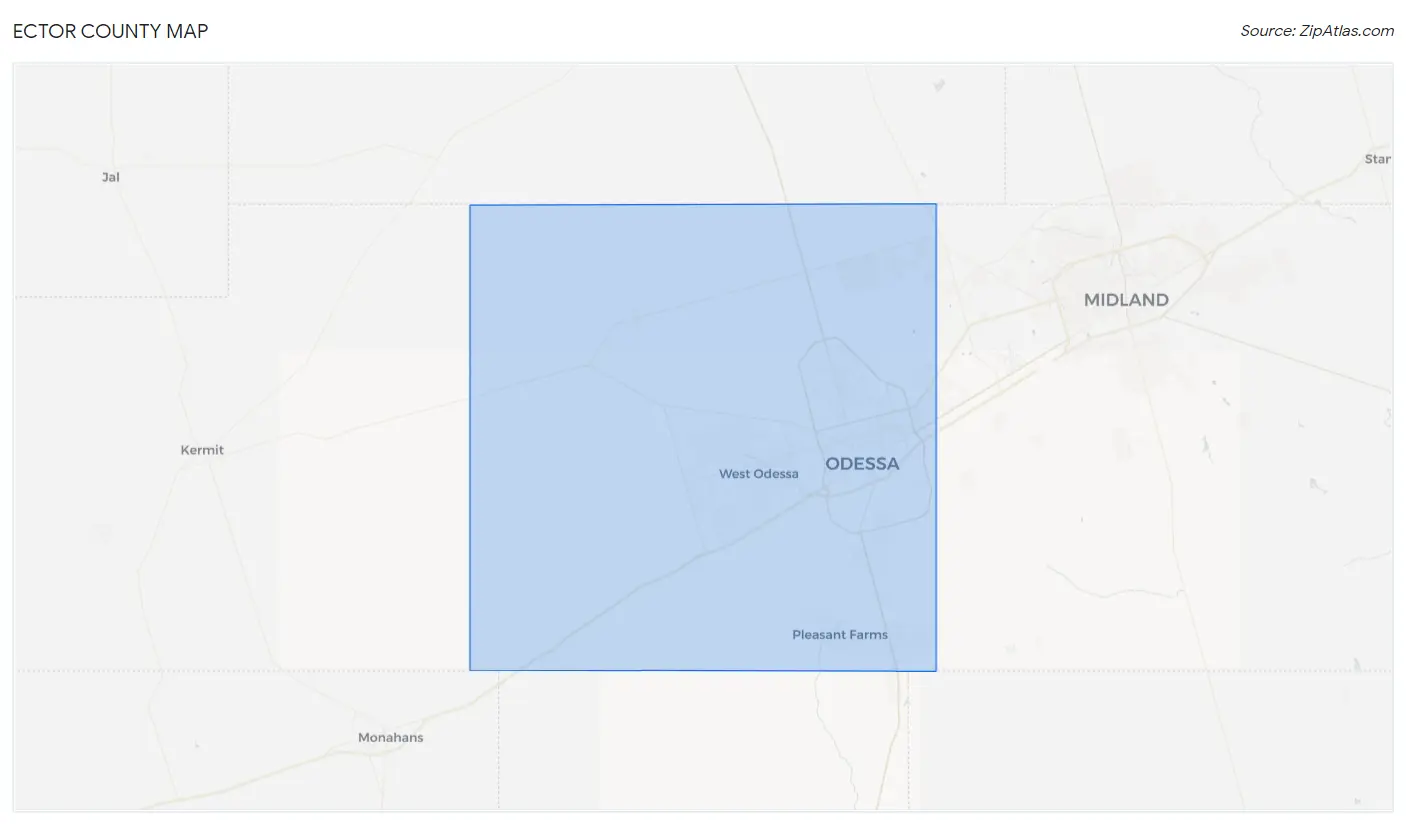
Ector County Map
Ector County Overview
$34,267
PER CAPITA INCOME
$81,404
AVG FAMILY INCOME
$70,566
AVG HOUSEHOLD INCOME
40.1%
WAGE / INCOME GAP [ % ]
59.9¢/ $1
WAGE / INCOME GAP [ $ ]
$13,800
FAMILY INCOME DEFICIT
0.46
INEQUALITY / GINI INDEX
162,300
TOTAL POPULATION
83,509
MALE POPULATION
78,791
FEMALE POPULATION
105.99
MALES / 100 FEMALES
94.35
FEMALES / 100 MALES
31.0
MEDIAN AGE
3.2
AVG FAMILY SIZE
2.6
AVG HOUSEHOLD SIZE
79,493
LABOR FORCE [ PEOPLE ]
67.3%
PERCENT IN LABOR FORCE
5.8%
UNEMPLOYMENT RATE
Ector County Area Codes
Income in Ector County
Income Overview in Ector County
Per Capita Income in Ector County is $34,267, while median incomes of families and households are $81,404 and $70,566 respectively.
| Characteristic | Number | Measure |
| Per Capita Income | 162,300 | $34,267 |
| Median Family Income | 41,497 | $81,404 |
| Mean Family Income | 41,497 | $104,112 |
| Median Household Income | 60,676 | $70,566 |
| Mean Household Income | 60,676 | $92,876 |
| Income Deficit | 41,497 | $13,800 |
| Wage / Income Gap (%) | 162,300 | 40.05% |
| Wage / Income Gap ($) | 162,300 | 59.95¢ per $1 |
| Gini / Inequality Index | 162,300 | 0.46 |
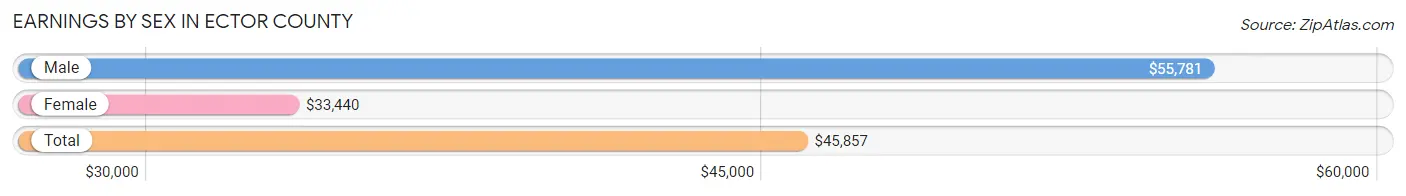
Earnings by Sex in Ector County
Average Earnings in Ector County are $45,857, $55,781 for men and $33,440 for women, a difference of 40.1%.
| Sex | Number | Average Earnings |
| Male | 48,944 (59.5%) | $55,781 |
| Female | 33,368 (40.5%) | $33,440 |
| Total | 82,312 (100.0%) | $45,857 |
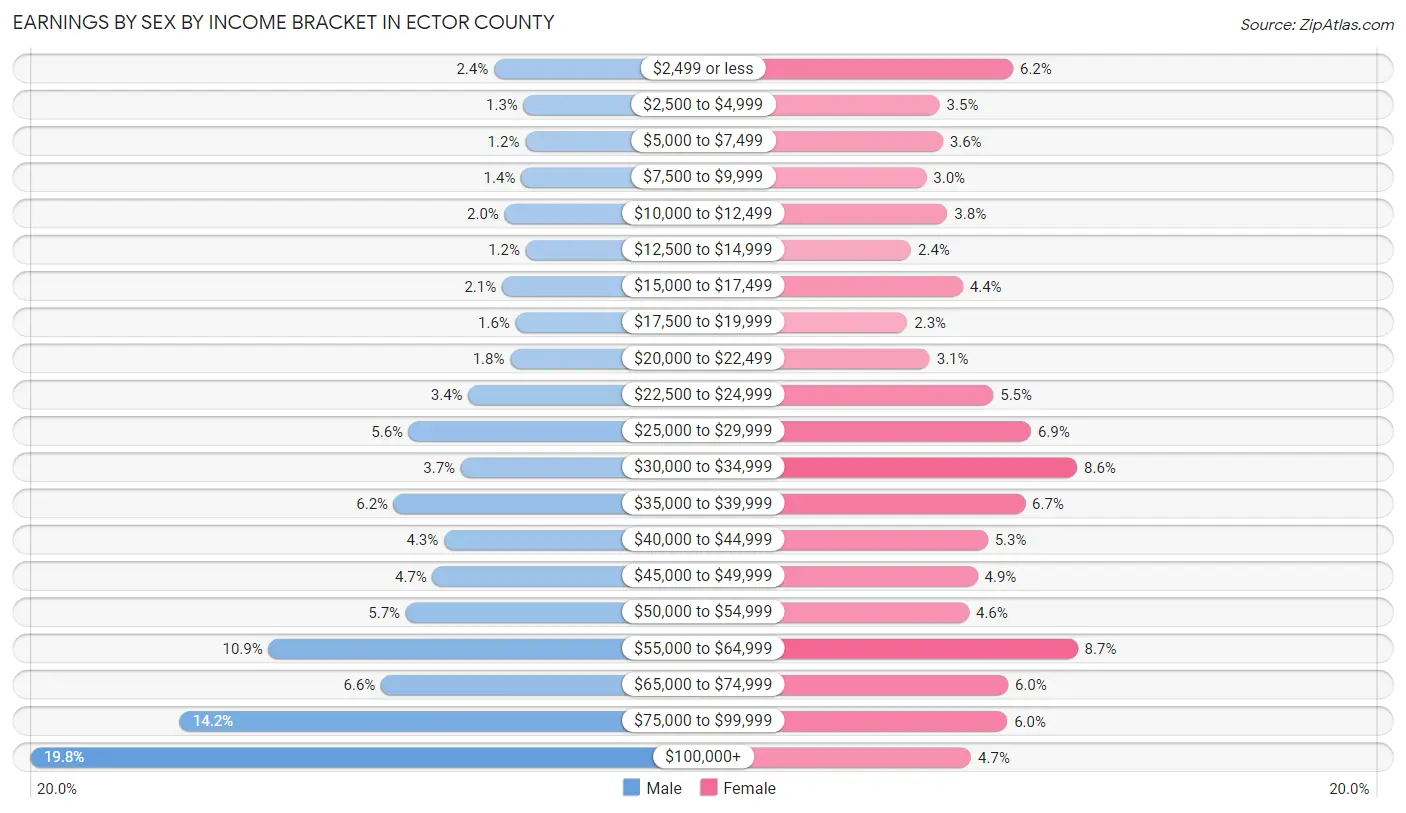
Earnings by Sex by Income Bracket in Ector County
The most common earnings brackets in Ector County are $100,000+ for men (9,670 | 19.8%) and $55,000 to $64,999 for women (2,885 | 8.6%).
| Income | Male | Female |
| $2,499 or less | 1,181 (2.4%) | 2,078 (6.2%) |
| $2,500 to $4,999 | 634 (1.3%) | 1,162 (3.5%) |
| $5,000 to $7,499 | 606 (1.2%) | 1,200 (3.6%) |
| $7,500 to $9,999 | 680 (1.4%) | 993 (3.0%) |
| $10,000 to $12,499 | 983 (2.0%) | 1,257 (3.8%) |
| $12,500 to $14,999 | 599 (1.2%) | 803 (2.4%) |
| $15,000 to $17,499 | 1,031 (2.1%) | 1,452 (4.3%) |
| $17,500 to $19,999 | 781 (1.6%) | 759 (2.3%) |
| $20,000 to $22,499 | 879 (1.8%) | 1,039 (3.1%) |
| $22,500 to $24,999 | 1,648 (3.4%) | 1,831 (5.5%) |
| $25,000 to $29,999 | 2,743 (5.6%) | 2,301 (6.9%) |
| $30,000 to $34,999 | 1,787 (3.6%) | 2,879 (8.6%) |
| $35,000 to $39,999 | 3,015 (6.2%) | 2,228 (6.7%) |
| $40,000 to $44,999 | 2,096 (4.3%) | 1,762 (5.3%) |
| $45,000 to $49,999 | 2,307 (4.7%) | 1,635 (4.9%) |
| $50,000 to $54,999 | 2,797 (5.7%) | 1,529 (4.6%) |
| $55,000 to $64,999 | 5,314 (10.9%) | 2,885 (8.6%) |
| $65,000 to $74,999 | 3,252 (6.6%) | 2,015 (6.0%) |
| $75,000 to $99,999 | 6,941 (14.2%) | 2,005 (6.0%) |
| $100,000+ | 9,670 (19.8%) | 1,555 (4.7%) |
| Total | 48,944 (100.0%) | 33,368 (100.0%) |
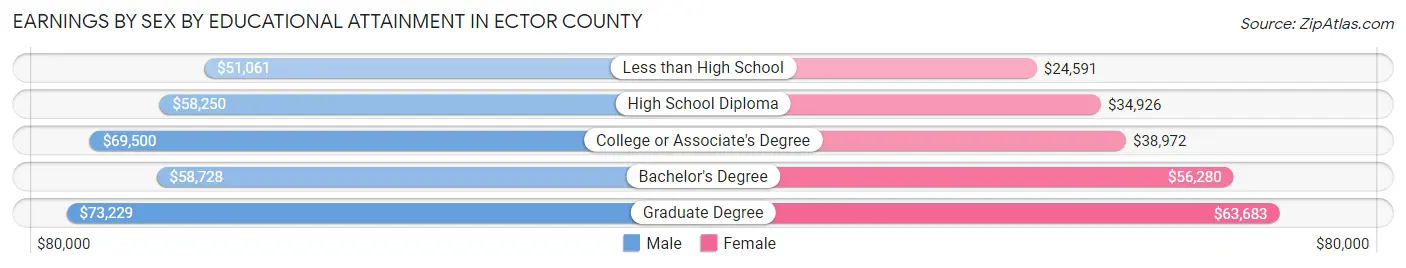
Earnings by Sex by Educational Attainment in Ector County
Average earnings in Ector County are $59,399 for men and $36,750 for women, a difference of 38.1%. Men with an educational attainment of graduate degree enjoy the highest average annual earnings of $73,229, while those with less than high school education earn the least with $51,061. Women with an educational attainment of graduate degree earn the most with the average annual earnings of $63,683, while those with less than high school education have the smallest earnings of $24,591.
| Educational Attainment | Male Income | Female Income |
| Less than High School | $51,061 | $24,591 |
| High School Diploma | $58,250 | $34,926 |
| College or Associate's Degree | $69,500 | $38,972 |
| Bachelor's Degree | $58,728 | $56,280 |
| Graduate Degree | $73,229 | $63,683 |
| Total | $59,399 | $36,750 |
Family Income in Ector County
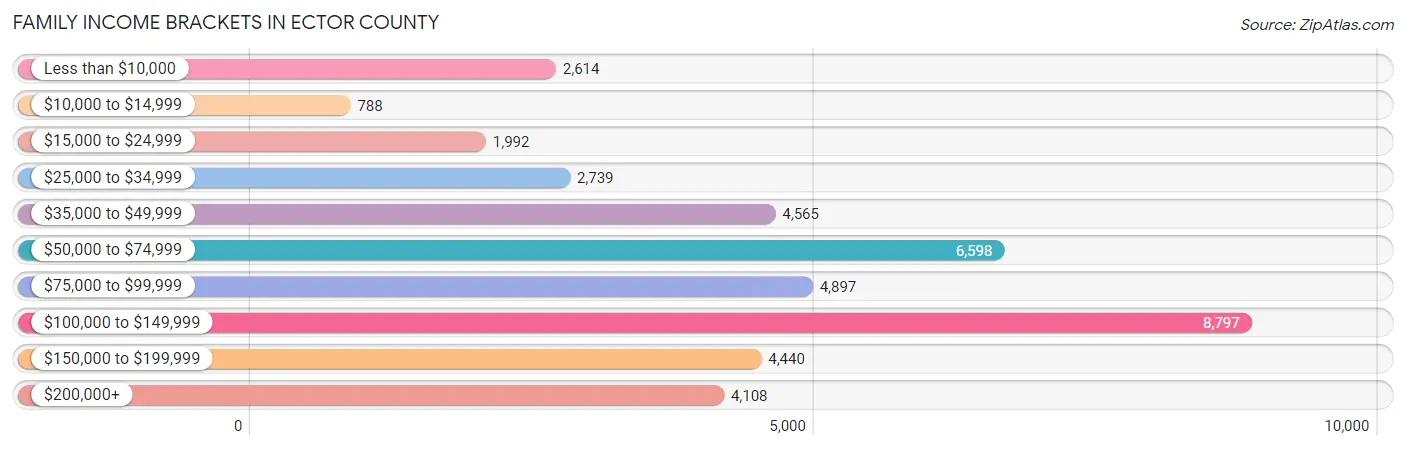
Family Income Brackets in Ector County
According to the Ector County family income data, there are 8,797 families falling into the $100,000 to $149,999 income range, which is the most common income bracket and makes up 21.2% of all families. Conversely, the $10,000 to $14,999 income bracket is the least frequent group with only 788 families (1.9%) belonging to this category.
| Income Bracket | # Families | % Families |
| Less than $10,000 | 2,614 | 6.3% |
| $10,000 to $14,999 | 788 | 1.9% |
| $15,000 to $24,999 | 1,992 | 4.8% |
| $25,000 to $34,999 | 2,739 | 6.6% |
| $35,000 to $49,999 | 4,565 | 11.0% |
| $50,000 to $74,999 | 6,598 | 15.9% |
| $75,000 to $99,999 | 4,897 | 11.8% |
| $100,000 to $149,999 | 8,797 | 21.2% |
| $150,000 to $199,999 | 4,440 | 10.7% |
| $200,000+ | 4,108 | 9.9% |
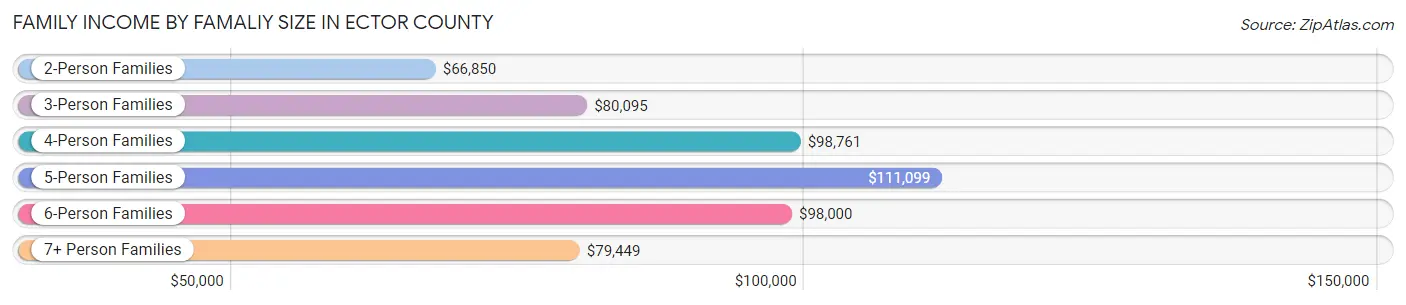
Family Income by Famaliy Size in Ector County
5-person families (5,449 | 13.1%) account for the highest median family income in Ector County with $111,099 per family, while 2-person families (15,806 | 38.1%) have the highest median income of $33,425 per family member.
| Income Bracket | # Families | Median Income |
| 2-Person Families | 15,806 (38.1%) | $66,850 |
| 3-Person Families | 9,097 (21.9%) | $80,095 |
| 4-Person Families | 7,902 (19.0%) | $98,761 |
| 5-Person Families | 5,449 (13.1%) | $111,099 |
| 6-Person Families | 2,350 (5.7%) | $98,000 |
| 7+ Person Families | 893 (2.1%) | $79,449 |
| Total | 41,497 (100.0%) | $81,404 |
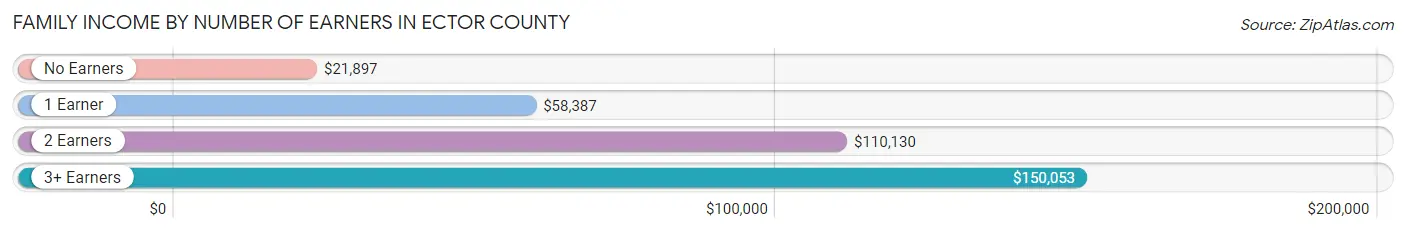
Family Income by Number of Earners in Ector County
The median family income in Ector County is $81,404, with families comprising 3+ earners (4,839) having the highest median family income of $150,053, while families with no earners (4,279) have the lowest median family income of $21,897, accounting for 11.7% and 10.3% of families, respectively.
| Number of Earners | # Families | Median Income |
| No Earners | 4,279 (10.3%) | $21,897 |
| 1 Earner | 16,119 (38.8%) | $58,387 |
| 2 Earners | 16,260 (39.2%) | $110,130 |
| 3+ Earners | 4,839 (11.7%) | $150,053 |
| Total | 41,497 (100.0%) | $81,404 |
Household Income in Ector County
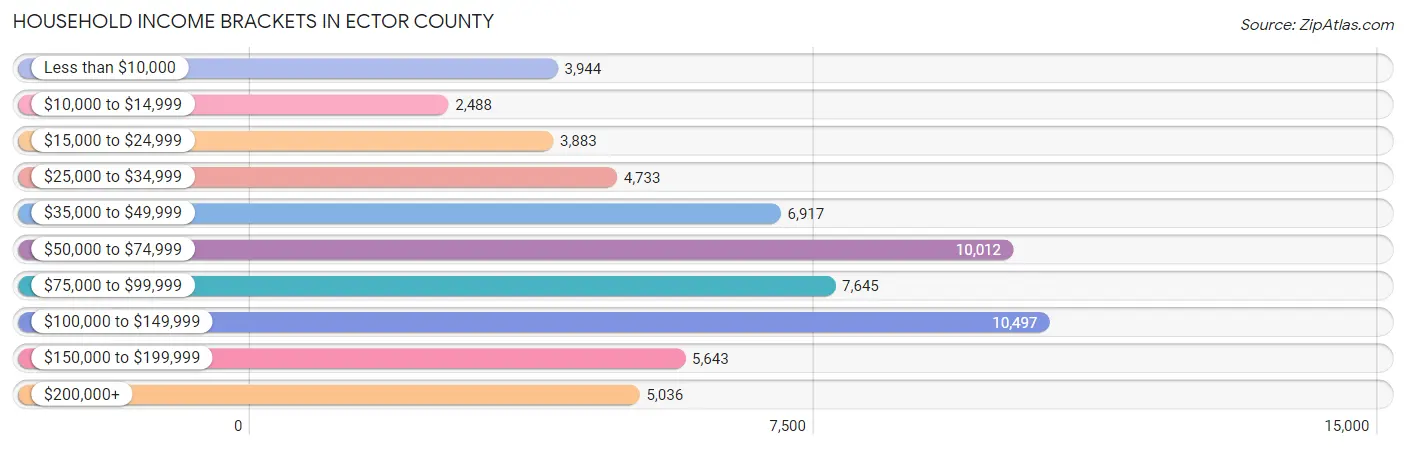
Household Income Brackets in Ector County
With 10,497 households falling in the category, the $100,000 to $149,999 income range is the most frequent in Ector County, accounting for 17.3% of all households. In contrast, only 2,488 households (4.1%) fall into the $10,000 to $14,999 income bracket, making it the least populous group.
| Income Bracket | # Households | % Households |
| Less than $10,000 | 3,944 | 6.5% |
| $10,000 to $14,999 | 2,488 | 4.1% |
| $15,000 to $24,999 | 3,883 | 6.4% |
| $25,000 to $34,999 | 4,733 | 7.8% |
| $35,000 to $49,999 | 6,917 | 11.4% |
| $50,000 to $74,999 | 10,012 | 16.5% |
| $75,000 to $99,999 | 7,645 | 12.6% |
| $100,000 to $149,999 | 10,497 | 17.3% |
| $150,000 to $199,999 | 5,643 | 9.3% |
| $200,000+ | 5,036 | 8.3% |
Household Income by Householder Age in Ector County
The median household income in Ector County is $70,566, with the highest median household income of $86,449 found in the 45 to 64 years age bracket for the primary householder. A total of 20,266 households (33.4%) fall into this category. Meanwhile, the 65+ years age bracket for the primary householder has the lowest median household income of $39,418, with 10,364 households (17.1%) in this group.
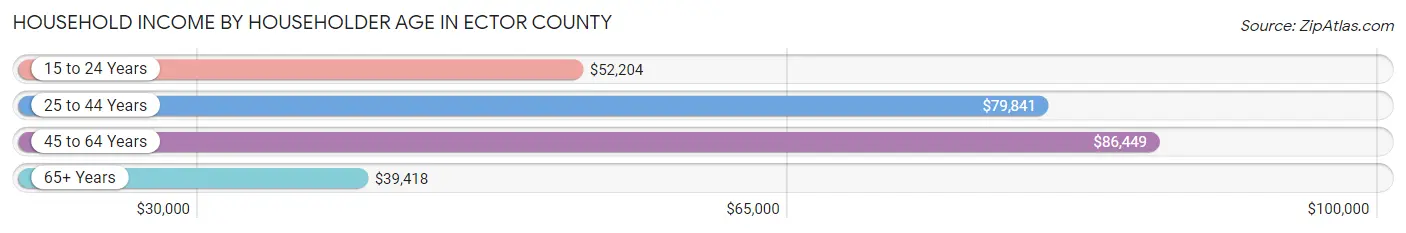
| Income Bracket | # Households | Median Income |
| 15 to 24 Years | 4,753 (7.8%) | $52,204 |
| 25 to 44 Years | 25,293 (41.7%) | $79,841 |
| 45 to 64 Years | 20,266 (33.4%) | $86,449 |
| 65+ Years | 10,364 (17.1%) | $39,418 |
| Total | 60,676 (100.0%) | $70,566 |
Poverty in Ector County
Income Below Poverty by Sex and Age in Ector County
With 12.8% poverty level for males and 18.9% for females among the residents of Ector County, 12 to 14 year old males and 15 year old females are the most vulnerable to poverty, with 1,080 males (26.0%) and 323 females (28.7%) in their respective age groups living below the poverty level.
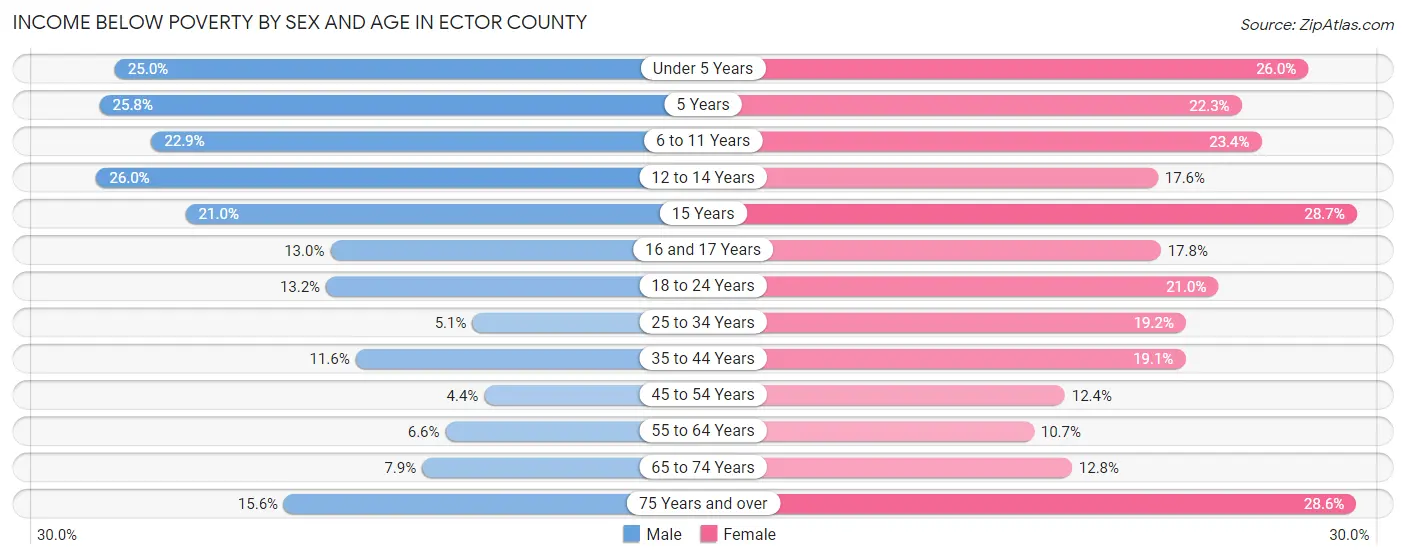
| Age Bracket | Male | Female |
| Under 5 Years | 1,829 (25.0%) | 1,727 (26.0%) |
| 5 Years | 434 (25.8%) | 306 (22.3%) |
| 6 to 11 Years | 1,819 (22.9%) | 1,915 (23.4%) |
| 12 to 14 Years | 1,080 (26.0%) | 671 (17.6%) |
| 15 Years | 285 (21.0%) | 323 (28.7%) |
| 16 and 17 Years | 315 (13.0%) | 453 (17.8%) |
| 18 to 24 Years | 1,101 (13.2%) | 1,578 (21.0%) |
| 25 to 34 Years | 714 (5.1%) | 2,392 (19.2%) |
| 35 to 44 Years | 1,371 (11.6%) | 1,919 (19.1%) |
| 45 to 54 Years | 383 (4.4%) | 1,039 (12.4%) |
| 55 to 64 Years | 503 (6.6%) | 812 (10.7%) |
| 65 to 74 Years | 346 (7.9%) | 620 (12.8%) |
| 75 Years and over | 367 (15.6%) | 995 (28.6%) |
| Total | 10,547 (12.8%) | 14,750 (18.9%) |
Income Above Poverty by Sex and Age in Ector County
According to the poverty statistics in Ector County, males aged 45 to 54 years and females aged 55 to 64 years are the age groups that are most secure financially, with 95.6% of males and 89.3% of females in these age groups living above the poverty line.
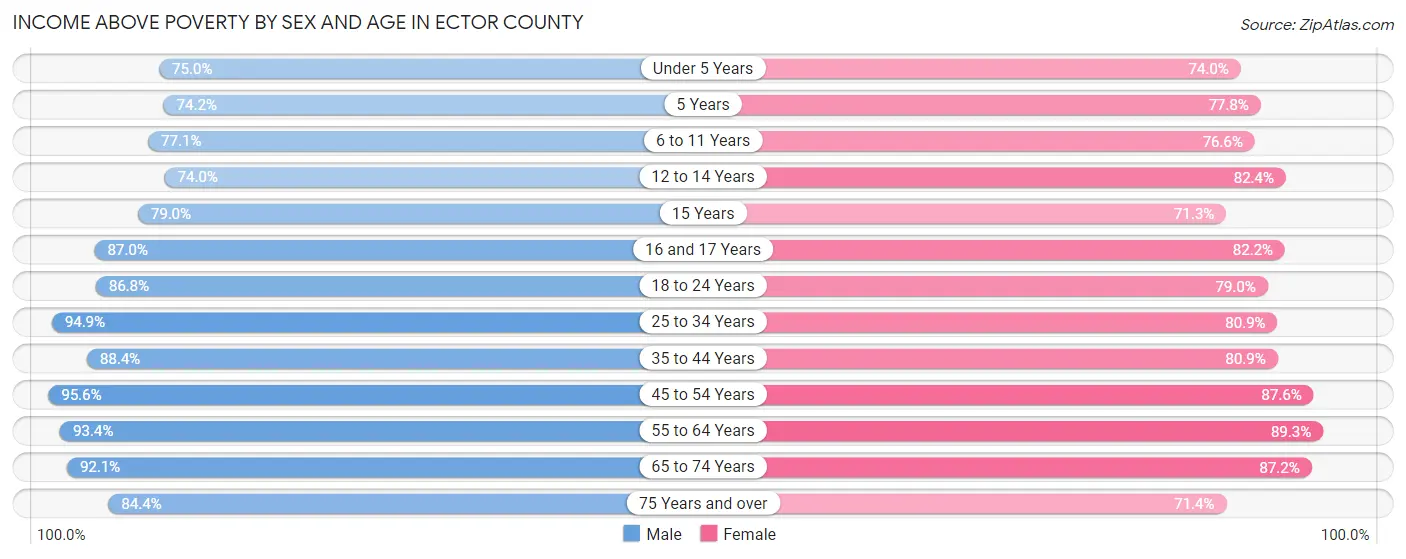
| Age Bracket | Male | Female |
| Under 5 Years | 5,496 (75.0%) | 4,923 (74.0%) |
| 5 Years | 1,247 (74.2%) | 1,069 (77.7%) |
| 6 to 11 Years | 6,111 (77.1%) | 6,283 (76.6%) |
| 12 to 14 Years | 3,074 (74.0%) | 3,142 (82.4%) |
| 15 Years | 1,070 (79.0%) | 804 (71.3%) |
| 16 and 17 Years | 2,111 (87.0%) | 2,098 (82.2%) |
| 18 to 24 Years | 7,225 (86.8%) | 5,951 (79.0%) |
| 25 to 34 Years | 13,381 (94.9%) | 10,096 (80.8%) |
| 35 to 44 Years | 10,476 (88.4%) | 8,115 (80.9%) |
| 45 to 54 Years | 8,302 (95.6%) | 7,326 (87.6%) |
| 55 to 64 Years | 7,152 (93.4%) | 6,782 (89.3%) |
| 65 to 74 Years | 4,052 (92.1%) | 4,220 (87.2%) |
| 75 Years and over | 1,992 (84.4%) | 2,479 (71.4%) |
| Total | 71,689 (87.2%) | 63,288 (81.1%) |
Income Below Poverty Among Married-Couple Families in Ector County
The poverty statistics for married-couple families in Ector County show that 7.2% or 2,002 of the total 27,877 families live below the poverty line. Families with 5 or more children have the highest poverty rate of 45.5%, comprising of 161 families. On the other hand, families with no children have the lowest poverty rate of 3.4%, which includes 424 families.
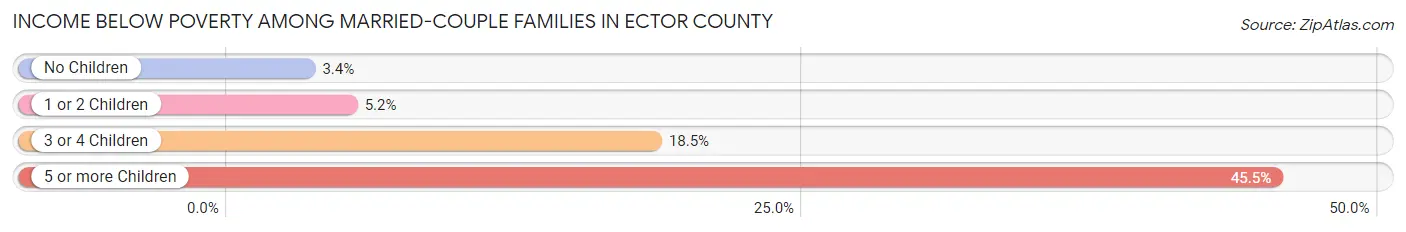
| Children | Above Poverty | Below Poverty |
| No Children | 12,145 (96.6%) | 424 (3.4%) |
| 1 or 2 Children | 9,607 (94.8%) | 528 (5.2%) |
| 3 or 4 Children | 3,930 (81.6%) | 889 (18.4%) |
| 5 or more Children | 193 (54.5%) | 161 (45.5%) |
| Total | 25,875 (92.8%) | 2,002 (7.2%) |
Income Below Poverty Among Single-Parent Households in Ector County
According to the poverty data in Ector County, 10.6% or 384 single-father households and 30.2% or 3,023 single-mother households are living below the poverty line. Among single-father households, those with 3 or 4 children have the highest poverty rate, with 204 households (52.8%) experiencing poverty. Likewise, among single-mother households, those with 3 or 4 children have the highest poverty rate, with 658 households (49.6%) falling below the poverty line.
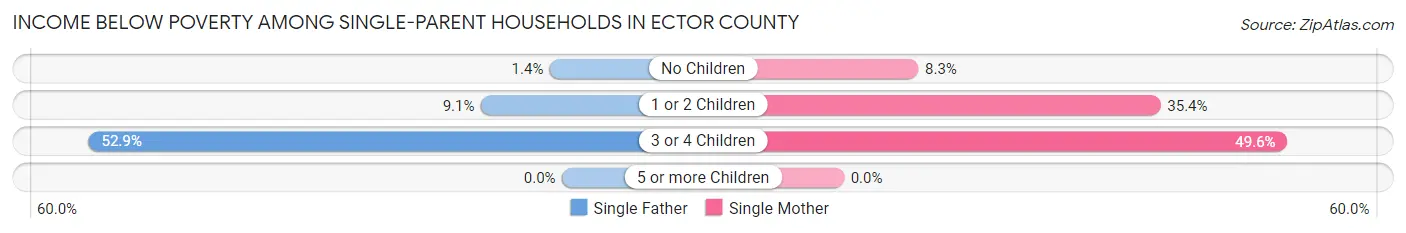
| Children | Single Father | Single Mother |
| No Children | 20 (1.4%) | 217 (8.3%) |
| 1 or 2 Children | 160 (9.1%) | 2,148 (35.4%) |
| 3 or 4 Children | 204 (52.8%) | 658 (49.6%) |
| 5 or more Children | 0 (0.0%) | 0 (0.0%) |
| Total | 384 (10.6%) | 3,023 (30.2%) |
Income Below Poverty Among Married-Couple vs Single-Parent Households in Ector County
The poverty data for Ector County shows that 2,002 of the married-couple family households (7.2%) and 3,407 of the single-parent households (25.0%) are living below the poverty level. Within the married-couple family households, those with 5 or more children have the highest poverty rate, with 161 households (45.5%) falling below the poverty line. Among the single-parent households, those with 3 or 4 children have the highest poverty rate, with 862 household (50.3%) living below poverty.
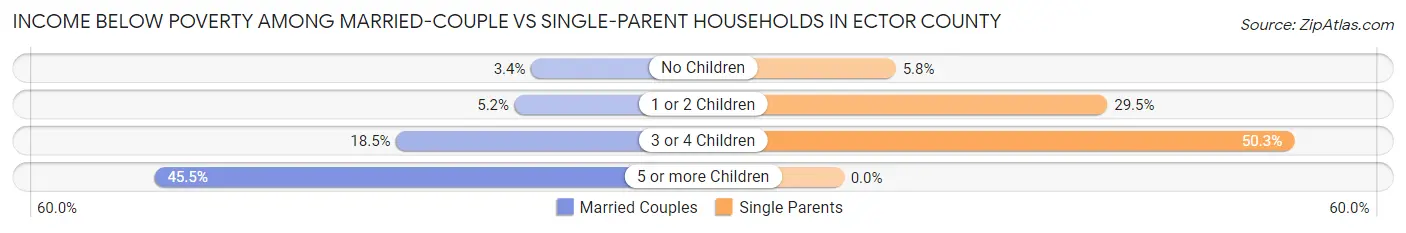
| Children | Married-Couple Families | Single-Parent Households |
| No Children | 424 (3.4%) | 237 (5.8%) |
| 1 or 2 Children | 528 (5.2%) | 2,308 (29.5%) |
| 3 or 4 Children | 889 (18.4%) | 862 (50.3%) |
| 5 or more Children | 161 (45.5%) | 0 (0.0%) |
| Total | 2,002 (7.2%) | 3,407 (25.0%) |
Race in Ector County
The most populous races in Ector County are Hispanic or Latino (103,201 | 63.6%), White / Caucasian (97,752 | 60.2%), and Some other Race (29,474 | 18.2%).
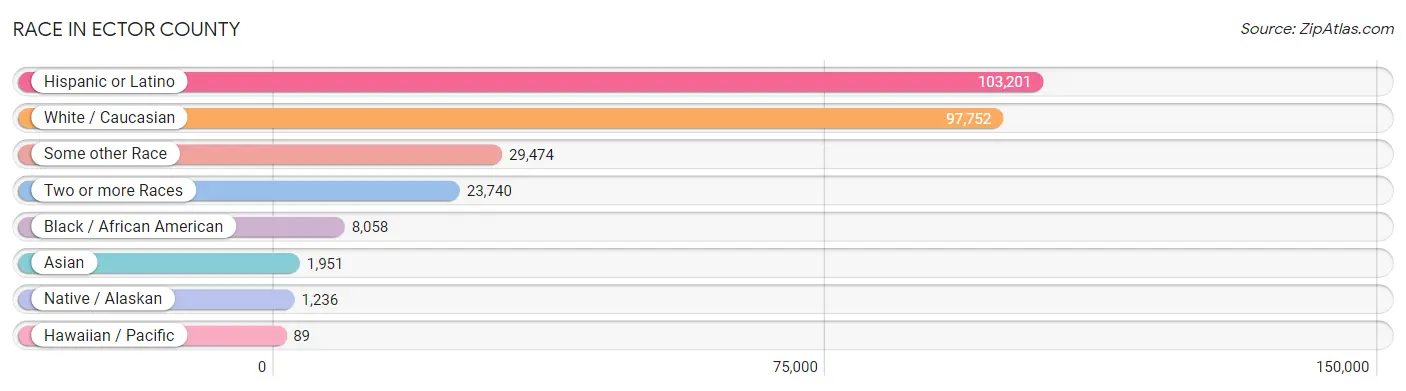
| Race | # Population | % Population |
| Asian | 1,951 | 1.2% |
| Black / African American | 8,058 | 5.0% |
| Hawaiian / Pacific | 89 | 0.1% |
| Hispanic or Latino | 103,201 | 63.6% |
| Native / Alaskan | 1,236 | 0.8% |
| White / Caucasian | 97,752 | 60.2% |
| Two or more Races | 23,740 | 14.6% |
| Some other Race | 29,474 | 18.2% |
| Total | 162,300 | 100.0% |
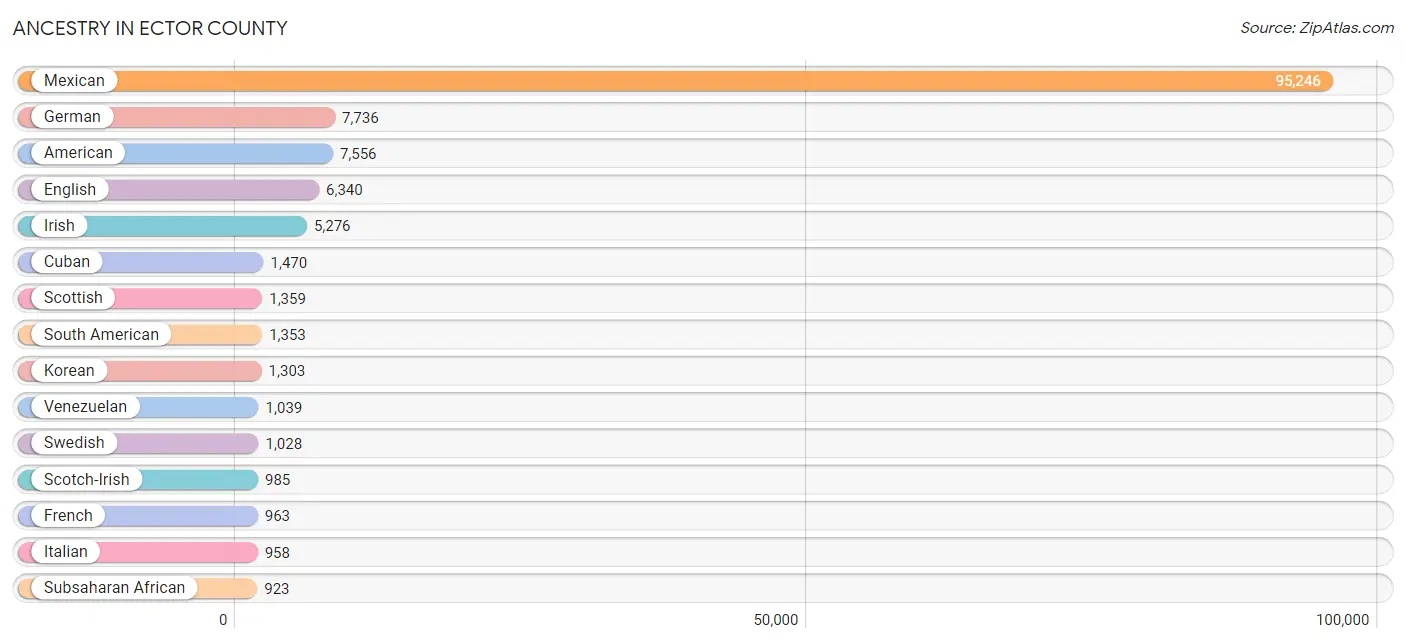
Ancestry in Ector County
The most populous ancestries reported in Ector County are Mexican (95,246 | 58.7%), German (7,736 | 4.8%), American (7,556 | 4.7%), English (6,340 | 3.9%), and Irish (5,276 | 3.3%), together accounting for 75.3% of all Ector County residents.
| Ancestry | # Population | % Population |
| African | 352 | 0.2% |
| Alaska Native | 10 | 0.0% |
| American | 7,556 | 4.7% |
| Apache | 103 | 0.1% |
| Arab | 323 | 0.2% |
| Argentinean | 10 | 0.0% |
| Armenian | 6 | 0.0% |
| Australian | 10 | 0.0% |
| Austrian | 52 | 0.0% |
| Belgian | 92 | 0.1% |
| Bhutanese | 107 | 0.1% |
| Blackfeet | 107 | 0.1% |
| Bolivian | 36 | 0.0% |
| Brazilian | 13 | 0.0% |
| British | 137 | 0.1% |
| Burmese | 71 | 0.0% |
| Canadian | 128 | 0.1% |
| Carpatho Rusyn | 9 | 0.0% |
| Central American | 618 | 0.4% |
| Central American Indian | 39 | 0.0% |
| Cherokee | 199 | 0.1% |
| Chickasaw | 37 | 0.0% |
| Chilean | 61 | 0.0% |
| Choctaw | 105 | 0.1% |
| Colombian | 207 | 0.1% |
| Comanche | 75 | 0.1% |
| Costa Rican | 48 | 0.0% |
| Cree | 21 | 0.0% |
| Cuban | 1,470 | 0.9% |
| Czech | 283 | 0.2% |
| Czechoslovakian | 60 | 0.0% |
| Danish | 45 | 0.0% |
| Delaware | 15 | 0.0% |
| Dominican | 38 | 0.0% |
| Dutch | 310 | 0.2% |
| Dutch West Indian | 58 | 0.0% |
| Eastern European | 40 | 0.0% |
| Egyptian | 290 | 0.2% |
| English | 6,340 | 3.9% |
| European | 423 | 0.3% |
| Finnish | 55 | 0.0% |
| French | 963 | 0.6% |
| French Canadian | 40 | 0.0% |
| German | 7,736 | 4.8% |
| Ghanaian | 9 | 0.0% |
| Greek | 177 | 0.1% |
| Guamanian / Chamorro | 27 | 0.0% |
| Guatemalan | 90 | 0.1% |
| Guyanese | 25 | 0.0% |
| Haitian | 54 | 0.0% |
| Honduran | 195 | 0.1% |
| Hungarian | 338 | 0.2% |
| Indian (Asian) | 286 | 0.2% |
| Iranian | 27 | 0.0% |
| Irish | 5,276 | 3.3% |
| Israeli | 11 | 0.0% |
| Italian | 958 | 0.6% |
| Kenyan | 148 | 0.1% |
| Korean | 1,303 | 0.8% |
| Lebanese | 21 | 0.0% |
| Lithuanian | 18 | 0.0% |
| Mexican | 95,246 | 58.7% |
| Mexican American Indian | 622 | 0.4% |
| Native Hawaiian | 310 | 0.2% |
| Navajo | 260 | 0.2% |
| Nicaraguan | 73 | 0.0% |
| Nigerian | 167 | 0.1% |
| Northern European | 42 | 0.0% |
| Norwegian | 230 | 0.1% |
| Osage | 105 | 0.1% |
| Pakistani | 1 | 0.0% |
| Panamanian | 76 | 0.1% |
| Pennsylvania German | 16 | 0.0% |
| Polish | 405 | 0.3% |
| Portuguese | 79 | 0.1% |
| Potawatomi | 20 | 0.0% |
| Pueblo | 67 | 0.0% |
| Puerto Rican | 434 | 0.3% |
| Romanian | 16 | 0.0% |
| Russian | 189 | 0.1% |
| Salvadoran | 136 | 0.1% |
| Scandinavian | 253 | 0.2% |
| Scotch-Irish | 985 | 0.6% |
| Scottish | 1,359 | 0.8% |
| Slavic | 9 | 0.0% |
| South African | 46 | 0.0% |
| South American | 1,353 | 0.8% |
| Spaniard | 539 | 0.3% |
| Spanish | 352 | 0.2% |
| Sri Lankan | 506 | 0.3% |
| Subsaharan African | 923 | 0.6% |
| Swedish | 1,028 | 0.6% |
| Swiss | 34 | 0.0% |
| Syrian | 12 | 0.0% |
| Thai | 183 | 0.1% |
| Trinidadian and Tobagonian | 8 | 0.0% |
| Turkish | 85 | 0.1% |
| Ukrainian | 33 | 0.0% |
| Venezuelan | 1,039 | 0.6% |
| Vietnamese | 22 | 0.0% |
| Welsh | 320 | 0.2% | View All 101 Rows |
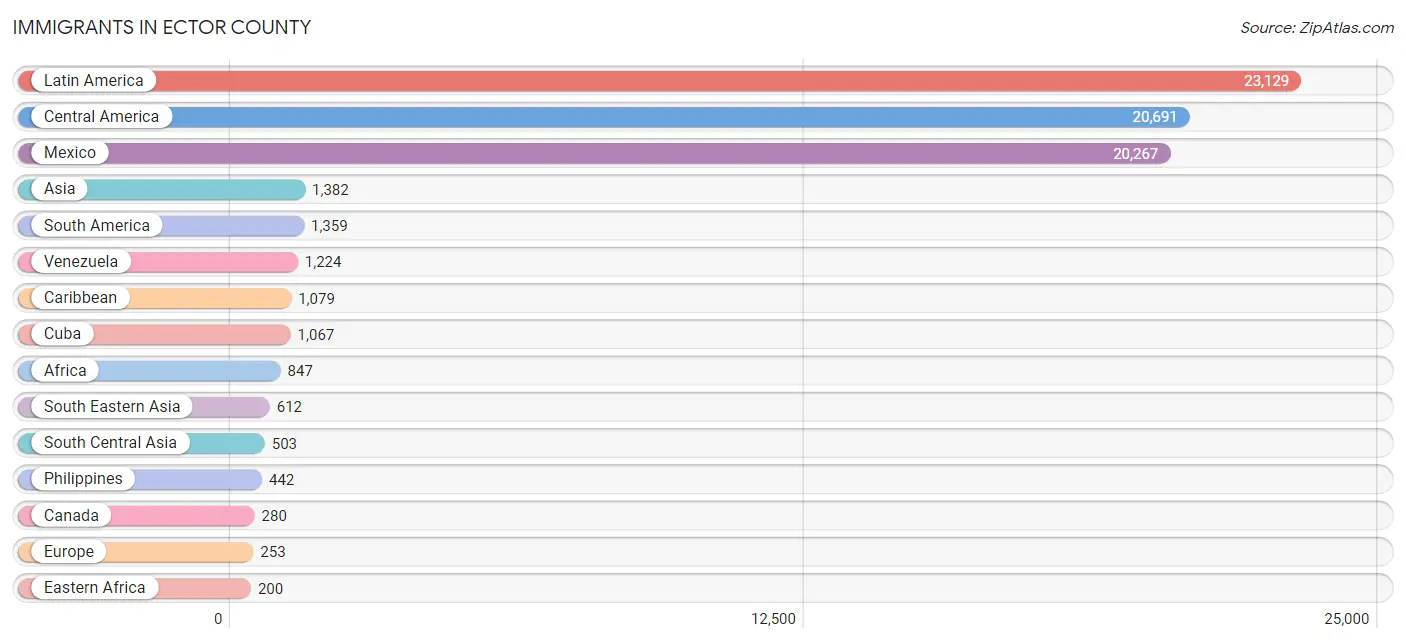
Immigrants in Ector County
The most numerous immigrant groups reported in Ector County came from Latin America (23,129 | 14.2%), Central America (20,691 | 12.8%), Mexico (20,267 | 12.5%), Asia (1,382 | 0.9%), and South America (1,359 | 0.8%), together accounting for 41.2% of all Ector County residents.
| Immigration Origin | # Population | % Population |
| Africa | 847 | 0.5% |
| Asia | 1,382 | 0.9% |
| Australia | 10 | 0.0% |
| Austria | 15 | 0.0% |
| Bangladesh | 22 | 0.0% |
| Bolivia | 36 | 0.0% |
| Brazil | 17 | 0.0% |
| Cameroon | 15 | 0.0% |
| Canada | 280 | 0.2% |
| Caribbean | 1,079 | 0.7% |
| Central America | 20,691 | 12.8% |
| China | 78 | 0.1% |
| Colombia | 82 | 0.1% |
| Cuba | 1,067 | 0.7% |
| Eastern Africa | 200 | 0.1% |
| Eastern Asia | 128 | 0.1% |
| Eastern Europe | 3 | 0.0% |
| Egypt | 200 | 0.1% |
| El Salvador | 120 | 0.1% |
| England | 25 | 0.0% |
| Europe | 253 | 0.2% |
| Germany | 106 | 0.1% |
| Ghana | 2 | 0.0% |
| Guatemala | 81 | 0.1% |
| Honduras | 162 | 0.1% |
| India | 157 | 0.1% |
| Ireland | 19 | 0.0% |
| Israel | 11 | 0.0% |
| Italy | 29 | 0.0% |
| Japan | 12 | 0.0% |
| Kazakhstan | 115 | 0.1% |
| Kenya | 200 | 0.1% |
| Korea | 38 | 0.0% |
| Latin America | 23,129 | 14.2% |
| Malaysia | 28 | 0.0% |
| Mexico | 20,267 | 12.5% |
| Middle Africa | 162 | 0.1% |
| Nepal | 19 | 0.0% |
| Nicaragua | 28 | 0.0% |
| Nigeria | 167 | 0.1% |
| Northern Africa | 200 | 0.1% |
| Northern Europe | 65 | 0.0% |
| Oceania | 10 | 0.0% |
| Pakistan | 190 | 0.1% |
| Panama | 33 | 0.0% |
| Philippines | 442 | 0.3% |
| Serbia | 3 | 0.0% |
| South Africa | 46 | 0.0% |
| South America | 1,359 | 0.8% |
| South Central Asia | 503 | 0.3% |
| South Eastern Asia | 612 | 0.4% |
| Southern Europe | 64 | 0.0% |
| Spain | 35 | 0.0% |
| Taiwan | 24 | 0.0% |
| Thailand | 1 | 0.0% |
| Trinidad and Tobago | 12 | 0.0% |
| Turkey | 128 | 0.1% |
| Venezuela | 1,224 | 0.7% |
| Vietnam | 141 | 0.1% |
| Western Africa | 169 | 0.1% |
| Western Asia | 139 | 0.1% |
| Western Europe | 121 | 0.1% | View All 62 Rows |
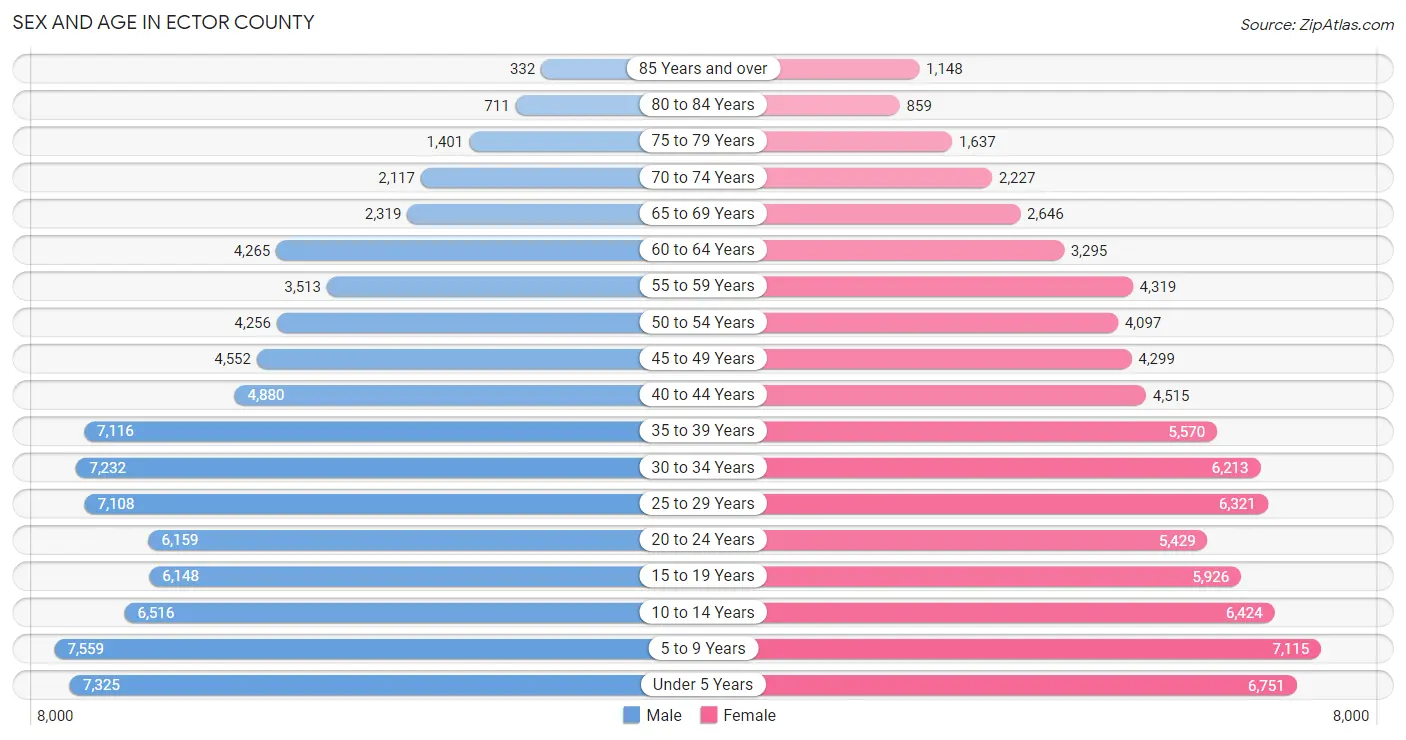
Sex and Age in Ector County
Sex and Age in Ector County
The most populous age groups in Ector County are 5 to 9 Years (7,559 | 9.0%) for men and 5 to 9 Years (7,115 | 9.0%) for women.
| Age Bracket | Male | Female |
| Under 5 Years | 7,325 (8.8%) | 6,751 (8.6%) |
| 5 to 9 Years | 7,559 (9.0%) | 7,115 (9.0%) |
| 10 to 14 Years | 6,516 (7.8%) | 6,424 (8.2%) |
| 15 to 19 Years | 6,148 (7.4%) | 5,926 (7.5%) |
| 20 to 24 Years | 6,159 (7.4%) | 5,429 (6.9%) |
| 25 to 29 Years | 7,108 (8.5%) | 6,321 (8.0%) |
| 30 to 34 Years | 7,232 (8.7%) | 6,213 (7.9%) |
| 35 to 39 Years | 7,116 (8.5%) | 5,570 (7.1%) |
| 40 to 44 Years | 4,880 (5.8%) | 4,515 (5.7%) |
| 45 to 49 Years | 4,552 (5.4%) | 4,299 (5.5%) |
| 50 to 54 Years | 4,256 (5.1%) | 4,097 (5.2%) |
| 55 to 59 Years | 3,513 (4.2%) | 4,319 (5.5%) |
| 60 to 64 Years | 4,265 (5.1%) | 3,295 (4.2%) |
| 65 to 69 Years | 2,319 (2.8%) | 2,646 (3.4%) |
| 70 to 74 Years | 2,117 (2.5%) | 2,227 (2.8%) |
| 75 to 79 Years | 1,401 (1.7%) | 1,637 (2.1%) |
| 80 to 84 Years | 711 (0.9%) | 859 (1.1%) |
| 85 Years and over | 332 (0.4%) | 1,148 (1.5%) |
| Total | 83,509 (100.0%) | 78,791 (100.0%) |
Families and Households in Ector County
Median Family Size in Ector County
The median family size in Ector County is 3.22 persons per family, with married-couple families (27,877 | 67.2%) accounting for the largest median family size of 3.44 persons per family. On the other hand, single male/father families (3,614 | 8.7%) represent the smallest median family size with 2.41 persons per family.

| Family Type | # Families | Family Size |
| Married-Couple | 27,877 (67.2%) | 3.44 |
| Single Male/Father | 3,614 (8.7%) | 2.41 |
| Single Female/Mother | 10,006 (24.1%) | 2.89 |
| Total Families | 41,497 (100.0%) | 3.22 |
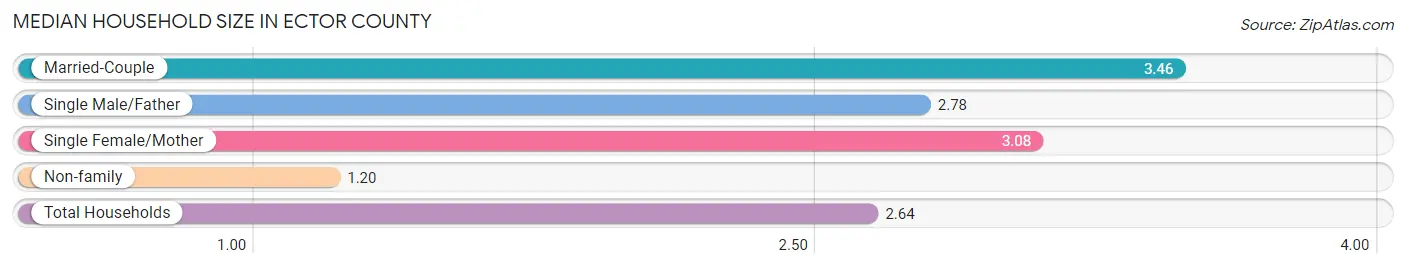
Median Household Size in Ector County
The median household size in Ector County is 2.64 persons per household, with married-couple households (27,877 | 45.9%) accounting for the largest median household size of 3.46 persons per household. non-family households (19,179 | 31.6%) represent the smallest median household size with 1.20 persons per household.
| Household Type | # Households | Household Size |
| Married-Couple | 27,877 (45.9%) | 3.46 |
| Single Male/Father | 3,614 (6.0%) | 2.78 |
| Single Female/Mother | 10,006 (16.5%) | 3.08 |
| Non-family | 19,179 (31.6%) | 1.20 |
| Total Households | 60,676 (100.0%) | 2.64 |
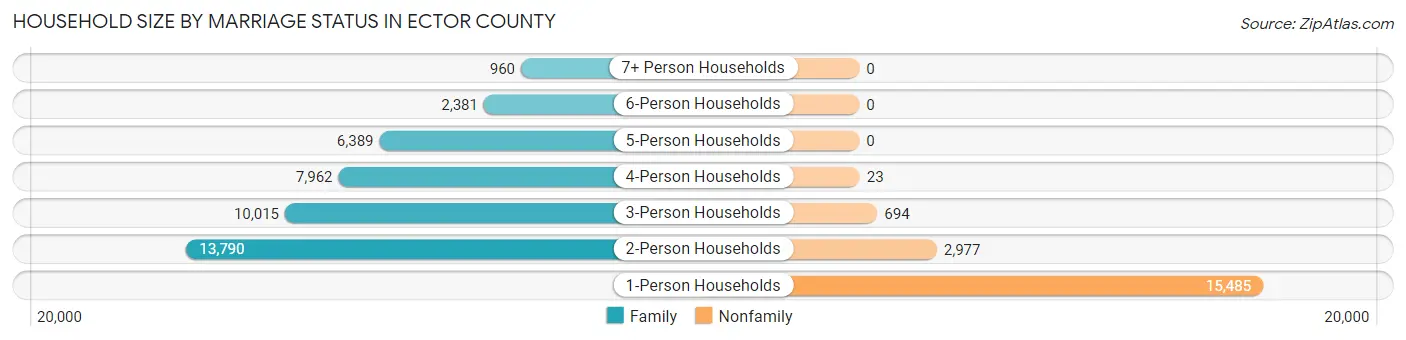
Household Size by Marriage Status in Ector County
Out of a total of 60,676 households in Ector County, 41,497 (68.4%) are family households, while 19,179 (31.6%) are nonfamily households. The most numerous type of family households are 2-person households, comprising 13,790, and the most common type of nonfamily households are 1-person households, comprising 15,485.
| Household Size | Family Households | Nonfamily Households |
| 1-Person Households | - | 15,485 (25.5%) |
| 2-Person Households | 13,790 (22.7%) | 2,977 (4.9%) |
| 3-Person Households | 10,015 (16.5%) | 694 (1.1%) |
| 4-Person Households | 7,962 (13.1%) | 23 (0.0%) |
| 5-Person Households | 6,389 (10.5%) | 0 (0.0%) |
| 6-Person Households | 2,381 (3.9%) | 0 (0.0%) |
| 7+ Person Households | 960 (1.6%) | 0 (0.0%) |
| Total | 41,497 (68.4%) | 19,179 (31.6%) |
Female Fertility in Ector County
Fertility by Age in Ector County
Average fertility rate in Ector County is 86.0 births per 1,000 women. Women in the age bracket of 20 to 34 years have the highest fertility rate with 149.0 births per 1,000 women. Women in the age bracket of 20 to 34 years acount for 80.0% of all women with births.
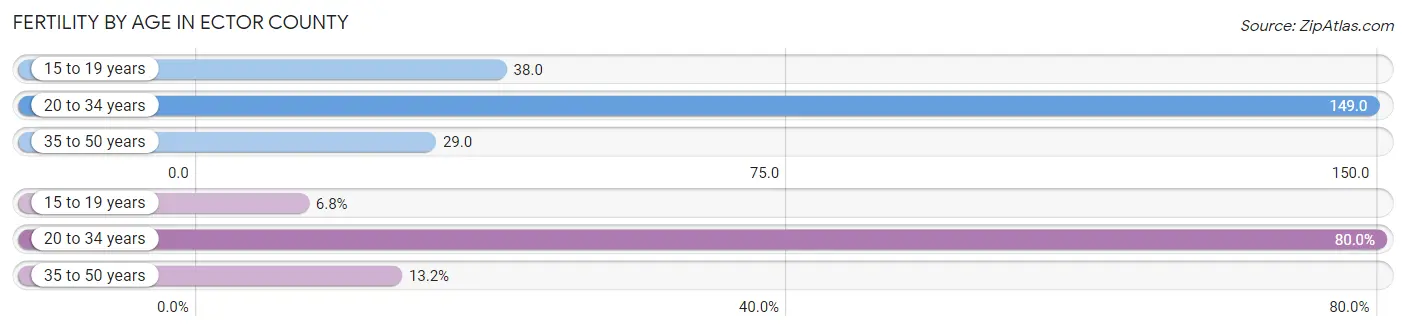
| Age Bracket | Women with Births | Births / 1,000 Women |
| 15 to 19 years | 228 (6.8%) | 38.0 |
| 20 to 34 years | 2,668 (80.0%) | 149.0 |
| 35 to 50 years | 439 (13.2%) | 29.0 |
| Total | 3,335 (100.0%) | 86.0 |
Fertility by Age by Marriage Status in Ector County
67.6% of women with births (3,335) in Ector County are married. The highest percentage of unmarried women with births falls into 15 to 19 years age bracket with 81.6% of them unmarried at the time of birth, while the lowest percentage of unmarried women with births belong to 35 to 50 years age bracket with 24.2% of them unmarried.
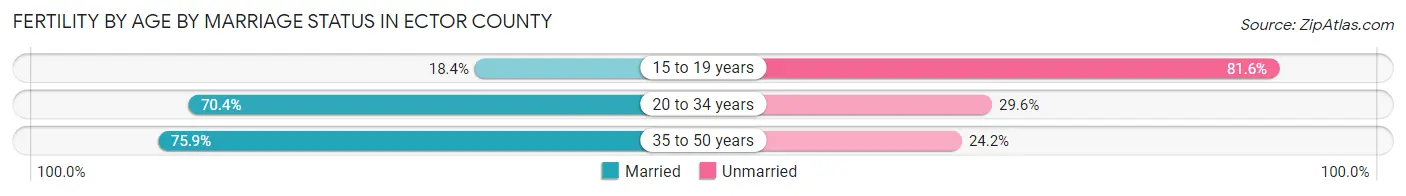
| Age Bracket | Married | Unmarried |
| 15 to 19 years | 42 (18.4%) | 186 (81.6%) |
| 20 to 34 years | 1,878 (70.4%) | 790 (29.6%) |
| 35 to 50 years | 333 (75.8%) | 106 (24.1%) |
| Total | 2,254 (67.6%) | 1,081 (32.4%) |
Fertility by Education in Ector County
Average fertility rate in Ector County is 86.0 births per 1,000 women. Women with the education attainment of bachelor's degree have the highest fertility rate of 124.0 births per 1,000 women, while women with the education attainment of graduate degree have the lowest fertility at 29.0 births per 1,000 women. Women with the education attainment of college or associate's degree represent 43.2% of all women with births.
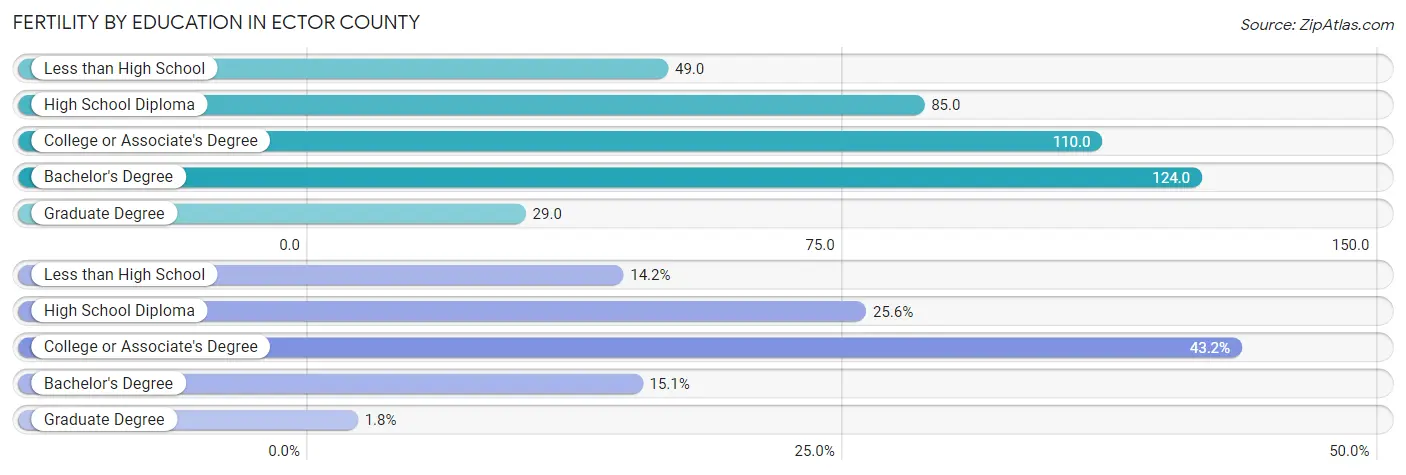
| Educational Attainment | Women with Births | Births / 1,000 Women |
| Less than High School | 475 (14.2%) | 49.0 |
| High School Diploma | 854 (25.6%) | 85.0 |
| College or Associate's Degree | 1,441 (43.2%) | 110.0 |
| Bachelor's Degree | 505 (15.1%) | 124.0 |
| Graduate Degree | 60 (1.8%) | 29.0 |
| Total | 3,335 (100.0%) | 86.0 |
Fertility by Education by Marriage Status in Ector County
32.4% of women with births in Ector County are unmarried. Women with the educational attainment of graduate degree are most likely to be married with 100.0% of them married at childbirth, while women with the educational attainment of less than high school are least likely to be married with 49.3% of them unmarried at childbirth.
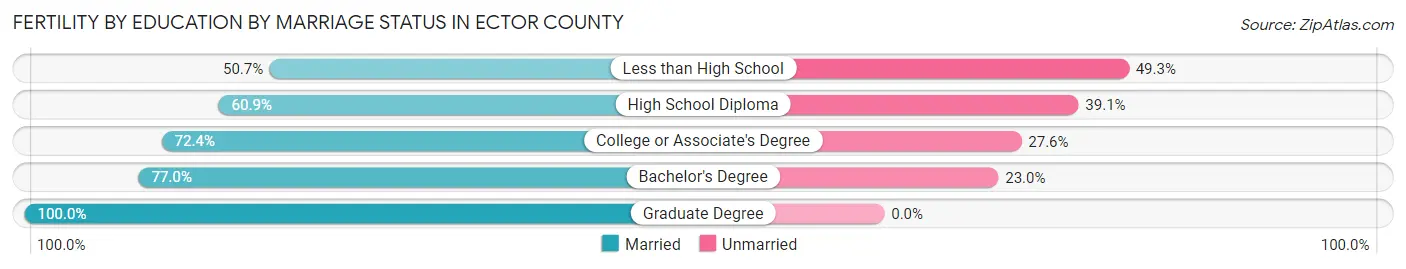
| Educational Attainment | Married | Unmarried |
| Less than High School | 241 (50.7%) | 234 (49.3%) |
| High School Diploma | 520 (60.9%) | 334 (39.1%) |
| College or Associate's Degree | 1,043 (72.4%) | 398 (27.6%) |
| Bachelor's Degree | 389 (77.0%) | 116 (23.0%) |
| Graduate Degree | 60 (100.0%) | 0 (0.0%) |
| Total | 2,254 (67.6%) | 1,081 (32.4%) |
Employment Characteristics in Ector County
Employment by Class of Employer in Ector County
Among the 73,281 employed individuals in Ector County, private company employees (53,571 | 73.1%), self-employed (not incorporated) (5,569 | 7.6%), and local government employees (5,280 | 7.2%) make up the most common classes of employment.
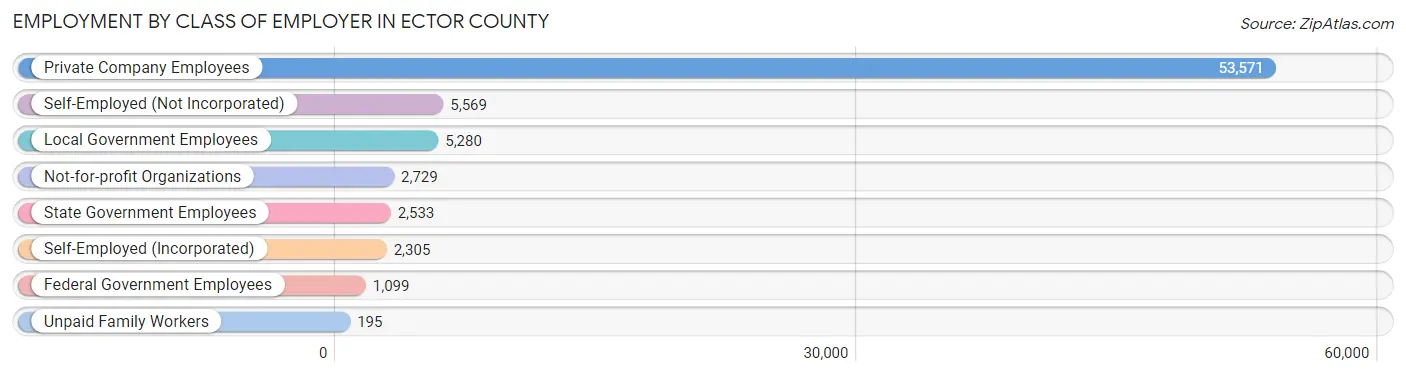
| Employer Class | # Employees | % Employees |
| Private Company Employees | 53,571 | 73.1% |
| Self-Employed (Incorporated) | 2,305 | 3.2% |
| Self-Employed (Not Incorporated) | 5,569 | 7.6% |
| Not-for-profit Organizations | 2,729 | 3.7% |
| Local Government Employees | 5,280 | 7.2% |
| State Government Employees | 2,533 | 3.5% |
| Federal Government Employees | 1,099 | 1.5% |
| Unpaid Family Workers | 195 | 0.3% |
| Total | 73,281 | 100.0% |
Employment Status by Age in Ector County
According to the labor force statistics for Ector County, out of the total population over 16 years of age (118,118), 67.3% or 79,493 individuals are in the labor force, with 5.8% or 4,611 of them unemployed. The age group with the highest labor force participation rate is 35 to 44 years, with 83.1% or 18,349 individuals in the labor force. Within the labor force, the 16 to 19 years age range has the highest percentage of unemployed individuals, with 11.5% or 414 of them being unemployed.
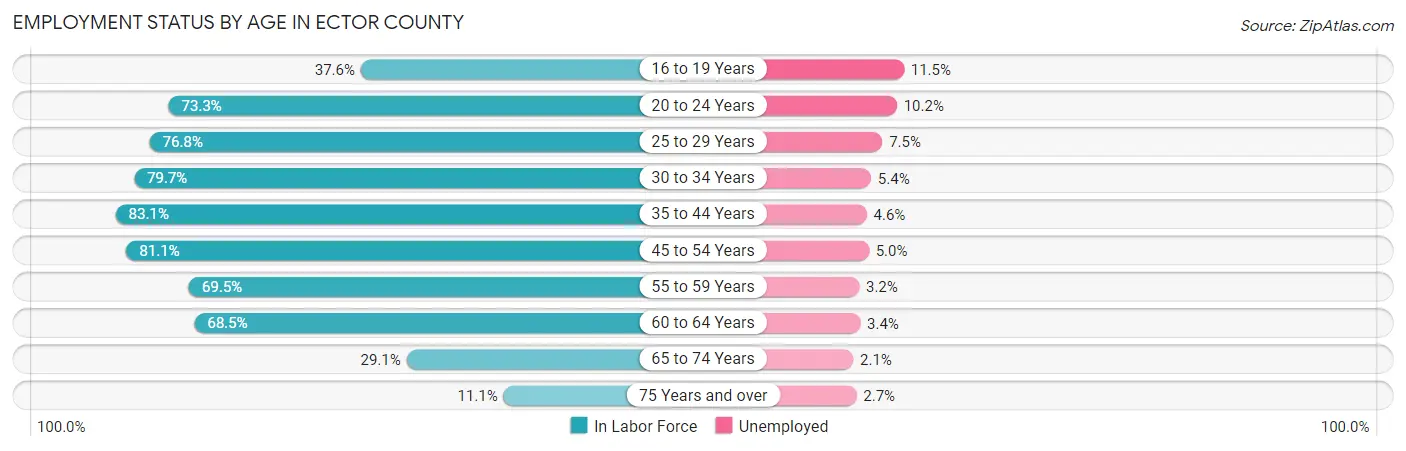
| Age Bracket | In Labor Force | Unemployed |
| 16 to 19 Years | 3,603 (37.6%) | 414 (11.5%) |
| 20 to 24 Years | 8,494 (73.3%) | 866 (10.2%) |
| 25 to 29 Years | 10,313 (76.8%) | 773 (7.5%) |
| 30 to 34 Years | 10,716 (79.7%) | 579 (5.4%) |
| 35 to 44 Years | 18,349 (83.1%) | 844 (4.6%) |
| 45 to 54 Years | 13,952 (81.1%) | 698 (5.0%) |
| 55 to 59 Years | 5,443 (69.5%) | 174 (3.2%) |
| 60 to 64 Years | 5,179 (68.5%) | 176 (3.4%) |
| 65 to 74 Years | 2,709 (29.1%) | 57 (2.1%) |
| 75 Years and over | 676 (11.1%) | 18 (2.7%) |
| Total | 79,493 (67.3%) | 4,611 (5.8%) |
Employment Status by Educational Attainment in Ector County
According to labor force statistics for Ector County, 78.4% of individuals (63,936) out of the total population between 25 and 64 years of age (81,551) are in the labor force, with 5.1% or 3,261 of them being unemployed. The group with the highest labor force participation rate are those with the educational attainment of bachelor's degree or higher, with 87.8% or 12,274 individuals in the labor force. Within the labor force, individuals with less than high school education have the highest percentage of unemployment, with 5.9% or 690 of them being unemployed.
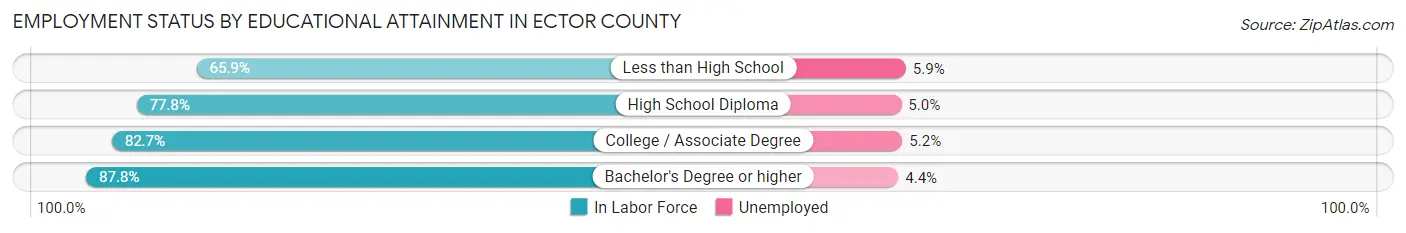
| Educational Attainment | In Labor Force | Unemployed |
| Less than High School | 11,701 (65.9%) | 1,048 (5.9%) |
| High School Diploma | 18,950 (77.8%) | 1,218 (5.0%) |
| College / Associate Degree | 21,054 (82.7%) | 1,324 (5.2%) |
| Bachelor's Degree or higher | 12,274 (87.8%) | 615 (4.4%) |
| Total | 63,936 (78.4%) | 4,159 (5.1%) |
Employment Occupations by Sex in Ector County
Management, Business, Science and Arts Occupations
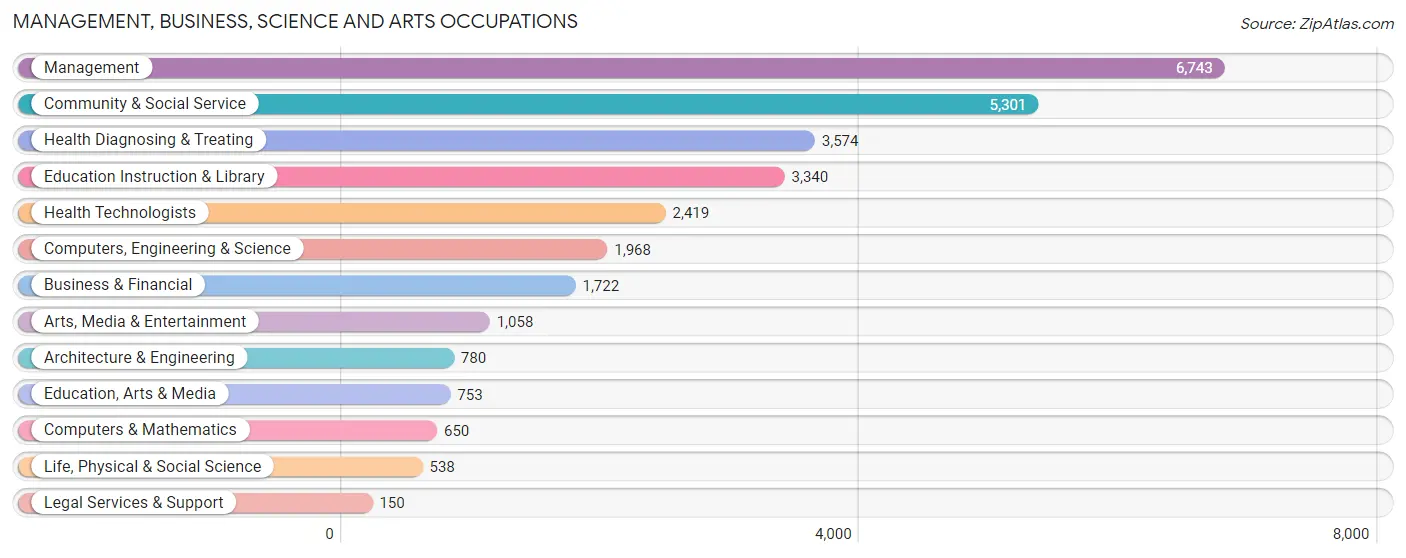
The most common Management, Business, Science and Arts occupations in Ector County are Management (6,743 | 9.0%), Community & Social Service (5,301 | 7.1%), Health Diagnosing & Treating (3,574 | 4.8%), Education Instruction & Library (3,340 | 4.5%), and Health Technologists (2,419 | 3.2%).
Management, Business, Science and Arts Occupations by Sex
Within the Management, Business, Science and Arts occupations in Ector County, the most male-oriented occupations are Architecture & Engineering (97.3%), Computers, Engineering & Science (81.9%), and Life, Physical & Social Science (78.2%), while the most female-oriented occupations are Health Diagnosing & Treating (78.3%), Education Instruction & Library (77.7%), and Health Technologists (76.5%).
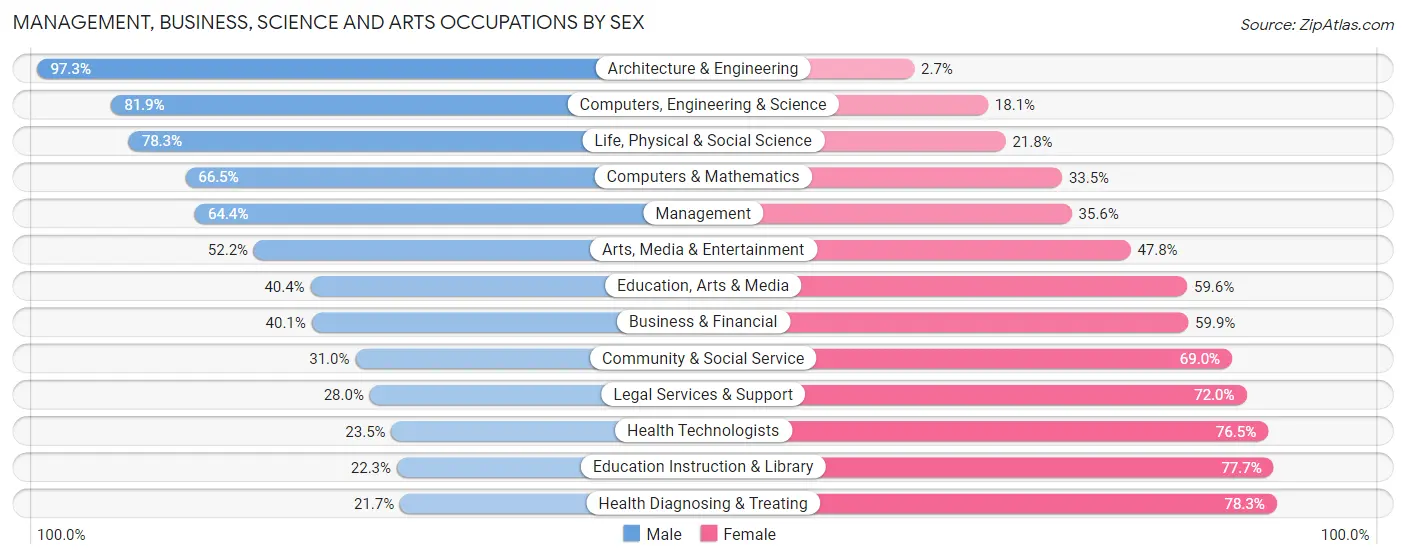
| Occupation | Male | Female |
| Management | 4,345 (64.4%) | 2,398 (35.6%) |
| Business & Financial | 691 (40.1%) | 1,031 (59.9%) |
| Computers, Engineering & Science | 1,612 (81.9%) | 356 (18.1%) |
| Computers & Mathematics | 432 (66.5%) | 218 (33.5%) |
| Architecture & Engineering | 759 (97.3%) | 21 (2.7%) |
| Life, Physical & Social Science | 421 (78.2%) | 117 (21.7%) |
| Community & Social Service | 1,644 (31.0%) | 3,657 (69.0%) |
| Education, Arts & Media | 304 (40.4%) | 449 (59.6%) |
| Legal Services & Support | 42 (28.0%) | 108 (72.0%) |
| Education Instruction & Library | 746 (22.3%) | 2,594 (77.7%) |
| Arts, Media & Entertainment | 552 (52.2%) | 506 (47.8%) |
| Health Diagnosing & Treating | 775 (21.7%) | 2,799 (78.3%) |
| Health Technologists | 568 (23.5%) | 1,851 (76.5%) |
| Total (Category) | 9,067 (47.0%) | 10,241 (53.0%) |
| Total (Overall) | 45,915 (61.4%) | 28,879 (38.6%) |
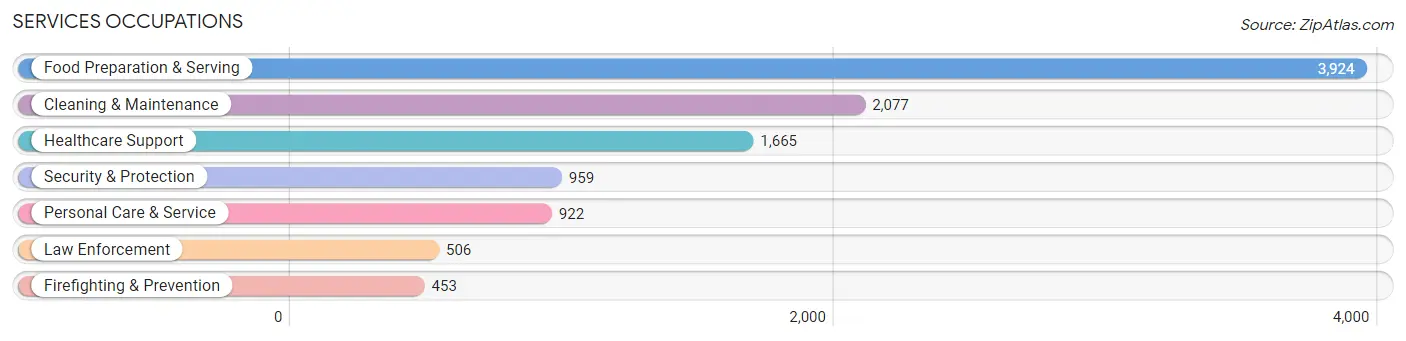
Services Occupations
The most common Services occupations in Ector County are Food Preparation & Serving (3,924 | 5.2%), Cleaning & Maintenance (2,077 | 2.8%), Healthcare Support (1,665 | 2.2%), Security & Protection (959 | 1.3%), and Personal Care & Service (922 | 1.2%).
Services Occupations by Sex
Within the Services occupations in Ector County, the most male-oriented occupations are Law Enforcement (83.4%), Security & Protection (79.8%), and Firefighting & Prevention (75.7%), while the most female-oriented occupations are Personal Care & Service (86.3%), Healthcare Support (84.3%), and Food Preparation & Serving (64.6%).
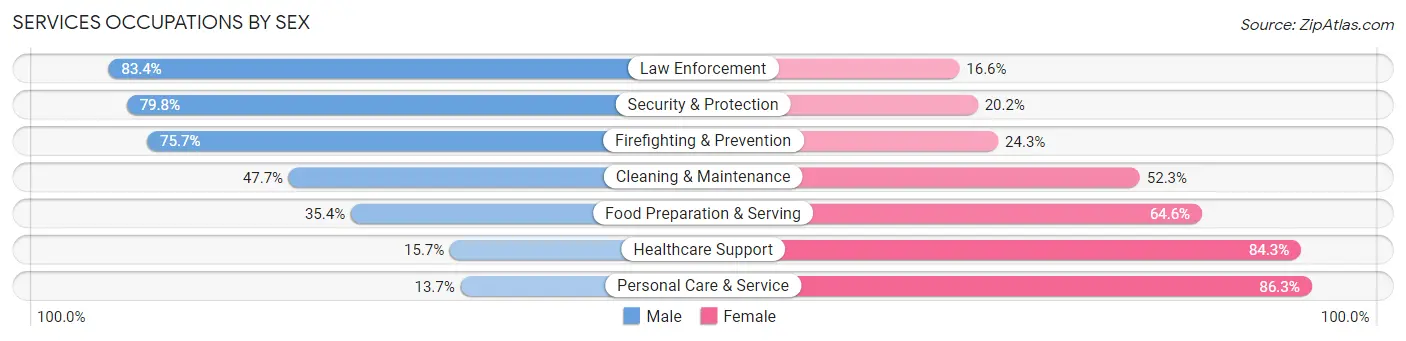
| Occupation | Male | Female |
| Healthcare Support | 262 (15.7%) | 1,403 (84.3%) |
| Security & Protection | 765 (79.8%) | 194 (20.2%) |
| Firefighting & Prevention | 343 (75.7%) | 110 (24.3%) |
| Law Enforcement | 422 (83.4%) | 84 (16.6%) |
| Food Preparation & Serving | 1,388 (35.4%) | 2,536 (64.6%) |
| Cleaning & Maintenance | 990 (47.7%) | 1,087 (52.3%) |
| Personal Care & Service | 126 (13.7%) | 796 (86.3%) |
| Total (Category) | 3,531 (37.0%) | 6,016 (63.0%) |
| Total (Overall) | 45,915 (61.4%) | 28,879 (38.6%) |
Sales and Office Occupations
The most common Sales and Office occupations in Ector County are Sales & Related (8,379 | 11.2%), and Office & Administration (7,981 | 10.7%).
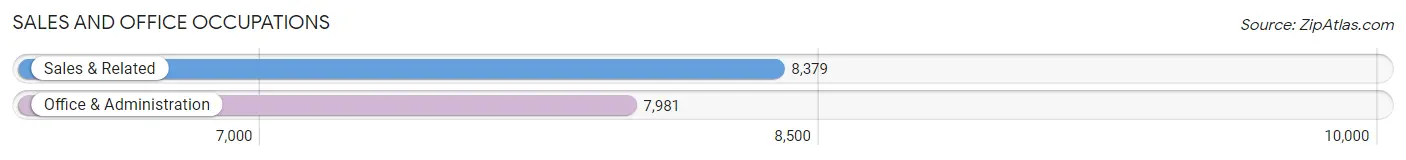
Sales and Office Occupations by Sex
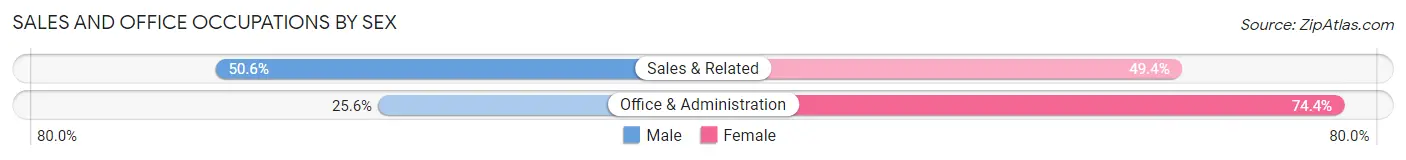
| Occupation | Male | Female |
| Sales & Related | 4,242 (50.6%) | 4,137 (49.4%) |
| Office & Administration | 2,046 (25.6%) | 5,935 (74.4%) |
| Total (Category) | 6,288 (38.4%) | 10,072 (61.6%) |
| Total (Overall) | 45,915 (61.4%) | 28,879 (38.6%) |
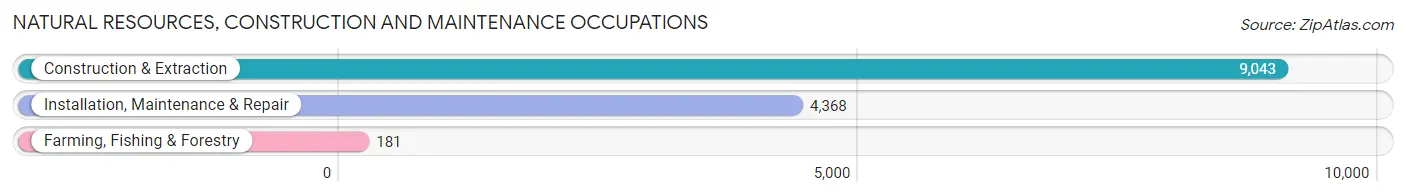
Natural Resources, Construction and Maintenance Occupations
The most common Natural Resources, Construction and Maintenance occupations in Ector County are Construction & Extraction (9,043 | 12.1%), Installation, Maintenance & Repair (4,368 | 5.8%), and Farming, Fishing & Forestry (181 | 0.2%).
Natural Resources, Construction and Maintenance Occupations by Sex
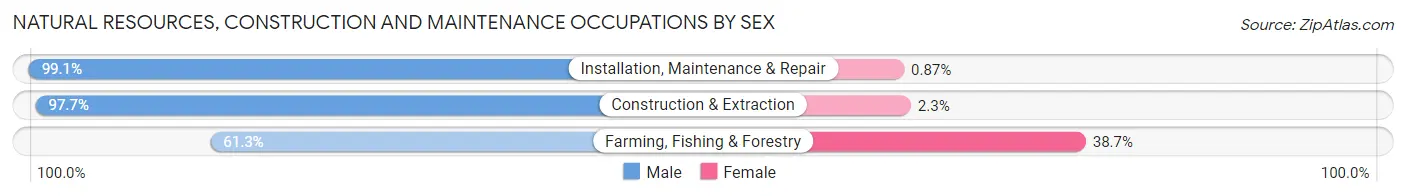
| Occupation | Male | Female |
| Farming, Fishing & Forestry | 111 (61.3%) | 70 (38.7%) |
| Construction & Extraction | 8,837 (97.7%) | 206 (2.3%) |
| Installation, Maintenance & Repair | 4,330 (99.1%) | 38 (0.9%) |
| Total (Category) | 13,278 (97.7%) | 314 (2.3%) |
| Total (Overall) | 45,915 (61.4%) | 28,879 (38.6%) |
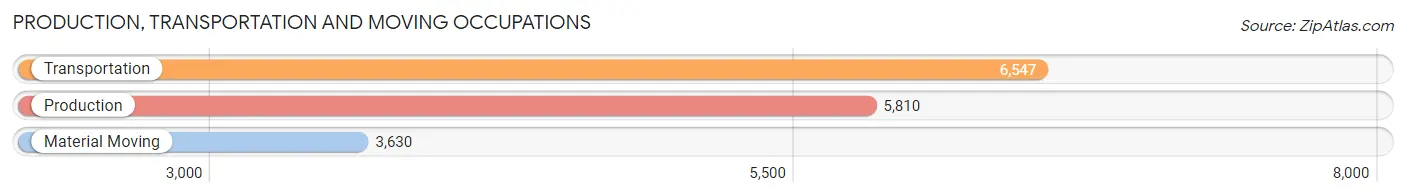
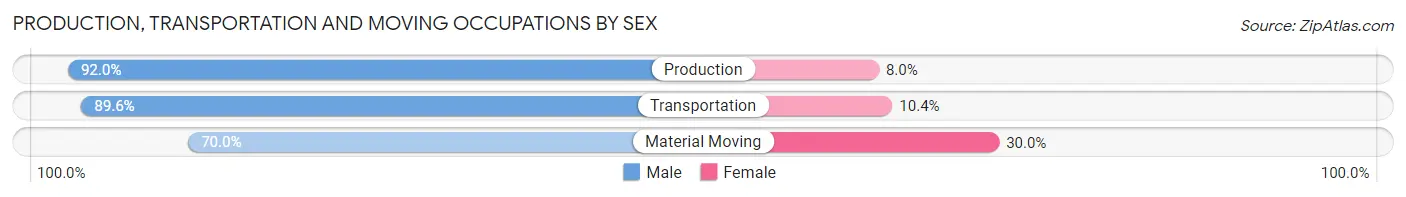
Production, Transportation and Moving Occupations
The most common Production, Transportation and Moving occupations in Ector County are Transportation (6,547 | 8.7%), Production (5,810 | 7.8%), and Material Moving (3,630 | 4.9%).
Production, Transportation and Moving Occupations by Sex
| Occupation | Male | Female |
| Production | 5,347 (92.0%) | 463 (8.0%) |
| Transportation | 5,864 (89.6%) | 683 (10.4%) |
| Material Moving | 2,540 (70.0%) | 1,090 (30.0%) |
| Total (Category) | 13,751 (86.0%) | 2,236 (14.0%) |
| Total (Overall) | 45,915 (61.4%) | 28,879 (38.6%) |
Employment Industries by Sex in Ector County
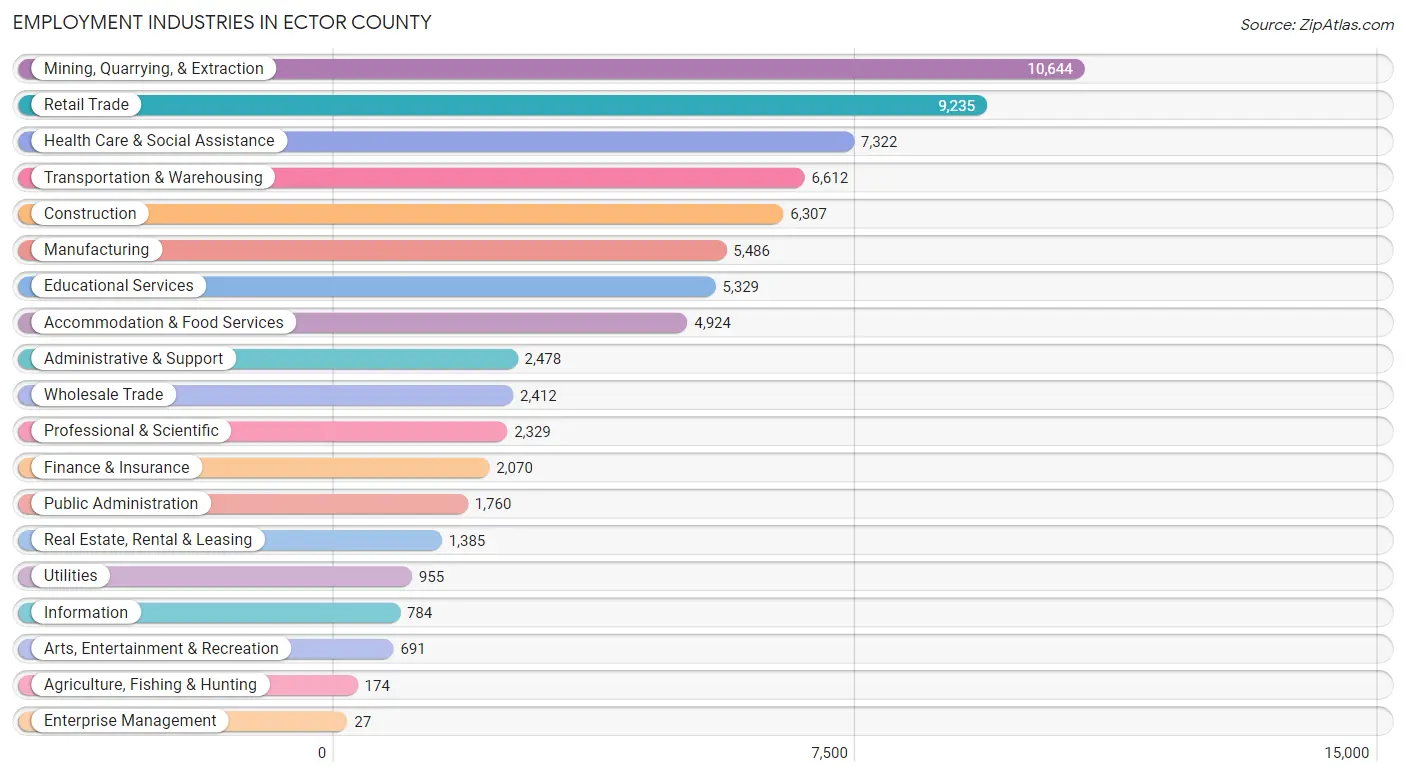
Employment Industries in Ector County
The major employment industries in Ector County include Mining, Quarrying, & Extraction (10,644 | 14.2%), Retail Trade (9,235 | 12.3%), Health Care & Social Assistance (7,322 | 9.8%), Transportation & Warehousing (6,612 | 8.8%), and Construction (6,307 | 8.4%).
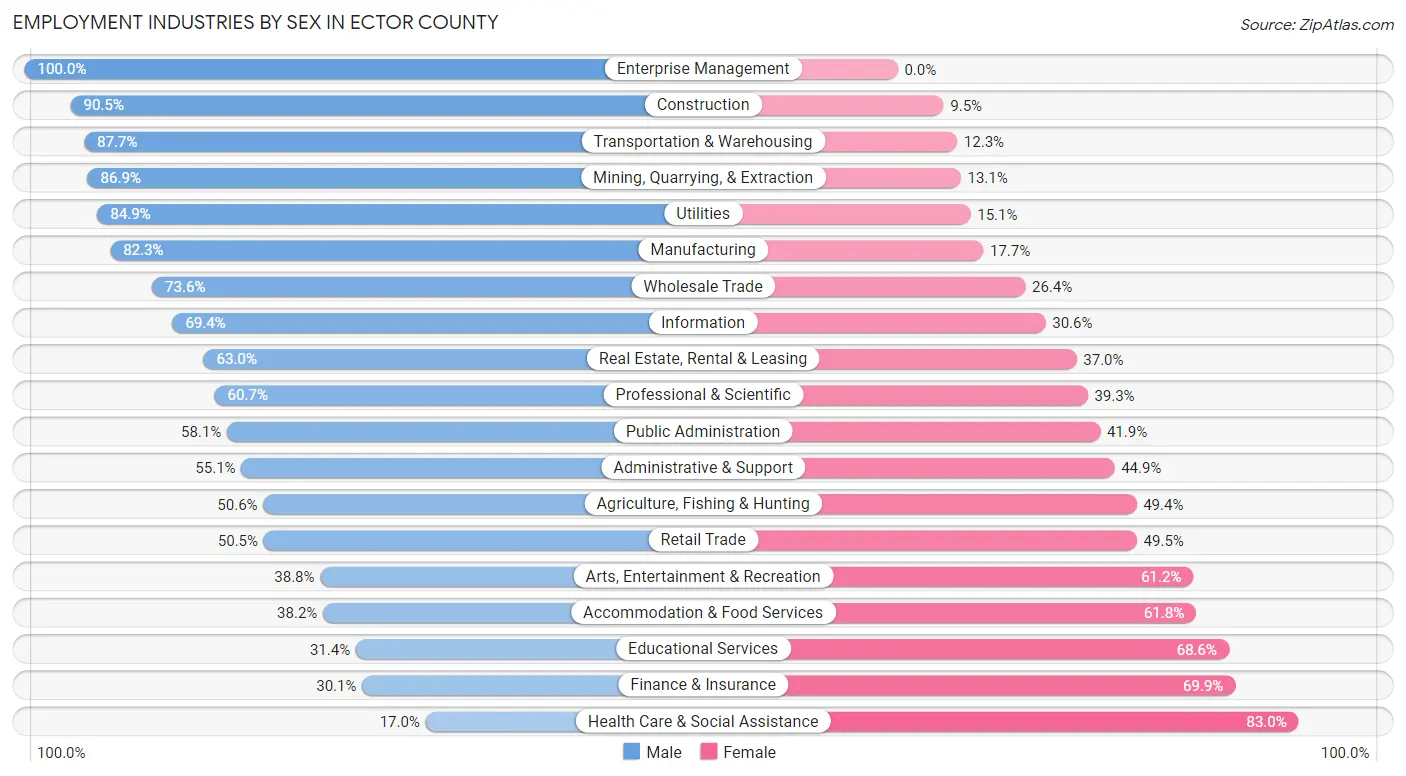
Employment Industries by Sex in Ector County
The Ector County industries that see more men than women are Enterprise Management (100.0%), Construction (90.5%), and Transportation & Warehousing (87.7%), whereas the industries that tend to have a higher number of women are Health Care & Social Assistance (83.0%), Finance & Insurance (69.9%), and Educational Services (68.6%).
| Industry | Male | Female |
| Agriculture, Fishing & Hunting | 88 (50.6%) | 86 (49.4%) |
| Mining, Quarrying, & Extraction | 9,254 (86.9%) | 1,390 (13.1%) |
| Construction | 5,707 (90.5%) | 600 (9.5%) |
| Manufacturing | 4,514 (82.3%) | 972 (17.7%) |
| Wholesale Trade | 1,775 (73.6%) | 637 (26.4%) |
| Retail Trade | 4,662 (50.5%) | 4,573 (49.5%) |
| Transportation & Warehousing | 5,798 (87.7%) | 814 (12.3%) |
| Utilities | 811 (84.9%) | 144 (15.1%) |
| Information | 544 (69.4%) | 240 (30.6%) |
| Finance & Insurance | 623 (30.1%) | 1,447 (69.9%) |
| Real Estate, Rental & Leasing | 872 (63.0%) | 513 (37.0%) |
| Professional & Scientific | 1,413 (60.7%) | 916 (39.3%) |
| Enterprise Management | 27 (100.0%) | 0 (0.0%) |
| Administrative & Support | 1,366 (55.1%) | 1,112 (44.9%) |
| Educational Services | 1,674 (31.4%) | 3,655 (68.6%) |
| Health Care & Social Assistance | 1,243 (17.0%) | 6,079 (83.0%) |
| Arts, Entertainment & Recreation | 268 (38.8%) | 423 (61.2%) |
| Accommodation & Food Services | 1,881 (38.2%) | 3,043 (61.8%) |
| Public Administration | 1,022 (58.1%) | 738 (41.9%) |
| Total | 45,915 (61.4%) | 28,879 (38.6%) |
Education in Ector County
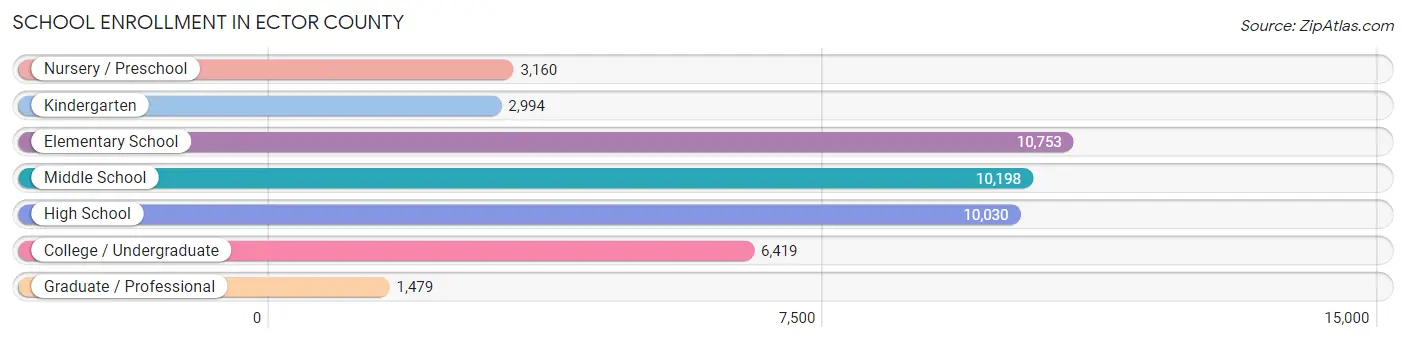
School Enrollment in Ector County
The most common levels of schooling among the 45,033 students in Ector County are elementary school (10,753 | 23.9%), middle school (10,198 | 22.7%), and high school (10,030 | 22.3%).
| School Level | # Students | % Students |
| Nursery / Preschool | 3,160 | 7.0% |
| Kindergarten | 2,994 | 6.7% |
| Elementary School | 10,753 | 23.9% |
| Middle School | 10,198 | 22.7% |
| High School | 10,030 | 22.3% |
| College / Undergraduate | 6,419 | 14.2% |
| Graduate / Professional | 1,479 | 3.3% |
| Total | 45,033 | 100.0% |
School Enrollment by Age by Funding Source in Ector County
Out of a total of 45,033 students who are enrolled in schools in Ector County, 4,503 (10.0%) attend a private institution, while the remaining 40,530 (90.0%) are enrolled in public schools. The age group of 3 to 4 year olds has the highest likelihood of being enrolled in private schools, with 673 (29.0% in the age bracket) enrolled. Conversely, the age group of 15 to 17 year olds has the lowest likelihood of being enrolled in a private school, with 6,803 (94.6% in the age bracket) attending a public institution.
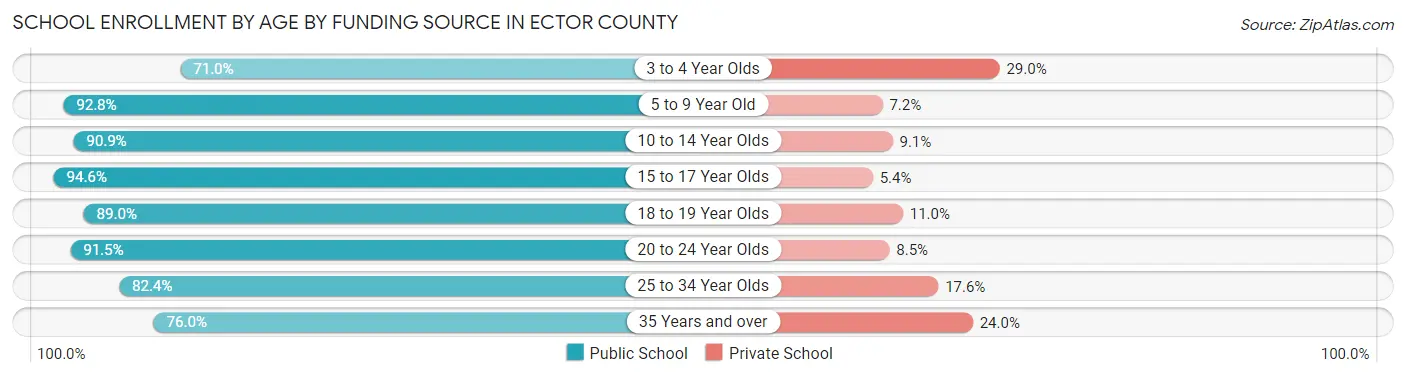
| Age Bracket | Public School | Private School |
| 3 to 4 Year Olds | 1,646 (71.0%) | 673 (29.0%) |
| 5 to 9 Year Old | 12,640 (92.8%) | 985 (7.2%) |
| 10 to 14 Year Olds | 11,386 (90.9%) | 1,140 (9.1%) |
| 15 to 17 Year Olds | 6,803 (94.6%) | 389 (5.4%) |
| 18 to 19 Year Olds | 1,956 (89.0%) | 242 (11.0%) |
| 20 to 24 Year Olds | 2,904 (91.5%) | 270 (8.5%) |
| 25 to 34 Year Olds | 1,862 (82.4%) | 398 (17.6%) |
| 35 Years and over | 1,321 (76.0%) | 418 (24.0%) |
| Total | 40,530 (90.0%) | 4,503 (10.0%) |
Educational Attainment by Field of Study in Ector County
Business (3,426 | 19.5%), education (2,183 | 12.4%), science & technology (1,873 | 10.6%), arts & humanities (1,611 | 9.2%), and liberal arts & history (1,235 | 7.0%) are the most common fields of study among 17,594 individuals in Ector County who have obtained a bachelor's degree or higher.
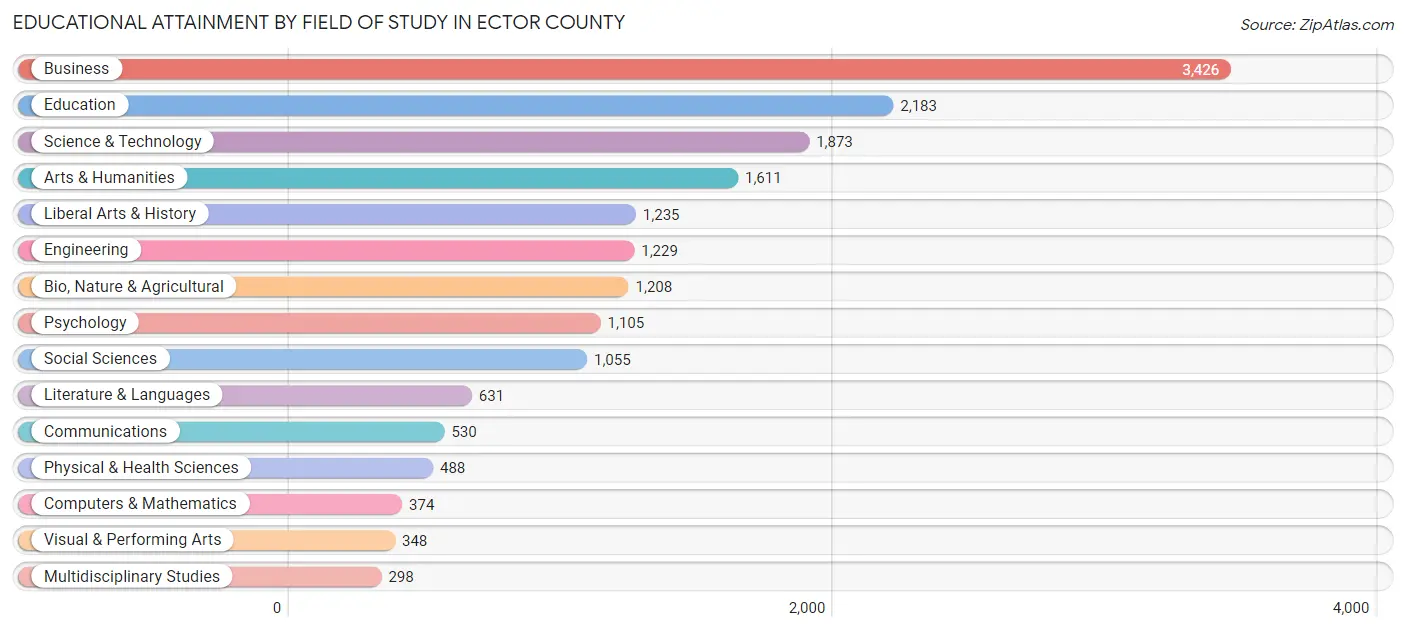
| Field of Study | # Graduates | % Graduates |
| Computers & Mathematics | 374 | 2.1% |
| Bio, Nature & Agricultural | 1,208 | 6.9% |
| Physical & Health Sciences | 488 | 2.8% |
| Psychology | 1,105 | 6.3% |
| Social Sciences | 1,055 | 6.0% |
| Engineering | 1,229 | 7.0% |
| Multidisciplinary Studies | 298 | 1.7% |
| Science & Technology | 1,873 | 10.6% |
| Business | 3,426 | 19.5% |
| Education | 2,183 | 12.4% |
| Literature & Languages | 631 | 3.6% |
| Liberal Arts & History | 1,235 | 7.0% |
| Visual & Performing Arts | 348 | 2.0% |
| Communications | 530 | 3.0% |
| Arts & Humanities | 1,611 | 9.2% |
| Total | 17,594 | 100.0% |
Transportation & Commute in Ector County
Vehicle Availability by Sex in Ector County
The most prevalent vehicle ownership categories in Ector County are males with 2 vehicles (19,495, accounting for 43.2%) and females with 2 vehicles (12,633, making up 70.0%).
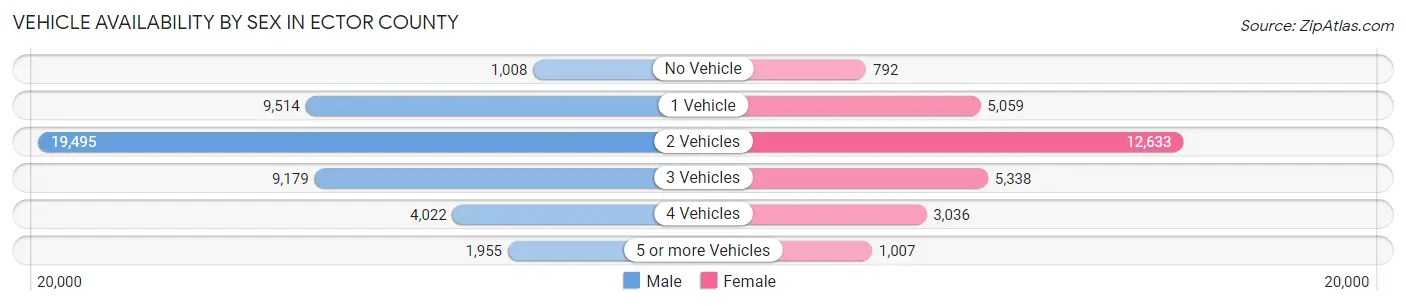
| Vehicles Available | Male | Female |
| No Vehicle | 1,008 (2.2%) | 792 (2.8%) |
| 1 Vehicle | 9,514 (21.1%) | 5,059 (18.2%) |
| 2 Vehicles | 19,495 (43.2%) | 12,633 (45.3%) |
| 3 Vehicles | 9,179 (20.3%) | 5,338 (19.2%) |
| 4 Vehicles | 4,022 (8.9%) | 3,036 (10.9%) |
| 5 or more Vehicles | 1,955 (4.3%) | 1,007 (3.6%) |
| Total | 45,173 (100.0%) | 27,865 (100.0%) |
Commute Time in Ector County
The most frequently occuring commute durations in Ector County are 15 to 19 minutes (12,362 commuters, 17.5%), 10 to 14 minutes (12,187 commuters, 17.2%), and 20 to 24 minutes (11,262 commuters, 15.9%).
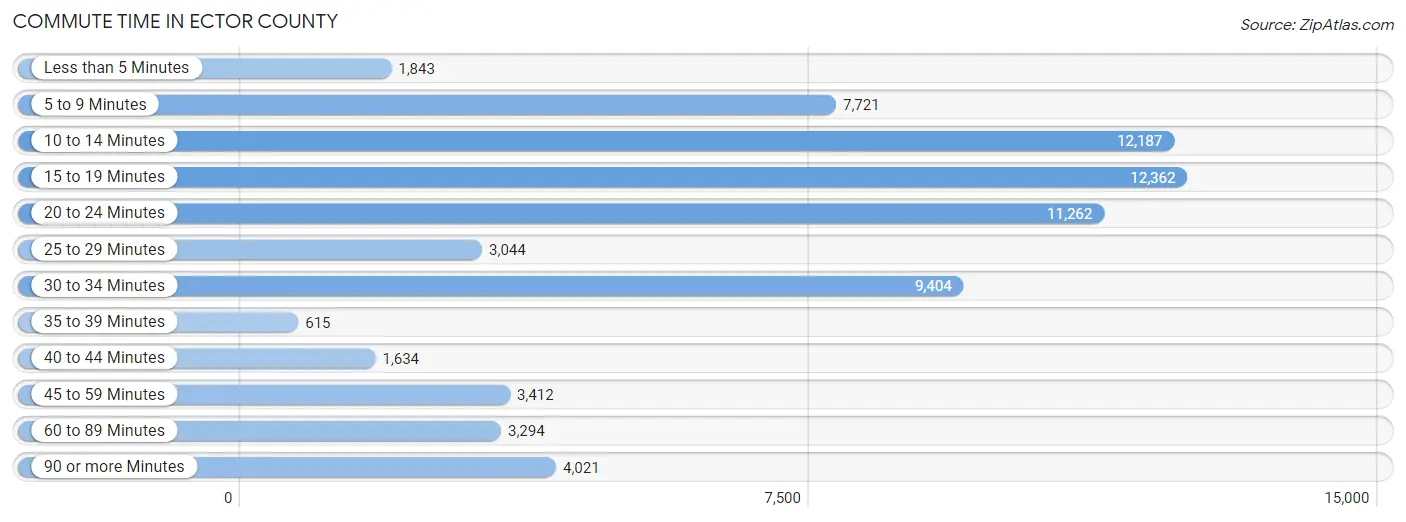
| Commute Time | # Commuters | % Commuters |
| Less than 5 Minutes | 1,843 | 2.6% |
| 5 to 9 Minutes | 7,721 | 10.9% |
| 10 to 14 Minutes | 12,187 | 17.2% |
| 15 to 19 Minutes | 12,362 | 17.5% |
| 20 to 24 Minutes | 11,262 | 15.9% |
| 25 to 29 Minutes | 3,044 | 4.3% |
| 30 to 34 Minutes | 9,404 | 13.3% |
| 35 to 39 Minutes | 615 | 0.9% |
| 40 to 44 Minutes | 1,634 | 2.3% |
| 45 to 59 Minutes | 3,412 | 4.8% |
| 60 to 89 Minutes | 3,294 | 4.6% |
| 90 or more Minutes | 4,021 | 5.7% |
Commute Time by Sex in Ector County
The most common commute times in Ector County are 15 to 19 minutes (7,816 commuters, 17.7%) for males and 10 to 14 minutes (6,076 commuters, 22.7%) for females.
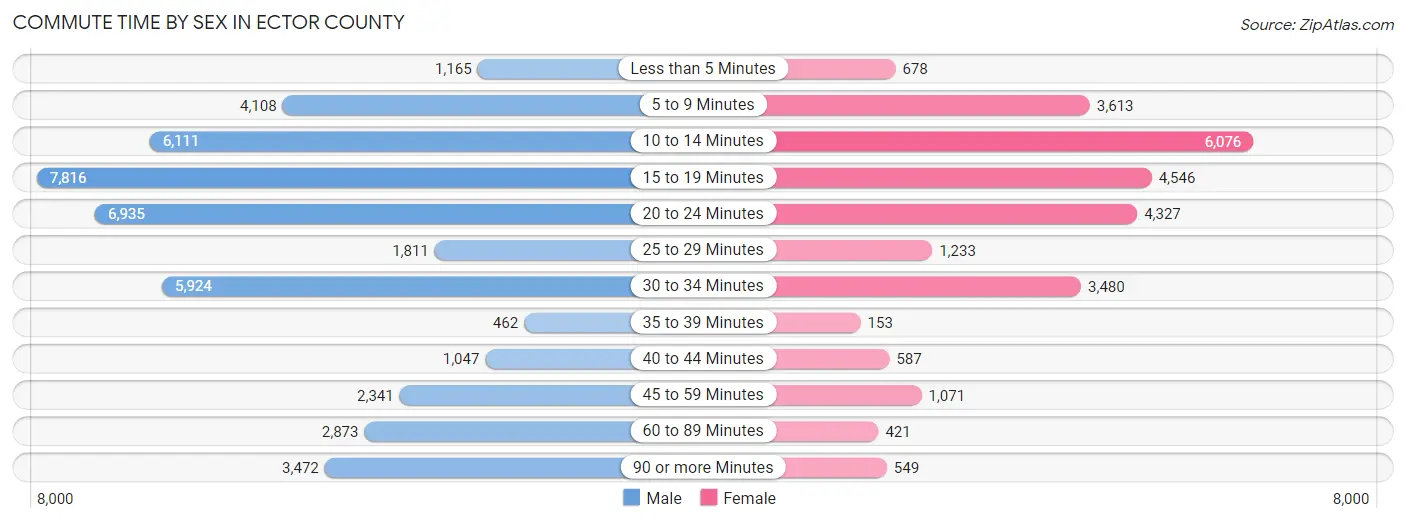
| Commute Time | Male | Female |
| Less than 5 Minutes | 1,165 (2.6%) | 678 (2.5%) |
| 5 to 9 Minutes | 4,108 (9.3%) | 3,613 (13.5%) |
| 10 to 14 Minutes | 6,111 (13.9%) | 6,076 (22.7%) |
| 15 to 19 Minutes | 7,816 (17.7%) | 4,546 (17.0%) |
| 20 to 24 Minutes | 6,935 (15.7%) | 4,327 (16.2%) |
| 25 to 29 Minutes | 1,811 (4.1%) | 1,233 (4.6%) |
| 30 to 34 Minutes | 5,924 (13.4%) | 3,480 (13.0%) |
| 35 to 39 Minutes | 462 (1.1%) | 153 (0.6%) |
| 40 to 44 Minutes | 1,047 (2.4%) | 587 (2.2%) |
| 45 to 59 Minutes | 2,341 (5.3%) | 1,071 (4.0%) |
| 60 to 89 Minutes | 2,873 (6.5%) | 421 (1.6%) |
| 90 or more Minutes | 3,472 (7.9%) | 549 (2.1%) |
Time of Departure to Work by Sex in Ector County
The most frequent times of departure to work in Ector County are 6:00 AM to 6:29 AM (6,852, 15.5%) for males and 7:30 AM to 7:59 AM (4,841, 18.1%) for females.
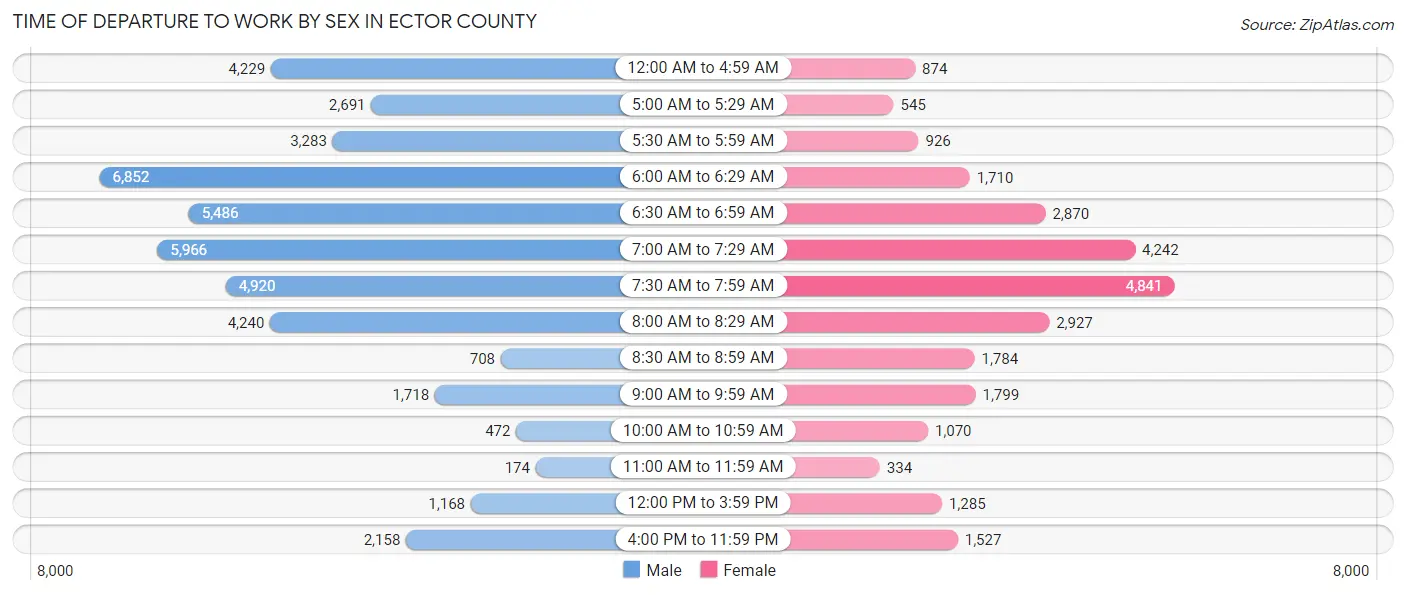
| Time of Departure | Male | Female |
| 12:00 AM to 4:59 AM | 4,229 (9.6%) | 874 (3.3%) |
| 5:00 AM to 5:29 AM | 2,691 (6.1%) | 545 (2.0%) |
| 5:30 AM to 5:59 AM | 3,283 (7.4%) | 926 (3.5%) |
| 6:00 AM to 6:29 AM | 6,852 (15.5%) | 1,710 (6.4%) |
| 6:30 AM to 6:59 AM | 5,486 (12.4%) | 2,870 (10.7%) |
| 7:00 AM to 7:29 AM | 5,966 (13.5%) | 4,242 (15.9%) |
| 7:30 AM to 7:59 AM | 4,920 (11.2%) | 4,841 (18.1%) |
| 8:00 AM to 8:29 AM | 4,240 (9.6%) | 2,927 (11.0%) |
| 8:30 AM to 8:59 AM | 708 (1.6%) | 1,784 (6.7%) |
| 9:00 AM to 9:59 AM | 1,718 (3.9%) | 1,799 (6.7%) |
| 10:00 AM to 10:59 AM | 472 (1.1%) | 1,070 (4.0%) |
| 11:00 AM to 11:59 AM | 174 (0.4%) | 334 (1.3%) |
| 12:00 PM to 3:59 PM | 1,168 (2.6%) | 1,285 (4.8%) |
| 4:00 PM to 11:59 PM | 2,158 (4.9%) | 1,527 (5.7%) |
| Total | 44,065 (100.0%) | 26,734 (100.0%) |
Housing Occupancy in Ector County
Occupancy by Ownership in Ector County
Of the total 60,676 dwellings in Ector County, owner-occupied units account for 39,398 (64.9%), while renter-occupied units make up 21,278 (35.1%).
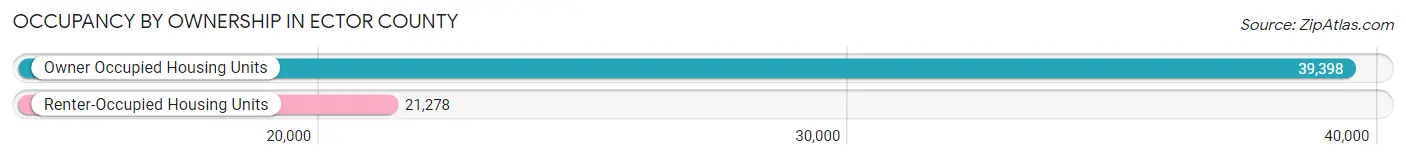
| Occupancy | # Housing Units | % Housing Units |
| Owner Occupied Housing Units | 39,398 | 64.9% |
| Renter-Occupied Housing Units | 21,278 | 35.1% |
| Total Occupied Housing Units | 60,676 | 100.0% |
Occupancy by Household Size in Ector County
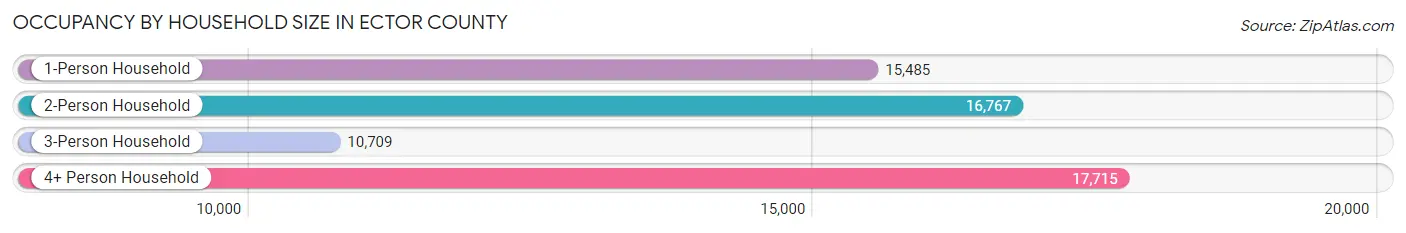
| Household Size | # Housing Units | % Housing Units |
| 1-Person Household | 15,485 | 25.5% |
| 2-Person Household | 16,767 | 27.6% |
| 3-Person Household | 10,709 | 17.6% |
| 4+ Person Household | 17,715 | 29.2% |
| Total Housing Units | 60,676 | 100.0% |
Occupancy by Ownership by Household Size in Ector County
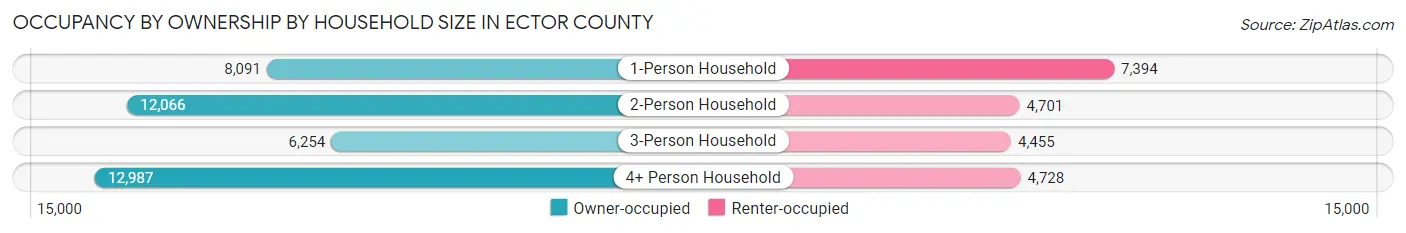
| Household Size | Owner-occupied | Renter-occupied |
| 1-Person Household | 8,091 (52.2%) | 7,394 (47.7%) |
| 2-Person Household | 12,066 (72.0%) | 4,701 (28.0%) |
| 3-Person Household | 6,254 (58.4%) | 4,455 (41.6%) |
| 4+ Person Household | 12,987 (73.3%) | 4,728 (26.7%) |
| Total Housing Units | 39,398 (64.9%) | 21,278 (35.1%) |
Occupancy by Educational Attainment in Ector County
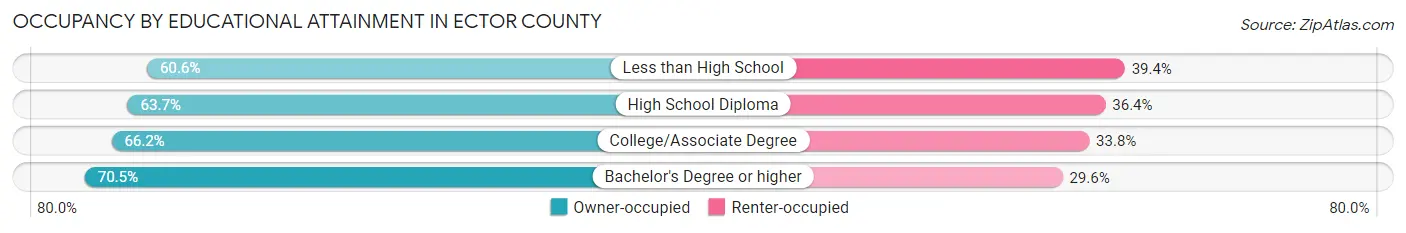
| Household Size | Owner-occupied | Renter-occupied |
| Less than High School | 8,303 (60.6%) | 5,402 (39.4%) |
| High School Diploma | 10,792 (63.6%) | 6,162 (36.3%) |
| College/Associate Degree | 13,214 (66.2%) | 6,740 (33.8%) |
| Bachelor's Degree or higher | 7,089 (70.5%) | 2,974 (29.5%) |
Occupancy by Age of Householder in Ector County
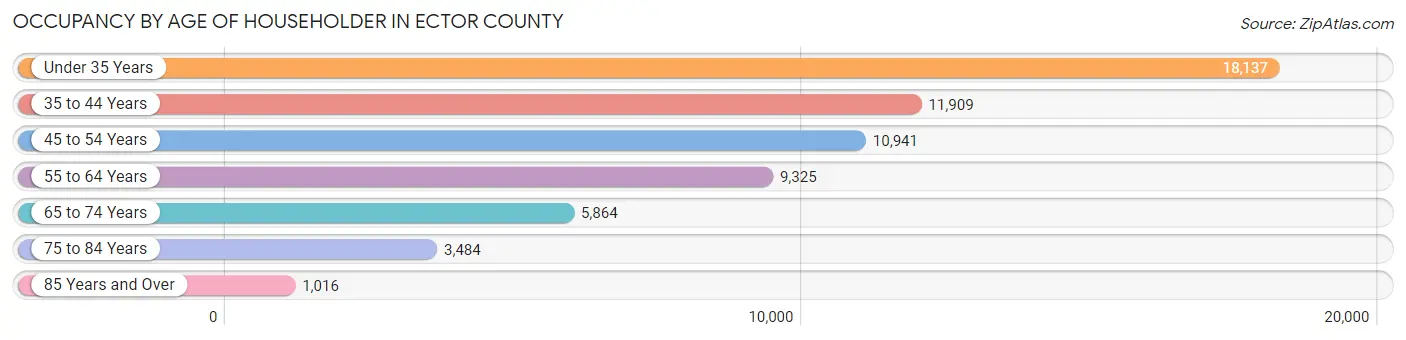
| Age Bracket | # Households | % Households |
| Under 35 Years | 18,137 | 29.9% |
| 35 to 44 Years | 11,909 | 19.6% |
| 45 to 54 Years | 10,941 | 18.0% |
| 55 to 64 Years | 9,325 | 15.4% |
| 65 to 74 Years | 5,864 | 9.7% |
| 75 to 84 Years | 3,484 | 5.7% |
| 85 Years and Over | 1,016 | 1.7% |
| Total | 60,676 | 100.0% |
Housing Finances in Ector County
Median Income by Occupancy in Ector County
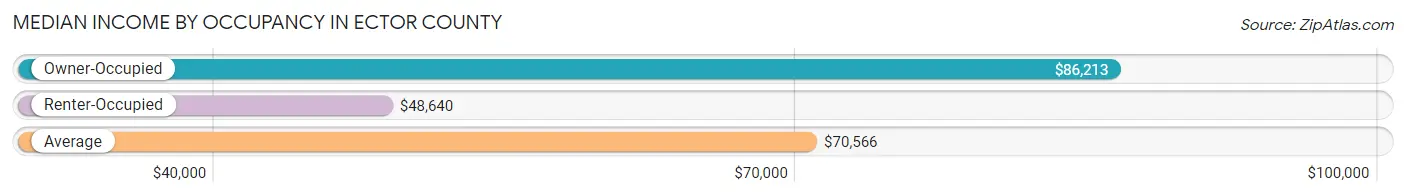
| Occupancy Type | # Households | Median Income |
| Owner-Occupied | 39,398 (64.9%) | $86,213 |
| Renter-Occupied | 21,278 (35.1%) | $48,640 |
| Average | 60,676 (100.0%) | $70,566 |
Occupancy by Householder Income Bracket in Ector County
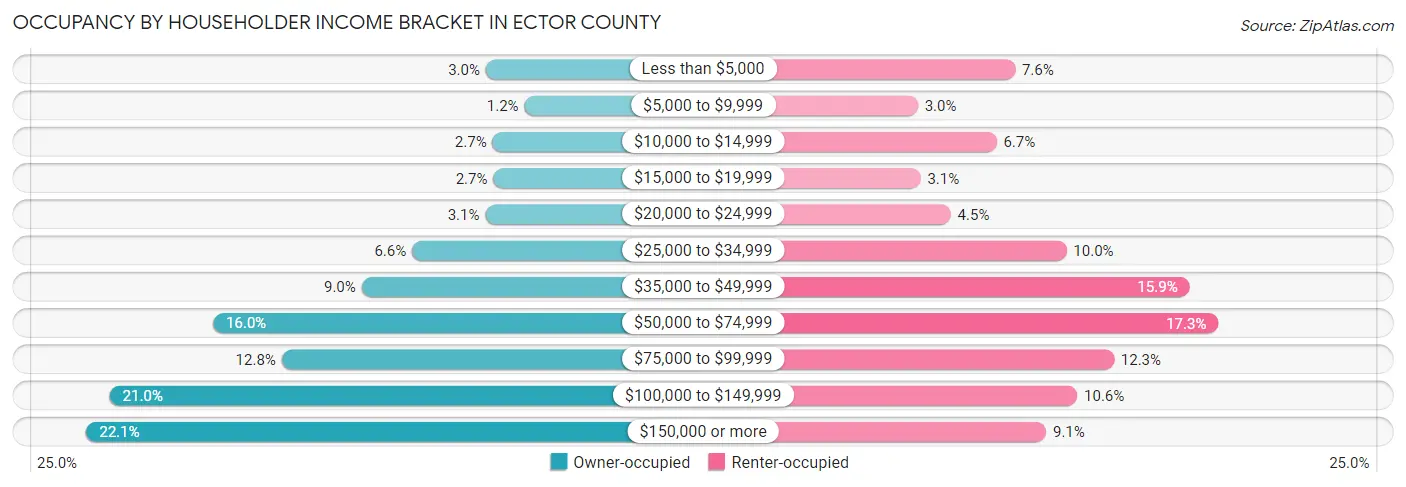
| Income Bracket | Owner-occupied | Renter-occupied |
| Less than $5,000 | 1,199 (3.0%) | 1,615 (7.6%) |
| $5,000 to $9,999 | 473 (1.2%) | 629 (3.0%) |
| $10,000 to $14,999 | 1,072 (2.7%) | 1,427 (6.7%) |
| $15,000 to $19,999 | 1,055 (2.7%) | 658 (3.1%) |
| $20,000 to $24,999 | 1,204 (3.1%) | 963 (4.5%) |
| $25,000 to $34,999 | 2,579 (6.6%) | 2,136 (10.0%) |
| $35,000 to $49,999 | 3,528 (8.9%) | 3,384 (15.9%) |
| $50,000 to $74,999 | 6,317 (16.0%) | 3,674 (17.3%) |
| $75,000 to $99,999 | 5,028 (12.8%) | 2,618 (12.3%) |
| $100,000 to $149,999 | 8,253 (20.9%) | 2,245 (10.5%) |
| $150,000 or more | 8,690 (22.1%) | 1,929 (9.1%) |
| Total | 39,398 (100.0%) | 21,278 (100.0%) |
Monthly Housing Cost Tiers in Ector County
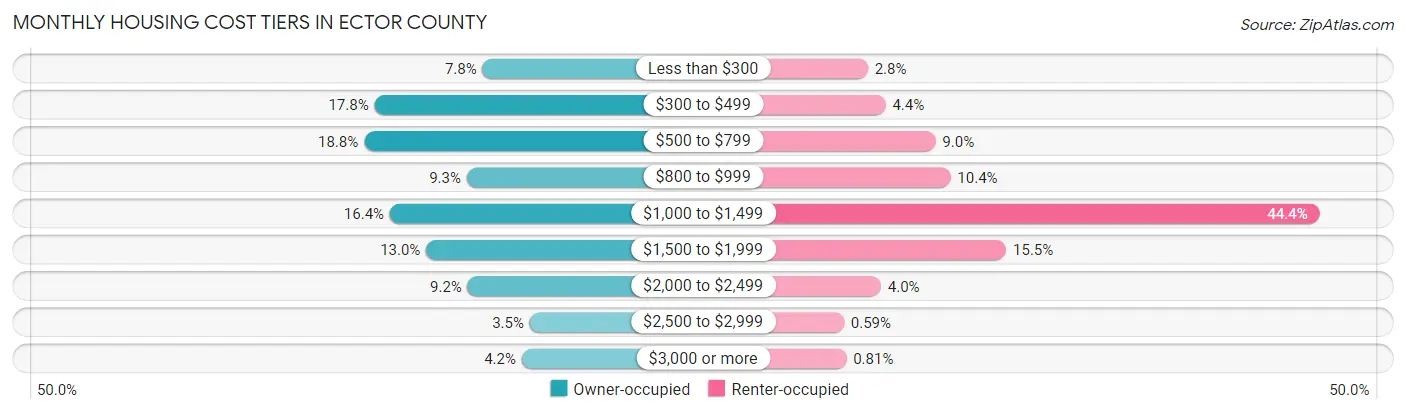
| Monthly Cost | Owner-occupied | Renter-occupied |
| Less than $300 | 3,090 (7.8%) | 593 (2.8%) |
| $300 to $499 | 7,010 (17.8%) | 941 (4.4%) |
| $500 to $799 | 7,388 (18.8%) | 1,919 (9.0%) |
| $800 to $999 | 3,659 (9.3%) | 2,213 (10.4%) |
| $1,000 to $1,499 | 6,448 (16.4%) | 9,444 (44.4%) |
| $1,500 to $1,999 | 5,133 (13.0%) | 3,304 (15.5%) |
| $2,000 to $2,499 | 3,628 (9.2%) | 851 (4.0%) |
| $2,500 to $2,999 | 1,375 (3.5%) | 125 (0.6%) |
| $3,000 or more | 1,667 (4.2%) | 173 (0.8%) |
| Total | 39,398 (100.0%) | 21,278 (100.0%) |
Physical Housing Characteristics in Ector County
Housing Structures in Ector County
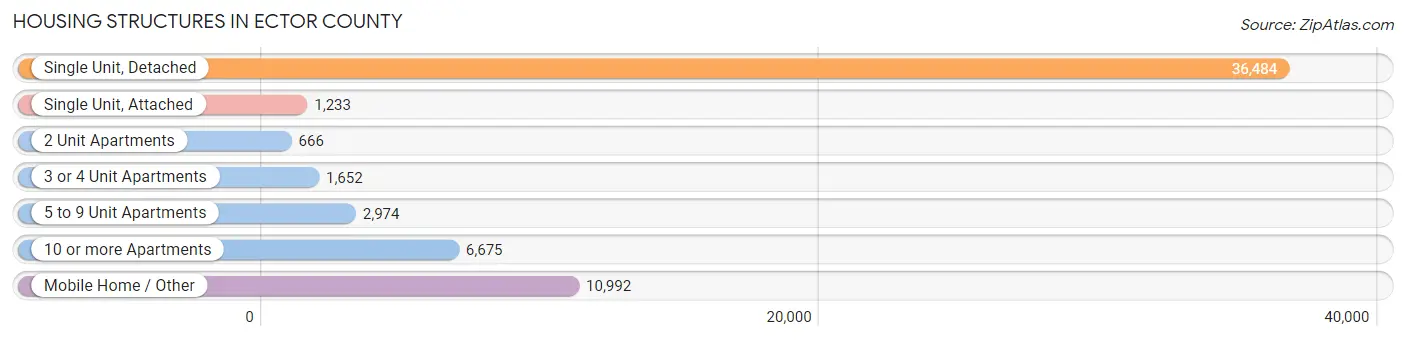
| Structure Type | # Housing Units | % Housing Units |
| Single Unit, Detached | 36,484 | 60.1% |
| Single Unit, Attached | 1,233 | 2.0% |
| 2 Unit Apartments | 666 | 1.1% |
| 3 or 4 Unit Apartments | 1,652 | 2.7% |
| 5 to 9 Unit Apartments | 2,974 | 4.9% |
| 10 or more Apartments | 6,675 | 11.0% |
| Mobile Home / Other | 10,992 | 18.1% |
| Total | 60,676 | 100.0% |
Housing Structures by Occupancy in Ector County
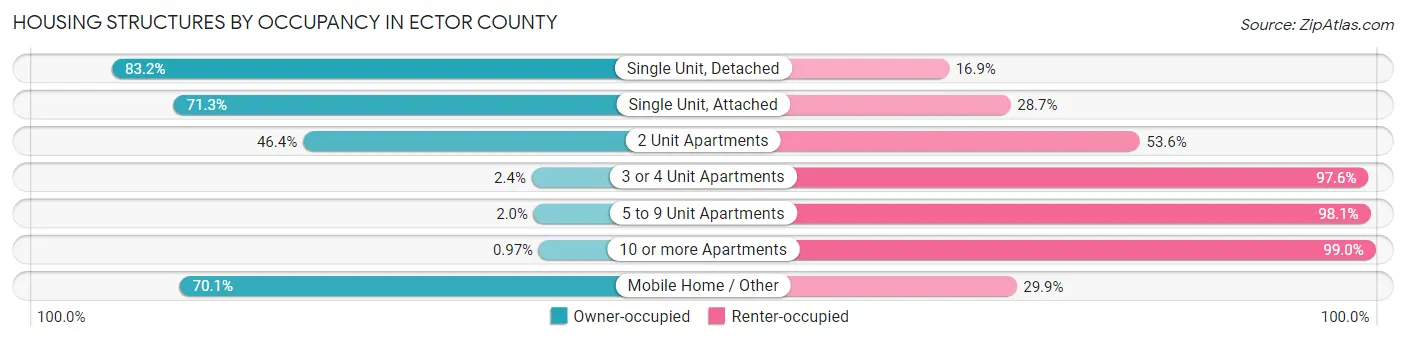
| Structure Type | Owner-occupied | Renter-occupied |
| Single Unit, Detached | 30,338 (83.2%) | 6,146 (16.9%) |
| Single Unit, Attached | 879 (71.3%) | 354 (28.7%) |
| 2 Unit Apartments | 309 (46.4%) | 357 (53.6%) |
| 3 or 4 Unit Apartments | 39 (2.4%) | 1,613 (97.6%) |
| 5 to 9 Unit Apartments | 58 (1.9%) | 2,916 (98.1%) |
| 10 or more Apartments | 65 (1.0%) | 6,610 (99.0%) |
| Mobile Home / Other | 7,710 (70.1%) | 3,282 (29.9%) |
| Total | 39,398 (64.9%) | 21,278 (35.1%) |
Housing Structures by Number of Rooms in Ector County
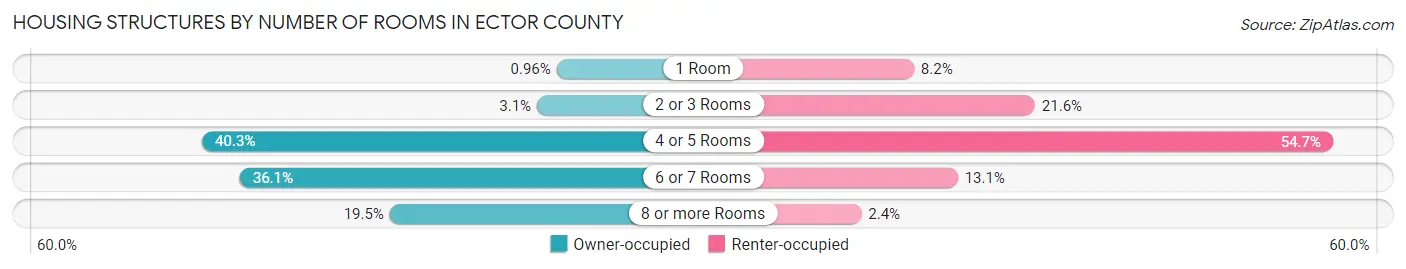
| Number of Rooms | Owner-occupied | Renter-occupied |
| 1 Room | 377 (1.0%) | 1,746 (8.2%) |
| 2 or 3 Rooms | 1,237 (3.1%) | 4,604 (21.6%) |
| 4 or 5 Rooms | 15,880 (40.3%) | 11,640 (54.7%) |
| 6 or 7 Rooms | 14,228 (36.1%) | 2,782 (13.1%) |
| 8 or more Rooms | 7,676 (19.5%) | 506 (2.4%) |
| Total | 39,398 (100.0%) | 21,278 (100.0%) |
Housing Structure by Heating Type in Ector County
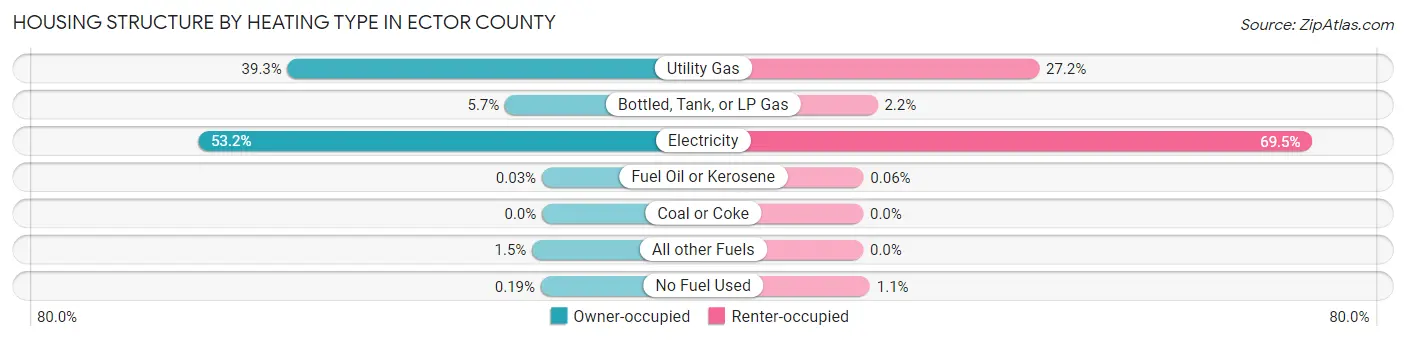
| Heating Type | Owner-occupied | Renter-occupied |
| Utility Gas | 15,499 (39.3%) | 5,789 (27.2%) |
| Bottled, Tank, or LP Gas | 2,255 (5.7%) | 475 (2.2%) |
| Electricity | 20,955 (53.2%) | 14,778 (69.5%) |
| Fuel Oil or Kerosene | 10 (0.0%) | 12 (0.1%) |
| Coal or Coke | 0 (0.0%) | 0 (0.0%) |
| All other Fuels | 604 (1.5%) | 0 (0.0%) |
| No Fuel Used | 75 (0.2%) | 224 (1.1%) |
| Total | 39,398 (100.0%) | 21,278 (100.0%) |
Household Vehicle Usage in Ector County
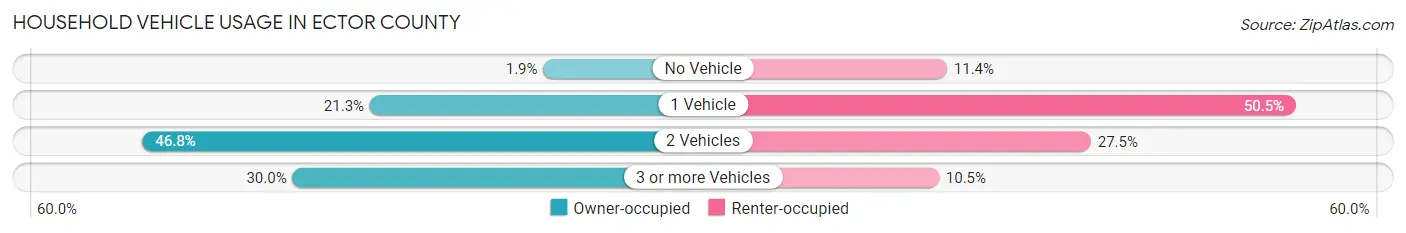
| Vehicles per Household | Owner-occupied | Renter-occupied |
| No Vehicle | 743 (1.9%) | 2,430 (11.4%) |
| 1 Vehicle | 8,401 (21.3%) | 10,750 (50.5%) |
| 2 Vehicles | 18,438 (46.8%) | 5,860 (27.5%) |
| 3 or more Vehicles | 11,816 (30.0%) | 2,238 (10.5%) |
| Total | 39,398 (100.0%) | 21,278 (100.0%) |
Real Estate & Mortgages in Ector County
Real Estate and Mortgage Overview in Ector County
| Characteristic | Without Mortgage | With Mortgage |
| Housing Units | 20,797 | 18,601 |
| Median Property Value | $129,200 | $217,000 |
| Median Household Income | $67,748 | $5,176 |
| Monthly Housing Costs | $513 | $1,537 |
| Real Estate Taxes | $1,572 | $575 |
Property Value by Mortgage Status in Ector County
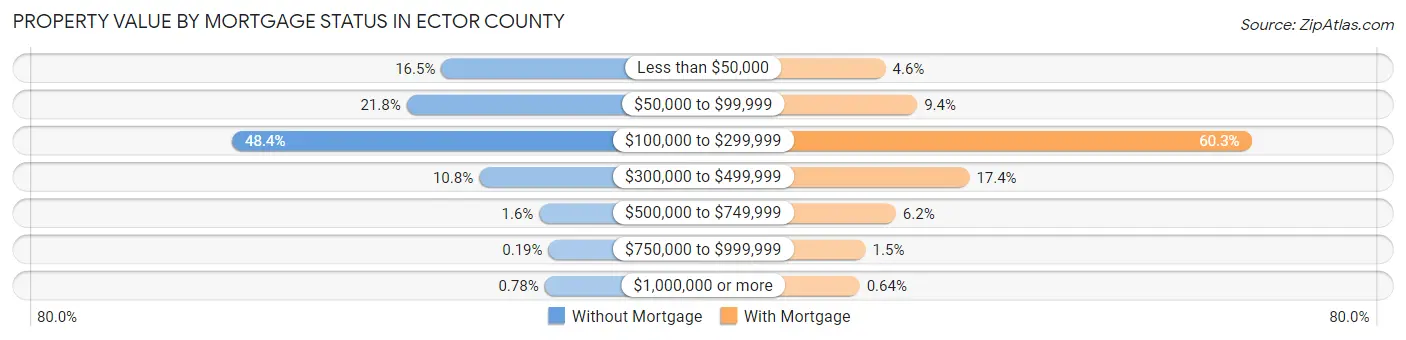
| Property Value | Without Mortgage | With Mortgage |
| Less than $50,000 | 3,434 (16.5%) | 851 (4.6%) |
| $50,000 to $99,999 | 4,535 (21.8%) | 1,749 (9.4%) |
| $100,000 to $299,999 | 10,059 (48.4%) | 11,221 (60.3%) |
| $300,000 to $499,999 | 2,237 (10.8%) | 3,230 (17.4%) |
| $500,000 to $749,999 | 330 (1.6%) | 1,144 (6.1%) |
| $750,000 to $999,999 | 40 (0.2%) | 287 (1.5%) |
| $1,000,000 or more | 162 (0.8%) | 119 (0.6%) |
| Total | 20,797 (100.0%) | 18,601 (100.0%) |
Household Income by Mortgage Status in Ector County
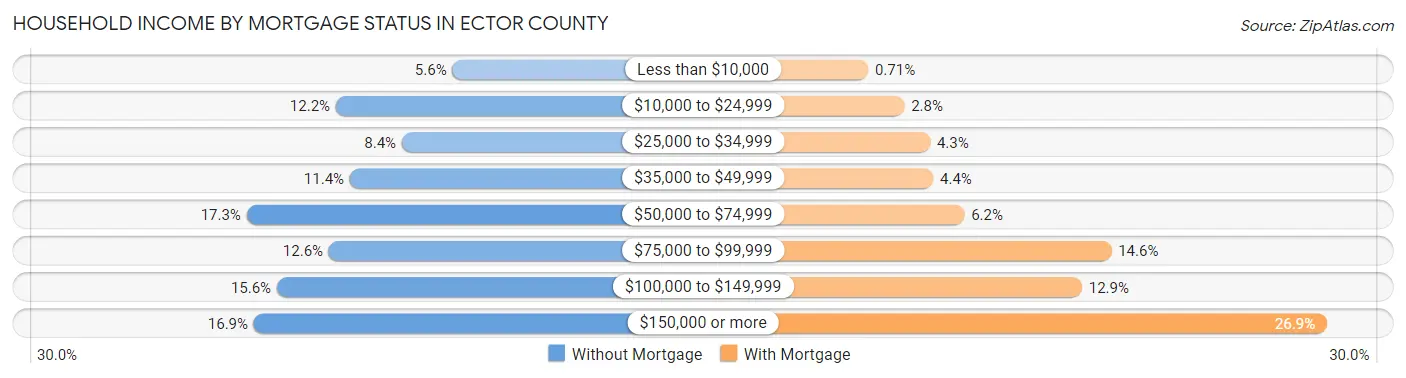
| Household Income | Without Mortgage | With Mortgage |
| Less than $10,000 | 1,154 (5.6%) | 132 (0.7%) |
| $10,000 to $24,999 | 2,540 (12.2%) | 518 (2.8%) |
| $25,000 to $34,999 | 1,755 (8.4%) | 791 (4.3%) |
| $35,000 to $49,999 | 2,372 (11.4%) | 824 (4.4%) |
| $50,000 to $74,999 | 3,599 (17.3%) | 1,156 (6.2%) |
| $75,000 to $99,999 | 2,622 (12.6%) | 2,718 (14.6%) |
| $100,000 to $149,999 | 3,241 (15.6%) | 2,406 (12.9%) |
| $150,000 or more | 3,514 (16.9%) | 5,012 (26.9%) |
| Total | 20,797 (100.0%) | 18,601 (100.0%) |
Property Value to Household Income Ratio in Ector County
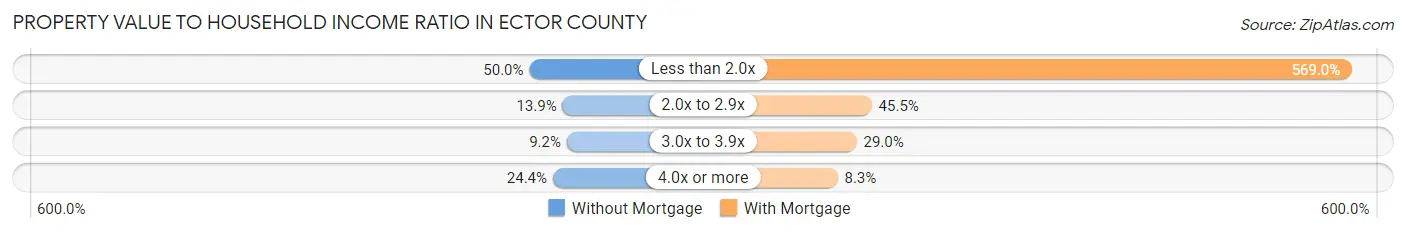
| Value-to-Income Ratio | Without Mortgage | With Mortgage |
| Less than 2.0x | 10,401 (50.0%) | 105,838 (569.0%) |
| 2.0x to 2.9x | 2,888 (13.9%) | 8,463 (45.5%) |
| 3.0x to 3.9x | 1,906 (9.2%) | 5,402 (29.0%) |
| 4.0x or more | 5,067 (24.4%) | 1,547 (8.3%) |
| Total | 20,797 (100.0%) | 18,601 (100.0%) |
Real Estate Taxes by Mortgage Status in Ector County
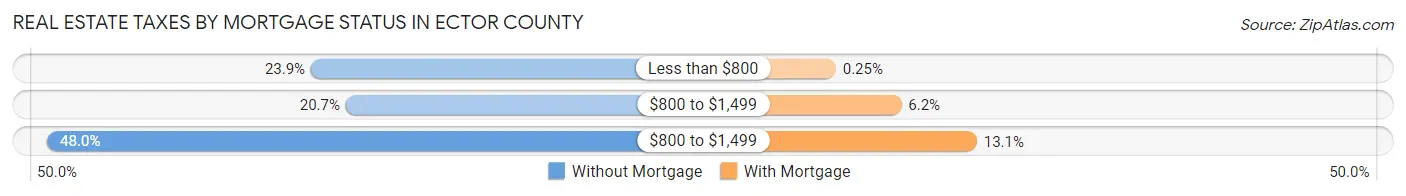
| Property Taxes | Without Mortgage | With Mortgage |
| Less than $800 | 4,960 (23.8%) | 46 (0.3%) |
| $800 to $1,499 | 4,298 (20.7%) | 1,161 (6.2%) |
| $800 to $1,499 | 9,973 (47.9%) | 2,442 (13.1%) |
| Total | 20,797 (100.0%) | 18,601 (100.0%) |
Health & Disability in Ector County
Health Insurance Coverage by Age in Ector County
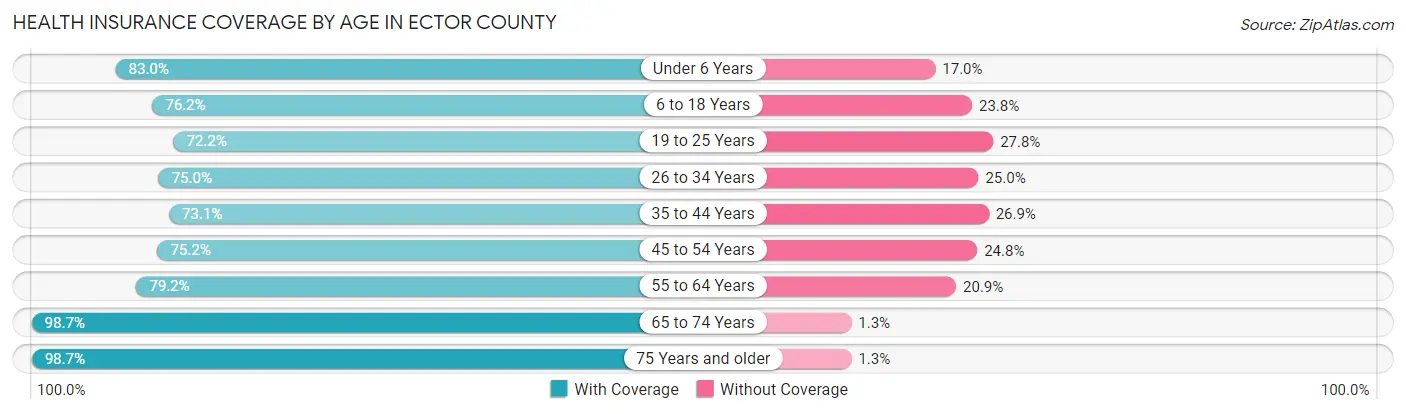
| Age Bracket | With Coverage | Without Coverage |
| Under 6 Years | 14,262 (83.0%) | 2,918 (17.0%) |
| 6 to 18 Years | 25,793 (76.2%) | 8,068 (23.8%) |
| 19 to 25 Years | 11,735 (72.2%) | 4,512 (27.8%) |
| 26 to 34 Years | 18,389 (75.0%) | 6,137 (25.0%) |
| 35 to 44 Years | 15,976 (73.1%) | 5,888 (26.9%) |
| 45 to 54 Years | 12,823 (75.2%) | 4,227 (24.8%) |
| 55 to 64 Years | 12,069 (79.1%) | 3,180 (20.8%) |
| 65 to 74 Years | 9,116 (98.7%) | 122 (1.3%) |
| 75 Years and older | 5,755 (98.7%) | 78 (1.3%) |
| Total | 125,918 (78.2%) | 35,130 (21.8%) |
Health Insurance Coverage by Citizenship Status in Ector County
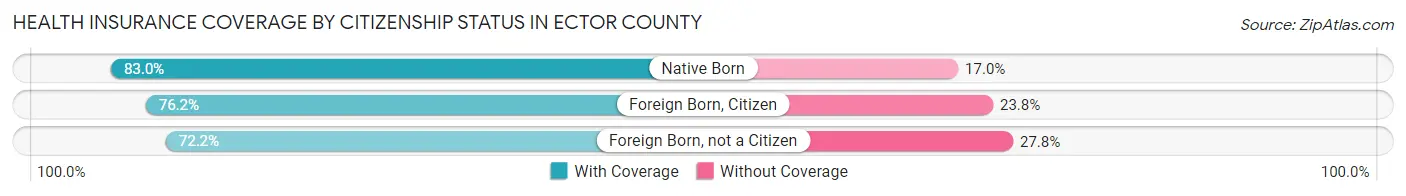
| Citizenship Status | With Coverage | Without Coverage |
| Native Born | 14,262 (83.0%) | 2,918 (17.0%) |
| Foreign Born, Citizen | 25,793 (76.2%) | 8,068 (23.8%) |
| Foreign Born, not a Citizen | 11,735 (72.2%) | 4,512 (27.8%) |
Health Insurance Coverage by Household Income in Ector County
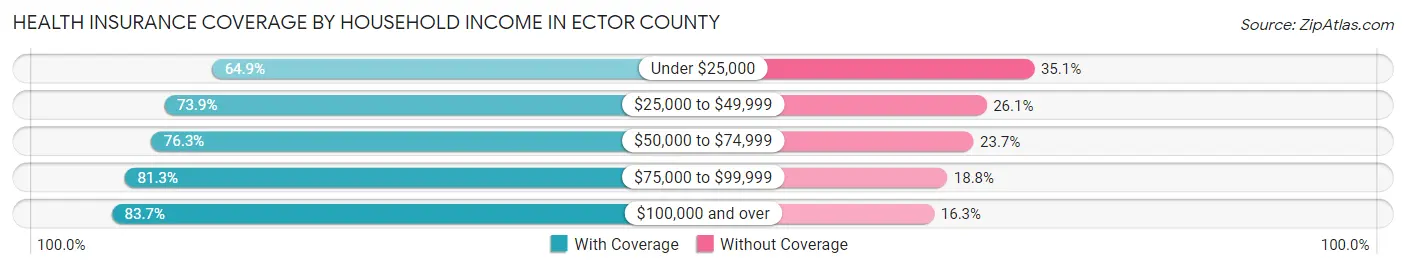
| Household Income | With Coverage | Without Coverage |
| Under $25,000 | 13,312 (64.9%) | 7,190 (35.1%) |
| $25,000 to $49,999 | 19,941 (73.9%) | 7,050 (26.1%) |
| $50,000 to $74,999 | 19,116 (76.3%) | 5,927 (23.7%) |
| $75,000 to $99,999 | 17,035 (81.2%) | 3,931 (18.8%) |
| $100,000 and over | 55,919 (83.7%) | 10,897 (16.3%) |
Public vs Private Health Insurance Coverage by Age in Ector County
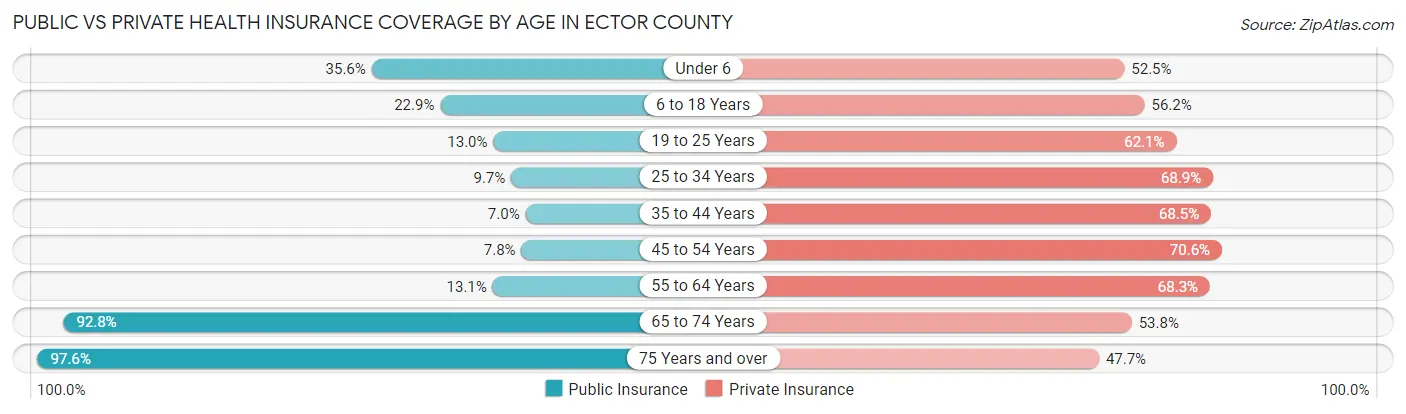
| Age Bracket | Public Insurance | Private Insurance |
| Under 6 | 6,115 (35.6%) | 9,011 (52.4%) |
| 6 to 18 Years | 7,738 (22.9%) | 19,030 (56.2%) |
| 19 to 25 Years | 2,111 (13.0%) | 10,086 (62.1%) |
| 25 to 34 Years | 2,380 (9.7%) | 16,902 (68.9%) |
| 35 to 44 Years | 1,537 (7.0%) | 14,983 (68.5%) |
| 45 to 54 Years | 1,327 (7.8%) | 12,028 (70.6%) |
| 55 to 64 Years | 2,002 (13.1%) | 10,418 (68.3%) |
| 65 to 74 Years | 8,571 (92.8%) | 4,972 (53.8%) |
| 75 Years and over | 5,693 (97.6%) | 2,784 (47.7%) |
| Total | 37,474 (23.3%) | 100,214 (62.2%) |
Disability Status by Sex by Age in Ector County
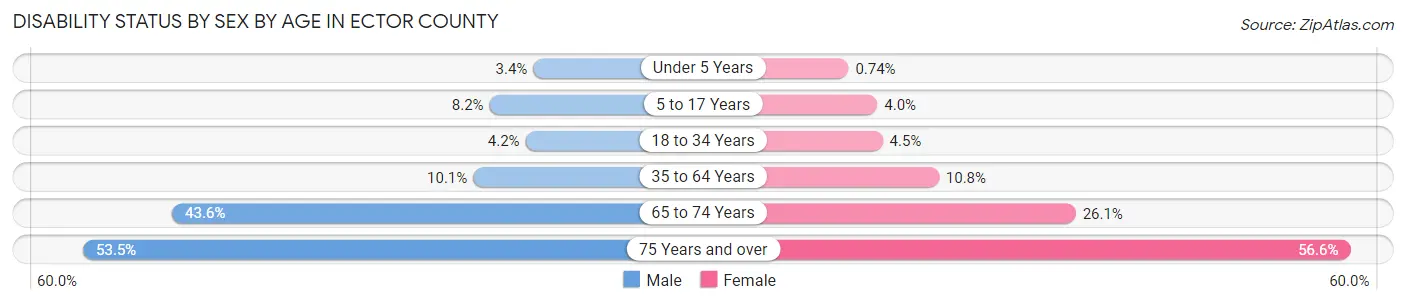
| Age Bracket | Male | Female |
| Under 5 Years | 246 (3.4%) | 50 (0.7%) |
| 5 to 17 Years | 1,470 (8.2%) | 682 (4.0%) |
| 18 to 34 Years | 949 (4.2%) | 914 (4.5%) |
| 35 to 64 Years | 2,832 (10.1%) | 2,810 (10.8%) |
| 65 to 74 Years | 1,916 (43.6%) | 1,261 (26.1%) |
| 75 Years and over | 1,262 (53.5%) | 1,967 (56.6%) |
Disability Class by Sex by Age in Ector County
Disability Class: Hearing Difficulty
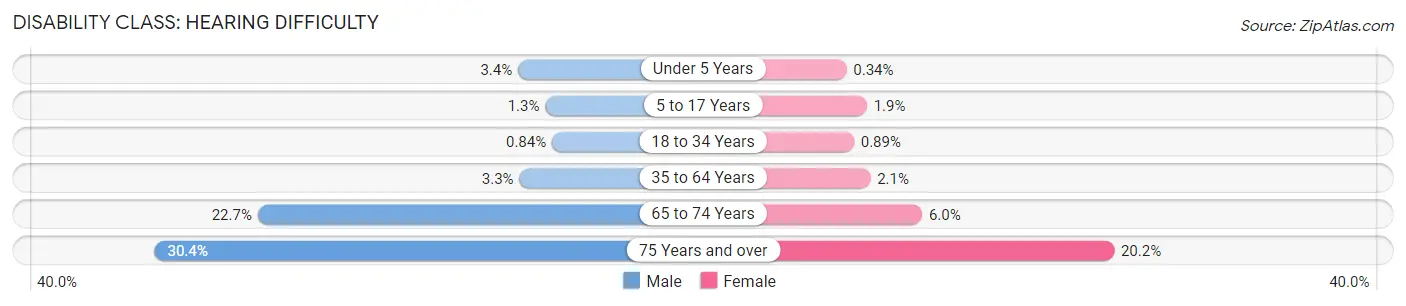
| Age Bracket | Male | Female |
| Under 5 Years | 246 (3.4%) | 23 (0.3%) |
| 5 to 17 Years | 239 (1.3%) | 318 (1.8%) |
| 18 to 34 Years | 189 (0.8%) | 180 (0.9%) |
| 35 to 64 Years | 919 (3.3%) | 548 (2.1%) |
| 65 to 74 Years | 998 (22.7%) | 288 (5.9%) |
| 75 Years and over | 716 (30.3%) | 702 (20.2%) |
Disability Class: Vision Difficulty
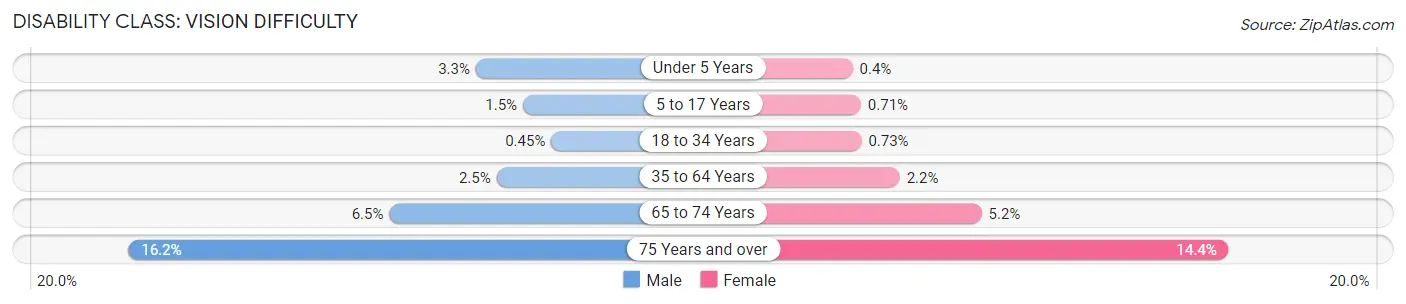
| Age Bracket | Male | Female |
| Under 5 Years | 238 (3.3%) | 27 (0.4%) |
| 5 to 17 Years | 268 (1.5%) | 122 (0.7%) |
| 18 to 34 Years | 101 (0.4%) | 147 (0.7%) |
| 35 to 64 Years | 700 (2.5%) | 560 (2.1%) |
| 65 to 74 Years | 284 (6.5%) | 251 (5.2%) |
| 75 Years and over | 381 (16.2%) | 499 (14.4%) |
Disability Class: Cognitive Difficulty
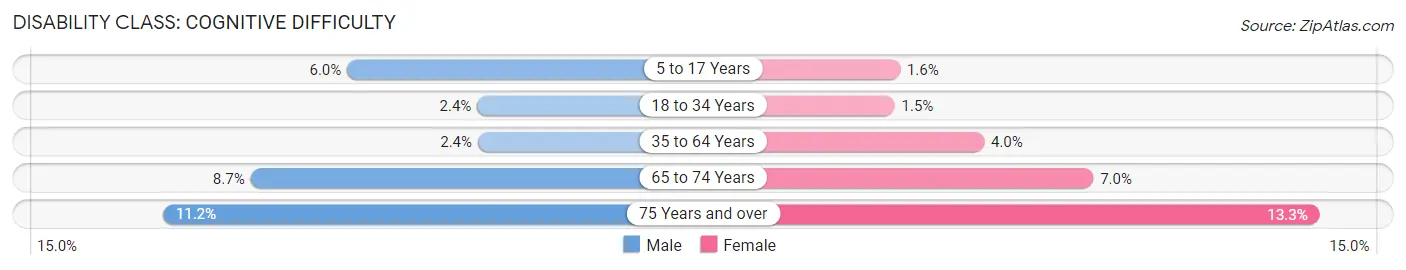
| Age Bracket | Male | Female |
| 5 to 17 Years | 1,076 (6.0%) | 279 (1.6%) |
| 18 to 34 Years | 541 (2.4%) | 297 (1.5%) |
| 35 to 64 Years | 671 (2.4%) | 1,029 (4.0%) |
| 65 to 74 Years | 383 (8.7%) | 339 (7.0%) |
| 75 Years and over | 263 (11.2%) | 462 (13.3%) |
Disability Class: Ambulatory Difficulty
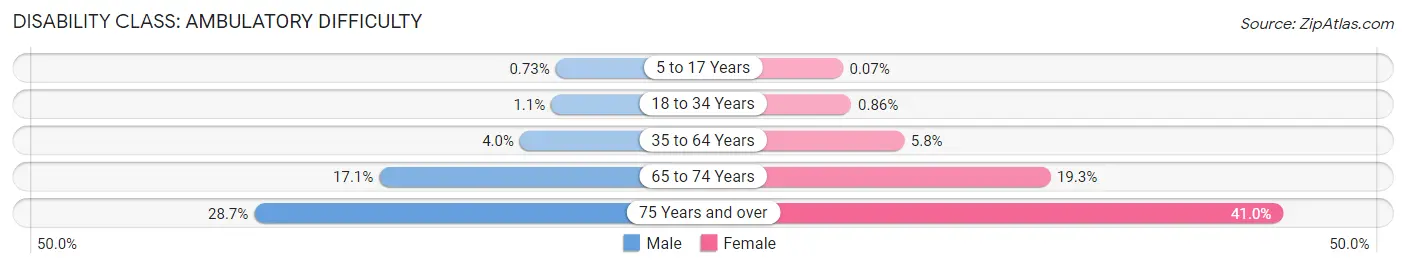
| Age Bracket | Male | Female |
| 5 to 17 Years | 130 (0.7%) | 12 (0.1%) |
| 18 to 34 Years | 257 (1.1%) | 173 (0.9%) |
| 35 to 64 Years | 1,139 (4.0%) | 1,496 (5.8%) |
| 65 to 74 Years | 752 (17.1%) | 935 (19.3%) |
| 75 Years and over | 677 (28.7%) | 1,423 (41.0%) |
Disability Class: Self-Care Difficulty
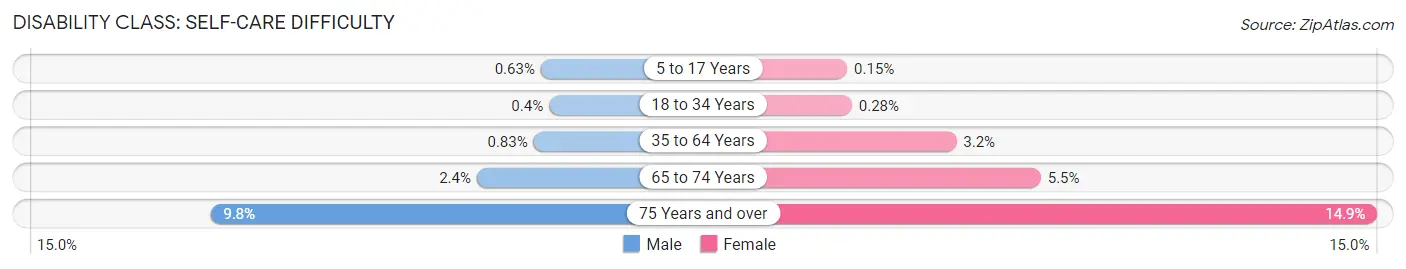
| Age Bracket | Male | Female |
| 5 to 17 Years | 112 (0.6%) | 25 (0.2%) |
| 18 to 34 Years | 91 (0.4%) | 56 (0.3%) |
| 35 to 64 Years | 235 (0.8%) | 828 (3.2%) |
| 65 to 74 Years | 106 (2.4%) | 268 (5.5%) |
| 75 Years and over | 232 (9.8%) | 518 (14.9%) |
Technology Access in Ector County
Computing Device Access in Ector County
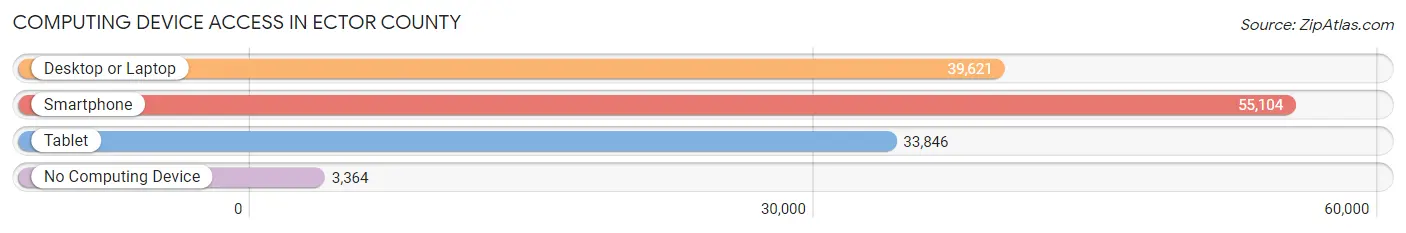
| Device Type | # Households | % Households |
| Desktop or Laptop | 39,621 | 65.3% |
| Smartphone | 55,104 | 90.8% |
| Tablet | 33,846 | 55.8% |
| No Computing Device | 3,364 | 5.5% |
| Total | 60,676 | 100.0% |
Internet Access in Ector County
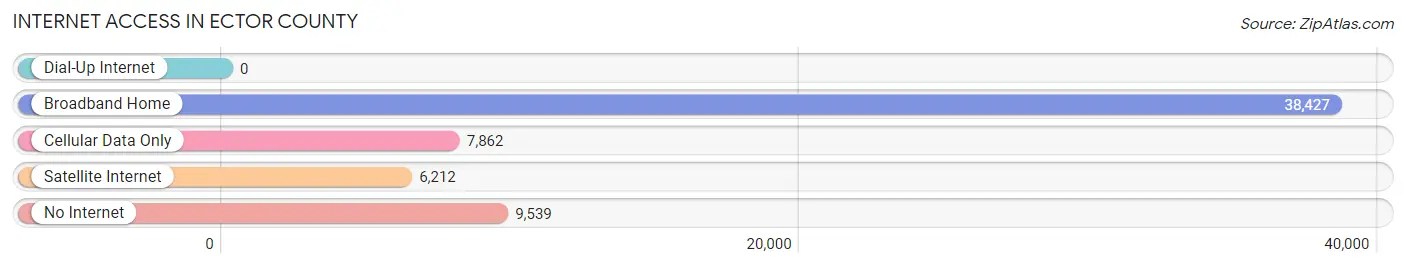
| Internet Type | # Households | % Households |
| Dial-Up Internet | 0 | 0.0% |
| Broadband Home | 38,427 | 63.3% |
| Cellular Data Only | 7,862 | 13.0% |
| Satellite Internet | 6,212 | 10.2% |
| No Internet | 9,539 | 15.7% |
| Total | 60,676 | 100.0% |
Ector County Summary
Ector County is located in the western part of the state of Texas, in the Permian Basin region. It is bordered by Midland County to the north, Andrews County to the east, Ward County to the south, and Winkler County to the west. The county seat is Odessa, which is also the largest city in the county.
Geography
Ector County covers an area of 902 square miles, making it the 33rd largest county in Texas. The terrain is mostly flat, with some rolling hills in the northern part of the county. The county is drained by the Pecos River, which flows through the northern part of the county. The county is also home to several small lakes, including Lake Ector, Lake JB Thomas, and Lake Odessa.
The climate of Ector County is semi-arid, with hot summers and mild winters. The average annual temperature is around 65°F, and the average annual precipitation is around 17 inches.
Demographics
As of the 2010 census, Ector County had a population of 137,130. The racial makeup of the county was 75.3% White, 5.3% African American, 0.7% Native American, 1.2% Asian, 0.1% Pacific Islander, 15.2% from other races, and 2.2% from two or more races. Hispanic or Latino of any race were 44.2% of the population.
The median household income in Ector County was $45,945, and the median family income was $51,945. The per capita income was $21,945. About 17.2% of the population was below the poverty line.
Economy
Ector County is an important center for oil and gas production. The county is home to several major oil and gas companies, including Chevron, ExxonMobil, and Occidental Petroleum. The county is also home to several major oil and gas service companies, such as Halliburton and Schlumberger.
In addition to oil and gas, Ector County is also home to several other industries, including manufacturing, agriculture, and tourism. The county is home to several major manufacturing companies, such as Dow Chemical and Lockheed Martin. Agriculture is also an important part of the county’s economy, with cotton, sorghum, and hay being the main crops. Tourism is also an important part of the county’s economy, with several attractions, such as the Odessa Meteor Crater, the Odessa Zoo, and the Odessa Arts District.
History
Ector County was established in 1887, and was named after Mathew Ector, a Confederate general from Texas. The county was originally part of Tom Green County, but was split off in 1887. The county seat was originally located in the town of Ector, but was moved to Odessa in 1891.
Oil was discovered in the county in 1926, and the county quickly became an important center for oil and gas production. The county’s population grew rapidly during this time, and by the 1950s, the county was one of the most populous counties in the state.
In the 1960s, the county was the site of several major civil rights protests, as African Americans in the county sought to gain equal rights. The protests were successful, and the county was eventually integrated.
Today, Ector County is an important center for oil and gas production, and is also home to several other industries. The county is also home to several attractions, such as the Odessa Meteor Crater, the Odessa Zoo, and the Odessa Arts District.
Common Questions
What is Per Capita Income in Ector County?
Per Capita income in Ector County is $34,267.
What is the Median Family Income in Ector County?
Median Family Income in Ector County is $81,404.
What is the Median Household income in Ector County?
Median Household Income in Ector County is $70,566.
What is Income or Wage Gap in Ector County?
Income or Wage Gap in Ector County is 40.1%.
Women in Ector County earn 59.9 cents for every dollar earned by a man.
What is Family Income Deficit in Ector County?
Family Income Deficit in Ector County is $13,800.
Families that are below poverty line in Ector County earn $13,800 less on average than the poverty threshold level.
What is Inequality or Gini Index in Ector County?
Inequality or Gini Index in Ector County is 0.46.
What is the Total Population of Ector County?
Total Population of Ector County is 162,300.
What is the Total Male Population of Ector County?
Total Male Population of Ector County is 83,509.
What is the Total Female Population of Ector County?
Total Female Population of Ector County is 78,791.
What is the Ratio of Males per 100 Females in Ector County?
There are 105.99 Males per 100 Females in Ector County.
What is the Ratio of Females per 100 Males in Ector County?
There are 94.35 Females per 100 Males in Ector County.
What is the Median Population Age in Ector County?
Median Population Age in Ector County is 31.0 Years.
What is the Average Family Size in Ector County
Average Family Size in Ector County is 3.2 People.
What is the Average Household Size in Ector County
Average Household Size in Ector County is 2.6 People.
How Large is the Labor Force in Ector County?
There are 79,493 People in the Labor Forcein in Ector County.
What is the Percentage of People in the Labor Force in Ector County?
67.3% of People are in the Labor Force in Ector County.
What is the Unemployment Rate in Ector County?
Unemployment Rate in Ector County is 5.8%.