Denton, TX Map & Demographics
Denton Map
Denton Overview
$35,628
PER CAPITA INCOME
$95,687
AVG FAMILY INCOME
$71,921
AVG HOUSEHOLD INCOME
27.1%
WAGE / INCOME GAP [ % ]
72.9¢/ $1
WAGE / INCOME GAP [ $ ]
$11,056
FAMILY INCOME DEFICIT
0.45
INEQUALITY / GINI INDEX
142,262
TOTAL POPULATION
70,206
MALE POPULATION
72,056
FEMALE POPULATION
97.43
MALES / 100 FEMALES
102.64
FEMALES / 100 MALES
30.4
MEDIAN AGE
3.1
AVG FAMILY SIZE
2.5
AVG HOUSEHOLD SIZE
81,241
LABOR FORCE [ PEOPLE ]
67.8%
PERCENT IN LABOR FORCE
4.8%
UNEMPLOYMENT RATE
Income in Denton
Income Overview in Denton
Per Capita Income in Denton is $35,628, while median incomes of families and households are $95,687 and $71,921 respectively.
| Characteristic | Number | Measure |
| Per Capita Income | 142,262 | $35,628 |
| Median Family Income | 30,903 | $95,687 |
| Mean Family Income | 30,903 | $116,532 |
| Median Household Income | 52,243 | $71,921 |
| Mean Household Income | 52,243 | $92,581 |
| Income Deficit | 30,903 | $11,056 |
| Wage / Income Gap (%) | 142,262 | 27.13% |
| Wage / Income Gap ($) | 142,262 | 72.87¢ per $1 |
| Gini / Inequality Index | 142,262 | 0.45 |
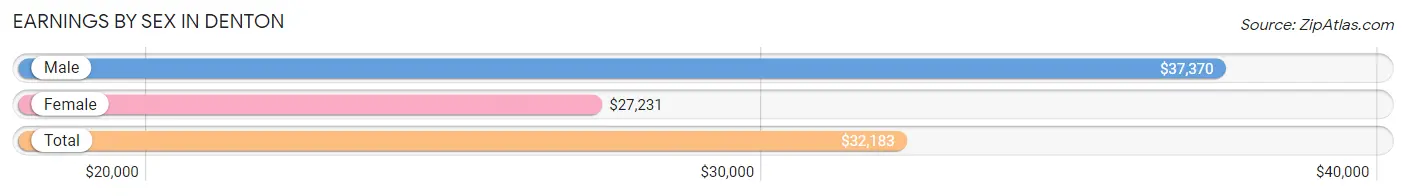
Earnings by Sex in Denton
Average Earnings in Denton are $32,183, $37,370 for men and $27,231 for women, a difference of 27.1%.
| Sex | Number | Average Earnings |
| Male | 44,246 (51.3%) | $37,370 |
| Female | 42,065 (48.7%) | $27,231 |
| Total | 86,311 (100.0%) | $32,183 |
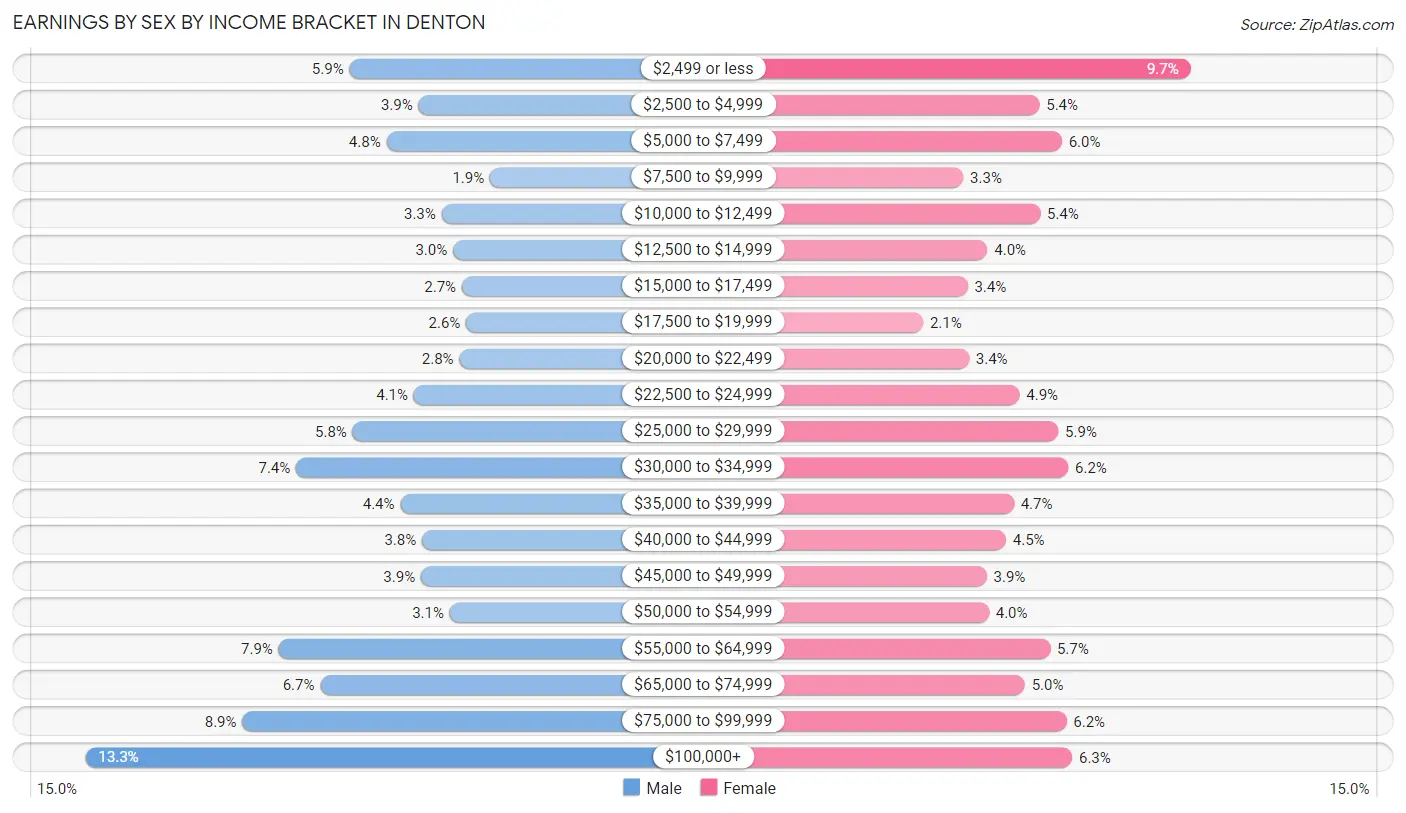
Earnings by Sex by Income Bracket in Denton
The most common earnings brackets in Denton are $100,000+ for men (5,882 | 13.3%) and $2,499 or less for women (4,063 | 9.7%).
| Income | Male | Female |
| $2,499 or less | 2,599 (5.9%) | 4,063 (9.7%) |
| $2,500 to $4,999 | 1,741 (3.9%) | 2,276 (5.4%) |
| $5,000 to $7,499 | 2,137 (4.8%) | 2,539 (6.0%) |
| $7,500 to $9,999 | 851 (1.9%) | 1,374 (3.3%) |
| $10,000 to $12,499 | 1,450 (3.3%) | 2,285 (5.4%) |
| $12,500 to $14,999 | 1,311 (3.0%) | 1,662 (4.0%) |
| $15,000 to $17,499 | 1,198 (2.7%) | 1,427 (3.4%) |
| $17,500 to $19,999 | 1,147 (2.6%) | 901 (2.1%) |
| $20,000 to $22,499 | 1,231 (2.8%) | 1,441 (3.4%) |
| $22,500 to $24,999 | 1,796 (4.1%) | 2,039 (4.9%) |
| $25,000 to $29,999 | 2,558 (5.8%) | 2,498 (5.9%) |
| $30,000 to $34,999 | 3,262 (7.4%) | 2,615 (6.2%) |
| $35,000 to $39,999 | 1,966 (4.4%) | 1,971 (4.7%) |
| $40,000 to $44,999 | 1,693 (3.8%) | 1,880 (4.5%) |
| $45,000 to $49,999 | 1,706 (3.9%) | 1,652 (3.9%) |
| $50,000 to $54,999 | 1,351 (3.0%) | 1,679 (4.0%) |
| $55,000 to $64,999 | 3,478 (7.9%) | 2,401 (5.7%) |
| $65,000 to $74,999 | 2,959 (6.7%) | 2,102 (5.0%) |
| $75,000 to $99,999 | 3,930 (8.9%) | 2,596 (6.2%) |
| $100,000+ | 5,882 (13.3%) | 2,664 (6.3%) |
| Total | 44,246 (100.0%) | 42,065 (100.0%) |
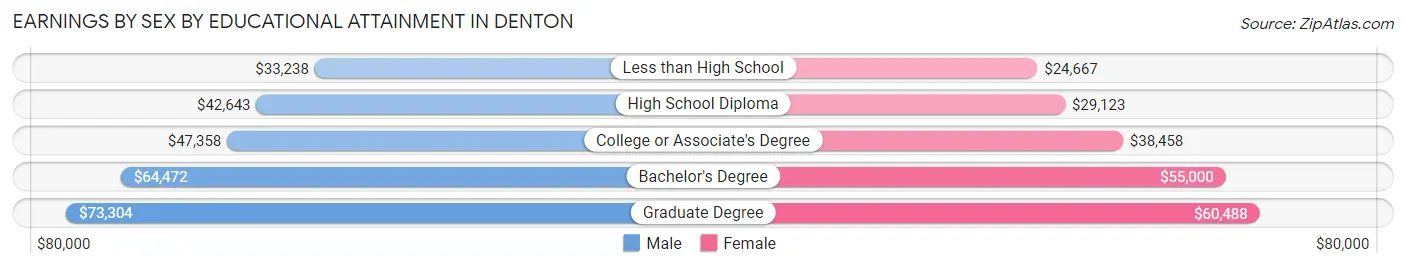
Earnings by Sex by Educational Attainment in Denton
Average earnings in Denton are $51,369 for men and $40,572 for women, a difference of 21.0%. Men with an educational attainment of graduate degree enjoy the highest average annual earnings of $73,304, while those with less than high school education earn the least with $33,238. Women with an educational attainment of graduate degree earn the most with the average annual earnings of $60,488, while those with less than high school education have the smallest earnings of $24,667.
| Educational Attainment | Male Income | Female Income |
| Less than High School | $33,238 | $24,667 |
| High School Diploma | $42,643 | $29,123 |
| College or Associate's Degree | $47,358 | $38,458 |
| Bachelor's Degree | $64,472 | $55,000 |
| Graduate Degree | $73,304 | $60,488 |
| Total | $51,369 | $40,572 |
Family Income in Denton
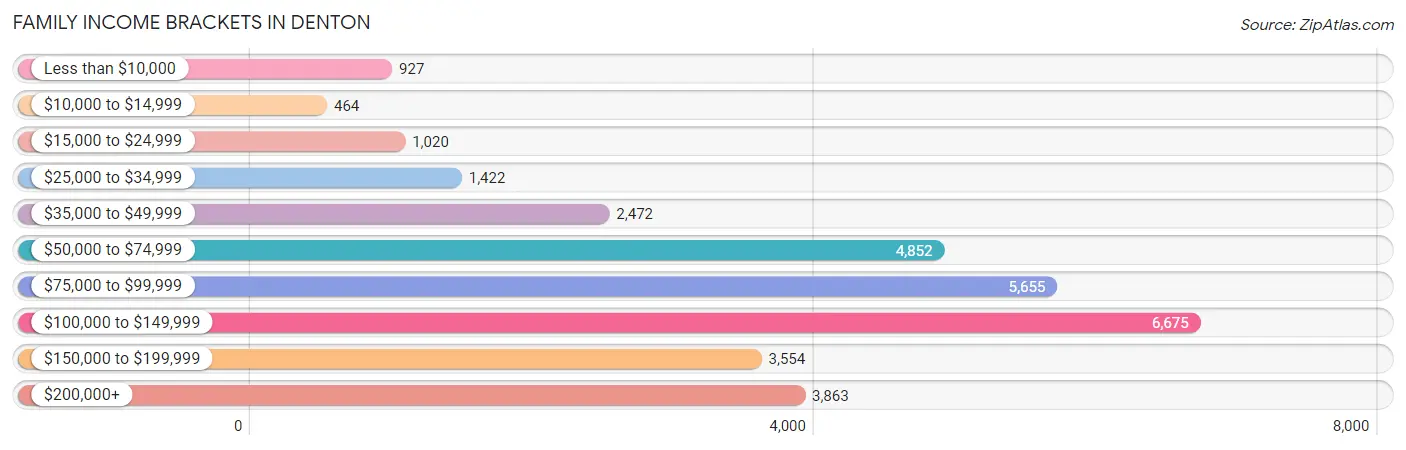
Family Income Brackets in Denton
According to the Denton family income data, there are 6,675 families falling into the $100,000 to $149,999 income range, which is the most common income bracket and makes up 21.6% of all families. Conversely, the $10,000 to $14,999 income bracket is the least frequent group with only 464 families (1.5%) belonging to this category.
| Income Bracket | # Families | % Families |
| Less than $10,000 | 927 | 3.0% |
| $10,000 to $14,999 | 464 | 1.5% |
| $15,000 to $24,999 | 1,020 | 3.3% |
| $25,000 to $34,999 | 1,422 | 4.6% |
| $35,000 to $49,999 | 2,472 | 8.0% |
| $50,000 to $74,999 | 4,852 | 15.7% |
| $75,000 to $99,999 | 5,655 | 18.3% |
| $100,000 to $149,999 | 6,675 | 21.6% |
| $150,000 to $199,999 | 3,554 | 11.5% |
| $200,000+ | 3,863 | 12.5% |
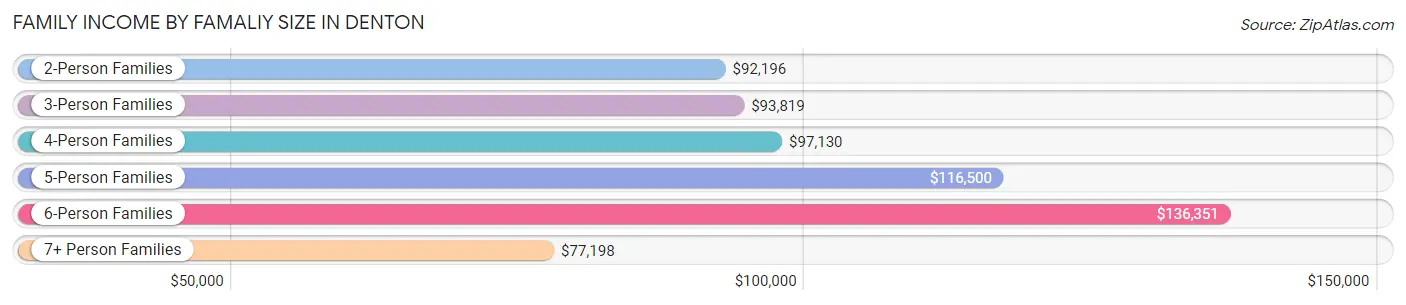
Family Income by Famaliy Size in Denton
6-person families (815 | 2.6%) account for the highest median family income in Denton with $136,351 per family, while 2-person families (15,247 | 49.3%) have the highest median income of $46,098 per family member.
| Income Bracket | # Families | Median Income |
| 2-Person Families | 15,247 (49.3%) | $92,196 |
| 3-Person Families | 6,622 (21.4%) | $93,819 |
| 4-Person Families | 5,162 (16.7%) | $97,130 |
| 5-Person Families | 2,602 (8.4%) | $116,500 |
| 6-Person Families | 815 (2.6%) | $136,351 |
| 7+ Person Families | 455 (1.5%) | $77,198 |
| Total | 30,903 (100.0%) | $95,687 |
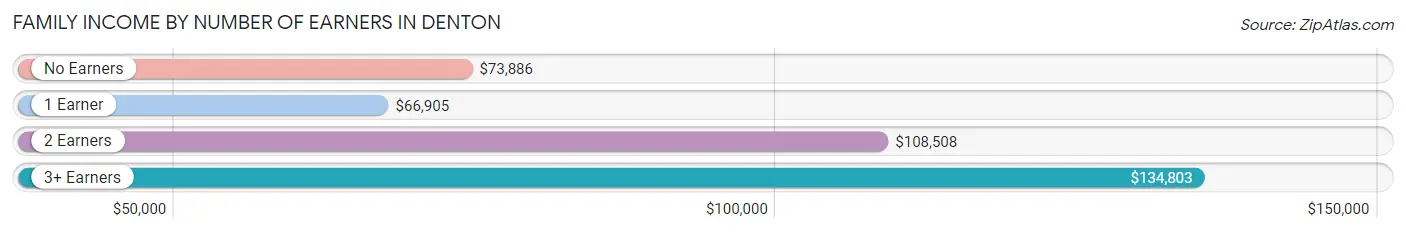
Family Income by Number of Earners in Denton
The median family income in Denton is $95,687, with families comprising 3+ earners (3,542) having the highest median family income of $134,803, while families with 1 earner (9,475) have the lowest median family income of $66,905, accounting for 11.5% and 30.7% of families, respectively.
| Number of Earners | # Families | Median Income |
| No Earners | 4,136 (13.4%) | $73,886 |
| 1 Earner | 9,475 (30.7%) | $66,905 |
| 2 Earners | 13,750 (44.5%) | $108,508 |
| 3+ Earners | 3,542 (11.5%) | $134,803 |
| Total | 30,903 (100.0%) | $95,687 |
Household Income in Denton
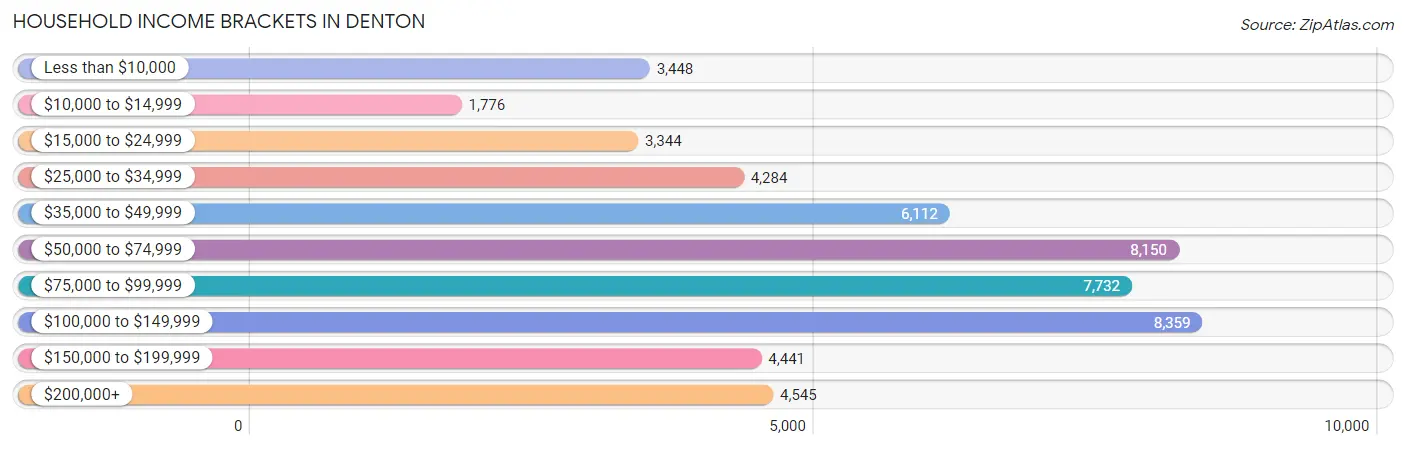
Household Income Brackets in Denton
With 8,359 households falling in the category, the $100,000 to $149,999 income range is the most frequent in Denton, accounting for 16.0% of all households. In contrast, only 1,776 households (3.4%) fall into the $10,000 to $14,999 income bracket, making it the least populous group.
| Income Bracket | # Households | % Households |
| Less than $10,000 | 3,448 | 6.6% |
| $10,000 to $14,999 | 1,776 | 3.4% |
| $15,000 to $24,999 | 3,344 | 6.4% |
| $25,000 to $34,999 | 4,284 | 8.2% |
| $35,000 to $49,999 | 6,112 | 11.7% |
| $50,000 to $74,999 | 8,150 | 15.6% |
| $75,000 to $99,999 | 7,732 | 14.8% |
| $100,000 to $149,999 | 8,359 | 16.0% |
| $150,000 to $199,999 | 4,441 | 8.5% |
| $200,000+ | 4,545 | 8.7% |
Household Income by Householder Age in Denton
The median household income in Denton is $71,921, with the highest median household income of $91,208 found in the 45 to 64 years age bracket for the primary householder. A total of 15,759 households (30.2%) fall into this category. Meanwhile, the 15 to 24 years age bracket for the primary householder has the lowest median household income of $24,352, with 7,139 households (13.7%) in this group.
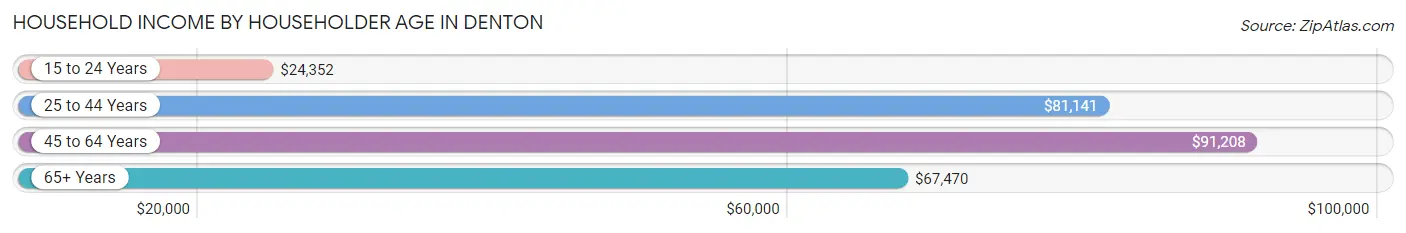
| Income Bracket | # Households | Median Income |
| 15 to 24 Years | 7,139 (13.7%) | $24,352 |
| 25 to 44 Years | 19,260 (36.9%) | $81,141 |
| 45 to 64 Years | 15,759 (30.2%) | $91,208 |
| 65+ Years | 10,085 (19.3%) | $67,470 |
| Total | 52,243 (100.0%) | $71,921 |
Poverty in Denton
Income Below Poverty by Sex and Age in Denton
With 15.2% poverty level for males and 16.2% for females among the residents of Denton, 18 to 24 year old males and 18 to 24 year old females are the most vulnerable to poverty, with 5,187 males (44.7%) and 5,162 females (46.8%) in their respective age groups living below the poverty level.
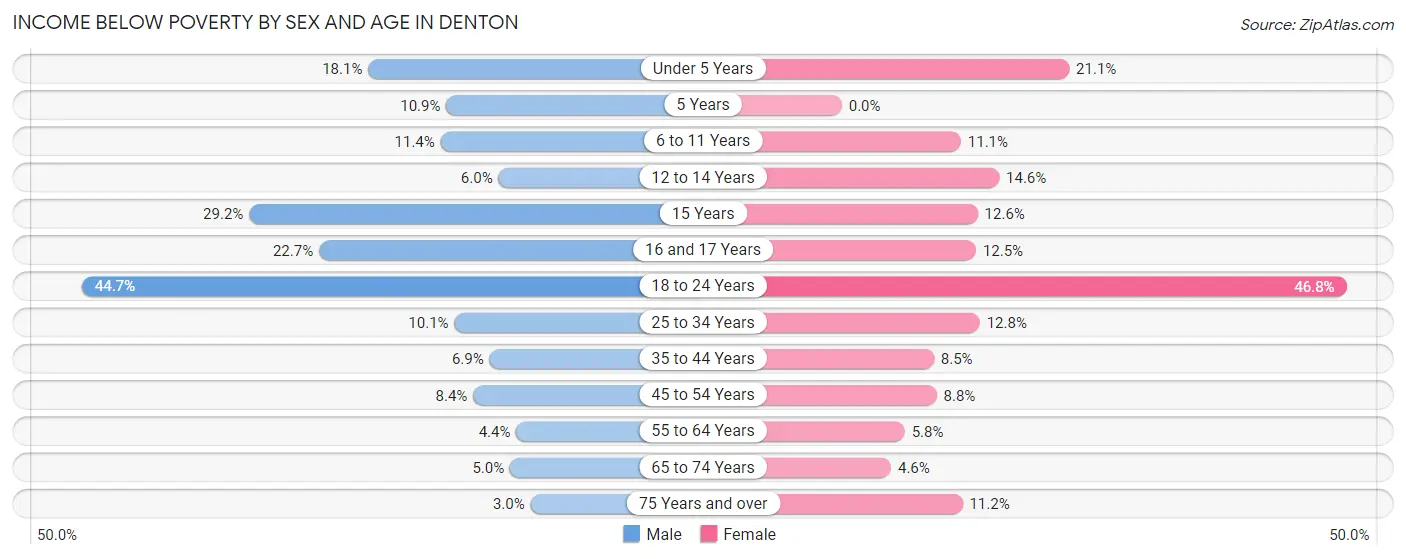
| Age Bracket | Male | Female |
| Under 5 Years | 674 (18.1%) | 624 (21.1%) |
| 5 Years | 73 (10.9%) | 0 (0.0%) |
| 6 to 11 Years | 464 (11.4%) | 475 (11.1%) |
| 12 to 14 Years | 135 (6.0%) | 328 (14.6%) |
| 15 Years | 177 (29.2%) | 88 (12.6%) |
| 16 and 17 Years | 384 (22.7%) | 190 (12.4%) |
| 18 to 24 Years | 5,187 (44.7%) | 5,162 (46.8%) |
| 25 to 34 Years | 1,361 (10.1%) | 1,483 (12.8%) |
| 35 to 44 Years | 543 (6.9%) | 651 (8.5%) |
| 45 to 54 Years | 596 (8.4%) | 628 (8.8%) |
| 55 to 64 Years | 258 (4.4%) | 427 (5.8%) |
| 65 to 74 Years | 224 (5.0%) | 241 (4.6%) |
| 75 Years and over | 96 (3.0%) | 442 (11.2%) |
| Total | 10,172 (15.2%) | 10,739 (16.2%) |
Income Above Poverty by Sex and Age in Denton
According to the poverty statistics in Denton, males aged 75 years and over and females aged 5 years are the age groups that are most secure financially, with 97.0% of males and 100.0% of females in these age groups living above the poverty line.
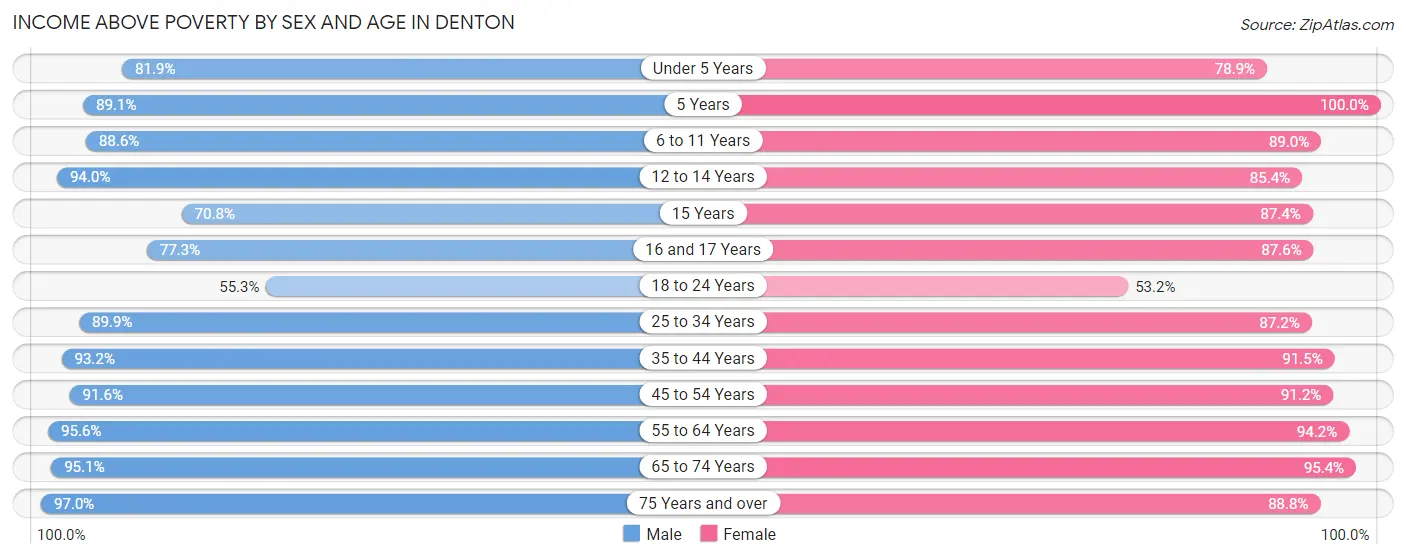
| Age Bracket | Male | Female |
| Under 5 Years | 3,048 (81.9%) | 2,334 (78.9%) |
| 5 Years | 599 (89.1%) | 587 (100.0%) |
| 6 to 11 Years | 3,610 (88.6%) | 3,822 (88.9%) |
| 12 to 14 Years | 2,109 (94.0%) | 1,919 (85.4%) |
| 15 Years | 430 (70.8%) | 610 (87.4%) |
| 16 and 17 Years | 1,309 (77.3%) | 1,336 (87.5%) |
| 18 to 24 Years | 6,422 (55.3%) | 5,862 (53.2%) |
| 25 to 34 Years | 12,095 (89.9%) | 10,104 (87.2%) |
| 35 to 44 Years | 7,387 (93.1%) | 6,976 (91.5%) |
| 45 to 54 Years | 6,527 (91.6%) | 6,505 (91.2%) |
| 55 to 64 Years | 5,650 (95.6%) | 6,887 (94.2%) |
| 65 to 74 Years | 4,299 (95.1%) | 5,034 (95.4%) |
| 75 Years and over | 3,064 (97.0%) | 3,503 (88.8%) |
| Total | 56,549 (84.8%) | 55,479 (83.8%) |
Income Below Poverty Among Married-Couple Families in Denton
The poverty statistics for married-couple families in Denton show that 3.9% or 887 of the total 22,995 families live below the poverty line. Families with 5 or more children have the highest poverty rate of 77.4%, comprising of 147 families. On the other hand, families with no children have the lowest poverty rate of 2.7%, which includes 359 families.
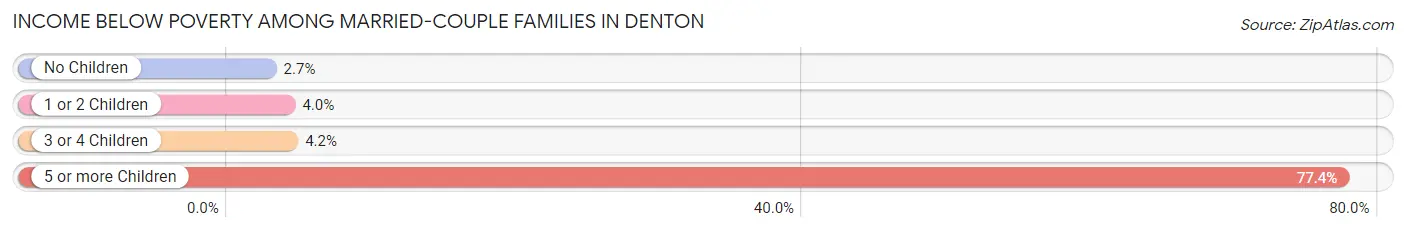
| Children | Above Poverty | Below Poverty |
| No Children | 13,009 (97.3%) | 359 (2.7%) |
| 1 or 2 Children | 7,088 (96.0%) | 295 (4.0%) |
| 3 or 4 Children | 1,968 (95.8%) | 86 (4.2%) |
| 5 or more Children | 43 (22.6%) | 147 (77.4%) |
| Total | 22,108 (96.1%) | 887 (3.9%) |
Income Below Poverty Among Single-Parent Households in Denton
According to the poverty data in Denton, 17.1% or 432 single-father households and 18.7% or 1,007 single-mother households are living below the poverty line. Among single-father households, those with 3 or 4 children have the highest poverty rate, with 71 households (42.8%) experiencing poverty. Likewise, among single-mother households, those with 5 or more children have the highest poverty rate, with 21 households (100.0%) falling below the poverty line.
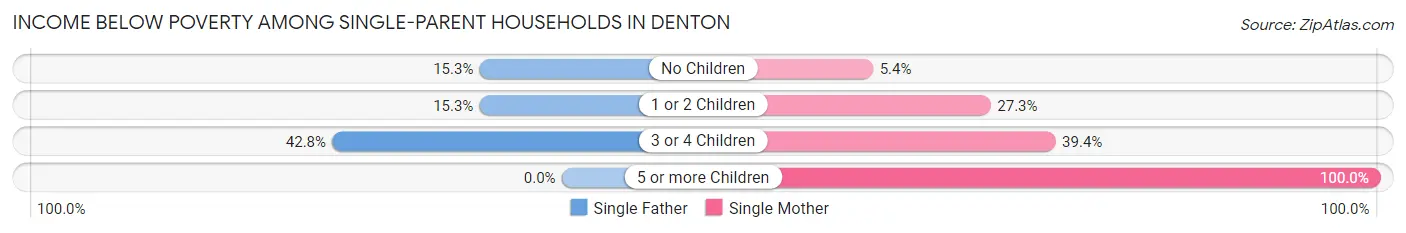
| Children | Single Father | Single Mother |
| No Children | 152 (15.3%) | 133 (5.4%) |
| 1 or 2 Children | 209 (15.3%) | 660 (27.3%) |
| 3 or 4 Children | 71 (42.8%) | 193 (39.4%) |
| 5 or more Children | 0 (0.0%) | 21 (100.0%) |
| Total | 432 (17.1%) | 1,007 (18.7%) |
Income Below Poverty Among Married-Couple vs Single-Parent Households in Denton
The poverty data for Denton shows that 887 of the married-couple family households (3.9%) and 1,439 of the single-parent households (18.2%) are living below the poverty level. Within the married-couple family households, those with 5 or more children have the highest poverty rate, with 147 households (77.4%) falling below the poverty line. Among the single-parent households, those with 5 or more children have the highest poverty rate, with 21 household (100.0%) living below poverty.
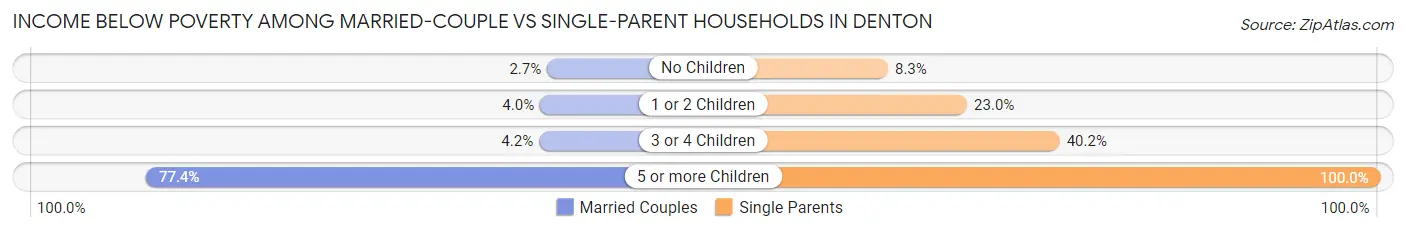
| Children | Married-Couple Families | Single-Parent Households |
| No Children | 359 (2.7%) | 285 (8.3%) |
| 1 or 2 Children | 295 (4.0%) | 869 (23.0%) |
| 3 or 4 Children | 86 (4.2%) | 264 (40.2%) |
| 5 or more Children | 147 (77.4%) | 21 (100.0%) |
| Total | 887 (3.9%) | 1,439 (18.2%) |
Race in Denton
The most populous races in Denton are White / Caucasian (96,497 | 67.8%), Hispanic or Latino (34,337 | 24.1%), and Black / African American (16,335 | 11.5%).
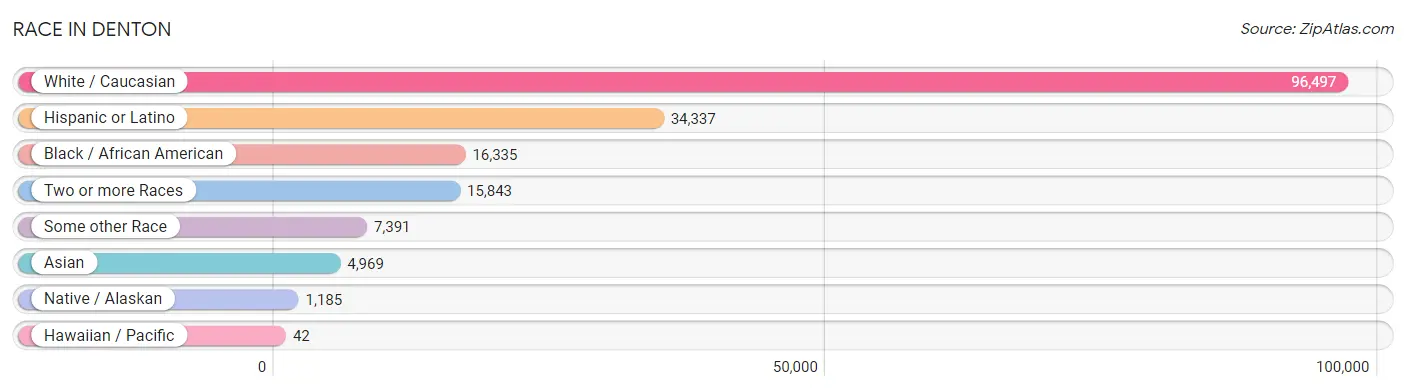
| Race | # Population | % Population |
| Asian | 4,969 | 3.5% |
| Black / African American | 16,335 | 11.5% |
| Hawaiian / Pacific | 42 | 0.0% |
| Hispanic or Latino | 34,337 | 24.1% |
| Native / Alaskan | 1,185 | 0.8% |
| White / Caucasian | 96,497 | 67.8% |
| Two or more Races | 15,843 | 11.1% |
| Some other Race | 7,391 | 5.2% |
| Total | 142,262 | 100.0% |
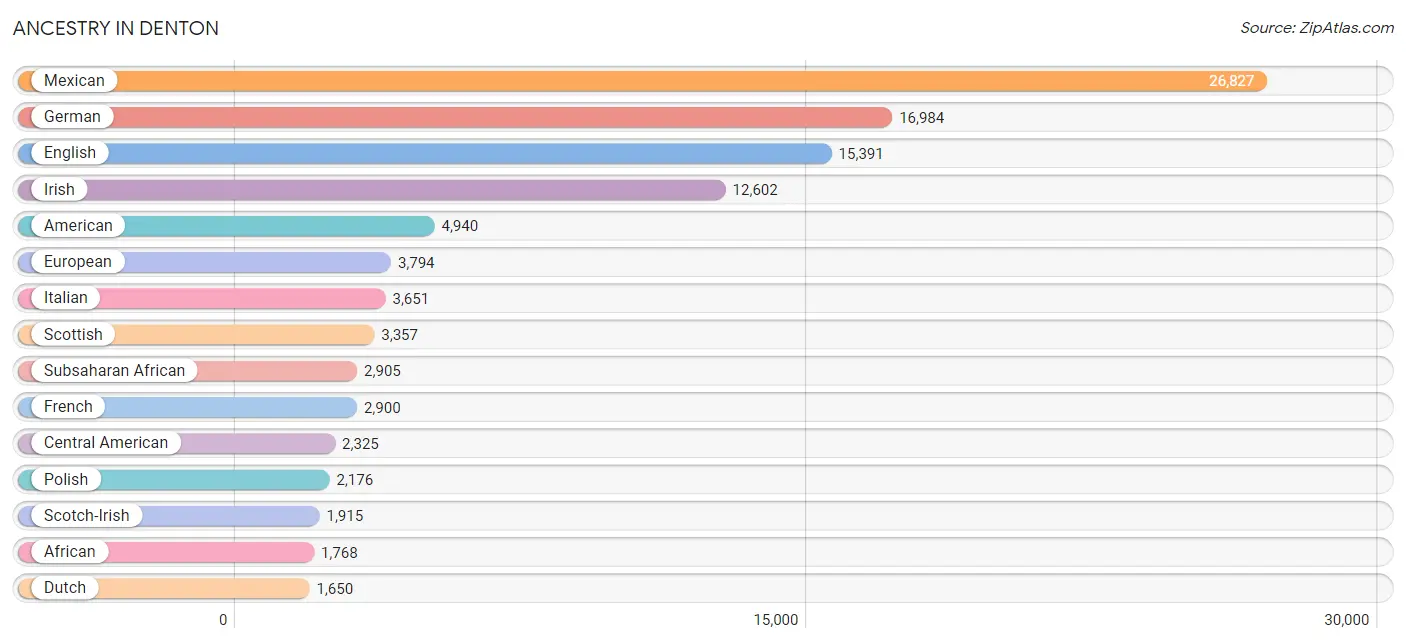
Ancestry in Denton
The most populous ancestries reported in Denton are Mexican (26,827 | 18.9%), German (16,984 | 11.9%), English (15,391 | 10.8%), Irish (12,602 | 8.9%), and American (4,940 | 3.5%), together accounting for 53.9% of all Denton residents.
| Ancestry | # Population | % Population |
| African | 1,768 | 1.2% |
| Alaska Native | 7 | 0.0% |
| Albanian | 170 | 0.1% |
| Alsatian | 11 | 0.0% |
| American | 4,940 | 3.5% |
| Apache | 209 | 0.2% |
| Arab | 1,403 | 1.0% |
| Argentinean | 60 | 0.0% |
| Armenian | 15 | 0.0% |
| Australian | 71 | 0.1% |
| Austrian | 121 | 0.1% |
| Bahamian | 164 | 0.1% |
| Belgian | 89 | 0.1% |
| Belizean | 141 | 0.1% |
| Bermudan | 32 | 0.0% |
| Bhutanese | 152 | 0.1% |
| Blackfeet | 69 | 0.1% |
| Bolivian | 183 | 0.1% |
| Brazilian | 13 | 0.0% |
| British | 1,042 | 0.7% |
| Bulgarian | 10 | 0.0% |
| Burmese | 1,015 | 0.7% |
| Cajun | 59 | 0.0% |
| Canadian | 374 | 0.3% |
| Central American | 2,325 | 1.6% |
| Central American Indian | 184 | 0.1% |
| Cherokee | 570 | 0.4% |
| Chickasaw | 140 | 0.1% |
| Chilean | 173 | 0.1% |
| Chippewa | 10 | 0.0% |
| Choctaw | 255 | 0.2% |
| Colombian | 353 | 0.3% |
| Colville | 14 | 0.0% |
| Comanche | 60 | 0.0% |
| Costa Rican | 25 | 0.0% |
| Creek | 22 | 0.0% |
| Croatian | 124 | 0.1% |
| Cuban | 240 | 0.2% |
| Cypriot | 106 | 0.1% |
| Czech | 786 | 0.5% |
| Czechoslovakian | 159 | 0.1% |
| Danish | 393 | 0.3% |
| Delaware | 118 | 0.1% |
| Dominican | 107 | 0.1% |
| Dutch | 1,650 | 1.2% |
| Eastern European | 224 | 0.2% |
| English | 15,391 | 10.8% |
| Ethiopian | 75 | 0.1% |
| European | 3,794 | 2.7% |
| Fijian | 16 | 0.0% |
| Filipino | 82 | 0.1% |
| Finnish | 349 | 0.3% |
| French | 2,900 | 2.0% |
| French Canadian | 385 | 0.3% |
| German | 16,984 | 11.9% |
| Ghanaian | 132 | 0.1% |
| Greek | 279 | 0.2% |
| Guamanian / Chamorro | 23 | 0.0% |
| Guatemalan | 807 | 0.6% |
| Haitian | 56 | 0.0% |
| Hmong | 33 | 0.0% |
| Honduran | 440 | 0.3% |
| Hungarian | 435 | 0.3% |
| Icelander | 24 | 0.0% |
| Indian (Asian) | 1,443 | 1.0% |
| Indonesian | 42 | 0.0% |
| Inupiat | 24 | 0.0% |
| Iranian | 138 | 0.1% |
| Iraqi | 28 | 0.0% |
| Irish | 12,602 | 8.9% |
| Iroquois | 54 | 0.0% |
| Italian | 3,651 | 2.6% |
| Jamaican | 93 | 0.1% |
| Jordanian | 73 | 0.1% |
| Kenyan | 74 | 0.1% |
| Korean | 1,038 | 0.7% |
| Laotian | 68 | 0.1% |
| Latvian | 62 | 0.0% |
| Lebanese | 252 | 0.2% |
| Liberian | 30 | 0.0% |
| Lithuanian | 65 | 0.1% |
| Macedonian | 12 | 0.0% |
| Malaysian | 9 | 0.0% |
| Mexican | 26,827 | 18.9% |
| Mexican American Indian | 276 | 0.2% |
| Mongolian | 17 | 0.0% |
| Moroccan | 23 | 0.0% |
| Native Hawaiian | 60 | 0.0% |
| Navajo | 69 | 0.1% |
| Nicaraguan | 14 | 0.0% |
| Nigerian | 688 | 0.5% |
| Northern European | 145 | 0.1% |
| Norwegian | 1,253 | 0.9% |
| Osage | 27 | 0.0% |
| Pakistani | 181 | 0.1% |
| Palestinian | 252 | 0.2% |
| Panamanian | 10 | 0.0% |
| Peruvian | 37 | 0.0% |
| Polish | 2,176 | 1.5% |
| Portuguese | 439 | 0.3% |
| Pueblo | 45 | 0.0% |
| Puerto Rican | 1,542 | 1.1% |
| Romanian | 177 | 0.1% |
| Russian | 392 | 0.3% |
| Salvadoran | 1,029 | 0.7% |
| Scandinavian | 520 | 0.4% |
| Scotch-Irish | 1,915 | 1.3% |
| Scottish | 3,357 | 2.4% |
| Seminole | 27 | 0.0% |
| Serbian | 18 | 0.0% |
| Slovak | 449 | 0.3% |
| Slovene | 13 | 0.0% |
| Somali | 52 | 0.0% |
| South African | 12 | 0.0% |
| South American | 1,300 | 0.9% |
| South American Indian | 15 | 0.0% |
| Spaniard | 255 | 0.2% |
| Spanish | 376 | 0.3% |
| Sri Lankan | 714 | 0.5% |
| Subsaharan African | 2,905 | 2.0% |
| Sudanese | 10 | 0.0% |
| Swedish | 726 | 0.5% |
| Swiss | 337 | 0.2% |
| Thai | 1,142 | 0.8% |
| Trinidadian and Tobagonian | 54 | 0.0% |
| Turkish | 119 | 0.1% |
| Ukrainian | 88 | 0.1% |
| Venezuelan | 466 | 0.3% |
| Vietnamese | 46 | 0.0% |
| Welsh | 911 | 0.6% |
| West Indian | 31 | 0.0% |
| Yugoslavian | 36 | 0.0% |
| Zimbabwean | 11 | 0.0% | View All 133 Rows |
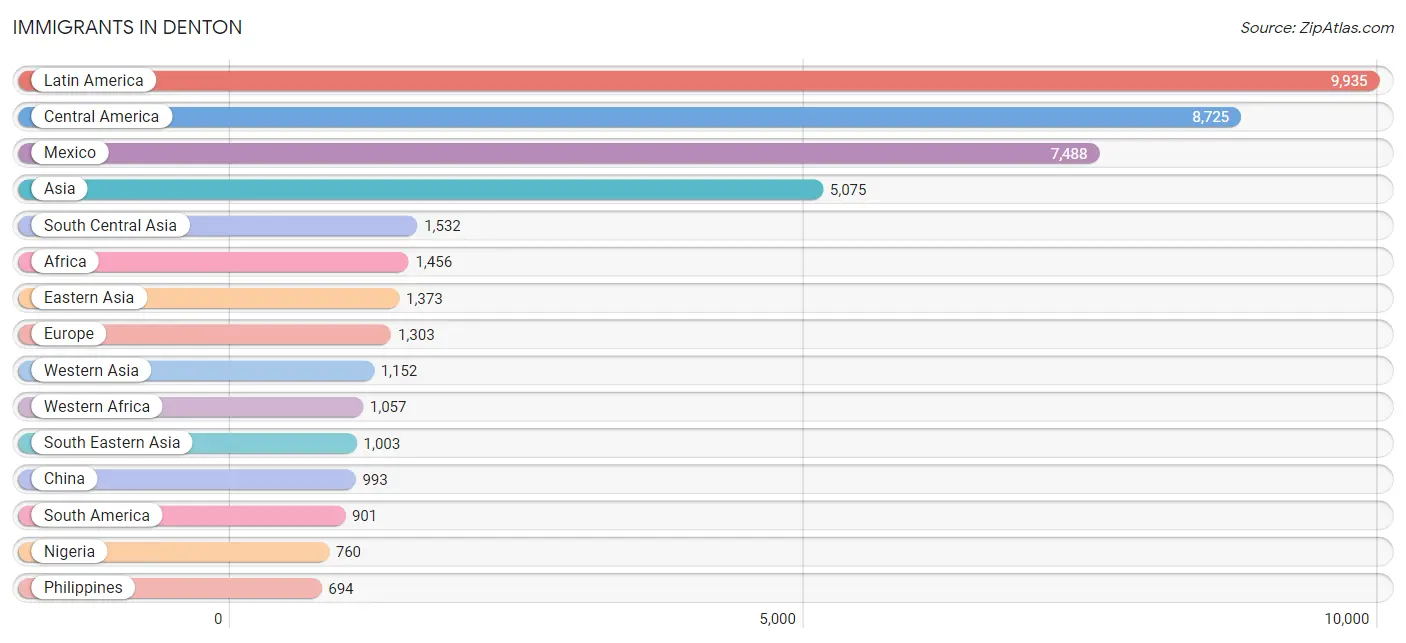
Immigrants in Denton
The most numerous immigrant groups reported in Denton came from Latin America (9,935 | 7.0%), Central America (8,725 | 6.1%), Mexico (7,488 | 5.3%), Asia (5,075 | 3.6%), and South Central Asia (1,532 | 1.1%), together accounting for 23.0% of all Denton residents.
| Immigration Origin | # Population | % Population |
| Africa | 1,456 | 1.0% |
| Asia | 5,075 | 3.6% |
| Australia | 38 | 0.0% |
| Austria | 4 | 0.0% |
| Bahamas | 84 | 0.1% |
| Bangladesh | 376 | 0.3% |
| Belgium | 35 | 0.0% |
| Belize | 43 | 0.0% |
| Bolivia | 196 | 0.1% |
| Bosnia and Herzegovina | 37 | 0.0% |
| Brazil | 136 | 0.1% |
| Bulgaria | 2 | 0.0% |
| Cameroon | 71 | 0.1% |
| Canada | 395 | 0.3% |
| Caribbean | 309 | 0.2% |
| Central America | 8,725 | 6.1% |
| China | 993 | 0.7% |
| Colombia | 211 | 0.2% |
| Cuba | 138 | 0.1% |
| Czechoslovakia | 22 | 0.0% |
| Denmark | 4 | 0.0% |
| Dominican Republic | 3 | 0.0% |
| Eastern Africa | 219 | 0.2% |
| Eastern Asia | 1,373 | 1.0% |
| Eastern Europe | 382 | 0.3% |
| El Salvador | 559 | 0.4% |
| England | 120 | 0.1% |
| Ethiopia | 37 | 0.0% |
| Europe | 1,303 | 0.9% |
| France | 83 | 0.1% |
| Germany | 237 | 0.2% |
| Ghana | 162 | 0.1% |
| Greece | 27 | 0.0% |
| Guatemala | 387 | 0.3% |
| Honduras | 228 | 0.2% |
| Hong Kong | 82 | 0.1% |
| Hungary | 42 | 0.0% |
| India | 579 | 0.4% |
| Indonesia | 10 | 0.0% |
| Iran | 134 | 0.1% |
| Iraq | 255 | 0.2% |
| Ireland | 15 | 0.0% |
| Japan | 16 | 0.0% |
| Jordan | 47 | 0.0% |
| Kazakhstan | 12 | 0.0% |
| Kenya | 91 | 0.1% |
| Korea | 364 | 0.3% |
| Kuwait | 7 | 0.0% |
| Latin America | 9,935 | 7.0% |
| Liberia | 53 | 0.0% |
| Lithuania | 12 | 0.0% |
| Malaysia | 61 | 0.0% |
| Mexico | 7,488 | 5.3% |
| Micronesia | 3 | 0.0% |
| Middle Africa | 71 | 0.1% |
| Nepal | 321 | 0.2% |
| Netherlands | 58 | 0.0% |
| Nicaragua | 20 | 0.0% |
| Nigeria | 760 | 0.5% |
| North Macedonia | 71 | 0.1% |
| Northern Europe | 276 | 0.2% |
| Oceania | 88 | 0.1% |
| Pakistan | 44 | 0.0% |
| Peru | 15 | 0.0% |
| Philippines | 694 | 0.5% |
| Portugal | 67 | 0.1% |
| Russia | 91 | 0.1% |
| Saudi Arabia | 634 | 0.4% |
| Scotland | 106 | 0.1% |
| Serbia | 23 | 0.0% |
| Sierra Leone | 9 | 0.0% |
| South Africa | 109 | 0.1% |
| South America | 901 | 0.6% |
| South Central Asia | 1,532 | 1.1% |
| South Eastern Asia | 1,003 | 0.7% |
| Southern Europe | 143 | 0.1% |
| Spain | 49 | 0.0% |
| Sri Lanka | 66 | 0.1% |
| Taiwan | 187 | 0.1% |
| Thailand | 24 | 0.0% |
| Trinidad and Tobago | 84 | 0.1% |
| Turkey | 99 | 0.1% |
| Uganda | 7 | 0.0% |
| Ukraine | 67 | 0.1% |
| Venezuela | 343 | 0.2% |
| Vietnam | 172 | 0.1% |
| Western Africa | 1,057 | 0.7% |
| Western Asia | 1,152 | 0.8% |
| Western Europe | 417 | 0.3% |
| Zimbabwe | 11 | 0.0% | View All 90 Rows |
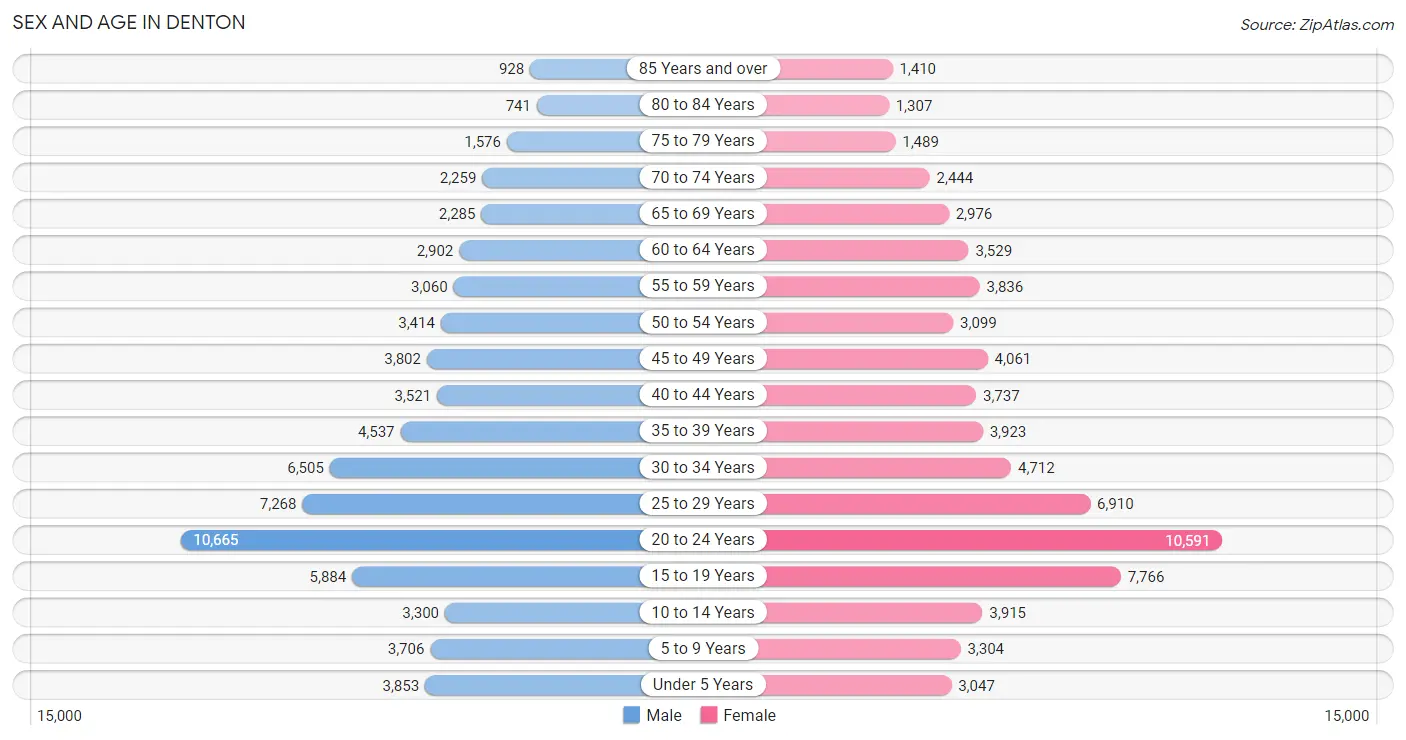
Sex and Age in Denton
Sex and Age in Denton
The most populous age groups in Denton are 20 to 24 Years (10,665 | 15.2%) for men and 20 to 24 Years (10,591 | 14.7%) for women.
| Age Bracket | Male | Female |
| Under 5 Years | 3,853 (5.5%) | 3,047 (4.2%) |
| 5 to 9 Years | 3,706 (5.3%) | 3,304 (4.6%) |
| 10 to 14 Years | 3,300 (4.7%) | 3,915 (5.4%) |
| 15 to 19 Years | 5,884 (8.4%) | 7,766 (10.8%) |
| 20 to 24 Years | 10,665 (15.2%) | 10,591 (14.7%) |
| 25 to 29 Years | 7,268 (10.3%) | 6,910 (9.6%) |
| 30 to 34 Years | 6,505 (9.3%) | 4,712 (6.5%) |
| 35 to 39 Years | 4,537 (6.5%) | 3,923 (5.4%) |
| 40 to 44 Years | 3,521 (5.0%) | 3,737 (5.2%) |
| 45 to 49 Years | 3,802 (5.4%) | 4,061 (5.6%) |
| 50 to 54 Years | 3,414 (4.9%) | 3,099 (4.3%) |
| 55 to 59 Years | 3,060 (4.4%) | 3,836 (5.3%) |
| 60 to 64 Years | 2,902 (4.1%) | 3,529 (4.9%) |
| 65 to 69 Years | 2,285 (3.3%) | 2,976 (4.1%) |
| 70 to 74 Years | 2,259 (3.2%) | 2,444 (3.4%) |
| 75 to 79 Years | 1,576 (2.2%) | 1,489 (2.1%) |
| 80 to 84 Years | 741 (1.1%) | 1,307 (1.8%) |
| 85 Years and over | 928 (1.3%) | 1,410 (2.0%) |
| Total | 70,206 (100.0%) | 72,056 (100.0%) |
Families and Households in Denton
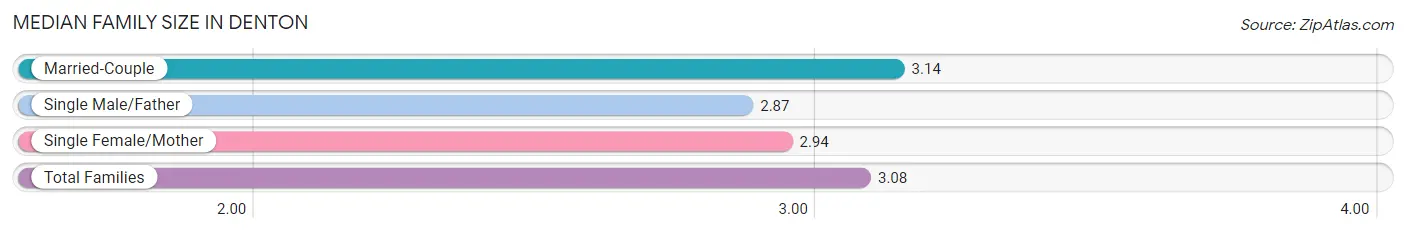
Median Family Size in Denton
The median family size in Denton is 3.08 persons per family, with married-couple families (22,995 | 74.4%) accounting for the largest median family size of 3.14 persons per family. On the other hand, single male/father families (2,521 | 8.2%) represent the smallest median family size with 2.87 persons per family.
| Family Type | # Families | Family Size |
| Married-Couple | 22,995 (74.4%) | 3.14 |
| Single Male/Father | 2,521 (8.2%) | 2.87 |
| Single Female/Mother | 5,387 (17.4%) | 2.94 |
| Total Families | 30,903 (100.0%) | 3.08 |
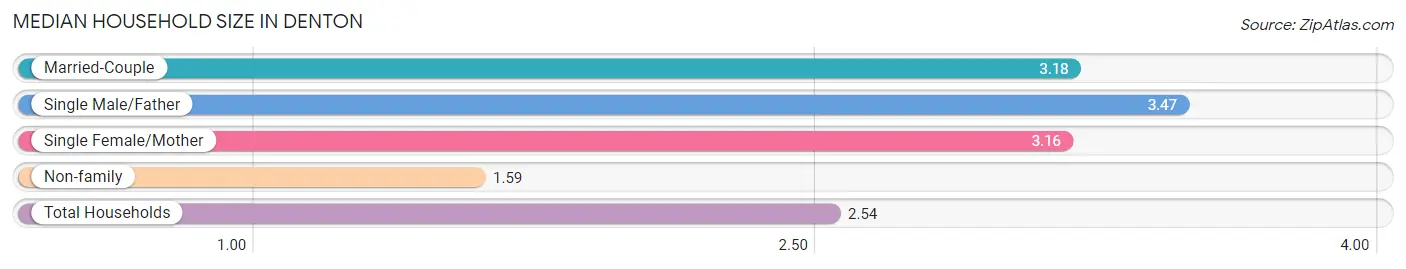
Median Household Size in Denton
The median household size in Denton is 2.54 persons per household, with single male/father households (2,521 | 4.8%) accounting for the largest median household size of 3.47 persons per household. non-family households (21,340 | 40.8%) represent the smallest median household size with 1.59 persons per household.
| Household Type | # Households | Household Size |
| Married-Couple | 22,995 (44.0%) | 3.18 |
| Single Male/Father | 2,521 (4.8%) | 3.47 |
| Single Female/Mother | 5,387 (10.3%) | 3.16 |
| Non-family | 21,340 (40.8%) | 1.59 |
| Total Households | 52,243 (100.0%) | 2.54 |
Household Size by Marriage Status in Denton
Out of a total of 52,243 households in Denton, 30,903 (59.2%) are family households, while 21,340 (40.8%) are nonfamily households. The most numerous type of family households are 2-person households, comprising 14,049, and the most common type of nonfamily households are 1-person households, comprising 14,140.
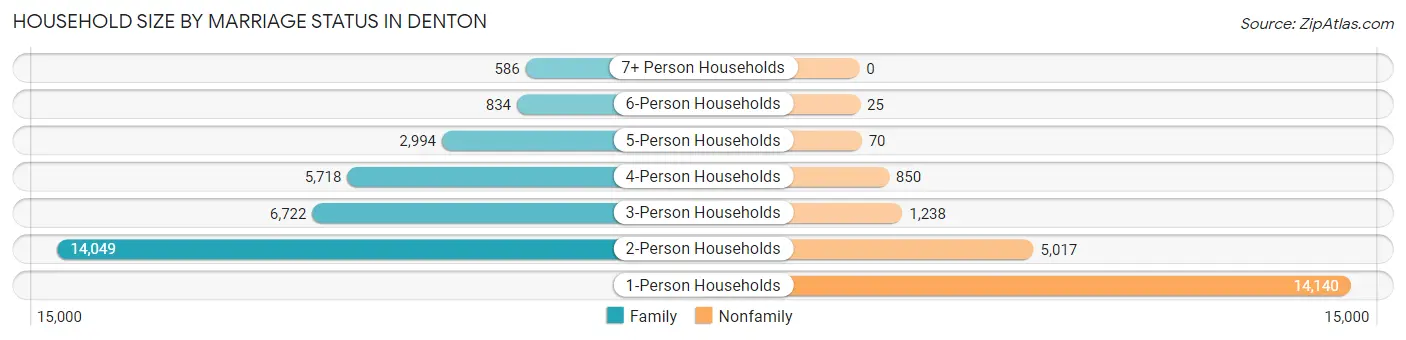
| Household Size | Family Households | Nonfamily Households |
| 1-Person Households | - | 14,140 (27.1%) |
| 2-Person Households | 14,049 (26.9%) | 5,017 (9.6%) |
| 3-Person Households | 6,722 (12.9%) | 1,238 (2.4%) |
| 4-Person Households | 5,718 (11.0%) | 850 (1.6%) |
| 5-Person Households | 2,994 (5.7%) | 70 (0.1%) |
| 6-Person Households | 834 (1.6%) | 25 (0.1%) |
| 7+ Person Households | 586 (1.1%) | 0 (0.0%) |
| Total | 30,903 (59.2%) | 21,340 (40.8%) |
Female Fertility in Denton
Fertility by Age in Denton
Average fertility rate in Denton is 30.0 births per 1,000 women. Women in the age bracket of 20 to 34 years have the highest fertility rate with 40.0 births per 1,000 women. Women in the age bracket of 20 to 34 years acount for 71.2% of all women with births.
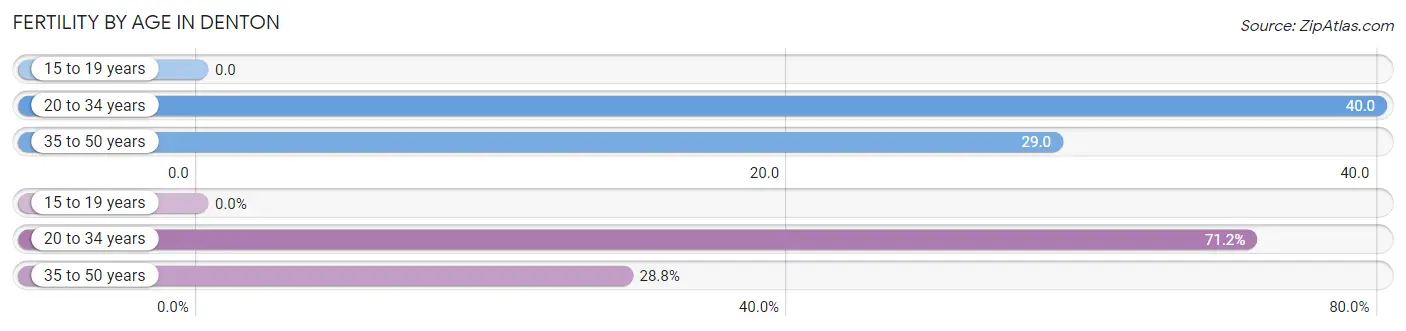
| Age Bracket | Women with Births | Births / 1,000 Women |
| 15 to 19 years | 0 (0.0%) | 0.0 |
| 20 to 34 years | 887 (71.2%) | 40.0 |
| 35 to 50 years | 359 (28.8%) | 29.0 |
| Total | 1,246 (100.0%) | 30.0 |
Fertility by Age by Marriage Status in Denton
87.9% of women with births (1,246) in Denton are married. The highest percentage of unmarried women with births falls into 20 to 34 years age bracket with 13.1% of them unmarried at the time of birth, while the lowest percentage of unmarried women with births belong to 35 to 50 years age bracket with 9.8% of them unmarried.
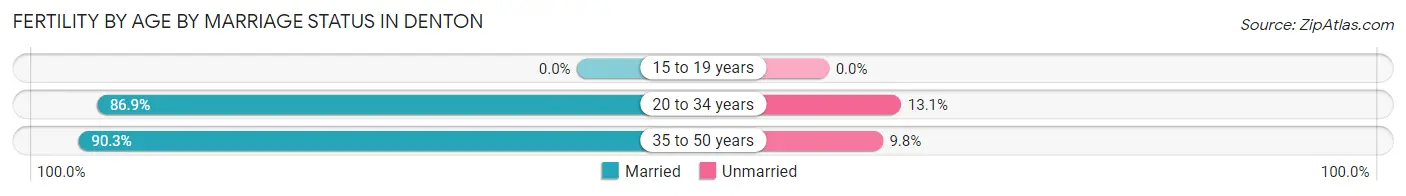
| Age Bracket | Married | Unmarried |
| 15 to 19 years | 0 (0.0%) | 0 (0.0%) |
| 20 to 34 years | 771 (86.9%) | 116 (13.1%) |
| 35 to 50 years | 324 (90.2%) | 35 (9.8%) |
| Total | 1,095 (87.9%) | 151 (12.1%) |
Fertility by Education in Denton
Average fertility rate in Denton is 30.0 births per 1,000 women. Women with the education attainment of graduate degree have the highest fertility rate of 61.0 births per 1,000 women, while women with the education attainment of less than high school have the lowest fertility at 1.0 births per 1,000 women. Women with the education attainment of bachelor's degree represent 37.3% of all women with births.
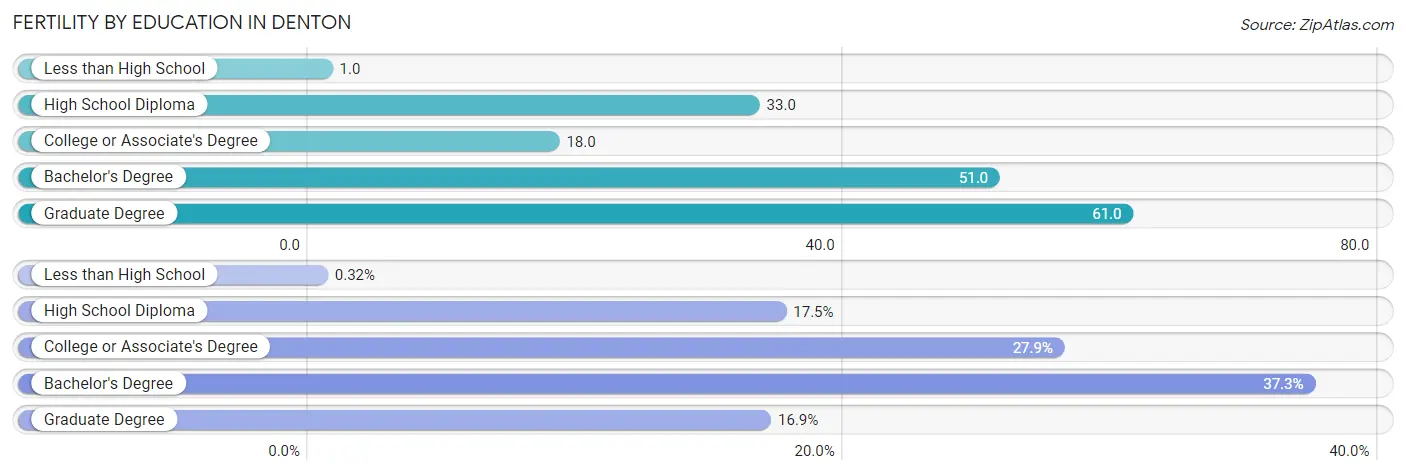
| Educational Attainment | Women with Births | Births / 1,000 Women |
| Less than High School | 4 (0.3%) | 1.0 |
| High School Diploma | 218 (17.5%) | 33.0 |
| College or Associate's Degree | 348 (27.9%) | 18.0 |
| Bachelor's Degree | 465 (37.3%) | 51.0 |
| Graduate Degree | 211 (16.9%) | 61.0 |
| Total | 1,246 (100.0%) | 30.0 |
Fertility by Education by Marriage Status in Denton
12.1% of women with births in Denton are unmarried. Women with the educational attainment of less than high school are most likely to be married with 100.0% of them married at childbirth, while women with the educational attainment of college or associate's degree are least likely to be married with 29.6% of them unmarried at childbirth.
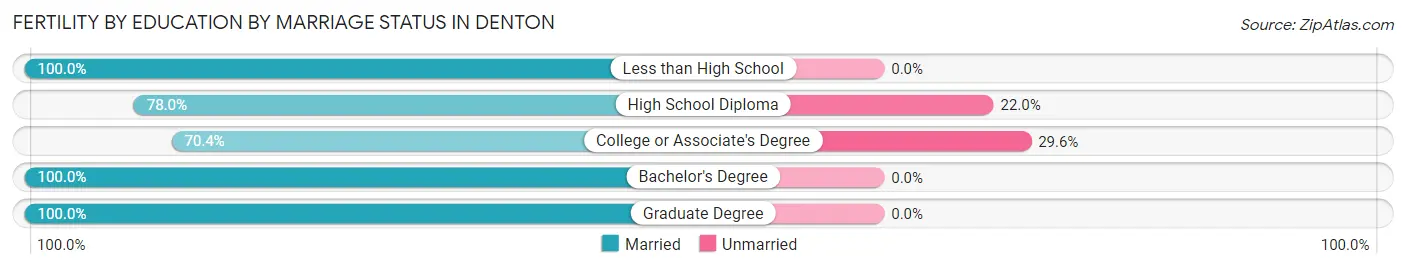
| Educational Attainment | Married | Unmarried |
| Less than High School | 4 (100.0%) | 0 (0.0%) |
| High School Diploma | 170 (78.0%) | 48 (22.0%) |
| College or Associate's Degree | 245 (70.4%) | 103 (29.6%) |
| Bachelor's Degree | 465 (100.0%) | 0 (0.0%) |
| Graduate Degree | 211 (100.0%) | 0 (0.0%) |
| Total | 1,095 (87.9%) | 151 (12.1%) |
Employment Characteristics in Denton
Employment by Class of Employer in Denton
Among the 75,620 employed individuals in Denton, private company employees (50,138 | 66.3%), state government employees (7,310 | 9.7%), and local government employees (5,760 | 7.6%) make up the most common classes of employment.
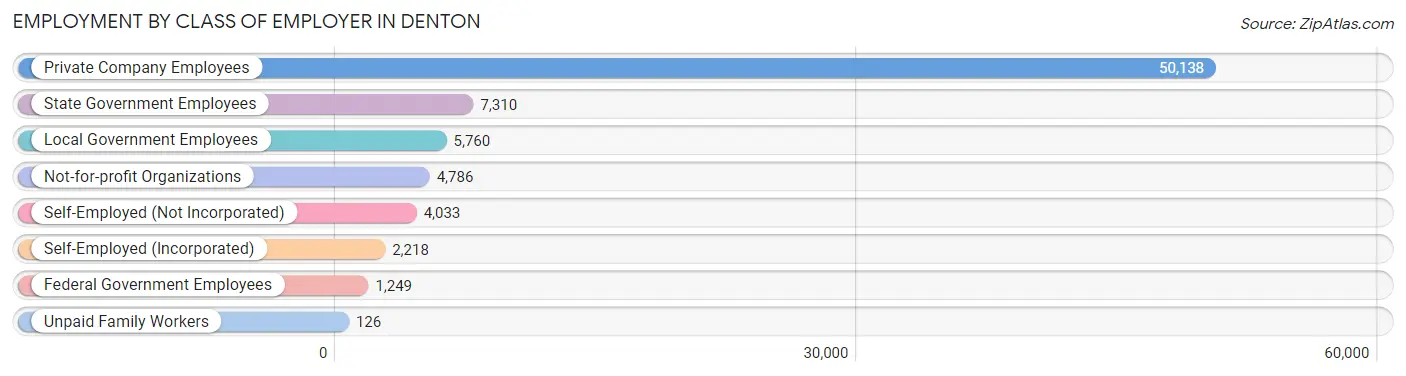
| Employer Class | # Employees | % Employees |
| Private Company Employees | 50,138 | 66.3% |
| Self-Employed (Incorporated) | 2,218 | 2.9% |
| Self-Employed (Not Incorporated) | 4,033 | 5.3% |
| Not-for-profit Organizations | 4,786 | 6.3% |
| Local Government Employees | 5,760 | 7.6% |
| State Government Employees | 7,310 | 9.7% |
| Federal Government Employees | 1,249 | 1.7% |
| Unpaid Family Workers | 126 | 0.2% |
| Total | 75,620 | 100.0% |
Employment Status by Age in Denton
According to the labor force statistics for Denton, out of the total population over 16 years of age (119,824), 67.8% or 81,241 individuals are in the labor force, with 4.8% or 3,900 of them unemployed. The age group with the highest labor force participation rate is 30 to 34 years, with 89.3% or 10,017 individuals in the labor force. Within the labor force, the 16 to 19 years age range has the highest percentage of unemployed individuals, with 15.9% or 845 of them being unemployed.
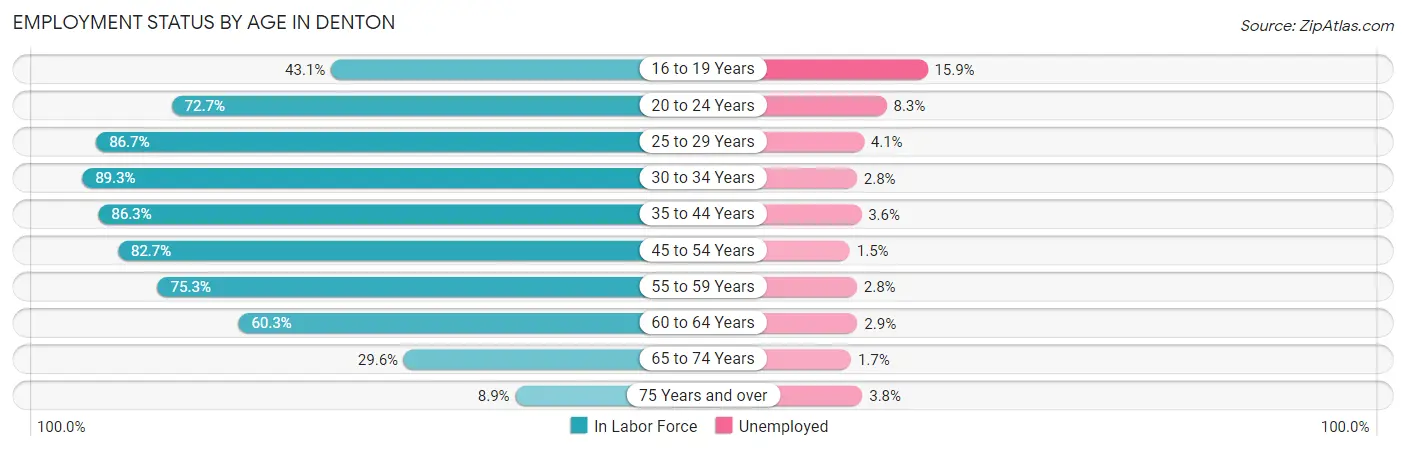
| Age Bracket | In Labor Force | Unemployed |
| 16 to 19 Years | 5,317 (43.1%) | 845 (15.9%) |
| 20 to 24 Years | 15,453 (72.7%) | 1,283 (8.3%) |
| 25 to 29 Years | 12,292 (86.7%) | 504 (4.1%) |
| 30 to 34 Years | 10,017 (89.3%) | 280 (2.8%) |
| 35 to 44 Years | 13,565 (86.3%) | 488 (3.6%) |
| 45 to 54 Years | 11,889 (82.7%) | 178 (1.5%) |
| 55 to 59 Years | 5,193 (75.3%) | 145 (2.8%) |
| 60 to 64 Years | 3,878 (60.3%) | 112 (2.9%) |
| 65 to 74 Years | 2,949 (29.6%) | 50 (1.7%) |
| 75 Years and over | 663 (8.9%) | 25 (3.8%) |
| Total | 81,241 (67.8%) | 3,900 (4.8%) |
Employment Status by Educational Attainment in Denton
According to labor force statistics for Denton, 82.6% of individuals (56,842) out of the total population between 25 and 64 years of age (68,816) are in the labor force, with 3.0% or 1,705 of them being unemployed. The group with the highest labor force participation rate are those with the educational attainment of bachelor's degree or higher, with 87.2% or 23,340 individuals in the labor force. Within the labor force, individuals with high school diploma education have the highest percentage of unemployment, with 3.8% or 418 of them being unemployed.
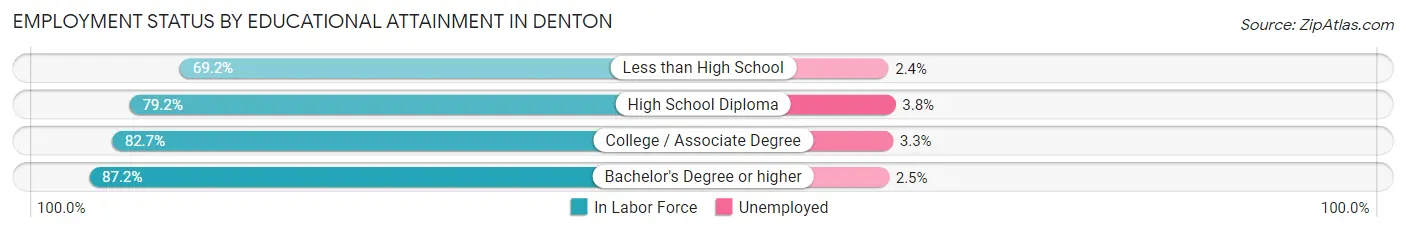
| Educational Attainment | In Labor Force | Unemployed |
| Less than High School | 4,108 (69.2%) | 142 (2.4%) |
| High School Diploma | 10,999 (79.2%) | 528 (3.8%) |
| College / Associate Degree | 18,382 (82.7%) | 733 (3.3%) |
| Bachelor's Degree or higher | 23,340 (87.2%) | 669 (2.5%) |
| Total | 56,842 (82.6%) | 2,064 (3.0%) |
Employment Occupations by Sex in Denton
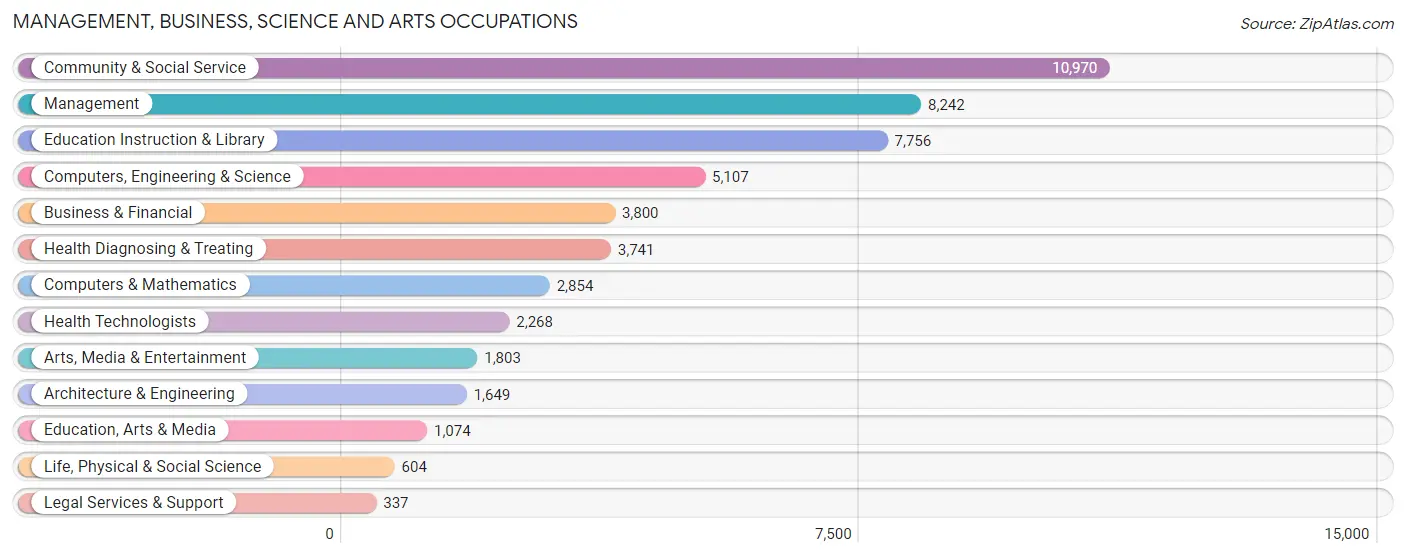
Management, Business, Science and Arts Occupations
The most common Management, Business, Science and Arts occupations in Denton are Community & Social Service (10,970 | 14.2%), Management (8,242 | 10.7%), Education Instruction & Library (7,756 | 10.0%), Computers, Engineering & Science (5,107 | 6.6%), and Business & Financial (3,800 | 4.9%).
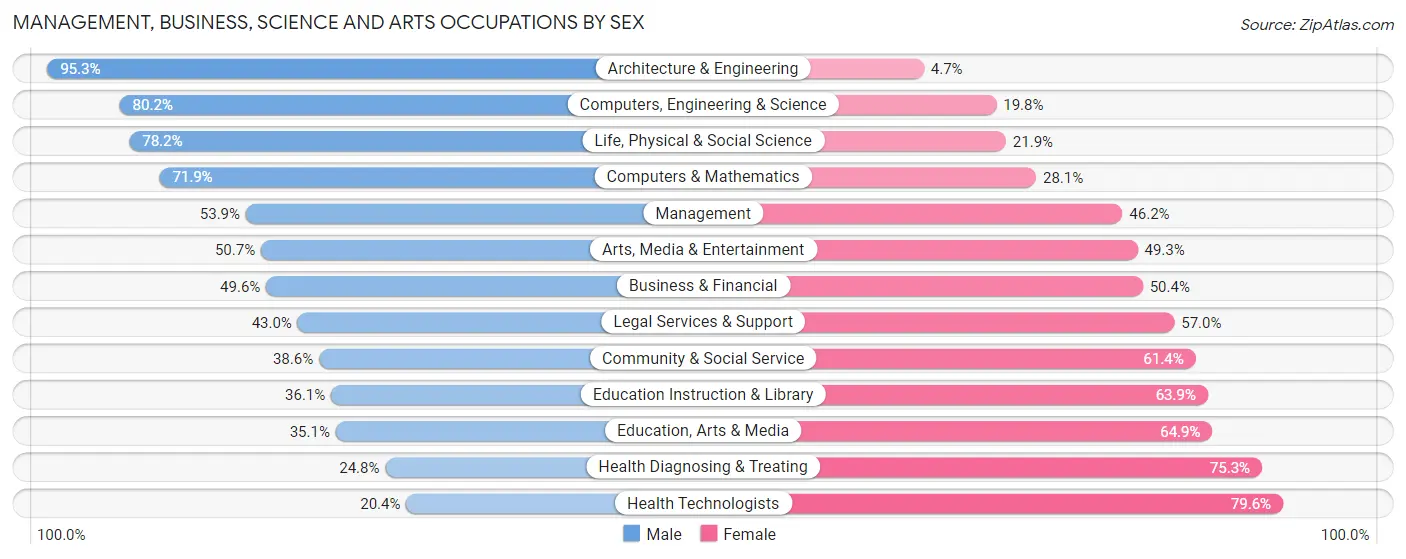
Management, Business, Science and Arts Occupations by Sex
Within the Management, Business, Science and Arts occupations in Denton, the most male-oriented occupations are Architecture & Engineering (95.3%), Computers, Engineering & Science (80.2%), and Life, Physical & Social Science (78.1%), while the most female-oriented occupations are Health Technologists (79.6%), Health Diagnosing & Treating (75.2%), and Education, Arts & Media (64.9%).
| Occupation | Male | Female |
| Management | 4,438 (53.8%) | 3,804 (46.2%) |
| Business & Financial | 1,885 (49.6%) | 1,915 (50.4%) |
| Computers, Engineering & Science | 4,094 (80.2%) | 1,013 (19.8%) |
| Computers & Mathematics | 2,051 (71.9%) | 803 (28.1%) |
| Architecture & Engineering | 1,571 (95.3%) | 78 (4.7%) |
| Life, Physical & Social Science | 472 (78.1%) | 132 (21.8%) |
| Community & Social Service | 4,233 (38.6%) | 6,737 (61.4%) |
| Education, Arts & Media | 377 (35.1%) | 697 (64.9%) |
| Legal Services & Support | 145 (43.0%) | 192 (57.0%) |
| Education Instruction & Library | 2,797 (36.1%) | 4,959 (63.9%) |
| Arts, Media & Entertainment | 914 (50.7%) | 889 (49.3%) |
| Health Diagnosing & Treating | 926 (24.7%) | 2,815 (75.2%) |
| Health Technologists | 462 (20.4%) | 1,806 (79.6%) |
| Total (Category) | 15,576 (48.9%) | 16,284 (51.1%) |
| Total (Overall) | 39,775 (51.5%) | 37,507 (48.5%) |
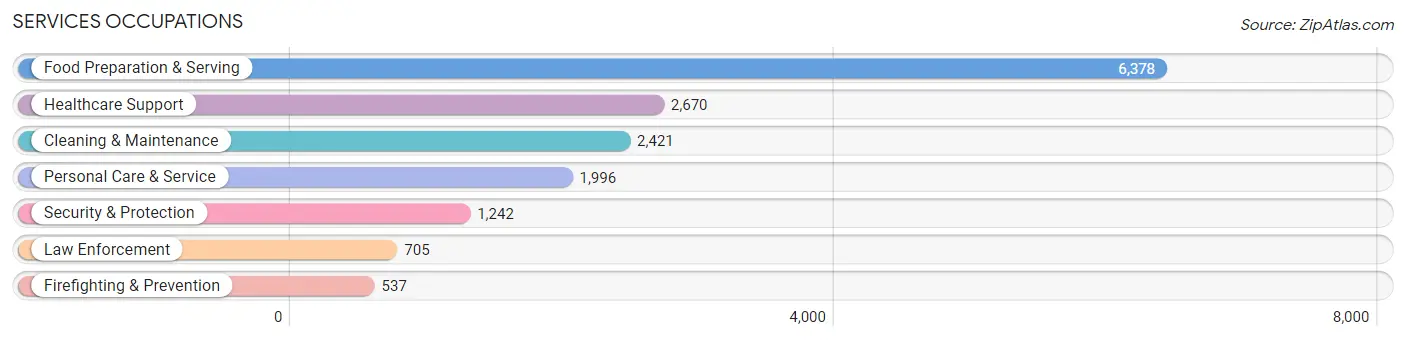
Services Occupations
The most common Services occupations in Denton are Food Preparation & Serving (6,378 | 8.3%), Healthcare Support (2,670 | 3.5%), Cleaning & Maintenance (2,421 | 3.1%), Personal Care & Service (1,996 | 2.6%), and Security & Protection (1,242 | 1.6%).
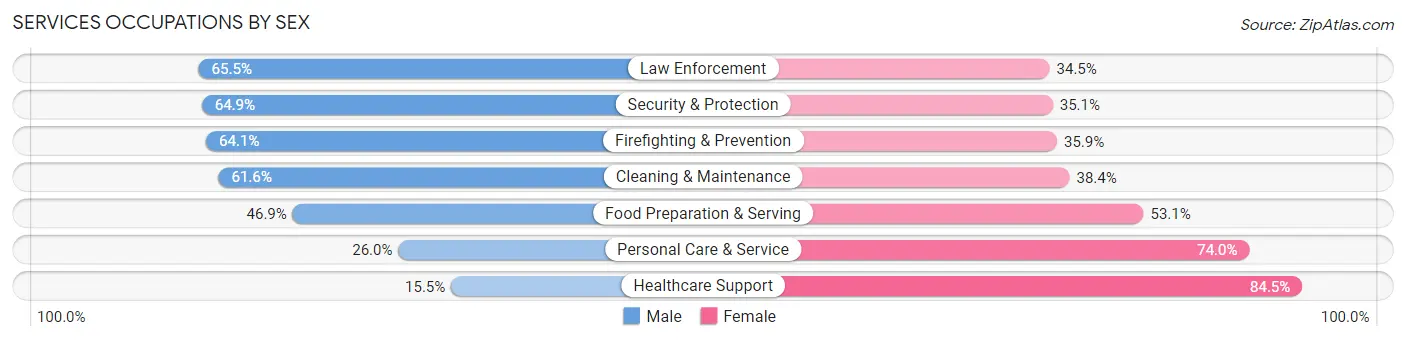
Services Occupations by Sex
Within the Services occupations in Denton, the most male-oriented occupations are Law Enforcement (65.5%), Security & Protection (64.9%), and Firefighting & Prevention (64.1%), while the most female-oriented occupations are Healthcare Support (84.5%), Personal Care & Service (74.0%), and Food Preparation & Serving (53.1%).
| Occupation | Male | Female |
| Healthcare Support | 415 (15.5%) | 2,255 (84.5%) |
| Security & Protection | 806 (64.9%) | 436 (35.1%) |
| Firefighting & Prevention | 344 (64.1%) | 193 (35.9%) |
| Law Enforcement | 462 (65.5%) | 243 (34.5%) |
| Food Preparation & Serving | 2,993 (46.9%) | 3,385 (53.1%) |
| Cleaning & Maintenance | 1,491 (61.6%) | 930 (38.4%) |
| Personal Care & Service | 519 (26.0%) | 1,477 (74.0%) |
| Total (Category) | 6,224 (42.3%) | 8,483 (57.7%) |
| Total (Overall) | 39,775 (51.5%) | 37,507 (48.5%) |
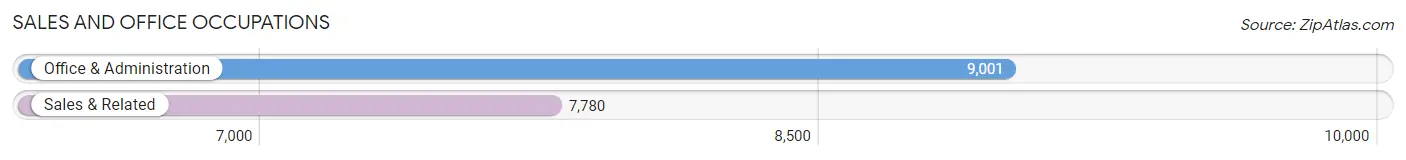
Sales and Office Occupations
The most common Sales and Office occupations in Denton are Office & Administration (9,001 | 11.7%), and Sales & Related (7,780 | 10.1%).
Sales and Office Occupations by Sex
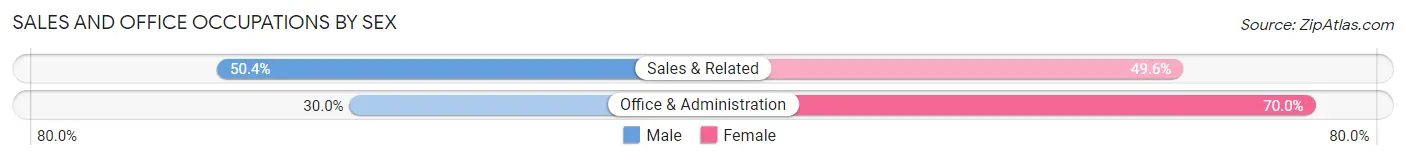
| Occupation | Male | Female |
| Sales & Related | 3,919 (50.4%) | 3,861 (49.6%) |
| Office & Administration | 2,703 (30.0%) | 6,298 (70.0%) |
| Total (Category) | 6,622 (39.5%) | 10,159 (60.5%) |
| Total (Overall) | 39,775 (51.5%) | 37,507 (48.5%) |
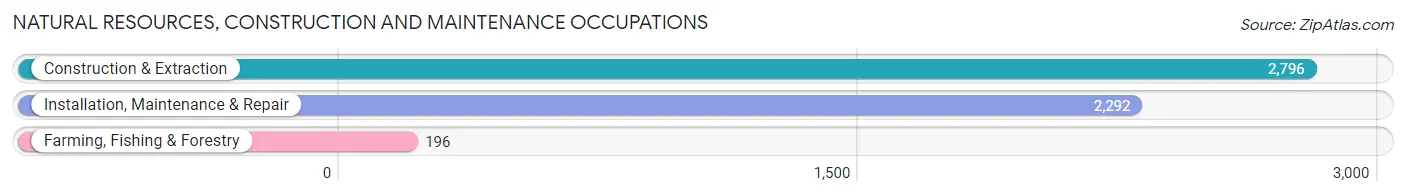
Natural Resources, Construction and Maintenance Occupations
The most common Natural Resources, Construction and Maintenance occupations in Denton are Construction & Extraction (2,796 | 3.6%), Installation, Maintenance & Repair (2,292 | 3.0%), and Farming, Fishing & Forestry (196 | 0.3%).
Natural Resources, Construction and Maintenance Occupations by Sex
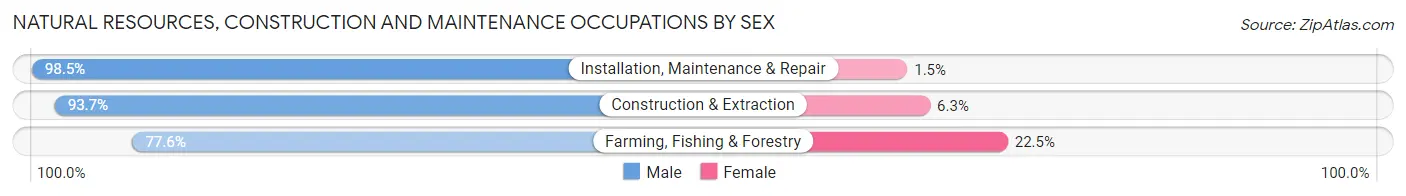
| Occupation | Male | Female |
| Farming, Fishing & Forestry | 152 (77.5%) | 44 (22.5%) |
| Construction & Extraction | 2,620 (93.7%) | 176 (6.3%) |
| Installation, Maintenance & Repair | 2,257 (98.5%) | 35 (1.5%) |
| Total (Category) | 5,029 (95.2%) | 255 (4.8%) |
| Total (Overall) | 39,775 (51.5%) | 37,507 (48.5%) |
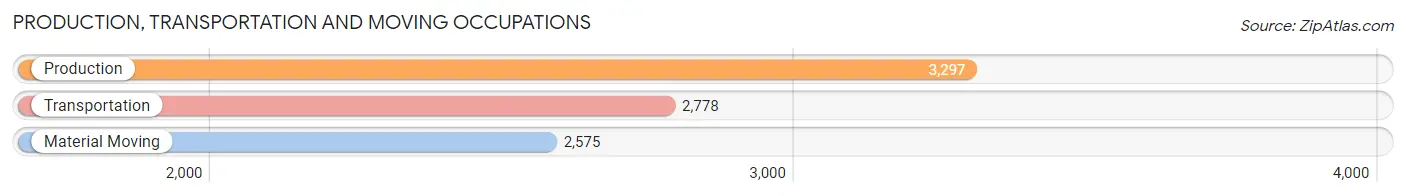
Production, Transportation and Moving Occupations
The most common Production, Transportation and Moving occupations in Denton are Production (3,297 | 4.3%), Transportation (2,778 | 3.6%), and Material Moving (2,575 | 3.3%).
Production, Transportation and Moving Occupations by Sex
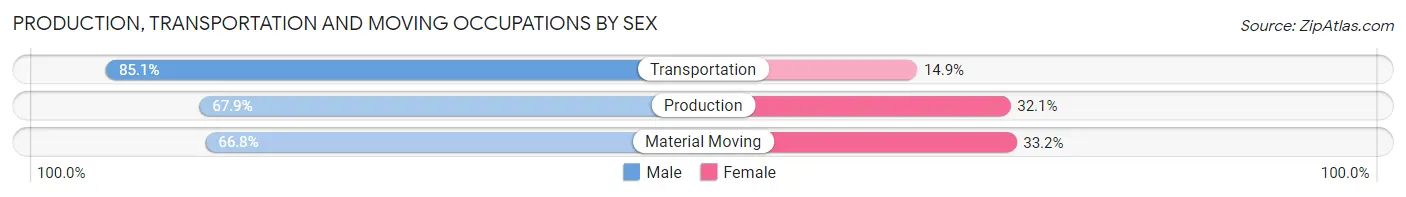
| Occupation | Male | Female |
| Production | 2,240 (67.9%) | 1,057 (32.1%) |
| Transportation | 2,363 (85.1%) | 415 (14.9%) |
| Material Moving | 1,721 (66.8%) | 854 (33.2%) |
| Total (Category) | 6,324 (73.1%) | 2,326 (26.9%) |
| Total (Overall) | 39,775 (51.5%) | 37,507 (48.5%) |
Employment Industries by Sex in Denton
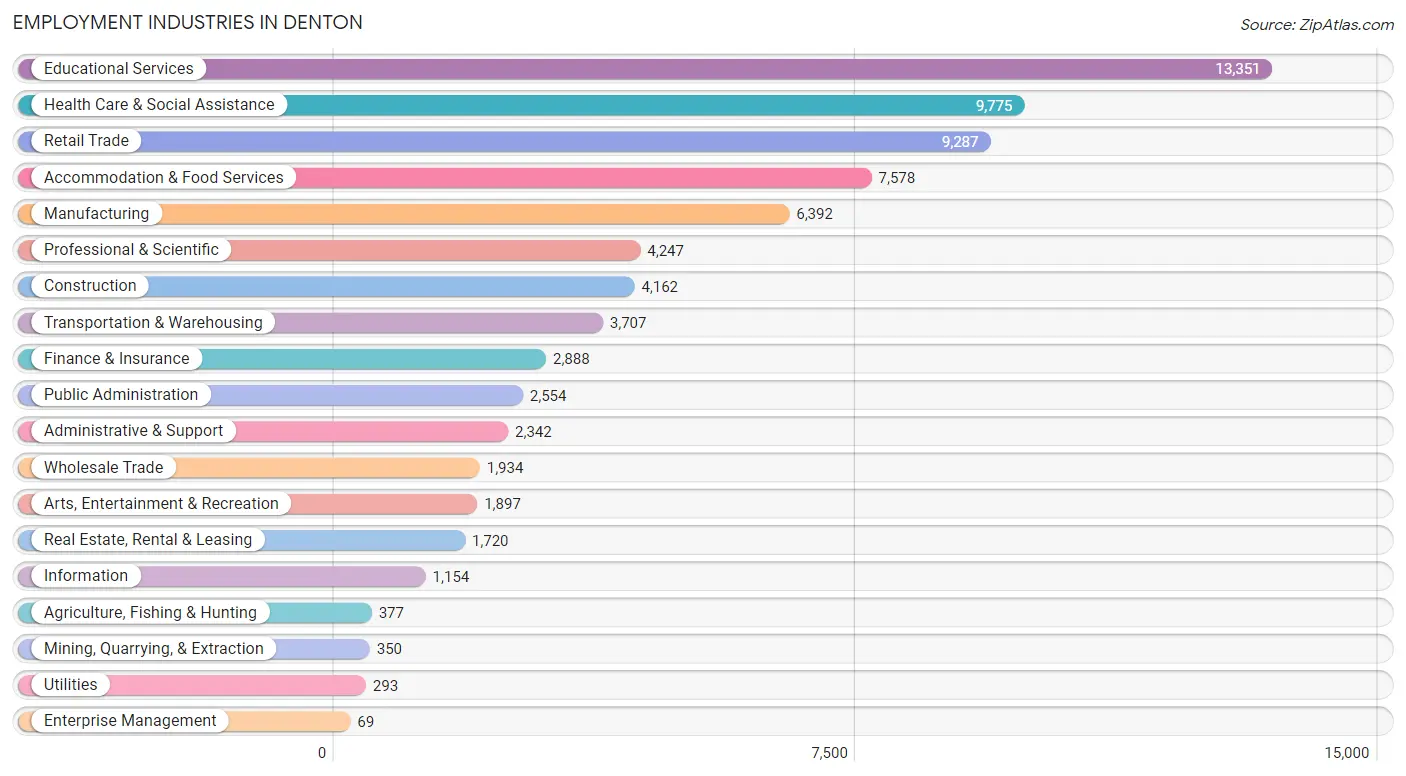
Employment Industries in Denton
The major employment industries in Denton include Educational Services (13,351 | 17.3%), Health Care & Social Assistance (9,775 | 12.7%), Retail Trade (9,287 | 12.0%), Accommodation & Food Services (7,578 | 9.8%), and Manufacturing (6,392 | 8.3%).
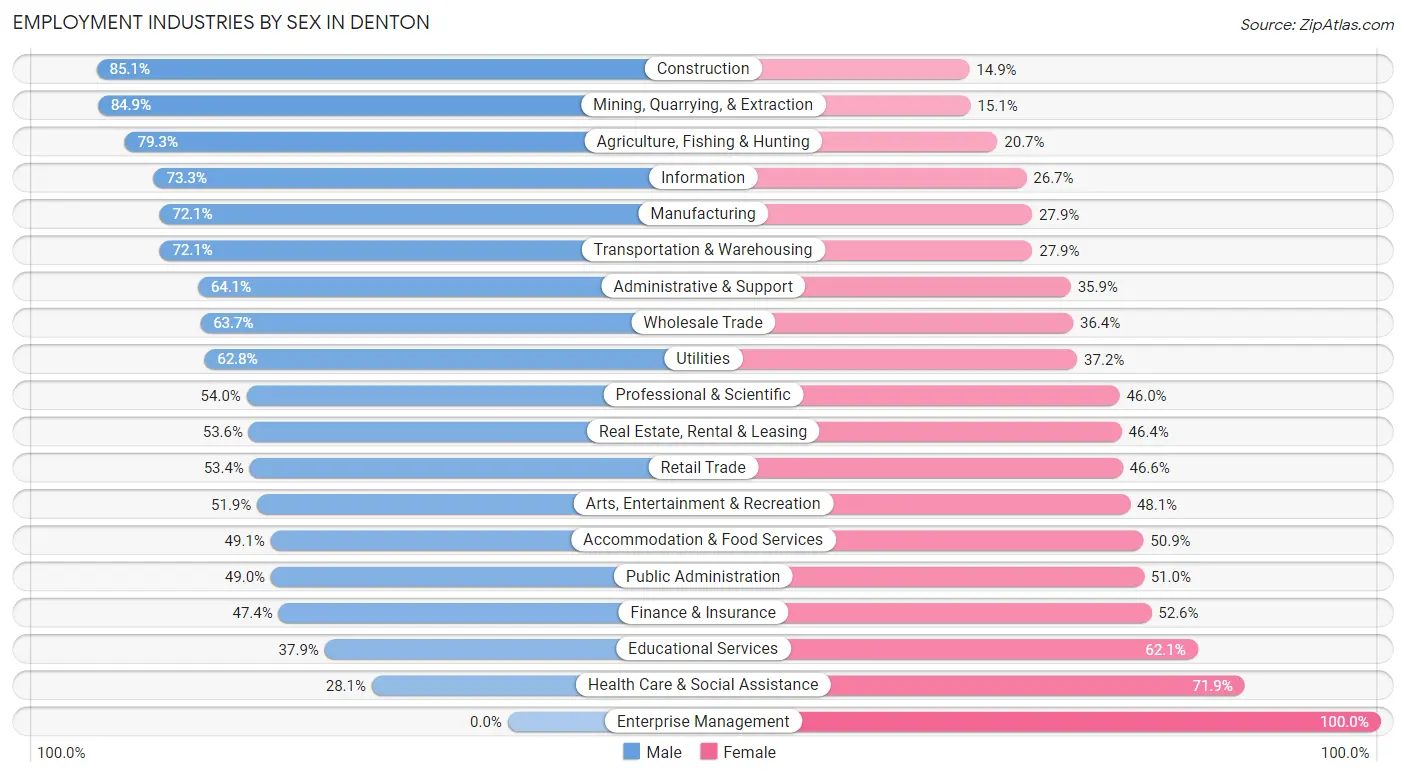
Employment Industries by Sex in Denton
The Denton industries that see more men than women are Construction (85.1%), Mining, Quarrying, & Extraction (84.9%), and Agriculture, Fishing & Hunting (79.3%), whereas the industries that tend to have a higher number of women are Enterprise Management (100.0%), Health Care & Social Assistance (71.9%), and Educational Services (62.1%).
| Industry | Male | Female |
| Agriculture, Fishing & Hunting | 299 (79.3%) | 78 (20.7%) |
| Mining, Quarrying, & Extraction | 297 (84.9%) | 53 (15.1%) |
| Construction | 3,542 (85.1%) | 620 (14.9%) |
| Manufacturing | 4,609 (72.1%) | 1,783 (27.9%) |
| Wholesale Trade | 1,231 (63.6%) | 703 (36.3%) |
| Retail Trade | 4,960 (53.4%) | 4,327 (46.6%) |
| Transportation & Warehousing | 2,672 (72.1%) | 1,035 (27.9%) |
| Utilities | 184 (62.8%) | 109 (37.2%) |
| Information | 846 (73.3%) | 308 (26.7%) |
| Finance & Insurance | 1,370 (47.4%) | 1,518 (52.6%) |
| Real Estate, Rental & Leasing | 922 (53.6%) | 798 (46.4%) |
| Professional & Scientific | 2,295 (54.0%) | 1,952 (46.0%) |
| Enterprise Management | 0 (0.0%) | 69 (100.0%) |
| Administrative & Support | 1,502 (64.1%) | 840 (35.9%) |
| Educational Services | 5,059 (37.9%) | 8,292 (62.1%) |
| Health Care & Social Assistance | 2,751 (28.1%) | 7,024 (71.9%) |
| Arts, Entertainment & Recreation | 984 (51.9%) | 913 (48.1%) |
| Accommodation & Food Services | 3,719 (49.1%) | 3,859 (50.9%) |
| Public Administration | 1,252 (49.0%) | 1,302 (51.0%) |
| Total | 39,775 (51.5%) | 37,507 (48.5%) |
Education in Denton
School Enrollment in Denton
The most common levels of schooling among the 47,911 students in Denton are college / undergraduate (23,916 | 49.9%), high school (5,961 | 12.4%), and elementary school (5,788 | 12.1%).
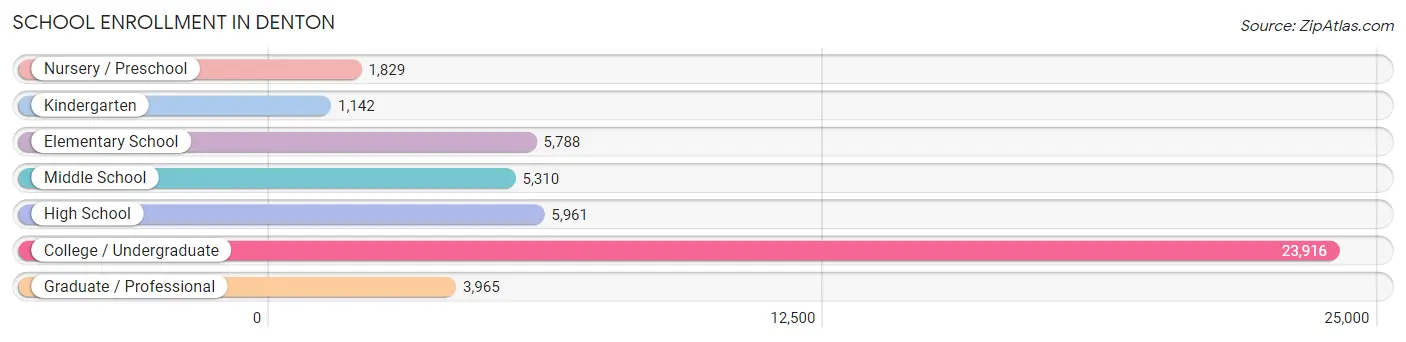
| School Level | # Students | % Students |
| Nursery / Preschool | 1,829 | 3.8% |
| Kindergarten | 1,142 | 2.4% |
| Elementary School | 5,788 | 12.1% |
| Middle School | 5,310 | 11.1% |
| High School | 5,961 | 12.4% |
| College / Undergraduate | 23,916 | 49.9% |
| Graduate / Professional | 3,965 | 8.3% |
| Total | 47,911 | 100.0% |
School Enrollment by Age by Funding Source in Denton
Out of a total of 47,911 students who are enrolled in schools in Denton, 4,025 (8.4%) attend a private institution, while the remaining 43,886 (91.6%) are enrolled in public schools. The age group of 3 to 4 year olds has the highest likelihood of being enrolled in private schools, with 518 (34.5% in the age bracket) enrolled. Conversely, the age group of 25 to 34 year olds has the lowest likelihood of being enrolled in a private school, with 4,206 (93.7% in the age bracket) attending a public institution.
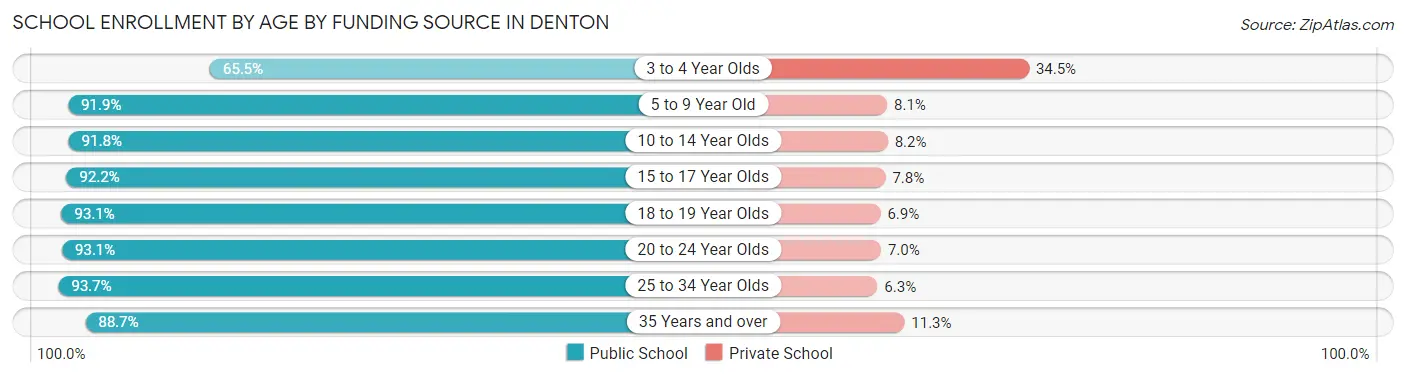
| Age Bracket | Public School | Private School |
| 3 to 4 Year Olds | 983 (65.5%) | 518 (34.5%) |
| 5 to 9 Year Old | 5,885 (91.9%) | 518 (8.1%) |
| 10 to 14 Year Olds | 6,553 (91.8%) | 586 (8.2%) |
| 15 to 17 Year Olds | 4,476 (92.2%) | 378 (7.8%) |
| 18 to 19 Year Olds | 6,960 (93.1%) | 513 (6.9%) |
| 20 to 24 Year Olds | 12,971 (93.0%) | 969 (7.0%) |
| 25 to 34 Year Olds | 4,206 (93.7%) | 282 (6.3%) |
| 35 Years and over | 1,874 (88.7%) | 239 (11.3%) |
| Total | 43,886 (91.6%) | 4,025 (8.4%) |
Educational Attainment by Field of Study in Denton
Business (6,672 | 18.0%), education (4,159 | 11.2%), science & technology (3,531 | 9.5%), social sciences (2,744 | 7.4%), and engineering (2,728 | 7.3%) are the most common fields of study among 37,110 individuals in Denton who have obtained a bachelor's degree or higher.
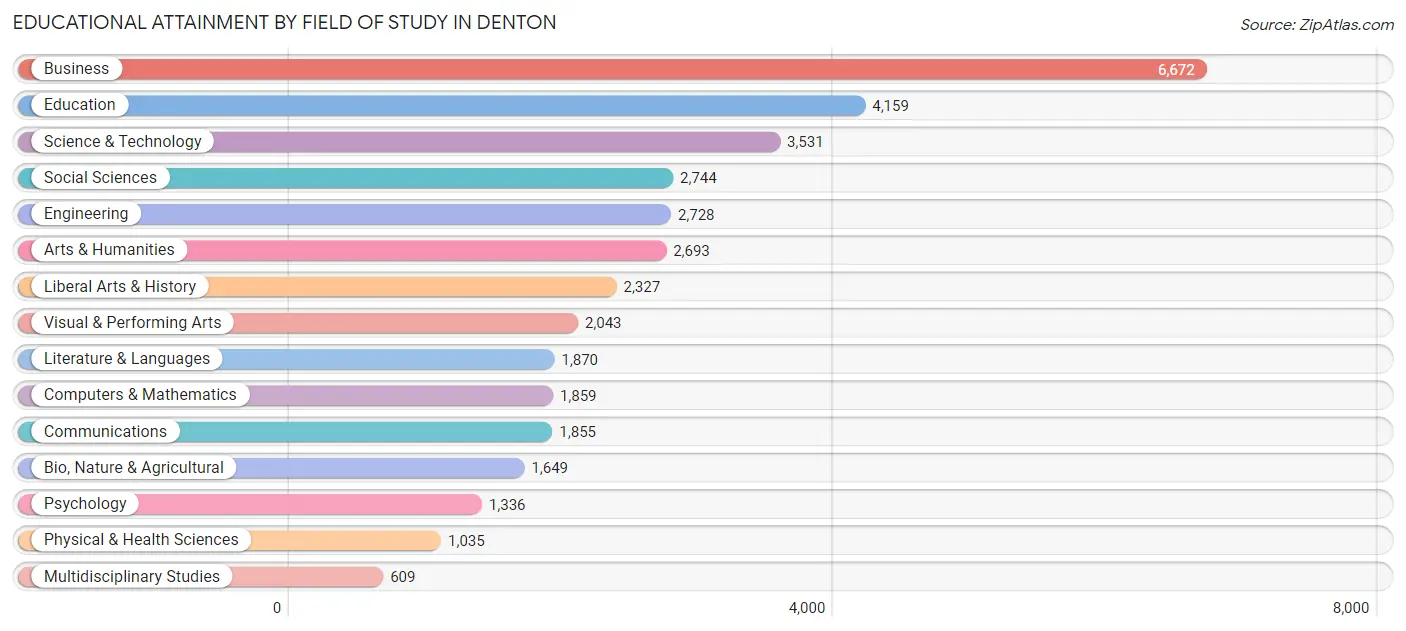
| Field of Study | # Graduates | % Graduates |
| Computers & Mathematics | 1,859 | 5.0% |
| Bio, Nature & Agricultural | 1,649 | 4.4% |
| Physical & Health Sciences | 1,035 | 2.8% |
| Psychology | 1,336 | 3.6% |
| Social Sciences | 2,744 | 7.4% |
| Engineering | 2,728 | 7.3% |
| Multidisciplinary Studies | 609 | 1.6% |
| Science & Technology | 3,531 | 9.5% |
| Business | 6,672 | 18.0% |
| Education | 4,159 | 11.2% |
| Literature & Languages | 1,870 | 5.0% |
| Liberal Arts & History | 2,327 | 6.3% |
| Visual & Performing Arts | 2,043 | 5.5% |
| Communications | 1,855 | 5.0% |
| Arts & Humanities | 2,693 | 7.3% |
| Total | 37,110 | 100.0% |
Transportation & Commute in Denton
Vehicle Availability by Sex in Denton
The most prevalent vehicle ownership categories in Denton are males with 2 vehicles (16,275, accounting for 42.3%) and females with 2 vehicles (14,584, making up 48.0%).
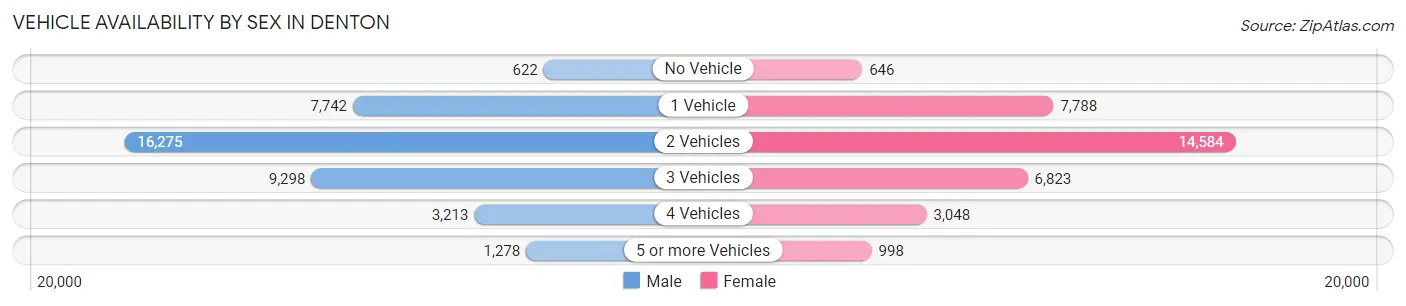
| Vehicles Available | Male | Female |
| No Vehicle | 622 (1.6%) | 646 (1.9%) |
| 1 Vehicle | 7,742 (20.2%) | 7,788 (23.0%) |
| 2 Vehicles | 16,275 (42.3%) | 14,584 (43.0%) |
| 3 Vehicles | 9,298 (24.2%) | 6,823 (20.1%) |
| 4 Vehicles | 3,213 (8.4%) | 3,048 (9.0%) |
| 5 or more Vehicles | 1,278 (3.3%) | 998 (2.9%) |
| Total | 38,428 (100.0%) | 33,887 (100.0%) |
Commute Time in Denton
The most frequently occuring commute durations in Denton are 15 to 19 minutes (12,662 commuters, 18.7%), 10 to 14 minutes (11,147 commuters, 16.5%), and 5 to 9 minutes (8,179 commuters, 12.1%).
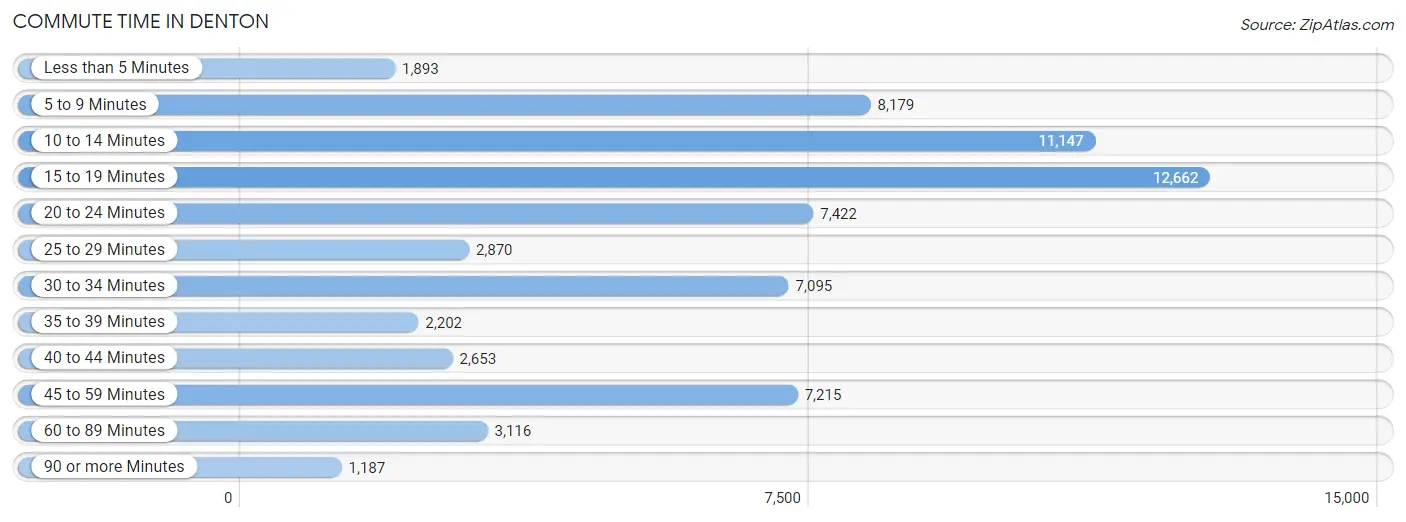
| Commute Time | # Commuters | % Commuters |
| Less than 5 Minutes | 1,893 | 2.8% |
| 5 to 9 Minutes | 8,179 | 12.1% |
| 10 to 14 Minutes | 11,147 | 16.5% |
| 15 to 19 Minutes | 12,662 | 18.7% |
| 20 to 24 Minutes | 7,422 | 11.0% |
| 25 to 29 Minutes | 2,870 | 4.2% |
| 30 to 34 Minutes | 7,095 | 10.5% |
| 35 to 39 Minutes | 2,202 | 3.3% |
| 40 to 44 Minutes | 2,653 | 3.9% |
| 45 to 59 Minutes | 7,215 | 10.7% |
| 60 to 89 Minutes | 3,116 | 4.6% |
| 90 or more Minutes | 1,187 | 1.8% |
Commute Time by Sex in Denton
The most common commute times in Denton are 15 to 19 minutes (5,620 commuters, 15.9%) for males and 15 to 19 minutes (7,042 commuters, 21.8%) for females.
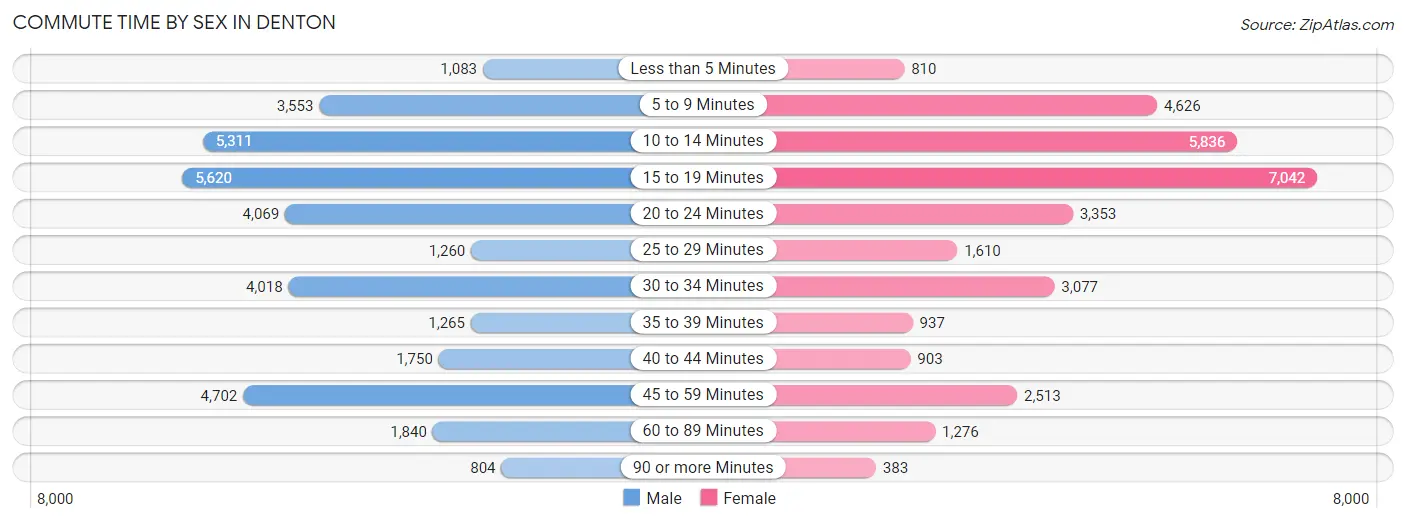
| Commute Time | Male | Female |
| Less than 5 Minutes | 1,083 (3.1%) | 810 (2.5%) |
| 5 to 9 Minutes | 3,553 (10.1%) | 4,626 (14.3%) |
| 10 to 14 Minutes | 5,311 (15.1%) | 5,836 (18.0%) |
| 15 to 19 Minutes | 5,620 (15.9%) | 7,042 (21.8%) |
| 20 to 24 Minutes | 4,069 (11.5%) | 3,353 (10.4%) |
| 25 to 29 Minutes | 1,260 (3.6%) | 1,610 (5.0%) |
| 30 to 34 Minutes | 4,018 (11.4%) | 3,077 (9.5%) |
| 35 to 39 Minutes | 1,265 (3.6%) | 937 (2.9%) |
| 40 to 44 Minutes | 1,750 (5.0%) | 903 (2.8%) |
| 45 to 59 Minutes | 4,702 (13.3%) | 2,513 (7.8%) |
| 60 to 89 Minutes | 1,840 (5.2%) | 1,276 (3.9%) |
| 90 or more Minutes | 804 (2.3%) | 383 (1.2%) |
Time of Departure to Work by Sex in Denton
The most frequent times of departure to work in Denton are 7:00 AM to 7:29 AM (4,186, 11.9%) for males and 7:30 AM to 7:59 AM (4,484, 13.9%) for females.
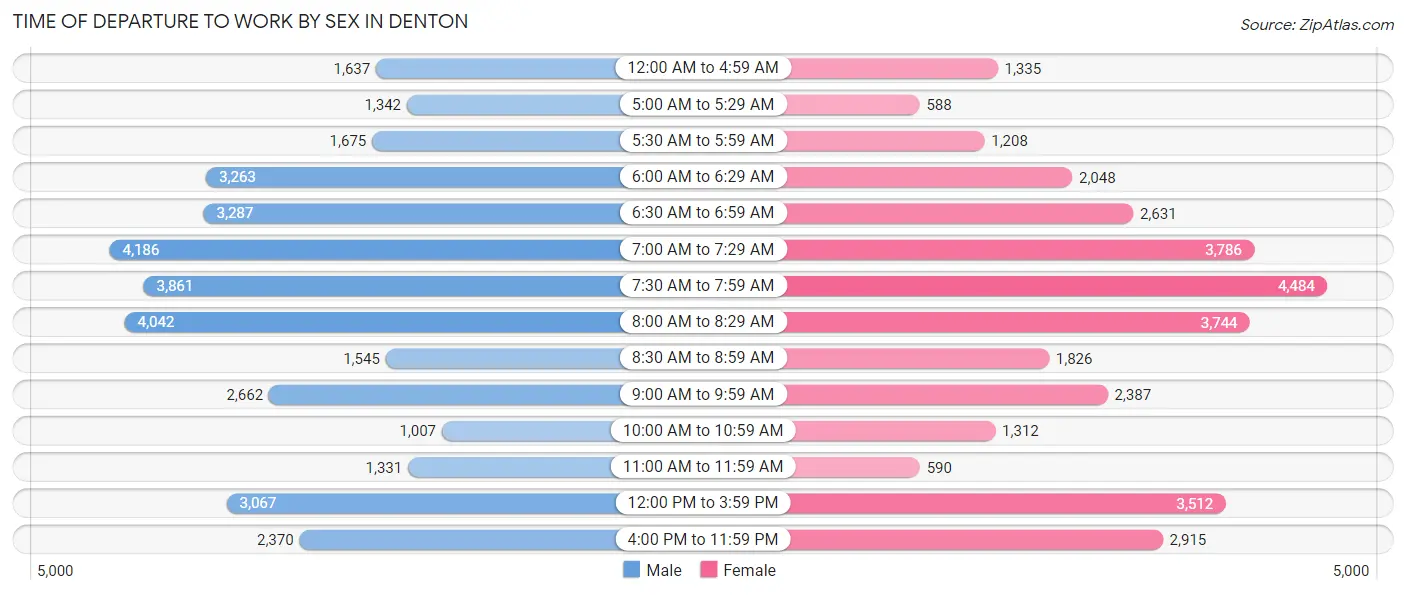
| Time of Departure | Male | Female |
| 12:00 AM to 4:59 AM | 1,637 (4.6%) | 1,335 (4.1%) |
| 5:00 AM to 5:29 AM | 1,342 (3.8%) | 588 (1.8%) |
| 5:30 AM to 5:59 AM | 1,675 (4.8%) | 1,208 (3.7%) |
| 6:00 AM to 6:29 AM | 3,263 (9.2%) | 2,048 (6.3%) |
| 6:30 AM to 6:59 AM | 3,287 (9.3%) | 2,631 (8.1%) |
| 7:00 AM to 7:29 AM | 4,186 (11.9%) | 3,786 (11.7%) |
| 7:30 AM to 7:59 AM | 3,861 (11.0%) | 4,484 (13.9%) |
| 8:00 AM to 8:29 AM | 4,042 (11.5%) | 3,744 (11.6%) |
| 8:30 AM to 8:59 AM | 1,545 (4.4%) | 1,826 (5.6%) |
| 9:00 AM to 9:59 AM | 2,662 (7.5%) | 2,387 (7.4%) |
| 10:00 AM to 10:59 AM | 1,007 (2.9%) | 1,312 (4.1%) |
| 11:00 AM to 11:59 AM | 1,331 (3.8%) | 590 (1.8%) |
| 12:00 PM to 3:59 PM | 3,067 (8.7%) | 3,512 (10.8%) |
| 4:00 PM to 11:59 PM | 2,370 (6.7%) | 2,915 (9.0%) |
| Total | 35,275 (100.0%) | 32,366 (100.0%) |
Housing Occupancy in Denton
Occupancy by Ownership in Denton
Of the total 52,243 dwellings in Denton, owner-occupied units account for 25,798 (49.4%), while renter-occupied units make up 26,445 (50.6%).
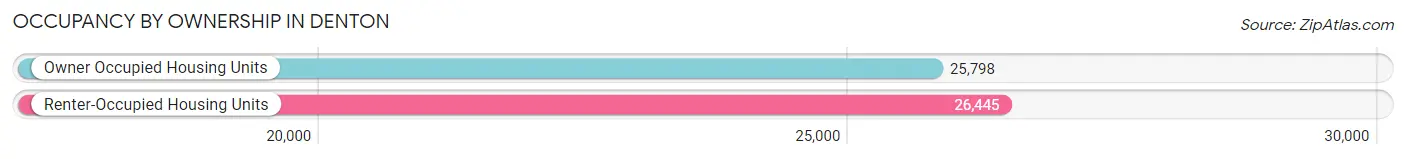
| Occupancy | # Housing Units | % Housing Units |
| Owner Occupied Housing Units | 25,798 | 49.4% |
| Renter-Occupied Housing Units | 26,445 | 50.6% |
| Total Occupied Housing Units | 52,243 | 100.0% |
Occupancy by Household Size in Denton
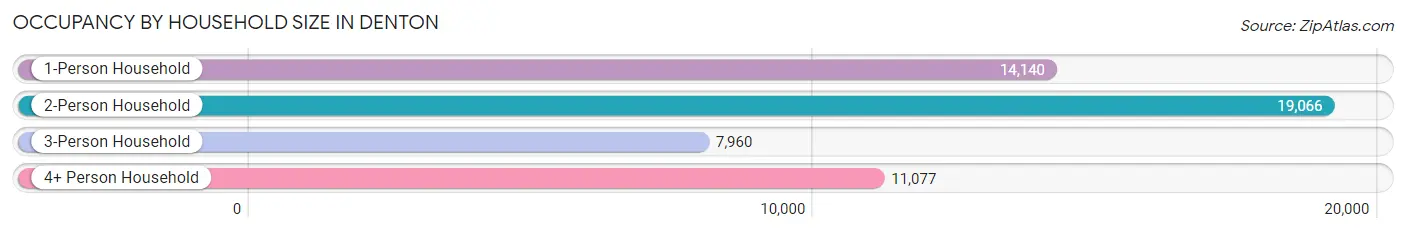
| Household Size | # Housing Units | % Housing Units |
| 1-Person Household | 14,140 | 27.1% |
| 2-Person Household | 19,066 | 36.5% |
| 3-Person Household | 7,960 | 15.2% |
| 4+ Person Household | 11,077 | 21.2% |
| Total Housing Units | 52,243 | 100.0% |
Occupancy by Ownership by Household Size in Denton
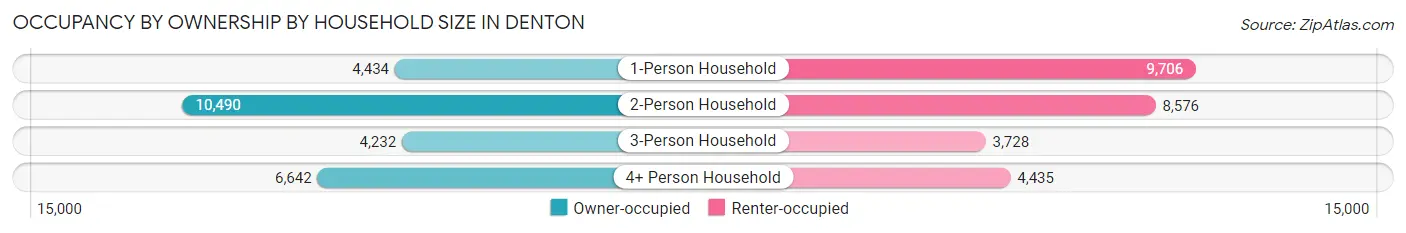
| Household Size | Owner-occupied | Renter-occupied |
| 1-Person Household | 4,434 (31.4%) | 9,706 (68.6%) |
| 2-Person Household | 10,490 (55.0%) | 8,576 (45.0%) |
| 3-Person Household | 4,232 (53.2%) | 3,728 (46.8%) |
| 4+ Person Household | 6,642 (60.0%) | 4,435 (40.0%) |
| Total Housing Units | 25,798 (49.4%) | 26,445 (50.6%) |
Occupancy by Educational Attainment in Denton
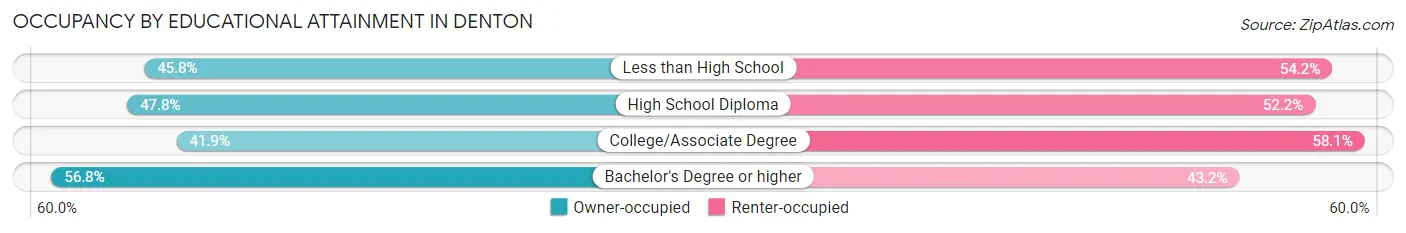
| Household Size | Owner-occupied | Renter-occupied |
| Less than High School | 1,433 (45.8%) | 1,698 (54.2%) |
| High School Diploma | 4,174 (47.8%) | 4,560 (52.2%) |
| College/Associate Degree | 7,729 (41.9%) | 10,714 (58.1%) |
| Bachelor's Degree or higher | 12,462 (56.8%) | 9,473 (43.2%) |
Occupancy by Age of Householder in Denton
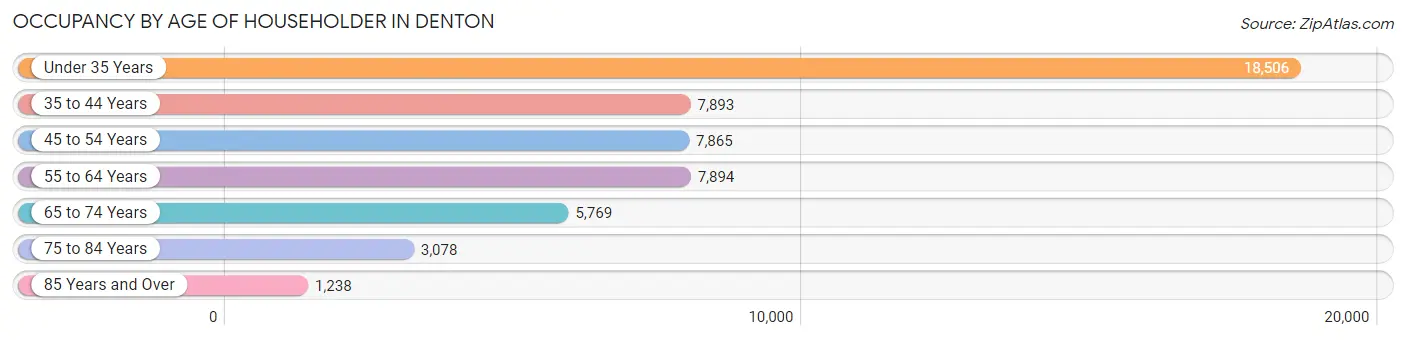
| Age Bracket | # Households | % Households |
| Under 35 Years | 18,506 | 35.4% |
| 35 to 44 Years | 7,893 | 15.1% |
| 45 to 54 Years | 7,865 | 15.0% |
| 55 to 64 Years | 7,894 | 15.1% |
| 65 to 74 Years | 5,769 | 11.0% |
| 75 to 84 Years | 3,078 | 5.9% |
| 85 Years and Over | 1,238 | 2.4% |
| Total | 52,243 | 100.0% |
Housing Finances in Denton
Median Income by Occupancy in Denton
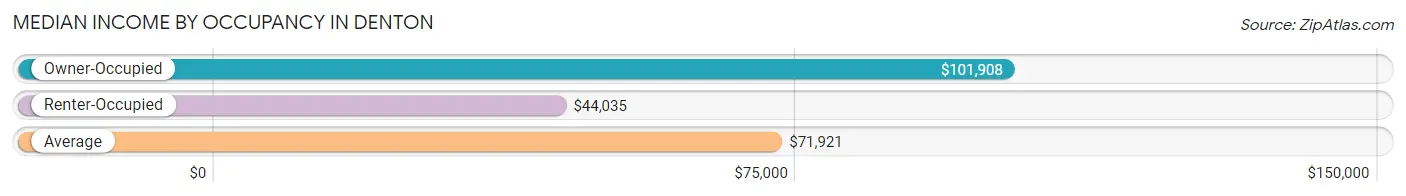
| Occupancy Type | # Households | Median Income |
| Owner-Occupied | 25,798 (49.4%) | $101,908 |
| Renter-Occupied | 26,445 (50.6%) | $44,035 |
| Average | 52,243 (100.0%) | $71,921 |
Occupancy by Householder Income Bracket in Denton
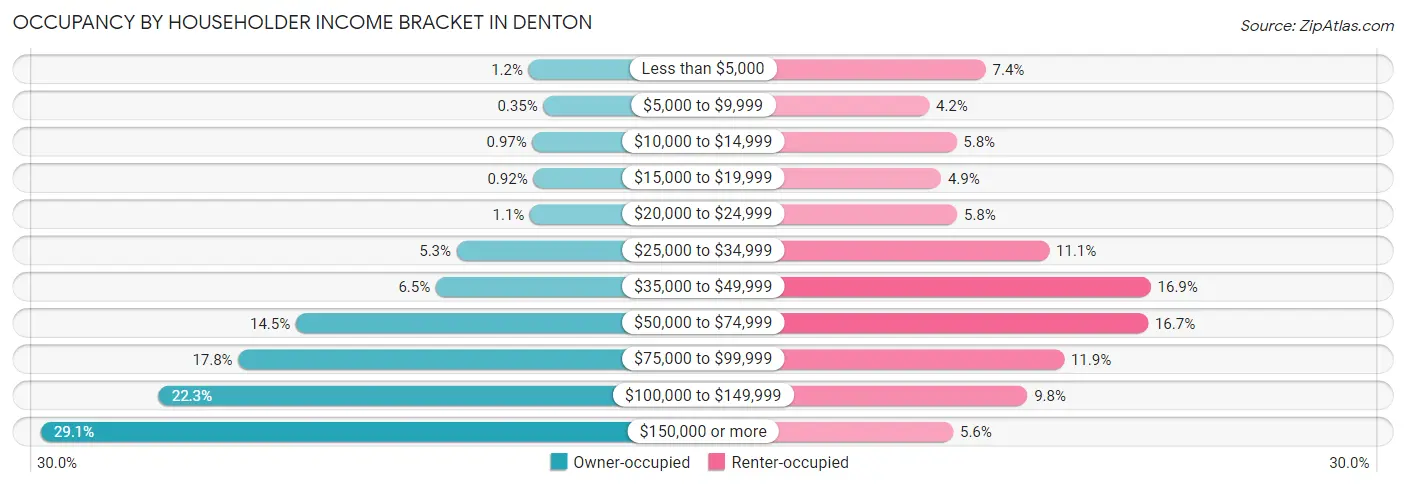
| Income Bracket | Owner-occupied | Renter-occupied |
| Less than $5,000 | 307 (1.2%) | 1,965 (7.4%) |
| $5,000 to $9,999 | 90 (0.4%) | 1,110 (4.2%) |
| $10,000 to $14,999 | 249 (1.0%) | 1,523 (5.8%) |
| $15,000 to $19,999 | 237 (0.9%) | 1,291 (4.9%) |
| $20,000 to $24,999 | 287 (1.1%) | 1,535 (5.8%) |
| $25,000 to $34,999 | 1,368 (5.3%) | 2,926 (11.1%) |
| $35,000 to $49,999 | 1,675 (6.5%) | 4,458 (16.9%) |
| $50,000 to $74,999 | 3,738 (14.5%) | 4,420 (16.7%) |
| $75,000 to $99,999 | 4,587 (17.8%) | 3,150 (11.9%) |
| $100,000 to $149,999 | 5,760 (22.3%) | 2,594 (9.8%) |
| $150,000 or more | 7,500 (29.1%) | 1,473 (5.6%) |
| Total | 25,798 (100.0%) | 26,445 (100.0%) |
Monthly Housing Cost Tiers in Denton
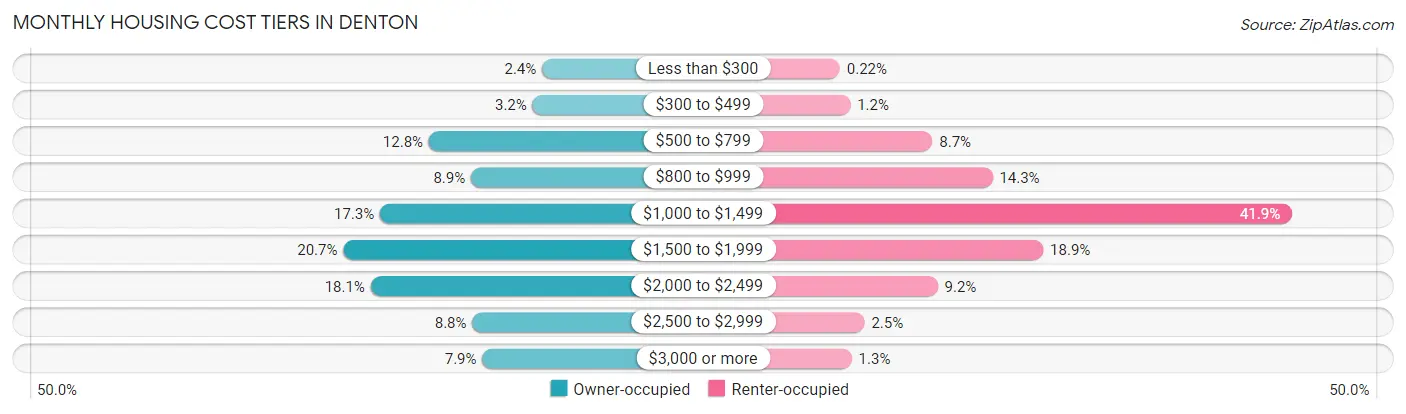
| Monthly Cost | Owner-occupied | Renter-occupied |
| Less than $300 | 609 (2.4%) | 57 (0.2%) |
| $300 to $499 | 834 (3.2%) | 313 (1.2%) |
| $500 to $799 | 3,296 (12.8%) | 2,310 (8.7%) |
| $800 to $999 | 2,296 (8.9%) | 3,773 (14.3%) |
| $1,000 to $1,499 | 4,459 (17.3%) | 11,068 (41.8%) |
| $1,500 to $1,999 | 5,330 (20.7%) | 5,009 (18.9%) |
| $2,000 to $2,499 | 4,681 (18.1%) | 2,439 (9.2%) |
| $2,500 to $2,999 | 2,265 (8.8%) | 659 (2.5%) |
| $3,000 or more | 2,028 (7.9%) | 346 (1.3%) |
| Total | 25,798 (100.0%) | 26,445 (100.0%) |
Physical Housing Characteristics in Denton
Housing Structures in Denton
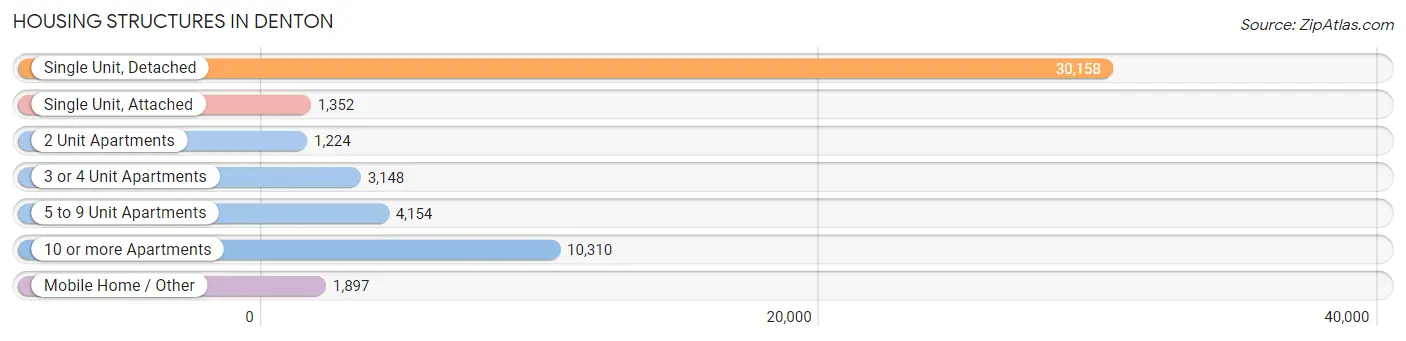
| Structure Type | # Housing Units | % Housing Units |
| Single Unit, Detached | 30,158 | 57.7% |
| Single Unit, Attached | 1,352 | 2.6% |
| 2 Unit Apartments | 1,224 | 2.3% |
| 3 or 4 Unit Apartments | 3,148 | 6.0% |
| 5 to 9 Unit Apartments | 4,154 | 8.0% |
| 10 or more Apartments | 10,310 | 19.7% |
| Mobile Home / Other | 1,897 | 3.6% |
| Total | 52,243 | 100.0% |
Housing Structures by Occupancy in Denton
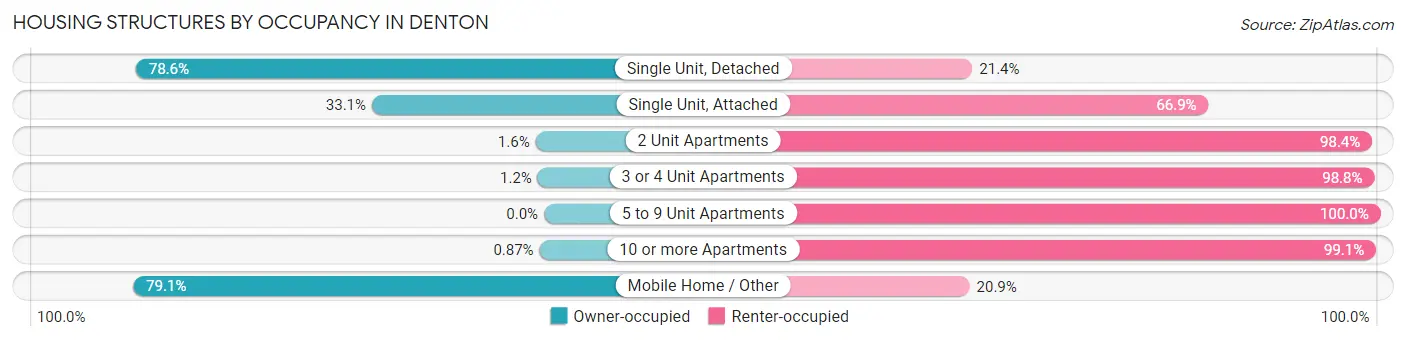
| Structure Type | Owner-occupied | Renter-occupied |
| Single Unit, Detached | 23,701 (78.6%) | 6,457 (21.4%) |
| Single Unit, Attached | 448 (33.1%) | 904 (66.9%) |
| 2 Unit Apartments | 20 (1.6%) | 1,204 (98.4%) |
| 3 or 4 Unit Apartments | 38 (1.2%) | 3,110 (98.8%) |
| 5 to 9 Unit Apartments | 0 (0.0%) | 4,154 (100.0%) |
| 10 or more Apartments | 90 (0.9%) | 10,220 (99.1%) |
| Mobile Home / Other | 1,501 (79.1%) | 396 (20.9%) |
| Total | 25,798 (49.4%) | 26,445 (50.6%) |
Housing Structures by Number of Rooms in Denton
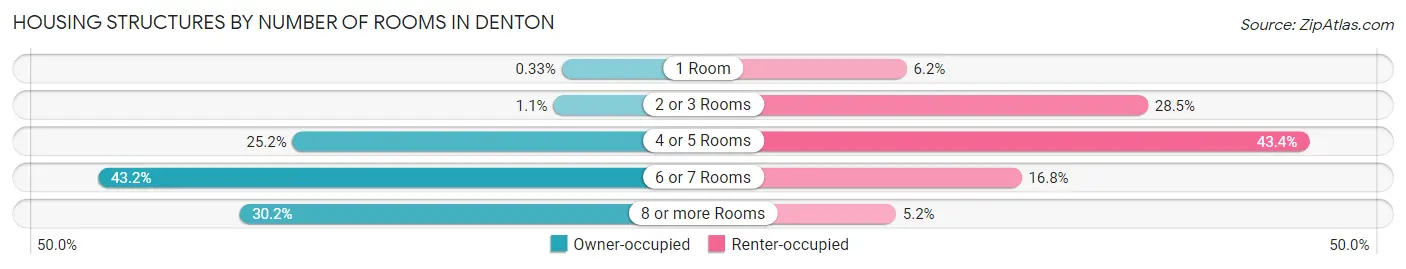
| Number of Rooms | Owner-occupied | Renter-occupied |
| 1 Room | 86 (0.3%) | 1,632 (6.2%) |
| 2 or 3 Rooms | 280 (1.1%) | 7,532 (28.5%) |
| 4 or 5 Rooms | 6,507 (25.2%) | 11,473 (43.4%) |
| 6 or 7 Rooms | 11,147 (43.2%) | 4,440 (16.8%) |
| 8 or more Rooms | 7,778 (30.1%) | 1,368 (5.2%) |
| Total | 25,798 (100.0%) | 26,445 (100.0%) |
Housing Structure by Heating Type in Denton
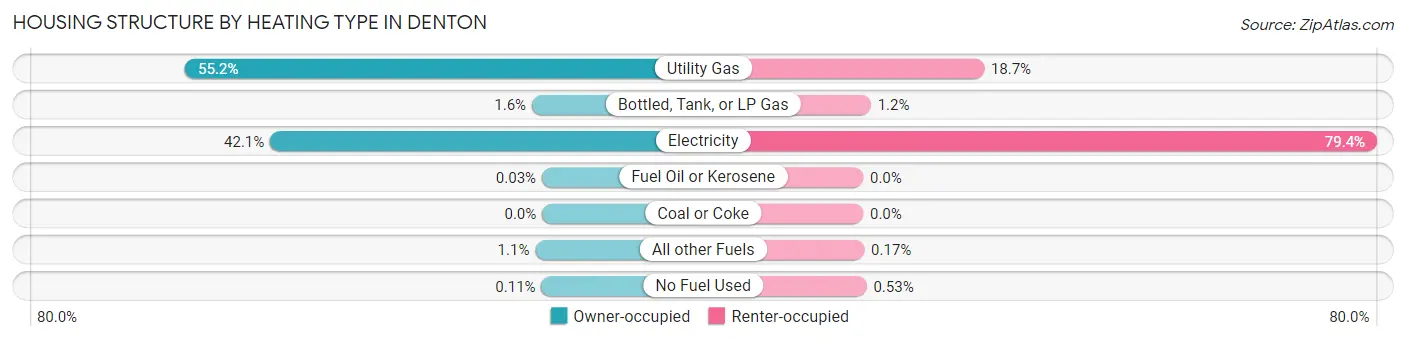
| Heating Type | Owner-occupied | Renter-occupied |
| Utility Gas | 14,236 (55.2%) | 4,943 (18.7%) |
| Bottled, Tank, or LP Gas | 405 (1.6%) | 314 (1.2%) |
| Electricity | 10,848 (42.0%) | 21,004 (79.4%) |
| Fuel Oil or Kerosene | 8 (0.0%) | 0 (0.0%) |
| Coal or Coke | 0 (0.0%) | 0 (0.0%) |
| All other Fuels | 273 (1.1%) | 44 (0.2%) |
| No Fuel Used | 28 (0.1%) | 140 (0.5%) |
| Total | 25,798 (100.0%) | 26,445 (100.0%) |
Household Vehicle Usage in Denton
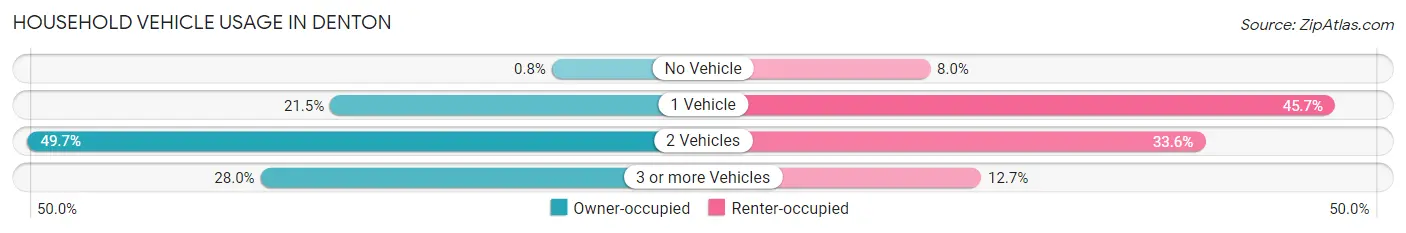
| Vehicles per Household | Owner-occupied | Renter-occupied |
| No Vehicle | 207 (0.8%) | 2,102 (8.0%) |
| 1 Vehicle | 5,543 (21.5%) | 12,094 (45.7%) |
| 2 Vehicles | 12,826 (49.7%) | 8,887 (33.6%) |
| 3 or more Vehicles | 7,222 (28.0%) | 3,362 (12.7%) |
| Total | 25,798 (100.0%) | 26,445 (100.0%) |
Real Estate & Mortgages in Denton
Real Estate and Mortgage Overview in Denton
| Characteristic | Without Mortgage | With Mortgage |
| Housing Units | 9,040 | 16,758 |
| Median Property Value | $261,700 | $311,600 |
| Median Household Income | $83,261 | $5,436 |
| Monthly Housing Costs | $797 | $1,996 |
| Real Estate Taxes | $3,957 | $411 |
Property Value by Mortgage Status in Denton
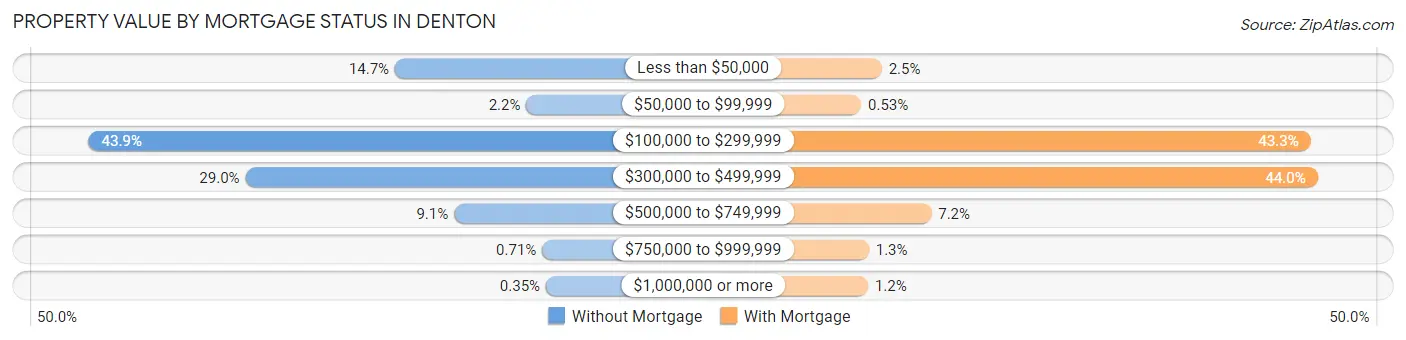
| Property Value | Without Mortgage | With Mortgage |
| Less than $50,000 | 1,332 (14.7%) | 417 (2.5%) |
| $50,000 to $99,999 | 201 (2.2%) | 89 (0.5%) |
| $100,000 to $299,999 | 3,969 (43.9%) | 7,262 (43.3%) |
| $300,000 to $499,999 | 2,619 (29.0%) | 7,374 (44.0%) |
| $500,000 to $749,999 | 823 (9.1%) | 1,208 (7.2%) |
| $750,000 to $999,999 | 64 (0.7%) | 211 (1.3%) |
| $1,000,000 or more | 32 (0.4%) | 197 (1.2%) |
| Total | 9,040 (100.0%) | 16,758 (100.0%) |
Household Income by Mortgage Status in Denton
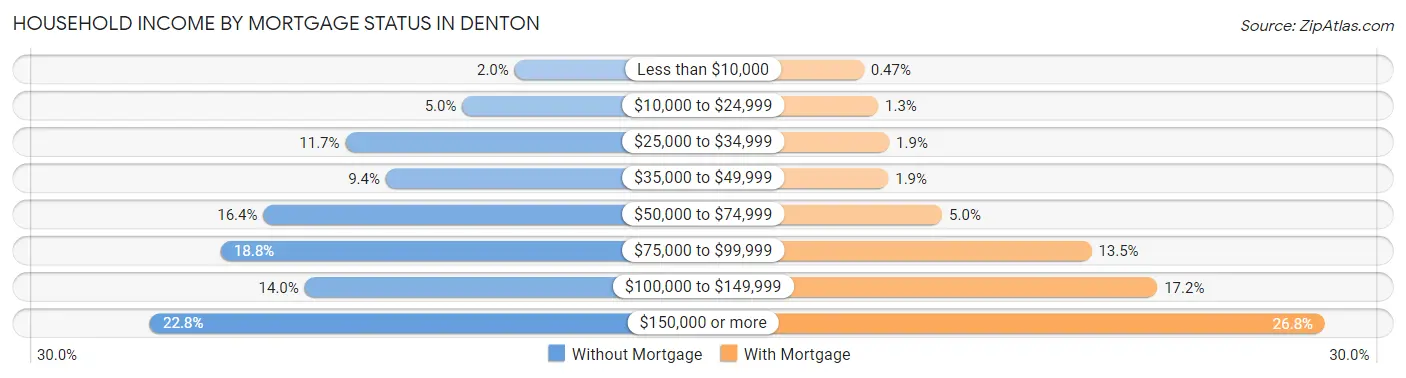
| Household Income | Without Mortgage | With Mortgage |
| Less than $10,000 | 181 (2.0%) | 78 (0.5%) |
| $10,000 to $24,999 | 451 (5.0%) | 216 (1.3%) |
| $25,000 to $34,999 | 1,055 (11.7%) | 322 (1.9%) |
| $35,000 to $49,999 | 846 (9.4%) | 313 (1.9%) |
| $50,000 to $74,999 | 1,479 (16.4%) | 829 (5.0%) |
| $75,000 to $99,999 | 1,698 (18.8%) | 2,259 (13.5%) |
| $100,000 to $149,999 | 1,266 (14.0%) | 2,889 (17.2%) |
| $150,000 or more | 2,064 (22.8%) | 4,494 (26.8%) |
| Total | 9,040 (100.0%) | 16,758 (100.0%) |
Property Value to Household Income Ratio in Denton
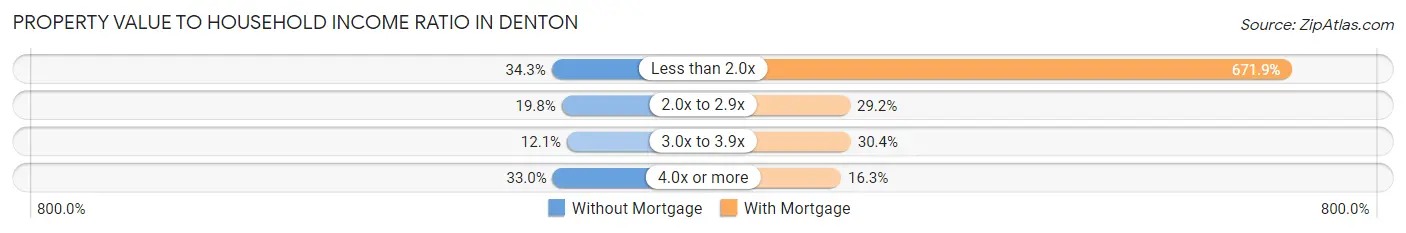
| Value-to-Income Ratio | Without Mortgage | With Mortgage |
| Less than 2.0x | 3,101 (34.3%) | 112,602 (671.9%) |
| 2.0x to 2.9x | 1,791 (19.8%) | 4,897 (29.2%) |
| 3.0x to 3.9x | 1,093 (12.1%) | 5,087 (30.4%) |
| 4.0x or more | 2,981 (33.0%) | 2,724 (16.3%) |
| Total | 9,040 (100.0%) | 16,758 (100.0%) |
Real Estate Taxes by Mortgage Status in Denton
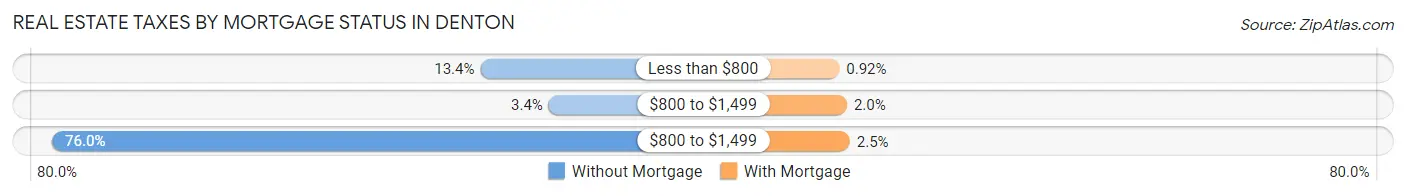
| Property Taxes | Without Mortgage | With Mortgage |
| Less than $800 | 1,212 (13.4%) | 155 (0.9%) |
| $800 to $1,499 | 309 (3.4%) | 342 (2.0%) |
| $800 to $1,499 | 6,868 (76.0%) | 411 (2.5%) |
| Total | 9,040 (100.0%) | 16,758 (100.0%) |
Health & Disability in Denton
Health Insurance Coverage by Age in Denton
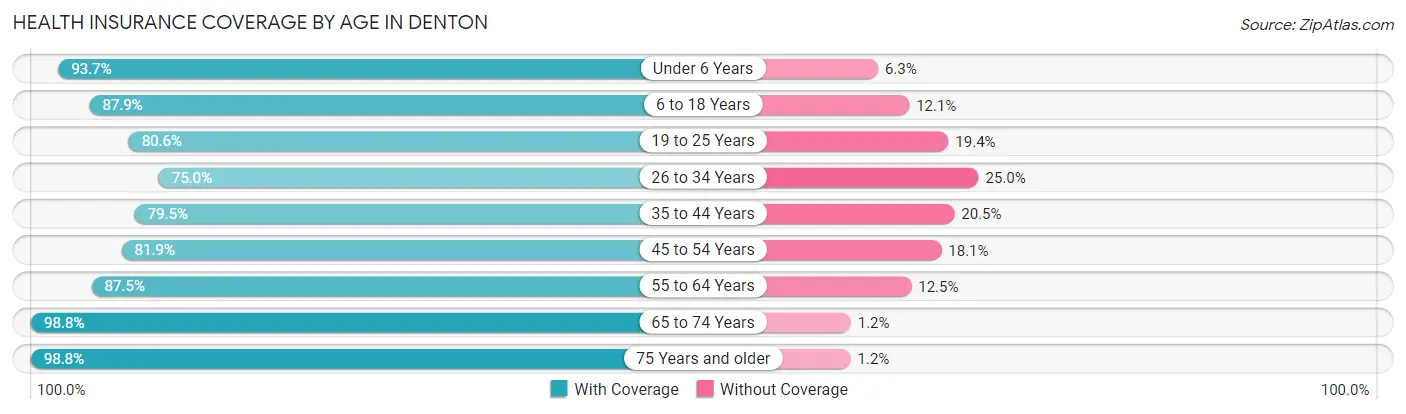
| Age Bracket | With Coverage | Without Coverage |
| Under 6 Years | 7,681 (93.7%) | 515 (6.3%) |
| 6 to 18 Years | 18,826 (87.9%) | 2,591 (12.1%) |
| 19 to 25 Years | 23,219 (80.6%) | 5,596 (19.4%) |
| 26 to 34 Years | 16,563 (75.0%) | 5,530 (25.0%) |
| 35 to 44 Years | 12,378 (79.5%) | 3,198 (20.5%) |
| 45 to 54 Years | 11,676 (81.9%) | 2,580 (18.1%) |
| 55 to 64 Years | 11,570 (87.5%) | 1,652 (12.5%) |
| 65 to 74 Years | 9,679 (98.8%) | 119 (1.2%) |
| 75 Years and older | 7,021 (98.8%) | 84 (1.2%) |
| Total | 118,613 (84.4%) | 21,865 (15.6%) |
Health Insurance Coverage by Citizenship Status in Denton
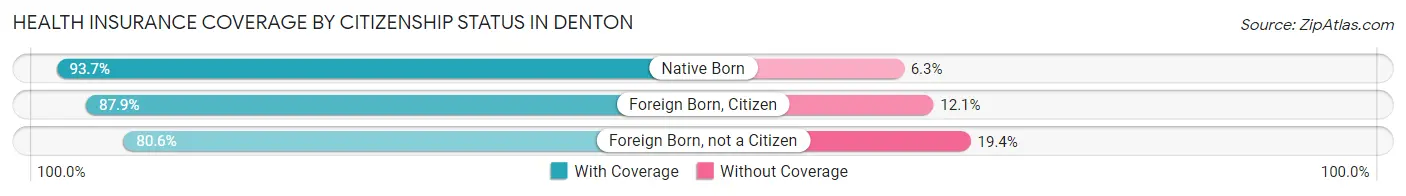
| Citizenship Status | With Coverage | Without Coverage |
| Native Born | 7,681 (93.7%) | 515 (6.3%) |
| Foreign Born, Citizen | 18,826 (87.9%) | 2,591 (12.1%) |
| Foreign Born, not a Citizen | 23,219 (80.6%) | 5,596 (19.4%) |
Health Insurance Coverage by Household Income in Denton
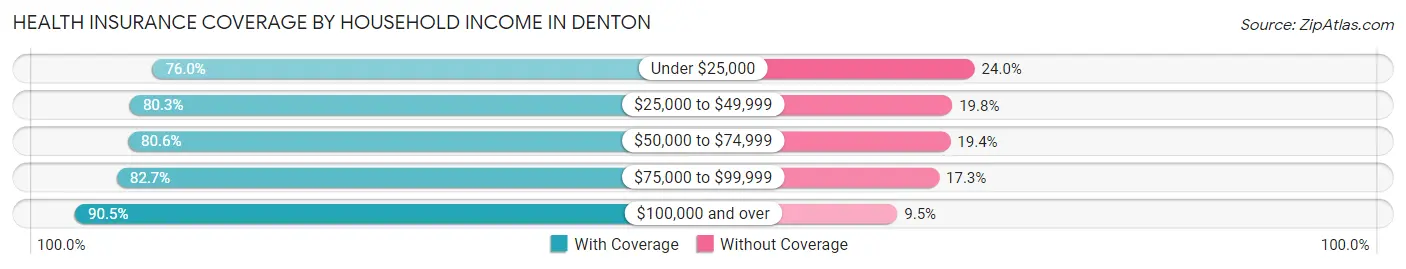
| Household Income | With Coverage | Without Coverage |
| Under $25,000 | 11,622 (76.0%) | 3,662 (24.0%) |
| $25,000 to $49,999 | 17,534 (80.2%) | 4,315 (19.8%) |
| $50,000 to $74,999 | 16,425 (80.6%) | 3,957 (19.4%) |
| $75,000 to $99,999 | 17,828 (82.7%) | 3,728 (17.3%) |
| $100,000 and over | 48,678 (90.5%) | 5,090 (9.5%) |
Public vs Private Health Insurance Coverage by Age in Denton
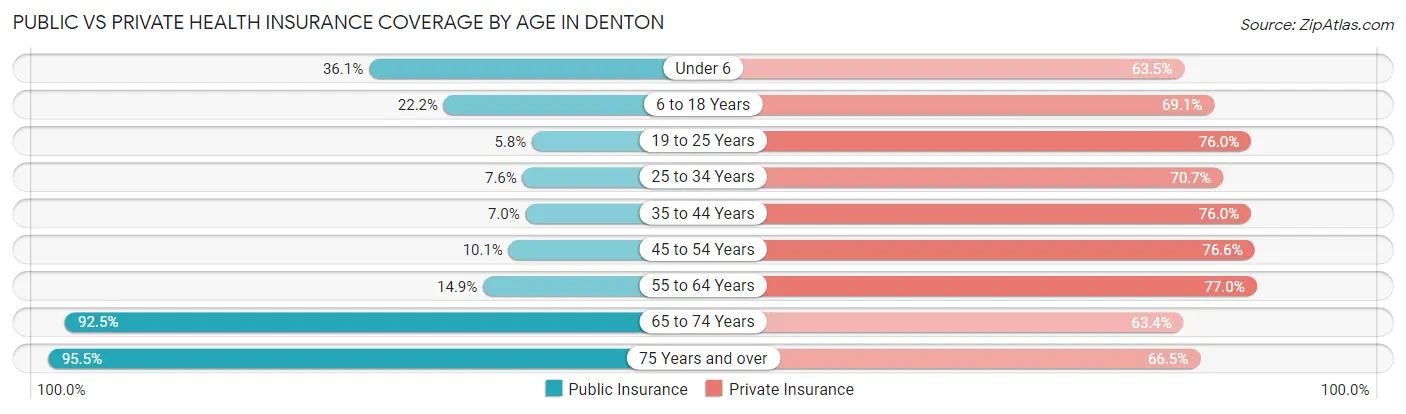
| Age Bracket | Public Insurance | Private Insurance |
| Under 6 | 2,957 (36.1%) | 5,207 (63.5%) |
| 6 to 18 Years | 4,750 (22.2%) | 14,794 (69.1%) |
| 19 to 25 Years | 1,672 (5.8%) | 21,889 (76.0%) |
| 25 to 34 Years | 1,670 (7.6%) | 15,614 (70.7%) |
| 35 to 44 Years | 1,092 (7.0%) | 11,833 (76.0%) |
| 45 to 54 Years | 1,446 (10.1%) | 10,921 (76.6%) |
| 55 to 64 Years | 1,969 (14.9%) | 10,178 (77.0%) |
| 65 to 74 Years | 9,060 (92.5%) | 6,216 (63.4%) |
| 75 Years and over | 6,786 (95.5%) | 4,725 (66.5%) |
| Total | 31,402 (22.4%) | 101,377 (72.2%) |
Disability Status by Sex by Age in Denton

| Age Bracket | Male | Female |
| Under 5 Years | 0 (0.0%) | 36 (1.2%) |
| 5 to 17 Years | 635 (6.7%) | 869 (8.9%) |
| 18 to 34 Years | 1,627 (6.0%) | 3,013 (11.1%) |
| 35 to 64 Years | 2,807 (13.4%) | 2,545 (11.5%) |
| 65 to 74 Years | 1,107 (24.5%) | 1,236 (23.4%) |
| 75 Years and over | 1,425 (45.1%) | 1,641 (41.6%) |
Disability Class by Sex by Age in Denton
Disability Class: Hearing Difficulty
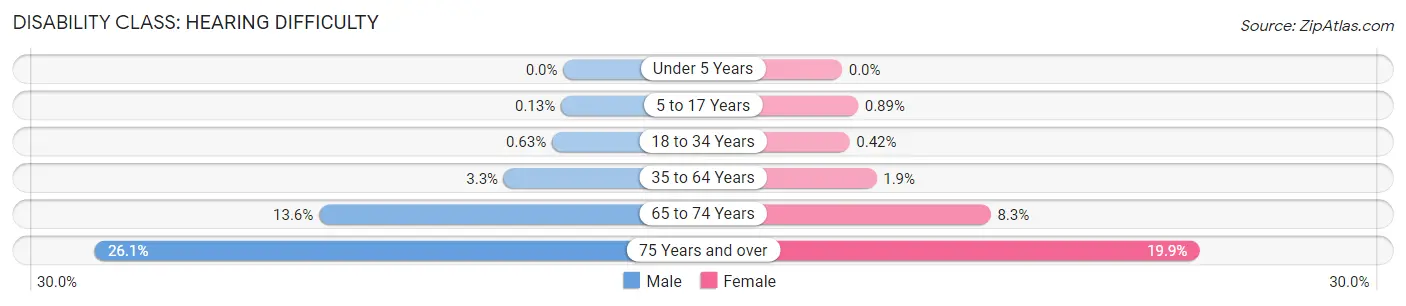
| Age Bracket | Male | Female |
| Under 5 Years | 0 (0.0%) | 0 (0.0%) |
| 5 to 17 Years | 12 (0.1%) | 87 (0.9%) |
| 18 to 34 Years | 170 (0.6%) | 115 (0.4%) |
| 35 to 64 Years | 693 (3.3%) | 424 (1.9%) |
| 65 to 74 Years | 615 (13.6%) | 437 (8.3%) |
| 75 Years and over | 824 (26.1%) | 785 (19.9%) |
Disability Class: Vision Difficulty
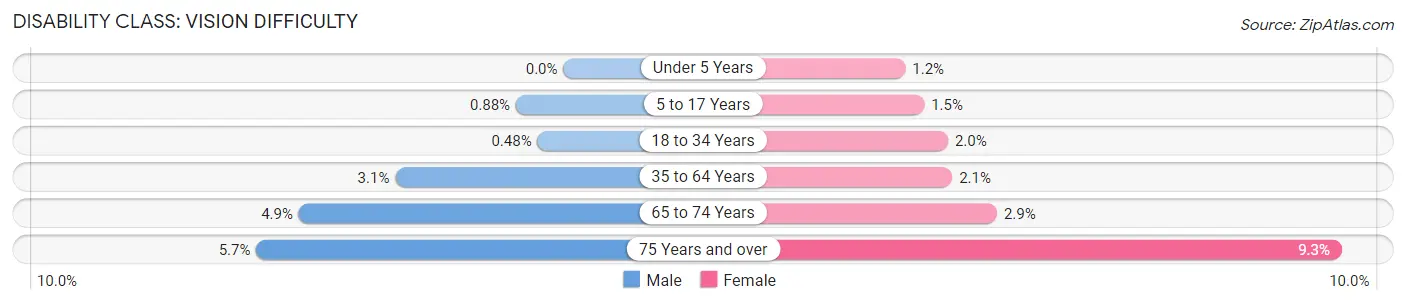
| Age Bracket | Male | Female |
| Under 5 Years | 0 (0.0%) | 36 (1.2%) |
| 5 to 17 Years | 83 (0.9%) | 150 (1.5%) |
| 18 to 34 Years | 130 (0.5%) | 536 (2.0%) |
| 35 to 64 Years | 653 (3.1%) | 452 (2.1%) |
| 65 to 74 Years | 222 (4.9%) | 152 (2.9%) |
| 75 Years and over | 180 (5.7%) | 366 (9.3%) |
Disability Class: Cognitive Difficulty
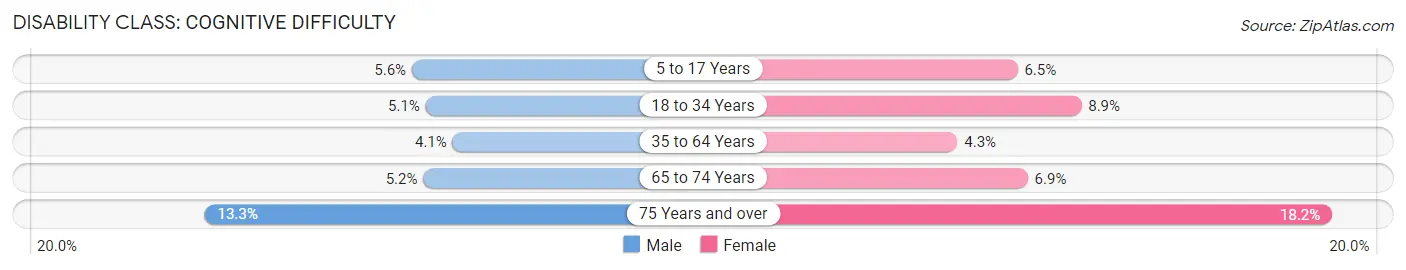
| Age Bracket | Male | Female |
| 5 to 17 Years | 531 (5.6%) | 637 (6.5%) |
| 18 to 34 Years | 1,386 (5.1%) | 2,424 (8.9%) |
| 35 to 64 Years | 862 (4.1%) | 948 (4.3%) |
| 65 to 74 Years | 235 (5.2%) | 364 (6.9%) |
| 75 Years and over | 421 (13.3%) | 718 (18.2%) |
Disability Class: Ambulatory Difficulty
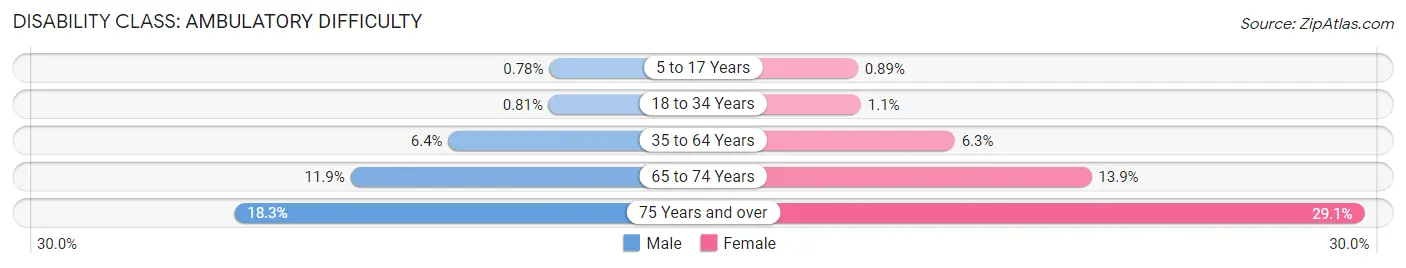
| Age Bracket | Male | Female |
| 5 to 17 Years | 74 (0.8%) | 87 (0.9%) |
| 18 to 34 Years | 219 (0.8%) | 289 (1.1%) |
| 35 to 64 Years | 1,342 (6.4%) | 1,390 (6.3%) |
| 65 to 74 Years | 536 (11.8%) | 733 (13.9%) |
| 75 Years and over | 579 (18.3%) | 1,148 (29.1%) |
Disability Class: Self-Care Difficulty
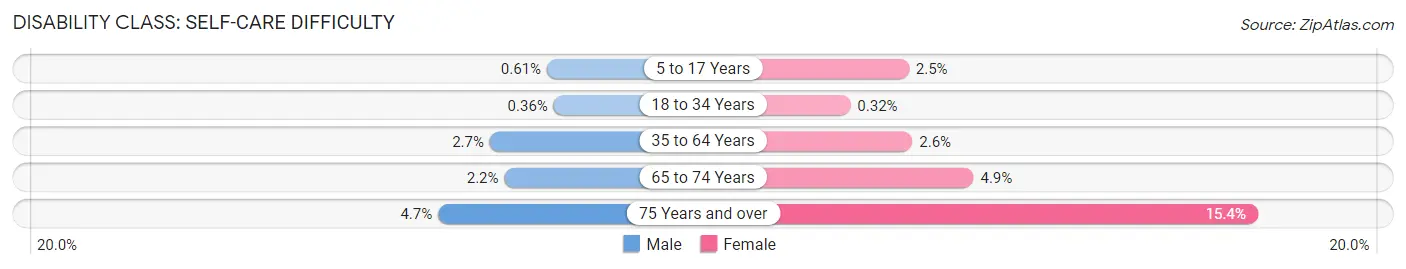
| Age Bracket | Male | Female |
| 5 to 17 Years | 58 (0.6%) | 243 (2.5%) |
| 18 to 34 Years | 97 (0.4%) | 86 (0.3%) |
| 35 to 64 Years | 572 (2.7%) | 578 (2.6%) |
| 65 to 74 Years | 99 (2.2%) | 258 (4.9%) |
| 75 Years and over | 147 (4.6%) | 609 (15.4%) |
Technology Access in Denton
Computing Device Access in Denton
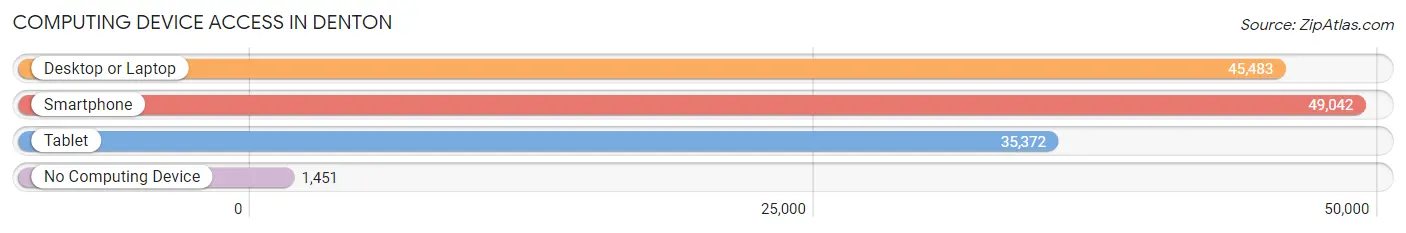
| Device Type | # Households | % Households |
| Desktop or Laptop | 45,483 | 87.1% |
| Smartphone | 49,042 | 93.9% |
| Tablet | 35,372 | 67.7% |
| No Computing Device | 1,451 | 2.8% |
| Total | 52,243 | 100.0% |
Internet Access in Denton
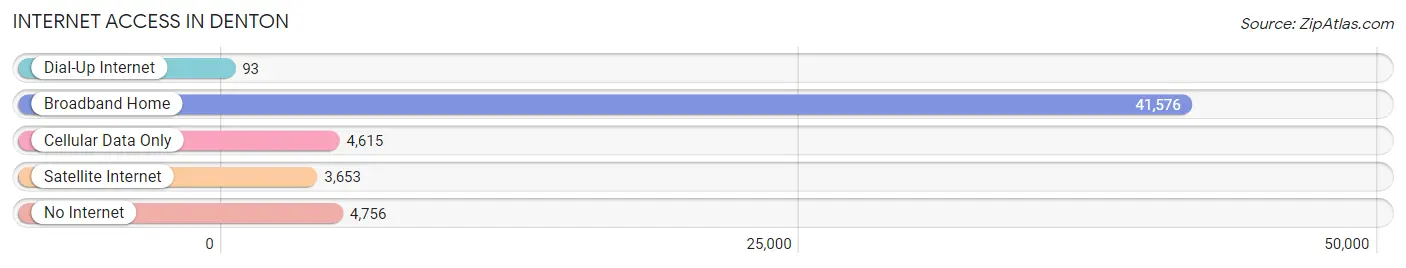
| Internet Type | # Households | % Households |
| Dial-Up Internet | 93 | 0.2% |
| Broadband Home | 41,576 | 79.6% |
| Cellular Data Only | 4,615 | 8.8% |
| Satellite Internet | 3,653 | 7.0% |
| No Internet | 4,756 | 9.1% |
| Total | 52,243 | 100.0% |
Denton Summary
Denton, Texas is a city located in the northern part of the state, about 40 miles north of Dallas and Fort Worth. It is the county seat of Denton County and is part of the Dallas-Fort Worth-Arlington metropolitan area. The city has a population of approximately 136,000 people, making it the 27th most populous city in Texas.
History
The area that is now Denton was first settled in the 1840s by settlers from the Peters Colony. The city was officially founded in 1857 and was named after John B. Denton, a soldier who died in the Battle of the Alamo. The city was incorporated in 1866 and quickly became an important trading center for the surrounding area.
In the late 19th century, Denton was a major stop on the Texas and Pacific Railway, which connected the city to Dallas and Fort Worth. This allowed the city to become a major hub for the cotton industry, as well as other agricultural products.
In the early 20th century, Denton began to experience rapid growth due to the expansion of the University of North Texas and Texas Woman's University. The city also became a major center for the oil and gas industry, as well as manufacturing.
Geography
Denton is located in the northern part of Texas, about 40 miles north of Dallas and Fort Worth. It is situated in the Blackland Prairie region of the state, which is characterized by flat terrain and fertile soil. The city is located on the Elm Fork of the Trinity River, which provides a source of water for the city.
The climate in Denton is classified as humid subtropical, with hot summers and mild winters. The average annual temperature is around 68 degrees Fahrenheit, with an average high of around 90 degrees in the summer and an average low of around 40 degrees in the winter.
Economy
Denton's economy is largely based on education, healthcare, and manufacturing. The city is home to the University of North Texas, Texas Woman's University, and North Central Texas College, which provide a large number of jobs in the area. The city is also home to several major healthcare providers, including Denton Regional Medical Center and Texas Health Presbyterian Hospital.
The city is also home to several major manufacturing companies, including Peterbilt Motors, which produces trucks and other vehicles, and Raytheon, which produces defense and aerospace products. The city is also home to several major retail stores, including Walmart, Target, and Best Buy.
Demographics
As of the 2020 census, the population of Denton was 136,000, making it the 27th most populous city in Texas. The population is fairly diverse, with the largest racial/ethnic groups being White (63.2%), Hispanic or Latino (20.2%), and African American (11.3%).
The median household income in Denton is $54,000, and the median home value is $182,000. The city has a poverty rate of 13.3%, which is slightly higher than the national average. The city also has a high rate of educational attainment, with over 90% of adults having at least a high school diploma.
Common Questions
What is Per Capita Income in Denton?
Per Capita income in Denton is $35,628.
What is the Median Family Income in Denton?
Median Family Income in Denton is $95,687.
What is the Median Household income in Denton?
Median Household Income in Denton is $71,921.
What is Income or Wage Gap in Denton?
Income or Wage Gap in Denton is 27.1%.
Women in Denton earn 72.9 cents for every dollar earned by a man.
What is Family Income Deficit in Denton?
Family Income Deficit in Denton is $11,056.
Families that are below poverty line in Denton earn $11,056 less on average than the poverty threshold level.
What is Inequality or Gini Index in Denton?
Inequality or Gini Index in Denton is 0.45.
What is the Total Population of Denton?
Total Population of Denton is 142,262.
What is the Total Male Population of Denton?
Total Male Population of Denton is 70,206.
What is the Total Female Population of Denton?
Total Female Population of Denton is 72,056.
What is the Ratio of Males per 100 Females in Denton?
There are 97.43 Males per 100 Females in Denton.
What is the Ratio of Females per 100 Males in Denton?
There are 102.64 Females per 100 Males in Denton.
What is the Median Population Age in Denton?
Median Population Age in Denton is 30.4 Years.
What is the Average Family Size in Denton
Average Family Size in Denton is 3.1 People.
What is the Average Household Size in Denton
Average Household Size in Denton is 2.5 People.
How Large is the Labor Force in Denton?
There are 81,241 People in the Labor Forcein in Denton.
What is the Percentage of People in the Labor Force in Denton?
67.8% of People are in the Labor Force in Denton.
What is the Unemployment Rate in Denton?
Unemployment Rate in Denton is 4.8%.