Harris County, TX Map & Demographics
Harris County Map
Harris County Overview
$38,184
PER CAPITA INCOME
$82,895
AVG FAMILY INCOME
$70,789
AVG HOUSEHOLD INCOME
27.3%
WAGE / INCOME GAP [ % ]
72.7¢/ $1
WAGE / INCOME GAP [ $ ]
$11,691
FAMILY INCOME DEFICIT
0.50
INEQUALITY / GINI INDEX
4,726,177
TOTAL POPULATION
2,359,415
MALE POPULATION
2,366,762
FEMALE POPULATION
99.69
MALES / 100 FEMALES
100.31
FEMALES / 100 MALES
34.1
MEDIAN AGE
3.4
AVG FAMILY SIZE
2.8
AVG HOUSEHOLD SIZE
2,444,649
LABOR FORCE [ PEOPLE ]
67.4%
PERCENT IN LABOR FORCE
6.4%
UNEMPLOYMENT RATE
Income in Harris County
Income Overview in Harris County
Per Capita Income in Harris County is $38,184, while median incomes of families and households are $82,895 and $70,789 respectively.
| Characteristic | Number | Measure |
| Per Capita Income | 4,726,177 | $38,184 |
| Median Family Income | 1,139,193 | $82,895 |
| Mean Family Income | 1,139,193 | $119,139 |
| Median Household Income | 1,692,896 | $70,789 |
| Mean Household Income | 1,692,896 | $104,780 |
| Income Deficit | 1,139,193 | $11,691 |
| Wage / Income Gap (%) | 4,726,177 | 27.34% |
| Wage / Income Gap ($) | 4,726,177 | 72.66¢ per $1 |
| Gini / Inequality Index | 4,726,177 | 0.50 |
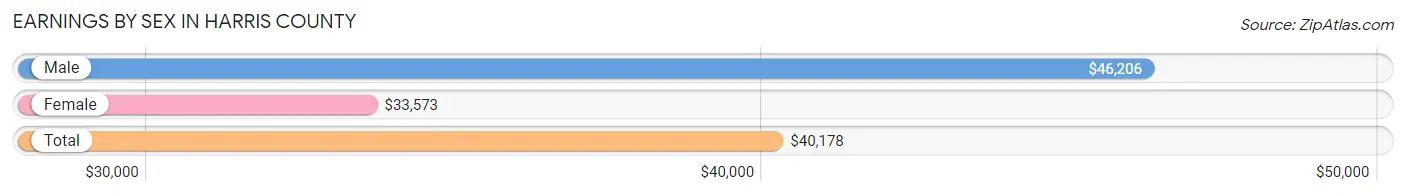
Earnings by Sex in Harris County
Average Earnings in Harris County are $40,178, $46,206 for men and $33,573 for women, a difference of 27.3%.
| Sex | Number | Average Earnings |
| Male | 1,372,723 (55.0%) | $46,206 |
| Female | 1,122,333 (45.0%) | $33,573 |
| Total | 2,495,056 (100.0%) | $40,178 |
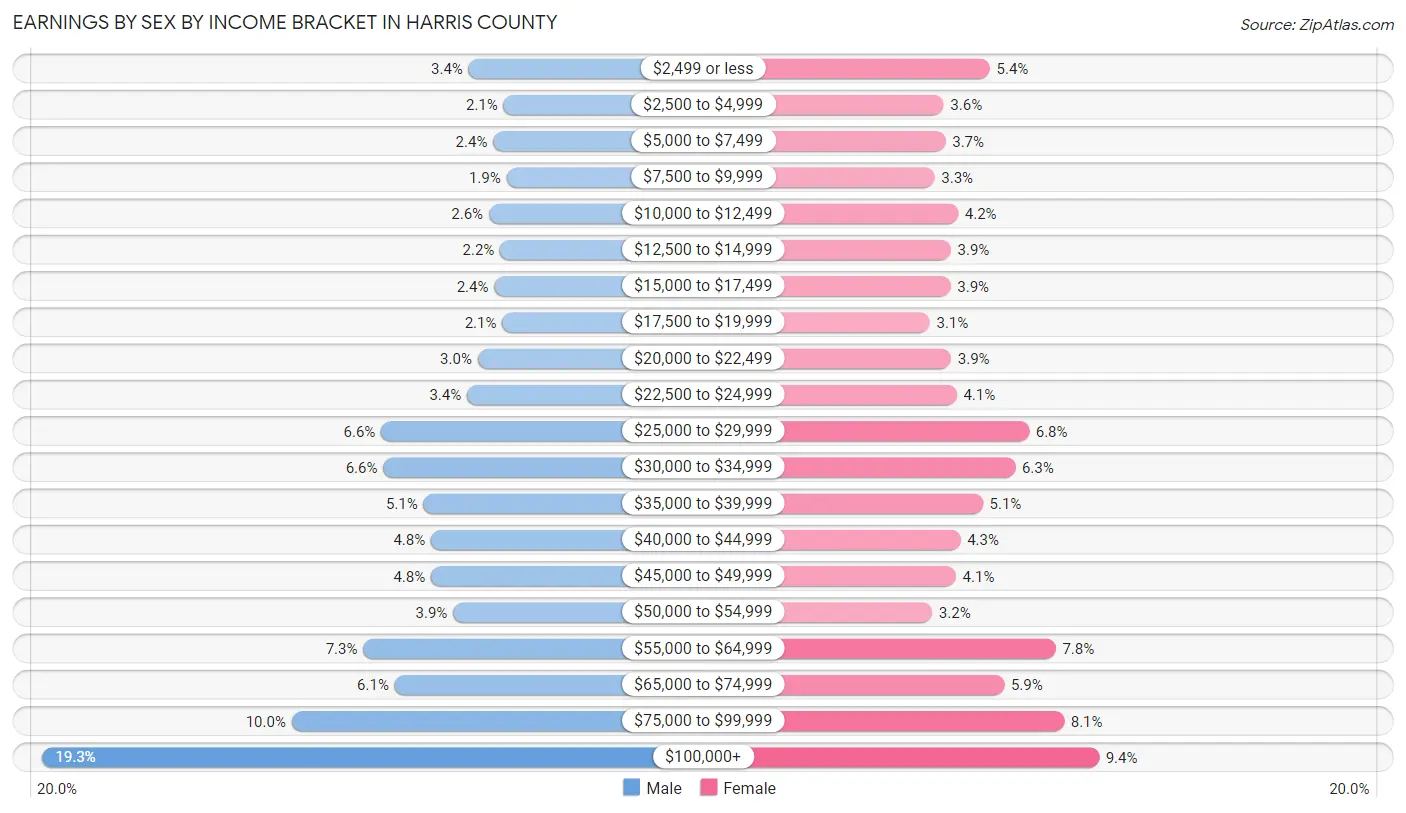
Earnings by Sex by Income Bracket in Harris County
The most common earnings brackets in Harris County are $100,000+ for men (265,394 | 19.3%) and $100,000+ for women (105,932 | 9.4%).
| Income | Male | Female |
| $2,499 or less | 46,148 (3.4%) | 60,005 (5.3%) |
| $2,500 to $4,999 | 28,126 (2.1%) | 40,627 (3.6%) |
| $5,000 to $7,499 | 33,471 (2.4%) | 41,442 (3.7%) |
| $7,500 to $9,999 | 26,691 (1.9%) | 36,844 (3.3%) |
| $10,000 to $12,499 | 35,721 (2.6%) | 46,733 (4.2%) |
| $12,500 to $14,999 | 29,890 (2.2%) | 43,707 (3.9%) |
| $15,000 to $17,499 | 32,911 (2.4%) | 43,505 (3.9%) |
| $17,500 to $19,999 | 28,838 (2.1%) | 34,790 (3.1%) |
| $20,000 to $22,499 | 41,431 (3.0%) | 43,753 (3.9%) |
| $22,500 to $24,999 | 46,961 (3.4%) | 46,072 (4.1%) |
| $25,000 to $29,999 | 91,098 (6.6%) | 76,550 (6.8%) |
| $30,000 to $34,999 | 90,077 (6.6%) | 70,716 (6.3%) |
| $35,000 to $39,999 | 69,342 (5.1%) | 57,166 (5.1%) |
| $40,000 to $44,999 | 65,529 (4.8%) | 47,720 (4.3%) |
| $45,000 to $49,999 | 65,463 (4.8%) | 45,819 (4.1%) |
| $50,000 to $54,999 | 54,022 (3.9%) | 35,764 (3.2%) |
| $55,000 to $64,999 | 100,351 (7.3%) | 87,808 (7.8%) |
| $65,000 to $74,999 | 84,145 (6.1%) | 66,120 (5.9%) |
| $75,000 to $99,999 | 137,114 (10.0%) | 91,260 (8.1%) |
| $100,000+ | 265,394 (19.3%) | 105,932 (9.4%) |
| Total | 1,372,723 (100.0%) | 1,122,333 (100.0%) |
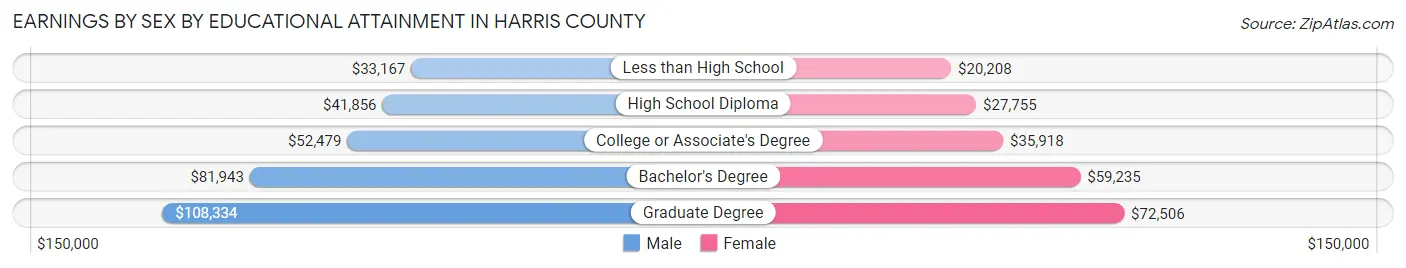
Earnings by Sex by Educational Attainment in Harris County
Average earnings in Harris County are $52,727 for men and $38,679 for women, a difference of 26.6%. Men with an educational attainment of graduate degree enjoy the highest average annual earnings of $108,334, while those with less than high school education earn the least with $33,167. Women with an educational attainment of graduate degree earn the most with the average annual earnings of $72,506, while those with less than high school education have the smallest earnings of $20,208.
| Educational Attainment | Male Income | Female Income |
| Less than High School | $33,167 | $20,208 |
| High School Diploma | $41,856 | $27,755 |
| College or Associate's Degree | $52,479 | $35,918 |
| Bachelor's Degree | $81,943 | $59,235 |
| Graduate Degree | $108,334 | $72,506 |
| Total | $52,727 | $38,679 |
Family Income in Harris County
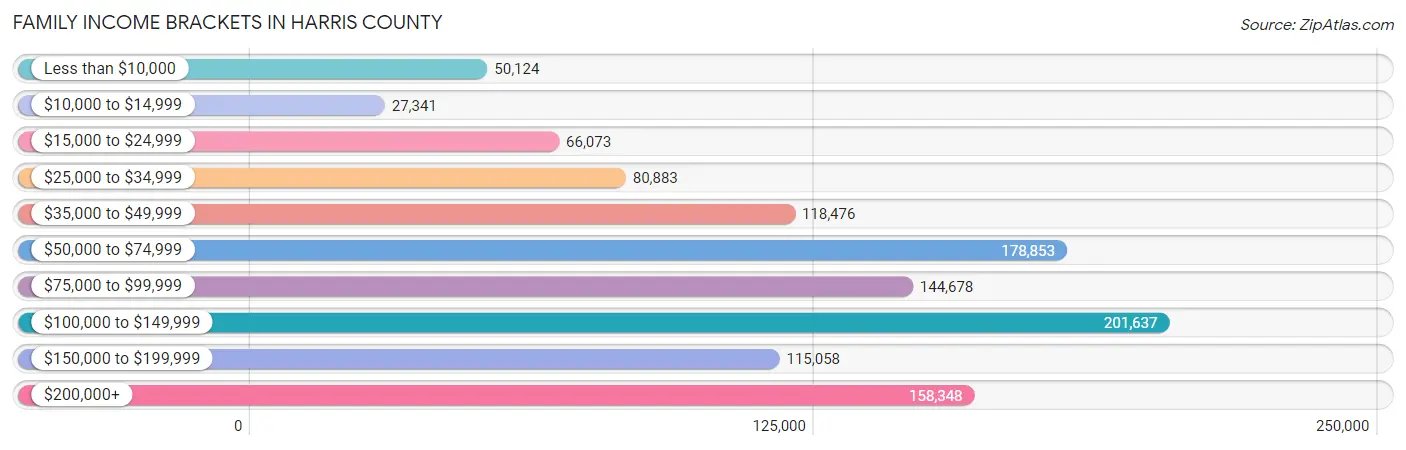
Family Income Brackets in Harris County
According to the Harris County family income data, there are 201,637 families falling into the $100,000 to $149,999 income range, which is the most common income bracket and makes up 17.7% of all families. Conversely, the $10,000 to $14,999 income bracket is the least frequent group with only 27,341 families (2.4%) belonging to this category.
| Income Bracket | # Families | % Families |
| Less than $10,000 | 50,124 | 4.4% |
| $10,000 to $14,999 | 27,341 | 2.4% |
| $15,000 to $24,999 | 66,073 | 5.8% |
| $25,000 to $34,999 | 80,883 | 7.1% |
| $35,000 to $49,999 | 118,476 | 10.4% |
| $50,000 to $74,999 | 178,853 | 15.7% |
| $75,000 to $99,999 | 144,678 | 12.7% |
| $100,000 to $149,999 | 201,637 | 17.7% |
| $150,000 to $199,999 | 115,058 | 10.1% |
| $200,000+ | 158,348 | 13.9% |
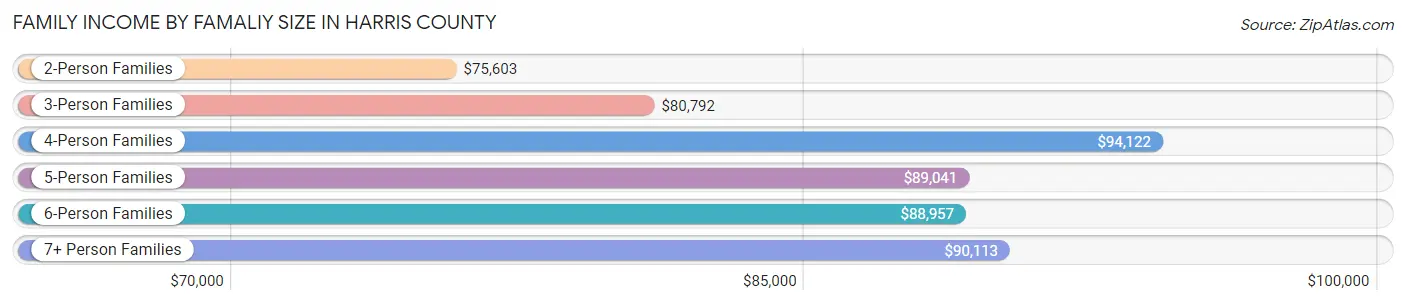
Family Income by Famaliy Size in Harris County
4-person families (232,103 | 20.4%) account for the highest median family income in Harris County with $94,122 per family, while 2-person families (436,255 | 38.3%) have the highest median income of $37,802 per family member.
| Income Bracket | # Families | Median Income |
| 2-Person Families | 436,255 (38.3%) | $75,603 |
| 3-Person Families | 273,959 (24.0%) | $80,792 |
| 4-Person Families | 232,103 (20.4%) | $94,122 |
| 5-Person Families | 122,300 (10.7%) | $89,041 |
| 6-Person Families | 46,819 (4.1%) | $88,957 |
| 7+ Person Families | 27,757 (2.4%) | $90,113 |
| Total | 1,139,193 (100.0%) | $82,895 |
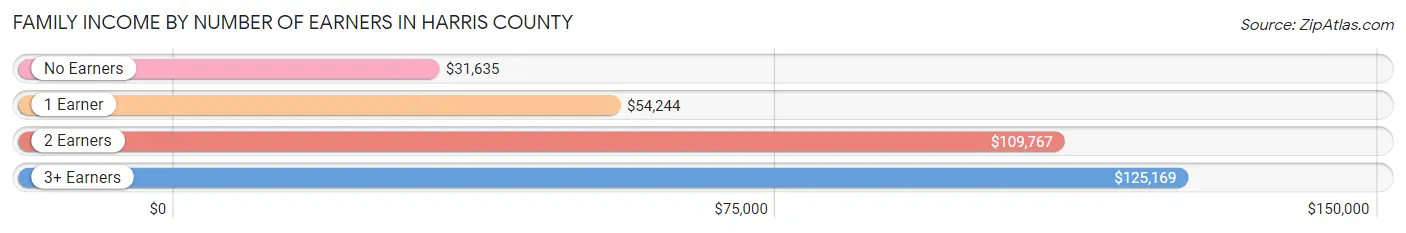
Family Income by Number of Earners in Harris County
The median family income in Harris County is $82,895, with families comprising 3+ earners (149,265) having the highest median family income of $125,169, while families with no earners (115,434) have the lowest median family income of $31,635, accounting for 13.1% and 10.1% of families, respectively.
| Number of Earners | # Families | Median Income |
| No Earners | 115,434 (10.1%) | $31,635 |
| 1 Earner | 407,269 (35.7%) | $54,244 |
| 2 Earners | 467,225 (41.0%) | $109,767 |
| 3+ Earners | 149,265 (13.1%) | $125,169 |
| Total | 1,139,193 (100.0%) | $82,895 |
Household Income in Harris County
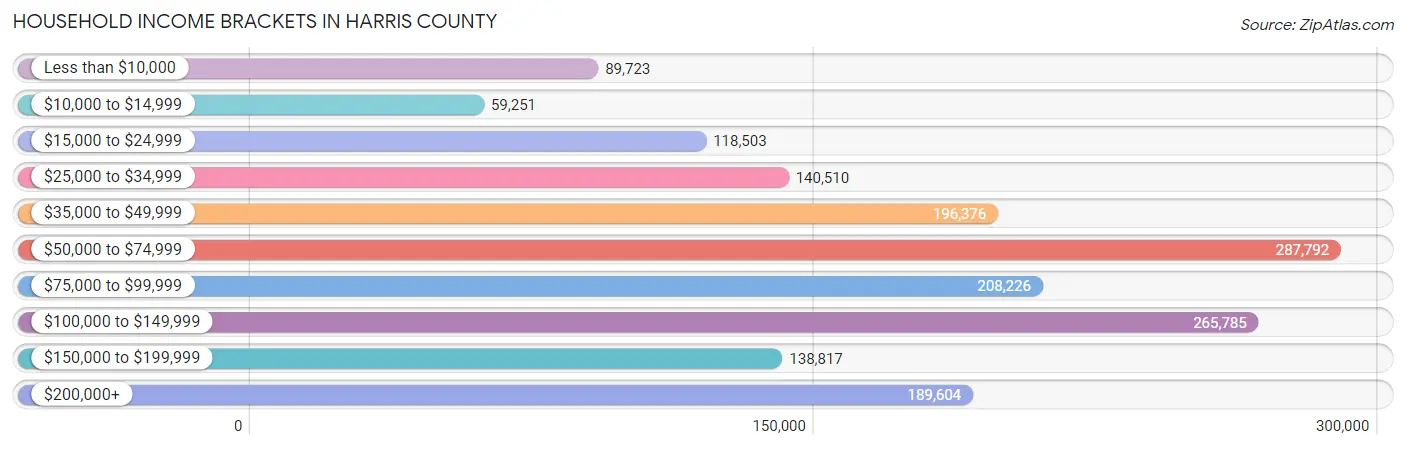
Household Income Brackets in Harris County
With 287,792 households falling in the category, the $50,000 to $74,999 income range is the most frequent in Harris County, accounting for 17.0% of all households. In contrast, only 59,251 households (3.5%) fall into the $10,000 to $14,999 income bracket, making it the least populous group.
| Income Bracket | # Households | % Households |
| Less than $10,000 | 89,723 | 5.3% |
| $10,000 to $14,999 | 59,251 | 3.5% |
| $15,000 to $24,999 | 118,503 | 7.0% |
| $25,000 to $34,999 | 140,510 | 8.3% |
| $35,000 to $49,999 | 196,376 | 11.6% |
| $50,000 to $74,999 | 287,792 | 17.0% |
| $75,000 to $99,999 | 208,226 | 12.3% |
| $100,000 to $149,999 | 265,785 | 15.7% |
| $150,000 to $199,999 | 138,817 | 8.2% |
| $200,000+ | 189,604 | 11.2% |
Household Income by Householder Age in Harris County
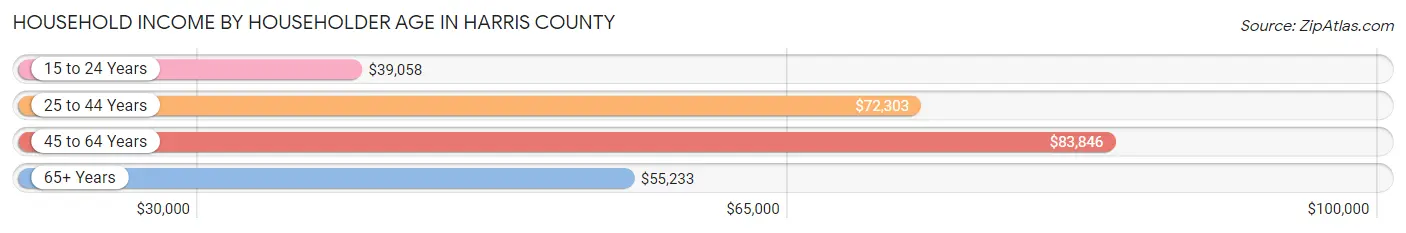
The median household income in Harris County is $70,789, with the highest median household income of $83,846 found in the 45 to 64 years age bracket for the primary householder. A total of 612,560 households (36.2%) fall into this category. Meanwhile, the 15 to 24 years age bracket for the primary householder has the lowest median household income of $39,058, with 77,169 households (4.6%) in this group.
| Income Bracket | # Households | Median Income |
| 15 to 24 Years | 77,169 (4.6%) | $39,058 |
| 25 to 44 Years | 688,941 (40.7%) | $72,303 |
| 45 to 64 Years | 612,560 (36.2%) | $83,846 |
| 65+ Years | 314,226 (18.6%) | $55,233 |
| Total | 1,692,896 (100.0%) | $70,789 |
Poverty in Harris County
Income Below Poverty by Sex and Age in Harris County
With 14.1% poverty level for males and 17.5% for females among the residents of Harris County, 5 year old males and under 5 year old females are the most vulnerable to poverty, with 10,066 males (28.3%) and 40,758 females (25.4%) in their respective age groups living below the poverty level.
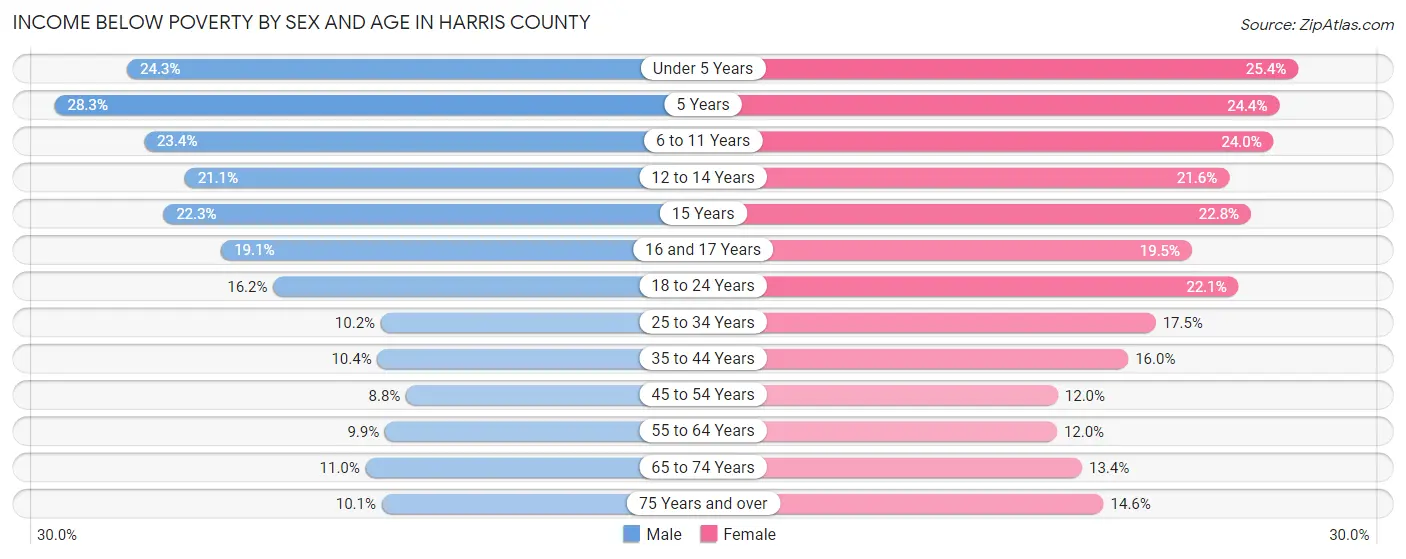
| Age Bracket | Male | Female |
| Under 5 Years | 40,616 (24.3%) | 40,758 (25.4%) |
| 5 Years | 10,066 (28.3%) | 8,007 (24.4%) |
| 6 to 11 Years | 49,626 (23.4%) | 48,519 (24.0%) |
| 12 to 14 Years | 21,880 (21.1%) | 22,320 (21.6%) |
| 15 Years | 7,987 (22.3%) | 7,332 (22.8%) |
| 16 and 17 Years | 13,366 (19.1%) | 13,458 (19.5%) |
| 18 to 24 Years | 36,257 (16.2%) | 47,747 (22.1%) |
| 25 to 34 Years | 37,332 (10.2%) | 63,537 (17.5%) |
| 35 to 44 Years | 35,674 (10.3%) | 53,307 (16.0%) |
| 45 to 54 Years | 25,634 (8.7%) | 35,154 (12.0%) |
| 55 to 64 Years | 24,586 (9.9%) | 30,540 (12.0%) |
| 65 to 74 Years | 16,825 (11.0%) | 23,184 (13.4%) |
| 75 Years and over | 7,786 (10.1%) | 16,183 (14.6%) |
| Total | 327,635 (14.1%) | 410,046 (17.5%) |
Income Above Poverty by Sex and Age in Harris County
According to the poverty statistics in Harris County, males aged 45 to 54 years and females aged 55 to 64 years are the age groups that are most secure financially, with 91.2% of males and 88.0% of females in these age groups living above the poverty line.
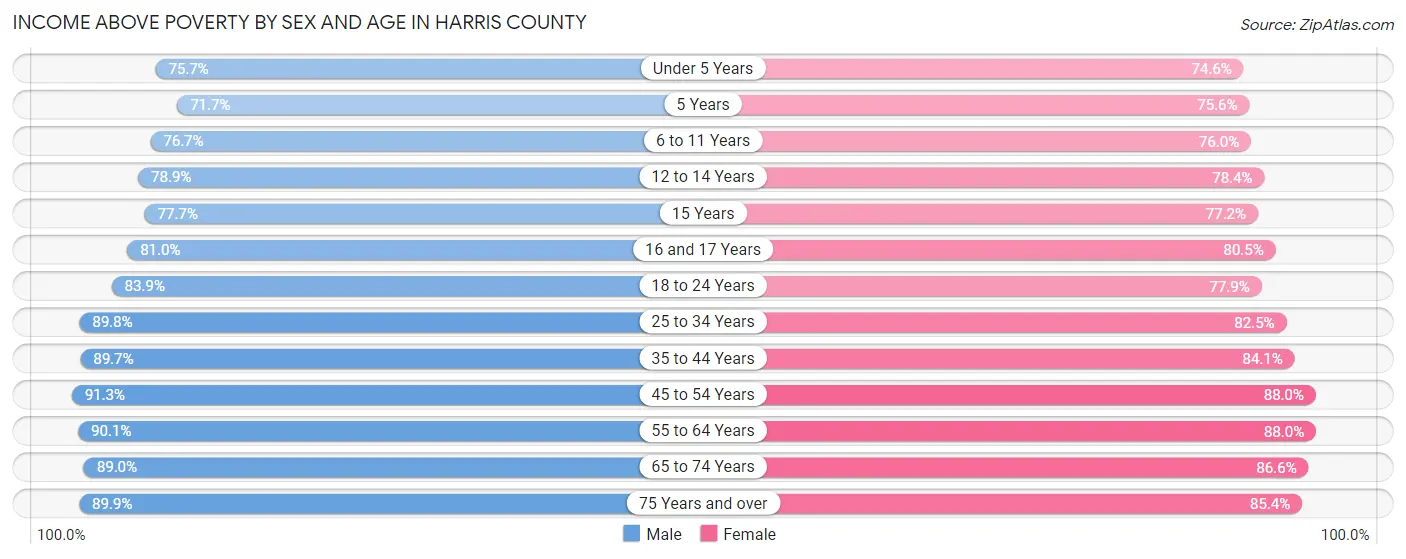
| Age Bracket | Male | Female |
| Under 5 Years | 126,614 (75.7%) | 119,626 (74.6%) |
| 5 Years | 25,469 (71.7%) | 24,869 (75.6%) |
| 6 to 11 Years | 162,920 (76.6%) | 153,345 (76.0%) |
| 12 to 14 Years | 81,917 (78.9%) | 81,214 (78.4%) |
| 15 Years | 27,863 (77.7%) | 24,849 (77.2%) |
| 16 and 17 Years | 56,796 (80.9%) | 55,594 (80.5%) |
| 18 to 24 Years | 188,235 (83.9%) | 168,417 (77.9%) |
| 25 to 34 Years | 330,023 (89.8%) | 299,967 (82.5%) |
| 35 to 44 Years | 308,883 (89.6%) | 280,988 (84.1%) |
| 45 to 54 Years | 267,222 (91.2%) | 257,082 (88.0%) |
| 55 to 64 Years | 223,055 (90.1%) | 224,296 (88.0%) |
| 65 to 74 Years | 135,951 (89.0%) | 150,150 (86.6%) |
| 75 Years and over | 69,194 (89.9%) | 94,836 (85.4%) |
| Total | 2,004,142 (86.0%) | 1,935,233 (82.5%) |
Income Below Poverty Among Married-Couple Families in Harris County
The poverty statistics for married-couple families in Harris County show that 7.1% or 54,938 of the total 774,203 families live below the poverty line. Families with 5 or more children have the highest poverty rate of 35.5%, comprising of 2,130 families. On the other hand, families with no children have the lowest poverty rate of 4.8%, which includes 18,715 families.
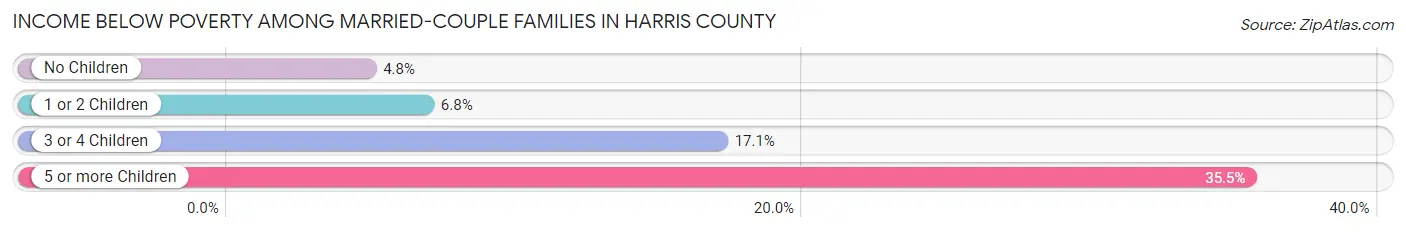
| Children | Above Poverty | Below Poverty |
| No Children | 370,046 (95.2%) | 18,715 (4.8%) |
| 1 or 2 Children | 278,655 (93.2%) | 20,385 (6.8%) |
| 3 or 4 Children | 66,692 (83.0%) | 13,708 (17.1%) |
| 5 or more Children | 3,872 (64.5%) | 2,130 (35.5%) |
| Total | 719,265 (92.9%) | 54,938 (7.1%) |
Income Below Poverty Among Single-Parent Households in Harris County
According to the poverty data in Harris County, 13.4% or 14,299 single-father households and 29.8% or 76,956 single-mother households are living below the poverty line. Among single-father households, those with 5 or more children have the highest poverty rate, with 634 households (66.6%) experiencing poverty. Likewise, among single-mother households, those with 5 or more children have the highest poverty rate, with 3,135 households (81.0%) falling below the poverty line.
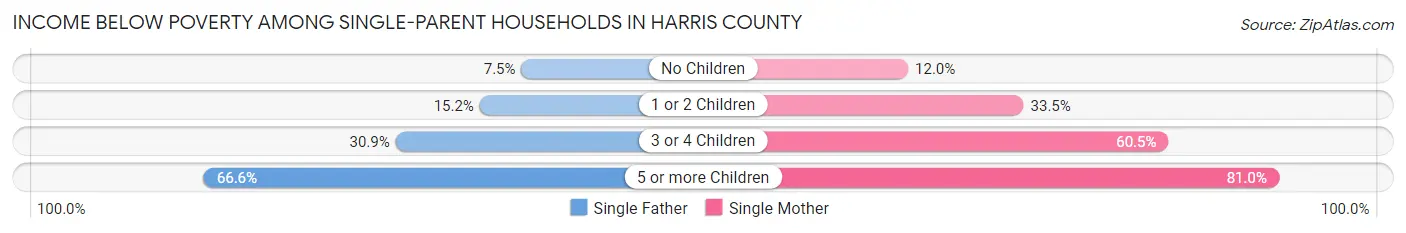
| Children | Single Father | Single Mother |
| No Children | 3,728 (7.5%) | 10,875 (12.0%) |
| 1 or 2 Children | 7,042 (15.2%) | 45,073 (33.5%) |
| 3 or 4 Children | 2,895 (30.9%) | 17,873 (60.5%) |
| 5 or more Children | 634 (66.6%) | 3,135 (81.0%) |
| Total | 14,299 (13.4%) | 76,956 (29.8%) |
Income Below Poverty Among Married-Couple vs Single-Parent Households in Harris County
The poverty data for Harris County shows that 54,938 of the married-couple family households (7.1%) and 91,255 of the single-parent households (25.0%) are living below the poverty level. Within the married-couple family households, those with 5 or more children have the highest poverty rate, with 2,130 households (35.5%) falling below the poverty line. Among the single-parent households, those with 5 or more children have the highest poverty rate, with 3,769 household (78.2%) living below poverty.
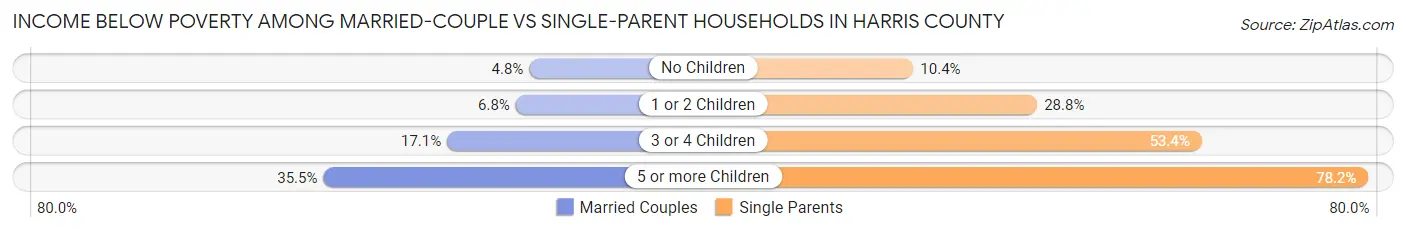
| Children | Married-Couple Families | Single-Parent Households |
| No Children | 18,715 (4.8%) | 14,603 (10.4%) |
| 1 or 2 Children | 20,385 (6.8%) | 52,115 (28.8%) |
| 3 or 4 Children | 13,708 (17.1%) | 20,768 (53.3%) |
| 5 or more Children | 2,130 (35.5%) | 3,769 (78.2%) |
| Total | 54,938 (7.1%) | 91,255 (25.0%) |
Race in Harris County
The most populous races in Harris County are White / Caucasian (2,175,176 | 46.0%), Hispanic or Latino (2,076,103 | 43.9%), and Black / African American (893,393 | 18.9%).
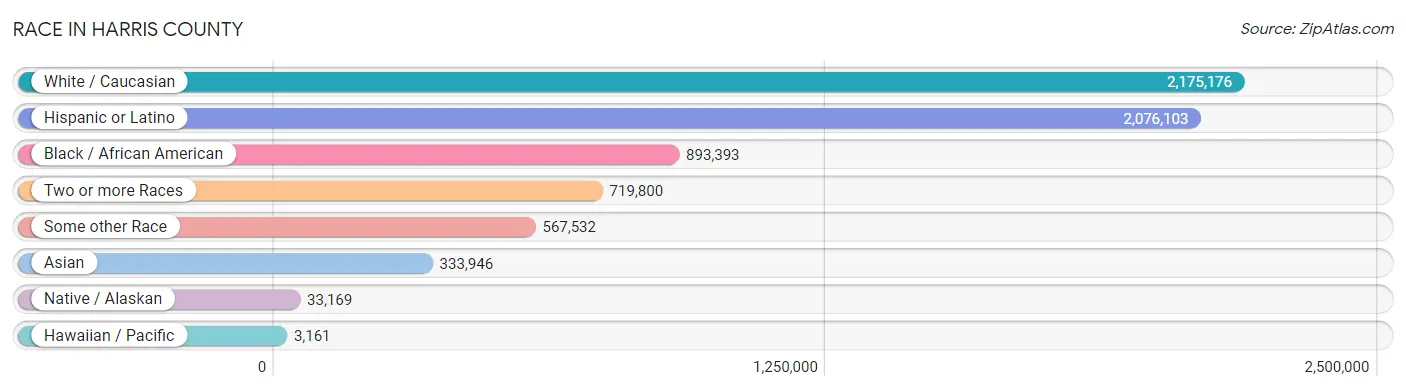
| Race | # Population | % Population |
| Asian | 333,946 | 7.1% |
| Black / African American | 893,393 | 18.9% |
| Hawaiian / Pacific | 3,161 | 0.1% |
| Hispanic or Latino | 2,076,103 | 43.9% |
| Native / Alaskan | 33,169 | 0.7% |
| White / Caucasian | 2,175,176 | 46.0% |
| Two or more Races | 719,800 | 15.2% |
| Some other Race | 567,532 | 12.0% |
| Total | 4,726,177 | 100.0% |
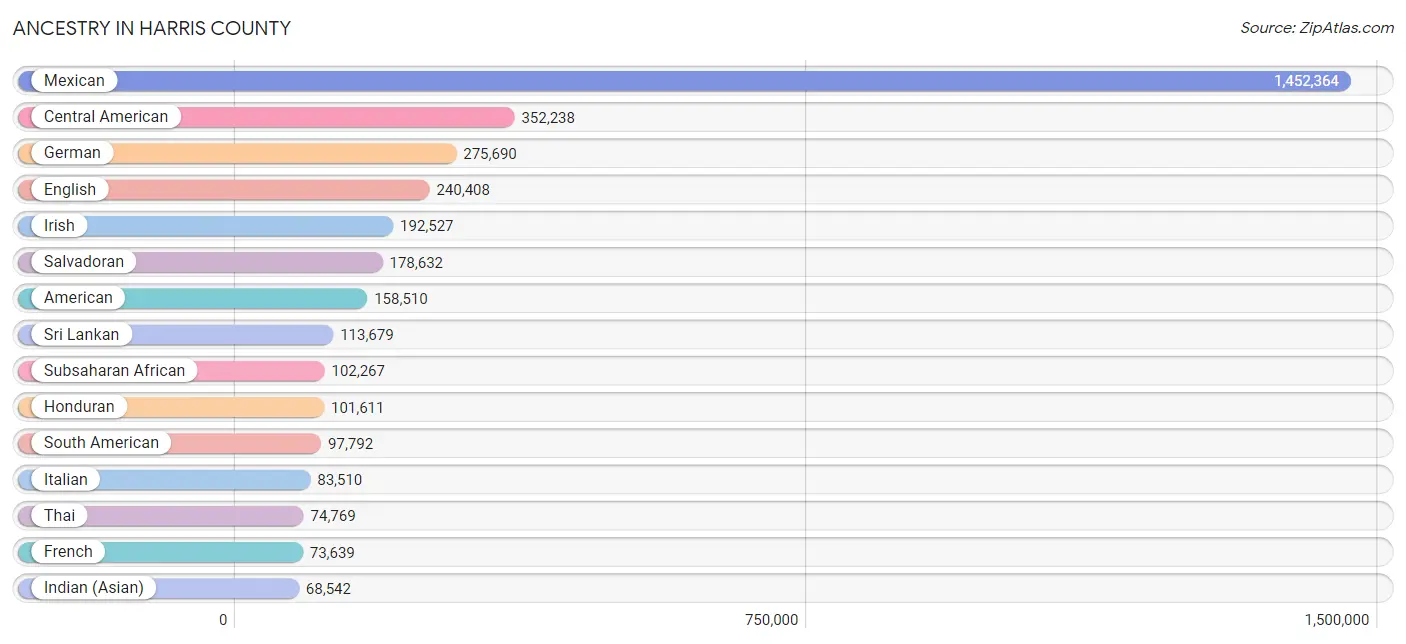
Ancestry in Harris County
The most populous ancestries reported in Harris County are Mexican (1,452,364 | 30.7%), Central American (352,238 | 7.4%), German (275,690 | 5.8%), English (240,408 | 5.1%), and Irish (192,527 | 4.1%), together accounting for 53.2% of all Harris County residents.
| Ancestry | # Population | % Population |
| Afghan | 2,685 | 0.1% |
| African | 45,706 | 1.0% |
| Alaska Native | 253 | 0.0% |
| Alaskan Athabascan | 86 | 0.0% |
| Albanian | 634 | 0.0% |
| Aleut | 32 | 0.0% |
| Alsatian | 97 | 0.0% |
| American | 158,510 | 3.4% |
| Apache | 1,666 | 0.0% |
| Arab | 41,773 | 0.9% |
| Arapaho | 7 | 0.0% |
| Argentinean | 6,118 | 0.1% |
| Armenian | 1,230 | 0.0% |
| Assyrian / Chaldean / Syriac | 36 | 0.0% |
| Australian | 1,392 | 0.0% |
| Austrian | 4,197 | 0.1% |
| Bahamian | 1,346 | 0.0% |
| Bangladeshi | 91 | 0.0% |
| Barbadian | 479 | 0.0% |
| Basque | 278 | 0.0% |
| Belgian | 2,093 | 0.0% |
| Belizean | 1,750 | 0.0% |
| Bermudan | 29 | 0.0% |
| Bhutanese | 10,266 | 0.2% |
| Blackfeet | 938 | 0.0% |
| Bolivian | 1,828 | 0.0% |
| Brazilian | 5,019 | 0.1% |
| British | 19,936 | 0.4% |
| British West Indian | 1,992 | 0.0% |
| Bulgarian | 529 | 0.0% |
| Burmese | 17,615 | 0.4% |
| Cajun | 2,797 | 0.1% |
| Cambodian | 26 | 0.0% |
| Canadian | 5,351 | 0.1% |
| Cape Verdean | 88 | 0.0% |
| Celtic | 955 | 0.0% |
| Central American | 352,238 | 7.4% |
| Central American Indian | 8,608 | 0.2% |
| Cherokee | 9,513 | 0.2% |
| Cheyenne | 173 | 0.0% |
| Chickasaw | 709 | 0.0% |
| Chilean | 3,477 | 0.1% |
| Chinese | 30 | 0.0% |
| Chippewa | 372 | 0.0% |
| Choctaw | 3,588 | 0.1% |
| Colombian | 35,079 | 0.7% |
| Comanche | 397 | 0.0% |
| Costa Rican | 2,060 | 0.0% |
| Cree | 28 | 0.0% |
| Creek | 856 | 0.0% |
| Croatian | 2,244 | 0.1% |
| Crow | 130 | 0.0% |
| Cuban | 38,911 | 0.8% |
| Cypriot | 43 | 0.0% |
| Czech | 22,134 | 0.5% |
| Czechoslovakian | 2,576 | 0.1% |
| Danish | 6,540 | 0.1% |
| Delaware | 161 | 0.0% |
| Dominican | 8,491 | 0.2% |
| Dutch | 20,458 | 0.4% |
| Dutch West Indian | 483 | 0.0% |
| Eastern European | 4,426 | 0.1% |
| Ecuadorian | 7,234 | 0.2% |
| Egyptian | 6,589 | 0.1% |
| English | 240,408 | 5.1% |
| Estonian | 86 | 0.0% |
| Ethiopian | 4,877 | 0.1% |
| European | 52,866 | 1.1% |
| Filipino | 4,590 | 0.1% |
| Finnish | 1,945 | 0.0% |
| French | 73,639 | 1.6% |
| French American Indian | 386 | 0.0% |
| French Canadian | 10,784 | 0.2% |
| German | 275,690 | 5.8% |
| German Russian | 246 | 0.0% |
| Ghanaian | 2,155 | 0.1% |
| Greek | 8,836 | 0.2% |
| Guamanian / Chamorro | 2,132 | 0.1% |
| Guatemalan | 54,671 | 1.2% |
| Guyanese | 645 | 0.0% |
| Haitian | 3,513 | 0.1% |
| Honduran | 101,611 | 2.1% |
| Hopi | 17 | 0.0% |
| Houma | 130 | 0.0% |
| Hungarian | 4,505 | 0.1% |
| Icelander | 300 | 0.0% |
| Indian (Asian) | 68,542 | 1.5% |
| Indonesian | 1,665 | 0.0% |
| Inupiat | 113 | 0.0% |
| Iranian | 10,374 | 0.2% |
| Iraqi | 5,471 | 0.1% |
| Irish | 192,527 | 4.1% |
| Iroquois | 269 | 0.0% |
| Israeli | 1,821 | 0.0% |
| Italian | 83,510 | 1.8% |
| Jamaican | 10,742 | 0.2% |
| Japanese | 5,561 | 0.1% |
| Jordanian | 2,880 | 0.1% |
| Kenyan | 1,589 | 0.0% |
| Kiowa | 50 | 0.0% |
| Korean | 40,158 | 0.9% |
| Laotian | 3,256 | 0.1% |
| Latvian | 421 | 0.0% |
| Lebanese | 7,004 | 0.2% |
| Liberian | 749 | 0.0% |
| Lithuanian | 2,158 | 0.1% |
| Lumbee | 109 | 0.0% |
| Luxembourger | 118 | 0.0% |
| Macedonian | 755 | 0.0% |
| Malaysian | 3,277 | 0.1% |
| Maltese | 108 | 0.0% |
| Marshallese | 8 | 0.0% |
| Menominee | 14 | 0.0% |
| Mexican | 1,452,364 | 30.7% |
| Mexican American Indian | 15,196 | 0.3% |
| Mongolian | 653 | 0.0% |
| Moroccan | 1,550 | 0.0% |
| Native Hawaiian | 2,724 | 0.1% |
| Navajo | 1,226 | 0.0% |
| Nepalese | 13 | 0.0% |
| New Zealander | 337 | 0.0% |
| Nicaraguan | 11,047 | 0.2% |
| Nigerian | 35,055 | 0.7% |
| Northern European | 3,437 | 0.1% |
| Norwegian | 17,673 | 0.4% |
| Okinawan | 399 | 0.0% |
| Osage | 500 | 0.0% |
| Ottawa | 40 | 0.0% |
| Pakistani | 3,843 | 0.1% |
| Palestinian | 3,972 | 0.1% |
| Panamanian | 3,544 | 0.1% |
| Paraguayan | 412 | 0.0% |
| Pennsylvania German | 368 | 0.0% |
| Peruvian | 9,450 | 0.2% |
| Pima | 6 | 0.0% |
| Polish | 45,295 | 1.0% |
| Portuguese | 6,593 | 0.1% |
| Potawatomi | 157 | 0.0% |
| Pueblo | 508 | 0.0% |
| Puerto Rican | 38,127 | 0.8% |
| Romanian | 3,305 | 0.1% |
| Russian | 14,106 | 0.3% |
| Salvadoran | 178,632 | 3.8% |
| Samoan | 1,259 | 0.0% |
| Scandinavian | 6,826 | 0.1% |
| Scotch-Irish | 26,314 | 0.6% |
| Scottish | 44,773 | 0.9% |
| Seminole | 56 | 0.0% |
| Senegalese | 706 | 0.0% |
| Serbian | 2,002 | 0.0% |
| Shoshone | 157 | 0.0% |
| Sierra Leonean | 869 | 0.0% |
| Sioux | 550 | 0.0% |
| Slavic | 1,027 | 0.0% |
| Slovak | 2,179 | 0.1% |
| Slovene | 893 | 0.0% |
| Somali | 140 | 0.0% |
| South African | 1,382 | 0.0% |
| South American | 97,792 | 2.1% |
| South American Indian | 312 | 0.0% |
| Soviet Union | 163 | 0.0% |
| Spaniard | 14,548 | 0.3% |
| Spanish | 9,835 | 0.2% |
| Spanish American | 599 | 0.0% |
| Spanish American Indian | 212 | 0.0% |
| Sri Lankan | 113,679 | 2.4% |
| Subsaharan African | 102,267 | 2.2% |
| Sudanese | 1,120 | 0.0% |
| Swedish | 16,368 | 0.4% |
| Swiss | 4,195 | 0.1% |
| Syrian | 3,540 | 0.1% |
| Thai | 74,769 | 1.6% |
| Tlingit-Haida | 33 | 0.0% |
| Tohono O'Odham | 108 | 0.0% |
| Tongan | 58 | 0.0% |
| Trinidadian and Tobagonian | 3,457 | 0.1% |
| Turkish | 3,254 | 0.1% |
| U.S. Virgin Islander | 615 | 0.0% |
| Ugandan | 181 | 0.0% |
| Ukrainian | 4,566 | 0.1% |
| Uruguayan | 1,450 | 0.0% |
| Ute | 93 | 0.0% |
| Venezuelan | 32,544 | 0.7% |
| Vietnamese | 3,277 | 0.1% |
| Welsh | 12,611 | 0.3% |
| West Indian | 4,072 | 0.1% |
| Yakama | 146 | 0.0% |
| Yaqui | 174 | 0.0% |
| Yugoslavian | 1,657 | 0.0% |
| Yuman | 24 | 0.0% |
| Yup'ik | 17 | 0.0% |
| Zimbabwean | 90 | 0.0% | View All 192 Rows |
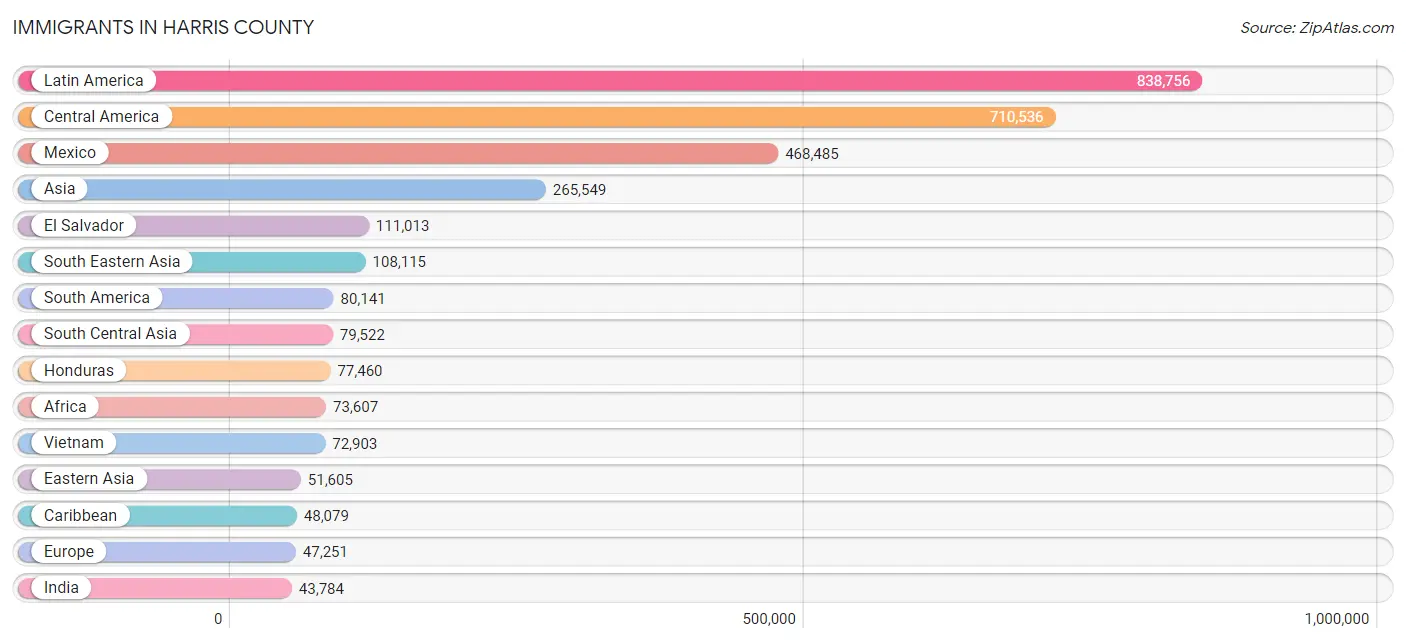
Immigrants in Harris County
The most numerous immigrant groups reported in Harris County came from Latin America (838,756 | 17.7%), Central America (710,536 | 15.0%), Mexico (468,485 | 9.9%), Asia (265,549 | 5.6%), and El Salvador (111,013 | 2.4%), together accounting for 50.7% of all Harris County residents.
| Immigration Origin | # Population | % Population |
| Afghanistan | 2,522 | 0.1% |
| Africa | 73,607 | 1.6% |
| Albania | 367 | 0.0% |
| Argentina | 3,998 | 0.1% |
| Armenia | 303 | 0.0% |
| Asia | 265,549 | 5.6% |
| Australia | 2,268 | 0.1% |
| Austria | 306 | 0.0% |
| Azores | 8 | 0.0% |
| Bahamas | 749 | 0.0% |
| Bangladesh | 3,399 | 0.1% |
| Barbados | 489 | 0.0% |
| Belarus | 269 | 0.0% |
| Belgium | 391 | 0.0% |
| Belize | 1,334 | 0.0% |
| Bolivia | 1,564 | 0.0% |
| Bosnia and Herzegovina | 1,545 | 0.0% |
| Brazil | 6,230 | 0.1% |
| Bulgaria | 521 | 0.0% |
| Cabo Verde | 18 | 0.0% |
| Cambodia | 2,309 | 0.1% |
| Cameroon | 5,593 | 0.1% |
| Canada | 10,332 | 0.2% |
| Caribbean | 48,079 | 1.0% |
| Central America | 710,536 | 15.0% |
| Chile | 2,220 | 0.1% |
| China | 39,271 | 0.8% |
| Colombia | 25,312 | 0.5% |
| Congo | 536 | 0.0% |
| Costa Rica | 1,471 | 0.0% |
| Croatia | 323 | 0.0% |
| Cuba | 26,882 | 0.6% |
| Czechoslovakia | 415 | 0.0% |
| Denmark | 715 | 0.0% |
| Dominica | 1,118 | 0.0% |
| Dominican Republic | 3,988 | 0.1% |
| Eastern Africa | 12,110 | 0.3% |
| Eastern Asia | 51,605 | 1.1% |
| Eastern Europe | 15,271 | 0.3% |
| Ecuador | 4,674 | 0.1% |
| Egypt | 4,654 | 0.1% |
| El Salvador | 111,013 | 2.4% |
| England | 4,161 | 0.1% |
| Eritrea | 2,588 | 0.1% |
| Ethiopia | 3,503 | 0.1% |
| Europe | 47,251 | 1.0% |
| Fiji | 99 | 0.0% |
| France | 3,248 | 0.1% |
| Germany | 5,747 | 0.1% |
| Ghana | 2,548 | 0.1% |
| Greece | 1,167 | 0.0% |
| Grenada | 101 | 0.0% |
| Guatemala | 41,494 | 0.9% |
| Guyana | 626 | 0.0% |
| Haiti | 1,372 | 0.0% |
| Honduras | 77,460 | 1.6% |
| Hong Kong | 2,805 | 0.1% |
| Hungary | 603 | 0.0% |
| India | 43,784 | 0.9% |
| Indonesia | 3,076 | 0.1% |
| Iran | 8,425 | 0.2% |
| Iraq | 7,155 | 0.2% |
| Ireland | 704 | 0.0% |
| Israel | 1,101 | 0.0% |
| Italy | 2,096 | 0.0% |
| Jamaica | 6,091 | 0.1% |
| Japan | 3,357 | 0.1% |
| Jordan | 2,887 | 0.1% |
| Kazakhstan | 880 | 0.0% |
| Kenya | 2,370 | 0.1% |
| Korea | 8,977 | 0.2% |
| Kuwait | 1,354 | 0.0% |
| Laos | 1,107 | 0.0% |
| Latin America | 838,756 | 17.7% |
| Latvia | 114 | 0.0% |
| Lebanon | 2,895 | 0.1% |
| Liberia | 1,108 | 0.0% |
| Lithuania | 82 | 0.0% |
| Malaysia | 1,571 | 0.0% |
| Mexico | 468,485 | 9.9% |
| Micronesia | 180 | 0.0% |
| Middle Africa | 8,548 | 0.2% |
| Moldova | 78 | 0.0% |
| Morocco | 1,390 | 0.0% |
| Nepal | 3,322 | 0.1% |
| Netherlands | 1,479 | 0.0% |
| Nicaragua | 7,326 | 0.2% |
| Nigeria | 31,292 | 0.7% |
| North Macedonia | 356 | 0.0% |
| Northern Africa | 8,256 | 0.2% |
| Northern Europe | 14,683 | 0.3% |
| Norway | 759 | 0.0% |
| Oceania | 3,108 | 0.1% |
| Pakistan | 14,564 | 0.3% |
| Panama | 1,820 | 0.0% |
| Peru | 5,842 | 0.1% |
| Philippines | 21,971 | 0.5% |
| Poland | 1,705 | 0.0% |
| Portugal | 504 | 0.0% |
| Romania | 1,941 | 0.0% |
| Russia | 3,912 | 0.1% |
| Saudi Arabia | 1,991 | 0.0% |
| Scotland | 1,465 | 0.0% |
| Senegal | 928 | 0.0% |
| Serbia | 608 | 0.0% |
| Sierra Leone | 1,363 | 0.0% |
| Singapore | 1,005 | 0.0% |
| Somalia | 257 | 0.0% |
| South Africa | 2,065 | 0.0% |
| South America | 80,141 | 1.7% |
| South Central Asia | 79,522 | 1.7% |
| South Eastern Asia | 108,115 | 2.3% |
| Southern Europe | 5,651 | 0.1% |
| Spain | 1,863 | 0.0% |
| Sri Lanka | 1,755 | 0.0% |
| St. Vincent and the Grenadines | 100 | 0.0% |
| Sudan | 1,029 | 0.0% |
| Sweden | 708 | 0.0% |
| Switzerland | 427 | 0.0% |
| Syria | 2,367 | 0.1% |
| Taiwan | 6,488 | 0.1% |
| Thailand | 2,769 | 0.1% |
| Trinidad and Tobago | 4,157 | 0.1% |
| Turkey | 2,321 | 0.1% |
| Uganda | 632 | 0.0% |
| Ukraine | 1,536 | 0.0% |
| Uruguay | 1,118 | 0.0% |
| Uzbekistan | 269 | 0.0% |
| Venezuela | 27,984 | 0.6% |
| Vietnam | 72,903 | 1.5% |
| West Indies | 401 | 0.0% |
| Western Africa | 40,494 | 0.9% |
| Western Asia | 25,419 | 0.5% |
| Western Europe | 11,608 | 0.3% |
| Yemen | 209 | 0.0% |
| Zaire | 679 | 0.0% |
| Zimbabwe | 448 | 0.0% | View All 137 Rows |
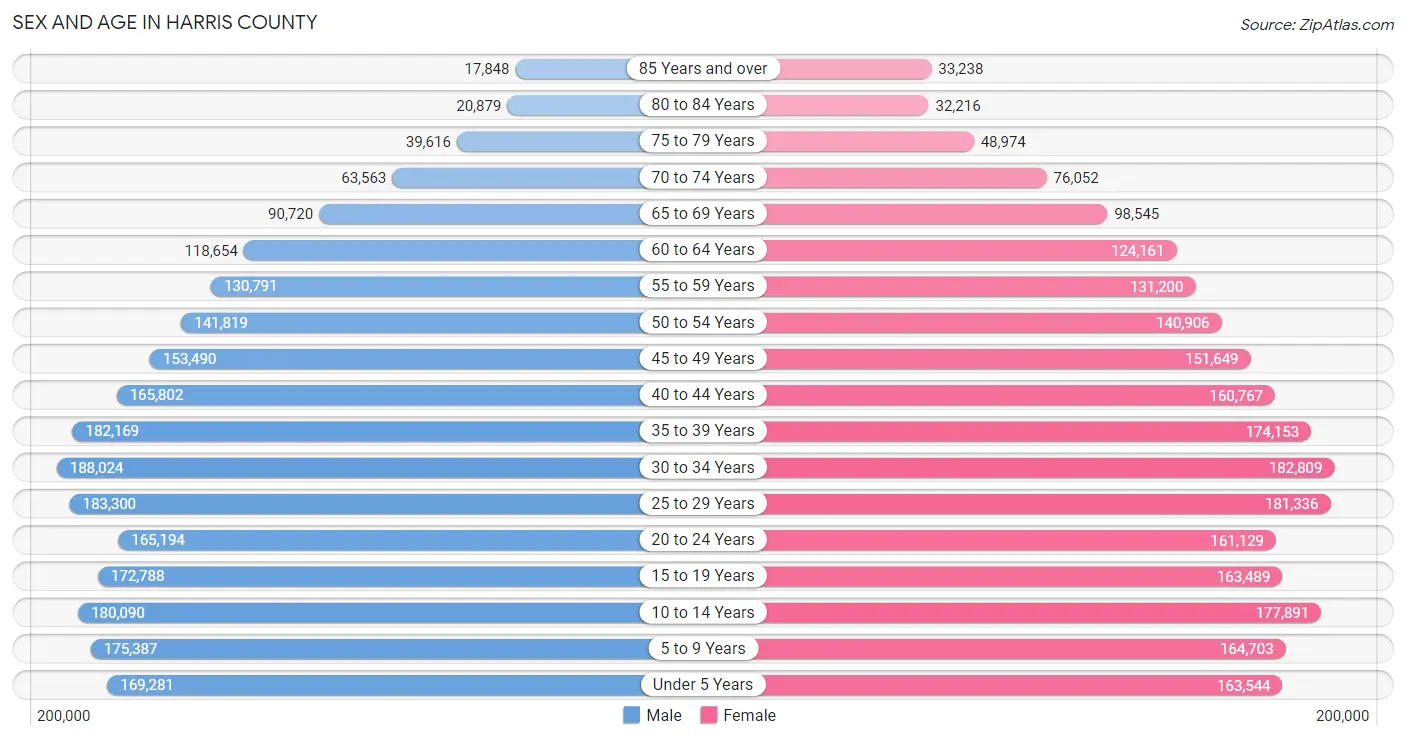
Sex and Age in Harris County
Sex and Age in Harris County
The most populous age groups in Harris County are 30 to 34 Years (188,024 | 8.0%) for men and 30 to 34 Years (182,809 | 7.7%) for women.
| Age Bracket | Male | Female |
| Under 5 Years | 169,281 (7.2%) | 163,544 (6.9%) |
| 5 to 9 Years | 175,387 (7.4%) | 164,703 (7.0%) |
| 10 to 14 Years | 180,090 (7.6%) | 177,891 (7.5%) |
| 15 to 19 Years | 172,788 (7.3%) | 163,489 (6.9%) |
| 20 to 24 Years | 165,194 (7.0%) | 161,129 (6.8%) |
| 25 to 29 Years | 183,300 (7.8%) | 181,336 (7.7%) |
| 30 to 34 Years | 188,024 (8.0%) | 182,809 (7.7%) |
| 35 to 39 Years | 182,169 (7.7%) | 174,153 (7.4%) |
| 40 to 44 Years | 165,802 (7.0%) | 160,767 (6.8%) |
| 45 to 49 Years | 153,490 (6.5%) | 151,649 (6.4%) |
| 50 to 54 Years | 141,819 (6.0%) | 140,906 (5.9%) |
| 55 to 59 Years | 130,791 (5.5%) | 131,200 (5.5%) |
| 60 to 64 Years | 118,654 (5.0%) | 124,161 (5.2%) |
| 65 to 69 Years | 90,720 (3.8%) | 98,545 (4.2%) |
| 70 to 74 Years | 63,563 (2.7%) | 76,052 (3.2%) |
| 75 to 79 Years | 39,616 (1.7%) | 48,974 (2.1%) |
| 80 to 84 Years | 20,879 (0.9%) | 32,216 (1.4%) |
| 85 Years and over | 17,848 (0.8%) | 33,238 (1.4%) |
| Total | 2,359,415 (100.0%) | 2,366,762 (100.0%) |
Families and Households in Harris County
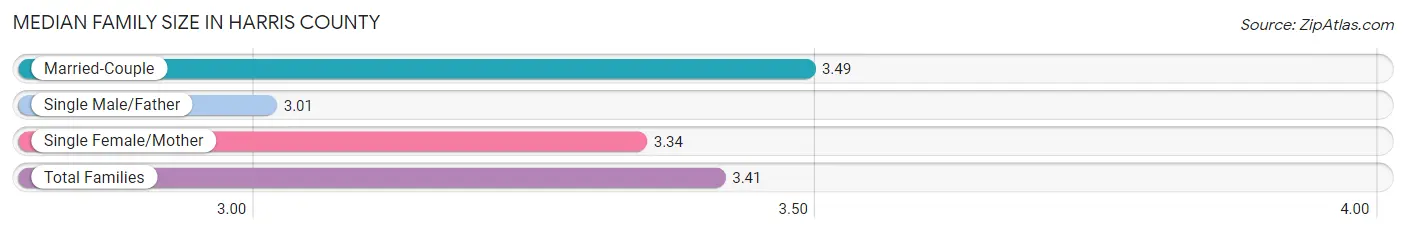
Median Family Size in Harris County
The median family size in Harris County is 3.41 persons per family, with married-couple families (774,203 | 68.0%) accounting for the largest median family size of 3.49 persons per family. On the other hand, single male/father families (106,472 | 9.3%) represent the smallest median family size with 3.01 persons per family.
| Family Type | # Families | Family Size |
| Married-Couple | 774,203 (68.0%) | 3.49 |
| Single Male/Father | 106,472 (9.3%) | 3.01 |
| Single Female/Mother | 258,518 (22.7%) | 3.34 |
| Total Families | 1,139,193 (100.0%) | 3.41 |
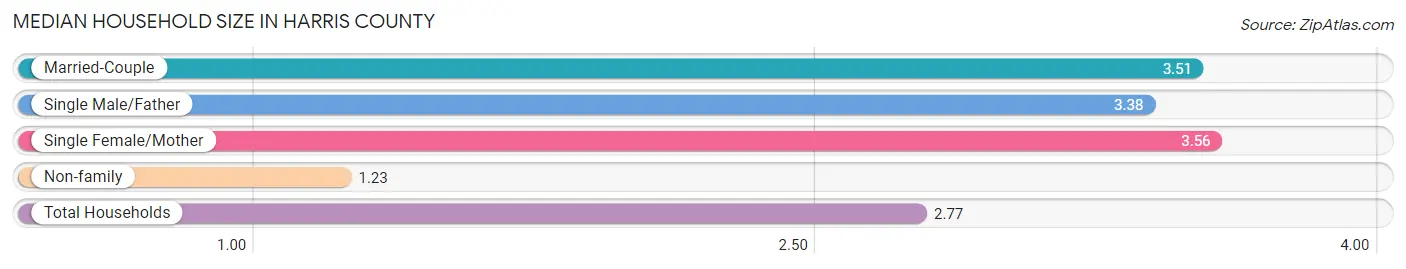
Median Household Size in Harris County
The median household size in Harris County is 2.77 persons per household, with single female/mother households (258,518 | 15.3%) accounting for the largest median household size of 3.56 persons per household. non-family households (553,703 | 32.7%) represent the smallest median household size with 1.23 persons per household.
| Household Type | # Households | Household Size |
| Married-Couple | 774,203 (45.7%) | 3.51 |
| Single Male/Father | 106,472 (6.3%) | 3.38 |
| Single Female/Mother | 258,518 (15.3%) | 3.56 |
| Non-family | 553,703 (32.7%) | 1.23 |
| Total Households | 1,692,896 (100.0%) | 2.77 |
Household Size by Marriage Status in Harris County
Out of a total of 1,692,896 households in Harris County, 1,139,193 (67.3%) are family households, while 553,703 (32.7%) are nonfamily households. The most numerous type of family households are 2-person households, comprising 399,405, and the most common type of nonfamily households are 1-person households, comprising 452,548.
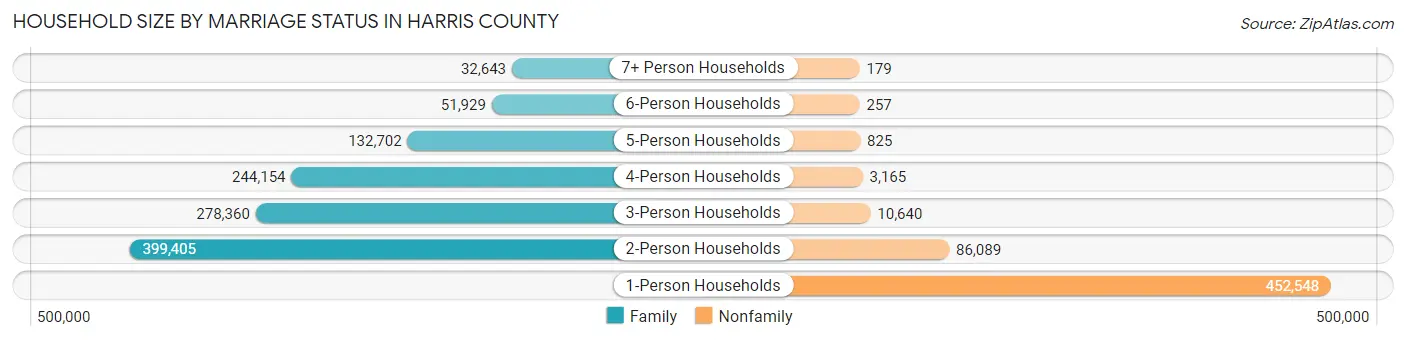
| Household Size | Family Households | Nonfamily Households |
| 1-Person Households | - | 452,548 (26.7%) |
| 2-Person Households | 399,405 (23.6%) | 86,089 (5.1%) |
| 3-Person Households | 278,360 (16.4%) | 10,640 (0.6%) |
| 4-Person Households | 244,154 (14.4%) | 3,165 (0.2%) |
| 5-Person Households | 132,702 (7.8%) | 825 (0.1%) |
| 6-Person Households | 51,929 (3.1%) | 257 (0.0%) |
| 7+ Person Households | 32,643 (1.9%) | 179 (0.0%) |
| Total | 1,139,193 (67.3%) | 553,703 (32.7%) |
Female Fertility in Harris County
Fertility by Age in Harris County
Average fertility rate in Harris County is 57.0 births per 1,000 women. Women in the age bracket of 20 to 34 years have the highest fertility rate with 92.0 births per 1,000 women. Women in the age bracket of 20 to 34 years acount for 69.5% of all women with births.
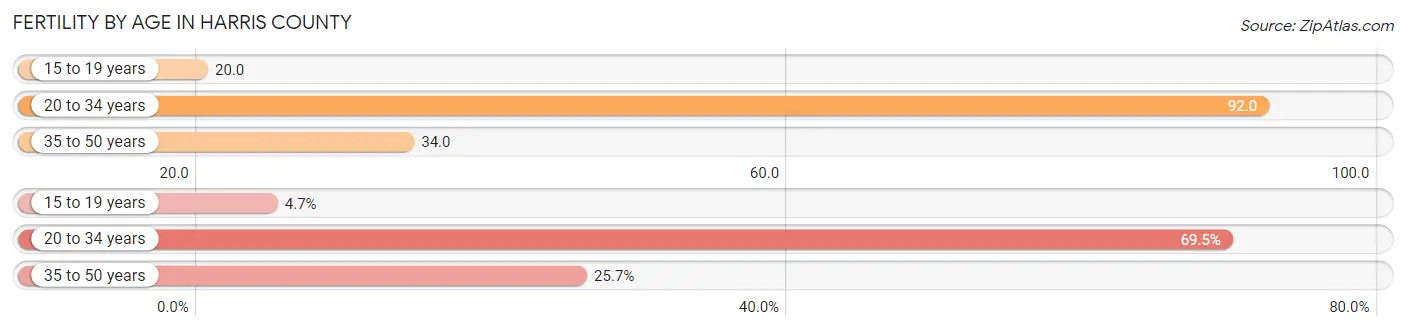
| Age Bracket | Women with Births | Births / 1,000 Women |
| 15 to 19 years | 3,292 (4.7%) | 20.0 |
| 20 to 34 years | 48,321 (69.5%) | 92.0 |
| 35 to 50 years | 17,877 (25.7%) | 34.0 |
| Total | 69,490 (100.0%) | 57.0 |
Fertility by Age by Marriage Status in Harris County
64.5% of women with births (69,490) in Harris County are married. The highest percentage of unmarried women with births falls into 15 to 19 years age bracket with 89.1% of them unmarried at the time of birth, while the lowest percentage of unmarried women with births belong to 35 to 50 years age bracket with 24.3% of them unmarried.
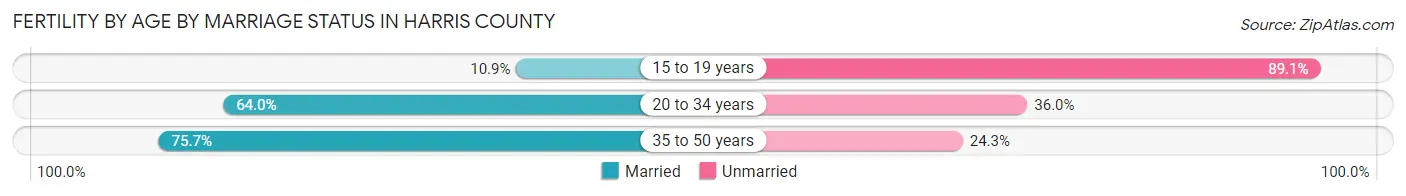
| Age Bracket | Married | Unmarried |
| 15 to 19 years | 359 (10.9%) | 2,933 (89.1%) |
| 20 to 34 years | 30,925 (64.0%) | 17,396 (36.0%) |
| 35 to 50 years | 13,533 (75.7%) | 4,344 (24.3%) |
| Total | 44,821 (64.5%) | 24,669 (35.5%) |
Fertility by Education in Harris County
Average fertility rate in Harris County is 57.0 births per 1,000 women. Women with the education attainment of high school diploma have the highest fertility rate of 68.0 births per 1,000 women, while women with the education attainment of less than high school have the lowest fertility at 42.0 births per 1,000 women. Women with the education attainment of college or associate's degree represent 28.1% of all women with births.
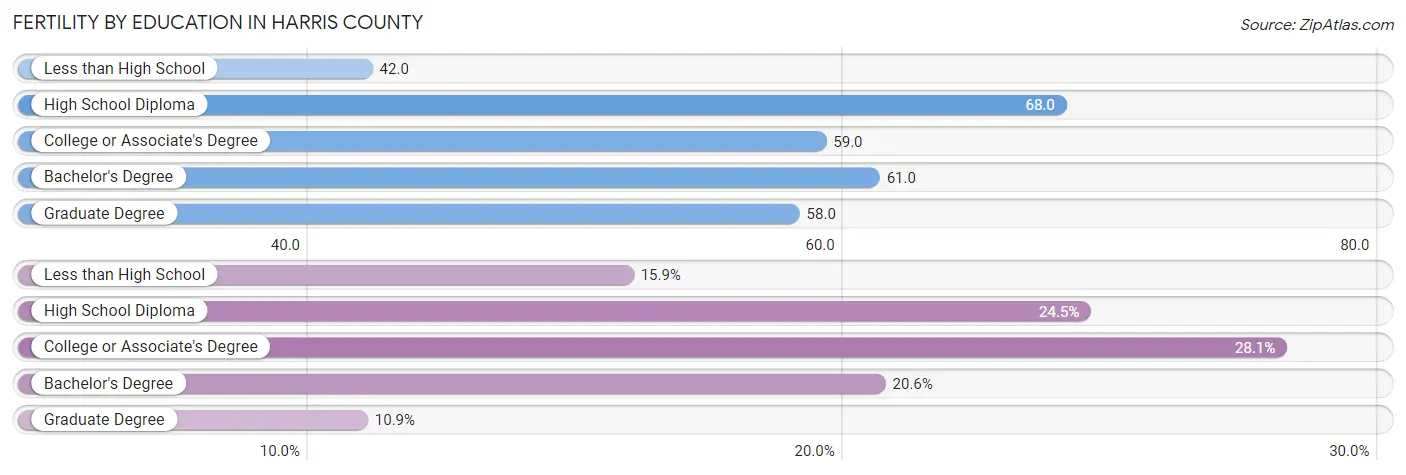
| Educational Attainment | Women with Births | Births / 1,000 Women |
| Less than High School | 11,041 (15.9%) | 42.0 |
| High School Diploma | 16,996 (24.5%) | 68.0 |
| College or Associate's Degree | 19,547 (28.1%) | 59.0 |
| Bachelor's Degree | 14,322 (20.6%) | 61.0 |
| Graduate Degree | 7,584 (10.9%) | 58.0 |
| Total | 69,490 (100.0%) | 57.0 |
Fertility by Education by Marriage Status in Harris County
35.5% of women with births in Harris County are unmarried. Women with the educational attainment of graduate degree are most likely to be married with 94.3% of them married at childbirth, while women with the educational attainment of less than high school are least likely to be married with 52.3% of them unmarried at childbirth.
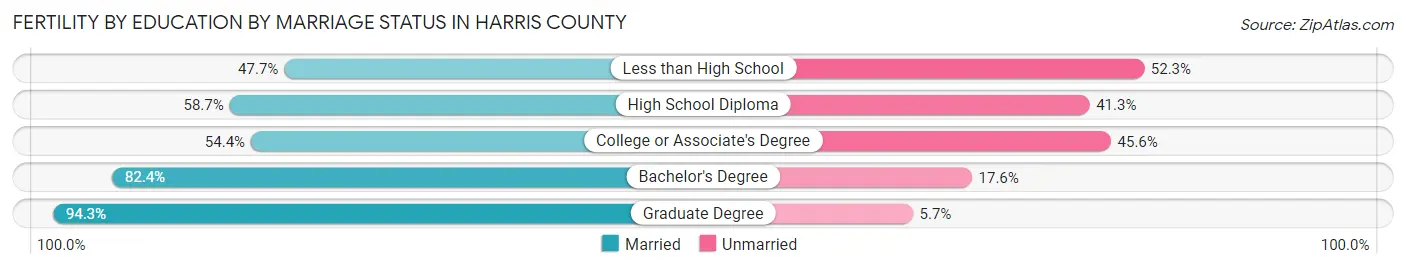
| Educational Attainment | Married | Unmarried |
| Less than High School | 5,267 (47.7%) | 5,774 (52.3%) |
| High School Diploma | 9,977 (58.7%) | 7,019 (41.3%) |
| College or Associate's Degree | 10,634 (54.4%) | 8,913 (45.6%) |
| Bachelor's Degree | 11,801 (82.4%) | 2,521 (17.6%) |
| Graduate Degree | 7,152 (94.3%) | 432 (5.7%) |
| Total | 44,821 (64.5%) | 24,669 (35.5%) |
Employment Characteristics in Harris County
Employment by Class of Employer in Harris County
Among the 2,239,156 employed individuals in Harris County, private company employees (1,637,962 | 73.2%), self-employed (not incorporated) (146,467 | 6.5%), and local government employees (141,208 | 6.3%) make up the most common classes of employment.
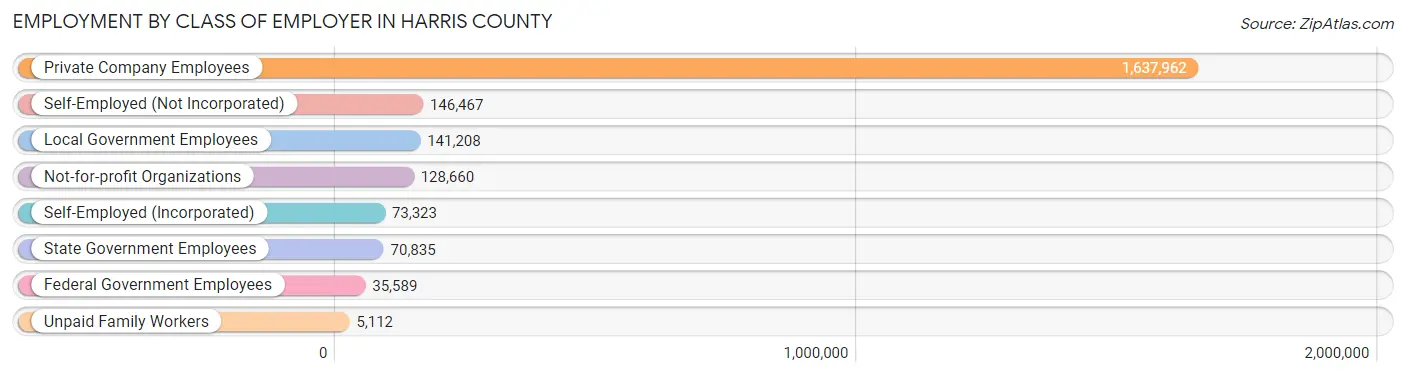
| Employer Class | # Employees | % Employees |
| Private Company Employees | 1,637,962 | 73.2% |
| Self-Employed (Incorporated) | 73,323 | 3.3% |
| Self-Employed (Not Incorporated) | 146,467 | 6.5% |
| Not-for-profit Organizations | 128,660 | 5.8% |
| Local Government Employees | 141,208 | 6.3% |
| State Government Employees | 70,835 | 3.2% |
| Federal Government Employees | 35,589 | 1.6% |
| Unpaid Family Workers | 5,112 | 0.2% |
| Total | 2,239,156 | 100.0% |
Employment Status by Age in Harris County
According to the labor force statistics for Harris County, out of the total population over 16 years of age (3,627,075), 67.4% or 2,444,649 individuals are in the labor force, with 6.4% or 156,458 of them unemployed. The age group with the highest labor force participation rate is 30 to 34 years, with 82.9% or 307,421 individuals in the labor force. Within the labor force, the 16 to 19 years age range has the highest percentage of unemployed individuals, with 20.4% or 18,156 of them being unemployed.
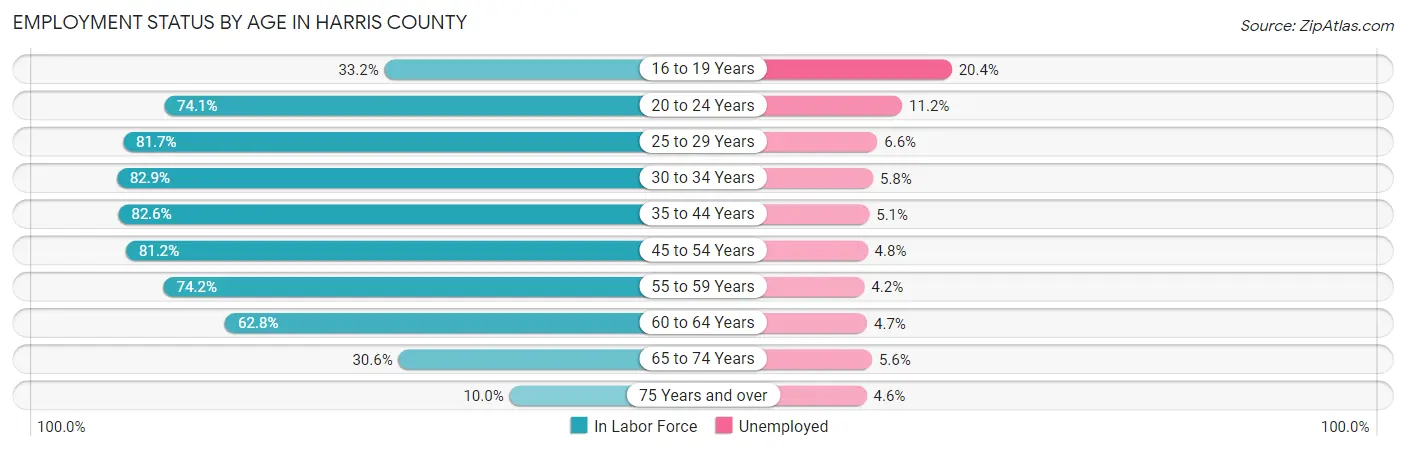
| Age Bracket | In Labor Force | Unemployed |
| 16 to 19 Years | 89,000 (33.2%) | 18,156 (20.4%) |
| 20 to 24 Years | 241,805 (74.1%) | 27,082 (11.2%) |
| 25 to 29 Years | 297,908 (81.7%) | 19,662 (6.6%) |
| 30 to 34 Years | 307,421 (82.9%) | 17,830 (5.8%) |
| 35 to 44 Years | 564,068 (82.6%) | 28,767 (5.1%) |
| 45 to 54 Years | 477,346 (81.2%) | 22,913 (4.8%) |
| 55 to 59 Years | 194,397 (74.2%) | 8,165 (4.2%) |
| 60 to 64 Years | 152,488 (62.8%) | 7,167 (4.7%) |
| 65 to 74 Years | 100,637 (30.6%) | 5,636 (5.6%) |
| 75 Years and over | 19,277 (10.0%) | 887 (4.6%) |
| Total | 2,444,649 (67.4%) | 156,458 (6.4%) |
Employment Status by Educational Attainment in Harris County
According to labor force statistics for Harris County, 79.4% of individuals (1,993,758) out of the total population between 25 and 64 years of age (2,511,030) are in the labor force, with 5.2% or 103,675 of them being unemployed. The group with the highest labor force participation rate are those with the educational attainment of bachelor's degree or higher, with 86.7% or 729,703 individuals in the labor force. Within the labor force, individuals with college / associate degree education have the highest percentage of unemployment, with 6.5% or 34,723 of them being unemployed.
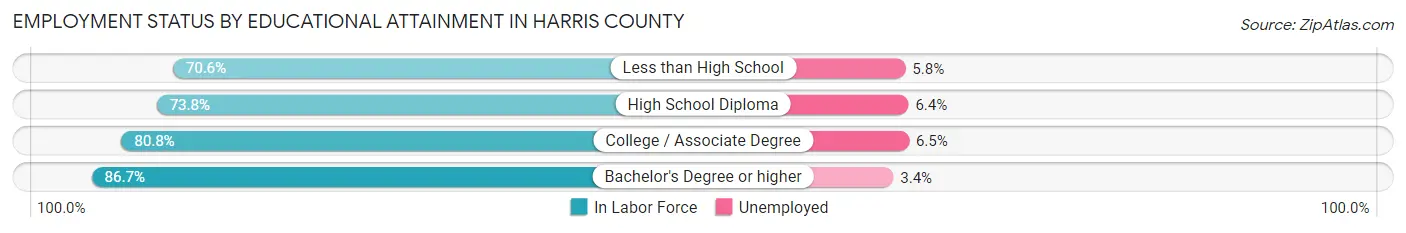
| Educational Attainment | In Labor Force | Unemployed |
| Less than High School | 308,093 (70.6%) | 25,311 (5.8%) |
| High School Diploma | 422,030 (73.8%) | 36,599 (6.4%) |
| College / Associate Degree | 534,201 (80.8%) | 42,974 (6.5%) |
| Bachelor's Degree or higher | 729,703 (86.7%) | 28,616 (3.4%) |
| Total | 1,993,758 (79.4%) | 130,574 (5.2%) |
Employment Occupations by Sex in Harris County
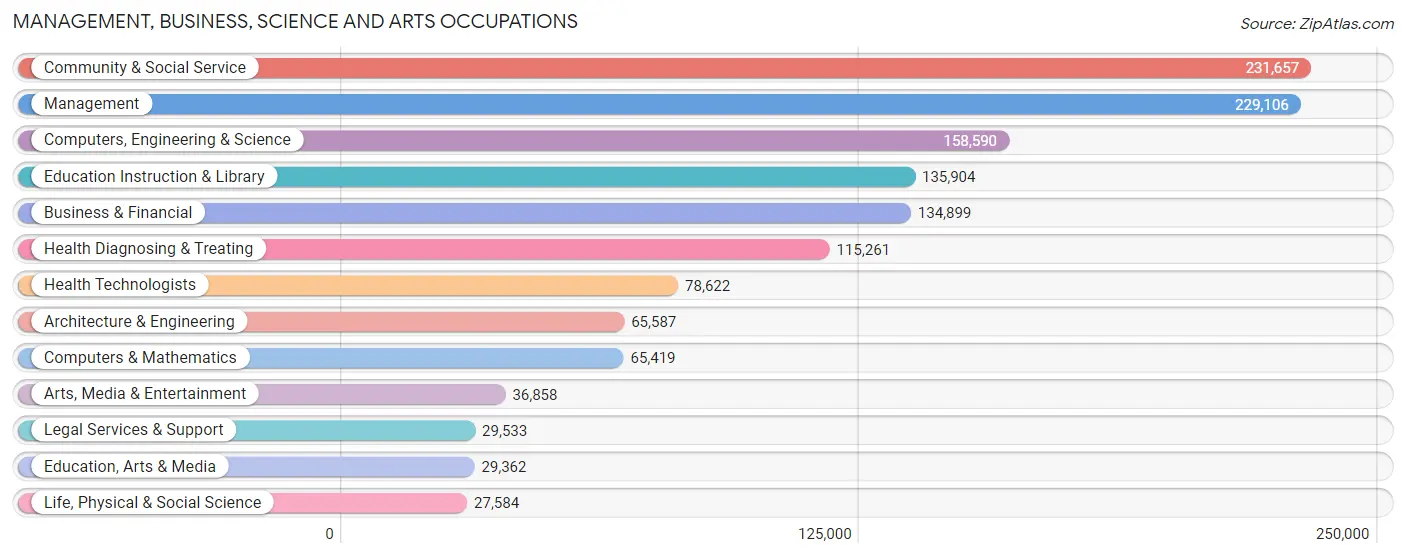
Management, Business, Science and Arts Occupations
The most common Management, Business, Science and Arts occupations in Harris County are Community & Social Service (231,657 | 10.1%), Management (229,106 | 10.0%), Computers, Engineering & Science (158,590 | 6.9%), Education Instruction & Library (135,904 | 5.9%), and Business & Financial (134,899 | 5.9%).
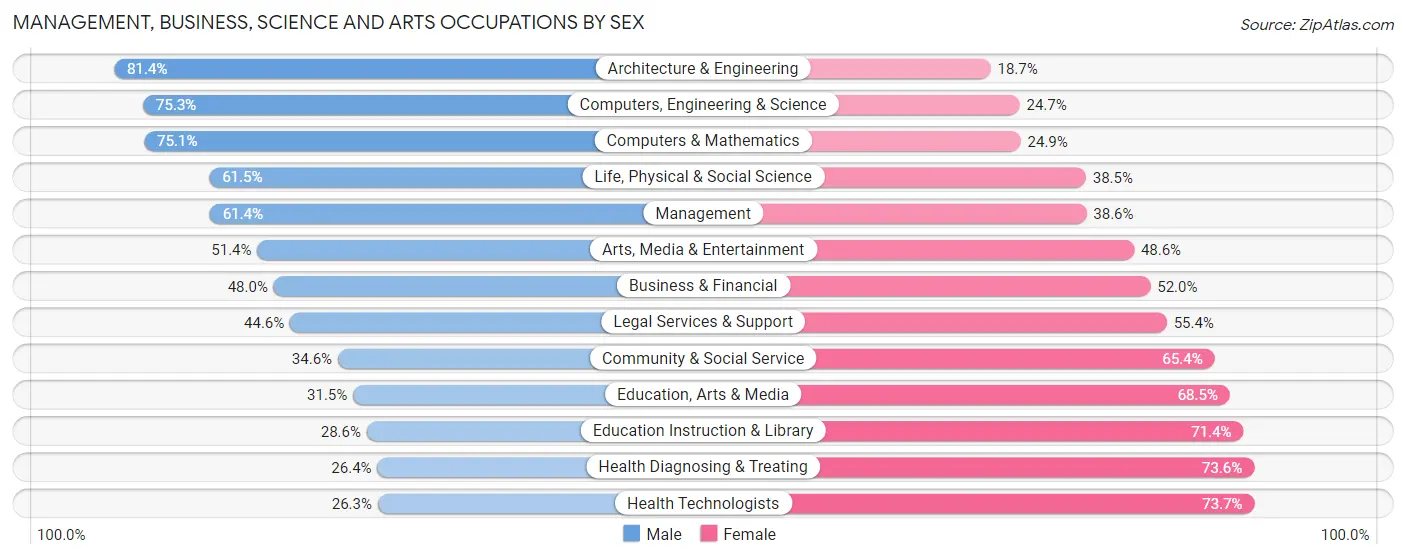
Management, Business, Science and Arts Occupations by Sex
Within the Management, Business, Science and Arts occupations in Harris County, the most male-oriented occupations are Architecture & Engineering (81.4%), Computers, Engineering & Science (75.3%), and Computers & Mathematics (75.1%), while the most female-oriented occupations are Health Technologists (73.7%), Health Diagnosing & Treating (73.6%), and Education Instruction & Library (71.4%).
| Occupation | Male | Female |
| Management | 140,599 (61.4%) | 88,507 (38.6%) |
| Business & Financial | 64,789 (48.0%) | 70,110 (52.0%) |
| Computers, Engineering & Science | 119,428 (75.3%) | 39,162 (24.7%) |
| Computers & Mathematics | 49,116 (75.1%) | 16,303 (24.9%) |
| Architecture & Engineering | 53,353 (81.4%) | 12,234 (18.6%) |
| Life, Physical & Social Science | 16,959 (61.5%) | 10,625 (38.5%) |
| Community & Social Service | 80,255 (34.6%) | 151,402 (65.4%) |
| Education, Arts & Media | 9,240 (31.5%) | 20,122 (68.5%) |
| Legal Services & Support | 13,175 (44.6%) | 16,358 (55.4%) |
| Education Instruction & Library | 38,879 (28.6%) | 97,025 (71.4%) |
| Arts, Media & Entertainment | 18,961 (51.4%) | 17,897 (48.6%) |
| Health Diagnosing & Treating | 30,424 (26.4%) | 84,837 (73.6%) |
| Health Technologists | 20,695 (26.3%) | 57,927 (73.7%) |
| Total (Category) | 435,495 (50.1%) | 434,018 (49.9%) |
| Total (Overall) | 1,268,361 (55.5%) | 1,016,814 (44.5%) |
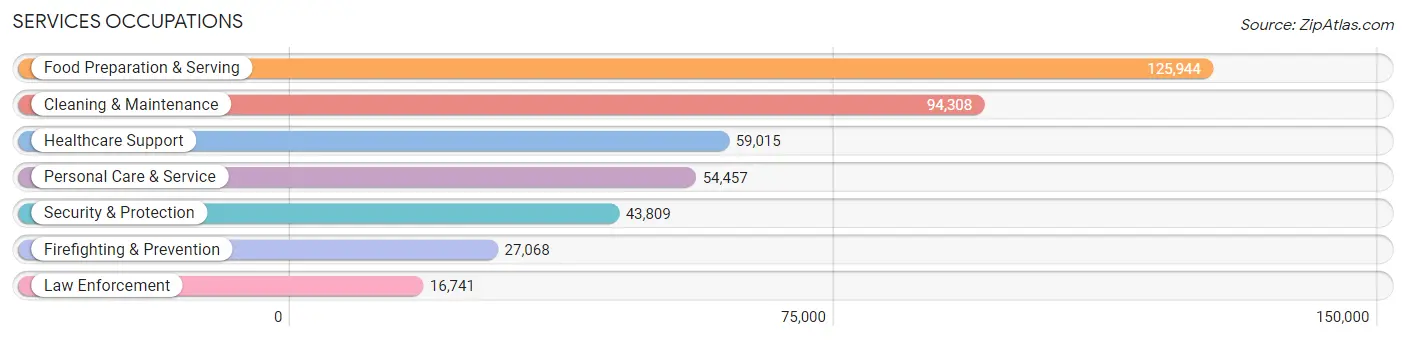
Services Occupations
The most common Services occupations in Harris County are Food Preparation & Serving (125,944 | 5.5%), Cleaning & Maintenance (94,308 | 4.1%), Healthcare Support (59,015 | 2.6%), Personal Care & Service (54,457 | 2.4%), and Security & Protection (43,809 | 1.9%).
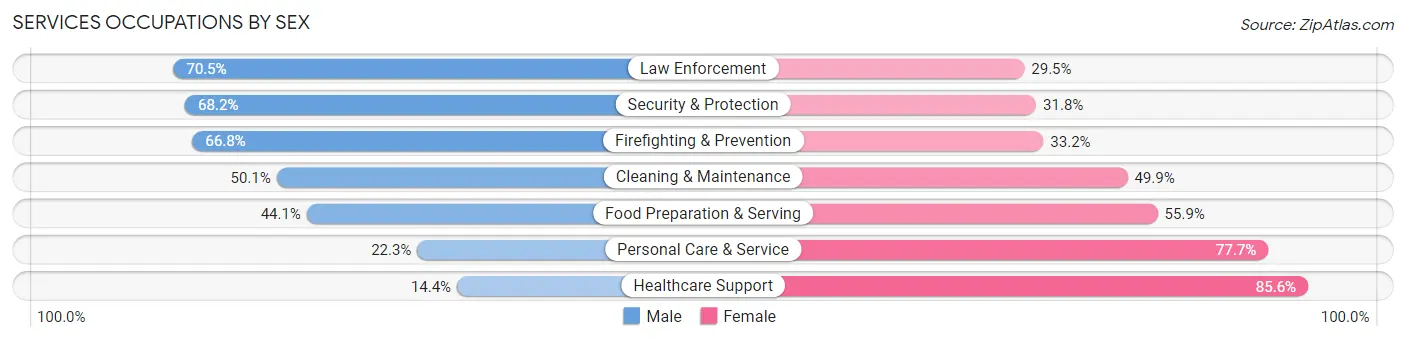
Services Occupations by Sex
Within the Services occupations in Harris County, the most male-oriented occupations are Law Enforcement (70.5%), Security & Protection (68.2%), and Firefighting & Prevention (66.8%), while the most female-oriented occupations are Healthcare Support (85.6%), Personal Care & Service (77.7%), and Food Preparation & Serving (55.9%).
| Occupation | Male | Female |
| Healthcare Support | 8,493 (14.4%) | 50,522 (85.6%) |
| Security & Protection | 29,878 (68.2%) | 13,931 (31.8%) |
| Firefighting & Prevention | 18,071 (66.8%) | 8,997 (33.2%) |
| Law Enforcement | 11,807 (70.5%) | 4,934 (29.5%) |
| Food Preparation & Serving | 55,592 (44.1%) | 70,352 (55.9%) |
| Cleaning & Maintenance | 47,260 (50.1%) | 47,048 (49.9%) |
| Personal Care & Service | 12,122 (22.3%) | 42,335 (77.7%) |
| Total (Category) | 153,345 (40.6%) | 224,188 (59.4%) |
| Total (Overall) | 1,268,361 (55.5%) | 1,016,814 (44.5%) |
Sales and Office Occupations
The most common Sales and Office occupations in Harris County are Office & Administration (236,579 | 10.3%), and Sales & Related (230,836 | 10.1%).
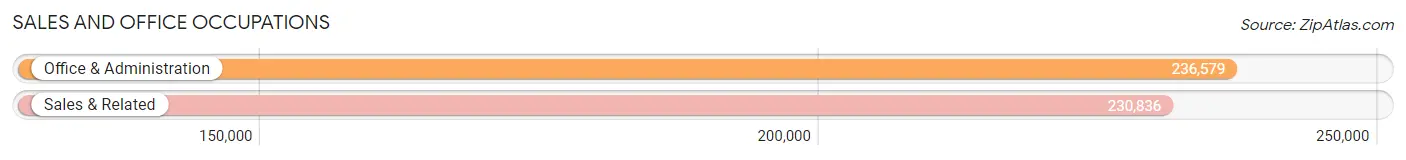
Sales and Office Occupations by Sex
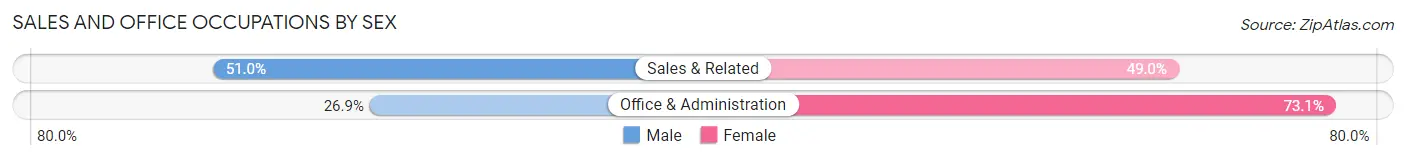
| Occupation | Male | Female |
| Sales & Related | 117,822 (51.0%) | 113,014 (49.0%) |
| Office & Administration | 63,642 (26.9%) | 172,937 (73.1%) |
| Total (Category) | 181,464 (38.8%) | 285,951 (61.2%) |
| Total (Overall) | 1,268,361 (55.5%) | 1,016,814 (44.5%) |
Natural Resources, Construction and Maintenance Occupations
The most common Natural Resources, Construction and Maintenance occupations in Harris County are Construction & Extraction (181,086 | 7.9%), Installation, Maintenance & Repair (77,446 | 3.4%), and Farming, Fishing & Forestry (2,929 | 0.1%).
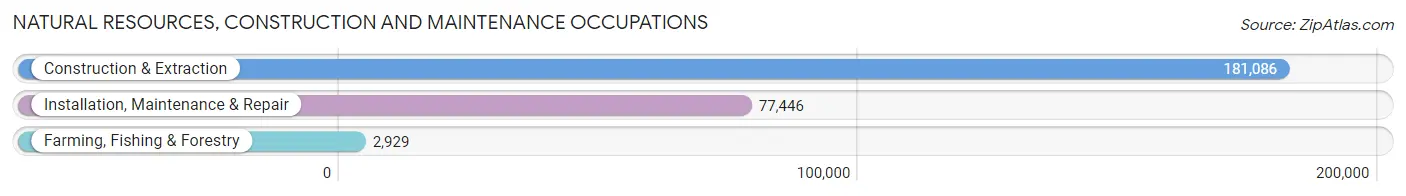
Natural Resources, Construction and Maintenance Occupations by Sex
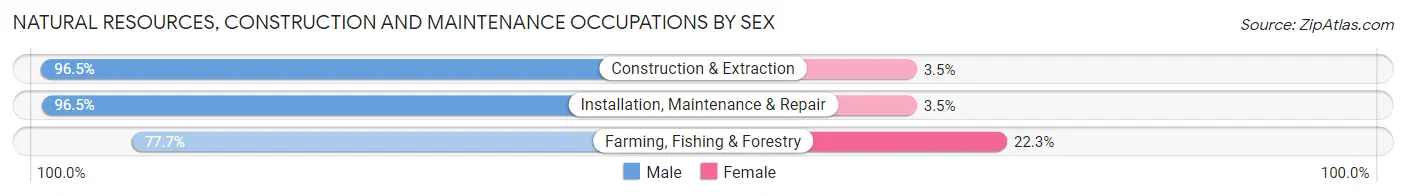
| Occupation | Male | Female |
| Farming, Fishing & Forestry | 2,276 (77.7%) | 653 (22.3%) |
| Construction & Extraction | 174,741 (96.5%) | 6,345 (3.5%) |
| Installation, Maintenance & Repair | 74,724 (96.5%) | 2,722 (3.5%) |
| Total (Category) | 251,741 (96.3%) | 9,720 (3.7%) |
| Total (Overall) | 1,268,361 (55.5%) | 1,016,814 (44.5%) |
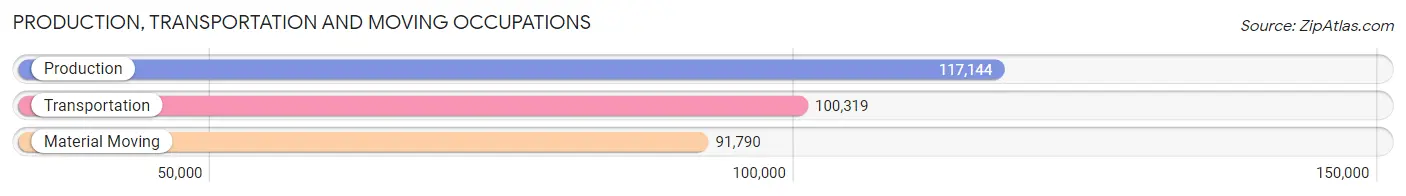
Production, Transportation and Moving Occupations
The most common Production, Transportation and Moving occupations in Harris County are Production (117,144 | 5.1%), Transportation (100,319 | 4.4%), and Material Moving (91,790 | 4.0%).
Production, Transportation and Moving Occupations by Sex
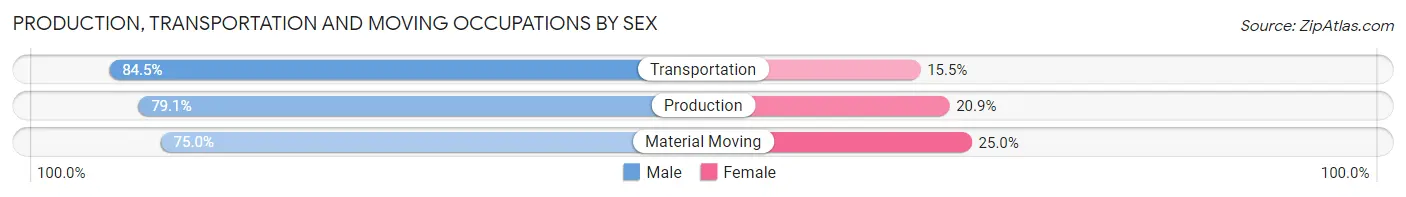
| Occupation | Male | Female |
| Production | 92,712 (79.1%) | 24,432 (20.9%) |
| Transportation | 84,738 (84.5%) | 15,581 (15.5%) |
| Material Moving | 68,866 (75.0%) | 22,924 (25.0%) |
| Total (Category) | 246,316 (79.6%) | 62,937 (20.3%) |
| Total (Overall) | 1,268,361 (55.5%) | 1,016,814 (44.5%) |
Employment Industries by Sex in Harris County
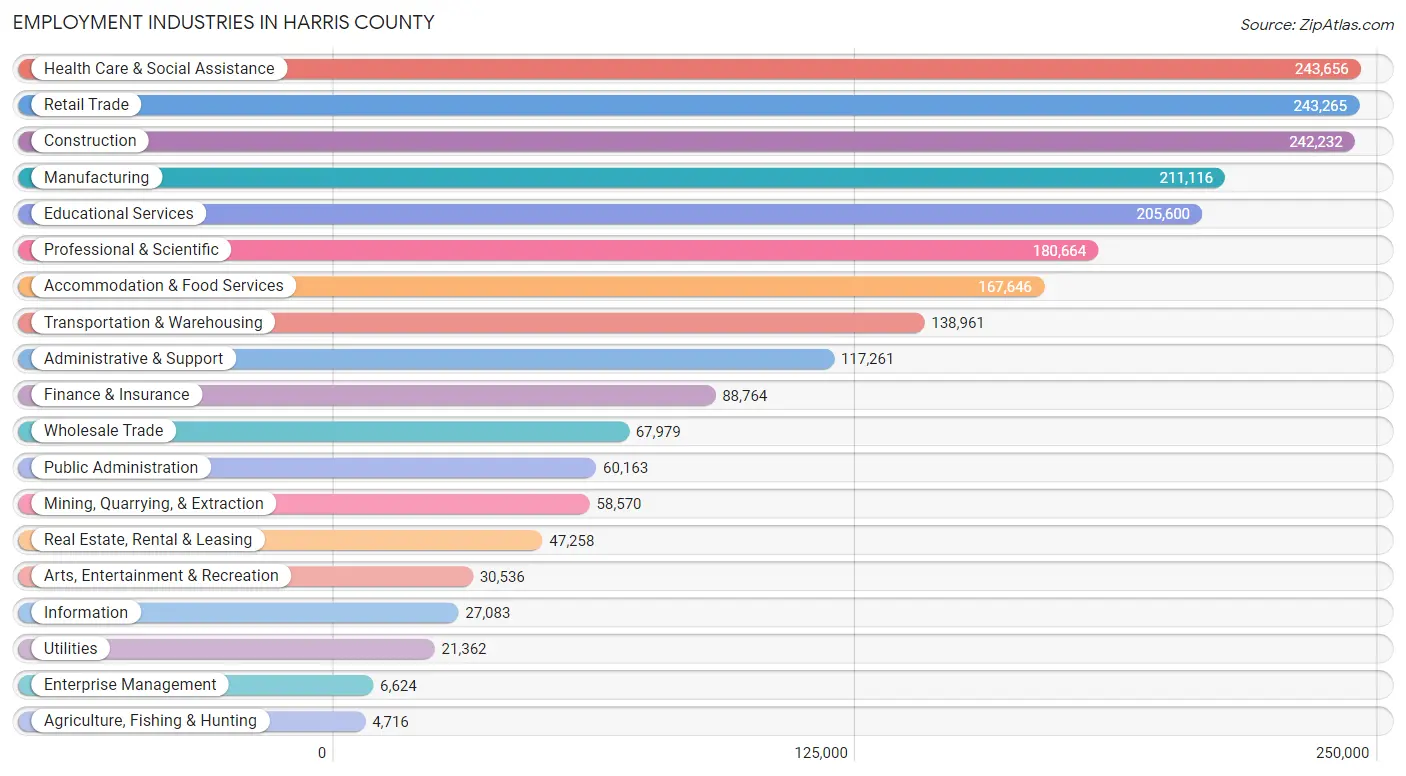
Employment Industries in Harris County
The major employment industries in Harris County include Health Care & Social Assistance (243,656 | 10.7%), Retail Trade (243,265 | 10.6%), Construction (242,232 | 10.6%), Manufacturing (211,116 | 9.2%), and Educational Services (205,600 | 9.0%).
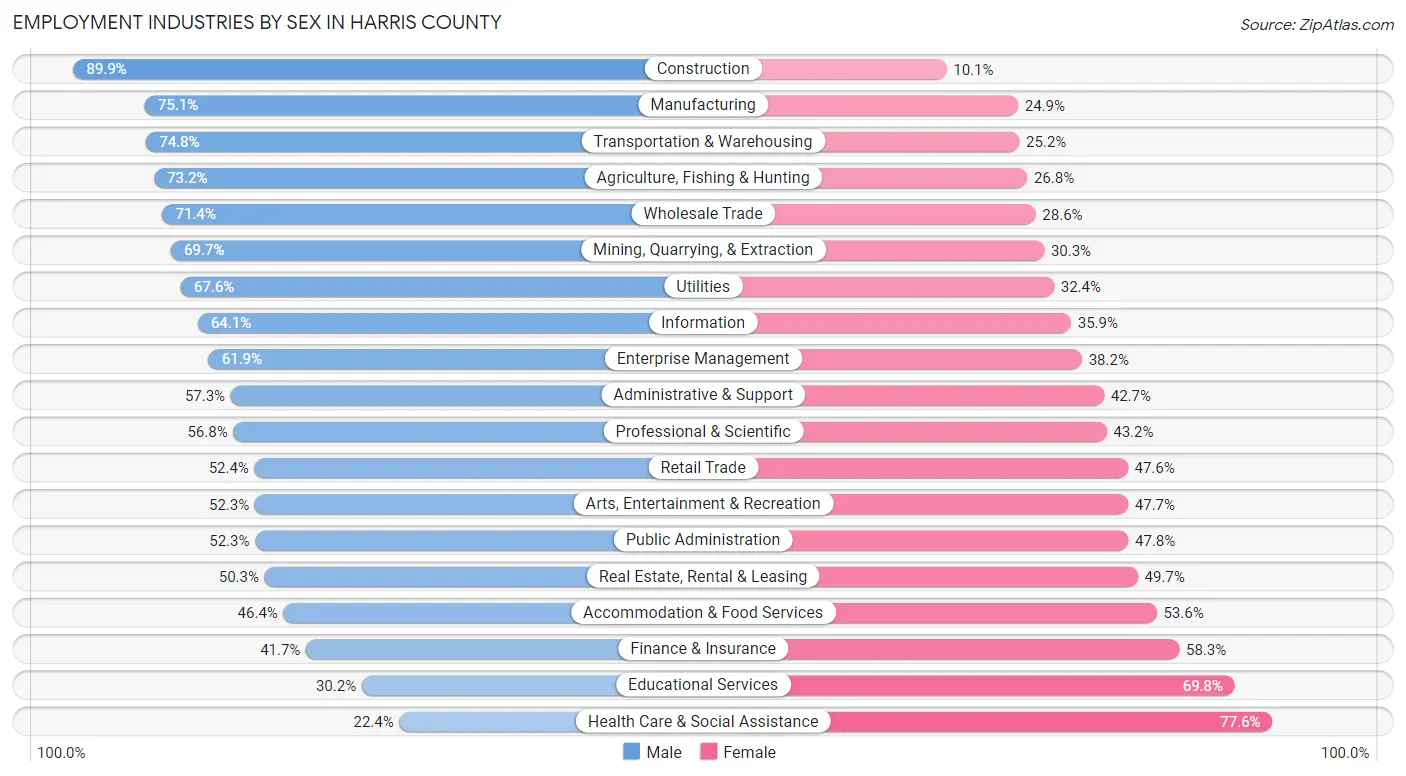
Employment Industries by Sex in Harris County
The Harris County industries that see more men than women are Construction (89.9%), Manufacturing (75.1%), and Transportation & Warehousing (74.8%), whereas the industries that tend to have a higher number of women are Health Care & Social Assistance (77.6%), Educational Services (69.8%), and Finance & Insurance (58.3%).
| Industry | Male | Female |
| Agriculture, Fishing & Hunting | 3,451 (73.2%) | 1,265 (26.8%) |
| Mining, Quarrying, & Extraction | 40,805 (69.7%) | 17,765 (30.3%) |
| Construction | 217,744 (89.9%) | 24,488 (10.1%) |
| Manufacturing | 158,517 (75.1%) | 52,599 (24.9%) |
| Wholesale Trade | 48,563 (71.4%) | 19,416 (28.6%) |
| Retail Trade | 127,403 (52.4%) | 115,862 (47.6%) |
| Transportation & Warehousing | 103,936 (74.8%) | 35,025 (25.2%) |
| Utilities | 14,449 (67.6%) | 6,913 (32.4%) |
| Information | 17,365 (64.1%) | 9,718 (35.9%) |
| Finance & Insurance | 37,026 (41.7%) | 51,738 (58.3%) |
| Real Estate, Rental & Leasing | 23,767 (50.3%) | 23,491 (49.7%) |
| Professional & Scientific | 102,543 (56.8%) | 78,121 (43.2%) |
| Enterprise Management | 4,097 (61.9%) | 2,527 (38.2%) |
| Administrative & Support | 67,177 (57.3%) | 50,084 (42.7%) |
| Educational Services | 62,026 (30.2%) | 143,574 (69.8%) |
| Health Care & Social Assistance | 54,546 (22.4%) | 189,110 (77.6%) |
| Arts, Entertainment & Recreation | 15,971 (52.3%) | 14,565 (47.7%) |
| Accommodation & Food Services | 77,752 (46.4%) | 89,894 (53.6%) |
| Public Administration | 31,433 (52.2%) | 28,730 (47.7%) |
| Total | 1,268,361 (55.5%) | 1,016,814 (44.5%) |
Education in Harris County
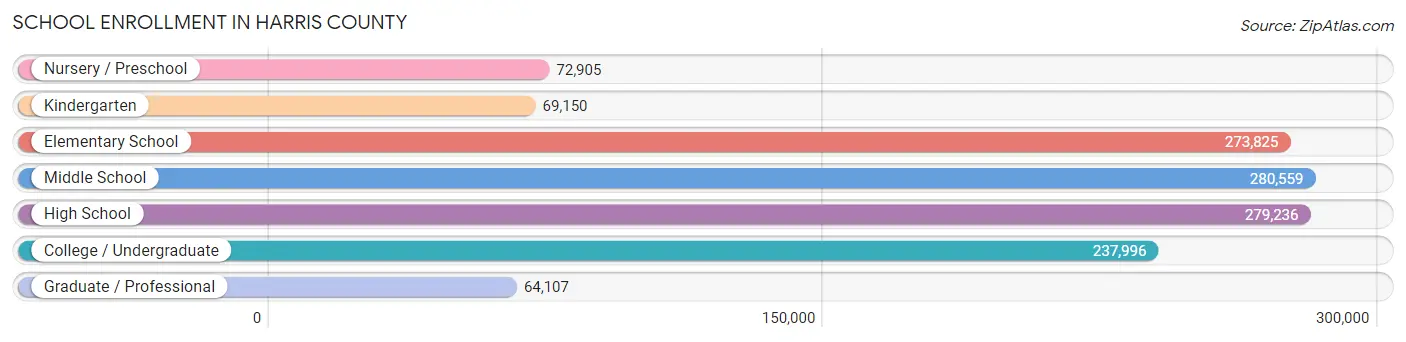
School Enrollment in Harris County
The most common levels of schooling among the 1,277,778 students in Harris County are middle school (280,559 | 22.0%), high school (279,236 | 21.8%), and elementary school (273,825 | 21.4%).
| School Level | # Students | % Students |
| Nursery / Preschool | 72,905 | 5.7% |
| Kindergarten | 69,150 | 5.4% |
| Elementary School | 273,825 | 21.4% |
| Middle School | 280,559 | 22.0% |
| High School | 279,236 | 21.8% |
| College / Undergraduate | 237,996 | 18.6% |
| Graduate / Professional | 64,107 | 5.0% |
| Total | 1,277,778 | 100.0% |
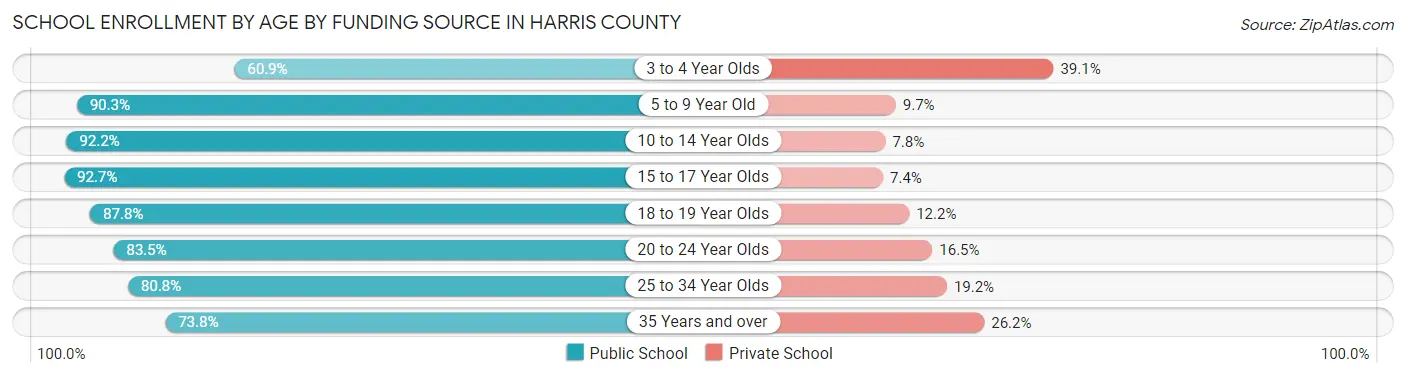
School Enrollment by Age by Funding Source in Harris County
Out of a total of 1,277,778 students who are enrolled in schools in Harris County, 158,444 (12.4%) attend a private institution, while the remaining 1,119,334 (87.6%) are enrolled in public schools. The age group of 3 to 4 year olds has the highest likelihood of being enrolled in private schools, with 22,425 (39.1% in the age bracket) enrolled. Conversely, the age group of 15 to 17 year olds has the lowest likelihood of being enrolled in a private school, with 184,637 (92.6% in the age bracket) attending a public institution.
| Age Bracket | Public School | Private School |
| 3 to 4 Year Olds | 34,959 (60.9%) | 22,425 (39.1%) |
| 5 to 9 Year Old | 289,186 (90.3%) | 31,145 (9.7%) |
| 10 to 14 Year Olds | 321,033 (92.2%) | 27,121 (7.8%) |
| 15 to 17 Year Olds | 184,637 (92.6%) | 14,640 (7.3%) |
| 18 to 19 Year Olds | 79,632 (87.8%) | 11,072 (12.2%) |
| 20 to 24 Year Olds | 97,249 (83.5%) | 19,246 (16.5%) |
| 25 to 34 Year Olds | 66,453 (80.8%) | 15,834 (19.2%) |
| 35 Years and over | 46,600 (73.8%) | 16,546 (26.2%) |
| Total | 1,119,334 (87.6%) | 158,444 (12.4%) |
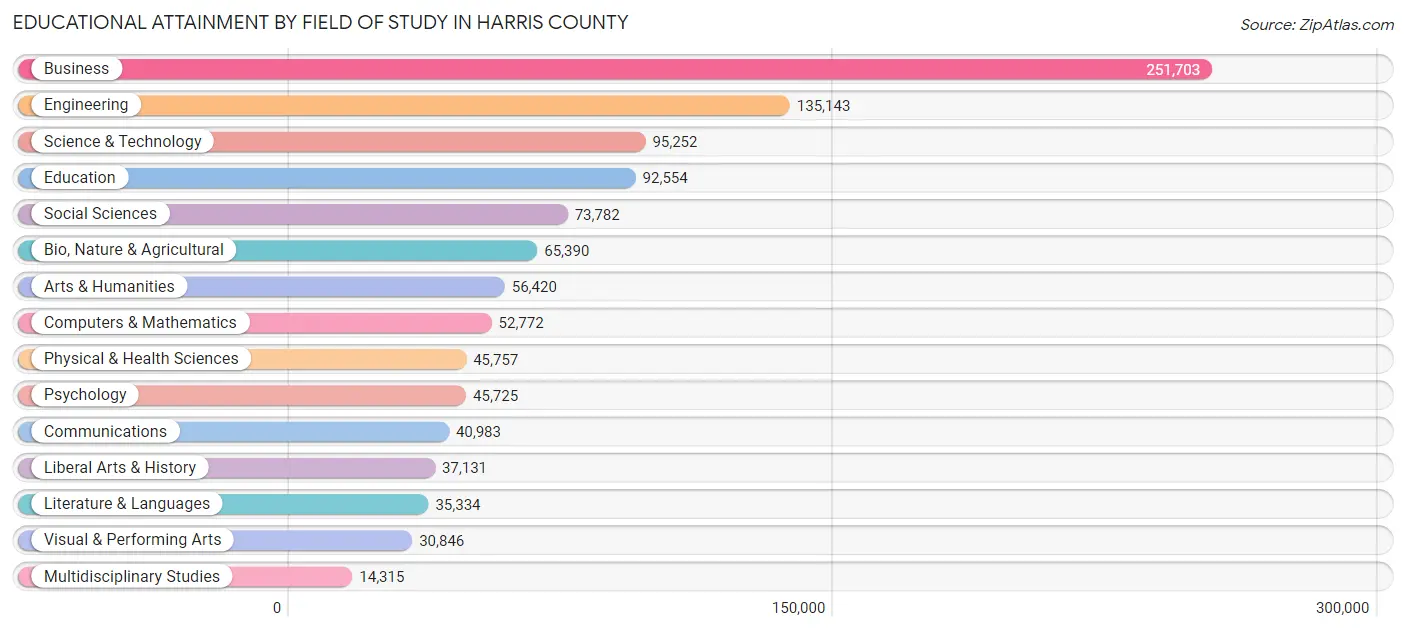
Educational Attainment by Field of Study in Harris County
Business (251,703 | 23.5%), engineering (135,143 | 12.6%), science & technology (95,252 | 8.9%), education (92,554 | 8.6%), and social sciences (73,782 | 6.9%) are the most common fields of study among 1,073,107 individuals in Harris County who have obtained a bachelor's degree or higher.
| Field of Study | # Graduates | % Graduates |
| Computers & Mathematics | 52,772 | 4.9% |
| Bio, Nature & Agricultural | 65,390 | 6.1% |
| Physical & Health Sciences | 45,757 | 4.3% |
| Psychology | 45,725 | 4.3% |
| Social Sciences | 73,782 | 6.9% |
| Engineering | 135,143 | 12.6% |
| Multidisciplinary Studies | 14,315 | 1.3% |
| Science & Technology | 95,252 | 8.9% |
| Business | 251,703 | 23.5% |
| Education | 92,554 | 8.6% |
| Literature & Languages | 35,334 | 3.3% |
| Liberal Arts & History | 37,131 | 3.5% |
| Visual & Performing Arts | 30,846 | 2.9% |
| Communications | 40,983 | 3.8% |
| Arts & Humanities | 56,420 | 5.3% |
| Total | 1,073,107 | 100.0% |
Transportation & Commute in Harris County
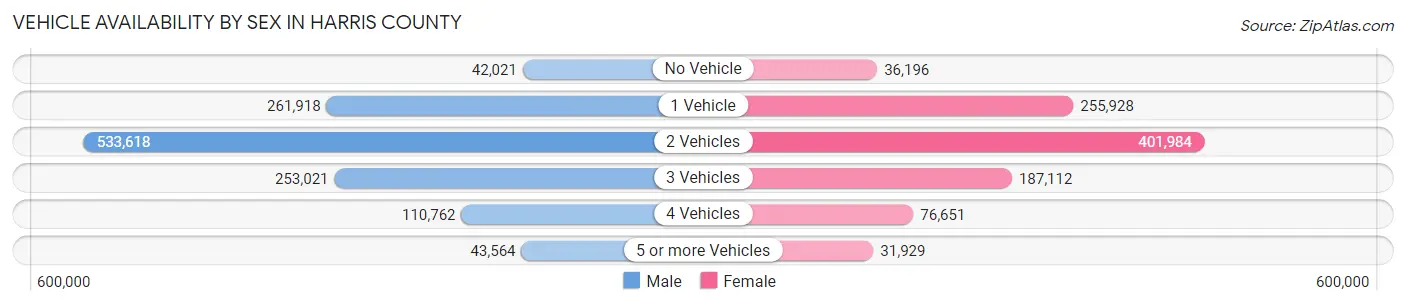
Vehicle Availability by Sex in Harris County
The most prevalent vehicle ownership categories in Harris County are males with 2 vehicles (533,618, accounting for 42.9%) and females with 2 vehicles (401,984, making up 53.9%).
| Vehicles Available | Male | Female |
| No Vehicle | 42,021 (3.4%) | 36,196 (3.7%) |
| 1 Vehicle | 261,918 (21.0%) | 255,928 (25.9%) |
| 2 Vehicles | 533,618 (42.9%) | 401,984 (40.6%) |
| 3 Vehicles | 253,021 (20.3%) | 187,112 (18.9%) |
| 4 Vehicles | 110,762 (8.9%) | 76,651 (7.7%) |
| 5 or more Vehicles | 43,564 (3.5%) | 31,929 (3.2%) |
| Total | 1,244,904 (100.0%) | 989,800 (100.0%) |
Commute Time in Harris County
The most frequently occuring commute durations in Harris County are 30 to 34 minutes (382,630 commuters, 18.9%), 20 to 24 minutes (297,121 commuters, 14.7%), and 15 to 19 minutes (280,055 commuters, 13.9%).
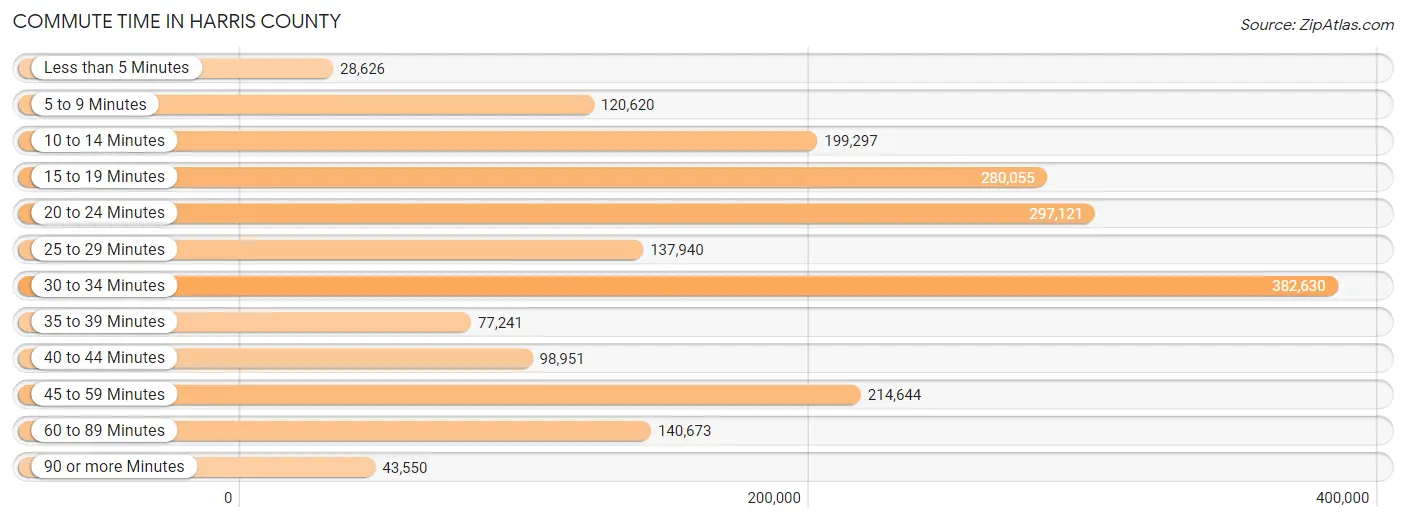
| Commute Time | # Commuters | % Commuters |
| Less than 5 Minutes | 28,626 | 1.4% |
| 5 to 9 Minutes | 120,620 | 6.0% |
| 10 to 14 Minutes | 199,297 | 9.9% |
| 15 to 19 Minutes | 280,055 | 13.9% |
| 20 to 24 Minutes | 297,121 | 14.7% |
| 25 to 29 Minutes | 137,940 | 6.8% |
| 30 to 34 Minutes | 382,630 | 18.9% |
| 35 to 39 Minutes | 77,241 | 3.8% |
| 40 to 44 Minutes | 98,951 | 4.9% |
| 45 to 59 Minutes | 214,644 | 10.6% |
| 60 to 89 Minutes | 140,673 | 7.0% |
| 90 or more Minutes | 43,550 | 2.1% |
Commute Time by Sex in Harris County
The most common commute times in Harris County are 30 to 34 minutes (228,951 commuters, 20.1%) for males and 30 to 34 minutes (153,679 commuters, 17.4%) for females.
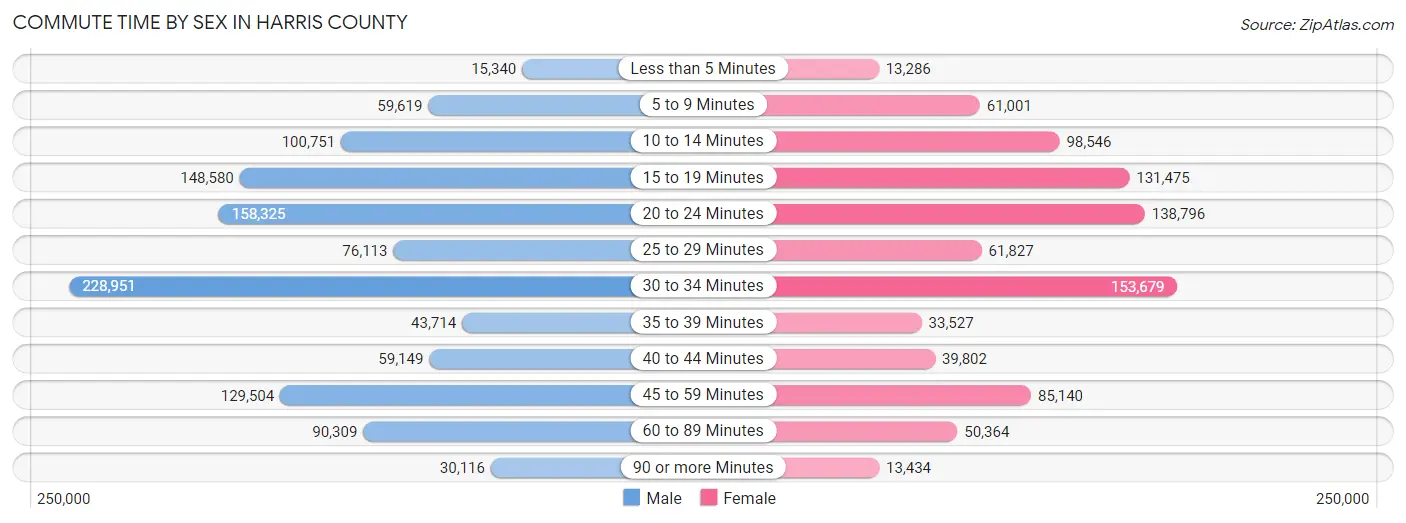
| Commute Time | Male | Female |
| Less than 5 Minutes | 15,340 (1.3%) | 13,286 (1.5%) |
| 5 to 9 Minutes | 59,619 (5.2%) | 61,001 (6.9%) |
| 10 to 14 Minutes | 100,751 (8.8%) | 98,546 (11.2%) |
| 15 to 19 Minutes | 148,580 (13.0%) | 131,475 (14.9%) |
| 20 to 24 Minutes | 158,325 (13.9%) | 138,796 (15.8%) |
| 25 to 29 Minutes | 76,113 (6.7%) | 61,827 (7.0%) |
| 30 to 34 Minutes | 228,951 (20.1%) | 153,679 (17.4%) |
| 35 to 39 Minutes | 43,714 (3.8%) | 33,527 (3.8%) |
| 40 to 44 Minutes | 59,149 (5.2%) | 39,802 (4.5%) |
| 45 to 59 Minutes | 129,504 (11.4%) | 85,140 (9.7%) |
| 60 to 89 Minutes | 90,309 (7.9%) | 50,364 (5.7%) |
| 90 or more Minutes | 30,116 (2.6%) | 13,434 (1.5%) |
Time of Departure to Work by Sex in Harris County
The most frequent times of departure to work in Harris County are 7:00 AM to 7:29 AM (166,644, 14.6%) for males and 7:00 AM to 7:29 AM (139,936, 15.9%) for females.
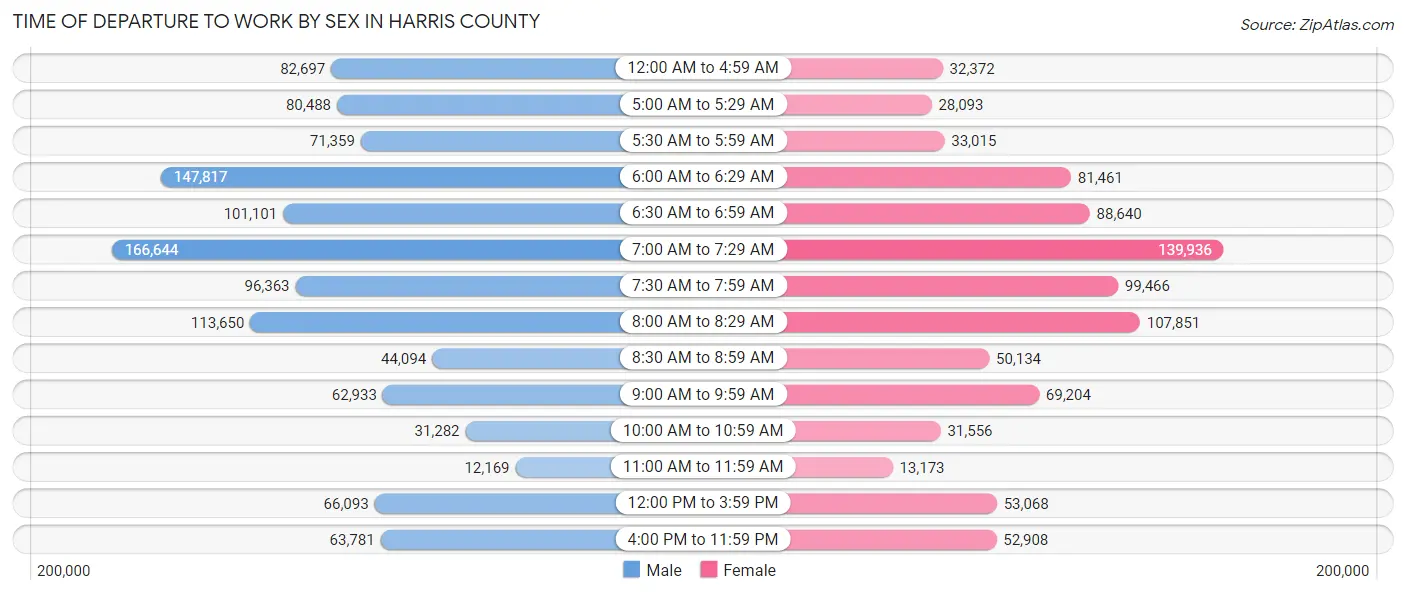
| Time of Departure | Male | Female |
| 12:00 AM to 4:59 AM | 82,697 (7.2%) | 32,372 (3.7%) |
| 5:00 AM to 5:29 AM | 80,488 (7.1%) | 28,093 (3.2%) |
| 5:30 AM to 5:59 AM | 71,359 (6.3%) | 33,015 (3.7%) |
| 6:00 AM to 6:29 AM | 147,817 (13.0%) | 81,461 (9.2%) |
| 6:30 AM to 6:59 AM | 101,101 (8.9%) | 88,640 (10.1%) |
| 7:00 AM to 7:29 AM | 166,644 (14.6%) | 139,936 (15.9%) |
| 7:30 AM to 7:59 AM | 96,363 (8.5%) | 99,466 (11.3%) |
| 8:00 AM to 8:29 AM | 113,650 (10.0%) | 107,851 (12.2%) |
| 8:30 AM to 8:59 AM | 44,094 (3.9%) | 50,134 (5.7%) |
| 9:00 AM to 9:59 AM | 62,933 (5.5%) | 69,204 (7.9%) |
| 10:00 AM to 10:59 AM | 31,282 (2.7%) | 31,556 (3.6%) |
| 11:00 AM to 11:59 AM | 12,169 (1.1%) | 13,173 (1.5%) |
| 12:00 PM to 3:59 PM | 66,093 (5.8%) | 53,068 (6.0%) |
| 4:00 PM to 11:59 PM | 63,781 (5.6%) | 52,908 (6.0%) |
| Total | 1,140,471 (100.0%) | 880,877 (100.0%) |
Housing Occupancy in Harris County
Occupancy by Ownership in Harris County
Of the total 1,692,896 dwellings in Harris County, owner-occupied units account for 924,703 (54.6%), while renter-occupied units make up 768,193 (45.4%).
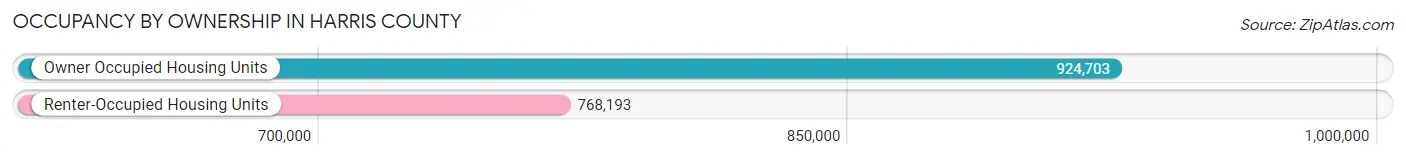
| Occupancy | # Housing Units | % Housing Units |
| Owner Occupied Housing Units | 924,703 | 54.6% |
| Renter-Occupied Housing Units | 768,193 | 45.4% |
| Total Occupied Housing Units | 1,692,896 | 100.0% |
Occupancy by Household Size in Harris County
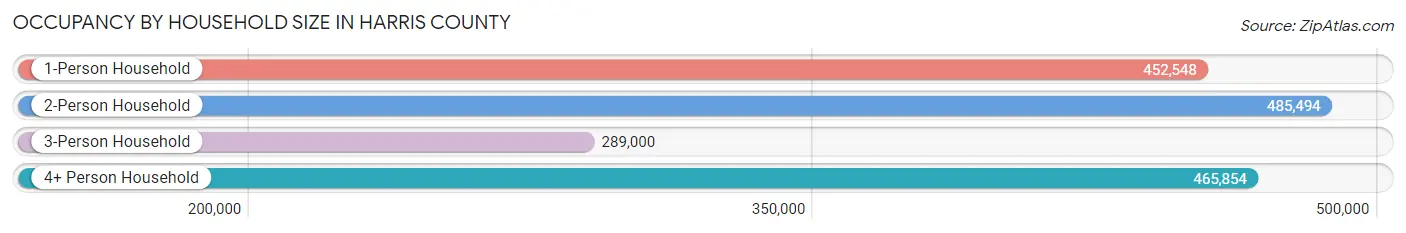
| Household Size | # Housing Units | % Housing Units |
| 1-Person Household | 452,548 | 26.7% |
| 2-Person Household | 485,494 | 28.7% |
| 3-Person Household | 289,000 | 17.1% |
| 4+ Person Household | 465,854 | 27.5% |
| Total Housing Units | 1,692,896 | 100.0% |
Occupancy by Ownership by Household Size in Harris County
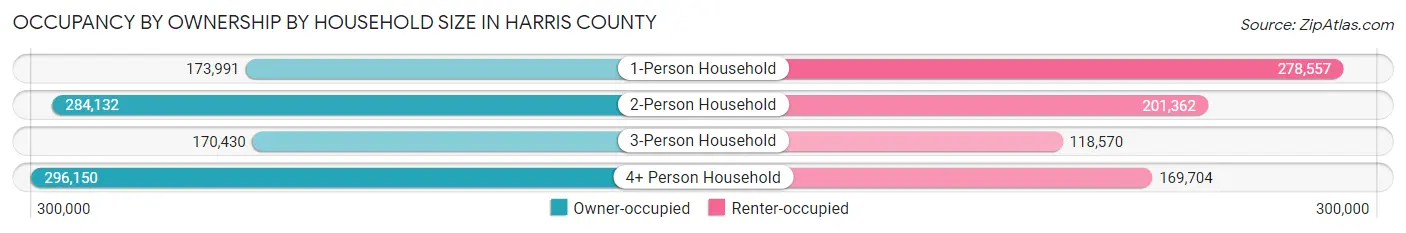
| Household Size | Owner-occupied | Renter-occupied |
| 1-Person Household | 173,991 (38.5%) | 278,557 (61.6%) |
| 2-Person Household | 284,132 (58.5%) | 201,362 (41.5%) |
| 3-Person Household | 170,430 (59.0%) | 118,570 (41.0%) |
| 4+ Person Household | 296,150 (63.6%) | 169,704 (36.4%) |
| Total Housing Units | 924,703 (54.6%) | 768,193 (45.4%) |
Occupancy by Educational Attainment in Harris County
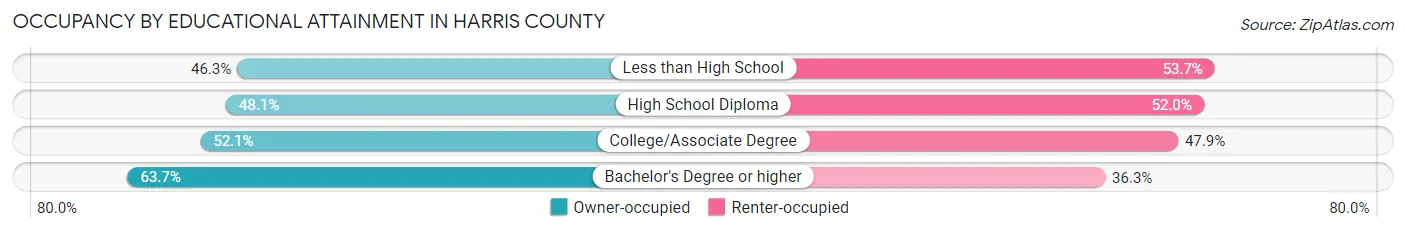
| Household Size | Owner-occupied | Renter-occupied |
| Less than High School | 122,119 (46.3%) | 141,579 (53.7%) |
| High School Diploma | 164,708 (48.0%) | 178,065 (51.9%) |
| College/Associate Degree | 243,577 (52.1%) | 223,655 (47.9%) |
| Bachelor's Degree or higher | 394,299 (63.7%) | 224,894 (36.3%) |
Occupancy by Age of Householder in Harris County
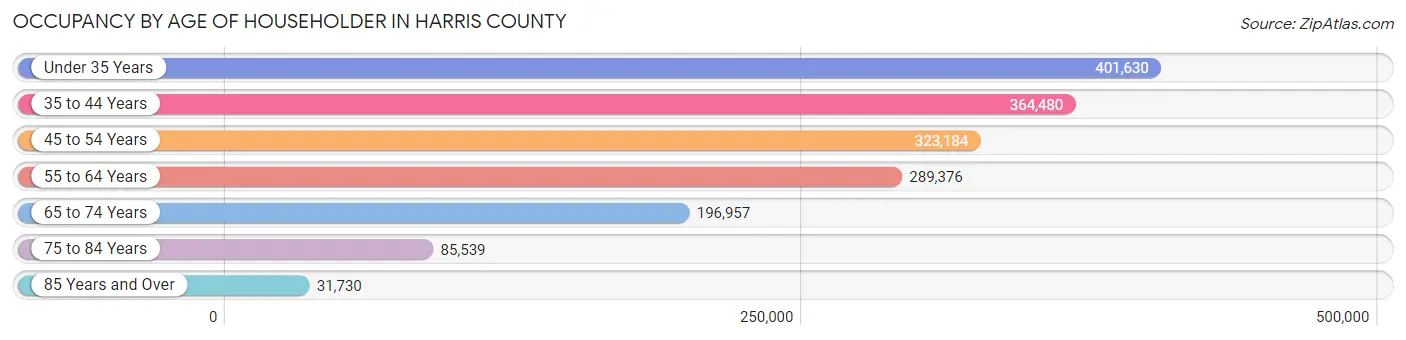
| Age Bracket | # Households | % Households |
| Under 35 Years | 401,630 | 23.7% |
| 35 to 44 Years | 364,480 | 21.5% |
| 45 to 54 Years | 323,184 | 19.1% |
| 55 to 64 Years | 289,376 | 17.1% |
| 65 to 74 Years | 196,957 | 11.6% |
| 75 to 84 Years | 85,539 | 5.1% |
| 85 Years and Over | 31,730 | 1.9% |
| Total | 1,692,896 | 100.0% |
Housing Finances in Harris County
Median Income by Occupancy in Harris County
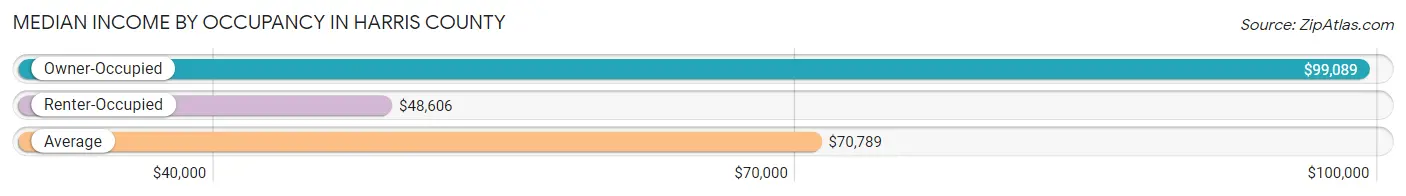
| Occupancy Type | # Households | Median Income |
| Owner-Occupied | 924,703 (54.6%) | $99,089 |
| Renter-Occupied | 768,193 (45.4%) | $48,606 |
| Average | 1,692,896 (100.0%) | $70,789 |
Occupancy by Householder Income Bracket in Harris County
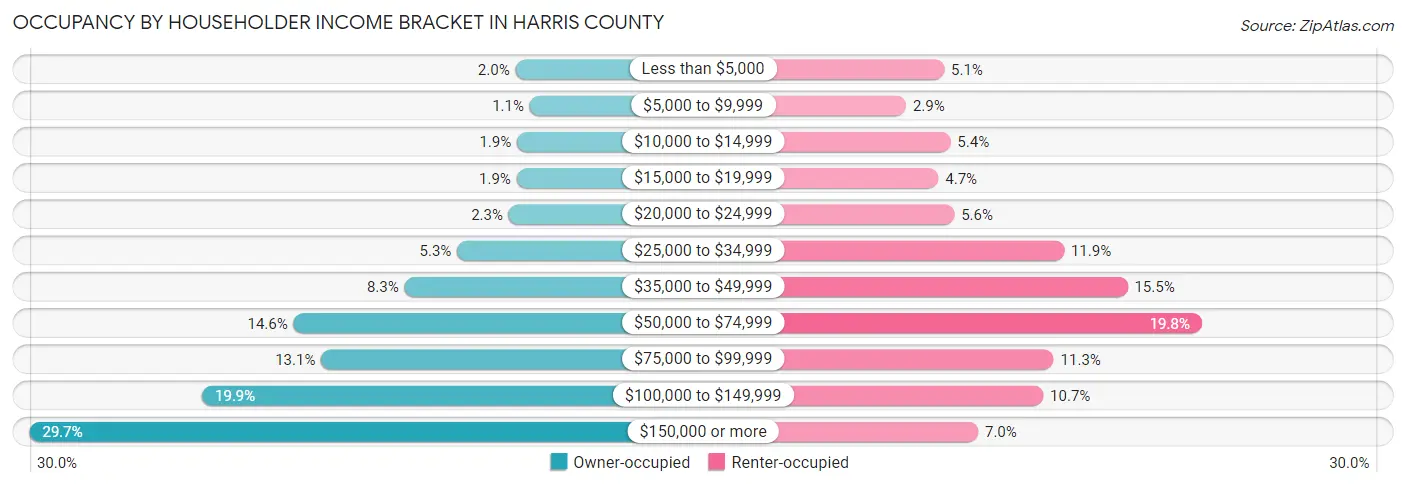
| Income Bracket | Owner-occupied | Renter-occupied |
| Less than $5,000 | 17,986 (1.9%) | 38,863 (5.1%) |
| $5,000 to $9,999 | 10,453 (1.1%) | 22,128 (2.9%) |
| $10,000 to $14,999 | 17,231 (1.9%) | 41,621 (5.4%) |
| $15,000 to $19,999 | 17,352 (1.9%) | 36,326 (4.7%) |
| $20,000 to $24,999 | 21,589 (2.3%) | 43,334 (5.6%) |
| $25,000 to $34,999 | 48,856 (5.3%) | 91,518 (11.9%) |
| $35,000 to $49,999 | 76,617 (8.3%) | 119,382 (15.5%) |
| $50,000 to $74,999 | 135,243 (14.6%) | 151,984 (19.8%) |
| $75,000 to $99,999 | 120,695 (13.1%) | 86,932 (11.3%) |
| $100,000 to $149,999 | 183,772 (19.9%) | 82,327 (10.7%) |
| $150,000 or more | 274,909 (29.7%) | 53,778 (7.0%) |
| Total | 924,703 (100.0%) | 768,193 (100.0%) |
Monthly Housing Cost Tiers in Harris County
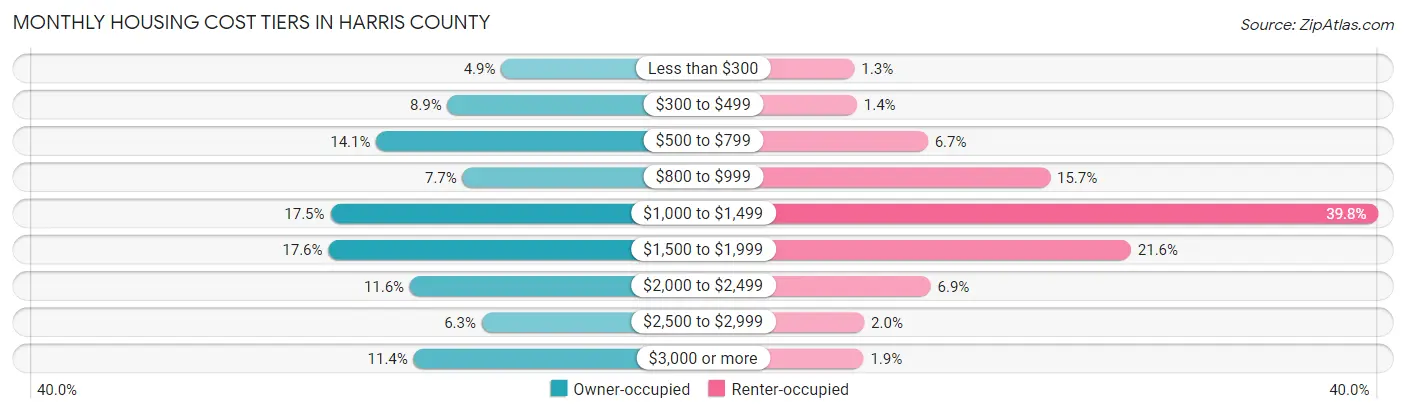
| Monthly Cost | Owner-occupied | Renter-occupied |
| Less than $300 | 45,227 (4.9%) | 9,629 (1.3%) |
| $300 to $499 | 81,863 (8.8%) | 11,001 (1.4%) |
| $500 to $799 | 130,371 (14.1%) | 51,122 (6.7%) |
| $800 to $999 | 71,581 (7.7%) | 120,285 (15.7%) |
| $1,000 to $1,499 | 161,671 (17.5%) | 305,979 (39.8%) |
| $1,500 to $1,999 | 162,992 (17.6%) | 166,025 (21.6%) |
| $2,000 to $2,499 | 107,457 (11.6%) | 52,730 (6.9%) |
| $2,500 to $2,999 | 58,555 (6.3%) | 15,141 (2.0%) |
| $3,000 or more | 104,986 (11.4%) | 14,737 (1.9%) |
| Total | 924,703 (100.0%) | 768,193 (100.0%) |
Physical Housing Characteristics in Harris County
Housing Structures in Harris County
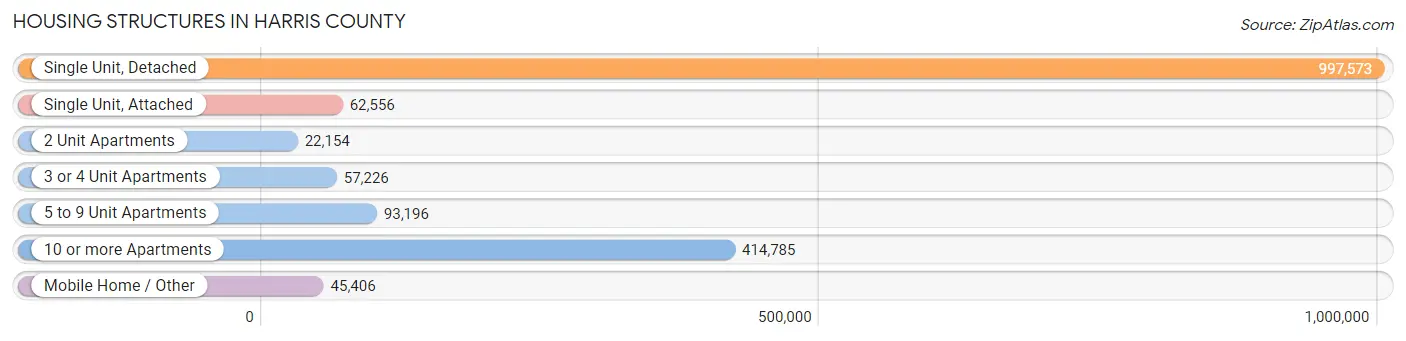
| Structure Type | # Housing Units | % Housing Units |
| Single Unit, Detached | 997,573 | 58.9% |
| Single Unit, Attached | 62,556 | 3.7% |
| 2 Unit Apartments | 22,154 | 1.3% |
| 3 or 4 Unit Apartments | 57,226 | 3.4% |
| 5 to 9 Unit Apartments | 93,196 | 5.5% |
| 10 or more Apartments | 414,785 | 24.5% |
| Mobile Home / Other | 45,406 | 2.7% |
| Total | 1,692,896 | 100.0% |
Housing Structures by Occupancy in Harris County
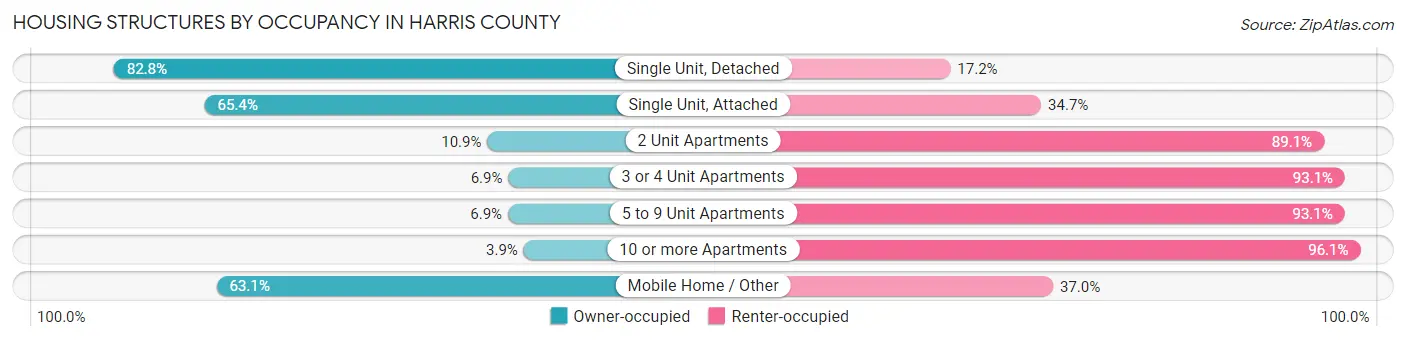
| Structure Type | Owner-occupied | Renter-occupied |
| Single Unit, Detached | 826,166 (82.8%) | 171,407 (17.2%) |
| Single Unit, Attached | 40,883 (65.3%) | 21,673 (34.6%) |
| 2 Unit Apartments | 2,417 (10.9%) | 19,737 (89.1%) |
| 3 or 4 Unit Apartments | 3,931 (6.9%) | 53,295 (93.1%) |
| 5 to 9 Unit Apartments | 6,467 (6.9%) | 86,729 (93.1%) |
| 10 or more Apartments | 16,212 (3.9%) | 398,573 (96.1%) |
| Mobile Home / Other | 28,627 (63.0%) | 16,779 (36.9%) |
| Total | 924,703 (54.6%) | 768,193 (45.4%) |
Housing Structures by Number of Rooms in Harris County
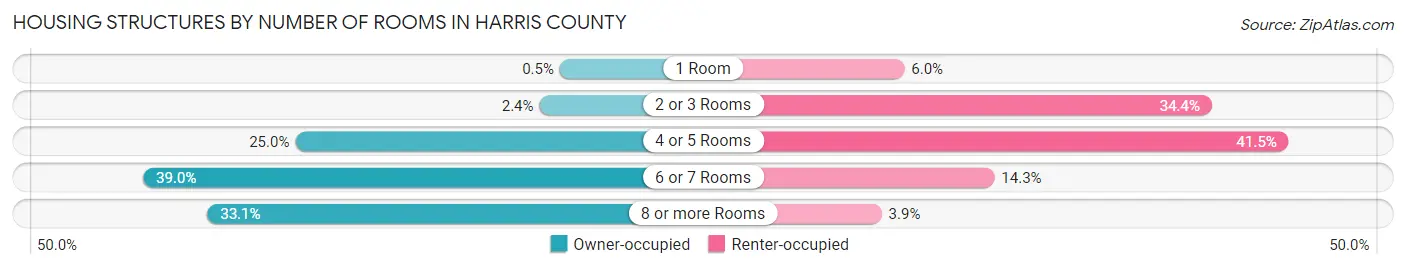
| Number of Rooms | Owner-occupied | Renter-occupied |
| 1 Room | 4,607 (0.5%) | 45,805 (6.0%) |
| 2 or 3 Rooms | 22,110 (2.4%) | 264,196 (34.4%) |
| 4 or 5 Rooms | 230,906 (25.0%) | 318,773 (41.5%) |
| 6 or 7 Rooms | 360,987 (39.0%) | 109,798 (14.3%) |
| 8 or more Rooms | 306,093 (33.1%) | 29,621 (3.9%) |
| Total | 924,703 (100.0%) | 768,193 (100.0%) |
Housing Structure by Heating Type in Harris County
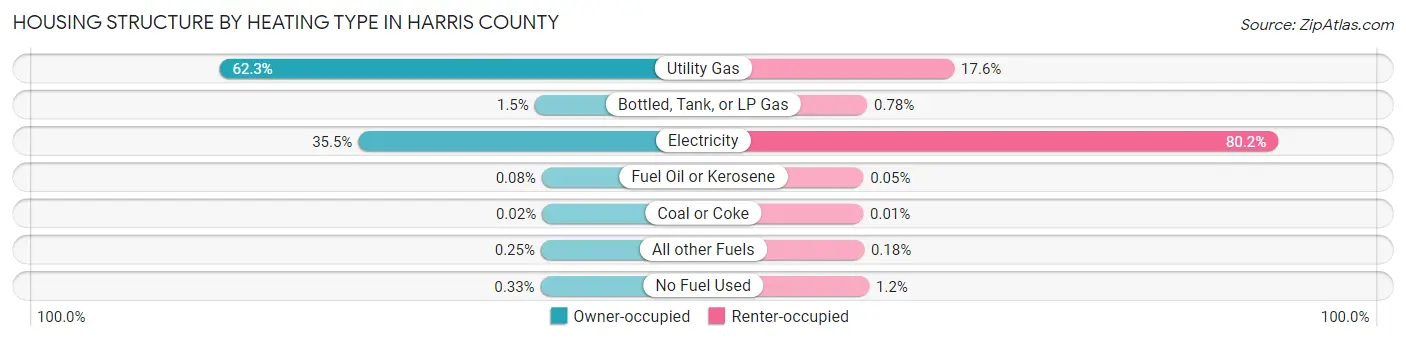
| Heating Type | Owner-occupied | Renter-occupied |
| Utility Gas | 576,418 (62.3%) | 135,312 (17.6%) |
| Bottled, Tank, or LP Gas | 13,386 (1.5%) | 5,967 (0.8%) |
| Electricity | 328,606 (35.5%) | 616,065 (80.2%) |
| Fuel Oil or Kerosene | 714 (0.1%) | 406 (0.1%) |
| Coal or Coke | 158 (0.0%) | 106 (0.0%) |
| All other Fuels | 2,337 (0.3%) | 1,356 (0.2%) |
| No Fuel Used | 3,084 (0.3%) | 8,981 (1.2%) |
| Total | 924,703 (100.0%) | 768,193 (100.0%) |
Household Vehicle Usage in Harris County
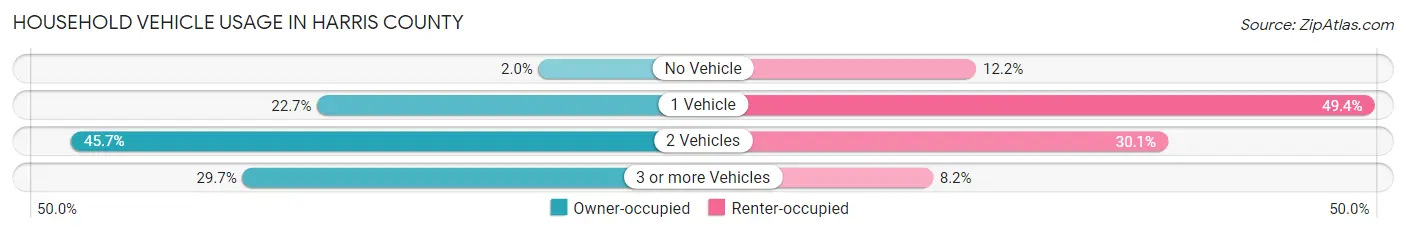
| Vehicles per Household | Owner-occupied | Renter-occupied |
| No Vehicle | 18,587 (2.0%) | 94,027 (12.2%) |
| 1 Vehicle | 209,664 (22.7%) | 379,627 (49.4%) |
| 2 Vehicles | 422,160 (45.7%) | 231,540 (30.1%) |
| 3 or more Vehicles | 274,292 (29.7%) | 62,999 (8.2%) |
| Total | 924,703 (100.0%) | 768,193 (100.0%) |
Real Estate & Mortgages in Harris County
Real Estate and Mortgage Overview in Harris County
| Characteristic | Without Mortgage | With Mortgage |
| Housing Units | 387,191 | 537,512 |
| Median Property Value | $206,100 | $251,900 |
| Median Household Income | $76,164 | $192,037 |
| Monthly Housing Costs | $666 | $96,542 |
| Real Estate Taxes | $3,154 | $23,889 |
Property Value by Mortgage Status in Harris County
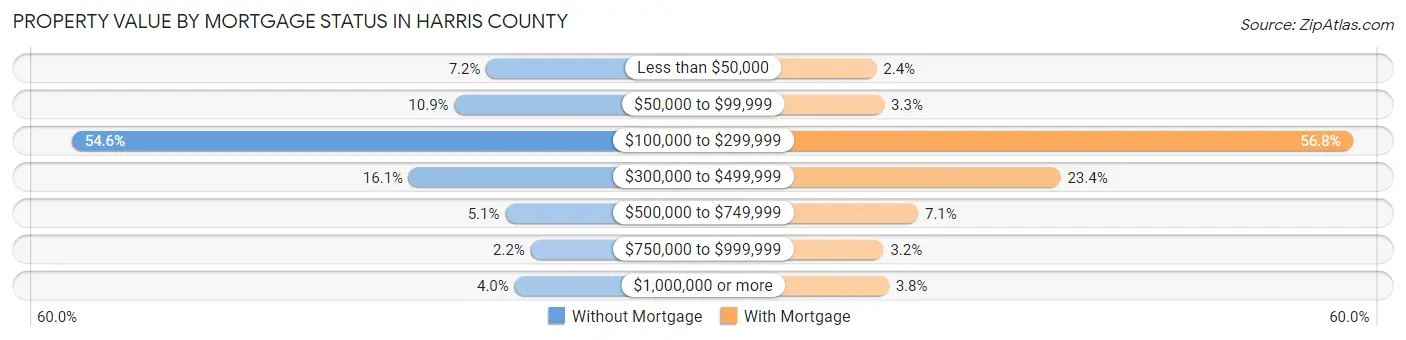
| Property Value | Without Mortgage | With Mortgage |
| Less than $50,000 | 27,976 (7.2%) | 12,796 (2.4%) |
| $50,000 to $99,999 | 42,116 (10.9%) | 17,593 (3.3%) |
| $100,000 to $299,999 | 211,399 (54.6%) | 305,316 (56.8%) |
| $300,000 to $499,999 | 62,279 (16.1%) | 125,905 (23.4%) |
| $500,000 to $749,999 | 19,579 (5.1%) | 38,357 (7.1%) |
| $750,000 to $999,999 | 8,354 (2.2%) | 17,149 (3.2%) |
| $1,000,000 or more | 15,488 (4.0%) | 20,396 (3.8%) |
| Total | 387,191 (100.0%) | 537,512 (100.0%) |
Household Income by Mortgage Status in Harris County
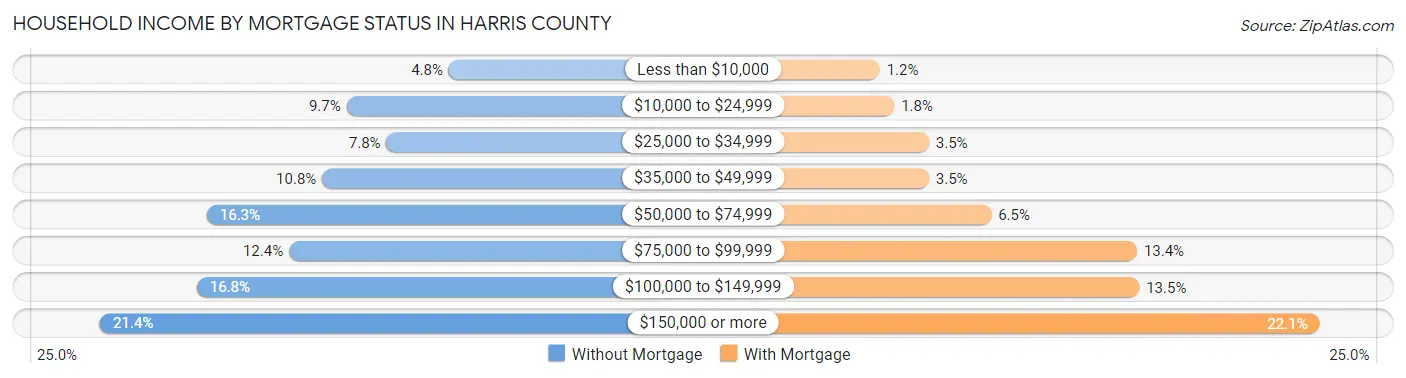
| Household Income | Without Mortgage | With Mortgage |
| Less than $10,000 | 18,572 (4.8%) | 6,189 (1.1%) |
| $10,000 to $24,999 | 37,436 (9.7%) | 9,867 (1.8%) |
| $25,000 to $34,999 | 30,078 (7.8%) | 18,736 (3.5%) |
| $35,000 to $49,999 | 41,914 (10.8%) | 18,778 (3.5%) |
| $50,000 to $74,999 | 63,191 (16.3%) | 34,703 (6.5%) |
| $75,000 to $99,999 | 48,067 (12.4%) | 72,052 (13.4%) |
| $100,000 to $149,999 | 65,061 (16.8%) | 72,628 (13.5%) |
| $150,000 or more | 82,872 (21.4%) | 118,711 (22.1%) |
| Total | 387,191 (100.0%) | 537,512 (100.0%) |
Property Value to Household Income Ratio in Harris County
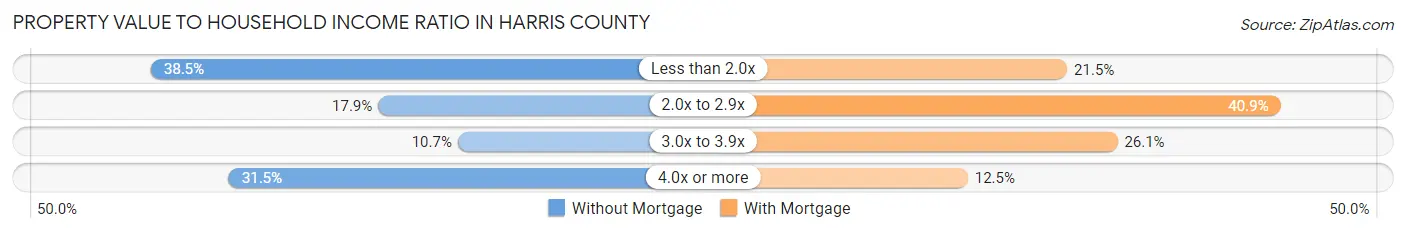
| Value-to-Income Ratio | Without Mortgage | With Mortgage |
| Less than 2.0x | 149,185 (38.5%) | 115,803 (21.5%) |
| 2.0x to 2.9x | 69,293 (17.9%) | 219,870 (40.9%) |
| 3.0x to 3.9x | 41,294 (10.7%) | 140,367 (26.1%) |
| 4.0x or more | 121,772 (31.5%) | 67,311 (12.5%) |
| Total | 387,191 (100.0%) | 537,512 (100.0%) |
Real Estate Taxes by Mortgage Status in Harris County
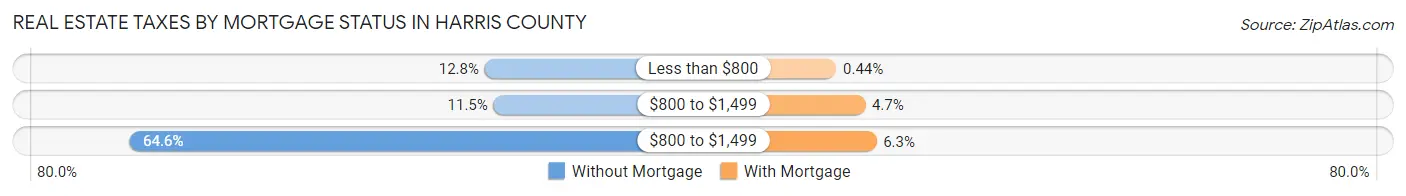
| Property Taxes | Without Mortgage | With Mortgage |
| Less than $800 | 49,407 (12.8%) | 2,370 (0.4%) |
| $800 to $1,499 | 44,421 (11.5%) | 25,053 (4.7%) |
| $800 to $1,499 | 250,039 (64.6%) | 33,918 (6.3%) |
| Total | 387,191 (100.0%) | 537,512 (100.0%) |
Health & Disability in Harris County
Health Insurance Coverage by Age in Harris County
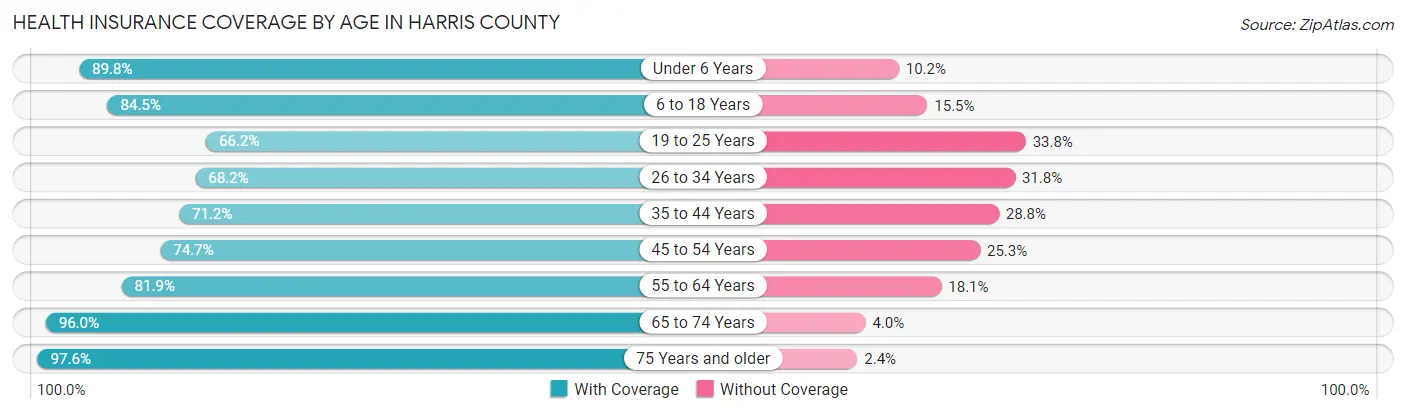
| Age Bracket | With Coverage | Without Coverage |
| Under 6 Years | 361,167 (89.8%) | 40,861 (10.2%) |
| 6 to 18 Years | 761,107 (84.5%) | 139,518 (15.5%) |
| 19 to 25 Years | 301,781 (66.2%) | 154,311 (33.8%) |
| 26 to 34 Years | 451,297 (68.2%) | 210,695 (31.8%) |
| 35 to 44 Years | 482,875 (71.2%) | 195,425 (28.8%) |
| 45 to 54 Years | 436,783 (74.7%) | 148,032 (25.3%) |
| 55 to 64 Years | 411,555 (81.9%) | 90,931 (18.1%) |
| 65 to 74 Years | 313,187 (96.0%) | 12,923 (4.0%) |
| 75 Years and older | 183,408 (97.6%) | 4,591 (2.4%) |
| Total | 3,703,160 (78.8%) | 997,287 (21.2%) |
Health Insurance Coverage by Citizenship Status in Harris County
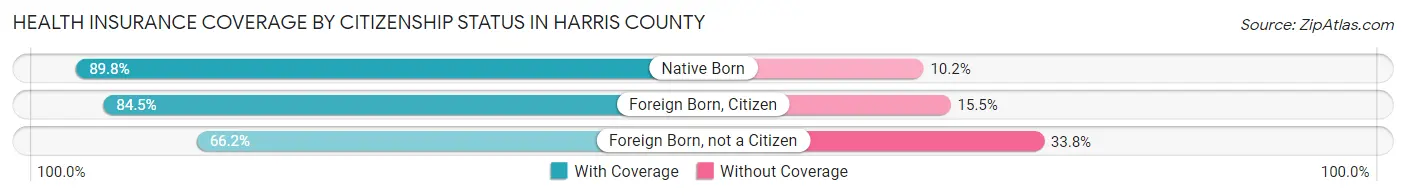
| Citizenship Status | With Coverage | Without Coverage |
| Native Born | 361,167 (89.8%) | 40,861 (10.2%) |
| Foreign Born, Citizen | 761,107 (84.5%) | 139,518 (15.5%) |
| Foreign Born, not a Citizen | 301,781 (66.2%) | 154,311 (33.8%) |
Health Insurance Coverage by Household Income in Harris County
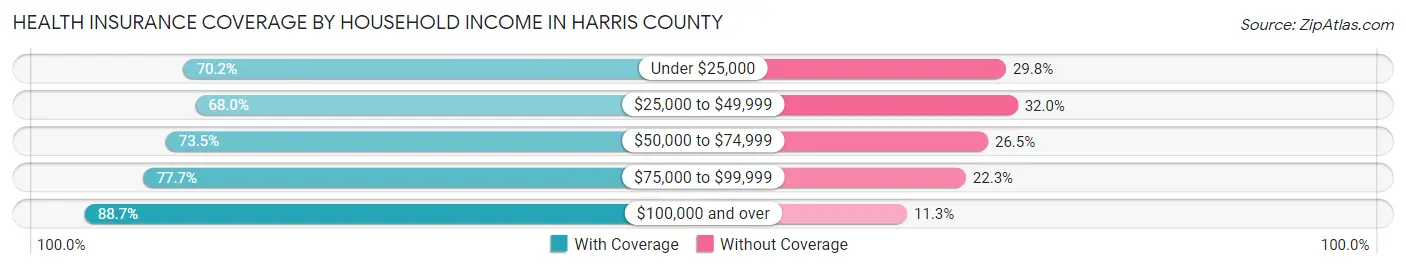
| Household Income | With Coverage | Without Coverage |
| Under $25,000 | 396,126 (70.2%) | 168,299 (29.8%) |
| $25,000 to $49,999 | 579,481 (68.0%) | 272,952 (32.0%) |
| $50,000 to $74,999 | 561,229 (73.5%) | 202,087 (26.5%) |
| $75,000 to $99,999 | 478,169 (77.7%) | 137,389 (22.3%) |
| $100,000 and over | 1,669,991 (88.7%) | 212,538 (11.3%) |
Public vs Private Health Insurance Coverage by Age in Harris County
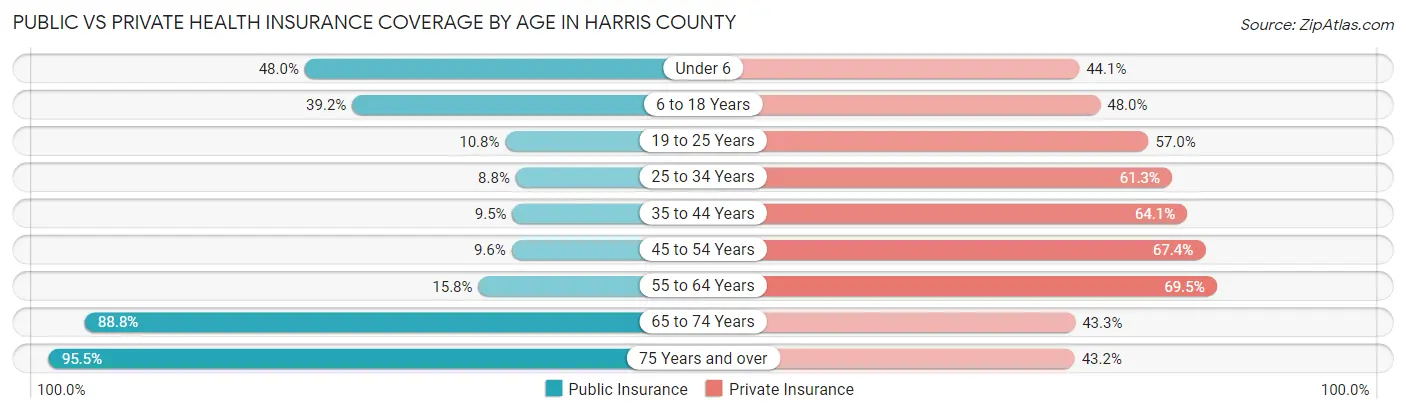
| Age Bracket | Public Insurance | Private Insurance |
| Under 6 | 192,962 (48.0%) | 177,187 (44.1%) |
| 6 to 18 Years | 353,019 (39.2%) | 432,136 (48.0%) |
| 19 to 25 Years | 49,139 (10.8%) | 259,724 (57.0%) |
| 25 to 34 Years | 58,488 (8.8%) | 405,538 (61.3%) |
| 35 to 44 Years | 64,088 (9.5%) | 434,668 (64.1%) |
| 45 to 54 Years | 56,182 (9.6%) | 394,299 (67.4%) |
| 55 to 64 Years | 79,293 (15.8%) | 349,426 (69.5%) |
| 65 to 74 Years | 289,600 (88.8%) | 141,295 (43.3%) |
| 75 Years and over | 179,533 (95.5%) | 81,300 (43.2%) |
| Total | 1,322,304 (28.1%) | 2,675,573 (56.9%) |
Disability Status by Sex by Age in Harris County
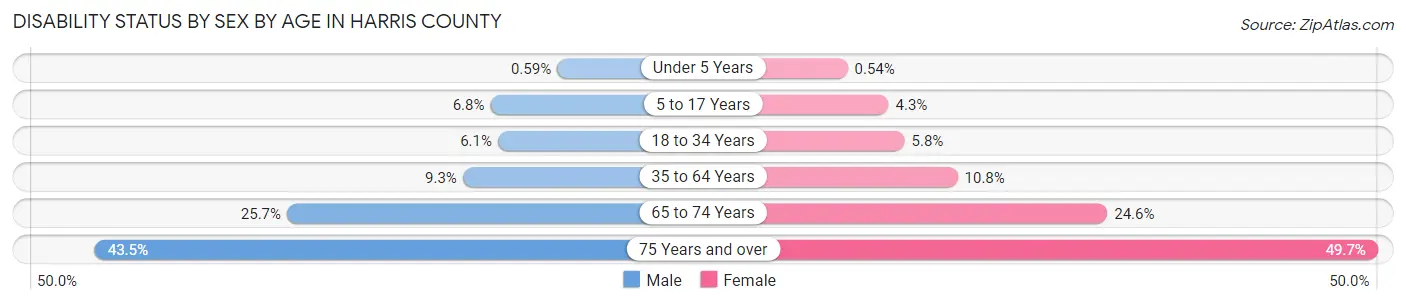
| Age Bracket | Male | Female |
| Under 5 Years | 997 (0.6%) | 875 (0.5%) |
| 5 to 17 Years | 31,278 (6.8%) | 19,254 (4.3%) |
| 18 to 34 Years | 36,238 (6.1%) | 34,191 (5.8%) |
| 35 to 64 Years | 82,571 (9.3%) | 94,756 (10.7%) |
| 65 to 74 Years | 39,195 (25.7%) | 42,707 (24.6%) |
| 75 Years and over | 33,469 (43.5%) | 55,207 (49.7%) |
Disability Class by Sex by Age in Harris County
Disability Class: Hearing Difficulty
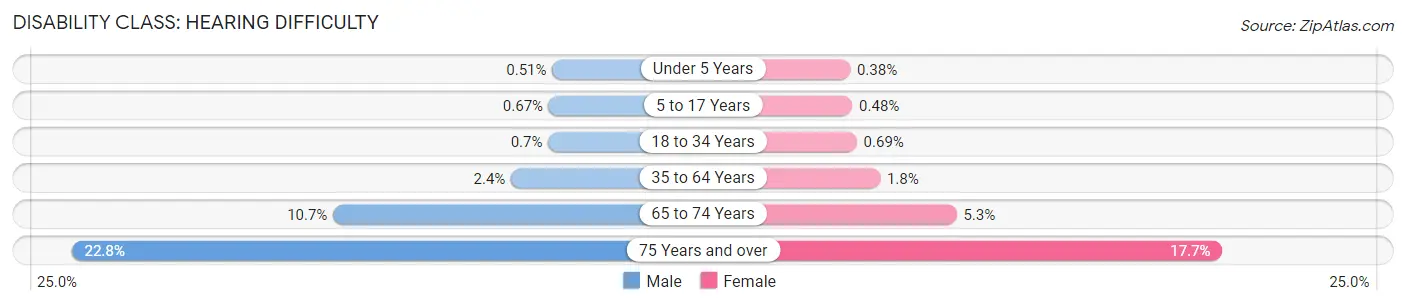
| Age Bracket | Male | Female |
| Under 5 Years | 868 (0.5%) | 629 (0.4%) |
| 5 to 17 Years | 3,083 (0.7%) | 2,146 (0.5%) |
| 18 to 34 Years | 4,169 (0.7%) | 4,062 (0.7%) |
| 35 to 64 Years | 21,429 (2.4%) | 15,583 (1.8%) |
| 65 to 74 Years | 16,323 (10.7%) | 9,219 (5.3%) |
| 75 Years and over | 17,567 (22.8%) | 19,602 (17.7%) |
Disability Class: Vision Difficulty
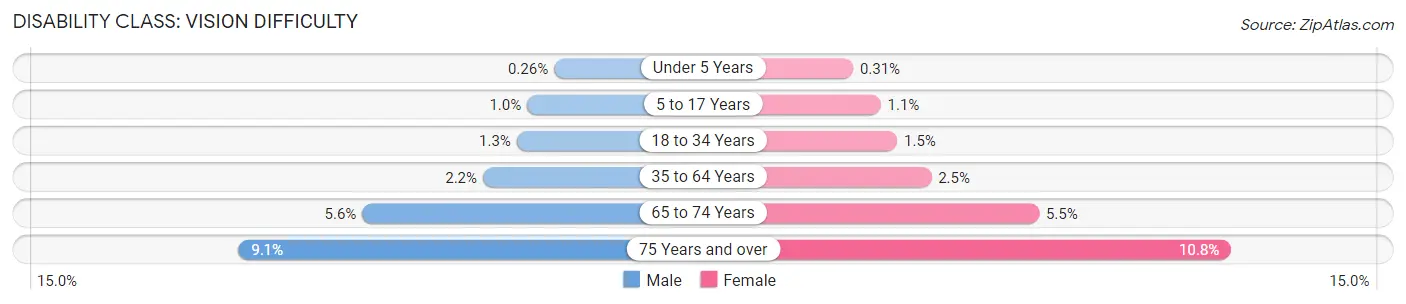
| Age Bracket | Male | Female |
| Under 5 Years | 448 (0.3%) | 502 (0.3%) |
| 5 to 17 Years | 4,683 (1.0%) | 4,800 (1.1%) |
| 18 to 34 Years | 7,744 (1.3%) | 9,046 (1.5%) |
| 35 to 64 Years | 19,791 (2.2%) | 21,943 (2.5%) |
| 65 to 74 Years | 8,560 (5.6%) | 9,511 (5.5%) |
| 75 Years and over | 6,966 (9.0%) | 12,040 (10.8%) |
Disability Class: Cognitive Difficulty
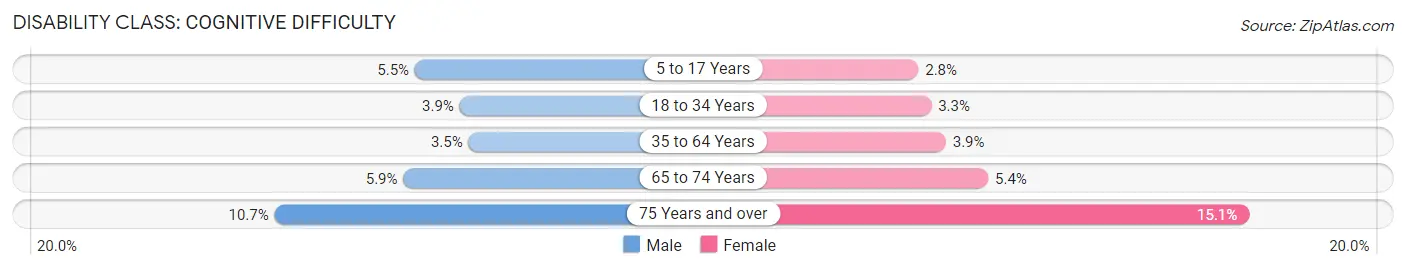
| Age Bracket | Male | Female |
| 5 to 17 Years | 25,424 (5.5%) | 12,617 (2.8%) |
| 18 to 34 Years | 22,940 (3.8%) | 19,474 (3.3%) |
| 35 to 64 Years | 31,131 (3.5%) | 34,043 (3.9%) |
| 65 to 74 Years | 9,075 (5.9%) | 9,412 (5.4%) |
| 75 Years and over | 8,249 (10.7%) | 16,784 (15.1%) |
Disability Class: Ambulatory Difficulty
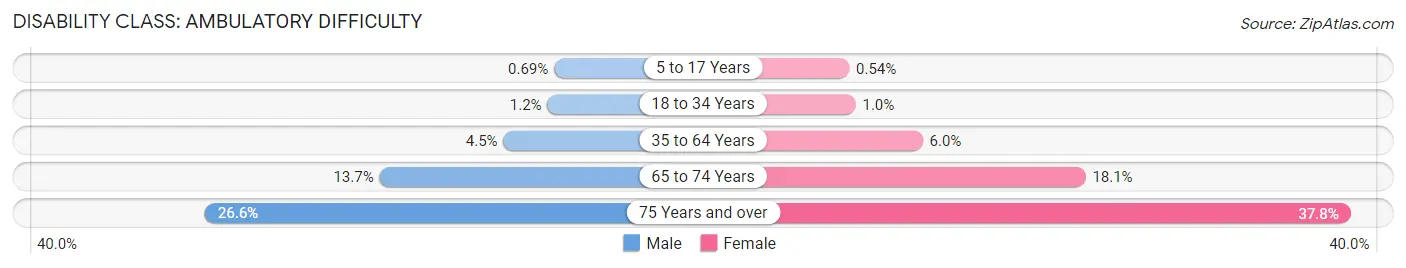
| Age Bracket | Male | Female |
| 5 to 17 Years | 3,176 (0.7%) | 2,400 (0.5%) |
| 18 to 34 Years | 7,046 (1.2%) | 5,959 (1.0%) |
| 35 to 64 Years | 39,325 (4.4%) | 52,901 (6.0%) |
| 65 to 74 Years | 20,850 (13.7%) | 31,353 (18.1%) |
| 75 Years and over | 20,481 (26.6%) | 41,935 (37.8%) |
Disability Class: Self-Care Difficulty
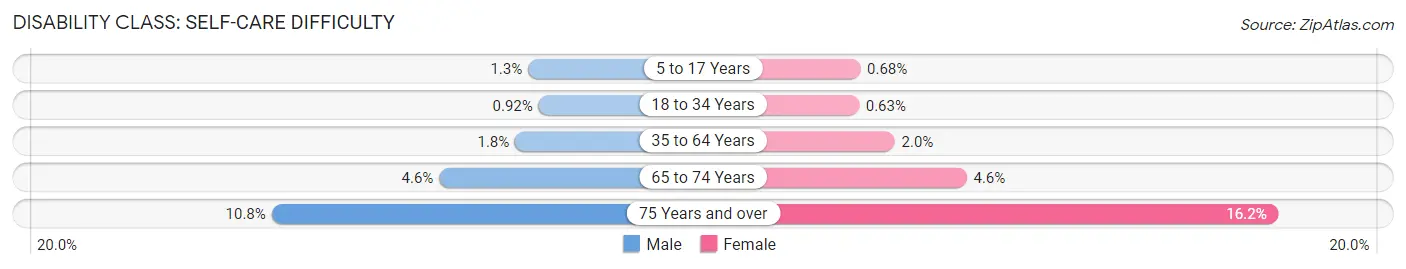
| Age Bracket | Male | Female |
| 5 to 17 Years | 6,058 (1.3%) | 3,009 (0.7%) |
| 18 to 34 Years | 5,485 (0.9%) | 3,669 (0.6%) |
| 35 to 64 Years | 15,797 (1.8%) | 17,253 (2.0%) |
| 65 to 74 Years | 7,040 (4.6%) | 8,020 (4.6%) |
| 75 Years and over | 8,340 (10.8%) | 17,993 (16.2%) |
Technology Access in Harris County
Computing Device Access in Harris County
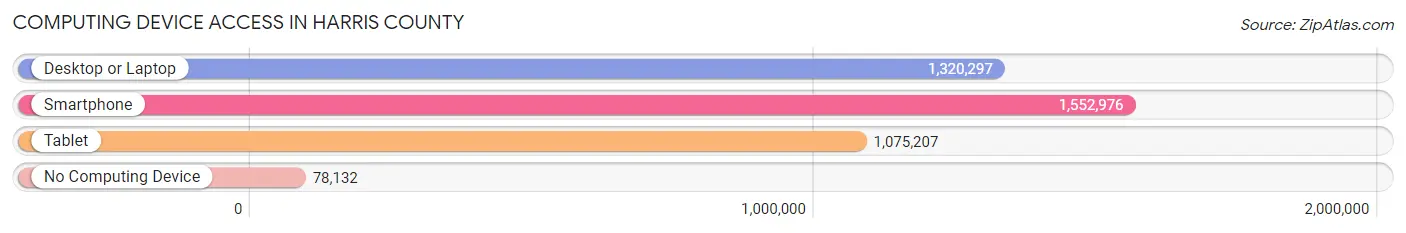
| Device Type | # Households | % Households |
| Desktop or Laptop | 1,320,297 | 78.0% |
| Smartphone | 1,552,976 | 91.7% |
| Tablet | 1,075,207 | 63.5% |
| No Computing Device | 78,132 | 4.6% |
| Total | 1,692,896 | 100.0% |
Internet Access in Harris County
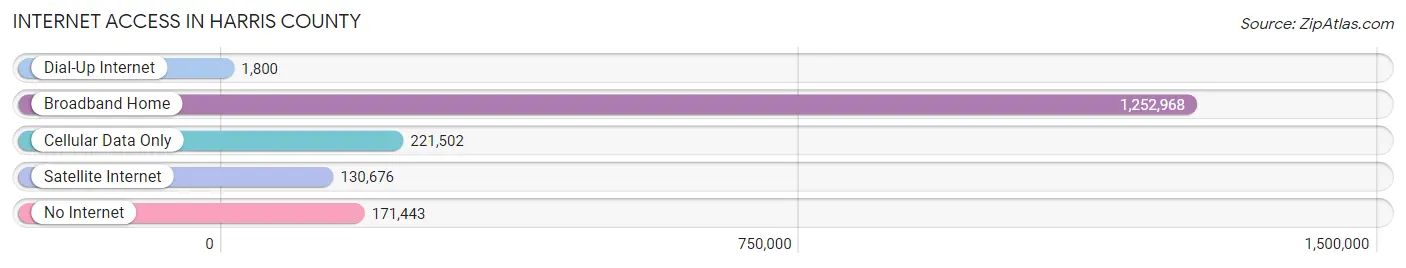
| Internet Type | # Households | % Households |
| Dial-Up Internet | 1,800 | 0.1% |
| Broadband Home | 1,252,968 | 74.0% |
| Cellular Data Only | 221,502 | 13.1% |
| Satellite Internet | 130,676 | 7.7% |
| No Internet | 171,443 | 10.1% |
| Total | 1,692,896 | 100.0% |
Harris County Summary
Harris County, Texas is located in the southeastern part of the state and is the third most populous county in the United States. It is part of the Houston–The Woodlands–Sugar Land metropolitan area, which is the fifth most populous metropolitan area in the United States. The county seat is Houston, the largest city in Texas and the fourth most populous city in the United States.
History
Harris County was established in 1836 and is named after John Richardson Harris, an early settler of the area. The county was originally part of the Mexican state of Coahuila y Tejas, and was later annexed by the Republic of Texas in 1836. The county was organized in 1837 and was one of the original counties of the Republic of Texas.
In the early days of the county, the economy was largely based on agriculture, with cotton, corn, and sugar cane being the main crops. The county also had a thriving cattle industry, with many ranches in the area.
In the late 19th century, the economy shifted to oil and gas production, and the county became a major center of the oil and gas industry. The discovery of oil in 1901 in the Spindletop oil field near Beaumont, Texas, led to a boom in the oil and gas industry in the county. This boom led to the development of the Port of Houston, which is now the largest port in the United States in terms of foreign tonnage.
Geography
Harris County covers an area of 1,777 square miles and is located in the southeastern part of Texas. It is bordered by Montgomery County to the north, Liberty County to the east, Chambers County to the southeast, Galveston County to the south, and Waller County to the west. The county is divided into four regions: the Houston metropolitan area, the coastal region, the northern region, and the western region.
The Houston metropolitan area is the most populous region in the county and is home to the city of Houston, the largest city in Texas and the fourth most populous city in the United States. The coastal region is located along the Gulf Coast and is home to the cities of Galveston and Baytown. The northern region is located in the northern part of the county and is home to the cities of Humble and Spring. The western region is located in the western part of the county and is home to the cities of Katy and Cypress.
Economy
The economy of Harris County is largely based on the oil and gas industry, with the Port of Houston being the largest port in the United States in terms of foreign tonnage. The county is also home to many major corporations, including ExxonMobil, Shell Oil Company, and Chevron Corporation.
The county is also home to many major medical centers, including the Texas Medical Center, the largest medical center in the world. The county is also home to the Johnson Space Center, the National Aeronautics and Space Administration's (NASA) center for human spaceflight activities.
Demographics
As of the 2010 census, Harris County had a population of 4,092,459, making it the third most populous county in the United States. The population is racially and ethnically diverse, with the largest racial group being White (44.3%), followed by Hispanic or Latino (37.2%), Black or African American (17.2%), and Asian (5.3%).
The median household income in the county is $54,822, and the median family income is $63,867. The poverty rate in the county is 17.2%, and the unemployment rate is 5.2%.
Conclusion
Harris County, Texas is a large and diverse county located in the southeastern part of the state. It is home to the city of Houston, the largest city in Texas and the fourth most populous city in the United States. The economy of the county is largely based on the oil and gas industry, with the Port of Houston being the largest port in the United States in terms of foreign tonnage. The county is also home to many major corporations, medical centers, and NASA's Johnson Space Center. The population of the county is racially and ethnically diverse, with the largest racial group being White. The median household income in the county is $54,822, and the poverty rate is 17.2%.
Common Questions
What is Per Capita Income in Harris County?
Per Capita income in Harris County is $38,184.
What is the Median Family Income in Harris County?
Median Family Income in Harris County is $82,895.
What is the Median Household income in Harris County?
Median Household Income in Harris County is $70,789.
What is Income or Wage Gap in Harris County?
Income or Wage Gap in Harris County is 27.3%.
Women in Harris County earn 72.7 cents for every dollar earned by a man.
What is Family Income Deficit in Harris County?
Family Income Deficit in Harris County is $11,691.
Families that are below poverty line in Harris County earn $11,691 less on average than the poverty threshold level.
What is Inequality or Gini Index in Harris County?
Inequality or Gini Index in Harris County is 0.50.
What is the Total Population of Harris County?
Total Population of Harris County is 4,726,177.
What is the Total Male Population of Harris County?
Total Male Population of Harris County is 2,359,415.
What is the Total Female Population of Harris County?
Total Female Population of Harris County is 2,366,762.
What is the Ratio of Males per 100 Females in Harris County?
There are 99.69 Males per 100 Females in Harris County.
What is the Ratio of Females per 100 Males in Harris County?
There are 100.31 Females per 100 Males in Harris County.
What is the Median Population Age in Harris County?
Median Population Age in Harris County is 34.1 Years.
What is the Average Family Size in Harris County
Average Family Size in Harris County is 3.4 People.
What is the Average Household Size in Harris County
Average Household Size in Harris County is 2.8 People.
How Large is the Labor Force in Harris County?
There are 2,444,649 People in the Labor Forcein in Harris County.
What is the Percentage of People in the Labor Force in Harris County?
67.4% of People are in the Labor Force in Harris County.
What is the Unemployment Rate in Harris County?
Unemployment Rate in Harris County is 6.4%.