Nueces County, TX Map & Demographics
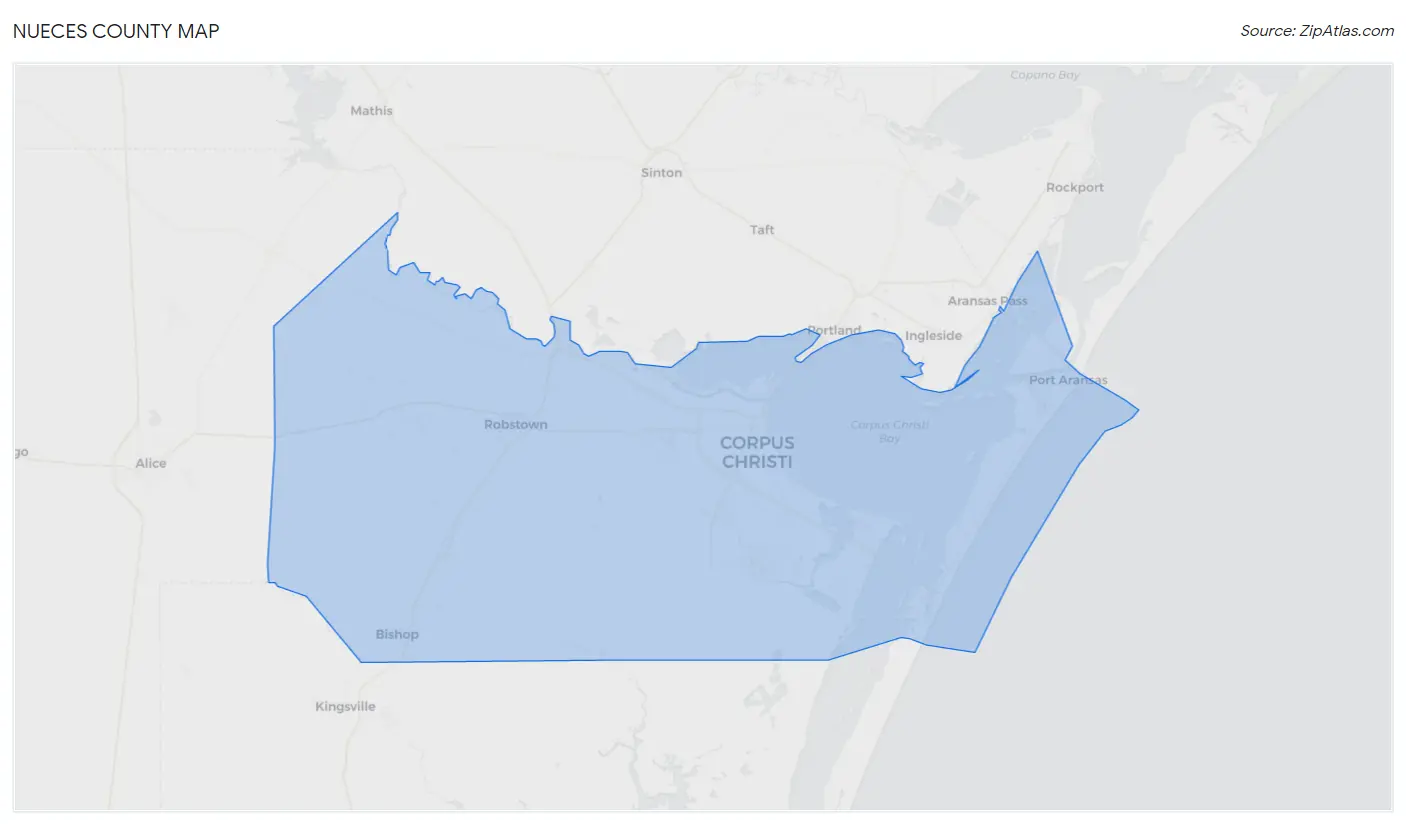
Nueces County Map
Nueces County Overview
$32,284
PER CAPITA INCOME
$77,667
AVG FAMILY INCOME
$64,027
AVG HOUSEHOLD INCOME
32.6%
WAGE / INCOME GAP [ % ]
67.4¢/ $1
WAGE / INCOME GAP [ $ ]
$11,292
FAMILY INCOME DEFICIT
0.46
INEQUALITY / GINI INDEX
353,245
TOTAL POPULATION
176,105
MALE POPULATION
177,140
FEMALE POPULATION
99.42
MALES / 100 FEMALES
100.59
FEMALES / 100 MALES
36.2
MEDIAN AGE
3.2
AVG FAMILY SIZE
2.6
AVG HOUSEHOLD SIZE
172,354
LABOR FORCE [ PEOPLE ]
62.0%
PERCENT IN LABOR FORCE
5.7%
UNEMPLOYMENT RATE
Nueces County Area Codes
Income in Nueces County
Income Overview in Nueces County
Per Capita Income in Nueces County is $32,284, while median incomes of families and households are $77,667 and $64,027 respectively.
| Characteristic | Number | Measure |
| Per Capita Income | 353,245 | $32,284 |
| Median Family Income | 88,312 | $77,667 |
| Mean Family Income | 88,312 | $98,125 |
| Median Household Income | 130,122 | $64,027 |
| Mean Household Income | 130,122 | $85,253 |
| Income Deficit | 88,312 | $11,292 |
| Wage / Income Gap (%) | 353,245 | 32.58% |
| Wage / Income Gap ($) | 353,245 | 67.42¢ per $1 |
| Gini / Inequality Index | 353,245 | 0.46 |
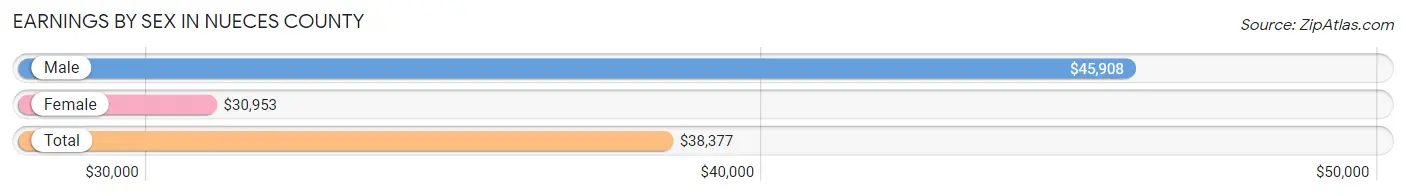
Earnings by Sex in Nueces County
Average Earnings in Nueces County are $38,377, $45,908 for men and $30,953 for women, a difference of 32.6%.
| Sex | Number | Average Earnings |
| Male | 96,122 (54.4%) | $45,908 |
| Female | 80,612 (45.6%) | $30,953 |
| Total | 176,734 (100.0%) | $38,377 |
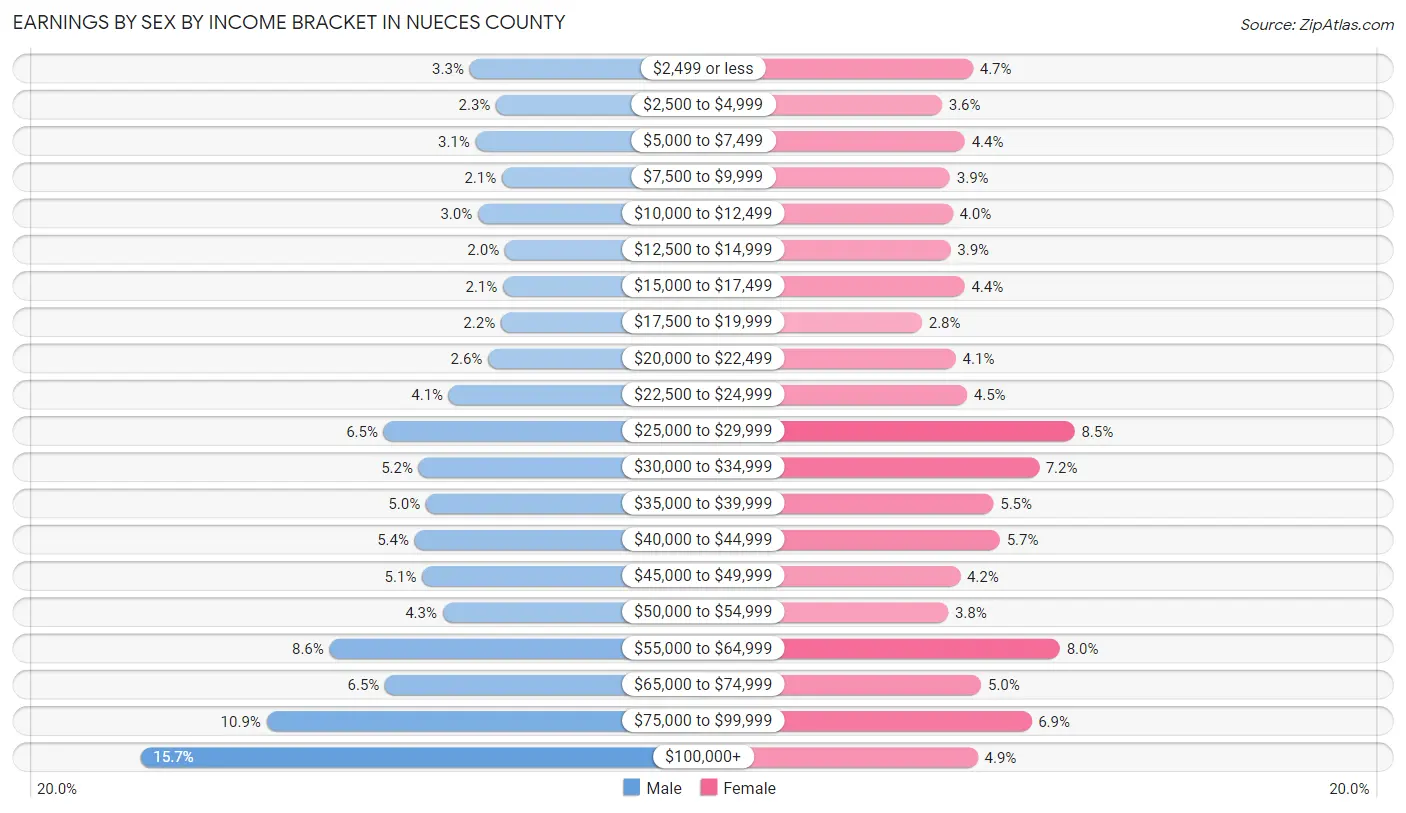
Earnings by Sex by Income Bracket in Nueces County
The most common earnings brackets in Nueces County are $100,000+ for men (15,053 | 15.7%) and $25,000 to $29,999 for women (6,874 | 8.5%).
| Income | Male | Female |
| $2,499 or less | 3,189 (3.3%) | 3,804 (4.7%) |
| $2,500 to $4,999 | 2,235 (2.3%) | 2,870 (3.6%) |
| $5,000 to $7,499 | 2,982 (3.1%) | 3,566 (4.4%) |
| $7,500 to $9,999 | 2,030 (2.1%) | 3,112 (3.9%) |
| $10,000 to $12,499 | 2,891 (3.0%) | 3,194 (4.0%) |
| $12,500 to $14,999 | 1,925 (2.0%) | 3,127 (3.9%) |
| $15,000 to $17,499 | 1,988 (2.1%) | 3,556 (4.4%) |
| $17,500 to $19,999 | 2,062 (2.1%) | 2,266 (2.8%) |
| $20,000 to $22,499 | 2,524 (2.6%) | 3,293 (4.1%) |
| $22,500 to $24,999 | 3,937 (4.1%) | 3,629 (4.5%) |
| $25,000 to $29,999 | 6,291 (6.5%) | 6,874 (8.5%) |
| $30,000 to $34,999 | 5,031 (5.2%) | 5,800 (7.2%) |
| $35,000 to $39,999 | 4,769 (5.0%) | 4,422 (5.5%) |
| $40,000 to $44,999 | 5,172 (5.4%) | 4,618 (5.7%) |
| $45,000 to $49,999 | 4,903 (5.1%) | 3,420 (4.2%) |
| $50,000 to $54,999 | 4,163 (4.3%) | 3,055 (3.8%) |
| $55,000 to $64,999 | 8,236 (8.6%) | 6,429 (8.0%) |
| $65,000 to $74,999 | 6,236 (6.5%) | 4,057 (5.0%) |
| $75,000 to $99,999 | 10,505 (10.9%) | 5,573 (6.9%) |
| $100,000+ | 15,053 (15.7%) | 3,947 (4.9%) |
| Total | 96,122 (100.0%) | 80,612 (100.0%) |
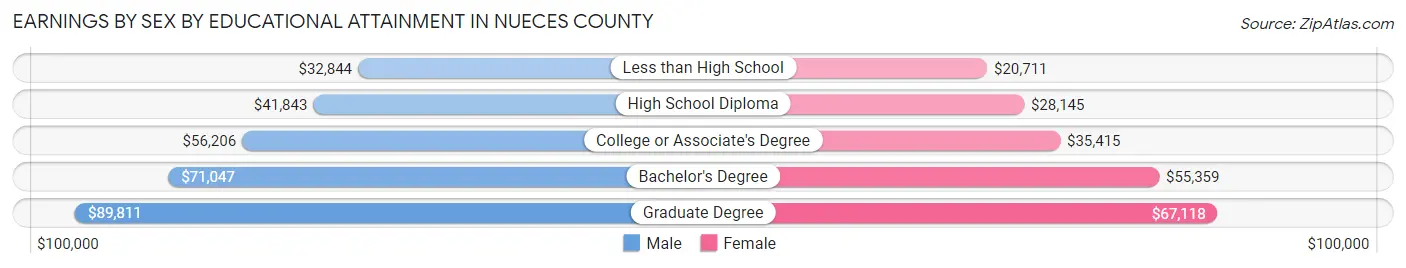
Earnings by Sex by Educational Attainment in Nueces County
Average earnings in Nueces County are $51,852 for men and $35,487 for women, a difference of 31.6%. Men with an educational attainment of graduate degree enjoy the highest average annual earnings of $89,811, while those with less than high school education earn the least with $32,844. Women with an educational attainment of graduate degree earn the most with the average annual earnings of $67,118, while those with less than high school education have the smallest earnings of $20,711.
| Educational Attainment | Male Income | Female Income |
| Less than High School | $32,844 | $20,711 |
| High School Diploma | $41,843 | $28,145 |
| College or Associate's Degree | $56,206 | $35,415 |
| Bachelor's Degree | $71,047 | $55,359 |
| Graduate Degree | $89,811 | $67,118 |
| Total | $51,852 | $35,487 |
Family Income in Nueces County
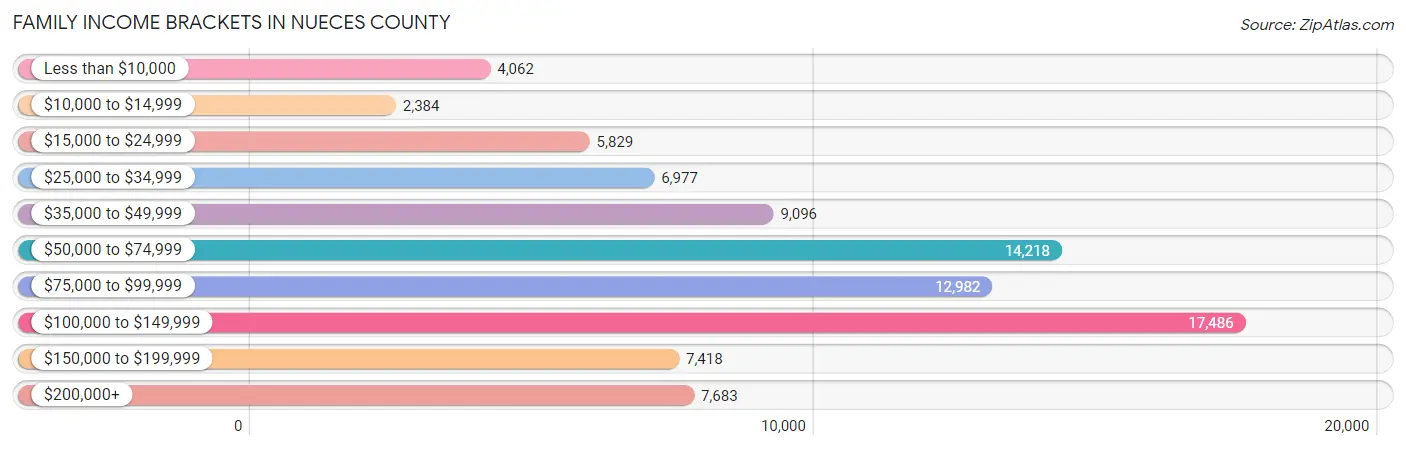
Family Income Brackets in Nueces County
According to the Nueces County family income data, there are 17,486 families falling into the $100,000 to $149,999 income range, which is the most common income bracket and makes up 19.8% of all families. Conversely, the $10,000 to $14,999 income bracket is the least frequent group with only 2,384 families (2.7%) belonging to this category.
| Income Bracket | # Families | % Families |
| Less than $10,000 | 4,062 | 4.6% |
| $10,000 to $14,999 | 2,384 | 2.7% |
| $15,000 to $24,999 | 5,829 | 6.6% |
| $25,000 to $34,999 | 6,977 | 7.9% |
| $35,000 to $49,999 | 9,096 | 10.3% |
| $50,000 to $74,999 | 14,218 | 16.1% |
| $75,000 to $99,999 | 12,982 | 14.7% |
| $100,000 to $149,999 | 17,486 | 19.8% |
| $150,000 to $199,999 | 7,418 | 8.4% |
| $200,000+ | 7,683 | 8.7% |
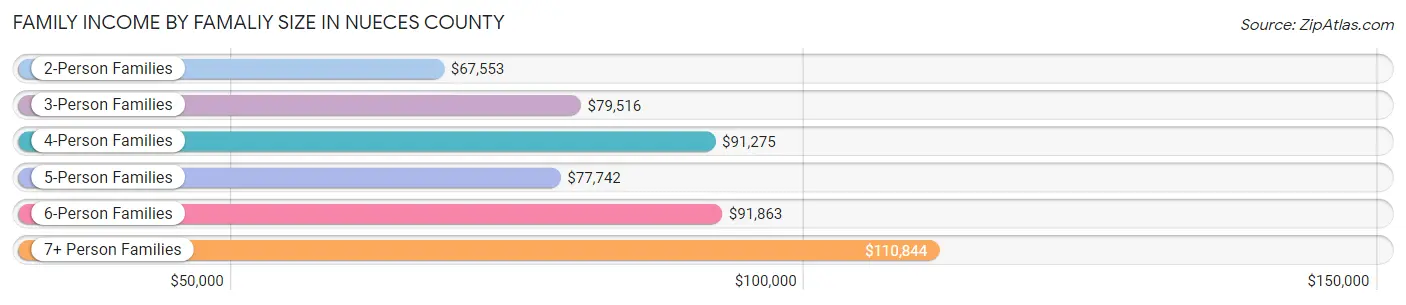
Family Income by Famaliy Size in Nueces County
7+ person families (2,006 | 2.3%) account for the highest median family income in Nueces County with $110,844 per family, while 2-person families (39,741 | 45.0%) have the highest median income of $33,776 per family member.
| Income Bracket | # Families | Median Income |
| 2-Person Families | 39,741 (45.0%) | $67,553 |
| 3-Person Families | 19,983 (22.6%) | $79,516 |
| 4-Person Families | 16,450 (18.6%) | $91,275 |
| 5-Person Families | 7,576 (8.6%) | $77,742 |
| 6-Person Families | 2,556 (2.9%) | $91,863 |
| 7+ Person Families | 2,006 (2.3%) | $110,844 |
| Total | 88,312 (100.0%) | $77,667 |
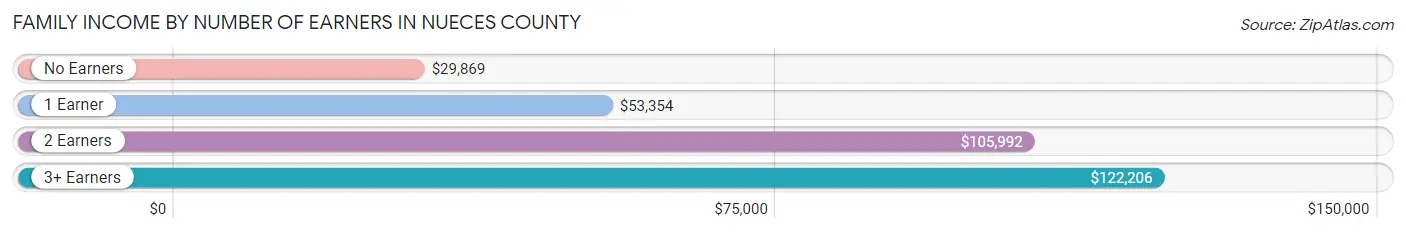
Family Income by Number of Earners in Nueces County
The median family income in Nueces County is $77,667, with families comprising 3+ earners (7,738) having the highest median family income of $122,206, while families with no earners (13,073) have the lowest median family income of $29,869, accounting for 8.8% and 14.8% of families, respectively.
| Number of Earners | # Families | Median Income |
| No Earners | 13,073 (14.8%) | $29,869 |
| 1 Earner | 31,724 (35.9%) | $53,354 |
| 2 Earners | 35,777 (40.5%) | $105,992 |
| 3+ Earners | 7,738 (8.8%) | $122,206 |
| Total | 88,312 (100.0%) | $77,667 |
Household Income in Nueces County
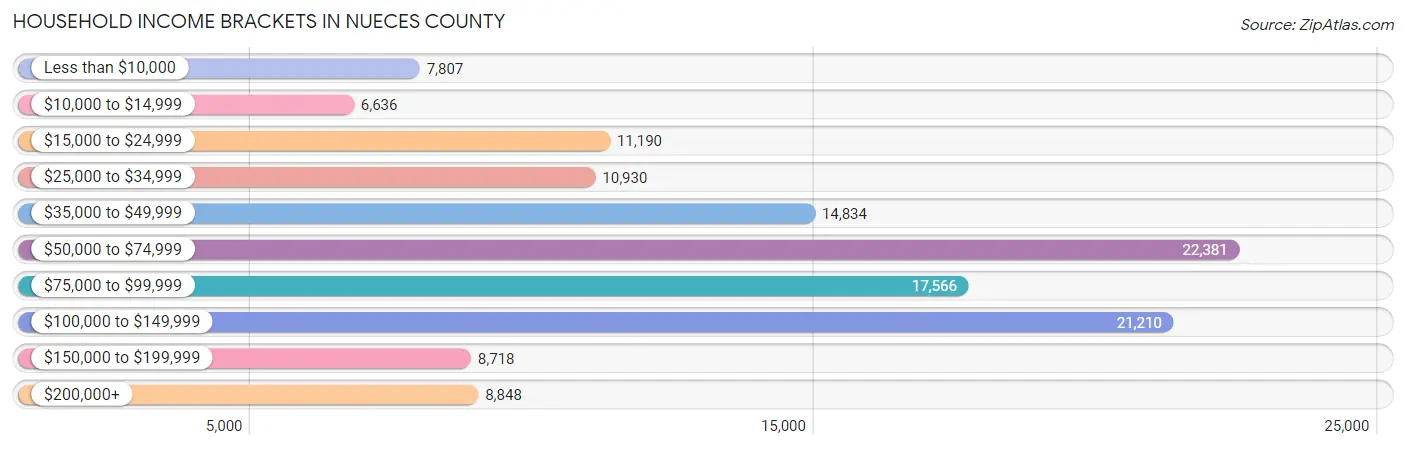
Household Income Brackets in Nueces County
With 22,381 households falling in the category, the $50,000 to $74,999 income range is the most frequent in Nueces County, accounting for 17.2% of all households. In contrast, only 6,636 households (5.1%) fall into the $10,000 to $14,999 income bracket, making it the least populous group.
| Income Bracket | # Households | % Households |
| Less than $10,000 | 7,807 | 6.0% |
| $10,000 to $14,999 | 6,636 | 5.1% |
| $15,000 to $24,999 | 11,190 | 8.6% |
| $25,000 to $34,999 | 10,930 | 8.4% |
| $35,000 to $49,999 | 14,834 | 11.4% |
| $50,000 to $74,999 | 22,381 | 17.2% |
| $75,000 to $99,999 | 17,566 | 13.5% |
| $100,000 to $149,999 | 21,210 | 16.3% |
| $150,000 to $199,999 | 8,718 | 6.7% |
| $200,000+ | 8,848 | 6.8% |
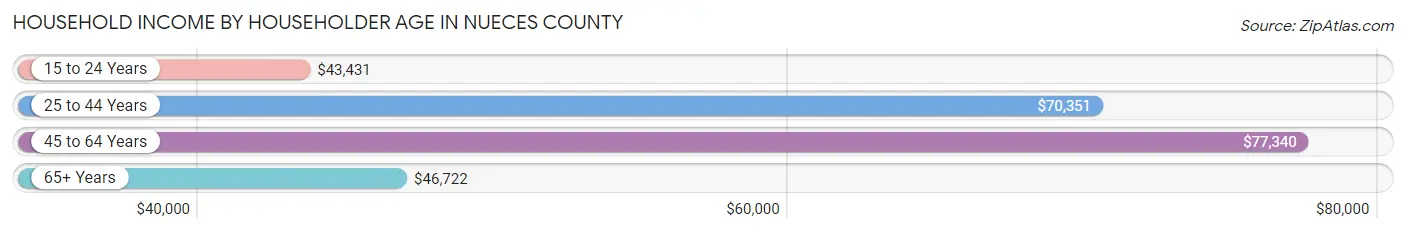
Household Income by Householder Age in Nueces County
The median household income in Nueces County is $64,027, with the highest median household income of $77,340 found in the 45 to 64 years age bracket for the primary householder. A total of 45,019 households (34.6%) fall into this category. Meanwhile, the 15 to 24 years age bracket for the primary householder has the lowest median household income of $43,431, with 6,643 households (5.1%) in this group.
| Income Bracket | # Households | Median Income |
| 15 to 24 Years | 6,643 (5.1%) | $43,431 |
| 25 to 44 Years | 45,525 (35.0%) | $70,351 |
| 45 to 64 Years | 45,019 (34.6%) | $77,340 |
| 65+ Years | 32,935 (25.3%) | $46,722 |
| Total | 130,122 (100.0%) | $64,027 |
Poverty in Nueces County
Income Below Poverty by Sex and Age in Nueces County
With 15.4% poverty level for males and 19.2% for females among the residents of Nueces County, 5 year old males and 5 year old females are the most vulnerable to poverty, with 904 males (29.4%) and 659 females (29.2%) in their respective age groups living below the poverty level.
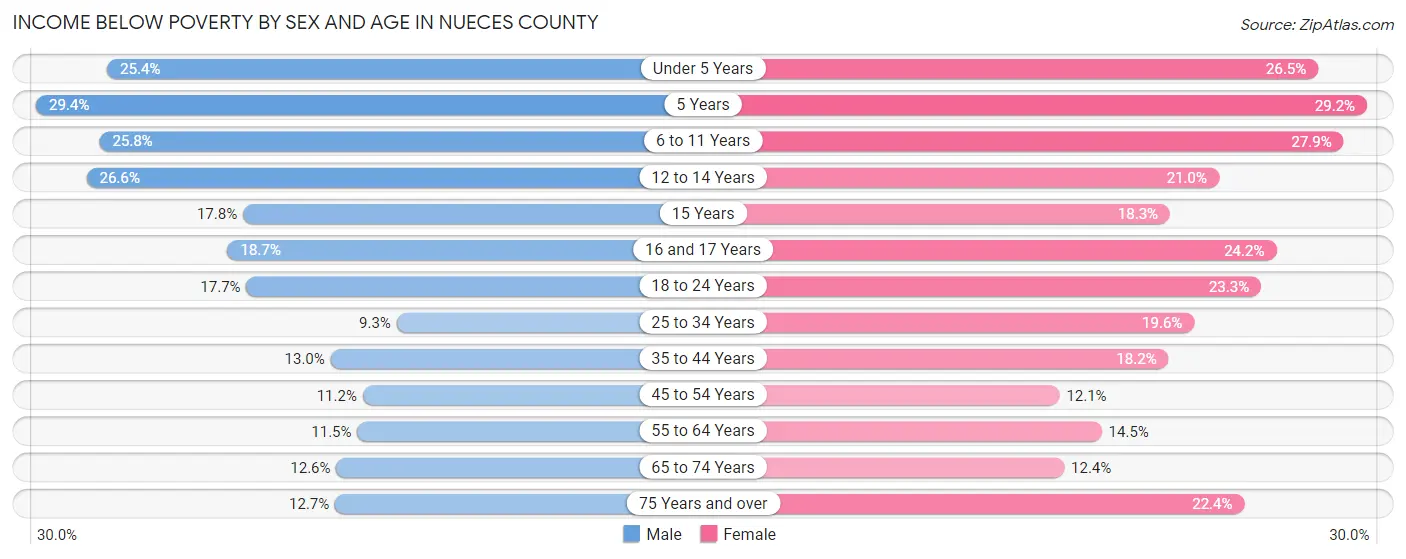
| Age Bracket | Male | Female |
| Under 5 Years | 2,874 (25.4%) | 2,819 (26.5%) |
| 5 Years | 904 (29.4%) | 659 (29.2%) |
| 6 to 11 Years | 3,756 (25.8%) | 3,799 (27.9%) |
| 12 to 14 Years | 1,806 (26.6%) | 1,533 (21.0%) |
| 15 Years | 525 (17.8%) | 379 (18.3%) |
| 16 and 17 Years | 907 (18.7%) | 1,223 (24.2%) |
| 18 to 24 Years | 2,933 (17.6%) | 3,761 (23.3%) |
| 25 to 34 Years | 2,333 (9.3%) | 4,611 (19.6%) |
| 35 to 44 Years | 3,002 (13.0%) | 4,181 (18.2%) |
| 45 to 54 Years | 2,242 (11.2%) | 2,475 (12.1%) |
| 55 to 64 Years | 2,310 (11.5%) | 3,061 (14.5%) |
| 65 to 74 Years | 1,870 (12.6%) | 2,029 (12.4%) |
| 75 Years and over | 1,058 (12.7%) | 2,734 (22.4%) |
| Total | 26,520 (15.4%) | 33,264 (19.2%) |
Income Above Poverty by Sex and Age in Nueces County
According to the poverty statistics in Nueces County, males aged 25 to 34 years and females aged 45 to 54 years are the age groups that are most secure financially, with 90.7% of males and 87.9% of females in these age groups living above the poverty line.
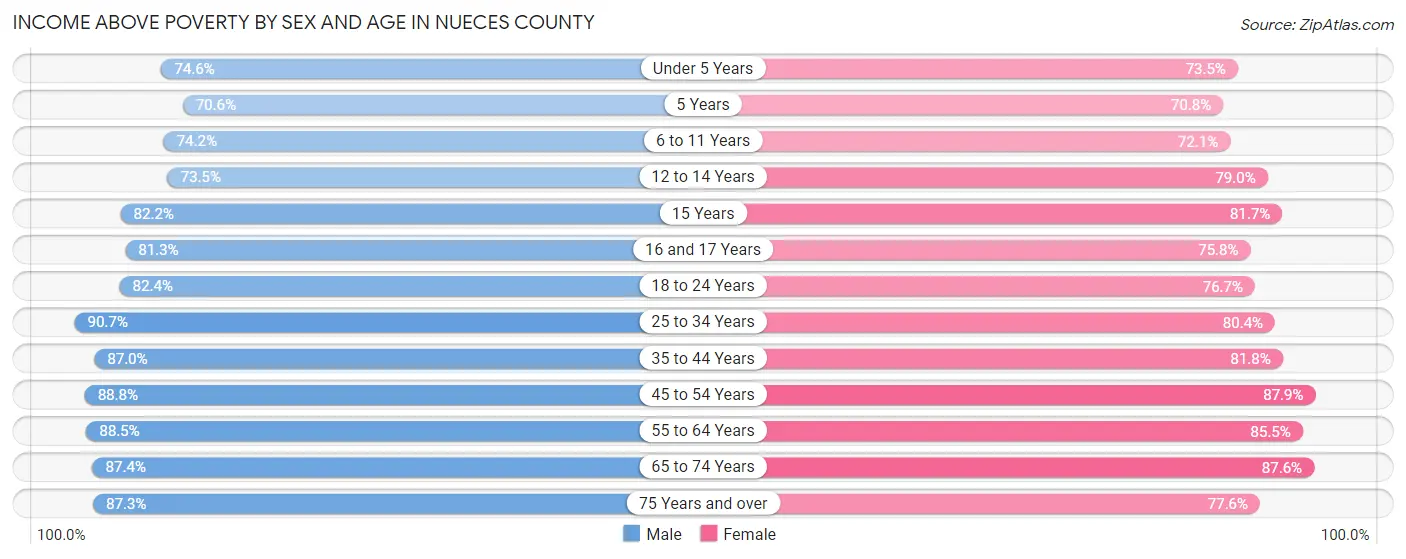
| Age Bracket | Male | Female |
| Under 5 Years | 8,442 (74.6%) | 7,811 (73.5%) |
| 5 Years | 2,175 (70.6%) | 1,595 (70.8%) |
| 6 to 11 Years | 10,786 (74.2%) | 9,798 (72.1%) |
| 12 to 14 Years | 4,995 (73.5%) | 5,772 (79.0%) |
| 15 Years | 2,418 (82.2%) | 1,695 (81.7%) |
| 16 and 17 Years | 3,942 (81.3%) | 3,833 (75.8%) |
| 18 to 24 Years | 13,688 (82.4%) | 12,352 (76.7%) |
| 25 to 34 Years | 22,819 (90.7%) | 18,894 (80.4%) |
| 35 to 44 Years | 20,163 (87.0%) | 18,800 (81.8%) |
| 45 to 54 Years | 17,835 (88.8%) | 17,941 (87.9%) |
| 55 to 64 Years | 17,830 (88.5%) | 18,092 (85.5%) |
| 65 to 74 Years | 12,928 (87.4%) | 14,361 (87.6%) |
| 75 Years and over | 7,267 (87.3%) | 9,464 (77.6%) |
| Total | 145,288 (84.6%) | 140,408 (80.8%) |
Income Below Poverty Among Married-Couple Families in Nueces County
The poverty statistics for married-couple families in Nueces County show that 5.2% or 3,070 of the total 58,939 families live below the poverty line. Families with 5 or more children have the highest poverty rate of 20.7%, comprising of 97 families. On the other hand, families with no children have the lowest poverty rate of 4.1%, which includes 1,377 families.
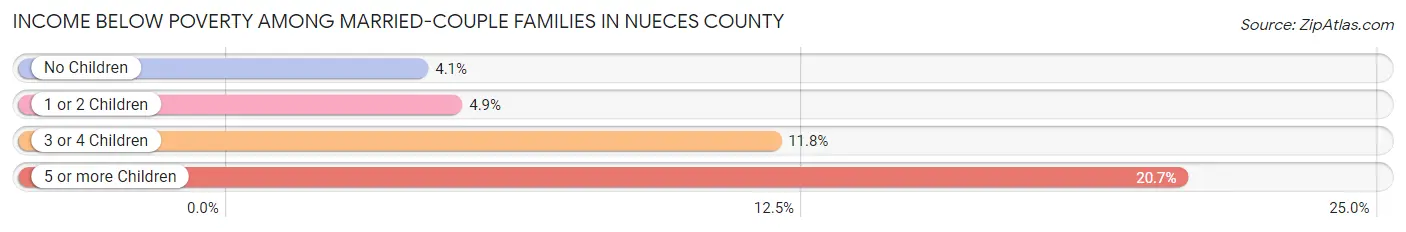
| Children | Above Poverty | Below Poverty |
| No Children | 31,921 (95.9%) | 1,377 (4.1%) |
| 1 or 2 Children | 18,913 (95.1%) | 971 (4.9%) |
| 3 or 4 Children | 4,663 (88.2%) | 625 (11.8%) |
| 5 or more Children | 372 (79.3%) | 97 (20.7%) |
| Total | 55,869 (94.8%) | 3,070 (5.2%) |
Income Below Poverty Among Single-Parent Households in Nueces County
According to the poverty data in Nueces County, 18.7% or 1,484 single-father households and 33.6% or 7,198 single-mother households are living below the poverty line. Among single-father households, those with 5 or more children have the highest poverty rate, with 9 households (100.0%) experiencing poverty. Likewise, among single-mother households, those with 5 or more children have the highest poverty rate, with 276 households (77.1%) falling below the poverty line.
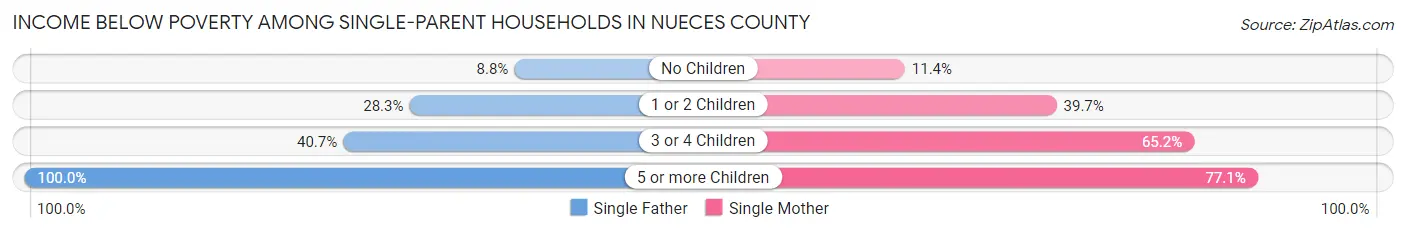
| Children | Single Father | Single Mother |
| No Children | 376 (8.8%) | 904 (11.4%) |
| 1 or 2 Children | 896 (28.3%) | 3,972 (39.7%) |
| 3 or 4 Children | 203 (40.7%) | 2,046 (65.2%) |
| 5 or more Children | 9 (100.0%) | 276 (77.1%) |
| Total | 1,484 (18.7%) | 7,198 (33.6%) |
Income Below Poverty Among Married-Couple vs Single-Parent Households in Nueces County
The poverty data for Nueces County shows that 3,070 of the married-couple family households (5.2%) and 8,682 of the single-parent households (29.6%) are living below the poverty level. Within the married-couple family households, those with 5 or more children have the highest poverty rate, with 97 households (20.7%) falling below the poverty line. Among the single-parent households, those with 5 or more children have the highest poverty rate, with 285 household (77.7%) living below poverty.
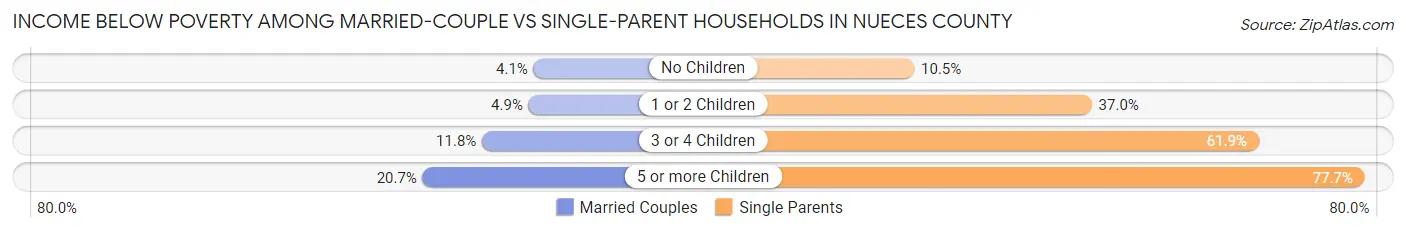
| Children | Married-Couple Families | Single-Parent Households |
| No Children | 1,377 (4.1%) | 1,280 (10.5%) |
| 1 or 2 Children | 971 (4.9%) | 4,868 (36.9%) |
| 3 or 4 Children | 625 (11.8%) | 2,249 (61.9%) |
| 5 or more Children | 97 (20.7%) | 285 (77.7%) |
| Total | 3,070 (5.2%) | 8,682 (29.6%) |
Race in Nueces County
The most populous races in Nueces County are Hispanic or Latino (229,173 | 64.9%), White / Caucasian (224,557 | 63.6%), and Two or more Races (90,641 | 25.7%).
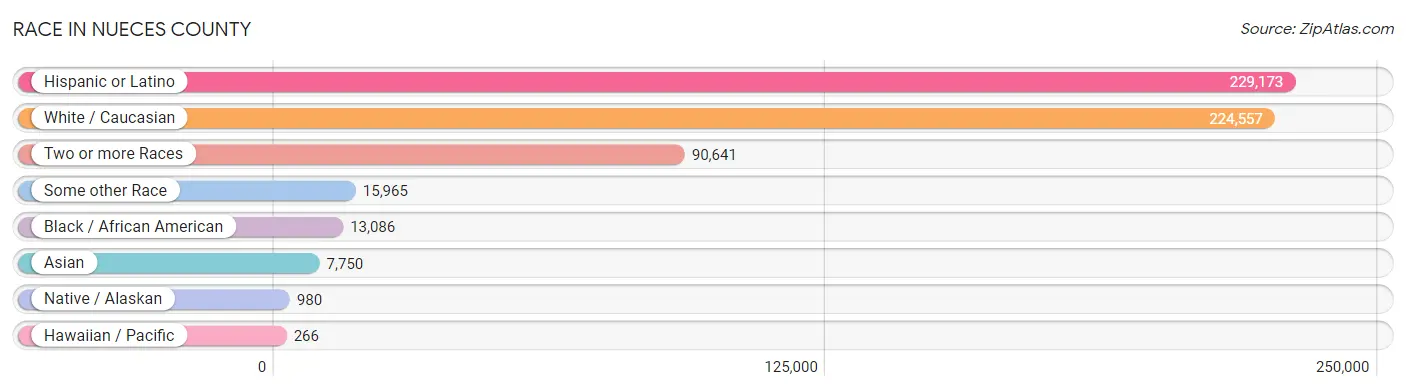
| Race | # Population | % Population |
| Asian | 7,750 | 2.2% |
| Black / African American | 13,086 | 3.7% |
| Hawaiian / Pacific | 266 | 0.1% |
| Hispanic or Latino | 229,173 | 64.9% |
| Native / Alaskan | 980 | 0.3% |
| White / Caucasian | 224,557 | 63.6% |
| Two or more Races | 90,641 | 25.7% |
| Some other Race | 15,965 | 4.5% |
| Total | 353,245 | 100.0% |
Ancestry in Nueces County
The most populous ancestries reported in Nueces County are Mexican (208,832 | 59.1%), German (24,840 | 7.0%), Irish (15,840 | 4.5%), English (14,714 | 4.2%), and American (9,172 | 2.6%), together accounting for 77.4% of all Nueces County residents.
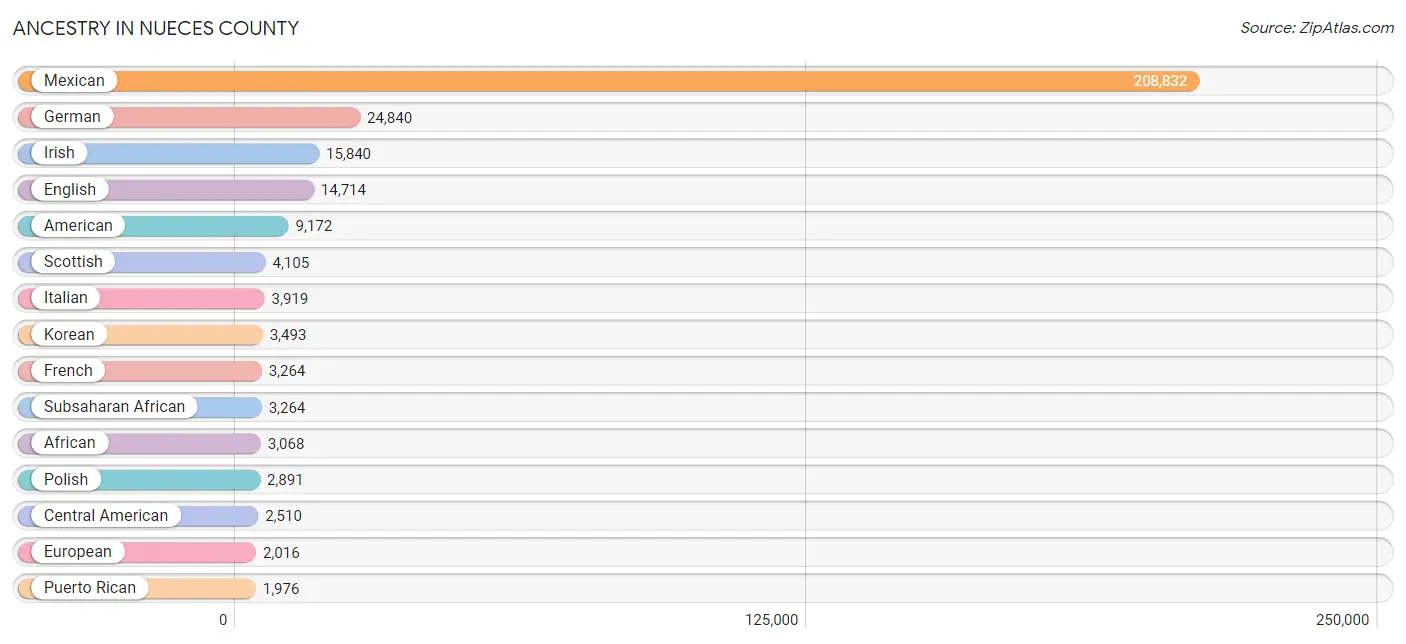
| Ancestry | # Population | % Population |
| African | 3,068 | 0.9% |
| Alsatian | 32 | 0.0% |
| American | 9,172 | 2.6% |
| Apache | 401 | 0.1% |
| Arab | 670 | 0.2% |
| Argentinean | 35 | 0.0% |
| Armenian | 106 | 0.0% |
| Australian | 17 | 0.0% |
| Austrian | 201 | 0.1% |
| Barbadian | 53 | 0.0% |
| Belgian | 60 | 0.0% |
| Bhutanese | 670 | 0.2% |
| Blackfeet | 30 | 0.0% |
| Bolivian | 57 | 0.0% |
| Brazilian | 103 | 0.0% |
| British | 845 | 0.2% |
| British West Indian | 232 | 0.1% |
| Bulgarian | 26 | 0.0% |
| Burmese | 511 | 0.1% |
| Cajun | 123 | 0.0% |
| Cambodian | 12 | 0.0% |
| Canadian | 278 | 0.1% |
| Celtic | 21 | 0.0% |
| Central American | 2,510 | 0.7% |
| Central American Indian | 410 | 0.1% |
| Cherokee | 1,423 | 0.4% |
| Chickasaw | 19 | 0.0% |
| Chilean | 313 | 0.1% |
| Chippewa | 93 | 0.0% |
| Choctaw | 22 | 0.0% |
| Colombian | 405 | 0.1% |
| Comanche | 35 | 0.0% |
| Cree | 5 | 0.0% |
| Creek | 42 | 0.0% |
| Croatian | 44 | 0.0% |
| Cuban | 727 | 0.2% |
| Czech | 1,719 | 0.5% |
| Czechoslovakian | 260 | 0.1% |
| Danish | 399 | 0.1% |
| Dominican | 241 | 0.1% |
| Dutch | 1,681 | 0.5% |
| Eastern European | 183 | 0.1% |
| Ecuadorian | 75 | 0.0% |
| Egyptian | 23 | 0.0% |
| English | 14,714 | 4.2% |
| European | 2,016 | 0.6% |
| Filipino | 195 | 0.1% |
| Finnish | 72 | 0.0% |
| French | 3,264 | 0.9% |
| French Canadian | 435 | 0.1% |
| German | 24,840 | 7.0% |
| Greek | 379 | 0.1% |
| Guamanian / Chamorro | 105 | 0.0% |
| Guatemalan | 943 | 0.3% |
| Haitian | 46 | 0.0% |
| Hmong | 11 | 0.0% |
| Honduran | 803 | 0.2% |
| Hopi | 59 | 0.0% |
| Hungarian | 395 | 0.1% |
| Indian (Asian) | 1,308 | 0.4% |
| Indonesian | 39 | 0.0% |
| Iranian | 140 | 0.0% |
| Iraqi | 9 | 0.0% |
| Irish | 15,840 | 4.5% |
| Iroquois | 6 | 0.0% |
| Israeli | 8 | 0.0% |
| Italian | 3,919 | 1.1% |
| Jamaican | 157 | 0.0% |
| Japanese | 42 | 0.0% |
| Korean | 3,493 | 1.0% |
| Laotian | 29 | 0.0% |
| Latvian | 27 | 0.0% |
| Lebanese | 232 | 0.1% |
| Lithuanian | 119 | 0.0% |
| Malaysian | 33 | 0.0% |
| Mexican | 208,832 | 59.1% |
| Mexican American Indian | 504 | 0.1% |
| Moroccan | 30 | 0.0% |
| Native Hawaiian | 453 | 0.1% |
| Navajo | 55 | 0.0% |
| Nicaraguan | 230 | 0.1% |
| Nigerian | 92 | 0.0% |
| Northern European | 66 | 0.0% |
| Norwegian | 1,113 | 0.3% |
| Osage | 101 | 0.0% |
| Ottawa | 3 | 0.0% |
| Pakistani | 282 | 0.1% |
| Palestinian | 122 | 0.0% |
| Panamanian | 137 | 0.0% |
| Paraguayan | 133 | 0.0% |
| Pennsylvania German | 144 | 0.0% |
| Peruvian | 55 | 0.0% |
| Polish | 2,891 | 0.8% |
| Portuguese | 495 | 0.1% |
| Potawatomi | 106 | 0.0% |
| Puerto Rican | 1,976 | 0.6% |
| Romanian | 132 | 0.0% |
| Russian | 790 | 0.2% |
| Salvadoran | 397 | 0.1% |
| Samoan | 23 | 0.0% |
| Scandinavian | 261 | 0.1% |
| Scotch-Irish | 1,875 | 0.5% |
| Scottish | 4,105 | 1.2% |
| Serbian | 20 | 0.0% |
| Slavic | 73 | 0.0% |
| Slovak | 104 | 0.0% |
| Slovene | 6 | 0.0% |
| South African | 26 | 0.0% |
| South American | 1,944 | 0.5% |
| Soviet Union | 7 | 0.0% |
| Spaniard | 1,629 | 0.5% |
| Spanish | 771 | 0.2% |
| Spanish American | 18 | 0.0% |
| Sri Lankan | 1,048 | 0.3% |
| Subsaharan African | 3,264 | 0.9% |
| Swedish | 1,183 | 0.3% |
| Swiss | 299 | 0.1% |
| Syrian | 100 | 0.0% |
| Thai | 1,520 | 0.4% |
| Tongan | 10 | 0.0% |
| Trinidadian and Tobagonian | 19 | 0.0% |
| Turkish | 107 | 0.0% |
| Ugandan | 25 | 0.0% |
| Ukrainian | 198 | 0.1% |
| Uruguayan | 19 | 0.0% |
| Venezuelan | 852 | 0.2% |
| Vietnamese | 111 | 0.0% |
| Welsh | 1,176 | 0.3% |
| West Indian | 57 | 0.0% |
| Yugoslavian | 60 | 0.0% |
| Yuman | 4 | 0.0% |
| Zimbabwean | 9 | 0.0% | View All 132 Rows |
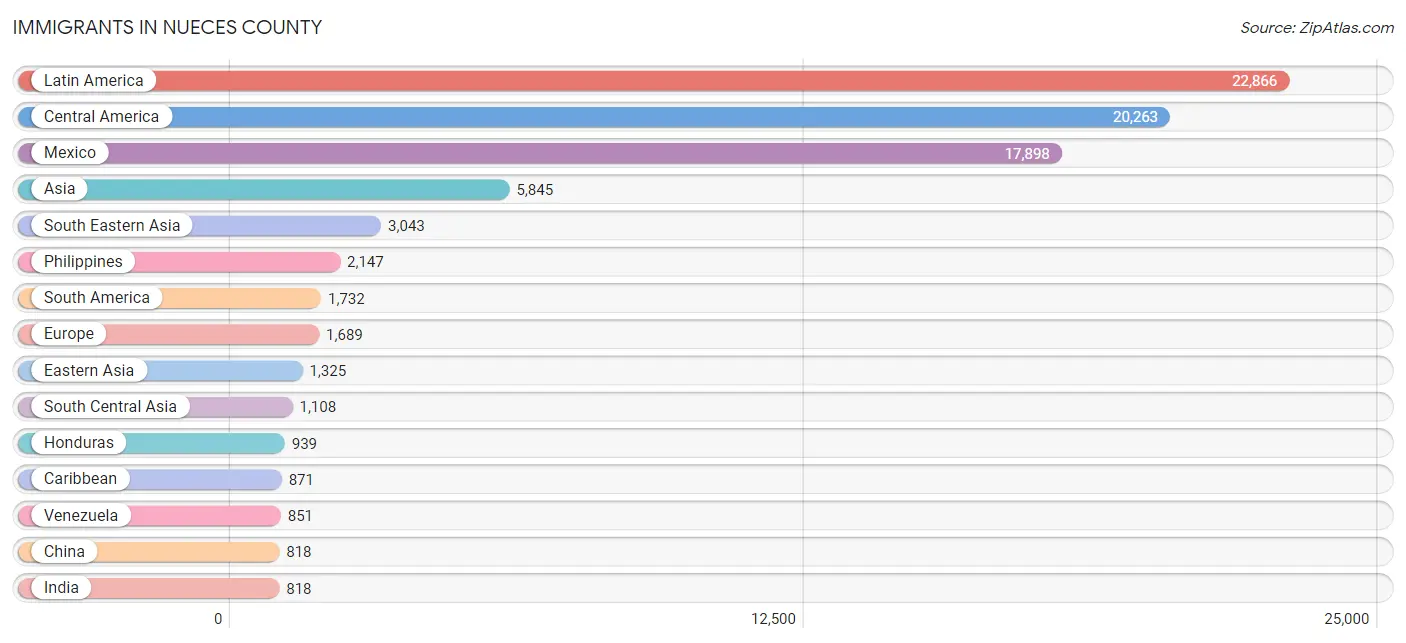
Immigrants in Nueces County
The most numerous immigrant groups reported in Nueces County came from Latin America (22,866 | 6.5%), Central America (20,263 | 5.7%), Mexico (17,898 | 5.1%), Asia (5,845 | 1.7%), and South Eastern Asia (3,043 | 0.9%), together accounting for 19.8% of all Nueces County residents.
| Immigration Origin | # Population | % Population |
| Africa | 389 | 0.1% |
| Argentina | 52 | 0.0% |
| Asia | 5,845 | 1.7% |
| Australia | 16 | 0.0% |
| Austria | 19 | 0.0% |
| Bahamas | 19 | 0.0% |
| Bangladesh | 111 | 0.0% |
| Barbados | 53 | 0.0% |
| Belarus | 9 | 0.0% |
| Belgium | 15 | 0.0% |
| Belize | 25 | 0.0% |
| Bolivia | 26 | 0.0% |
| Bosnia and Herzegovina | 46 | 0.0% |
| Brazil | 97 | 0.0% |
| Bulgaria | 28 | 0.0% |
| Cambodia | 23 | 0.0% |
| Cameroon | 14 | 0.0% |
| Canada | 517 | 0.2% |
| Caribbean | 871 | 0.3% |
| Central America | 20,263 | 5.7% |
| Chile | 267 | 0.1% |
| China | 818 | 0.2% |
| Colombia | 234 | 0.1% |
| Cuba | 466 | 0.1% |
| Czechoslovakia | 8 | 0.0% |
| Dominica | 27 | 0.0% |
| Dominican Republic | 113 | 0.0% |
| Eastern Africa | 94 | 0.0% |
| Eastern Asia | 1,325 | 0.4% |
| Eastern Europe | 491 | 0.1% |
| Ecuador | 75 | 0.0% |
| Egypt | 37 | 0.0% |
| El Salvador | 440 | 0.1% |
| England | 198 | 0.1% |
| Europe | 1,689 | 0.5% |
| Fiji | 42 | 0.0% |
| France | 17 | 0.0% |
| Germany | 506 | 0.1% |
| Grenada | 29 | 0.0% |
| Guatemala | 743 | 0.2% |
| Guyana | 20 | 0.0% |
| Honduras | 939 | 0.3% |
| Hong Kong | 37 | 0.0% |
| Hungary | 11 | 0.0% |
| India | 818 | 0.2% |
| Indonesia | 50 | 0.0% |
| Iran | 47 | 0.0% |
| Iraq | 18 | 0.0% |
| Ireland | 68 | 0.0% |
| Israel | 40 | 0.0% |
| Italy | 112 | 0.0% |
| Jamaica | 20 | 0.0% |
| Japan | 125 | 0.0% |
| Kenya | 6 | 0.0% |
| Korea | 382 | 0.1% |
| Kuwait | 8 | 0.0% |
| Laos | 26 | 0.0% |
| Latin America | 22,866 | 6.5% |
| Lebanon | 14 | 0.0% |
| Malaysia | 76 | 0.0% |
| Mexico | 17,898 | 5.1% |
| Middle Africa | 35 | 0.0% |
| Morocco | 30 | 0.0% |
| Netherlands | 23 | 0.0% |
| Nicaragua | 80 | 0.0% |
| Nigeria | 120 | 0.0% |
| Northern Africa | 67 | 0.0% |
| Northern Europe | 311 | 0.1% |
| Oceania | 75 | 0.0% |
| Pakistan | 132 | 0.0% |
| Panama | 111 | 0.0% |
| Peru | 59 | 0.0% |
| Philippines | 2,147 | 0.6% |
| Poland | 80 | 0.0% |
| Portugal | 10 | 0.0% |
| Romania | 22 | 0.0% |
| Russia | 176 | 0.1% |
| Saudi Arabia | 134 | 0.0% |
| Somalia | 33 | 0.0% |
| South America | 1,732 | 0.5% |
| South Central Asia | 1,108 | 0.3% |
| South Eastern Asia | 3,043 | 0.9% |
| Southern Europe | 258 | 0.1% |
| Spain | 136 | 0.0% |
| Switzerland | 49 | 0.0% |
| Syria | 25 | 0.0% |
| Taiwan | 106 | 0.0% |
| Thailand | 160 | 0.1% |
| Trinidad and Tobago | 87 | 0.0% |
| Turkey | 102 | 0.0% |
| Uganda | 25 | 0.0% |
| Ukraine | 95 | 0.0% |
| Uruguay | 19 | 0.0% |
| Venezuela | 851 | 0.2% |
| Vietnam | 547 | 0.2% |
| West Indies | 20 | 0.0% |
| Western Africa | 120 | 0.0% |
| Western Asia | 369 | 0.1% |
| Western Europe | 629 | 0.2% |
| Zaire | 21 | 0.0% |
| Zimbabwe | 21 | 0.0% | View All 101 Rows |
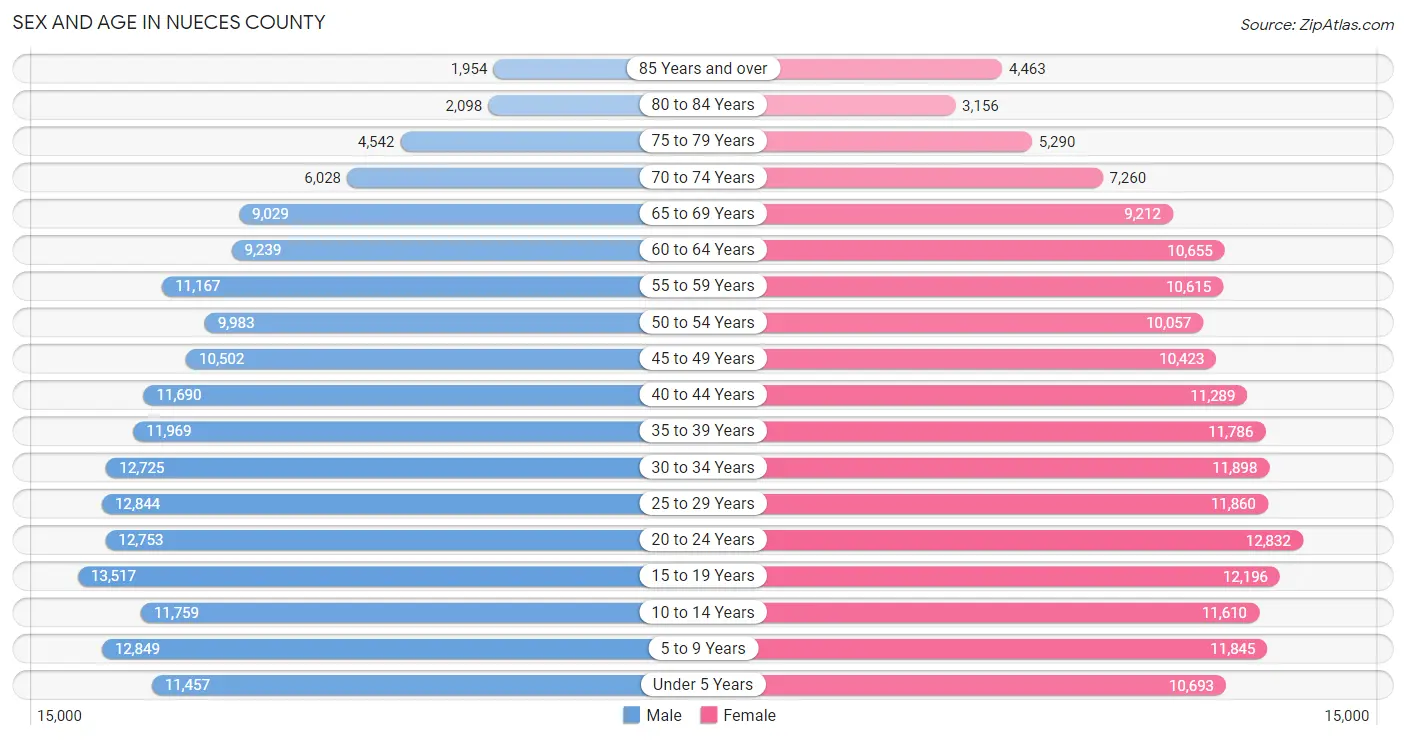
Sex and Age in Nueces County
Sex and Age in Nueces County
The most populous age groups in Nueces County are 15 to 19 Years (13,517 | 7.7%) for men and 20 to 24 Years (12,832 | 7.2%) for women.
| Age Bracket | Male | Female |
| Under 5 Years | 11,457 (6.5%) | 10,693 (6.0%) |
| 5 to 9 Years | 12,849 (7.3%) | 11,845 (6.7%) |
| 10 to 14 Years | 11,759 (6.7%) | 11,610 (6.6%) |
| 15 to 19 Years | 13,517 (7.7%) | 12,196 (6.9%) |
| 20 to 24 Years | 12,753 (7.2%) | 12,832 (7.2%) |
| 25 to 29 Years | 12,844 (7.3%) | 11,860 (6.7%) |
| 30 to 34 Years | 12,725 (7.2%) | 11,898 (6.7%) |
| 35 to 39 Years | 11,969 (6.8%) | 11,786 (6.7%) |
| 40 to 44 Years | 11,690 (6.6%) | 11,289 (6.4%) |
| 45 to 49 Years | 10,502 (6.0%) | 10,423 (5.9%) |
| 50 to 54 Years | 9,983 (5.7%) | 10,057 (5.7%) |
| 55 to 59 Years | 11,167 (6.3%) | 10,615 (6.0%) |
| 60 to 64 Years | 9,239 (5.2%) | 10,655 (6.0%) |
| 65 to 69 Years | 9,029 (5.1%) | 9,212 (5.2%) |
| 70 to 74 Years | 6,028 (3.4%) | 7,260 (4.1%) |
| 75 to 79 Years | 4,542 (2.6%) | 5,290 (3.0%) |
| 80 to 84 Years | 2,098 (1.2%) | 3,156 (1.8%) |
| 85 Years and over | 1,954 (1.1%) | 4,463 (2.5%) |
| Total | 176,105 (100.0%) | 177,140 (100.0%) |
Families and Households in Nueces County
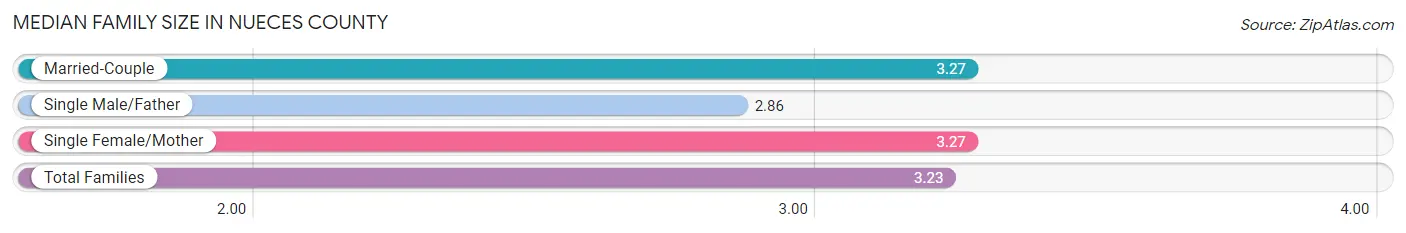
Median Family Size in Nueces County
The median family size in Nueces County is 3.23 persons per family, with married-couple families (58,939 | 66.7%) accounting for the largest median family size of 3.27 persons per family. On the other hand, single male/father families (7,936 | 9.0%) represent the smallest median family size with 2.86 persons per family.
| Family Type | # Families | Family Size |
| Married-Couple | 58,939 (66.7%) | 3.27 |
| Single Male/Father | 7,936 (9.0%) | 2.86 |
| Single Female/Mother | 21,437 (24.3%) | 3.27 |
| Total Families | 88,312 (100.0%) | 3.23 |
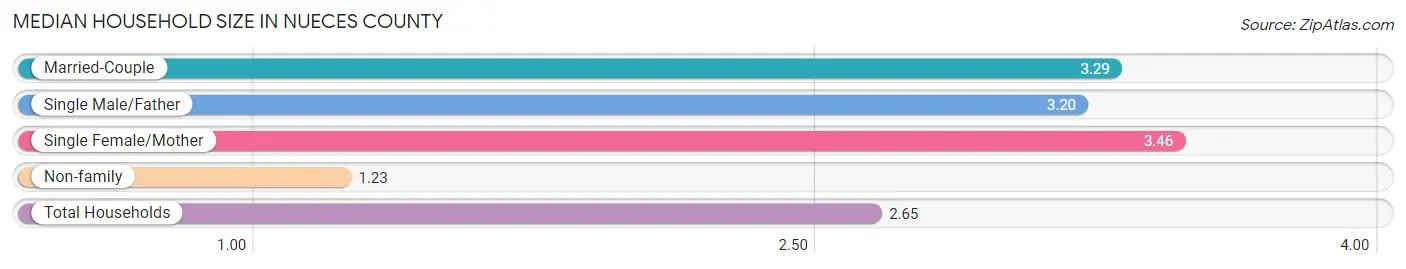
Median Household Size in Nueces County
The median household size in Nueces County is 2.65 persons per household, with single female/mother households (21,437 | 16.5%) accounting for the largest median household size of 3.46 persons per household. non-family households (41,810 | 32.1%) represent the smallest median household size with 1.23 persons per household.
| Household Type | # Households | Household Size |
| Married-Couple | 58,939 (45.3%) | 3.29 |
| Single Male/Father | 7,936 (6.1%) | 3.20 |
| Single Female/Mother | 21,437 (16.5%) | 3.46 |
| Non-family | 41,810 (32.1%) | 1.23 |
| Total Households | 130,122 (100.0%) | 2.65 |
Household Size by Marriage Status in Nueces County
Out of a total of 130,122 households in Nueces County, 88,312 (67.9%) are family households, while 41,810 (32.1%) are nonfamily households. The most numerous type of family households are 2-person households, comprising 36,607, and the most common type of nonfamily households are 1-person households, comprising 34,193.
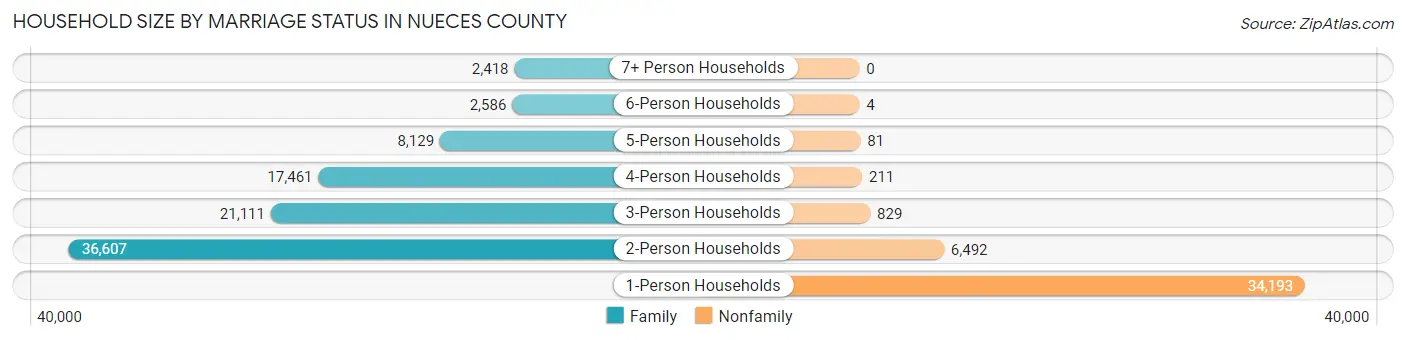
| Household Size | Family Households | Nonfamily Households |
| 1-Person Households | - | 34,193 (26.3%) |
| 2-Person Households | 36,607 (28.1%) | 6,492 (5.0%) |
| 3-Person Households | 21,111 (16.2%) | 829 (0.6%) |
| 4-Person Households | 17,461 (13.4%) | 211 (0.2%) |
| 5-Person Households | 8,129 (6.2%) | 81 (0.1%) |
| 6-Person Households | 2,586 (2.0%) | 4 (0.0%) |
| 7+ Person Households | 2,418 (1.9%) | 0 (0.0%) |
| Total | 88,312 (67.9%) | 41,810 (32.1%) |
Female Fertility in Nueces County
Fertility by Age in Nueces County
Average fertility rate in Nueces County is 55.0 births per 1,000 women. Women in the age bracket of 20 to 34 years have the highest fertility rate with 88.0 births per 1,000 women. Women in the age bracket of 20 to 34 years acount for 69.5% of all women with births.
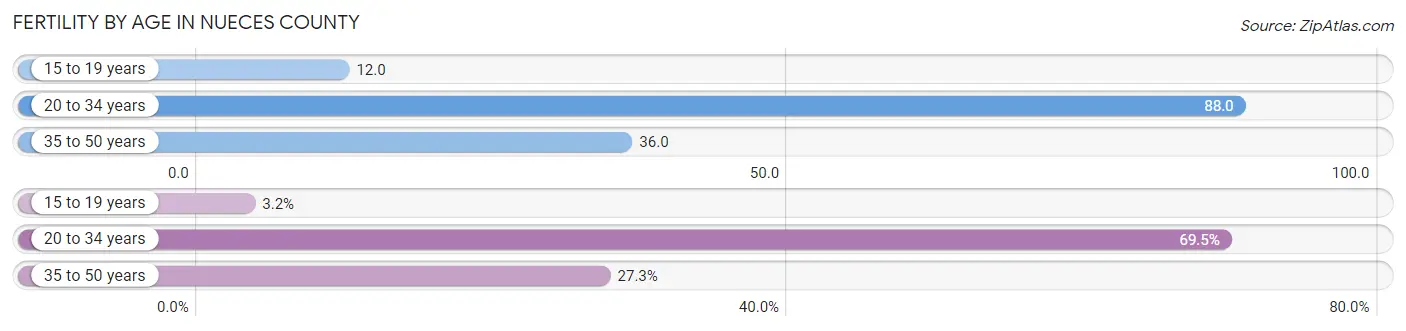
| Age Bracket | Women with Births | Births / 1,000 Women |
| 15 to 19 years | 149 (3.2%) | 12.0 |
| 20 to 34 years | 3,221 (69.5%) | 88.0 |
| 35 to 50 years | 1,267 (27.3%) | 36.0 |
| Total | 4,637 (100.0%) | 55.0 |
Fertility by Age by Marriage Status in Nueces County
58.7% of women with births (4,637) in Nueces County are married. The highest percentage of unmarried women with births falls into 15 to 19 years age bracket with 75.8% of them unmarried at the time of birth, while the lowest percentage of unmarried women with births belong to 35 to 50 years age bracket with 18.9% of them unmarried.
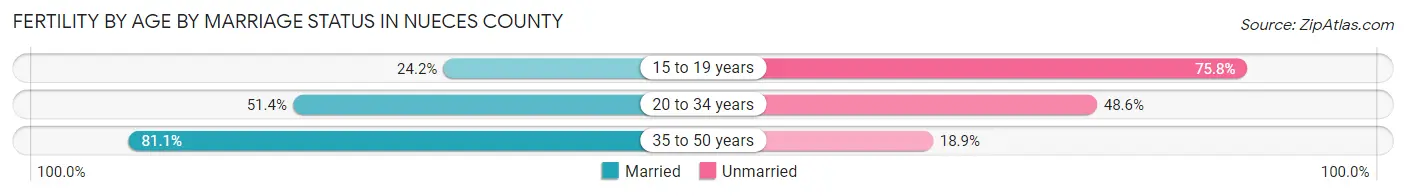
| Age Bracket | Married | Unmarried |
| 15 to 19 years | 36 (24.2%) | 113 (75.8%) |
| 20 to 34 years | 1,656 (51.4%) | 1,565 (48.6%) |
| 35 to 50 years | 1,028 (81.1%) | 239 (18.9%) |
| Total | 2,722 (58.7%) | 1,915 (41.3%) |
Fertility by Education in Nueces County
Average fertility rate in Nueces County is 55.0 births per 1,000 women. Women with the education attainment of bachelor's degree have the highest fertility rate of 69.0 births per 1,000 women, while women with the education attainment of less than high school have the lowest fertility at 41.0 births per 1,000 women. Women with the education attainment of college or associate's degree represent 41.3% of all women with births.
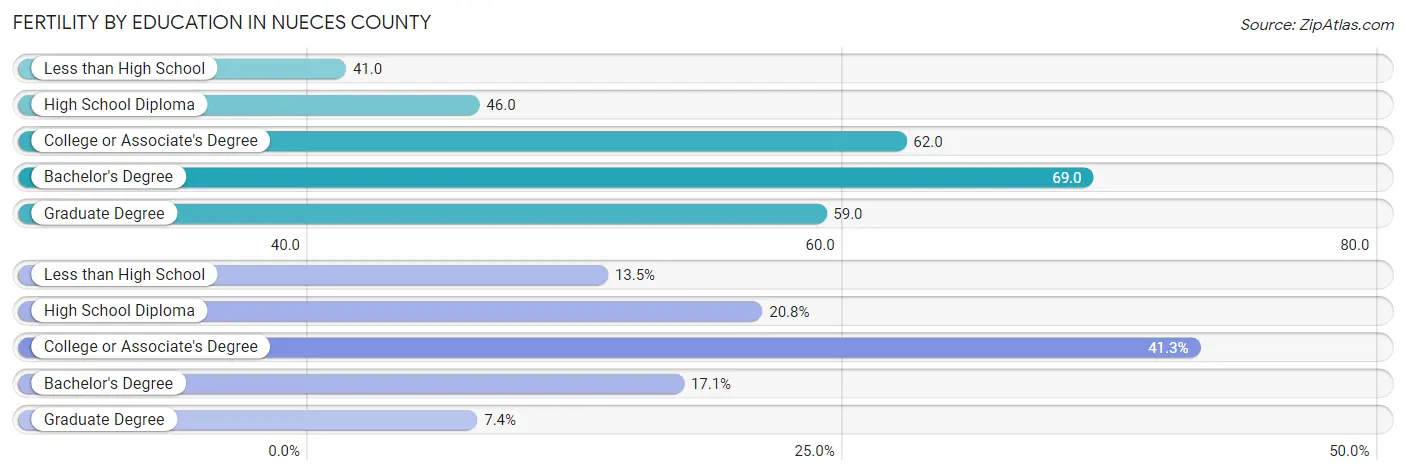
| Educational Attainment | Women with Births | Births / 1,000 Women |
| Less than High School | 627 (13.5%) | 41.0 |
| High School Diploma | 962 (20.7%) | 46.0 |
| College or Associate's Degree | 1,913 (41.3%) | 62.0 |
| Bachelor's Degree | 792 (17.1%) | 69.0 |
| Graduate Degree | 343 (7.4%) | 59.0 |
| Total | 4,637 (100.0%) | 55.0 |
Fertility by Education by Marriage Status in Nueces County
41.3% of women with births in Nueces County are unmarried. Women with the educational attainment of graduate degree are most likely to be married with 100.0% of them married at childbirth, while women with the educational attainment of less than high school are least likely to be married with 65.9% of them unmarried at childbirth.
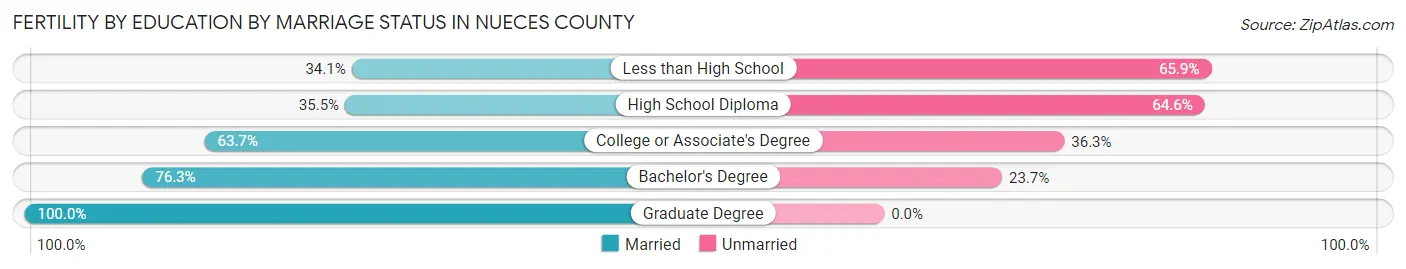
| Educational Attainment | Married | Unmarried |
| Less than High School | 214 (34.1%) | 413 (65.9%) |
| High School Diploma | 341 (35.4%) | 621 (64.5%) |
| College or Associate's Degree | 1,219 (63.7%) | 694 (36.3%) |
| Bachelor's Degree | 604 (76.3%) | 188 (23.7%) |
| Graduate Degree | 343 (100.0%) | 0 (0.0%) |
| Total | 2,722 (58.7%) | 1,915 (41.3%) |
Employment Characteristics in Nueces County
Employment by Class of Employer in Nueces County
Among the 160,375 employed individuals in Nueces County, private company employees (108,891 | 67.9%), local government employees (12,783 | 8.0%), and self-employed (not incorporated) (11,326 | 7.1%) make up the most common classes of employment.
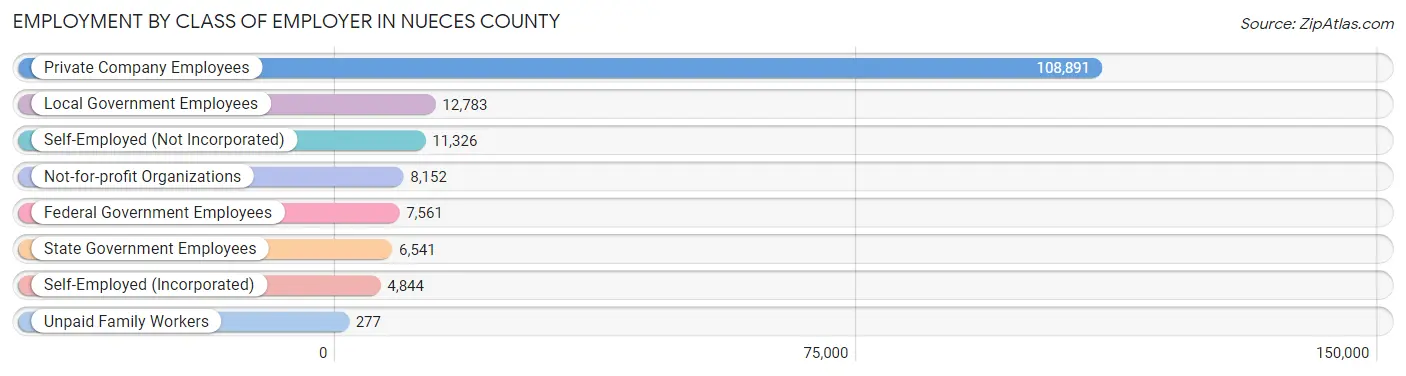
| Employer Class | # Employees | % Employees |
| Private Company Employees | 108,891 | 67.9% |
| Self-Employed (Incorporated) | 4,844 | 3.0% |
| Self-Employed (Not Incorporated) | 11,326 | 7.1% |
| Not-for-profit Organizations | 8,152 | 5.1% |
| Local Government Employees | 12,783 | 8.0% |
| State Government Employees | 6,541 | 4.1% |
| Federal Government Employees | 7,561 | 4.7% |
| Unpaid Family Workers | 277 | 0.2% |
| Total | 160,375 | 100.0% |
Employment Status by Age in Nueces County
According to the labor force statistics for Nueces County, out of the total population over 16 years of age (277,990), 62.0% or 172,354 individuals are in the labor force, with 5.7% or 9,824 of them unemployed. The age group with the highest labor force participation rate is 35 to 44 years, with 82.2% or 38,415 individuals in the labor force. Within the labor force, the 16 to 19 years age range has the highest percentage of unemployed individuals, with 21.5% or 1,231 of them being unemployed.
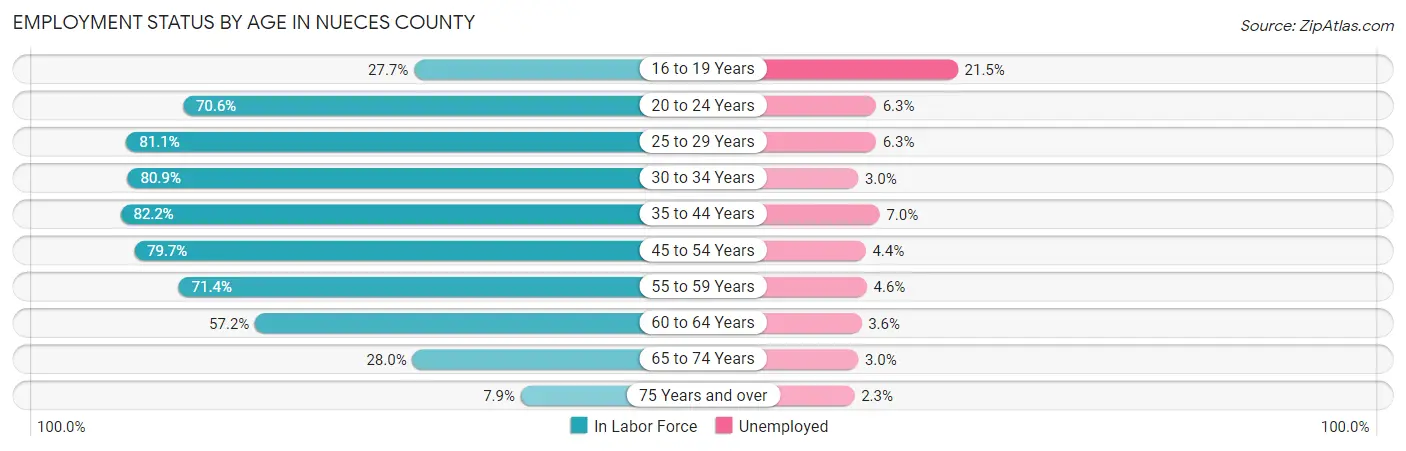
| Age Bracket | In Labor Force | Unemployed |
| 16 to 19 Years | 5,726 (27.7%) | 1,231 (21.5%) |
| 20 to 24 Years | 18,063 (70.6%) | 1,138 (6.3%) |
| 25 to 29 Years | 20,035 (81.1%) | 1,262 (6.3%) |
| 30 to 34 Years | 19,920 (80.9%) | 598 (3.0%) |
| 35 to 44 Years | 38,415 (82.2%) | 2,689 (7.0%) |
| 45 to 54 Years | 32,649 (79.7%) | 1,437 (4.4%) |
| 55 to 59 Years | 15,552 (71.4%) | 715 (4.6%) |
| 60 to 64 Years | 11,379 (57.2%) | 410 (3.6%) |
| 65 to 74 Years | 8,828 (28.0%) | 265 (3.0%) |
| 75 Years and over | 1,699 (7.9%) | 39 (2.3%) |
| Total | 172,354 (62.0%) | 9,824 (5.7%) |
Employment Status by Educational Attainment in Nueces County
According to labor force statistics for Nueces County, 77.2% of individuals (137,958) out of the total population between 25 and 64 years of age (178,702) are in the labor force, with 5.1% or 7,036 of them being unemployed. The group with the highest labor force participation rate are those with the educational attainment of bachelor's degree or higher, with 86.6% or 35,257 individuals in the labor force. Within the labor force, individuals with less than high school education have the highest percentage of unemployment, with 9.3% or 1,434 of them being unemployed.
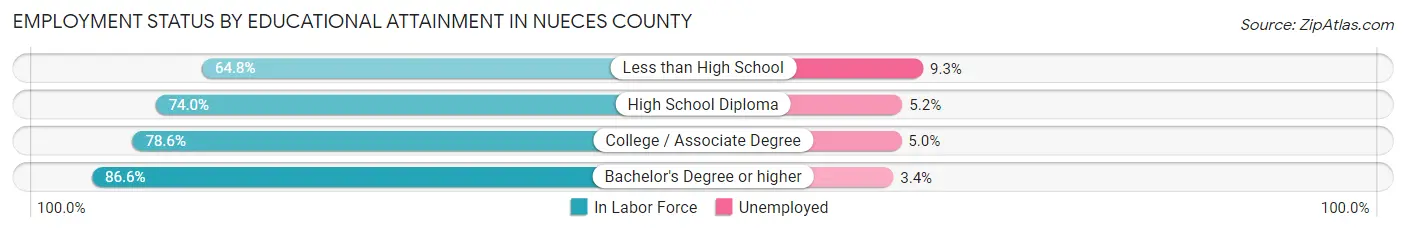
| Educational Attainment | In Labor Force | Unemployed |
| Less than High School | 15,422 (64.8%) | 2,213 (9.3%) |
| High School Diploma | 39,147 (74.0%) | 2,751 (5.2%) |
| College / Associate Degree | 48,173 (78.6%) | 3,064 (5.0%) |
| Bachelor's Degree or higher | 35,257 (86.6%) | 1,384 (3.4%) |
| Total | 137,958 (77.2%) | 9,114 (5.1%) |
Employment Occupations by Sex in Nueces County
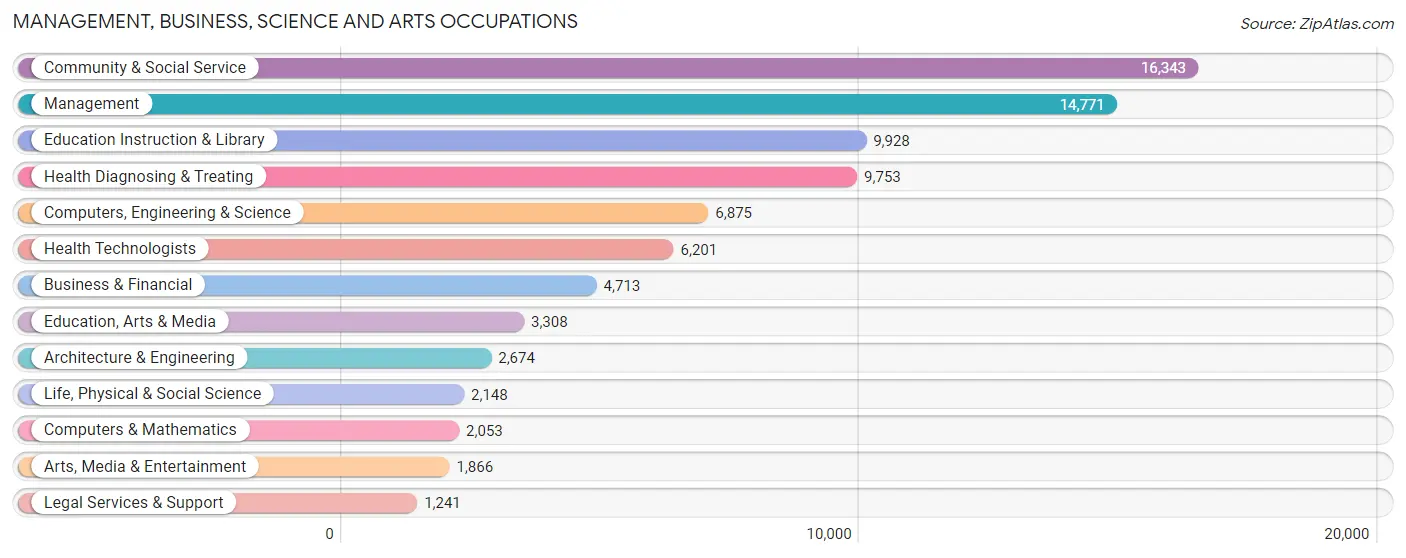
Management, Business, Science and Arts Occupations
The most common Management, Business, Science and Arts occupations in Nueces County are Community & Social Service (16,343 | 10.2%), Management (14,771 | 9.2%), Education Instruction & Library (9,928 | 6.2%), Health Diagnosing & Treating (9,753 | 6.1%), and Computers, Engineering & Science (6,875 | 4.3%).
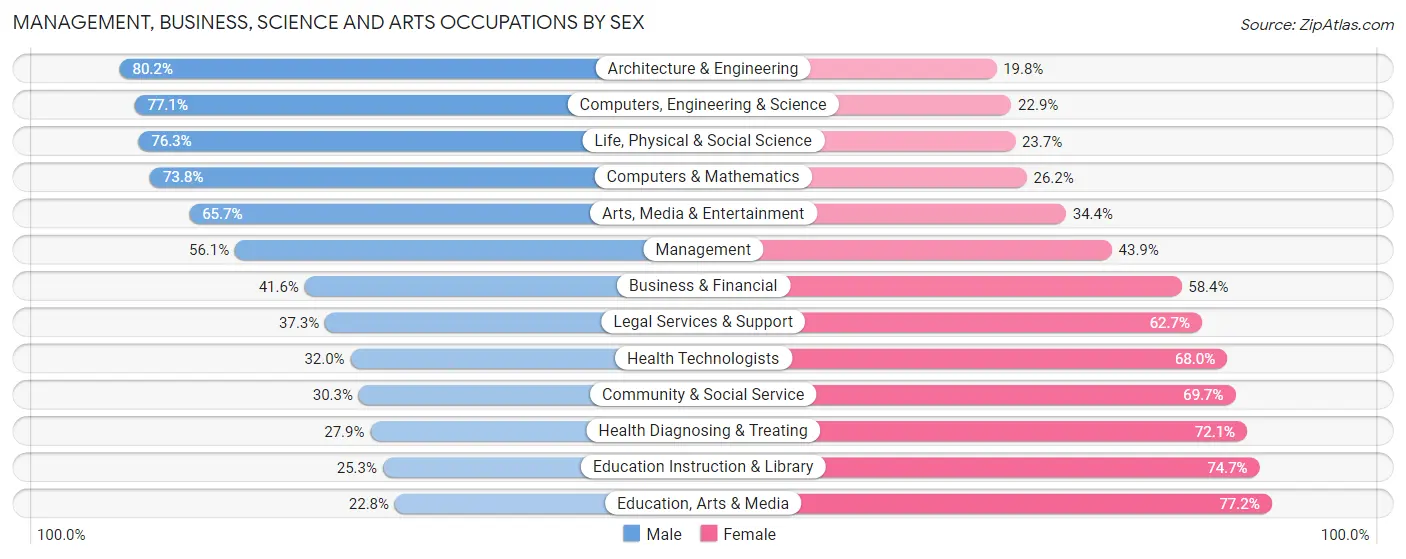
Management, Business, Science and Arts Occupations by Sex
Within the Management, Business, Science and Arts occupations in Nueces County, the most male-oriented occupations are Architecture & Engineering (80.2%), Computers, Engineering & Science (77.1%), and Life, Physical & Social Science (76.3%), while the most female-oriented occupations are Education, Arts & Media (77.2%), Education Instruction & Library (74.7%), and Health Diagnosing & Treating (72.1%).
| Occupation | Male | Female |
| Management | 8,286 (56.1%) | 6,485 (43.9%) |
| Business & Financial | 1,959 (41.6%) | 2,754 (58.4%) |
| Computers, Engineering & Science | 5,298 (77.1%) | 1,577 (22.9%) |
| Computers & Mathematics | 1,516 (73.8%) | 537 (26.2%) |
| Architecture & Engineering | 2,144 (80.2%) | 530 (19.8%) |
| Life, Physical & Social Science | 1,638 (76.3%) | 510 (23.7%) |
| Community & Social Service | 4,950 (30.3%) | 11,393 (69.7%) |
| Education, Arts & Media | 753 (22.8%) | 2,555 (77.2%) |
| Legal Services & Support | 463 (37.3%) | 778 (62.7%) |
| Education Instruction & Library | 2,509 (25.3%) | 7,419 (74.7%) |
| Arts, Media & Entertainment | 1,225 (65.6%) | 641 (34.4%) |
| Health Diagnosing & Treating | 2,719 (27.9%) | 7,034 (72.1%) |
| Health Technologists | 1,986 (32.0%) | 4,215 (68.0%) |
| Total (Category) | 23,212 (44.3%) | 29,243 (55.7%) |
| Total (Overall) | 86,624 (54.0%) | 73,913 (46.0%) |
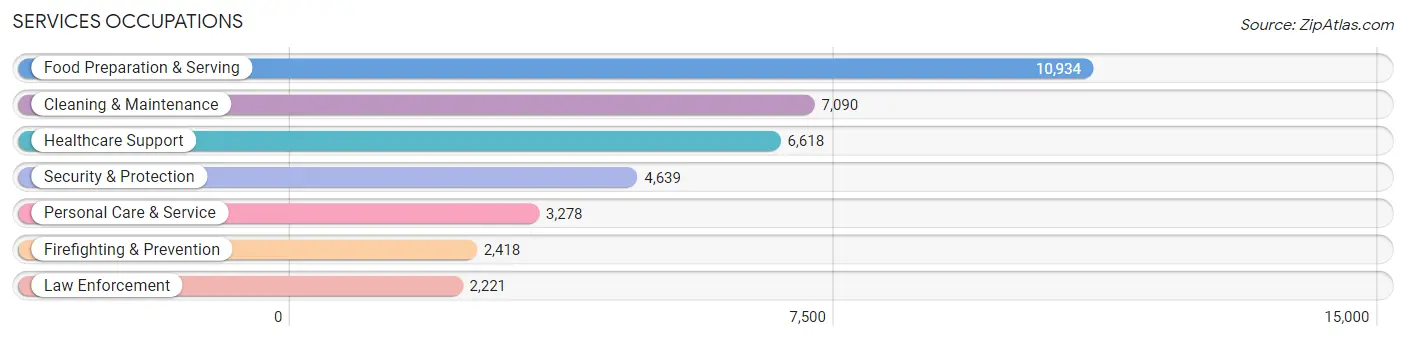
Services Occupations
The most common Services occupations in Nueces County are Food Preparation & Serving (10,934 | 6.8%), Cleaning & Maintenance (7,090 | 4.4%), Healthcare Support (6,618 | 4.1%), Security & Protection (4,639 | 2.9%), and Personal Care & Service (3,278 | 2.0%).
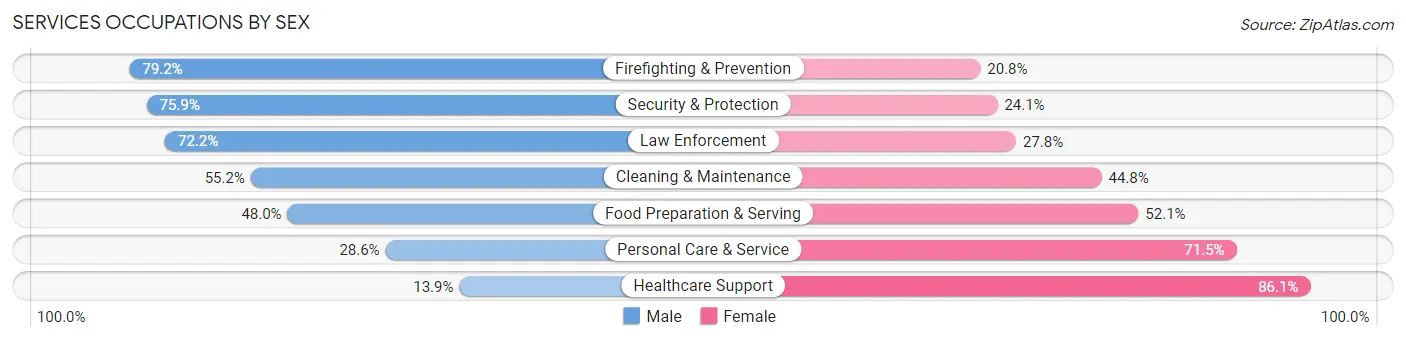
Services Occupations by Sex
Within the Services occupations in Nueces County, the most male-oriented occupations are Firefighting & Prevention (79.2%), Security & Protection (75.9%), and Law Enforcement (72.2%), while the most female-oriented occupations are Healthcare Support (86.1%), Personal Care & Service (71.5%), and Food Preparation & Serving (52.0%).
| Occupation | Male | Female |
| Healthcare Support | 922 (13.9%) | 5,696 (86.1%) |
| Security & Protection | 3,519 (75.9%) | 1,120 (24.1%) |
| Firefighting & Prevention | 1,916 (79.2%) | 502 (20.8%) |
| Law Enforcement | 1,603 (72.2%) | 618 (27.8%) |
| Food Preparation & Serving | 5,243 (47.9%) | 5,691 (52.0%) |
| Cleaning & Maintenance | 3,916 (55.2%) | 3,174 (44.8%) |
| Personal Care & Service | 936 (28.5%) | 2,342 (71.5%) |
| Total (Category) | 14,536 (44.7%) | 18,023 (55.3%) |
| Total (Overall) | 86,624 (54.0%) | 73,913 (46.0%) |
Sales and Office Occupations
The most common Sales and Office occupations in Nueces County are Office & Administration (17,576 | 11.0%), and Sales & Related (16,686 | 10.4%).
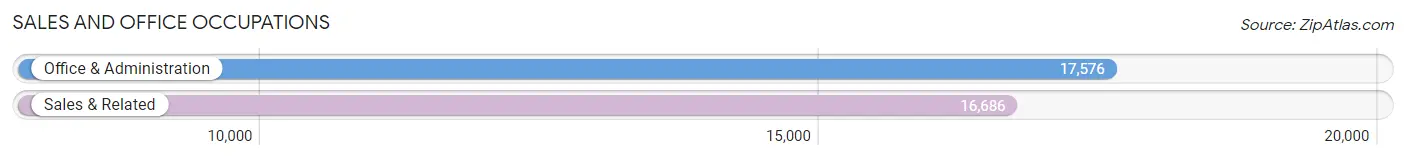
Sales and Office Occupations by Sex
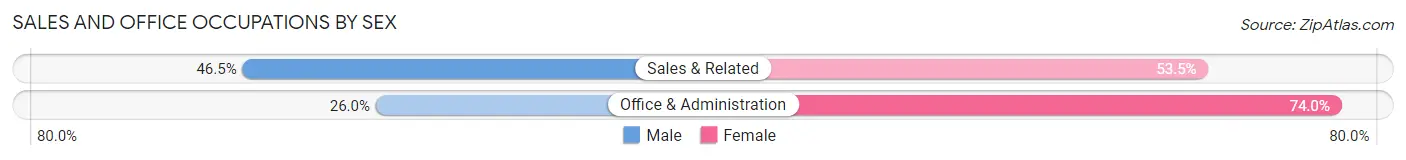
| Occupation | Male | Female |
| Sales & Related | 7,756 (46.5%) | 8,930 (53.5%) |
| Office & Administration | 4,564 (26.0%) | 13,012 (74.0%) |
| Total (Category) | 12,320 (36.0%) | 21,942 (64.0%) |
| Total (Overall) | 86,624 (54.0%) | 73,913 (46.0%) |
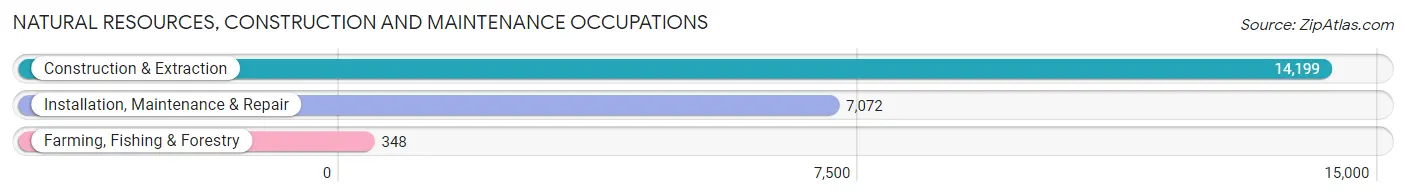
Natural Resources, Construction and Maintenance Occupations
The most common Natural Resources, Construction and Maintenance occupations in Nueces County are Construction & Extraction (14,199 | 8.8%), Installation, Maintenance & Repair (7,072 | 4.4%), and Farming, Fishing & Forestry (348 | 0.2%).
Natural Resources, Construction and Maintenance Occupations by Sex
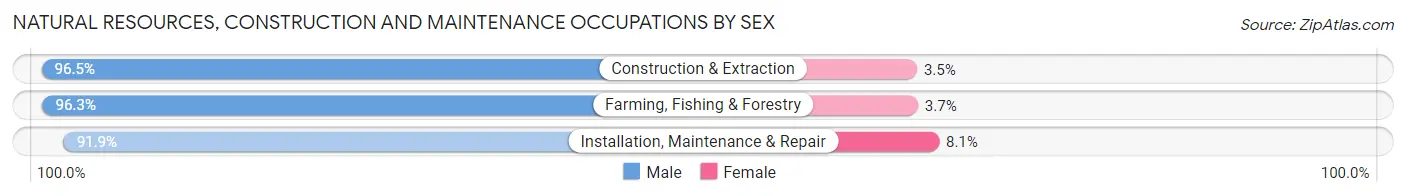
| Occupation | Male | Female |
| Farming, Fishing & Forestry | 335 (96.3%) | 13 (3.7%) |
| Construction & Extraction | 13,697 (96.5%) | 502 (3.5%) |
| Installation, Maintenance & Repair | 6,496 (91.9%) | 576 (8.1%) |
| Total (Category) | 20,528 (95.0%) | 1,091 (5.1%) |
| Total (Overall) | 86,624 (54.0%) | 73,913 (46.0%) |
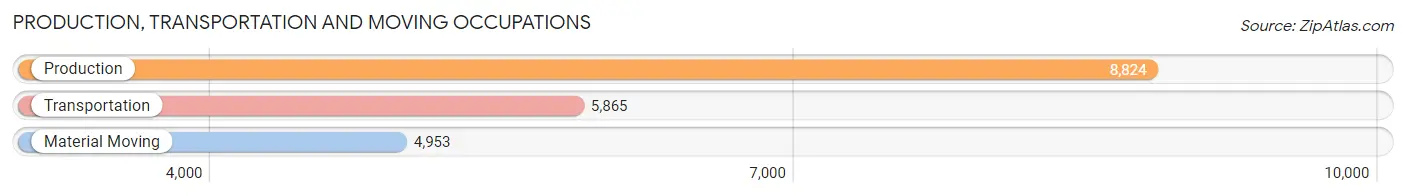
Production, Transportation and Moving Occupations
The most common Production, Transportation and Moving occupations in Nueces County are Production (8,824 | 5.5%), Transportation (5,865 | 3.6%), and Material Moving (4,953 | 3.1%).
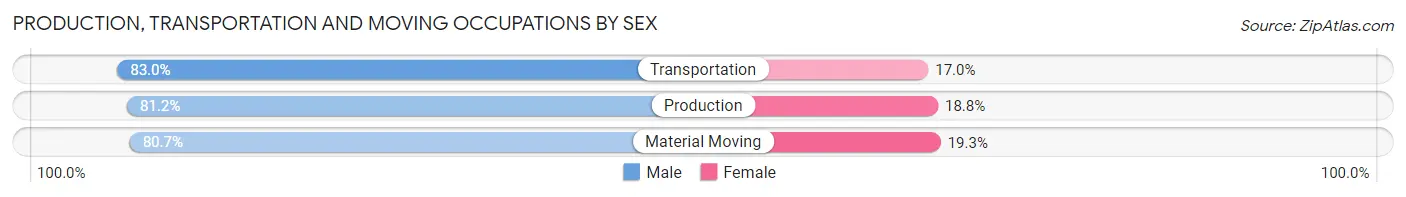
Production, Transportation and Moving Occupations by Sex
| Occupation | Male | Female |
| Production | 7,164 (81.2%) | 1,660 (18.8%) |
| Transportation | 4,867 (83.0%) | 998 (17.0%) |
| Material Moving | 3,997 (80.7%) | 956 (19.3%) |
| Total (Category) | 16,028 (81.6%) | 3,614 (18.4%) |
| Total (Overall) | 86,624 (54.0%) | 73,913 (46.0%) |
Employment Industries by Sex in Nueces County
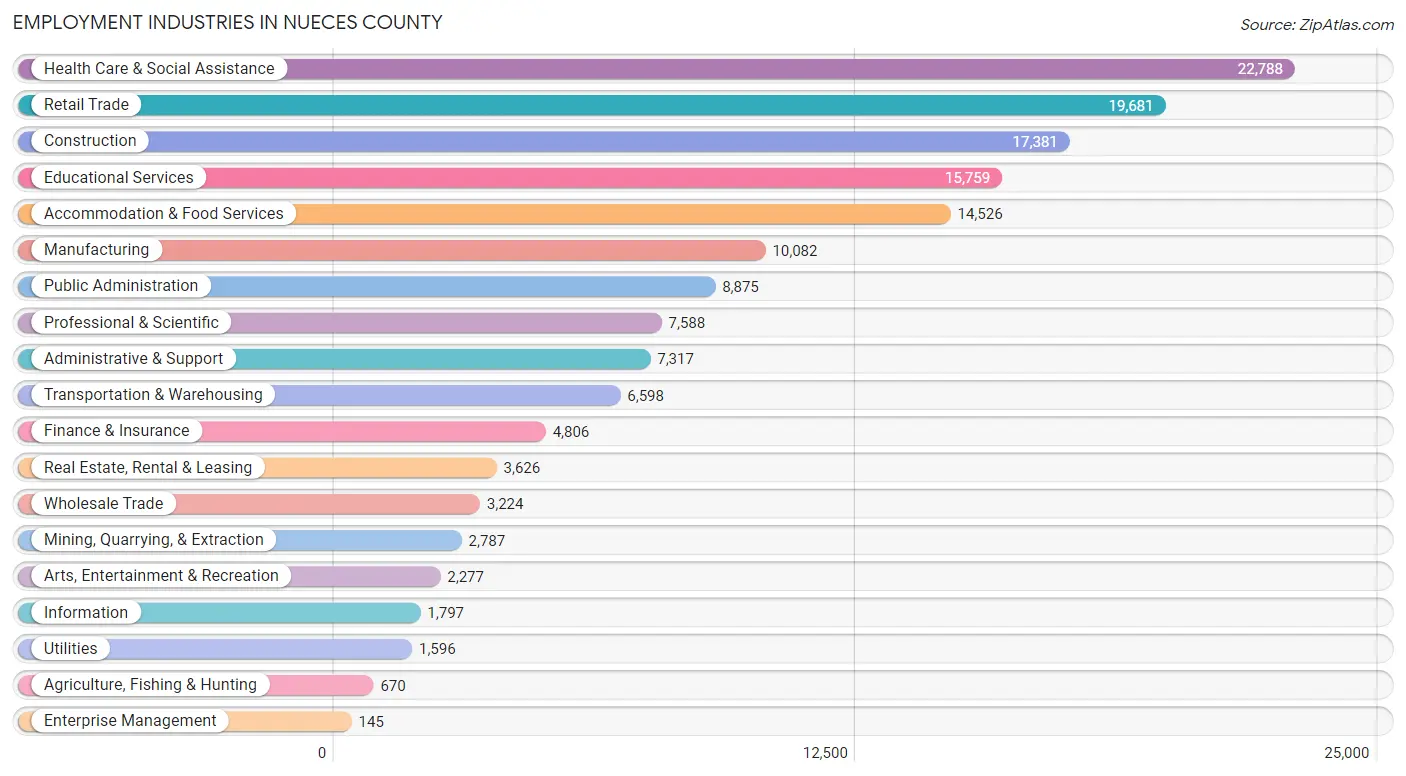
Employment Industries in Nueces County
The major employment industries in Nueces County include Health Care & Social Assistance (22,788 | 14.2%), Retail Trade (19,681 | 12.3%), Construction (17,381 | 10.8%), Educational Services (15,759 | 9.8%), and Accommodation & Food Services (14,526 | 9.0%).
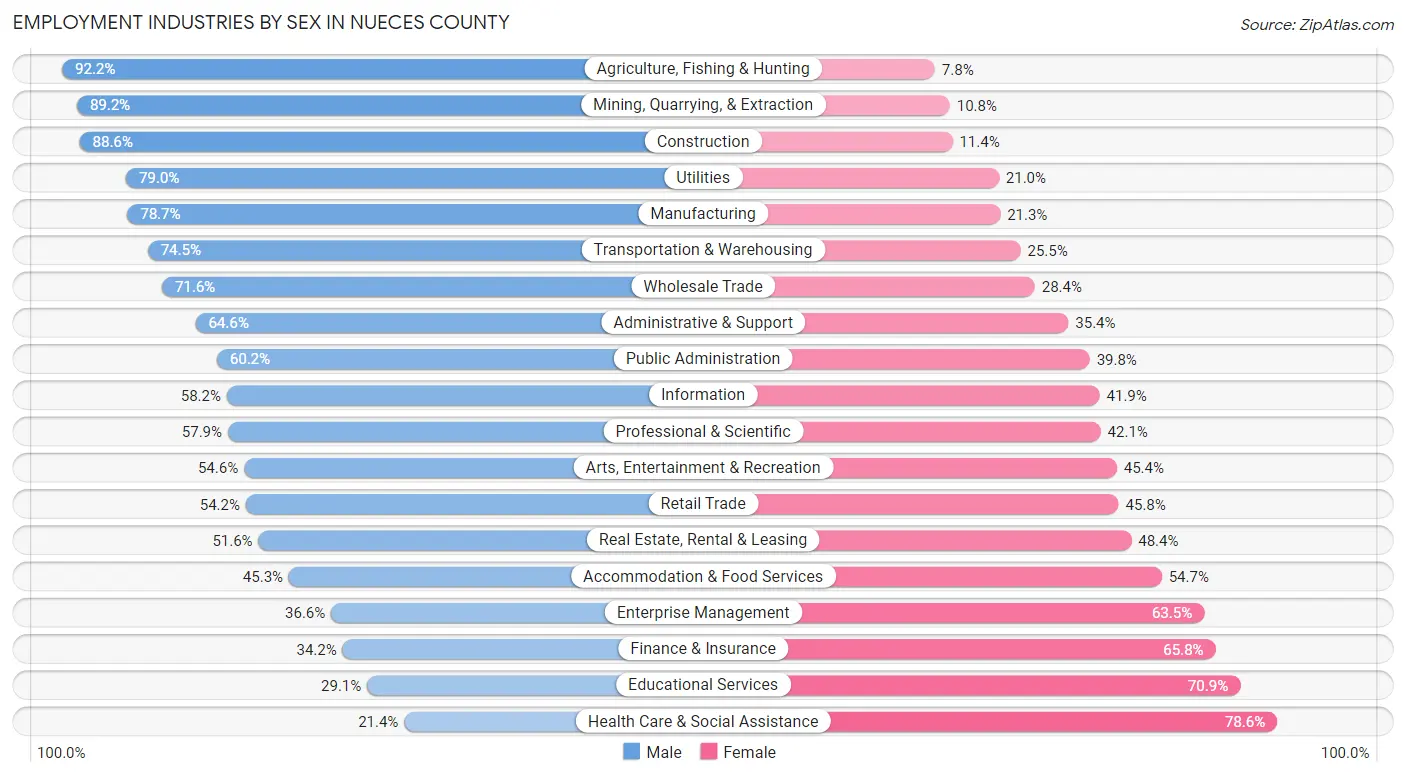
Employment Industries by Sex in Nueces County
The Nueces County industries that see more men than women are Agriculture, Fishing & Hunting (92.2%), Mining, Quarrying, & Extraction (89.2%), and Construction (88.6%), whereas the industries that tend to have a higher number of women are Health Care & Social Assistance (78.6%), Educational Services (70.9%), and Finance & Insurance (65.8%).
| Industry | Male | Female |
| Agriculture, Fishing & Hunting | 618 (92.2%) | 52 (7.8%) |
| Mining, Quarrying, & Extraction | 2,485 (89.2%) | 302 (10.8%) |
| Construction | 15,399 (88.6%) | 1,982 (11.4%) |
| Manufacturing | 7,938 (78.7%) | 2,144 (21.3%) |
| Wholesale Trade | 2,307 (71.6%) | 917 (28.4%) |
| Retail Trade | 10,671 (54.2%) | 9,010 (45.8%) |
| Transportation & Warehousing | 4,916 (74.5%) | 1,682 (25.5%) |
| Utilities | 1,261 (79.0%) | 335 (21.0%) |
| Information | 1,045 (58.2%) | 752 (41.8%) |
| Finance & Insurance | 1,643 (34.2%) | 3,163 (65.8%) |
| Real Estate, Rental & Leasing | 1,871 (51.6%) | 1,755 (48.4%) |
| Professional & Scientific | 4,396 (57.9%) | 3,192 (42.1%) |
| Enterprise Management | 53 (36.5%) | 92 (63.4%) |
| Administrative & Support | 4,728 (64.6%) | 2,589 (35.4%) |
| Educational Services | 4,586 (29.1%) | 11,173 (70.9%) |
| Health Care & Social Assistance | 4,883 (21.4%) | 17,905 (78.6%) |
| Arts, Entertainment & Recreation | 1,243 (54.6%) | 1,034 (45.4%) |
| Accommodation & Food Services | 6,579 (45.3%) | 7,947 (54.7%) |
| Public Administration | 5,343 (60.2%) | 3,532 (39.8%) |
| Total | 86,624 (54.0%) | 73,913 (46.0%) |
Education in Nueces County
School Enrollment in Nueces County
The most common levels of schooling among the 85,262 students in Nueces County are high school (18,787 | 22.0%), middle school (18,454 | 21.6%), and elementary school (17,736 | 20.8%).
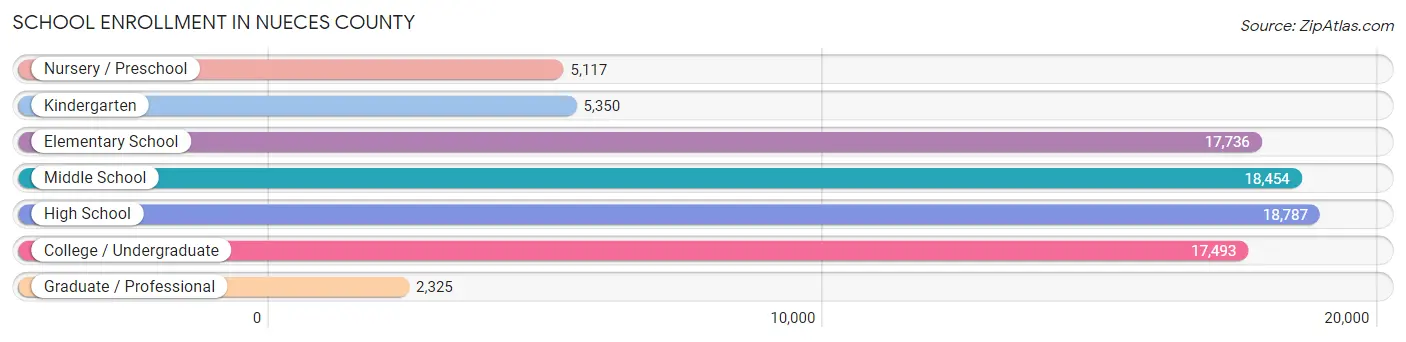
| School Level | # Students | % Students |
| Nursery / Preschool | 5,117 | 6.0% |
| Kindergarten | 5,350 | 6.3% |
| Elementary School | 17,736 | 20.8% |
| Middle School | 18,454 | 21.6% |
| High School | 18,787 | 22.0% |
| College / Undergraduate | 17,493 | 20.5% |
| Graduate / Professional | 2,325 | 2.7% |
| Total | 85,262 | 100.0% |
School Enrollment by Age by Funding Source in Nueces County
Out of a total of 85,262 students who are enrolled in schools in Nueces County, 6,821 (8.0%) attend a private institution, while the remaining 78,441 (92.0%) are enrolled in public schools. The age group of 3 to 4 year olds has the highest likelihood of being enrolled in private schools, with 1,120 (27.1% in the age bracket) enrolled. Conversely, the age group of 15 to 17 year olds has the lowest likelihood of being enrolled in a private school, with 13,109 (96.4% in the age bracket) attending a public institution.
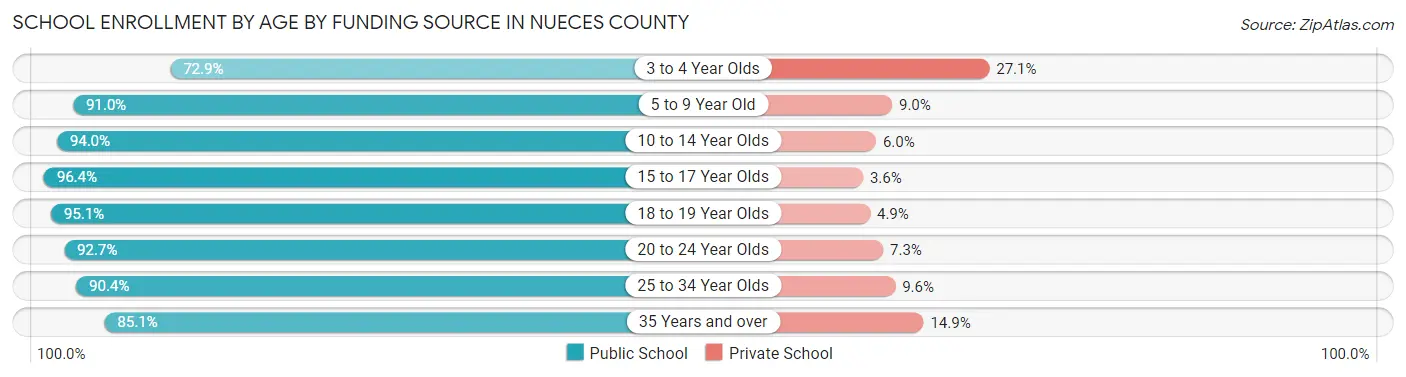
| Age Bracket | Public School | Private School |
| 3 to 4 Year Olds | 3,008 (72.9%) | 1,120 (27.1%) |
| 5 to 9 Year Old | 20,186 (91.0%) | 1,998 (9.0%) |
| 10 to 14 Year Olds | 21,000 (94.0%) | 1,344 (6.0%) |
| 15 to 17 Year Olds | 13,109 (96.4%) | 488 (3.6%) |
| 18 to 19 Year Olds | 7,072 (95.1%) | 365 (4.9%) |
| 20 to 24 Year Olds | 7,032 (92.7%) | 557 (7.3%) |
| 25 to 34 Year Olds | 3,910 (90.4%) | 415 (9.6%) |
| 35 Years and over | 3,114 (85.1%) | 544 (14.9%) |
| Total | 78,441 (92.0%) | 6,821 (8.0%) |
Educational Attainment by Field of Study in Nueces County
Business (11,036 | 20.0%), education (8,884 | 16.1%), science & technology (5,720 | 10.3%), arts & humanities (4,109 | 7.4%), and bio, nature & agricultural (4,011 | 7.2%) are the most common fields of study among 55,331 individuals in Nueces County who have obtained a bachelor's degree or higher.
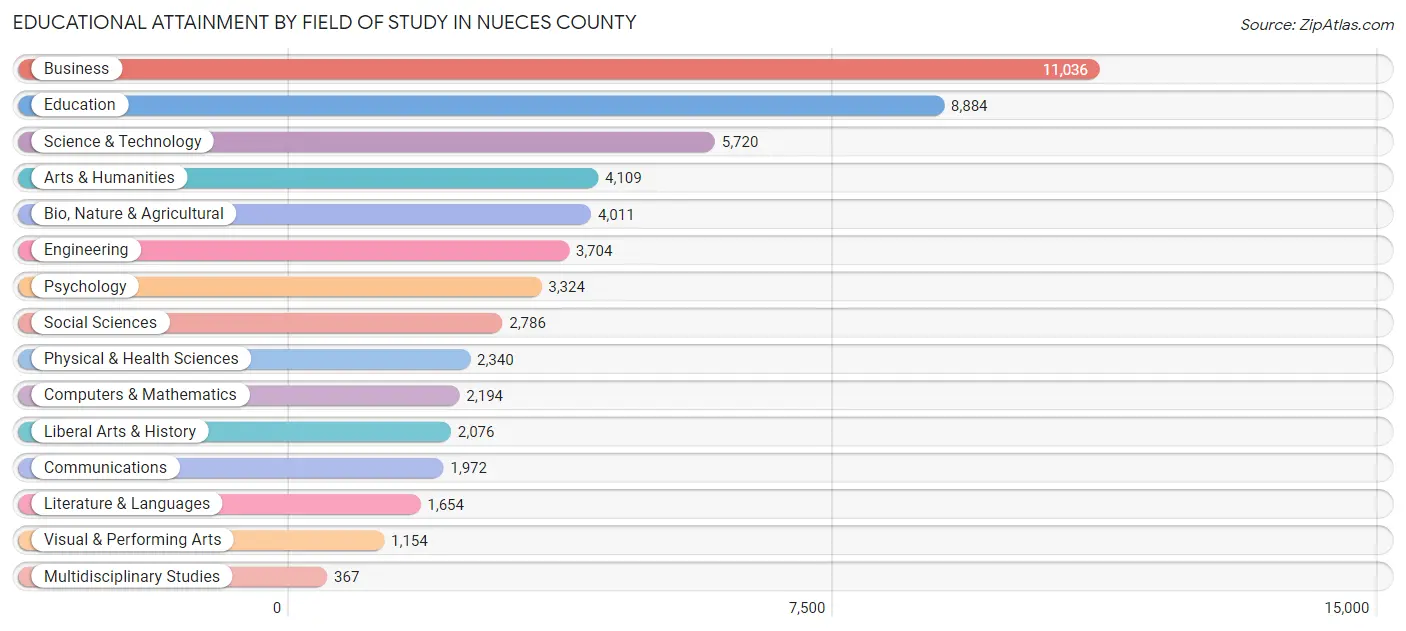
| Field of Study | # Graduates | % Graduates |
| Computers & Mathematics | 2,194 | 4.0% |
| Bio, Nature & Agricultural | 4,011 | 7.2% |
| Physical & Health Sciences | 2,340 | 4.2% |
| Psychology | 3,324 | 6.0% |
| Social Sciences | 2,786 | 5.0% |
| Engineering | 3,704 | 6.7% |
| Multidisciplinary Studies | 367 | 0.7% |
| Science & Technology | 5,720 | 10.3% |
| Business | 11,036 | 20.0% |
| Education | 8,884 | 16.1% |
| Literature & Languages | 1,654 | 3.0% |
| Liberal Arts & History | 2,076 | 3.7% |
| Visual & Performing Arts | 1,154 | 2.1% |
| Communications | 1,972 | 3.6% |
| Arts & Humanities | 4,109 | 7.4% |
| Total | 55,331 | 100.0% |
Transportation & Commute in Nueces County
Vehicle Availability by Sex in Nueces County
The most prevalent vehicle ownership categories in Nueces County are males with 2 vehicles (38,652, accounting for 44.4%) and females with 2 vehicles (29,454, making up 53.5%).
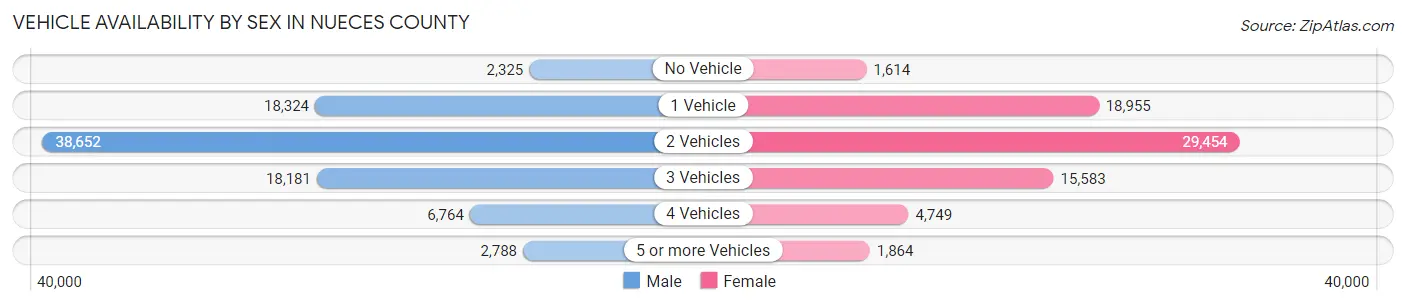
| Vehicles Available | Male | Female |
| No Vehicle | 2,325 (2.7%) | 1,614 (2.2%) |
| 1 Vehicle | 18,324 (21.0%) | 18,955 (26.3%) |
| 2 Vehicles | 38,652 (44.4%) | 29,454 (40.8%) |
| 3 Vehicles | 18,181 (20.9%) | 15,583 (21.6%) |
| 4 Vehicles | 6,764 (7.8%) | 4,749 (6.6%) |
| 5 or more Vehicles | 2,788 (3.2%) | 1,864 (2.6%) |
| Total | 87,034 (100.0%) | 72,219 (100.0%) |
Commute Time in Nueces County
The most frequently occuring commute durations in Nueces County are 15 to 19 minutes (47,903 commuters, 31.3%), 10 to 14 minutes (26,613 commuters, 17.4%), and 20 to 24 minutes (25,776 commuters, 16.8%).
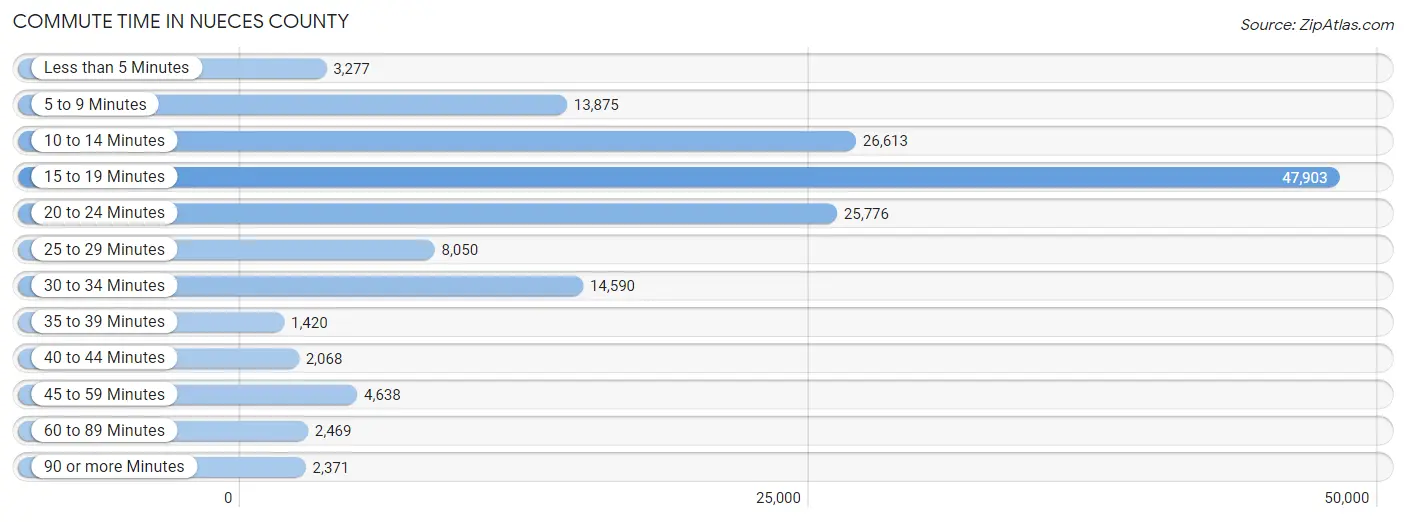
| Commute Time | # Commuters | % Commuters |
| Less than 5 Minutes | 3,277 | 2.1% |
| 5 to 9 Minutes | 13,875 | 9.1% |
| 10 to 14 Minutes | 26,613 | 17.4% |
| 15 to 19 Minutes | 47,903 | 31.3% |
| 20 to 24 Minutes | 25,776 | 16.8% |
| 25 to 29 Minutes | 8,050 | 5.3% |
| 30 to 34 Minutes | 14,590 | 9.5% |
| 35 to 39 Minutes | 1,420 | 0.9% |
| 40 to 44 Minutes | 2,068 | 1.3% |
| 45 to 59 Minutes | 4,638 | 3.0% |
| 60 to 89 Minutes | 2,469 | 1.6% |
| 90 or more Minutes | 2,371 | 1.5% |
Commute Time by Sex in Nueces County
The most common commute times in Nueces County are 15 to 19 minutes (27,215 commuters, 32.2%) for males and 15 to 19 minutes (20,688 commuters, 30.2%) for females.
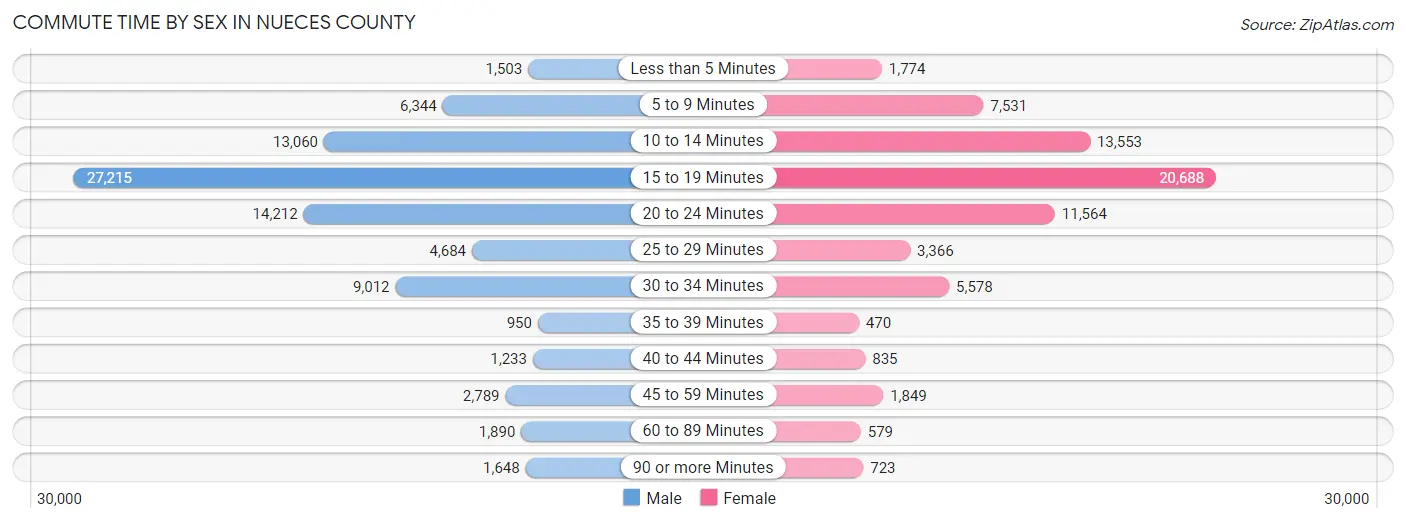
| Commute Time | Male | Female |
| Less than 5 Minutes | 1,503 (1.8%) | 1,774 (2.6%) |
| 5 to 9 Minutes | 6,344 (7.5%) | 7,531 (11.0%) |
| 10 to 14 Minutes | 13,060 (15.4%) | 13,553 (19.8%) |
| 15 to 19 Minutes | 27,215 (32.2%) | 20,688 (30.2%) |
| 20 to 24 Minutes | 14,212 (16.8%) | 11,564 (16.9%) |
| 25 to 29 Minutes | 4,684 (5.5%) | 3,366 (4.9%) |
| 30 to 34 Minutes | 9,012 (10.7%) | 5,578 (8.1%) |
| 35 to 39 Minutes | 950 (1.1%) | 470 (0.7%) |
| 40 to 44 Minutes | 1,233 (1.5%) | 835 (1.2%) |
| 45 to 59 Minutes | 2,789 (3.3%) | 1,849 (2.7%) |
| 60 to 89 Minutes | 1,890 (2.2%) | 579 (0.9%) |
| 90 or more Minutes | 1,648 (1.9%) | 723 (1.1%) |
Time of Departure to Work by Sex in Nueces County
The most frequent times of departure to work in Nueces County are 7:00 AM to 7:29 AM (13,095, 15.5%) for males and 7:30 AM to 7:59 AM (13,535, 19.8%) for females.
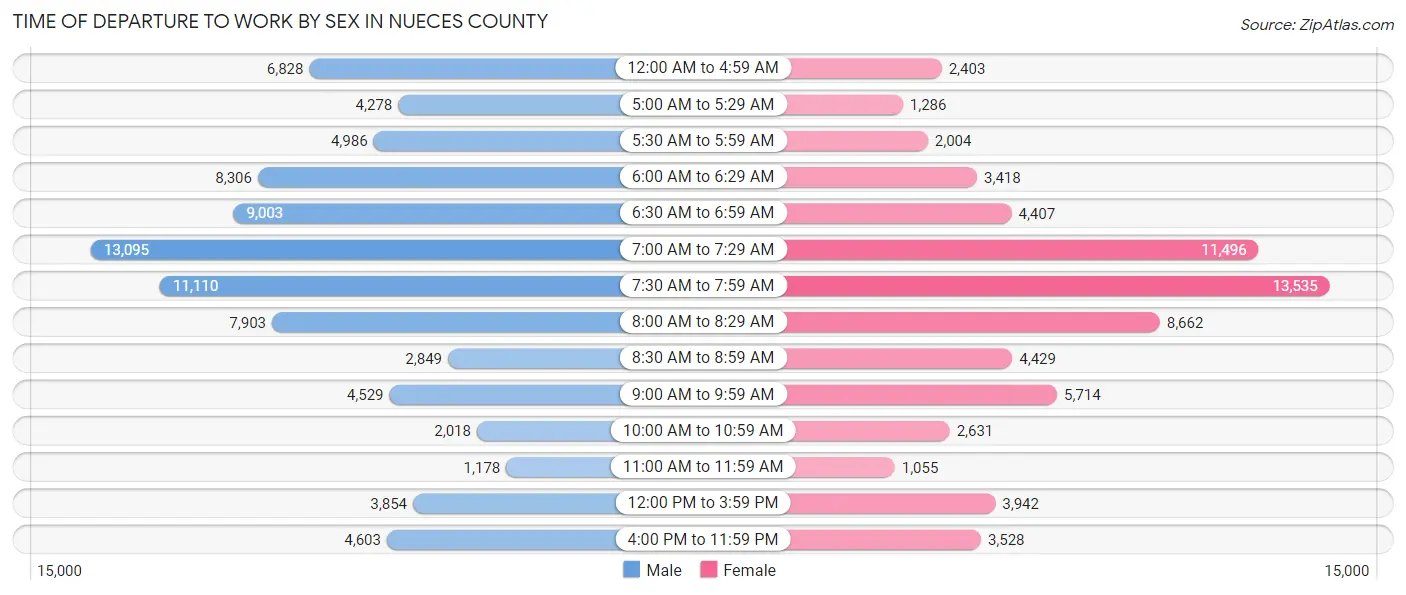
| Time of Departure | Male | Female |
| 12:00 AM to 4:59 AM | 6,828 (8.1%) | 2,403 (3.5%) |
| 5:00 AM to 5:29 AM | 4,278 (5.1%) | 1,286 (1.9%) |
| 5:30 AM to 5:59 AM | 4,986 (5.9%) | 2,004 (2.9%) |
| 6:00 AM to 6:29 AM | 8,306 (9.8%) | 3,418 (5.0%) |
| 6:30 AM to 6:59 AM | 9,003 (10.6%) | 4,407 (6.4%) |
| 7:00 AM to 7:29 AM | 13,095 (15.5%) | 11,496 (16.8%) |
| 7:30 AM to 7:59 AM | 11,110 (13.1%) | 13,535 (19.8%) |
| 8:00 AM to 8:29 AM | 7,903 (9.3%) | 8,662 (12.6%) |
| 8:30 AM to 8:59 AM | 2,849 (3.4%) | 4,429 (6.5%) |
| 9:00 AM to 9:59 AM | 4,529 (5.4%) | 5,714 (8.3%) |
| 10:00 AM to 10:59 AM | 2,018 (2.4%) | 2,631 (3.8%) |
| 11:00 AM to 11:59 AM | 1,178 (1.4%) | 1,055 (1.5%) |
| 12:00 PM to 3:59 PM | 3,854 (4.6%) | 3,942 (5.8%) |
| 4:00 PM to 11:59 PM | 4,603 (5.4%) | 3,528 (5.1%) |
| Total | 84,540 (100.0%) | 68,510 (100.0%) |
Housing Occupancy in Nueces County
Occupancy by Ownership in Nueces County
Of the total 130,122 dwellings in Nueces County, owner-occupied units account for 77,275 (59.4%), while renter-occupied units make up 52,847 (40.6%).
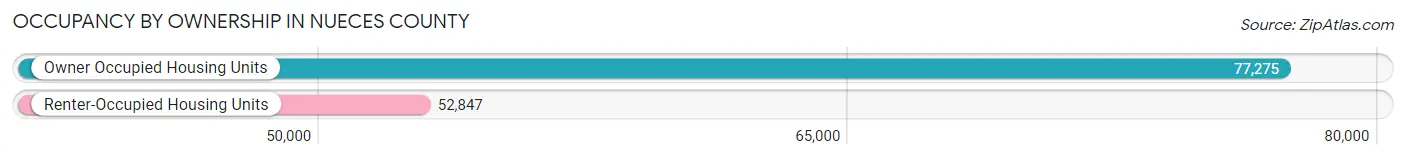
| Occupancy | # Housing Units | % Housing Units |
| Owner Occupied Housing Units | 77,275 | 59.4% |
| Renter-Occupied Housing Units | 52,847 | 40.6% |
| Total Occupied Housing Units | 130,122 | 100.0% |
Occupancy by Household Size in Nueces County
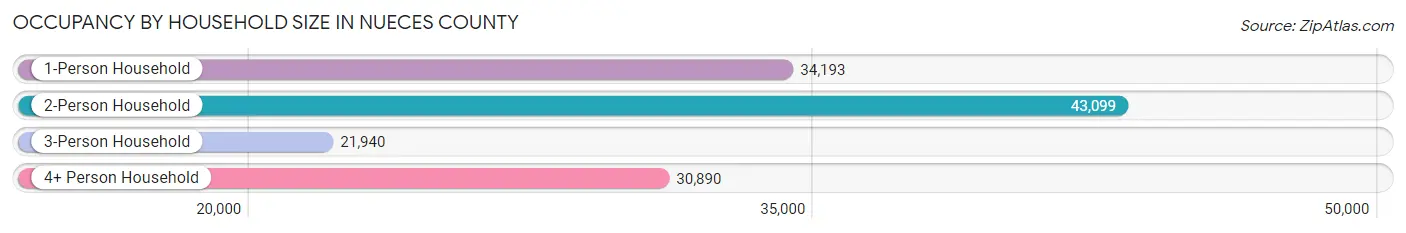
| Household Size | # Housing Units | % Housing Units |
| 1-Person Household | 34,193 | 26.3% |
| 2-Person Household | 43,099 | 33.1% |
| 3-Person Household | 21,940 | 16.9% |
| 4+ Person Household | 30,890 | 23.7% |
| Total Housing Units | 130,122 | 100.0% |
Occupancy by Ownership by Household Size in Nueces County
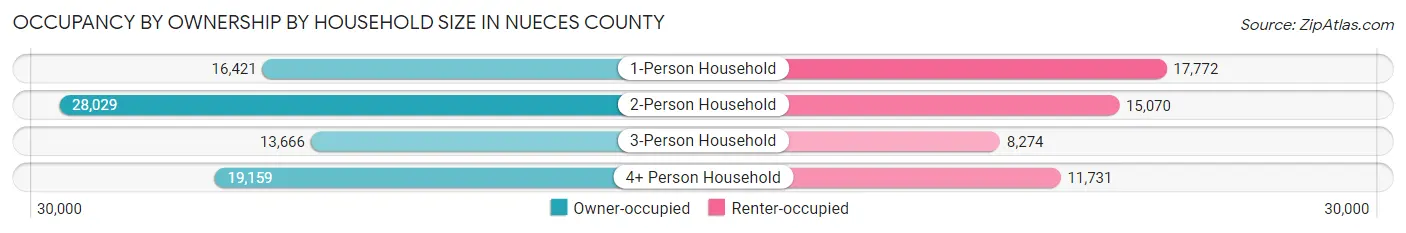
| Household Size | Owner-occupied | Renter-occupied |
| 1-Person Household | 16,421 (48.0%) | 17,772 (52.0%) |
| 2-Person Household | 28,029 (65.0%) | 15,070 (35.0%) |
| 3-Person Household | 13,666 (62.3%) | 8,274 (37.7%) |
| 4+ Person Household | 19,159 (62.0%) | 11,731 (38.0%) |
| Total Housing Units | 77,275 (59.4%) | 52,847 (40.6%) |
Occupancy by Educational Attainment in Nueces County
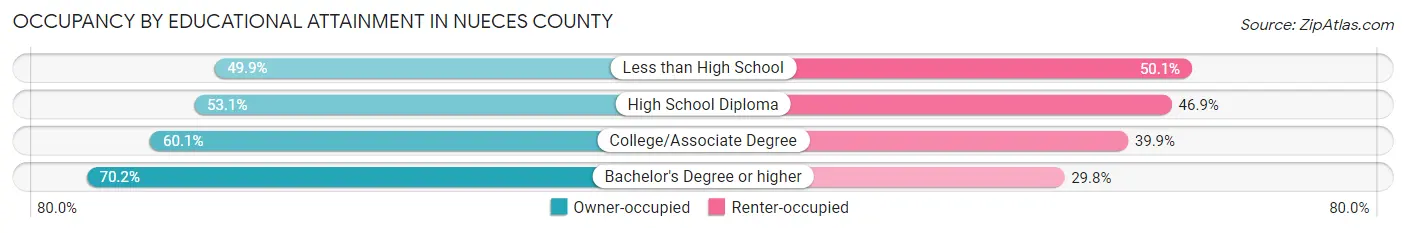
| Household Size | Owner-occupied | Renter-occupied |
| Less than High School | 9,163 (49.9%) | 9,194 (50.1%) |
| High School Diploma | 17,275 (53.1%) | 15,242 (46.9%) |
| College/Associate Degree | 28,401 (60.1%) | 18,871 (39.9%) |
| Bachelor's Degree or higher | 22,436 (70.2%) | 9,540 (29.8%) |
Occupancy by Age of Householder in Nueces County
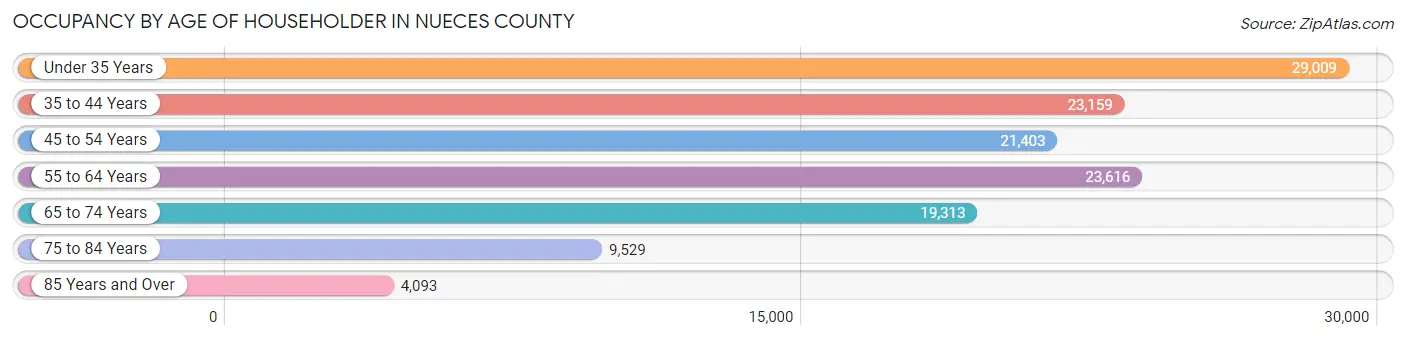
| Age Bracket | # Households | % Households |
| Under 35 Years | 29,009 | 22.3% |
| 35 to 44 Years | 23,159 | 17.8% |
| 45 to 54 Years | 21,403 | 16.5% |
| 55 to 64 Years | 23,616 | 18.1% |
| 65 to 74 Years | 19,313 | 14.8% |
| 75 to 84 Years | 9,529 | 7.3% |
| 85 Years and Over | 4,093 | 3.2% |
| Total | 130,122 | 100.0% |
Housing Finances in Nueces County
Median Income by Occupancy in Nueces County
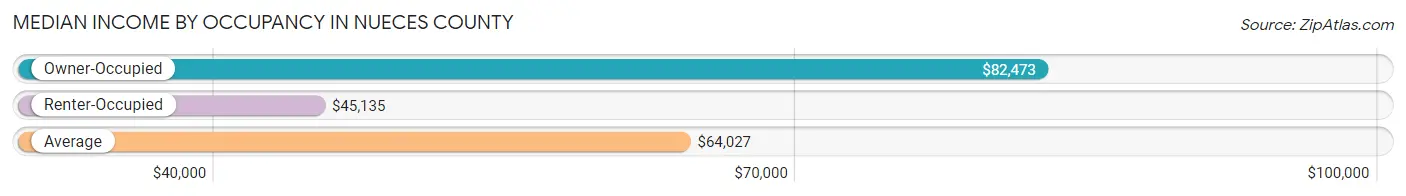
| Occupancy Type | # Households | Median Income |
| Owner-Occupied | 77,275 (59.4%) | $82,473 |
| Renter-Occupied | 52,847 (40.6%) | $45,135 |
| Average | 130,122 (100.0%) | $64,027 |
Occupancy by Householder Income Bracket in Nueces County
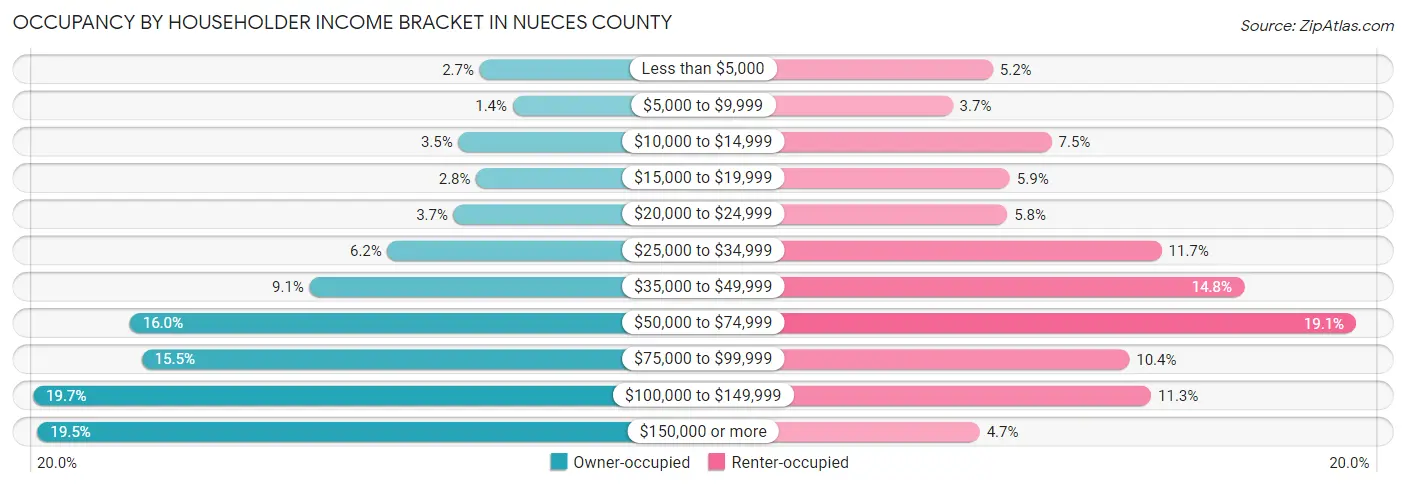
| Income Bracket | Owner-occupied | Renter-occupied |
| Less than $5,000 | 2,053 (2.7%) | 2,763 (5.2%) |
| $5,000 to $9,999 | 1,083 (1.4%) | 1,955 (3.7%) |
| $10,000 to $14,999 | 2,683 (3.5%) | 3,948 (7.5%) |
| $15,000 to $19,999 | 2,154 (2.8%) | 3,108 (5.9%) |
| $20,000 to $24,999 | 2,819 (3.6%) | 3,057 (5.8%) |
| $25,000 to $34,999 | 4,768 (6.2%) | 6,161 (11.7%) |
| $35,000 to $49,999 | 7,064 (9.1%) | 7,816 (14.8%) |
| $50,000 to $74,999 | 12,357 (16.0%) | 10,074 (19.1%) |
| $75,000 to $99,999 | 12,008 (15.5%) | 5,510 (10.4%) |
| $100,000 to $149,999 | 15,206 (19.7%) | 5,953 (11.3%) |
| $150,000 or more | 15,080 (19.5%) | 2,502 (4.7%) |
| Total | 77,275 (100.0%) | 52,847 (100.0%) |
Monthly Housing Cost Tiers in Nueces County
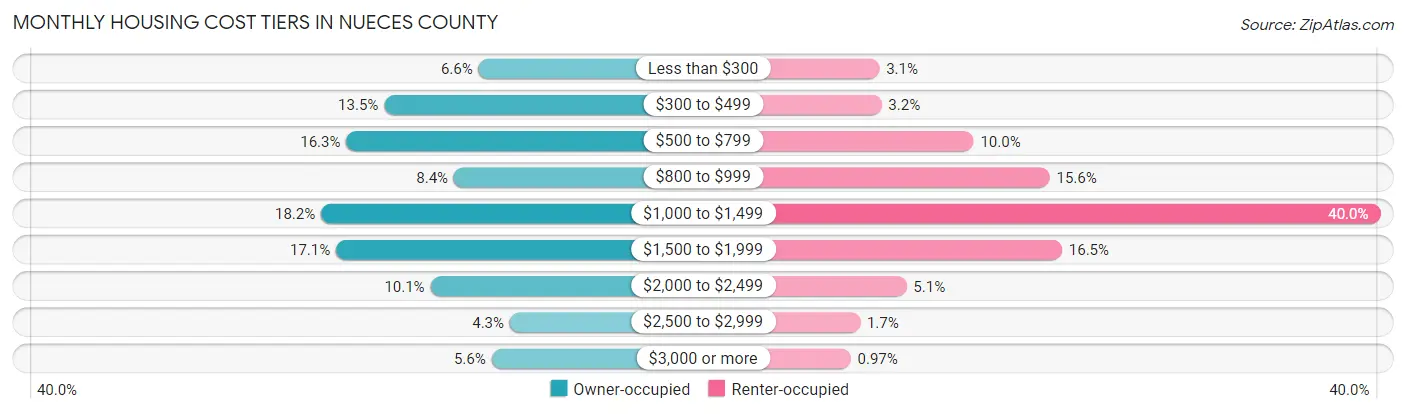
| Monthly Cost | Owner-occupied | Renter-occupied |
| Less than $300 | 5,080 (6.6%) | 1,628 (3.1%) |
| $300 to $499 | 10,451 (13.5%) | 1,712 (3.2%) |
| $500 to $799 | 12,603 (16.3%) | 5,293 (10.0%) |
| $800 to $999 | 6,479 (8.4%) | 8,253 (15.6%) |
| $1,000 to $1,499 | 14,043 (18.2%) | 21,130 (40.0%) |
| $1,500 to $1,999 | 13,183 (17.1%) | 8,737 (16.5%) |
| $2,000 to $2,499 | 7,813 (10.1%) | 2,686 (5.1%) |
| $2,500 to $2,999 | 3,289 (4.3%) | 877 (1.7%) |
| $3,000 or more | 4,334 (5.6%) | 511 (1.0%) |
| Total | 77,275 (100.0%) | 52,847 (100.0%) |
Physical Housing Characteristics in Nueces County
Housing Structures in Nueces County
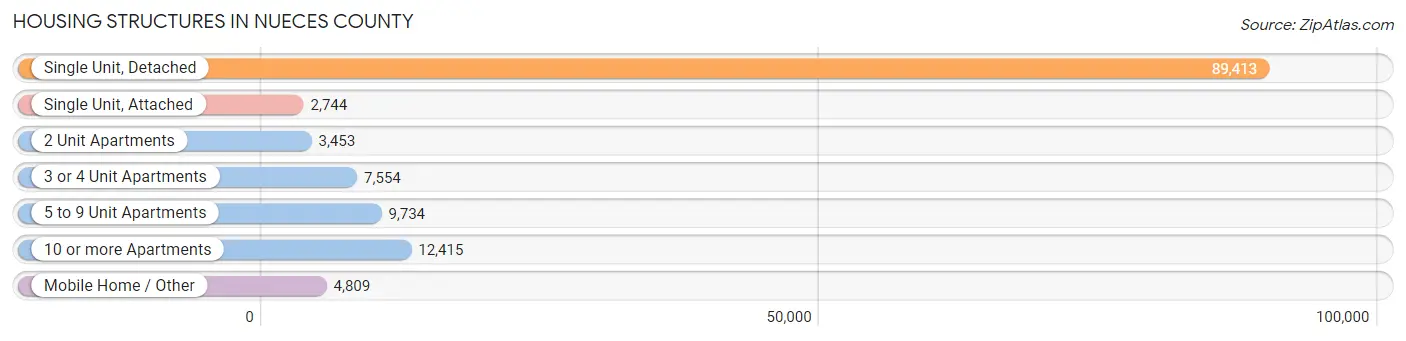
| Structure Type | # Housing Units | % Housing Units |
| Single Unit, Detached | 89,413 | 68.7% |
| Single Unit, Attached | 2,744 | 2.1% |
| 2 Unit Apartments | 3,453 | 2.6% |
| 3 or 4 Unit Apartments | 7,554 | 5.8% |
| 5 to 9 Unit Apartments | 9,734 | 7.5% |
| 10 or more Apartments | 12,415 | 9.5% |
| Mobile Home / Other | 4,809 | 3.7% |
| Total | 130,122 | 100.0% |
Housing Structures by Occupancy in Nueces County
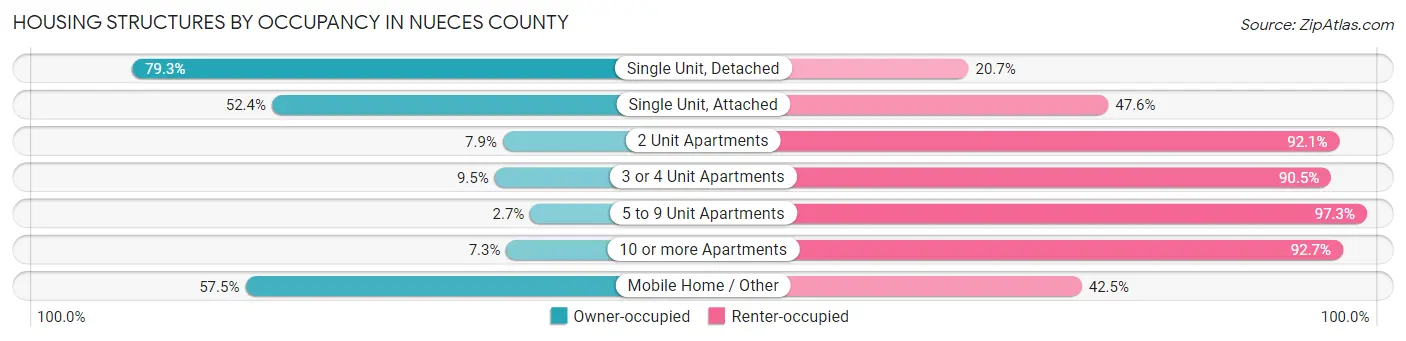
| Structure Type | Owner-occupied | Renter-occupied |
| Single Unit, Detached | 70,918 (79.3%) | 18,495 (20.7%) |
| Single Unit, Attached | 1,438 (52.4%) | 1,306 (47.6%) |
| 2 Unit Apartments | 274 (7.9%) | 3,179 (92.1%) |
| 3 or 4 Unit Apartments | 719 (9.5%) | 6,835 (90.5%) |
| 5 to 9 Unit Apartments | 259 (2.7%) | 9,475 (97.3%) |
| 10 or more Apartments | 901 (7.3%) | 11,514 (92.7%) |
| Mobile Home / Other | 2,766 (57.5%) | 2,043 (42.5%) |
| Total | 77,275 (59.4%) | 52,847 (40.6%) |
Housing Structures by Number of Rooms in Nueces County
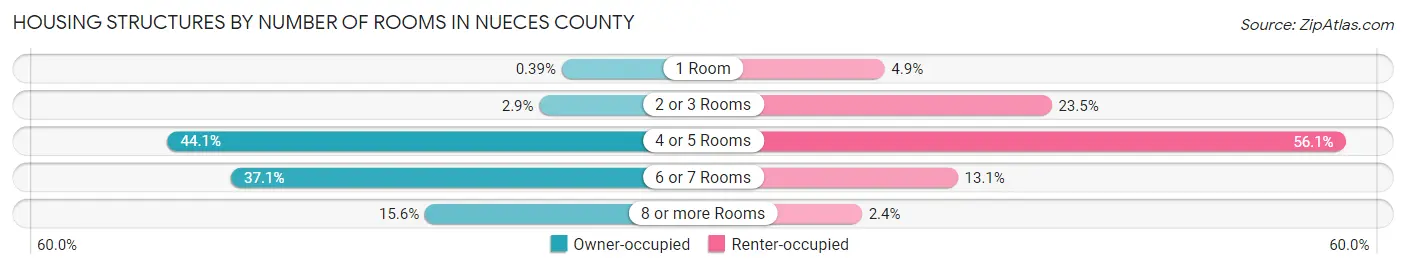
| Number of Rooms | Owner-occupied | Renter-occupied |
| 1 Room | 305 (0.4%) | 2,609 (4.9%) |
| 2 or 3 Rooms | 2,215 (2.9%) | 12,408 (23.5%) |
| 4 or 5 Rooms | 34,091 (44.1%) | 29,646 (56.1%) |
| 6 or 7 Rooms | 28,643 (37.1%) | 6,904 (13.1%) |
| 8 or more Rooms | 12,021 (15.6%) | 1,280 (2.4%) |
| Total | 77,275 (100.0%) | 52,847 (100.0%) |
Housing Structure by Heating Type in Nueces County
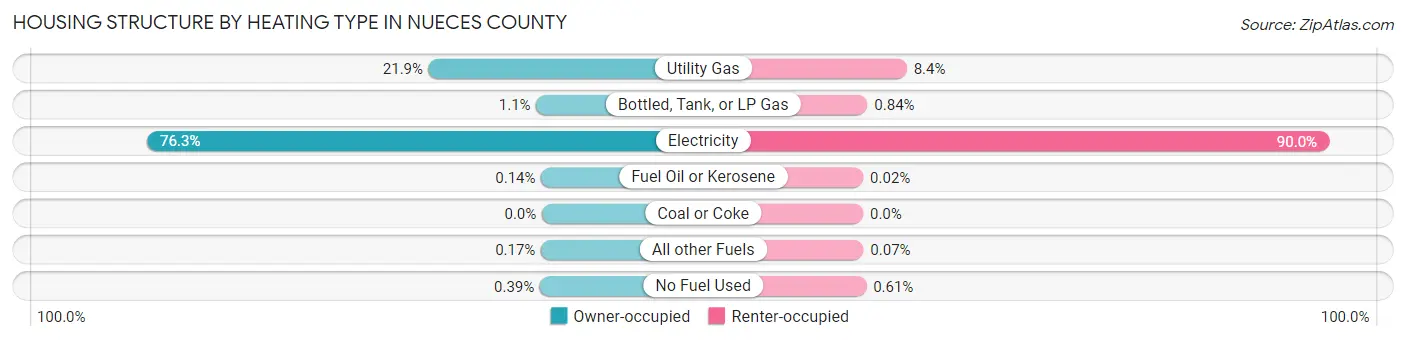
| Heating Type | Owner-occupied | Renter-occupied |
| Utility Gas | 16,906 (21.9%) | 4,459 (8.4%) |
| Bottled, Tank, or LP Gas | 848 (1.1%) | 443 (0.8%) |
| Electricity | 58,982 (76.3%) | 47,569 (90.0%) |
| Fuel Oil or Kerosene | 107 (0.1%) | 13 (0.0%) |
| Coal or Coke | 0 (0.0%) | 0 (0.0%) |
| All other Fuels | 128 (0.2%) | 39 (0.1%) |
| No Fuel Used | 304 (0.4%) | 324 (0.6%) |
| Total | 77,275 (100.0%) | 52,847 (100.0%) |
Household Vehicle Usage in Nueces County
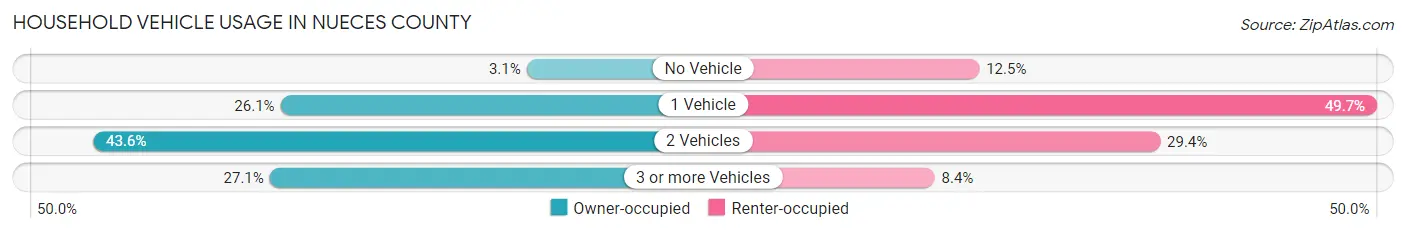
| Vehicles per Household | Owner-occupied | Renter-occupied |
| No Vehicle | 2,424 (3.1%) | 6,628 (12.5%) |
| 1 Vehicle | 20,183 (26.1%) | 26,246 (49.7%) |
| 2 Vehicles | 33,702 (43.6%) | 15,550 (29.4%) |
| 3 or more Vehicles | 20,966 (27.1%) | 4,423 (8.4%) |
| Total | 77,275 (100.0%) | 52,847 (100.0%) |
Real Estate & Mortgages in Nueces County
Real Estate and Mortgage Overview in Nueces County
| Characteristic | Without Mortgage | With Mortgage |
| Housing Units | 36,615 | 40,660 |
| Median Property Value | $140,400 | $206,500 |
| Median Household Income | $61,280 | $10,242 |
| Monthly Housing Costs | $572 | $4,275 |
| Real Estate Taxes | $2,025 | $2,929 |
Property Value by Mortgage Status in Nueces County
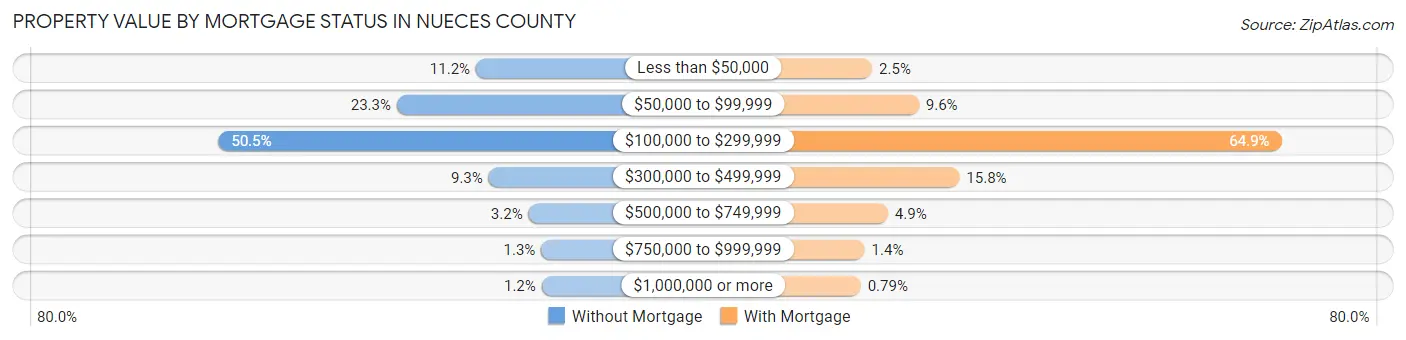
| Property Value | Without Mortgage | With Mortgage |
| Less than $50,000 | 4,111 (11.2%) | 1,028 (2.5%) |
| $50,000 to $99,999 | 8,524 (23.3%) | 3,919 (9.6%) |
| $100,000 to $299,999 | 18,483 (50.5%) | 26,383 (64.9%) |
| $300,000 to $499,999 | 3,402 (9.3%) | 6,437 (15.8%) |
| $500,000 to $749,999 | 1,180 (3.2%) | 2,004 (4.9%) |
| $750,000 to $999,999 | 467 (1.3%) | 567 (1.4%) |
| $1,000,000 or more | 448 (1.2%) | 322 (0.8%) |
| Total | 36,615 (100.0%) | 40,660 (100.0%) |
Household Income by Mortgage Status in Nueces County
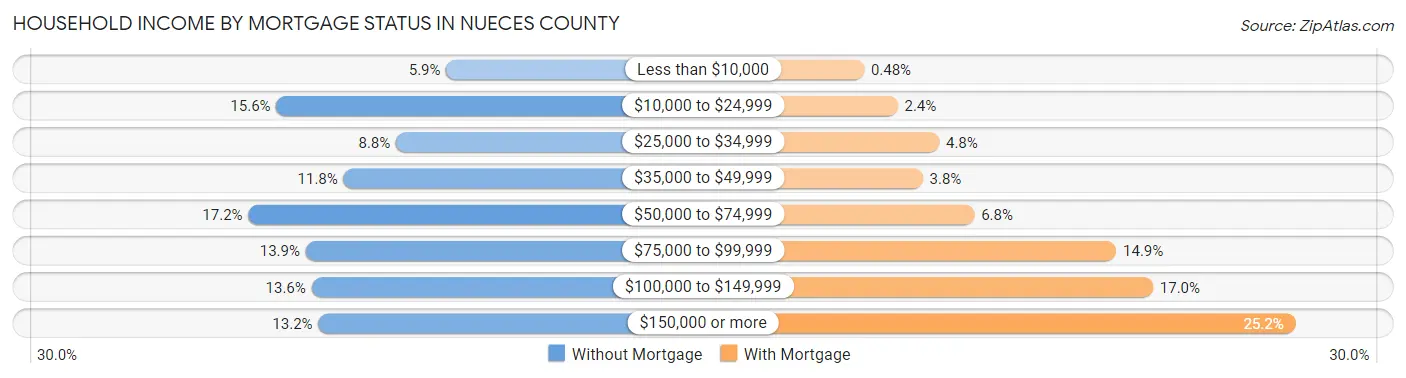
| Household Income | Without Mortgage | With Mortgage |
| Less than $10,000 | 2,159 (5.9%) | 196 (0.5%) |
| $10,000 to $24,999 | 5,716 (15.6%) | 977 (2.4%) |
| $25,000 to $34,999 | 3,211 (8.8%) | 1,940 (4.8%) |
| $35,000 to $49,999 | 4,309 (11.8%) | 1,557 (3.8%) |
| $50,000 to $74,999 | 6,302 (17.2%) | 2,755 (6.8%) |
| $75,000 to $99,999 | 5,100 (13.9%) | 6,055 (14.9%) |
| $100,000 to $149,999 | 4,980 (13.6%) | 6,908 (17.0%) |
| $150,000 or more | 4,838 (13.2%) | 10,226 (25.2%) |
| Total | 36,615 (100.0%) | 40,660 (100.0%) |
Property Value to Household Income Ratio in Nueces County
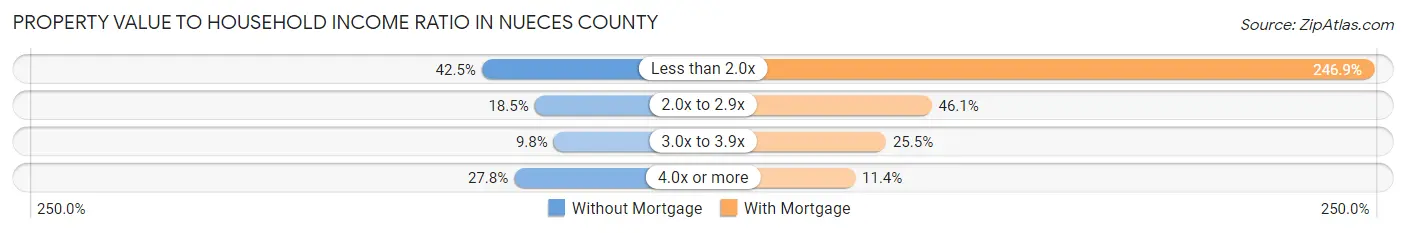
| Value-to-Income Ratio | Without Mortgage | With Mortgage |
| Less than 2.0x | 15,553 (42.5%) | 100,387 (246.9%) |
| 2.0x to 2.9x | 6,771 (18.5%) | 18,756 (46.1%) |
| 3.0x to 3.9x | 3,600 (9.8%) | 10,347 (25.5%) |
| 4.0x or more | 10,166 (27.8%) | 4,651 (11.4%) |
| Total | 36,615 (100.0%) | 40,660 (100.0%) |
Real Estate Taxes by Mortgage Status in Nueces County
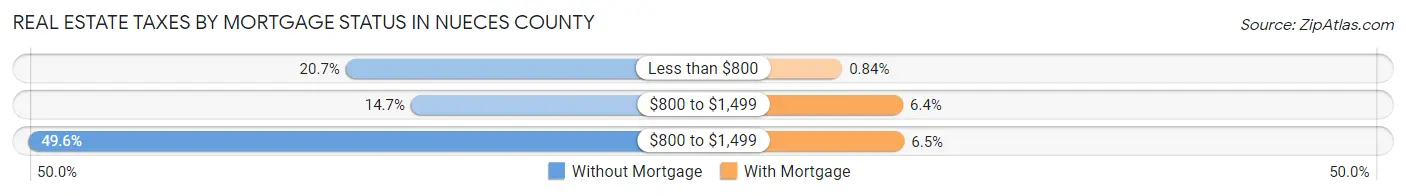
| Property Taxes | Without Mortgage | With Mortgage |
| Less than $800 | 7,571 (20.7%) | 343 (0.8%) |
| $800 to $1,499 | 5,394 (14.7%) | 2,604 (6.4%) |
| $800 to $1,499 | 18,175 (49.6%) | 2,646 (6.5%) |
| Total | 36,615 (100.0%) | 40,660 (100.0%) |
Health & Disability in Nueces County
Health Insurance Coverage by Age in Nueces County
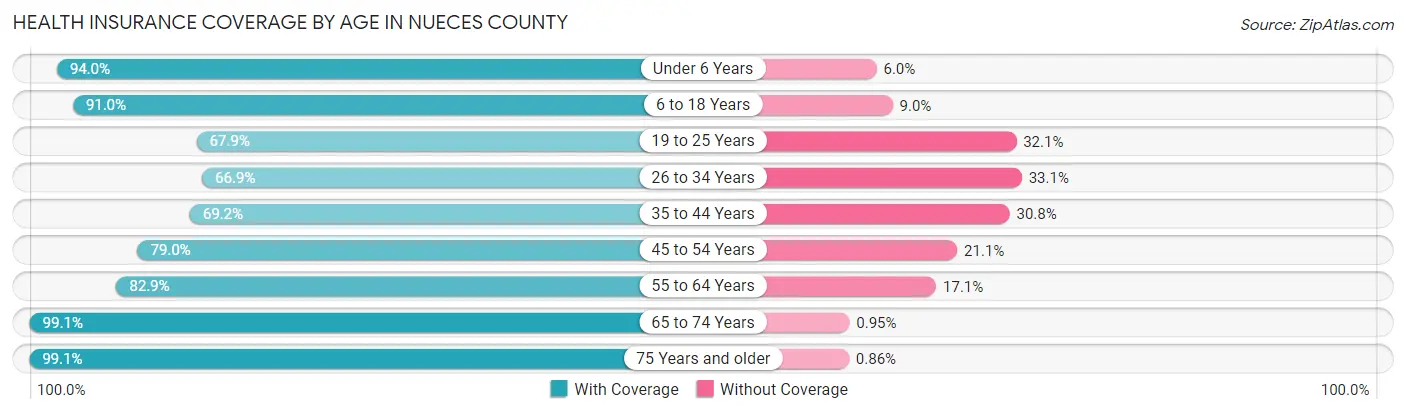
| Age Bracket | With Coverage | Without Coverage |
| Under 6 Years | 25,949 (94.0%) | 1,659 (6.0%) |
| 6 to 18 Years | 57,097 (91.0%) | 5,657 (9.0%) |
| 19 to 25 Years | 23,645 (67.9%) | 11,158 (32.1%) |
| 26 to 34 Years | 28,840 (66.9%) | 14,261 (33.1%) |
| 35 to 44 Years | 31,683 (69.2%) | 14,112 (30.8%) |
| 45 to 54 Years | 31,920 (78.9%) | 8,509 (21.0%) |
| 55 to 64 Years | 34,131 (82.9%) | 7,049 (17.1%) |
| 65 to 74 Years | 30,893 (99.1%) | 295 (0.9%) |
| 75 Years and older | 20,346 (99.1%) | 177 (0.9%) |
| Total | 284,504 (81.9%) | 62,877 (18.1%) |
Health Insurance Coverage by Citizenship Status in Nueces County
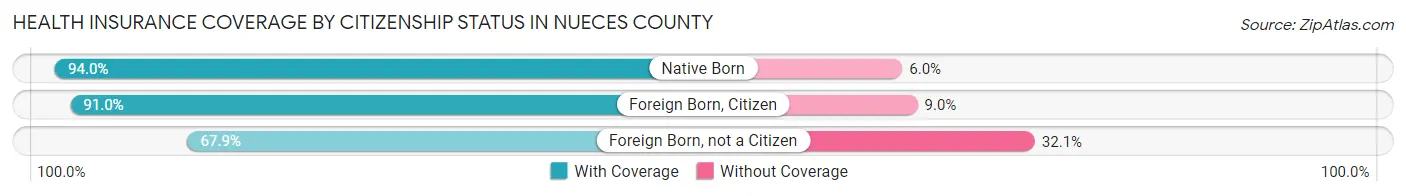
| Citizenship Status | With Coverage | Without Coverage |
| Native Born | 25,949 (94.0%) | 1,659 (6.0%) |
| Foreign Born, Citizen | 57,097 (91.0%) | 5,657 (9.0%) |
| Foreign Born, not a Citizen | 23,645 (67.9%) | 11,158 (32.1%) |
Health Insurance Coverage by Household Income in Nueces County
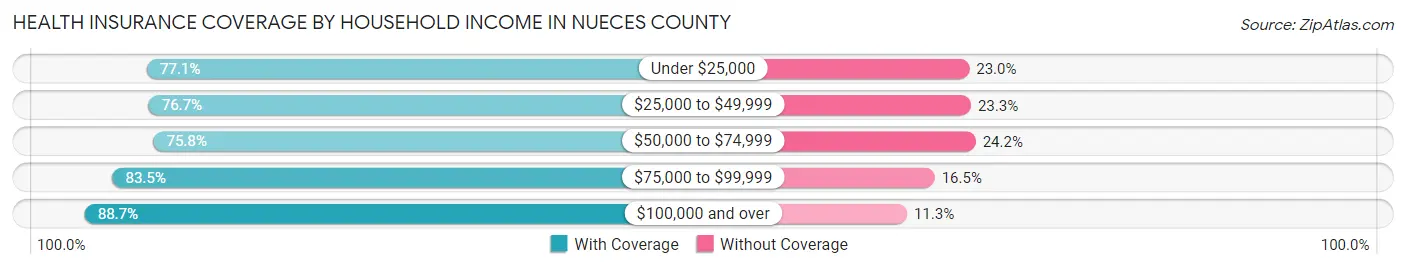
| Household Income | With Coverage | Without Coverage |
| Under $25,000 | 38,962 (77.0%) | 11,602 (23.0%) |
| $25,000 to $49,999 | 46,463 (76.7%) | 14,088 (23.3%) |
| $50,000 to $74,999 | 43,206 (75.8%) | 13,761 (24.2%) |
| $75,000 to $99,999 | 42,462 (83.5%) | 8,381 (16.5%) |
| $100,000 and over | 109,744 (88.7%) | 13,948 (11.3%) |
Public vs Private Health Insurance Coverage by Age in Nueces County
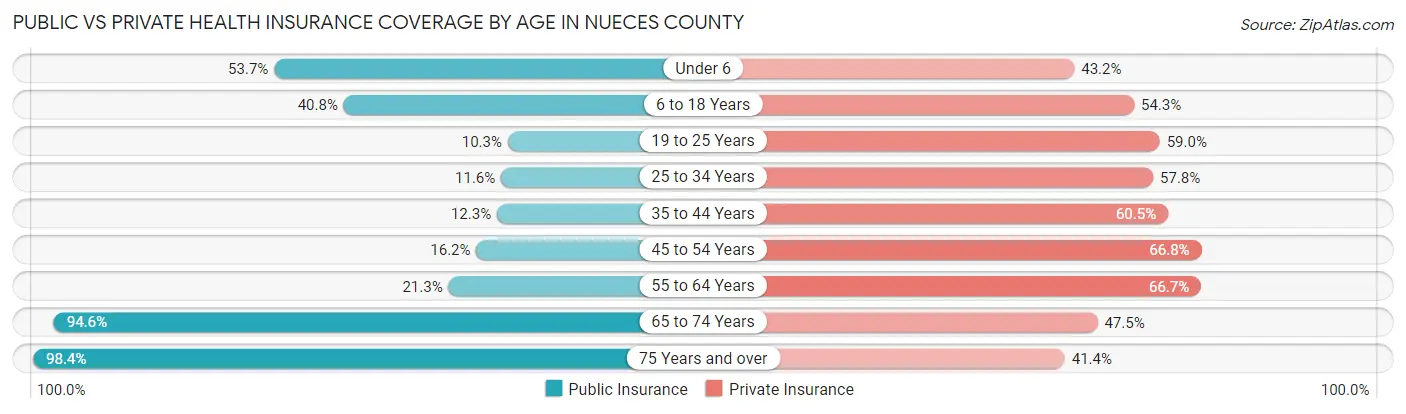
| Age Bracket | Public Insurance | Private Insurance |
| Under 6 | 14,819 (53.7%) | 11,916 (43.2%) |
| 6 to 18 Years | 25,578 (40.8%) | 34,046 (54.2%) |
| 19 to 25 Years | 3,588 (10.3%) | 20,536 (59.0%) |
| 25 to 34 Years | 4,977 (11.6%) | 24,905 (57.8%) |
| 35 to 44 Years | 5,644 (12.3%) | 27,723 (60.5%) |
| 45 to 54 Years | 6,528 (16.2%) | 26,987 (66.7%) |
| 55 to 64 Years | 8,778 (21.3%) | 27,458 (66.7%) |
| 65 to 74 Years | 29,498 (94.6%) | 14,801 (47.5%) |
| 75 Years and over | 20,197 (98.4%) | 8,497 (41.4%) |
| Total | 119,607 (34.4%) | 196,869 (56.7%) |
Disability Status by Sex by Age in Nueces County
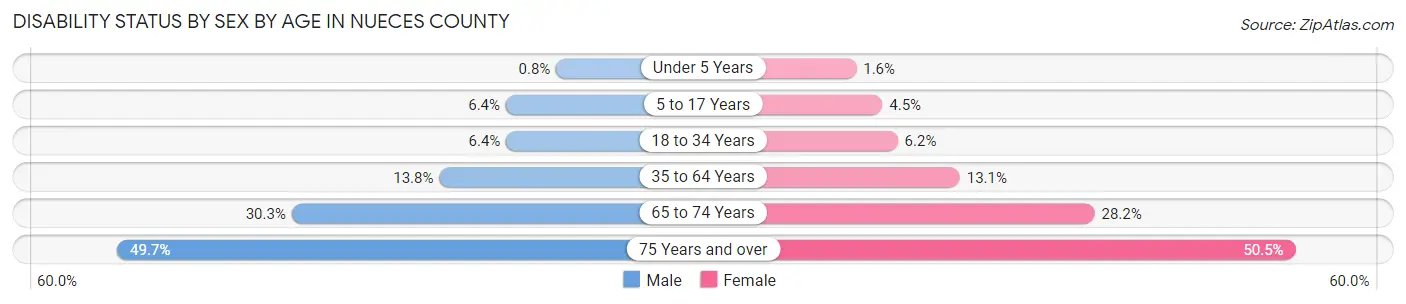
| Age Bracket | Male | Female |
| Under 5 Years | 92 (0.8%) | 172 (1.6%) |
| 5 to 17 Years | 2,074 (6.4%) | 1,383 (4.5%) |
| 18 to 34 Years | 2,668 (6.4%) | 2,564 (6.2%) |
| 35 to 64 Years | 8,695 (13.8%) | 8,475 (13.1%) |
| 65 to 74 Years | 4,476 (30.2%) | 4,613 (28.1%) |
| 75 Years and over | 4,137 (49.7%) | 6,162 (50.5%) |
Disability Class by Sex by Age in Nueces County
Disability Class: Hearing Difficulty
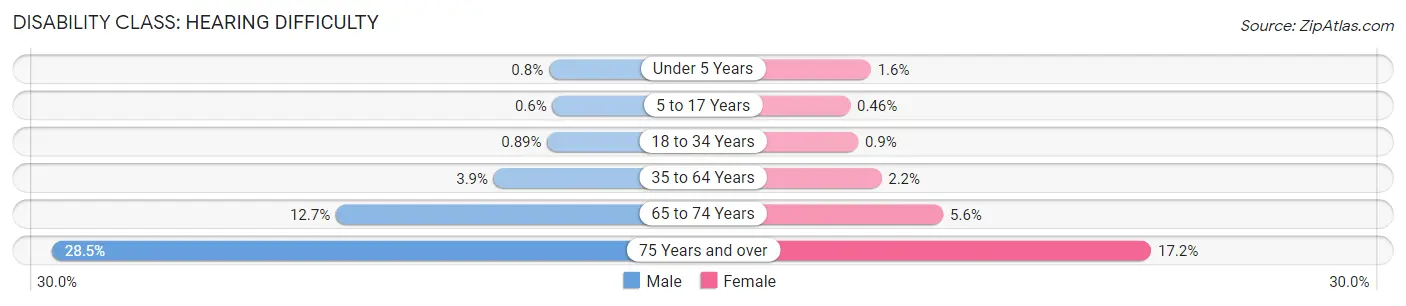
| Age Bracket | Male | Female |
| Under 5 Years | 92 (0.8%) | 172 (1.6%) |
| 5 to 17 Years | 195 (0.6%) | 140 (0.5%) |
| 18 to 34 Years | 373 (0.9%) | 370 (0.9%) |
| 35 to 64 Years | 2,435 (3.9%) | 1,417 (2.2%) |
| 65 to 74 Years | 1,873 (12.7%) | 924 (5.6%) |
| 75 Years and over | 2,371 (28.5%) | 2,100 (17.2%) |
Disability Class: Vision Difficulty
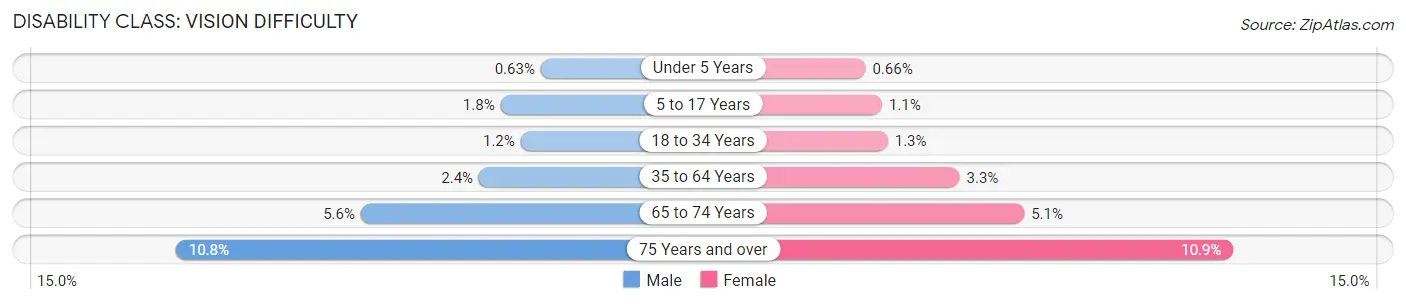
| Age Bracket | Male | Female |
| Under 5 Years | 72 (0.6%) | 71 (0.7%) |
| 5 to 17 Years | 567 (1.8%) | 344 (1.1%) |
| 18 to 34 Years | 498 (1.2%) | 528 (1.3%) |
| 35 to 64 Years | 1,481 (2.4%) | 2,114 (3.3%) |
| 65 to 74 Years | 835 (5.6%) | 832 (5.1%) |
| 75 Years and over | 898 (10.8%) | 1,330 (10.9%) |
Disability Class: Cognitive Difficulty
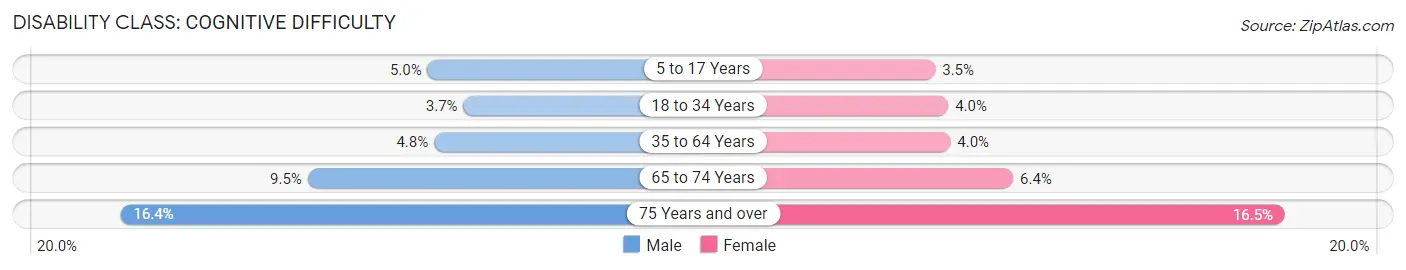
| Age Bracket | Male | Female |
| 5 to 17 Years | 1,634 (5.0%) | 1,061 (3.5%) |
| 18 to 34 Years | 1,554 (3.7%) | 1,630 (4.0%) |
| 35 to 64 Years | 3,019 (4.8%) | 2,601 (4.0%) |
| 65 to 74 Years | 1,405 (9.5%) | 1,043 (6.4%) |
| 75 Years and over | 1,369 (16.4%) | 2,007 (16.5%) |
Disability Class: Ambulatory Difficulty
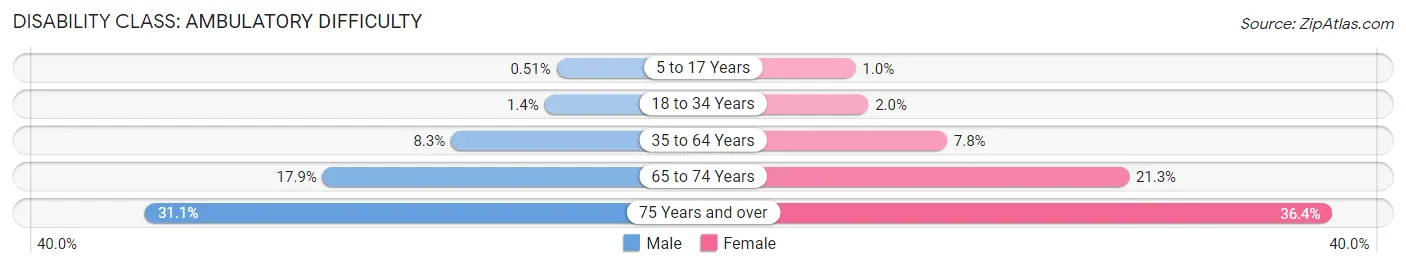
| Age Bracket | Male | Female |
| 5 to 17 Years | 165 (0.5%) | 310 (1.0%) |
| 18 to 34 Years | 584 (1.4%) | 807 (2.0%) |
| 35 to 64 Years | 5,247 (8.3%) | 5,034 (7.8%) |
| 65 to 74 Years | 2,645 (17.9%) | 3,495 (21.3%) |
| 75 Years and over | 2,586 (31.1%) | 4,443 (36.4%) |
Disability Class: Self-Care Difficulty
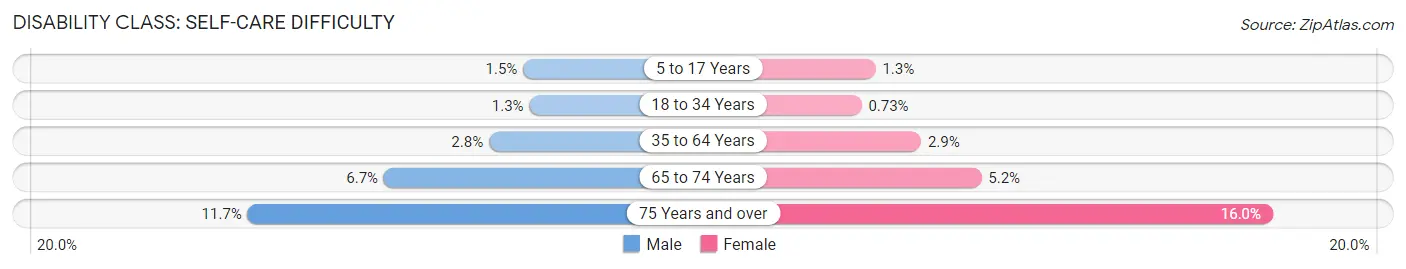
| Age Bracket | Male | Female |
| 5 to 17 Years | 483 (1.5%) | 382 (1.3%) |
| 18 to 34 Years | 529 (1.3%) | 300 (0.7%) |
| 35 to 64 Years | 1,739 (2.8%) | 1,895 (2.9%) |
| 65 to 74 Years | 985 (6.7%) | 849 (5.2%) |
| 75 Years and over | 976 (11.7%) | 1,952 (16.0%) |
Technology Access in Nueces County
Computing Device Access in Nueces County
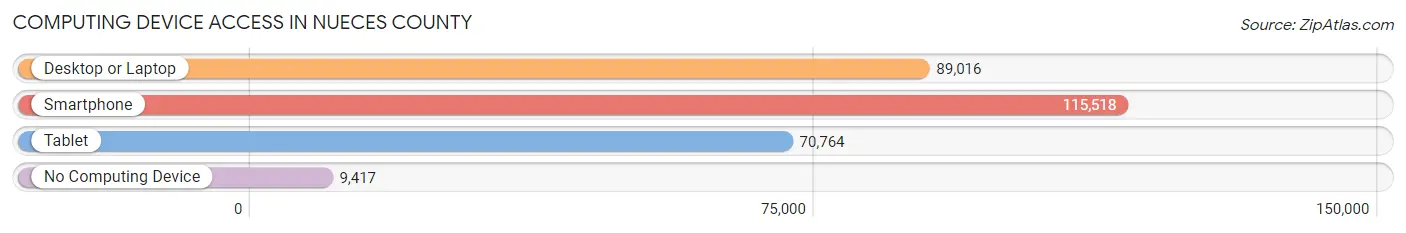
| Device Type | # Households | % Households |
| Desktop or Laptop | 89,016 | 68.4% |
| Smartphone | 115,518 | 88.8% |
| Tablet | 70,764 | 54.4% |
| No Computing Device | 9,417 | 7.2% |
| Total | 130,122 | 100.0% |
Internet Access in Nueces County
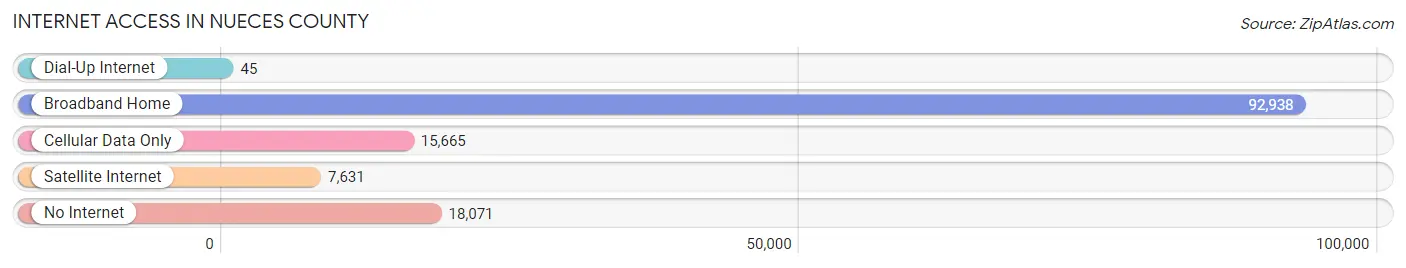
| Internet Type | # Households | % Households |
| Dial-Up Internet | 45 | 0.0% |
| Broadband Home | 92,938 | 71.4% |
| Cellular Data Only | 15,665 | 12.0% |
| Satellite Internet | 7,631 | 5.9% |
| No Internet | 18,071 | 13.9% |
| Total | 130,122 | 100.0% |
Nueces County Summary
Nueces County is located in the south-central region of Texas, along the Gulf of Mexico. It is bordered by San Patricio County to the north, Kleberg County to the west, and Aransas and Refugio counties to the east. The county seat is Corpus Christi, the largest city in the county. Nueces County is home to a population of approximately 355,000 people, making it the 15th most populous county in Texas.
History
Nueces County was established in 1846, when Texas was still a part of Mexico. The county was named after the Nueces River, which runs through the county. The area was originally inhabited by the Karankawa and Coahuiltecan Native American tribes. The first European settlers arrived in the area in the late 1700s, and the county was officially organized in 1846.
In the early 1900s, the county experienced a period of rapid growth due to the discovery of oil in the area. This led to the development of the Port of Corpus Christi, which is now the fifth largest port in the United States. The county also experienced a population boom during this time, as many people moved to the area to take advantage of the economic opportunities.
Geography
Nueces County covers an area of 1,053 square miles, making it the 15th largest county in Texas. The county is located in the Coastal Plains region of Texas, and is characterized by flat terrain and sandy soils. The Nueces River runs through the county, and is a major source of water for the area. The county is also home to several lakes, including Lake Corpus Christi and Choke Canyon Reservoir.
The climate in Nueces County is generally warm and humid, with temperatures ranging from the mid-60s in the winter to the mid-90s in the summer. The county receives an average of 33 inches of rain per year, and is prone to hurricanes and tropical storms.
Economy
Nueces County has a diverse economy, with a variety of industries providing employment opportunities. The county is home to several large employers, including the Port of Corpus Christi, Valero Energy Corporation, and the Naval Air Station Corpus Christi. The county is also home to several universities and colleges, including Texas A&M University-Corpus Christi and Del Mar College.
The county’s economy is largely driven by the oil and gas industry, which accounts for a large portion of the county’s GDP. The county is also home to several manufacturing companies, including the Corpus Christi Army Depot and the Corpus Christi Ship Channel. Tourism is also an important part of the county’s economy, as the area is home to several popular attractions, including the USS Lexington Museum and the Texas State Aquarium.
Demographics
As of the 2010 census, Nueces County had a population of 355,000 people. The population is largely Hispanic, with approximately 70% of the population identifying as Hispanic or Latino. The county is also home to a large African American population, with approximately 15% of the population identifying as African American. The median household income in the county is $45,000, and the median home value is $130,000.
Nueces County is a diverse and vibrant community, with a rich history and a bright future. The county is home to a variety of industries, providing employment opportunities for its residents. The county is also home to several popular attractions, making it a popular destination for tourists. With its diverse population and strong economy, Nueces County is an important part of the state of Texas.
Common Questions
What is Per Capita Income in Nueces County?
Per Capita income in Nueces County is $32,284.
What is the Median Family Income in Nueces County?
Median Family Income in Nueces County is $77,667.
What is the Median Household income in Nueces County?
Median Household Income in Nueces County is $64,027.
What is Income or Wage Gap in Nueces County?
Income or Wage Gap in Nueces County is 32.6%.
Women in Nueces County earn 67.4 cents for every dollar earned by a man.
What is Family Income Deficit in Nueces County?
Family Income Deficit in Nueces County is $11,292.
Families that are below poverty line in Nueces County earn $11,292 less on average than the poverty threshold level.
What is Inequality or Gini Index in Nueces County?
Inequality or Gini Index in Nueces County is 0.46.
What is the Total Population of Nueces County?
Total Population of Nueces County is 353,245.
What is the Total Male Population of Nueces County?
Total Male Population of Nueces County is 176,105.
What is the Total Female Population of Nueces County?
Total Female Population of Nueces County is 177,140.
What is the Ratio of Males per 100 Females in Nueces County?
There are 99.42 Males per 100 Females in Nueces County.
What is the Ratio of Females per 100 Males in Nueces County?
There are 100.59 Females per 100 Males in Nueces County.
What is the Median Population Age in Nueces County?
Median Population Age in Nueces County is 36.2 Years.
What is the Average Family Size in Nueces County
Average Family Size in Nueces County is 3.2 People.
What is the Average Household Size in Nueces County
Average Household Size in Nueces County is 2.6 People.
How Large is the Labor Force in Nueces County?
There are 172,354 People in the Labor Forcein in Nueces County.
What is the Percentage of People in the Labor Force in Nueces County?
62.0% of People are in the Labor Force in Nueces County.
What is the Unemployment Rate in Nueces County?
Unemployment Rate in Nueces County is 5.7%.