Area Code 432 Map & Demographics
Area Code 432 Map
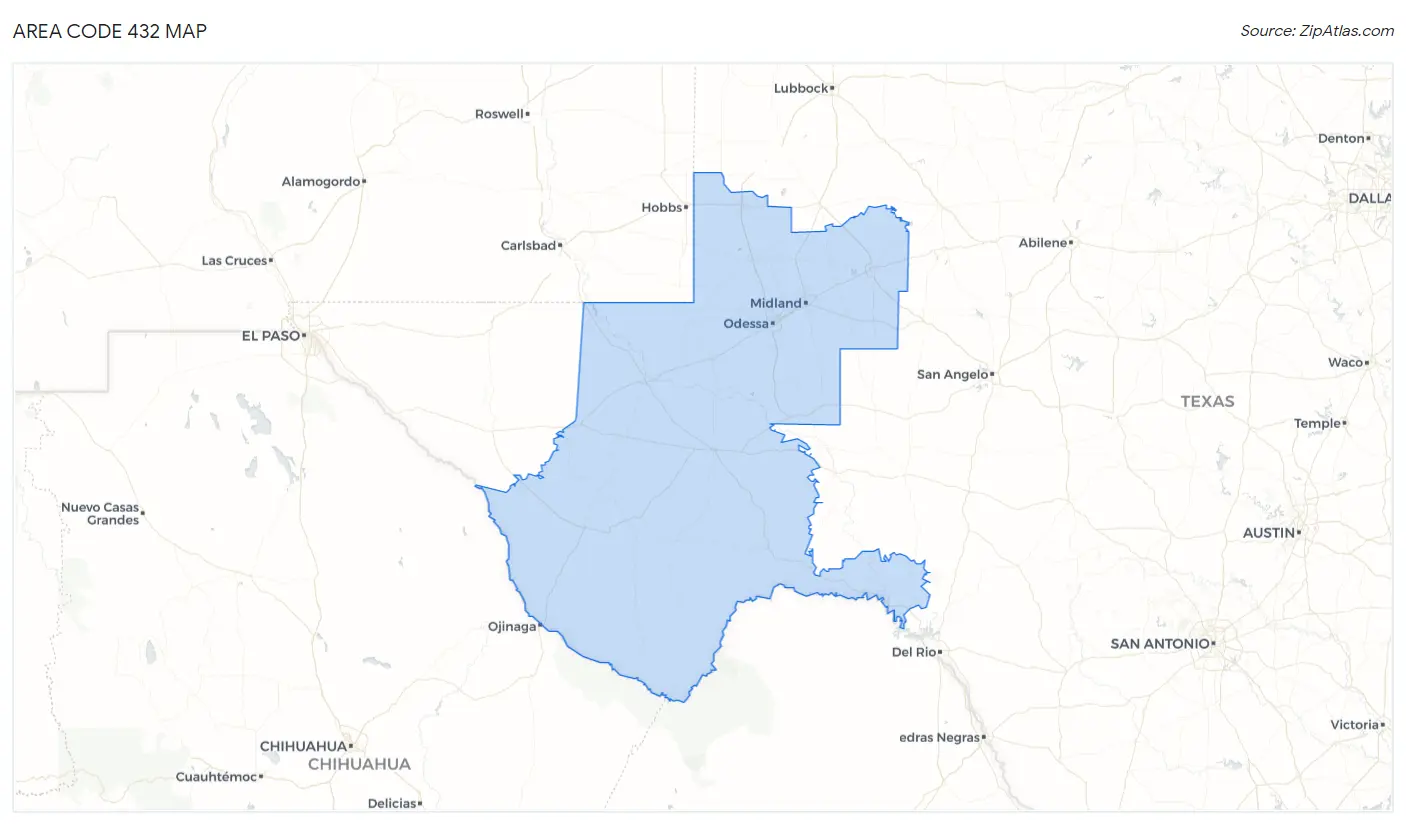
Area Code 432 Overview
$33,641
PER CAPITA INCOME
$85,623
AVG FAMILY INCOME
$72,982
AVG HOUSEHOLD INCOME
40.7%
WAGE / INCOME GAP [ % ]
59.3¢/ $1
WAGE / INCOME GAP [ $ ]
$10,917
FAMILY INCOME DEFICIT
25.17
INEQUALITY / GINI INDEX
542,614
TOTAL POPULATION
282,158
MALE POPULATION
260,456
FEMALE POPULATION
108.33
MALES / 100 FEMALES
92.31
FEMALES / 100 MALES
38.3
MEDIAN AGE
3.4
AVG FAMILY SIZE
2.7
AVG HOUSEHOLD SIZE
250,792
LABOR FORCE [ PEOPLE ]
62.0%
PERCENT IN LABOR FORCE
5.9%
UNEMPLOYMENT RATE
Income in Area Code 432
Income Overview in Area Code 432
Per Capita Income in Area Code 432 is $33,641, while median incomes of families and households are $85,623 and $72,982 respectively.
| Characteristic | Number | Measure |
| Per Capita Income | 542,614 | $33,641 |
| Median Family Income | 137,324 | $85,623 |
| Mean Family Income | 137,324 | $6,012,014 |
| Median Household Income | 201,162 | $72,982 |
| Mean Household Income | 201,162 | $5,472,027 |
| Income Deficit | 137,324 | $10,917 |
| Wage / Income Gap (%) | 542,614 | 40.69% |
| Wage / Income Gap ($) | 542,614 | 59.31¢ per $1 |
| Gini / Inequality Index | 542,614 | 25.17 |
Earnings by Sex in Area Code 432
Average Earnings in Area Code 432 are $45,009, $57,361 for men and $33,530 for women, a difference of 41.5%.
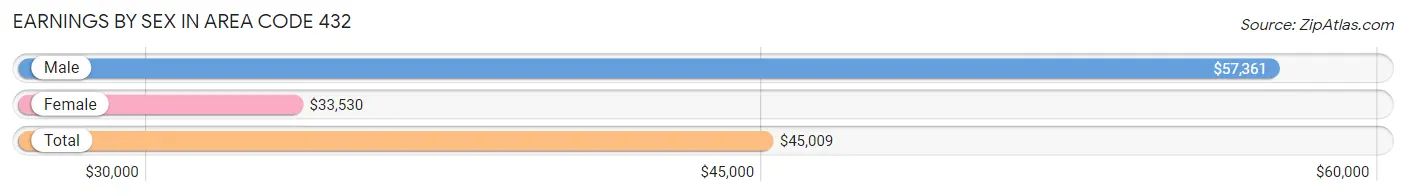
| Sex | Number | Average Earnings |
| Male | 163,103 (58.6%) | $57,361 |
| Female | 115,263 (41.4%) | $33,530 |
| Total | 278,366 (100.0%) | $45,009 |
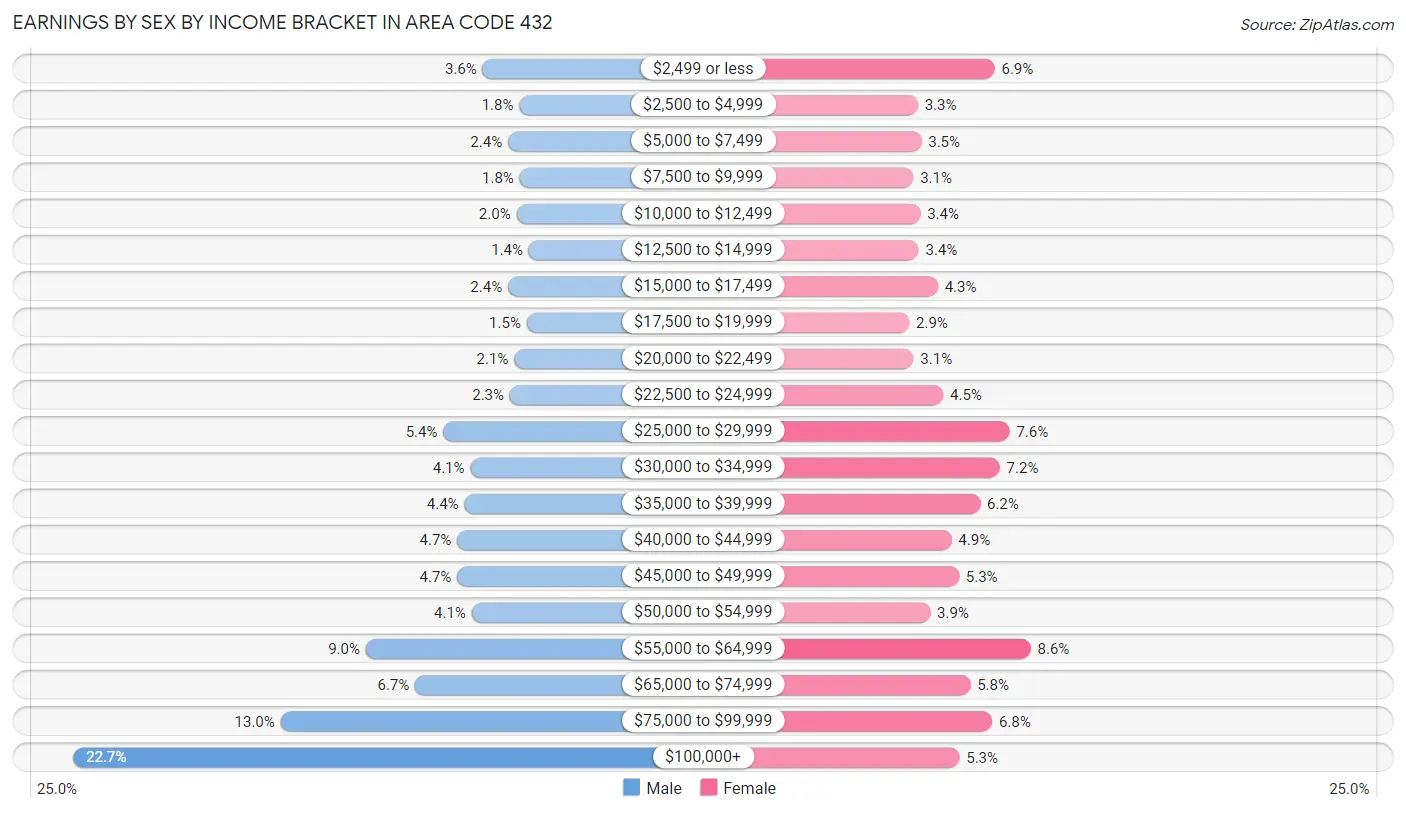
Earnings by Sex by Income Bracket in Area Code 432
The most common earnings brackets in Area Code 432 are $100,000+ for men (37,066 | 22.7%) and $55,000 to $64,999 for women (9,927 | 8.6%).
| Income | Male | Female |
| $2,499 or less | 5,796 (3.5%) | 7,981 (6.9%) |
| $2,500 to $4,999 | 2,985 (1.8%) | 3,823 (3.3%) |
| $5,000 to $7,499 | 3,847 (2.4%) | 4,018 (3.5%) |
| $7,500 to $9,999 | 2,953 (1.8%) | 3,590 (3.1%) |
| $10,000 to $12,499 | 3,191 (2.0%) | 3,963 (3.4%) |
| $12,500 to $14,999 | 2,251 (1.4%) | 3,878 (3.4%) |
| $15,000 to $17,499 | 3,855 (2.4%) | 4,911 (4.3%) |
| $17,500 to $19,999 | 2,413 (1.5%) | 3,365 (2.9%) |
| $20,000 to $22,499 | 3,370 (2.1%) | 3,598 (3.1%) |
| $22,500 to $24,999 | 3,708 (2.3%) | 5,199 (4.5%) |
| $25,000 to $29,999 | 8,791 (5.4%) | 8,782 (7.6%) |
| $30,000 to $34,999 | 6,724 (4.1%) | 8,258 (7.2%) |
| $35,000 to $39,999 | 7,178 (4.4%) | 7,188 (6.2%) |
| $40,000 to $44,999 | 7,737 (4.7%) | 5,646 (4.9%) |
| $45,000 to $49,999 | 7,732 (4.7%) | 6,055 (5.2%) |
| $50,000 to $54,999 | 6,624 (4.1%) | 4,501 (3.9%) |
| $55,000 to $64,999 | 14,707 (9.0%) | 9,927 (8.6%) |
| $65,000 to $74,999 | 10,948 (6.7%) | 6,667 (5.8%) |
| $75,000 to $99,999 | 21,227 (13.0%) | 7,838 (6.8%) |
| $100,000+ | 37,066 (22.7%) | 6,075 (5.3%) |
| Total | 163,103 (100.0%) | 115,263 (100.0%) |
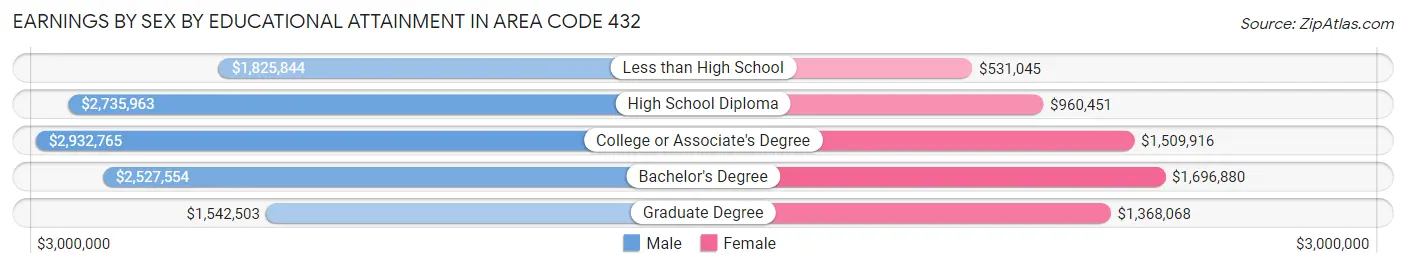
Earnings by Sex by Educational Attainment in Area Code 432
Average earnings in Area Code 432 are $3,349,487 for men and $1,772,803 for women, a difference of 47.1%. Men with an educational attainment of college or associate's degree enjoy the highest average annual earnings of $2,932,765, while those with graduate degree education earn the least with $1,542,503. Women with an educational attainment of bachelor's degree earn the most with the average annual earnings of $1,696,880, while those with less than high school education have the smallest earnings of $531,045.
| Educational Attainment | Male Income | Female Income |
| Less than High School | $1,825,844 | $531,045 |
| High School Diploma | $2,735,963 | $960,451 |
| College or Associate's Degree | $2,932,765 | $1,509,916 |
| Bachelor's Degree | $2,527,554 | $1,696,880 |
| Graduate Degree | $1,542,503 | $1,368,068 |
| Total | $3,349,487 | $1,772,803 |
Family Income in Area Code 432
Family Income Brackets in Area Code 432
According to the Area Code 432 family income data, there are 1,686,613 families falling into the $100,000 to $149,999 income range, which is the most common income bracket and makes up 1,228.2% of all families. Conversely, the $10,000 to $14,999 income bracket is the least frequent group with only 134,166 families (97.7%) belonging to this category.
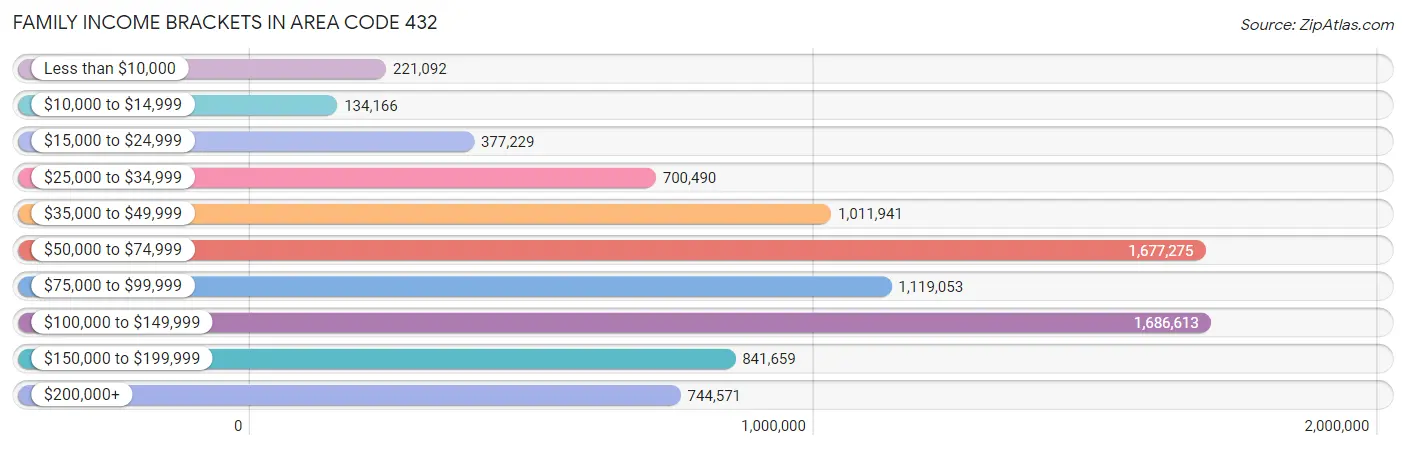
| Income Bracket | # Families | % Families |
| Less than $10,000 | 221,092 | 161.0% |
| $10,000 to $14,999 | 134,166 | 97.7% |
| $15,000 to $24,999 | 377,229 | 274.7% |
| $25,000 to $34,999 | 700,490 | 510.1% |
| $35,000 to $49,999 | 1,011,941 | 736.9% |
| $50,000 to $74,999 | 1,677,275 | 1,221.4% |
| $75,000 to $99,999 | 1,119,053 | 814.9% |
| $100,000 to $149,999 | 1,686,613 | 1,228.2% |
| $150,000 to $199,999 | 841,659 | 612.9% |
| $200,000+ | 744,571 | 542.2% |
Family Income by Famaliy Size in Area Code 432
5-person families (16,794 | 12.2%) account for the highest median family income in Area Code 432 with $113,127 per family, while 2-person families (53,338 | 38.8%) have the highest median income of $38,162 per family member.
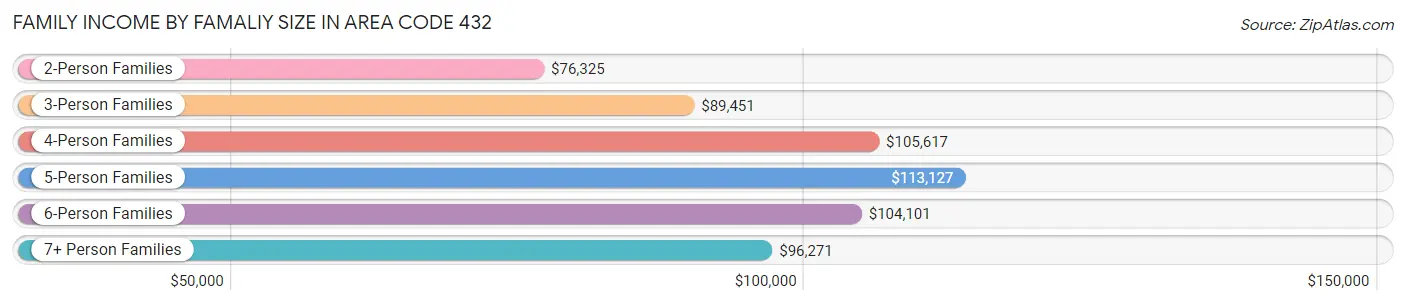
| Income Bracket | # Families | Median Income |
| 2-Person Families | 53,338 (38.8%) | $76,325 |
| 3-Person Families | 29,749 (21.7%) | $89,451 |
| 4-Person Families | 28,580 (20.8%) | $105,617 |
| 5-Person Families | 16,794 (12.2%) | $113,127 |
| 6-Person Families | 6,098 (4.4%) | $104,101 |
| 7+ Person Families | 2,765 (2.0%) | $96,271 |
| Total | 137,324 (100.0%) | $85,623 |
Family Income by Number of Earners in Area Code 432
The median family income in Area Code 432 is $85,623, with families comprising 3+ earners (16,515) having the highest median family income of $139,150, while families with no earners (13,608) have the lowest median family income of $43,630, accounting for 12.0% and 9.9% of families, respectively.
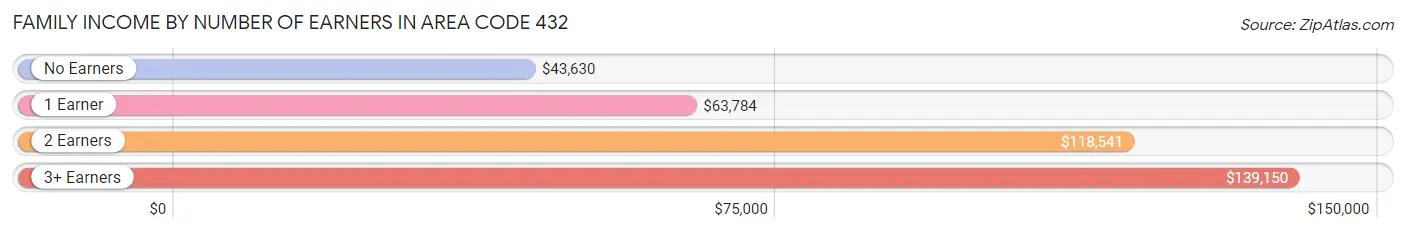
| Number of Earners | # Families | Median Income |
| No Earners | 13,608 (9.9%) | $43,630 |
| 1 Earner | 50,299 (36.6%) | $63,784 |
| 2 Earners | 56,902 (41.4%) | $118,541 |
| 3+ Earners | 16,515 (12.0%) | $139,150 |
| Total | 137,324 (100.0%) | $85,623 |
Household Income in Area Code 432
Household Income Brackets in Area Code 432
With 2,080,820 households falling in the category, the $50,000 to $74,999 income range is the most frequent in Area Code 432, accounting for 1,034.4% of all households. In contrast, only 694,411 households (345.2%) fall into the less than $10,000 income bracket, making it the least populous group.
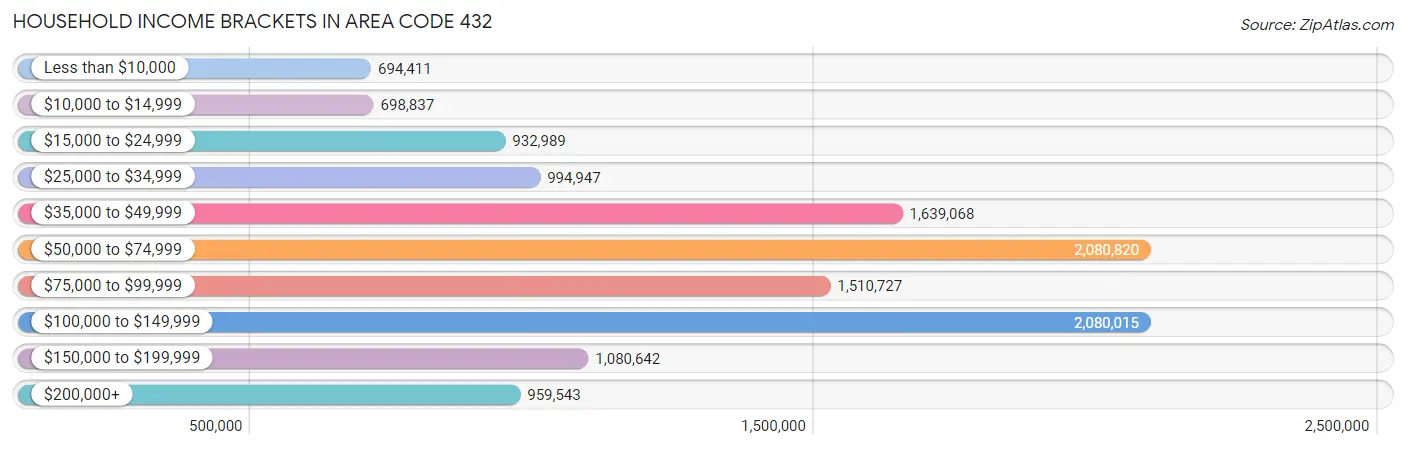
| Income Bracket | # Households | % Households |
| Less than $10,000 | 694,411 | 345.2% |
| $10,000 to $14,999 | 698,837 | 347.4% |
| $15,000 to $24,999 | 932,989 | 463.8% |
| $25,000 to $34,999 | 994,947 | 494.6% |
| $35,000 to $49,999 | 1,639,068 | 814.8% |
| $50,000 to $74,999 | 2,080,820 | 1,034.4% |
| $75,000 to $99,999 | 1,510,727 | 751.0% |
| $100,000 to $149,999 | 2,080,015 | 1,034.0% |
| $150,000 to $199,999 | 1,080,642 | 537.2% |
| $200,000+ | 959,543 | 477.0% |
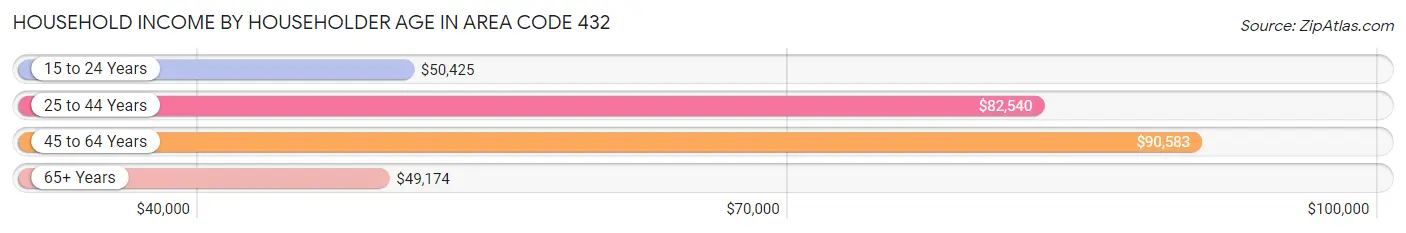
Household Income by Householder Age in Area Code 432
The median household income in Area Code 432 is $72,982, with the highest median household income of $90,583 found in the 45 to 64 years age bracket for the primary householder. A total of 66,516 households (33.1%) fall into this category. Meanwhile, the 65+ years age bracket for the primary householder has the lowest median household income of $49,174, with 40,694 households (20.2%) in this group.
| Income Bracket | # Households | Median Income |
| 15 to 24 Years | 13,206 (6.6%) | $50,425 |
| 25 to 44 Years | 80,746 (40.1%) | $82,540 |
| 45 to 64 Years | 66,516 (33.1%) | $90,583 |
| 65+ Years | 40,694 (20.2%) | $49,174 |
| Total | 201,162 (100.0%) | $72,982 |
Poverty in Area Code 432
Income Below Poverty by Sex and Age in Area Code 432
With 12.7% poverty level for males and 15.9% for females among the residents of Area Code 432, 15 year old males and 5 year old females are the most vulnerable to poverty, with 1,065 males (25.5%) and 1,183 females (28.1%) in their respective age groups living below the poverty level.
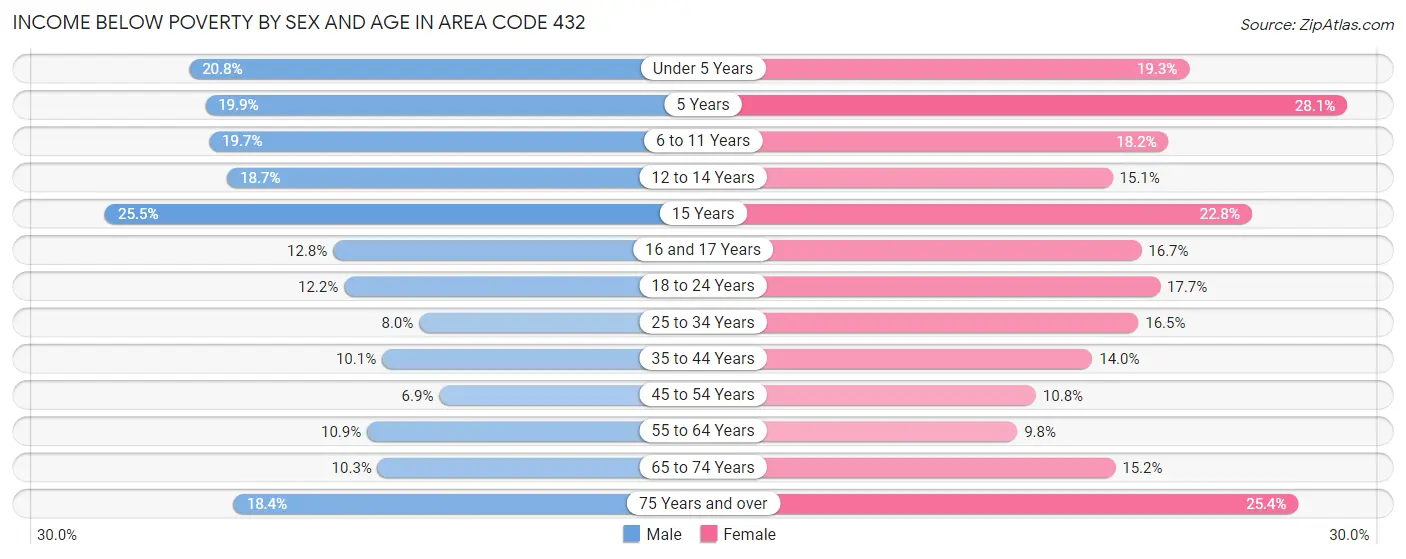
| Age Bracket | Male | Female |
| Under 5 Years | 4,660 (20.8%) | 3,990 (19.3%) |
| 5 Years | 1,007 (19.9%) | 1,183 (28.1%) |
| 6 to 11 Years | 5,161 (19.7%) | 4,621 (18.2%) |
| 12 to 14 Years | 2,312 (18.7%) | 1,919 (15.1%) |
| 15 Years | 1,065 (25.5%) | 824 (22.8%) |
| 16 and 17 Years | 1,051 (12.8%) | 1,345 (16.7%) |
| 18 to 24 Years | 3,216 (12.2%) | 4,053 (17.7%) |
| 25 to 34 Years | 3,439 (8.0%) | 6,405 (16.5%) |
| 35 to 44 Years | 3,916 (10.1%) | 4,740 (14.0%) |
| 45 to 54 Years | 2,129 (6.9%) | 2,999 (10.8%) |
| 55 to 64 Years | 2,903 (10.9%) | 2,637 (9.8%) |
| 65 to 74 Years | 1,822 (10.3%) | 2,950 (15.2%) |
| 75 Years and over | 1,811 (18.3%) | 3,377 (25.4%) |
| Total | 34,492 (12.7%) | 41,043 (15.9%) |
Income Above Poverty by Sex and Age in Area Code 432
According to the poverty statistics in Area Code 432, males aged 45 to 54 years and females aged 55 to 64 years are the age groups that are most secure financially, with 93.1% of males and 90.2% of females in these age groups living above the poverty line.
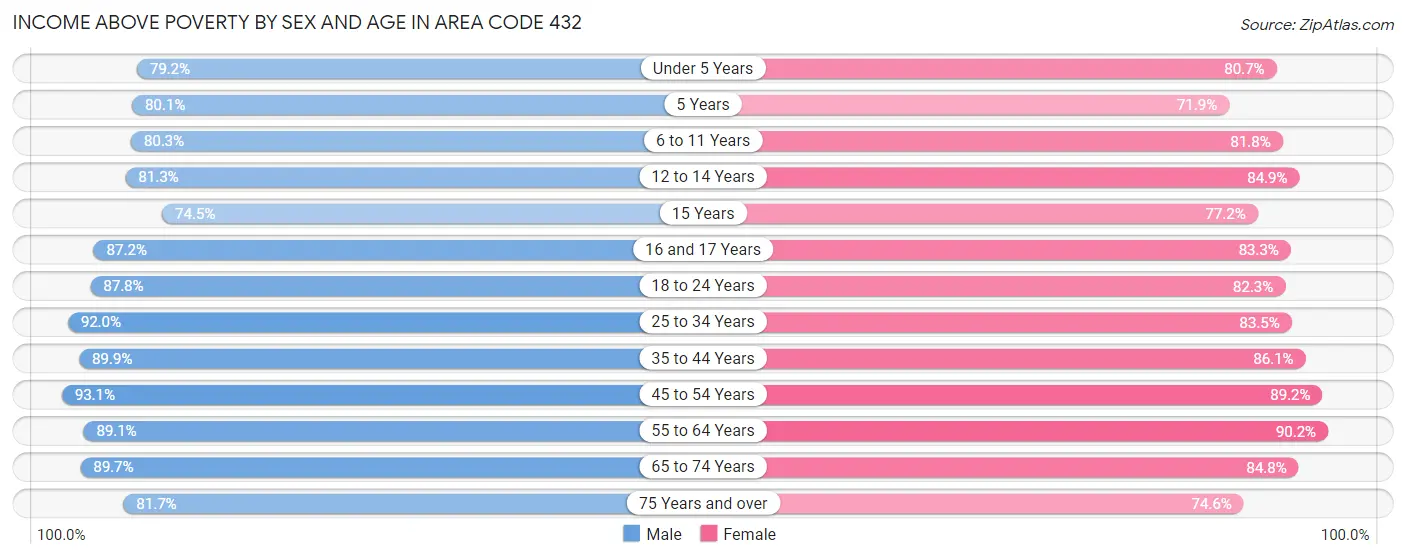
| Age Bracket | Male | Female |
| Under 5 Years | 17,708 (79.2%) | 16,644 (80.7%) |
| 5 Years | 4,043 (80.1%) | 3,021 (71.9%) |
| 6 to 11 Years | 21,001 (80.3%) | 20,779 (81.8%) |
| 12 to 14 Years | 10,039 (81.3%) | 10,807 (84.9%) |
| 15 Years | 3,108 (74.5%) | 2,786 (77.2%) |
| 16 and 17 Years | 7,144 (87.2%) | 6,719 (83.3%) |
| 18 to 24 Years | 23,133 (87.8%) | 18,814 (82.3%) |
| 25 to 34 Years | 39,382 (92.0%) | 32,391 (83.5%) |
| 35 to 44 Years | 34,867 (89.9%) | 29,247 (86.1%) |
| 45 to 54 Years | 28,665 (93.1%) | 24,746 (89.2%) |
| 55 to 64 Years | 23,657 (89.1%) | 24,356 (90.2%) |
| 65 to 74 Years | 15,794 (89.7%) | 16,414 (84.8%) |
| 75 Years and over | 8,060 (81.7%) | 9,908 (74.6%) |
| Total | 236,601 (87.3%) | 216,632 (84.1%) |
Income Below Poverty Among Married-Couple Families in Area Code 432
The poverty statistics for married-couple families in Area Code 432 show that 6.4% or 6,370 of the total 99,660 families live below the poverty line. Families with 5 or more children have the highest poverty rate of 40.1%, comprising of 387 families. On the other hand, families with 1 or 2 children have the lowest poverty rate of 3.2%, which includes 1,220 families.
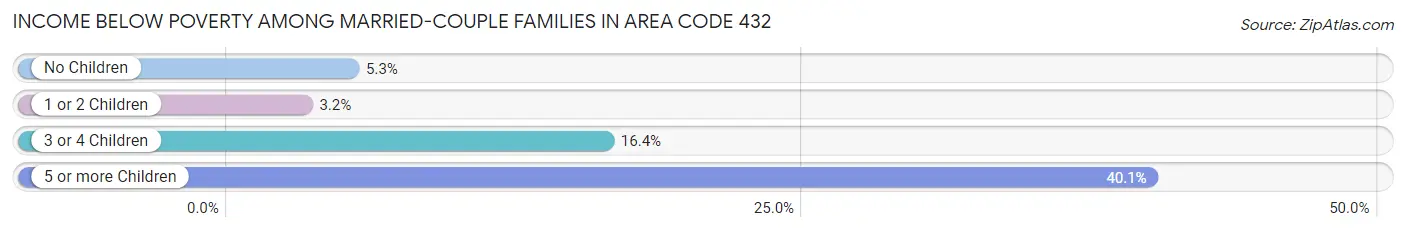
| Children | Above Poverty | Below Poverty |
| No Children | 44,582 (94.7%) | 2,480 (5.3%) |
| 1 or 2 Children | 36,454 (96.8%) | 1,220 (3.2%) |
| 3 or 4 Children | 11,675 (83.6%) | 2,283 (16.4%) |
| 5 or more Children | 579 (59.9%) | 387 (40.1%) |
| Total | 93,290 (93.6%) | 6,370 (6.4%) |
Income Below Poverty Among Single-Parent Households in Area Code 432
According to the poverty data in Area Code 432, 10.8% or 1,233 single-father households and 28.4% or 7,466 single-mother households are living below the poverty line. Among single-father households, those with 3 or 4 children have the highest poverty rate, with 416 households (39.5%) experiencing poverty. Likewise, among single-mother households, those with 5 or more children have the highest poverty rate, with 119 households (93.0%) falling below the poverty line.
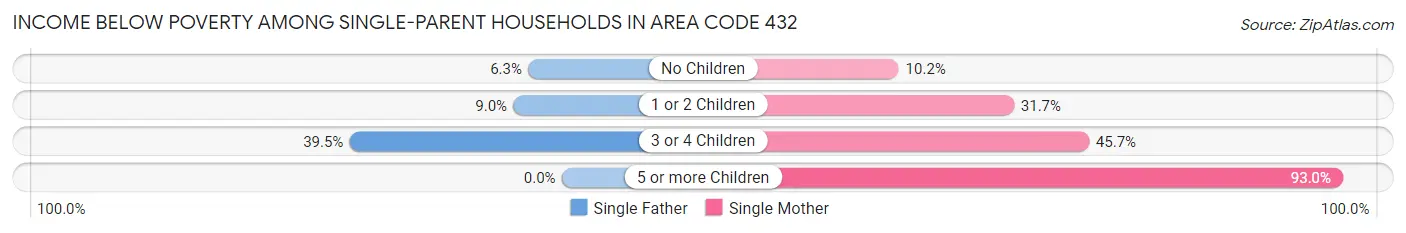
| Children | Single Father | Single Mother |
| No Children | 254 (6.3%) | 729 (10.2%) |
| 1 or 2 Children | 563 (9.0%) | 4,704 (31.7%) |
| 3 or 4 Children | 416 (39.5%) | 1,914 (45.7%) |
| 5 or more Children | 0 (0.0%) | 119 (93.0%) |
| Total | 1,233 (10.8%) | 7,466 (28.4%) |
Income Below Poverty Among Married-Couple vs Single-Parent Households in Area Code 432
The poverty data for Area Code 432 shows that 6,370 of the married-couple family households (6.4%) and 8,699 of the single-parent households (23.1%) are living below the poverty level. Within the married-couple family households, those with 5 or more children have the highest poverty rate, with 387 households (40.1%) falling below the poverty line. Among the single-parent households, those with 5 or more children have the highest poverty rate, with 119 household (66.5%) living below poverty.
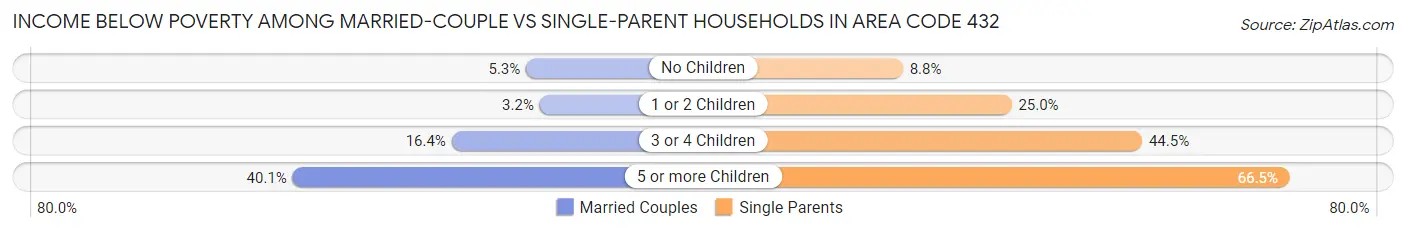
| Children | Married-Couple Families | Single-Parent Households |
| No Children | 2,480 (5.3%) | 983 (8.8%) |
| 1 or 2 Children | 1,220 (3.2%) | 5,267 (25.0%) |
| 3 or 4 Children | 2,283 (16.4%) | 2,330 (44.5%) |
| 5 or more Children | 387 (40.1%) | 119 (66.5%) |
| Total | 6,370 (6.4%) | 8,699 (23.1%) |
Race in Area Code 432
The most populous races in Area Code 432 are White / Caucasian (355,062 | 65.4%), Hispanic or Latino (313,639 | 57.8%), and Two or more Races (80,244 | 14.8%).
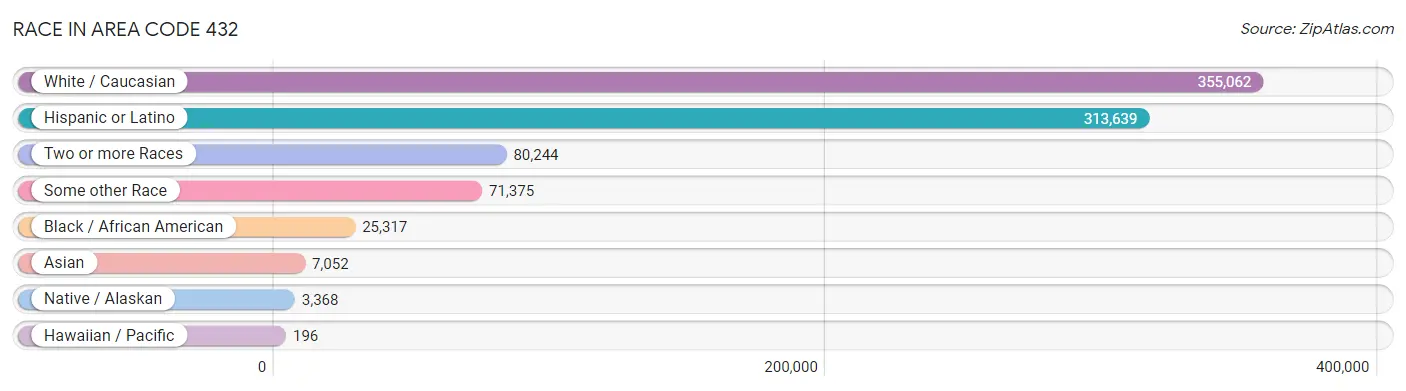
| Race | # Population | % Population |
| Asian | 7,052 | 1.3% |
| Black / African American | 25,317 | 4.7% |
| Hawaiian / Pacific | 196 | 0.0% |
| Hispanic or Latino | 313,639 | 57.8% |
| Native / Alaskan | 3,368 | 0.6% |
| White / Caucasian | 355,062 | 65.4% |
| Two or more Races | 80,244 | 14.8% |
| Some other Race | 71,375 | 13.2% |
| Total | 542,614 | 100.0% |
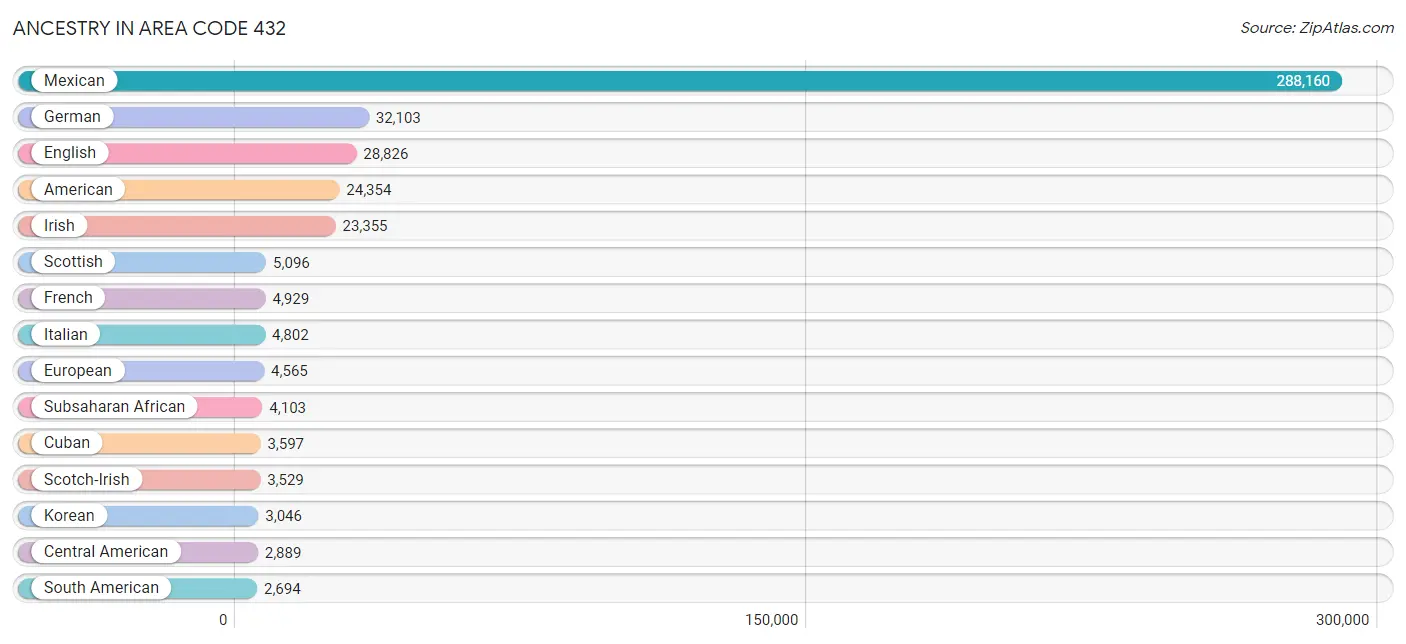
Ancestry in Area Code 432
The most populous ancestries reported in Area Code 432 are Mexican (288,160 | 53.1%), German (32,103 | 5.9%), English (28,826 | 5.3%), American (24,354 | 4.5%), and Irish (23,355 | 4.3%), together accounting for 73.1% of all Area Code 432 residents.
| Ancestry | # Population | % Population |
| African | 1,770 | 0.3% |
| Alaska Native | 80 | 0.0% |
| Albanian | 28 | 0.0% |
| American | 24,354 | 4.5% |
| Apache | 309 | 0.1% |
| Arab | 1,859 | 0.3% |
| Argentinean | 25 | 0.0% |
| Armenian | 41 | 0.0% |
| Australian | 43 | 0.0% |
| Austrian | 321 | 0.1% |
| Barbadian | 18 | 0.0% |
| Belgian | 161 | 0.0% |
| Belizean | 21 | 0.0% |
| Bermudan | 22 | 0.0% |
| Bhutanese | 730 | 0.1% |
| Blackfeet | 493 | 0.1% |
| Bolivian | 72 | 0.0% |
| Brazilian | 21 | 0.0% |
| British | 1,563 | 0.3% |
| Bulgarian | 3 | 0.0% |
| Burmese | 689 | 0.1% |
| Cajun | 59 | 0.0% |
| Cambodian | 5 | 0.0% |
| Canadian | 1,178 | 0.2% |
| Carpatho Rusyn | 9 | 0.0% |
| Central American | 2,889 | 0.5% |
| Central American Indian | 138 | 0.0% |
| Cherokee | 1,121 | 0.2% |
| Chickasaw | 166 | 0.0% |
| Chilean | 61 | 0.0% |
| Chippewa | 24 | 0.0% |
| Choctaw | 542 | 0.1% |
| Colombian | 651 | 0.1% |
| Comanche | 257 | 0.1% |
| Costa Rican | 48 | 0.0% |
| Cree | 21 | 0.0% |
| Creek | 25 | 0.0% |
| Croatian | 37 | 0.0% |
| Cuban | 3,597 | 0.7% |
| Czech | 1,572 | 0.3% |
| Czechoslovakian | 132 | 0.0% |
| Danish | 352 | 0.1% |
| Delaware | 49 | 0.0% |
| Dominican | 132 | 0.0% |
| Dutch | 1,472 | 0.3% |
| Dutch West Indian | 173 | 0.0% |
| Eastern European | 553 | 0.1% |
| Ecuadorian | 123 | 0.0% |
| Egyptian | 310 | 0.1% |
| English | 28,826 | 5.3% |
| Ethiopian | 12 | 0.0% |
| European | 4,565 | 0.8% |
| Filipino | 37 | 0.0% |
| Finnish | 55 | 0.0% |
| French | 4,929 | 0.9% |
| French American Indian | 109 | 0.0% |
| French Canadian | 441 | 0.1% |
| German | 32,103 | 5.9% |
| Ghanaian | 32 | 0.0% |
| Greek | 722 | 0.1% |
| Guamanian / Chamorro | 63 | 0.0% |
| Guatemalan | 719 | 0.1% |
| Guyanese | 163 | 0.0% |
| Haitian | 57 | 0.0% |
| Honduran | 1,003 | 0.2% |
| Hungarian | 495 | 0.1% |
| Icelander | 61 | 0.0% |
| Indian (Asian) | 1,195 | 0.2% |
| Indonesian | 300 | 0.1% |
| Iranian | 55 | 0.0% |
| Irish | 23,355 | 4.3% |
| Iroquois | 5 | 0.0% |
| Israeli | 133 | 0.0% |
| Italian | 4,802 | 0.9% |
| Jamaican | 400 | 0.1% |
| Japanese | 503 | 0.1% |
| Jordanian | 44 | 0.0% |
| Kenyan | 148 | 0.0% |
| Korean | 3,046 | 0.6% |
| Laotian | 10 | 0.0% |
| Lebanese | 839 | 0.2% |
| Lithuanian | 73 | 0.0% |
| Malaysian | 98 | 0.0% |
| Mexican | 288,160 | 53.1% |
| Mexican American Indian | 1,159 | 0.2% |
| Moroccan | 11 | 0.0% |
| Native Hawaiian | 354 | 0.1% |
| Navajo | 517 | 0.1% |
| New Zealander | 6 | 0.0% |
| Nicaraguan | 378 | 0.1% |
| Nigerian | 1,279 | 0.2% |
| Northern European | 296 | 0.1% |
| Norwegian | 1,364 | 0.3% |
| Osage | 105 | 0.0% |
| Pakistani | 69 | 0.0% |
| Palestinian | 260 | 0.1% |
| Panamanian | 77 | 0.0% |
| Pennsylvania German | 737 | 0.1% |
| Peruvian | 371 | 0.1% |
| Polish | 2,162 | 0.4% |
| Portuguese | 341 | 0.1% |
| Potawatomi | 34 | 0.0% |
| Pueblo | 67 | 0.0% |
| Puerto Rican | 1,962 | 0.4% |
| Romanian | 44 | 0.0% |
| Russian | 881 | 0.2% |
| Salvadoran | 656 | 0.1% |
| Samoan | 190 | 0.0% |
| Scandinavian | 851 | 0.2% |
| Scotch-Irish | 3,529 | 0.6% |
| Scottish | 5,096 | 0.9% |
| Seminole | 54 | 0.0% |
| Serbian | 90 | 0.0% |
| Sioux | 75 | 0.0% |
| Slavic | 96 | 0.0% |
| Slovak | 299 | 0.1% |
| Slovene | 39 | 0.0% |
| South African | 81 | 0.0% |
| South American | 2,694 | 0.5% |
| South American Indian | 110 | 0.0% |
| Spaniard | 1,574 | 0.3% |
| Spanish | 1,206 | 0.2% |
| Spanish American | 120 | 0.0% |
| Spanish American Indian | 40 | 0.0% |
| Sri Lankan | 1,083 | 0.2% |
| Subsaharan African | 4,103 | 0.8% |
| Sudanese | 159 | 0.0% |
| Swedish | 2,154 | 0.4% |
| Swiss | 160 | 0.0% |
| Syrian | 20 | 0.0% |
| Thai | 1,764 | 0.3% |
| Tongan | 53 | 0.0% |
| Trinidadian and Tobagonian | 8 | 0.0% |
| Turkish | 85 | 0.0% |
| Ukrainian | 276 | 0.1% |
| Venezuelan | 1,391 | 0.3% |
| Vietnamese | 151 | 0.0% |
| Welsh | 951 | 0.2% |
| West Indian | 74 | 0.0% |
| Yaqui | 11 | 0.0% |
| Yugoslavian | 40 | 0.0% | View All 141 Rows |
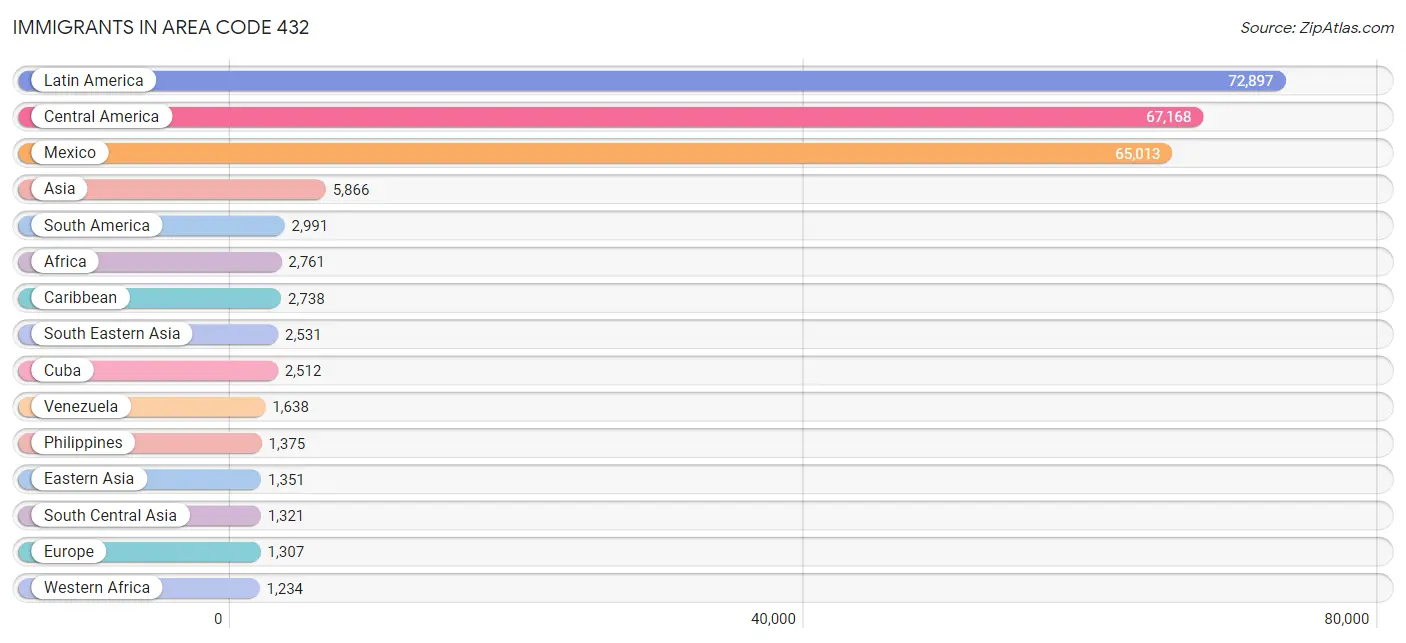
Immigrants in Area Code 432
The most numerous immigrant groups reported in Area Code 432 came from Latin America (72,897 | 13.4%), Central America (67,168 | 12.4%), Mexico (65,013 | 12.0%), Asia (5,866 | 1.1%), and South America (2,991 | 0.5%), together accounting for 39.4% of all Area Code 432 residents.
| Immigration Origin | # Population | % Population |
| Africa | 2,761 | 0.5% |
| Albania | 28 | 0.0% |
| Argentina | 6 | 0.0% |
| Asia | 5,866 | 1.1% |
| Australia | 73 | 0.0% |
| Austria | 15 | 0.0% |
| Bahamas | 10 | 0.0% |
| Bangladesh | 123 | 0.0% |
| Barbados | 18 | 0.0% |
| Belize | 74 | 0.0% |
| Bolivia | 203 | 0.0% |
| Brazil | 17 | 0.0% |
| Bulgaria | 3 | 0.0% |
| Cambodia | 435 | 0.1% |
| Cameroon | 54 | 0.0% |
| Canada | 1,167 | 0.2% |
| Caribbean | 2,738 | 0.5% |
| Central America | 67,168 | 12.4% |
| China | 950 | 0.2% |
| Colombia | 390 | 0.1% |
| Costa Rica | 6 | 0.0% |
| Cuba | 2,512 | 0.5% |
| Dominican Republic | 119 | 0.0% |
| Eastern Africa | 738 | 0.1% |
| Eastern Asia | 1,351 | 0.3% |
| Eastern Europe | 165 | 0.0% |
| Ecuador | 203 | 0.0% |
| Egypt | 252 | 0.1% |
| El Salvador | 688 | 0.1% |
| England | 119 | 0.0% |
| Europe | 1,307 | 0.2% |
| France | 31 | 0.0% |
| Germany | 558 | 0.1% |
| Ghana | 25 | 0.0% |
| Guatemala | 509 | 0.1% |
| Guyana | 40 | 0.0% |
| Haiti | 9 | 0.0% |
| Honduras | 703 | 0.1% |
| Hong Kong | 78 | 0.0% |
| Hungary | 9 | 0.0% |
| India | 770 | 0.1% |
| Indonesia | 10 | 0.0% |
| Iran | 64 | 0.0% |
| Iraq | 95 | 0.0% |
| Ireland | 36 | 0.0% |
| Israel | 11 | 0.0% |
| Italy | 66 | 0.0% |
| Jamaica | 45 | 0.0% |
| Japan | 124 | 0.0% |
| Kazakhstan | 115 | 0.0% |
| Kenya | 400 | 0.1% |
| Korea | 277 | 0.1% |
| Laos | 59 | 0.0% |
| Latin America | 72,897 | 13.4% |
| Lebanon | 147 | 0.0% |
| Malaysia | 28 | 0.0% |
| Mexico | 65,013 | 12.0% |
| Middle Africa | 201 | 0.0% |
| Moldova | 25 | 0.0% |
| Morocco | 84 | 0.0% |
| Nepal | 52 | 0.0% |
| Netherlands | 10 | 0.0% |
| Nicaragua | 142 | 0.0% |
| Nigeria | 985 | 0.2% |
| Northern Africa | 414 | 0.1% |
| Northern Europe | 382 | 0.1% |
| Oceania | 156 | 0.0% |
| Pakistan | 197 | 0.0% |
| Panama | 33 | 0.0% |
| Peru | 468 | 0.1% |
| Philippines | 1,375 | 0.3% |
| Romania | 21 | 0.0% |
| Russia | 48 | 0.0% |
| Saudi Arabia | 8 | 0.0% |
| Scotland | 37 | 0.0% |
| Senegal | 51 | 0.0% |
| Serbia | 3 | 0.0% |
| Somalia | 88 | 0.0% |
| South Africa | 95 | 0.0% |
| South America | 2,991 | 0.5% |
| South Central Asia | 1,321 | 0.2% |
| South Eastern Asia | 2,531 | 0.5% |
| Southern Europe | 138 | 0.0% |
| Spain | 72 | 0.0% |
| Sudan | 67 | 0.0% |
| Syria | 83 | 0.0% |
| Taiwan | 53 | 0.0% |
| Thailand | 45 | 0.0% |
| Trinidad and Tobago | 12 | 0.0% |
| Turkey | 151 | 0.0% |
| Uganda | 129 | 0.0% |
| Ukraine | 17 | 0.0% |
| Venezuela | 1,638 | 0.3% |
| Vietnam | 413 | 0.1% |
| Western Africa | 1,234 | 0.2% |
| Western Asia | 495 | 0.1% |
| Western Europe | 614 | 0.1% |
| Zimbabwe | 62 | 0.0% | View All 98 Rows |
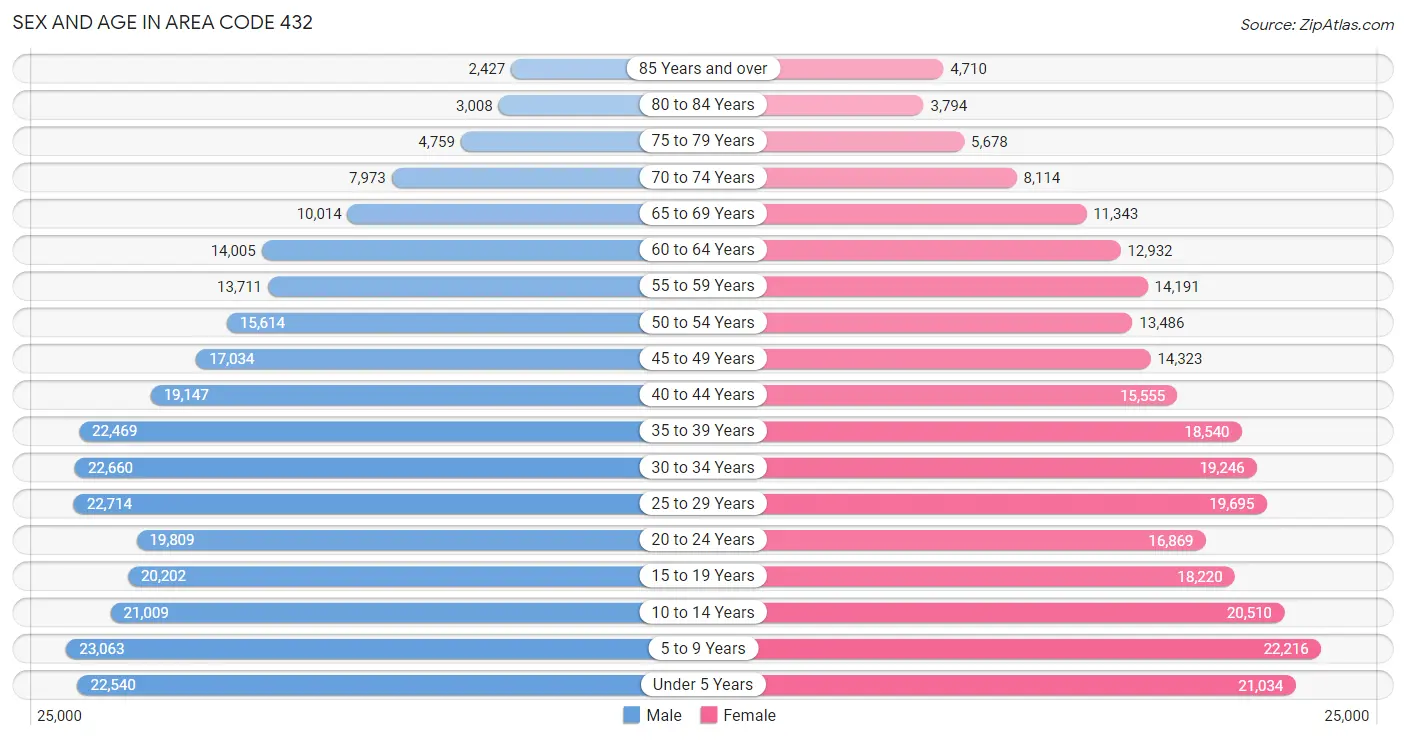
Sex and Age in Area Code 432
Sex and Age in Area Code 432
The most populous age groups in Area Code 432 are 5 to 9 Years (23,063 | 8.2%) for men and 5 to 9 Years (22,216 | 8.5%) for women.
| Age Bracket | Male | Female |
| Under 5 Years | 22,540 (8.0%) | 21,034 (8.1%) |
| 5 to 9 Years | 23,063 (8.2%) | 22,216 (8.5%) |
| 10 to 14 Years | 21,009 (7.4%) | 20,510 (7.9%) |
| 15 to 19 Years | 20,202 (7.2%) | 18,220 (7.0%) |
| 20 to 24 Years | 19,809 (7.0%) | 16,869 (6.5%) |
| 25 to 29 Years | 22,714 (8.1%) | 19,695 (7.6%) |
| 30 to 34 Years | 22,660 (8.0%) | 19,246 (7.4%) |
| 35 to 39 Years | 22,469 (8.0%) | 18,540 (7.1%) |
| 40 to 44 Years | 19,147 (6.8%) | 15,555 (6.0%) |
| 45 to 49 Years | 17,034 (6.0%) | 14,323 (5.5%) |
| 50 to 54 Years | 15,614 (5.5%) | 13,486 (5.2%) |
| 55 to 59 Years | 13,711 (4.9%) | 14,191 (5.4%) |
| 60 to 64 Years | 14,005 (5.0%) | 12,932 (5.0%) |
| 65 to 69 Years | 10,014 (3.5%) | 11,343 (4.4%) |
| 70 to 74 Years | 7,973 (2.8%) | 8,114 (3.1%) |
| 75 to 79 Years | 4,759 (1.7%) | 5,678 (2.2%) |
| 80 to 84 Years | 3,008 (1.1%) | 3,794 (1.5%) |
| 85 Years and over | 2,427 (0.9%) | 4,710 (1.8%) |
| Total | 282,158 (100.0%) | 260,456 (100.0%) |
Families and Households in Area Code 432
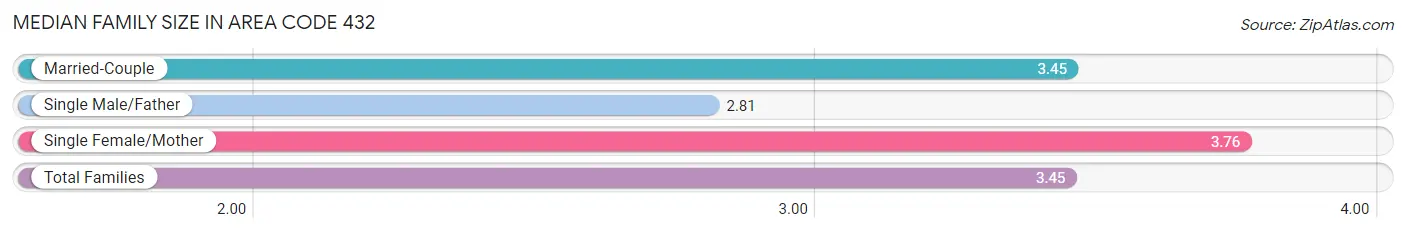
Median Family Size in Area Code 432
The median family size in Area Code 432 is 3.45 persons per family, with single female/mother families (26,278 | 19.1%) accounting for the largest median family size of 3.75959 persons per family. On the other hand, single male/father families (11,386 | 8.3%) represent the smallest median family size with 2.81 persons per family.
| Family Type | # Families | Family Size |
| Married-Couple | 99,660 (72.6%) | 3.45 |
| Single Male/Father | 11,386 (8.3%) | 2.81 |
| Single Female/Mother | 26,278 (19.1%) | 3.76 |
| Total Families | 137,324 (100.0%) | 3.45 |
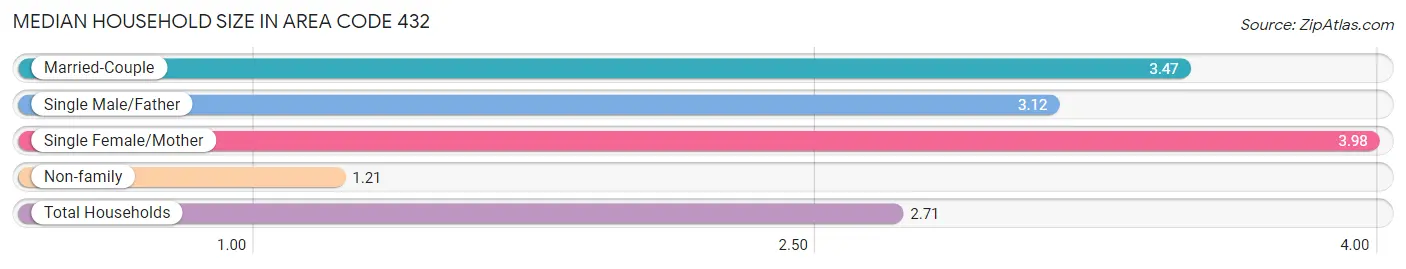
Median Household Size in Area Code 432
The median household size in Area Code 432 is 2.71 persons per household, with single female/mother households (26,278 | 13.1%) accounting for the largest median household size of 3.98061 persons per household. non-family households (63,838 | 31.7%) represent the smallest median household size with 1.21 persons per household.
| Household Type | # Households | Household Size |
| Married-Couple | 99,660 (49.5%) | 3.47 |
| Single Male/Father | 11,386 (5.7%) | 3.12 |
| Single Female/Mother | 26,278 (13.1%) | 3.98 |
| Non-family | 63,838 (31.7%) | 1.21 |
| Total Households | 201,162 (100.0%) | 2.71 |
Household Size by Marriage Status in Area Code 432
Out of a total of 201,162 households in Area Code 432, 137,324 (68.3%) are family households, while 63,838 (31.7%) are nonfamily households. The most numerous type of family households are 2-person households, comprising 48,901, and the most common type of nonfamily households are 1-person households, comprising 54,052.
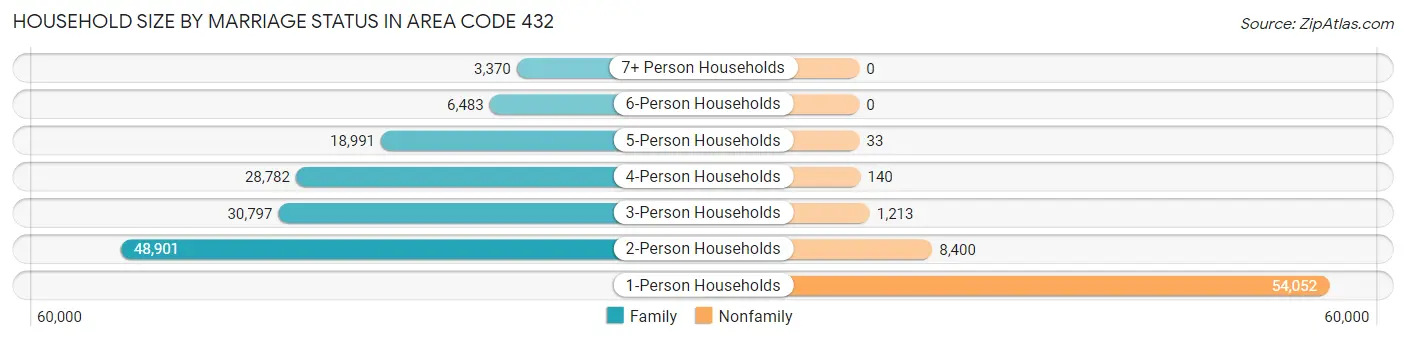
| Household Size | Family Households | Nonfamily Households |
| 1-Person Households | - | 54,052 (26.9%) |
| 2-Person Households | 48,901 (24.3%) | 8,400 (4.2%) |
| 3-Person Households | 30,797 (15.3%) | 1,213 (0.6%) |
| 4-Person Households | 28,782 (14.3%) | 140 (0.1%) |
| 5-Person Households | 18,991 (9.4%) | 33 (0.0%) |
| 6-Person Households | 6,483 (3.2%) | 0 (0.0%) |
| 7+ Person Households | 3,370 (1.7%) | 0 (0.0%) |
| Total | 137,324 (68.3%) | 63,838 (31.7%) |
Female Fertility in Area Code 432
Fertility by Age in Area Code 432
Average fertility rate in Area Code 432 is 142.6 births per 1,000 women. Women in the age bracket of 20 to 34 years have the highest fertility rate with 243.7 births per 1,000 women. Women in the age bracket of 20 to 34 years acount for 76.8% of all women with births.
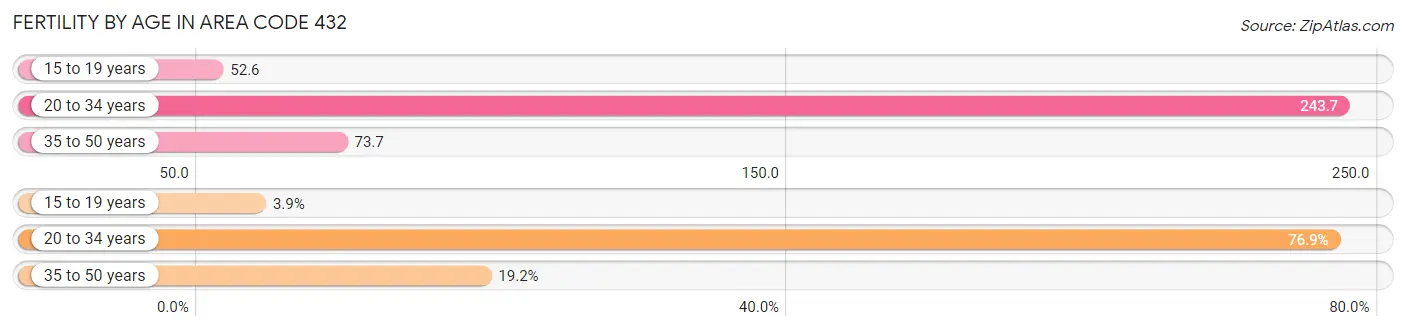
| Age Bracket | Women with Births | Births / 1,000 Women |
| 15 to 19 years | 414 (3.9%) | 52.6 |
| 20 to 34 years | 8,102 (76.8%) | 243.7 |
| 35 to 50 years | 2,027 (19.2%) | 73.7 |
| Total | 10,543 (100.0%) | 142.6 |
Fertility by Age by Marriage Status in Area Code 432
58.1% of women with births (10,543) in Area Code 432 are married. The highest percentage of unmarried women with births falls into 15 to 19 years age bracket with 95.2% of them unmarried at the time of birth, while the lowest percentage of unmarried women with births belong to 20 to 34 years age bracket with 47.9% of them unmarried.
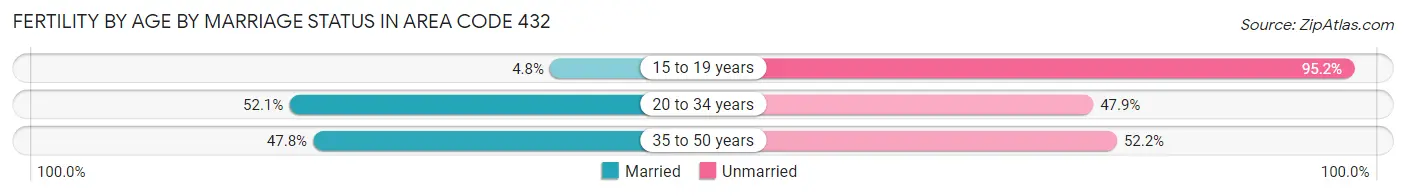
| Age Bracket | Married | Unmarried |
| 15 to 19 years | 20 (4.8%) | 394 (95.2%) |
| 20 to 34 years | 4,219 (52.1%) | 3,883 (47.9%) |
| 35 to 50 years | 968 (47.8%) | 1,059 (52.2%) |
| Total | 6,121 (58.1%) | 4,422 (41.9%) |
Fertility by Education in Area Code 432
Average fertility rate in Area Code 432 is 142.6 births per 1,000 women. Women with the education attainment of graduate degree have the highest fertility rate of 232.8 births per 1,000 women, while women with the education attainment of less than high school have the lowest fertility at 116.0 births per 1,000 women. Women with the education attainment of college or associate's degree represent 32.3% of all women with births.
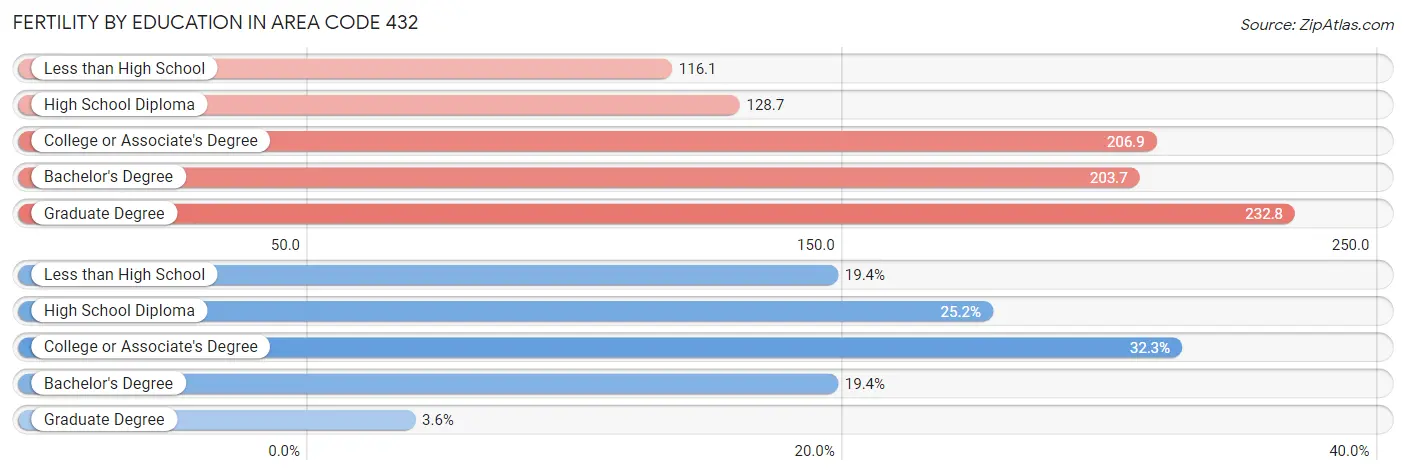
| Educational Attainment | Women with Births | Births / 1,000 Women |
| Less than High School | 2,049 (19.4%) | 116.0 |
| High School Diploma | 2,660 (25.2%) | 128.7 |
| College or Associate's Degree | 3,407 (32.3%) | 206.9 |
| Bachelor's Degree | 2,048 (19.4%) | 203.7 |
| Graduate Degree | 379 (3.6%) | 232.8 |
| Total | 10,543 (100.0%) | 142.6 |
Fertility by Education by Marriage Status in Area Code 432
41.9% of women with births in Area Code 432 are unmarried. Women with the educational attainment of bachelor's degree are most likely to be married with 70.2% of them married at childbirth, while women with the educational attainment of graduate degree are least likely to be married with 100.0% of them unmarried at childbirth.
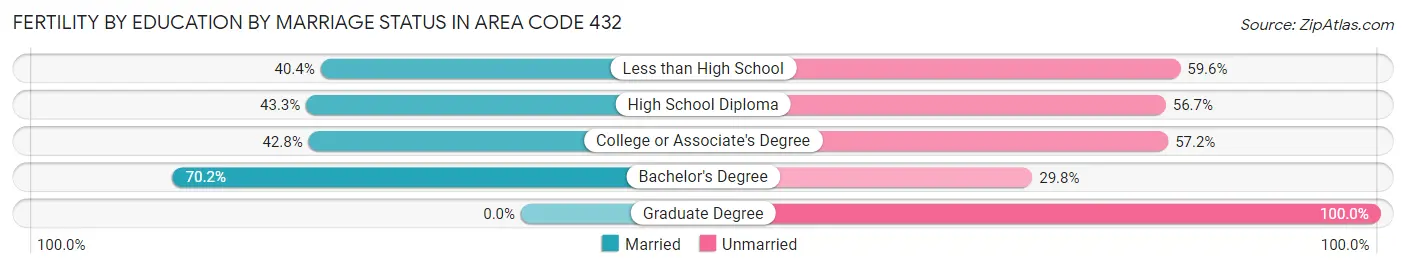
| Educational Attainment | Married | Unmarried |
| Less than High School | 827 (40.4%) | 1,222 (59.6%) |
| High School Diploma | 1,151 (43.3%) | 1,509 (56.7%) |
| College or Associate's Degree | 1,458 (42.8%) | 1,949 (57.2%) |
| Bachelor's Degree | 1,437 (70.2%) | 611 (29.8%) |
| Graduate Degree | 0 (0.0%) | 379 (100.0%) |
| Total | 6,121 (58.1%) | 4,422 (41.9%) |
Employment Characteristics in Area Code 432
Employment by Class of Employer in Area Code 432
Among the 249,694 employed individuals in Area Code 432, private company employees (169,963 | 68.1%), local government employees (19,735 | 7.9%), and self-employed (not incorporated) (18,614 | 7.4%) make up the most common classes of employment.
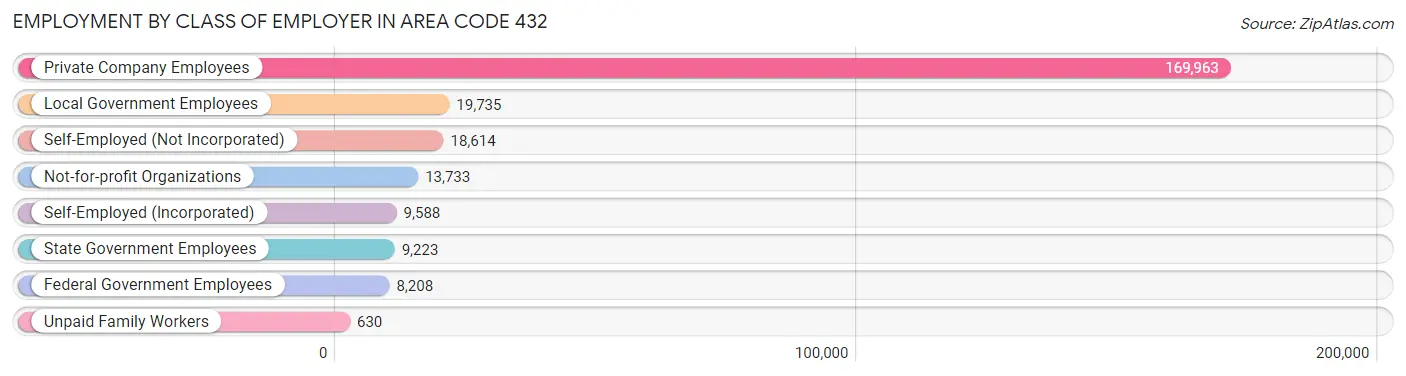
| Employer Class | # Employees | % Employees |
| Private Company Employees | 169,963 | 68.1% |
| Self-Employed (Incorporated) | 9,588 | 3.8% |
| Self-Employed (Not Incorporated) | 18,614 | 7.4% |
| Not-for-profit Organizations | 13,733 | 5.5% |
| Local Government Employees | 19,735 | 7.9% |
| State Government Employees | 9,223 | 3.7% |
| Federal Government Employees | 8,208 | 3.3% |
| Unpaid Family Workers | 630 | 0.3% |
| Total | 249,694 | 100.0% |
Employment Status by Age in Area Code 432
According to the labor force statistics for Area Code 432, out of the total population over 16 years of age (404,442), 62.0% or 250,794 individuals are in the labor force, with 5.9% or 14,697 of them unemployed. The age group with the highest labor force participation rate is 30 to 34 years, with 82.1% or 34,396 individuals in the labor force. Within the labor force, the 20 to 24 years age range has the highest percentage of unemployed individuals, with 558.0% or 163,589 of them being unemployed.
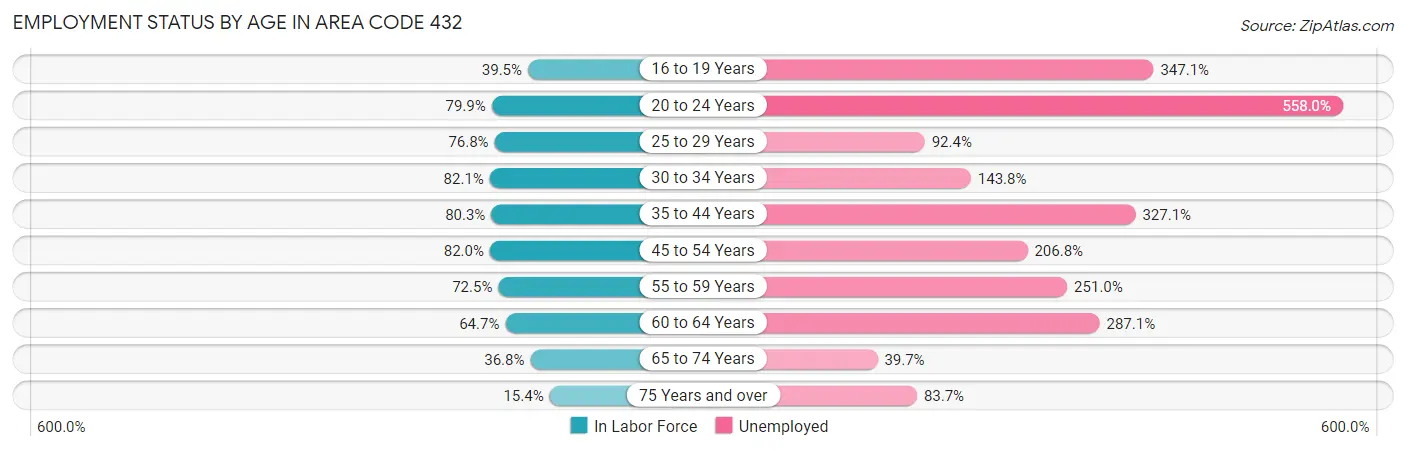
| Age Bracket | In Labor Force | Unemployed |
| 16 to 19 Years | 12,106 (39.5%) | 42,027 (347.1%) |
| 20 to 24 Years | 29,315 (79.9%) | 163,589 (558.0%) |
| 25 to 29 Years | 32,554 (76.8%) | 30,079 (92.4%) |
| 30 to 34 Years | 34,395 (82.1%) | 49,461 (143.8%) |
| 35 to 44 Years | 60,827 (80.3%) | 198,962 (327.1%) |
| 45 to 54 Years | 49,552 (82.0%) | 102,471 (206.8%) |
| 55 to 59 Years | 20,235 (72.5%) | 50,790 (251.0%) |
| 60 to 64 Years | 17,425 (64.7%) | 50,030 (287.1%) |
| 65 to 74 Years | 13,777 (36.8%) | 5,469 (39.7%) |
| 75 Years and over | 3,760 (15.4%) | 3,148 (83.7%) |
| Total | 250,792 (62.0%) | 14,699 (5.9%) |
Employment Status by Educational Attainment in Area Code 432
According to labor force statistics for Area Code 432, 78.3% of individuals (215,632) out of the total population between 25 and 64 years of age (275,322) are in the labor force, with 194.9% or 420,267 of them being unemployed. The group with the highest labor force participation rate are those with the educational attainment of bachelor's degree or higher, with 85.7% or 49,880 individuals in the labor force. Within the labor force, individuals with high school diploma education have the highest percentage of unemployment, with 360.2% or 218,991 of them being unemployed.
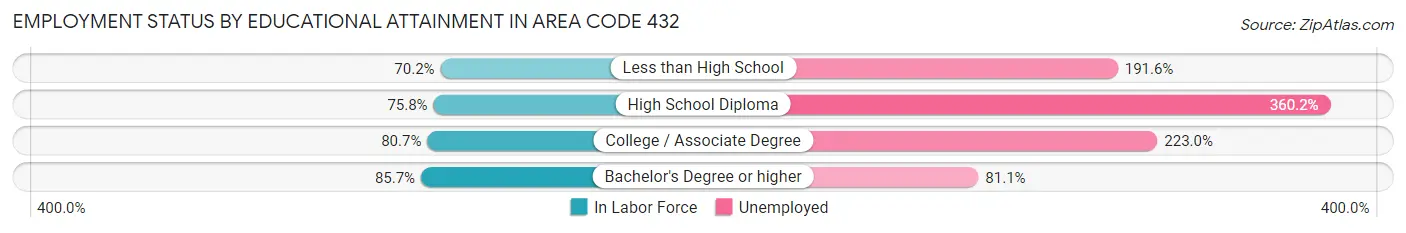
| Educational Attainment | In Labor Force | Unemployed |
| Less than High School | 38,253 (70.2%) | 104,351 (191.6%) |
| High School Diploma | 60,796 (75.8%) | 289,057 (360.2%) |
| College / Associate Degree | 66,485 (80.7%) | 183,707 (223.0%) |
| Bachelor's Degree or higher | 49,883 (85.7%) | 47,225 (81.1%) |
| Total | 215,643 (78.3%) | 536,603 (194.9%) |
Employment Occupations by Sex in Area Code 432
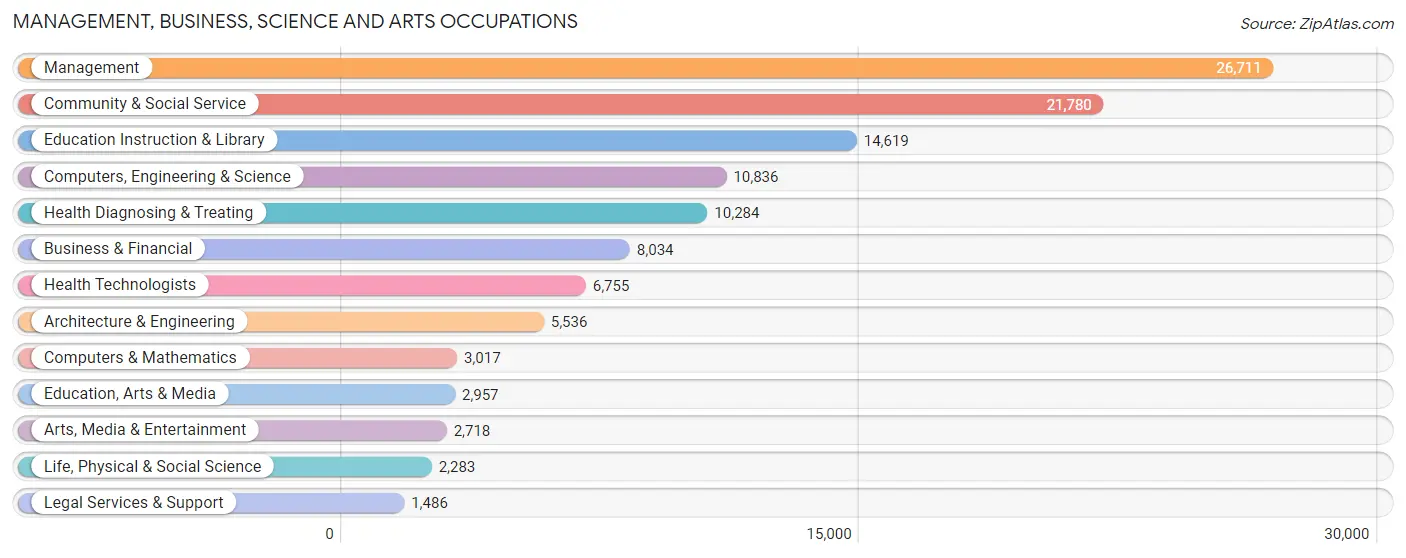
Management, Business, Science and Arts Occupations
The most common Management, Business, Science and Arts occupations in Area Code 432 are Management (26,711 | 10.6%), Community & Social Service (21,780 | 8.6%), Education Instruction & Library (14,619 | 5.8%), Computers, Engineering & Science (10,836 | 4.3%), and Health Diagnosing & Treating (10,284 | 4.1%).
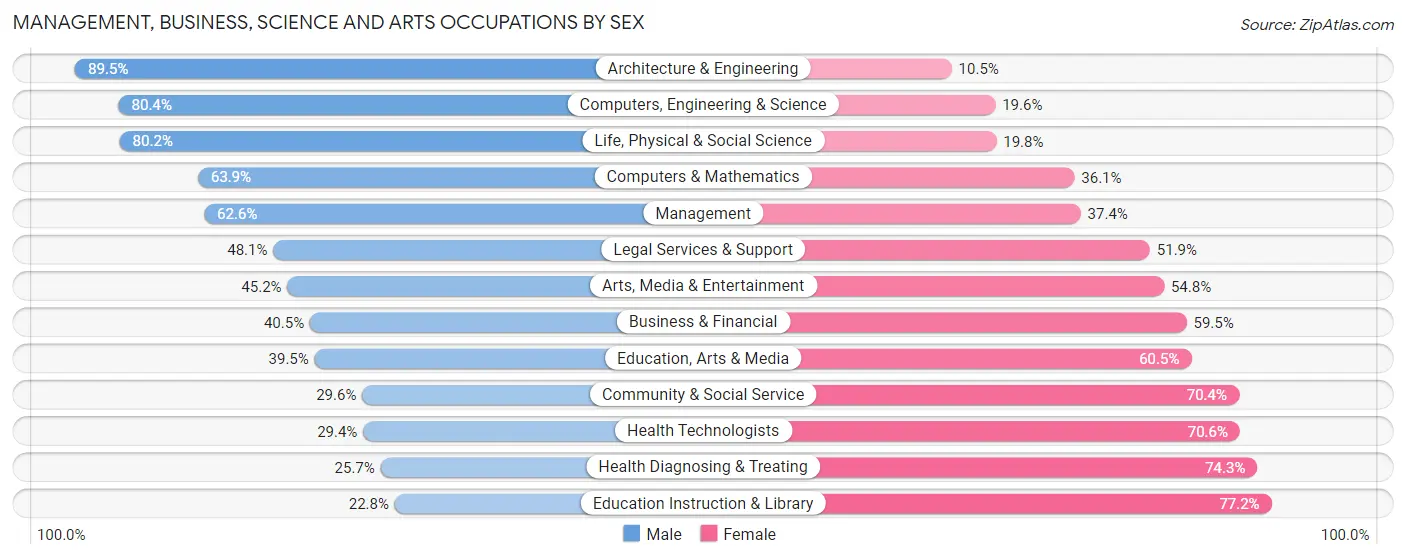
Management, Business, Science and Arts Occupations by Sex
Within the Management, Business, Science and Arts occupations in Area Code 432, the most male-oriented occupations are Architecture & Engineering (89.5%), Computers, Engineering & Science (80.4%), and Life, Physical & Social Science (80.2%), while the most female-oriented occupations are Education Instruction & Library (77.2%), Health Diagnosing & Treating (74.3%), and Health Technologists (70.6%).
| Occupation | Male | Female |
| Management | 16,710 (62.6%) | 10,001 (37.4%) |
| Business & Financial | 3,251 (40.5%) | 4,783 (59.5%) |
| Computers, Engineering & Science | 8,710 (80.4%) | 2,126 (19.6%) |
| Computers & Mathematics | 1,927 (63.9%) | 1,090 (36.1%) |
| Architecture & Engineering | 4,953 (89.5%) | 583 (10.5%) |
| Life, Physical & Social Science | 1,830 (80.2%) | 453 (19.8%) |
| Community & Social Service | 6,440 (29.6%) | 15,340 (70.4%) |
| Education, Arts & Media | 1,168 (39.5%) | 1,789 (60.5%) |
| Legal Services & Support | 715 (48.1%) | 771 (51.9%) |
| Education Instruction & Library | 3,329 (22.8%) | 11,290 (77.2%) |
| Arts, Media & Entertainment | 1,228 (45.2%) | 1,490 (54.8%) |
| Health Diagnosing & Treating | 2,646 (25.7%) | 7,638 (74.3%) |
| Health Technologists | 1,984 (29.4%) | 4,771 (70.6%) |
| Total (Category) | 37,757 (48.6%) | 39,888 (51.4%) |
| Total (Overall) | 149,447 (59.2%) | 102,844 (40.8%) |
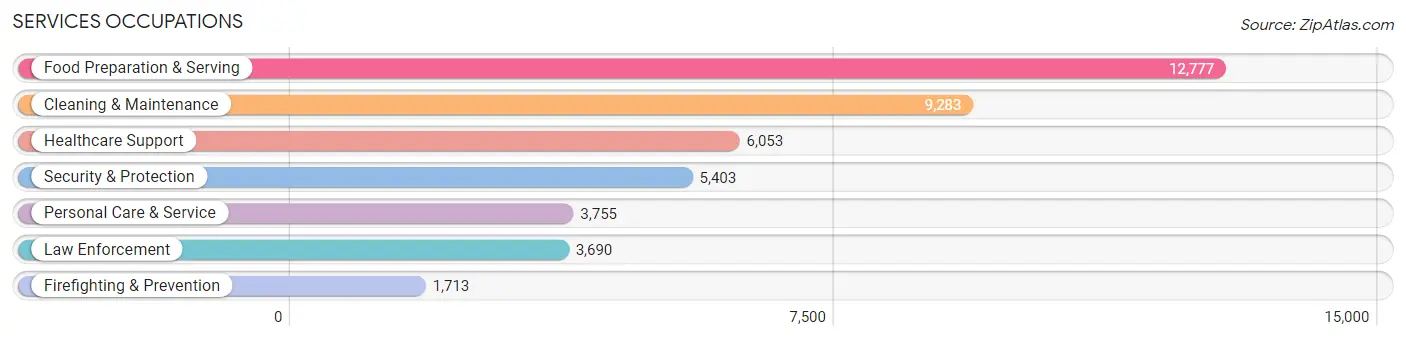
Services Occupations
The most common Services occupations in Area Code 432 are Food Preparation & Serving (12,777 | 5.1%), Cleaning & Maintenance (9,283 | 3.7%), Healthcare Support (6,053 | 2.4%), Security & Protection (5,403 | 2.1%), and Personal Care & Service (3,755 | 1.5%).
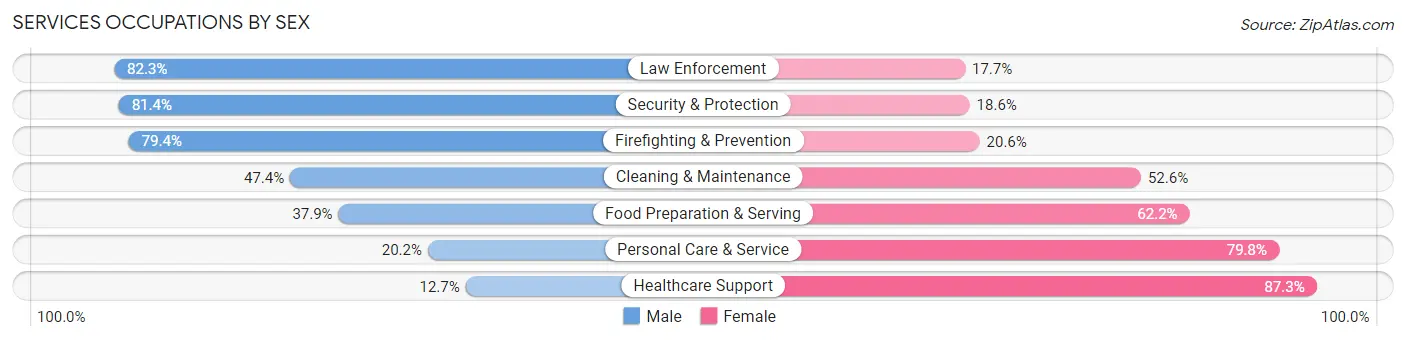
Services Occupations by Sex
Within the Services occupations in Area Code 432, the most male-oriented occupations are Law Enforcement (82.3%), Security & Protection (81.4%), and Firefighting & Prevention (79.4%), while the most female-oriented occupations are Healthcare Support (87.3%), Personal Care & Service (79.8%), and Food Preparation & Serving (62.2%).
| Occupation | Male | Female |
| Healthcare Support | 768 (12.7%) | 5,285 (87.3%) |
| Security & Protection | 4,396 (81.4%) | 1,007 (18.6%) |
| Firefighting & Prevention | 1,360 (79.4%) | 353 (20.6%) |
| Law Enforcement | 3,036 (82.3%) | 654 (17.7%) |
| Food Preparation & Serving | 4,836 (37.9%) | 7,941 (62.2%) |
| Cleaning & Maintenance | 4,404 (47.4%) | 4,879 (52.6%) |
| Personal Care & Service | 757 (20.2%) | 2,998 (79.8%) |
| Total (Category) | 15,161 (40.7%) | 22,110 (59.3%) |
| Total (Overall) | 149,447 (59.2%) | 102,844 (40.8%) |
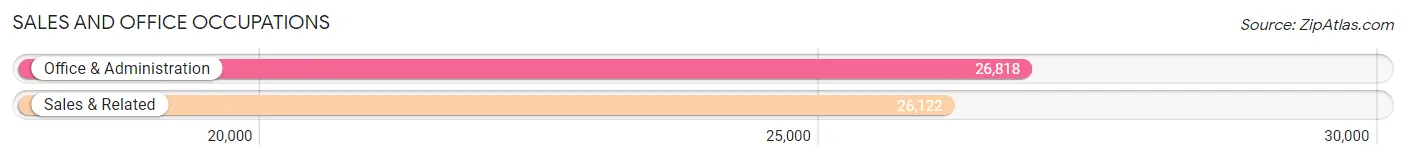
Sales and Office Occupations
The most common Sales and Office occupations in Area Code 432 are Office & Administration (26,818 | 10.6%), and Sales & Related (26,122 | 10.3%).
Sales and Office Occupations by Sex
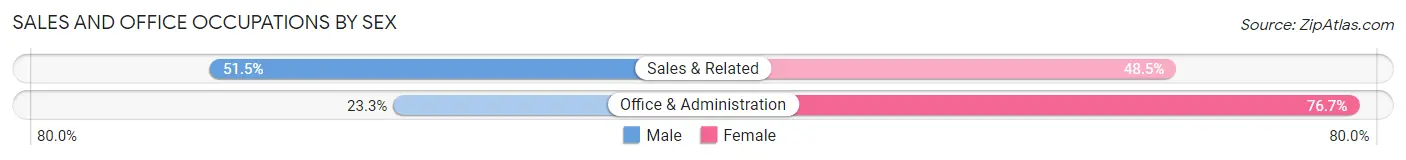
| Occupation | Male | Female |
| Sales & Related | 13,443 (51.5%) | 12,679 (48.5%) |
| Office & Administration | 6,249 (23.3%) | 20,569 (76.7%) |
| Total (Category) | 19,692 (37.2%) | 33,248 (62.8%) |
| Total (Overall) | 149,447 (59.2%) | 102,844 (40.8%) |
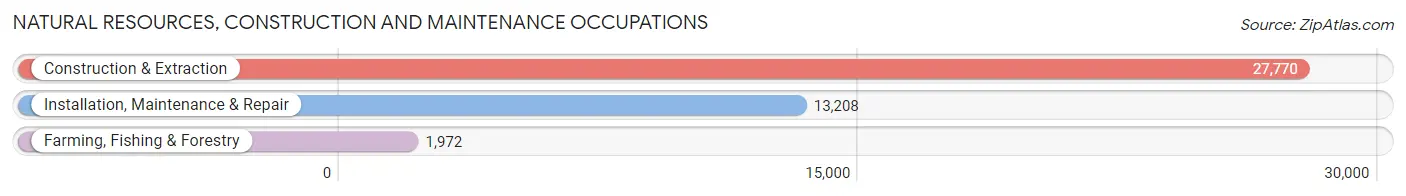
Natural Resources, Construction and Maintenance Occupations
The most common Natural Resources, Construction and Maintenance occupations in Area Code 432 are Construction & Extraction (27,770 | 11.0%), Installation, Maintenance & Repair (13,208 | 5.2%), and Farming, Fishing & Forestry (1,972 | 0.8%).
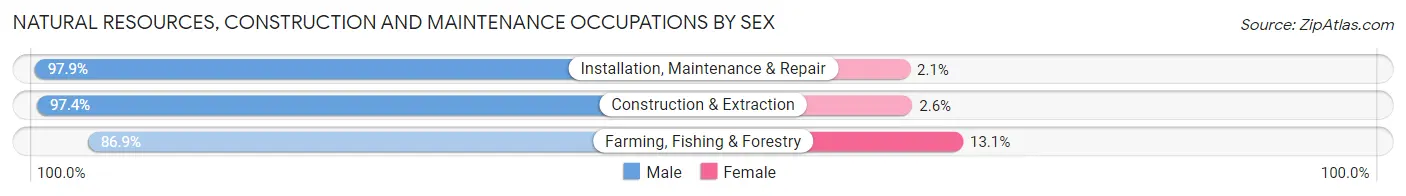
Natural Resources, Construction and Maintenance Occupations by Sex
| Occupation | Male | Female |
| Farming, Fishing & Forestry | 1,713 (86.9%) | 259 (13.1%) |
| Construction & Extraction | 27,054 (97.4%) | 716 (2.6%) |
| Installation, Maintenance & Repair | 12,929 (97.9%) | 279 (2.1%) |
| Total (Category) | 41,696 (97.1%) | 1,254 (2.9%) |
| Total (Overall) | 149,447 (59.2%) | 102,844 (40.8%) |
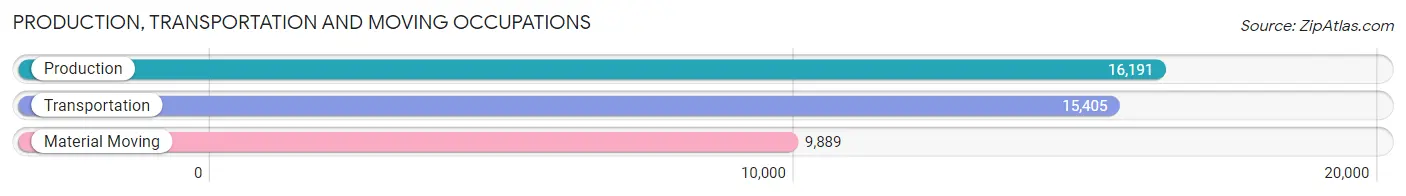
Production, Transportation and Moving Occupations
The most common Production, Transportation and Moving occupations in Area Code 432 are Production (16,191 | 6.4%), Transportation (15,405 | 6.1%), and Material Moving (9,889 | 3.9%).
Production, Transportation and Moving Occupations by Sex
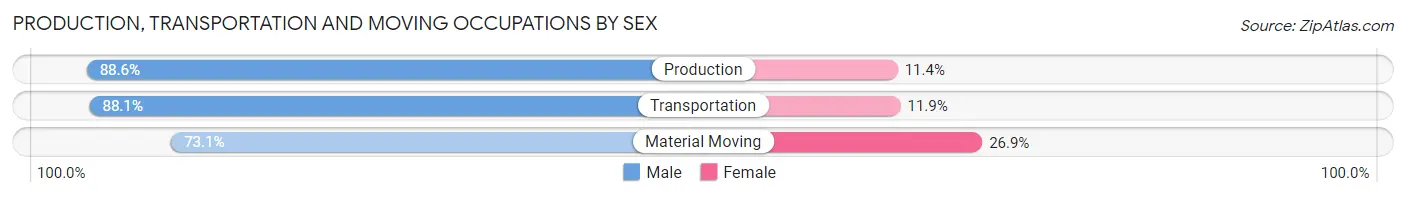
| Occupation | Male | Female |
| Production | 14,344 (88.6%) | 1,847 (11.4%) |
| Transportation | 13,569 (88.1%) | 1,836 (11.9%) |
| Material Moving | 7,228 (73.1%) | 2,661 (26.9%) |
| Total (Category) | 35,141 (84.7%) | 6,344 (15.3%) |
| Total (Overall) | 149,447 (59.2%) | 102,844 (40.8%) |
Employment Industries by Sex in Area Code 432
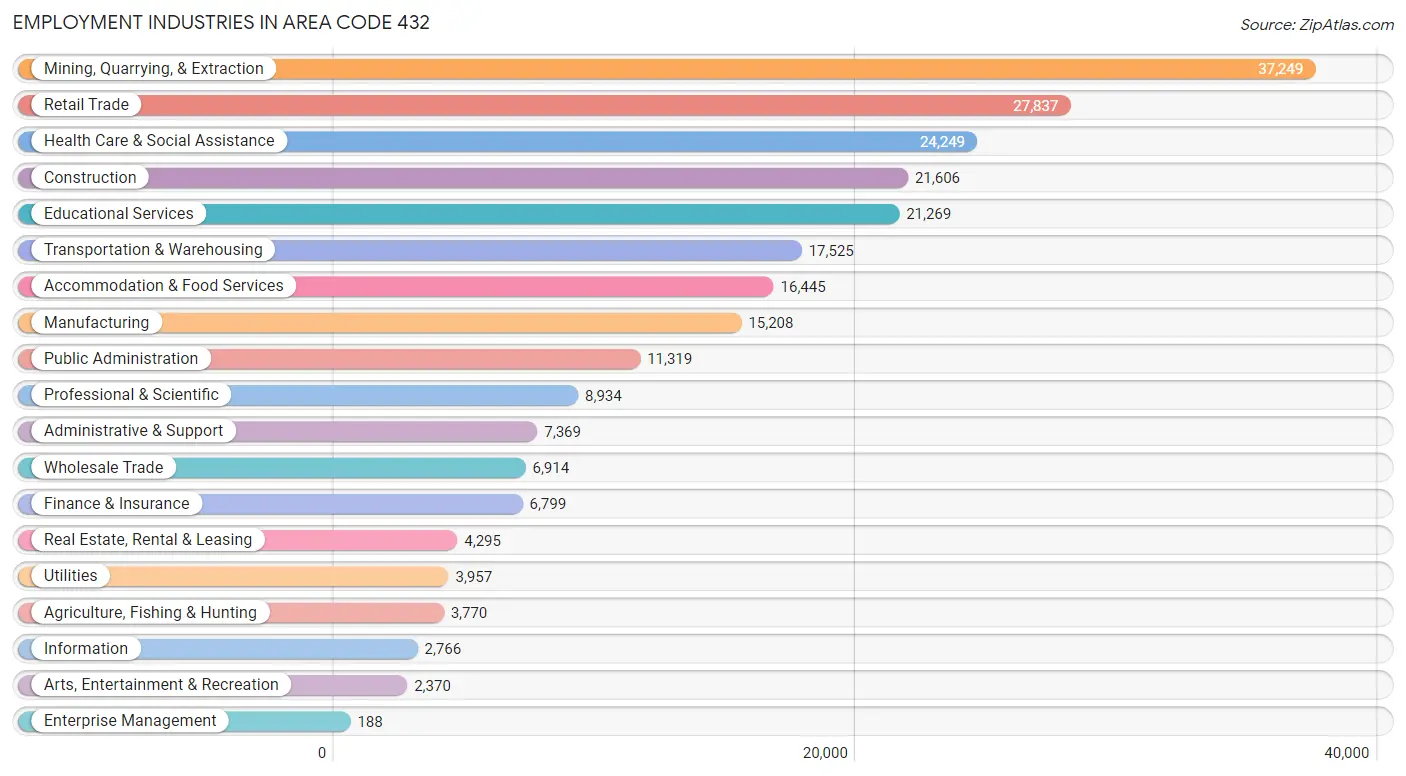
Employment Industries in Area Code 432
The major employment industries in Area Code 432 include Mining, Quarrying, & Extraction (37,249 | 14.8%), Retail Trade (27,837 | 11.0%), Health Care & Social Assistance (24,249 | 9.6%), Construction (21,606 | 8.6%), and Educational Services (21,269 | 8.4%).
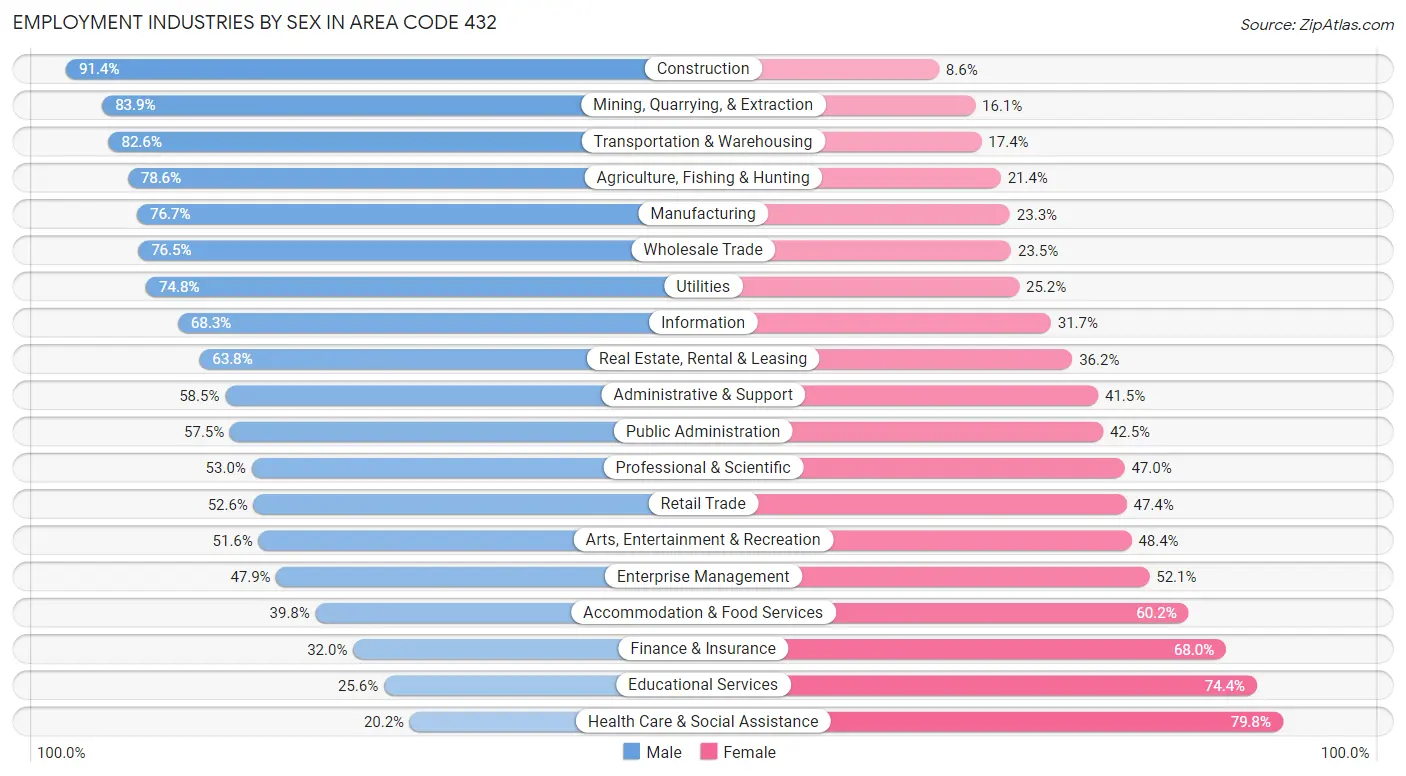
Employment Industries by Sex in Area Code 432
The Area Code 432 industries that see more men than women are Construction (91.4%), Mining, Quarrying, & Extraction (83.9%), and Transportation & Warehousing (82.6%), whereas the industries that tend to have a higher number of women are Health Care & Social Assistance (79.8%), Educational Services (74.4%), and Finance & Insurance (68.0%).
| Industry | Male | Female |
| Agriculture, Fishing & Hunting | 2,964 (78.6%) | 806 (21.4%) |
| Mining, Quarrying, & Extraction | 31,258 (83.9%) | 5,991 (16.1%) |
| Construction | 19,751 (91.4%) | 1,855 (8.6%) |
| Manufacturing | 11,667 (76.7%) | 3,541 (23.3%) |
| Wholesale Trade | 5,288 (76.5%) | 1,626 (23.5%) |
| Retail Trade | 14,636 (52.6%) | 13,201 (47.4%) |
| Transportation & Warehousing | 14,479 (82.6%) | 3,046 (17.4%) |
| Utilities | 2,961 (74.8%) | 996 (25.2%) |
| Information | 1,888 (68.3%) | 878 (31.7%) |
| Finance & Insurance | 2,174 (32.0%) | 4,625 (68.0%) |
| Real Estate, Rental & Leasing | 2,741 (63.8%) | 1,554 (36.2%) |
| Professional & Scientific | 4,735 (53.0%) | 4,199 (47.0%) |
| Enterprise Management | 90 (47.9%) | 98 (52.1%) |
| Administrative & Support | 4,309 (58.5%) | 3,060 (41.5%) |
| Educational Services | 5,444 (25.6%) | 15,825 (74.4%) |
| Health Care & Social Assistance | 4,909 (20.2%) | 19,340 (79.8%) |
| Arts, Entertainment & Recreation | 1,222 (51.6%) | 1,148 (48.4%) |
| Accommodation & Food Services | 6,539 (39.8%) | 9,906 (60.2%) |
| Public Administration | 6,504 (57.5%) | 4,815 (42.5%) |
| Total | 149,447 (59.2%) | 102,844 (40.8%) |
Education in Area Code 432
School Enrollment in Area Code 432
The most common levels of schooling among the 141,168 students in Area Code 432 are elementary school (35,342 | 25.0%), middle school (32,142 | 22.8%), and high school (31,755 | 22.5%).
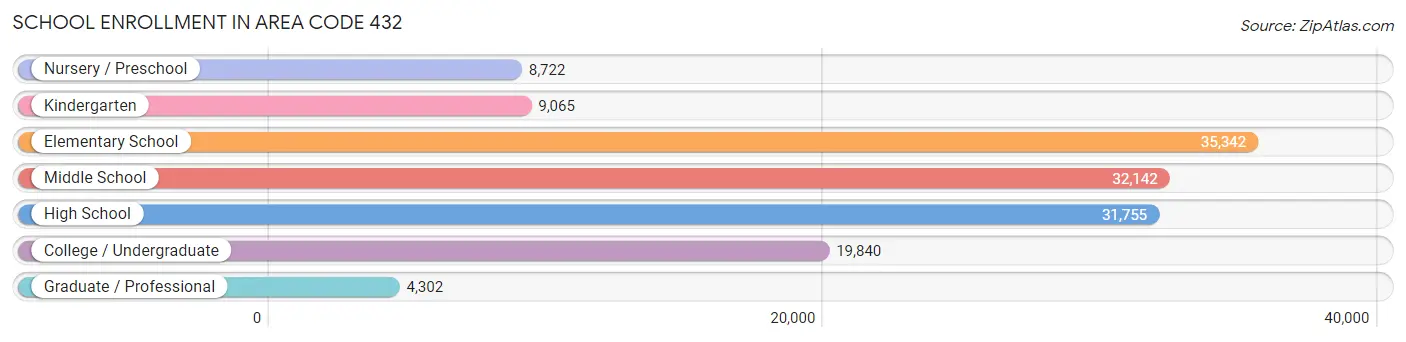
| School Level | # Students | % Students |
| Nursery / Preschool | 8,722 | 6.2% |
| Kindergarten | 9,065 | 6.4% |
| Elementary School | 35,342 | 25.0% |
| Middle School | 32,142 | 22.8% |
| High School | 31,755 | 22.5% |
| College / Undergraduate | 19,840 | 14.1% |
| Graduate / Professional | 4,302 | 3.0% |
| Total | 141,168 | 100.0% |
School Enrollment by Age by Funding Source in Area Code 432
Out of a total of 141,168 students who are enrolled in schools in Area Code 432, 18,034 (12.8%) attend a private institution, while the remaining 123,134 (87.2%) are enrolled in public schools. The age group of 3 to 4 year olds has the highest likelihood of being enrolled in private schools, with 1,715 (28.8% in the age bracket) enrolled. Conversely, the age group of 15 to 17 year olds has the lowest likelihood of being enrolled in a private school, with 21,163 (91.6% in the age bracket) attending a public institution.
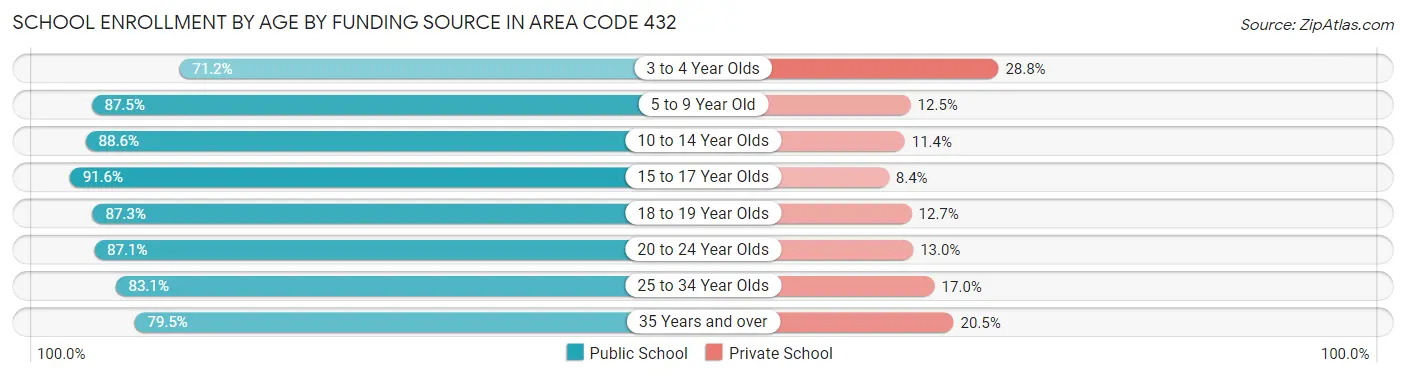
| Age Bracket | Public School | Private School |
| 3 to 4 Year Olds | 4,234 (71.2%) | 1,715 (28.8%) |
| 5 to 9 Year Old | 37,255 (87.5%) | 5,313 (12.5%) |
| 10 to 14 Year Olds | 35,908 (88.6%) | 4,609 (11.4%) |
| 15 to 17 Year Olds | 21,163 (91.6%) | 1,944 (8.4%) |
| 18 to 19 Year Olds | 6,614 (87.3%) | 959 (12.7%) |
| 20 to 24 Year Olds | 7,568 (87.1%) | 1,126 (13.0%) |
| 25 to 34 Year Olds | 5,710 (83.1%) | 1,165 (17.0%) |
| 35 Years and over | 4,681 (79.5%) | 1,204 (20.5%) |
| Total | 123,134 (87.2%) | 18,034 (12.8%) |
Educational Attainment by Field of Study in Area Code 432
Business (14,883 | 20.0%), education (10,742 | 14.4%), science & technology (7,202 | 9.7%), engineering (6,824 | 9.2%), and arts & humanities (6,494 | 8.7%) are the most common fields of study among 74,487 individuals in Area Code 432 who have obtained a bachelor's degree or higher.
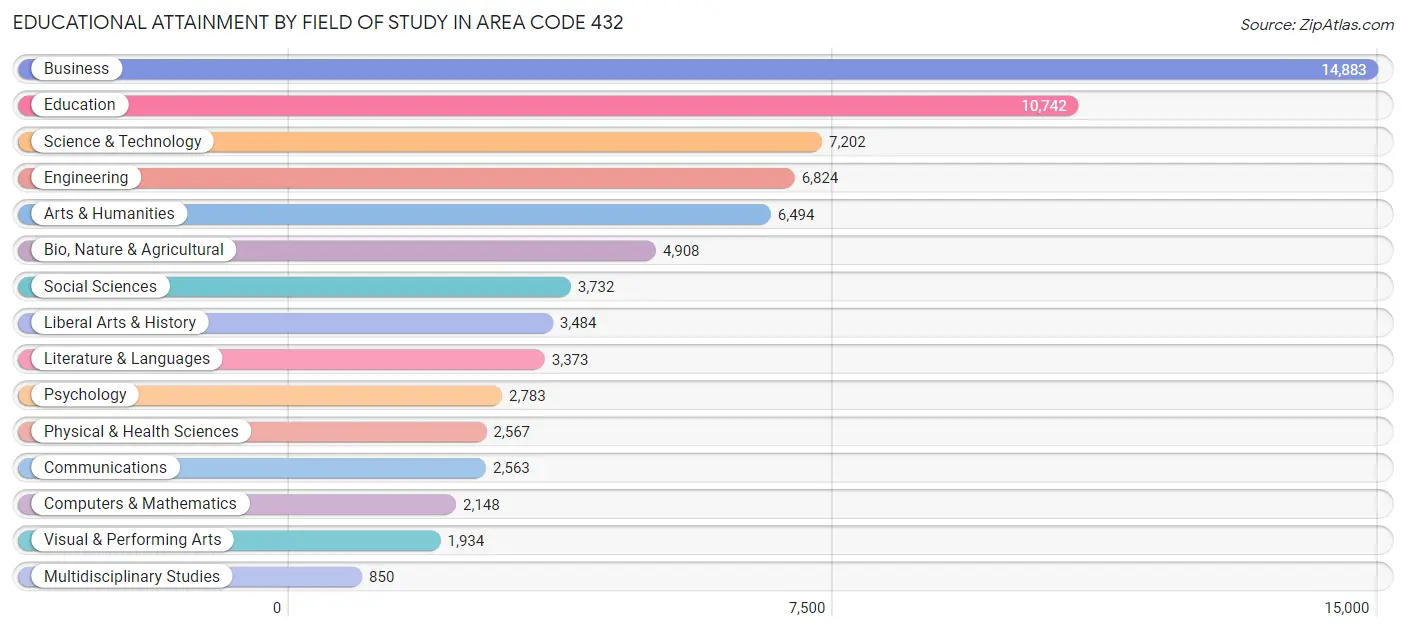
| Field of Study | # Graduates | % Graduates |
| Computers & Mathematics | 2,148 | 2.9% |
| Bio, Nature & Agricultural | 4,908 | 6.6% |
| Physical & Health Sciences | 2,567 | 3.5% |
| Psychology | 2,783 | 3.7% |
| Social Sciences | 3,732 | 5.0% |
| Engineering | 6,824 | 9.2% |
| Multidisciplinary Studies | 850 | 1.1% |
| Science & Technology | 7,202 | 9.7% |
| Business | 14,883 | 20.0% |
| Education | 10,742 | 14.4% |
| Literature & Languages | 3,373 | 4.5% |
| Liberal Arts & History | 3,484 | 4.7% |
| Visual & Performing Arts | 1,934 | 2.6% |
| Communications | 2,563 | 3.4% |
| Arts & Humanities | 6,494 | 8.7% |
| Total | 74,487 | 100.0% |
Transportation & Commute in Area Code 432
Vehicle Availability by Sex in Area Code 432
The most prevalent vehicle ownership categories in Area Code 432 are males with 2 vehicles (60,920, accounting for 41.0%) and females with 2 vehicles (41,446, making up 60.7%).
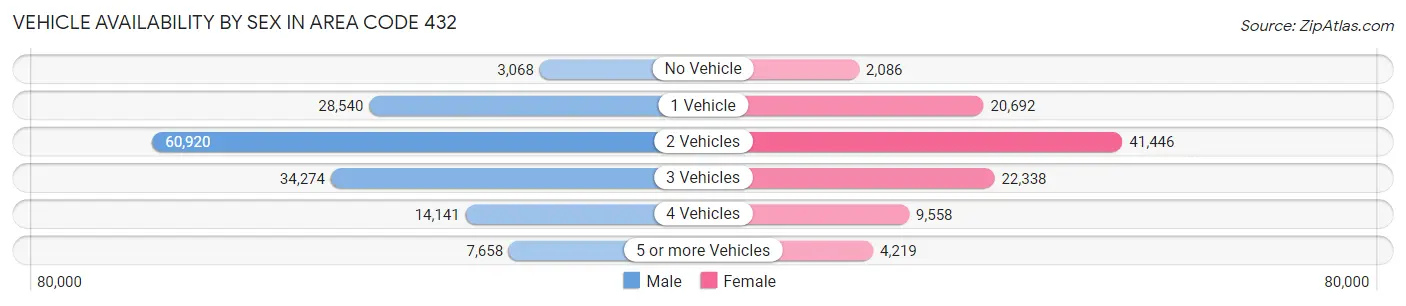
| Vehicles Available | Male | Female |
| No Vehicle | 3,068 (2.1%) | 2,086 (2.1%) |
| 1 Vehicle | 28,540 (19.2%) | 20,692 (20.6%) |
| 2 Vehicles | 60,920 (41.0%) | 41,446 (41.3%) |
| 3 Vehicles | 34,274 (23.1%) | 22,338 (22.3%) |
| 4 Vehicles | 14,141 (9.5%) | 9,558 (9.5%) |
| 5 or more Vehicles | 7,658 (5.1%) | 4,219 (4.2%) |
| Total | 148,601 (100.0%) | 100,339 (100.0%) |
Commute Time in Area Code 432
The most frequently occuring commute durations in Area Code 432 are 10 to 14 minutes (46,122 commuters, 19.3%), 15 to 19 minutes (41,771 commuters, 17.4%), and 5 to 9 minutes (38,048 commuters, 15.9%).
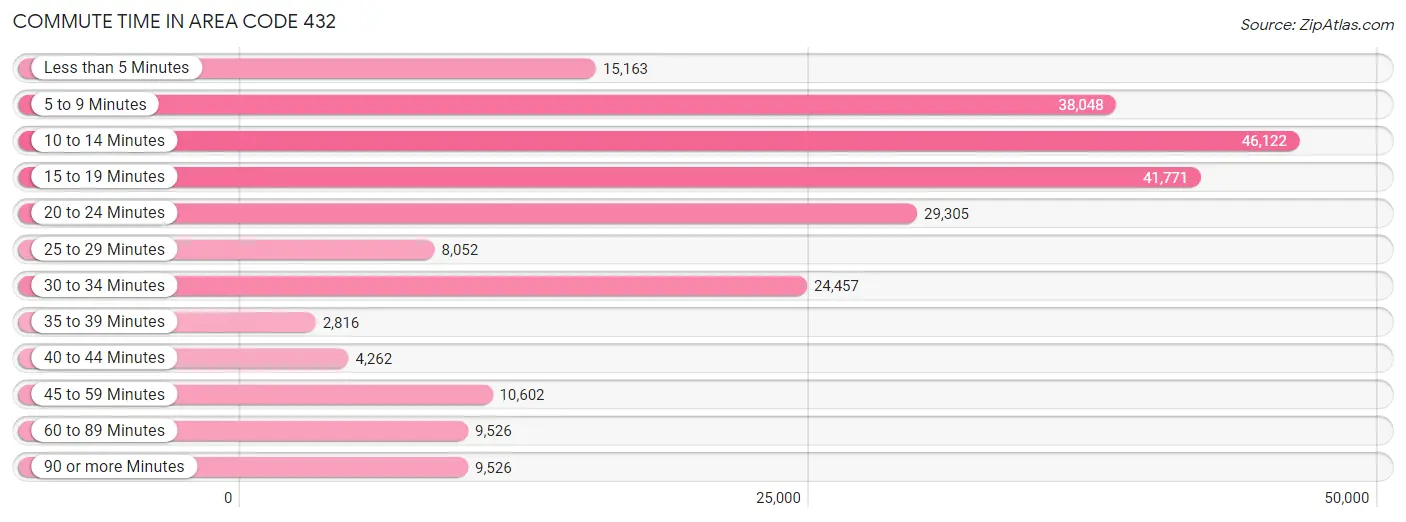
| Commute Time | # Commuters | % Commuters |
| Less than 5 Minutes | 15,163 | 6.3% |
| 5 to 9 Minutes | 38,048 | 15.9% |
| 10 to 14 Minutes | 46,122 | 19.3% |
| 15 to 19 Minutes | 41,771 | 17.4% |
| 20 to 24 Minutes | 29,305 | 12.2% |
| 25 to 29 Minutes | 8,052 | 3.4% |
| 30 to 34 Minutes | 24,457 | 10.2% |
| 35 to 39 Minutes | 2,816 | 1.2% |
| 40 to 44 Minutes | 4,262 | 1.8% |
| 45 to 59 Minutes | 10,602 | 4.4% |
| 60 to 89 Minutes | 9,526 | 4.0% |
| 90 or more Minutes | 9,526 | 4.0% |
Commute Time by Sex in Area Code 432
The most common commute times in Area Code 432 are 10 to 14 minutes (25,494 commuters, 17.7%) for males and 10 to 14 minutes (20,628 commuters, 21.6%) for females.
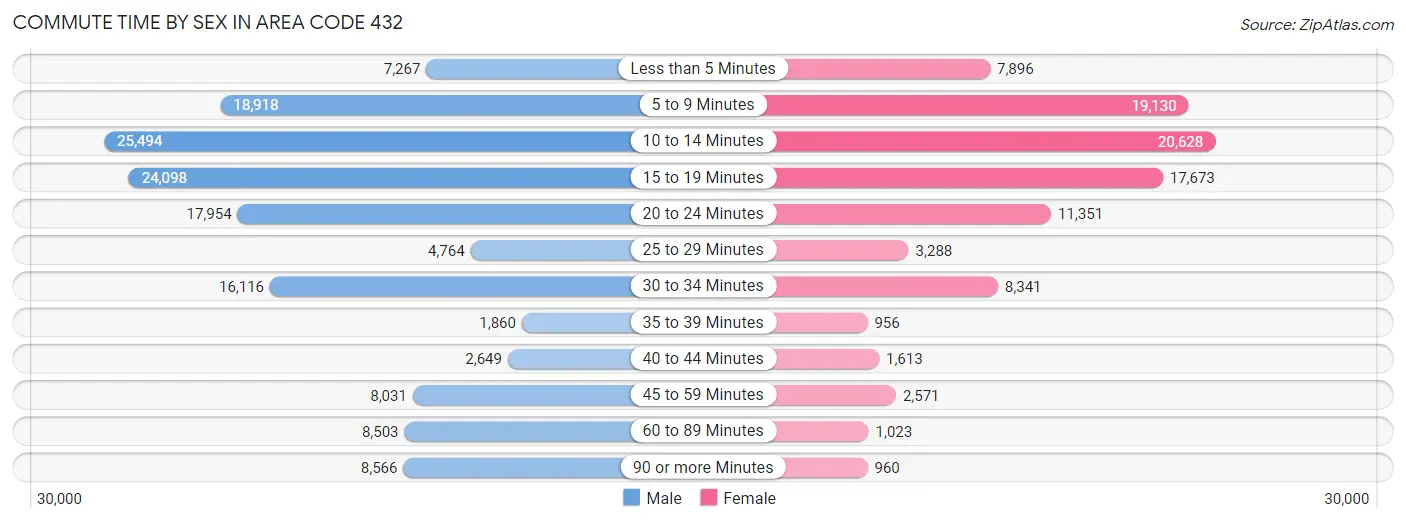
| Commute Time | Male | Female |
| Less than 5 Minutes | 7,267 (5.0%) | 7,896 (8.3%) |
| 5 to 9 Minutes | 18,918 (13.1%) | 19,130 (20.1%) |
| 10 to 14 Minutes | 25,494 (17.7%) | 20,628 (21.6%) |
| 15 to 19 Minutes | 24,098 (16.7%) | 17,673 (18.5%) |
| 20 to 24 Minutes | 17,954 (12.4%) | 11,351 (11.9%) |
| 25 to 29 Minutes | 4,764 (3.3%) | 3,288 (3.5%) |
| 30 to 34 Minutes | 16,116 (11.2%) | 8,341 (8.7%) |
| 35 to 39 Minutes | 1,860 (1.3%) | 956 (1.0%) |
| 40 to 44 Minutes | 2,649 (1.8%) | 1,613 (1.7%) |
| 45 to 59 Minutes | 8,031 (5.6%) | 2,571 (2.7%) |
| 60 to 89 Minutes | 8,503 (5.9%) | 1,023 (1.1%) |
| 90 or more Minutes | 8,566 (5.9%) | 960 (1.0%) |
Time of Departure to Work by Sex in Area Code 432
The most frequent times of departure to work in Area Code 432 are 7:00 AM to 7:29 AM (22,307, 15.5%) for males and 7:30 AM to 7:59 AM (19,556, 20.5%) for females.
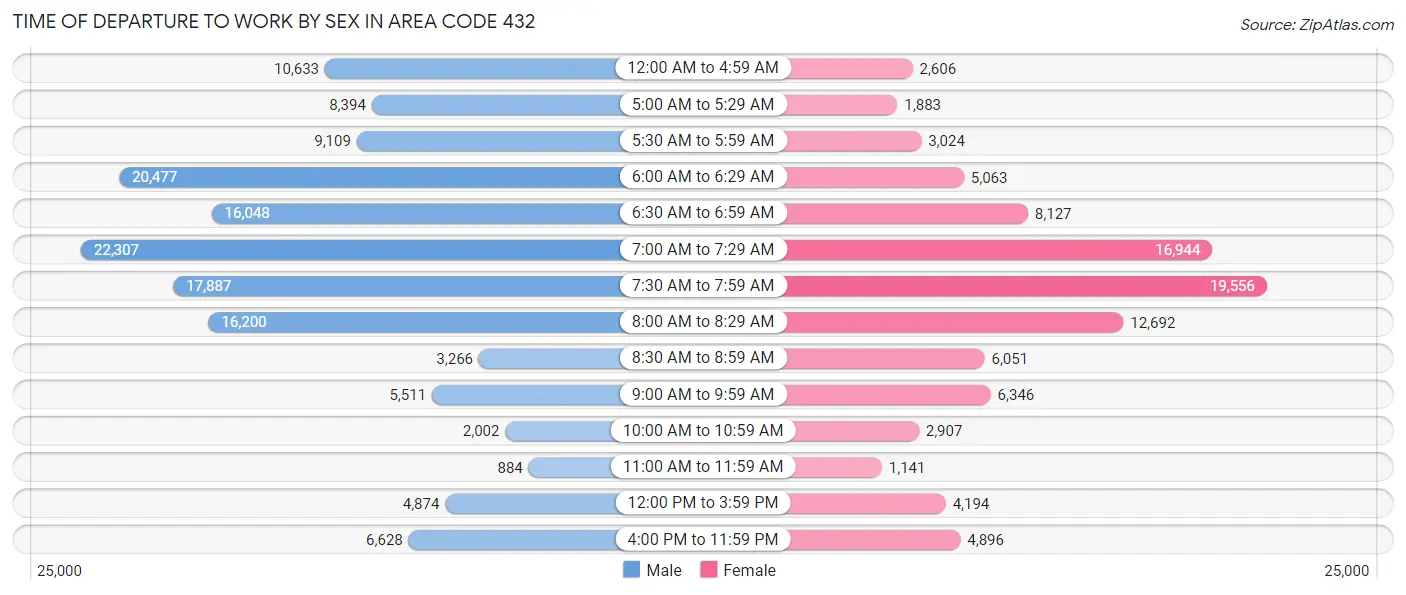
| Time of Departure | Male | Female |
| 12:00 AM to 4:59 AM | 10,633 (7.4%) | 2,606 (2.7%) |
| 5:00 AM to 5:29 AM | 8,394 (5.8%) | 1,883 (2.0%) |
| 5:30 AM to 5:59 AM | 9,109 (6.3%) | 3,024 (3.2%) |
| 6:00 AM to 6:29 AM | 20,477 (14.2%) | 5,063 (5.3%) |
| 6:30 AM to 6:59 AM | 16,048 (11.1%) | 8,127 (8.5%) |
| 7:00 AM to 7:29 AM | 22,307 (15.5%) | 16,944 (17.8%) |
| 7:30 AM to 7:59 AM | 17,887 (12.4%) | 19,556 (20.5%) |
| 8:00 AM to 8:29 AM | 16,200 (11.2%) | 12,692 (13.3%) |
| 8:30 AM to 8:59 AM | 3,266 (2.3%) | 6,051 (6.3%) |
| 9:00 AM to 9:59 AM | 5,511 (3.8%) | 6,346 (6.7%) |
| 10:00 AM to 10:59 AM | 2,002 (1.4%) | 2,907 (3.0%) |
| 11:00 AM to 11:59 AM | 884 (0.6%) | 1,141 (1.2%) |
| 12:00 PM to 3:59 PM | 4,874 (3.4%) | 4,194 (4.4%) |
| 4:00 PM to 11:59 PM | 6,628 (4.6%) | 4,896 (5.1%) |
| Total | 144,220 (100.0%) | 95,430 (100.0%) |
Housing Occupancy in Area Code 432
Occupancy by Ownership in Area Code 432
Of the total 201,162 dwellings in Area Code 432, owner-occupied units account for 136,398 (67.8%), while renter-occupied units make up 64,764 (32.2%).
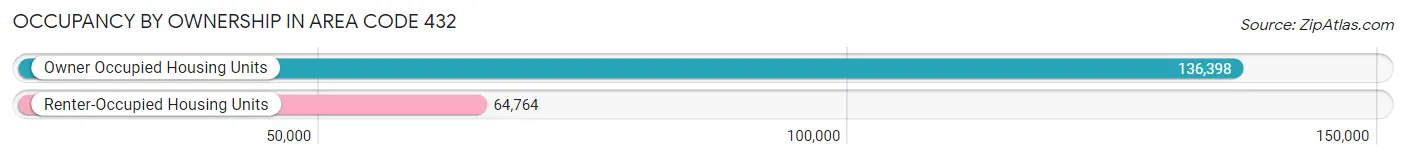
| Occupancy | # Housing Units | % Housing Units |
| Owner Occupied Housing Units | 136,398 | 67.8% |
| Renter-Occupied Housing Units | 64,764 | 32.2% |
| Total Occupied Housing Units | 201,162 | 100.0% |
Occupancy by Household Size in Area Code 432
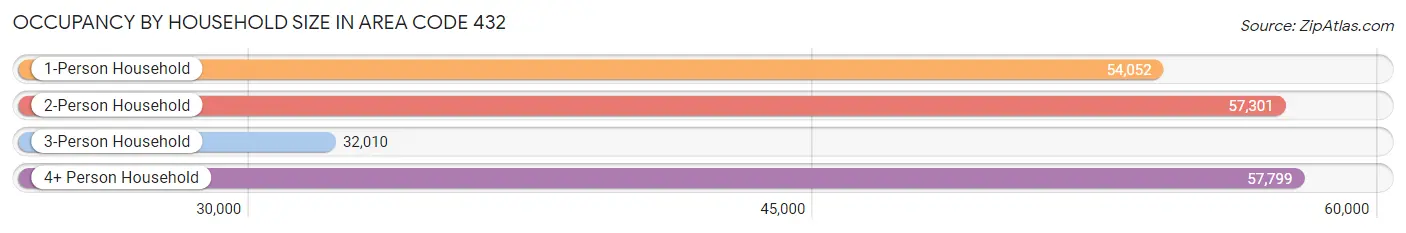
| Household Size | # Housing Units | % Housing Units |
| 1-Person Household | 54,052 | 26.9% |
| 2-Person Household | 57,301 | 28.5% |
| 3-Person Household | 32,010 | 15.9% |
| 4+ Person Household | 57,799 | 28.7% |
| Total Housing Units | 201,162 | 100.0% |
Occupancy by Ownership by Household Size in Area Code 432
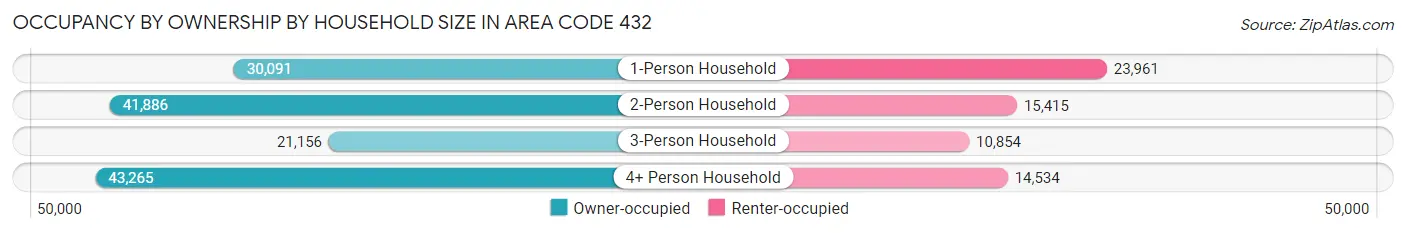
| Household Size | Owner-occupied | Renter-occupied |
| 1-Person Household | 30,091 (55.7%) | 23,961 (44.3%) |
| 2-Person Household | 41,886 (73.1%) | 15,415 (26.9%) |
| 3-Person Household | 21,156 (66.1%) | 10,854 (33.9%) |
| 4+ Person Household | 43,265 (74.9%) | 14,534 (25.2%) |
| Total Housing Units | 136,398 (67.8%) | 64,764 (32.2%) |
Occupancy by Educational Attainment in Area Code 432
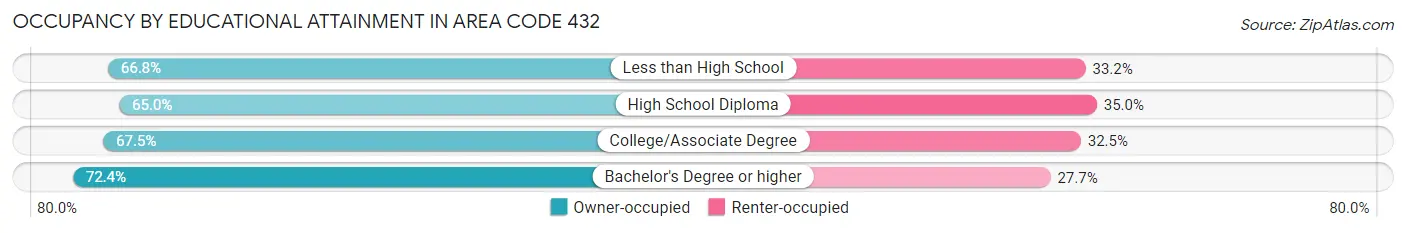
| Household Size | Owner-occupied | Renter-occupied |
| Less than High School | 26,011 (66.8%) | 12,931 (33.2%) |
| High School Diploma | 34,588 (65.0%) | 18,619 (35.0%) |
| College/Associate Degree | 43,167 (67.5%) | 20,746 (32.5%) |
| Bachelor's Degree or higher | 32,632 (72.4%) | 12,468 (27.7%) |
Occupancy by Age of Householder in Area Code 432
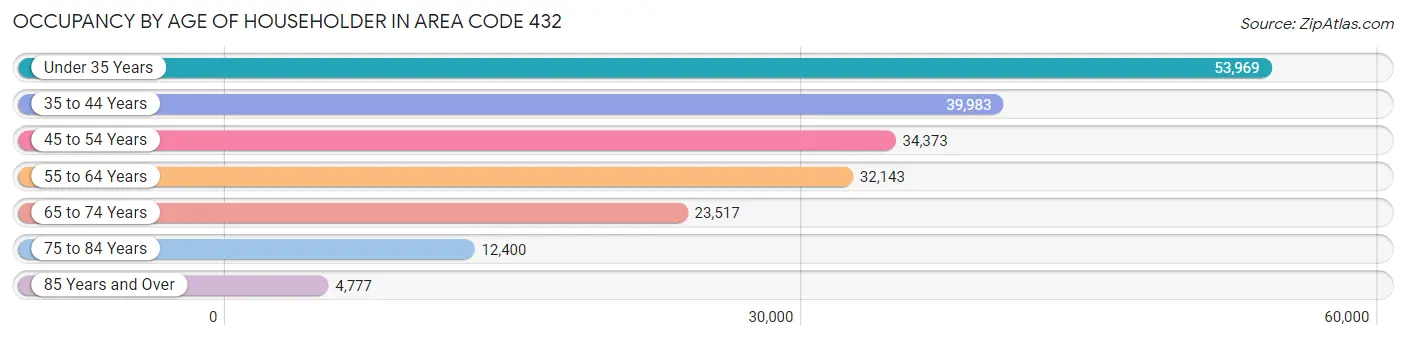
| Age Bracket | # Households | % Households |
| Under 35 Years | 53,969 | 26.8% |
| 35 to 44 Years | 39,983 | 19.9% |
| 45 to 54 Years | 34,373 | 17.1% |
| 55 to 64 Years | 32,143 | 16.0% |
| 65 to 74 Years | 23,517 | 11.7% |
| 75 to 84 Years | 12,400 | 6.2% |
| 85 Years and Over | 4,777 | 2.4% |
| Total | 201,162 | 100.0% |
Housing Finances in Area Code 432
Median Income by Occupancy in Area Code 432
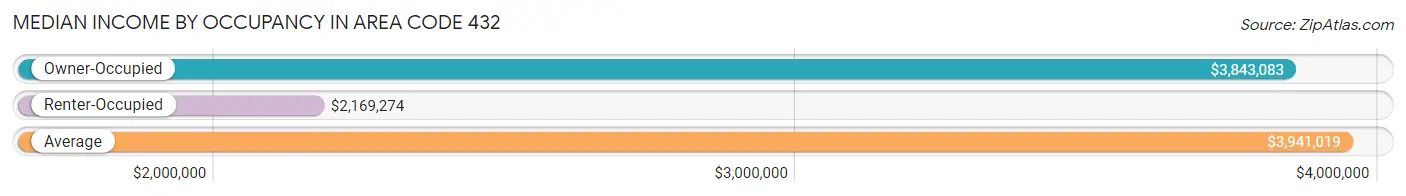
| Occupancy Type | # Households | Median Income |
| Owner-Occupied | 136,398 (67.8%) | $3,843,083 |
| Renter-Occupied | 64,764 (32.2%) | $2,169,274 |
| Average | 201,162 (100.0%) | $3,941,019 |
Occupancy by Householder Income Bracket in Area Code 432
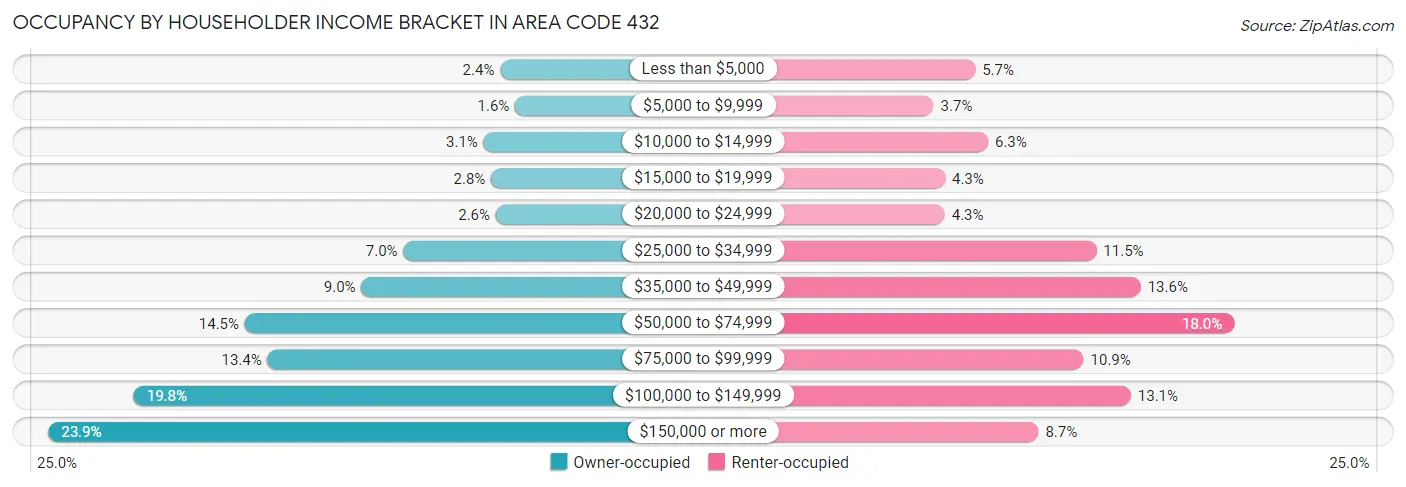
| Income Bracket | Owner-occupied | Renter-occupied |
| Less than $5,000 | 3,200 (2.4%) | 3,694 (5.7%) |
| $5,000 to $9,999 | 2,231 (1.6%) | 2,412 (3.7%) |
| $10,000 to $14,999 | 4,287 (3.1%) | 4,085 (6.3%) |
| $15,000 to $19,999 | 3,796 (2.8%) | 2,758 (4.3%) |
| $20,000 to $24,999 | 3,485 (2.6%) | 2,755 (4.3%) |
| $25,000 to $34,999 | 9,488 (7.0%) | 7,431 (11.5%) |
| $35,000 to $49,999 | 12,226 (9.0%) | 8,796 (13.6%) |
| $50,000 to $74,999 | 19,797 (14.5%) | 11,669 (18.0%) |
| $75,000 to $99,999 | 18,319 (13.4%) | 7,032 (10.9%) |
| $100,000 to $149,999 | 27,005 (19.8%) | 8,488 (13.1%) |
| $150,000 or more | 32,564 (23.9%) | 5,644 (8.7%) |
| Total | 136,398 (100.0%) | 64,764 (100.0%) |
Monthly Housing Cost Tiers in Area Code 432
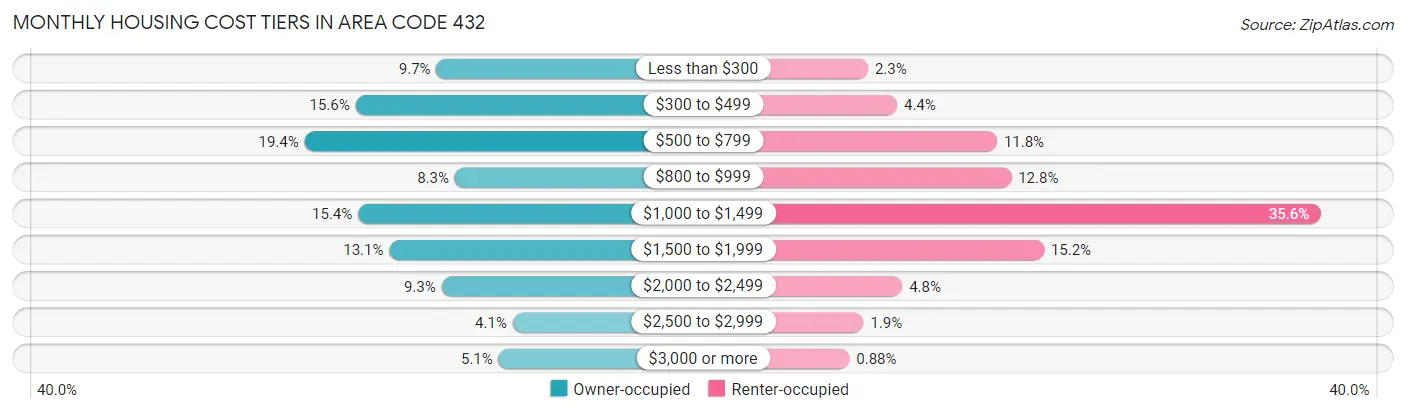
| Monthly Cost | Owner-occupied | Renter-occupied |
| Less than $300 | 13,192 (9.7%) | 1,460 (2.2%) |
| $300 to $499 | 21,317 (15.6%) | 2,840 (4.4%) |
| $500 to $799 | 26,440 (19.4%) | 7,613 (11.7%) |
| $800 to $999 | 11,329 (8.3%) | 8,287 (12.8%) |
| $1,000 to $1,499 | 21,057 (15.4%) | 23,062 (35.6%) |
| $1,500 to $1,999 | 17,917 (13.1%) | 9,853 (15.2%) |
| $2,000 to $2,499 | 12,678 (9.3%) | 3,092 (4.8%) |
| $2,500 to $2,999 | 5,519 (4.1%) | 1,244 (1.9%) |
| $3,000 or more | 6,949 (5.1%) | 572 (0.9%) |
| Total | 136,398 (100.0%) | 64,764 (100.0%) |
Physical Housing Characteristics in Area Code 432
Housing Structures in Area Code 432
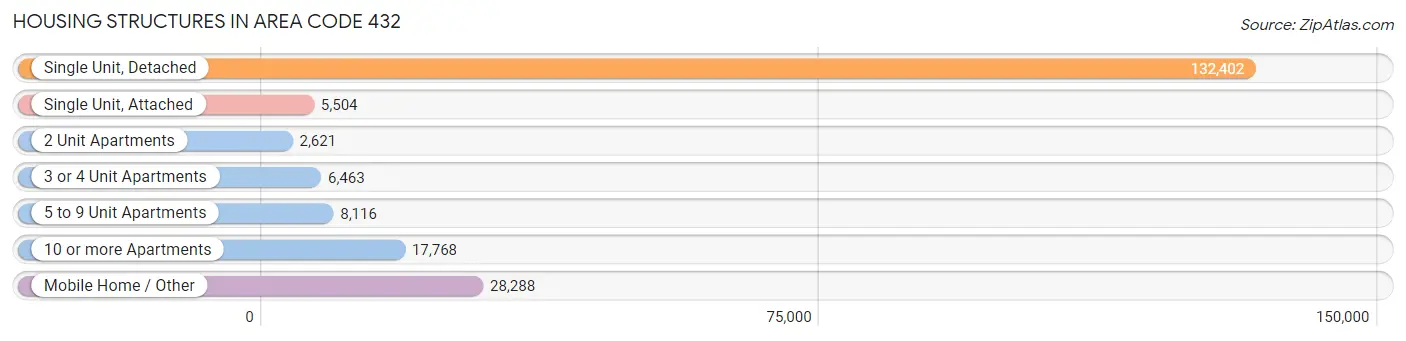
| Structure Type | # Housing Units | % Housing Units |
| Single Unit, Detached | 132,402 | 65.8% |
| Single Unit, Attached | 5,504 | 2.7% |
| 2 Unit Apartments | 2,621 | 1.3% |
| 3 or 4 Unit Apartments | 6,463 | 3.2% |
| 5 to 9 Unit Apartments | 8,116 | 4.0% |
| 10 or more Apartments | 17,768 | 8.8% |
| Mobile Home / Other | 28,288 | 14.1% |
| Total | 201,162 | 100.0% |
Housing Structures by Occupancy in Area Code 432
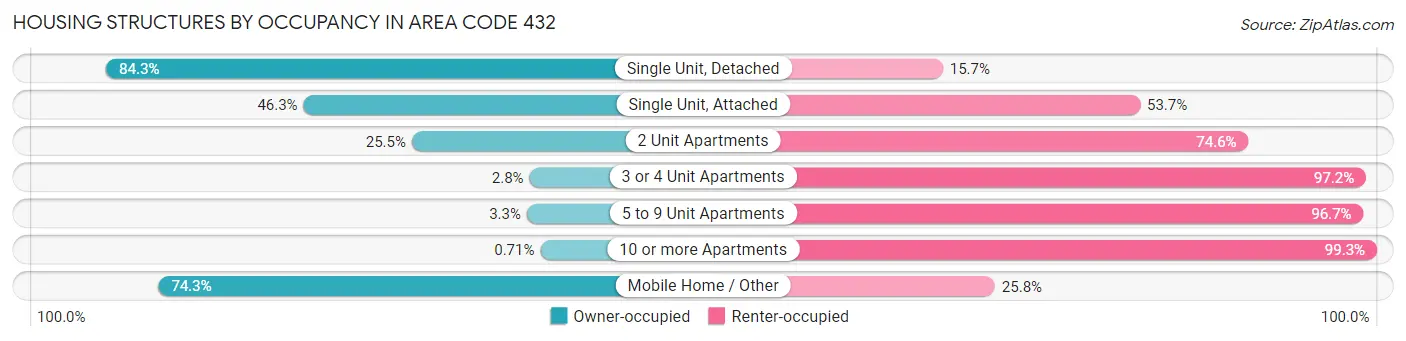
| Structure Type | Owner-occupied | Renter-occupied |
| Single Unit, Detached | 111,603 (84.3%) | 20,799 (15.7%) |
| Single Unit, Attached | 2,549 (46.3%) | 2,955 (53.7%) |
| 2 Unit Apartments | 667 (25.5%) | 1,954 (74.6%) |
| 3 or 4 Unit Apartments | 181 (2.8%) | 6,282 (97.2%) |
| 5 to 9 Unit Apartments | 268 (3.3%) | 7,848 (96.7%) |
| 10 or more Apartments | 127 (0.7%) | 17,641 (99.3%) |
| Mobile Home / Other | 21,003 (74.3%) | 7,285 (25.8%) |
| Total | 136,398 (67.8%) | 64,764 (32.2%) |
Housing Structures by Number of Rooms in Area Code 432
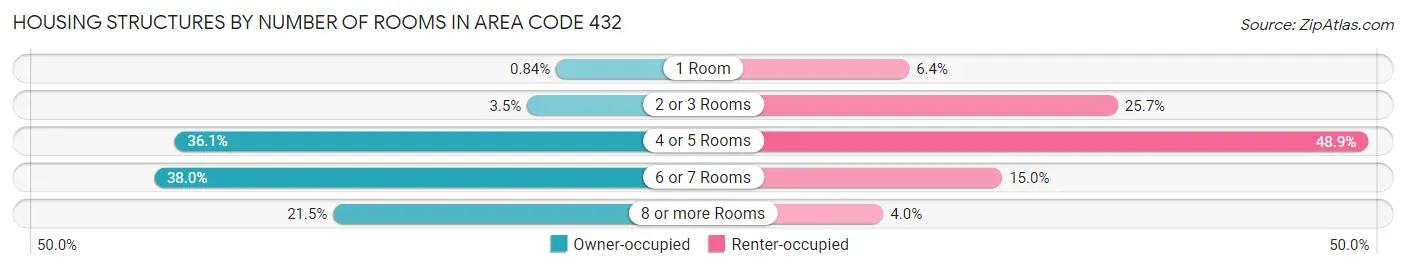
| Number of Rooms | Owner-occupied | Renter-occupied |
| 1 Room | 1,145 (0.8%) | 4,150 (6.4%) |
| 2 or 3 Rooms | 4,805 (3.5%) | 16,652 (25.7%) |
| 4 or 5 Rooms | 49,296 (36.1%) | 31,639 (48.8%) |
| 6 or 7 Rooms | 51,877 (38.0%) | 9,722 (15.0%) |
| 8 or more Rooms | 29,275 (21.5%) | 2,601 (4.0%) |
| Total | 136,398 (100.0%) | 64,764 (100.0%) |
Housing Structure by Heating Type in Area Code 432
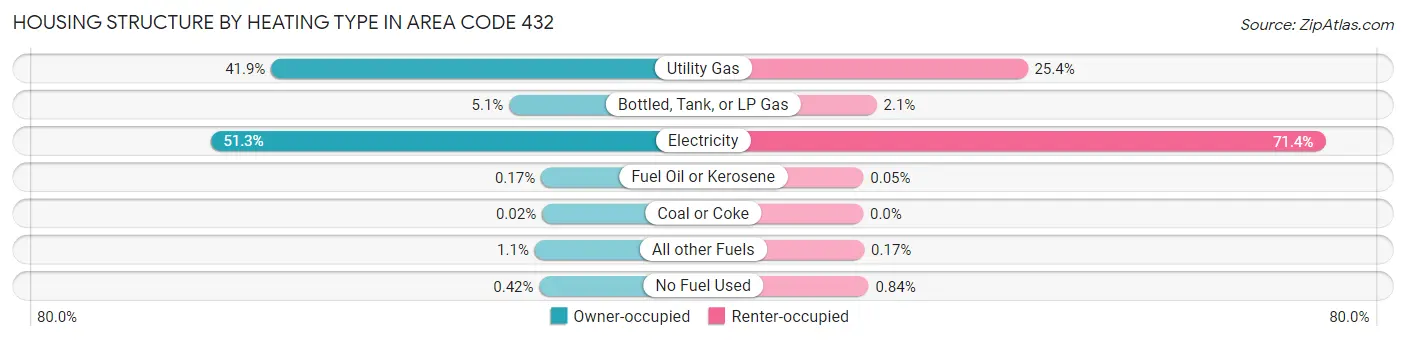
| Heating Type | Owner-occupied | Renter-occupied |
| Utility Gas | 57,120 (41.9%) | 16,461 (25.4%) |
| Bottled, Tank, or LP Gas | 6,945 (5.1%) | 1,358 (2.1%) |
| Electricity | 69,949 (51.3%) | 46,265 (71.4%) |
| Fuel Oil or Kerosene | 228 (0.2%) | 30 (0.1%) |
| Coal or Coke | 34 (0.0%) | 0 (0.0%) |
| All other Fuels | 1,555 (1.1%) | 109 (0.2%) |
| No Fuel Used | 567 (0.4%) | 541 (0.8%) |
| Total | 136,398 (100.0%) | 64,764 (100.0%) |
Household Vehicle Usage in Area Code 432
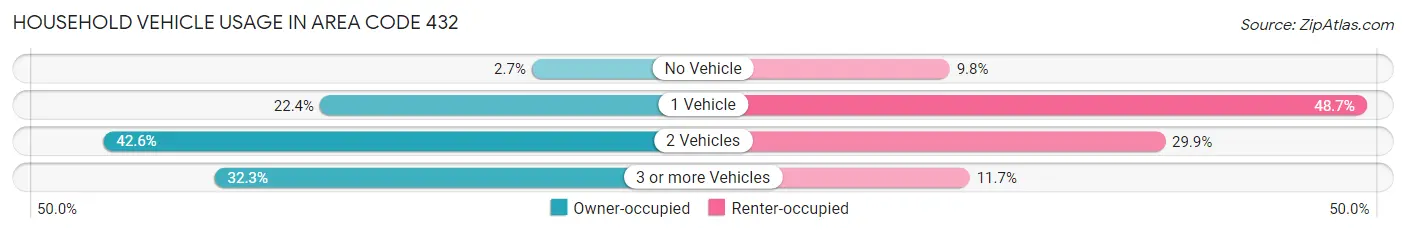
| Vehicles per Household | Owner-occupied | Renter-occupied |
| No Vehicle | 3,634 (2.7%) | 6,335 (9.8%) |
| 1 Vehicle | 30,611 (22.4%) | 31,534 (48.7%) |
| 2 Vehicles | 58,157 (42.6%) | 19,352 (29.9%) |
| 3 or more Vehicles | 43,996 (32.3%) | 7,543 (11.7%) |
| Total | 136,398 (100.0%) | 64,764 (100.0%) |
Real Estate & Mortgages in Area Code 432
Real Estate and Mortgage Overview in Area Code 432
| Characteristic | Without Mortgage | With Mortgage |
| Housing Units | 73,419 | 62,979 |
| Median Property Value | $7,234,100 | $7,900,500 |
| Median Household Income | $3,169,331 | $19,984 |
| Monthly Housing Costs | $28,378 | $6,672 |
| Real Estate Taxes | $75,490 | $2,932 |
Property Value by Mortgage Status in Area Code 432
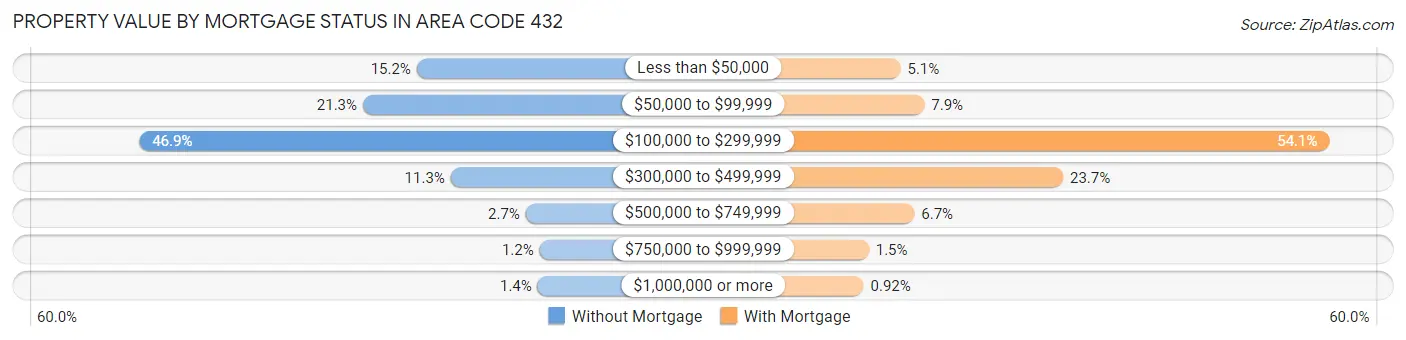
| Property Value | Without Mortgage | With Mortgage |
| Less than $50,000 | 11,154 (15.2%) | 3,237 (5.1%) |
| $50,000 to $99,999 | 15,666 (21.3%) | 4,948 (7.9%) |
| $100,000 to $299,999 | 34,437 (46.9%) | 34,095 (54.1%) |
| $300,000 to $499,999 | 8,306 (11.3%) | 14,934 (23.7%) |
| $500,000 to $749,999 | 2,001 (2.7%) | 4,235 (6.7%) |
| $750,000 to $999,999 | 846 (1.1%) | 949 (1.5%) |
| $1,000,000 or more | 1,009 (1.4%) | 581 (0.9%) |
| Total | 73,419 (100.0%) | 62,979 (100.0%) |
Household Income by Mortgage Status in Area Code 432
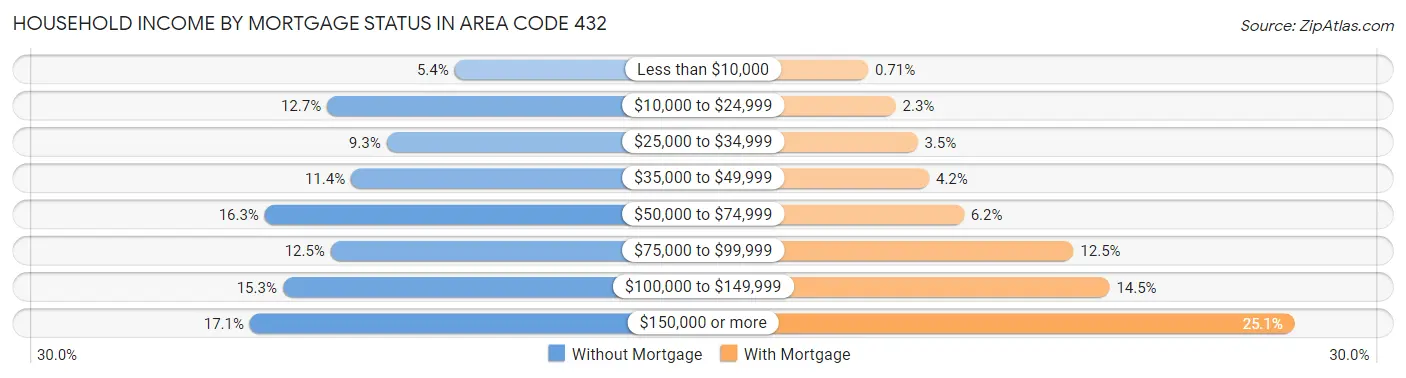
| Household Income | Without Mortgage | With Mortgage |
| Less than $10,000 | 3,988 (5.4%) | 446 (0.7%) |
| $10,000 to $24,999 | 9,341 (12.7%) | 1,443 (2.3%) |
| $25,000 to $34,999 | 6,841 (9.3%) | 2,227 (3.5%) |
| $35,000 to $49,999 | 8,336 (11.4%) | 2,647 (4.2%) |
| $50,000 to $74,999 | 11,954 (16.3%) | 3,890 (6.2%) |
| $75,000 to $99,999 | 9,182 (12.5%) | 7,843 (12.4%) |
| $100,000 to $149,999 | 11,197 (15.2%) | 9,137 (14.5%) |
| $150,000 or more | 12,580 (17.1%) | 15,808 (25.1%) |
| Total | 73,419 (100.0%) | 62,979 (100.0%) |
Property Value to Household Income Ratio in Area Code 432
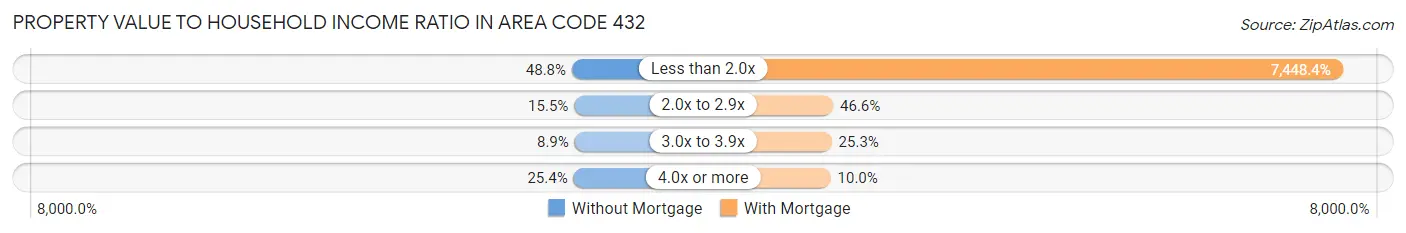
| Value-to-Income Ratio | Without Mortgage | With Mortgage |
| Less than 2.0x | 35,842 (48.8%) | 4,690,918 (7,448.4%) |
| 2.0x to 2.9x | 11,386 (15.5%) | 29,320 (46.6%) |
| 3.0x to 3.9x | 6,527 (8.9%) | 15,906 (25.3%) |
| 4.0x or more | 18,681 (25.4%) | 6,308 (10.0%) |
| Total | 73,419 (100.0%) | 62,979 (100.0%) |
Real Estate Taxes by Mortgage Status in Area Code 432
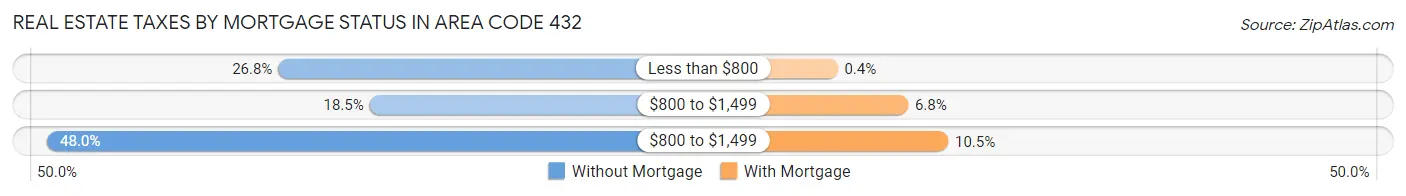
| Property Taxes | Without Mortgage | With Mortgage |
| Less than $800 | 19,709 (26.8%) | 250 (0.4%) |
| $800 to $1,499 | 13,579 (18.5%) | 4,306 (6.8%) |
| $800 to $1,499 | 35,204 (47.9%) | 6,613 (10.5%) |
| Total | 73,419 (100.0%) | 62,979 (100.0%) |
Health & Disability in Area Code 432
Health Insurance Coverage by Age in Area Code 432
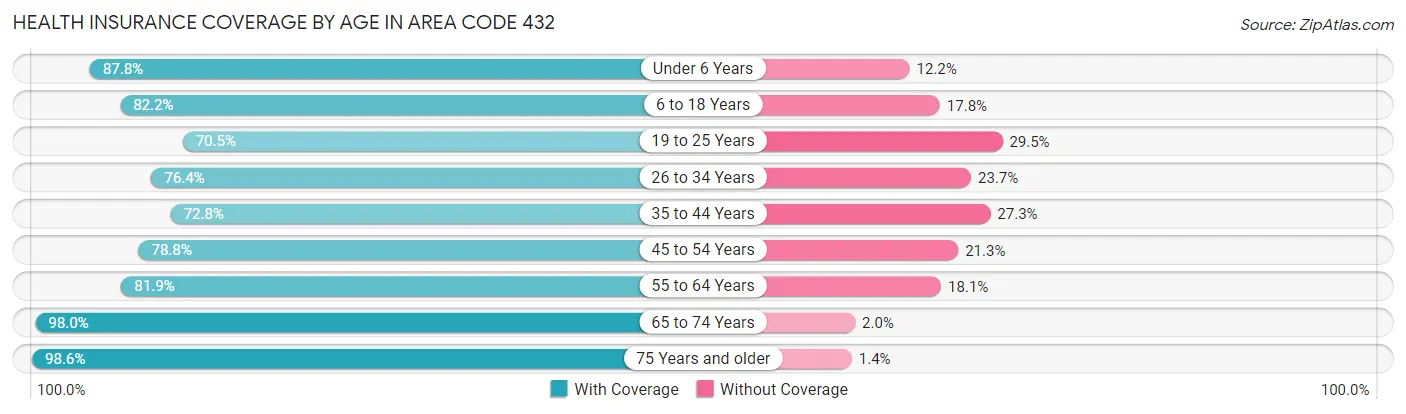
| Age Bracket | With Coverage | Without Coverage |
| Under 6 Years | 46,465 (87.8%) | 6,447 (12.2%) |
| 6 to 18 Years | 88,751 (82.2%) | 19,256 (17.8%) |
| 19 to 25 Years | 35,439 (70.5%) | 14,819 (29.5%) |
| 26 to 34 Years | 56,155 (76.3%) | 17,398 (23.6%) |
| 35 to 44 Years | 52,695 (72.8%) | 19,740 (27.3%) |
| 45 to 54 Years | 46,053 (78.7%) | 12,426 (21.2%) |
| 55 to 64 Years | 43,861 (81.9%) | 9,665 (18.1%) |
| 65 to 74 Years | 36,233 (98.0%) | 747 (2.0%) |
| 75 Years and older | 22,830 (98.6%) | 326 (1.4%) |
| Total | 428,482 (80.9%) | 100,824 (19.1%) |
Health Insurance Coverage by Citizenship Status in Area Code 432
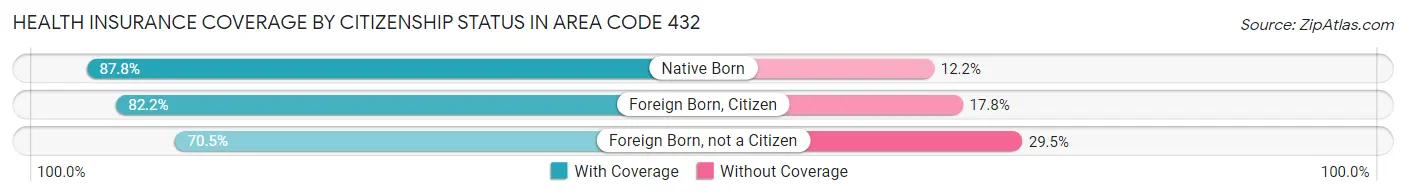
| Citizenship Status | With Coverage | Without Coverage |
| Native Born | 46,465 (87.8%) | 6,447 (12.2%) |
| Foreign Born, Citizen | 88,751 (82.2%) | 19,256 (17.8%) |
| Foreign Born, not a Citizen | 35,439 (70.5%) | 14,819 (29.5%) |
Health Insurance Coverage by Household Income in Area Code 432
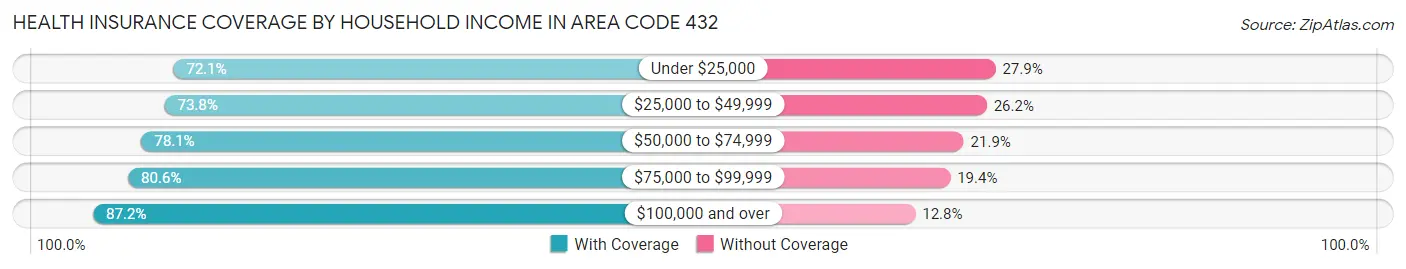
| Household Income | With Coverage | Without Coverage |
| Under $25,000 | 43,963 (72.1%) | 16,978 (27.9%) |
| $25,000 to $49,999 | 64,207 (73.8%) | 22,813 (26.2%) |
| $50,000 to $74,999 | 61,919 (78.1%) | 17,355 (21.9%) |
| $75,000 to $99,999 | 56,811 (80.6%) | 13,660 (19.4%) |
| $100,000 and over | 199,850 (87.2%) | 29,416 (12.8%) |
Public vs Private Health Insurance Coverage by Age in Area Code 432
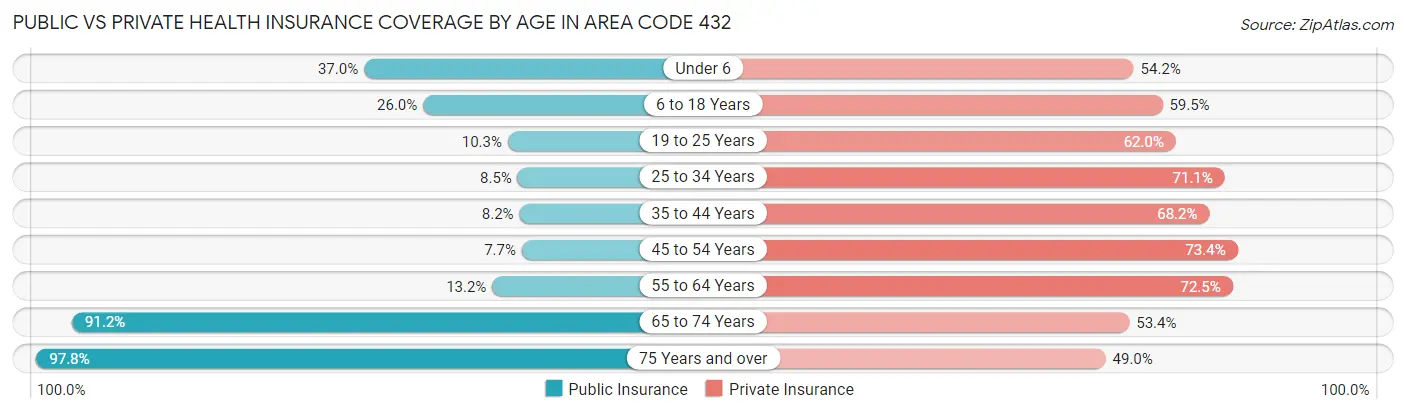
| Age Bracket | Public Insurance | Private Insurance |
| Under 6 | 19,579 (37.0%) | 28,663 (54.2%) |
| 6 to 18 Years | 28,119 (26.0%) | 64,284 (59.5%) |
| 19 to 25 Years | 5,180 (10.3%) | 31,150 (62.0%) |
| 25 to 34 Years | 6,237 (8.5%) | 52,263 (71.1%) |
| 35 to 44 Years | 5,908 (8.2%) | 49,406 (68.2%) |
| 45 to 54 Years | 4,507 (7.7%) | 42,949 (73.4%) |
| 55 to 64 Years | 7,071 (13.2%) | 38,816 (72.5%) |
| 65 to 74 Years | 33,729 (91.2%) | 19,732 (53.4%) |
| 75 Years and over | 22,649 (97.8%) | 11,340 (49.0%) |
| Total | 132,979 (25.1%) | 338,603 (64.0%) |
Disability Status by Sex by Age in Area Code 432
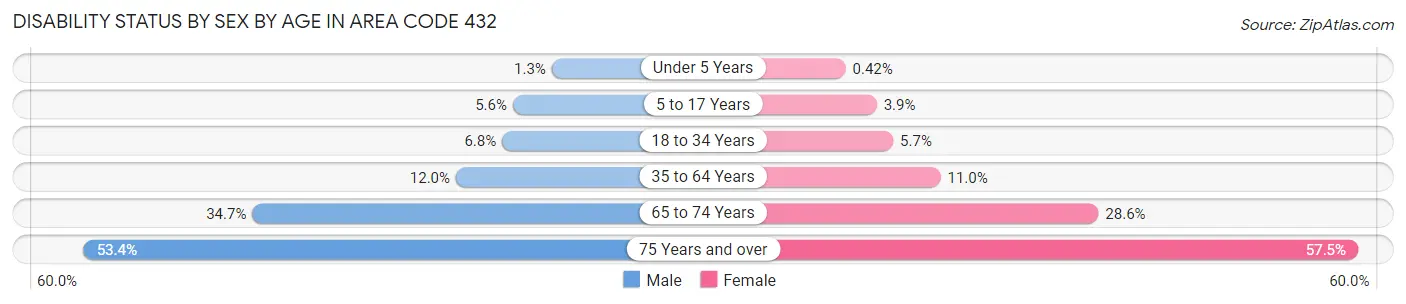
| Age Bracket | Male | Female |
| Under 5 Years | 292 (1.3%) | 89 (0.4%) |
| 5 to 17 Years | 3,179 (5.6%) | 2,116 (3.9%) |
| 18 to 34 Years | 4,669 (6.8%) | 3,542 (5.7%) |
| 35 to 64 Years | 11,461 (12.0%) | 9,758 (11.0%) |
| 65 to 74 Years | 6,104 (34.6%) | 5,534 (28.6%) |
| 75 Years and over | 5,272 (53.4%) | 7,635 (57.5%) |
Disability Class by Sex by Age in Area Code 432
Disability Class: Hearing Difficulty
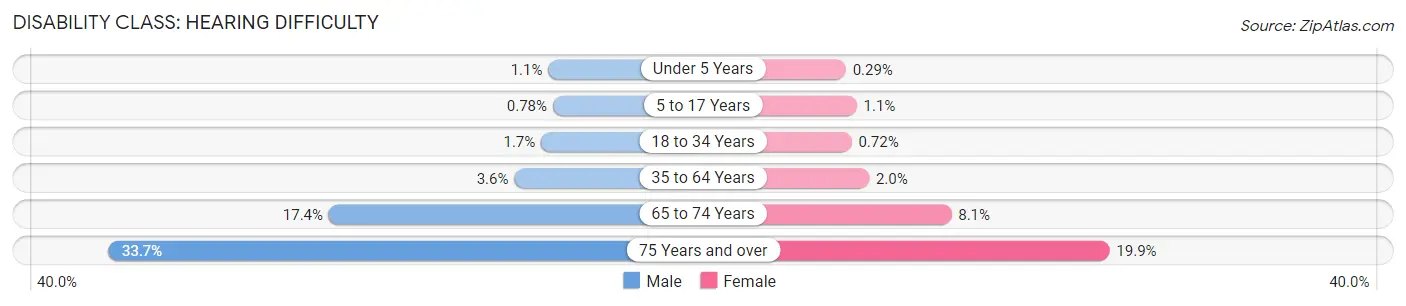
| Age Bracket | Male | Female |
| Under 5 Years | 253 (1.1%) | 62 (0.3%) |
| 5 to 17 Years | 442 (0.8%) | 597 (1.1%) |
| 18 to 34 Years | 1,128 (1.7%) | 444 (0.7%) |
| 35 to 64 Years | 3,483 (3.6%) | 1,794 (2.0%) |
| 65 to 74 Years | 3,067 (17.4%) | 1,574 (8.1%) |
| 75 Years and over | 3,330 (33.7%) | 2,640 (19.9%) |
Disability Class: Vision Difficulty
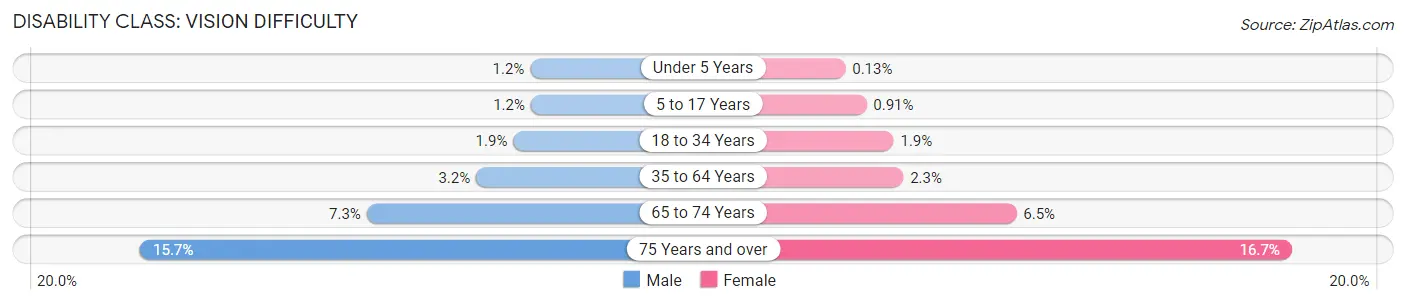
| Age Bracket | Male | Female |
| Under 5 Years | 277 (1.2%) | 27 (0.1%) |
| 5 to 17 Years | 682 (1.2%) | 496 (0.9%) |
| 18 to 34 Years | 1,275 (1.9%) | 1,187 (1.9%) |
| 35 to 64 Years | 3,103 (3.2%) | 2,019 (2.3%) |
| 65 to 74 Years | 1,286 (7.3%) | 1,254 (6.5%) |
| 75 Years and over | 1,551 (15.7%) | 2,219 (16.7%) |
Disability Class: Cognitive Difficulty
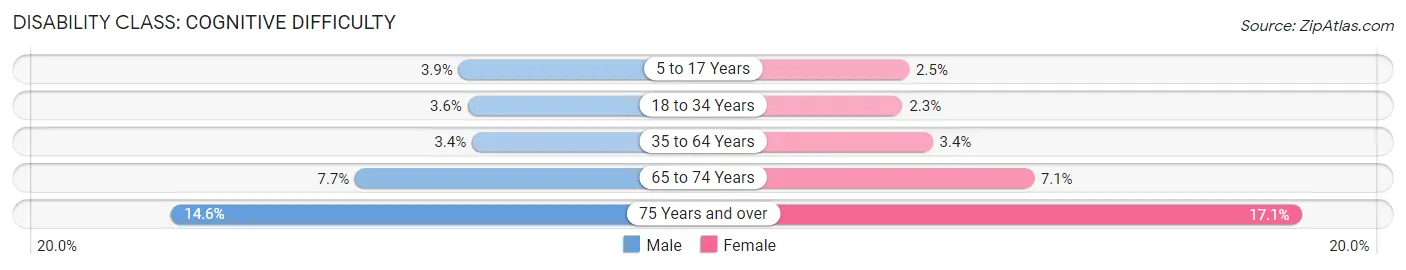
| Age Bracket | Male | Female |
| 5 to 17 Years | 2,192 (3.9%) | 1,360 (2.5%) |
| 18 to 34 Years | 2,427 (3.5%) | 1,391 (2.2%) |
| 35 to 64 Years | 3,248 (3.4%) | 2,992 (3.4%) |
| 65 to 74 Years | 1,362 (7.7%) | 1,380 (7.1%) |
| 75 Years and over | 1,436 (14.5%) | 2,266 (17.1%) |
Disability Class: Ambulatory Difficulty
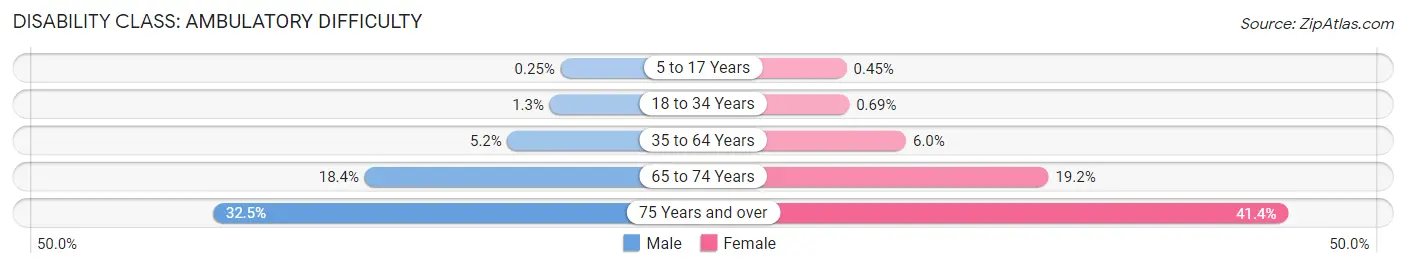
| Age Bracket | Male | Female |
| 5 to 17 Years | 141 (0.3%) | 246 (0.4%) |
| 18 to 34 Years | 860 (1.3%) | 430 (0.7%) |
| 35 to 64 Years | 4,955 (5.2%) | 5,289 (6.0%) |
| 65 to 74 Years | 3,247 (18.4%) | 3,714 (19.2%) |
| 75 Years and over | 3,211 (32.5%) | 5,504 (41.4%) |
Disability Class: Self-Care Difficulty
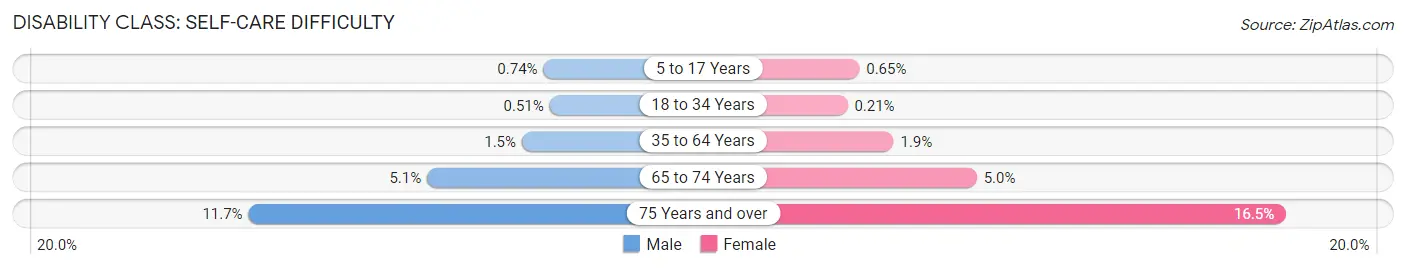
| Age Bracket | Male | Female |
| 5 to 17 Years | 417 (0.7%) | 352 (0.6%) |
| 18 to 34 Years | 351 (0.5%) | 128 (0.2%) |
| 35 to 64 Years | 1,475 (1.5%) | 1,700 (1.9%) |
| 65 to 74 Years | 891 (5.1%) | 970 (5.0%) |
| 75 Years and over | 1,154 (11.7%) | 2,191 (16.5%) |
Technology Access in Area Code 432
Computing Device Access in Area Code 432
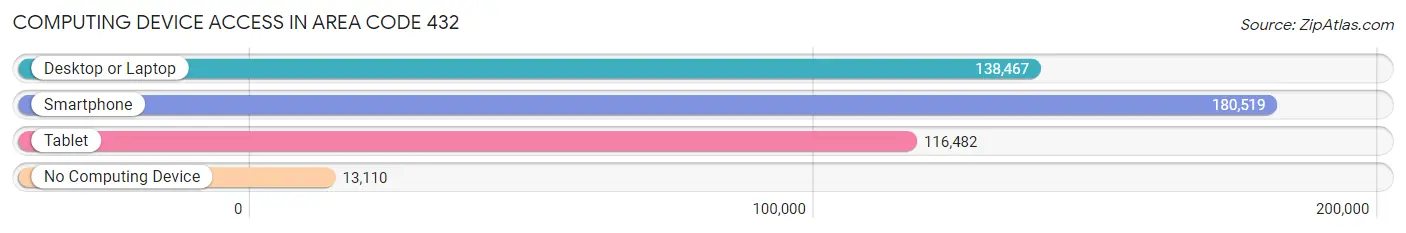
| Device Type | # Households | % Households |
| Desktop or Laptop | 138,467 | 68.8% |
| Smartphone | 180,519 | 89.7% |
| Tablet | 116,482 | 57.9% |
| No Computing Device | 13,110 | 6.5% |
| Total | 201,162 | 100.0% |
Internet Access in Area Code 432
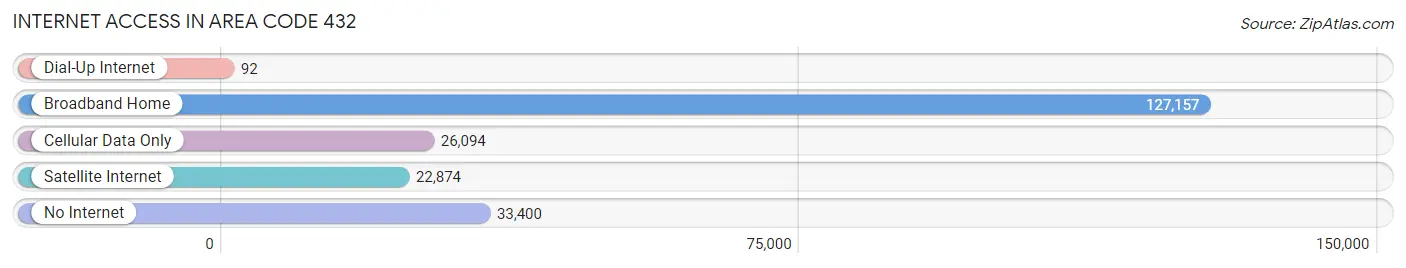
| Internet Type | # Households | % Households |
| Dial-Up Internet | 92 | 0.1% |
| Broadband Home | 127,157 | 63.2% |
| Cellular Data Only | 26,094 | 13.0% |
| Satellite Internet | 22,874 | 11.4% |
| No Internet | 33,400 | 16.6% |
| Total | 201,162 | 100.0% |
Area Code 432 Summary
Geography
Area code 432 is located in the state of Texas. It covers the western part of the state, including the cities of Midland, Odessa, and San Angelo.
Social
Area code 432 is home to a diverse population of people from all walks of life. The area is known for its friendly and welcoming atmosphere, and its residents are proud of their heritage and culture.
Economics
Area code 432 is an important economic hub in the state of Texas. The area is home to a number of oil and gas companies, as well as other businesses that provide jobs and economic opportunities for the local population.
Demographics
Area code 432 is home to a population of over 1.2 million people. The population is largely made up of people of Hispanic or Latino origin, with a significant number of African Americans and Native Americans also living in the area. The median household income in the area is slightly higher than the national average.
Common Questions
What is Per Capita Income in Area Code 432?
Per Capita income in Area Code 432 is $33,641.
What is the Median Family Income in Area Code 432?
Median Family Income in Area Code 432 is $85,623.
What is the Median Household income in Area Code 432?
Median Household Income in Area Code 432 is $72,982.
What is Income or Wage Gap in Area Code 432?
Income or Wage Gap in Area Code 432 is 40.7%.
Women in Area Code 432 earn 59.3 cents for every dollar earned by a man.
What is Family Income Deficit in Area Code 432?
Family Income Deficit in Area Code 432 is $10,917.
Families that are below poverty line in Area Code 432 earn $10,917 less on average than the poverty threshold level.
What is Inequality or Gini Index in Area Code 432?
Inequality or Gini Index in Area Code 432 is 25.17.
What is the Total Population of Area Code 432?
Total Population of Area Code 432 is 542,614.
What is the Total Male Population of Area Code 432?
Total Male Population of Area Code 432 is 282,158.
What is the Total Female Population of Area Code 432?
Total Female Population of Area Code 432 is 260,456.
What is the Ratio of Males per 100 Females in Area Code 432?
There are 108.33 Males per 100 Females in Area Code 432.
What is the Ratio of Females per 100 Males in Area Code 432?
There are 92.31 Females per 100 Males in Area Code 432.
What is the Median Population Age in Area Code 432?
Median Population Age in Area Code 432 is 38.3 Years.
What is the Average Family Size in Area Code 432
Average Family Size in Area Code 432 is 3.4 People.
What is the Average Household Size in Area Code 432
Average Household Size in Area Code 432 is 2.7 People.
How Large is the Labor Force in Area Code 432?
There are 250,792 People in the Labor Forcein in Area Code 432.
What is the Percentage of People in the Labor Force in Area Code 432?
62.0% of People are in the Labor Force in Area Code 432.
What is the Unemployment Rate in Area Code 432?
Unemployment Rate in Area Code 432 is 5.9%.