Collin County, TX Map & Demographics
Collin County Map
Collin County Overview
$52,654
PER CAPITA INCOME
$134,685
AVG FAMILY INCOME
$113,255
AVG HOUSEHOLD INCOME
36.7%
WAGE / INCOME GAP [ % ]
63.3¢/ $1
WAGE / INCOME GAP [ $ ]
$12,443
FAMILY INCOME DEFICIT
0.43
INEQUALITY / GINI INDEX
1,079,153
TOTAL POPULATION
537,145
MALE POPULATION
542,008
FEMALE POPULATION
99.10
MALES / 100 FEMALES
100.91
FEMALES / 100 MALES
37.1
MEDIAN AGE
3.3
AVG FAMILY SIZE
2.8
AVG HOUSEHOLD SIZE
591,130
LABOR FORCE [ PEOPLE ]
70.3%
PERCENT IN LABOR FORCE
4.2%
UNEMPLOYMENT RATE
Income in Collin County
Income Overview in Collin County
Per Capita Income in Collin County is $52,654, while median incomes of families and households are $134,685 and $113,255 respectively.
| Characteristic | Number | Measure |
| Per Capita Income | 1,079,153 | $52,654 |
| Median Family Income | 281,219 | $134,685 |
| Mean Family Income | 281,219 | $165,880 |
| Median Household Income | 383,675 | $113,255 |
| Mean Household Income | 383,675 | $144,818 |
| Income Deficit | 281,219 | $12,443 |
| Wage / Income Gap (%) | 1,079,153 | 36.67% |
| Wage / Income Gap ($) | 1,079,153 | 63.33¢ per $1 |
| Gini / Inequality Index | 1,079,153 | 0.43 |
Earnings by Sex in Collin County
Average Earnings in Collin County are $58,383, $73,250 for men and $46,392 for women, a difference of 36.7%.
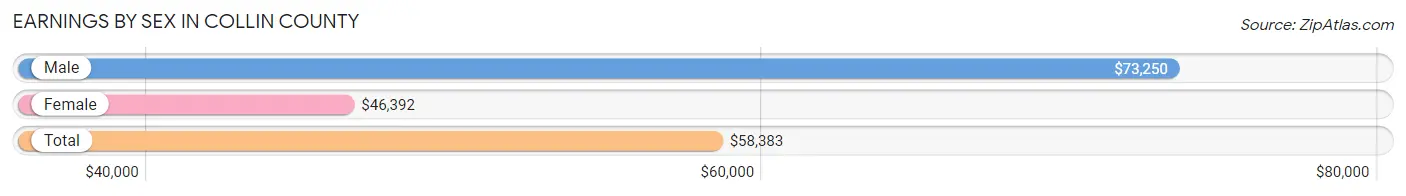
| Sex | Number | Average Earnings |
| Male | 333,085 (54.6%) | $73,250 |
| Female | 277,439 (45.4%) | $46,392 |
| Total | 610,524 (100.0%) | $58,383 |
Earnings by Sex by Income Bracket in Collin County
The most common earnings brackets in Collin County are $100,000+ for men (125,564 | 37.7%) and $100,000+ for women (45,834 | 16.5%).
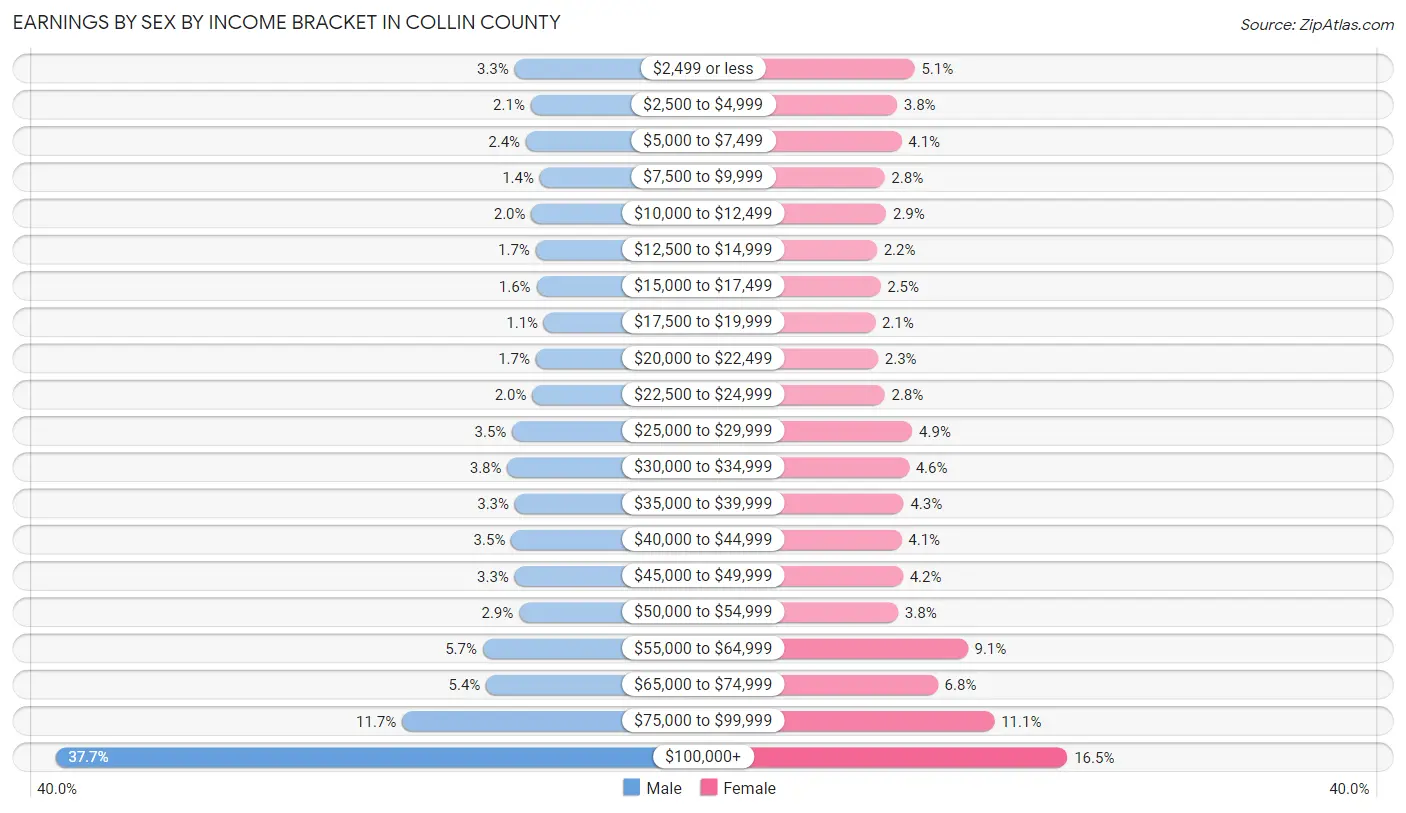
| Income | Male | Female |
| $2,499 or less | 10,917 (3.3%) | 14,077 (5.1%) |
| $2,500 to $4,999 | 6,890 (2.1%) | 10,411 (3.7%) |
| $5,000 to $7,499 | 8,107 (2.4%) | 11,336 (4.1%) |
| $7,500 to $9,999 | 4,616 (1.4%) | 7,821 (2.8%) |
| $10,000 to $12,499 | 6,727 (2.0%) | 8,153 (2.9%) |
| $12,500 to $14,999 | 5,648 (1.7%) | 6,211 (2.2%) |
| $15,000 to $17,499 | 5,472 (1.6%) | 6,964 (2.5%) |
| $17,500 to $19,999 | 3,609 (1.1%) | 5,853 (2.1%) |
| $20,000 to $22,499 | 5,623 (1.7%) | 6,454 (2.3%) |
| $22,500 to $24,999 | 6,502 (1.9%) | 7,854 (2.8%) |
| $25,000 to $29,999 | 11,515 (3.5%) | 13,604 (4.9%) |
| $30,000 to $34,999 | 12,738 (3.8%) | 12,861 (4.6%) |
| $35,000 to $39,999 | 10,849 (3.3%) | 11,780 (4.3%) |
| $40,000 to $44,999 | 11,753 (3.5%) | 11,336 (4.1%) |
| $45,000 to $49,999 | 10,901 (3.3%) | 11,619 (4.2%) |
| $50,000 to $54,999 | 9,786 (2.9%) | 10,623 (3.8%) |
| $55,000 to $64,999 | 18,857 (5.7%) | 25,102 (9.0%) |
| $65,000 to $74,999 | 18,018 (5.4%) | 18,881 (6.8%) |
| $75,000 to $99,999 | 38,993 (11.7%) | 30,665 (11.1%) |
| $100,000+ | 125,564 (37.7%) | 45,834 (16.5%) |
| Total | 333,085 (100.0%) | 277,439 (100.0%) |
Earnings by Sex by Educational Attainment in Collin County
Average earnings in Collin County are $86,190 for men and $54,505 for women, a difference of 36.8%. Men with an educational attainment of graduate degree enjoy the highest average annual earnings of $124,717, while those with less than high school education earn the least with $35,797. Women with an educational attainment of graduate degree earn the most with the average annual earnings of $77,106, while those with less than high school education have the smallest earnings of $23,690.
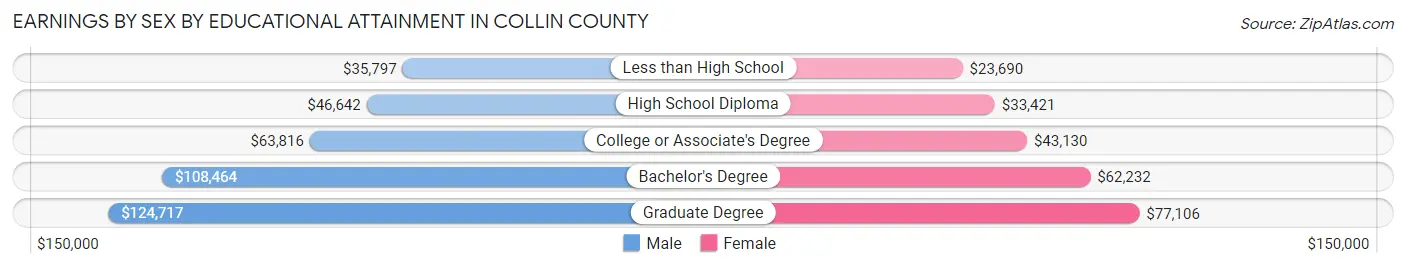
| Educational Attainment | Male Income | Female Income |
| Less than High School | $35,797 | $23,690 |
| High School Diploma | $46,642 | $33,421 |
| College or Associate's Degree | $63,816 | $43,130 |
| Bachelor's Degree | $108,464 | $62,232 |
| Graduate Degree | $124,717 | $77,106 |
| Total | $86,190 | $54,505 |
Family Income in Collin County
Family Income Brackets in Collin County
According to the Collin County family income data, there are 75,648 families falling into the $200,000+ income range, which is the most common income bracket and makes up 26.9% of all families. Conversely, the $10,000 to $14,999 income bracket is the least frequent group with only 2,250 families (0.8%) belonging to this category.
| Income Bracket | # Families | % Families |
| Less than $10,000 | 5,624 | 2.0% |
| $10,000 to $14,999 | 2,250 | 0.8% |
| $15,000 to $24,999 | 5,624 | 2.0% |
| $25,000 to $34,999 | 7,593 | 2.7% |
| $35,000 to $49,999 | 15,467 | 5.5% |
| $50,000 to $74,999 | 29,809 | 10.6% |
| $75,000 to $99,999 | 31,497 | 11.2% |
| $100,000 to $149,999 | 60,462 | 21.5% |
| $150,000 to $199,999 | 47,245 | 16.8% |
| $200,000+ | 75,648 | 26.9% |
Family Income by Famaliy Size in Collin County
4-person families (67,405 | 24.0%) account for the highest median family income in Collin County with $158,863 per family, while 2-person families (106,477 | 37.9%) have the highest median income of $56,392 per family member.
| Income Bracket | # Families | Median Income |
| 2-Person Families | 106,477 (37.9%) | $112,783 |
| 3-Person Families | 66,049 (23.5%) | $132,488 |
| 4-Person Families | 67,405 (24.0%) | $158,863 |
| 5-Person Families | 28,539 (10.2%) | $154,597 |
| 6-Person Families | 8,724 (3.1%) | $145,549 |
| 7+ Person Families | 4,025 (1.4%) | $136,487 |
| Total | 281,219 (100.0%) | $134,685 |
Family Income by Number of Earners in Collin County
The median family income in Collin County is $134,685, with families comprising 3+ earners (35,347) having the highest median family income of $172,291, while families with no earners (21,938) have the lowest median family income of $59,676, accounting for 12.6% and 7.8% of families, respectively.
| Number of Earners | # Families | Median Income |
| No Earners | 21,938 (7.8%) | $59,676 |
| 1 Earner | 89,161 (31.7%) | $100,498 |
| 2 Earners | 134,773 (47.9%) | $158,561 |
| 3+ Earners | 35,347 (12.6%) | $172,291 |
| Total | 281,219 (100.0%) | $134,685 |
Household Income in Collin County
Household Income Brackets in Collin County
With 82,490 households falling in the category, the $200,000+ income range is the most frequent in Collin County, accounting for 21.5% of all households. In contrast, only 4,988 households (1.3%) fall into the $10,000 to $14,999 income bracket, making it the least populous group.
| Income Bracket | # Households | % Households |
| Less than $10,000 | 11,510 | 3.0% |
| $10,000 to $14,999 | 4,988 | 1.3% |
| $15,000 to $24,999 | 13,429 | 3.5% |
| $25,000 to $34,999 | 15,347 | 4.0% |
| $35,000 to $49,999 | 27,625 | 7.2% |
| $50,000 to $74,999 | 51,412 | 13.4% |
| $75,000 to $99,999 | 46,425 | 12.1% |
| $100,000 to $149,999 | 75,968 | 19.8% |
| $150,000 to $199,999 | 54,482 | 14.2% |
| $200,000+ | 82,490 | 21.5% |
Household Income by Householder Age in Collin County
The median household income in Collin County is $113,255, with the highest median household income of $139,993 found in the 45 to 64 years age bracket for the primary householder. A total of 156,460 households (40.8%) fall into this category. Meanwhile, the 15 to 24 years age bracket for the primary householder has the lowest median household income of $45,497, with 12,593 households (3.3%) in this group.
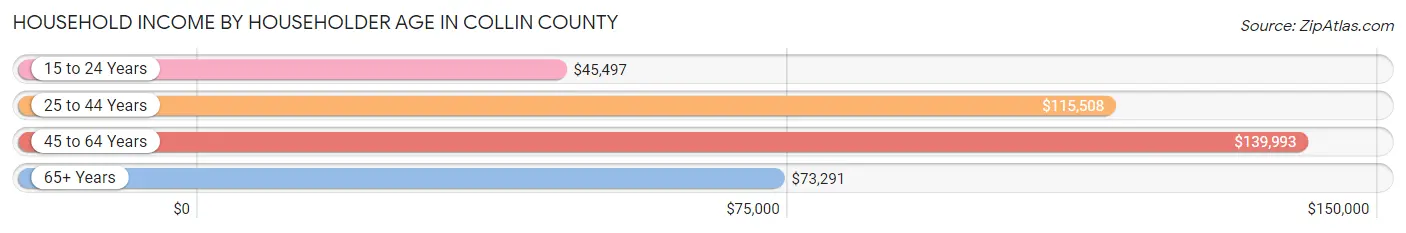
| Income Bracket | # Households | Median Income |
| 15 to 24 Years | 12,593 (3.3%) | $45,497 |
| 25 to 44 Years | 149,514 (39.0%) | $115,508 |
| 45 to 64 Years | 156,460 (40.8%) | $139,993 |
| 65+ Years | 65,108 (17.0%) | $73,291 |
| Total | 383,675 (100.0%) | $113,255 |
Poverty in Collin County
Income Below Poverty by Sex and Age in Collin County
With 5.7% poverty level for males and 6.9% for females among the residents of Collin County, 18 to 24 year old males and 18 to 24 year old females are the most vulnerable to poverty, with 5,304 males (11.0%) and 5,481 females (12.0%) in their respective age groups living below the poverty level.
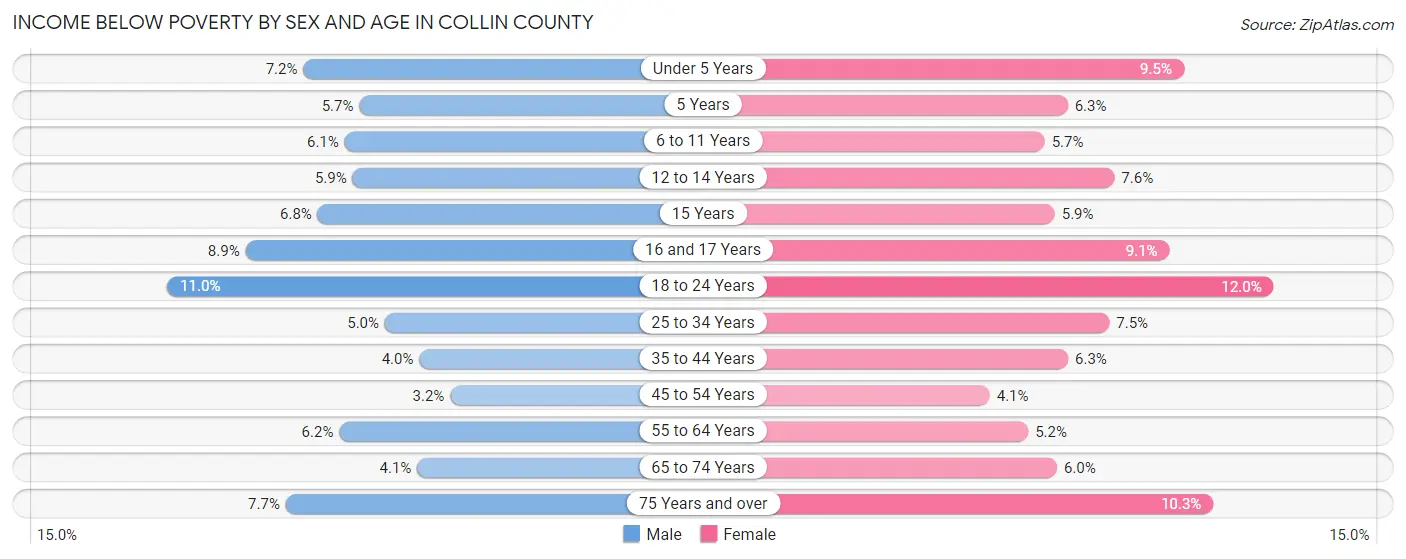
| Age Bracket | Male | Female |
| Under 5 Years | 2,312 (7.2%) | 2,905 (9.5%) |
| 5 Years | 402 (5.7%) | 427 (6.3%) |
| 6 to 11 Years | 2,932 (6.1%) | 2,536 (5.7%) |
| 12 to 14 Years | 1,415 (5.9%) | 1,899 (7.6%) |
| 15 Years | 603 (6.8%) | 513 (5.9%) |
| 16 and 17 Years | 1,514 (8.8%) | 1,469 (9.1%) |
| 18 to 24 Years | 5,304 (11.0%) | 5,481 (12.0%) |
| 25 to 34 Years | 3,365 (5.0%) | 5,128 (7.4%) |
| 35 to 44 Years | 3,361 (4.0%) | 5,449 (6.3%) |
| 45 to 54 Years | 2,567 (3.2%) | 3,267 (4.1%) |
| 55 to 64 Years | 3,793 (6.2%) | 3,118 (5.2%) |
| 65 to 74 Years | 1,395 (4.1%) | 2,410 (6.0%) |
| 75 Years and over | 1,473 (7.7%) | 2,680 (10.3%) |
| Total | 30,436 (5.7%) | 37,282 (6.9%) |
Income Above Poverty by Sex and Age in Collin County
According to the poverty statistics in Collin County, males aged 45 to 54 years and females aged 45 to 54 years are the age groups that are most secure financially, with 96.9% of males and 95.9% of females in these age groups living above the poverty line.
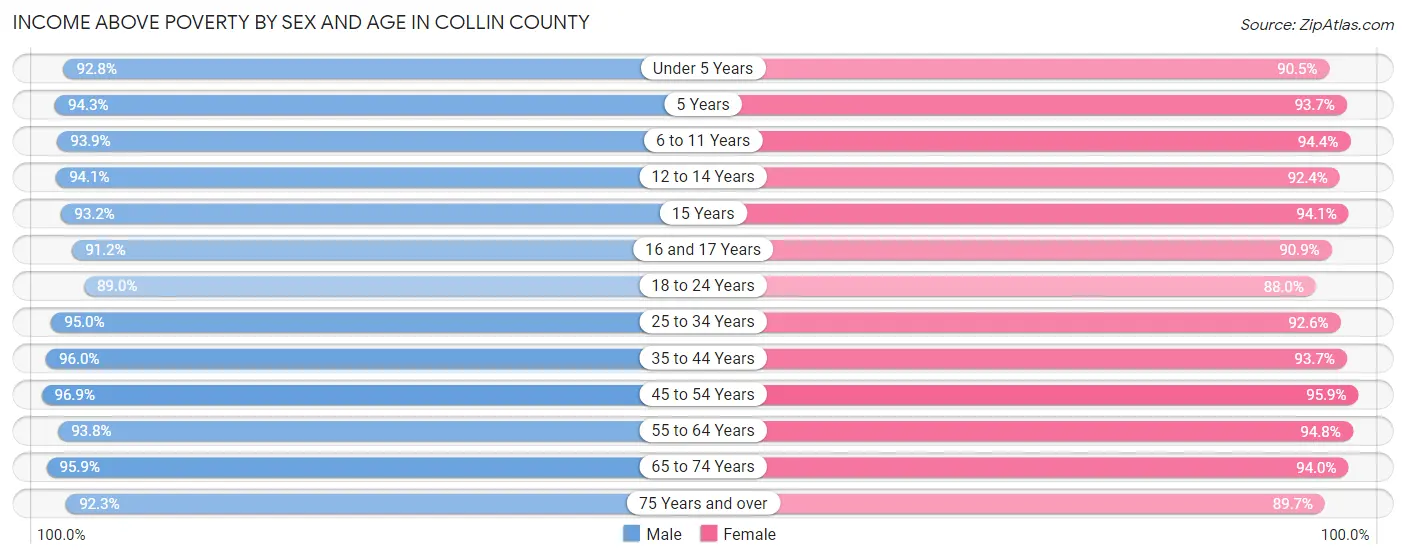
| Age Bracket | Male | Female |
| Under 5 Years | 29,611 (92.8%) | 27,621 (90.5%) |
| 5 Years | 6,675 (94.3%) | 6,366 (93.7%) |
| 6 to 11 Years | 45,248 (93.9%) | 42,354 (94.4%) |
| 12 to 14 Years | 22,698 (94.1%) | 23,120 (92.4%) |
| 15 Years | 8,215 (93.2%) | 8,137 (94.1%) |
| 16 and 17 Years | 15,596 (91.1%) | 14,639 (90.9%) |
| 18 to 24 Years | 42,775 (89.0%) | 40,115 (88.0%) |
| 25 to 34 Years | 64,399 (95.0%) | 63,693 (92.5%) |
| 35 to 44 Years | 80,549 (96.0%) | 81,073 (93.7%) |
| 45 to 54 Years | 79,048 (96.9%) | 76,008 (95.9%) |
| 55 to 64 Years | 56,962 (93.8%) | 56,987 (94.8%) |
| 65 to 74 Years | 32,888 (95.9%) | 37,818 (94.0%) |
| 75 Years and over | 17,590 (92.3%) | 23,232 (89.7%) |
| Total | 502,254 (94.3%) | 501,163 (93.1%) |
Income Below Poverty Among Married-Couple Families in Collin County
The poverty statistics for married-couple families in Collin County show that 3.1% or 7,138 of the total 232,942 families live below the poverty line. Families with 5 or more children have the highest poverty rate of 13.0%, comprising of 144 families. On the other hand, families with no children have the lowest poverty rate of 2.3%, which includes 2,484 families.
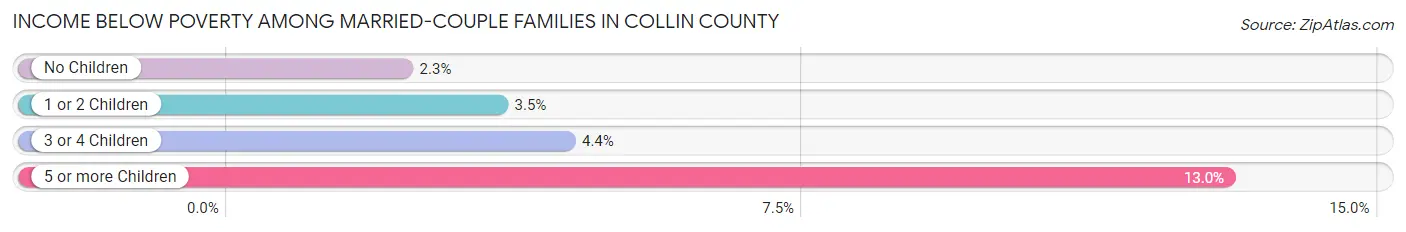
| Children | Above Poverty | Below Poverty |
| No Children | 106,286 (97.7%) | 2,484 (2.3%) |
| 1 or 2 Children | 98,859 (96.5%) | 3,604 (3.5%) |
| 3 or 4 Children | 19,698 (95.6%) | 906 (4.4%) |
| 5 or more Children | 961 (87.0%) | 144 (13.0%) |
| Total | 225,804 (96.9%) | 7,138 (3.1%) |
Income Below Poverty Among Single-Parent Households in Collin County
According to the poverty data in Collin County, 5.5% or 755 single-father households and 14.0% or 4,838 single-mother households are living below the poverty line. Among single-father households, those with 3 or 4 children have the highest poverty rate, with 93 households (12.3%) experiencing poverty. Likewise, among single-mother households, those with 5 or more children have the highest poverty rate, with 67 households (42.4%) falling below the poverty line.
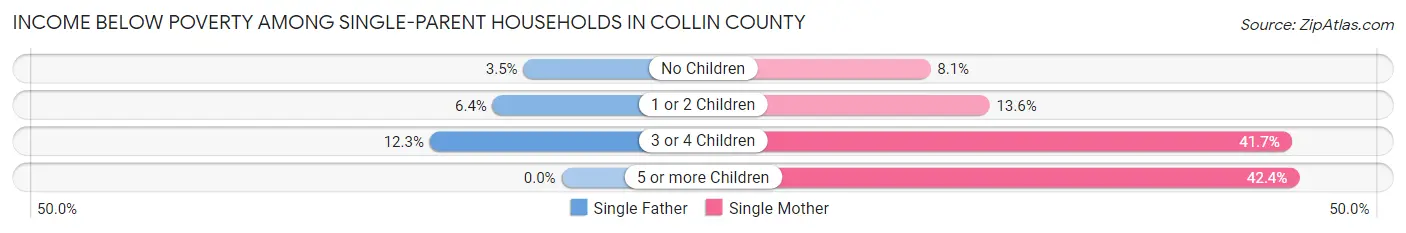
| Children | Single Father | Single Mother |
| No Children | 204 (3.5%) | 1,064 (8.1%) |
| 1 or 2 Children | 458 (6.4%) | 2,467 (13.6%) |
| 3 or 4 Children | 93 (12.3%) | 1,240 (41.7%) |
| 5 or more Children | 0 (0.0%) | 67 (42.4%) |
| Total | 755 (5.5%) | 4,838 (14.0%) |
Income Below Poverty Among Married-Couple vs Single-Parent Households in Collin County
The poverty data for Collin County shows that 7,138 of the married-couple family households (3.1%) and 5,593 of the single-parent households (11.6%) are living below the poverty level. Within the married-couple family households, those with 5 or more children have the highest poverty rate, with 144 households (13.0%) falling below the poverty line. Among the single-parent households, those with 3 or 4 children have the highest poverty rate, with 1,333 household (35.7%) living below poverty.
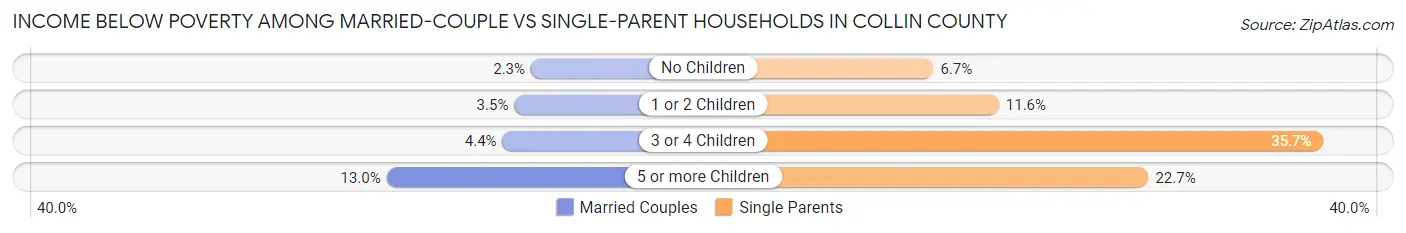
| Children | Married-Couple Families | Single-Parent Households |
| No Children | 2,484 (2.3%) | 1,268 (6.7%) |
| 1 or 2 Children | 3,604 (3.5%) | 2,925 (11.6%) |
| 3 or 4 Children | 906 (4.4%) | 1,333 (35.7%) |
| 5 or more Children | 144 (13.0%) | 67 (22.7%) |
| Total | 7,138 (3.1%) | 5,593 (11.6%) |
Race in Collin County
The most populous races in Collin County are White / Caucasian (646,170 | 59.9%), Asian (183,217 | 17.0%), and Hispanic or Latino (168,844 | 15.7%).
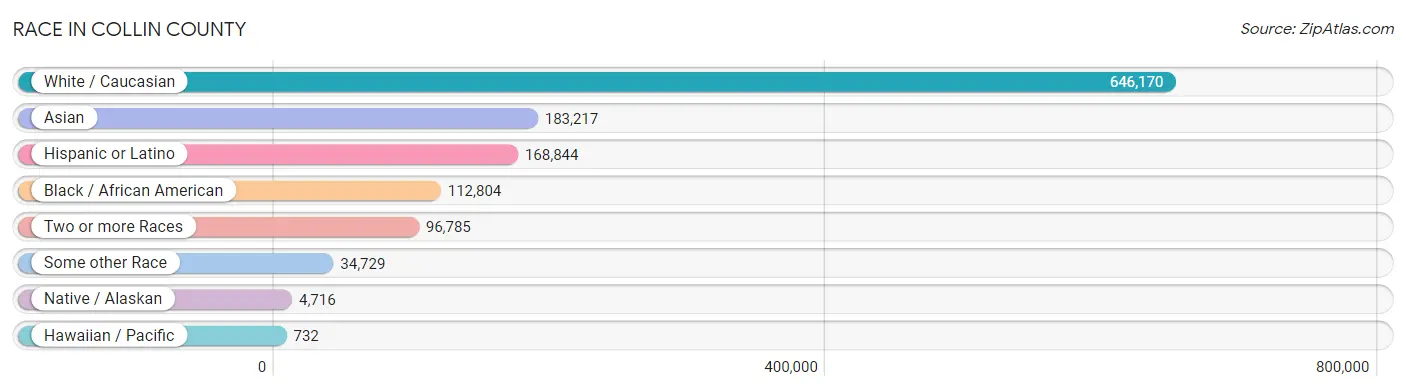
| Race | # Population | % Population |
| Asian | 183,217 | 17.0% |
| Black / African American | 112,804 | 10.4% |
| Hawaiian / Pacific | 732 | 0.1% |
| Hispanic or Latino | 168,844 | 15.7% |
| Native / Alaskan | 4,716 | 0.4% |
| White / Caucasian | 646,170 | 59.9% |
| Two or more Races | 96,785 | 9.0% |
| Some other Race | 34,729 | 3.2% |
| Total | 1,079,153 | 100.0% |
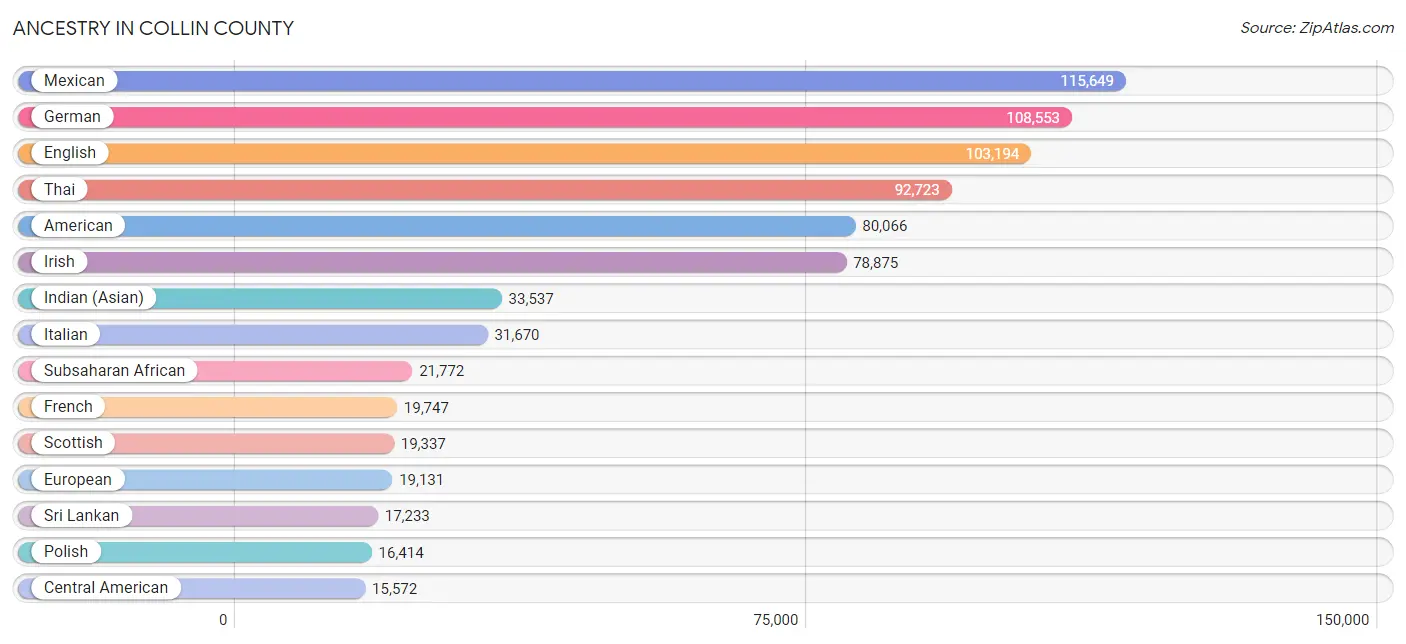
Ancestry in Collin County
The most populous ancestries reported in Collin County are Mexican (115,649 | 10.7%), German (108,553 | 10.1%), English (103,194 | 9.6%), Thai (92,723 | 8.6%), and American (80,066 | 7.4%), together accounting for 46.3% of all Collin County residents.
| Ancestry | # Population | % Population |
| Afghan | 467 | 0.0% |
| African | 8,639 | 0.8% |
| Albanian | 788 | 0.1% |
| Aleut | 53 | 0.0% |
| Alsatian | 12 | 0.0% |
| American | 80,066 | 7.4% |
| Apache | 415 | 0.0% |
| Arab | 11,539 | 1.1% |
| Argentinean | 893 | 0.1% |
| Armenian | 409 | 0.0% |
| Assyrian / Chaldean / Syriac | 58 | 0.0% |
| Australian | 180 | 0.0% |
| Austrian | 1,799 | 0.2% |
| Bahamian | 41 | 0.0% |
| Bangladeshi | 214 | 0.0% |
| Barbadian | 104 | 0.0% |
| Basque | 117 | 0.0% |
| Belgian | 549 | 0.1% |
| Belizean | 114 | 0.0% |
| Bermudan | 21 | 0.0% |
| Bhutanese | 5,606 | 0.5% |
| Blackfeet | 264 | 0.0% |
| Bolivian | 310 | 0.0% |
| Brazilian | 2,351 | 0.2% |
| British | 8,082 | 0.7% |
| British West Indian | 97 | 0.0% |
| Bulgarian | 238 | 0.0% |
| Burmese | 13,023 | 1.2% |
| Cajun | 685 | 0.1% |
| Cambodian | 101 | 0.0% |
| Canadian | 2,794 | 0.3% |
| Cape Verdean | 35 | 0.0% |
| Carpatho Rusyn | 11 | 0.0% |
| Celtic | 102 | 0.0% |
| Central American | 15,572 | 1.4% |
| Central American Indian | 1,316 | 0.1% |
| Cherokee | 3,467 | 0.3% |
| Cheyenne | 13 | 0.0% |
| Chickasaw | 388 | 0.0% |
| Chilean | 799 | 0.1% |
| Chinese | 13 | 0.0% |
| Chippewa | 82 | 0.0% |
| Choctaw | 1,157 | 0.1% |
| Colombian | 3,544 | 0.3% |
| Colville | 60 | 0.0% |
| Comanche | 149 | 0.0% |
| Costa Rican | 793 | 0.1% |
| Cree | 32 | 0.0% |
| Creek | 290 | 0.0% |
| Croatian | 816 | 0.1% |
| Cuban | 2,623 | 0.2% |
| Czech | 5,793 | 0.5% |
| Czechoslovakian | 765 | 0.1% |
| Danish | 3,114 | 0.3% |
| Delaware | 4 | 0.0% |
| Dominican | 1,257 | 0.1% |
| Dutch | 6,635 | 0.6% |
| Dutch West Indian | 266 | 0.0% |
| Eastern European | 2,831 | 0.3% |
| Ecuadorian | 779 | 0.1% |
| Egyptian | 1,561 | 0.1% |
| English | 103,194 | 9.6% |
| Estonian | 71 | 0.0% |
| Ethiopian | 2,940 | 0.3% |
| European | 19,131 | 1.8% |
| Filipino | 3,421 | 0.3% |
| Finnish | 882 | 0.1% |
| French | 19,747 | 1.8% |
| French American Indian | 35 | 0.0% |
| French Canadian | 2,747 | 0.3% |
| German | 108,553 | 10.1% |
| Ghanaian | 533 | 0.1% |
| Greek | 2,703 | 0.3% |
| Guamanian / Chamorro | 459 | 0.0% |
| Guatemalan | 5,473 | 0.5% |
| Guyanese | 380 | 0.0% |
| Haitian | 477 | 0.0% |
| Hmong | 56 | 0.0% |
| Honduran | 2,653 | 0.3% |
| Hopi | 34 | 0.0% |
| Hungarian | 2,762 | 0.3% |
| Icelander | 122 | 0.0% |
| Indian (Asian) | 33,537 | 3.1% |
| Indonesian | 413 | 0.0% |
| Inupiat | 205 | 0.0% |
| Iranian | 7,033 | 0.6% |
| Iraqi | 1,103 | 0.1% |
| Irish | 78,875 | 7.3% |
| Iroquois | 1 | 0.0% |
| Israeli | 714 | 0.1% |
| Italian | 31,670 | 2.9% |
| Jamaican | 1,577 | 0.2% |
| Japanese | 1,496 | 0.1% |
| Jordanian | 859 | 0.1% |
| Kenyan | 994 | 0.1% |
| Kiowa | 73 | 0.0% |
| Korean | 12,497 | 1.2% |
| Laotian | 1,086 | 0.1% |
| Latvian | 204 | 0.0% |
| Lebanese | 1,950 | 0.2% |
| Liberian | 117 | 0.0% |
| Lithuanian | 985 | 0.1% |
| Lumbee | 108 | 0.0% |
| Luxembourger | 63 | 0.0% |
| Macedonian | 155 | 0.0% |
| Malaysian | 1,427 | 0.1% |
| Maltese | 40 | 0.0% |
| Mexican | 115,649 | 10.7% |
| Mexican American Indian | 1,738 | 0.2% |
| Mongolian | 141 | 0.0% |
| Moroccan | 428 | 0.0% |
| Native Hawaiian | 990 | 0.1% |
| Navajo | 311 | 0.0% |
| New Zealander | 112 | 0.0% |
| Nicaraguan | 798 | 0.1% |
| Nigerian | 5,605 | 0.5% |
| Northern European | 1,247 | 0.1% |
| Norwegian | 8,129 | 0.7% |
| Okinawan | 35 | 0.0% |
| Osage | 110 | 0.0% |
| Pakistani | 1,380 | 0.1% |
| Palestinian | 1,056 | 0.1% |
| Panamanian | 693 | 0.1% |
| Paraguayan | 10 | 0.0% |
| Pennsylvania German | 159 | 0.0% |
| Peruvian | 1,893 | 0.2% |
| Polish | 16,414 | 1.5% |
| Portuguese | 2,802 | 0.3% |
| Potawatomi | 118 | 0.0% |
| Pueblo | 150 | 0.0% |
| Puerto Rican | 7,682 | 0.7% |
| Romanian | 2,039 | 0.2% |
| Russian | 5,374 | 0.5% |
| Salvadoran | 5,159 | 0.5% |
| Samoan | 123 | 0.0% |
| Scandinavian | 2,466 | 0.2% |
| Scotch-Irish | 11,351 | 1.1% |
| Scottish | 19,337 | 1.8% |
| Seminole | 110 | 0.0% |
| Serbian | 474 | 0.0% |
| Sierra Leonean | 32 | 0.0% |
| Sioux | 156 | 0.0% |
| Slavic | 323 | 0.0% |
| Slovak | 1,110 | 0.1% |
| Slovene | 521 | 0.1% |
| Somali | 81 | 0.0% |
| South African | 819 | 0.1% |
| South American | 14,092 | 1.3% |
| South American Indian | 112 | 0.0% |
| Spaniard | 5,634 | 0.5% |
| Spanish | 2,678 | 0.3% |
| Spanish American Indian | 81 | 0.0% |
| Sri Lankan | 17,233 | 1.6% |
| Subsaharan African | 21,772 | 2.0% |
| Sudanese | 58 | 0.0% |
| Swedish | 8,320 | 0.8% |
| Swiss | 1,201 | 0.1% |
| Syrian | 604 | 0.1% |
| Thai | 92,723 | 8.6% |
| Tongan | 168 | 0.0% |
| Trinidadian and Tobagonian | 384 | 0.0% |
| Turkish | 1,613 | 0.2% |
| Ugandan | 13 | 0.0% |
| Ukrainian | 2,012 | 0.2% |
| Uruguayan | 47 | 0.0% |
| Venezuelan | 5,636 | 0.5% |
| Vietnamese | 2,275 | 0.2% |
| Welsh | 5,831 | 0.5% |
| West Indian | 649 | 0.1% |
| Yaqui | 123 | 0.0% |
| Yugoslavian | 762 | 0.1% |
| Zimbabwean | 573 | 0.1% | View All 172 Rows |
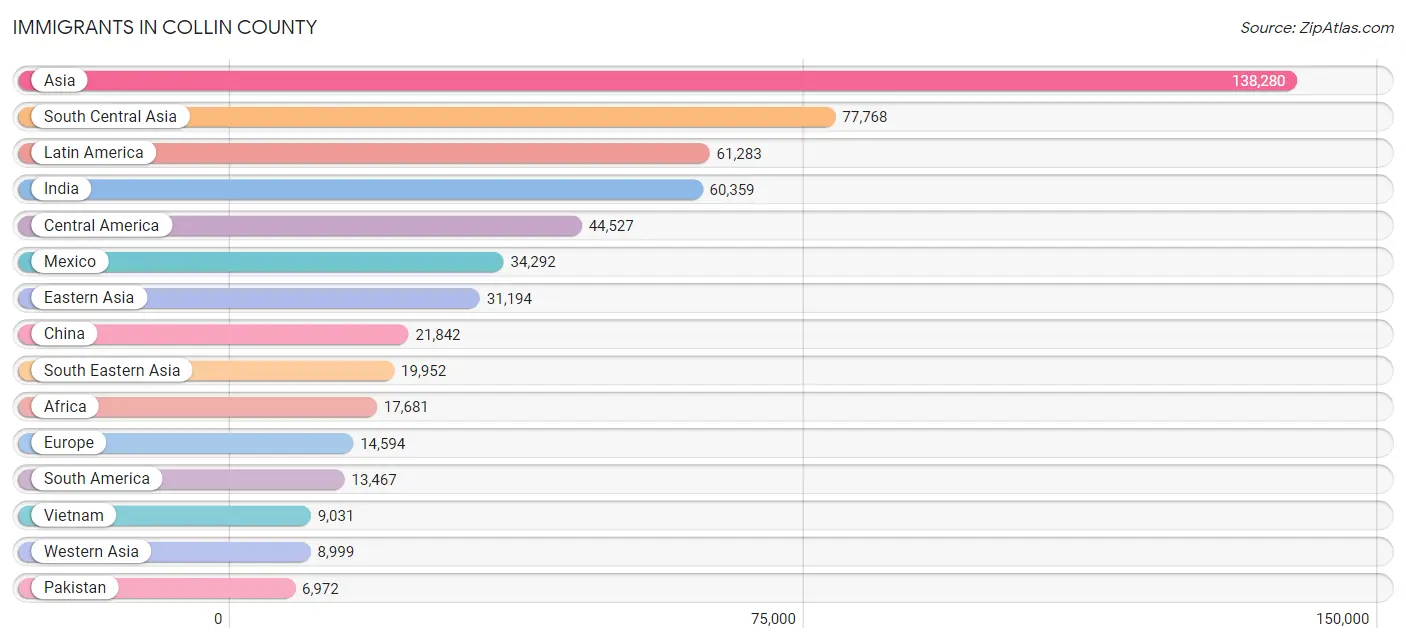
Immigrants in Collin County
The most numerous immigrant groups reported in Collin County came from Asia (138,280 | 12.8%), South Central Asia (77,768 | 7.2%), Latin America (61,283 | 5.7%), India (60,359 | 5.6%), and Central America (44,527 | 4.1%), together accounting for 35.4% of all Collin County residents.
| Immigration Origin | # Population | % Population |
| Afghanistan | 304 | 0.0% |
| Africa | 17,681 | 1.6% |
| Albania | 148 | 0.0% |
| Argentina | 521 | 0.1% |
| Armenia | 141 | 0.0% |
| Asia | 138,280 | 12.8% |
| Australia | 367 | 0.0% |
| Austria | 95 | 0.0% |
| Bahamas | 94 | 0.0% |
| Bangladesh | 2,241 | 0.2% |
| Barbados | 114 | 0.0% |
| Belarus | 231 | 0.0% |
| Belgium | 269 | 0.0% |
| Belize | 105 | 0.0% |
| Bolivia | 216 | 0.0% |
| Bosnia and Herzegovina | 159 | 0.0% |
| Brazil | 3,168 | 0.3% |
| Bulgaria | 127 | 0.0% |
| Cambodia | 737 | 0.1% |
| Cameroon | 933 | 0.1% |
| Canada | 4,945 | 0.5% |
| Caribbean | 3,289 | 0.3% |
| Central America | 44,527 | 4.1% |
| Chile | 483 | 0.0% |
| China | 21,842 | 2.0% |
| Colombia | 1,871 | 0.2% |
| Congo | 90 | 0.0% |
| Costa Rica | 282 | 0.0% |
| Croatia | 27 | 0.0% |
| Cuba | 781 | 0.1% |
| Czechoslovakia | 166 | 0.0% |
| Denmark | 64 | 0.0% |
| Dominica | 61 | 0.0% |
| Dominican Republic | 160 | 0.0% |
| Eastern Africa | 6,897 | 0.6% |
| Eastern Asia | 31,194 | 2.9% |
| Eastern Europe | 6,472 | 0.6% |
| Ecuador | 390 | 0.0% |
| Egypt | 1,027 | 0.1% |
| El Salvador | 3,948 | 0.4% |
| England | 1,367 | 0.1% |
| Eritrea | 249 | 0.0% |
| Ethiopia | 2,474 | 0.2% |
| Europe | 14,594 | 1.3% |
| Fiji | 84 | 0.0% |
| France | 682 | 0.1% |
| Germany | 1,450 | 0.1% |
| Ghana | 602 | 0.1% |
| Greece | 104 | 0.0% |
| Guatemala | 3,083 | 0.3% |
| Guyana | 348 | 0.0% |
| Haiti | 338 | 0.0% |
| Honduras | 2,026 | 0.2% |
| Hong Kong | 1,004 | 0.1% |
| Hungary | 139 | 0.0% |
| India | 60,359 | 5.6% |
| Indonesia | 858 | 0.1% |
| Iran | 5,159 | 0.5% |
| Iraq | 2,155 | 0.2% |
| Ireland | 118 | 0.0% |
| Israel | 1,162 | 0.1% |
| Italy | 351 | 0.0% |
| Jamaica | 958 | 0.1% |
| Japan | 2,517 | 0.2% |
| Jordan | 602 | 0.1% |
| Kazakhstan | 59 | 0.0% |
| Kenya | 1,848 | 0.2% |
| Korea | 6,764 | 0.6% |
| Kuwait | 669 | 0.1% |
| Laos | 788 | 0.1% |
| Latin America | 61,283 | 5.7% |
| Latvia | 101 | 0.0% |
| Lebanon | 1,132 | 0.1% |
| Liberia | 96 | 0.0% |
| Lithuania | 26 | 0.0% |
| Malaysia | 547 | 0.1% |
| Mexico | 34,292 | 3.2% |
| Micronesia | 15 | 0.0% |
| Middle Africa | 1,159 | 0.1% |
| Moldova | 106 | 0.0% |
| Morocco | 293 | 0.0% |
| Nepal | 1,370 | 0.1% |
| Netherlands | 324 | 0.0% |
| Nicaragua | 507 | 0.1% |
| Nigeria | 4,032 | 0.4% |
| North Macedonia | 260 | 0.0% |
| Northern Africa | 1,930 | 0.2% |
| Northern Europe | 4,277 | 0.4% |
| Norway | 12 | 0.0% |
| Oceania | 855 | 0.1% |
| Pakistan | 6,972 | 0.6% |
| Panama | 284 | 0.0% |
| Peru | 1,197 | 0.1% |
| Philippines | 6,340 | 0.6% |
| Poland | 604 | 0.1% |
| Portugal | 87 | 0.0% |
| Romania | 1,046 | 0.1% |
| Russia | 1,337 | 0.1% |
| Saudi Arabia | 326 | 0.0% |
| Scotland | 322 | 0.0% |
| Senegal | 17 | 0.0% |
| Serbia | 163 | 0.0% |
| Sierra Leone | 111 | 0.0% |
| Singapore | 207 | 0.0% |
| Somalia | 26 | 0.0% |
| South Africa | 1,163 | 0.1% |
| South America | 13,467 | 1.3% |
| South Central Asia | 77,768 | 7.2% |
| South Eastern Asia | 19,952 | 1.8% |
| Southern Europe | 951 | 0.1% |
| Spain | 409 | 0.0% |
| Sri Lanka | 444 | 0.0% |
| St. Vincent and the Grenadines | 97 | 0.0% |
| Sudan | 318 | 0.0% |
| Sweden | 659 | 0.1% |
| Switzerland | 74 | 0.0% |
| Syria | 255 | 0.0% |
| Taiwan | 4,215 | 0.4% |
| Thailand | 943 | 0.1% |
| Trinidad and Tobago | 542 | 0.1% |
| Turkey | 1,635 | 0.2% |
| Uganda | 185 | 0.0% |
| Ukraine | 1,206 | 0.1% |
| Uruguay | 41 | 0.0% |
| Uzbekistan | 511 | 0.1% |
| Venezuela | 5,055 | 0.5% |
| Vietnam | 9,031 | 0.8% |
| West Indies | 41 | 0.0% |
| Western Africa | 5,500 | 0.5% |
| Western Asia | 8,999 | 0.8% |
| Western Europe | 2,894 | 0.3% |
| Yemen | 45 | 0.0% |
| Zaire | 88 | 0.0% |
| Zimbabwe | 1,192 | 0.1% | View All 134 Rows |
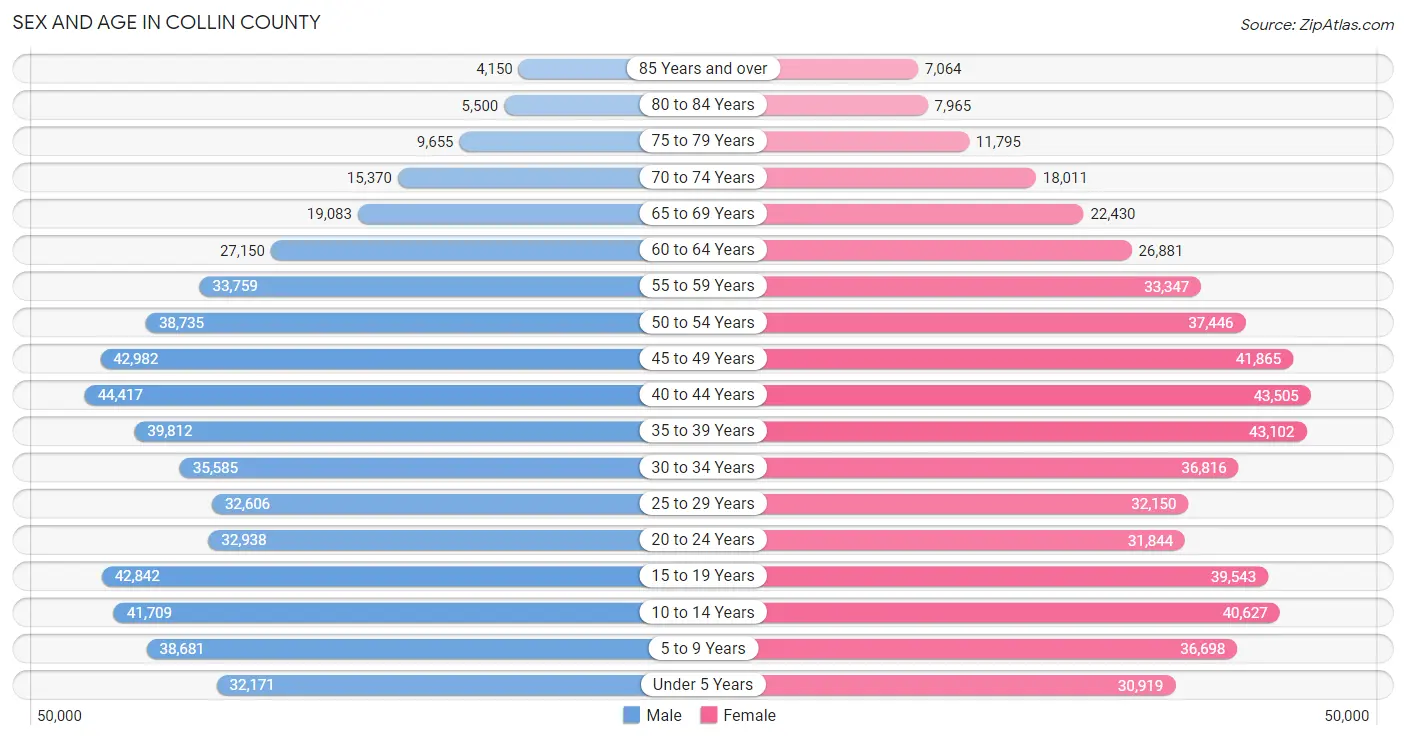
Sex and Age in Collin County
Sex and Age in Collin County
The most populous age groups in Collin County are 40 to 44 Years (44,417 | 8.3%) for men and 40 to 44 Years (43,505 | 8.0%) for women.
| Age Bracket | Male | Female |
| Under 5 Years | 32,171 (6.0%) | 30,919 (5.7%) |
| 5 to 9 Years | 38,681 (7.2%) | 36,698 (6.8%) |
| 10 to 14 Years | 41,709 (7.8%) | 40,627 (7.5%) |
| 15 to 19 Years | 42,842 (8.0%) | 39,543 (7.3%) |
| 20 to 24 Years | 32,938 (6.1%) | 31,844 (5.9%) |
| 25 to 29 Years | 32,606 (6.1%) | 32,150 (5.9%) |
| 30 to 34 Years | 35,585 (6.6%) | 36,816 (6.8%) |
| 35 to 39 Years | 39,812 (7.4%) | 43,102 (8.0%) |
| 40 to 44 Years | 44,417 (8.3%) | 43,505 (8.0%) |
| 45 to 49 Years | 42,982 (8.0%) | 41,865 (7.7%) |
| 50 to 54 Years | 38,735 (7.2%) | 37,446 (6.9%) |
| 55 to 59 Years | 33,759 (6.3%) | 33,347 (6.1%) |
| 60 to 64 Years | 27,150 (5.1%) | 26,881 (5.0%) |
| 65 to 69 Years | 19,083 (3.5%) | 22,430 (4.1%) |
| 70 to 74 Years | 15,370 (2.9%) | 18,011 (3.3%) |
| 75 to 79 Years | 9,655 (1.8%) | 11,795 (2.2%) |
| 80 to 84 Years | 5,500 (1.0%) | 7,965 (1.5%) |
| 85 Years and over | 4,150 (0.8%) | 7,064 (1.3%) |
| Total | 537,145 (100.0%) | 542,008 (100.0%) |
Families and Households in Collin County
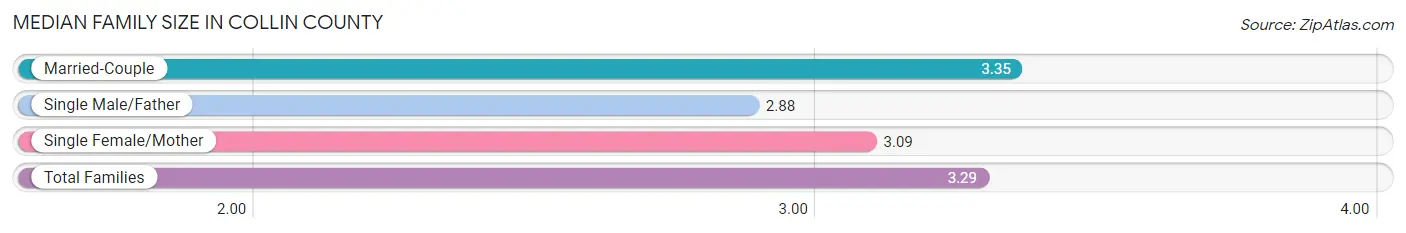
Median Family Size in Collin County
The median family size in Collin County is 3.29 persons per family, with married-couple families (232,942 | 82.8%) accounting for the largest median family size of 3.35 persons per family. On the other hand, single male/father families (13,795 | 4.9%) represent the smallest median family size with 2.88 persons per family.
| Family Type | # Families | Family Size |
| Married-Couple | 232,942 (82.8%) | 3.35 |
| Single Male/Father | 13,795 (4.9%) | 2.88 |
| Single Female/Mother | 34,482 (12.3%) | 3.09 |
| Total Families | 281,219 (100.0%) | 3.29 |
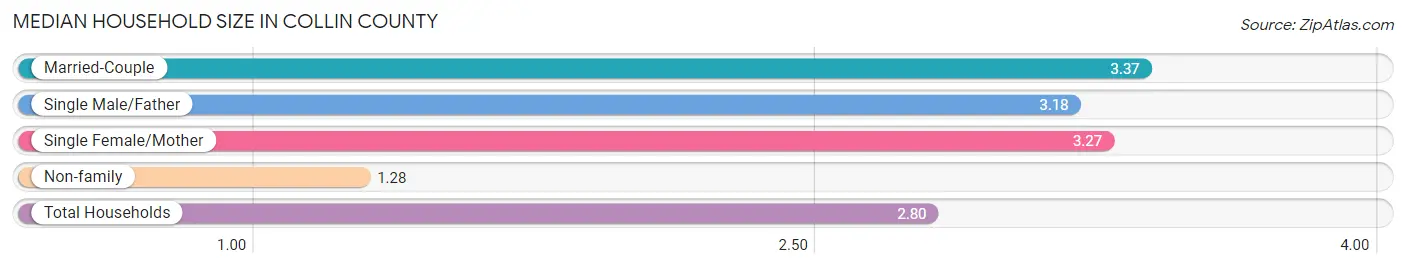
Median Household Size in Collin County
The median household size in Collin County is 2.80 persons per household, with married-couple households (232,942 | 60.7%) accounting for the largest median household size of 3.37 persons per household. non-family households (102,456 | 26.7%) represent the smallest median household size with 1.28 persons per household.
| Household Type | # Households | Household Size |
| Married-Couple | 232,942 (60.7%) | 3.37 |
| Single Male/Father | 13,795 (3.6%) | 3.18 |
| Single Female/Mother | 34,482 (9.0%) | 3.27 |
| Non-family | 102,456 (26.7%) | 1.28 |
| Total Households | 383,675 (100.0%) | 2.80 |
Household Size by Marriage Status in Collin County
Out of a total of 383,675 households in Collin County, 281,219 (73.3%) are family households, while 102,456 (26.7%) are nonfamily households. The most numerous type of family households are 2-person households, comprising 101,939, and the most common type of nonfamily households are 1-person households, comprising 82,478.
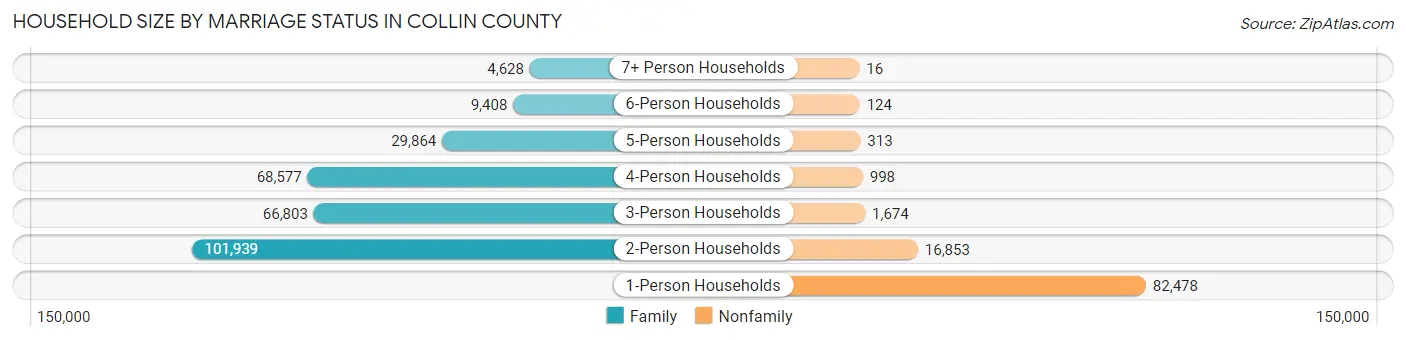
| Household Size | Family Households | Nonfamily Households |
| 1-Person Households | - | 82,478 (21.5%) |
| 2-Person Households | 101,939 (26.6%) | 16,853 (4.4%) |
| 3-Person Households | 66,803 (17.4%) | 1,674 (0.4%) |
| 4-Person Households | 68,577 (17.9%) | 998 (0.3%) |
| 5-Person Households | 29,864 (7.8%) | 313 (0.1%) |
| 6-Person Households | 9,408 (2.5%) | 124 (0.0%) |
| 7+ Person Households | 4,628 (1.2%) | 16 (0.0%) |
| Total | 281,219 (73.3%) | 102,456 (26.7%) |
Female Fertility in Collin County
Fertility by Age in Collin County
Average fertility rate in Collin County is 44.0 births per 1,000 women. Women in the age bracket of 20 to 34 years have the highest fertility rate with 76.0 births per 1,000 women. Women in the age bracket of 20 to 34 years acount for 62.6% of all women with births.
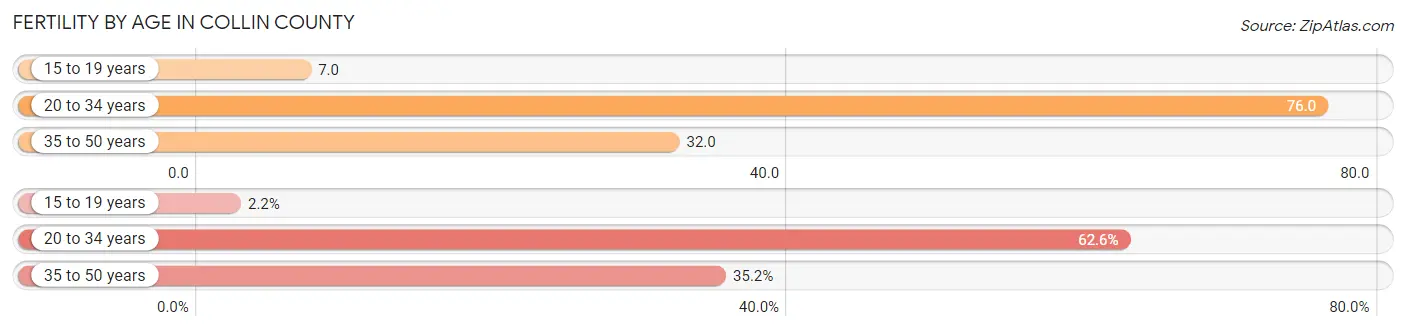
| Age Bracket | Women with Births | Births / 1,000 Women |
| 15 to 19 years | 275 (2.2%) | 7.0 |
| 20 to 34 years | 7,681 (62.6%) | 76.0 |
| 35 to 50 years | 4,315 (35.2%) | 32.0 |
| Total | 12,271 (100.0%) | 44.0 |
Fertility by Age by Marriage Status in Collin County
81.9% of women with births (12,271) in Collin County are married. The highest percentage of unmarried women with births falls into 15 to 19 years age bracket with 94.2% of them unmarried at the time of birth, while the lowest percentage of unmarried women with births belong to 35 to 50 years age bracket with 11.8% of them unmarried.
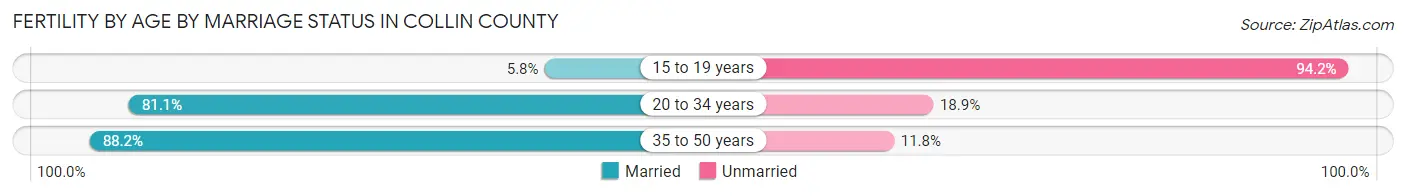
| Age Bracket | Married | Unmarried |
| 15 to 19 years | 16 (5.8%) | 259 (94.2%) |
| 20 to 34 years | 6,229 (81.1%) | 1,452 (18.9%) |
| 35 to 50 years | 3,806 (88.2%) | 509 (11.8%) |
| Total | 10,050 (81.9%) | 2,221 (18.1%) |
Fertility by Education in Collin County
Average fertility rate in Collin County is 44.0 births per 1,000 women. Women with the education attainment of graduate degree have the highest fertility rate of 56.0 births per 1,000 women, while women with the education attainment of less than high school have the lowest fertility at 18.0 births per 1,000 women. Women with the education attainment of bachelor's degree represent 37.5% of all women with births.
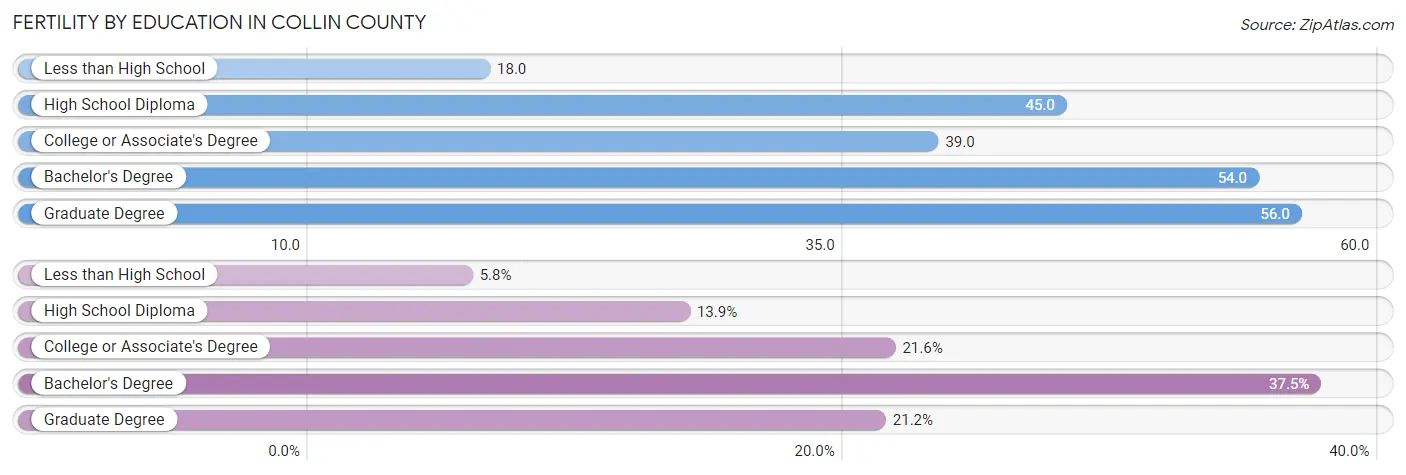
| Educational Attainment | Women with Births | Births / 1,000 Women |
| Less than High School | 706 (5.8%) | 18.0 |
| High School Diploma | 1,704 (13.9%) | 45.0 |
| College or Associate's Degree | 2,649 (21.6%) | 39.0 |
| Bachelor's Degree | 4,607 (37.5%) | 54.0 |
| Graduate Degree | 2,605 (21.2%) | 56.0 |
| Total | 12,271 (100.0%) | 44.0 |
Fertility by Education by Marriage Status in Collin County
18.1% of women with births in Collin County are unmarried. Women with the educational attainment of graduate degree are most likely to be married with 91.9% of them married at childbirth, while women with the educational attainment of high school diploma are least likely to be married with 48.6% of them unmarried at childbirth.
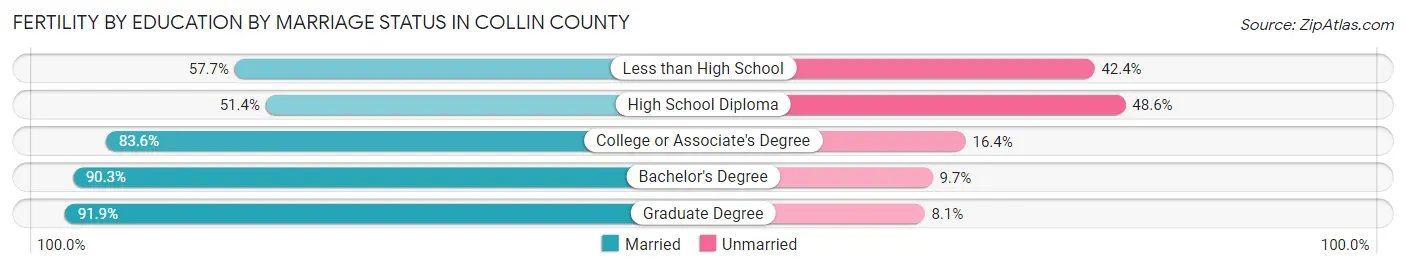
| Educational Attainment | Married | Unmarried |
| Less than High School | 407 (57.7%) | 299 (42.3%) |
| High School Diploma | 876 (51.4%) | 828 (48.6%) |
| College or Associate's Degree | 2,215 (83.6%) | 434 (16.4%) |
| Bachelor's Degree | 4,160 (90.3%) | 447 (9.7%) |
| Graduate Degree | 2,394 (91.9%) | 211 (8.1%) |
| Total | 10,050 (81.9%) | 2,221 (18.1%) |
Employment Characteristics in Collin County
Employment by Class of Employer in Collin County
Among the 559,680 employed individuals in Collin County, private company employees (418,364 | 74.8%), local government employees (35,229 | 6.3%), and self-employed (not incorporated) (32,332 | 5.8%) make up the most common classes of employment.
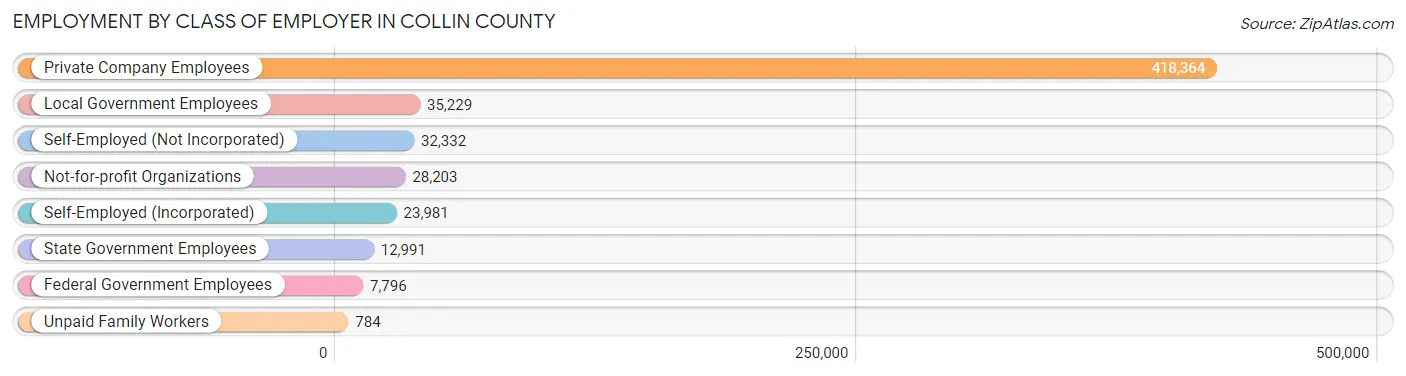
| Employer Class | # Employees | % Employees |
| Private Company Employees | 418,364 | 74.8% |
| Self-Employed (Incorporated) | 23,981 | 4.3% |
| Self-Employed (Not Incorporated) | 32,332 | 5.8% |
| Not-for-profit Organizations | 28,203 | 5.0% |
| Local Government Employees | 35,229 | 6.3% |
| State Government Employees | 12,991 | 2.3% |
| Federal Government Employees | 7,796 | 1.4% |
| Unpaid Family Workers | 784 | 0.1% |
| Total | 559,680 | 100.0% |
Employment Status by Age in Collin County
According to the labor force statistics for Collin County, out of the total population over 16 years of age (840,868), 70.3% or 591,130 individuals are in the labor force, with 4.2% or 24,827 of them unemployed. The age group with the highest labor force participation rate is 35 to 44 years, with 85.5% or 146,065 individuals in the labor force. Within the labor force, the 16 to 19 years age range has the highest percentage of unemployed individuals, with 11.2% or 2,639 of them being unemployed.
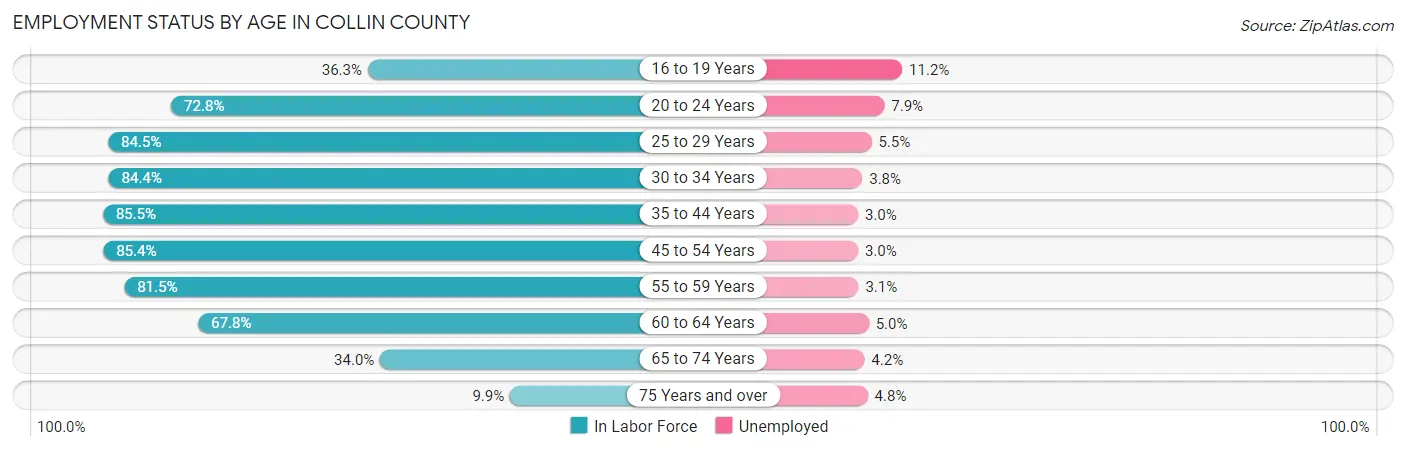
| Age Bracket | In Labor Force | Unemployed |
| 16 to 19 Years | 23,561 (36.3%) | 2,639 (11.2%) |
| 20 to 24 Years | 47,161 (72.8%) | 3,726 (7.9%) |
| 25 to 29 Years | 54,719 (84.5%) | 3,010 (5.5%) |
| 30 to 34 Years | 61,106 (84.4%) | 2,322 (3.8%) |
| 35 to 44 Years | 146,065 (85.5%) | 4,382 (3.0%) |
| 45 to 54 Years | 137,518 (85.4%) | 4,126 (3.0%) |
| 55 to 59 Years | 54,691 (81.5%) | 1,695 (3.1%) |
| 60 to 64 Years | 36,633 (67.8%) | 1,832 (5.0%) |
| 65 to 74 Years | 25,464 (34.0%) | 1,069 (4.2%) |
| 75 Years and over | 4,567 (9.9%) | 219 (4.8%) |
| Total | 591,130 (70.3%) | 24,827 (4.2%) |
Employment Status by Educational Attainment in Collin County
According to labor force statistics for Collin County, 83.1% of individuals (490,421) out of the total population between 25 and 64 years of age (590,158) are in the labor force, with 3.5% or 17,165 of them being unemployed. The group with the highest labor force participation rate are those with the educational attainment of bachelor's degree or higher, with 86.2% or 287,603 individuals in the labor force. Within the labor force, individuals with college / associate degree education have the highest percentage of unemployment, with 4.3% or 5,166 of them being unemployed.
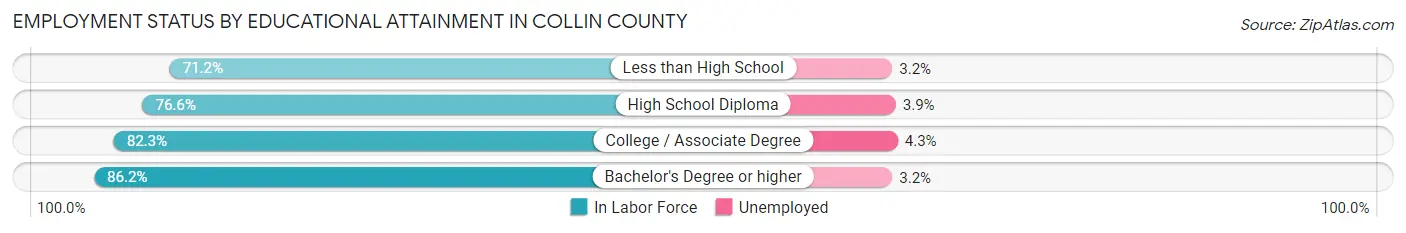
| Educational Attainment | In Labor Force | Unemployed |
| Less than High School | 21,819 (71.2%) | 981 (3.2%) |
| High School Diploma | 61,185 (76.6%) | 3,115 (3.9%) |
| College / Associate Degree | 120,151 (82.3%) | 6,278 (4.3%) |
| Bachelor's Degree or higher | 287,603 (86.2%) | 10,677 (3.2%) |
| Total | 490,421 (83.1%) | 20,656 (3.5%) |
Employment Occupations by Sex in Collin County
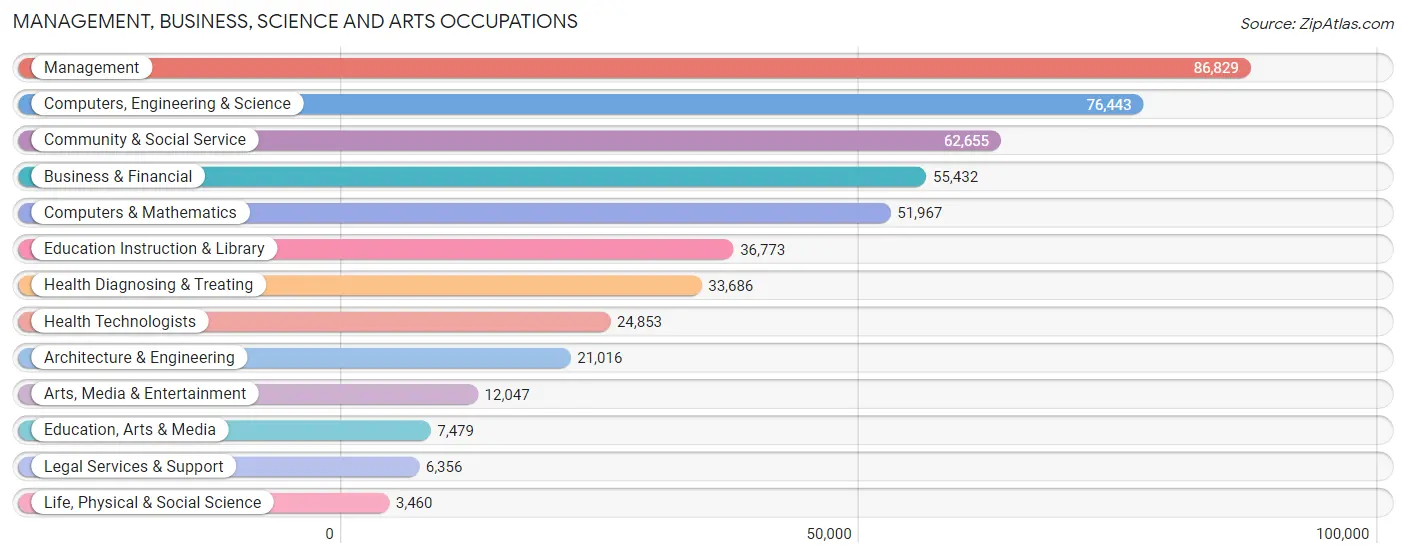
Management, Business, Science and Arts Occupations
The most common Management, Business, Science and Arts occupations in Collin County are Management (86,829 | 15.3%), Computers, Engineering & Science (76,443 | 13.5%), Community & Social Service (62,655 | 11.1%), Business & Financial (55,432 | 9.8%), and Computers & Mathematics (51,967 | 9.2%).
Management, Business, Science and Arts Occupations by Sex
Within the Management, Business, Science and Arts occupations in Collin County, the most male-oriented occupations are Architecture & Engineering (84.5%), Computers, Engineering & Science (77.2%), and Computers & Mathematics (75.9%), while the most female-oriented occupations are Education Instruction & Library (76.7%), Health Diagnosing & Treating (72.6%), and Health Technologists (71.3%).
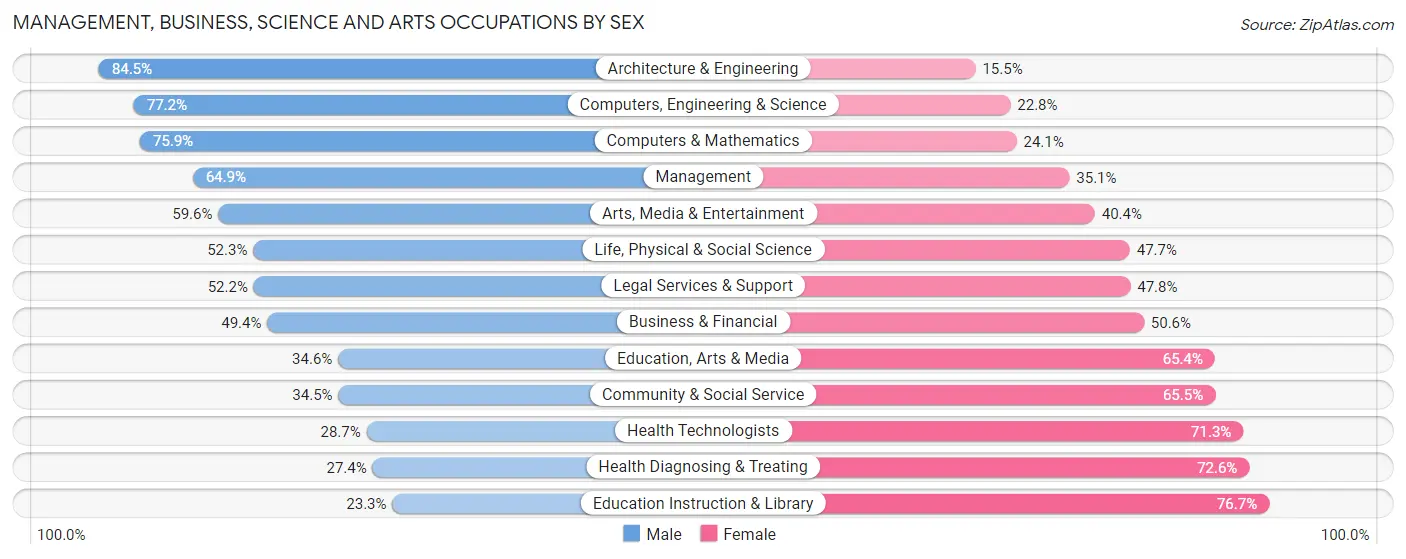
| Occupation | Male | Female |
| Management | 56,372 (64.9%) | 30,457 (35.1%) |
| Business & Financial | 27,369 (49.4%) | 28,063 (50.6%) |
| Computers, Engineering & Science | 59,027 (77.2%) | 17,416 (22.8%) |
| Computers & Mathematics | 39,458 (75.9%) | 12,509 (24.1%) |
| Architecture & Engineering | 17,759 (84.5%) | 3,257 (15.5%) |
| Life, Physical & Social Science | 1,810 (52.3%) | 1,650 (47.7%) |
| Community & Social Service | 21,644 (34.5%) | 41,011 (65.5%) |
| Education, Arts & Media | 2,587 (34.6%) | 4,892 (65.4%) |
| Legal Services & Support | 3,318 (52.2%) | 3,038 (47.8%) |
| Education Instruction & Library | 8,559 (23.3%) | 28,214 (76.7%) |
| Arts, Media & Entertainment | 7,180 (59.6%) | 4,867 (40.4%) |
| Health Diagnosing & Treating | 9,234 (27.4%) | 24,452 (72.6%) |
| Health Technologists | 7,125 (28.7%) | 17,728 (71.3%) |
| Total (Category) | 173,646 (55.1%) | 141,399 (44.9%) |
| Total (Overall) | 312,646 (55.2%) | 253,293 (44.8%) |
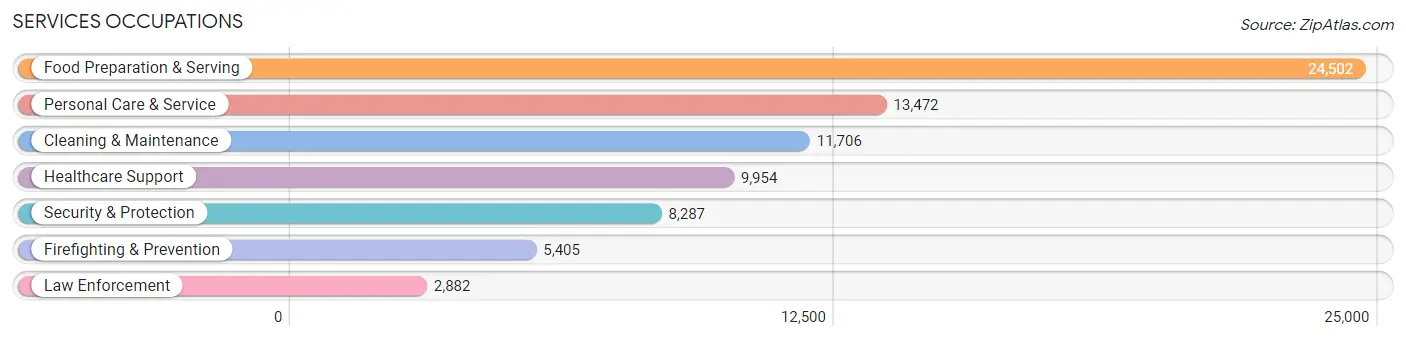
Services Occupations
The most common Services occupations in Collin County are Food Preparation & Serving (24,502 | 4.3%), Personal Care & Service (13,472 | 2.4%), Cleaning & Maintenance (11,706 | 2.1%), Healthcare Support (9,954 | 1.8%), and Security & Protection (8,287 | 1.5%).
Services Occupations by Sex
Within the Services occupations in Collin County, the most male-oriented occupations are Law Enforcement (82.2%), Security & Protection (75.8%), and Firefighting & Prevention (72.4%), while the most female-oriented occupations are Healthcare Support (87.6%), Personal Care & Service (74.1%), and Food Preparation & Serving (49.0%).
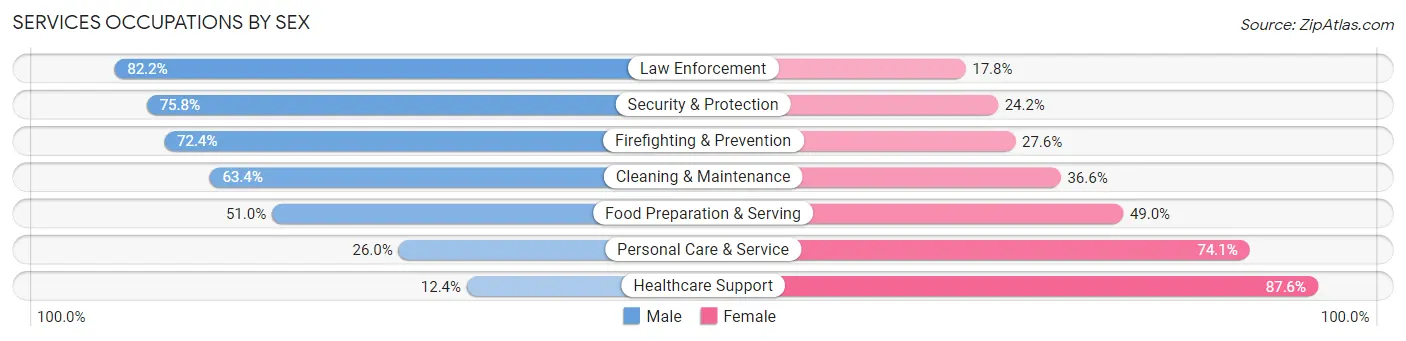
| Occupation | Male | Female |
| Healthcare Support | 1,236 (12.4%) | 8,718 (87.6%) |
| Security & Protection | 6,282 (75.8%) | 2,005 (24.2%) |
| Firefighting & Prevention | 3,912 (72.4%) | 1,493 (27.6%) |
| Law Enforcement | 2,370 (82.2%) | 512 (17.8%) |
| Food Preparation & Serving | 12,499 (51.0%) | 12,003 (49.0%) |
| Cleaning & Maintenance | 7,419 (63.4%) | 4,287 (36.6%) |
| Personal Care & Service | 3,496 (26.0%) | 9,976 (74.1%) |
| Total (Category) | 30,932 (45.5%) | 36,989 (54.5%) |
| Total (Overall) | 312,646 (55.2%) | 253,293 (44.8%) |
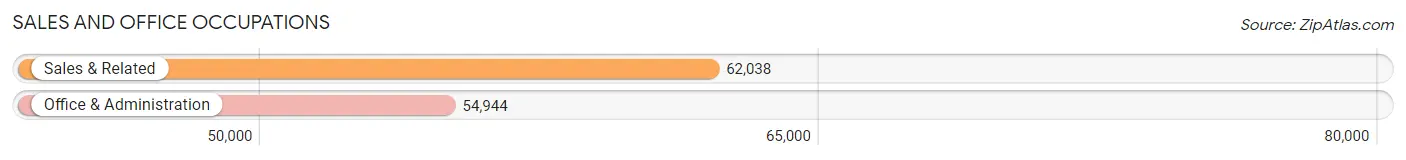
Sales and Office Occupations
The most common Sales and Office occupations in Collin County are Sales & Related (62,038 | 11.0%), and Office & Administration (54,944 | 9.7%).
Sales and Office Occupations by Sex
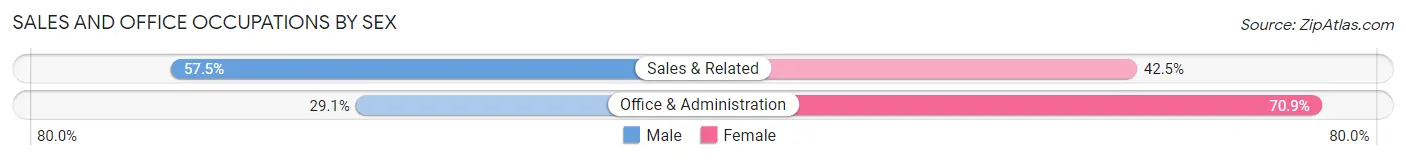
| Occupation | Male | Female |
| Sales & Related | 35,667 (57.5%) | 26,371 (42.5%) |
| Office & Administration | 15,978 (29.1%) | 38,966 (70.9%) |
| Total (Category) | 51,645 (44.2%) | 65,337 (55.8%) |
| Total (Overall) | 312,646 (55.2%) | 253,293 (44.8%) |
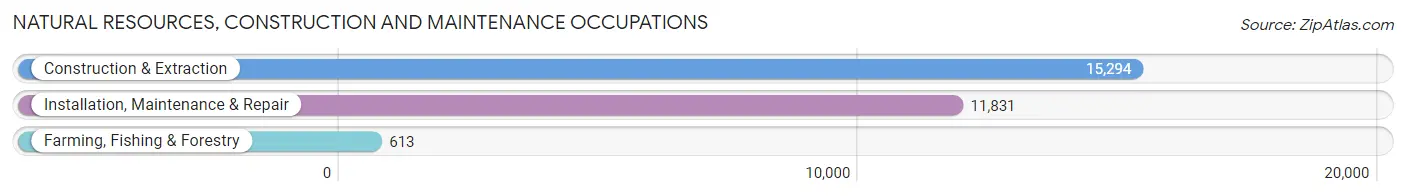
Natural Resources, Construction and Maintenance Occupations
The most common Natural Resources, Construction and Maintenance occupations in Collin County are Construction & Extraction (15,294 | 2.7%), Installation, Maintenance & Repair (11,831 | 2.1%), and Farming, Fishing & Forestry (613 | 0.1%).
Natural Resources, Construction and Maintenance Occupations by Sex
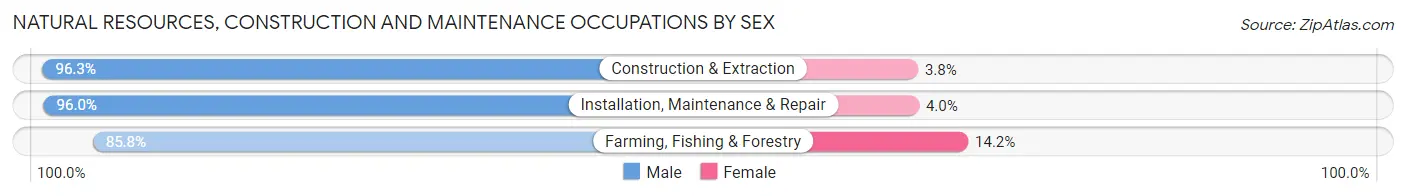
| Occupation | Male | Female |
| Farming, Fishing & Forestry | 526 (85.8%) | 87 (14.2%) |
| Construction & Extraction | 14,721 (96.3%) | 573 (3.7%) |
| Installation, Maintenance & Repair | 11,361 (96.0%) | 470 (4.0%) |
| Total (Category) | 26,608 (95.9%) | 1,130 (4.1%) |
| Total (Overall) | 312,646 (55.2%) | 253,293 (44.8%) |
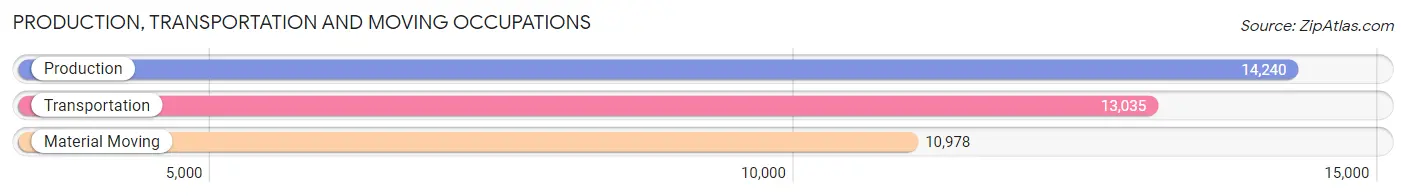
Production, Transportation and Moving Occupations
The most common Production, Transportation and Moving occupations in Collin County are Production (14,240 | 2.5%), Transportation (13,035 | 2.3%), and Material Moving (10,978 | 1.9%).
Production, Transportation and Moving Occupations by Sex
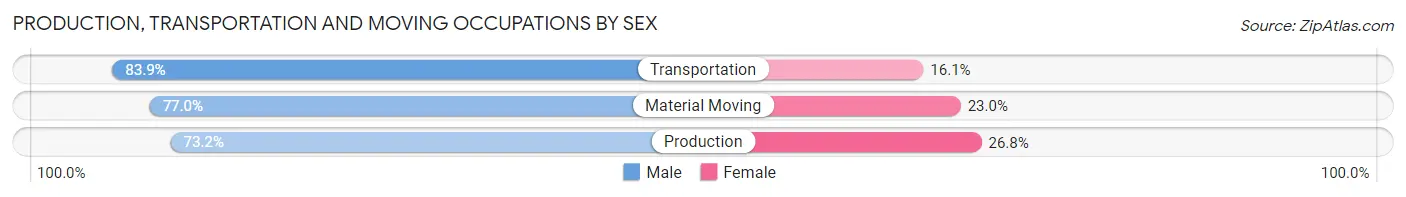
| Occupation | Male | Female |
| Production | 10,425 (73.2%) | 3,815 (26.8%) |
| Transportation | 10,934 (83.9%) | 2,101 (16.1%) |
| Material Moving | 8,456 (77.0%) | 2,522 (23.0%) |
| Total (Category) | 29,815 (77.9%) | 8,438 (22.1%) |
| Total (Overall) | 312,646 (55.2%) | 253,293 (44.8%) |
Employment Industries by Sex in Collin County
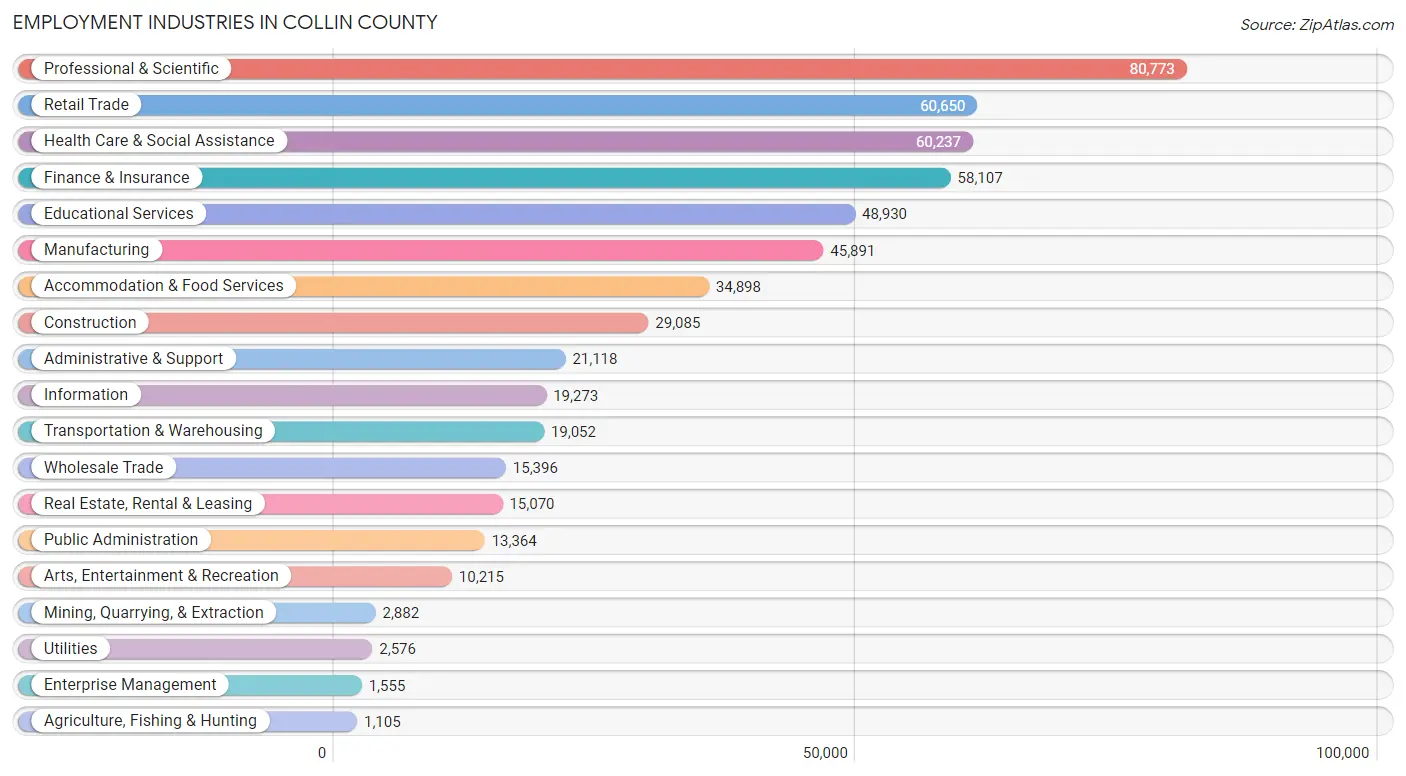
Employment Industries in Collin County
The major employment industries in Collin County include Professional & Scientific (80,773 | 14.3%), Retail Trade (60,650 | 10.7%), Health Care & Social Assistance (60,237 | 10.6%), Finance & Insurance (58,107 | 10.3%), and Educational Services (48,930 | 8.6%).
Employment Industries by Sex in Collin County
The Collin County industries that see more men than women are Construction (85.7%), Agriculture, Fishing & Hunting (81.5%), and Utilities (77.1%), whereas the industries that tend to have a higher number of women are Health Care & Social Assistance (74.7%), Educational Services (71.1%), and Real Estate, Rental & Leasing (52.1%).
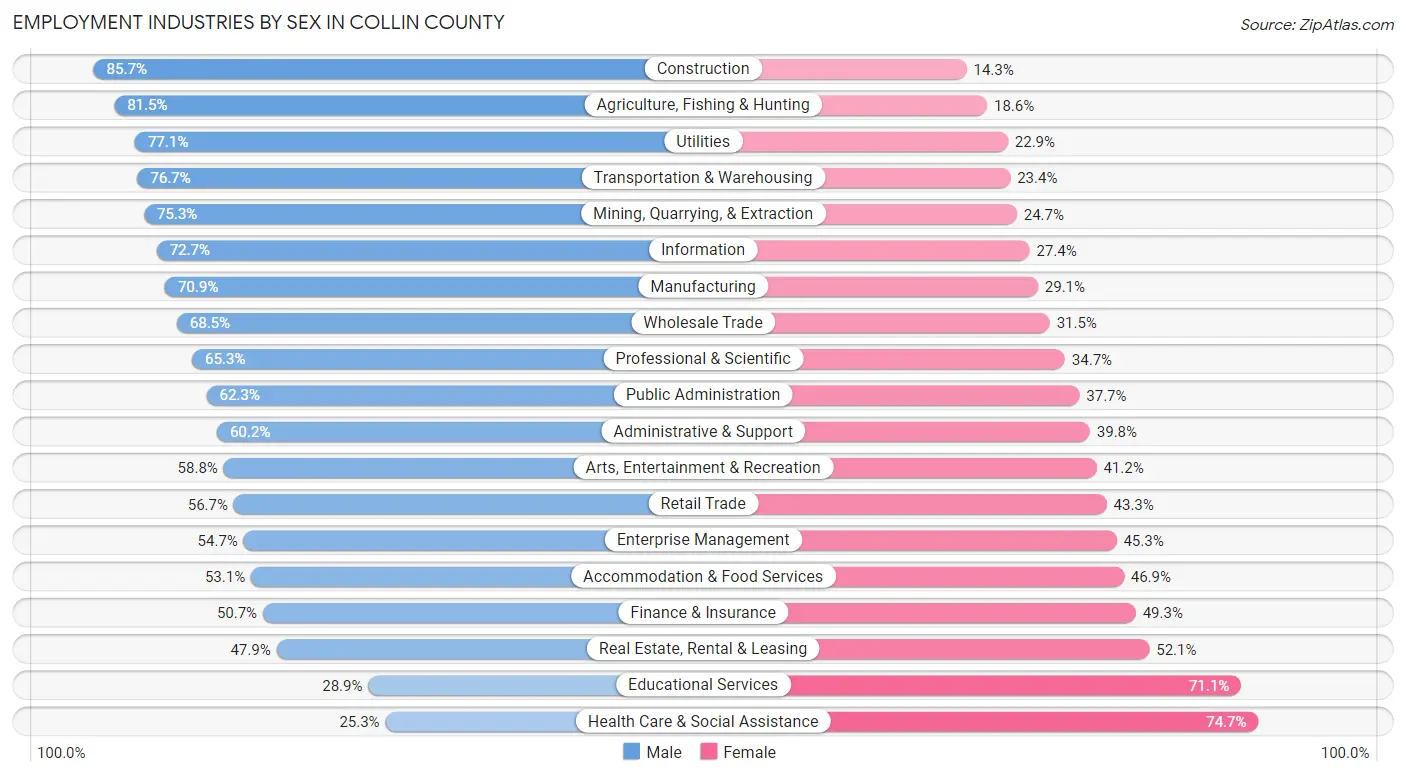
| Industry | Male | Female |
| Agriculture, Fishing & Hunting | 900 (81.5%) | 205 (18.5%) |
| Mining, Quarrying, & Extraction | 2,170 (75.3%) | 712 (24.7%) |
| Construction | 24,926 (85.7%) | 4,159 (14.3%) |
| Manufacturing | 32,550 (70.9%) | 13,341 (29.1%) |
| Wholesale Trade | 10,543 (68.5%) | 4,853 (31.5%) |
| Retail Trade | 34,386 (56.7%) | 26,264 (43.3%) |
| Transportation & Warehousing | 14,603 (76.6%) | 4,449 (23.4%) |
| Utilities | 1,987 (77.1%) | 589 (22.9%) |
| Information | 14,001 (72.7%) | 5,272 (27.4%) |
| Finance & Insurance | 29,444 (50.7%) | 28,663 (49.3%) |
| Real Estate, Rental & Leasing | 7,213 (47.9%) | 7,857 (52.1%) |
| Professional & Scientific | 52,769 (65.3%) | 28,004 (34.7%) |
| Enterprise Management | 850 (54.7%) | 705 (45.3%) |
| Administrative & Support | 12,707 (60.2%) | 8,411 (39.8%) |
| Educational Services | 14,119 (28.9%) | 34,811 (71.1%) |
| Health Care & Social Assistance | 15,248 (25.3%) | 44,989 (74.7%) |
| Arts, Entertainment & Recreation | 6,006 (58.8%) | 4,209 (41.2%) |
| Accommodation & Food Services | 18,546 (53.1%) | 16,352 (46.9%) |
| Public Administration | 8,331 (62.3%) | 5,033 (37.7%) |
| Total | 312,646 (55.2%) | 253,293 (44.8%) |
Education in Collin County
School Enrollment in Collin County
The most common levels of schooling among the 300,094 students in Collin County are high school (69,700 | 23.2%), middle school (63,677 | 21.2%), and elementary school (60,506 | 20.2%).
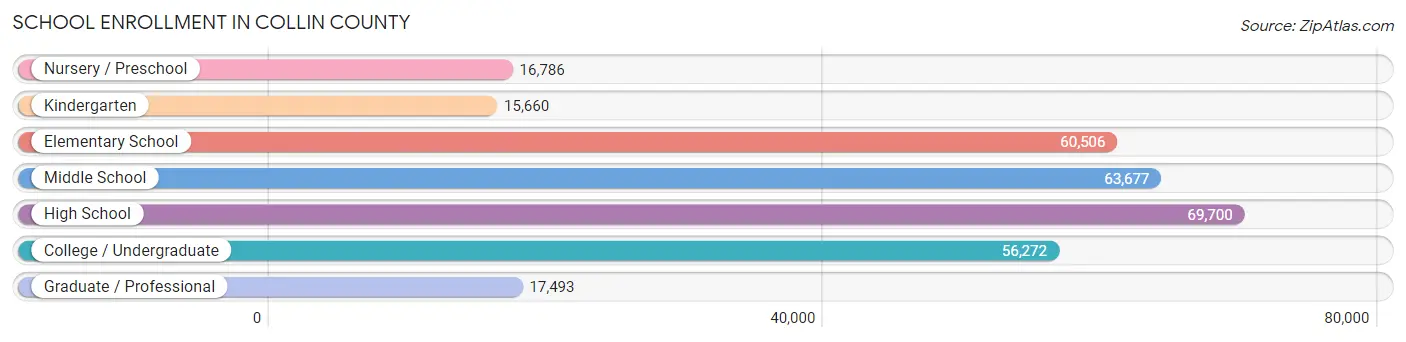
| School Level | # Students | % Students |
| Nursery / Preschool | 16,786 | 5.6% |
| Kindergarten | 15,660 | 5.2% |
| Elementary School | 60,506 | 20.2% |
| Middle School | 63,677 | 21.2% |
| High School | 69,700 | 23.2% |
| College / Undergraduate | 56,272 | 18.8% |
| Graduate / Professional | 17,493 | 5.8% |
| Total | 300,094 | 100.0% |
School Enrollment by Age by Funding Source in Collin County
Out of a total of 300,094 students who are enrolled in schools in Collin County, 39,913 (13.3%) attend a private institution, while the remaining 260,181 (86.7%) are enrolled in public schools. The age group of 3 to 4 year olds has the highest likelihood of being enrolled in private schools, with 8,322 (59.3% in the age bracket) enrolled. Conversely, the age group of 15 to 17 year olds has the lowest likelihood of being enrolled in a private school, with 46,263 (93.1% in the age bracket) attending a public institution.
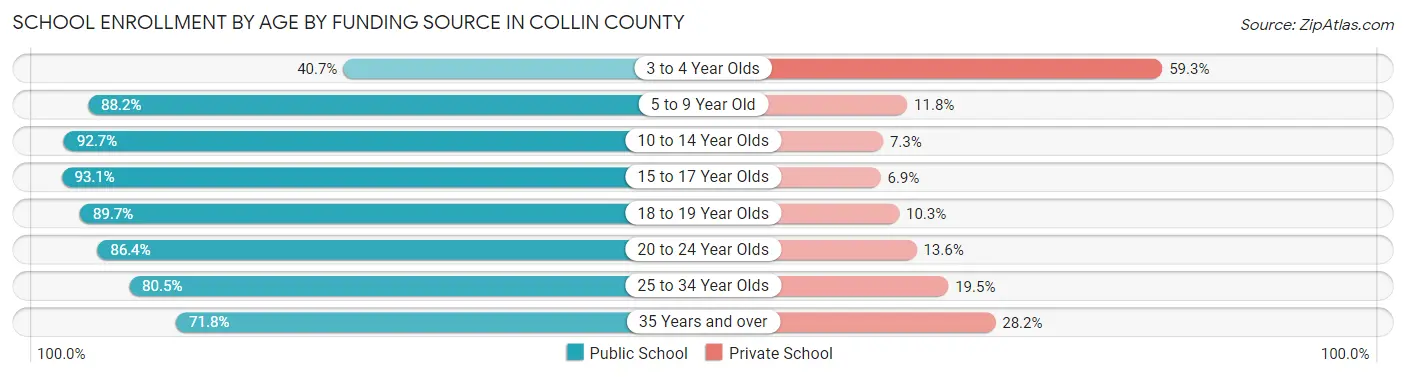
| Age Bracket | Public School | Private School |
| 3 to 4 Year Olds | 5,703 (40.7%) | 8,322 (59.3%) |
| 5 to 9 Year Old | 63,236 (88.2%) | 8,474 (11.8%) |
| 10 to 14 Year Olds | 75,055 (92.7%) | 5,931 (7.3%) |
| 15 to 17 Year Olds | 46,263 (93.1%) | 3,412 (6.9%) |
| 18 to 19 Year Olds | 21,817 (89.7%) | 2,509 (10.3%) |
| 20 to 24 Year Olds | 24,503 (86.4%) | 3,844 (13.6%) |
| 25 to 34 Year Olds | 12,147 (80.5%) | 2,938 (19.5%) |
| 35 Years and over | 11,438 (71.8%) | 4,502 (28.2%) |
| Total | 260,181 (86.7%) | 39,913 (13.3%) |
Educational Attainment by Field of Study in Collin County
Business (102,805 | 25.1%), engineering (56,340 | 13.7%), computers & mathematics (37,071 | 9.0%), science & technology (36,073 | 8.8%), and education (30,946 | 7.5%) are the most common fields of study among 410,328 individuals in Collin County who have obtained a bachelor's degree or higher.
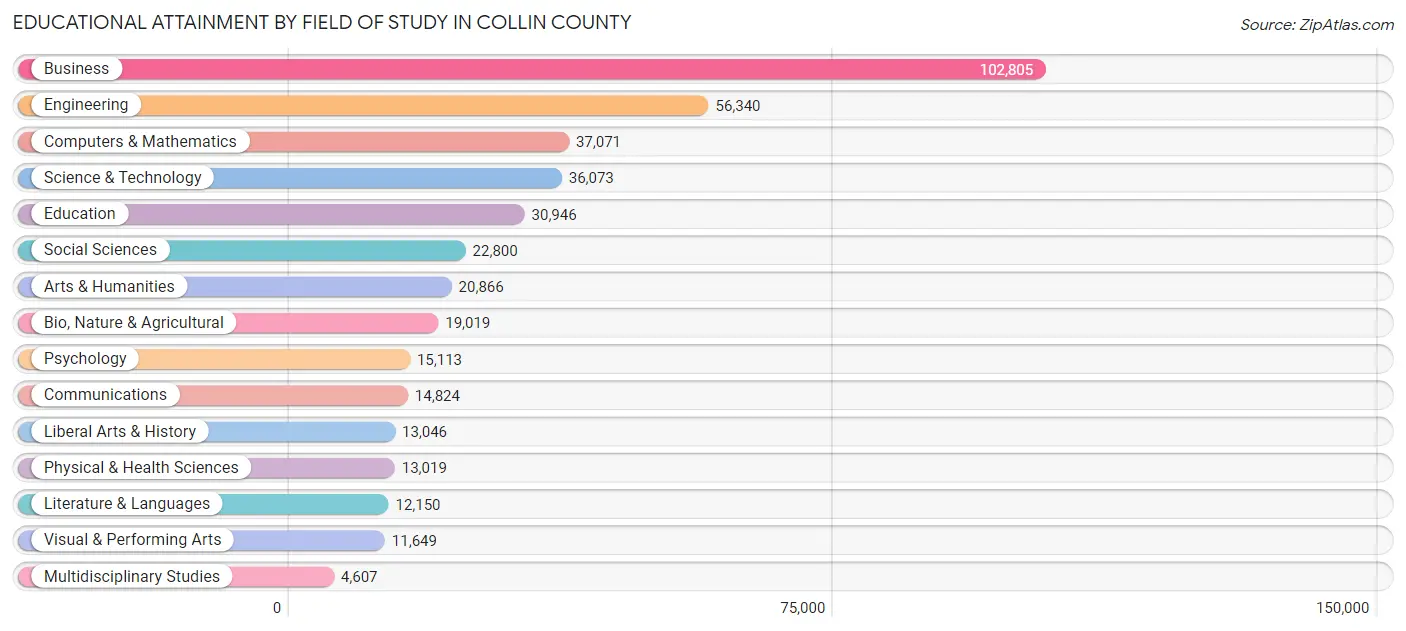
| Field of Study | # Graduates | % Graduates |
| Computers & Mathematics | 37,071 | 9.0% |
| Bio, Nature & Agricultural | 19,019 | 4.6% |
| Physical & Health Sciences | 13,019 | 3.2% |
| Psychology | 15,113 | 3.7% |
| Social Sciences | 22,800 | 5.6% |
| Engineering | 56,340 | 13.7% |
| Multidisciplinary Studies | 4,607 | 1.1% |
| Science & Technology | 36,073 | 8.8% |
| Business | 102,805 | 25.1% |
| Education | 30,946 | 7.5% |
| Literature & Languages | 12,150 | 3.0% |
| Liberal Arts & History | 13,046 | 3.2% |
| Visual & Performing Arts | 11,649 | 2.8% |
| Communications | 14,824 | 3.6% |
| Arts & Humanities | 20,866 | 5.1% |
| Total | 410,328 | 100.0% |
Transportation & Commute in Collin County
Vehicle Availability by Sex in Collin County
The most prevalent vehicle ownership categories in Collin County are males with 2 vehicles (149,009, accounting for 48.2%) and females with 2 vehicles (113,591, making up 59.8%).
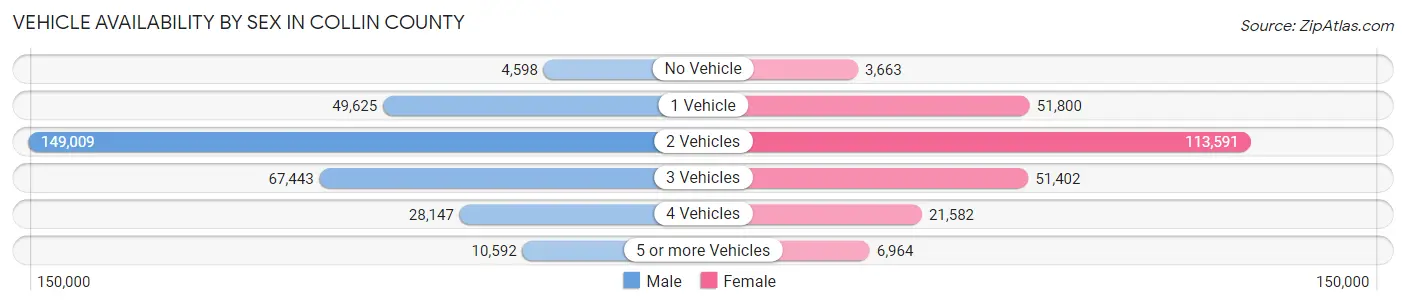
| Vehicles Available | Male | Female |
| No Vehicle | 4,598 (1.5%) | 3,663 (1.5%) |
| 1 Vehicle | 49,625 (16.0%) | 51,800 (20.8%) |
| 2 Vehicles | 149,009 (48.2%) | 113,591 (45.6%) |
| 3 Vehicles | 67,443 (21.8%) | 51,402 (20.6%) |
| 4 Vehicles | 28,147 (9.1%) | 21,582 (8.7%) |
| 5 or more Vehicles | 10,592 (3.4%) | 6,964 (2.8%) |
| Total | 309,414 (100.0%) | 249,002 (100.0%) |
Commute Time in Collin County
The most frequently occuring commute durations in Collin County are 30 to 34 minutes (68,628 commuters, 15.6%), 20 to 24 minutes (61,408 commuters, 14.0%), and 15 to 19 minutes (60,944 commuters, 13.9%).
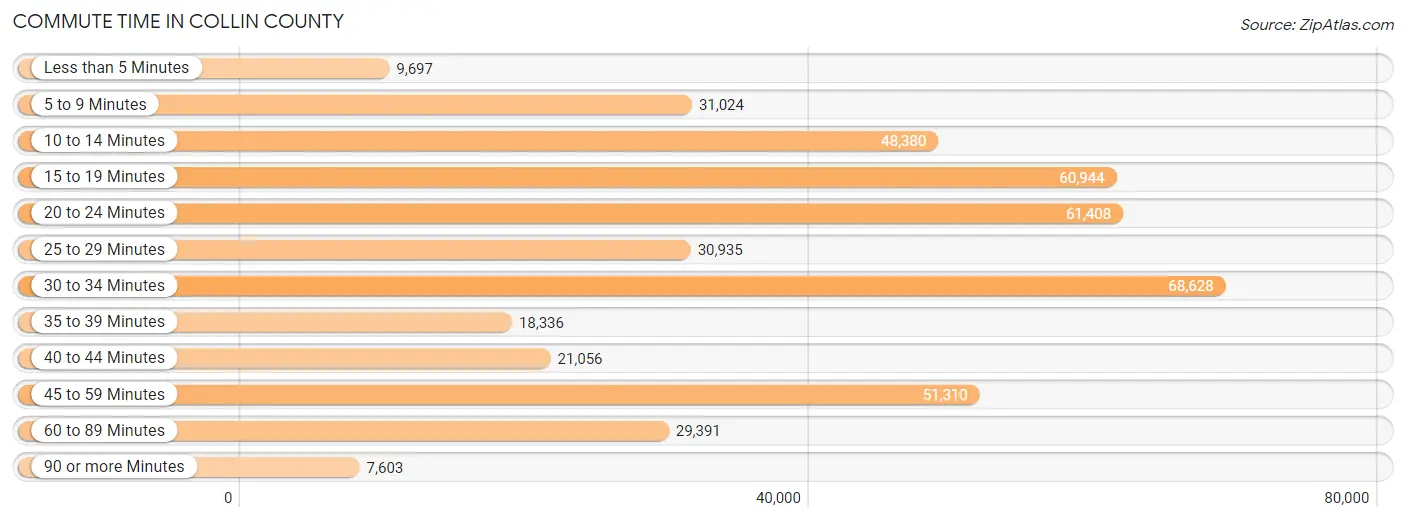
| Commute Time | # Commuters | % Commuters |
| Less than 5 Minutes | 9,697 | 2.2% |
| 5 to 9 Minutes | 31,024 | 7.1% |
| 10 to 14 Minutes | 48,380 | 11.0% |
| 15 to 19 Minutes | 60,944 | 13.9% |
| 20 to 24 Minutes | 61,408 | 14.0% |
| 25 to 29 Minutes | 30,935 | 7.0% |
| 30 to 34 Minutes | 68,628 | 15.6% |
| 35 to 39 Minutes | 18,336 | 4.2% |
| 40 to 44 Minutes | 21,056 | 4.8% |
| 45 to 59 Minutes | 51,310 | 11.7% |
| 60 to 89 Minutes | 29,391 | 6.7% |
| 90 or more Minutes | 7,603 | 1.7% |
Commute Time by Sex in Collin County
The most common commute times in Collin County are 30 to 34 minutes (40,265 commuters, 16.4%) for males and 15 to 19 minutes (30,503 commuters, 15.8%) for females.
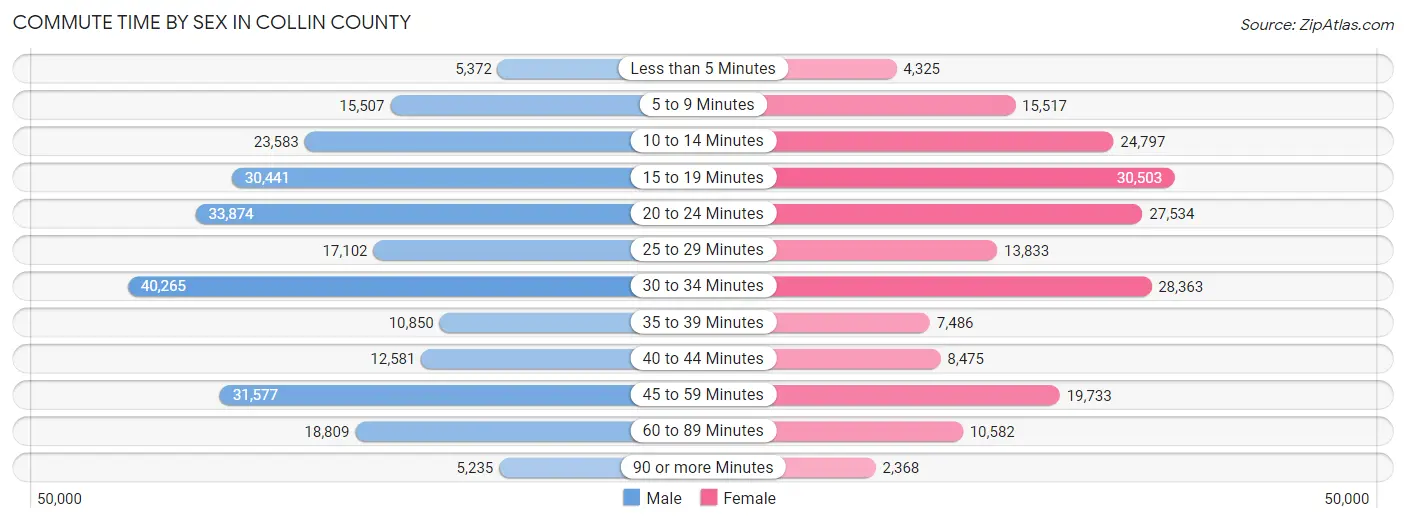
| Commute Time | Male | Female |
| Less than 5 Minutes | 5,372 (2.2%) | 4,325 (2.2%) |
| 5 to 9 Minutes | 15,507 (6.3%) | 15,517 (8.0%) |
| 10 to 14 Minutes | 23,583 (9.6%) | 24,797 (12.8%) |
| 15 to 19 Minutes | 30,441 (12.4%) | 30,503 (15.8%) |
| 20 to 24 Minutes | 33,874 (13.8%) | 27,534 (14.2%) |
| 25 to 29 Minutes | 17,102 (7.0%) | 13,833 (7.1%) |
| 30 to 34 Minutes | 40,265 (16.4%) | 28,363 (14.7%) |
| 35 to 39 Minutes | 10,850 (4.4%) | 7,486 (3.9%) |
| 40 to 44 Minutes | 12,581 (5.1%) | 8,475 (4.4%) |
| 45 to 59 Minutes | 31,577 (12.9%) | 19,733 (10.2%) |
| 60 to 89 Minutes | 18,809 (7.7%) | 10,582 (5.5%) |
| 90 or more Minutes | 5,235 (2.1%) | 2,368 (1.2%) |
Time of Departure to Work by Sex in Collin County
The most frequent times of departure to work in Collin County are 7:00 AM to 7:29 AM (38,990, 15.9%) for males and 7:00 AM to 7:29 AM (32,877, 17.0%) for females.
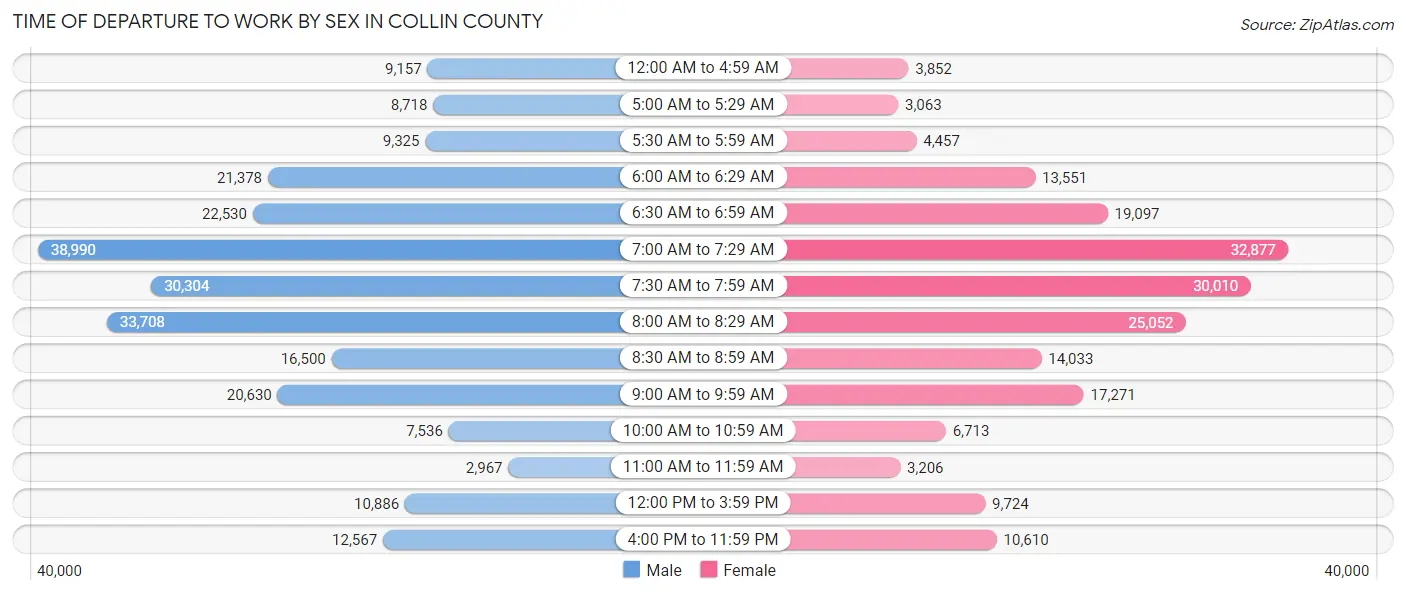
| Time of Departure | Male | Female |
| 12:00 AM to 4:59 AM | 9,157 (3.7%) | 3,852 (2.0%) |
| 5:00 AM to 5:29 AM | 8,718 (3.6%) | 3,063 (1.6%) |
| 5:30 AM to 5:59 AM | 9,325 (3.8%) | 4,457 (2.3%) |
| 6:00 AM to 6:29 AM | 21,378 (8.7%) | 13,551 (7.0%) |
| 6:30 AM to 6:59 AM | 22,530 (9.2%) | 19,097 (9.9%) |
| 7:00 AM to 7:29 AM | 38,990 (15.9%) | 32,877 (17.0%) |
| 7:30 AM to 7:59 AM | 30,304 (12.4%) | 30,010 (15.5%) |
| 8:00 AM to 8:29 AM | 33,708 (13.8%) | 25,052 (13.0%) |
| 8:30 AM to 8:59 AM | 16,500 (6.7%) | 14,033 (7.2%) |
| 9:00 AM to 9:59 AM | 20,630 (8.4%) | 17,271 (8.9%) |
| 10:00 AM to 10:59 AM | 7,536 (3.1%) | 6,713 (3.5%) |
| 11:00 AM to 11:59 AM | 2,967 (1.2%) | 3,206 (1.7%) |
| 12:00 PM to 3:59 PM | 10,886 (4.4%) | 9,724 (5.0%) |
| 4:00 PM to 11:59 PM | 12,567 (5.1%) | 10,610 (5.5%) |
| Total | 245,196 (100.0%) | 193,516 (100.0%) |
Housing Occupancy in Collin County
Occupancy by Ownership in Collin County
Of the total 383,675 dwellings in Collin County, owner-occupied units account for 247,538 (64.5%), while renter-occupied units make up 136,137 (35.5%).
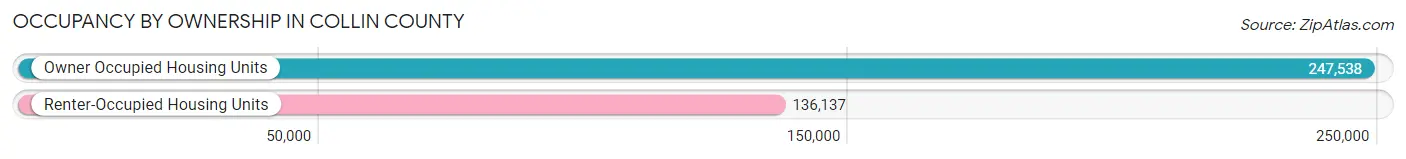
| Occupancy | # Housing Units | % Housing Units |
| Owner Occupied Housing Units | 247,538 | 64.5% |
| Renter-Occupied Housing Units | 136,137 | 35.5% |
| Total Occupied Housing Units | 383,675 | 100.0% |
Occupancy by Household Size in Collin County
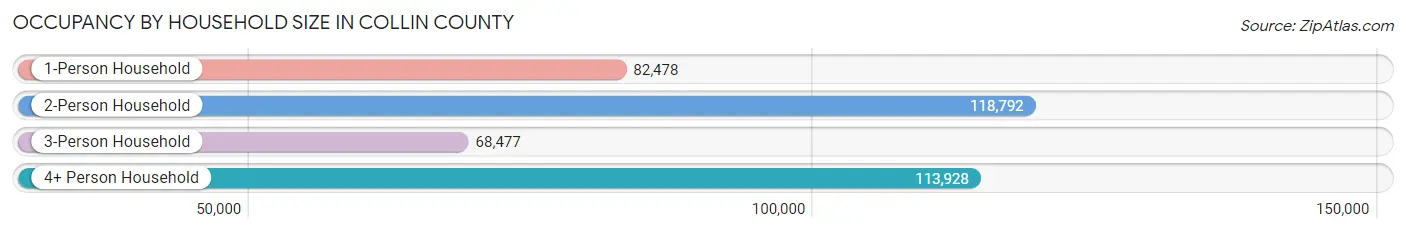
| Household Size | # Housing Units | % Housing Units |
| 1-Person Household | 82,478 | 21.5% |
| 2-Person Household | 118,792 | 31.0% |
| 3-Person Household | 68,477 | 17.8% |
| 4+ Person Household | 113,928 | 29.7% |
| Total Housing Units | 383,675 | 100.0% |
Occupancy by Ownership by Household Size in Collin County
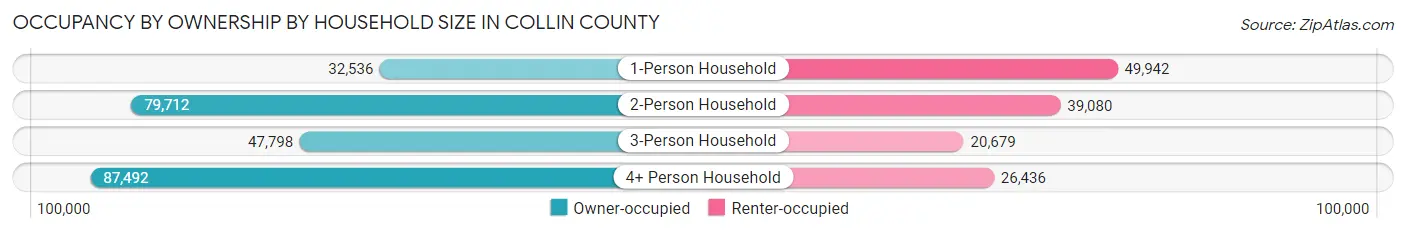
| Household Size | Owner-occupied | Renter-occupied |
| 1-Person Household | 32,536 (39.5%) | 49,942 (60.6%) |
| 2-Person Household | 79,712 (67.1%) | 39,080 (32.9%) |
| 3-Person Household | 47,798 (69.8%) | 20,679 (30.2%) |
| 4+ Person Household | 87,492 (76.8%) | 26,436 (23.2%) |
| Total Housing Units | 247,538 (64.5%) | 136,137 (35.5%) |
Occupancy by Educational Attainment in Collin County
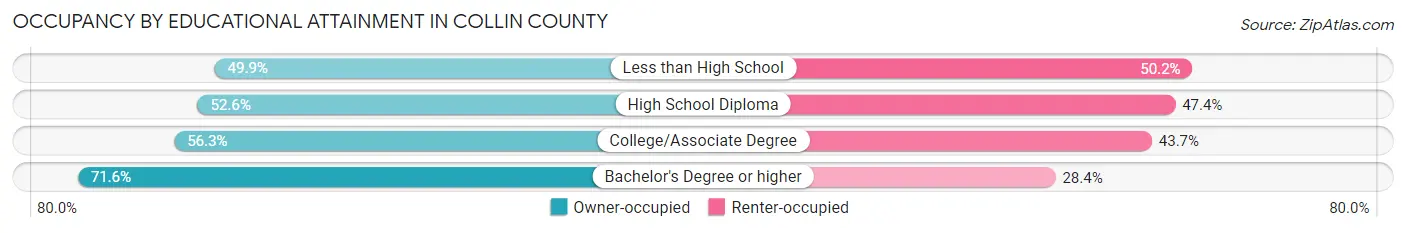
| Household Size | Owner-occupied | Renter-occupied |
| Less than High School | 7,689 (49.8%) | 7,734 (50.1%) |
| High School Diploma | 23,384 (52.6%) | 21,098 (47.4%) |
| College/Associate Degree | 56,017 (56.3%) | 43,538 (43.7%) |
| Bachelor's Degree or higher | 160,448 (71.6%) | 63,767 (28.4%) |
Occupancy by Age of Householder in Collin County
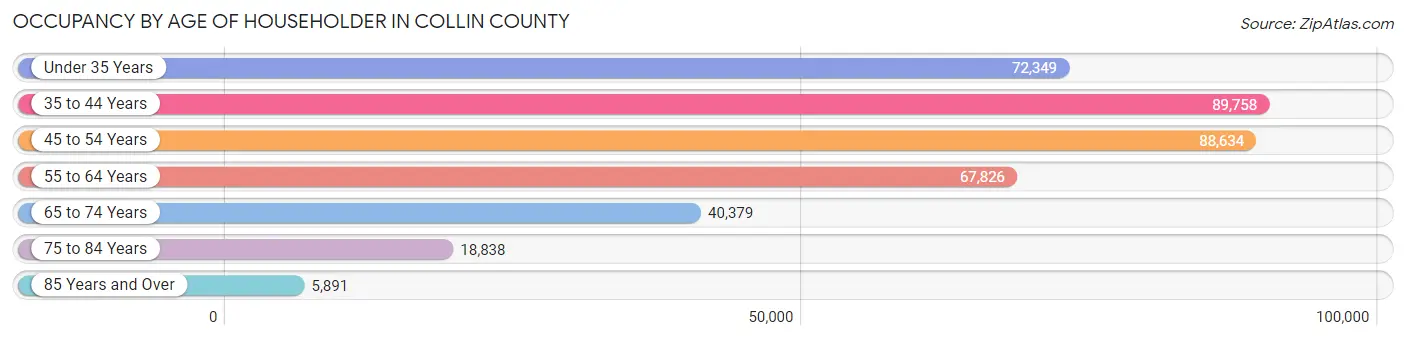
| Age Bracket | # Households | % Households |
| Under 35 Years | 72,349 | 18.9% |
| 35 to 44 Years | 89,758 | 23.4% |
| 45 to 54 Years | 88,634 | 23.1% |
| 55 to 64 Years | 67,826 | 17.7% |
| 65 to 74 Years | 40,379 | 10.5% |
| 75 to 84 Years | 18,838 | 4.9% |
| 85 Years and Over | 5,891 | 1.5% |
| Total | 383,675 | 100.0% |
Housing Finances in Collin County
Median Income by Occupancy in Collin County
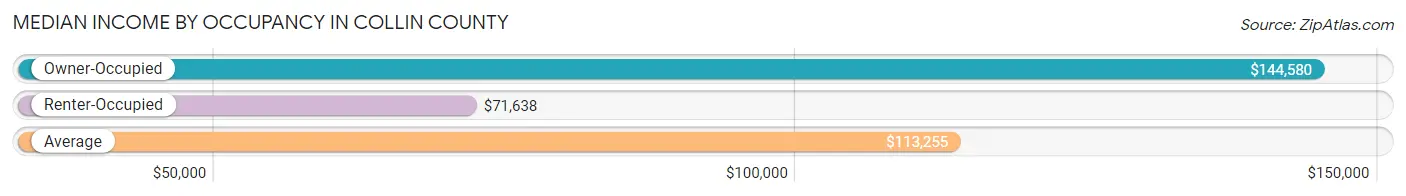
| Occupancy Type | # Households | Median Income |
| Owner-Occupied | 247,538 (64.5%) | $144,580 |
| Renter-Occupied | 136,137 (35.5%) | $71,638 |
| Average | 383,675 (100.0%) | $113,255 |
Occupancy by Householder Income Bracket in Collin County
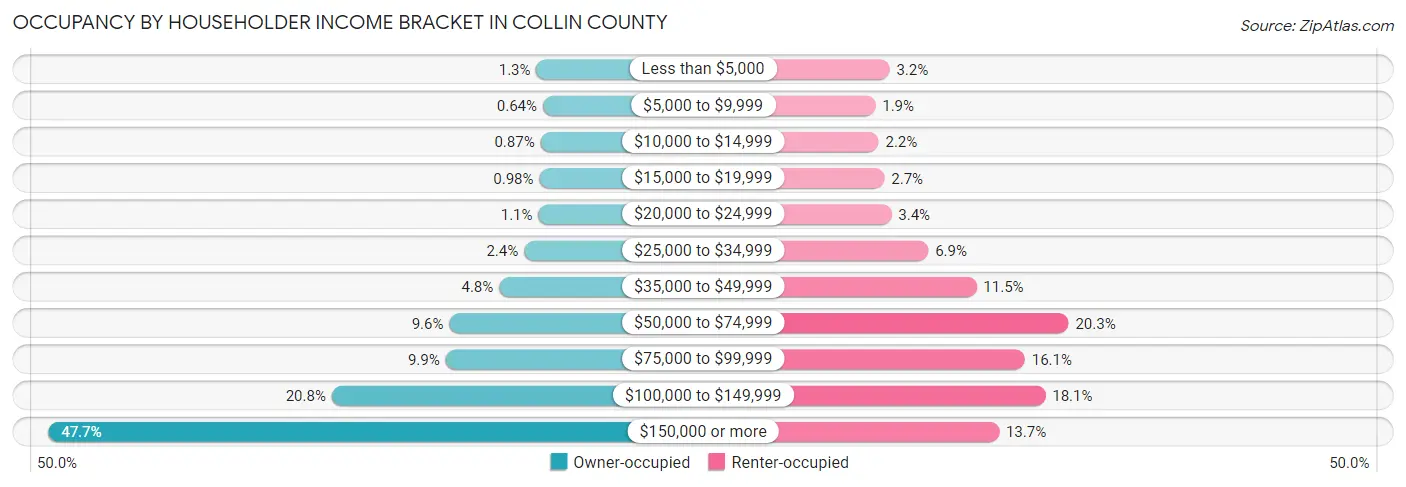
| Income Bracket | Owner-occupied | Renter-occupied |
| Less than $5,000 | 3,131 (1.3%) | 4,401 (3.2%) |
| $5,000 to $9,999 | 1,576 (0.6%) | 2,554 (1.9%) |
| $10,000 to $14,999 | 2,147 (0.9%) | 2,987 (2.2%) |
| $15,000 to $19,999 | 2,426 (1.0%) | 3,734 (2.7%) |
| $20,000 to $24,999 | 2,637 (1.1%) | 4,643 (3.4%) |
| $25,000 to $34,999 | 6,026 (2.4%) | 9,417 (6.9%) |
| $35,000 to $49,999 | 11,903 (4.8%) | 15,667 (11.5%) |
| $50,000 to $74,999 | 23,633 (9.6%) | 27,602 (20.3%) |
| $75,000 to $99,999 | 24,522 (9.9%) | 21,942 (16.1%) |
| $100,000 to $149,999 | 51,361 (20.7%) | 24,597 (18.1%) |
| $150,000 or more | 118,176 (47.7%) | 18,593 (13.7%) |
| Total | 247,538 (100.0%) | 136,137 (100.0%) |
Monthly Housing Cost Tiers in Collin County
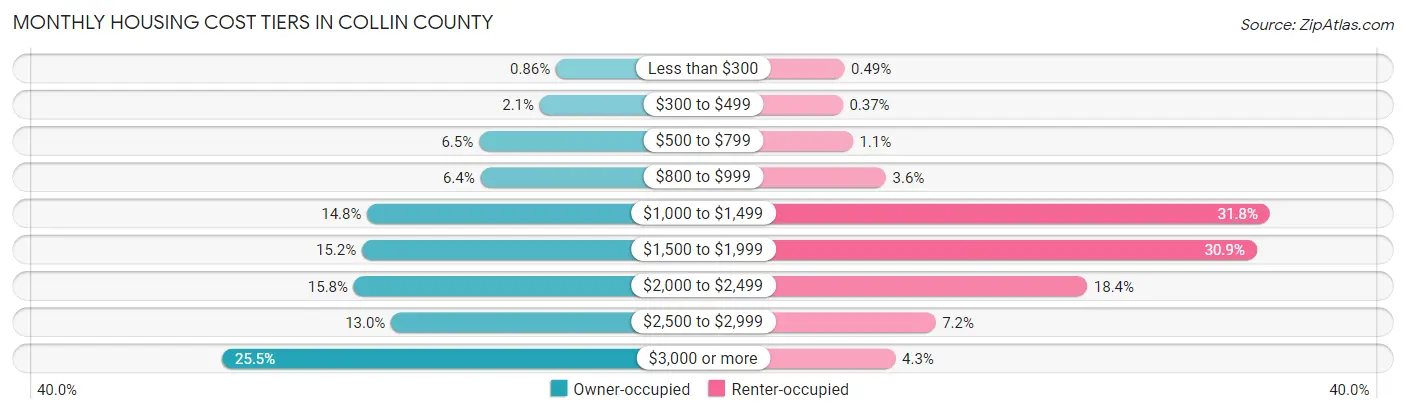
| Monthly Cost | Owner-occupied | Renter-occupied |
| Less than $300 | 2,119 (0.9%) | 673 (0.5%) |
| $300 to $499 | 5,086 (2.1%) | 508 (0.4%) |
| $500 to $799 | 16,159 (6.5%) | 1,511 (1.1%) |
| $800 to $999 | 15,896 (6.4%) | 4,836 (3.5%) |
| $1,000 to $1,499 | 36,544 (14.8%) | 43,348 (31.8%) |
| $1,500 to $1,999 | 37,514 (15.1%) | 42,045 (30.9%) |
| $2,000 to $2,499 | 38,990 (15.8%) | 25,004 (18.4%) |
| $2,500 to $2,999 | 32,177 (13.0%) | 9,799 (7.2%) |
| $3,000 or more | 63,053 (25.5%) | 5,786 (4.3%) |
| Total | 247,538 (100.0%) | 136,137 (100.0%) |
Physical Housing Characteristics in Collin County
Housing Structures in Collin County
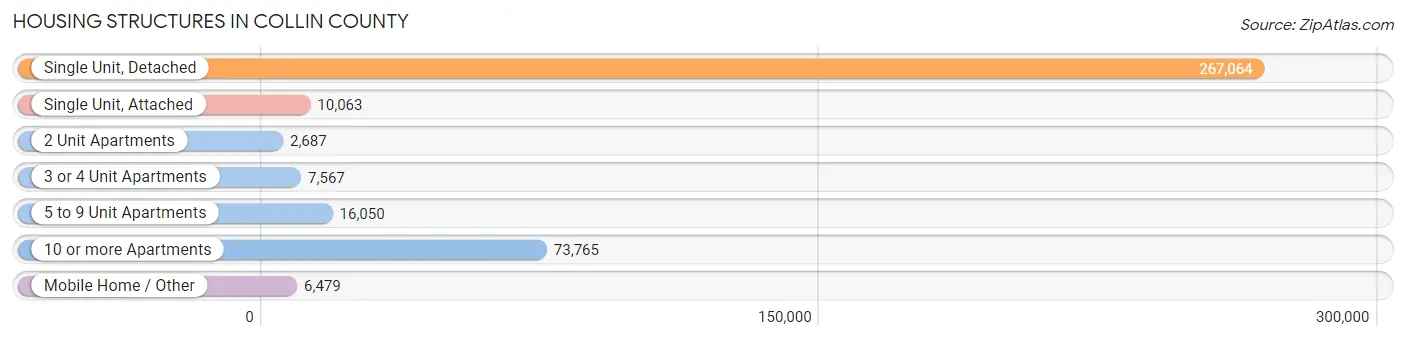
| Structure Type | # Housing Units | % Housing Units |
| Single Unit, Detached | 267,064 | 69.6% |
| Single Unit, Attached | 10,063 | 2.6% |
| 2 Unit Apartments | 2,687 | 0.7% |
| 3 or 4 Unit Apartments | 7,567 | 2.0% |
| 5 to 9 Unit Apartments | 16,050 | 4.2% |
| 10 or more Apartments | 73,765 | 19.2% |
| Mobile Home / Other | 6,479 | 1.7% |
| Total | 383,675 | 100.0% |
Housing Structures by Occupancy in Collin County
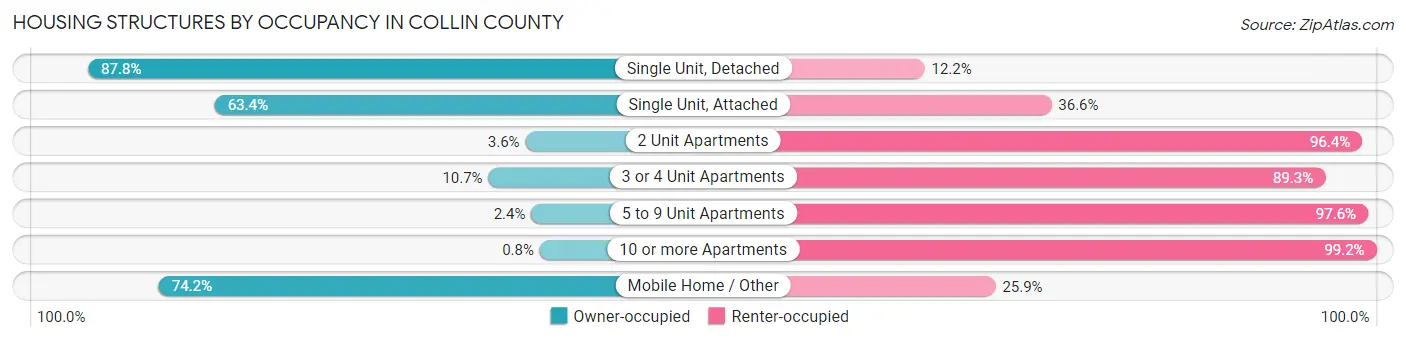
| Structure Type | Owner-occupied | Renter-occupied |
| Single Unit, Detached | 234,467 (87.8%) | 32,597 (12.2%) |
| Single Unit, Attached | 6,378 (63.4%) | 3,685 (36.6%) |
| 2 Unit Apartments | 96 (3.6%) | 2,591 (96.4%) |
| 3 or 4 Unit Apartments | 809 (10.7%) | 6,758 (89.3%) |
| 5 to 9 Unit Apartments | 391 (2.4%) | 15,659 (97.6%) |
| 10 or more Apartments | 593 (0.8%) | 73,172 (99.2%) |
| Mobile Home / Other | 4,804 (74.2%) | 1,675 (25.9%) |
| Total | 247,538 (64.5%) | 136,137 (35.5%) |
Housing Structures by Number of Rooms in Collin County
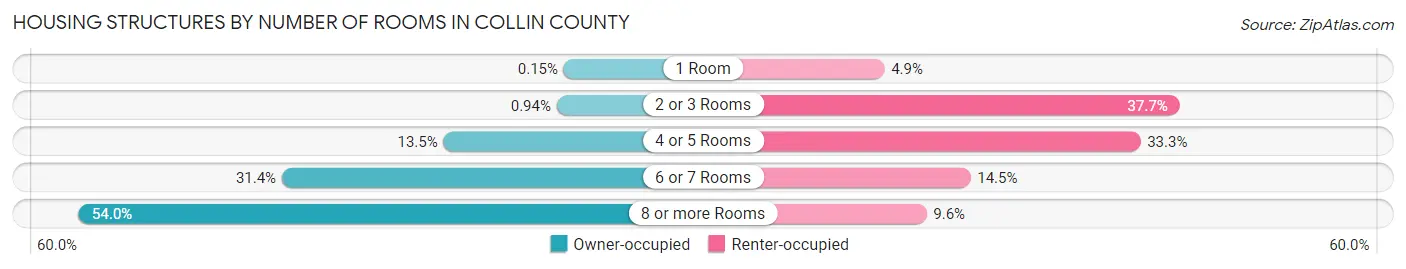
| Number of Rooms | Owner-occupied | Renter-occupied |
| 1 Room | 373 (0.2%) | 6,700 (4.9%) |
| 2 or 3 Rooms | 2,326 (0.9%) | 51,319 (37.7%) |
| 4 or 5 Rooms | 33,414 (13.5%) | 45,368 (33.3%) |
| 6 or 7 Rooms | 77,817 (31.4%) | 19,698 (14.5%) |
| 8 or more Rooms | 133,608 (54.0%) | 13,052 (9.6%) |
| Total | 247,538 (100.0%) | 136,137 (100.0%) |
Housing Structure by Heating Type in Collin County
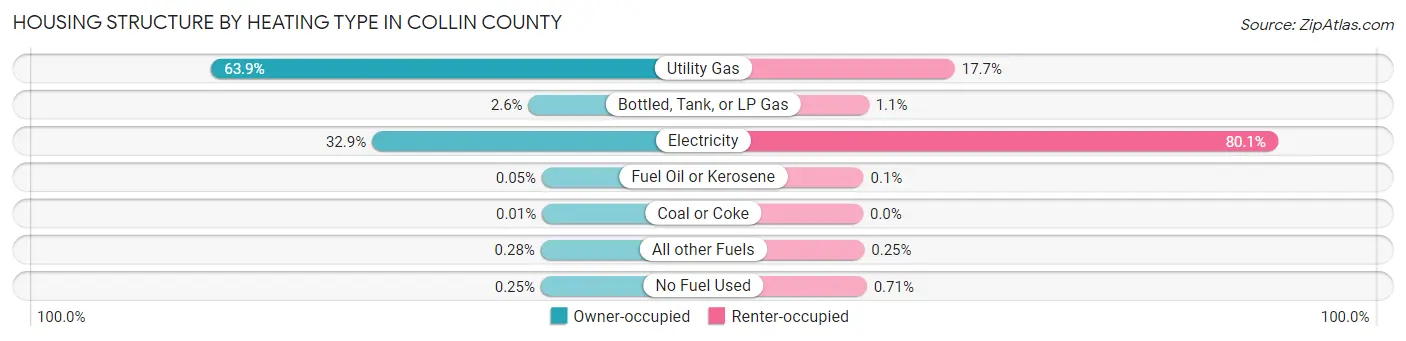
| Heating Type | Owner-occupied | Renter-occupied |
| Utility Gas | 158,199 (63.9%) | 24,136 (17.7%) |
| Bottled, Tank, or LP Gas | 6,537 (2.6%) | 1,483 (1.1%) |
| Electricity | 81,358 (32.9%) | 109,077 (80.1%) |
| Fuel Oil or Kerosene | 119 (0.1%) | 133 (0.1%) |
| Coal or Coke | 27 (0.0%) | 0 (0.0%) |
| All other Fuels | 688 (0.3%) | 336 (0.3%) |
| No Fuel Used | 610 (0.3%) | 972 (0.7%) |
| Total | 247,538 (100.0%) | 136,137 (100.0%) |
Household Vehicle Usage in Collin County
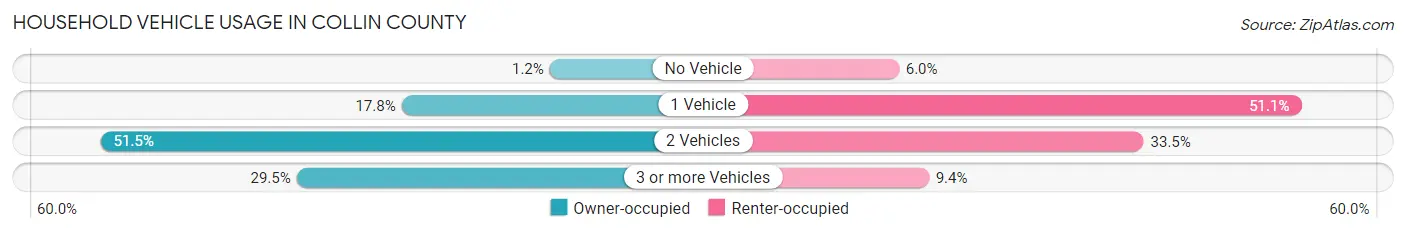
| Vehicles per Household | Owner-occupied | Renter-occupied |
| No Vehicle | 2,940 (1.2%) | 8,213 (6.0%) |
| 1 Vehicle | 44,013 (17.8%) | 69,586 (51.1%) |
| 2 Vehicles | 127,459 (51.5%) | 45,549 (33.5%) |
| 3 or more Vehicles | 73,126 (29.5%) | 12,789 (9.4%) |
| Total | 247,538 (100.0%) | 136,137 (100.0%) |
Real Estate & Mortgages in Collin County
Real Estate and Mortgage Overview in Collin County
| Characteristic | Without Mortgage | With Mortgage |
| Housing Units | 73,332 | 174,206 |
| Median Property Value | $388,000 | $420,900 |
| Median Household Income | $112,884 | $91,471 |
| Monthly Housing Costs | $1,007 | $62,000 |
| Real Estate Taxes | $6,320 | $2,725 |
Property Value by Mortgage Status in Collin County
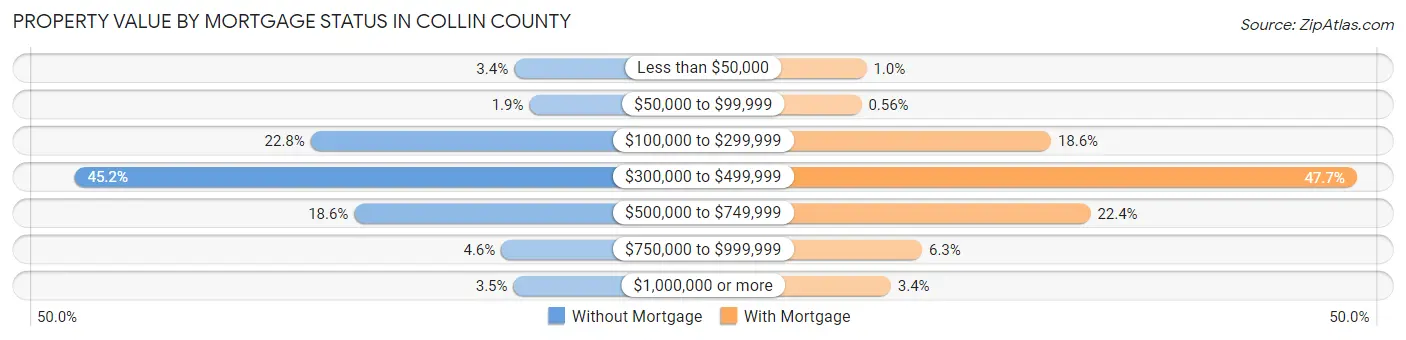
| Property Value | Without Mortgage | With Mortgage |
| Less than $50,000 | 2,488 (3.4%) | 1,817 (1.0%) |
| $50,000 to $99,999 | 1,415 (1.9%) | 983 (0.6%) |
| $100,000 to $299,999 | 16,693 (22.8%) | 32,417 (18.6%) |
| $300,000 to $499,999 | 33,172 (45.2%) | 83,143 (47.7%) |
| $500,000 to $749,999 | 13,646 (18.6%) | 38,973 (22.4%) |
| $750,000 to $999,999 | 3,390 (4.6%) | 11,022 (6.3%) |
| $1,000,000 or more | 2,528 (3.5%) | 5,851 (3.4%) |
| Total | 73,332 (100.0%) | 174,206 (100.0%) |
Household Income by Mortgage Status in Collin County
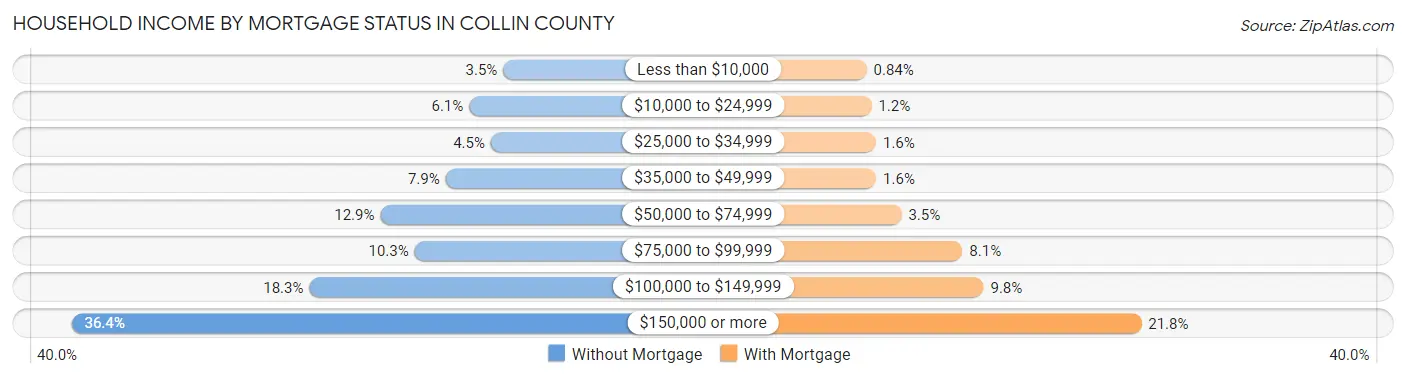
| Household Income | Without Mortgage | With Mortgage |
| Less than $10,000 | 2,599 (3.5%) | 1,466 (0.8%) |
| $10,000 to $24,999 | 4,494 (6.1%) | 2,108 (1.2%) |
| $25,000 to $34,999 | 3,288 (4.5%) | 2,716 (1.6%) |
| $35,000 to $49,999 | 5,812 (7.9%) | 2,738 (1.6%) |
| $50,000 to $74,999 | 9,461 (12.9%) | 6,091 (3.5%) |
| $75,000 to $99,999 | 7,545 (10.3%) | 14,172 (8.1%) |
| $100,000 to $149,999 | 13,428 (18.3%) | 16,977 (9.8%) |
| $150,000 or more | 26,705 (36.4%) | 37,933 (21.8%) |
| Total | 73,332 (100.0%) | 174,206 (100.0%) |
Property Value to Household Income Ratio in Collin County
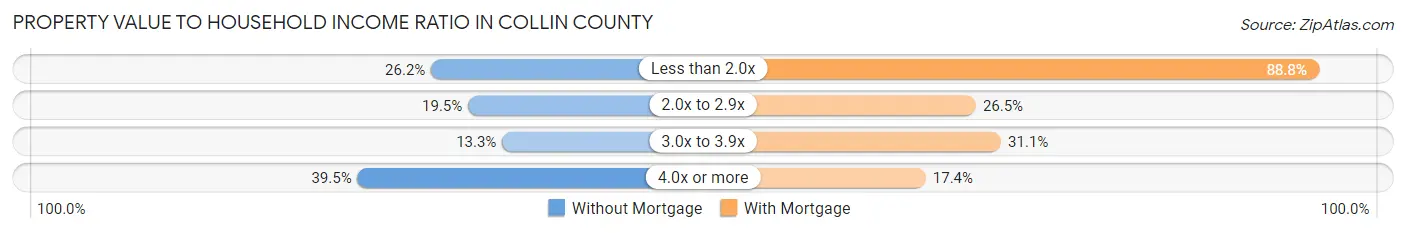
| Value-to-Income Ratio | Without Mortgage | With Mortgage |
| Less than 2.0x | 19,183 (26.2%) | 154,649 (88.8%) |
| 2.0x to 2.9x | 14,263 (19.5%) | 46,208 (26.5%) |
| 3.0x to 3.9x | 9,725 (13.3%) | 54,186 (31.1%) |
| 4.0x or more | 28,995 (39.5%) | 30,354 (17.4%) |
| Total | 73,332 (100.0%) | 174,206 (100.0%) |
Real Estate Taxes by Mortgage Status in Collin County

| Property Taxes | Without Mortgage | With Mortgage |
| Less than $800 | 2,948 (4.0%) | 635 (0.4%) |
| $800 to $1,499 | 2,875 (3.9%) | 2,009 (1.1%) |
| $800 to $1,499 | 65,593 (89.4%) | 2,711 (1.6%) |
| Total | 73,332 (100.0%) | 174,206 (100.0%) |
Health & Disability in Collin County
Health Insurance Coverage by Age in Collin County
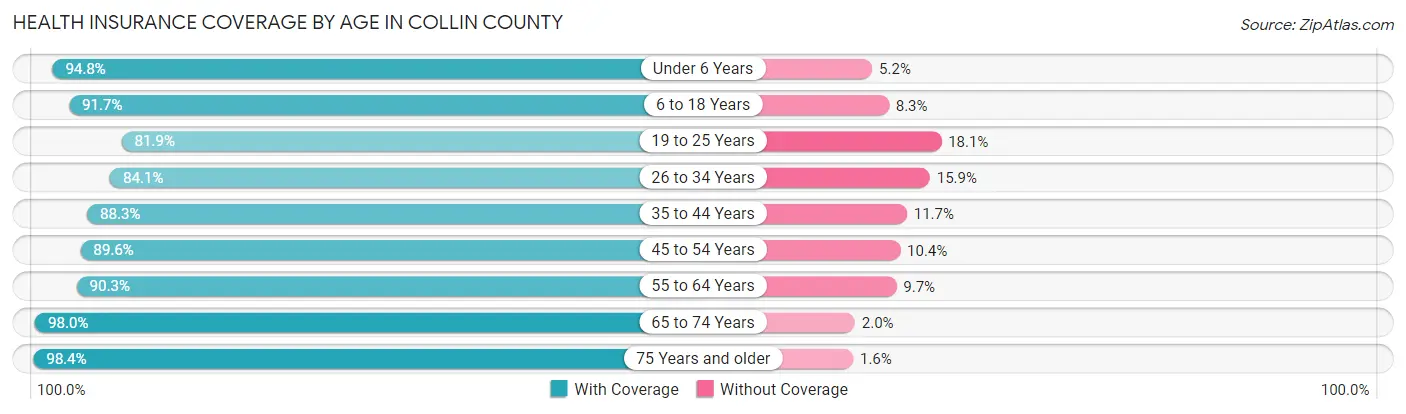
| Age Bracket | With Coverage | Without Coverage |
| Under 6 Years | 73,175 (94.8%) | 4,017 (5.2%) |
| 6 to 18 Years | 194,080 (91.7%) | 17,547 (8.3%) |
| 19 to 25 Years | 74,464 (81.9%) | 16,423 (18.1%) |
| 26 to 34 Years | 104,584 (84.1%) | 19,825 (15.9%) |
| 35 to 44 Years | 150,528 (88.3%) | 19,866 (11.7%) |
| 45 to 54 Years | 144,117 (89.6%) | 16,741 (10.4%) |
| 55 to 64 Years | 109,110 (90.3%) | 11,737 (9.7%) |
| 65 to 74 Years | 73,046 (98.0%) | 1,465 (2.0%) |
| 75 Years and older | 44,243 (98.4%) | 732 (1.6%) |
| Total | 967,347 (89.9%) | 108,353 (10.1%) |
Health Insurance Coverage by Citizenship Status in Collin County
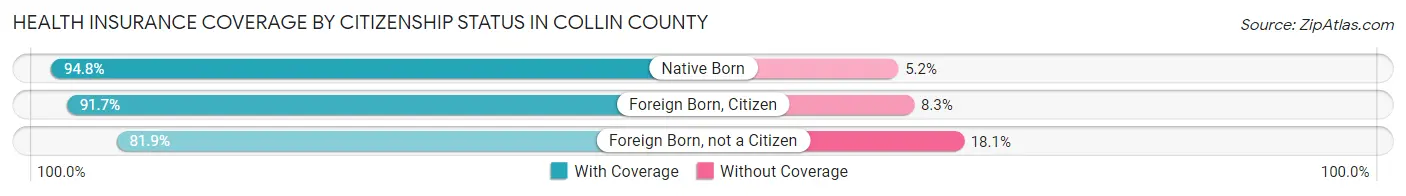
| Citizenship Status | With Coverage | Without Coverage |
| Native Born | 73,175 (94.8%) | 4,017 (5.2%) |
| Foreign Born, Citizen | 194,080 (91.7%) | 17,547 (8.3%) |
| Foreign Born, not a Citizen | 74,464 (81.9%) | 16,423 (18.1%) |
Health Insurance Coverage by Household Income in Collin County
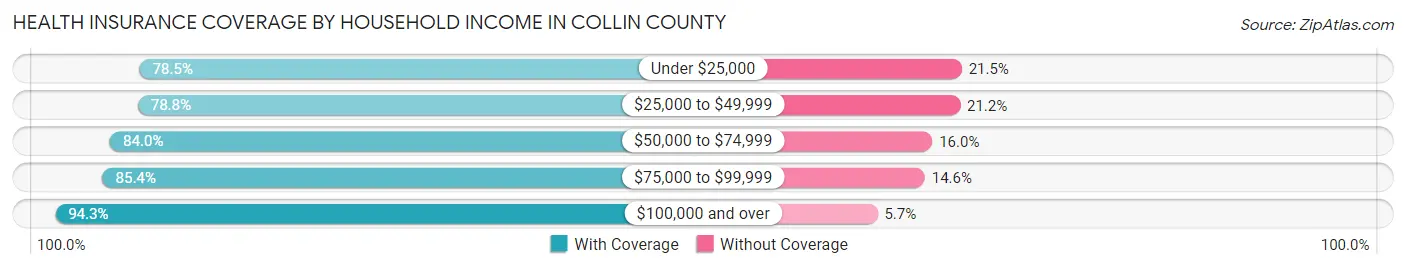
| Household Income | With Coverage | Without Coverage |
| Under $25,000 | 45,655 (78.5%) | 12,527 (21.5%) |
| $25,000 to $49,999 | 73,330 (78.8%) | 19,746 (21.2%) |
| $50,000 to $74,999 | 99,514 (84.0%) | 18,963 (16.0%) |
| $75,000 to $99,999 | 103,934 (85.4%) | 17,795 (14.6%) |
| $100,000 and over | 641,945 (94.3%) | 39,121 (5.7%) |
Public vs Private Health Insurance Coverage by Age in Collin County
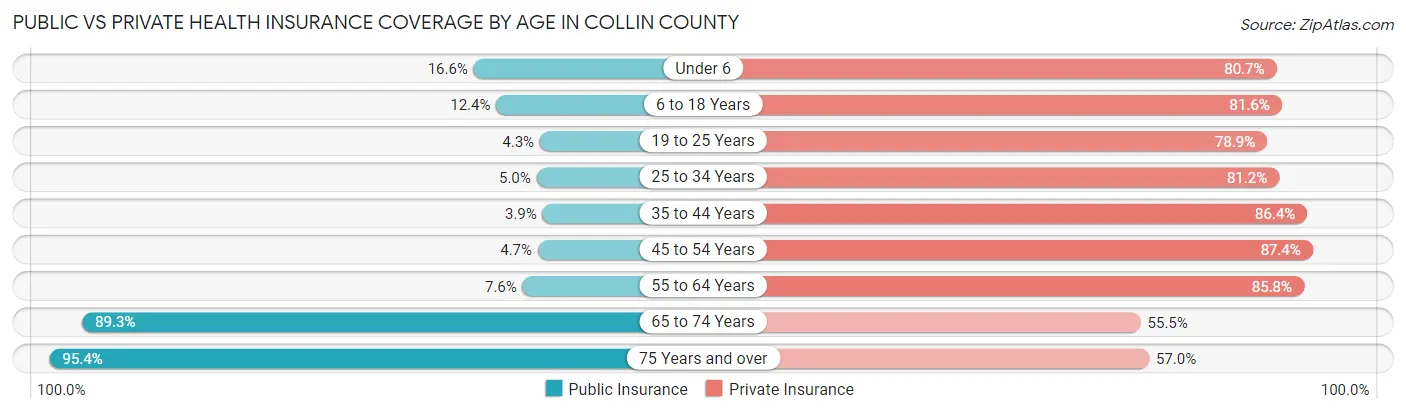
| Age Bracket | Public Insurance | Private Insurance |
| Under 6 | 12,846 (16.6%) | 62,257 (80.6%) |
| 6 to 18 Years | 26,319 (12.4%) | 172,764 (81.6%) |
| 19 to 25 Years | 3,941 (4.3%) | 71,726 (78.9%) |
| 25 to 34 Years | 6,176 (5.0%) | 100,981 (81.2%) |
| 35 to 44 Years | 6,573 (3.9%) | 147,176 (86.4%) |
| 45 to 54 Years | 7,608 (4.7%) | 140,589 (87.4%) |
| 55 to 64 Years | 9,131 (7.6%) | 103,642 (85.8%) |
| 65 to 74 Years | 66,558 (89.3%) | 41,322 (55.5%) |
| 75 Years and over | 42,900 (95.4%) | 25,645 (57.0%) |
| Total | 182,052 (16.9%) | 866,102 (80.5%) |
Disability Status by Sex by Age in Collin County
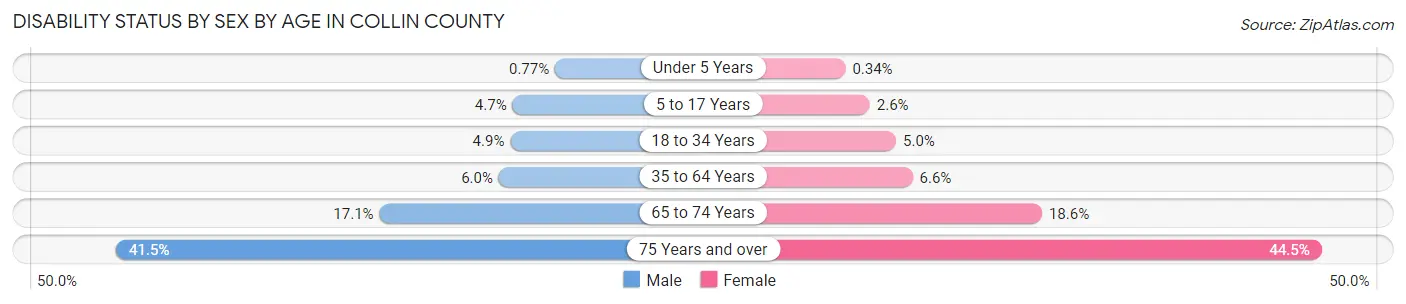
| Age Bracket | Male | Female |
| Under 5 Years | 249 (0.8%) | 106 (0.3%) |
| 5 to 17 Years | 5,021 (4.7%) | 2,650 (2.6%) |
| 18 to 34 Years | 5,777 (4.9%) | 5,816 (5.0%) |
| 35 to 64 Years | 13,552 (6.0%) | 14,830 (6.6%) |
| 65 to 74 Years | 5,853 (17.1%) | 7,476 (18.6%) |
| 75 Years and over | 7,913 (41.5%) | 11,536 (44.5%) |
Disability Class by Sex by Age in Collin County
Disability Class: Hearing Difficulty
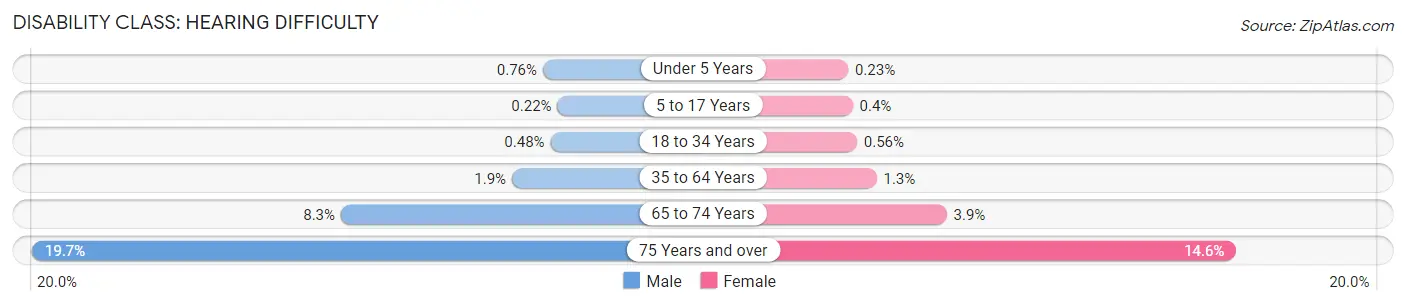
| Age Bracket | Male | Female |
| Under 5 Years | 243 (0.8%) | 71 (0.2%) |
| 5 to 17 Years | 239 (0.2%) | 409 (0.4%) |
| 18 to 34 Years | 565 (0.5%) | 641 (0.6%) |
| 35 to 64 Years | 4,319 (1.9%) | 2,908 (1.3%) |
| 65 to 74 Years | 2,833 (8.3%) | 1,566 (3.9%) |
| 75 Years and over | 3,762 (19.7%) | 3,794 (14.6%) |
Disability Class: Vision Difficulty
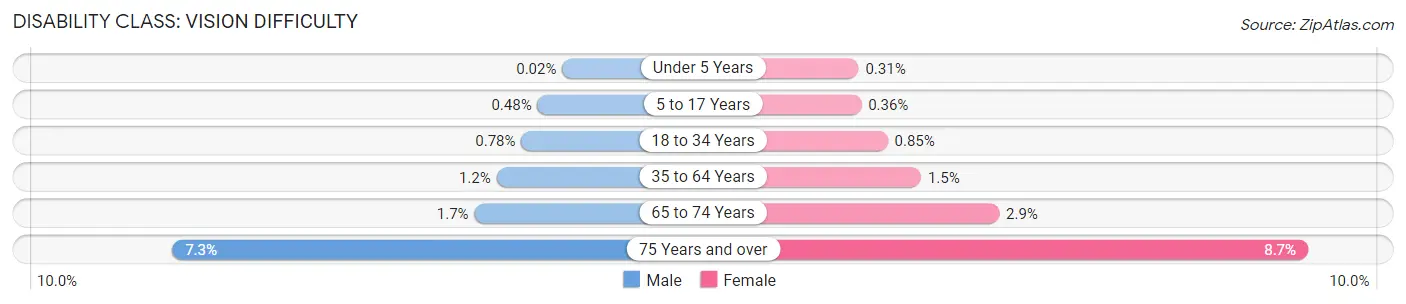
| Age Bracket | Male | Female |
| Under 5 Years | 6 (0.0%) | 95 (0.3%) |
| 5 to 17 Years | 513 (0.5%) | 366 (0.4%) |
| 18 to 34 Years | 914 (0.8%) | 983 (0.9%) |
| 35 to 64 Years | 2,807 (1.2%) | 3,320 (1.5%) |
| 65 to 74 Years | 566 (1.7%) | 1,175 (2.9%) |
| 75 Years and over | 1,384 (7.3%) | 2,242 (8.6%) |
Disability Class: Cognitive Difficulty
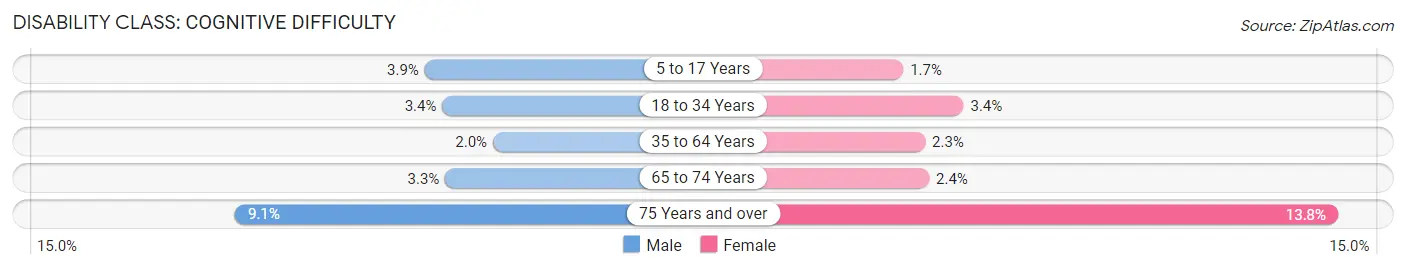
| Age Bracket | Male | Female |
| 5 to 17 Years | 4,108 (3.9%) | 1,747 (1.7%) |
| 18 to 34 Years | 3,953 (3.4%) | 3,915 (3.4%) |
| 35 to 64 Years | 4,442 (2.0%) | 5,242 (2.3%) |
| 65 to 74 Years | 1,127 (3.3%) | 976 (2.4%) |
| 75 Years and over | 1,742 (9.1%) | 3,579 (13.8%) |
Disability Class: Ambulatory Difficulty
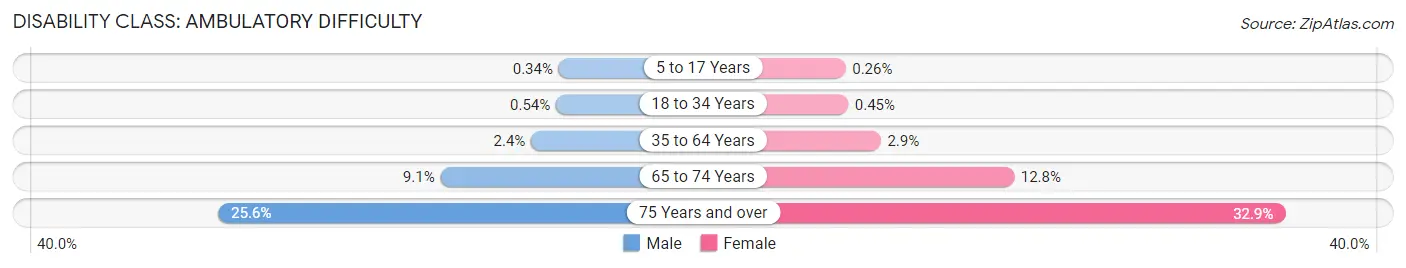
| Age Bracket | Male | Female |
| 5 to 17 Years | 363 (0.3%) | 269 (0.3%) |
| 18 to 34 Years | 638 (0.5%) | 515 (0.4%) |
| 35 to 64 Years | 5,417 (2.4%) | 6,480 (2.9%) |
| 65 to 74 Years | 3,126 (9.1%) | 5,137 (12.8%) |
| 75 Years and over | 4,886 (25.6%) | 8,530 (32.9%) |
Disability Class: Self-Care Difficulty
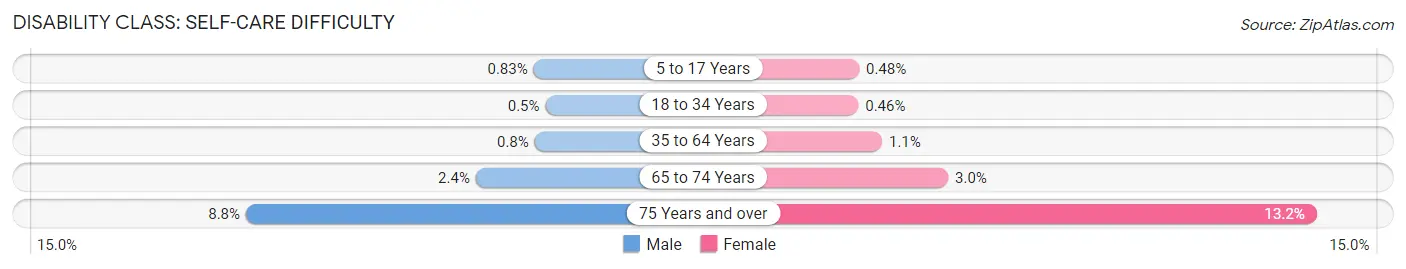
| Age Bracket | Male | Female |
| 5 to 17 Years | 885 (0.8%) | 492 (0.5%) |
| 18 to 34 Years | 591 (0.5%) | 530 (0.5%) |
| 35 to 64 Years | 1,816 (0.8%) | 2,525 (1.1%) |
| 65 to 74 Years | 836 (2.4%) | 1,190 (3.0%) |
| 75 Years and over | 1,686 (8.8%) | 3,426 (13.2%) |
Technology Access in Collin County
Computing Device Access in Collin County
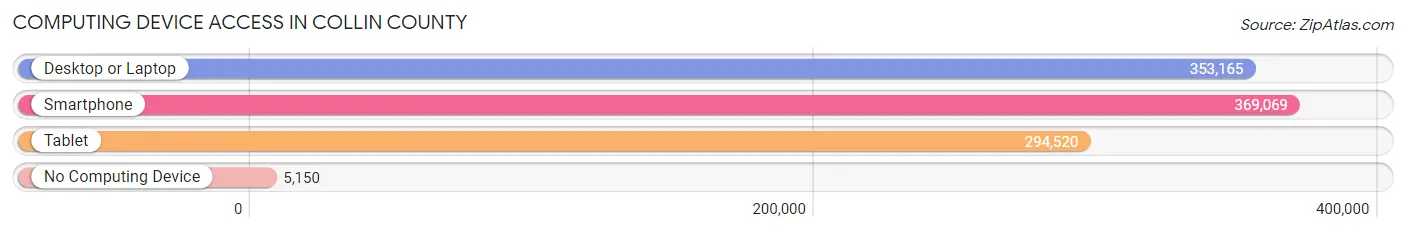
| Device Type | # Households | % Households |
| Desktop or Laptop | 353,165 | 92.0% |
| Smartphone | 369,069 | 96.2% |
| Tablet | 294,520 | 76.8% |
| No Computing Device | 5,150 | 1.3% |
| Total | 383,675 | 100.0% |
Internet Access in Collin County
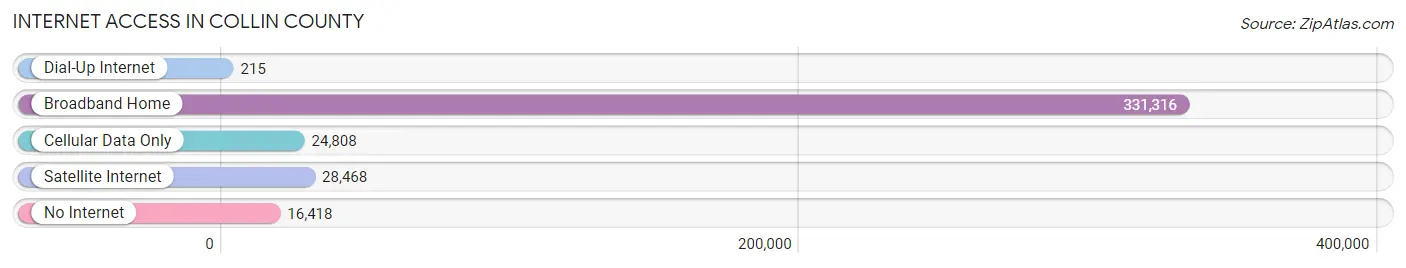
| Internet Type | # Households | % Households |
| Dial-Up Internet | 215 | 0.1% |
| Broadband Home | 331,316 | 86.4% |
| Cellular Data Only | 24,808 | 6.5% |
| Satellite Internet | 28,468 | 7.4% |
| No Internet | 16,418 | 4.3% |
| Total | 383,675 | 100.0% |
Collin County Summary
Collin County, Texas is located in the northeastern part of the state, just north of Dallas County. It is part of the Dallas-Fort Worth-Arlington metropolitan area and is one of the fastest growing counties in the United States. The county seat is McKinney, and the county is named after Collin McKinney, one of the signers of the Texas Declaration of Independence.
Geography
Collin County covers 886 square miles and is bordered by Grayson County to the north, Fannin County to the east, Hunt County to the south, and Dallas and Denton Counties to the west. The county is mostly flat, with some rolling hills in the western part. The terrain is mostly prairie, with some wooded areas in the eastern part. The county is drained by the Elm Fork of the Trinity River and several creeks, including Bois d'Arc Creek, Chambers Creek, and Lavon Lake.
Climate
Collin County has a humid subtropical climate, with hot summers and mild winters. The average annual temperature is 68°F, and the average annual precipitation is 37 inches.
Demographics
As of the 2010 census, the population of Collin County was 782,341, making it the seventh most populous county in Texas. The population density was 890 people per square mile. The racial makeup of the county was 79.2% White, 8.2% African American, 0.7% Native American, 6.3% Asian, and 4.6% from other races. Hispanic or Latino of any race made up 19.3% of the population.
The median household income was $87,822, and the median family income was $99,919. The per capita income was $37,948. About 4.2% of the population was below the poverty line.
Economy
Collin County has a diverse economy, with a mix of manufacturing, technology, and service industries. The county is home to several large companies, including Raytheon, Frito-Lay, and Dr Pepper Snapple Group. The county is also home to several universities, including the University of Texas at Dallas, Collin College, and Texas A&M University-Commerce.
The county's largest employers are Raytheon, Frito-Lay, Dr Pepper Snapple Group, and the University of Texas at Dallas. The county's unemployment rate was 3.2% in 2019.
History
Collin County was established in 1846, and was named after Collin McKinney, one of the signers of the Texas Declaration of Independence. The county was originally part of Fannin County, but was split off in 1846. The county seat was originally Buckner, but was moved to McKinney in 1848.
The county grew rapidly in the late 19th and early 20th centuries, as the population increased from 4,000 in 1880 to over 20,000 by 1910. The county continued to grow in the 20th century, and by 2000 the population had reached 514,000. The population has continued to grow since then, and as of 2019 the population was estimated to be over 900,000.
Common Questions
What is Per Capita Income in Collin County?
Per Capita income in Collin County is $52,654.
What is the Median Family Income in Collin County?
Median Family Income in Collin County is $134,685.
What is the Median Household income in Collin County?
Median Household Income in Collin County is $113,255.
What is Income or Wage Gap in Collin County?
Income or Wage Gap in Collin County is 36.7%.
Women in Collin County earn 63.3 cents for every dollar earned by a man.
What is Family Income Deficit in Collin County?
Family Income Deficit in Collin County is $12,443.
Families that are below poverty line in Collin County earn $12,443 less on average than the poverty threshold level.
What is Inequality or Gini Index in Collin County?
Inequality or Gini Index in Collin County is 0.43.
What is the Total Population of Collin County?
Total Population of Collin County is 1,079,153.
What is the Total Male Population of Collin County?
Total Male Population of Collin County is 537,145.
What is the Total Female Population of Collin County?
Total Female Population of Collin County is 542,008.
What is the Ratio of Males per 100 Females in Collin County?
There are 99.10 Males per 100 Females in Collin County.
What is the Ratio of Females per 100 Males in Collin County?
There are 100.91 Females per 100 Males in Collin County.
What is the Median Population Age in Collin County?
Median Population Age in Collin County is 37.1 Years.
What is the Average Family Size in Collin County
Average Family Size in Collin County is 3.3 People.
What is the Average Household Size in Collin County
Average Household Size in Collin County is 2.8 People.
How Large is the Labor Force in Collin County?
There are 591,130 People in the Labor Forcein in Collin County.
What is the Percentage of People in the Labor Force in Collin County?
70.3% of People are in the Labor Force in Collin County.
What is the Unemployment Rate in Collin County?
Unemployment Rate in Collin County is 4.2%.