Guadalupe County, TX Map & Demographics
Guadalupe County Map
Guadalupe County Overview
$37,184
PER CAPITA INCOME
$100,117
AVG FAMILY INCOME
$88,111
AVG HOUSEHOLD INCOME
31.4%
WAGE / INCOME GAP [ % ]
68.6¢/ $1
WAGE / INCOME GAP [ $ ]
$10,012
FAMILY INCOME DEFICIT
0.39
INEQUALITY / GINI INDEX
173,828
TOTAL POPULATION
86,706
MALE POPULATION
87,122
FEMALE POPULATION
99.52
MALES / 100 FEMALES
100.48
FEMALES / 100 MALES
37.3
MEDIAN AGE
3.3
AVG FAMILY SIZE
2.8
AVG HOUSEHOLD SIZE
87,958
LABOR FORCE [ PEOPLE ]
64.6%
PERCENT IN LABOR FORCE
4.3%
UNEMPLOYMENT RATE
Income in Guadalupe County
Income Overview in Guadalupe County
Per Capita Income in Guadalupe County is $37,184, while median incomes of families and households are $100,117 and $88,111 respectively.
| Characteristic | Number | Measure |
| Per Capita Income | 173,828 | $37,184 |
| Median Family Income | 45,960 | $100,117 |
| Mean Family Income | 45,960 | $115,498 |
| Median Household Income | 60,463 | $88,111 |
| Mean Household Income | 60,463 | $104,433 |
| Income Deficit | 45,960 | $10,012 |
| Wage / Income Gap (%) | 173,828 | 31.40% |
| Wage / Income Gap ($) | 173,828 | 68.60¢ per $1 |
| Gini / Inequality Index | 173,828 | 0.39 |
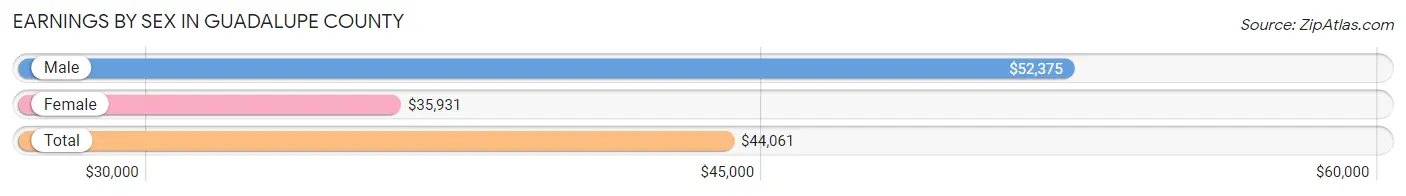
Earnings by Sex in Guadalupe County
Average Earnings in Guadalupe County are $44,061, $52,375 for men and $35,931 for women, a difference of 31.4%.
| Sex | Number | Average Earnings |
| Male | 49,375 (53.9%) | $52,375 |
| Female | 42,227 (46.1%) | $35,931 |
| Total | 91,602 (100.0%) | $44,061 |
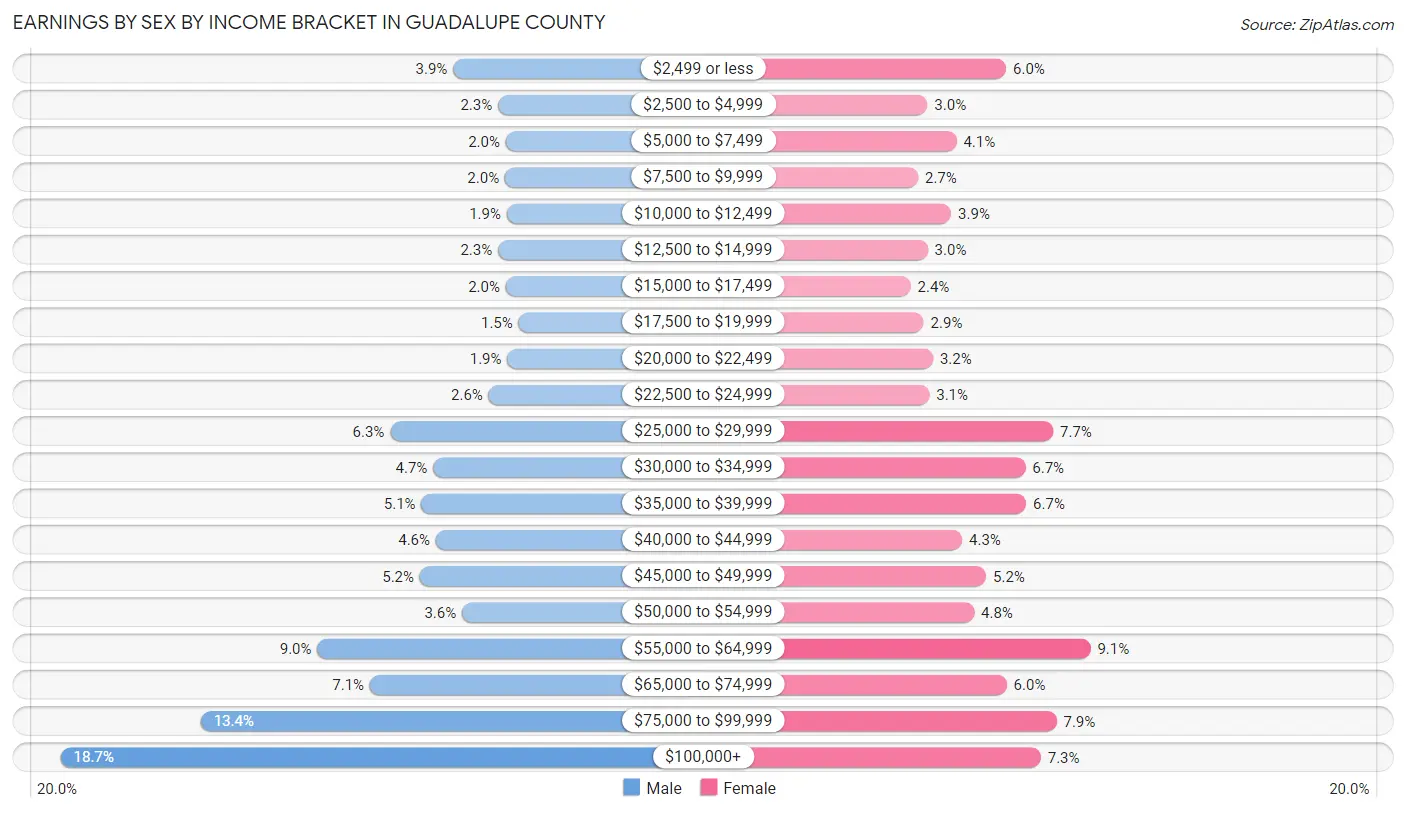
Earnings by Sex by Income Bracket in Guadalupe County
The most common earnings brackets in Guadalupe County are $100,000+ for men (9,208 | 18.6%) and $55,000 to $64,999 for women (3,854 | 9.1%).
| Income | Male | Female |
| $2,499 or less | 1,947 (3.9%) | 2,521 (6.0%) |
| $2,500 to $4,999 | 1,115 (2.3%) | 1,277 (3.0%) |
| $5,000 to $7,499 | 974 (2.0%) | 1,735 (4.1%) |
| $7,500 to $9,999 | 989 (2.0%) | 1,129 (2.7%) |
| $10,000 to $12,499 | 954 (1.9%) | 1,652 (3.9%) |
| $12,500 to $14,999 | 1,114 (2.3%) | 1,280 (3.0%) |
| $15,000 to $17,499 | 974 (2.0%) | 1,008 (2.4%) |
| $17,500 to $19,999 | 737 (1.5%) | 1,215 (2.9%) |
| $20,000 to $22,499 | 943 (1.9%) | 1,363 (3.2%) |
| $22,500 to $24,999 | 1,287 (2.6%) | 1,306 (3.1%) |
| $25,000 to $29,999 | 3,110 (6.3%) | 3,263 (7.7%) |
| $30,000 to $34,999 | 2,318 (4.7%) | 2,825 (6.7%) |
| $35,000 to $39,999 | 2,534 (5.1%) | 2,837 (6.7%) |
| $40,000 to $44,999 | 2,264 (4.6%) | 1,826 (4.3%) |
| $45,000 to $49,999 | 2,562 (5.2%) | 2,206 (5.2%) |
| $50,000 to $54,999 | 1,784 (3.6%) | 2,015 (4.8%) |
| $55,000 to $64,999 | 4,458 (9.0%) | 3,854 (9.1%) |
| $65,000 to $74,999 | 3,487 (7.1%) | 2,528 (6.0%) |
| $75,000 to $99,999 | 6,616 (13.4%) | 3,319 (7.9%) |
| $100,000+ | 9,208 (18.6%) | 3,068 (7.3%) |
| Total | 49,375 (100.0%) | 42,227 (100.0%) |
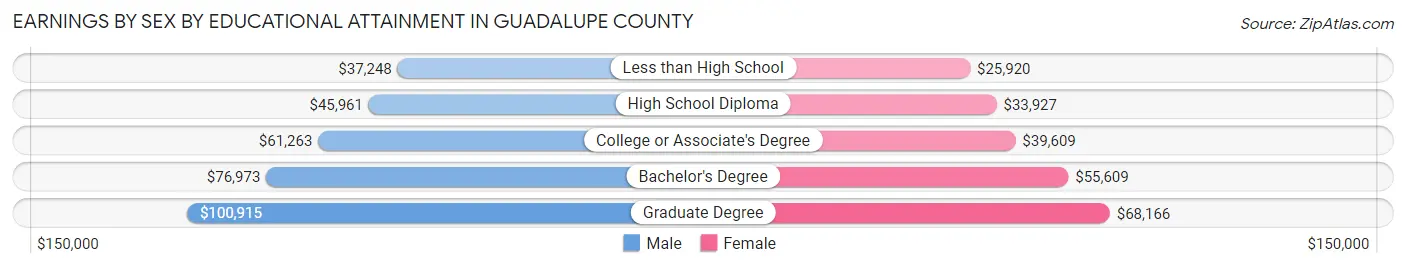
Earnings by Sex by Educational Attainment in Guadalupe County
Average earnings in Guadalupe County are $58,951 for men and $41,454 for women, a difference of 29.7%. Men with an educational attainment of graduate degree enjoy the highest average annual earnings of $100,915, while those with less than high school education earn the least with $37,248. Women with an educational attainment of graduate degree earn the most with the average annual earnings of $68,166, while those with less than high school education have the smallest earnings of $25,920.
| Educational Attainment | Male Income | Female Income |
| Less than High School | $37,248 | $25,920 |
| High School Diploma | $45,961 | $33,927 |
| College or Associate's Degree | $61,263 | $39,609 |
| Bachelor's Degree | $76,973 | $55,609 |
| Graduate Degree | $100,915 | $68,166 |
| Total | $58,951 | $41,454 |
Family Income in Guadalupe County
Family Income Brackets in Guadalupe County
According to the Guadalupe County family income data, there are 11,490 families falling into the $100,000 to $149,999 income range, which is the most common income bracket and makes up 25.0% of all families. Conversely, the $10,000 to $14,999 income bracket is the least frequent group with only 552 families (1.2%) belonging to this category.
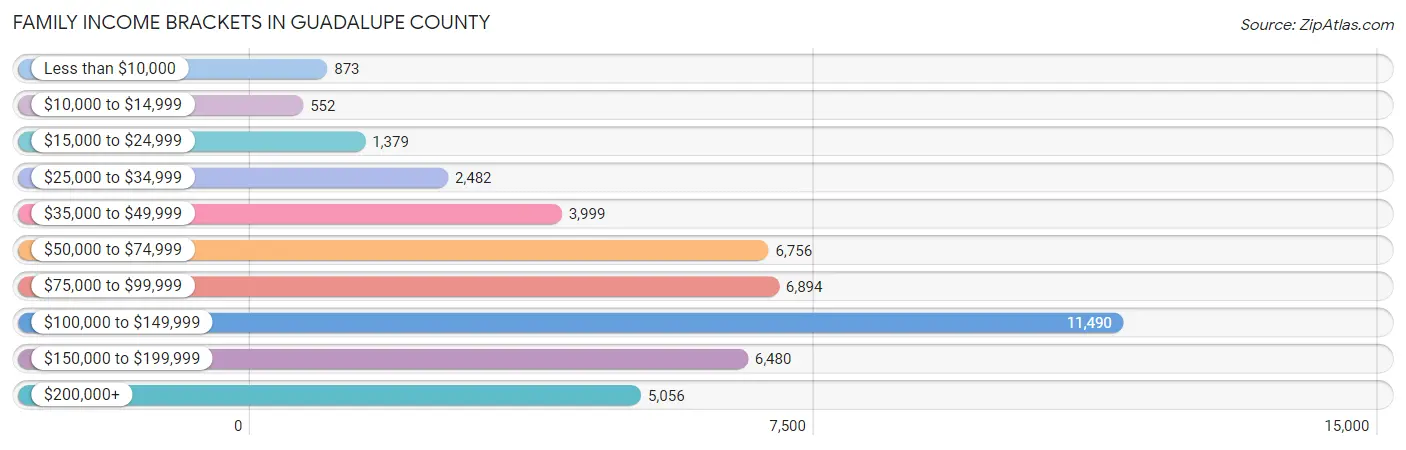
| Income Bracket | # Families | % Families |
| Less than $10,000 | 873 | 1.9% |
| $10,000 to $14,999 | 552 | 1.2% |
| $15,000 to $24,999 | 1,379 | 3.0% |
| $25,000 to $34,999 | 2,482 | 5.4% |
| $35,000 to $49,999 | 3,999 | 8.7% |
| $50,000 to $74,999 | 6,756 | 14.7% |
| $75,000 to $99,999 | 6,894 | 15.0% |
| $100,000 to $149,999 | 11,490 | 25.0% |
| $150,000 to $199,999 | 6,480 | 14.1% |
| $200,000+ | 5,056 | 11.0% |
Family Income by Famaliy Size in Guadalupe County
7+ person families (930 | 2.0%) account for the highest median family income in Guadalupe County with $123,400 per family, while 2-person families (18,297 | 39.8%) have the highest median income of $43,694 per family member.
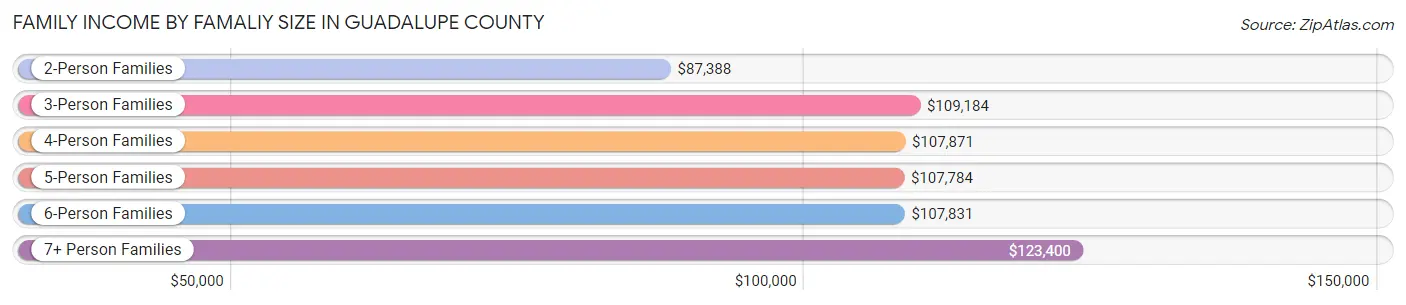
| Income Bracket | # Families | Median Income |
| 2-Person Families | 18,297 (39.8%) | $87,388 |
| 3-Person Families | 10,699 (23.3%) | $109,184 |
| 4-Person Families | 9,730 (21.2%) | $107,871 |
| 5-Person Families | 4,611 (10.0%) | $107,784 |
| 6-Person Families | 1,693 (3.7%) | $107,831 |
| 7+ Person Families | 930 (2.0%) | $123,400 |
| Total | 45,960 (100.0%) | $100,117 |
Family Income by Number of Earners in Guadalupe County
The median family income in Guadalupe County is $100,117, with families comprising 3+ earners (6,099) having the highest median family income of $151,680, while families with no earners (5,752) have the lowest median family income of $59,295, accounting for 13.3% and 12.5% of families, respectively.
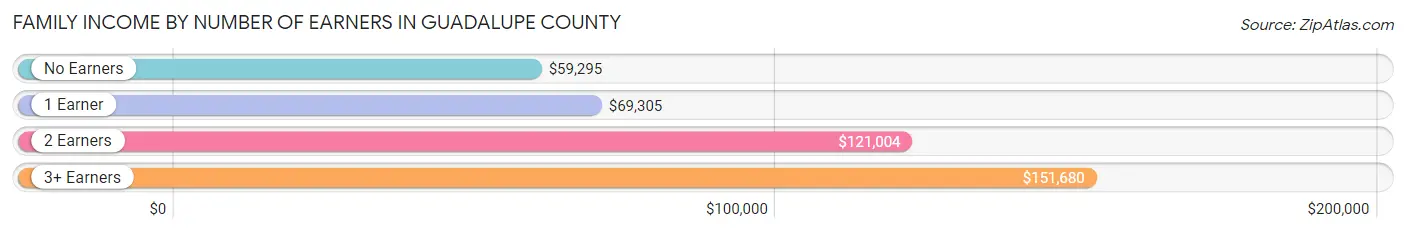
| Number of Earners | # Families | Median Income |
| No Earners | 5,752 (12.5%) | $59,295 |
| 1 Earner | 15,160 (33.0%) | $69,305 |
| 2 Earners | 18,949 (41.2%) | $121,004 |
| 3+ Earners | 6,099 (13.3%) | $151,680 |
| Total | 45,960 (100.0%) | $100,117 |
Household Income in Guadalupe County
Household Income Brackets in Guadalupe County
With 13,483 households falling in the category, the $100,000 to $149,999 income range is the most frequent in Guadalupe County, accounting for 22.3% of all households. In contrast, only 1,693 households (2.8%) fall into the $10,000 to $14,999 income bracket, making it the least populous group.
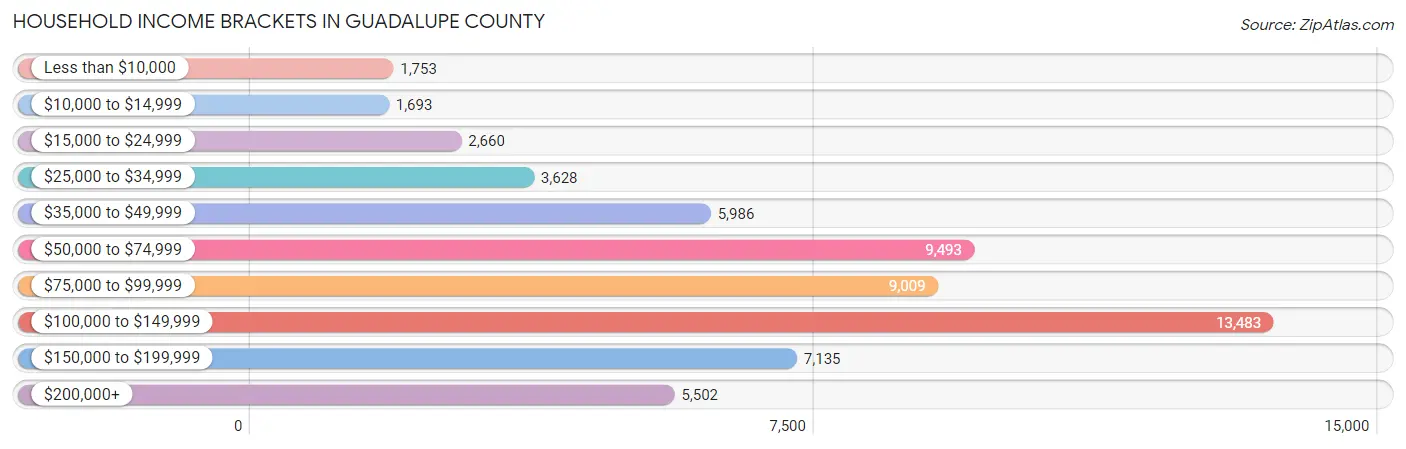
| Income Bracket | # Households | % Households |
| Less than $10,000 | 1,753 | 2.9% |
| $10,000 to $14,999 | 1,693 | 2.8% |
| $15,000 to $24,999 | 2,660 | 4.4% |
| $25,000 to $34,999 | 3,628 | 6.0% |
| $35,000 to $49,999 | 5,986 | 9.9% |
| $50,000 to $74,999 | 9,493 | 15.7% |
| $75,000 to $99,999 | 9,009 | 14.9% |
| $100,000 to $149,999 | 13,483 | 22.3% |
| $150,000 to $199,999 | 7,135 | 11.8% |
| $200,000+ | 5,502 | 9.1% |
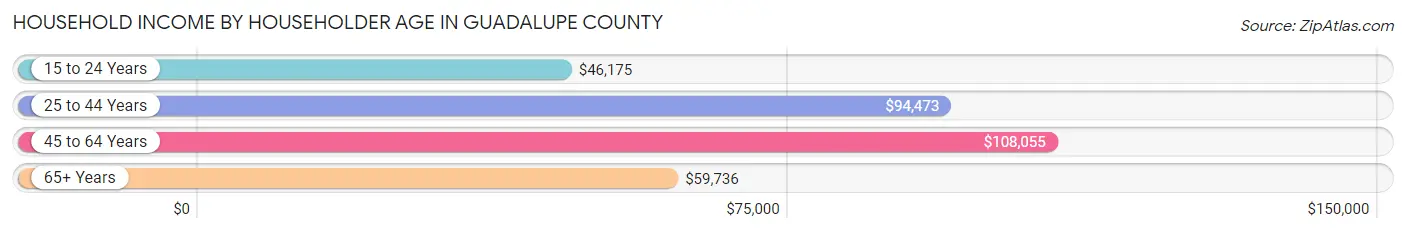
Household Income by Householder Age in Guadalupe County
The median household income in Guadalupe County is $88,111, with the highest median household income of $108,055 found in the 45 to 64 years age bracket for the primary householder. A total of 22,822 households (37.8%) fall into this category. Meanwhile, the 15 to 24 years age bracket for the primary householder has the lowest median household income of $46,175, with 1,350 households (2.2%) in this group.
| Income Bracket | # Households | Median Income |
| 15 to 24 Years | 1,350 (2.2%) | $46,175 |
| 25 to 44 Years | 22,080 (36.5%) | $94,473 |
| 45 to 64 Years | 22,822 (37.8%) | $108,055 |
| 65+ Years | 14,211 (23.5%) | $59,736 |
| Total | 60,463 (100.0%) | $88,111 |
Poverty in Guadalupe County
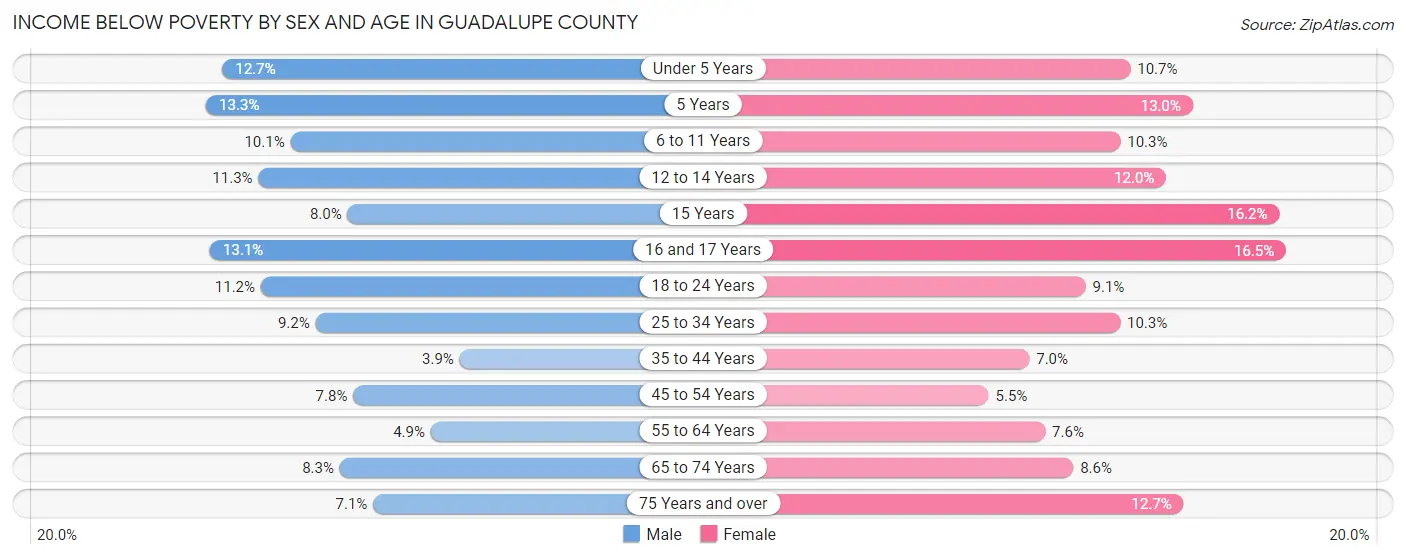
Income Below Poverty by Sex and Age in Guadalupe County
With 8.3% poverty level for males and 9.1% for females among the residents of Guadalupe County, 5 year old males and 16 and 17 year old females are the most vulnerable to poverty, with 190 males (13.3%) and 380 females (16.5%) in their respective age groups living below the poverty level.
| Age Bracket | Male | Female |
| Under 5 Years | 650 (12.7%) | 534 (10.7%) |
| 5 Years | 190 (13.3%) | 159 (13.0%) |
| 6 to 11 Years | 731 (10.1%) | 746 (10.3%) |
| 12 to 14 Years | 424 (11.3%) | 416 (12.0%) |
| 15 Years | 119 (8.0%) | 233 (16.2%) |
| 16 and 17 Years | 331 (13.1%) | 380 (16.5%) |
| 18 to 24 Years | 865 (11.2%) | 653 (9.0%) |
| 25 to 34 Years | 1,015 (9.2%) | 1,140 (10.3%) |
| 35 to 44 Years | 490 (3.8%) | 867 (7.0%) |
| 45 to 54 Years | 895 (7.8%) | 616 (5.4%) |
| 55 to 64 Years | 491 (4.9%) | 785 (7.5%) |
| 65 to 74 Years | 584 (8.3%) | 673 (8.6%) |
| 75 Years and over | 285 (7.1%) | 684 (12.7%) |
| Total | 7,070 (8.3%) | 7,886 (9.1%) |
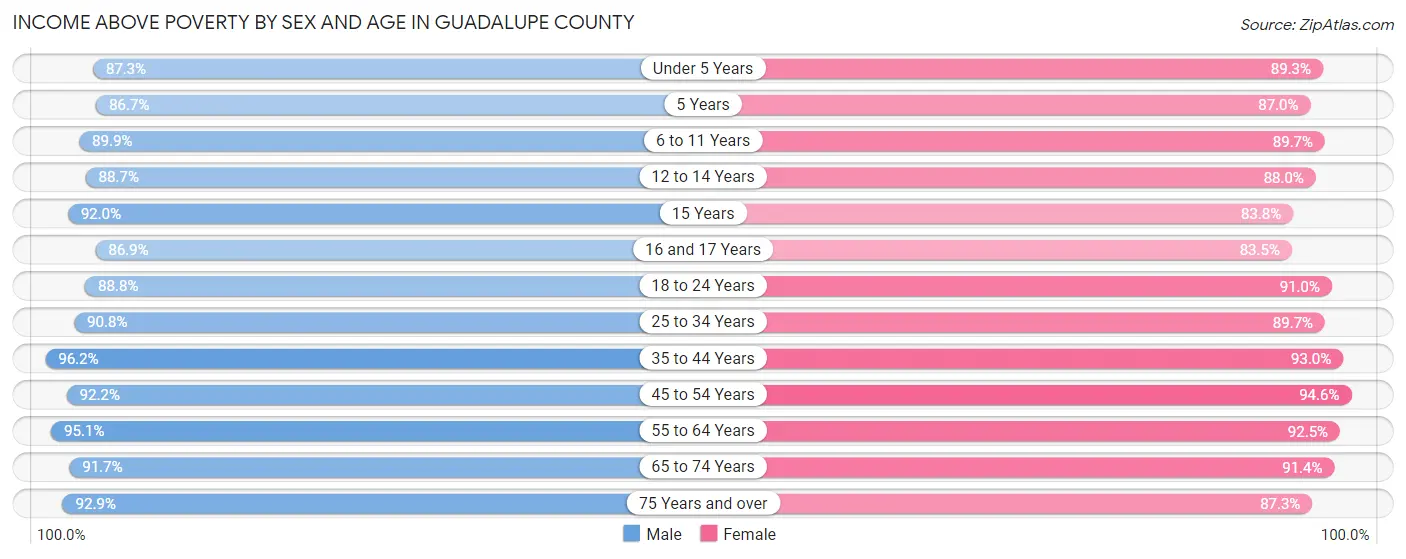
Income Above Poverty by Sex and Age in Guadalupe County
According to the poverty statistics in Guadalupe County, males aged 35 to 44 years and females aged 45 to 54 years are the age groups that are most secure financially, with 96.2% of males and 94.6% of females in these age groups living above the poverty line.
| Age Bracket | Male | Female |
| Under 5 Years | 4,486 (87.3%) | 4,454 (89.3%) |
| 5 Years | 1,243 (86.7%) | 1,061 (87.0%) |
| 6 to 11 Years | 6,484 (89.9%) | 6,472 (89.7%) |
| 12 to 14 Years | 3,323 (88.7%) | 3,038 (88.0%) |
| 15 Years | 1,366 (92.0%) | 1,202 (83.8%) |
| 16 and 17 Years | 2,192 (86.9%) | 1,924 (83.5%) |
| 18 to 24 Years | 6,839 (88.8%) | 6,563 (90.9%) |
| 25 to 34 Years | 10,018 (90.8%) | 9,892 (89.7%) |
| 35 to 44 Years | 12,253 (96.2%) | 11,592 (93.0%) |
| 45 to 54 Years | 10,573 (92.2%) | 10,688 (94.6%) |
| 55 to 64 Years | 9,492 (95.1%) | 9,616 (92.4%) |
| 65 to 74 Years | 6,448 (91.7%) | 7,160 (91.4%) |
| 75 Years and over | 3,754 (92.9%) | 4,707 (87.3%) |
| Total | 78,471 (91.7%) | 78,369 (90.9%) |
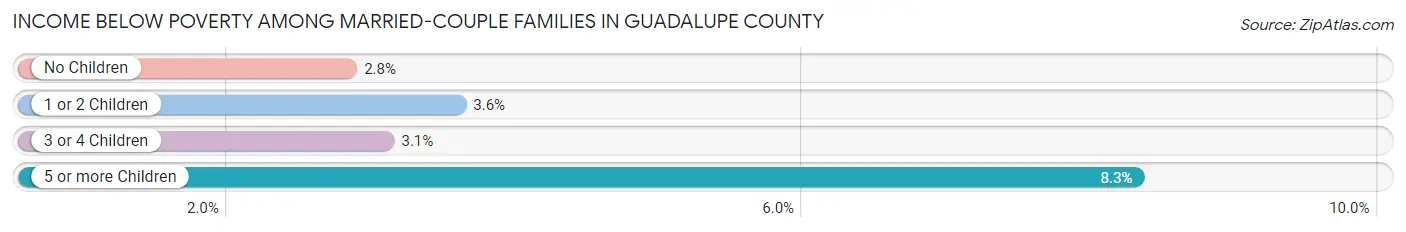
Income Below Poverty Among Married-Couple Families in Guadalupe County
The poverty statistics for married-couple families in Guadalupe County show that 3.2% or 1,108 of the total 34,737 families live below the poverty line. Families with 5 or more children have the highest poverty rate of 8.3%, comprising of 35 families. On the other hand, families with no children have the lowest poverty rate of 2.8%, which includes 530 families.
| Children | Above Poverty | Below Poverty |
| No Children | 18,173 (97.2%) | 530 (2.8%) |
| 1 or 2 Children | 11,623 (96.4%) | 433 (3.6%) |
| 3 or 4 Children | 3,447 (96.9%) | 110 (3.1%) |
| 5 or more Children | 386 (91.7%) | 35 (8.3%) |
| Total | 33,629 (96.8%) | 1,108 (3.2%) |
Income Below Poverty Among Single-Parent Households in Guadalupe County
According to the poverty data in Guadalupe County, 13.4% or 463 single-father households and 20.3% or 1,580 single-mother households are living below the poverty line. Among single-father households, those with 3 or 4 children have the highest poverty rate, with 104 households (41.9%) experiencing poverty. Likewise, among single-mother households, those with 3 or 4 children have the highest poverty rate, with 957 households (61.5%) falling below the poverty line.
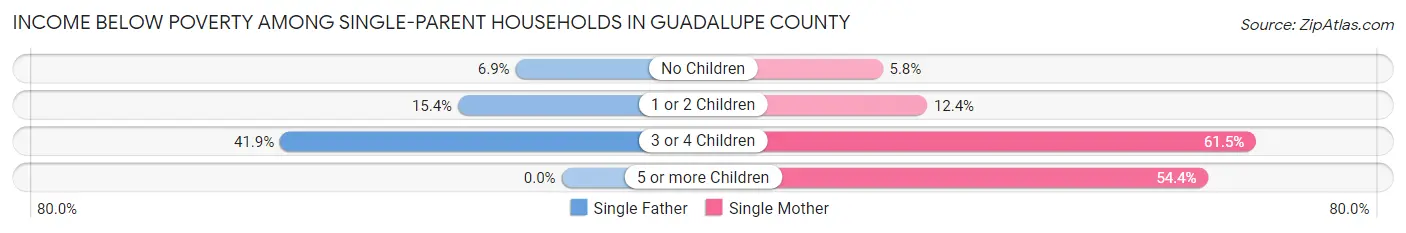
| Children | Single Father | Single Mother |
| No Children | 106 (6.9%) | 146 (5.8%) |
| 1 or 2 Children | 253 (15.4%) | 452 (12.4%) |
| 3 or 4 Children | 104 (41.9%) | 957 (61.5%) |
| 5 or more Children | 0 (0.0%) | 25 (54.3%) |
| Total | 463 (13.4%) | 1,580 (20.3%) |
Income Below Poverty Among Married-Couple vs Single-Parent Households in Guadalupe County
The poverty data for Guadalupe County shows that 1,108 of the married-couple family households (3.2%) and 2,043 of the single-parent households (18.2%) are living below the poverty level. Within the married-couple family households, those with 5 or more children have the highest poverty rate, with 35 households (8.3%) falling below the poverty line. Among the single-parent households, those with 3 or 4 children have the highest poverty rate, with 1,061 household (58.8%) living below poverty.
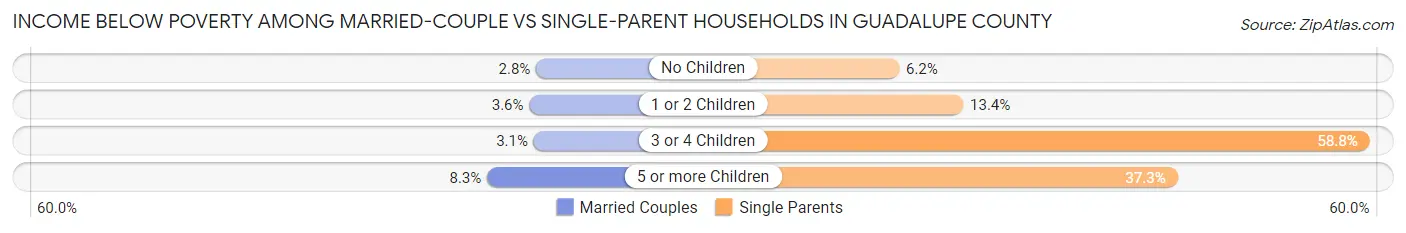
| Children | Married-Couple Families | Single-Parent Households |
| No Children | 530 (2.8%) | 252 (6.2%) |
| 1 or 2 Children | 433 (3.6%) | 705 (13.4%) |
| 3 or 4 Children | 110 (3.1%) | 1,061 (58.8%) |
| 5 or more Children | 35 (8.3%) | 25 (37.3%) |
| Total | 1,108 (3.2%) | 2,043 (18.2%) |
Race in Guadalupe County
The most populous races in Guadalupe County are White / Caucasian (114,005 | 65.6%), Hispanic or Latino (67,761 | 39.0%), and Two or more Races (30,606 | 17.6%).
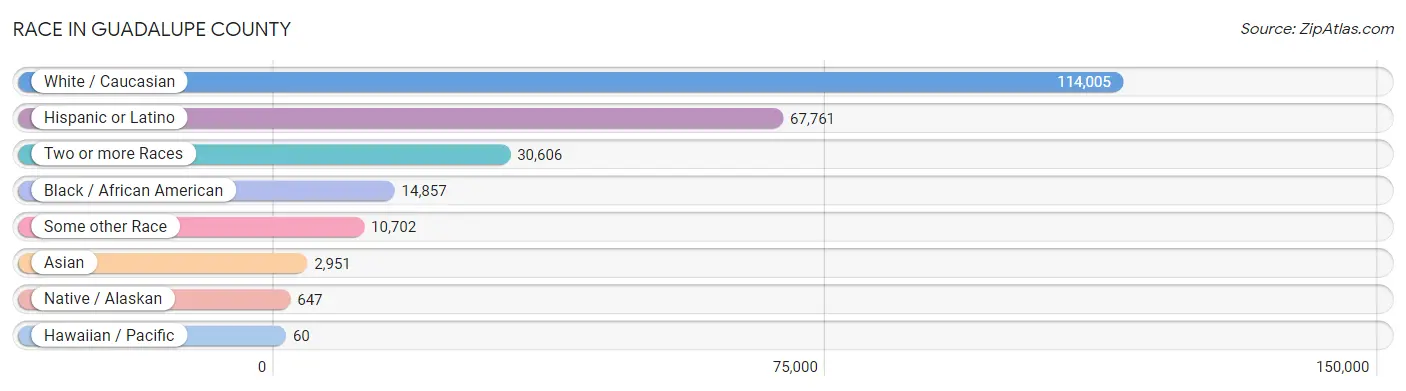
| Race | # Population | % Population |
| Asian | 2,951 | 1.7% |
| Black / African American | 14,857 | 8.6% |
| Hawaiian / Pacific | 60 | 0.0% |
| Hispanic or Latino | 67,761 | 39.0% |
| Native / Alaskan | 647 | 0.4% |
| White / Caucasian | 114,005 | 65.6% |
| Two or more Races | 30,606 | 17.6% |
| Some other Race | 10,702 | 6.2% |
| Total | 173,828 | 100.0% |
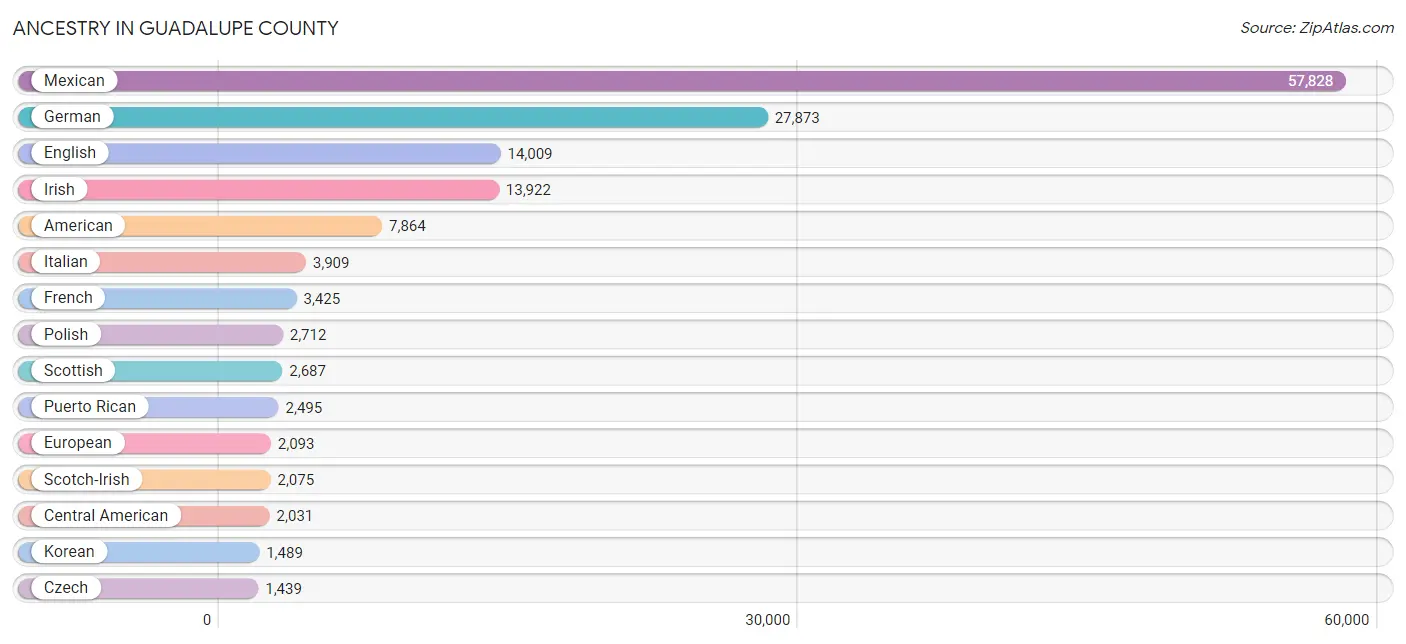
Ancestry in Guadalupe County
The most populous ancestries reported in Guadalupe County are Mexican (57,828 | 33.3%), German (27,873 | 16.0%), English (14,009 | 8.1%), Irish (13,922 | 8.0%), and American (7,864 | 4.5%), together accounting for 69.9% of all Guadalupe County residents.
| Ancestry | # Population | % Population |
| African | 672 | 0.4% |
| Alaska Native | 3 | 0.0% |
| Alsatian | 39 | 0.0% |
| American | 7,864 | 4.5% |
| Apache | 190 | 0.1% |
| Arab | 218 | 0.1% |
| Argentinean | 104 | 0.1% |
| Armenian | 37 | 0.0% |
| Australian | 40 | 0.0% |
| Austrian | 170 | 0.1% |
| Barbadian | 248 | 0.1% |
| Basque | 5 | 0.0% |
| Belgian | 75 | 0.0% |
| Belizean | 132 | 0.1% |
| Bhutanese | 610 | 0.4% |
| Blackfeet | 22 | 0.0% |
| Bolivian | 10 | 0.0% |
| Brazilian | 85 | 0.1% |
| British | 1,028 | 0.6% |
| British West Indian | 4 | 0.0% |
| Bulgarian | 111 | 0.1% |
| Burmese | 731 | 0.4% |
| Cajun | 146 | 0.1% |
| Canadian | 189 | 0.1% |
| Celtic | 3 | 0.0% |
| Central American | 2,031 | 1.2% |
| Central American Indian | 355 | 0.2% |
| Cherokee | 531 | 0.3% |
| Chickasaw | 32 | 0.0% |
| Chilean | 50 | 0.0% |
| Chinese | 12 | 0.0% |
| Choctaw | 330 | 0.2% |
| Colombian | 68 | 0.0% |
| Comanche | 26 | 0.0% |
| Costa Rican | 70 | 0.0% |
| Croatian | 23 | 0.0% |
| Cuban | 422 | 0.2% |
| Czech | 1,439 | 0.8% |
| Czechoslovakian | 141 | 0.1% |
| Danish | 351 | 0.2% |
| Dominican | 94 | 0.1% |
| Dutch | 1,002 | 0.6% |
| Dutch West Indian | 61 | 0.0% |
| Eastern European | 148 | 0.1% |
| Egyptian | 31 | 0.0% |
| English | 14,009 | 8.1% |
| Ethiopian | 45 | 0.0% |
| European | 2,093 | 1.2% |
| Filipino | 166 | 0.1% |
| Finnish | 274 | 0.2% |
| French | 3,425 | 2.0% |
| French Canadian | 321 | 0.2% |
| German | 27,873 | 16.0% |
| Ghanaian | 128 | 0.1% |
| Greek | 197 | 0.1% |
| Guamanian / Chamorro | 75 | 0.0% |
| Guatemalan | 395 | 0.2% |
| Guyanese | 44 | 0.0% |
| Haitian | 187 | 0.1% |
| Honduran | 243 | 0.1% |
| Hopi | 20 | 0.0% |
| Hungarian | 252 | 0.1% |
| Indian (Asian) | 465 | 0.3% |
| Iranian | 127 | 0.1% |
| Irish | 13,922 | 8.0% |
| Iroquois | 2 | 0.0% |
| Italian | 3,909 | 2.2% |
| Jamaican | 226 | 0.1% |
| Japanese | 64 | 0.0% |
| Kenyan | 41 | 0.0% |
| Korean | 1,489 | 0.9% |
| Lebanese | 87 | 0.1% |
| Liberian | 179 | 0.1% |
| Lithuanian | 73 | 0.0% |
| Lumbee | 30 | 0.0% |
| Maltese | 25 | 0.0% |
| Mexican | 57,828 | 33.3% |
| Mexican American Indian | 314 | 0.2% |
| Moroccan | 9 | 0.0% |
| Native Hawaiian | 197 | 0.1% |
| Navajo | 85 | 0.1% |
| New Zealander | 124 | 0.1% |
| Nicaraguan | 32 | 0.0% |
| Nigerian | 21 | 0.0% |
| Northern European | 219 | 0.1% |
| Norwegian | 746 | 0.4% |
| Osage | 8 | 0.0% |
| Pakistani | 104 | 0.1% |
| Panamanian | 713 | 0.4% |
| Pennsylvania German | 66 | 0.0% |
| Peruvian | 147 | 0.1% |
| Polish | 2,712 | 1.6% |
| Portuguese | 324 | 0.2% |
| Potawatomi | 56 | 0.0% |
| Pueblo | 97 | 0.1% |
| Puerto Rican | 2,495 | 1.4% |
| Russian | 269 | 0.2% |
| Salvadoran | 578 | 0.3% |
| Scandinavian | 482 | 0.3% |
| Scotch-Irish | 2,075 | 1.2% |
| Scottish | 2,687 | 1.5% |
| Seminole | 15 | 0.0% |
| Serbian | 53 | 0.0% |
| Sioux | 6 | 0.0% |
| Slavic | 2 | 0.0% |
| Slovak | 74 | 0.0% |
| Slovene | 77 | 0.0% |
| South American | 401 | 0.2% |
| Spaniard | 987 | 0.6% |
| Spanish | 398 | 0.2% |
| Spanish American | 17 | 0.0% |
| Sri Lankan | 852 | 0.5% |
| Subsaharan African | 1,219 | 0.7% |
| Swedish | 900 | 0.5% |
| Swiss | 128 | 0.1% |
| Syrian | 16 | 0.0% |
| Thai | 492 | 0.3% |
| Turkish | 28 | 0.0% |
| U.S. Virgin Islander | 10 | 0.0% |
| Ukrainian | 167 | 0.1% |
| Venezuelan | 22 | 0.0% |
| Welsh | 1,010 | 0.6% |
| West Indian | 67 | 0.0% |
| Yugoslavian | 32 | 0.0% | View All 124 Rows |
Immigrants in Guadalupe County
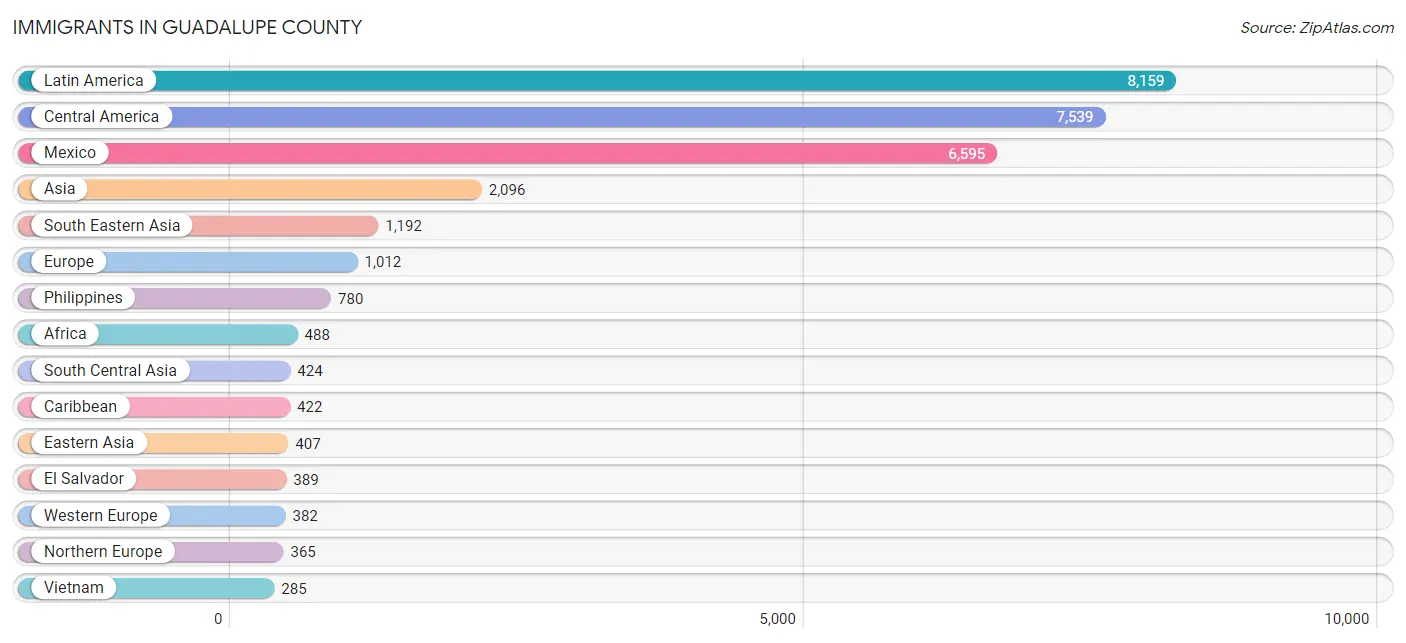
The most numerous immigrant groups reported in Guadalupe County came from Latin America (8,159 | 4.7%), Central America (7,539 | 4.3%), Mexico (6,595 | 3.8%), Asia (2,096 | 1.2%), and South Eastern Asia (1,192 | 0.7%), together accounting for 14.7% of all Guadalupe County residents.
| Immigration Origin | # Population | % Population |
| Africa | 488 | 0.3% |
| Argentina | 14 | 0.0% |
| Armenia | 18 | 0.0% |
| Asia | 2,096 | 1.2% |
| Australia | 5 | 0.0% |
| Bangladesh | 112 | 0.1% |
| Barbados | 64 | 0.0% |
| Belgium | 53 | 0.0% |
| Belize | 77 | 0.0% |
| Brazil | 60 | 0.0% |
| Bulgaria | 46 | 0.0% |
| Cambodia | 52 | 0.0% |
| Canada | 176 | 0.1% |
| Caribbean | 422 | 0.2% |
| Central America | 7,539 | 4.3% |
| China | 197 | 0.1% |
| Colombia | 35 | 0.0% |
| Costa Rica | 26 | 0.0% |
| Cuba | 227 | 0.1% |
| Czechoslovakia | 35 | 0.0% |
| Eastern Africa | 235 | 0.1% |
| Eastern Asia | 407 | 0.2% |
| Eastern Europe | 151 | 0.1% |
| Egypt | 1 | 0.0% |
| El Salvador | 389 | 0.2% |
| England | 238 | 0.1% |
| Ethiopia | 45 | 0.0% |
| Europe | 1,012 | 0.6% |
| France | 56 | 0.0% |
| Germany | 273 | 0.2% |
| Ghana | 98 | 0.1% |
| Guatemala | 32 | 0.0% |
| Guyana | 9 | 0.0% |
| Honduras | 177 | 0.1% |
| Hungary | 8 | 0.0% |
| India | 209 | 0.1% |
| Iran | 27 | 0.0% |
| Israel | 17 | 0.0% |
| Italy | 6 | 0.0% |
| Jamaica | 82 | 0.1% |
| Japan | 78 | 0.0% |
| Kazakhstan | 15 | 0.0% |
| Kenya | 24 | 0.0% |
| Korea | 132 | 0.1% |
| Latin America | 8,159 | 4.7% |
| Lebanon | 10 | 0.0% |
| Liberia | 85 | 0.1% |
| Mexico | 6,595 | 3.8% |
| Nepal | 13 | 0.0% |
| Nicaragua | 11 | 0.0% |
| Northern Africa | 1 | 0.0% |
| Northern Europe | 365 | 0.2% |
| Norway | 60 | 0.0% |
| Oceania | 41 | 0.0% |
| Panama | 222 | 0.1% |
| Peru | 80 | 0.1% |
| Philippines | 780 | 0.4% |
| Poland | 12 | 0.0% |
| Russia | 32 | 0.0% |
| South Africa | 21 | 0.0% |
| South America | 198 | 0.1% |
| South Central Asia | 424 | 0.2% |
| South Eastern Asia | 1,192 | 0.7% |
| Southern Europe | 114 | 0.1% |
| Spain | 108 | 0.1% |
| Sri Lanka | 45 | 0.0% |
| Taiwan | 21 | 0.0% |
| Thailand | 75 | 0.0% |
| Trinidad and Tobago | 49 | 0.0% |
| Turkey | 28 | 0.0% |
| Ukraine | 18 | 0.0% |
| Vietnam | 285 | 0.2% |
| Western Africa | 203 | 0.1% |
| Western Asia | 73 | 0.0% |
| Western Europe | 382 | 0.2% | View All 75 Rows |
Sex and Age in Guadalupe County
Sex and Age in Guadalupe County
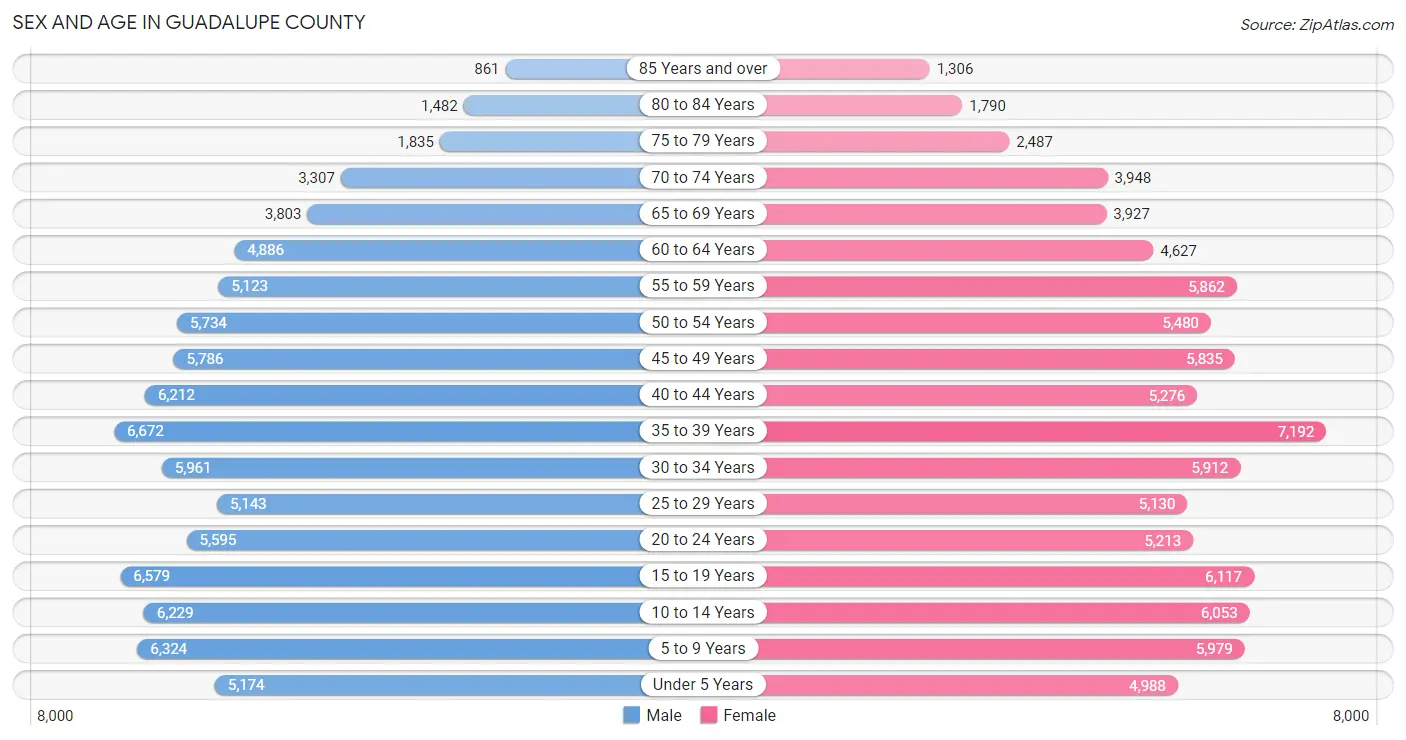
The most populous age groups in Guadalupe County are 35 to 39 Years (6,672 | 7.7%) for men and 35 to 39 Years (7,192 | 8.3%) for women.
| Age Bracket | Male | Female |
| Under 5 Years | 5,174 (6.0%) | 4,988 (5.7%) |
| 5 to 9 Years | 6,324 (7.3%) | 5,979 (6.9%) |
| 10 to 14 Years | 6,229 (7.2%) | 6,053 (7.0%) |
| 15 to 19 Years | 6,579 (7.6%) | 6,117 (7.0%) |
| 20 to 24 Years | 5,595 (6.5%) | 5,213 (6.0%) |
| 25 to 29 Years | 5,143 (5.9%) | 5,130 (5.9%) |
| 30 to 34 Years | 5,961 (6.9%) | 5,912 (6.8%) |
| 35 to 39 Years | 6,672 (7.7%) | 7,192 (8.3%) |
| 40 to 44 Years | 6,212 (7.2%) | 5,276 (6.1%) |
| 45 to 49 Years | 5,786 (6.7%) | 5,835 (6.7%) |
| 50 to 54 Years | 5,734 (6.6%) | 5,480 (6.3%) |
| 55 to 59 Years | 5,123 (5.9%) | 5,862 (6.7%) |
| 60 to 64 Years | 4,886 (5.6%) | 4,627 (5.3%) |
| 65 to 69 Years | 3,803 (4.4%) | 3,927 (4.5%) |
| 70 to 74 Years | 3,307 (3.8%) | 3,948 (4.5%) |
| 75 to 79 Years | 1,835 (2.1%) | 2,487 (2.9%) |
| 80 to 84 Years | 1,482 (1.7%) | 1,790 (2.1%) |
| 85 Years and over | 861 (1.0%) | 1,306 (1.5%) |
| Total | 86,706 (100.0%) | 87,122 (100.0%) |
Families and Households in Guadalupe County
Median Family Size in Guadalupe County
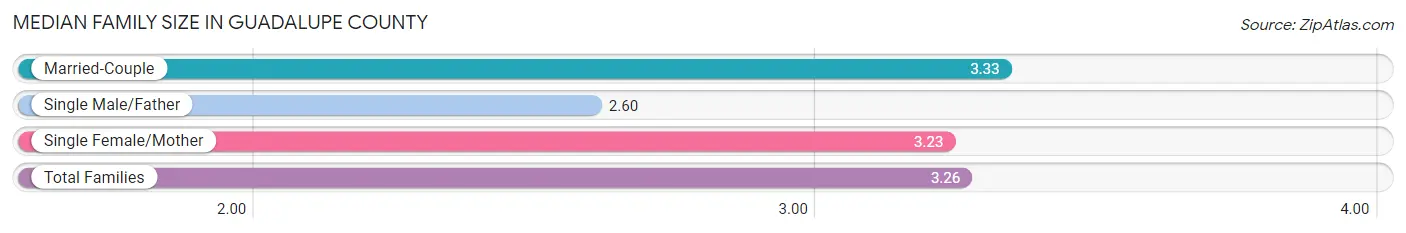
The median family size in Guadalupe County is 3.26 persons per family, with married-couple families (34,737 | 75.6%) accounting for the largest median family size of 3.33 persons per family. On the other hand, single male/father families (3,455 | 7.5%) represent the smallest median family size with 2.60 persons per family.
| Family Type | # Families | Family Size |
| Married-Couple | 34,737 (75.6%) | 3.33 |
| Single Male/Father | 3,455 (7.5%) | 2.60 |
| Single Female/Mother | 7,768 (16.9%) | 3.23 |
| Total Families | 45,960 (100.0%) | 3.26 |
Median Household Size in Guadalupe County
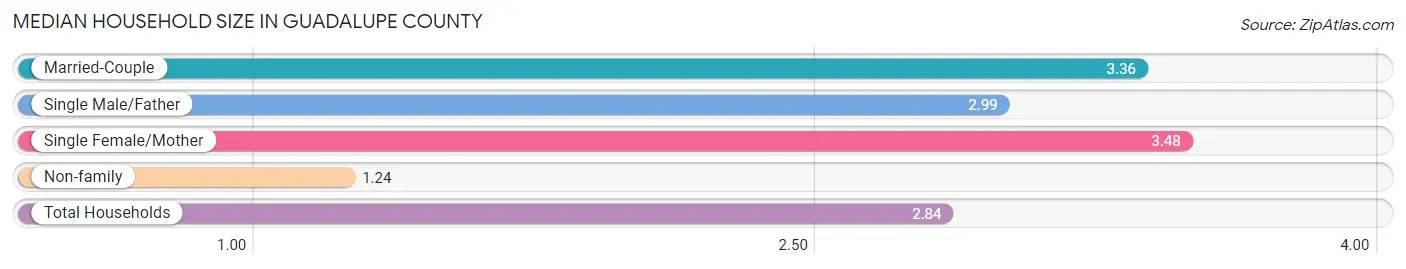
The median household size in Guadalupe County is 2.84 persons per household, with single female/mother households (7,768 | 12.9%) accounting for the largest median household size of 3.48 persons per household. non-family households (14,503 | 24.0%) represent the smallest median household size with 1.24 persons per household.
| Household Type | # Households | Household Size |
| Married-Couple | 34,737 (57.5%) | 3.36 |
| Single Male/Father | 3,455 (5.7%) | 2.99 |
| Single Female/Mother | 7,768 (12.9%) | 3.48 |
| Non-family | 14,503 (24.0%) | 1.24 |
| Total Households | 60,463 (100.0%) | 2.84 |
Household Size by Marriage Status in Guadalupe County
Out of a total of 60,463 households in Guadalupe County, 45,960 (76.0%) are family households, while 14,503 (24.0%) are nonfamily households. The most numerous type of family households are 2-person households, comprising 16,996, and the most common type of nonfamily households are 1-person households, comprising 11,793.
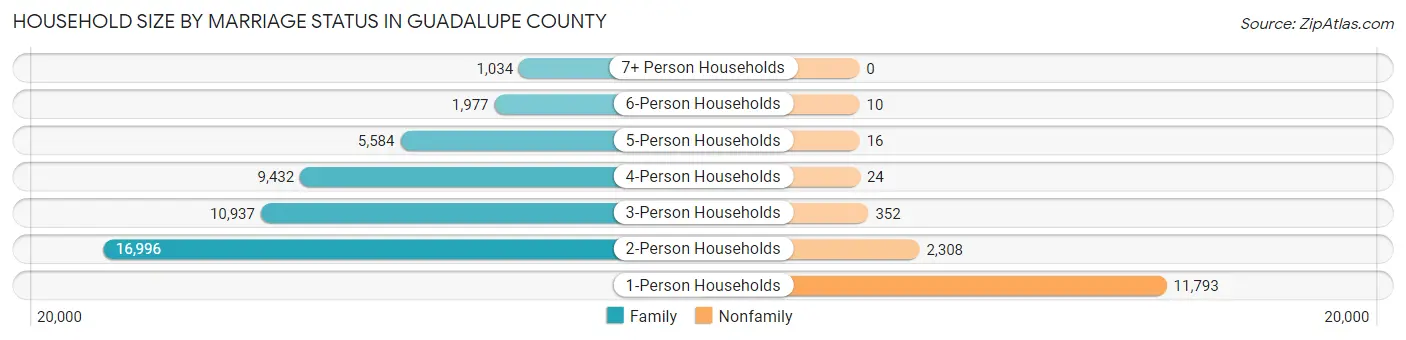
| Household Size | Family Households | Nonfamily Households |
| 1-Person Households | - | 11,793 (19.5%) |
| 2-Person Households | 16,996 (28.1%) | 2,308 (3.8%) |
| 3-Person Households | 10,937 (18.1%) | 352 (0.6%) |
| 4-Person Households | 9,432 (15.6%) | 24 (0.0%) |
| 5-Person Households | 5,584 (9.2%) | 16 (0.0%) |
| 6-Person Households | 1,977 (3.3%) | 10 (0.0%) |
| 7+ Person Households | 1,034 (1.7%) | 0 (0.0%) |
| Total | 45,960 (76.0%) | 14,503 (24.0%) |
Female Fertility in Guadalupe County
Fertility by Age in Guadalupe County
Average fertility rate in Guadalupe County is 62.0 births per 1,000 women. Women in the age bracket of 20 to 34 years have the highest fertility rate with 93.0 births per 1,000 women. Women in the age bracket of 20 to 34 years acount for 58.1% of all women with births.
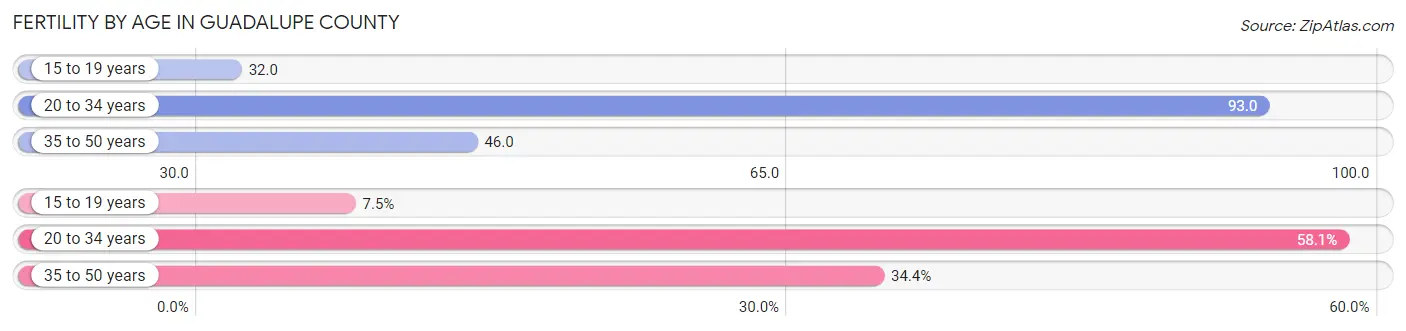
| Age Bracket | Women with Births | Births / 1,000 Women |
| 15 to 19 years | 195 (7.5%) | 32.0 |
| 20 to 34 years | 1,509 (58.1%) | 93.0 |
| 35 to 50 years | 894 (34.4%) | 46.0 |
| Total | 2,598 (100.0%) | 62.0 |
Fertility by Age by Marriage Status in Guadalupe County
72.3% of women with births (2,598) in Guadalupe County are married. The highest percentage of unmarried women with births falls into 15 to 19 years age bracket with 100.0% of them unmarried at the time of birth, while the lowest percentage of unmarried women with births belong to 35 to 50 years age bracket with 9.6% of them unmarried.
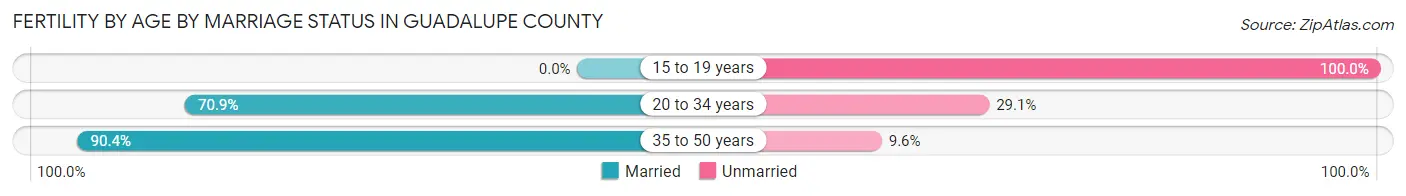
| Age Bracket | Married | Unmarried |
| 15 to 19 years | 0 (0.0%) | 195 (100.0%) |
| 20 to 34 years | 1,070 (70.9%) | 439 (29.1%) |
| 35 to 50 years | 808 (90.4%) | 86 (9.6%) |
| Total | 1,878 (72.3%) | 720 (27.7%) |
Fertility by Education in Guadalupe County
Average fertility rate in Guadalupe County is 62.0 births per 1,000 women. Women with the education attainment of bachelor's degree have the highest fertility rate of 96.0 births per 1,000 women, while women with the education attainment of less than high school have the lowest fertility at 28.0 births per 1,000 women. Women with the education attainment of high school diploma represent 37.9% of all women with births.
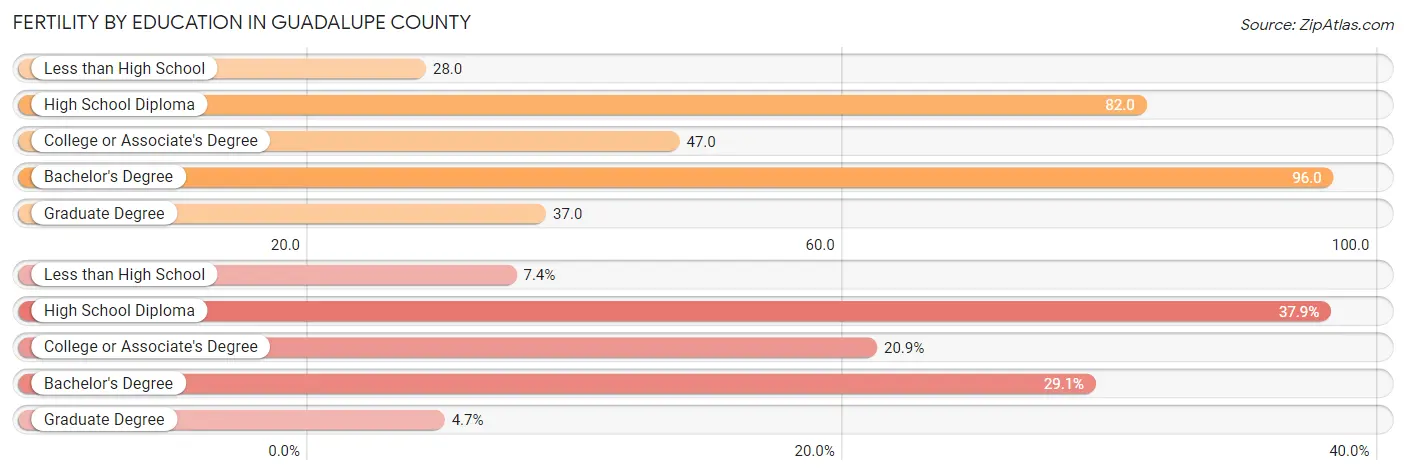
| Educational Attainment | Women with Births | Births / 1,000 Women |
| Less than High School | 192 (7.4%) | 28.0 |
| High School Diploma | 985 (37.9%) | 82.0 |
| College or Associate's Degree | 543 (20.9%) | 47.0 |
| Bachelor's Degree | 756 (29.1%) | 96.0 |
| Graduate Degree | 122 (4.7%) | 37.0 |
| Total | 2,598 (100.0%) | 62.0 |
Fertility by Education by Marriage Status in Guadalupe County
27.7% of women with births in Guadalupe County are unmarried. Women with the educational attainment of graduate degree are most likely to be married with 100.0% of them married at childbirth, while women with the educational attainment of high school diploma are least likely to be married with 39.6% of them unmarried at childbirth.
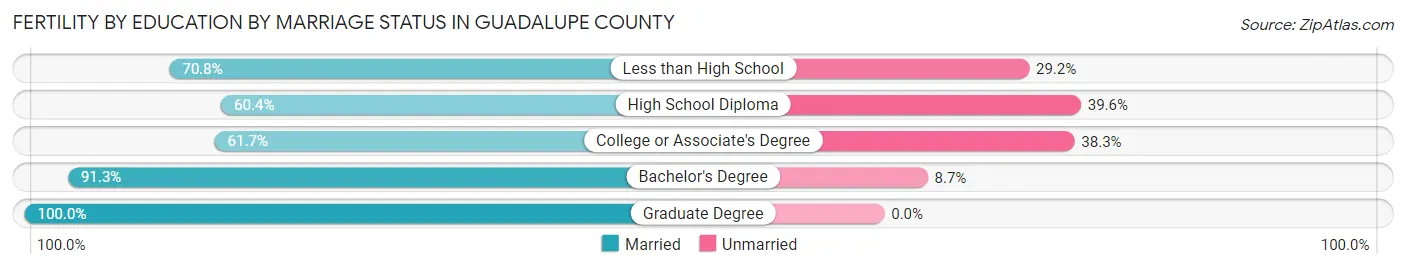
| Educational Attainment | Married | Unmarried |
| Less than High School | 136 (70.8%) | 56 (29.2%) |
| High School Diploma | 595 (60.4%) | 390 (39.6%) |
| College or Associate's Degree | 335 (61.7%) | 208 (38.3%) |
| Bachelor's Degree | 690 (91.3%) | 66 (8.7%) |
| Graduate Degree | 122 (100.0%) | 0 (0.0%) |
| Total | 1,878 (72.3%) | 720 (27.7%) |
Employment Characteristics in Guadalupe County
Employment by Class of Employer in Guadalupe County
Among the 83,268 employed individuals in Guadalupe County, private company employees (55,369 | 66.5%), local government employees (6,522 | 7.8%), and federal government employees (6,508 | 7.8%) make up the most common classes of employment.
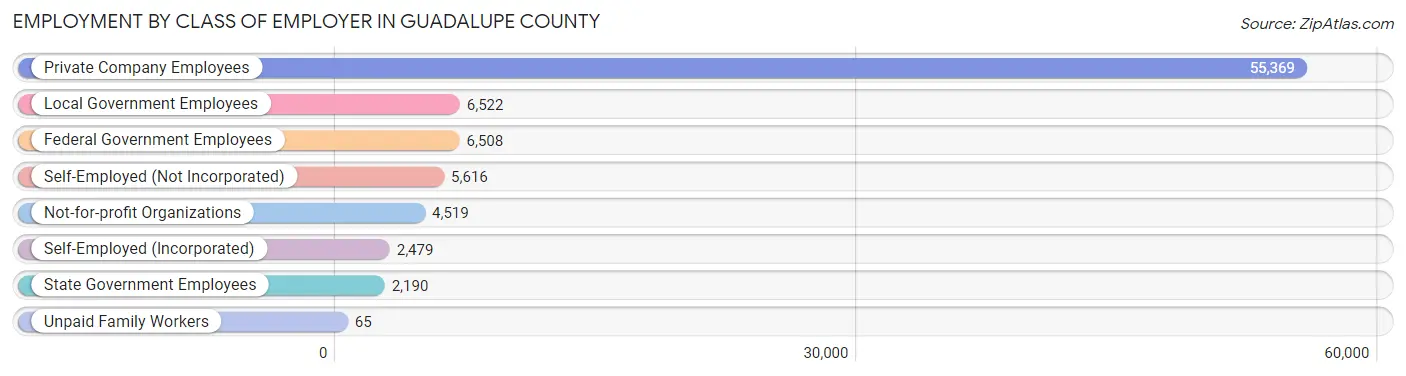
| Employer Class | # Employees | % Employees |
| Private Company Employees | 55,369 | 66.5% |
| Self-Employed (Incorporated) | 2,479 | 3.0% |
| Self-Employed (Not Incorporated) | 5,616 | 6.7% |
| Not-for-profit Organizations | 4,519 | 5.4% |
| Local Government Employees | 6,522 | 7.8% |
| State Government Employees | 2,190 | 2.6% |
| Federal Government Employees | 6,508 | 7.8% |
| Unpaid Family Workers | 65 | 0.1% |
| Total | 83,268 | 100.0% |
Employment Status by Age in Guadalupe County
According to the labor force statistics for Guadalupe County, out of the total population over 16 years of age (136,158), 64.6% or 87,958 individuals are in the labor force, with 4.3% or 3,782 of them unemployed. The age group with the highest labor force participation rate is 35 to 44 years, with 84.6% or 21,448 individuals in the labor force. Within the labor force, the 16 to 19 years age range has the highest percentage of unemployed individuals, with 13.0% or 485 of them being unemployed.
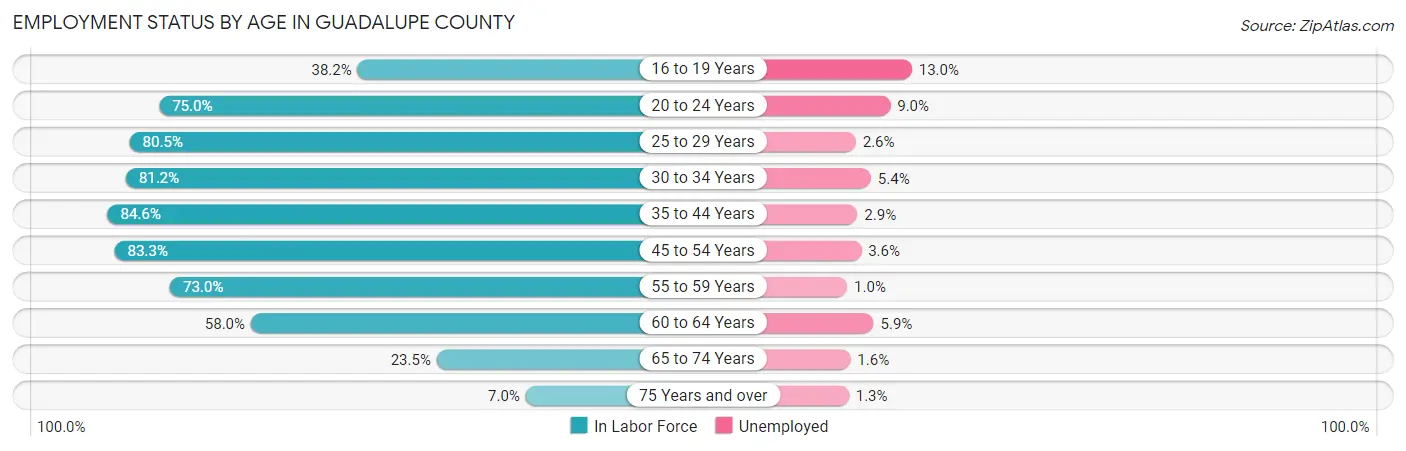
| Age Bracket | In Labor Force | Unemployed |
| 16 to 19 Years | 3,733 (38.2%) | 485 (13.0%) |
| 20 to 24 Years | 8,106 (75.0%) | 730 (9.0%) |
| 25 to 29 Years | 8,270 (80.5%) | 215 (2.6%) |
| 30 to 34 Years | 9,641 (81.2%) | 521 (5.4%) |
| 35 to 44 Years | 21,448 (84.6%) | 622 (2.9%) |
| 45 to 54 Years | 19,022 (83.3%) | 685 (3.6%) |
| 55 to 59 Years | 8,019 (73.0%) | 80 (1.0%) |
| 60 to 64 Years | 5,518 (58.0%) | 326 (5.9%) |
| 65 to 74 Years | 3,521 (23.5%) | 56 (1.6%) |
| 75 Years and over | 683 (7.0%) | 9 (1.3%) |
| Total | 87,958 (64.6%) | 3,782 (4.3%) |
Employment Status by Educational Attainment in Guadalupe County
According to labor force statistics for Guadalupe County, 79.2% of individuals (71,938) out of the total population between 25 and 64 years of age (90,831) are in the labor force, with 3.4% or 2,446 of them being unemployed. The group with the highest labor force participation rate are those with the educational attainment of bachelor's degree or higher, with 86.7% or 23,737 individuals in the labor force. Within the labor force, individuals with less than high school education have the highest percentage of unemployment, with 4.6% or 270 of them being unemployed.
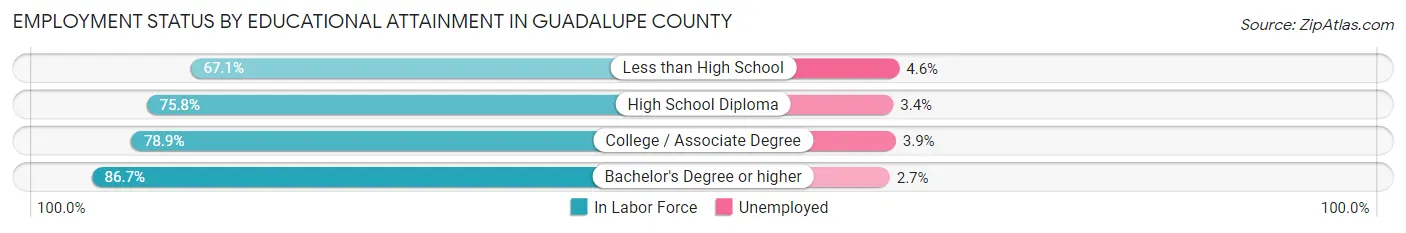
| Educational Attainment | In Labor Force | Unemployed |
| Less than High School | 5,875 (67.1%) | 403 (4.6%) |
| High School Diploma | 20,728 (75.8%) | 930 (3.4%) |
| College / Associate Degree | 21,581 (78.9%) | 1,067 (3.9%) |
| Bachelor's Degree or higher | 23,737 (86.7%) | 739 (2.7%) |
| Total | 71,938 (79.2%) | 3,088 (3.4%) |
Employment Occupations by Sex in Guadalupe County
Management, Business, Science and Arts Occupations
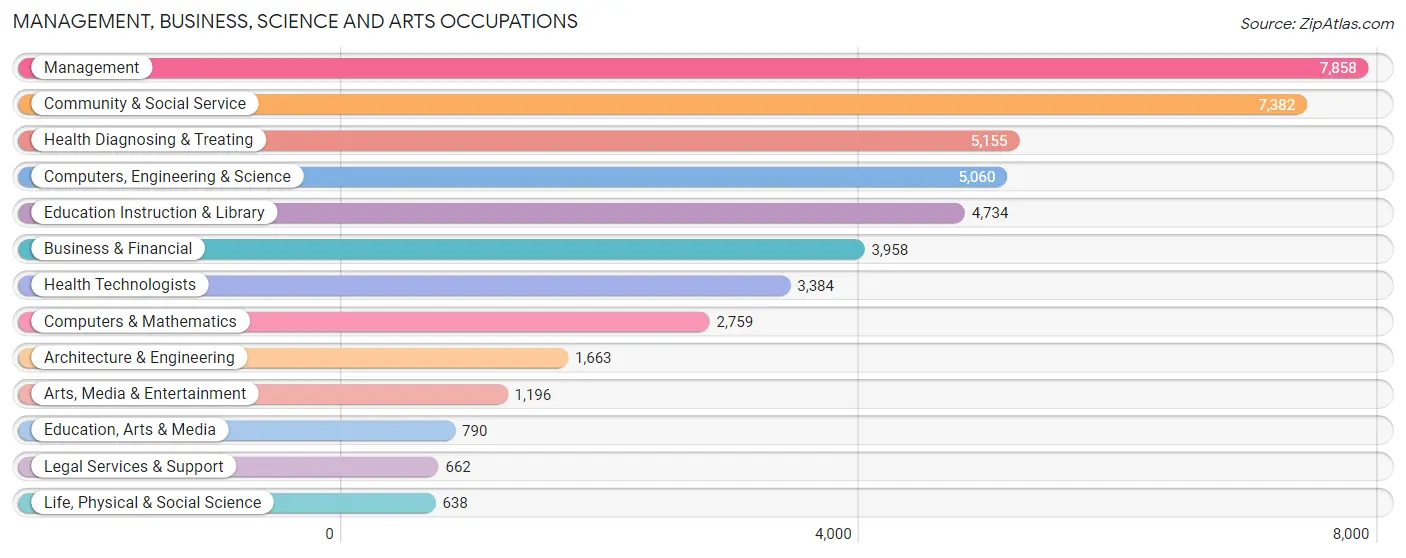
The most common Management, Business, Science and Arts occupations in Guadalupe County are Management (7,858 | 9.5%), Community & Social Service (7,382 | 9.0%), Health Diagnosing & Treating (5,155 | 6.2%), Computers, Engineering & Science (5,060 | 6.1%), and Education Instruction & Library (4,734 | 5.7%).
Management, Business, Science and Arts Occupations by Sex
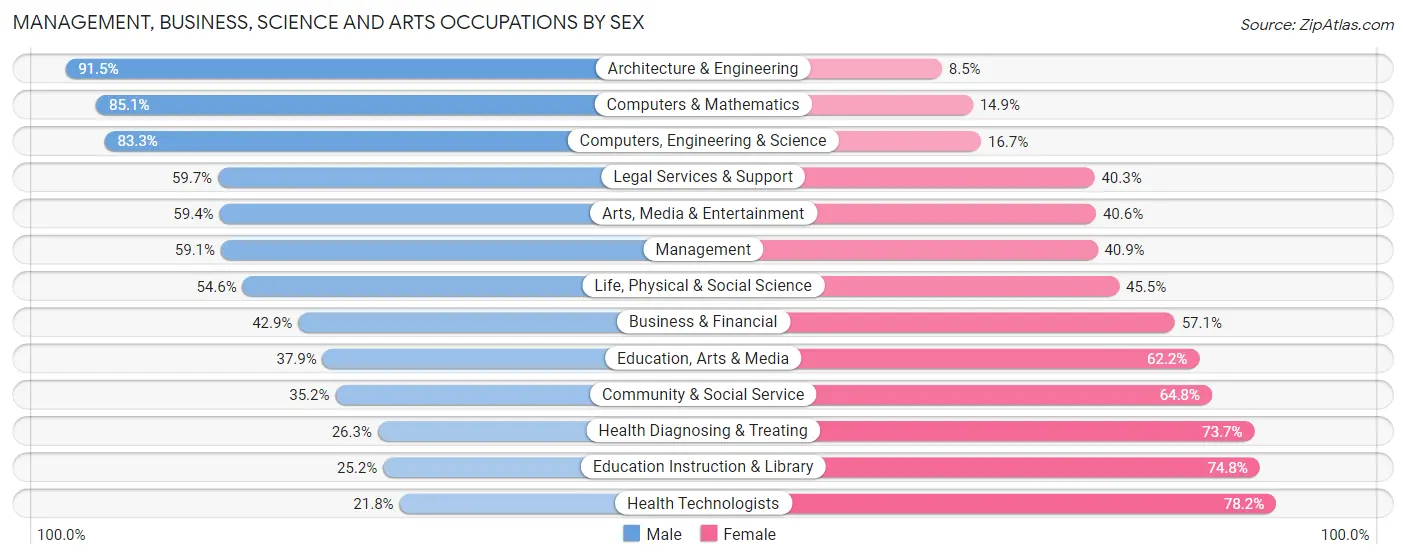
Within the Management, Business, Science and Arts occupations in Guadalupe County, the most male-oriented occupations are Architecture & Engineering (91.5%), Computers & Mathematics (85.1%), and Computers, Engineering & Science (83.3%), while the most female-oriented occupations are Health Technologists (78.2%), Education Instruction & Library (74.8%), and Health Diagnosing & Treating (73.7%).
| Occupation | Male | Female |
| Management | 4,641 (59.1%) | 3,217 (40.9%) |
| Business & Financial | 1,699 (42.9%) | 2,259 (57.1%) |
| Computers, Engineering & Science | 4,217 (83.3%) | 843 (16.7%) |
| Computers & Mathematics | 2,347 (85.1%) | 412 (14.9%) |
| Architecture & Engineering | 1,522 (91.5%) | 141 (8.5%) |
| Life, Physical & Social Science | 348 (54.5%) | 290 (45.5%) |
| Community & Social Service | 2,598 (35.2%) | 4,784 (64.8%) |
| Education, Arts & Media | 299 (37.9%) | 491 (62.2%) |
| Legal Services & Support | 395 (59.7%) | 267 (40.3%) |
| Education Instruction & Library | 1,194 (25.2%) | 3,540 (74.8%) |
| Arts, Media & Entertainment | 710 (59.4%) | 486 (40.6%) |
| Health Diagnosing & Treating | 1,358 (26.3%) | 3,797 (73.7%) |
| Health Technologists | 738 (21.8%) | 2,646 (78.2%) |
| Total (Category) | 14,513 (49.3%) | 14,900 (50.7%) |
| Total (Overall) | 44,495 (54.0%) | 37,938 (46.0%) |
Services Occupations
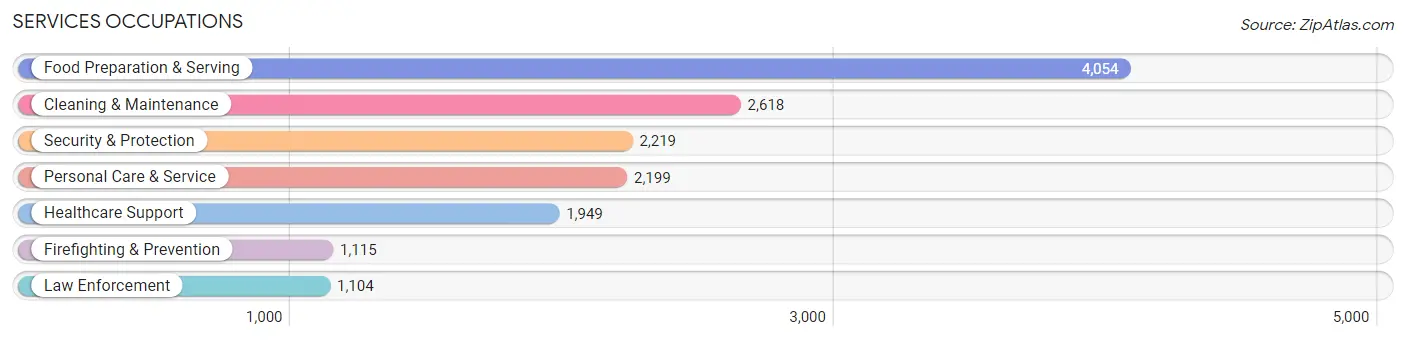
The most common Services occupations in Guadalupe County are Food Preparation & Serving (4,054 | 4.9%), Cleaning & Maintenance (2,618 | 3.2%), Security & Protection (2,219 | 2.7%), Personal Care & Service (2,199 | 2.7%), and Healthcare Support (1,949 | 2.4%).
Services Occupations by Sex
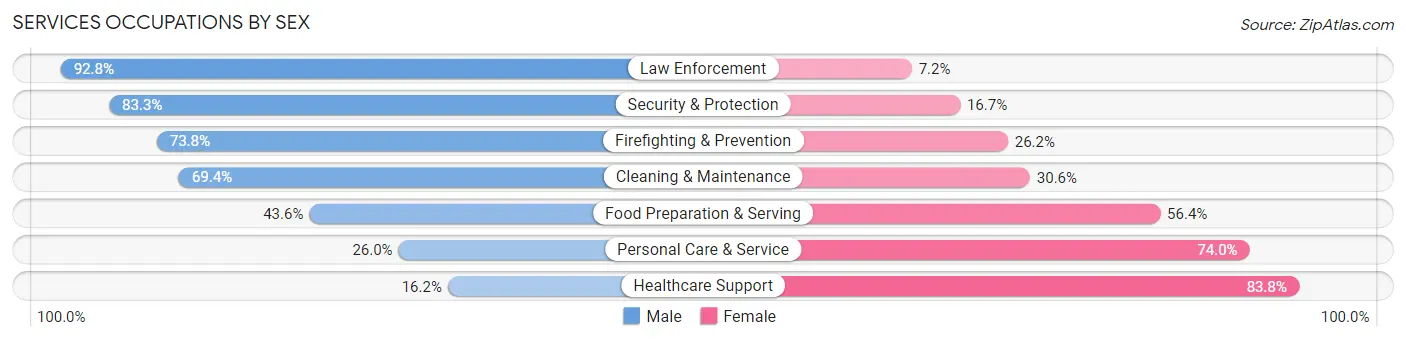
Within the Services occupations in Guadalupe County, the most male-oriented occupations are Law Enforcement (92.8%), Security & Protection (83.3%), and Firefighting & Prevention (73.8%), while the most female-oriented occupations are Healthcare Support (83.8%), Personal Care & Service (74.0%), and Food Preparation & Serving (56.4%).
| Occupation | Male | Female |
| Healthcare Support | 316 (16.2%) | 1,633 (83.8%) |
| Security & Protection | 1,848 (83.3%) | 371 (16.7%) |
| Firefighting & Prevention | 823 (73.8%) | 292 (26.2%) |
| Law Enforcement | 1,025 (92.8%) | 79 (7.2%) |
| Food Preparation & Serving | 1,769 (43.6%) | 2,285 (56.4%) |
| Cleaning & Maintenance | 1,818 (69.4%) | 800 (30.6%) |
| Personal Care & Service | 571 (26.0%) | 1,628 (74.0%) |
| Total (Category) | 6,322 (48.5%) | 6,717 (51.5%) |
| Total (Overall) | 44,495 (54.0%) | 37,938 (46.0%) |
Sales and Office Occupations
The most common Sales and Office occupations in Guadalupe County are Office & Administration (10,991 | 13.3%), and Sales & Related (8,040 | 9.8%).

Sales and Office Occupations by Sex
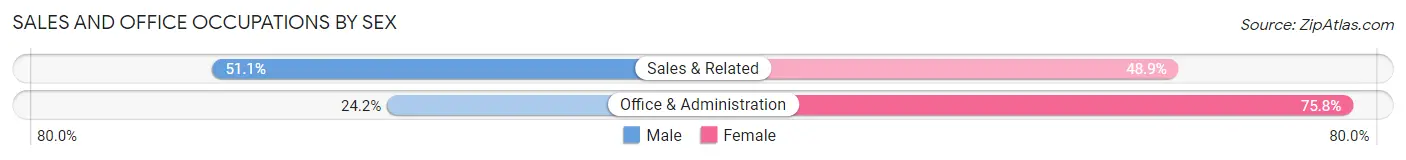
| Occupation | Male | Female |
| Sales & Related | 4,108 (51.1%) | 3,932 (48.9%) |
| Office & Administration | 2,664 (24.2%) | 8,327 (75.8%) |
| Total (Category) | 6,772 (35.6%) | 12,259 (64.4%) |
| Total (Overall) | 44,495 (54.0%) | 37,938 (46.0%) |
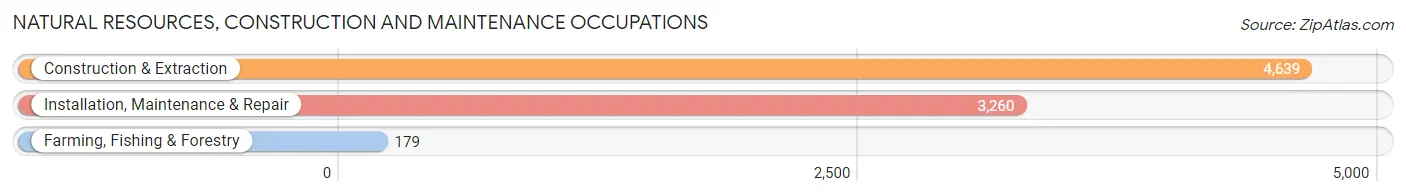
Natural Resources, Construction and Maintenance Occupations
The most common Natural Resources, Construction and Maintenance occupations in Guadalupe County are Construction & Extraction (4,639 | 5.6%), Installation, Maintenance & Repair (3,260 | 4.0%), and Farming, Fishing & Forestry (179 | 0.2%).
Natural Resources, Construction and Maintenance Occupations by Sex
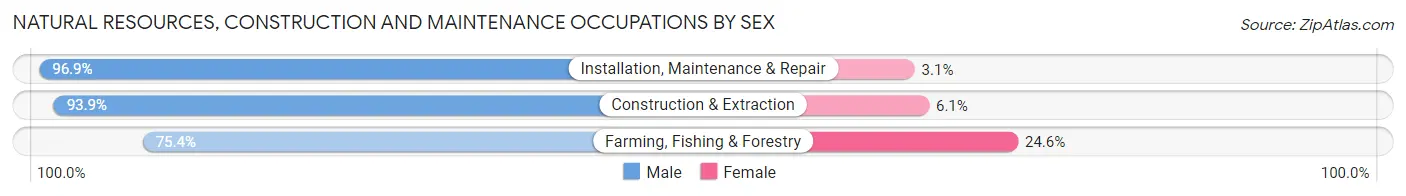
| Occupation | Male | Female |
| Farming, Fishing & Forestry | 135 (75.4%) | 44 (24.6%) |
| Construction & Extraction | 4,358 (93.9%) | 281 (6.1%) |
| Installation, Maintenance & Repair | 3,160 (96.9%) | 100 (3.1%) |
| Total (Category) | 7,653 (94.7%) | 425 (5.3%) |
| Total (Overall) | 44,495 (54.0%) | 37,938 (46.0%) |
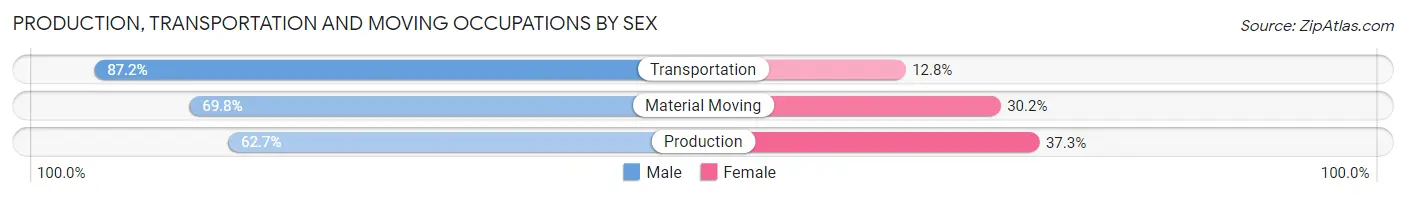
Production, Transportation and Moving Occupations
The most common Production, Transportation and Moving occupations in Guadalupe County are Production (5,296 | 6.4%), Material Moving (3,968 | 4.8%), and Transportation (3,608 | 4.4%).
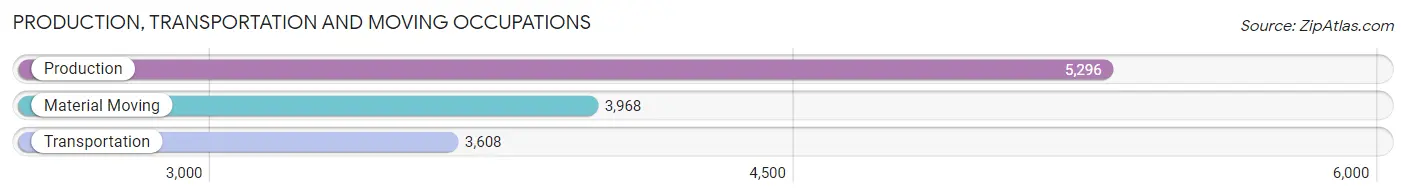
Production, Transportation and Moving Occupations by Sex
| Occupation | Male | Female |
| Production | 3,319 (62.7%) | 1,977 (37.3%) |
| Transportation | 3,147 (87.2%) | 461 (12.8%) |
| Material Moving | 2,769 (69.8%) | 1,199 (30.2%) |
| Total (Category) | 9,235 (71.7%) | 3,637 (28.3%) |
| Total (Overall) | 44,495 (54.0%) | 37,938 (46.0%) |
Employment Industries by Sex in Guadalupe County
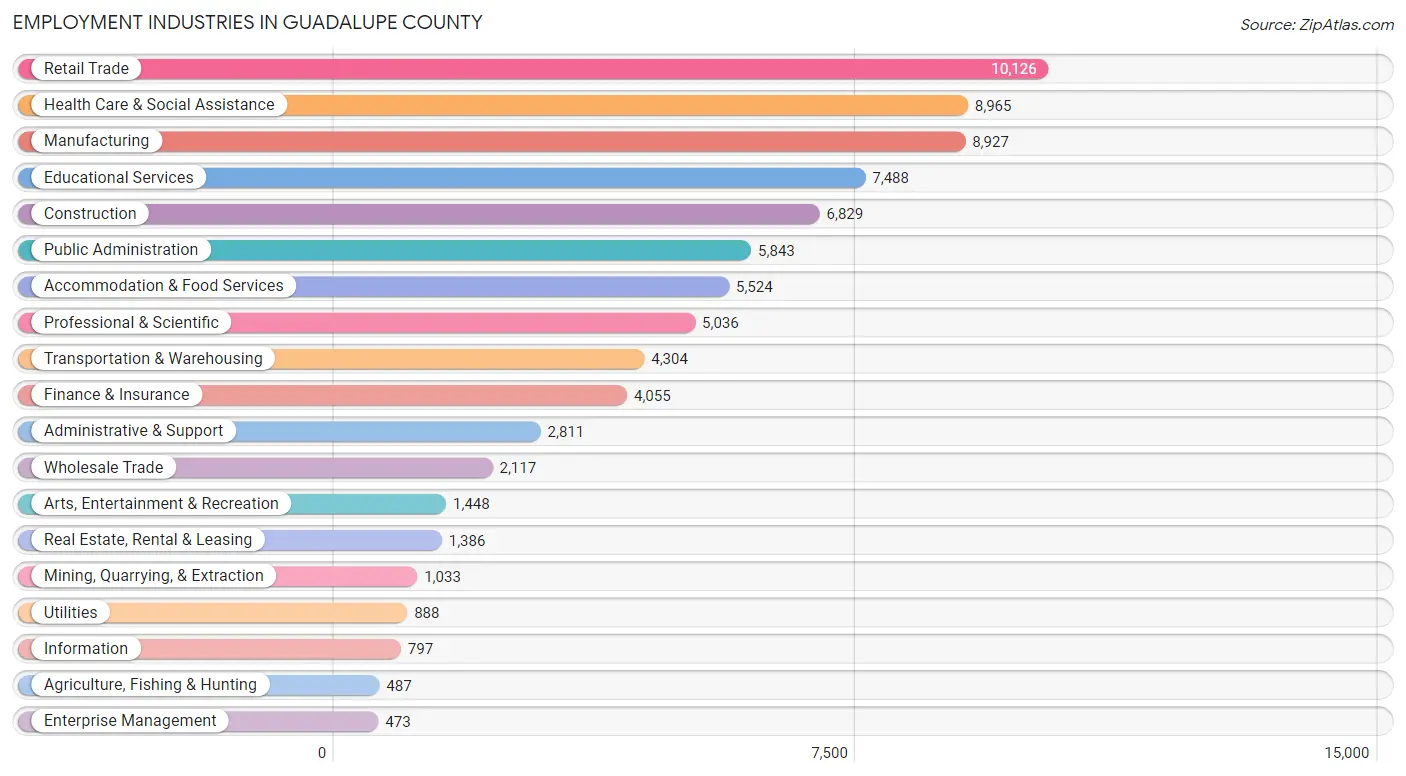
Employment Industries in Guadalupe County
The major employment industries in Guadalupe County include Retail Trade (10,126 | 12.3%), Health Care & Social Assistance (8,965 | 10.9%), Manufacturing (8,927 | 10.8%), Educational Services (7,488 | 9.1%), and Construction (6,829 | 8.3%).
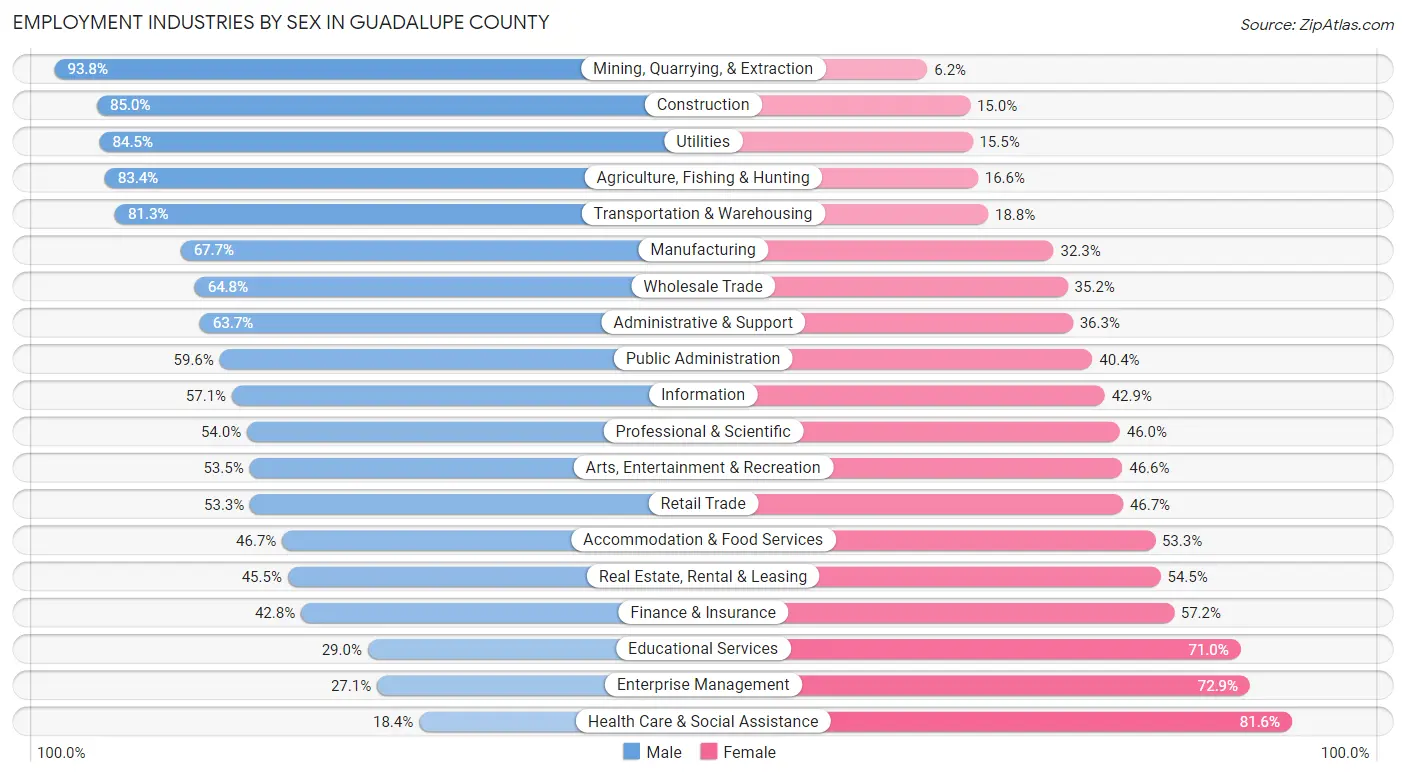
Employment Industries by Sex in Guadalupe County
The Guadalupe County industries that see more men than women are Mining, Quarrying, & Extraction (93.8%), Construction (85.0%), and Utilities (84.5%), whereas the industries that tend to have a higher number of women are Health Care & Social Assistance (81.6%), Enterprise Management (72.9%), and Educational Services (71.0%).
| Industry | Male | Female |
| Agriculture, Fishing & Hunting | 406 (83.4%) | 81 (16.6%) |
| Mining, Quarrying, & Extraction | 969 (93.8%) | 64 (6.2%) |
| Construction | 5,803 (85.0%) | 1,026 (15.0%) |
| Manufacturing | 6,042 (67.7%) | 2,885 (32.3%) |
| Wholesale Trade | 1,371 (64.8%) | 746 (35.2%) |
| Retail Trade | 5,399 (53.3%) | 4,727 (46.7%) |
| Transportation & Warehousing | 3,497 (81.2%) | 807 (18.8%) |
| Utilities | 750 (84.5%) | 138 (15.5%) |
| Information | 455 (57.1%) | 342 (42.9%) |
| Finance & Insurance | 1,735 (42.8%) | 2,320 (57.2%) |
| Real Estate, Rental & Leasing | 631 (45.5%) | 755 (54.5%) |
| Professional & Scientific | 2,718 (54.0%) | 2,318 (46.0%) |
| Enterprise Management | 128 (27.1%) | 345 (72.9%) |
| Administrative & Support | 1,791 (63.7%) | 1,020 (36.3%) |
| Educational Services | 2,169 (29.0%) | 5,319 (71.0%) |
| Health Care & Social Assistance | 1,646 (18.4%) | 7,319 (81.6%) |
| Arts, Entertainment & Recreation | 774 (53.4%) | 674 (46.6%) |
| Accommodation & Food Services | 2,579 (46.7%) | 2,945 (53.3%) |
| Public Administration | 3,485 (59.6%) | 2,358 (40.4%) |
| Total | 44,495 (54.0%) | 37,938 (46.0%) |
Education in Guadalupe County
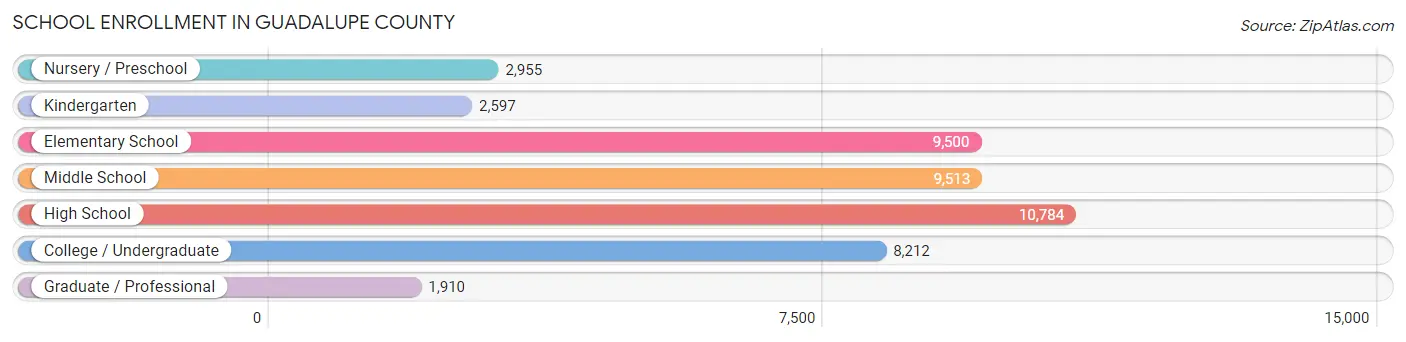
School Enrollment in Guadalupe County
The most common levels of schooling among the 45,471 students in Guadalupe County are high school (10,784 | 23.7%), middle school (9,513 | 20.9%), and elementary school (9,500 | 20.9%).
| School Level | # Students | % Students |
| Nursery / Preschool | 2,955 | 6.5% |
| Kindergarten | 2,597 | 5.7% |
| Elementary School | 9,500 | 20.9% |
| Middle School | 9,513 | 20.9% |
| High School | 10,784 | 23.7% |
| College / Undergraduate | 8,212 | 18.1% |
| Graduate / Professional | 1,910 | 4.2% |
| Total | 45,471 | 100.0% |
School Enrollment by Age by Funding Source in Guadalupe County
Out of a total of 45,471 students who are enrolled in schools in Guadalupe County, 6,457 (14.2%) attend a private institution, while the remaining 39,014 (85.8%) are enrolled in public schools. The age group of 3 to 4 year olds has the highest likelihood of being enrolled in private schools, with 1,060 (42.4% in the age bracket) enrolled. Conversely, the age group of 10 to 14 year olds has the lowest likelihood of being enrolled in a private school, with 11,209 (92.8% in the age bracket) attending a public institution.
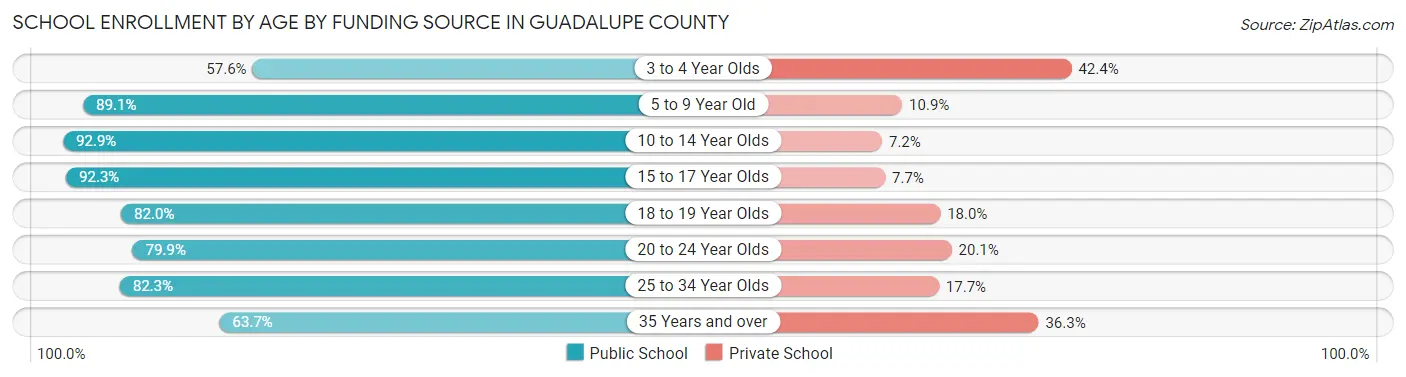
| Age Bracket | Public School | Private School |
| 3 to 4 Year Olds | 1,438 (57.6%) | 1,060 (42.4%) |
| 5 to 9 Year Old | 10,092 (89.1%) | 1,233 (10.9%) |
| 10 to 14 Year Olds | 11,209 (92.8%) | 863 (7.1%) |
| 15 to 17 Year Olds | 6,915 (92.3%) | 578 (7.7%) |
| 18 to 19 Year Olds | 2,532 (82.0%) | 555 (18.0%) |
| 20 to 24 Year Olds | 3,217 (79.9%) | 810 (20.1%) |
| 25 to 34 Year Olds | 2,027 (82.3%) | 437 (17.7%) |
| 35 Years and over | 1,596 (63.7%) | 909 (36.3%) |
| Total | 39,014 (85.8%) | 6,457 (14.2%) |
Educational Attainment by Field of Study in Guadalupe County
Business (8,564 | 23.6%), education (4,902 | 13.5%), science & technology (4,064 | 11.2%), arts & humanities (2,591 | 7.1%), and bio, nature & agricultural (2,094 | 5.8%) are the most common fields of study among 36,220 individuals in Guadalupe County who have obtained a bachelor's degree or higher.
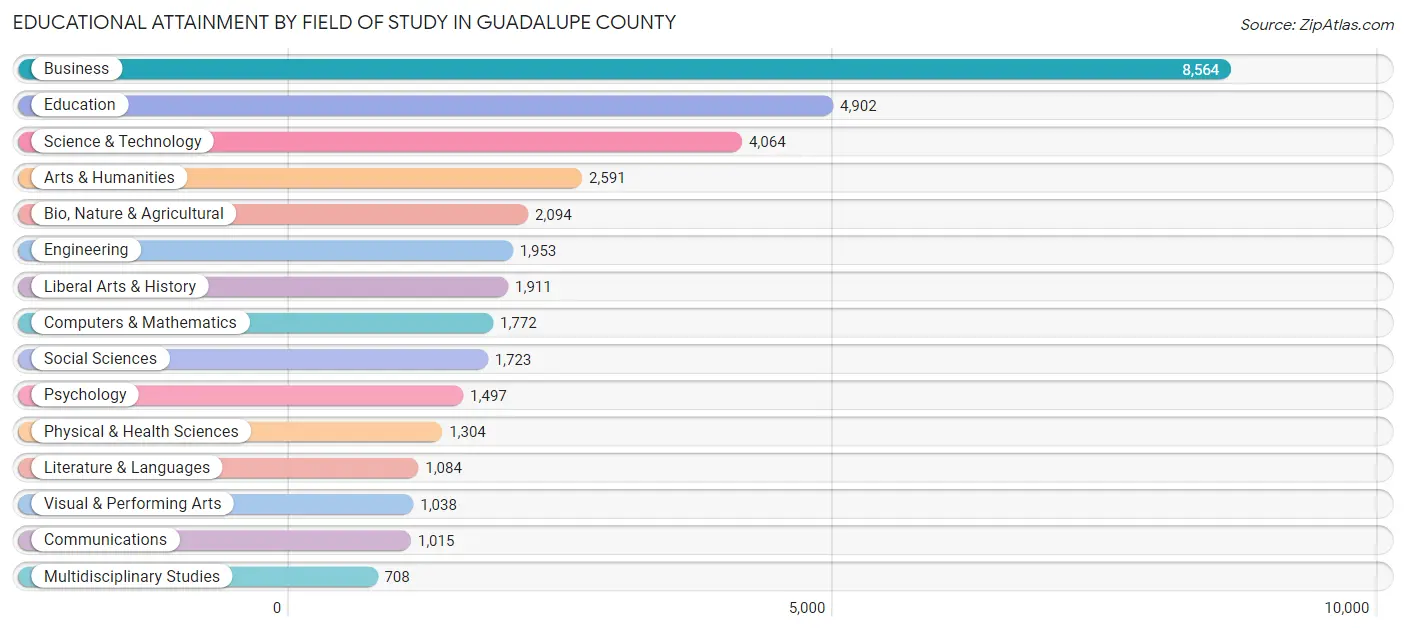
| Field of Study | # Graduates | % Graduates |
| Computers & Mathematics | 1,772 | 4.9% |
| Bio, Nature & Agricultural | 2,094 | 5.8% |
| Physical & Health Sciences | 1,304 | 3.6% |
| Psychology | 1,497 | 4.1% |
| Social Sciences | 1,723 | 4.8% |
| Engineering | 1,953 | 5.4% |
| Multidisciplinary Studies | 708 | 1.9% |
| Science & Technology | 4,064 | 11.2% |
| Business | 8,564 | 23.6% |
| Education | 4,902 | 13.5% |
| Literature & Languages | 1,084 | 3.0% |
| Liberal Arts & History | 1,911 | 5.3% |
| Visual & Performing Arts | 1,038 | 2.9% |
| Communications | 1,015 | 2.8% |
| Arts & Humanities | 2,591 | 7.1% |
| Total | 36,220 | 100.0% |
Transportation & Commute in Guadalupe County
Vehicle Availability by Sex in Guadalupe County
The most prevalent vehicle ownership categories in Guadalupe County are males with 2 vehicles (18,192, accounting for 40.2%) and females with 2 vehicles (15,172, making up 48.1%).
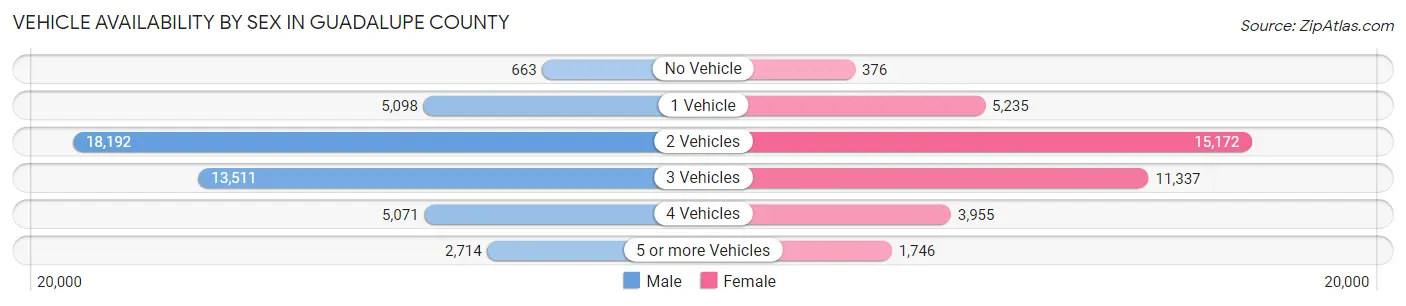
| Vehicles Available | Male | Female |
| No Vehicle | 663 (1.5%) | 376 (1.0%) |
| 1 Vehicle | 5,098 (11.3%) | 5,235 (13.8%) |
| 2 Vehicles | 18,192 (40.2%) | 15,172 (40.1%) |
| 3 Vehicles | 13,511 (29.9%) | 11,337 (30.0%) |
| 4 Vehicles | 5,071 (11.2%) | 3,955 (10.5%) |
| 5 or more Vehicles | 2,714 (6.0%) | 1,746 (4.6%) |
| Total | 45,249 (100.0%) | 37,821 (100.0%) |
Commute Time in Guadalupe County
The most frequently occuring commute durations in Guadalupe County are 15 to 19 minutes (11,450 commuters, 15.3%), 30 to 34 minutes (11,447 commuters, 15.3%), and 20 to 24 minutes (10,974 commuters, 14.6%).
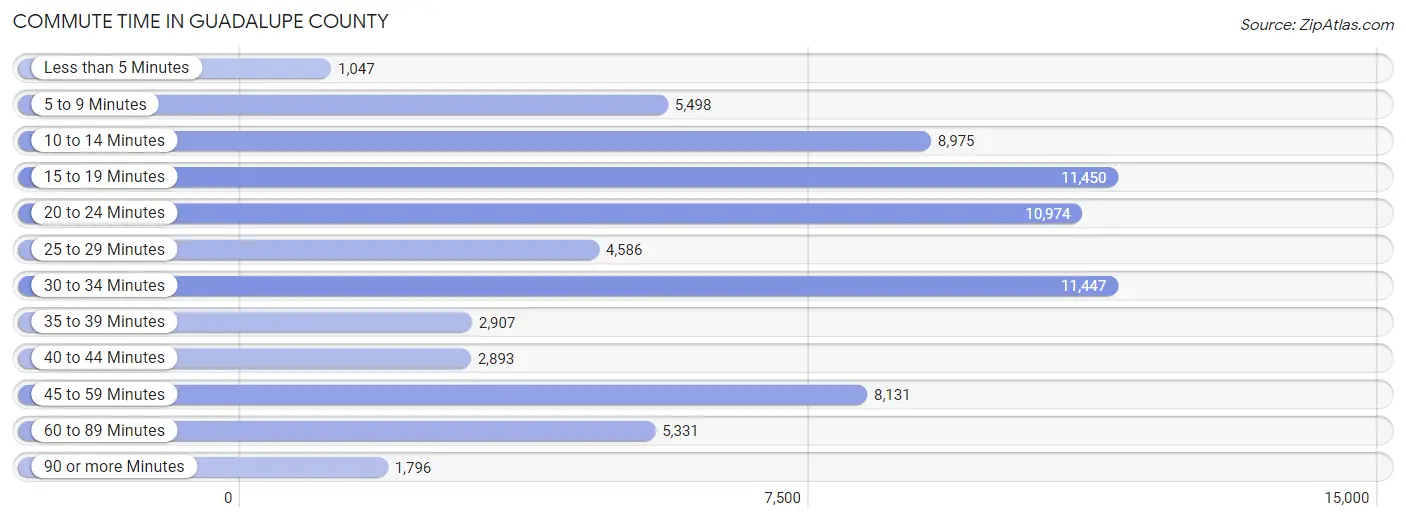
| Commute Time | # Commuters | % Commuters |
| Less than 5 Minutes | 1,047 | 1.4% |
| 5 to 9 Minutes | 5,498 | 7.3% |
| 10 to 14 Minutes | 8,975 | 12.0% |
| 15 to 19 Minutes | 11,450 | 15.3% |
| 20 to 24 Minutes | 10,974 | 14.6% |
| 25 to 29 Minutes | 4,586 | 6.1% |
| 30 to 34 Minutes | 11,447 | 15.3% |
| 35 to 39 Minutes | 2,907 | 3.9% |
| 40 to 44 Minutes | 2,893 | 3.9% |
| 45 to 59 Minutes | 8,131 | 10.8% |
| 60 to 89 Minutes | 5,331 | 7.1% |
| 90 or more Minutes | 1,796 | 2.4% |
Commute Time by Sex in Guadalupe County
The most common commute times in Guadalupe County are 30 to 34 minutes (6,919 commuters, 16.9%) for males and 15 to 19 minutes (5,980 commuters, 17.6%) for females.
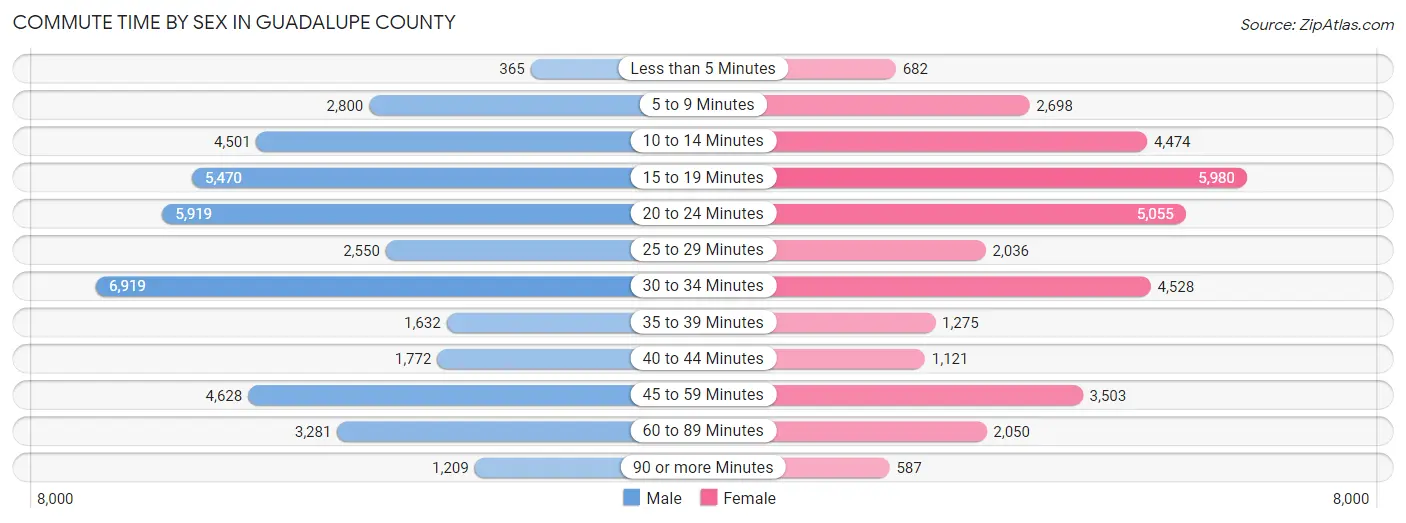
| Commute Time | Male | Female |
| Less than 5 Minutes | 365 (0.9%) | 682 (2.0%) |
| 5 to 9 Minutes | 2,800 (6.8%) | 2,698 (7.9%) |
| 10 to 14 Minutes | 4,501 (11.0%) | 4,474 (13.2%) |
| 15 to 19 Minutes | 5,470 (13.3%) | 5,980 (17.6%) |
| 20 to 24 Minutes | 5,919 (14.4%) | 5,055 (14.9%) |
| 25 to 29 Minutes | 2,550 (6.2%) | 2,036 (6.0%) |
| 30 to 34 Minutes | 6,919 (16.9%) | 4,528 (13.3%) |
| 35 to 39 Minutes | 1,632 (4.0%) | 1,275 (3.7%) |
| 40 to 44 Minutes | 1,772 (4.3%) | 1,121 (3.3%) |
| 45 to 59 Minutes | 4,628 (11.3%) | 3,503 (10.3%) |
| 60 to 89 Minutes | 3,281 (8.0%) | 2,050 (6.0%) |
| 90 or more Minutes | 1,209 (2.9%) | 587 (1.7%) |
Time of Departure to Work by Sex in Guadalupe County
The most frequent times of departure to work in Guadalupe County are 7:00 AM to 7:29 AM (5,883, 14.3%) for males and 7:00 AM to 7:29 AM (5,893, 17.3%) for females.
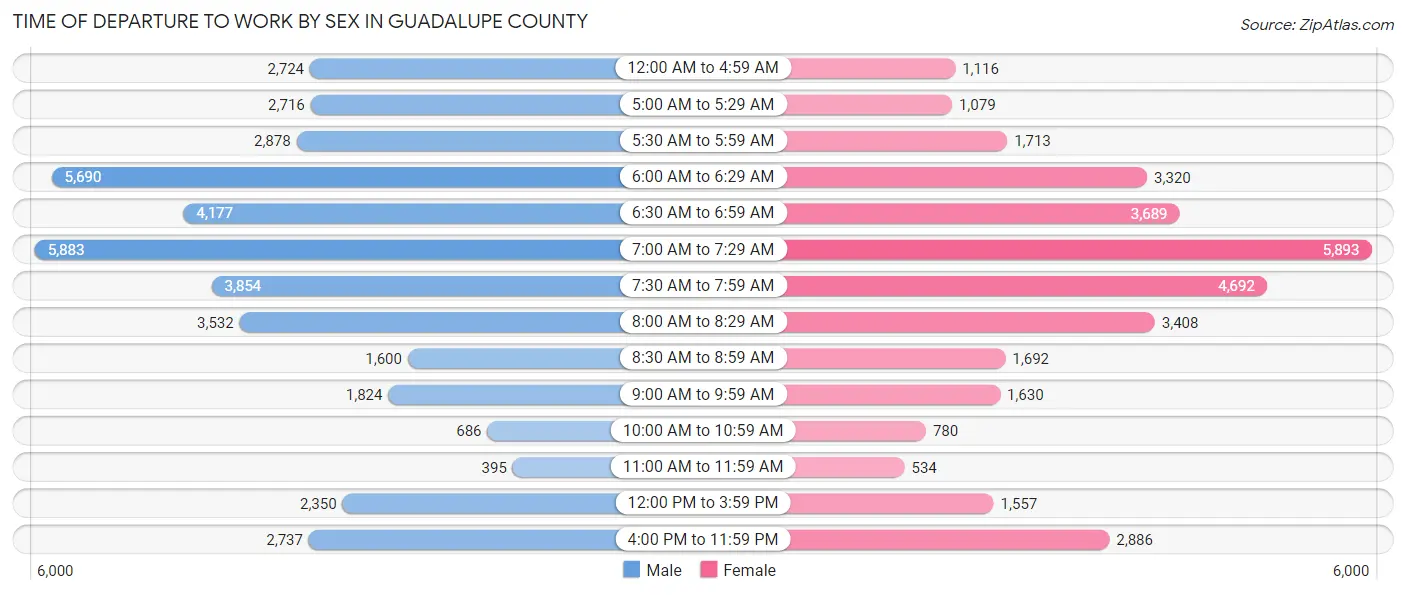
| Time of Departure | Male | Female |
| 12:00 AM to 4:59 AM | 2,724 (6.6%) | 1,116 (3.3%) |
| 5:00 AM to 5:29 AM | 2,716 (6.6%) | 1,079 (3.2%) |
| 5:30 AM to 5:59 AM | 2,878 (7.0%) | 1,713 (5.0%) |
| 6:00 AM to 6:29 AM | 5,690 (13.9%) | 3,320 (9.8%) |
| 6:30 AM to 6:59 AM | 4,177 (10.2%) | 3,689 (10.8%) |
| 7:00 AM to 7:29 AM | 5,883 (14.3%) | 5,893 (17.3%) |
| 7:30 AM to 7:59 AM | 3,854 (9.4%) | 4,692 (13.8%) |
| 8:00 AM to 8:29 AM | 3,532 (8.6%) | 3,408 (10.0%) |
| 8:30 AM to 8:59 AM | 1,600 (3.9%) | 1,692 (5.0%) |
| 9:00 AM to 9:59 AM | 1,824 (4.4%) | 1,630 (4.8%) |
| 10:00 AM to 10:59 AM | 686 (1.7%) | 780 (2.3%) |
| 11:00 AM to 11:59 AM | 395 (1.0%) | 534 (1.6%) |
| 12:00 PM to 3:59 PM | 2,350 (5.7%) | 1,557 (4.6%) |
| 4:00 PM to 11:59 PM | 2,737 (6.7%) | 2,886 (8.5%) |
| Total | 41,046 (100.0%) | 33,989 (100.0%) |
Housing Occupancy in Guadalupe County
Occupancy by Ownership in Guadalupe County
Of the total 60,463 dwellings in Guadalupe County, owner-occupied units account for 47,052 (77.8%), while renter-occupied units make up 13,411 (22.2%).
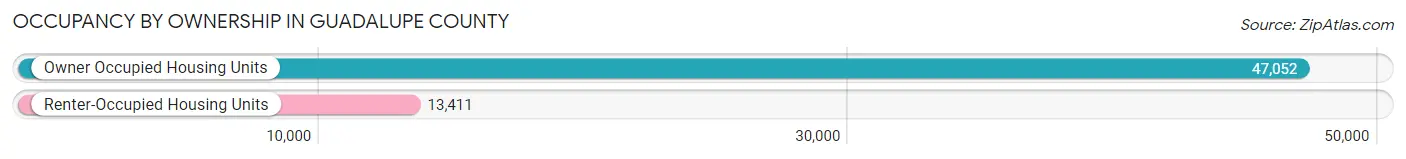
| Occupancy | # Housing Units | % Housing Units |
| Owner Occupied Housing Units | 47,052 | 77.8% |
| Renter-Occupied Housing Units | 13,411 | 22.2% |
| Total Occupied Housing Units | 60,463 | 100.0% |
Occupancy by Household Size in Guadalupe County
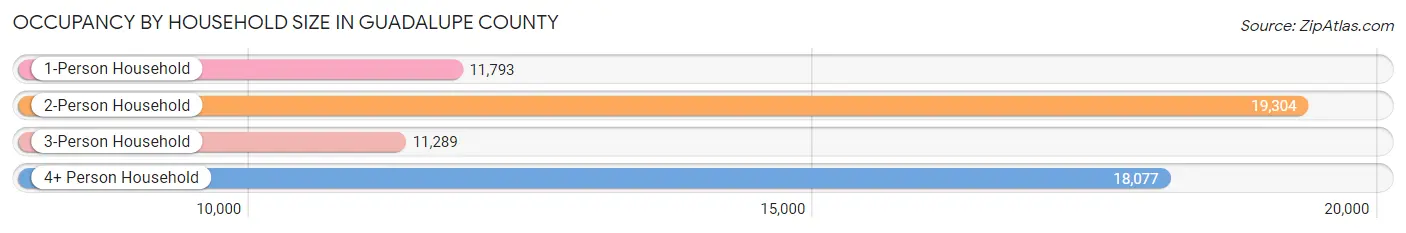
| Household Size | # Housing Units | % Housing Units |
| 1-Person Household | 11,793 | 19.5% |
| 2-Person Household | 19,304 | 31.9% |
| 3-Person Household | 11,289 | 18.7% |
| 4+ Person Household | 18,077 | 29.9% |
| Total Housing Units | 60,463 | 100.0% |
Occupancy by Ownership by Household Size in Guadalupe County
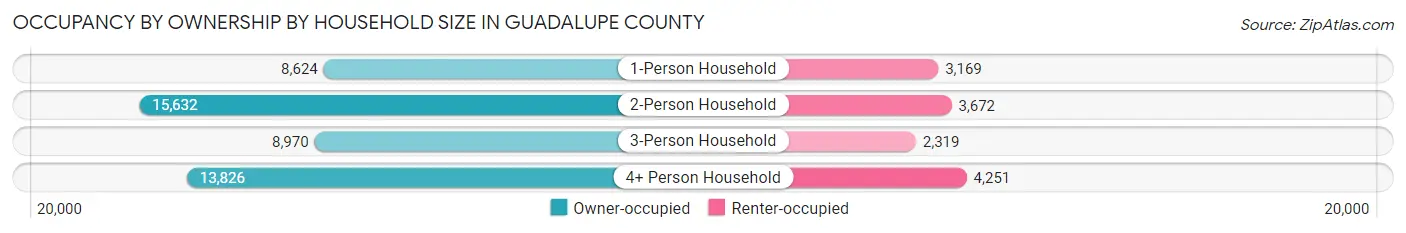
| Household Size | Owner-occupied | Renter-occupied |
| 1-Person Household | 8,624 (73.1%) | 3,169 (26.9%) |
| 2-Person Household | 15,632 (81.0%) | 3,672 (19.0%) |
| 3-Person Household | 8,970 (79.5%) | 2,319 (20.5%) |
| 4+ Person Household | 13,826 (76.5%) | 4,251 (23.5%) |
| Total Housing Units | 47,052 (77.8%) | 13,411 (22.2%) |
Occupancy by Educational Attainment in Guadalupe County
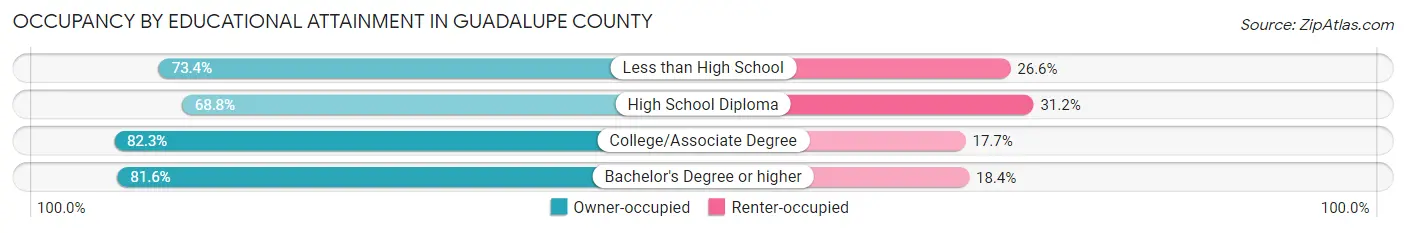
| Household Size | Owner-occupied | Renter-occupied |
| Less than High School | 3,899 (73.4%) | 1,414 (26.6%) |
| High School Diploma | 10,616 (68.8%) | 4,812 (31.2%) |
| College/Associate Degree | 15,411 (82.3%) | 3,320 (17.7%) |
| Bachelor's Degree or higher | 17,126 (81.6%) | 3,865 (18.4%) |
Occupancy by Age of Householder in Guadalupe County
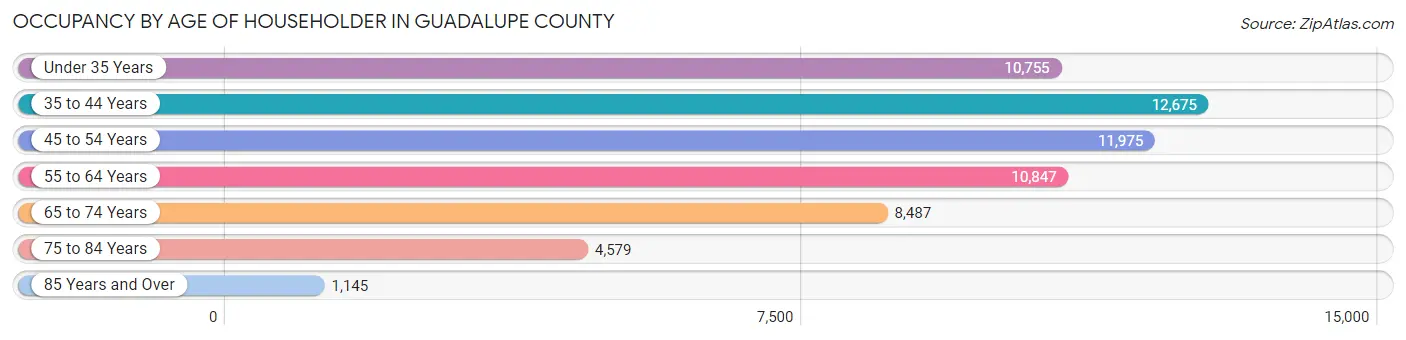
| Age Bracket | # Households | % Households |
| Under 35 Years | 10,755 | 17.8% |
| 35 to 44 Years | 12,675 | 21.0% |
| 45 to 54 Years | 11,975 | 19.8% |
| 55 to 64 Years | 10,847 | 17.9% |
| 65 to 74 Years | 8,487 | 14.0% |
| 75 to 84 Years | 4,579 | 7.6% |
| 85 Years and Over | 1,145 | 1.9% |
| Total | 60,463 | 100.0% |
Housing Finances in Guadalupe County
Median Income by Occupancy in Guadalupe County
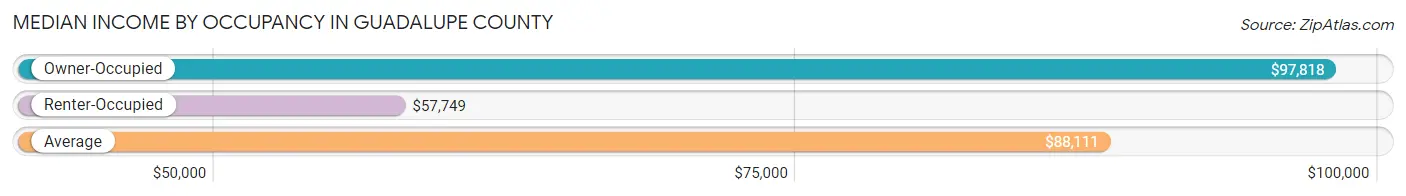
| Occupancy Type | # Households | Median Income |
| Owner-Occupied | 47,052 (77.8%) | $97,818 |
| Renter-Occupied | 13,411 (22.2%) | $57,749 |
| Average | 60,463 (100.0%) | $88,111 |
Occupancy by Householder Income Bracket in Guadalupe County
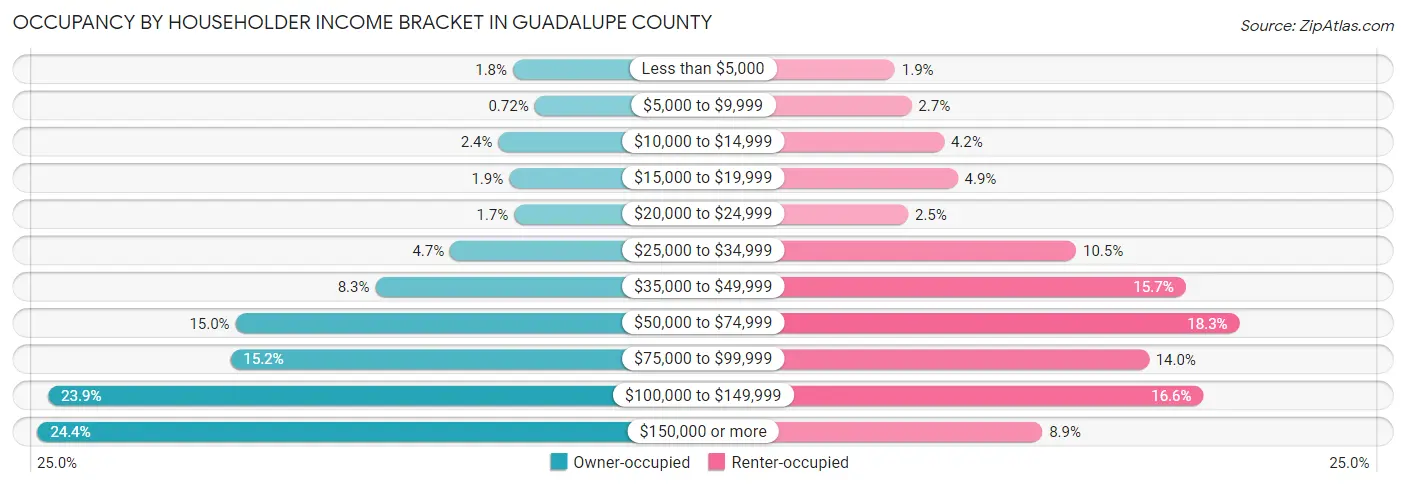
| Income Bracket | Owner-occupied | Renter-occupied |
| Less than $5,000 | 825 (1.8%) | 251 (1.9%) |
| $5,000 to $9,999 | 341 (0.7%) | 357 (2.7%) |
| $10,000 to $14,999 | 1,147 (2.4%) | 564 (4.2%) |
| $15,000 to $19,999 | 908 (1.9%) | 652 (4.9%) |
| $20,000 to $24,999 | 795 (1.7%) | 335 (2.5%) |
| $25,000 to $34,999 | 2,228 (4.7%) | 1,408 (10.5%) |
| $35,000 to $49,999 | 3,906 (8.3%) | 2,107 (15.7%) |
| $50,000 to $74,999 | 7,041 (15.0%) | 2,452 (18.3%) |
| $75,000 to $99,999 | 7,152 (15.2%) | 1,872 (14.0%) |
| $100,000 to $149,999 | 11,234 (23.9%) | 2,221 (16.6%) |
| $150,000 or more | 11,475 (24.4%) | 1,192 (8.9%) |
| Total | 47,052 (100.0%) | 13,411 (100.0%) |
Monthly Housing Cost Tiers in Guadalupe County
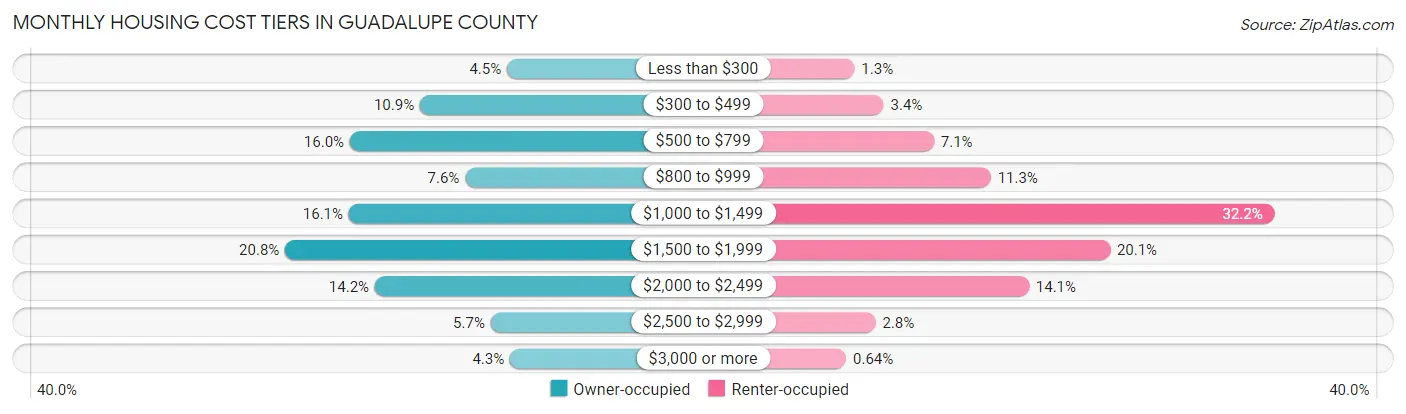
| Monthly Cost | Owner-occupied | Renter-occupied |
| Less than $300 | 2,104 (4.5%) | 167 (1.3%) |
| $300 to $499 | 5,119 (10.9%) | 456 (3.4%) |
| $500 to $799 | 7,549 (16.0%) | 952 (7.1%) |
| $800 to $999 | 3,551 (7.5%) | 1,514 (11.3%) |
| $1,000 to $1,499 | 7,583 (16.1%) | 4,319 (32.2%) |
| $1,500 to $1,999 | 9,793 (20.8%) | 2,691 (20.1%) |
| $2,000 to $2,499 | 6,683 (14.2%) | 1,891 (14.1%) |
| $2,500 to $2,999 | 2,670 (5.7%) | 376 (2.8%) |
| $3,000 or more | 2,000 (4.3%) | 86 (0.6%) |
| Total | 47,052 (100.0%) | 13,411 (100.0%) |
Physical Housing Characteristics in Guadalupe County
Housing Structures in Guadalupe County
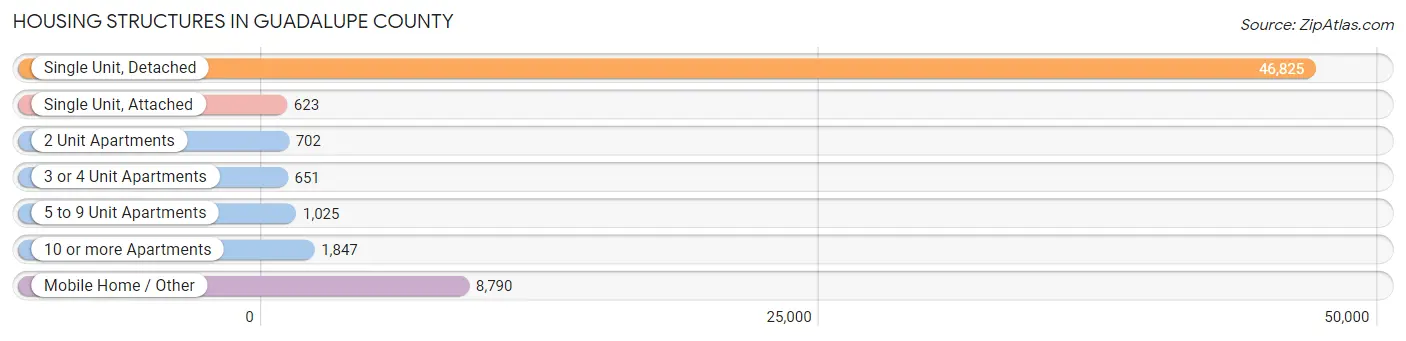
| Structure Type | # Housing Units | % Housing Units |
| Single Unit, Detached | 46,825 | 77.4% |
| Single Unit, Attached | 623 | 1.0% |
| 2 Unit Apartments | 702 | 1.2% |
| 3 or 4 Unit Apartments | 651 | 1.1% |
| 5 to 9 Unit Apartments | 1,025 | 1.7% |
| 10 or more Apartments | 1,847 | 3.0% |
| Mobile Home / Other | 8,790 | 14.5% |
| Total | 60,463 | 100.0% |
Housing Structures by Occupancy in Guadalupe County
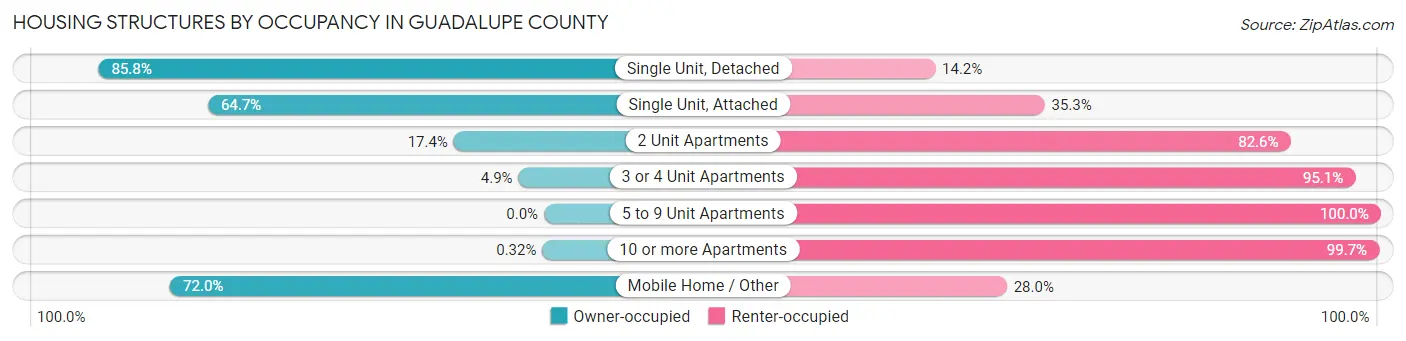
| Structure Type | Owner-occupied | Renter-occupied |
| Single Unit, Detached | 40,163 (85.8%) | 6,662 (14.2%) |
| Single Unit, Attached | 403 (64.7%) | 220 (35.3%) |
| 2 Unit Apartments | 122 (17.4%) | 580 (82.6%) |
| 3 or 4 Unit Apartments | 32 (4.9%) | 619 (95.1%) |
| 5 to 9 Unit Apartments | 0 (0.0%) | 1,025 (100.0%) |
| 10 or more Apartments | 6 (0.3%) | 1,841 (99.7%) |
| Mobile Home / Other | 6,326 (72.0%) | 2,464 (28.0%) |
| Total | 47,052 (77.8%) | 13,411 (22.2%) |
Housing Structures by Number of Rooms in Guadalupe County
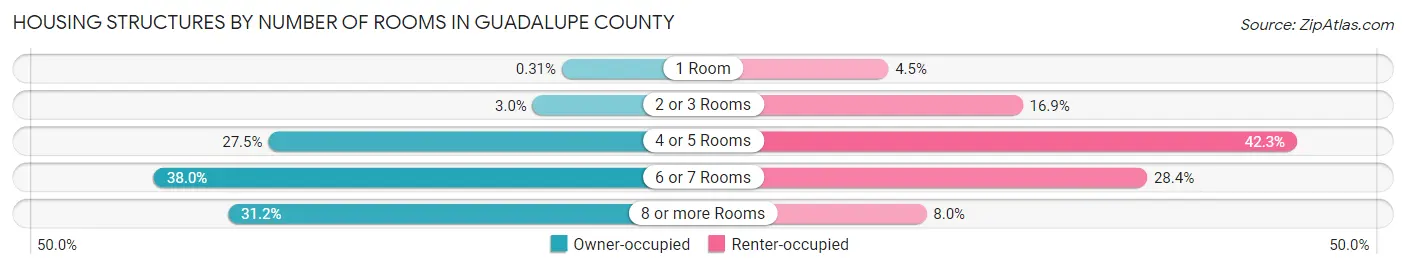
| Number of Rooms | Owner-occupied | Renter-occupied |
| 1 Room | 148 (0.3%) | 599 (4.5%) |
| 2 or 3 Rooms | 1,418 (3.0%) | 2,265 (16.9%) |
| 4 or 5 Rooms | 12,921 (27.5%) | 5,667 (42.3%) |
| 6 or 7 Rooms | 17,897 (38.0%) | 3,809 (28.4%) |
| 8 or more Rooms | 14,668 (31.2%) | 1,071 (8.0%) |
| Total | 47,052 (100.0%) | 13,411 (100.0%) |
Housing Structure by Heating Type in Guadalupe County
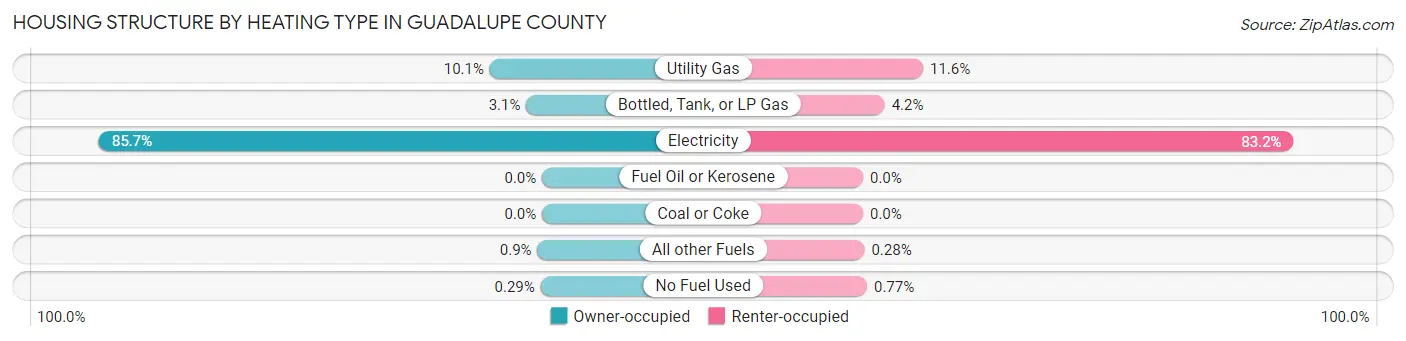
| Heating Type | Owner-occupied | Renter-occupied |
| Utility Gas | 4,751 (10.1%) | 1,555 (11.6%) |
| Bottled, Tank, or LP Gas | 1,439 (3.1%) | 562 (4.2%) |
| Electricity | 40,300 (85.7%) | 11,153 (83.2%) |
| Fuel Oil or Kerosene | 0 (0.0%) | 0 (0.0%) |
| Coal or Coke | 0 (0.0%) | 0 (0.0%) |
| All other Fuels | 425 (0.9%) | 38 (0.3%) |
| No Fuel Used | 137 (0.3%) | 103 (0.8%) |
| Total | 47,052 (100.0%) | 13,411 (100.0%) |
Household Vehicle Usage in Guadalupe County
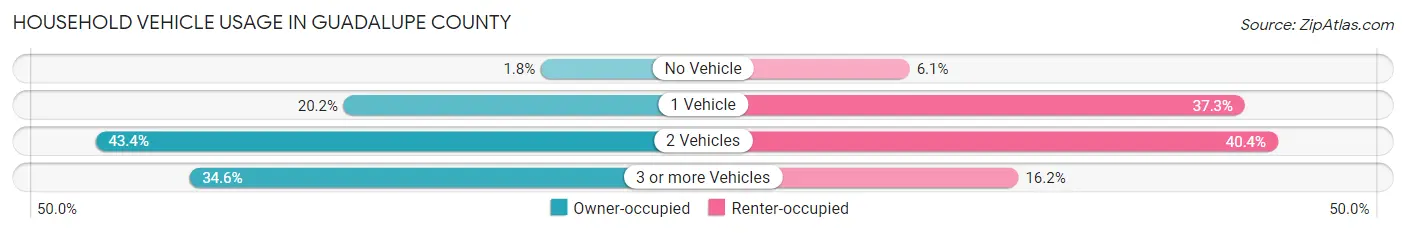
| Vehicles per Household | Owner-occupied | Renter-occupied |
| No Vehicle | 844 (1.8%) | 812 (6.0%) |
| 1 Vehicle | 9,503 (20.2%) | 5,006 (37.3%) |
| 2 Vehicles | 20,410 (43.4%) | 5,420 (40.4%) |
| 3 or more Vehicles | 16,295 (34.6%) | 2,173 (16.2%) |
| Total | 47,052 (100.0%) | 13,411 (100.0%) |
Real Estate & Mortgages in Guadalupe County
Real Estate and Mortgage Overview in Guadalupe County
| Characteristic | Without Mortgage | With Mortgage |
| Housing Units | 18,304 | 28,748 |
| Median Property Value | $222,900 | $274,100 |
| Median Household Income | $68,130 | $8,621 |
| Monthly Housing Costs | $586 | $1,948 |
| Real Estate Taxes | $2,629 | $2,393 |
Property Value by Mortgage Status in Guadalupe County
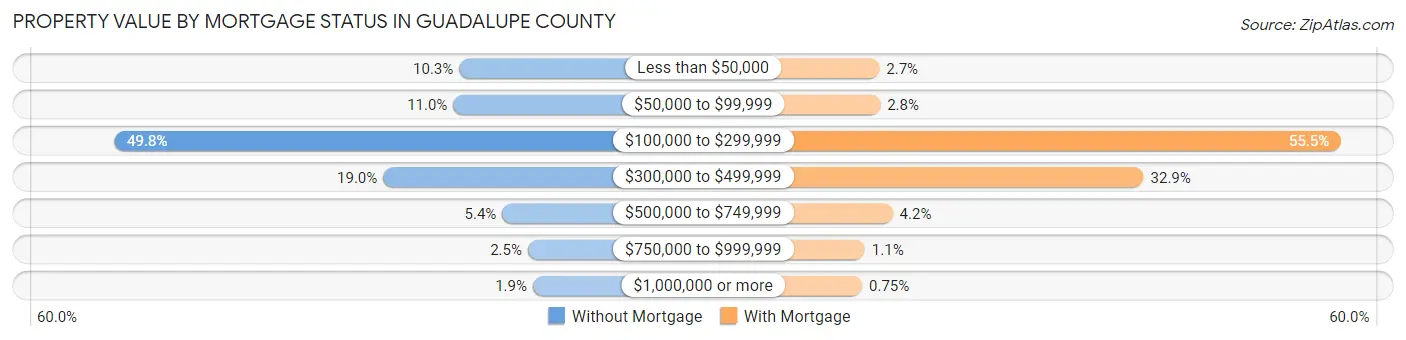
| Property Value | Without Mortgage | With Mortgage |
| Less than $50,000 | 1,893 (10.3%) | 782 (2.7%) |
| $50,000 to $99,999 | 2,018 (11.0%) | 811 (2.8%) |
| $100,000 to $299,999 | 9,111 (49.8%) | 15,948 (55.5%) |
| $300,000 to $499,999 | 3,484 (19.0%) | 9,463 (32.9%) |
| $500,000 to $749,999 | 992 (5.4%) | 1,219 (4.2%) |
| $750,000 to $999,999 | 455 (2.5%) | 309 (1.1%) |
| $1,000,000 or more | 351 (1.9%) | 216 (0.7%) |
| Total | 18,304 (100.0%) | 28,748 (100.0%) |
Household Income by Mortgage Status in Guadalupe County
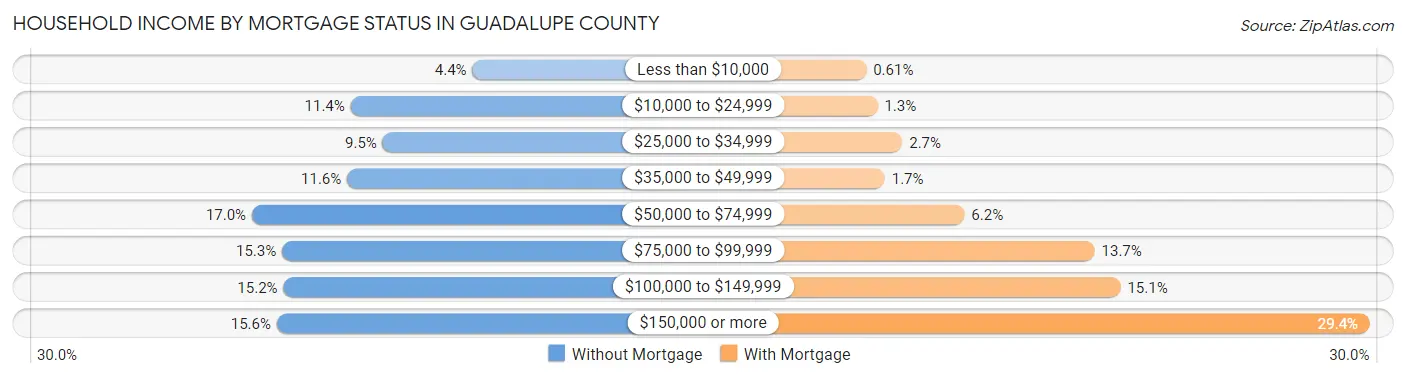
| Household Income | Without Mortgage | With Mortgage |
| Less than $10,000 | 807 (4.4%) | 174 (0.6%) |
| $10,000 to $24,999 | 2,081 (11.4%) | 359 (1.3%) |
| $25,000 to $34,999 | 1,747 (9.5%) | 769 (2.7%) |
| $35,000 to $49,999 | 2,118 (11.6%) | 481 (1.7%) |
| $50,000 to $74,999 | 3,114 (17.0%) | 1,788 (6.2%) |
| $75,000 to $99,999 | 2,799 (15.3%) | 3,927 (13.7%) |
| $100,000 to $149,999 | 2,784 (15.2%) | 4,353 (15.1%) |
| $150,000 or more | 2,854 (15.6%) | 8,450 (29.4%) |
| Total | 18,304 (100.0%) | 28,748 (100.0%) |
Property Value to Household Income Ratio in Guadalupe County
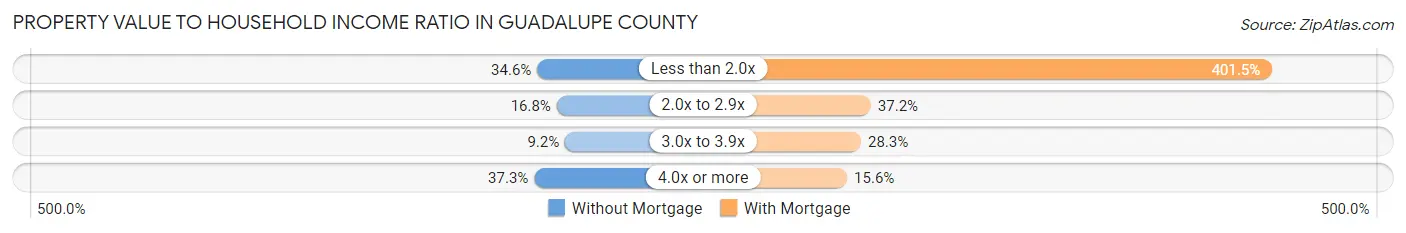
| Value-to-Income Ratio | Without Mortgage | With Mortgage |
| Less than 2.0x | 6,327 (34.6%) | 115,432 (401.5%) |
| 2.0x to 2.9x | 3,083 (16.8%) | 10,698 (37.2%) |
| 3.0x to 3.9x | 1,686 (9.2%) | 8,128 (28.3%) |
| 4.0x or more | 6,826 (37.3%) | 4,497 (15.6%) |
| Total | 18,304 (100.0%) | 28,748 (100.0%) |
Real Estate Taxes by Mortgage Status in Guadalupe County
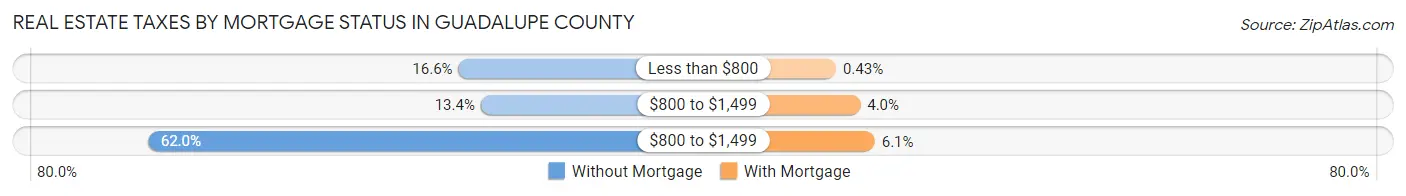
| Property Taxes | Without Mortgage | With Mortgage |
| Less than $800 | 3,041 (16.6%) | 125 (0.4%) |
| $800 to $1,499 | 2,444 (13.4%) | 1,144 (4.0%) |
| $800 to $1,499 | 11,349 (62.0%) | 1,755 (6.1%) |
| Total | 18,304 (100.0%) | 28,748 (100.0%) |
Health & Disability in Guadalupe County
Health Insurance Coverage by Age in Guadalupe County
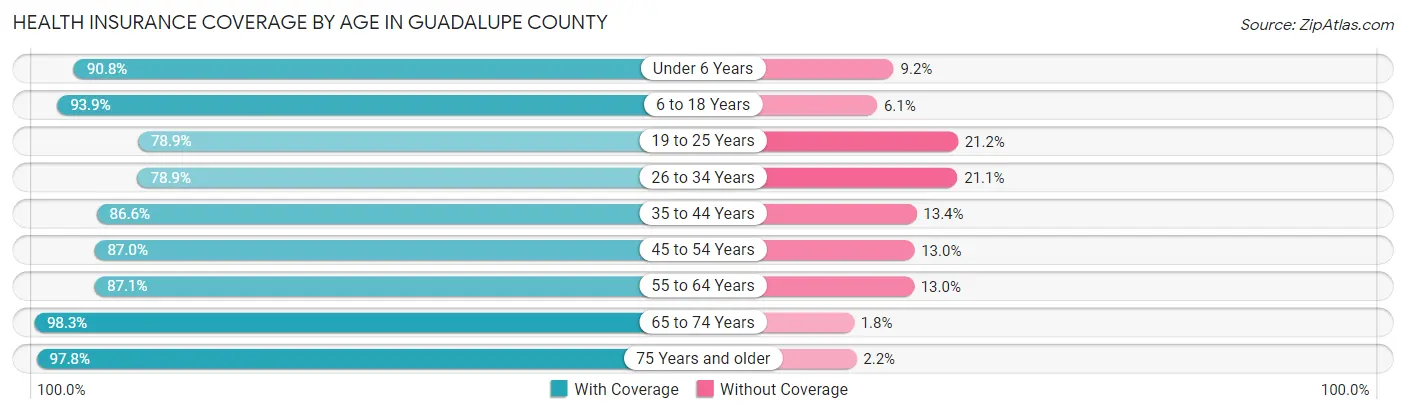
| Age Bracket | With Coverage | Without Coverage |
| Under 6 Years | 11,636 (90.8%) | 1,179 (9.2%) |
| 6 to 18 Years | 30,274 (93.9%) | 1,962 (6.1%) |
| 19 to 25 Years | 11,895 (78.8%) | 3,191 (21.1%) |
| 26 to 34 Years | 15,431 (78.9%) | 4,121 (21.1%) |
| 35 to 44 Years | 20,962 (86.6%) | 3,254 (13.4%) |
| 45 to 54 Years | 19,538 (87.0%) | 2,930 (13.0%) |
| 55 to 64 Years | 17,705 (87.1%) | 2,633 (13.0%) |
| 65 to 74 Years | 14,605 (98.3%) | 260 (1.8%) |
| 75 Years and older | 9,219 (97.8%) | 211 (2.2%) |
| Total | 151,265 (88.5%) | 19,741 (11.5%) |
Health Insurance Coverage by Citizenship Status in Guadalupe County
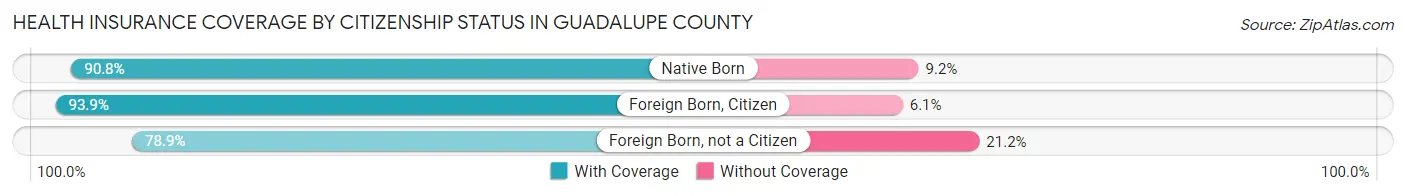
| Citizenship Status | With Coverage | Without Coverage |
| Native Born | 11,636 (90.8%) | 1,179 (9.2%) |
| Foreign Born, Citizen | 30,274 (93.9%) | 1,962 (6.1%) |
| Foreign Born, not a Citizen | 11,895 (78.8%) | 3,191 (21.1%) |
Health Insurance Coverage by Household Income in Guadalupe County
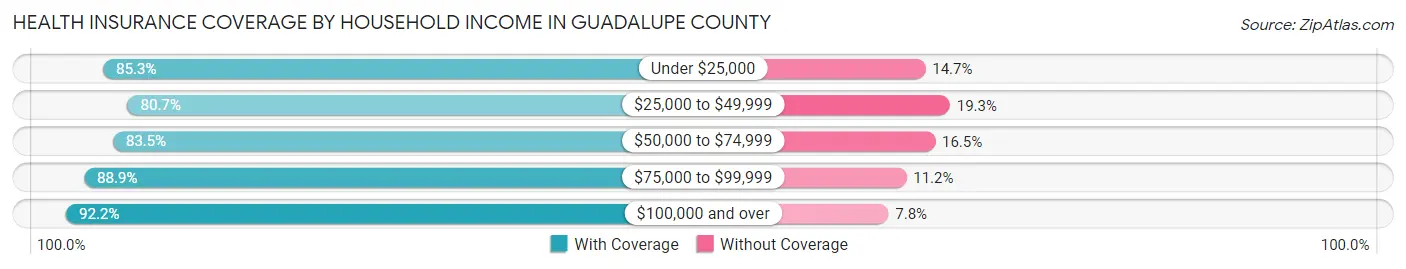
| Household Income | With Coverage | Without Coverage |
| Under $25,000 | 9,712 (85.3%) | 1,674 (14.7%) |
| $25,000 to $49,999 | 18,016 (80.7%) | 4,310 (19.3%) |
| $50,000 to $74,999 | 21,076 (83.5%) | 4,173 (16.5%) |
| $75,000 to $99,999 | 23,060 (88.8%) | 2,895 (11.2%) |
| $100,000 and over | 78,574 (92.2%) | 6,627 (7.8%) |
Public vs Private Health Insurance Coverage by Age in Guadalupe County
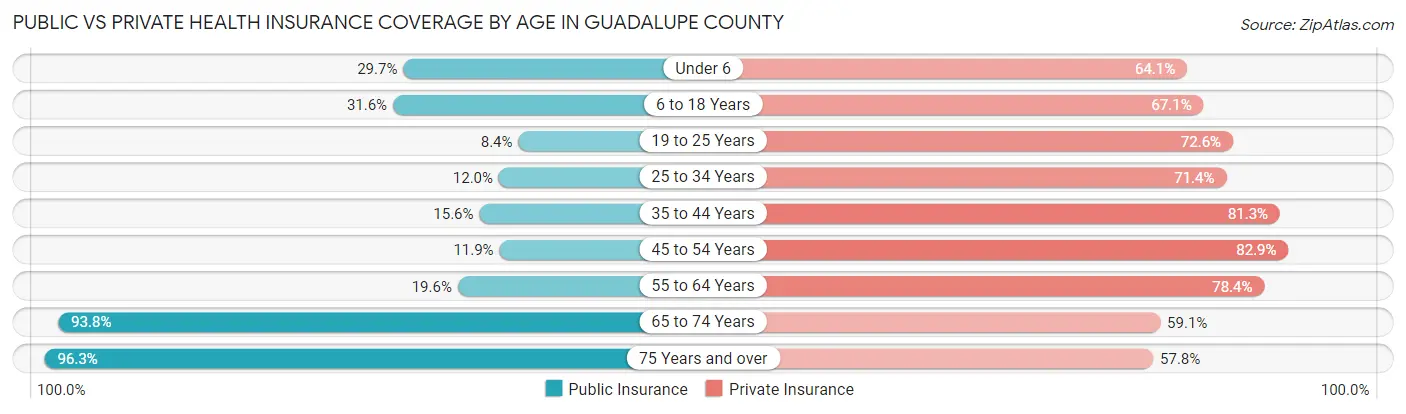
| Age Bracket | Public Insurance | Private Insurance |
| Under 6 | 3,808 (29.7%) | 8,211 (64.1%) |
| 6 to 18 Years | 10,197 (31.6%) | 21,639 (67.1%) |
| 19 to 25 Years | 1,259 (8.4%) | 10,951 (72.6%) |
| 25 to 34 Years | 2,341 (12.0%) | 13,952 (71.4%) |
| 35 to 44 Years | 3,775 (15.6%) | 19,692 (81.3%) |
| 45 to 54 Years | 2,664 (11.9%) | 18,622 (82.9%) |
| 55 to 64 Years | 3,986 (19.6%) | 15,948 (78.4%) |
| 65 to 74 Years | 13,942 (93.8%) | 8,784 (59.1%) |
| 75 Years and over | 9,082 (96.3%) | 5,450 (57.8%) |
| Total | 51,054 (29.9%) | 123,249 (72.1%) |
Disability Status by Sex by Age in Guadalupe County
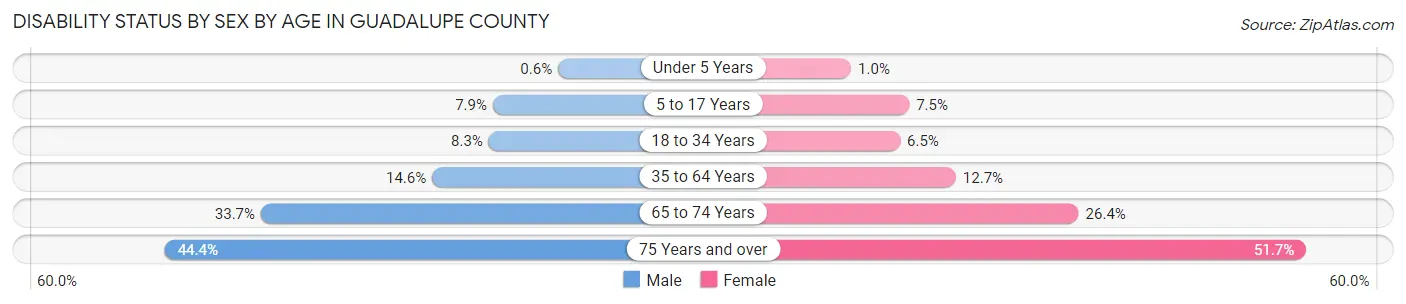
| Age Bracket | Male | Female |
| Under 5 Years | 31 (0.6%) | 52 (1.0%) |
| 5 to 17 Years | 1,301 (7.9%) | 1,184 (7.5%) |
| 18 to 34 Years | 1,559 (8.3%) | 1,199 (6.5%) |
| 35 to 64 Years | 4,856 (14.6%) | 4,297 (12.7%) |
| 65 to 74 Years | 2,369 (33.7%) | 2,066 (26.4%) |
| 75 Years and over | 1,793 (44.4%) | 2,787 (51.7%) |
Disability Class by Sex by Age in Guadalupe County
Disability Class: Hearing Difficulty
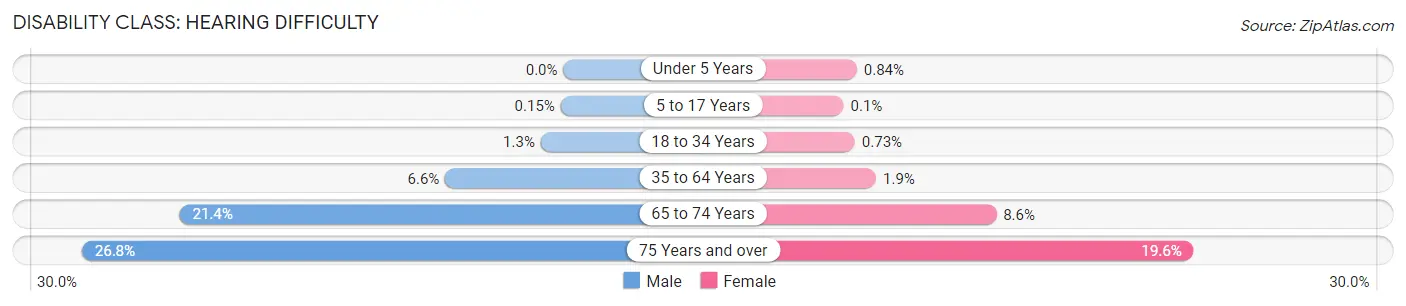
| Age Bracket | Male | Female |
| Under 5 Years | 0 (0.0%) | 42 (0.8%) |
| 5 to 17 Years | 25 (0.2%) | 16 (0.1%) |
| 18 to 34 Years | 236 (1.3%) | 135 (0.7%) |
| 35 to 64 Years | 2,187 (6.6%) | 644 (1.9%) |
| 65 to 74 Years | 1,503 (21.4%) | 674 (8.6%) |
| 75 Years and over | 1,083 (26.8%) | 1,056 (19.6%) |
Disability Class: Vision Difficulty
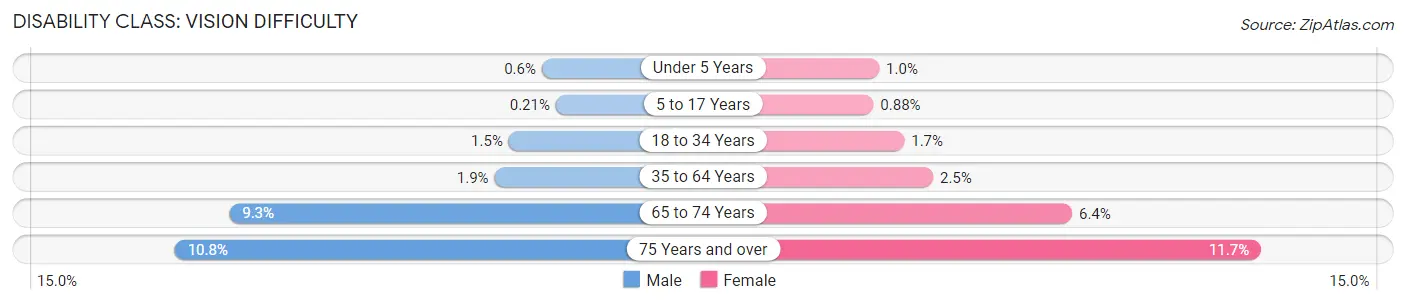
| Age Bracket | Male | Female |
| Under 5 Years | 31 (0.6%) | 52 (1.0%) |
| 5 to 17 Years | 35 (0.2%) | 138 (0.9%) |
| 18 to 34 Years | 285 (1.5%) | 321 (1.7%) |
| 35 to 64 Years | 639 (1.9%) | 860 (2.5%) |
| 65 to 74 Years | 654 (9.3%) | 502 (6.4%) |
| 75 Years and over | 437 (10.8%) | 629 (11.7%) |
Disability Class: Cognitive Difficulty
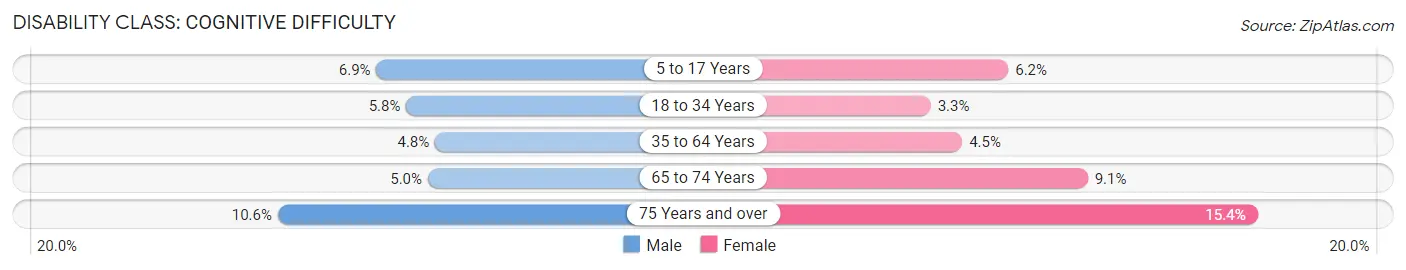
| Age Bracket | Male | Female |
| 5 to 17 Years | 1,149 (6.9%) | 975 (6.2%) |
| 18 to 34 Years | 1,092 (5.8%) | 609 (3.3%) |
| 35 to 64 Years | 1,582 (4.8%) | 1,510 (4.5%) |
| 65 to 74 Years | 354 (5.0%) | 715 (9.1%) |
| 75 Years and over | 428 (10.6%) | 832 (15.4%) |
Disability Class: Ambulatory Difficulty
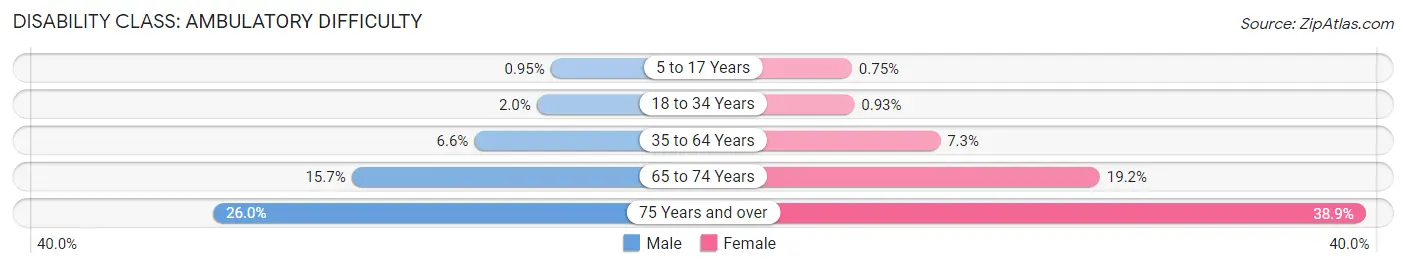
| Age Bracket | Male | Female |
| 5 to 17 Years | 158 (0.9%) | 119 (0.7%) |
| 18 to 34 Years | 373 (2.0%) | 172 (0.9%) |
| 35 to 64 Years | 2,201 (6.6%) | 2,470 (7.3%) |
| 65 to 74 Years | 1,106 (15.7%) | 1,501 (19.2%) |
| 75 Years and over | 1,050 (26.0%) | 2,096 (38.9%) |
Disability Class: Self-Care Difficulty
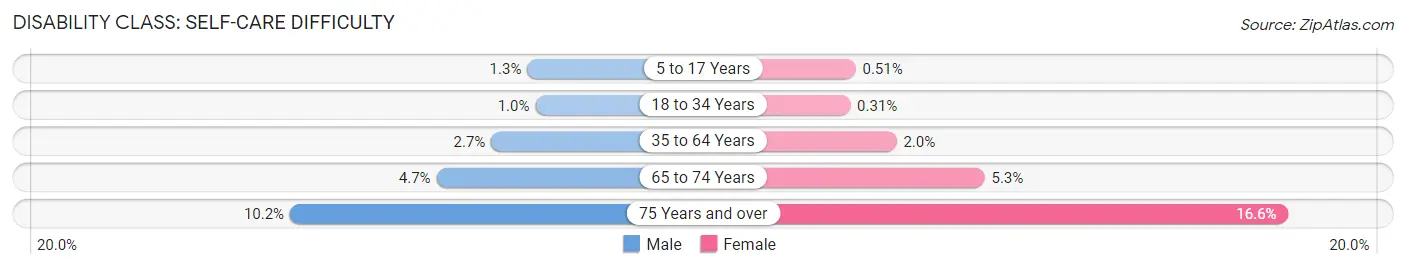
| Age Bracket | Male | Female |
| 5 to 17 Years | 222 (1.3%) | 80 (0.5%) |
| 18 to 34 Years | 194 (1.0%) | 58 (0.3%) |
| 35 to 64 Years | 891 (2.7%) | 686 (2.0%) |
| 65 to 74 Years | 331 (4.7%) | 415 (5.3%) |
| 75 Years and over | 410 (10.2%) | 894 (16.6%) |
Technology Access in Guadalupe County
Computing Device Access in Guadalupe County
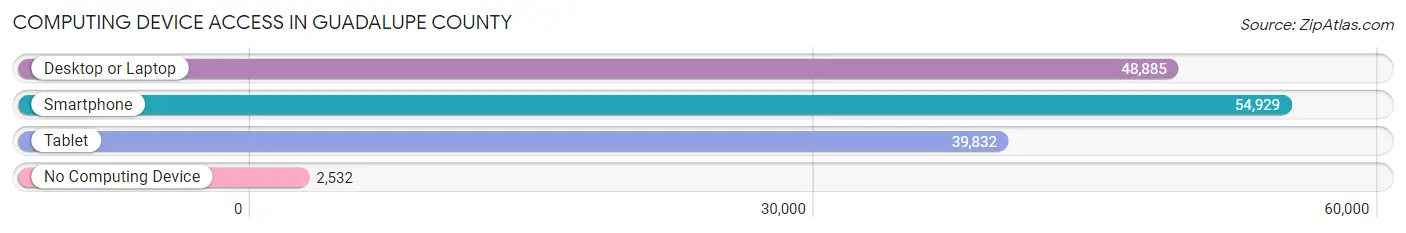
| Device Type | # Households | % Households |
| Desktop or Laptop | 48,885 | 80.8% |
| Smartphone | 54,929 | 90.8% |
| Tablet | 39,832 | 65.9% |
| No Computing Device | 2,532 | 4.2% |
| Total | 60,463 | 100.0% |
Internet Access in Guadalupe County
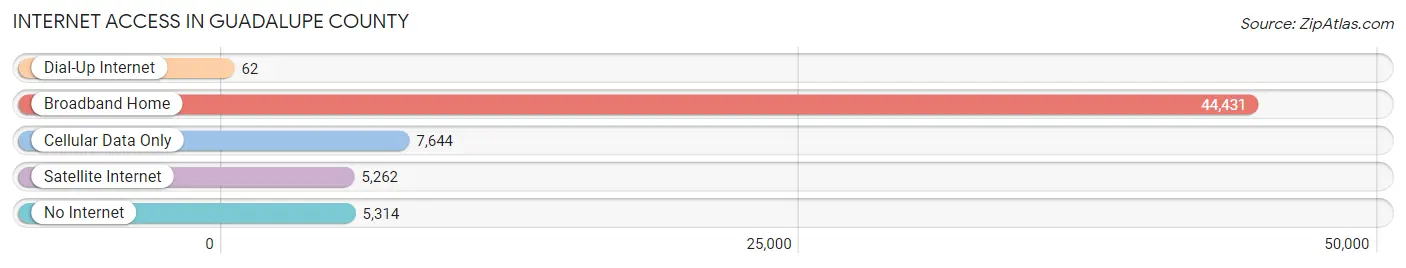
| Internet Type | # Households | % Households |
| Dial-Up Internet | 62 | 0.1% |
| Broadband Home | 44,431 | 73.5% |
| Cellular Data Only | 7,644 | 12.6% |
| Satellite Internet | 5,262 | 8.7% |
| No Internet | 5,314 | 8.8% |
| Total | 60,463 | 100.0% |
Guadalupe County Summary
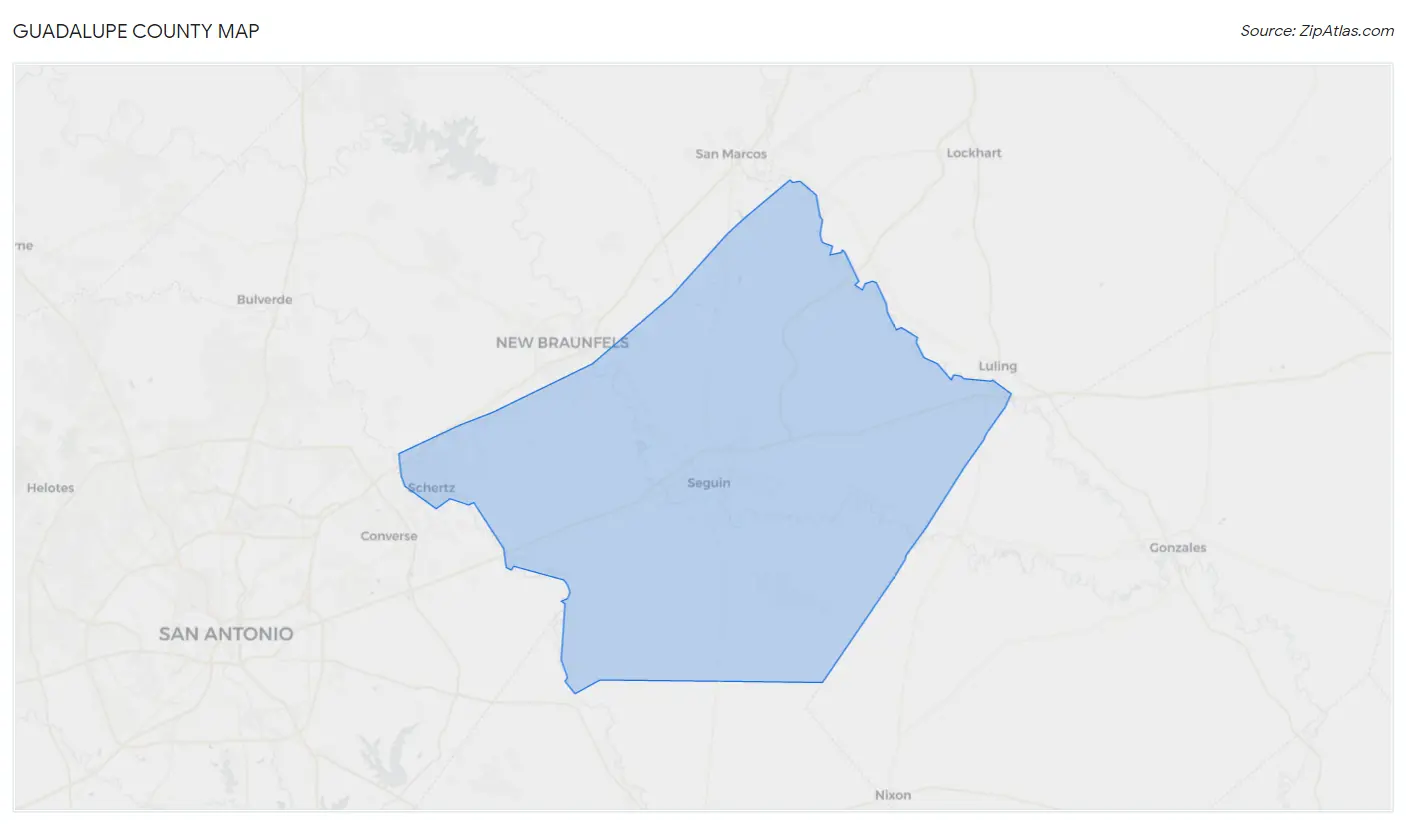
Guadalupe County is located in the south-central region of Texas, and is part of the San Antonio-New Braunfels Metropolitan Statistical Area. The county is bordered by Comal County to the north, Gonzales County to the east, Caldwell County to the south, and Hays and Travis Counties to the west. The county seat is Seguin, and the county has a total area of 876 square miles, with 874 square miles of land and 2 square miles of water. As of the 2010 census, the population of Guadalupe County was 131,533, making it the fourth-most populous county in Texas.
History
Guadalupe County was established in 1846, and was named after the Guadalupe River, which runs through the county. The county was originally part of the Mexican state of Coahuila y Tejas, and was part of the Republic of Texas after the Texas Revolution. The county was organized in 1846, and the first county seat was established in Seguin. The county was divided into four districts in 1848, and the first courthouse was built in 1849.
The county experienced rapid growth in the late 19th century, due to the arrival of German and Czech immigrants. The population of the county increased from 4,000 in 1880 to over 20,000 by 1900. The economy of the county was largely based on agriculture, with cotton, corn, and sorghum being the main crops. The county also had a thriving livestock industry, with cattle, sheep, and hogs being raised in the area.
In the early 20th century, the county experienced a period of industrialization, with the establishment of several factories in the area. The economy of the county shifted from agriculture to manufacturing, and the population of the county continued to grow. The county also experienced a period of population growth in the 1950s and 1960s, due to the influx of people from other parts of the state and country.
Geography
Guadalupe County is located in the south-central region of Texas, and is part of the San Antonio-New Braunfels Metropolitan Statistical Area. The county is bordered by Comal County to the north, Gonzales County to the east, Caldwell County to the south, and Hays and Travis Counties to the west. The county has a total area of 876 square miles, with 874 square miles of land and 2 square miles of water.
The terrain of the county is mostly flat, with some rolling hills in the western part of the county. The Guadalupe River runs through the county, and there are several small lakes and reservoirs in the area. The climate of the county is semi-arid, with hot summers and mild winters.
Economy
The economy of Guadalupe County is largely based on manufacturing, with several factories located in the area. The county is also home to several large companies, including Caterpillar, Inc., H-E-B Grocery, and Schlitterbahn Waterpark. The county also has a thriving agricultural industry, with cotton, corn, and sorghum being the main crops. The county also has a thriving livestock industry, with cattle, sheep, and hogs being raised in the area.
Demographics
As of the 2010 census, the population of Guadalupe County was 131,533, making it the fourth-most populous county in Texas. The population of the county was spread out, with 28.3% under the age of 18, 8.2% from 18 to 24, 28.3% from 25 to 44, 22.7% from 45 to 64, and 12.5% who were 65 years of age or older. The median age of the population was 35.3 years.
The racial makeup of the county was 79.2% White, 8.2% African American, 0.7% Native American, 0.9% Asian, 0.1% Pacific Islander, 8.7% from other races, and 2.2% from two or more races. Hispanic or Latino of any race were 28.3% of the population. The largest ancestry groups in the county were German (25.3%), English (13.2%), Irish (10.2%), and Mexican (9.7%).
Common Questions
What is Per Capita Income in Guadalupe County?
Per Capita income in Guadalupe County is $37,184.
What is the Median Family Income in Guadalupe County?
Median Family Income in Guadalupe County is $100,117.
What is the Median Household income in Guadalupe County?
Median Household Income in Guadalupe County is $88,111.
What is Income or Wage Gap in Guadalupe County?
Income or Wage Gap in Guadalupe County is 31.4%.
Women in Guadalupe County earn 68.6 cents for every dollar earned by a man.
What is Family Income Deficit in Guadalupe County?
Family Income Deficit in Guadalupe County is $10,012.
Families that are below poverty line in Guadalupe County earn $10,012 less on average than the poverty threshold level.
What is Inequality or Gini Index in Guadalupe County?
Inequality or Gini Index in Guadalupe County is 0.39.
What is the Total Population of Guadalupe County?
Total Population of Guadalupe County is 173,828.
What is the Total Male Population of Guadalupe County?
Total Male Population of Guadalupe County is 86,706.
What is the Total Female Population of Guadalupe County?
Total Female Population of Guadalupe County is 87,122.
What is the Ratio of Males per 100 Females in Guadalupe County?
There are 99.52 Males per 100 Females in Guadalupe County.
What is the Ratio of Females per 100 Males in Guadalupe County?
There are 100.48 Females per 100 Males in Guadalupe County.
What is the Median Population Age in Guadalupe County?
Median Population Age in Guadalupe County is 37.3 Years.
What is the Average Family Size in Guadalupe County
Average Family Size in Guadalupe County is 3.3 People.
What is the Average Household Size in Guadalupe County
Average Household Size in Guadalupe County is 2.8 People.
How Large is the Labor Force in Guadalupe County?
There are 87,958 People in the Labor Forcein in Guadalupe County.
What is the Percentage of People in the Labor Force in Guadalupe County?
64.6% of People are in the Labor Force in Guadalupe County.
What is the Unemployment Rate in Guadalupe County?
Unemployment Rate in Guadalupe County is 4.3%.