Area Code 346 Map & Demographics
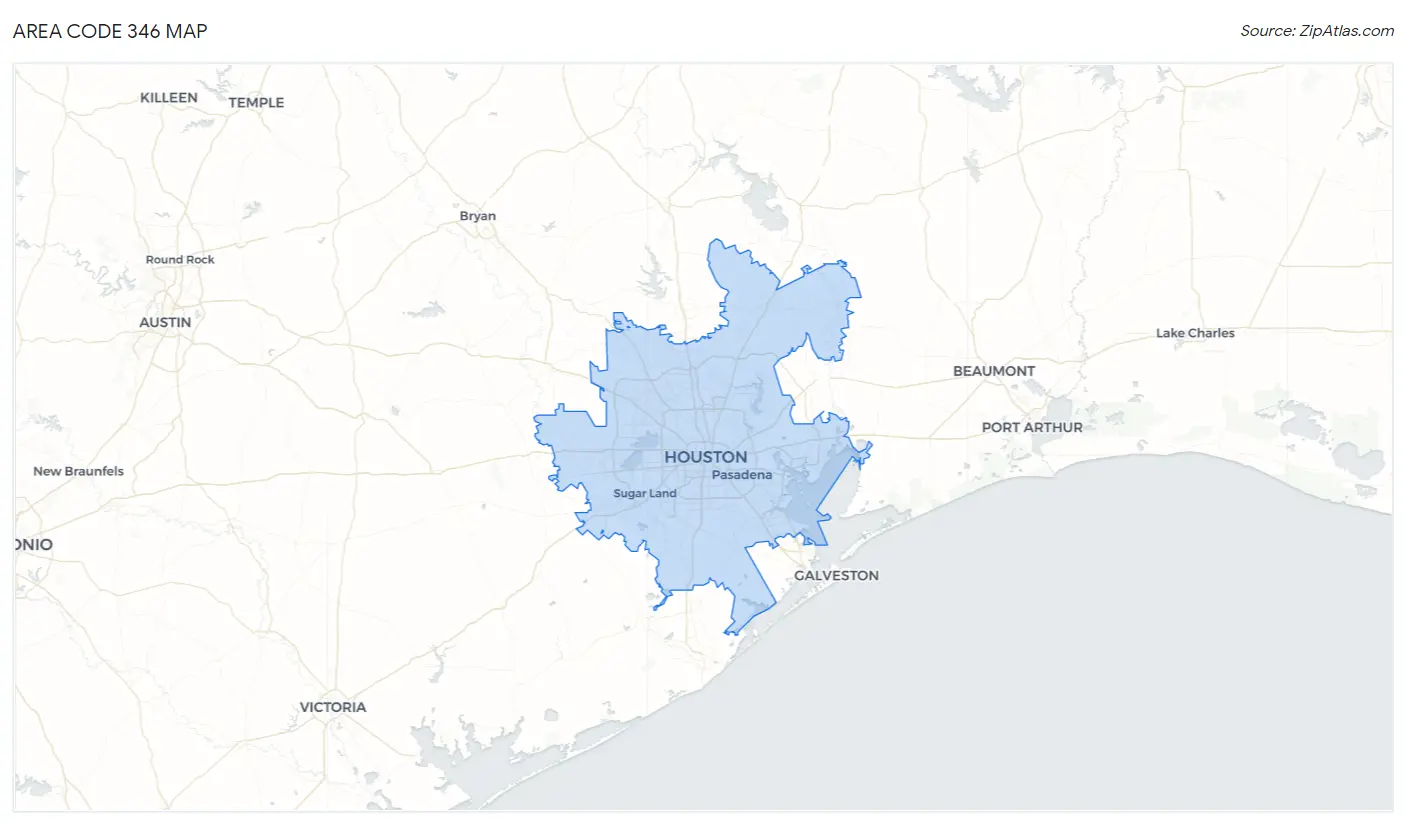
Area Code 346 Map
Area Code 346 Overview
$52,432
PER CAPITA INCOME
$108,624
AVG FAMILY INCOME
$97,970
AVG HOUSEHOLD INCOME
30.6%
WAGE / INCOME GAP [ % ]
69.4¢/ $1
WAGE / INCOME GAP [ $ ]
$11,672
FAMILY INCOME DEFICIT
5.79
INEQUALITY / GINI INDEX
635,682
TOTAL POPULATION
317,177
MALE POPULATION
318,505
FEMALE POPULATION
99.58
MALES / 100 FEMALES
100.42
FEMALES / 100 MALES
38.0
MEDIAN AGE
3.2
AVG FAMILY SIZE
2.7
AVG HOUSEHOLD SIZE
323,022
LABOR FORCE [ PEOPLE ]
65.7%
PERCENT IN LABOR FORCE
6.4%
UNEMPLOYMENT RATE
Income in Area Code 346
Income Overview in Area Code 346
Per Capita Income in Area Code 346 is $52,432, while median incomes of families and households are $108,624 and $97,970 respectively.
| Characteristic | Number | Measure |
| Per Capita Income | 635,682 | $52,432 |
| Median Family Income | 157,103 | $108,624 |
| Mean Family Income | 157,103 | $1,916,180 |
| Median Household Income | 210,107 | $97,970 |
| Mean Household Income | 210,107 | $1,684,260 |
| Income Deficit | 157,103 | $11,672 |
| Wage / Income Gap (%) | 635,682 | 30.61% |
| Wage / Income Gap ($) | 635,682 | 69.39¢ per $1 |
| Gini / Inequality Index | 635,682 | 5.79 |
Earnings by Sex in Area Code 346
Average Earnings in Area Code 346 are $53,100, $64,548 for men and $44,946 for women, a difference of 30.4%.
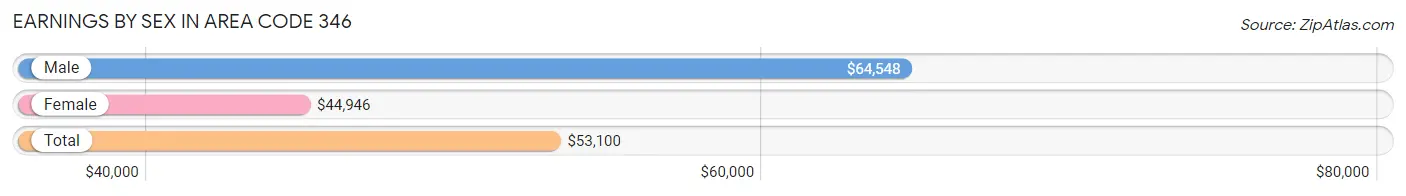
| Sex | Number | Average Earnings |
| Male | 182,079 (53.3%) | $64,548 |
| Female | 159,649 (46.7%) | $44,946 |
| Total | 341,728 (100.0%) | $53,100 |
Earnings by Sex by Income Bracket in Area Code 346
The most common earnings brackets in Area Code 346 are $100,000+ for men (40,016 | 22.0%) and $75,000 to $99,999 for women (15,792 | 9.9%).
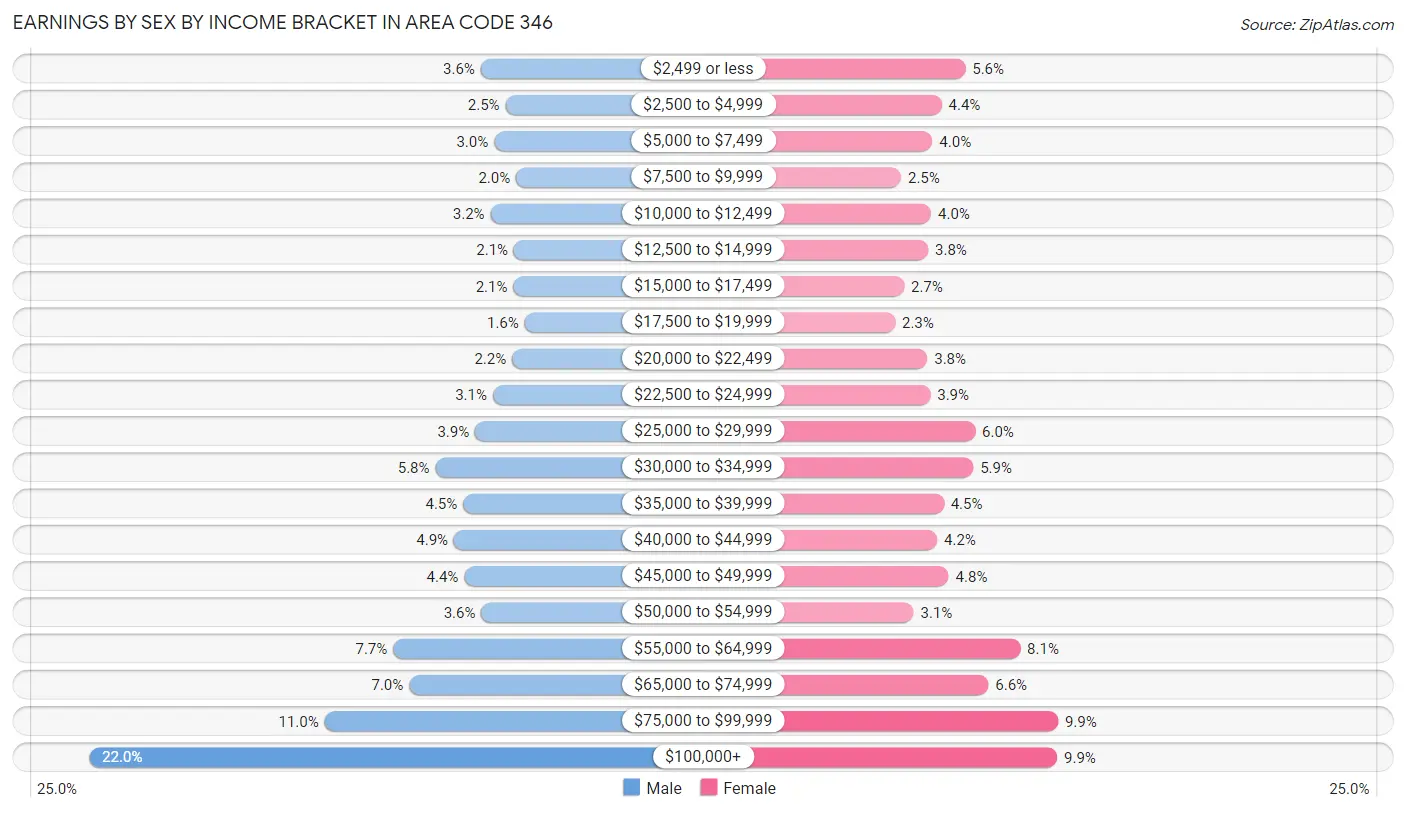
| Income | Male | Female |
| $2,499 or less | 6,627 (3.6%) | 8,864 (5.6%) |
| $2,500 to $4,999 | 4,510 (2.5%) | 7,084 (4.4%) |
| $5,000 to $7,499 | 5,483 (3.0%) | 6,400 (4.0%) |
| $7,500 to $9,999 | 3,613 (2.0%) | 4,052 (2.5%) |
| $10,000 to $12,499 | 5,797 (3.2%) | 6,302 (4.0%) |
| $12,500 to $14,999 | 3,782 (2.1%) | 6,081 (3.8%) |
| $15,000 to $17,499 | 3,848 (2.1%) | 4,271 (2.7%) |
| $17,500 to $19,999 | 2,868 (1.6%) | 3,605 (2.3%) |
| $20,000 to $22,499 | 3,943 (2.2%) | 6,024 (3.8%) |
| $22,500 to $24,999 | 5,592 (3.1%) | 6,247 (3.9%) |
| $25,000 to $29,999 | 7,110 (3.9%) | 9,594 (6.0%) |
| $30,000 to $34,999 | 10,488 (5.8%) | 9,450 (5.9%) |
| $35,000 to $39,999 | 8,128 (4.5%) | 7,247 (4.5%) |
| $40,000 to $44,999 | 8,905 (4.9%) | 6,746 (4.2%) |
| $45,000 to $49,999 | 8,035 (4.4%) | 7,610 (4.8%) |
| $50,000 to $54,999 | 6,577 (3.6%) | 4,999 (3.1%) |
| $55,000 to $64,999 | 14,100 (7.7%) | 12,970 (8.1%) |
| $65,000 to $74,999 | 12,727 (7.0%) | 10,590 (6.6%) |
| $75,000 to $99,999 | 19,930 (11.0%) | 15,792 (9.9%) |
| $100,000+ | 40,016 (22.0%) | 15,721 (9.9%) |
| Total | 182,079 (100.0%) | 159,649 (100.0%) |
Earnings by Sex by Educational Attainment in Area Code 346
Average earnings in Area Code 346 are $922,826 for men and $654,452 for women, a difference of 29.1%. Men with an educational attainment of graduate degree enjoy the highest average annual earnings of $1,295,282, while those with less than high school education earn the least with $434,294. Women with an educational attainment of graduate degree earn the most with the average annual earnings of $1,223,106, while those with less than high school education have the smallest earnings of $187,866.
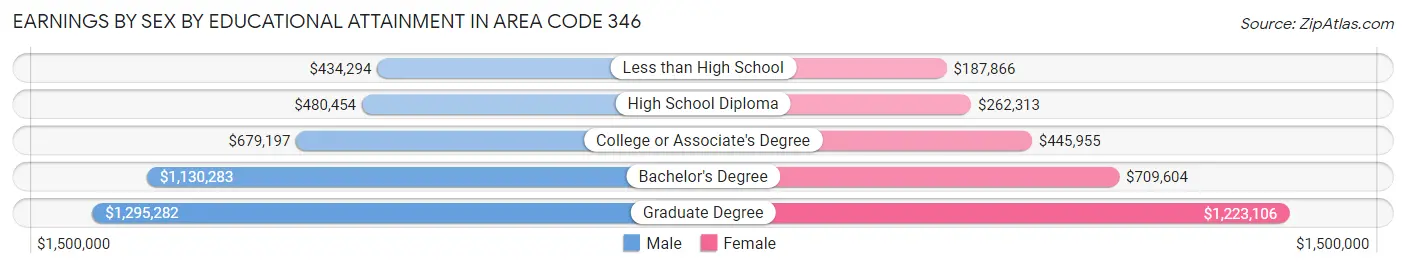
| Educational Attainment | Male Income | Female Income |
| Less than High School | $434,294 | $187,866 |
| High School Diploma | $480,454 | $262,313 |
| College or Associate's Degree | $679,197 | $445,955 |
| Bachelor's Degree | $1,130,283 | $709,604 |
| Graduate Degree | $1,295,282 | $1,223,106 |
| Total | $922,826 | $654,452 |
Family Income in Area Code 346
Family Income Brackets in Area Code 346
According to the Area Code 346 family income data, there are 399,042 families falling into the $100,000 to $149,999 income range, which is the most common income bracket and makes up 254.0% of all families. Conversely, the $10,000 to $14,999 income bracket is the least frequent group with only 27,807 families (17.7%) belonging to this category.
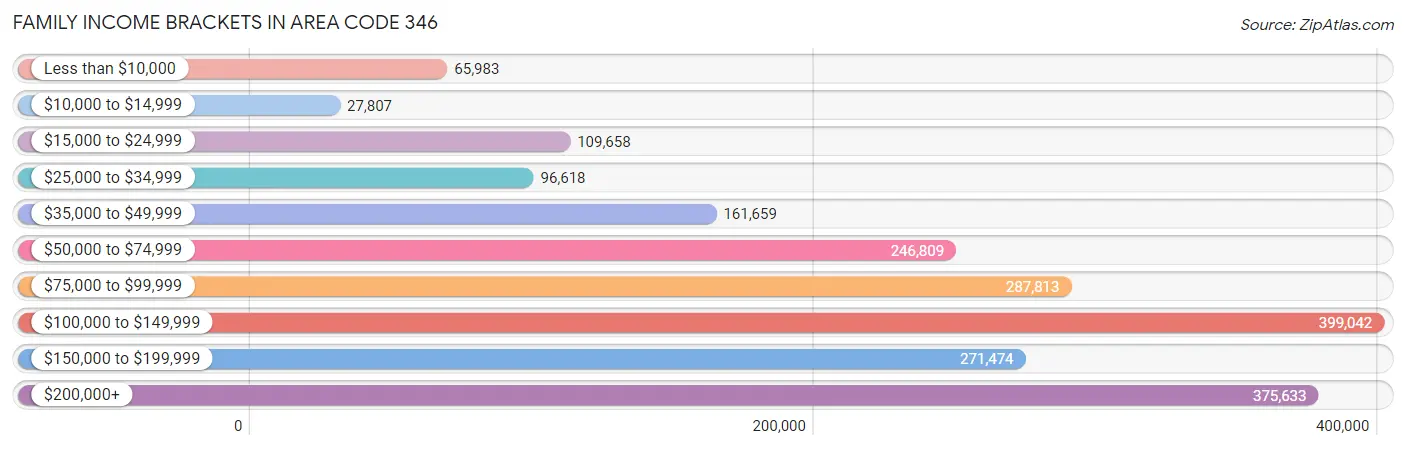
| Income Bracket | # Families | % Families |
| Less than $10,000 | 65,983 | 42.0% |
| $10,000 to $14,999 | 27,807 | 17.7% |
| $15,000 to $24,999 | 109,658 | 69.8% |
| $25,000 to $34,999 | 96,618 | 61.5% |
| $35,000 to $49,999 | 161,659 | 102.9% |
| $50,000 to $74,999 | 246,809 | 157.1% |
| $75,000 to $99,999 | 287,813 | 183.2% |
| $100,000 to $149,999 | 399,042 | 254.0% |
| $150,000 to $199,999 | 271,474 | 172.8% |
| $200,000+ | 375,633 | 239.1% |
Family Income by Famaliy Size in Area Code 346
7+ person families (4,073 | 2.6%) account for the highest median family income in Area Code 346 with $122,073 per family, while 2-person families (55,106 | 35.1%) have the highest median income of $48,123 per family member.
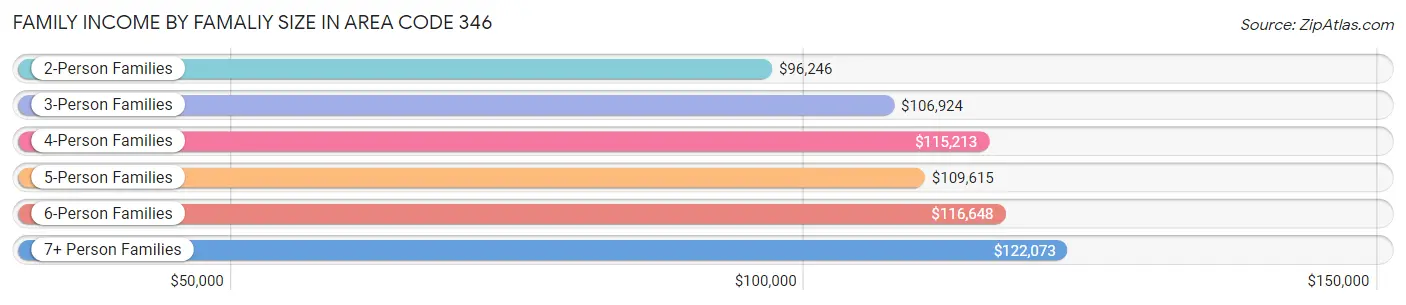
| Income Bracket | # Families | Median Income |
| 2-Person Families | 55,106 (35.1%) | $96,246 |
| 3-Person Families | 38,029 (24.2%) | $106,924 |
| 4-Person Families | 33,036 (21.0%) | $115,213 |
| 5-Person Families | 18,886 (12.0%) | $109,615 |
| 6-Person Families | 7,973 (5.1%) | $116,648 |
| 7+ Person Families | 4,073 (2.6%) | $122,073 |
| Total | 157,103 (100.0%) | $108,624 |
Family Income by Number of Earners in Area Code 346
The median family income in Area Code 346 is $108,624, with families comprising 3+ earners (27,073) having the highest median family income of $149,307, while families with no earners (14,393) have the lowest median family income of $47,496, accounting for 17.2% and 9.2% of families, respectively.
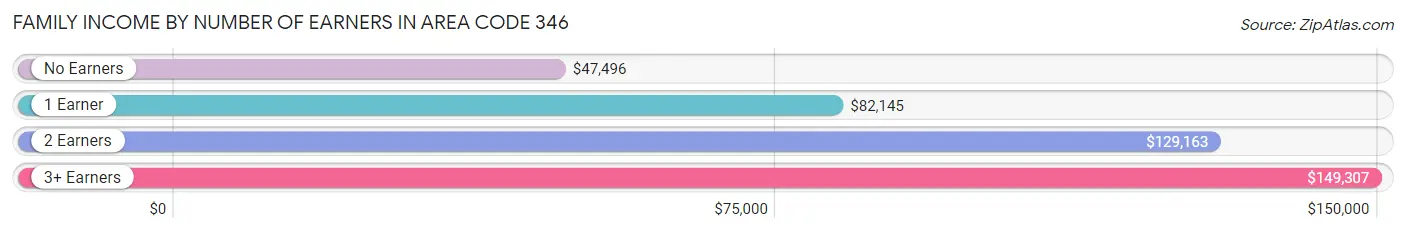
| Number of Earners | # Families | Median Income |
| No Earners | 14,393 (9.2%) | $47,496 |
| 1 Earner | 48,451 (30.8%) | $82,145 |
| 2 Earners | 67,186 (42.8%) | $129,163 |
| 3+ Earners | 27,073 (17.2%) | $149,307 |
| Total | 157,103 (100.0%) | $108,624 |
Household Income in Area Code 346
Household Income Brackets in Area Code 346
With 489,549 households falling in the category, the $100,000 to $149,999 income range is the most frequent in Area Code 346, accounting for 233.0% of all households. In contrast, only 60,721 households (28.9%) fall into the $10,000 to $14,999 income bracket, making it the least populous group.
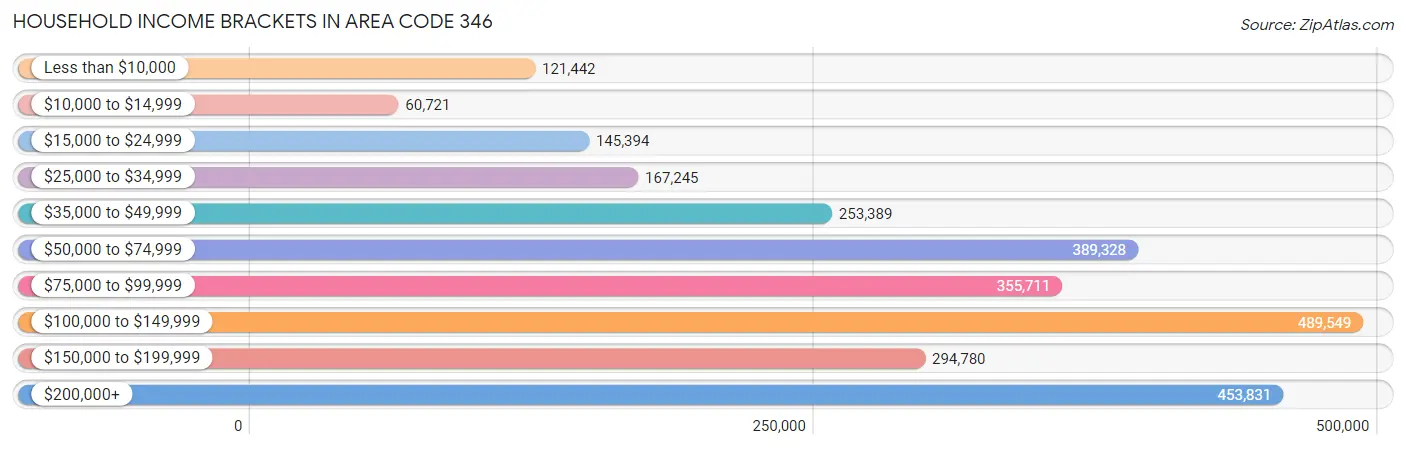
| Income Bracket | # Households | % Households |
| Less than $10,000 | 121,442 | 57.8% |
| $10,000 to $14,999 | 60,721 | 28.9% |
| $15,000 to $24,999 | 145,394 | 69.2% |
| $25,000 to $34,999 | 167,245 | 79.6% |
| $35,000 to $49,999 | 253,389 | 120.6% |
| $50,000 to $74,999 | 389,328 | 185.3% |
| $75,000 to $99,999 | 355,711 | 169.3% |
| $100,000 to $149,999 | 489,549 | 233.0% |
| $150,000 to $199,999 | 294,780 | 140.3% |
| $200,000+ | 453,831 | 216.0% |
Household Income by Householder Age in Area Code 346
The median household income in Area Code 346 is $97,970, with the highest median household income of $116,222 found in the 45 to 64 years age bracket for the primary householder. A total of 86,231 households (41.0%) fall into this category. Meanwhile, the 15 to 24 years age bracket for the primary householder has the lowest median household income of $51,485, with 7,036 households (3.4%) in this group.
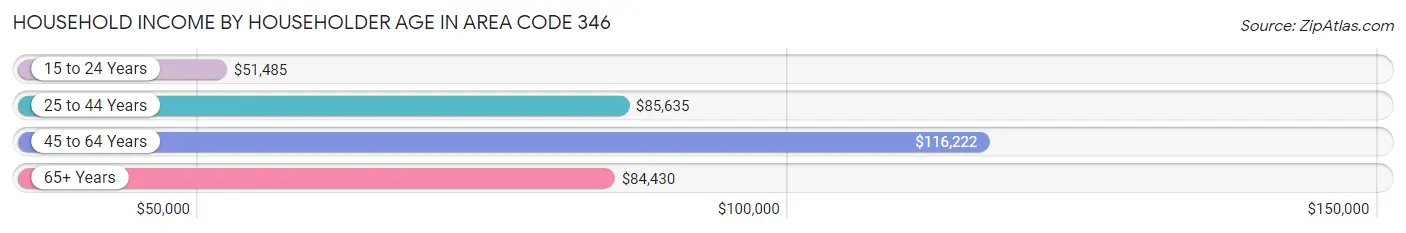
| Income Bracket | # Households | Median Income |
| 15 to 24 Years | 7,036 (3.4%) | $51,485 |
| 25 to 44 Years | 77,325 (36.8%) | $85,635 |
| 45 to 64 Years | 86,231 (41.0%) | $116,222 |
| 65+ Years | 39,515 (18.8%) | $84,430 |
| Total | 210,107 (100.0%) | $97,970 |
Poverty in Area Code 346
Income Below Poverty by Sex and Age in Area Code 346
With 9.9% poverty level for males and 10.8% for females among the residents of Area Code 346, 5 year old males and 15 year old females are the most vulnerable to poverty, with 991 males (21.1%) and 873 females (19.1%) in their respective age groups living below the poverty level.
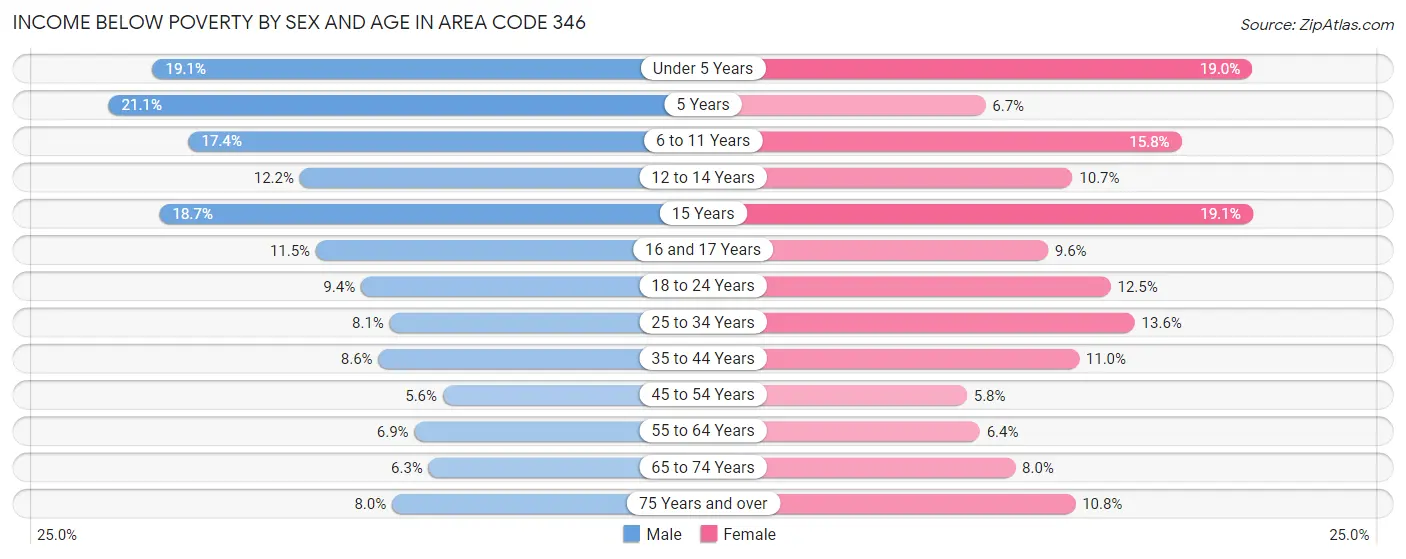
| Age Bracket | Male | Female |
| Under 5 Years | 3,630 (19.1%) | 3,535 (19.0%) |
| 5 Years | 991 (21.1%) | 292 (6.7%) |
| 6 to 11 Years | 5,072 (17.4%) | 4,286 (15.8%) |
| 12 to 14 Years | 1,828 (12.2%) | 1,629 (10.7%) |
| 15 Years | 960 (18.7%) | 873 (19.1%) |
| 16 and 17 Years | 1,145 (11.5%) | 888 (9.6%) |
| 18 to 24 Years | 2,816 (9.4%) | 3,498 (12.5%) |
| 25 to 34 Years | 3,415 (8.1%) | 5,803 (13.6%) |
| 35 to 44 Years | 3,607 (8.6%) | 5,057 (11.0%) |
| 45 to 54 Years | 2,365 (5.6%) | 2,573 (5.8%) |
| 55 to 64 Years | 2,369 (6.9%) | 2,367 (6.4%) |
| 65 to 74 Years | 1,479 (6.2%) | 2,032 (8.0%) |
| 75 Years and over | 798 (8.0%) | 1,500 (10.8%) |
| Total | 30,475 (9.9%) | 34,333 (10.8%) |
Income Above Poverty by Sex and Age in Area Code 346
According to the poverty statistics in Area Code 346, males aged 45 to 54 years and females aged 45 to 54 years are the age groups that are most secure financially, with 94.4% of males and 94.2% of females in these age groups living above the poverty line.
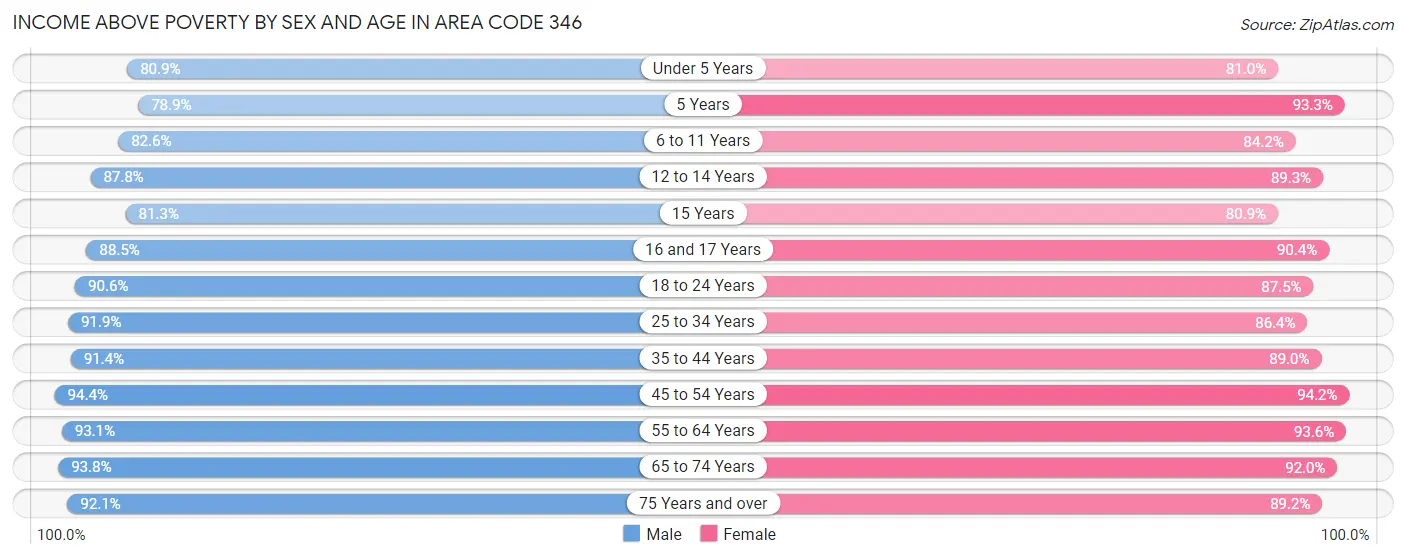
| Age Bracket | Male | Female |
| Under 5 Years | 15,417 (80.9%) | 15,036 (81.0%) |
| 5 Years | 3,706 (78.9%) | 4,092 (93.3%) |
| 6 to 11 Years | 24,090 (82.6%) | 22,908 (84.2%) |
| 12 to 14 Years | 13,116 (87.8%) | 13,596 (89.3%) |
| 15 Years | 4,164 (81.3%) | 3,707 (80.9%) |
| 16 and 17 Years | 8,826 (88.5%) | 8,403 (90.4%) |
| 18 to 24 Years | 27,185 (90.6%) | 24,562 (87.5%) |
| 25 to 34 Years | 38,939 (91.9%) | 36,899 (86.4%) |
| 35 to 44 Years | 38,432 (91.4%) | 40,903 (89.0%) |
| 45 to 54 Years | 39,939 (94.4%) | 41,755 (94.2%) |
| 55 to 64 Years | 31,891 (93.1%) | 34,621 (93.6%) |
| 65 to 74 Years | 22,195 (93.8%) | 23,252 (92.0%) |
| 75 Years and over | 9,242 (92.0%) | 12,345 (89.2%) |
| Total | 277,142 (90.1%) | 282,079 (89.1%) |
Income Below Poverty Among Married-Couple Families in Area Code 346
The poverty statistics for married-couple families in Area Code 346 show that 5.1% or 6,038 of the total 117,297 families live below the poverty line. Families with 5 or more children have the highest poverty rate of 23.3%, comprising of 141 families. On the other hand, families with no children have the lowest poverty rate of 3.6%, which includes 2,123 families.
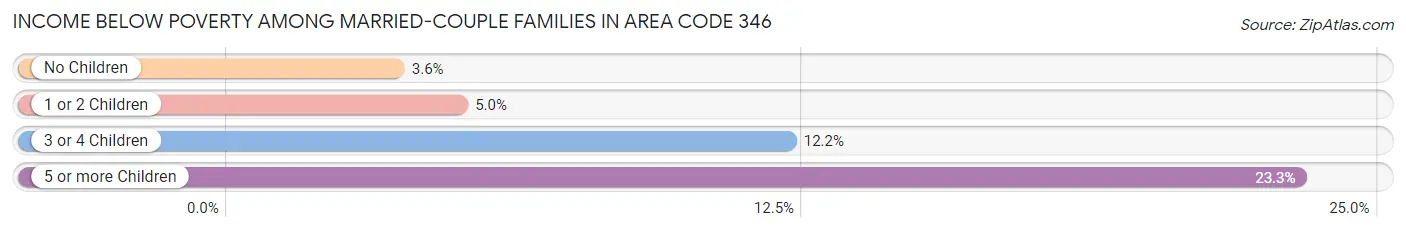
| Children | Above Poverty | Below Poverty |
| No Children | 56,323 (96.4%) | 2,123 (3.6%) |
| 1 or 2 Children | 43,976 (95.0%) | 2,321 (5.0%) |
| 3 or 4 Children | 10,495 (87.8%) | 1,453 (12.2%) |
| 5 or more Children | 465 (76.7%) | 141 (23.3%) |
| Total | 111,259 (94.9%) | 6,038 (5.1%) |
Income Below Poverty Among Single-Parent Households in Area Code 346
According to the poverty data in Area Code 346, 10.5% or 1,033 single-father households and 20.3% or 6,087 single-mother households are living below the poverty line. Among single-father households, those with 5 or more children have the highest poverty rate, with 86 households (71.7%) experiencing poverty. Likewise, among single-mother households, those with 5 or more children have the highest poverty rate, with 126 households (70.8%) falling below the poverty line.
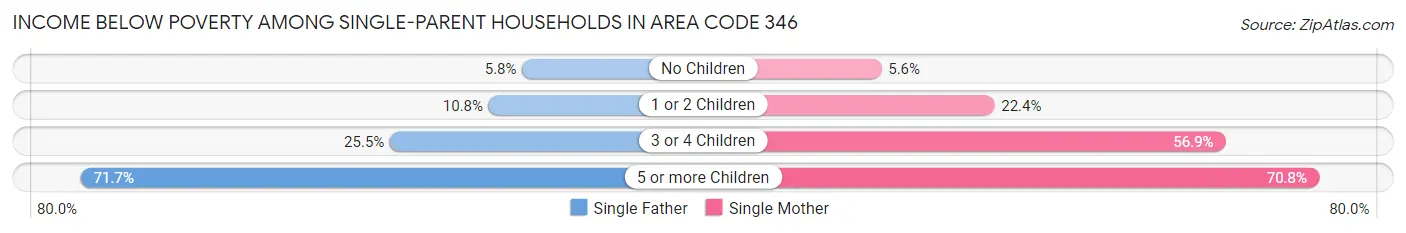
| Children | Single Father | Single Mother |
| No Children | 256 (5.8%) | 566 (5.6%) |
| 1 or 2 Children | 499 (10.8%) | 3,767 (22.4%) |
| 3 or 4 Children | 192 (25.5%) | 1,628 (56.9%) |
| 5 or more Children | 86 (71.7%) | 126 (70.8%) |
| Total | 1,033 (10.5%) | 6,087 (20.3%) |
Income Below Poverty Among Married-Couple vs Single-Parent Households in Area Code 346
The poverty data for Area Code 346 shows that 6,038 of the married-couple family households (5.1%) and 7,120 of the single-parent households (17.9%) are living below the poverty level. Within the married-couple family households, those with 5 or more children have the highest poverty rate, with 141 households (23.3%) falling below the poverty line. Among the single-parent households, those with 5 or more children have the highest poverty rate, with 212 household (71.1%) living below poverty.
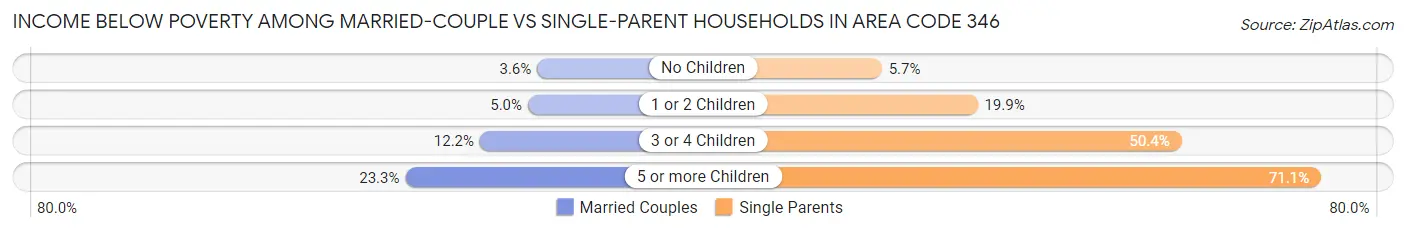
| Children | Married-Couple Families | Single-Parent Households |
| No Children | 2,123 (3.6%) | 822 (5.7%) |
| 1 or 2 Children | 2,321 (5.0%) | 4,266 (19.9%) |
| 3 or 4 Children | 1,453 (12.2%) | 1,820 (50.4%) |
| 5 or more Children | 141 (23.3%) | 212 (71.1%) |
| Total | 6,038 (5.1%) | 7,120 (17.9%) |
Race in Area Code 346
The most populous races in Area Code 346 are White / Caucasian (260,963 | 41.0%), Hispanic or Latino (217,391 | 34.2%), and Black / African American (115,434 | 18.2%).
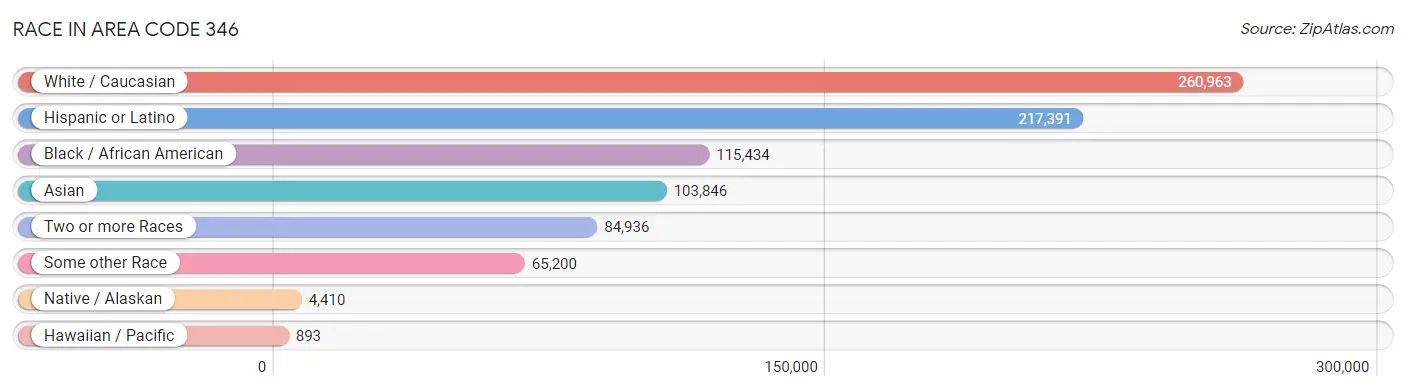
| Race | # Population | % Population |
| Asian | 103,846 | 16.3% |
| Black / African American | 115,434 | 18.2% |
| Hawaiian / Pacific | 893 | 0.1% |
| Hispanic or Latino | 217,391 | 34.2% |
| Native / Alaskan | 4,410 | 0.7% |
| White / Caucasian | 260,963 | 41.0% |
| Two or more Races | 84,936 | 13.4% |
| Some other Race | 65,200 | 10.3% |
| Total | 635,682 | 100.0% |
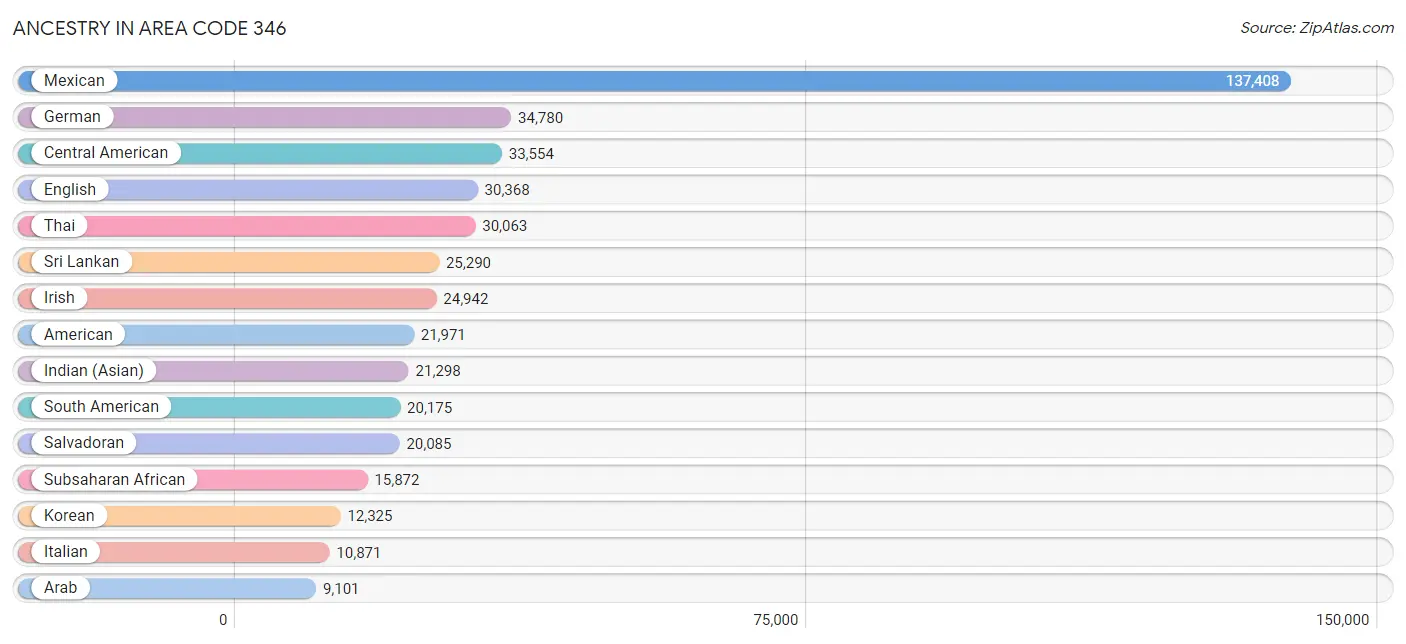
Ancestry in Area Code 346
The most populous ancestries reported in Area Code 346 are Mexican (137,408 | 21.6%), German (34,780 | 5.5%), Central American (33,554 | 5.3%), English (30,368 | 4.8%), and Thai (30,063 | 4.7%), together accounting for 41.9% of all Area Code 346 residents.
| Ancestry | # Population | % Population |
| Afghan | 258 | 0.0% |
| African | 5,727 | 0.9% |
| Alaskan Athabascan | 23 | 0.0% |
| Albanian | 215 | 0.0% |
| American | 21,971 | 3.5% |
| Apache | 88 | 0.0% |
| Arab | 9,101 | 1.4% |
| Argentinean | 1,001 | 0.2% |
| Armenian | 179 | 0.0% |
| Australian | 162 | 0.0% |
| Austrian | 457 | 0.1% |
| Bahamian | 61 | 0.0% |
| Bangladeshi | 11 | 0.0% |
| Barbadian | 149 | 0.0% |
| Basque | 24 | 0.0% |
| Belgian | 257 | 0.0% |
| Belizean | 373 | 0.1% |
| Bhutanese | 1,396 | 0.2% |
| Blackfeet | 149 | 0.0% |
| Bolivian | 117 | 0.0% |
| Brazilian | 701 | 0.1% |
| British | 2,471 | 0.4% |
| British West Indian | 512 | 0.1% |
| Bulgarian | 178 | 0.0% |
| Burmese | 2,452 | 0.4% |
| Cajun | 582 | 0.1% |
| Cambodian | 28 | 0.0% |
| Canadian | 876 | 0.1% |
| Cape Verdean | 60 | 0.0% |
| Celtic | 359 | 0.1% |
| Central American | 33,554 | 5.3% |
| Central American Indian | 881 | 0.1% |
| Cherokee | 1,312 | 0.2% |
| Cheyenne | 55 | 0.0% |
| Chickasaw | 39 | 0.0% |
| Chilean | 912 | 0.1% |
| Chippewa | 18 | 0.0% |
| Choctaw | 330 | 0.1% |
| Colombian | 8,846 | 1.4% |
| Comanche | 115 | 0.0% |
| Costa Rican | 165 | 0.0% |
| Creek | 53 | 0.0% |
| Croatian | 355 | 0.1% |
| Cuban | 8,206 | 1.3% |
| Czech | 3,151 | 0.5% |
| Czechoslovakian | 669 | 0.1% |
| Danish | 571 | 0.1% |
| Delaware | 15 | 0.0% |
| Dominican | 1,361 | 0.2% |
| Dutch | 3,293 | 0.5% |
| Dutch West Indian | 81 | 0.0% |
| Eastern European | 614 | 0.1% |
| Ecuadorian | 1,244 | 0.2% |
| Egyptian | 1,166 | 0.2% |
| English | 30,368 | 4.8% |
| Estonian | 4 | 0.0% |
| Ethiopian | 1,013 | 0.2% |
| European | 7,007 | 1.1% |
| Filipino | 1,893 | 0.3% |
| Finnish | 173 | 0.0% |
| French | 8,163 | 1.3% |
| French Canadian | 1,132 | 0.2% |
| German | 34,780 | 5.5% |
| German Russian | 198 | 0.0% |
| Ghanaian | 231 | 0.0% |
| Greek | 1,934 | 0.3% |
| Guamanian / Chamorro | 187 | 0.0% |
| Guatemalan | 5,097 | 0.8% |
| Guyanese | 39 | 0.0% |
| Haitian | 429 | 0.1% |
| Hmong | 28 | 0.0% |
| Honduran | 6,513 | 1.0% |
| Hopi | 28 | 0.0% |
| Houma | 64 | 0.0% |
| Hungarian | 543 | 0.1% |
| Icelander | 68 | 0.0% |
| Indian (Asian) | 21,298 | 3.4% |
| Indonesian | 122 | 0.0% |
| Iranian | 1,967 | 0.3% |
| Iraqi | 1,300 | 0.2% |
| Irish | 24,942 | 3.9% |
| Iroquois | 63 | 0.0% |
| Israeli | 37 | 0.0% |
| Italian | 10,871 | 1.7% |
| Jamaican | 2,852 | 0.4% |
| Japanese | 697 | 0.1% |
| Jordanian | 352 | 0.1% |
| Kenyan | 461 | 0.1% |
| Korean | 12,325 | 1.9% |
| Laotian | 603 | 0.1% |
| Lebanese | 1,588 | 0.3% |
| Liberian | 287 | 0.1% |
| Lithuanian | 294 | 0.1% |
| Luxembourger | 8 | 0.0% |
| Malaysian | 167 | 0.0% |
| Mexican | 137,408 | 21.6% |
| Mexican American Indian | 2,482 | 0.4% |
| Mongolian | 190 | 0.0% |
| Moroccan | 275 | 0.0% |
| Native Hawaiian | 778 | 0.1% |
| Navajo | 419 | 0.1% |
| Nicaraguan | 1,183 | 0.2% |
| Nigerian | 7,016 | 1.1% |
| Northern European | 336 | 0.1% |
| Norwegian | 2,297 | 0.4% |
| Okinawan | 98 | 0.0% |
| Osage | 181 | 0.0% |
| Pakistani | 542 | 0.1% |
| Palestinian | 630 | 0.1% |
| Panamanian | 461 | 0.1% |
| Pennsylvania German | 76 | 0.0% |
| Peruvian | 2,017 | 0.3% |
| Polish | 5,500 | 0.9% |
| Portuguese | 799 | 0.1% |
| Potawatomi | 4 | 0.0% |
| Pueblo | 15 | 0.0% |
| Puerto Rican | 4,950 | 0.8% |
| Romanian | 492 | 0.1% |
| Russian | 1,871 | 0.3% |
| Salvadoran | 20,085 | 3.2% |
| Samoan | 226 | 0.0% |
| Scandinavian | 642 | 0.1% |
| Scotch-Irish | 3,546 | 0.6% |
| Scottish | 5,469 | 0.9% |
| Seminole | 13 | 0.0% |
| Senegalese | 68 | 0.0% |
| Serbian | 57 | 0.0% |
| Sierra Leonean | 78 | 0.0% |
| Sioux | 100 | 0.0% |
| Slavic | 15 | 0.0% |
| Slovak | 281 | 0.0% |
| Slovene | 71 | 0.0% |
| Somali | 10 | 0.0% |
| South African | 47 | 0.0% |
| South American | 20,175 | 3.2% |
| South American Indian | 100 | 0.0% |
| Spaniard | 2,239 | 0.4% |
| Spanish | 1,955 | 0.3% |
| Spanish American | 50 | 0.0% |
| Spanish American Indian | 142 | 0.0% |
| Sri Lankan | 25,290 | 4.0% |
| Subsaharan African | 15,872 | 2.5% |
| Sudanese | 554 | 0.1% |
| Swedish | 2,424 | 0.4% |
| Swiss | 391 | 0.1% |
| Syrian | 250 | 0.0% |
| Thai | 30,063 | 4.7% |
| Trinidadian and Tobagonian | 182 | 0.0% |
| Turkish | 1,433 | 0.2% |
| Ukrainian | 444 | 0.1% |
| Uruguayan | 317 | 0.1% |
| Venezuelan | 5,721 | 0.9% |
| Vietnamese | 950 | 0.2% |
| Welsh | 1,563 | 0.3% |
| West Indian | 694 | 0.1% |
| Yaqui | 14 | 0.0% |
| Yugoslavian | 264 | 0.0% |
| Zimbabwean | 44 | 0.0% | View All 158 Rows |
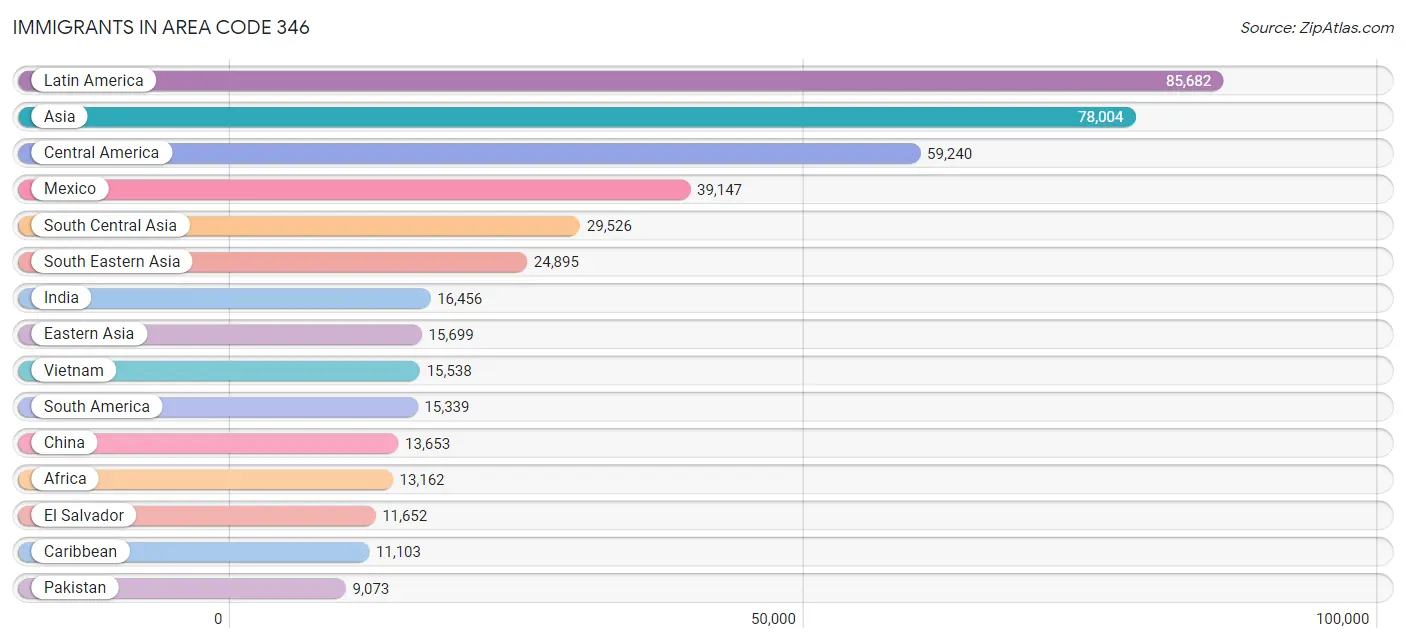
Immigrants in Area Code 346
The most numerous immigrant groups reported in Area Code 346 came from Latin America (85,682 | 13.5%), Asia (78,004 | 12.3%), Central America (59,240 | 9.3%), Mexico (39,147 | 6.2%), and South Central Asia (29,526 | 4.6%), together accounting for 45.9% of all Area Code 346 residents.
| Immigration Origin | # Population | % Population |
| Afghanistan | 208 | 0.0% |
| Africa | 13,162 | 2.1% |
| Albania | 194 | 0.0% |
| Argentina | 508 | 0.1% |
| Armenia | 60 | 0.0% |
| Asia | 78,004 | 12.3% |
| Australia | 141 | 0.0% |
| Austria | 14 | 0.0% |
| Azores | 8 | 0.0% |
| Bahamas | 141 | 0.0% |
| Bangladesh | 667 | 0.1% |
| Barbados | 410 | 0.1% |
| Belgium | 59 | 0.0% |
| Belize | 123 | 0.0% |
| Bolivia | 211 | 0.0% |
| Bosnia and Herzegovina | 271 | 0.0% |
| Brazil | 910 | 0.1% |
| Bulgaria | 98 | 0.0% |
| Cambodia | 462 | 0.1% |
| Cameroon | 944 | 0.2% |
| Canada | 2,024 | 0.3% |
| Caribbean | 11,103 | 1.8% |
| Central America | 59,240 | 9.3% |
| Chile | 687 | 0.1% |
| China | 13,653 | 2.1% |
| Colombia | 5,525 | 0.9% |
| Costa Rica | 166 | 0.0% |
| Croatia | 58 | 0.0% |
| Cuba | 6,810 | 1.1% |
| Czechoslovakia | 53 | 0.0% |
| Denmark | 61 | 0.0% |
| Dominica | 417 | 0.1% |
| Dominican Republic | 524 | 0.1% |
| Eastern Africa | 2,545 | 0.4% |
| Eastern Asia | 15,699 | 2.5% |
| Eastern Europe | 2,158 | 0.3% |
| Ecuador | 1,020 | 0.2% |
| Egypt | 1,039 | 0.2% |
| El Salvador | 11,652 | 1.8% |
| England | 707 | 0.1% |
| Eritrea | 253 | 0.0% |
| Ethiopia | 1,115 | 0.2% |
| Europe | 6,050 | 0.9% |
| Fiji | 15 | 0.0% |
| France | 115 | 0.0% |
| Germany | 459 | 0.1% |
| Ghana | 183 | 0.0% |
| Greece | 266 | 0.0% |
| Grenada | 27 | 0.0% |
| Guatemala | 2,457 | 0.4% |
| Guyana | 39 | 0.0% |
| Haiti | 207 | 0.0% |
| Honduras | 4,731 | 0.7% |
| Hong Kong | 1,335 | 0.2% |
| Hungary | 85 | 0.0% |
| India | 16,456 | 2.6% |
| Indonesia | 521 | 0.1% |
| Iran | 1,805 | 0.3% |
| Iraq | 2,677 | 0.4% |
| Ireland | 8 | 0.0% |
| Israel | 222 | 0.0% |
| Italy | 331 | 0.1% |
| Jamaica | 1,561 | 0.3% |
| Japan | 550 | 0.1% |
| Jordan | 595 | 0.1% |
| Kazakhstan | 134 | 0.0% |
| Kenya | 570 | 0.1% |
| Korea | 1,411 | 0.2% |
| Kuwait | 71 | 0.0% |
| Laos | 123 | 0.0% |
| Latin America | 85,682 | 13.5% |
| Latvia | 30 | 0.0% |
| Lebanon | 938 | 0.2% |
| Liberia | 482 | 0.1% |
| Lithuania | 36 | 0.0% |
| Malaysia | 487 | 0.1% |
| Mexico | 39,147 | 6.2% |
| Micronesia | 173 | 0.0% |
| Middle Africa | 1,153 | 0.2% |
| Morocco | 149 | 0.0% |
| Nepal | 947 | 0.2% |
| Netherlands | 43 | 0.0% |
| Nicaragua | 564 | 0.1% |
| Nigeria | 6,083 | 1.0% |
| Northern Africa | 1,678 | 0.3% |
| Northern Europe | 2,352 | 0.4% |
| Norway | 58 | 0.0% |
| Oceania | 337 | 0.1% |
| Pakistan | 9,073 | 1.4% |
| Panama | 400 | 0.1% |
| Peru | 1,293 | 0.2% |
| Philippines | 7,202 | 1.1% |
| Poland | 331 | 0.1% |
| Portugal | 106 | 0.0% |
| Romania | 214 | 0.0% |
| Russia | 555 | 0.1% |
| Saudi Arabia | 415 | 0.1% |
| Scotland | 223 | 0.0% |
| Senegal | 44 | 0.0% |
| Serbia | 18 | 0.0% |
| Sierra Leone | 276 | 0.0% |
| Singapore | 149 | 0.0% |
| Somalia | 14 | 0.0% |
| South Africa | 118 | 0.0% |
| South America | 15,339 | 2.4% |
| South Central Asia | 29,526 | 4.6% |
| South Eastern Asia | 24,895 | 3.9% |
| Southern Europe | 838 | 0.1% |
| Spain | 135 | 0.0% |
| Sri Lanka | 214 | 0.0% |
| St. Vincent and the Grenadines | 112 | 0.0% |
| Sudan | 255 | 0.0% |
| Sweden | 212 | 0.0% |
| Switzerland | 11 | 0.0% |
| Syria | 381 | 0.1% |
| Taiwan | 2,838 | 0.4% |
| Thailand | 293 | 0.1% |
| Trinidad and Tobago | 653 | 0.1% |
| Turkey | 1,556 | 0.2% |
| Uganda | 279 | 0.0% |
| Ukraine | 115 | 0.0% |
| Uruguay | 309 | 0.1% |
| Uzbekistan | 22 | 0.0% |
| Venezuela | 4,754 | 0.7% |
| Vietnam | 15,538 | 2.4% |
| Western Africa | 7,389 | 1.2% |
| Western Asia | 7,625 | 1.2% |
| Western Europe | 701 | 0.1% |
| Yemen | 119 | 0.0% |
| Zaire | 63 | 0.0% |
| Zimbabwe | 44 | 0.0% | View All 131 Rows |
Sex and Age in Area Code 346
Sex and Age in Area Code 346
The most populous age groups in Area Code 346 are 10 to 14 Years (25,697 | 8.1%) for men and 10 to 14 Years (25,681 | 8.1%) for women.
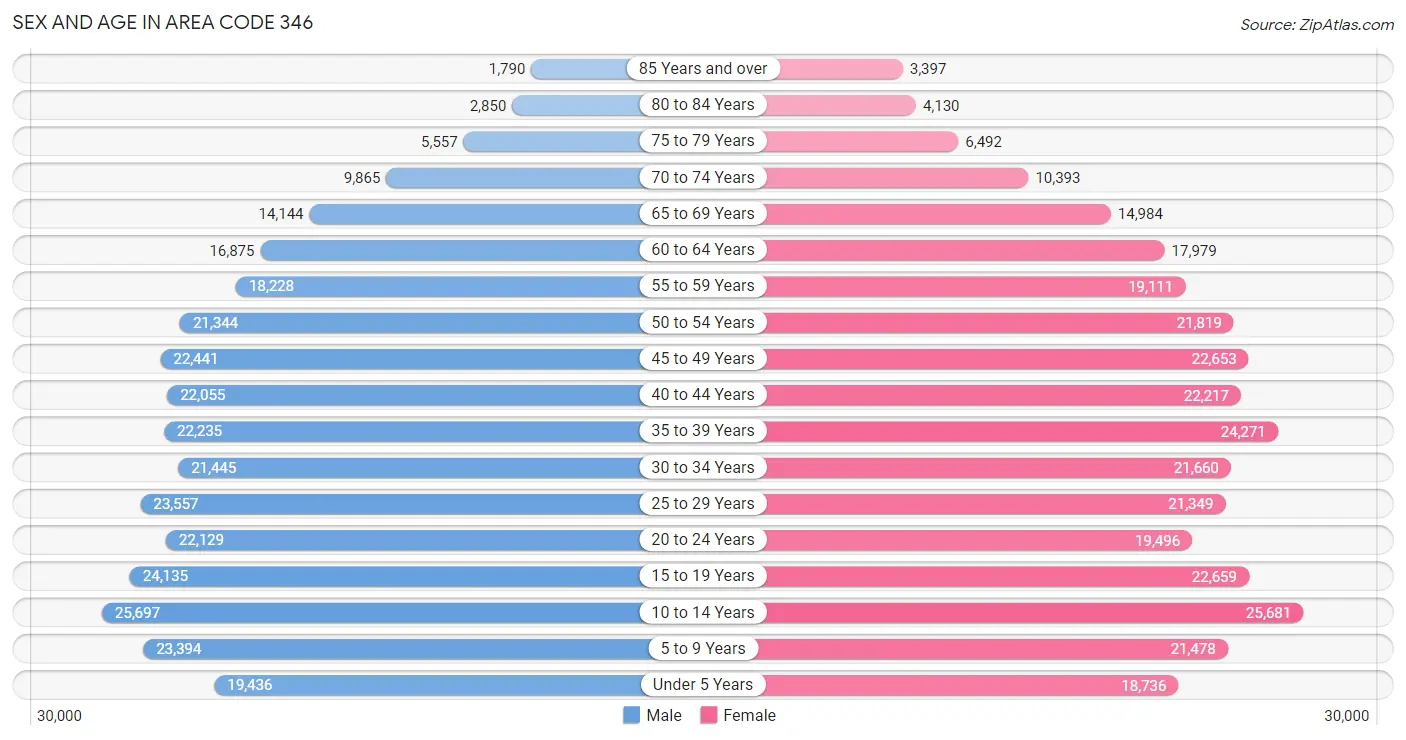
| Age Bracket | Male | Female |
| Under 5 Years | 19,436 (6.1%) | 18,736 (5.9%) |
| 5 to 9 Years | 23,394 (7.4%) | 21,478 (6.7%) |
| 10 to 14 Years | 25,697 (8.1%) | 25,681 (8.1%) |
| 15 to 19 Years | 24,135 (7.6%) | 22,659 (7.1%) |
| 20 to 24 Years | 22,129 (7.0%) | 19,496 (6.1%) |
| 25 to 29 Years | 23,557 (7.4%) | 21,349 (6.7%) |
| 30 to 34 Years | 21,445 (6.8%) | 21,660 (6.8%) |
| 35 to 39 Years | 22,235 (7.0%) | 24,271 (7.6%) |
| 40 to 44 Years | 22,055 (7.0%) | 22,217 (7.0%) |
| 45 to 49 Years | 22,441 (7.1%) | 22,653 (7.1%) |
| 50 to 54 Years | 21,344 (6.7%) | 21,819 (6.9%) |
| 55 to 59 Years | 18,228 (5.8%) | 19,111 (6.0%) |
| 60 to 64 Years | 16,875 (5.3%) | 17,979 (5.6%) |
| 65 to 69 Years | 14,144 (4.5%) | 14,984 (4.7%) |
| 70 to 74 Years | 9,865 (3.1%) | 10,393 (3.3%) |
| 75 to 79 Years | 5,557 (1.8%) | 6,492 (2.0%) |
| 80 to 84 Years | 2,850 (0.9%) | 4,130 (1.3%) |
| 85 Years and over | 1,790 (0.6%) | 3,397 (1.1%) |
| Total | 317,177 (100.0%) | 318,505 (100.0%) |
Families and Households in Area Code 346
Median Family Size in Area Code 346
The median family size in Area Code 346 is 3.23 persons per family, with married-couple families (117,297 | 74.7%) accounting for the largest median family size of 3.29153 persons per family. On the other hand, single male/father families (9,870 | 6.3%) represent the smallest median family size with 2.92 persons per family.
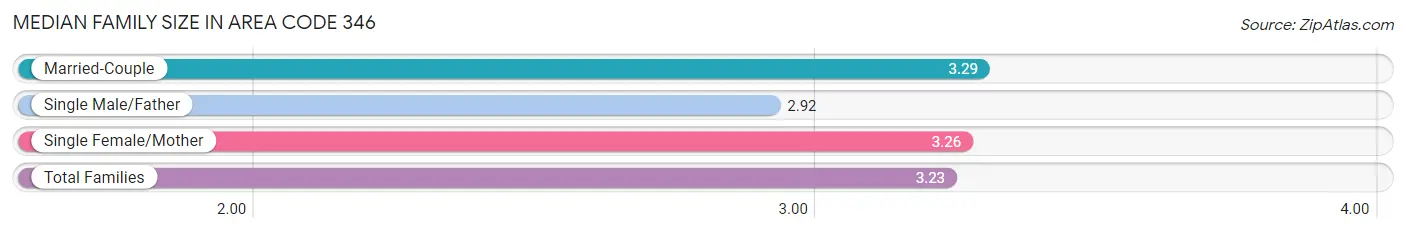
| Family Type | # Families | Family Size |
| Married-Couple | 117,297 (74.7%) | 3.29 |
| Single Male/Father | 9,870 (6.3%) | 2.92 |
| Single Female/Mother | 29,936 (19.1%) | 3.26 |
| Total Families | 157,103 (100.0%) | 3.23 |
Median Household Size in Area Code 346
The median household size in Area Code 346 is 2.73 persons per household, with single female/mother households (29,936 | 14.2%) accounting for the largest median household size of 3.46083 persons per household. non-family households (53,004 | 25.2%) represent the smallest median household size with 1.20 persons per household.
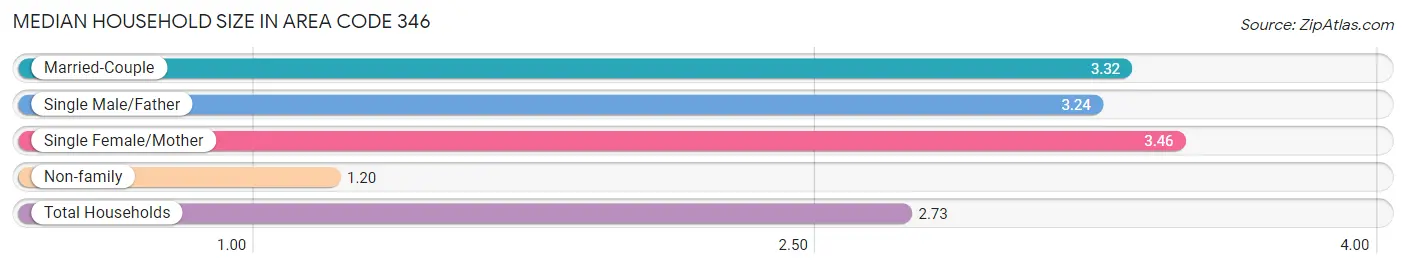
| Household Type | # Households | Household Size |
| Married-Couple | 117,297 (55.8%) | 3.32 |
| Single Male/Father | 9,870 (4.7%) | 3.24 |
| Single Female/Mother | 29,936 (14.2%) | 3.46 |
| Non-family | 53,004 (25.2%) | 1.20 |
| Total Households | 210,107 (100.0%) | 2.73 |
Household Size by Marriage Status in Area Code 346
Out of a total of 210,107 households in Area Code 346, 157,103 (74.8%) are family households, while 53,004 (25.2%) are nonfamily households. The most numerous type of family households are 2-person households, comprising 51,593, and the most common type of nonfamily households are 1-person households, comprising 44,036.
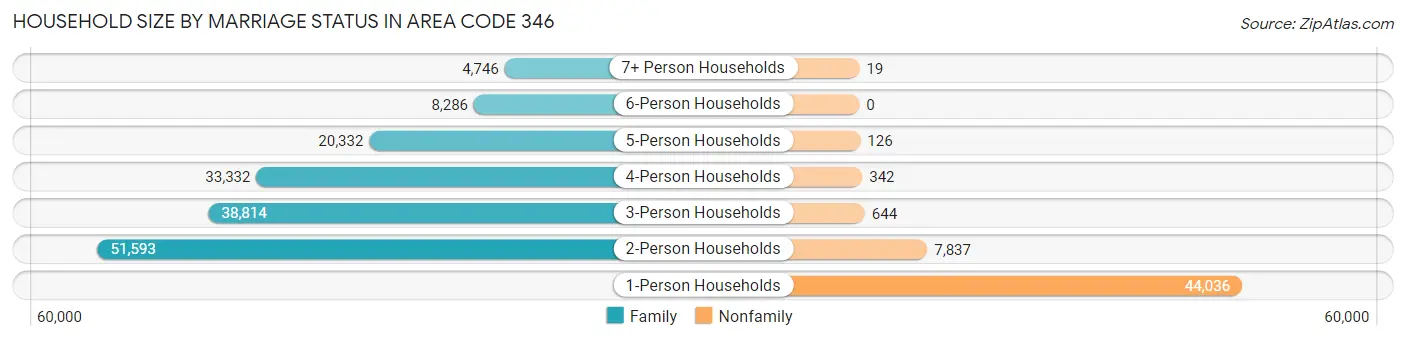
| Household Size | Family Households | Nonfamily Households |
| 1-Person Households | - | 44,036 (21.0%) |
| 2-Person Households | 51,593 (24.6%) | 7,837 (3.7%) |
| 3-Person Households | 38,814 (18.5%) | 644 (0.3%) |
| 4-Person Households | 33,332 (15.9%) | 342 (0.2%) |
| 5-Person Households | 20,332 (9.7%) | 126 (0.1%) |
| 6-Person Households | 8,286 (3.9%) | 0 (0.0%) |
| 7+ Person Households | 4,746 (2.3%) | 19 (0.0%) |
| Total | 157,103 (74.8%) | 53,004 (25.2%) |
Female Fertility in Area Code 346
Fertility by Age in Area Code 346
Average fertility rate in Area Code 346 is 52.2 births per 1,000 women. Women in the age bracket of 20 to 34 years have the highest fertility rate with 91.6 births per 1,000 women. Women in the age bracket of 20 to 34 years acount for 65.5% of all women with births.
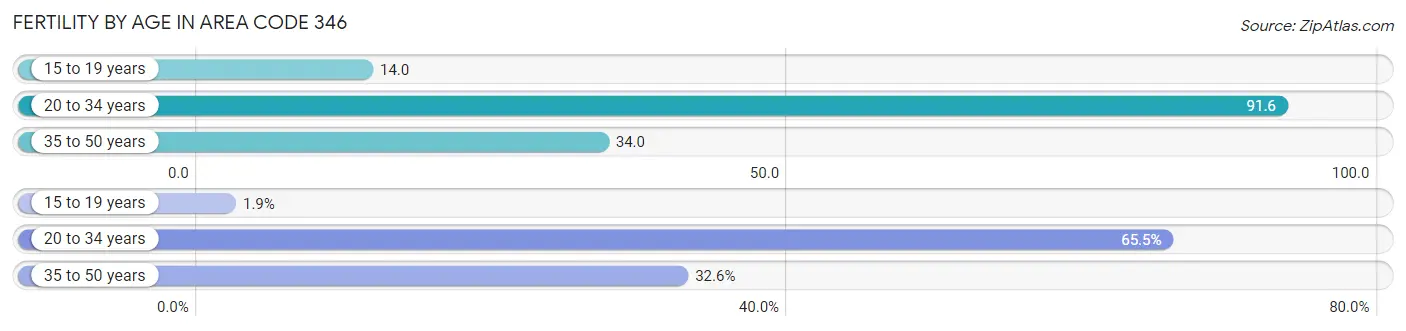
| Age Bracket | Women with Births | Births / 1,000 Women |
| 15 to 19 years | 158 (1.9%) | 14.0 |
| 20 to 34 years | 5,446 (65.5%) | 91.6 |
| 35 to 50 years | 2,709 (32.6%) | 34.0 |
| Total | 8,313 (100.0%) | 52.2 |
Fertility by Age by Marriage Status in Area Code 346
64.5% of women with births (8,313) in Area Code 346 are married. The highest percentage of unmarried women with births falls into 15 to 19 years age bracket with 100.0% of them unmarried at the time of birth, while the lowest percentage of unmarried women with births belong to 35 to 50 years age bracket with 24.8% of them unmarried.
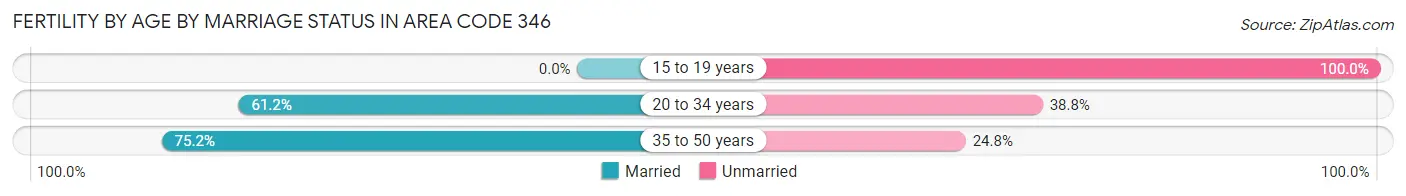
| Age Bracket | Married | Unmarried |
| 15 to 19 years | 0 (0.0%) | 158 (100.0%) |
| 20 to 34 years | 3,334 (61.2%) | 2,112 (38.8%) |
| 35 to 50 years | 2,036 (75.2%) | 673 (24.8%) |
| Total | 5,364 (64.5%) | 2,949 (35.5%) |
Fertility by Education in Area Code 346
Average fertility rate in Area Code 346 is 52.2 births per 1,000 women. Women with the education attainment of high school diploma have the highest fertility rate of 80.4 births per 1,000 women, while women with the education attainment of bachelor's degree have the lowest fertility at 39.3 births per 1,000 women. Women with the education attainment of college or associate's degree represent 35.8% of all women with births.
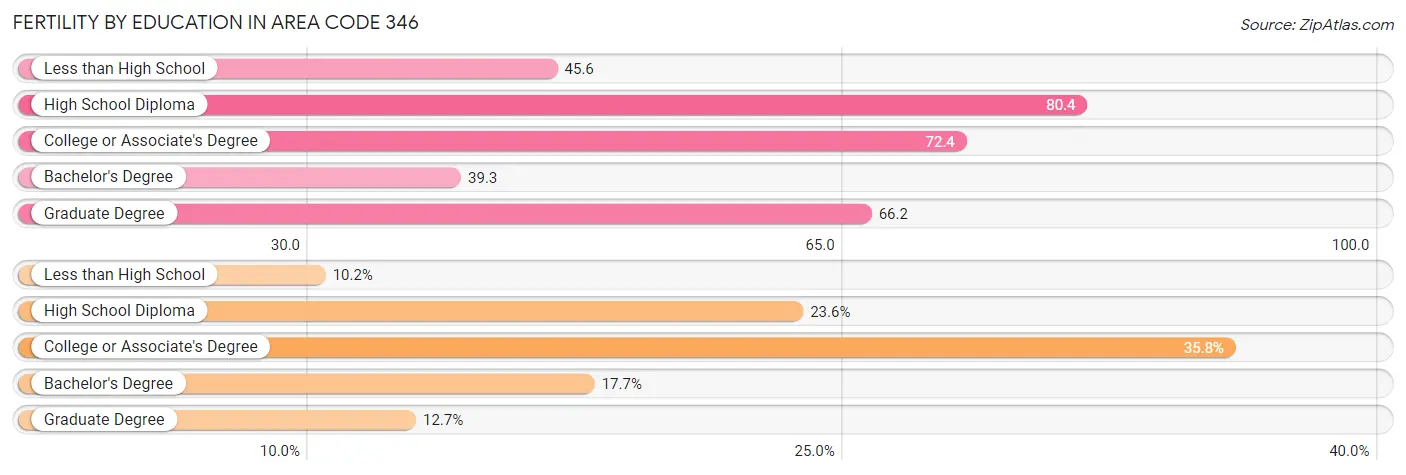
| Educational Attainment | Women with Births | Births / 1,000 Women |
| Less than High School | 846 (10.2%) | 45.6 |
| High School Diploma | 1,962 (23.6%) | 80.4 |
| College or Associate's Degree | 2,973 (35.8%) | 72.4 |
| Bachelor's Degree | 1,475 (17.7%) | 39.3 |
| Graduate Degree | 1,057 (12.7%) | 66.2 |
| Total | 8,313 (100.0%) | 52.2 |
Fertility by Education by Marriage Status in Area Code 346
35.5% of women with births in Area Code 346 are unmarried. Women with the educational attainment of graduate degree are most likely to be married with 92.4% of them married at childbirth, while women with the educational attainment of high school diploma are least likely to be married with 55.0% of them unmarried at childbirth.
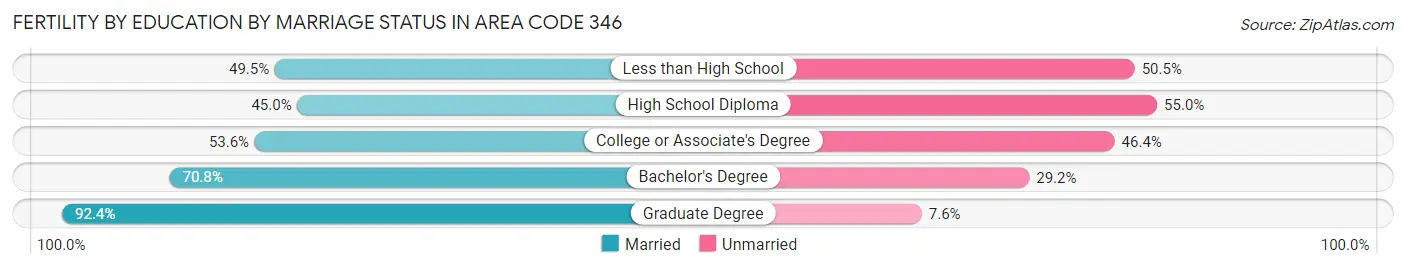
| Educational Attainment | Married | Unmarried |
| Less than High School | 419 (49.5%) | 427 (50.5%) |
| High School Diploma | 883 (45.0%) | 1,079 (55.0%) |
| College or Associate's Degree | 1,593 (53.6%) | 1,380 (46.4%) |
| Bachelor's Degree | 1,044 (70.8%) | 431 (29.2%) |
| Graduate Degree | 977 (92.4%) | 80 (7.6%) |
| Total | 5,364 (64.5%) | 2,949 (35.5%) |
Employment Characteristics in Area Code 346
Employment by Class of Employer in Area Code 346
Among the 304,268 employed individuals in Area Code 346, private company employees (214,328 | 70.4%), local government employees (22,146 | 7.3%), and self-employed (not incorporated) (19,386 | 6.4%) make up the most common classes of employment.
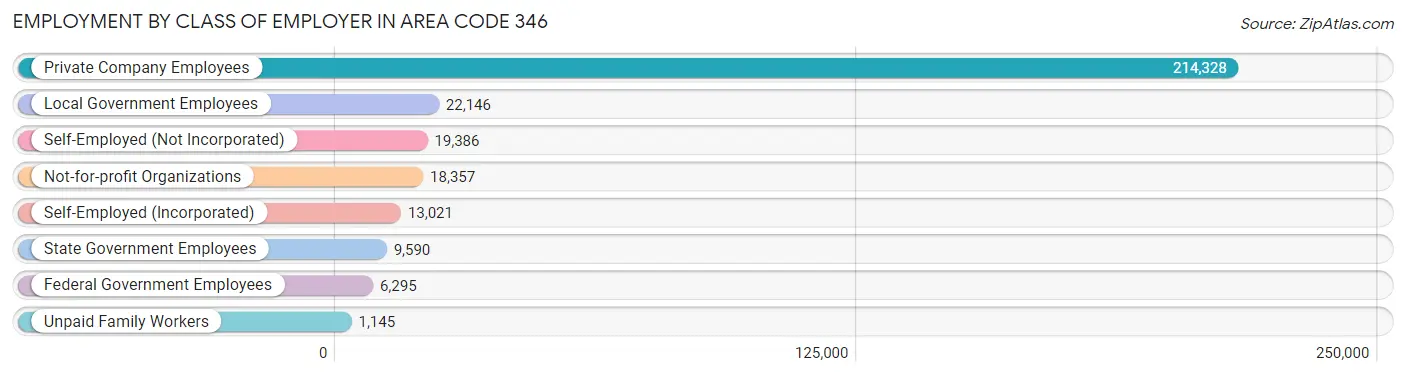
| Employer Class | # Employees | % Employees |
| Private Company Employees | 214,328 | 70.4% |
| Self-Employed (Incorporated) | 13,021 | 4.3% |
| Self-Employed (Not Incorporated) | 19,386 | 6.4% |
| Not-for-profit Organizations | 18,357 | 6.0% |
| Local Government Employees | 22,146 | 7.3% |
| State Government Employees | 9,590 | 3.2% |
| Federal Government Employees | 6,295 | 2.1% |
| Unpaid Family Workers | 1,145 | 0.4% |
| Total | 304,268 | 100.0% |
Employment Status by Age in Area Code 346
According to the labor force statistics for Area Code 346, out of the total population over 16 years of age (491,547), 65.7% or 323,045 individuals are in the labor force, with 6.4% or 20,707 of them unemployed. The age group with the highest labor force participation rate is 35 to 44 years, with 81.1% or 73,666 individuals in the labor force. Within the labor force, the 16 to 19 years age range has the highest percentage of unemployed individuals, with 256.6% or 36,861 of them being unemployed.
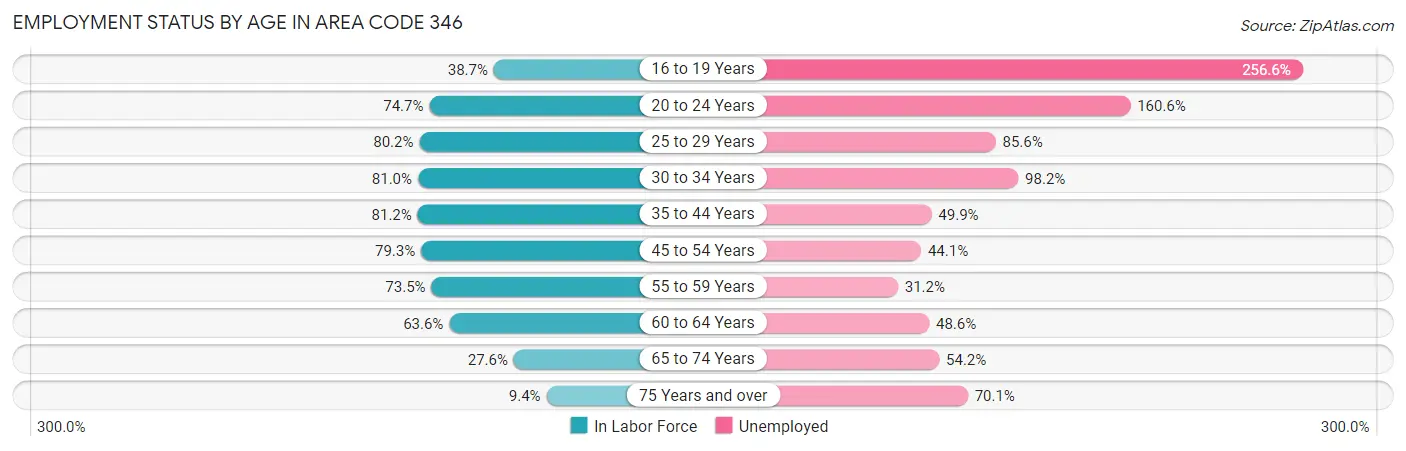
| Age Bracket | In Labor Force | Unemployed |
| 16 to 19 Years | 14,365 (38.7%) | 36,861 (256.6%) |
| 20 to 24 Years | 31,077 (74.7%) | 49,910 (160.6%) |
| 25 to 29 Years | 36,033 (80.2%) | 30,844 (85.6%) |
| 30 to 34 Years | 34,922 (81.0%) | 34,295 (98.2%) |
| 35 to 44 Years | 73,663 (81.1%) | 36,759 (49.9%) |
| 45 to 54 Years | 69,940 (79.2%) | 30,845 (44.1%) |
| 55 to 59 Years | 27,433 (73.5%) | 8,559 (31.2%) |
| 60 to 64 Years | 22,159 (63.6%) | 10,770 (48.6%) |
| 65 to 74 Years | 13,619 (27.6%) | 7,383 (54.2%) |
| 75 Years and over | 2,276 (9.4%) | 1,595 (70.1%) |
| Total | 323,022 (65.7%) | 20,702 (6.4%) |
Employment Status by Educational Attainment in Area Code 346
According to labor force statistics for Area Code 346, 78.1% of individuals (264,878) out of the total population between 25 and 64 years of age (339,239) are in the labor force, with 57.8% or 153,099 of them being unemployed. The group with the highest labor force participation rate are those with the educational attainment of bachelor's degree or higher, with 87.5% or 112,155 individuals in the labor force. Within the labor force, individuals with college / associate degree education have the highest percentage of unemployment, with 71.8% or 56,736 of them being unemployed.
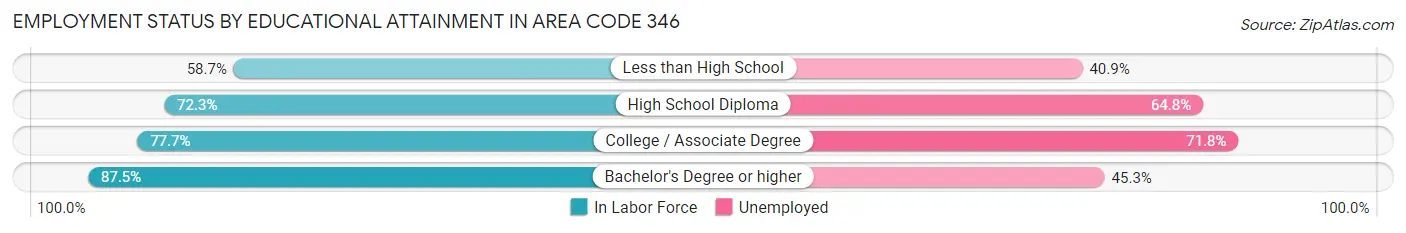
| Educational Attainment | In Labor Force | Unemployed |
| Less than High School | 22,838 (58.7%) | 15,906 (40.9%) |
| High School Diploma | 50,892 (72.3%) | 45,593 (64.8%) |
| College / Associate Degree | 79,019 (77.7%) | 73,048 (71.8%) |
| Bachelor's Degree or higher | 112,160 (87.5%) | 58,098 (45.3%) |
| Total | 264,867 (78.1%) | 196,080 (57.8%) |
Employment Occupations by Sex in Area Code 346
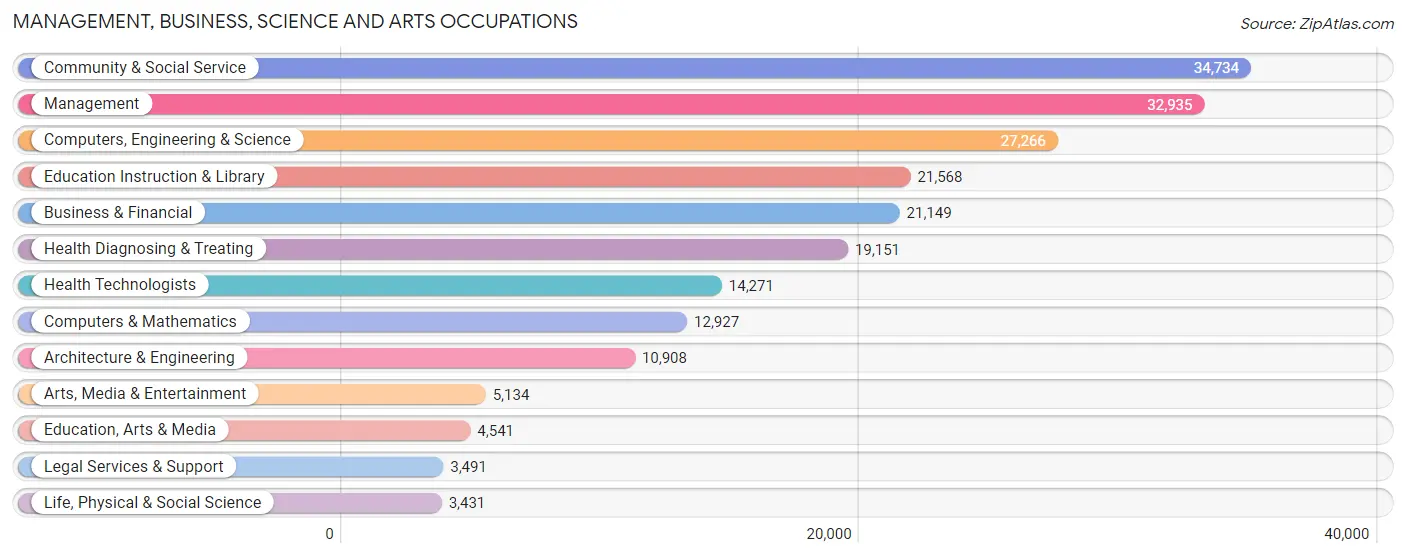
Management, Business, Science and Arts Occupations
The most common Management, Business, Science and Arts occupations in Area Code 346 are Community & Social Service (34,734 | 11.2%), Management (32,935 | 10.6%), Computers, Engineering & Science (27,266 | 8.8%), Education Instruction & Library (21,568 | 7.0%), and Business & Financial (21,149 | 6.8%).
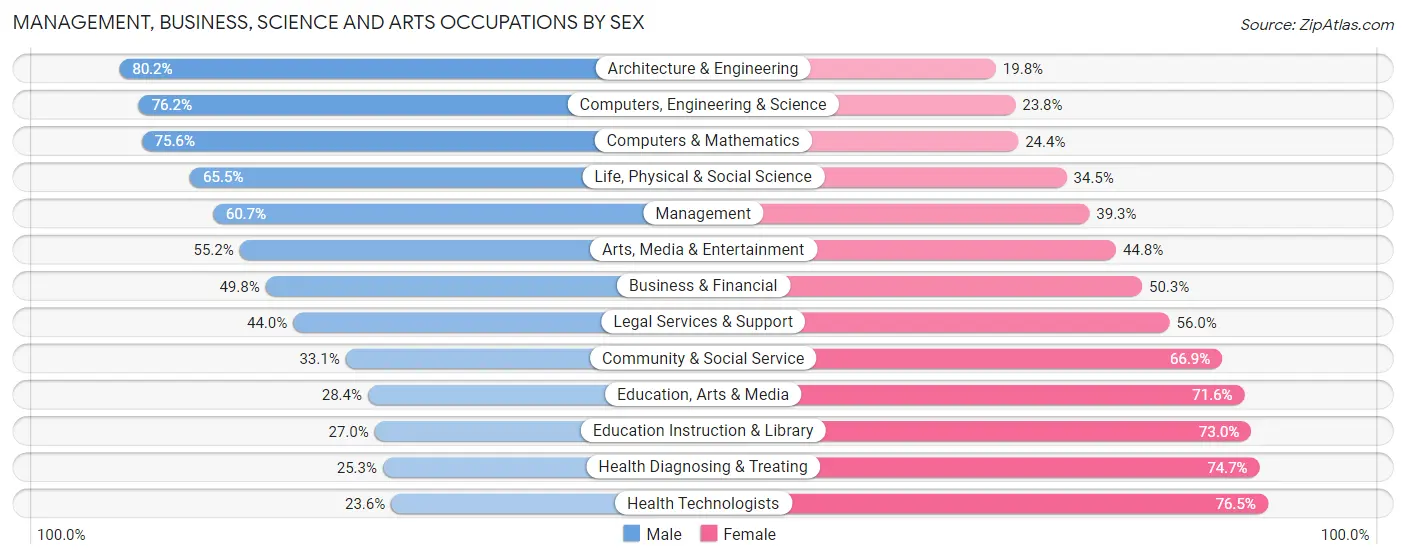
Management, Business, Science and Arts Occupations by Sex
Within the Management, Business, Science and Arts occupations in Area Code 346, the most male-oriented occupations are Architecture & Engineering (80.2%), Computers, Engineering & Science (76.2%), and Computers & Mathematics (75.6%), while the most female-oriented occupations are Health Technologists (76.4%), Health Diagnosing & Treating (74.7%), and Education Instruction & Library (73.0%).
| Occupation | Male | Female |
| Management | 20,005 (60.7%) | 12,930 (39.3%) |
| Business & Financial | 10,521 (49.7%) | 10,628 (50.2%) |
| Computers, Engineering & Science | 20,770 (76.2%) | 6,496 (23.8%) |
| Computers & Mathematics | 9,770 (75.6%) | 3,157 (24.4%) |
| Architecture & Engineering | 8,753 (80.2%) | 2,155 (19.8%) |
| Life, Physical & Social Science | 2,247 (65.5%) | 1,184 (34.5%) |
| Community & Social Service | 11,482 (33.1%) | 23,252 (66.9%) |
| Education, Arts & Media | 1,290 (28.4%) | 3,251 (71.6%) |
| Legal Services & Support | 1,536 (44.0%) | 1,955 (56.0%) |
| Education Instruction & Library | 5,824 (27.0%) | 15,744 (73.0%) |
| Arts, Media & Entertainment | 2,832 (55.2%) | 2,302 (44.8%) |
| Health Diagnosing & Treating | 4,839 (25.3%) | 14,312 (74.7%) |
| Health Technologists | 3,361 (23.5%) | 10,910 (76.4%) |
| Total (Category) | 67,617 (50.0%) | 67,618 (50.0%) |
| Total (Overall) | 166,747 (53.7%) | 143,680 (46.3%) |
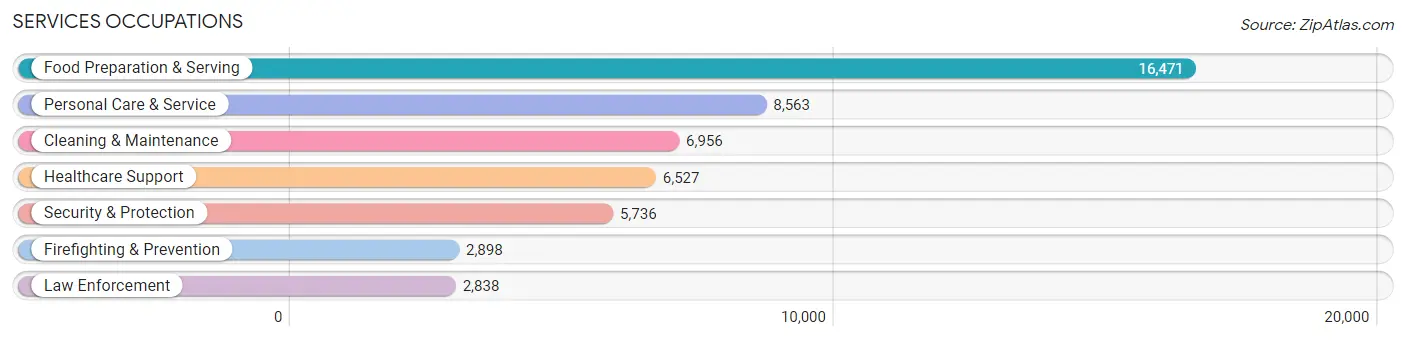
Services Occupations
The most common Services occupations in Area Code 346 are Food Preparation & Serving (16,471 | 5.3%), Personal Care & Service (8,563 | 2.8%), Cleaning & Maintenance (6,956 | 2.2%), Healthcare Support (6,527 | 2.1%), and Security & Protection (5,736 | 1.8%).
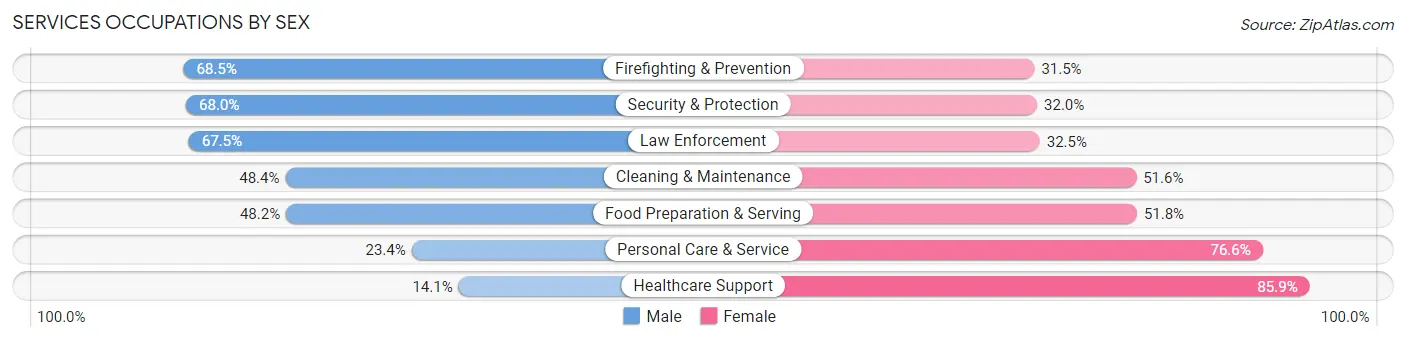
Services Occupations by Sex
Within the Services occupations in Area Code 346, the most male-oriented occupations are Firefighting & Prevention (68.5%), Security & Protection (68.0%), and Law Enforcement (67.5%), while the most female-oriented occupations are Healthcare Support (85.9%), Personal Care & Service (76.6%), and Food Preparation & Serving (51.8%).
| Occupation | Male | Female |
| Healthcare Support | 919 (14.1%) | 5,608 (85.9%) |
| Security & Protection | 3,901 (68.0%) | 1,835 (32.0%) |
| Firefighting & Prevention | 1,986 (68.5%) | 912 (31.5%) |
| Law Enforcement | 1,915 (67.5%) | 923 (32.5%) |
| Food Preparation & Serving | 7,946 (48.2%) | 8,525 (51.8%) |
| Cleaning & Maintenance | 3,365 (48.4%) | 3,591 (51.6%) |
| Personal Care & Service | 2,001 (23.4%) | 6,562 (76.6%) |
| Total (Category) | 18,132 (41.0%) | 26,121 (59.0%) |
| Total (Overall) | 166,747 (53.7%) | 143,680 (46.3%) |
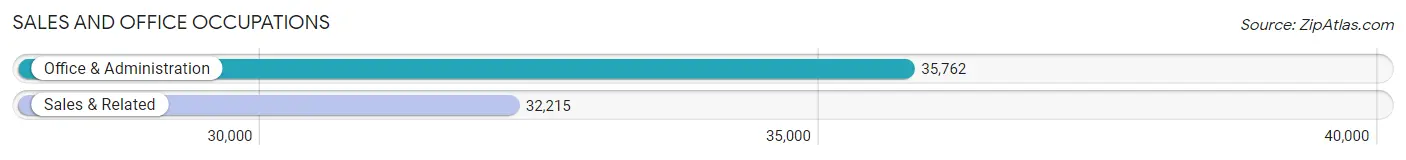
Sales and Office Occupations
The most common Sales and Office occupations in Area Code 346 are Office & Administration (35,762 | 11.5%), and Sales & Related (32,215 | 10.4%).
Sales and Office Occupations by Sex
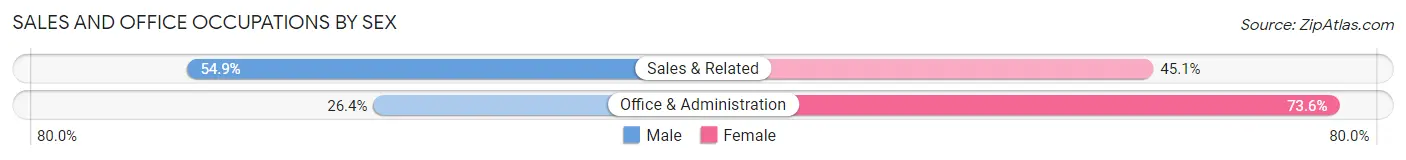
| Occupation | Male | Female |
| Sales & Related | 17,699 (54.9%) | 14,516 (45.1%) |
| Office & Administration | 9,427 (26.4%) | 26,335 (73.6%) |
| Total (Category) | 27,126 (39.9%) | 40,851 (60.1%) |
| Total (Overall) | 166,747 (53.7%) | 143,680 (46.3%) |
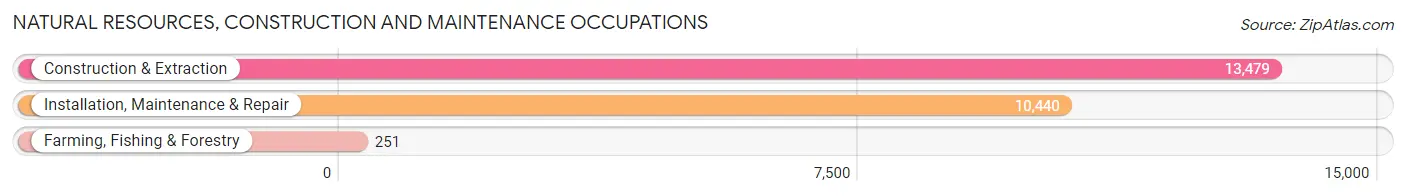
Natural Resources, Construction and Maintenance Occupations
The most common Natural Resources, Construction and Maintenance occupations in Area Code 346 are Construction & Extraction (13,479 | 4.3%), Installation, Maintenance & Repair (10,440 | 3.4%), and Farming, Fishing & Forestry (251 | 0.1%).
Natural Resources, Construction and Maintenance Occupations by Sex
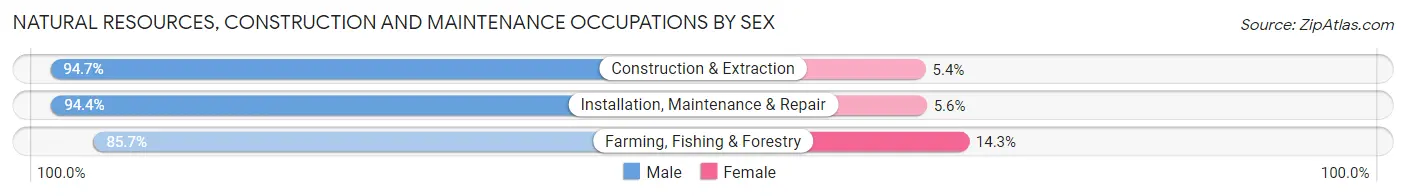
| Occupation | Male | Female |
| Farming, Fishing & Forestry | 215 (85.7%) | 36 (14.3%) |
| Construction & Extraction | 12,758 (94.7%) | 721 (5.3%) |
| Installation, Maintenance & Repair | 9,859 (94.4%) | 581 (5.6%) |
| Total (Category) | 22,832 (94.5%) | 1,338 (5.5%) |
| Total (Overall) | 166,747 (53.7%) | 143,680 (46.3%) |
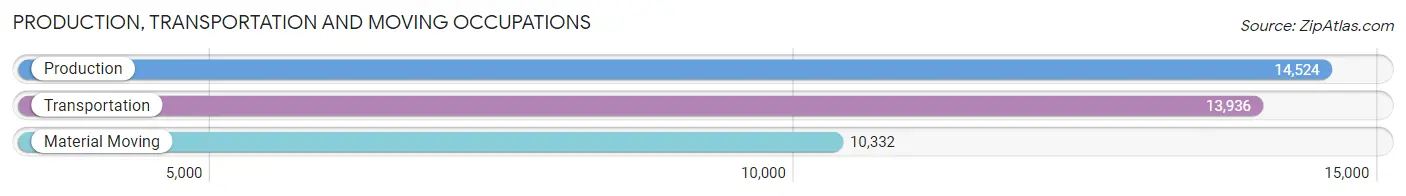
Production, Transportation and Moving Occupations
The most common Production, Transportation and Moving occupations in Area Code 346 are Production (14,524 | 4.7%), Transportation (13,936 | 4.5%), and Material Moving (10,332 | 3.3%).
Production, Transportation and Moving Occupations by Sex
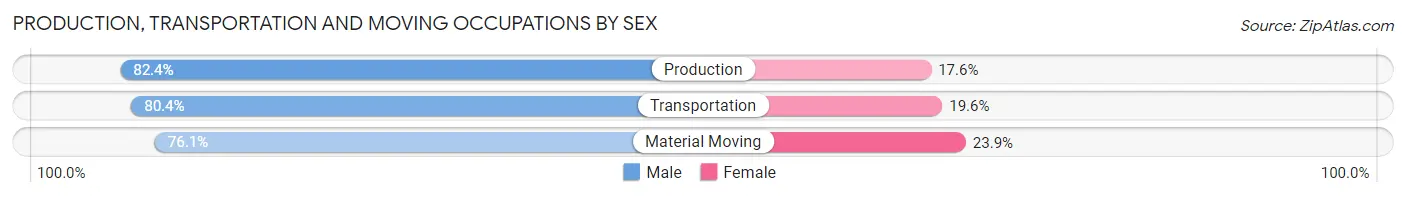
| Occupation | Male | Female |
| Production | 11,973 (82.4%) | 2,551 (17.6%) |
| Transportation | 11,206 (80.4%) | 2,730 (19.6%) |
| Material Moving | 7,861 (76.1%) | 2,471 (23.9%) |
| Total (Category) | 31,040 (80.0%) | 7,752 (20.0%) |
| Total (Overall) | 166,747 (53.7%) | 143,680 (46.3%) |
Employment Industries by Sex in Area Code 346
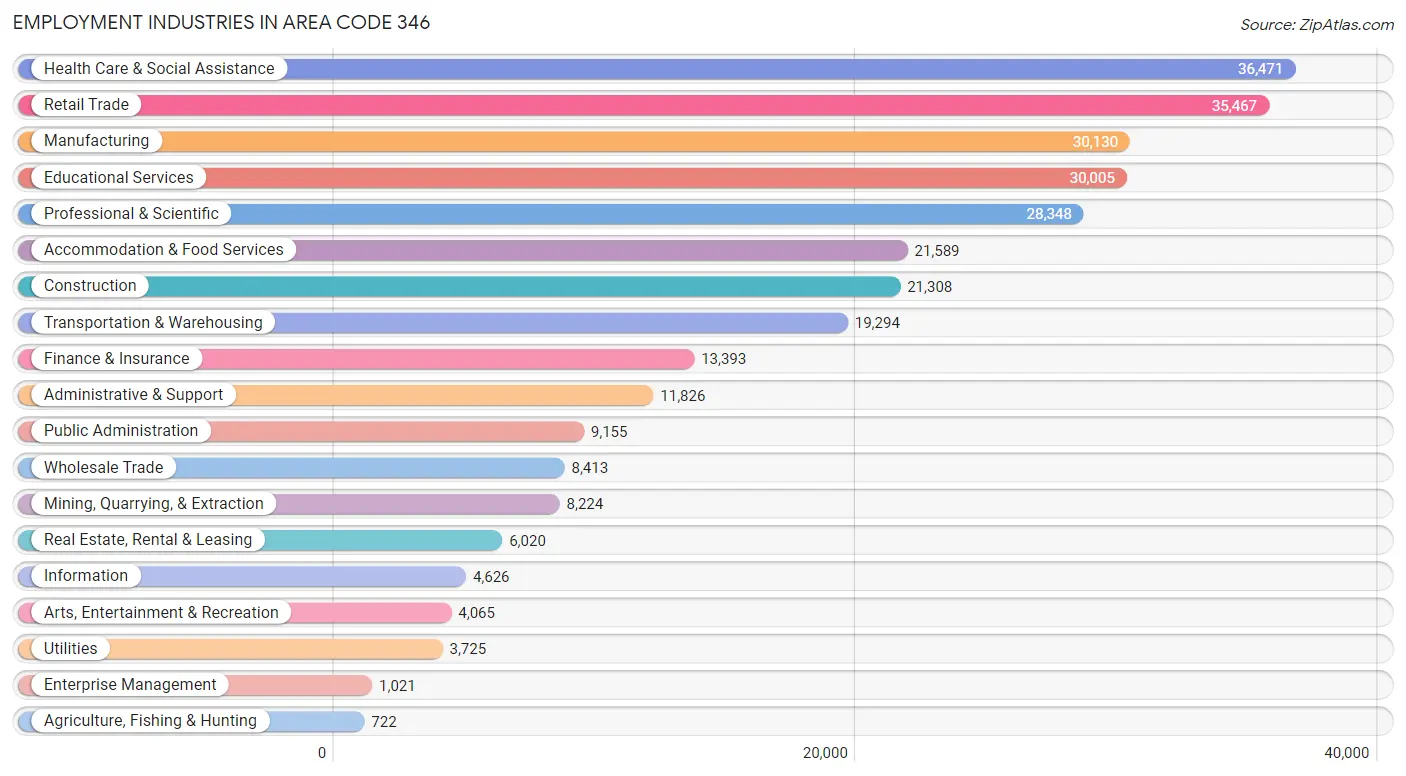
Employment Industries in Area Code 346
The major employment industries in Area Code 346 include Health Care & Social Assistance (36,471 | 11.7%), Retail Trade (35,467 | 11.4%), Manufacturing (30,130 | 9.7%), Educational Services (30,005 | 9.7%), and Professional & Scientific (28,348 | 9.1%).
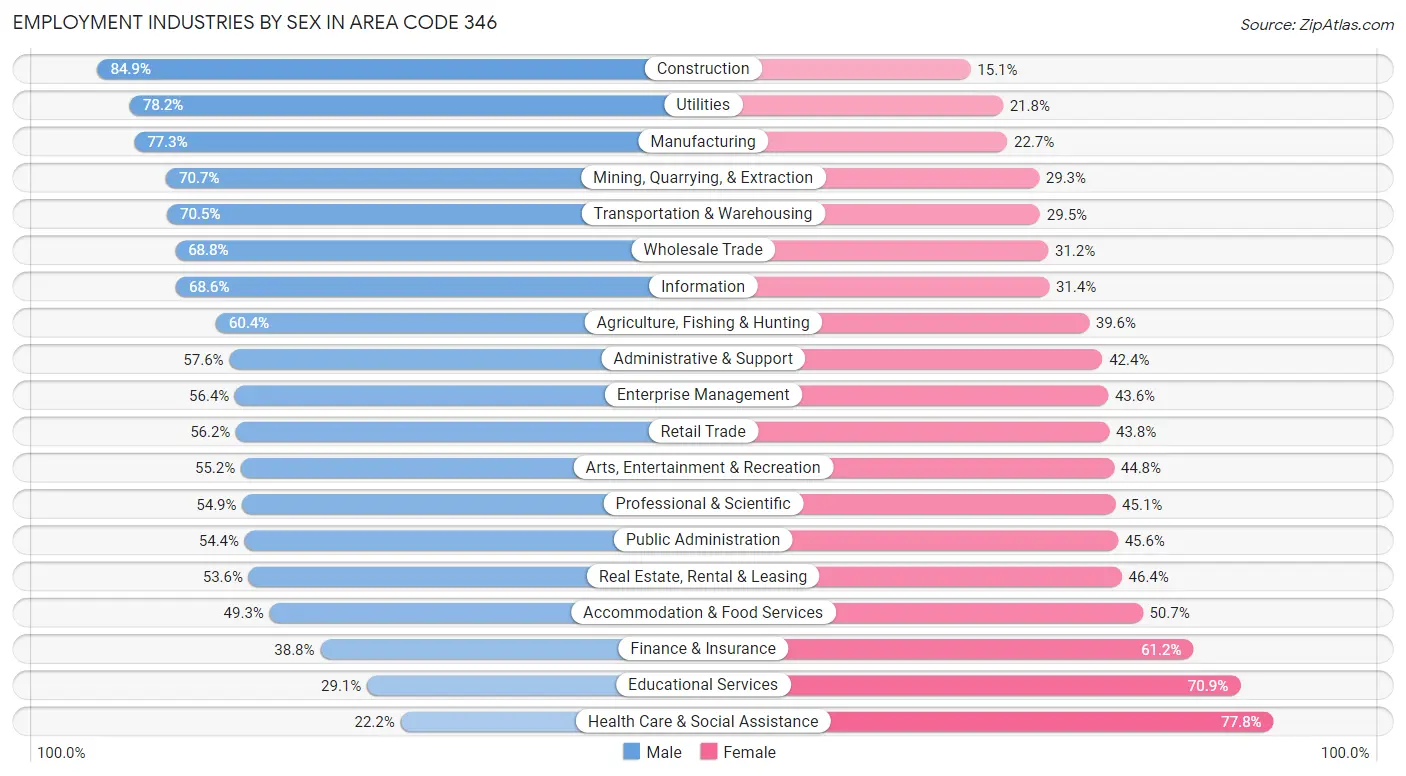
Employment Industries by Sex in Area Code 346
The Area Code 346 industries that see more men than women are Construction (84.9%), Utilities (78.2%), and Manufacturing (77.3%), whereas the industries that tend to have a higher number of women are Health Care & Social Assistance (77.8%), Educational Services (70.9%), and Finance & Insurance (61.2%).
| Industry | Male | Female |
| Agriculture, Fishing & Hunting | 436 (60.4%) | 286 (39.6%) |
| Mining, Quarrying, & Extraction | 5,816 (70.7%) | 2,408 (29.3%) |
| Construction | 18,091 (84.9%) | 3,217 (15.1%) |
| Manufacturing | 23,290 (77.3%) | 6,840 (22.7%) |
| Wholesale Trade | 5,790 (68.8%) | 2,623 (31.2%) |
| Retail Trade | 19,933 (56.2%) | 15,534 (43.8%) |
| Transportation & Warehousing | 13,605 (70.5%) | 5,689 (29.5%) |
| Utilities | 2,913 (78.2%) | 812 (21.8%) |
| Information | 3,175 (68.6%) | 1,451 (31.4%) |
| Finance & Insurance | 5,194 (38.8%) | 8,199 (61.2%) |
| Real Estate, Rental & Leasing | 3,227 (53.6%) | 2,793 (46.4%) |
| Professional & Scientific | 15,572 (54.9%) | 12,776 (45.1%) |
| Enterprise Management | 576 (56.4%) | 445 (43.6%) |
| Administrative & Support | 6,813 (57.6%) | 5,013 (42.4%) |
| Educational Services | 8,730 (29.1%) | 21,275 (70.9%) |
| Health Care & Social Assistance | 8,089 (22.2%) | 28,382 (77.8%) |
| Arts, Entertainment & Recreation | 2,244 (55.2%) | 1,821 (44.8%) |
| Accommodation & Food Services | 10,640 (49.3%) | 10,949 (50.7%) |
| Public Administration | 4,981 (54.4%) | 4,174 (45.6%) |
| Total | 166,747 (53.7%) | 143,680 (46.3%) |
Education in Area Code 346
School Enrollment in Area Code 346
The most common levels of schooling among the 178,426 students in Area Code 346 are high school (40,916 | 22.9%), middle school (40,106 | 22.5%), and college / undergraduate (37,125 | 20.8%).
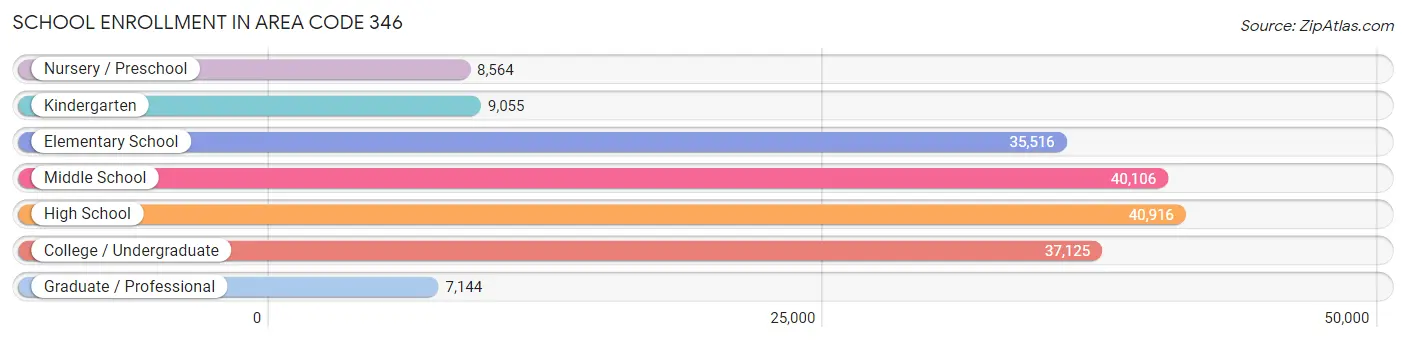
| School Level | # Students | % Students |
| Nursery / Preschool | 8,564 | 4.8% |
| Kindergarten | 9,055 | 5.1% |
| Elementary School | 35,516 | 19.9% |
| Middle School | 40,106 | 22.5% |
| High School | 40,916 | 22.9% |
| College / Undergraduate | 37,125 | 20.8% |
| Graduate / Professional | 7,144 | 4.0% |
| Total | 178,426 | 100.0% |
School Enrollment by Age by Funding Source in Area Code 346
Out of a total of 178,426 students who are enrolled in schools in Area Code 346, 19,199 (10.8%) attend a private institution, while the remaining 159,227 (89.2%) are enrolled in public schools. The age group of 3 to 4 year olds has the highest likelihood of being enrolled in private schools, with 3,608 (54.3% in the age bracket) enrolled. Conversely, the age group of 10 to 14 year olds has the lowest likelihood of being enrolled in a private school, with 47,191 (94.4% in the age bracket) attending a public institution.
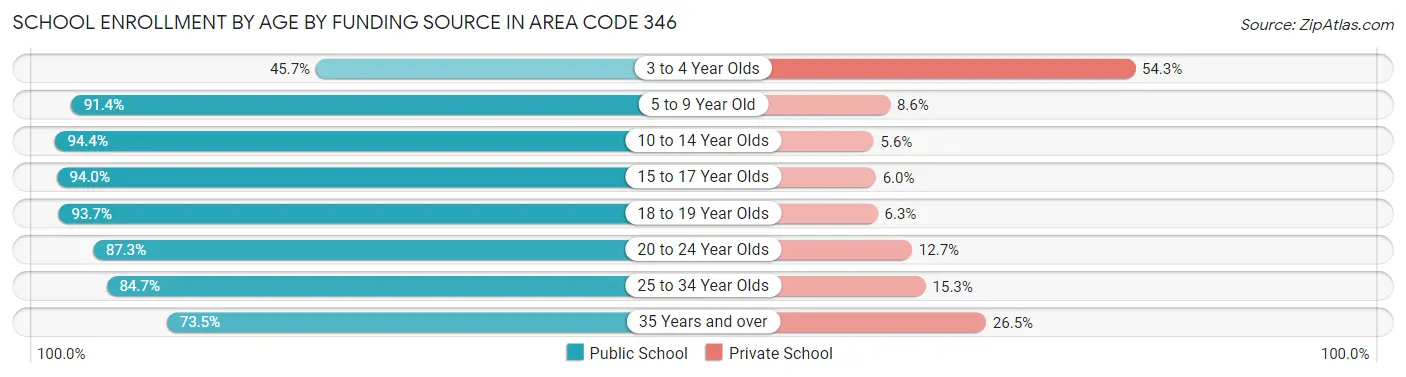
| Age Bracket | Public School | Private School |
| 3 to 4 Year Olds | 3,040 (45.7%) | 3,608 (54.3%) |
| 5 to 9 Year Old | 38,181 (91.4%) | 3,603 (8.6%) |
| 10 to 14 Year Olds | 47,191 (94.4%) | 2,787 (5.6%) |
| 15 to 17 Year Olds | 26,549 (94.0%) | 1,687 (6.0%) |
| 18 to 19 Year Olds | 11,752 (93.7%) | 793 (6.3%) |
| 20 to 24 Year Olds | 16,086 (87.3%) | 2,343 (12.7%) |
| 25 to 34 Year Olds | 8,279 (84.7%) | 1,491 (15.3%) |
| 35 Years and over | 8,113 (73.5%) | 2,923 (26.5%) |
| Total | 159,227 (89.2%) | 19,199 (10.8%) |
Educational Attainment by Field of Study in Area Code 346
Business (37,973 | 23.3%), engineering (24,331 | 14.9%), science & technology (17,590 | 10.8%), education (13,441 | 8.3%), and social sciences (10,136 | 6.2%) are the most common fields of study among 162,914 individuals in Area Code 346 who have obtained a bachelor's degree or higher.
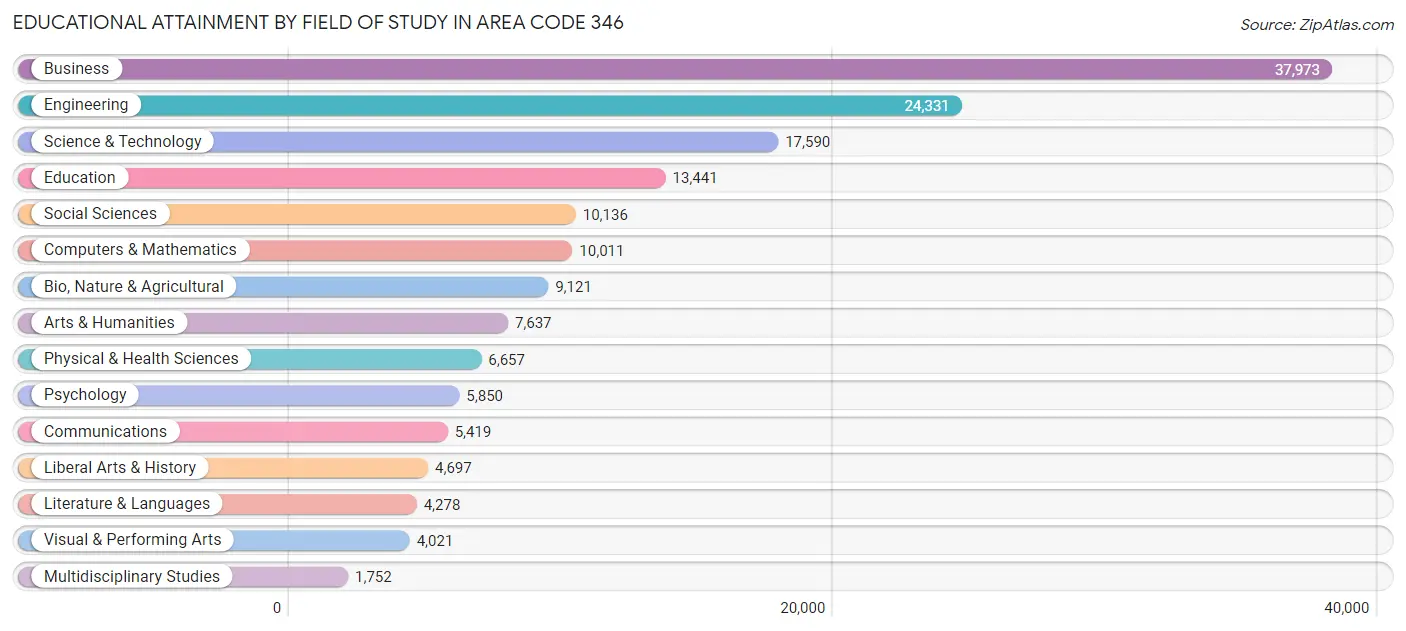
| Field of Study | # Graduates | % Graduates |
| Computers & Mathematics | 10,011 | 6.1% |
| Bio, Nature & Agricultural | 9,121 | 5.6% |
| Physical & Health Sciences | 6,657 | 4.1% |
| Psychology | 5,850 | 3.6% |
| Social Sciences | 10,136 | 6.2% |
| Engineering | 24,331 | 14.9% |
| Multidisciplinary Studies | 1,752 | 1.1% |
| Science & Technology | 17,590 | 10.8% |
| Business | 37,973 | 23.3% |
| Education | 13,441 | 8.3% |
| Literature & Languages | 4,278 | 2.6% |
| Liberal Arts & History | 4,697 | 2.9% |
| Visual & Performing Arts | 4,021 | 2.5% |
| Communications | 5,419 | 3.3% |
| Arts & Humanities | 7,637 | 4.7% |
| Total | 162,914 | 100.0% |
Transportation & Commute in Area Code 346
Vehicle Availability by Sex in Area Code 346
The most prevalent vehicle ownership categories in Area Code 346 are males with 2 vehicles (68,494, accounting for 41.7%) and females with 2 vehicles (56,012, making up 48.9%).
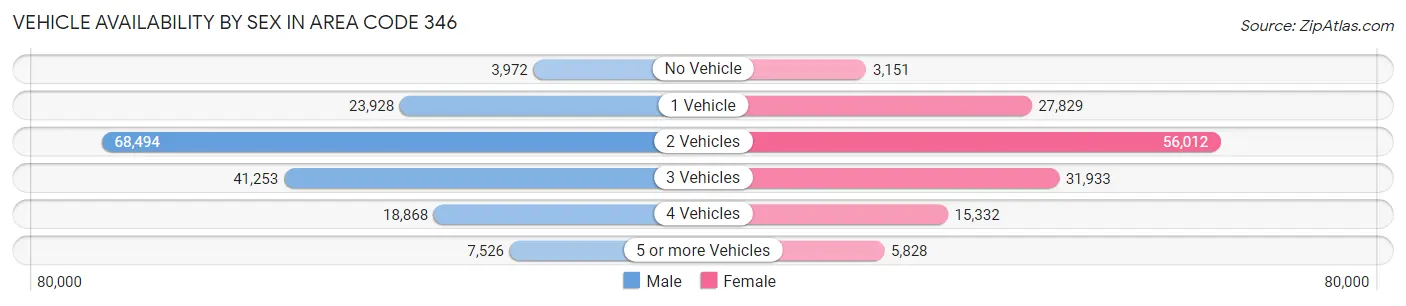
| Vehicles Available | Male | Female |
| No Vehicle | 3,972 (2.4%) | 3,151 (2.2%) |
| 1 Vehicle | 23,928 (14.6%) | 27,829 (19.9%) |
| 2 Vehicles | 68,494 (41.7%) | 56,012 (40.0%) |
| 3 Vehicles | 41,253 (25.2%) | 31,933 (22.8%) |
| 4 Vehicles | 18,868 (11.5%) | 15,332 (10.9%) |
| 5 or more Vehicles | 7,526 (4.6%) | 5,828 (4.2%) |
| Total | 164,041 (100.0%) | 140,085 (100.0%) |
Commute Time in Area Code 346
The most frequently occuring commute durations in Area Code 346 are 30 to 34 minutes (47,618 commuters, 17.6%), 45 to 59 minutes (39,030 commuters, 14.4%), and 20 to 24 minutes (35,190 commuters, 13.0%).
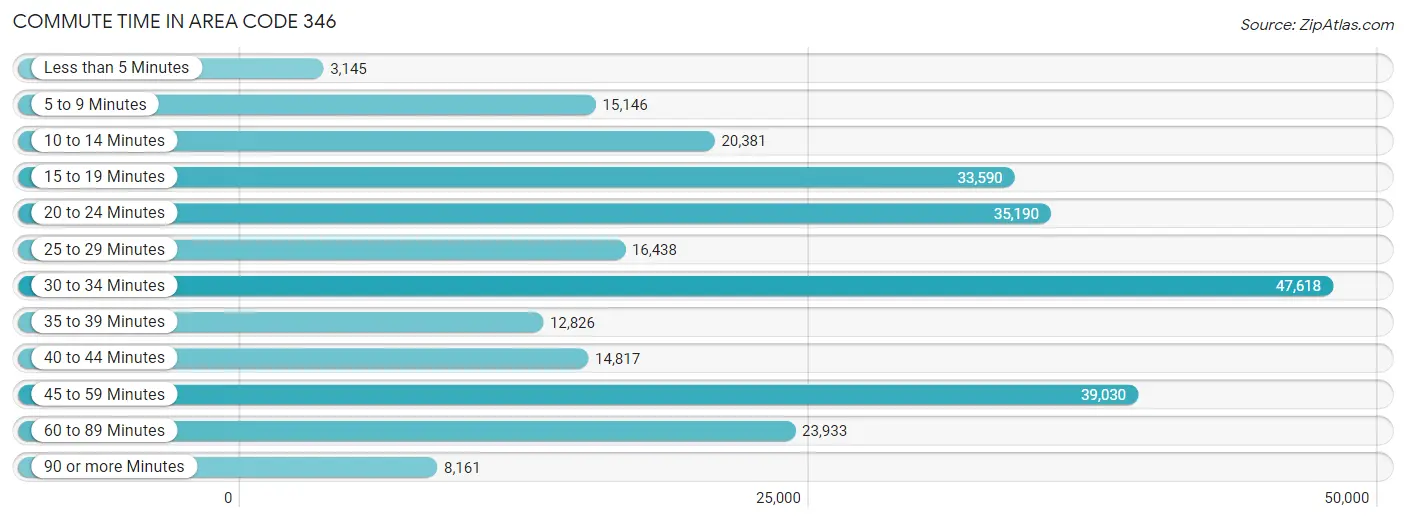
| Commute Time | # Commuters | % Commuters |
| Less than 5 Minutes | 3,145 | 1.2% |
| 5 to 9 Minutes | 15,146 | 5.6% |
| 10 to 14 Minutes | 20,381 | 7.5% |
| 15 to 19 Minutes | 33,590 | 12.4% |
| 20 to 24 Minutes | 35,190 | 13.0% |
| 25 to 29 Minutes | 16,438 | 6.1% |
| 30 to 34 Minutes | 47,618 | 17.6% |
| 35 to 39 Minutes | 12,826 | 4.8% |
| 40 to 44 Minutes | 14,817 | 5.5% |
| 45 to 59 Minutes | 39,030 | 14.4% |
| 60 to 89 Minutes | 23,933 | 8.9% |
| 90 or more Minutes | 8,161 | 3.0% |
Commute Time by Sex in Area Code 346
The most common commute times in Area Code 346 are 30 to 34 minutes (26,890 commuters, 18.3%) for males and 30 to 34 minutes (20,728 commuters, 16.8%) for females.
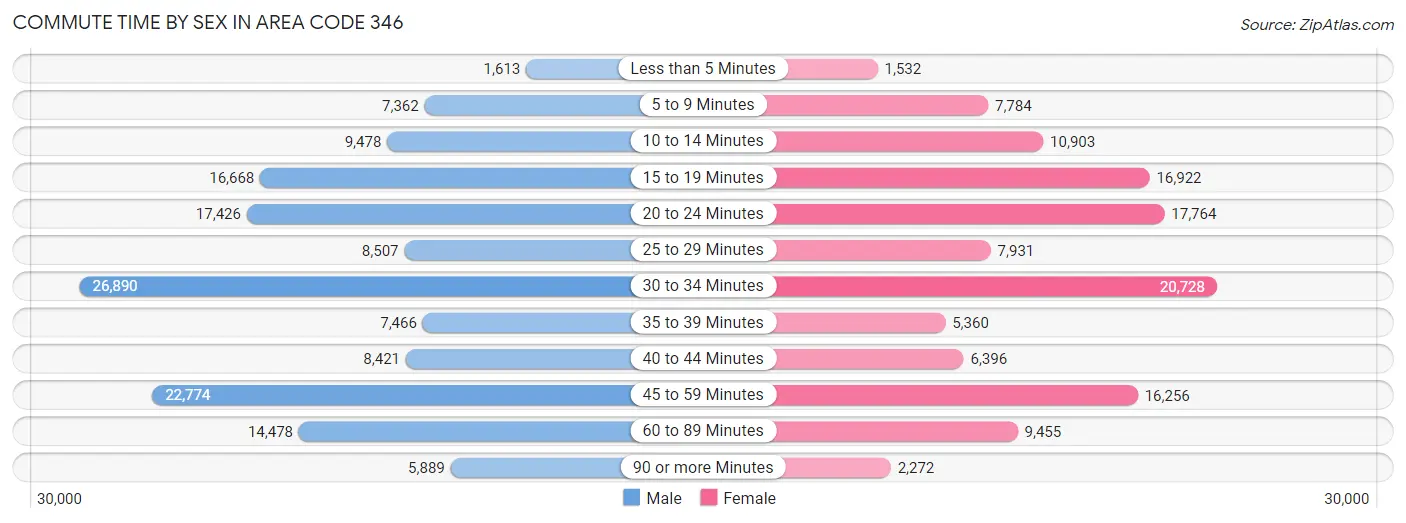
| Commute Time | Male | Female |
| Less than 5 Minutes | 1,613 (1.1%) | 1,532 (1.2%) |
| 5 to 9 Minutes | 7,362 (5.0%) | 7,784 (6.3%) |
| 10 to 14 Minutes | 9,478 (6.5%) | 10,903 (8.8%) |
| 15 to 19 Minutes | 16,668 (11.3%) | 16,922 (13.7%) |
| 20 to 24 Minutes | 17,426 (11.9%) | 17,764 (14.4%) |
| 25 to 29 Minutes | 8,507 (5.8%) | 7,931 (6.4%) |
| 30 to 34 Minutes | 26,890 (18.3%) | 20,728 (16.8%) |
| 35 to 39 Minutes | 7,466 (5.1%) | 5,360 (4.3%) |
| 40 to 44 Minutes | 8,421 (5.7%) | 6,396 (5.2%) |
| 45 to 59 Minutes | 22,774 (15.5%) | 16,256 (13.2%) |
| 60 to 89 Minutes | 14,478 (9.9%) | 9,455 (7.7%) |
| 90 or more Minutes | 5,889 (4.0%) | 2,272 (1.8%) |
Time of Departure to Work by Sex in Area Code 346
The most frequent times of departure to work in Area Code 346 are 7:00 AM to 7:29 AM (17,898, 12.2%) for males and 7:00 AM to 7:29 AM (18,216, 14.8%) for females.
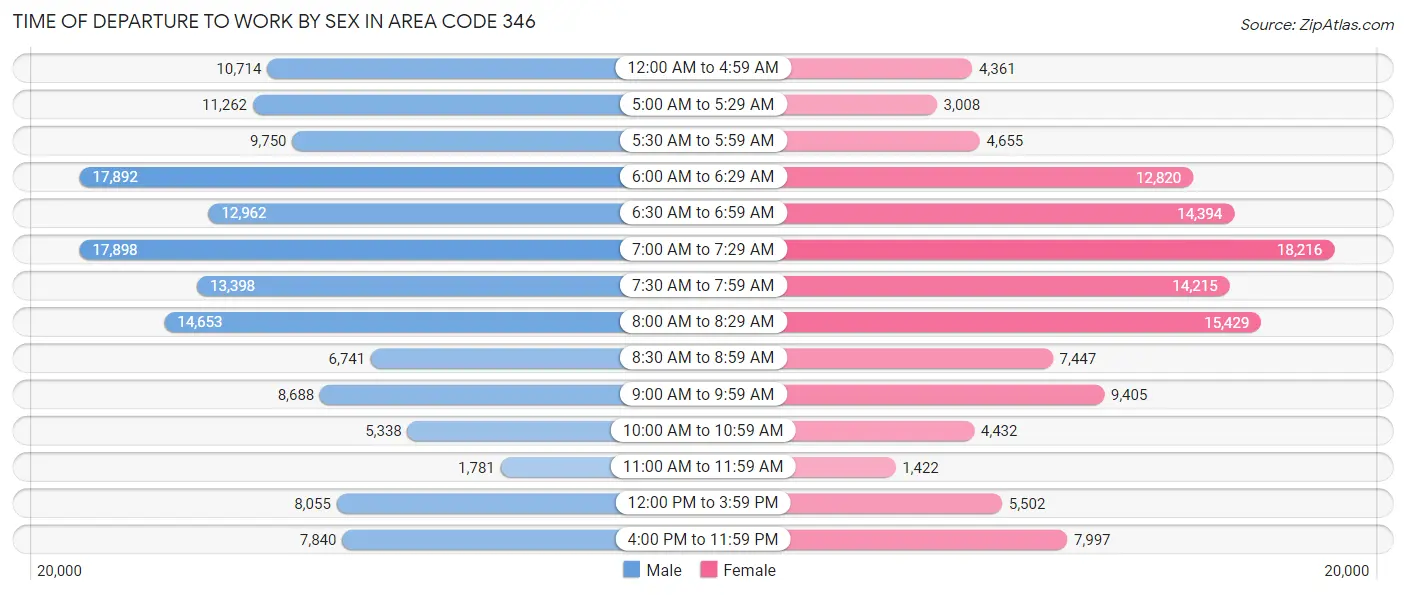
| Time of Departure | Male | Female |
| 12:00 AM to 4:59 AM | 10,714 (7.3%) | 4,361 (3.5%) |
| 5:00 AM to 5:29 AM | 11,262 (7.7%) | 3,008 (2.4%) |
| 5:30 AM to 5:59 AM | 9,750 (6.6%) | 4,655 (3.8%) |
| 6:00 AM to 6:29 AM | 17,892 (12.2%) | 12,820 (10.4%) |
| 6:30 AM to 6:59 AM | 12,962 (8.8%) | 14,394 (11.7%) |
| 7:00 AM to 7:29 AM | 17,898 (12.2%) | 18,216 (14.8%) |
| 7:30 AM to 7:59 AM | 13,398 (9.1%) | 14,215 (11.5%) |
| 8:00 AM to 8:29 AM | 14,653 (10.0%) | 15,429 (12.5%) |
| 8:30 AM to 8:59 AM | 6,741 (4.6%) | 7,447 (6.0%) |
| 9:00 AM to 9:59 AM | 8,688 (5.9%) | 9,405 (7.6%) |
| 10:00 AM to 10:59 AM | 5,338 (3.6%) | 4,432 (3.6%) |
| 11:00 AM to 11:59 AM | 1,781 (1.2%) | 1,422 (1.1%) |
| 12:00 PM to 3:59 PM | 8,055 (5.5%) | 5,502 (4.5%) |
| 4:00 PM to 11:59 PM | 7,840 (5.3%) | 7,997 (6.5%) |
| Total | 146,972 (100.0%) | 123,303 (100.0%) |
Housing Occupancy in Area Code 346
Occupancy by Ownership in Area Code 346
Of the total 210,107 dwellings in Area Code 346, owner-occupied units account for 142,669 (67.9%), while renter-occupied units make up 67,438 (32.1%).
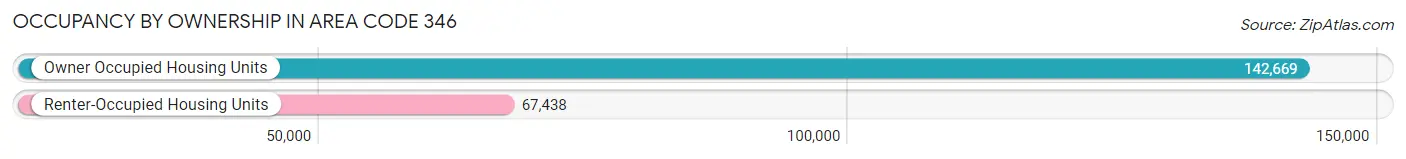
| Occupancy | # Housing Units | % Housing Units |
| Owner Occupied Housing Units | 142,669 | 67.9% |
| Renter-Occupied Housing Units | 67,438 | 32.1% |
| Total Occupied Housing Units | 210,107 | 100.0% |
Occupancy by Household Size in Area Code 346
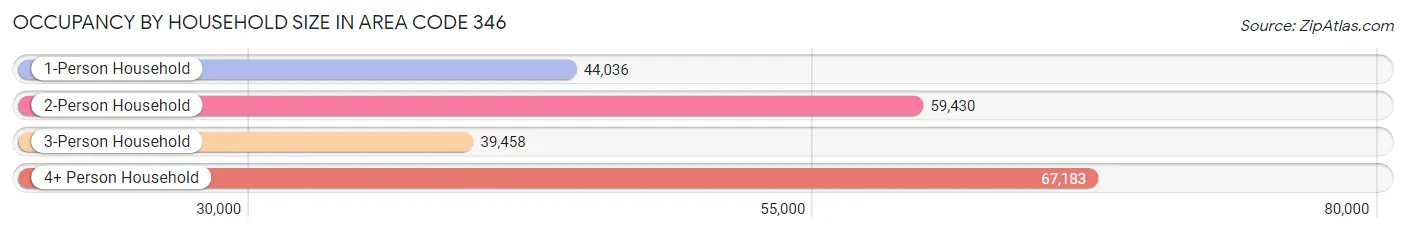
| Household Size | # Housing Units | % Housing Units |
| 1-Person Household | 44,036 | 21.0% |
| 2-Person Household | 59,430 | 28.3% |
| 3-Person Household | 39,458 | 18.8% |
| 4+ Person Household | 67,183 | 32.0% |
| Total Housing Units | 210,107 | 100.0% |
Occupancy by Ownership by Household Size in Area Code 346
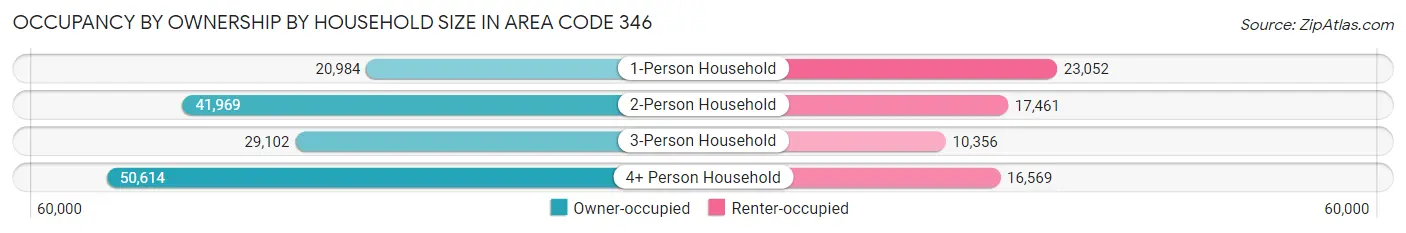
| Household Size | Owner-occupied | Renter-occupied |
| 1-Person Household | 20,984 (47.6%) | 23,052 (52.3%) |
| 2-Person Household | 41,969 (70.6%) | 17,461 (29.4%) |
| 3-Person Household | 29,102 (73.8%) | 10,356 (26.3%) |
| 4+ Person Household | 50,614 (75.3%) | 16,569 (24.7%) |
| Total Housing Units | 142,669 (67.9%) | 67,438 (32.1%) |
Occupancy by Educational Attainment in Area Code 346
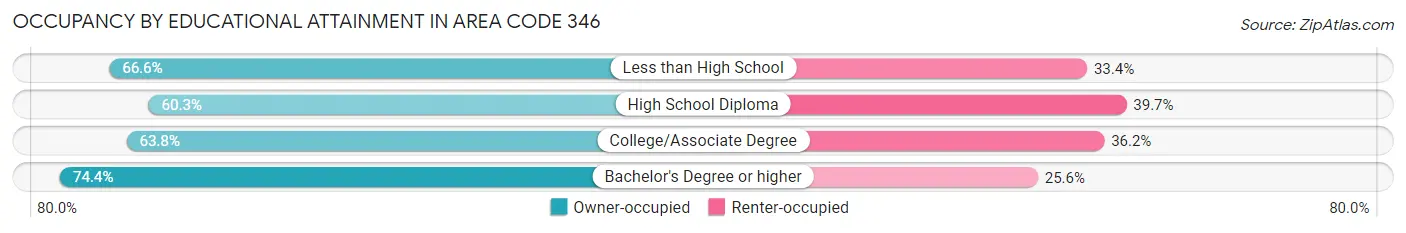
| Household Size | Owner-occupied | Renter-occupied |
| Less than High School | 13,115 (66.6%) | 6,588 (33.4%) |
| High School Diploma | 22,021 (60.3%) | 14,483 (39.7%) |
| College/Associate Degree | 41,942 (63.8%) | 23,762 (36.2%) |
| Bachelor's Degree or higher | 65,591 (74.4%) | 22,605 (25.6%) |
Occupancy by Age of Householder in Area Code 346
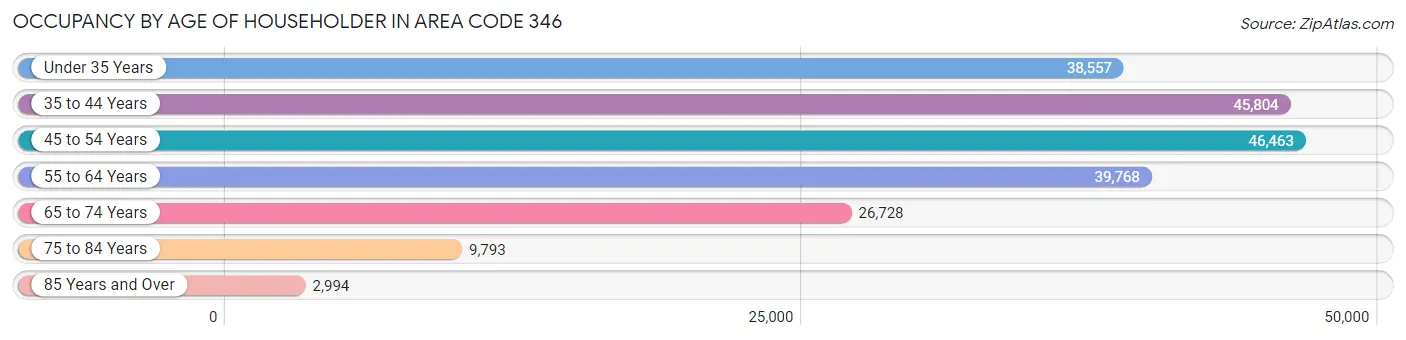
| Age Bracket | # Households | % Households |
| Under 35 Years | 38,557 | 18.3% |
| 35 to 44 Years | 45,804 | 21.8% |
| 45 to 54 Years | 46,463 | 22.1% |
| 55 to 64 Years | 39,768 | 18.9% |
| 65 to 74 Years | 26,728 | 12.7% |
| 75 to 84 Years | 9,793 | 4.7% |
| 85 Years and Over | 2,994 | 1.4% |
| Total | 210,107 | 100.0% |
Housing Finances in Area Code 346
Median Income by Occupancy in Area Code 346
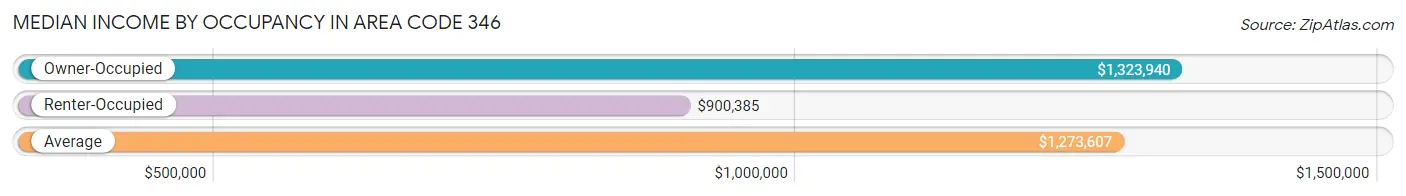
| Occupancy Type | # Households | Median Income |
| Owner-Occupied | 142,669 (67.9%) | $1,323,940 |
| Renter-Occupied | 67,438 (32.1%) | $900,385 |
| Average | 210,107 (100.0%) | $1,273,607 |
Occupancy by Householder Income Bracket in Area Code 346
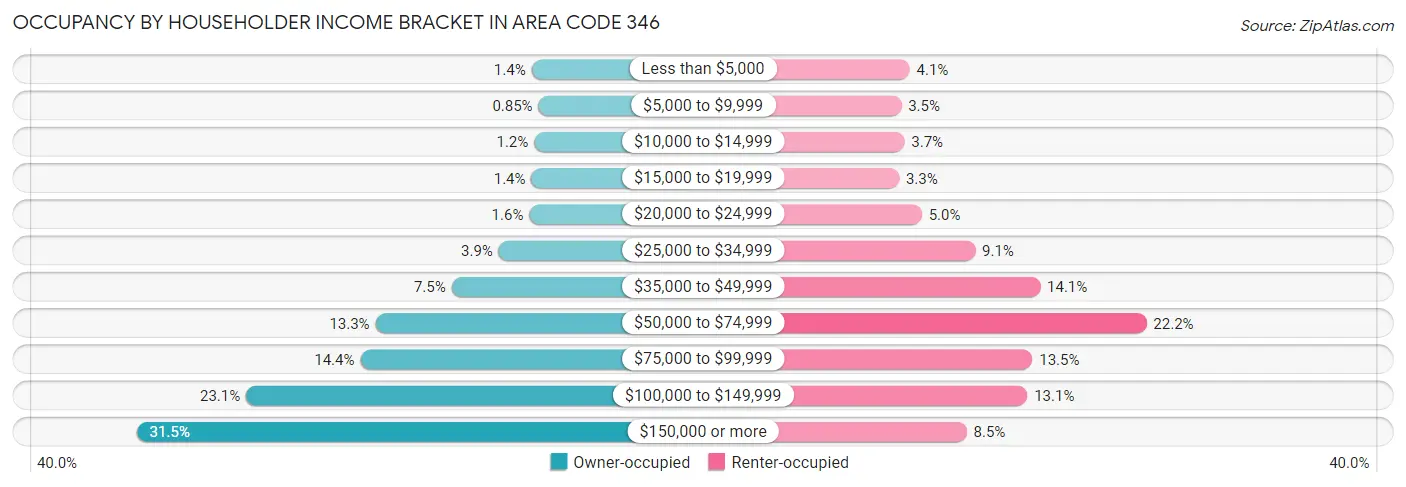
| Income Bracket | Owner-occupied | Renter-occupied |
| Less than $5,000 | 1,973 (1.4%) | 2,779 (4.1%) |
| $5,000 to $9,999 | 1,216 (0.9%) | 2,346 (3.5%) |
| $10,000 to $14,999 | 1,689 (1.2%) | 2,508 (3.7%) |
| $15,000 to $19,999 | 1,983 (1.4%) | 2,229 (3.3%) |
| $20,000 to $24,999 | 2,216 (1.5%) | 3,399 (5.0%) |
| $25,000 to $34,999 | 5,540 (3.9%) | 6,145 (9.1%) |
| $35,000 to $49,999 | 10,651 (7.5%) | 9,481 (14.1%) |
| $50,000 to $74,999 | 18,926 (13.3%) | 14,944 (22.2%) |
| $75,000 to $99,999 | 20,576 (14.4%) | 9,086 (13.5%) |
| $100,000 to $149,999 | 32,994 (23.1%) | 8,818 (13.1%) |
| $150,000 or more | 44,905 (31.5%) | 5,703 (8.5%) |
| Total | 142,669 (100.0%) | 67,438 (100.0%) |
Monthly Housing Cost Tiers in Area Code 346
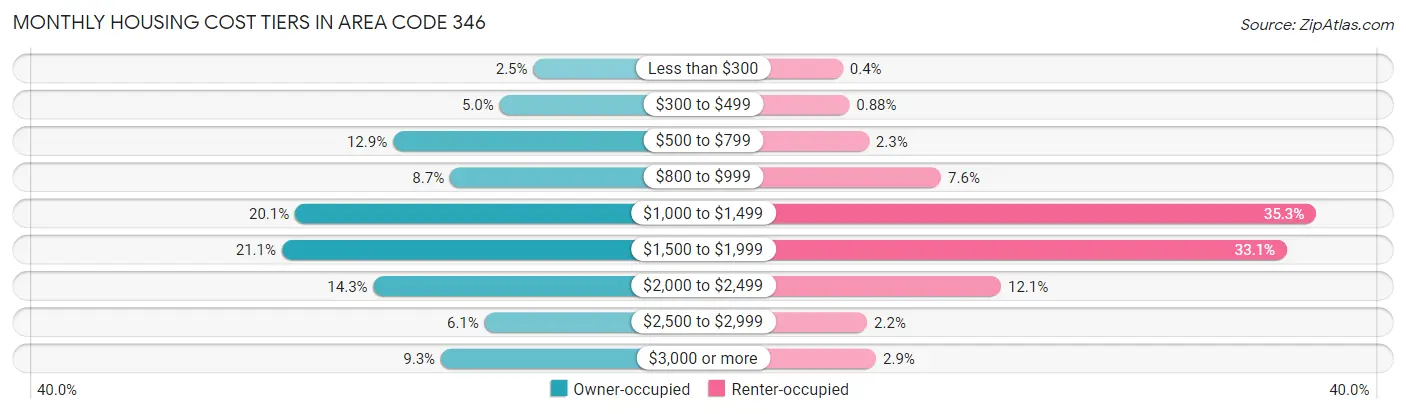
| Monthly Cost | Owner-occupied | Renter-occupied |
| Less than $300 | 3,610 (2.5%) | 272 (0.4%) |
| $300 to $499 | 7,165 (5.0%) | 592 (0.9%) |
| $500 to $799 | 18,366 (12.9%) | 1,565 (2.3%) |
| $800 to $999 | 12,373 (8.7%) | 5,153 (7.6%) |
| $1,000 to $1,499 | 28,644 (20.1%) | 23,775 (35.2%) |
| $1,500 to $1,999 | 30,045 (21.1%) | 22,319 (33.1%) |
| $2,000 to $2,499 | 20,410 (14.3%) | 8,124 (12.0%) |
| $2,500 to $2,999 | 8,732 (6.1%) | 1,478 (2.2%) |
| $3,000 or more | 13,324 (9.3%) | 1,925 (2.9%) |
| Total | 142,669 (100.0%) | 67,438 (100.0%) |
Physical Housing Characteristics in Area Code 346
Housing Structures in Area Code 346
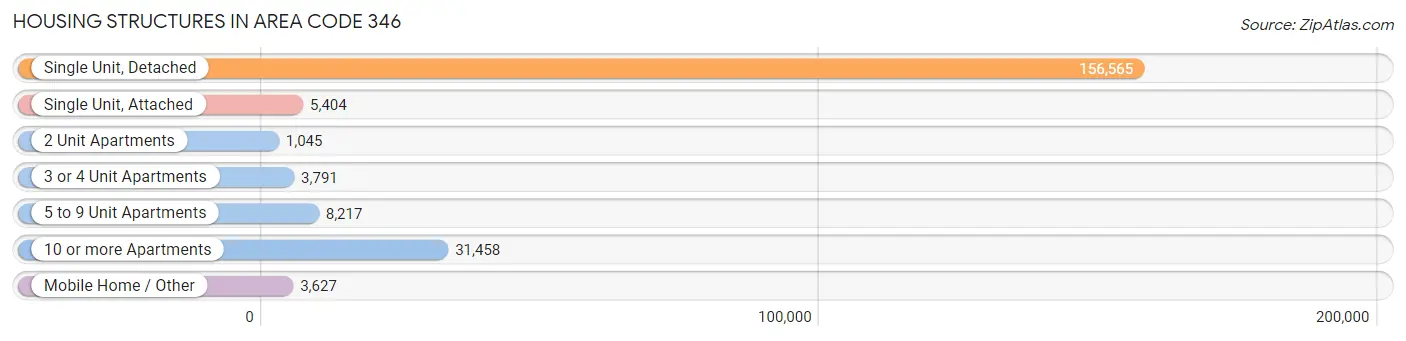
| Structure Type | # Housing Units | % Housing Units |
| Single Unit, Detached | 156,565 | 74.5% |
| Single Unit, Attached | 5,404 | 2.6% |
| 2 Unit Apartments | 1,045 | 0.5% |
| 3 or 4 Unit Apartments | 3,791 | 1.8% |
| 5 to 9 Unit Apartments | 8,217 | 3.9% |
| 10 or more Apartments | 31,458 | 15.0% |
| Mobile Home / Other | 3,627 | 1.7% |
| Total | 210,107 | 100.0% |
Housing Structures by Occupancy in Area Code 346
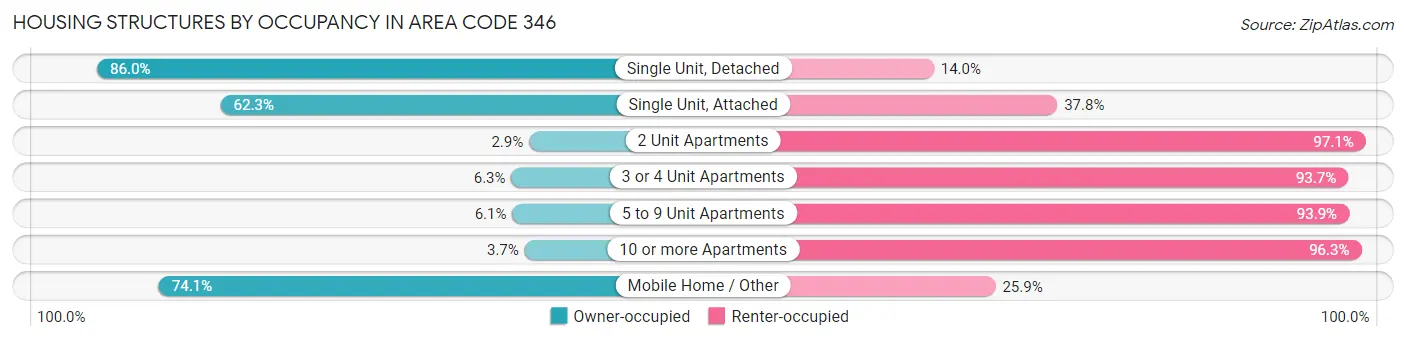
| Structure Type | Owner-occupied | Renter-occupied |
| Single Unit, Detached | 134,674 (86.0%) | 21,891 (14.0%) |
| Single Unit, Attached | 3,364 (62.3%) | 2,040 (37.8%) |
| 2 Unit Apartments | 30 (2.9%) | 1,015 (97.1%) |
| 3 or 4 Unit Apartments | 238 (6.3%) | 3,553 (93.7%) |
| 5 to 9 Unit Apartments | 501 (6.1%) | 7,716 (93.9%) |
| 10 or more Apartments | 1,173 (3.7%) | 30,285 (96.3%) |
| Mobile Home / Other | 2,689 (74.1%) | 938 (25.9%) |
| Total | 142,669 (67.9%) | 67,438 (32.1%) |
Housing Structures by Number of Rooms in Area Code 346
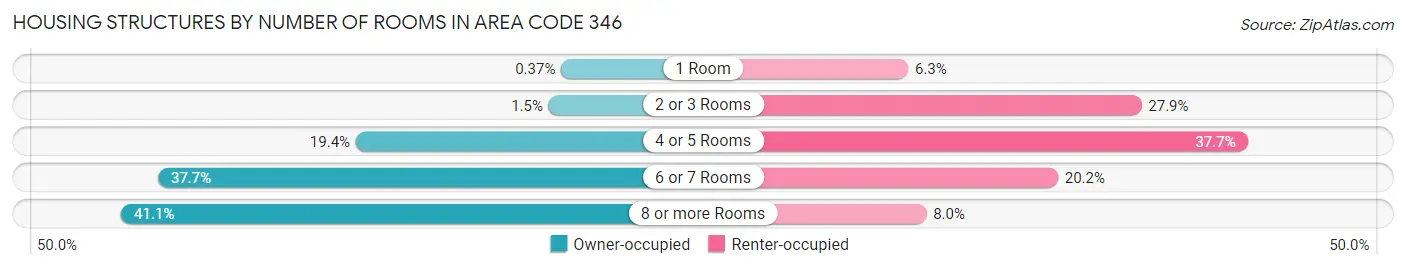
| Number of Rooms | Owner-occupied | Renter-occupied |
| 1 Room | 521 (0.4%) | 4,249 (6.3%) |
| 2 or 3 Rooms | 2,162 (1.5%) | 18,802 (27.9%) |
| 4 or 5 Rooms | 27,626 (19.4%) | 25,419 (37.7%) |
| 6 or 7 Rooms | 53,757 (37.7%) | 13,586 (20.2%) |
| 8 or more Rooms | 58,603 (41.1%) | 5,382 (8.0%) |
| Total | 142,669 (100.0%) | 67,438 (100.0%) |
Housing Structure by Heating Type in Area Code 346
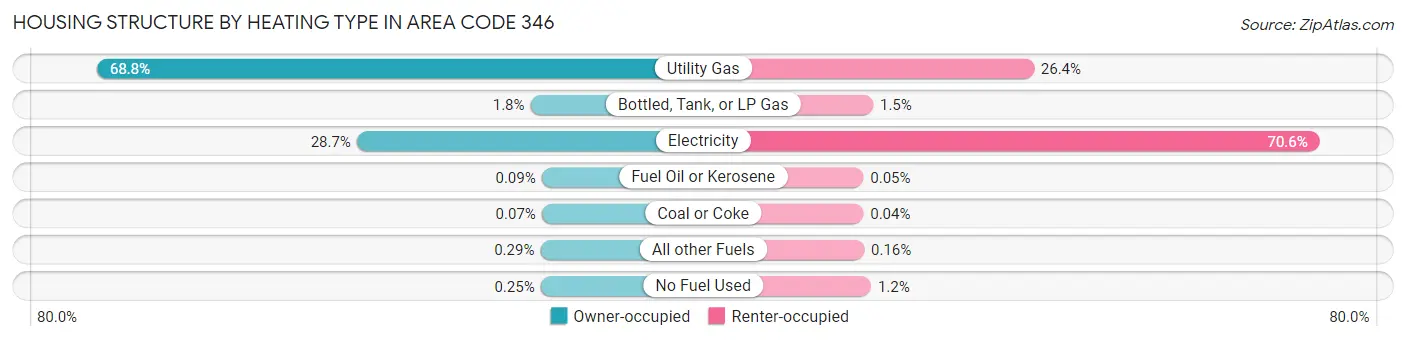
| Heating Type | Owner-occupied | Renter-occupied |
| Utility Gas | 98,213 (68.8%) | 17,808 (26.4%) |
| Bottled, Tank, or LP Gas | 2,582 (1.8%) | 1,039 (1.5%) |
| Electricity | 40,887 (28.7%) | 47,590 (70.6%) |
| Fuel Oil or Kerosene | 130 (0.1%) | 34 (0.1%) |
| Coal or Coke | 93 (0.1%) | 30 (0.0%) |
| All other Fuels | 407 (0.3%) | 110 (0.2%) |
| No Fuel Used | 357 (0.3%) | 827 (1.2%) |
| Total | 142,669 (100.0%) | 67,438 (100.0%) |
Household Vehicle Usage in Area Code 346
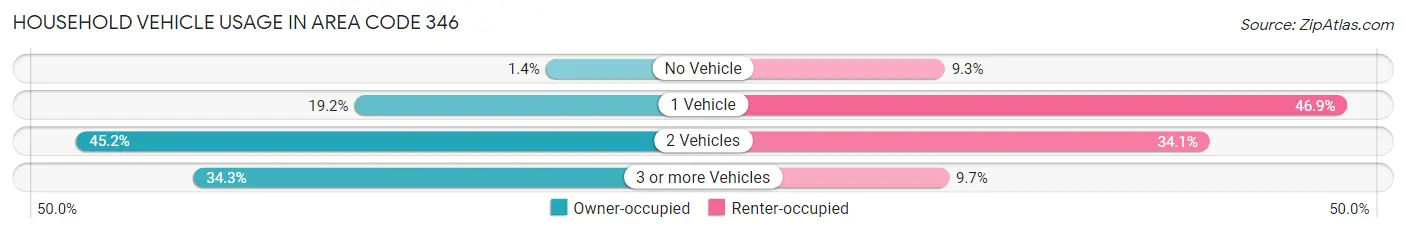
| Vehicles per Household | Owner-occupied | Renter-occupied |
| No Vehicle | 1,948 (1.4%) | 6,286 (9.3%) |
| 1 Vehicle | 27,427 (19.2%) | 31,629 (46.9%) |
| 2 Vehicles | 64,429 (45.2%) | 22,967 (34.1%) |
| 3 or more Vehicles | 48,865 (34.3%) | 6,556 (9.7%) |
| Total | 142,669 (100.0%) | 67,438 (100.0%) |
Real Estate & Mortgages in Area Code 346
Real Estate and Mortgage Overview in Area Code 346
| Characteristic | Without Mortgage | With Mortgage |
| Housing Units | 54,866 | 87,803 |
| Median Property Value | $3,080,700 | $3,275,600 |
| Median Household Income | $1,013,737 | $29,910 |
| Monthly Housing Costs | $10,259 | $12,685 |
| Real Estate Taxes | $52,292 | $3,433 |
Property Value by Mortgage Status in Area Code 346
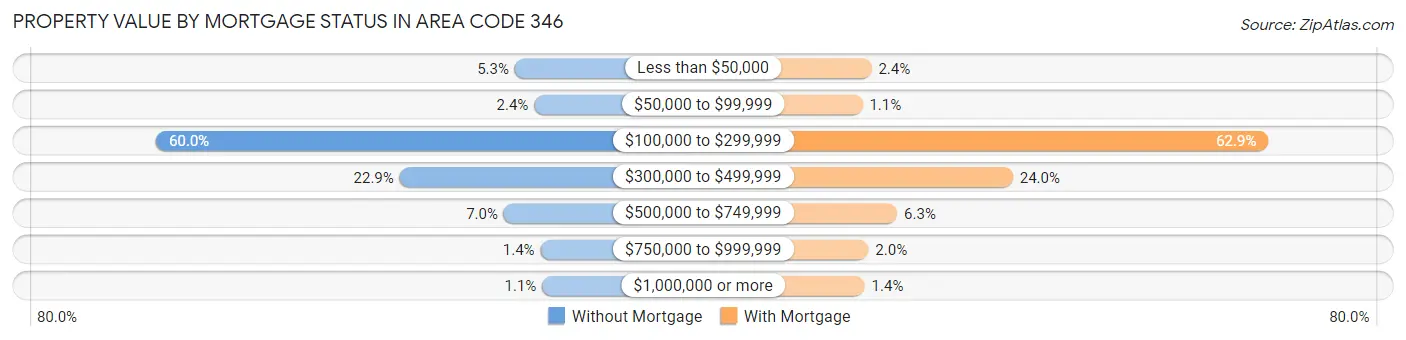
| Property Value | Without Mortgage | With Mortgage |
| Less than $50,000 | 2,909 (5.3%) | 2,127 (2.4%) |
| $50,000 to $99,999 | 1,288 (2.4%) | 921 (1.1%) |
| $100,000 to $299,999 | 32,909 (60.0%) | 55,211 (62.9%) |
| $300,000 to $499,999 | 12,544 (22.9%) | 21,036 (24.0%) |
| $500,000 to $749,999 | 3,827 (7.0%) | 5,569 (6.3%) |
| $750,000 to $999,999 | 768 (1.4%) | 1,718 (2.0%) |
| $1,000,000 or more | 621 (1.1%) | 1,221 (1.4%) |
| Total | 54,866 (100.0%) | 87,803 (100.0%) |
Household Income by Mortgage Status in Area Code 346
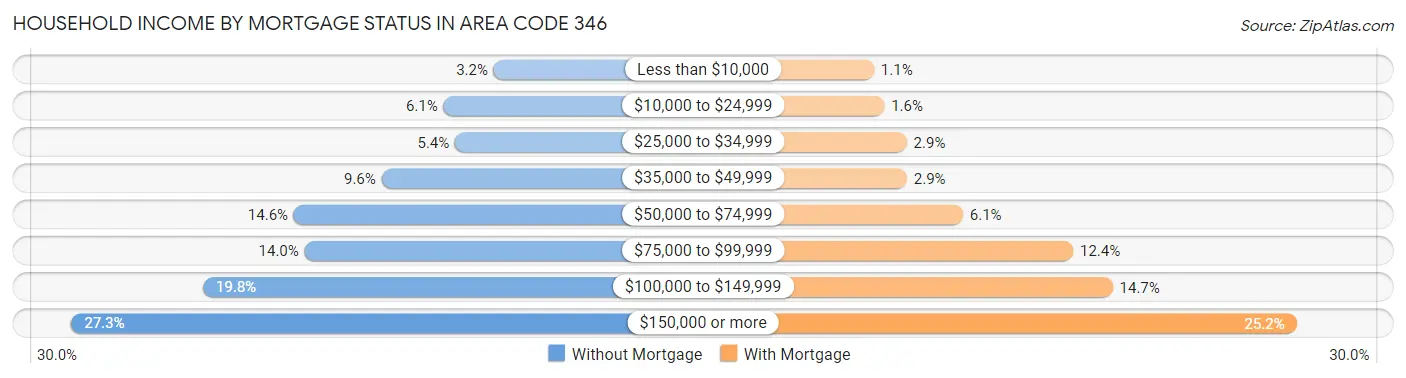
| Household Income | Without Mortgage | With Mortgage |
| Less than $10,000 | 1,748 (3.2%) | 925 (1.1%) |
| $10,000 to $24,999 | 3,326 (6.1%) | 1,441 (1.6%) |
| $25,000 to $34,999 | 2,963 (5.4%) | 2,562 (2.9%) |
| $35,000 to $49,999 | 5,267 (9.6%) | 2,577 (2.9%) |
| $50,000 to $74,999 | 8,016 (14.6%) | 5,384 (6.1%) |
| $75,000 to $99,999 | 7,681 (14.0%) | 10,910 (12.4%) |
| $100,000 to $149,999 | 10,870 (19.8%) | 12,895 (14.7%) |
| $150,000 or more | 14,995 (27.3%) | 22,124 (25.2%) |
| Total | 54,866 (100.0%) | 87,803 (100.0%) |
Property Value to Household Income Ratio in Area Code 346
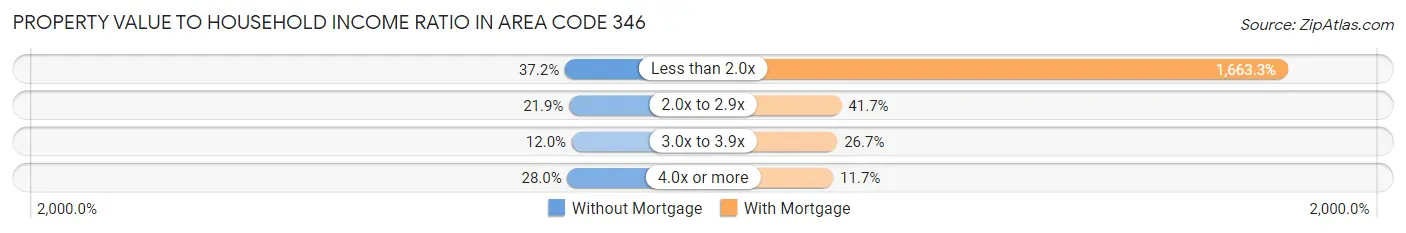
| Value-to-Income Ratio | Without Mortgage | With Mortgage |
| Less than 2.0x | 20,406 (37.2%) | 1,460,466 (1,663.3%) |
| 2.0x to 2.9x | 12,015 (21.9%) | 36,650 (41.7%) |
| 3.0x to 3.9x | 6,586 (12.0%) | 23,411 (26.7%) |
| 4.0x or more | 15,362 (28.0%) | 10,296 (11.7%) |
| Total | 54,866 (100.0%) | 87,803 (100.0%) |
Real Estate Taxes by Mortgage Status in Area Code 346
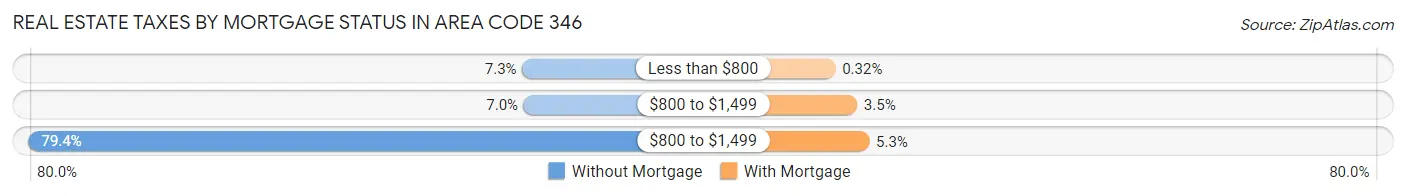
| Property Taxes | Without Mortgage | With Mortgage |
| Less than $800 | 3,986 (7.3%) | 285 (0.3%) |
| $800 to $1,499 | 3,860 (7.0%) | 3,067 (3.5%) |
| $800 to $1,499 | 43,588 (79.4%) | 4,628 (5.3%) |
| Total | 54,866 (100.0%) | 87,803 (100.0%) |
Health & Disability in Area Code 346
Health Insurance Coverage by Age in Area Code 346
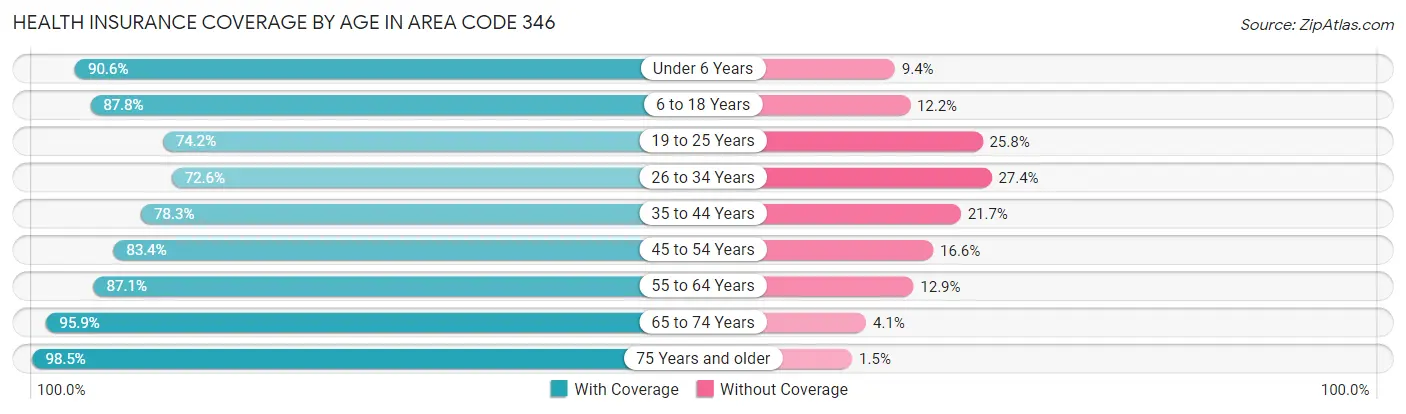
| Age Bracket | With Coverage | Without Coverage |
| Under 6 Years | 42,826 (90.6%) | 4,454 (9.4%) |
| 6 to 18 Years | 109,784 (87.8%) | 15,307 (12.2%) |
| 19 to 25 Years | 42,524 (74.2%) | 14,764 (25.8%) |
| 26 to 34 Years | 55,559 (72.6%) | 21,013 (27.4%) |
| 35 to 44 Years | 68,895 (78.3%) | 19,104 (21.7%) |
| 45 to 54 Years | 72,194 (83.4%) | 14,327 (16.6%) |
| 55 to 64 Years | 62,074 (87.1%) | 9,174 (12.9%) |
| 65 to 74 Years | 46,965 (95.9%) | 1,993 (4.1%) |
| 75 Years and older | 23,534 (98.5%) | 351 (1.5%) |
| Total | 524,355 (83.9%) | 100,487 (16.1%) |
Health Insurance Coverage by Citizenship Status in Area Code 346
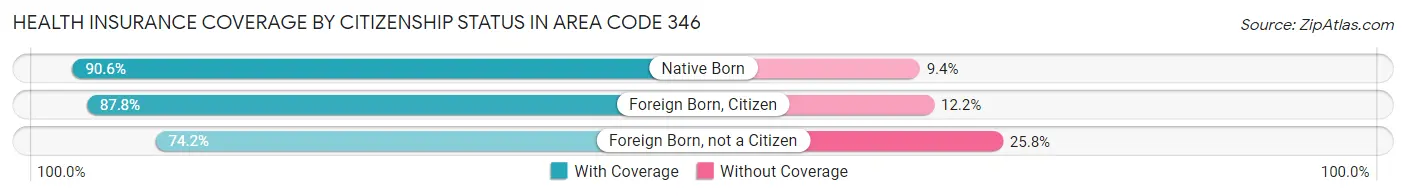
| Citizenship Status | With Coverage | Without Coverage |
| Native Born | 42,826 (90.6%) | 4,454 (9.4%) |
| Foreign Born, Citizen | 109,784 (87.8%) | 15,307 (12.2%) |
| Foreign Born, not a Citizen | 42,524 (74.2%) | 14,764 (25.8%) |
Health Insurance Coverage by Household Income in Area Code 346
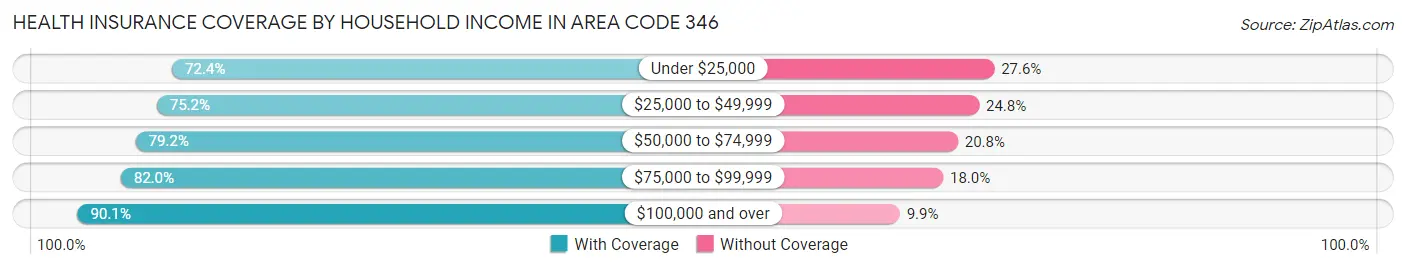
| Household Income | With Coverage | Without Coverage |
| Under $25,000 | 35,651 (72.4%) | 13,601 (27.6%) |
| $25,000 to $49,999 | 62,152 (75.2%) | 20,479 (24.8%) |
| $50,000 to $74,999 | 71,664 (79.2%) | 18,809 (20.8%) |
| $75,000 to $99,999 | 74,378 (82.0%) | 16,365 (18.0%) |
| $100,000 and over | 280,042 (90.1%) | 30,825 (9.9%) |
Public vs Private Health Insurance Coverage by Age in Area Code 346
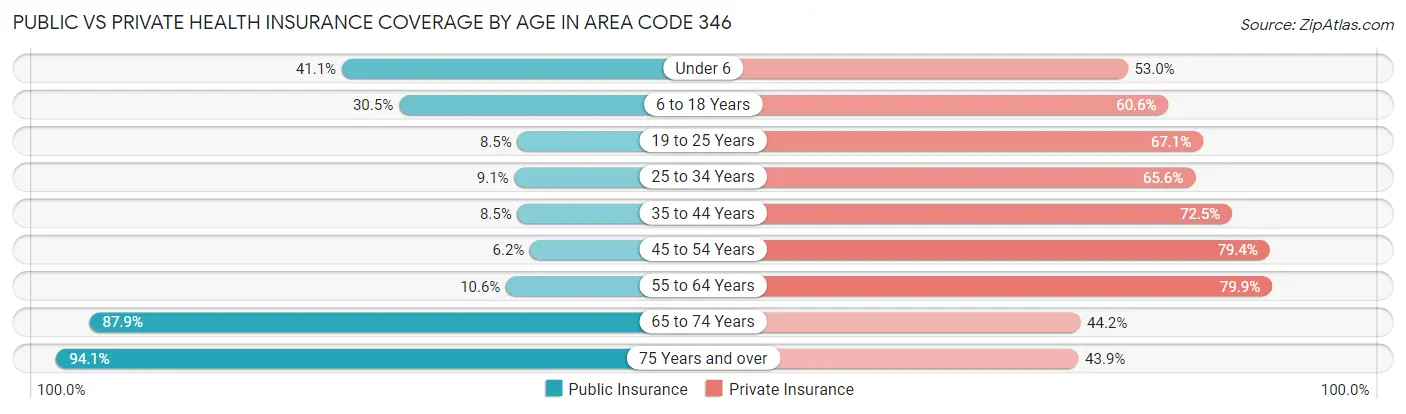
| Age Bracket | Public Insurance | Private Insurance |
| Under 6 | 19,430 (41.1%) | 25,068 (53.0%) |
| 6 to 18 Years | 38,165 (30.5%) | 75,824 (60.6%) |
| 19 to 25 Years | 4,872 (8.5%) | 38,409 (67.0%) |
| 25 to 34 Years | 6,952 (9.1%) | 50,205 (65.6%) |
| 35 to 44 Years | 7,476 (8.5%) | 63,760 (72.5%) |
| 45 to 54 Years | 5,334 (6.2%) | 68,713 (79.4%) |
| 55 to 64 Years | 7,558 (10.6%) | 56,890 (79.8%) |
| 65 to 74 Years | 43,052 (87.9%) | 21,652 (44.2%) |
| 75 Years and over | 22,475 (94.1%) | 10,478 (43.9%) |
| Total | 155,314 (24.9%) | 410,999 (65.8%) |
Disability Status by Sex by Age in Area Code 346
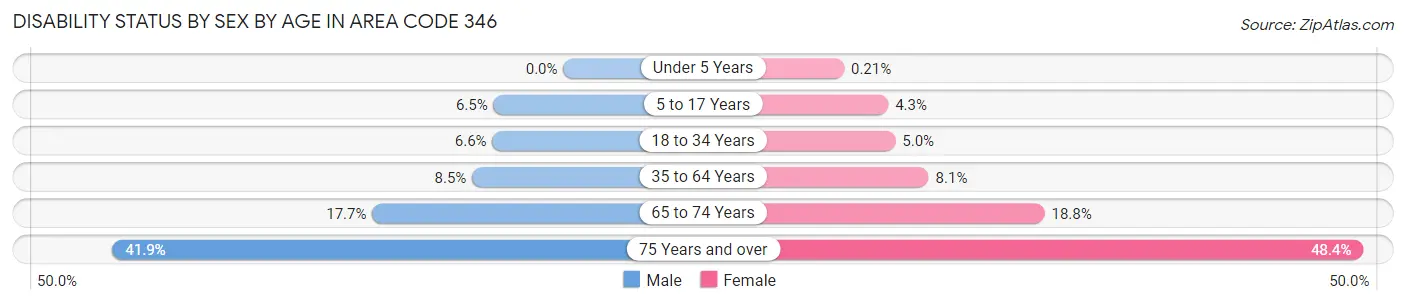
| Age Bracket | Male | Female |
| Under 5 Years | 0 (0.0%) | 39 (0.2%) |
| 5 to 17 Years | 4,160 (6.5%) | 2,628 (4.3%) |
| 18 to 34 Years | 4,746 (6.6%) | 3,515 (5.0%) |
| 35 to 64 Years | 10,027 (8.5%) | 10,263 (8.1%) |
| 65 to 74 Years | 4,197 (17.7%) | 4,758 (18.8%) |
| 75 Years and over | 4,202 (41.8%) | 6,699 (48.4%) |
Disability Class by Sex by Age in Area Code 346
Disability Class: Hearing Difficulty
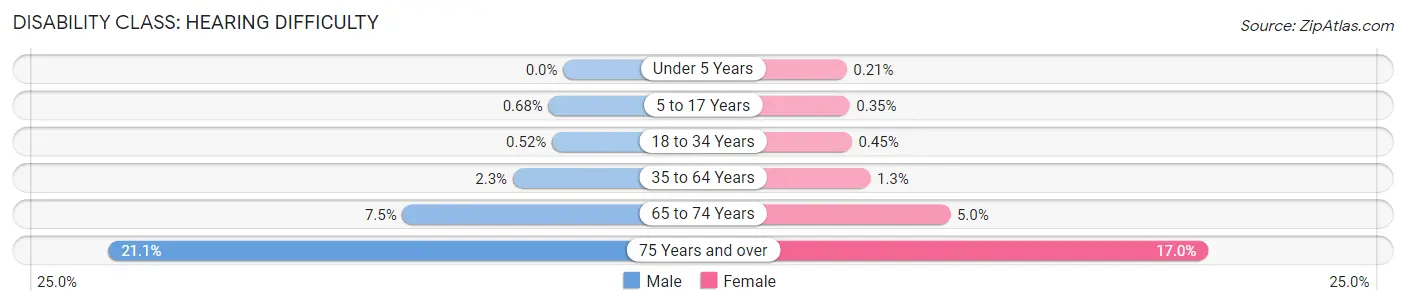
| Age Bracket | Male | Female |
| Under 5 Years | 0 (0.0%) | 39 (0.2%) |
| 5 to 17 Years | 438 (0.7%) | 211 (0.4%) |
| 18 to 34 Years | 372 (0.5%) | 318 (0.4%) |
| 35 to 64 Years | 2,770 (2.3%) | 1,671 (1.3%) |
| 65 to 74 Years | 1,765 (7.5%) | 1,268 (5.0%) |
| 75 Years and over | 2,120 (21.1%) | 2,354 (17.0%) |
Disability Class: Vision Difficulty
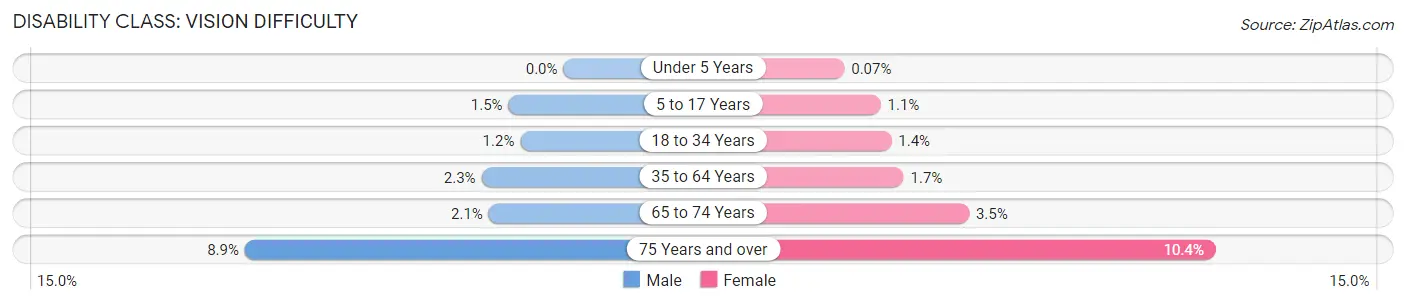
| Age Bracket | Male | Female |
| Under 5 Years | 0 (0.0%) | 14 (0.1%) |
| 5 to 17 Years | 982 (1.5%) | 660 (1.1%) |
| 18 to 34 Years | 865 (1.2%) | 974 (1.4%) |
| 35 to 64 Years | 2,702 (2.3%) | 2,191 (1.7%) |
| 65 to 74 Years | 492 (2.1%) | 894 (3.5%) |
| 75 Years and over | 891 (8.9%) | 1,441 (10.4%) |
Disability Class: Cognitive Difficulty
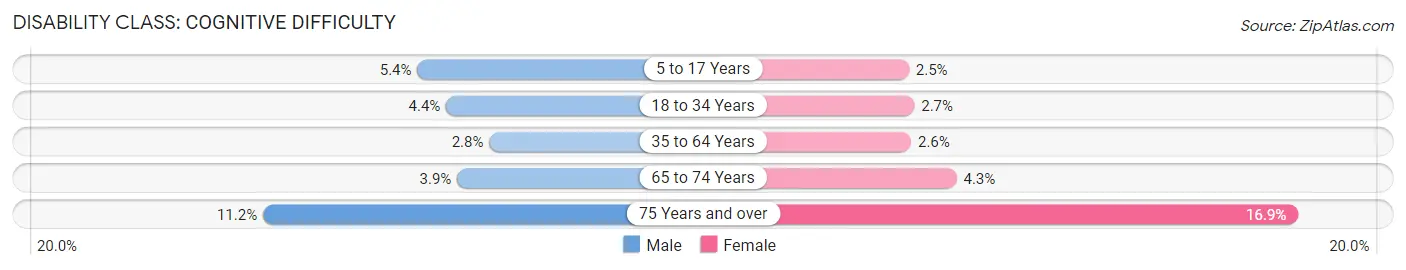
| Age Bracket | Male | Female |
| 5 to 17 Years | 3,482 (5.4%) | 1,520 (2.5%) |
| 18 to 34 Years | 3,140 (4.3%) | 1,903 (2.7%) |
| 35 to 64 Years | 3,260 (2.8%) | 3,277 (2.6%) |
| 65 to 74 Years | 932 (3.9%) | 1,078 (4.3%) |
| 75 Years and over | 1,119 (11.2%) | 2,346 (16.9%) |
Disability Class: Ambulatory Difficulty
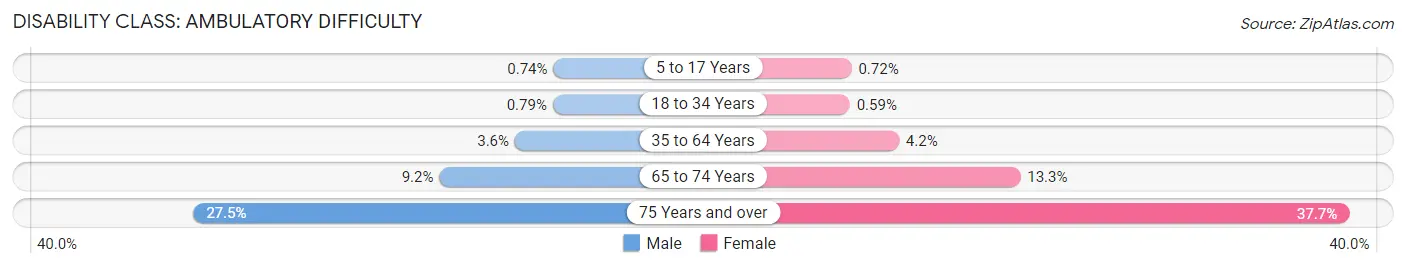
| Age Bracket | Male | Female |
| 5 to 17 Years | 478 (0.7%) | 439 (0.7%) |
| 18 to 34 Years | 567 (0.8%) | 417 (0.6%) |
| 35 to 64 Years | 4,267 (3.6%) | 5,397 (4.2%) |
| 65 to 74 Years | 2,180 (9.2%) | 3,350 (13.3%) |
| 75 Years and over | 2,759 (27.5%) | 5,214 (37.7%) |
Disability Class: Self-Care Difficulty
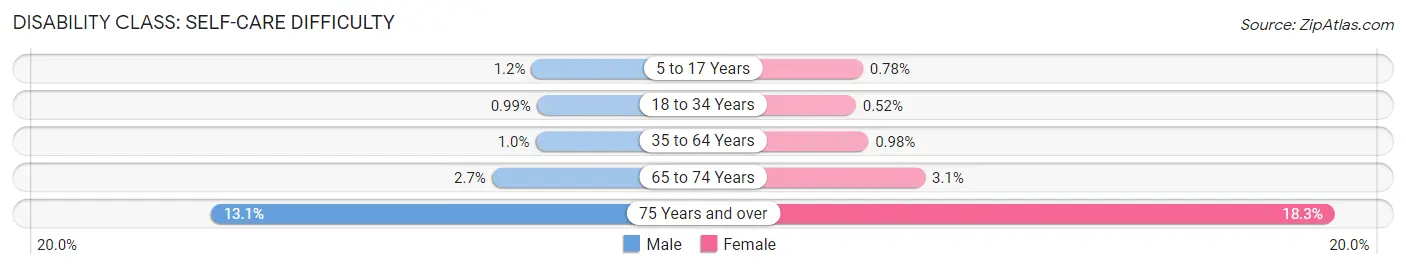
| Age Bracket | Male | Female |
| 5 to 17 Years | 763 (1.2%) | 474 (0.8%) |
| 18 to 34 Years | 711 (1.0%) | 366 (0.5%) |
| 35 to 64 Years | 1,238 (1.0%) | 1,249 (1.0%) |
| 65 to 74 Years | 629 (2.7%) | 782 (3.1%) |
| 75 Years and over | 1,314 (13.1%) | 2,532 (18.3%) |
Technology Access in Area Code 346
Computing Device Access in Area Code 346
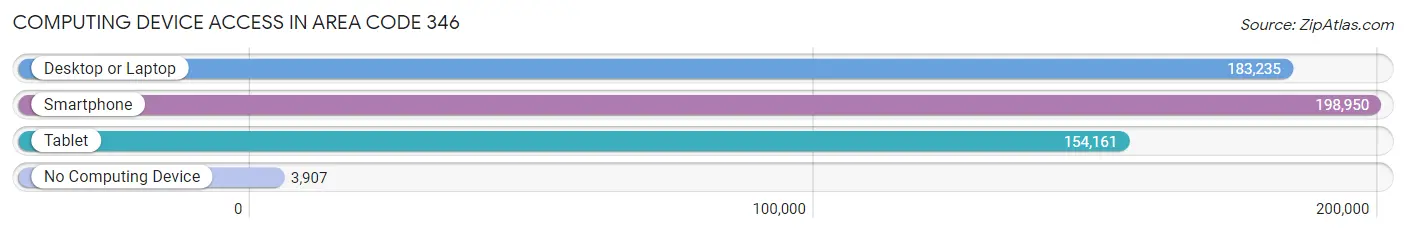
| Device Type | # Households | % Households |
| Desktop or Laptop | 183,235 | 87.2% |
| Smartphone | 198,950 | 94.7% |
| Tablet | 154,161 | 73.4% |
| No Computing Device | 3,907 | 1.9% |
| Total | 210,107 | 100.0% |
Internet Access in Area Code 346
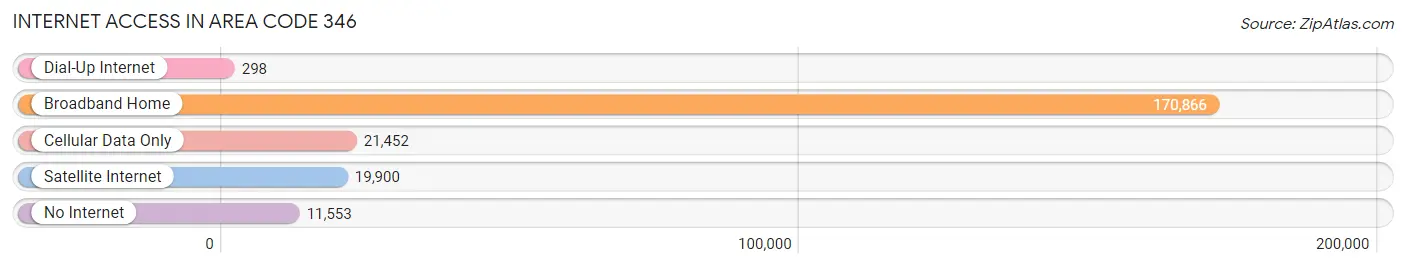
| Internet Type | # Households | % Households |
| Dial-Up Internet | 298 | 0.1% |
| Broadband Home | 170,866 | 81.3% |
| Cellular Data Only | 21,452 | 10.2% |
| Satellite Internet | 19,900 | 9.5% |
| No Internet | 11,553 | 5.5% |
| Total | 210,107 | 100.0% |
Area Code 346 Summary
Geography
Area code 346 is an overlay area code that covers the Houston metropolitan area in Texas. It was created in 2015 to provide additional phone numbers to the existing area codes 713, 281, and 832.
Social
Area code 346 is a relatively new area code, so it has not yet developed its own distinct social identity. However, it is part of the larger Houston metropolitan area, which is known for its diverse population and vibrant culture.
Economics
Area code 346 is located in one of the most economically prosperous regions in the United States. The Houston metropolitan area is home to many large corporations and is a major hub for the oil and gas industry.
Demographics
The population of area code 346 is diverse and rapidly growing. According to the most recent census data, the population of the area code is approximately 1.7 million people, with a median age of 33. The majority of the population is Hispanic or Latino, followed by White, African American, and Asian.
Common Questions
What is Per Capita Income in Area Code 346?
Per Capita income in Area Code 346 is $52,432.
What is the Median Family Income in Area Code 346?
Median Family Income in Area Code 346 is $108,624.
What is the Median Household income in Area Code 346?
Median Household Income in Area Code 346 is $97,970.
What is Income or Wage Gap in Area Code 346?
Income or Wage Gap in Area Code 346 is 30.6%.
Women in Area Code 346 earn 69.4 cents for every dollar earned by a man.
What is Family Income Deficit in Area Code 346?
Family Income Deficit in Area Code 346 is $11,672.
Families that are below poverty line in Area Code 346 earn $11,672 less on average than the poverty threshold level.
What is Inequality or Gini Index in Area Code 346?
Inequality or Gini Index in Area Code 346 is 5.79.
What is the Total Population of Area Code 346?
Total Population of Area Code 346 is 635,682.
What is the Total Male Population of Area Code 346?
Total Male Population of Area Code 346 is 317,177.
What is the Total Female Population of Area Code 346?
Total Female Population of Area Code 346 is 318,505.
What is the Ratio of Males per 100 Females in Area Code 346?
There are 99.58 Males per 100 Females in Area Code 346.
What is the Ratio of Females per 100 Males in Area Code 346?
There are 100.42 Females per 100 Males in Area Code 346.
What is the Median Population Age in Area Code 346?
Median Population Age in Area Code 346 is 38.0 Years.
What is the Average Family Size in Area Code 346
Average Family Size in Area Code 346 is 3.2 People.
What is the Average Household Size in Area Code 346
Average Household Size in Area Code 346 is 2.7 People.
How Large is the Labor Force in Area Code 346?
There are 323,022 People in the Labor Forcein in Area Code 346.
What is the Percentage of People in the Labor Force in Area Code 346?
65.7% of People are in the Labor Force in Area Code 346.
What is the Unemployment Rate in Area Code 346?
Unemployment Rate in Area Code 346 is 6.4%.