Hays County, TX Map & Demographics
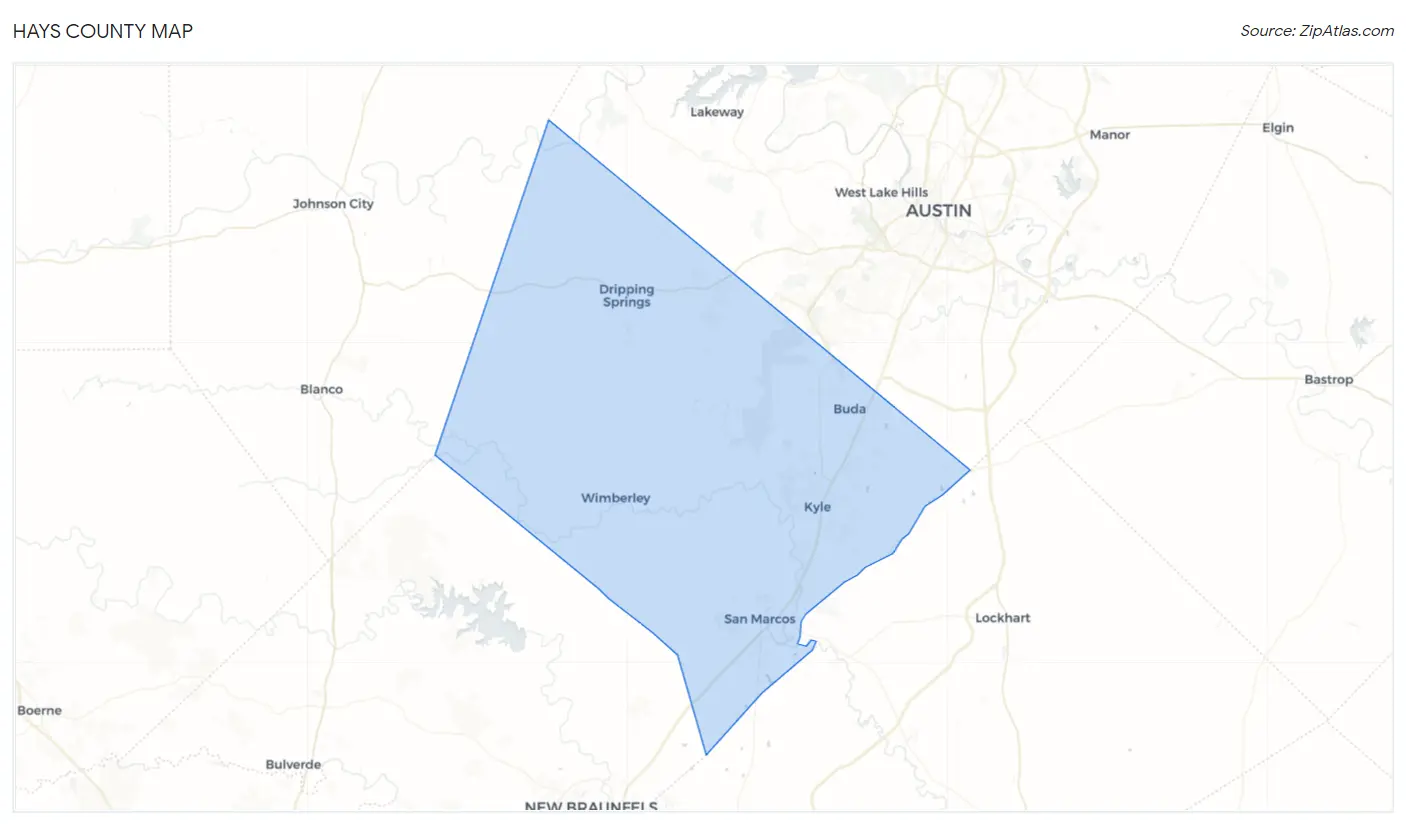
Hays County Map
Hays County Overview
$38,909
PER CAPITA INCOME
$100,644
AVG FAMILY INCOME
$79,990
AVG HOUSEHOLD INCOME
29.4%
WAGE / INCOME GAP [ % ]
70.6¢/ $1
WAGE / INCOME GAP [ $ ]
$10,402
FAMILY INCOME DEFICIT
0.45
INEQUALITY / GINI INDEX
245,351
TOTAL POPULATION
122,589
MALE POPULATION
122,762
FEMALE POPULATION
99.86
MALES / 100 FEMALES
100.14
FEMALES / 100 MALES
33.2
MEDIAN AGE
3.2
AVG FAMILY SIZE
2.7
AVG HOUSEHOLD SIZE
132,574
LABOR FORCE [ PEOPLE ]
67.9%
PERCENT IN LABOR FORCE
5.1%
UNEMPLOYMENT RATE
Income in Hays County
Income Overview in Hays County
Per Capita Income in Hays County is $38,909, while median incomes of families and households are $100,644 and $79,990 respectively.
| Characteristic | Number | Measure |
| Per Capita Income | 245,351 | $38,909 |
| Median Family Income | 58,878 | $100,644 |
| Mean Family Income | 58,878 | $126,815 |
| Median Household Income | 89,328 | $79,990 |
| Mean Household Income | 89,328 | $104,935 |
| Income Deficit | 58,878 | $10,402 |
| Wage / Income Gap (%) | 245,351 | 29.35% |
| Wage / Income Gap ($) | 245,351 | 70.65¢ per $1 |
| Gini / Inequality Index | 245,351 | 0.45 |
Earnings by Sex in Hays County
Average Earnings in Hays County are $39,551, $45,965 for men and $32,474 for women, a difference of 29.3%.
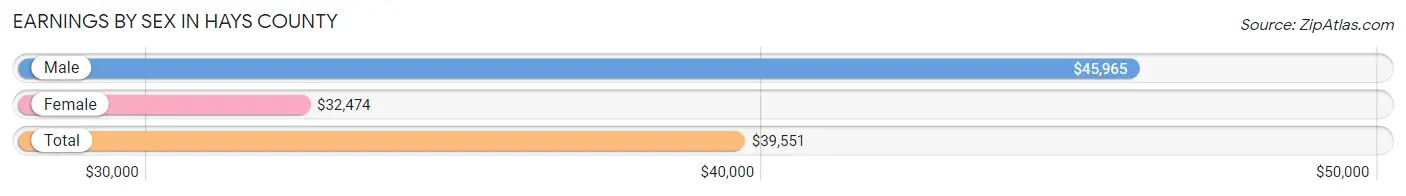
| Sex | Number | Average Earnings |
| Male | 75,053 (54.0%) | $45,965 |
| Female | 64,015 (46.0%) | $32,474 |
| Total | 139,068 (100.0%) | $39,551 |
Earnings by Sex by Income Bracket in Hays County
The most common earnings brackets in Hays County are $100,000+ for men (14,563 | 19.4%) and $100,000+ for women (5,741 | 9.0%).
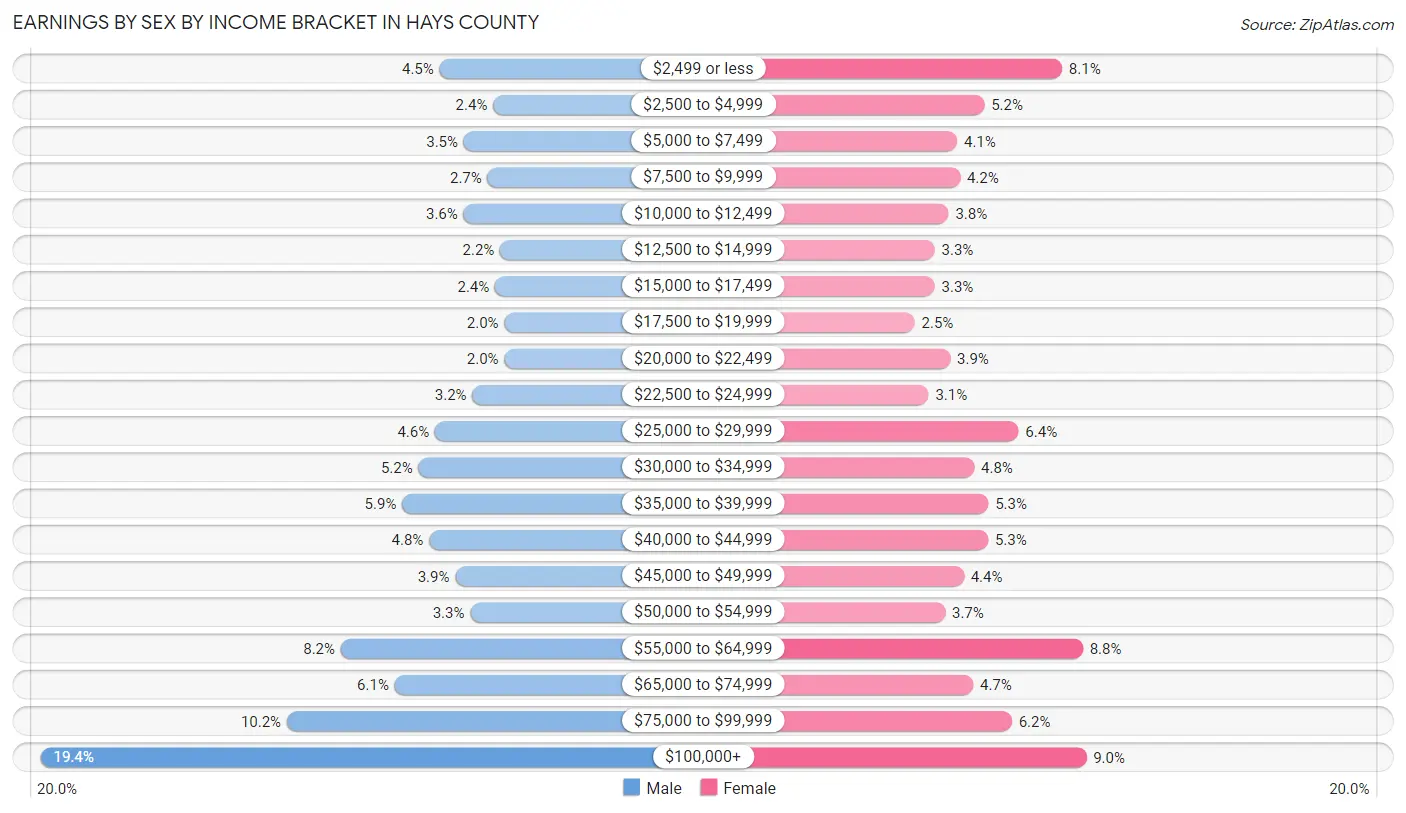
| Income | Male | Female |
| $2,499 or less | 3,337 (4.4%) | 5,159 (8.1%) |
| $2,500 to $4,999 | 1,830 (2.4%) | 3,294 (5.1%) |
| $5,000 to $7,499 | 2,658 (3.5%) | 2,646 (4.1%) |
| $7,500 to $9,999 | 1,989 (2.6%) | 2,712 (4.2%) |
| $10,000 to $12,499 | 2,664 (3.5%) | 2,436 (3.8%) |
| $12,500 to $14,999 | 1,634 (2.2%) | 2,103 (3.3%) |
| $15,000 to $17,499 | 1,777 (2.4%) | 2,109 (3.3%) |
| $17,500 to $19,999 | 1,516 (2.0%) | 1,629 (2.5%) |
| $20,000 to $22,499 | 1,519 (2.0%) | 2,480 (3.9%) |
| $22,500 to $24,999 | 2,420 (3.2%) | 1,960 (3.1%) |
| $25,000 to $29,999 | 3,469 (4.6%) | 4,118 (6.4%) |
| $30,000 to $34,999 | 3,931 (5.2%) | 3,052 (4.8%) |
| $35,000 to $39,999 | 4,389 (5.9%) | 3,391 (5.3%) |
| $40,000 to $44,999 | 3,630 (4.8%) | 3,385 (5.3%) |
| $45,000 to $49,999 | 2,895 (3.9%) | 2,804 (4.4%) |
| $50,000 to $54,999 | 2,480 (3.3%) | 2,353 (3.7%) |
| $55,000 to $64,999 | 6,118 (8.2%) | 5,662 (8.8%) |
| $65,000 to $74,999 | 4,602 (6.1%) | 3,028 (4.7%) |
| $75,000 to $99,999 | 7,632 (10.2%) | 3,953 (6.2%) |
| $100,000+ | 14,563 (19.4%) | 5,741 (9.0%) |
| Total | 75,053 (100.0%) | 64,015 (100.0%) |
Earnings by Sex by Educational Attainment in Hays County
Average earnings in Hays County are $58,374 for men and $42,282 for women, a difference of 27.6%. Men with an educational attainment of graduate degree enjoy the highest average annual earnings of $87,618, while those with less than high school education earn the least with $40,152. Women with an educational attainment of bachelor's degree earn the most with the average annual earnings of $56,896, while those with less than high school education have the smallest earnings of $25,068.
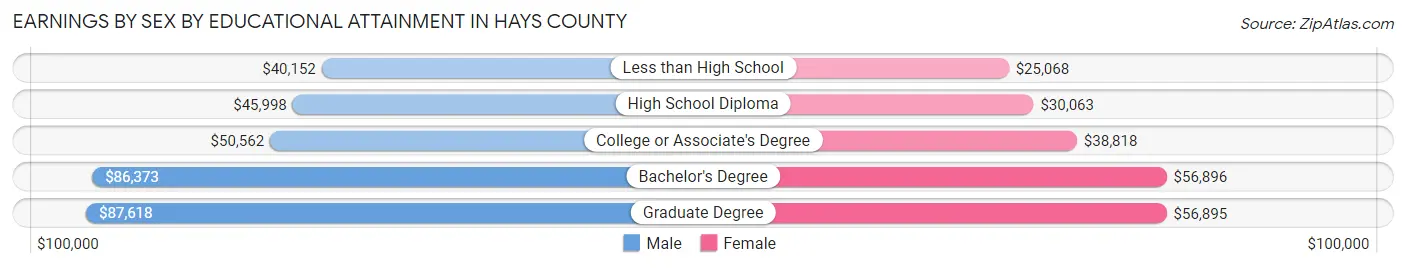
| Educational Attainment | Male Income | Female Income |
| Less than High School | $40,152 | $25,068 |
| High School Diploma | $45,998 | $30,063 |
| College or Associate's Degree | $50,562 | $38,818 |
| Bachelor's Degree | $86,373 | $56,896 |
| Graduate Degree | $87,618 | $56,895 |
| Total | $58,374 | $42,282 |
Family Income in Hays County
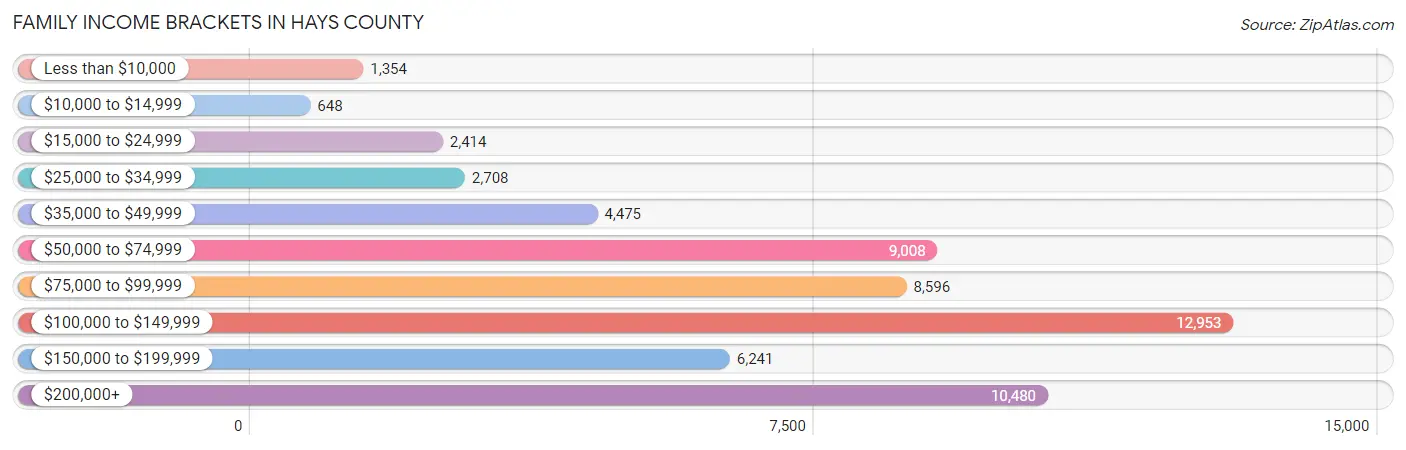
Family Income Brackets in Hays County
According to the Hays County family income data, there are 12,953 families falling into the $100,000 to $149,999 income range, which is the most common income bracket and makes up 22.0% of all families. Conversely, the $10,000 to $14,999 income bracket is the least frequent group with only 648 families (1.1%) belonging to this category.
| Income Bracket | # Families | % Families |
| Less than $10,000 | 1,354 | 2.3% |
| $10,000 to $14,999 | 648 | 1.1% |
| $15,000 to $24,999 | 2,414 | 4.1% |
| $25,000 to $34,999 | 2,708 | 4.6% |
| $35,000 to $49,999 | 4,475 | 7.6% |
| $50,000 to $74,999 | 9,008 | 15.3% |
| $75,000 to $99,999 | 8,596 | 14.6% |
| $100,000 to $149,999 | 12,953 | 22.0% |
| $150,000 to $199,999 | 6,241 | 10.6% |
| $200,000+ | 10,480 | 17.8% |
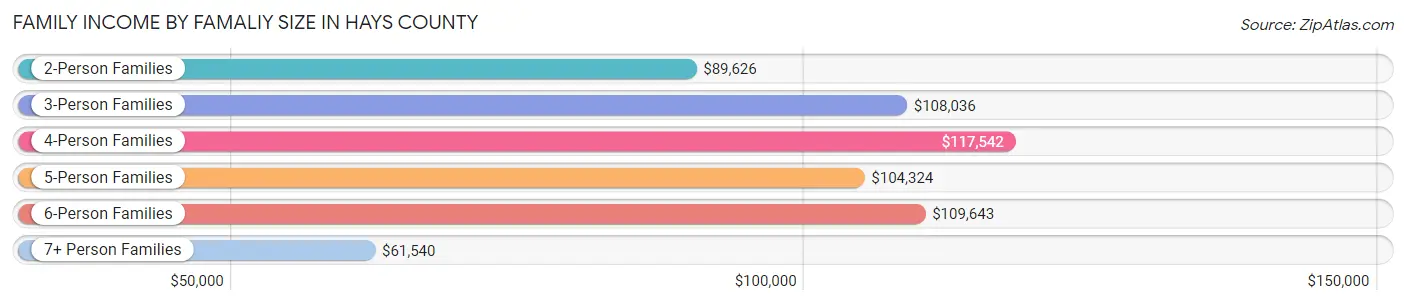
Family Income by Famaliy Size in Hays County
4-person families (12,529 | 21.3%) account for the highest median family income in Hays County with $117,542 per family, while 2-person families (25,526 | 43.3%) have the highest median income of $44,813 per family member.
| Income Bracket | # Families | Median Income |
| 2-Person Families | 25,526 (43.3%) | $89,626 |
| 3-Person Families | 12,466 (21.2%) | $108,036 |
| 4-Person Families | 12,529 (21.3%) | $117,542 |
| 5-Person Families | 5,090 (8.6%) | $104,324 |
| 6-Person Families | 1,954 (3.3%) | $109,643 |
| 7+ Person Families | 1,313 (2.2%) | $61,540 |
| Total | 58,878 (100.0%) | $100,644 |
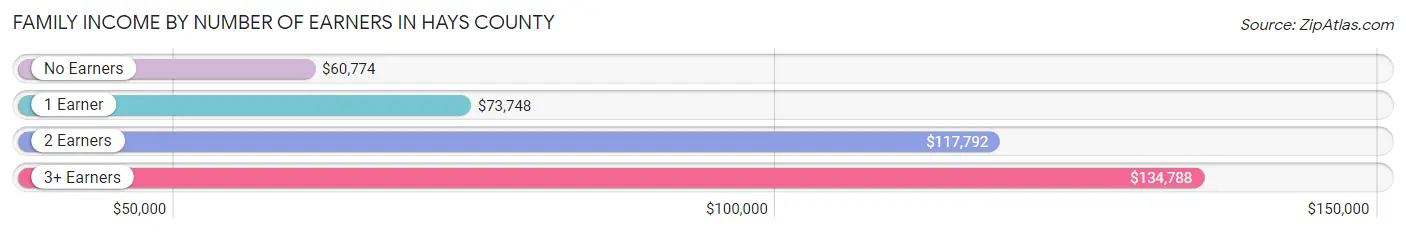
Family Income by Number of Earners in Hays County
The median family income in Hays County is $100,644, with families comprising 3+ earners (6,774) having the highest median family income of $134,788, while families with no earners (6,281) have the lowest median family income of $60,774, accounting for 11.5% and 10.7% of families, respectively.
| Number of Earners | # Families | Median Income |
| No Earners | 6,281 (10.7%) | $60,774 |
| 1 Earner | 18,615 (31.6%) | $73,748 |
| 2 Earners | 27,208 (46.2%) | $117,792 |
| 3+ Earners | 6,774 (11.5%) | $134,788 |
| Total | 58,878 (100.0%) | $100,644 |
Household Income in Hays County
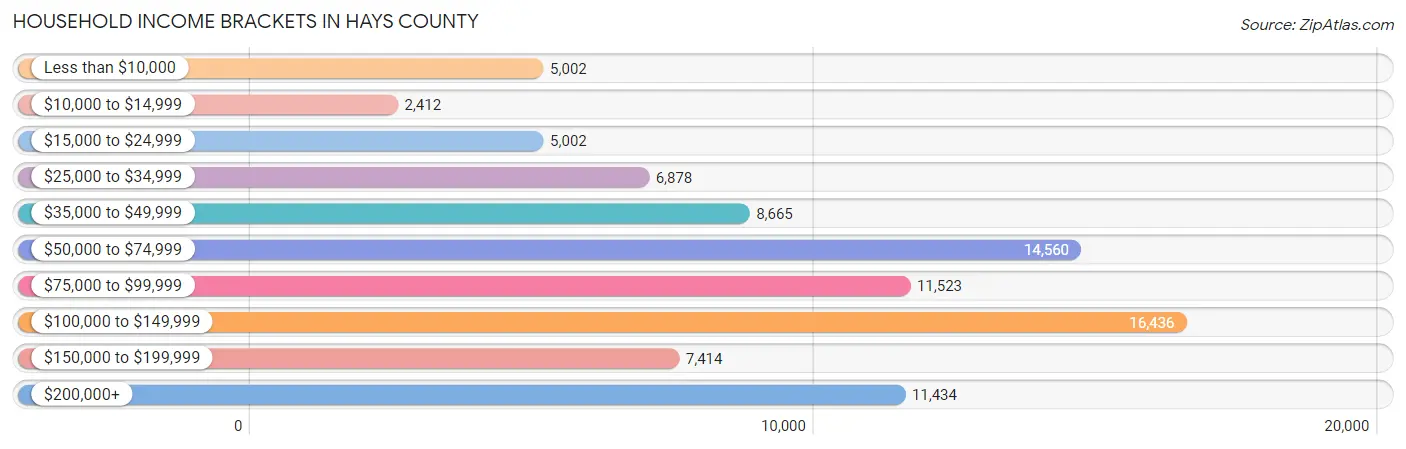
Household Income Brackets in Hays County
With 16,436 households falling in the category, the $100,000 to $149,999 income range is the most frequent in Hays County, accounting for 18.4% of all households. In contrast, only 2,412 households (2.7%) fall into the $10,000 to $14,999 income bracket, making it the least populous group.
| Income Bracket | # Households | % Households |
| Less than $10,000 | 5,002 | 5.6% |
| $10,000 to $14,999 | 2,412 | 2.7% |
| $15,000 to $24,999 | 5,002 | 5.6% |
| $25,000 to $34,999 | 6,878 | 7.7% |
| $35,000 to $49,999 | 8,665 | 9.7% |
| $50,000 to $74,999 | 14,560 | 16.3% |
| $75,000 to $99,999 | 11,523 | 12.9% |
| $100,000 to $149,999 | 16,436 | 18.4% |
| $150,000 to $199,999 | 7,414 | 8.3% |
| $200,000+ | 11,434 | 12.8% |
Household Income by Householder Age in Hays County
The median household income in Hays County is $79,990, with the highest median household income of $98,998 found in the 45 to 64 years age bracket for the primary householder. A total of 29,120 households (32.6%) fall into this category. Meanwhile, the 15 to 24 years age bracket for the primary householder has the lowest median household income of $28,131, with 10,305 households (11.5%) in this group.
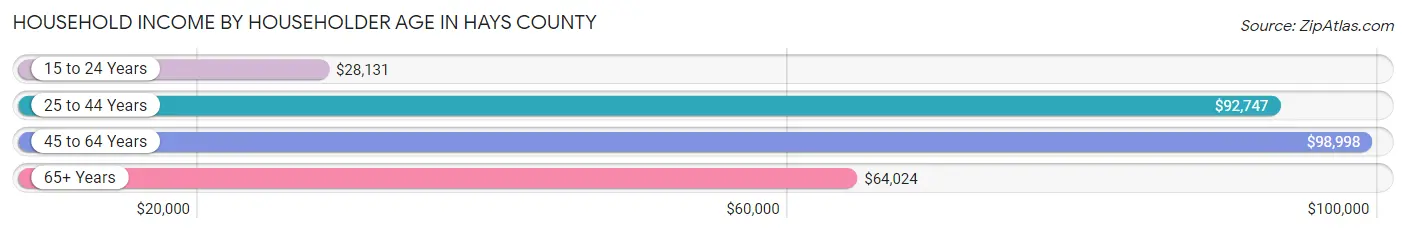
| Income Bracket | # Households | Median Income |
| 15 to 24 Years | 10,305 (11.5%) | $28,131 |
| 25 to 44 Years | 33,715 (37.7%) | $92,747 |
| 45 to 64 Years | 29,120 (32.6%) | $98,998 |
| 65+ Years | 16,188 (18.1%) | $64,024 |
| Total | 89,328 (100.0%) | $79,990 |
Poverty in Hays County
Income Below Poverty by Sex and Age in Hays County
With 11.0% poverty level for males and 14.9% for females among the residents of Hays County, 18 to 24 year old males and 18 to 24 year old females are the most vulnerable to poverty, with 4,391 males (25.9%) and 7,481 females (42.6%) in their respective age groups living below the poverty level.
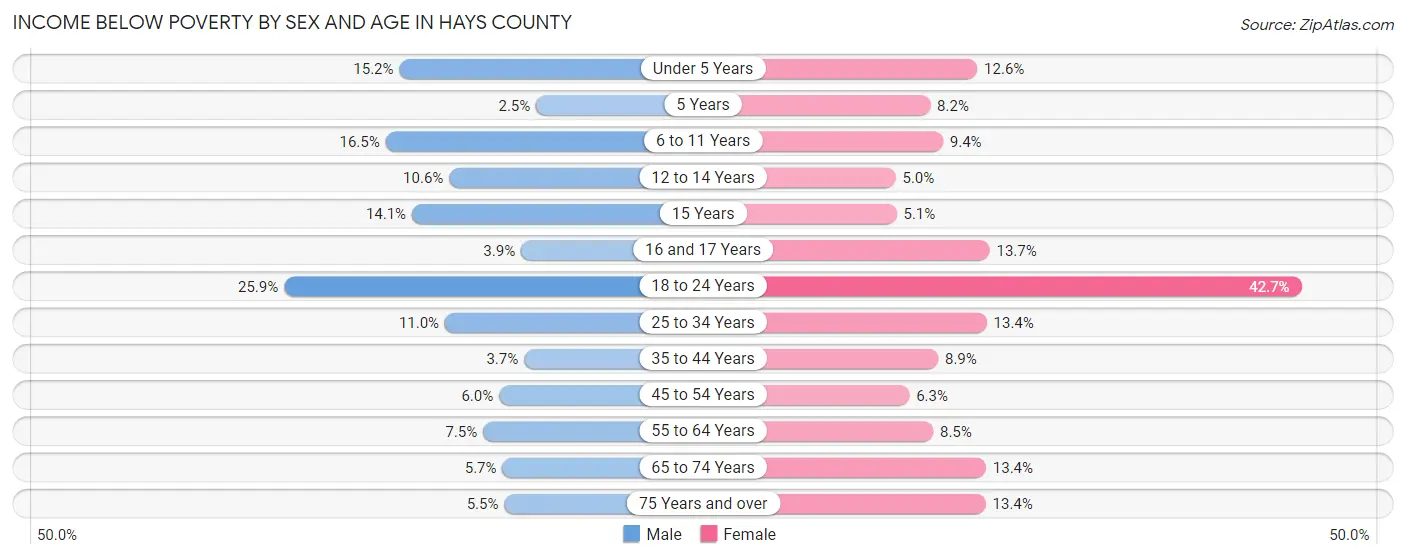
| Age Bracket | Male | Female |
| Under 5 Years | 1,117 (15.2%) | 872 (12.6%) |
| 5 Years | 34 (2.5%) | 132 (8.2%) |
| 6 to 11 Years | 1,638 (16.5%) | 879 (9.4%) |
| 12 to 14 Years | 491 (10.6%) | 226 (5.0%) |
| 15 Years | 283 (14.1%) | 91 (5.1%) |
| 16 and 17 Years | 106 (3.9%) | 369 (13.7%) |
| 18 to 24 Years | 4,391 (25.9%) | 7,481 (42.6%) |
| 25 to 34 Years | 1,944 (11.0%) | 2,136 (13.4%) |
| 35 to 44 Years | 645 (3.6%) | 1,563 (8.9%) |
| 45 to 54 Years | 841 (6.0%) | 836 (6.3%) |
| 55 to 64 Years | 893 (7.4%) | 1,072 (8.5%) |
| 65 to 74 Years | 486 (5.7%) | 1,315 (13.4%) |
| 75 Years and over | 226 (5.5%) | 683 (13.4%) |
| Total | 13,095 (11.0%) | 17,655 (14.9%) |
Income Above Poverty by Sex and Age in Hays County
According to the poverty statistics in Hays County, males aged 5 years and females aged 12 to 14 years are the age groups that are most secure financially, with 97.5% of males and 95.0% of females in these age groups living above the poverty line.
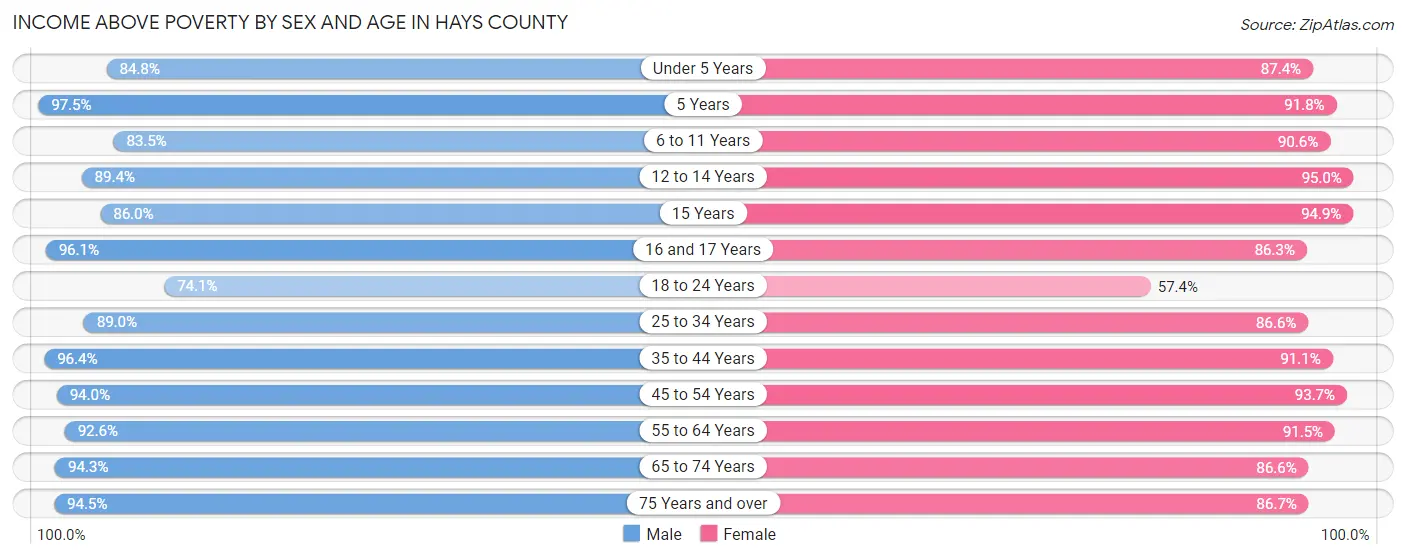
| Age Bracket | Male | Female |
| Under 5 Years | 6,224 (84.8%) | 6,073 (87.4%) |
| 5 Years | 1,310 (97.5%) | 1,478 (91.8%) |
| 6 to 11 Years | 8,292 (83.5%) | 8,494 (90.6%) |
| 12 to 14 Years | 4,142 (89.4%) | 4,304 (95.0%) |
| 15 Years | 1,731 (86.0%) | 1,702 (94.9%) |
| 16 and 17 Years | 2,592 (96.1%) | 2,323 (86.3%) |
| 18 to 24 Years | 12,552 (74.1%) | 10,059 (57.4%) |
| 25 to 34 Years | 15,740 (89.0%) | 13,752 (86.6%) |
| 35 to 44 Years | 17,050 (96.4%) | 15,944 (91.1%) |
| 45 to 54 Years | 13,239 (94.0%) | 12,520 (93.7%) |
| 55 to 64 Years | 11,099 (92.5%) | 11,587 (91.5%) |
| 65 to 74 Years | 8,100 (94.3%) | 8,518 (86.6%) |
| 75 Years and over | 3,900 (94.5%) | 4,432 (86.7%) |
| Total | 105,971 (89.0%) | 101,186 (85.1%) |
Income Below Poverty Among Married-Couple Families in Hays County
The poverty statistics for married-couple families in Hays County show that 3.9% or 1,795 of the total 45,987 families live below the poverty line. Families with 5 or more children have the highest poverty rate of 19.3%, comprising of 105 families. On the other hand, families with no children have the lowest poverty rate of 3.2%, which includes 795 families.
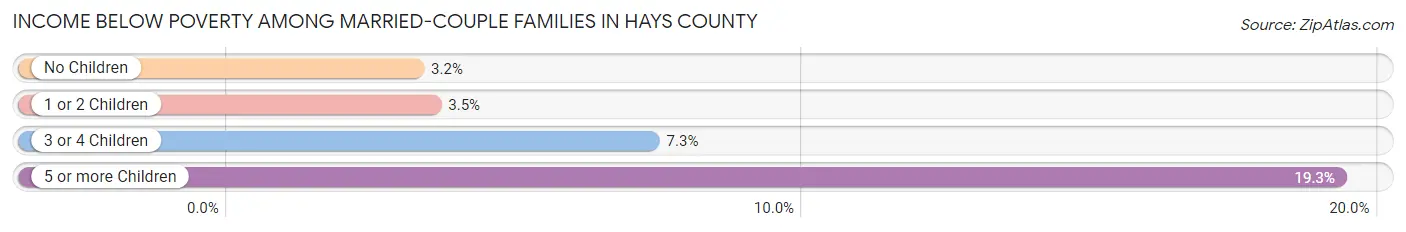
| Children | Above Poverty | Below Poverty |
| No Children | 23,774 (96.8%) | 795 (3.2%) |
| 1 or 2 Children | 16,191 (96.5%) | 595 (3.5%) |
| 3 or 4 Children | 3,788 (92.7%) | 300 (7.3%) |
| 5 or more Children | 439 (80.7%) | 105 (19.3%) |
| Total | 44,192 (96.1%) | 1,795 (3.9%) |
Income Below Poverty Among Single-Parent Households in Hays County
According to the poverty data in Hays County, 11.2% or 474 single-father households and 22.4% or 1,939 single-mother households are living below the poverty line. Among single-father households, those with no children have the highest poverty rate, with 252 households (13.8%) experiencing poverty. Likewise, among single-mother households, those with 3 or 4 children have the highest poverty rate, with 549 households (48.5%) falling below the poverty line.
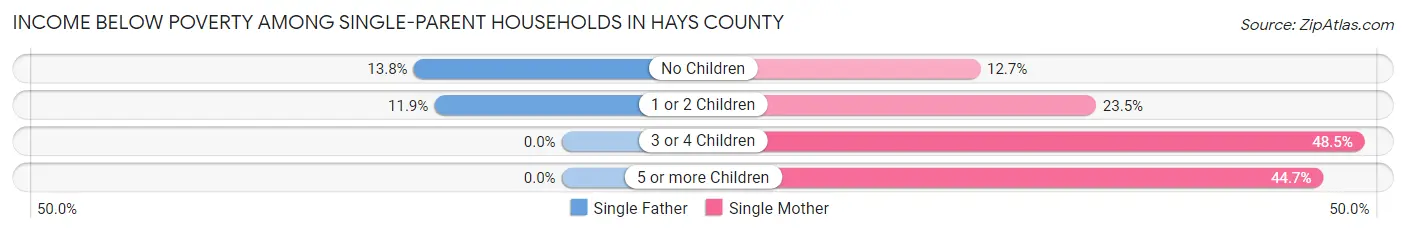
| Children | Single Father | Single Mother |
| No Children | 252 (13.8%) | 468 (12.7%) |
| 1 or 2 Children | 222 (11.9%) | 876 (23.5%) |
| 3 or 4 Children | 0 (0.0%) | 549 (48.5%) |
| 5 or more Children | 0 (0.0%) | 46 (44.7%) |
| Total | 474 (11.2%) | 1,939 (22.4%) |
Income Below Poverty Among Married-Couple vs Single-Parent Households in Hays County
The poverty data for Hays County shows that 1,795 of the married-couple family households (3.9%) and 2,413 of the single-parent households (18.7%) are living below the poverty level. Within the married-couple family households, those with 5 or more children have the highest poverty rate, with 105 households (19.3%) falling below the poverty line. Among the single-parent households, those with 5 or more children have the highest poverty rate, with 46 household (44.7%) living below poverty.
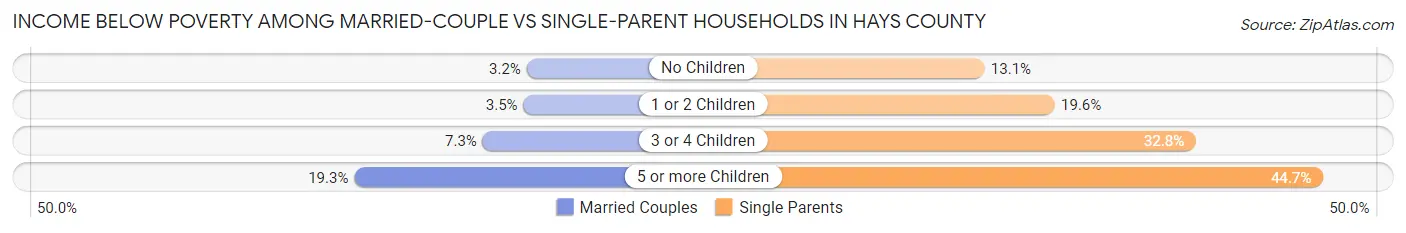
| Children | Married-Couple Families | Single-Parent Households |
| No Children | 795 (3.2%) | 720 (13.1%) |
| 1 or 2 Children | 595 (3.5%) | 1,098 (19.6%) |
| 3 or 4 Children | 300 (7.3%) | 549 (32.8%) |
| 5 or more Children | 105 (19.3%) | 46 (44.7%) |
| Total | 1,795 (3.9%) | 2,413 (18.7%) |
Race in Hays County
The most populous races in Hays County are White / Caucasian (173,667 | 70.8%), Hispanic or Latino (98,944 | 40.3%), and Two or more Races (44,280 | 18.0%).
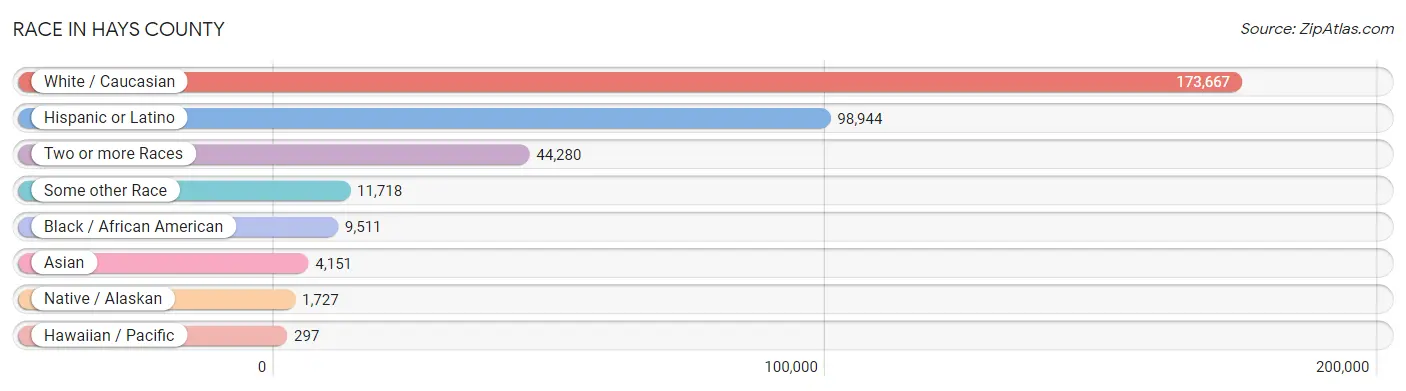
| Race | # Population | % Population |
| Asian | 4,151 | 1.7% |
| Black / African American | 9,511 | 3.9% |
| Hawaiian / Pacific | 297 | 0.1% |
| Hispanic or Latino | 98,944 | 40.3% |
| Native / Alaskan | 1,727 | 0.7% |
| White / Caucasian | 173,667 | 70.8% |
| Two or more Races | 44,280 | 18.0% |
| Some other Race | 11,718 | 4.8% |
| Total | 245,351 | 100.0% |
Ancestry in Hays County
The most populous ancestries reported in Hays County are Mexican (84,056 | 34.3%), German (30,447 | 12.4%), English (24,838 | 10.1%), Irish (21,379 | 8.7%), and American (8,486 | 3.5%), together accounting for 69.0% of all Hays County residents.
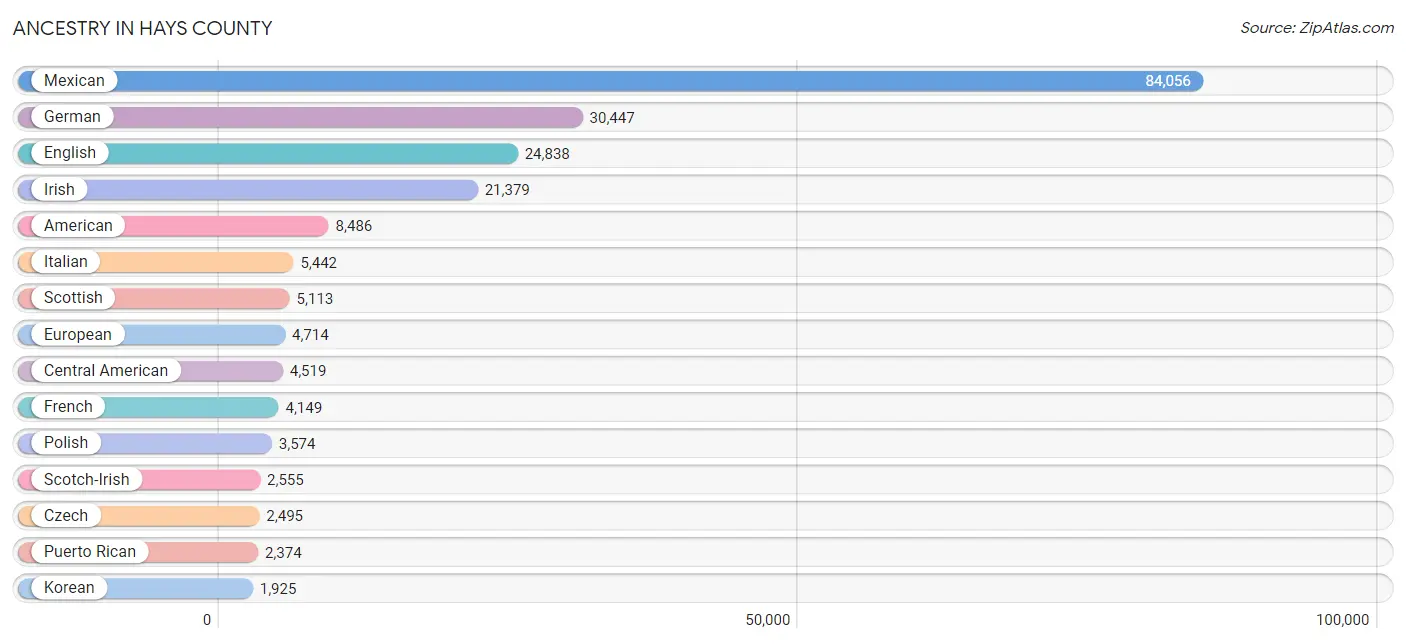
| Ancestry | # Population | % Population |
| African | 1,064 | 0.4% |
| American | 8,486 | 3.5% |
| Apache | 179 | 0.1% |
| Arab | 1,689 | 0.7% |
| Argentinean | 76 | 0.0% |
| Armenian | 151 | 0.1% |
| Australian | 78 | 0.0% |
| Austrian | 227 | 0.1% |
| Basque | 4 | 0.0% |
| Belgian | 221 | 0.1% |
| Bhutanese | 667 | 0.3% |
| Blackfeet | 115 | 0.1% |
| Bolivian | 354 | 0.1% |
| Brazilian | 117 | 0.1% |
| British | 1,797 | 0.7% |
| Bulgarian | 6 | 0.0% |
| Burmese | 703 | 0.3% |
| Cajun | 100 | 0.0% |
| Cambodian | 5 | 0.0% |
| Canadian | 171 | 0.1% |
| Celtic | 82 | 0.0% |
| Central American | 4,519 | 1.8% |
| Central American Indian | 195 | 0.1% |
| Cherokee | 948 | 0.4% |
| Cheyenne | 10 | 0.0% |
| Chickasaw | 2 | 0.0% |
| Chilean | 50 | 0.0% |
| Choctaw | 318 | 0.1% |
| Colombian | 744 | 0.3% |
| Comanche | 80 | 0.0% |
| Costa Rican | 143 | 0.1% |
| Creek | 51 | 0.0% |
| Croatian | 105 | 0.0% |
| Cuban | 481 | 0.2% |
| Cypriot | 11 | 0.0% |
| Czech | 2,495 | 1.0% |
| Czechoslovakian | 155 | 0.1% |
| Danish | 599 | 0.2% |
| Dominican | 555 | 0.2% |
| Dutch | 1,780 | 0.7% |
| Dutch West Indian | 2 | 0.0% |
| Eastern European | 326 | 0.1% |
| Ecuadorian | 67 | 0.0% |
| Egyptian | 108 | 0.0% |
| English | 24,838 | 10.1% |
| European | 4,714 | 1.9% |
| Filipino | 16 | 0.0% |
| Finnish | 120 | 0.1% |
| French | 4,149 | 1.7% |
| French American Indian | 1 | 0.0% |
| French Canadian | 951 | 0.4% |
| German | 30,447 | 12.4% |
| German Russian | 78 | 0.0% |
| Ghanaian | 54 | 0.0% |
| Greek | 875 | 0.4% |
| Guamanian / Chamorro | 136 | 0.1% |
| Guatemalan | 615 | 0.3% |
| Haitian | 18 | 0.0% |
| Honduran | 1,685 | 0.7% |
| Hungarian | 339 | 0.1% |
| Indian (Asian) | 1,166 | 0.5% |
| Indonesian | 73 | 0.0% |
| Iranian | 385 | 0.2% |
| Iraqi | 533 | 0.2% |
| Irish | 21,379 | 8.7% |
| Italian | 5,442 | 2.2% |
| Jamaican | 355 | 0.1% |
| Japanese | 43 | 0.0% |
| Korean | 1,925 | 0.8% |
| Laotian | 74 | 0.0% |
| Latvian | 32 | 0.0% |
| Lebanese | 309 | 0.1% |
| Liberian | 6 | 0.0% |
| Lithuanian | 108 | 0.0% |
| Maltese | 5 | 0.0% |
| Mexican | 84,056 | 34.3% |
| Mexican American Indian | 1,669 | 0.7% |
| Mongolian | 54 | 0.0% |
| Native Hawaiian | 263 | 0.1% |
| Navajo | 37 | 0.0% |
| New Zealander | 12 | 0.0% |
| Nicaraguan | 263 | 0.1% |
| Nigerian | 420 | 0.2% |
| Northern European | 365 | 0.2% |
| Norwegian | 1,896 | 0.8% |
| Osage | 34 | 0.0% |
| Paiute | 113 | 0.1% |
| Pakistani | 178 | 0.1% |
| Palestinian | 123 | 0.1% |
| Panamanian | 316 | 0.1% |
| Paraguayan | 3 | 0.0% |
| Pennsylvania German | 16 | 0.0% |
| Peruvian | 119 | 0.1% |
| Polish | 3,574 | 1.5% |
| Portuguese | 477 | 0.2% |
| Potawatomi | 22 | 0.0% |
| Puerto Rican | 2,374 | 1.0% |
| Romanian | 18 | 0.0% |
| Russian | 934 | 0.4% |
| Salvadoran | 1,464 | 0.6% |
| Scandinavian | 579 | 0.2% |
| Scotch-Irish | 2,555 | 1.0% |
| Scottish | 5,113 | 2.1% |
| Serbian | 19 | 0.0% |
| Sierra Leonean | 8 | 0.0% |
| Sioux | 44 | 0.0% |
| Slavic | 23 | 0.0% |
| Slovak | 133 | 0.1% |
| Slovene | 145 | 0.1% |
| South African | 15 | 0.0% |
| South American | 1,617 | 0.7% |
| South American Indian | 72 | 0.0% |
| Spaniard | 770 | 0.3% |
| Spanish | 1,086 | 0.4% |
| Sri Lankan | 522 | 0.2% |
| Subsaharan African | 1,630 | 0.7% |
| Sudanese | 20 | 0.0% |
| Swedish | 1,741 | 0.7% |
| Swiss | 300 | 0.1% |
| Syrian | 39 | 0.0% |
| Thai | 1,201 | 0.5% |
| Tongan | 47 | 0.0% |
| Trinidadian and Tobagonian | 54 | 0.0% |
| Turkish | 31 | 0.0% |
| Ukrainian | 333 | 0.1% |
| Venezuelan | 204 | 0.1% |
| Vietnamese | 224 | 0.1% |
| Welsh | 1,483 | 0.6% |
| West Indian | 54 | 0.0% |
| Yaqui | 291 | 0.1% |
| Yugoslavian | 63 | 0.0% | View All 131 Rows |
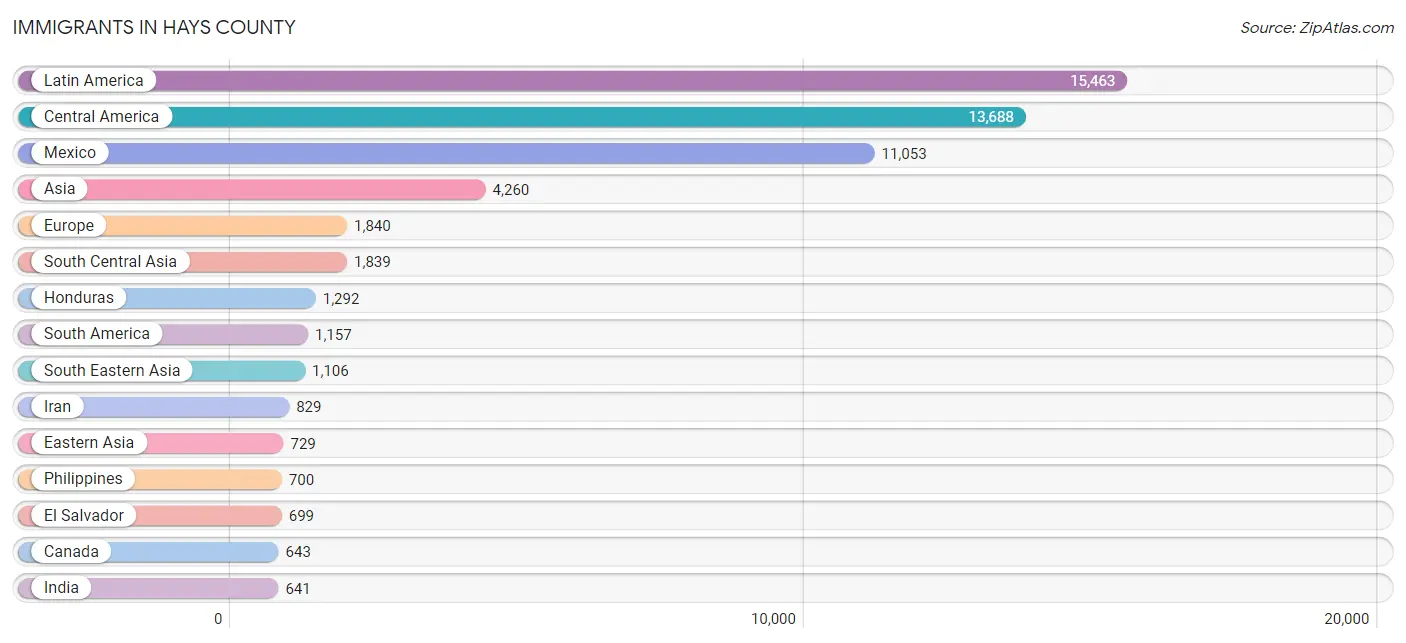
Immigrants in Hays County
The most numerous immigrant groups reported in Hays County came from Latin America (15,463 | 6.3%), Central America (13,688 | 5.6%), Mexico (11,053 | 4.5%), Asia (4,260 | 1.7%), and Europe (1,840 | 0.7%), together accounting for 18.9% of all Hays County residents.
| Immigration Origin | # Population | % Population |
| Africa | 550 | 0.2% |
| Argentina | 41 | 0.0% |
| Asia | 4,260 | 1.7% |
| Australia | 1 | 0.0% |
| Bahamas | 39 | 0.0% |
| Bangladesh | 331 | 0.1% |
| Belgium | 4 | 0.0% |
| Belize | 71 | 0.0% |
| Bolivia | 150 | 0.1% |
| Bosnia and Herzegovina | 52 | 0.0% |
| Brazil | 217 | 0.1% |
| Cameroon | 6 | 0.0% |
| Canada | 643 | 0.3% |
| Caribbean | 618 | 0.3% |
| Central America | 13,688 | 5.6% |
| China | 269 | 0.1% |
| Colombia | 619 | 0.3% |
| Cuba | 135 | 0.1% |
| Dominican Republic | 430 | 0.2% |
| Eastern Africa | 79 | 0.0% |
| Eastern Asia | 729 | 0.3% |
| Eastern Europe | 463 | 0.2% |
| Ecuador | 13 | 0.0% |
| Egypt | 92 | 0.0% |
| El Salvador | 699 | 0.3% |
| England | 272 | 0.1% |
| Europe | 1,840 | 0.7% |
| France | 175 | 0.1% |
| Germany | 310 | 0.1% |
| Ghana | 5 | 0.0% |
| Guatemala | 346 | 0.1% |
| Honduras | 1,292 | 0.5% |
| Hong Kong | 68 | 0.0% |
| India | 641 | 0.3% |
| Indonesia | 19 | 0.0% |
| Iran | 829 | 0.3% |
| Iraq | 533 | 0.2% |
| Ireland | 43 | 0.0% |
| Italy | 4 | 0.0% |
| Jamaica | 14 | 0.0% |
| Japan | 172 | 0.1% |
| Jordan | 17 | 0.0% |
| Korea | 258 | 0.1% |
| Latin America | 15,463 | 6.3% |
| Latvia | 6 | 0.0% |
| Lebanon | 21 | 0.0% |
| Lithuania | 19 | 0.0% |
| Malaysia | 88 | 0.0% |
| Mexico | 11,053 | 4.5% |
| Middle Africa | 6 | 0.0% |
| Moldova | 19 | 0.0% |
| Nepal | 20 | 0.0% |
| Netherlands | 138 | 0.1% |
| Nicaragua | 120 | 0.1% |
| Nigeria | 188 | 0.1% |
| Northern Africa | 92 | 0.0% |
| Northern Europe | 639 | 0.3% |
| Norway | 21 | 0.0% |
| Oceania | 17 | 0.0% |
| Pakistan | 18 | 0.0% |
| Panama | 107 | 0.0% |
| Peru | 53 | 0.0% |
| Philippines | 700 | 0.3% |
| Poland | 128 | 0.1% |
| Portugal | 18 | 0.0% |
| Romania | 2 | 0.0% |
| Russia | 128 | 0.1% |
| Scotland | 153 | 0.1% |
| South Africa | 56 | 0.0% |
| South America | 1,157 | 0.5% |
| South Central Asia | 1,839 | 0.7% |
| South Eastern Asia | 1,106 | 0.4% |
| Southern Europe | 92 | 0.0% |
| Spain | 70 | 0.0% |
| Taiwan | 1 | 0.0% |
| Thailand | 48 | 0.0% |
| Turkey | 4 | 0.0% |
| Uganda | 1 | 0.0% |
| Ukraine | 78 | 0.0% |
| Venezuela | 64 | 0.0% |
| Vietnam | 245 | 0.1% |
| Western Africa | 193 | 0.1% |
| Western Asia | 586 | 0.2% |
| Western Europe | 627 | 0.3% |
| Zimbabwe | 75 | 0.0% | View All 85 Rows |
Sex and Age in Hays County
Sex and Age in Hays County
The most populous age groups in Hays County are 20 to 24 Years (14,087 | 11.5%) for men and 20 to 24 Years (14,921 | 12.1%) for women.
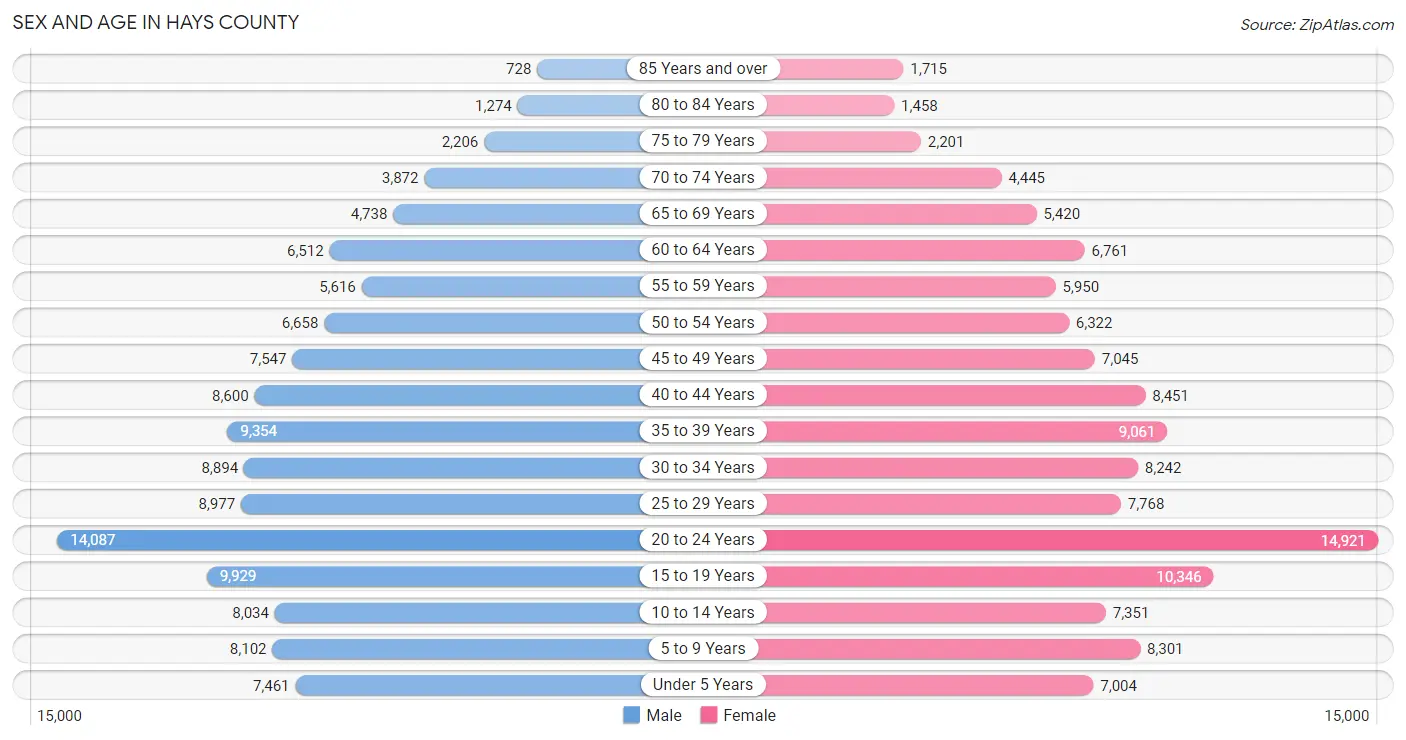
| Age Bracket | Male | Female |
| Under 5 Years | 7,461 (6.1%) | 7,004 (5.7%) |
| 5 to 9 Years | 8,102 (6.6%) | 8,301 (6.8%) |
| 10 to 14 Years | 8,034 (6.6%) | 7,351 (6.0%) |
| 15 to 19 Years | 9,929 (8.1%) | 10,346 (8.4%) |
| 20 to 24 Years | 14,087 (11.5%) | 14,921 (12.1%) |
| 25 to 29 Years | 8,977 (7.3%) | 7,768 (6.3%) |
| 30 to 34 Years | 8,894 (7.3%) | 8,242 (6.7%) |
| 35 to 39 Years | 9,354 (7.6%) | 9,061 (7.4%) |
| 40 to 44 Years | 8,600 (7.0%) | 8,451 (6.9%) |
| 45 to 49 Years | 7,547 (6.2%) | 7,045 (5.7%) |
| 50 to 54 Years | 6,658 (5.4%) | 6,322 (5.1%) |
| 55 to 59 Years | 5,616 (4.6%) | 5,950 (4.9%) |
| 60 to 64 Years | 6,512 (5.3%) | 6,761 (5.5%) |
| 65 to 69 Years | 4,738 (3.9%) | 5,420 (4.4%) |
| 70 to 74 Years | 3,872 (3.2%) | 4,445 (3.6%) |
| 75 to 79 Years | 2,206 (1.8%) | 2,201 (1.8%) |
| 80 to 84 Years | 1,274 (1.0%) | 1,458 (1.2%) |
| 85 Years and over | 728 (0.6%) | 1,715 (1.4%) |
| Total | 122,589 (100.0%) | 122,762 (100.0%) |
Families and Households in Hays County
Median Family Size in Hays County
The median family size in Hays County is 3.18 persons per family, with married-couple families (45,987 | 78.1%) accounting for the largest median family size of 3.25 persons per family. On the other hand, single male/father families (4,241 | 7.2%) represent the smallest median family size with 2.66 persons per family.
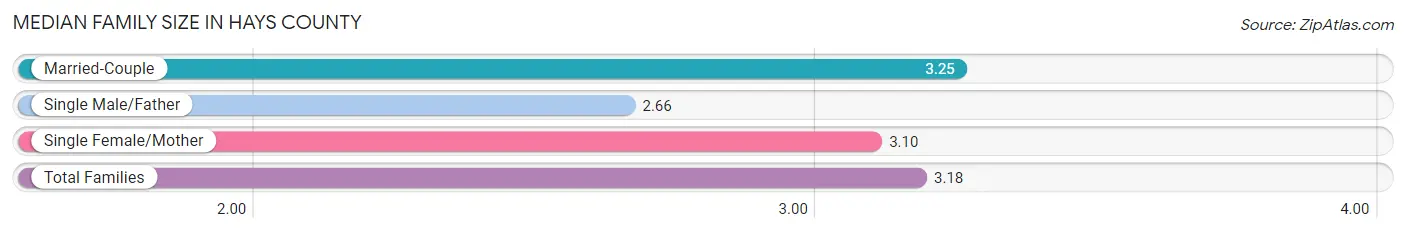
| Family Type | # Families | Family Size |
| Married-Couple | 45,987 (78.1%) | 3.25 |
| Single Male/Father | 4,241 (7.2%) | 2.66 |
| Single Female/Mother | 8,650 (14.7%) | 3.10 |
| Total Families | 58,878 (100.0%) | 3.18 |
Median Household Size in Hays County
The median household size in Hays County is 2.67 persons per household, with single female/mother households (8,650 | 9.7%) accounting for the largest median household size of 3.35 persons per household. non-family households (30,450 | 34.1%) represent the smallest median household size with 1.50 persons per household.
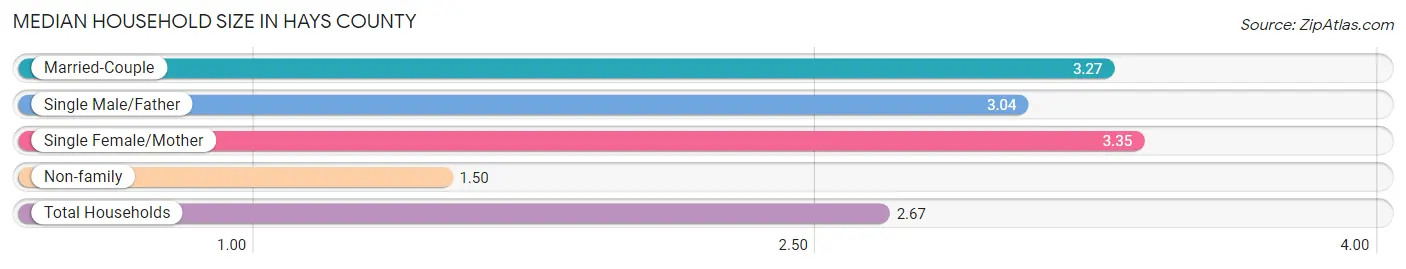
| Household Type | # Households | Household Size |
| Married-Couple | 45,987 (51.5%) | 3.27 |
| Single Male/Father | 4,241 (4.8%) | 3.04 |
| Single Female/Mother | 8,650 (9.7%) | 3.35 |
| Non-family | 30,450 (34.1%) | 1.50 |
| Total Households | 89,328 (100.0%) | 2.67 |
Household Size by Marriage Status in Hays County
Out of a total of 89,328 households in Hays County, 58,878 (65.9%) are family households, while 30,450 (34.1%) are nonfamily households. The most numerous type of family households are 2-person households, comprising 23,990, and the most common type of nonfamily households are 1-person households, comprising 19,389.
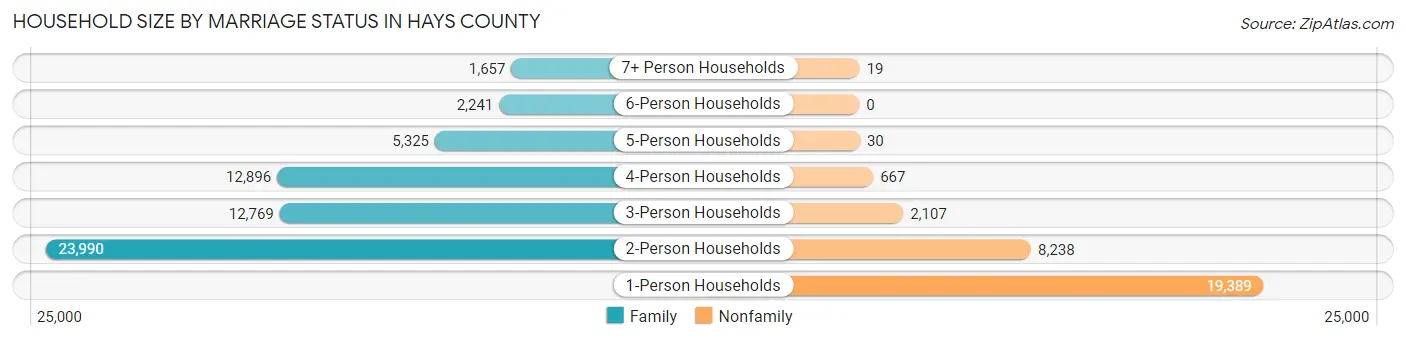
| Household Size | Family Households | Nonfamily Households |
| 1-Person Households | - | 19,389 (21.7%) |
| 2-Person Households | 23,990 (26.9%) | 8,238 (9.2%) |
| 3-Person Households | 12,769 (14.3%) | 2,107 (2.4%) |
| 4-Person Households | 12,896 (14.4%) | 667 (0.7%) |
| 5-Person Households | 5,325 (6.0%) | 30 (0.0%) |
| 6-Person Households | 2,241 (2.5%) | 0 (0.0%) |
| 7+ Person Households | 1,657 (1.8%) | 19 (0.0%) |
| Total | 58,878 (65.9%) | 30,450 (34.1%) |
Female Fertility in Hays County
Fertility by Age in Hays County
Average fertility rate in Hays County is 45.0 births per 1,000 women. Women in the age bracket of 35 to 50 years have the highest fertility rate with 57.0 births per 1,000 women. Women in the age bracket of 20 to 34 years acount for 50.4% of all women with births.
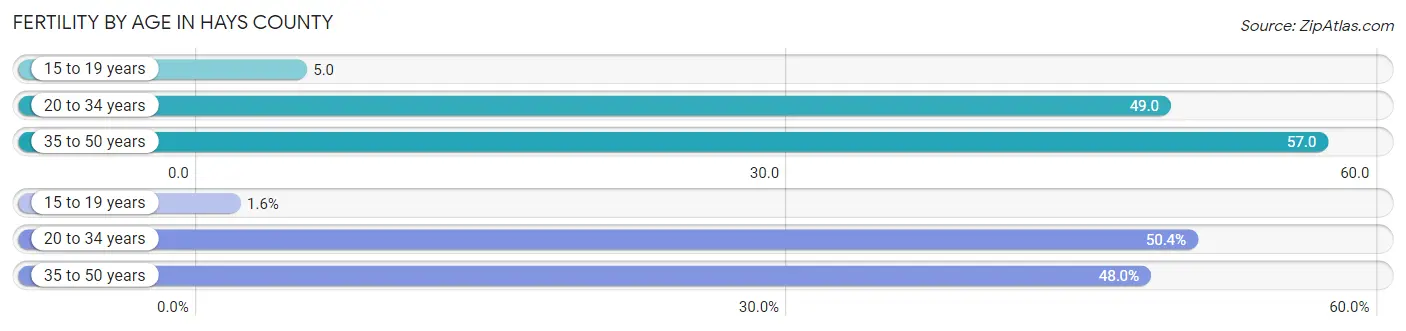
| Age Bracket | Women with Births | Births / 1,000 Women |
| 15 to 19 years | 49 (1.6%) | 5.0 |
| 20 to 34 years | 1,518 (50.4%) | 49.0 |
| 35 to 50 years | 1,446 (48.0%) | 57.0 |
| Total | 3,013 (100.0%) | 45.0 |
Fertility by Age by Marriage Status in Hays County
83.4% of women with births (3,013) in Hays County are married. The highest percentage of unmarried women with births falls into 15 to 19 years age bracket with 61.2% of them unmarried at the time of birth, while the lowest percentage of unmarried women with births belong to 20 to 34 years age bracket with 15.7% of them unmarried.
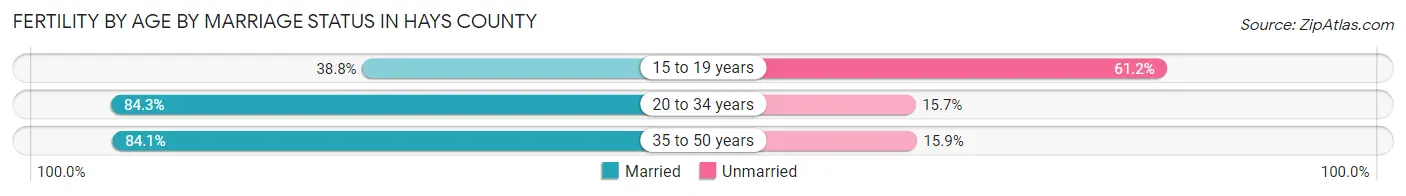
| Age Bracket | Married | Unmarried |
| 15 to 19 years | 19 (38.8%) | 30 (61.2%) |
| 20 to 34 years | 1,280 (84.3%) | 238 (15.7%) |
| 35 to 50 years | 1,216 (84.1%) | 230 (15.9%) |
| Total | 2,513 (83.4%) | 500 (16.6%) |
Fertility by Education in Hays County
Average fertility rate in Hays County is 45.0 births per 1,000 women. Women with the education attainment of graduate degree have the highest fertility rate of 128.0 births per 1,000 women, while women with the education attainment of college or associate's degree have the lowest fertility at 22.0 births per 1,000 women. Women with the education attainment of graduate degree represent 28.4% of all women with births.
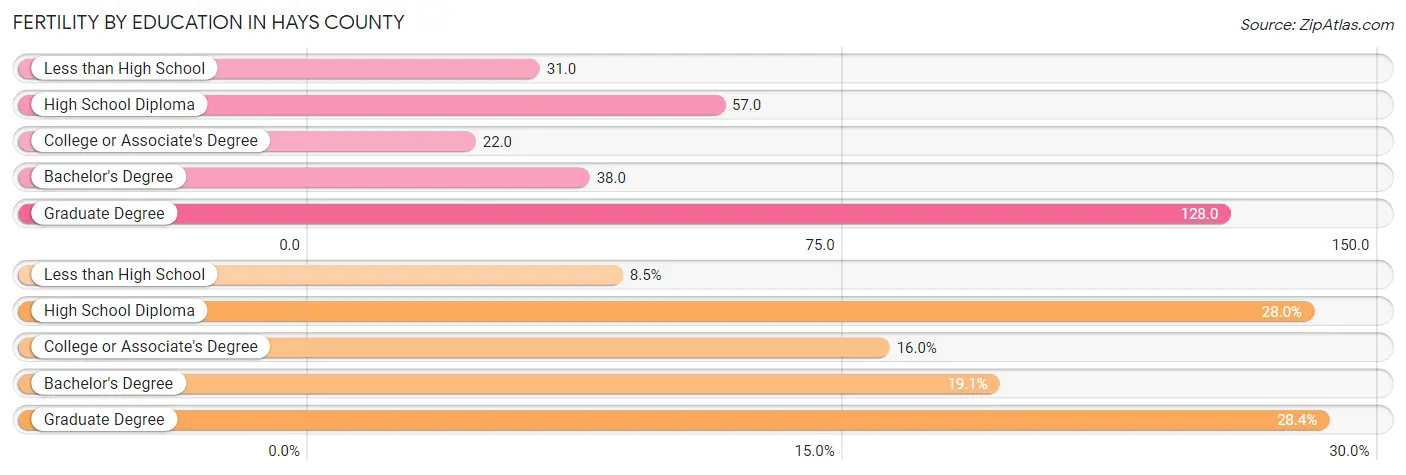
| Educational Attainment | Women with Births | Births / 1,000 Women |
| Less than High School | 257 (8.5%) | 31.0 |
| High School Diploma | 842 (28.0%) | 57.0 |
| College or Associate's Degree | 483 (16.0%) | 22.0 |
| Bachelor's Degree | 576 (19.1%) | 38.0 |
| Graduate Degree | 855 (28.4%) | 128.0 |
| Total | 3,013 (100.0%) | 45.0 |
Fertility by Education by Marriage Status in Hays County
16.6% of women with births in Hays County are unmarried. Women with the educational attainment of bachelor's degree are most likely to be married with 98.4% of them married at childbirth, while women with the educational attainment of college or associate's degree are least likely to be married with 50.7% of them unmarried at childbirth.
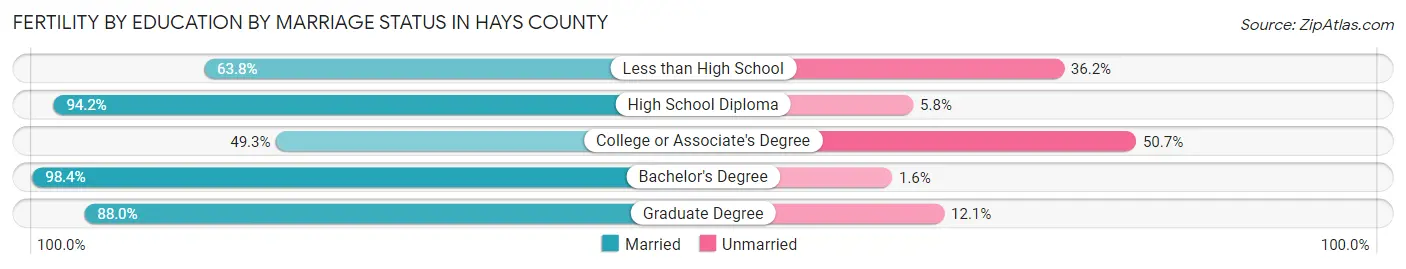
| Educational Attainment | Married | Unmarried |
| Less than High School | 164 (63.8%) | 93 (36.2%) |
| High School Diploma | 793 (94.2%) | 49 (5.8%) |
| College or Associate's Degree | 238 (49.3%) | 245 (50.7%) |
| Bachelor's Degree | 567 (98.4%) | 9 (1.6%) |
| Graduate Degree | 752 (87.9%) | 103 (12.0%) |
| Total | 2,513 (83.4%) | 500 (16.6%) |
Employment Characteristics in Hays County
Employment by Class of Employer in Hays County
Among the 124,248 employed individuals in Hays County, private company employees (82,753 | 66.6%), local government employees (10,837 | 8.7%), and self-employed (not incorporated) (8,569 | 6.9%) make up the most common classes of employment.
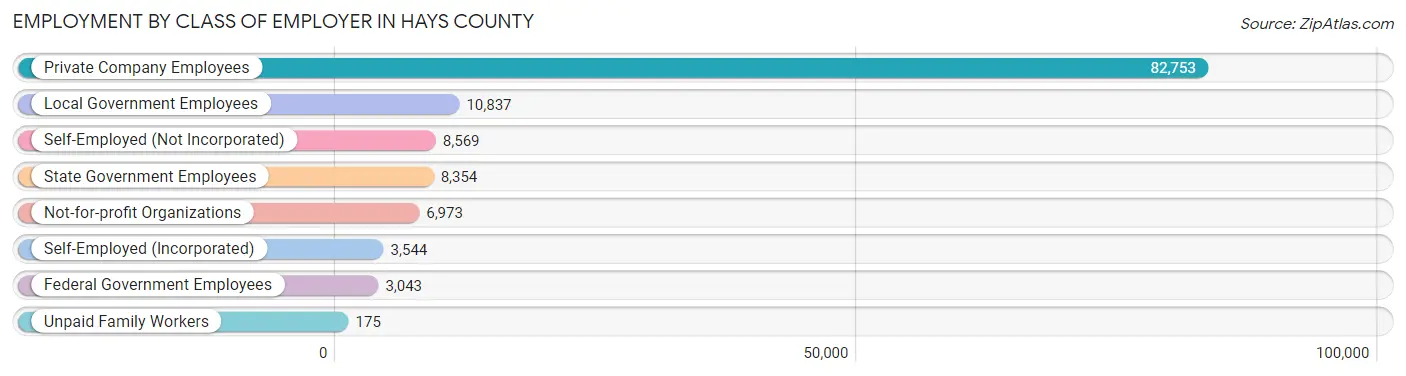
| Employer Class | # Employees | % Employees |
| Private Company Employees | 82,753 | 66.6% |
| Self-Employed (Incorporated) | 3,544 | 2.9% |
| Self-Employed (Not Incorporated) | 8,569 | 6.9% |
| Not-for-profit Organizations | 6,973 | 5.6% |
| Local Government Employees | 10,837 | 8.7% |
| State Government Employees | 8,354 | 6.7% |
| Federal Government Employees | 3,043 | 2.5% |
| Unpaid Family Workers | 175 | 0.1% |
| Total | 124,248 | 100.0% |
Employment Status by Age in Hays County
According to the labor force statistics for Hays County, out of the total population over 16 years of age (195,249), 67.9% or 132,574 individuals are in the labor force, with 5.1% or 6,761 of them unemployed. The age group with the highest labor force participation rate is 25 to 29 years, with 87.9% or 14,719 individuals in the labor force. Within the labor force, the 16 to 19 years age range has the highest percentage of unemployed individuals, with 16.8% or 1,101 of them being unemployed.
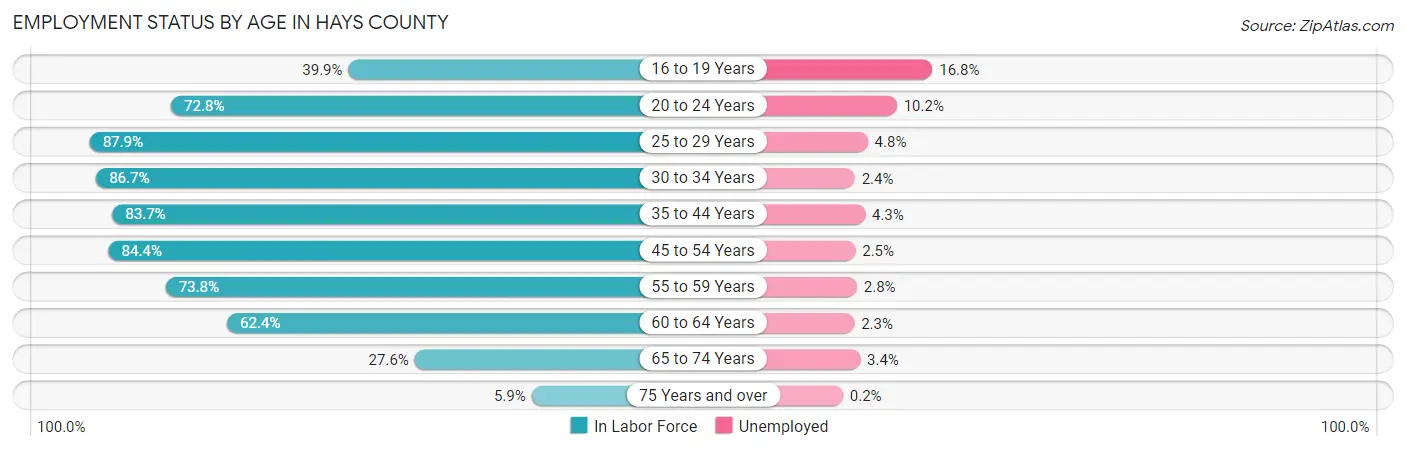
| Age Bracket | In Labor Force | Unemployed |
| 16 to 19 Years | 6,554 (39.9%) | 1,101 (16.8%) |
| 20 to 24 Years | 21,118 (72.8%) | 2,154 (10.2%) |
| 25 to 29 Years | 14,719 (87.9%) | 707 (4.8%) |
| 30 to 34 Years | 14,857 (86.7%) | 357 (2.4%) |
| 35 to 44 Years | 29,685 (83.7%) | 1,276 (4.3%) |
| 45 to 54 Years | 23,271 (84.4%) | 582 (2.5%) |
| 55 to 59 Years | 8,536 (73.8%) | 239 (2.8%) |
| 60 to 64 Years | 8,282 (62.4%) | 190 (2.3%) |
| 65 to 74 Years | 5,099 (27.6%) | 173 (3.4%) |
| 75 Years and over | 565 (5.9%) | 1 (0.2%) |
| Total | 132,574 (67.9%) | 6,761 (5.1%) |
Employment Status by Educational Attainment in Hays County
According to labor force statistics for Hays County, 81.6% of individuals (99,355) out of the total population between 25 and 64 years of age (121,758) are in the labor force, with 3.4% or 3,378 of them being unemployed. The group with the highest labor force participation rate are those with the educational attainment of bachelor's degree or higher, with 87.5% or 42,696 individuals in the labor force. Within the labor force, individuals with less than high school education have the highest percentage of unemployment, with 8.8% or 755 of them being unemployed.
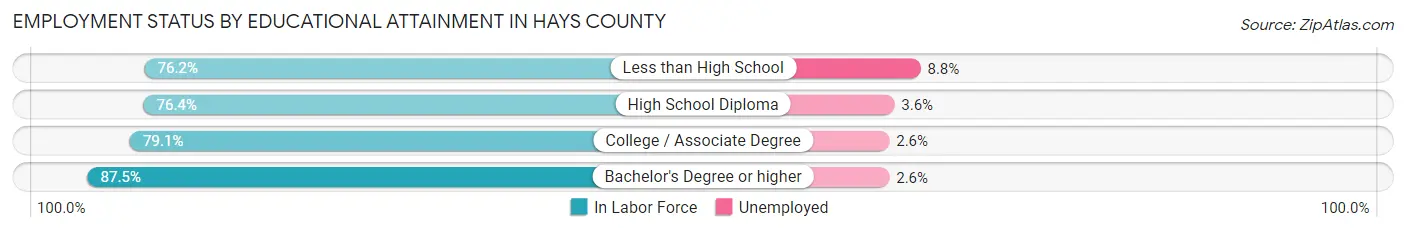
| Educational Attainment | In Labor Force | Unemployed |
| Less than High School | 8,582 (76.2%) | 991 (8.8%) |
| High School Diploma | 21,199 (76.4%) | 999 (3.6%) |
| College / Associate Degree | 26,857 (79.1%) | 883 (2.6%) |
| Bachelor's Degree or higher | 42,696 (87.5%) | 1,269 (2.6%) |
| Total | 99,355 (81.6%) | 4,140 (3.4%) |
Employment Occupations by Sex in Hays County
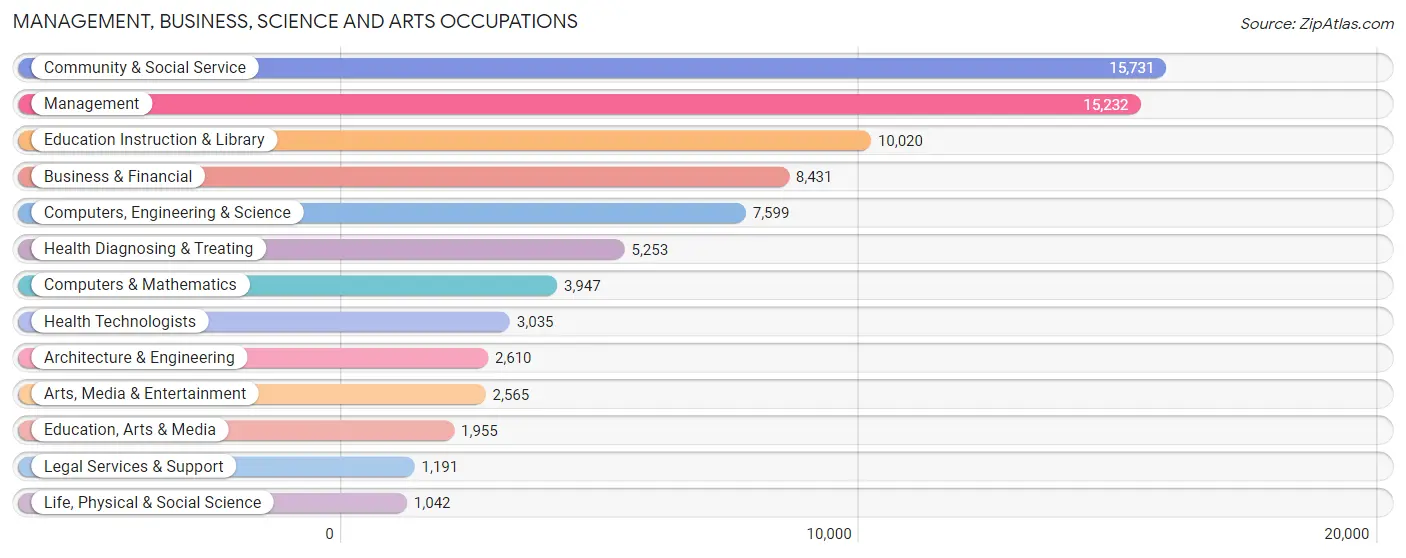
Management, Business, Science and Arts Occupations
The most common Management, Business, Science and Arts occupations in Hays County are Community & Social Service (15,731 | 12.5%), Management (15,232 | 12.1%), Education Instruction & Library (10,020 | 8.0%), Business & Financial (8,431 | 6.7%), and Computers, Engineering & Science (7,599 | 6.1%).
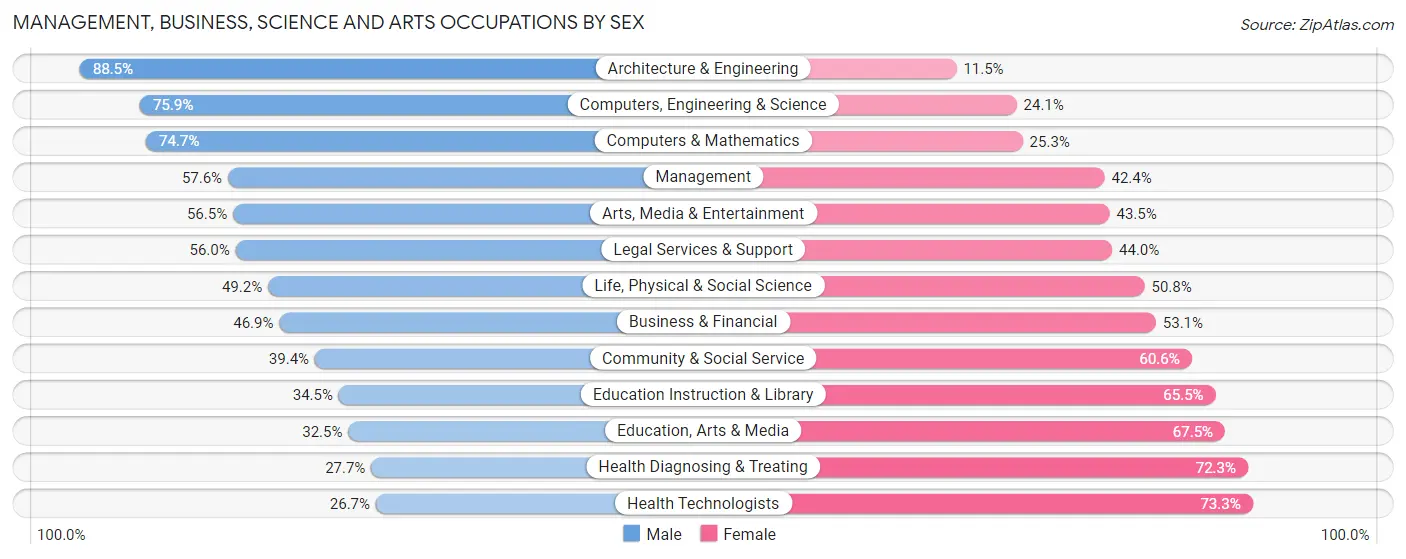
Management, Business, Science and Arts Occupations by Sex
Within the Management, Business, Science and Arts occupations in Hays County, the most male-oriented occupations are Architecture & Engineering (88.5%), Computers, Engineering & Science (75.9%), and Computers & Mathematics (74.7%), while the most female-oriented occupations are Health Technologists (73.3%), Health Diagnosing & Treating (72.3%), and Education, Arts & Media (67.5%).
| Occupation | Male | Female |
| Management | 8,771 (57.6%) | 6,461 (42.4%) |
| Business & Financial | 3,952 (46.9%) | 4,479 (53.1%) |
| Computers, Engineering & Science | 5,769 (75.9%) | 1,830 (24.1%) |
| Computers & Mathematics | 2,947 (74.7%) | 1,000 (25.3%) |
| Architecture & Engineering | 2,309 (88.5%) | 301 (11.5%) |
| Life, Physical & Social Science | 513 (49.2%) | 529 (50.8%) |
| Community & Social Service | 6,205 (39.4%) | 9,526 (60.6%) |
| Education, Arts & Media | 635 (32.5%) | 1,320 (67.5%) |
| Legal Services & Support | 667 (56.0%) | 524 (44.0%) |
| Education Instruction & Library | 3,453 (34.5%) | 6,567 (65.5%) |
| Arts, Media & Entertainment | 1,450 (56.5%) | 1,115 (43.5%) |
| Health Diagnosing & Treating | 1,455 (27.7%) | 3,798 (72.3%) |
| Health Technologists | 811 (26.7%) | 2,224 (73.3%) |
| Total (Category) | 26,152 (50.1%) | 26,094 (49.9%) |
| Total (Overall) | 68,453 (54.6%) | 56,961 (45.4%) |
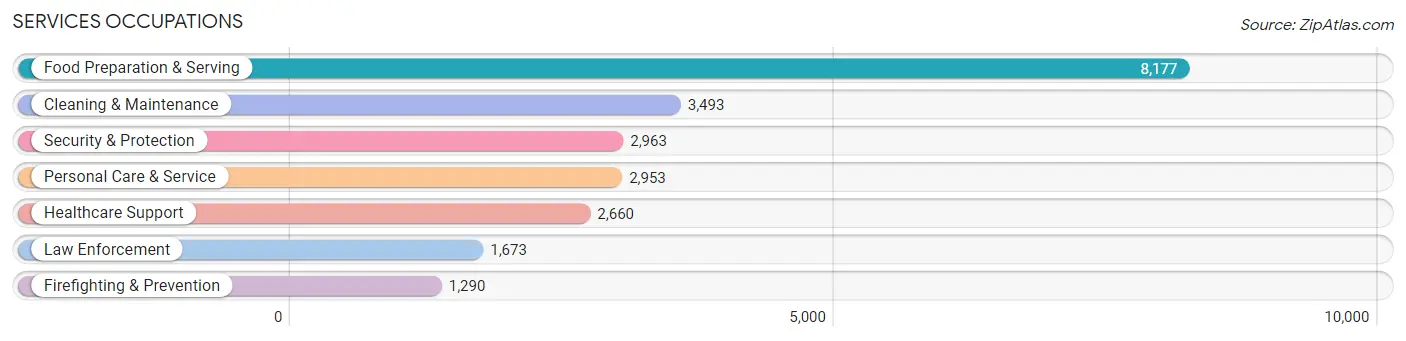
Services Occupations
The most common Services occupations in Hays County are Food Preparation & Serving (8,177 | 6.5%), Cleaning & Maintenance (3,493 | 2.8%), Security & Protection (2,963 | 2.4%), Personal Care & Service (2,953 | 2.4%), and Healthcare Support (2,660 | 2.1%).
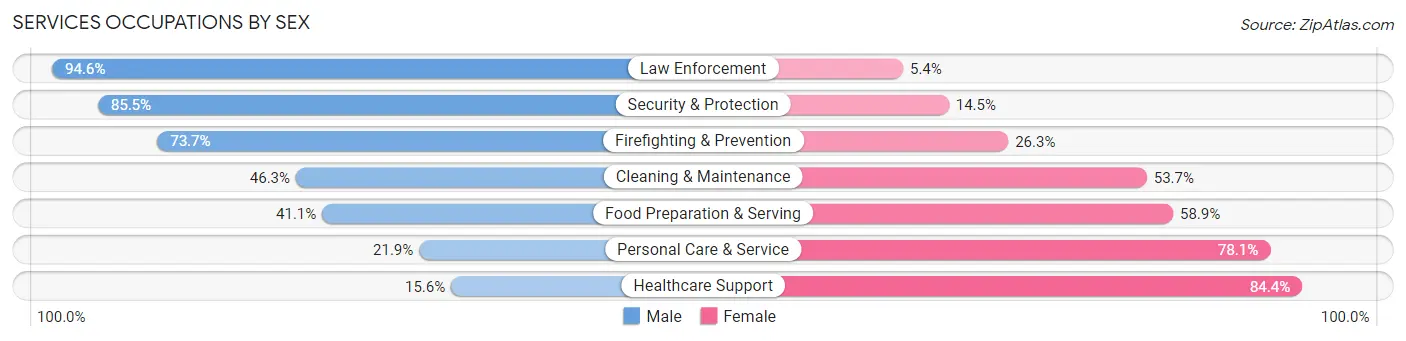
Services Occupations by Sex
Within the Services occupations in Hays County, the most male-oriented occupations are Law Enforcement (94.6%), Security & Protection (85.5%), and Firefighting & Prevention (73.7%), while the most female-oriented occupations are Healthcare Support (84.4%), Personal Care & Service (78.1%), and Food Preparation & Serving (58.9%).
| Occupation | Male | Female |
| Healthcare Support | 414 (15.6%) | 2,246 (84.4%) |
| Security & Protection | 2,533 (85.5%) | 430 (14.5%) |
| Firefighting & Prevention | 951 (73.7%) | 339 (26.3%) |
| Law Enforcement | 1,582 (94.6%) | 91 (5.4%) |
| Food Preparation & Serving | 3,360 (41.1%) | 4,817 (58.9%) |
| Cleaning & Maintenance | 1,617 (46.3%) | 1,876 (53.7%) |
| Personal Care & Service | 646 (21.9%) | 2,307 (78.1%) |
| Total (Category) | 8,570 (42.3%) | 11,676 (57.7%) |
| Total (Overall) | 68,453 (54.6%) | 56,961 (45.4%) |
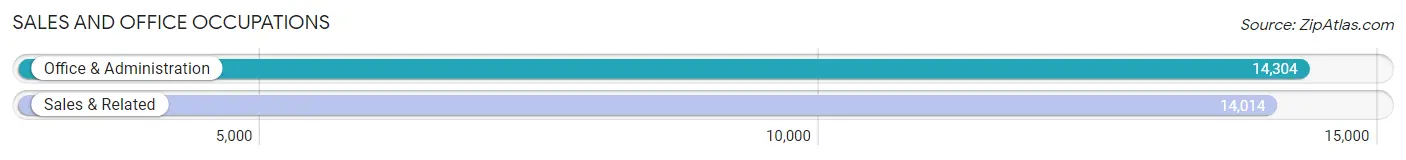
Sales and Office Occupations
The most common Sales and Office occupations in Hays County are Office & Administration (14,304 | 11.4%), and Sales & Related (14,014 | 11.2%).
Sales and Office Occupations by Sex
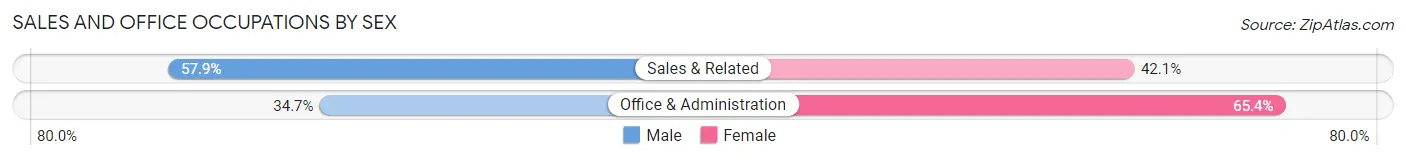
| Occupation | Male | Female |
| Sales & Related | 8,119 (57.9%) | 5,895 (42.1%) |
| Office & Administration | 4,957 (34.6%) | 9,347 (65.3%) |
| Total (Category) | 13,076 (46.2%) | 15,242 (53.8%) |
| Total (Overall) | 68,453 (54.6%) | 56,961 (45.4%) |
Natural Resources, Construction and Maintenance Occupations
The most common Natural Resources, Construction and Maintenance occupations in Hays County are Construction & Extraction (7,656 | 6.1%), Installation, Maintenance & Repair (3,767 | 3.0%), and Farming, Fishing & Forestry (15 | 0.0%).
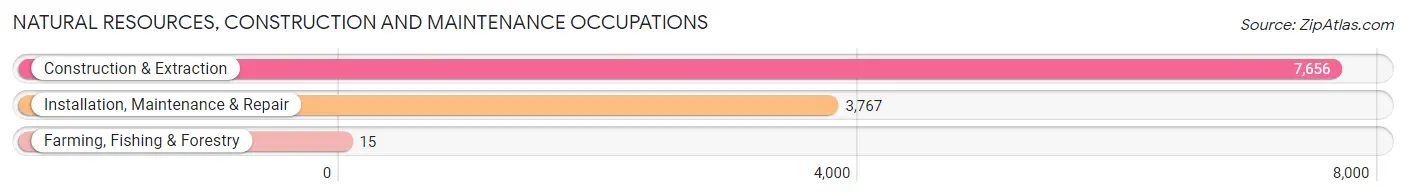
Natural Resources, Construction and Maintenance Occupations by Sex
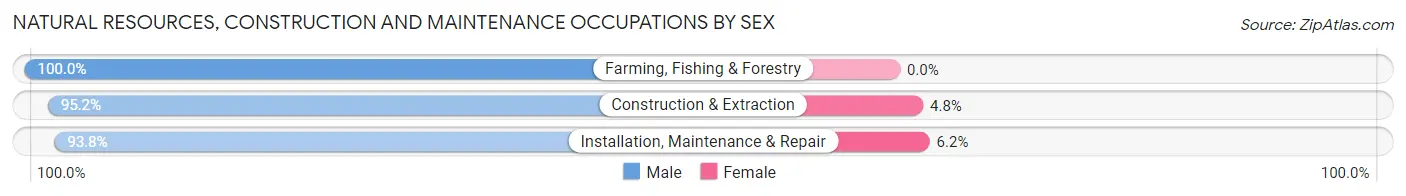
| Occupation | Male | Female |
| Farming, Fishing & Forestry | 15 (100.0%) | 0 (0.0%) |
| Construction & Extraction | 7,286 (95.2%) | 370 (4.8%) |
| Installation, Maintenance & Repair | 3,534 (93.8%) | 233 (6.2%) |
| Total (Category) | 10,835 (94.7%) | 603 (5.3%) |
| Total (Overall) | 68,453 (54.6%) | 56,961 (45.4%) |
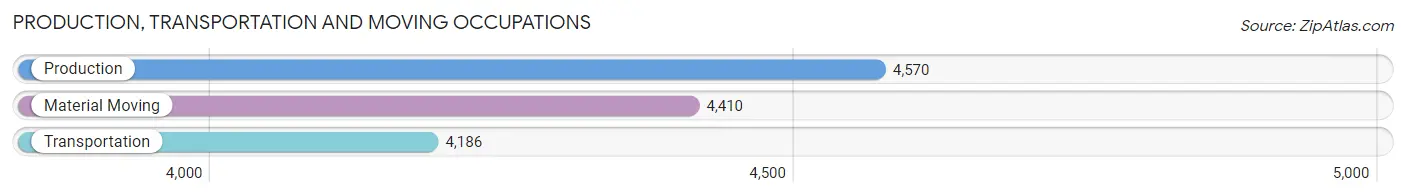
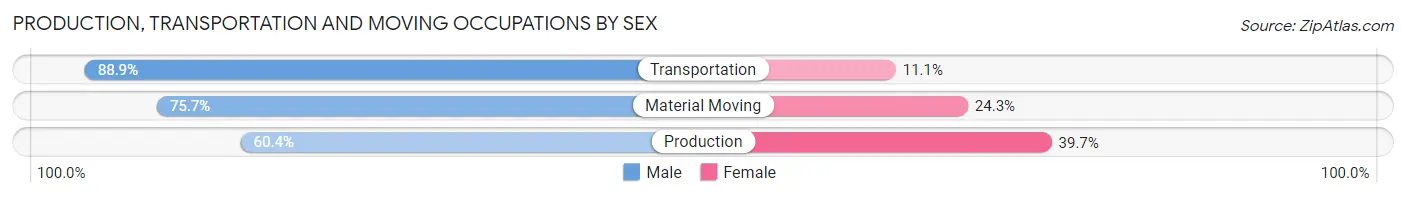
Production, Transportation and Moving Occupations
The most common Production, Transportation and Moving occupations in Hays County are Production (4,570 | 3.6%), Material Moving (4,410 | 3.5%), and Transportation (4,186 | 3.3%).
Production, Transportation and Moving Occupations by Sex
| Occupation | Male | Female |
| Production | 2,758 (60.4%) | 1,812 (39.7%) |
| Transportation | 3,723 (88.9%) | 463 (11.1%) |
| Material Moving | 3,339 (75.7%) | 1,071 (24.3%) |
| Total (Category) | 9,820 (74.6%) | 3,346 (25.4%) |
| Total (Overall) | 68,453 (54.6%) | 56,961 (45.4%) |
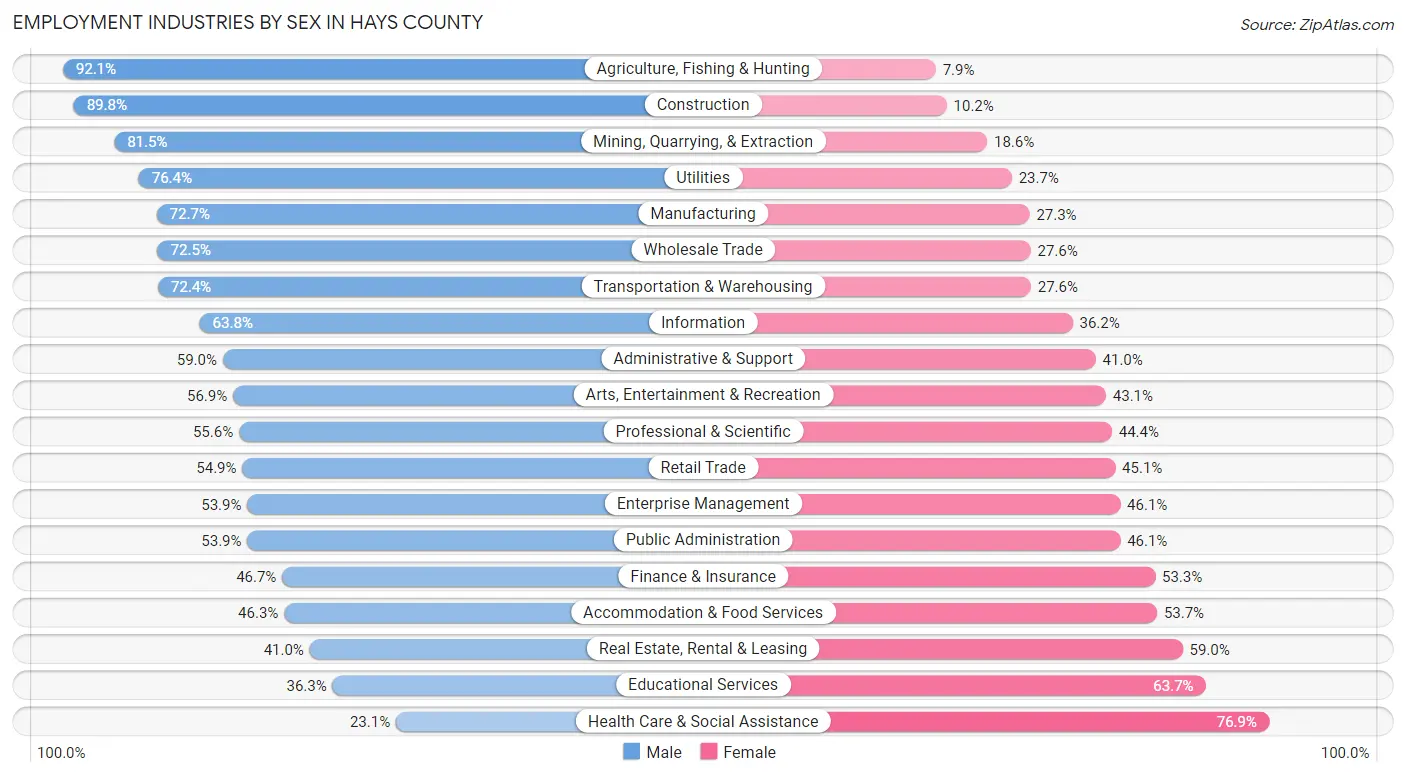
Employment Industries by Sex in Hays County
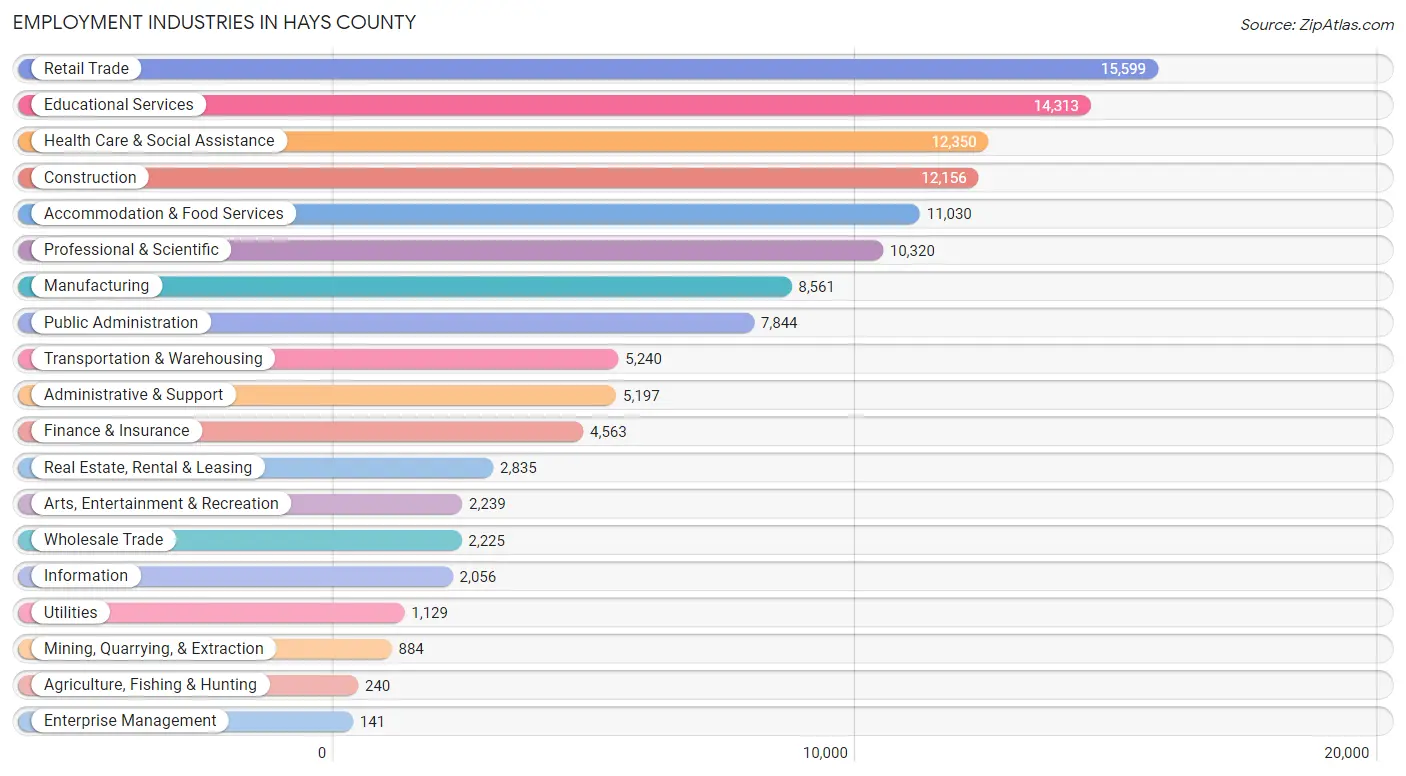
Employment Industries in Hays County
The major employment industries in Hays County include Retail Trade (15,599 | 12.4%), Educational Services (14,313 | 11.4%), Health Care & Social Assistance (12,350 | 9.9%), Construction (12,156 | 9.7%), and Accommodation & Food Services (11,030 | 8.8%).
Employment Industries by Sex in Hays County
The Hays County industries that see more men than women are Agriculture, Fishing & Hunting (92.1%), Construction (89.8%), and Mining, Quarrying, & Extraction (81.5%), whereas the industries that tend to have a higher number of women are Health Care & Social Assistance (76.9%), Educational Services (63.7%), and Real Estate, Rental & Leasing (59.0%).
| Industry | Male | Female |
| Agriculture, Fishing & Hunting | 221 (92.1%) | 19 (7.9%) |
| Mining, Quarrying, & Extraction | 720 (81.5%) | 164 (18.5%) |
| Construction | 10,918 (89.8%) | 1,238 (10.2%) |
| Manufacturing | 6,221 (72.7%) | 2,340 (27.3%) |
| Wholesale Trade | 1,612 (72.5%) | 613 (27.6%) |
| Retail Trade | 8,568 (54.9%) | 7,031 (45.1%) |
| Transportation & Warehousing | 3,794 (72.4%) | 1,446 (27.6%) |
| Utilities | 862 (76.3%) | 267 (23.6%) |
| Information | 1,311 (63.8%) | 745 (36.2%) |
| Finance & Insurance | 2,130 (46.7%) | 2,433 (53.3%) |
| Real Estate, Rental & Leasing | 1,162 (41.0%) | 1,673 (59.0%) |
| Professional & Scientific | 5,740 (55.6%) | 4,580 (44.4%) |
| Enterprise Management | 76 (53.9%) | 65 (46.1%) |
| Administrative & Support | 3,065 (59.0%) | 2,132 (41.0%) |
| Educational Services | 5,190 (36.3%) | 9,123 (63.7%) |
| Health Care & Social Assistance | 2,856 (23.1%) | 9,494 (76.9%) |
| Arts, Entertainment & Recreation | 1,273 (56.9%) | 966 (43.1%) |
| Accommodation & Food Services | 5,105 (46.3%) | 5,925 (53.7%) |
| Public Administration | 4,227 (53.9%) | 3,617 (46.1%) |
| Total | 68,453 (54.6%) | 56,961 (45.4%) |
Education in Hays County
School Enrollment in Hays County
The most common levels of schooling among the 76,064 students in Hays County are college / undergraduate (27,381 | 36.0%), high school (13,299 | 17.5%), and elementary school (13,271 | 17.4%).
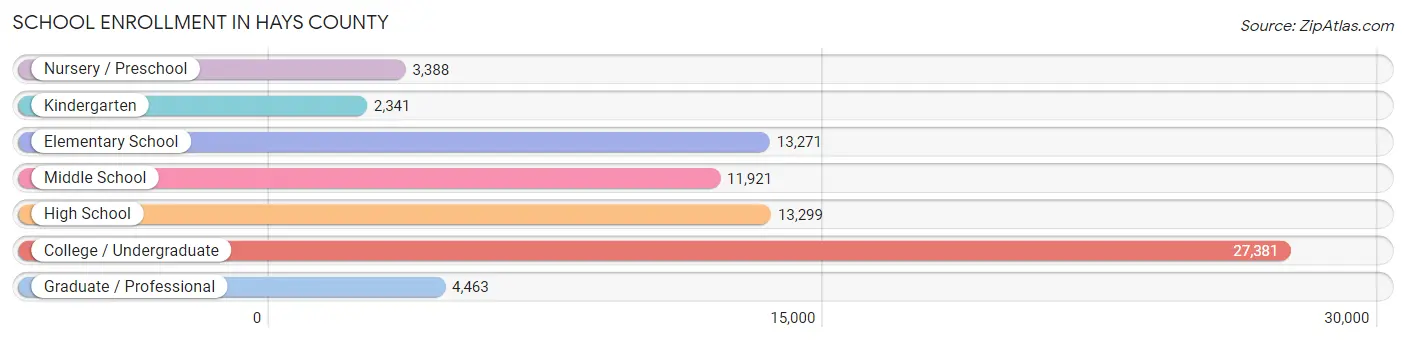
| School Level | # Students | % Students |
| Nursery / Preschool | 3,388 | 4.4% |
| Kindergarten | 2,341 | 3.1% |
| Elementary School | 13,271 | 17.4% |
| Middle School | 11,921 | 15.7% |
| High School | 13,299 | 17.5% |
| College / Undergraduate | 27,381 | 36.0% |
| Graduate / Professional | 4,463 | 5.9% |
| Total | 76,064 | 100.0% |
School Enrollment by Age by Funding Source in Hays County
Out of a total of 76,064 students who are enrolled in schools in Hays County, 8,139 (10.7%) attend a private institution, while the remaining 67,925 (89.3%) are enrolled in public schools. The age group of 3 to 4 year olds has the highest likelihood of being enrolled in private schools, with 914 (41.7% in the age bracket) enrolled. Conversely, the age group of 20 to 24 year olds has the lowest likelihood of being enrolled in a private school, with 16,125 (94.2% in the age bracket) attending a public institution.
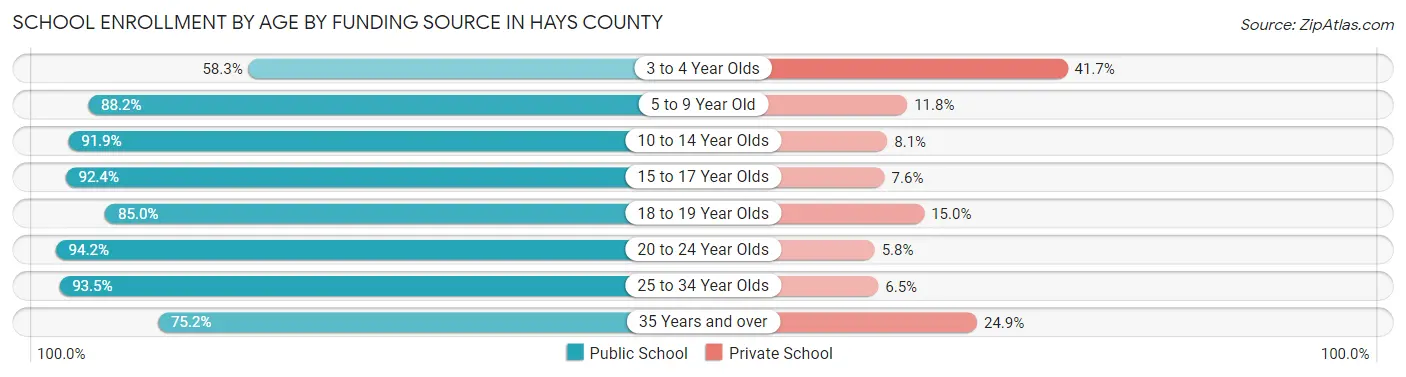
| Age Bracket | Public School | Private School |
| 3 to 4 Year Olds | 1,278 (58.3%) | 914 (41.7%) |
| 5 to 9 Year Old | 13,427 (88.2%) | 1,803 (11.8%) |
| 10 to 14 Year Olds | 13,842 (91.9%) | 1,226 (8.1%) |
| 15 to 17 Year Olds | 8,674 (92.4%) | 717 (7.6%) |
| 18 to 19 Year Olds | 7,461 (85.0%) | 1,318 (15.0%) |
| 20 to 24 Year Olds | 16,125 (94.2%) | 991 (5.8%) |
| 25 to 34 Year Olds | 4,561 (93.5%) | 315 (6.5%) |
| 35 Years and over | 2,564 (75.1%) | 848 (24.8%) |
| Total | 67,925 (89.3%) | 8,139 (10.7%) |
Educational Attainment by Field of Study in Hays County
Business (11,486 | 17.6%), education (7,321 | 11.2%), science & technology (5,461 | 8.4%), arts & humanities (5,327 | 8.2%), and social sciences (5,228 | 8.0%) are the most common fields of study among 65,221 individuals in Hays County who have obtained a bachelor's degree or higher.
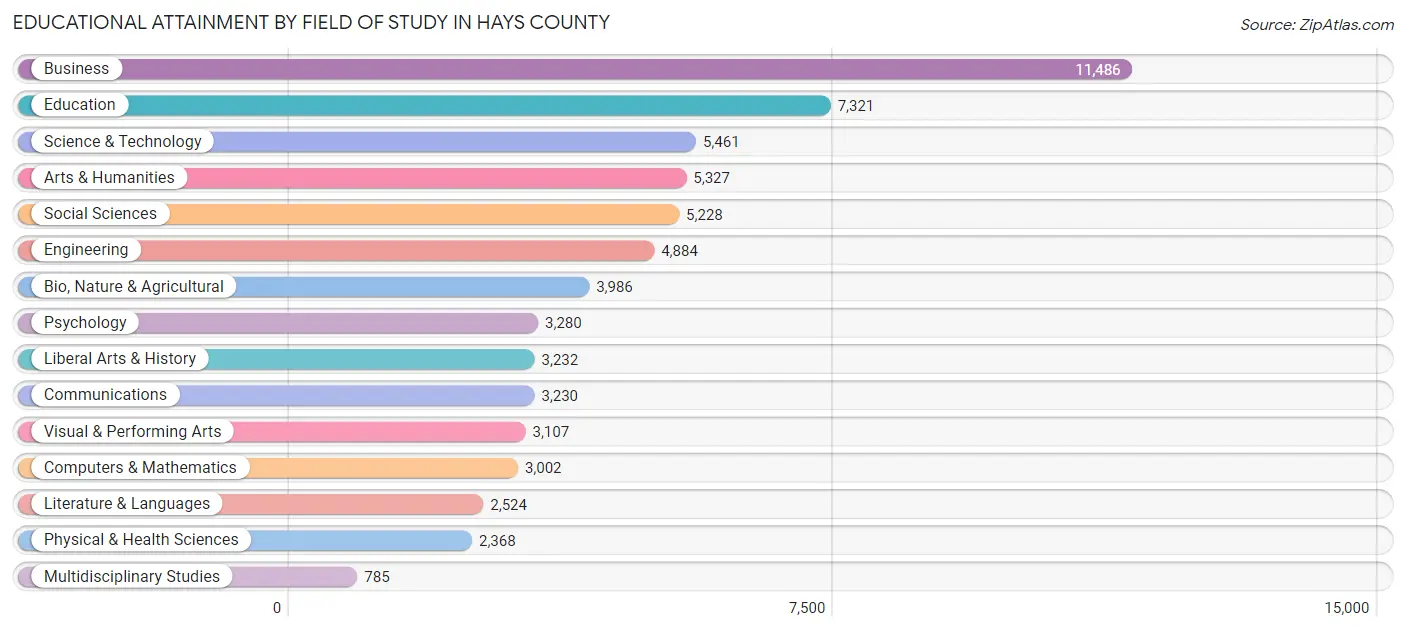
| Field of Study | # Graduates | % Graduates |
| Computers & Mathematics | 3,002 | 4.6% |
| Bio, Nature & Agricultural | 3,986 | 6.1% |
| Physical & Health Sciences | 2,368 | 3.6% |
| Psychology | 3,280 | 5.0% |
| Social Sciences | 5,228 | 8.0% |
| Engineering | 4,884 | 7.5% |
| Multidisciplinary Studies | 785 | 1.2% |
| Science & Technology | 5,461 | 8.4% |
| Business | 11,486 | 17.6% |
| Education | 7,321 | 11.2% |
| Literature & Languages | 2,524 | 3.9% |
| Liberal Arts & History | 3,232 | 5.0% |
| Visual & Performing Arts | 3,107 | 4.8% |
| Communications | 3,230 | 5.0% |
| Arts & Humanities | 5,327 | 8.2% |
| Total | 65,221 | 100.0% |
Transportation & Commute in Hays County
Vehicle Availability by Sex in Hays County
The most prevalent vehicle ownership categories in Hays County are males with 2 vehicles (31,385, accounting for 46.5%) and females with 2 vehicles (26,090, making up 57.0%).
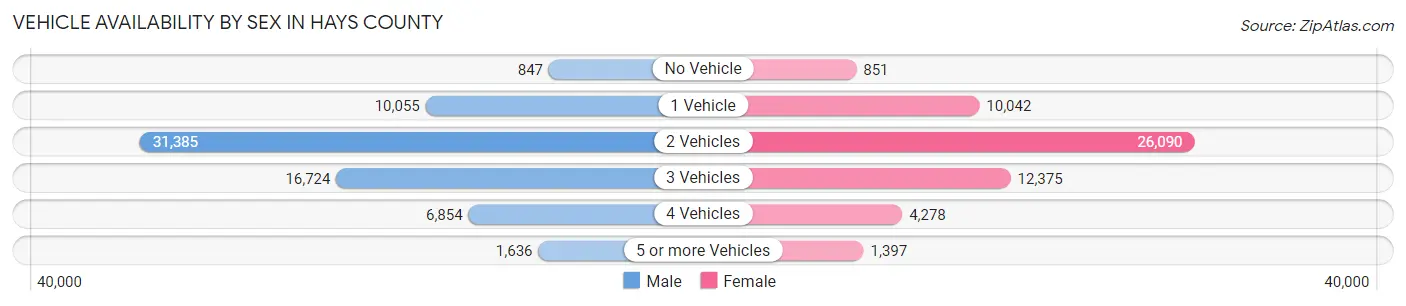
| Vehicles Available | Male | Female |
| No Vehicle | 847 (1.3%) | 851 (1.5%) |
| 1 Vehicle | 10,055 (14.9%) | 10,042 (18.2%) |
| 2 Vehicles | 31,385 (46.5%) | 26,090 (47.4%) |
| 3 Vehicles | 16,724 (24.8%) | 12,375 (22.5%) |
| 4 Vehicles | 6,854 (10.2%) | 4,278 (7.8%) |
| 5 or more Vehicles | 1,636 (2.4%) | 1,397 (2.5%) |
| Total | 67,501 (100.0%) | 55,033 (100.0%) |
Commute Time in Hays County
The most frequently occuring commute durations in Hays County are 45 to 59 minutes (15,137 commuters, 14.1%), 30 to 34 minutes (14,033 commuters, 13.1%), and 10 to 14 minutes (12,749 commuters, 11.9%).
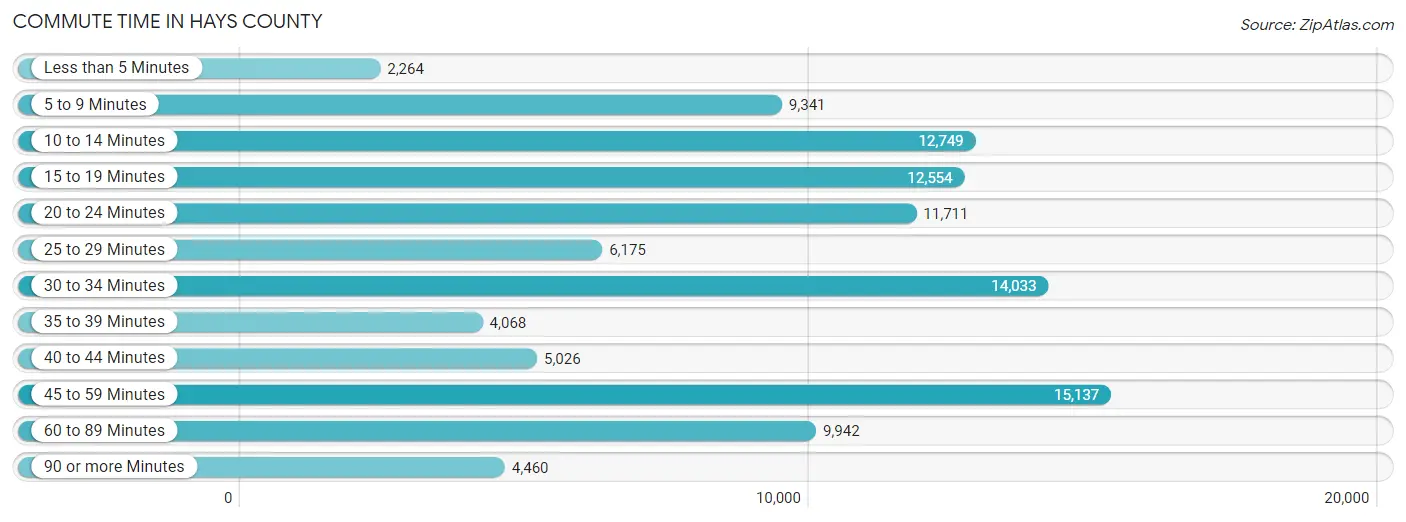
| Commute Time | # Commuters | % Commuters |
| Less than 5 Minutes | 2,264 | 2.1% |
| 5 to 9 Minutes | 9,341 | 8.7% |
| 10 to 14 Minutes | 12,749 | 11.9% |
| 15 to 19 Minutes | 12,554 | 11.7% |
| 20 to 24 Minutes | 11,711 | 10.9% |
| 25 to 29 Minutes | 6,175 | 5.8% |
| 30 to 34 Minutes | 14,033 | 13.1% |
| 35 to 39 Minutes | 4,068 | 3.8% |
| 40 to 44 Minutes | 5,026 | 4.7% |
| 45 to 59 Minutes | 15,137 | 14.1% |
| 60 to 89 Minutes | 9,942 | 9.2% |
| 90 or more Minutes | 4,460 | 4.2% |
Commute Time by Sex in Hays County
The most common commute times in Hays County are 45 to 59 minutes (8,171 commuters, 13.7%) for males and 45 to 59 minutes (6,966 commuters, 14.6%) for females.
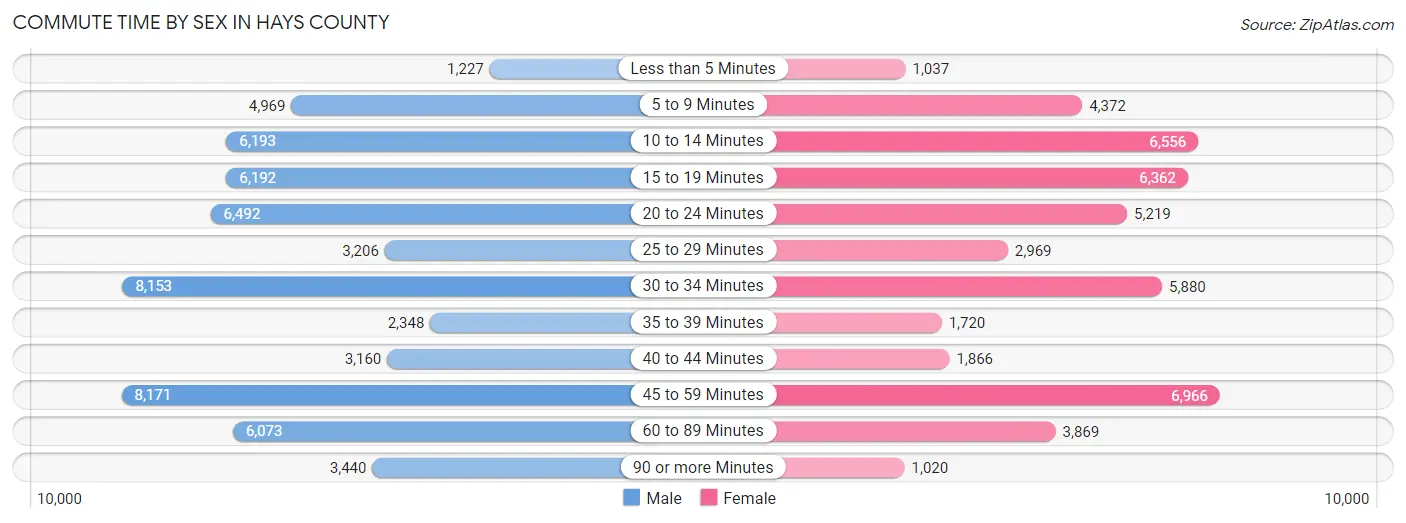
| Commute Time | Male | Female |
| Less than 5 Minutes | 1,227 (2.1%) | 1,037 (2.2%) |
| 5 to 9 Minutes | 4,969 (8.3%) | 4,372 (9.1%) |
| 10 to 14 Minutes | 6,193 (10.4%) | 6,556 (13.7%) |
| 15 to 19 Minutes | 6,192 (10.4%) | 6,362 (13.3%) |
| 20 to 24 Minutes | 6,492 (10.9%) | 5,219 (10.9%) |
| 25 to 29 Minutes | 3,206 (5.4%) | 2,969 (6.2%) |
| 30 to 34 Minutes | 8,153 (13.7%) | 5,880 (12.3%) |
| 35 to 39 Minutes | 2,348 (3.9%) | 1,720 (3.6%) |
| 40 to 44 Minutes | 3,160 (5.3%) | 1,866 (3.9%) |
| 45 to 59 Minutes | 8,171 (13.7%) | 6,966 (14.6%) |
| 60 to 89 Minutes | 6,073 (10.2%) | 3,869 (8.1%) |
| 90 or more Minutes | 3,440 (5.8%) | 1,020 (2.1%) |
Time of Departure to Work by Sex in Hays County
The most frequent times of departure to work in Hays County are 7:00 AM to 7:29 AM (8,545, 14.3%) for males and 7:00 AM to 7:29 AM (7,063, 14.8%) for females.
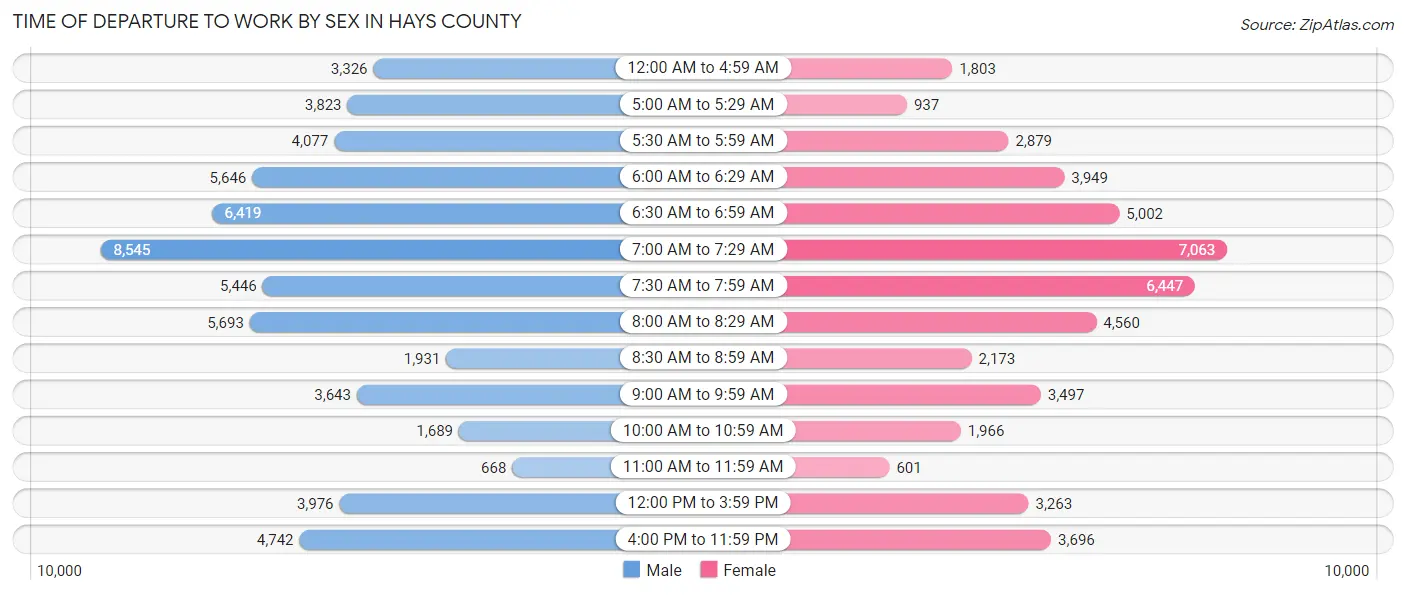
| Time of Departure | Male | Female |
| 12:00 AM to 4:59 AM | 3,326 (5.6%) | 1,803 (3.8%) |
| 5:00 AM to 5:29 AM | 3,823 (6.4%) | 937 (2.0%) |
| 5:30 AM to 5:59 AM | 4,077 (6.8%) | 2,879 (6.0%) |
| 6:00 AM to 6:29 AM | 5,646 (9.5%) | 3,949 (8.3%) |
| 6:30 AM to 6:59 AM | 6,419 (10.8%) | 5,002 (10.5%) |
| 7:00 AM to 7:29 AM | 8,545 (14.3%) | 7,063 (14.8%) |
| 7:30 AM to 7:59 AM | 5,446 (9.1%) | 6,447 (13.5%) |
| 8:00 AM to 8:29 AM | 5,693 (9.6%) | 4,560 (9.5%) |
| 8:30 AM to 8:59 AM | 1,931 (3.2%) | 2,173 (4.5%) |
| 9:00 AM to 9:59 AM | 3,643 (6.1%) | 3,497 (7.3%) |
| 10:00 AM to 10:59 AM | 1,689 (2.8%) | 1,966 (4.1%) |
| 11:00 AM to 11:59 AM | 668 (1.1%) | 601 (1.3%) |
| 12:00 PM to 3:59 PM | 3,976 (6.7%) | 3,263 (6.8%) |
| 4:00 PM to 11:59 PM | 4,742 (8.0%) | 3,696 (7.7%) |
| Total | 59,624 (100.0%) | 47,836 (100.0%) |
Housing Occupancy in Hays County
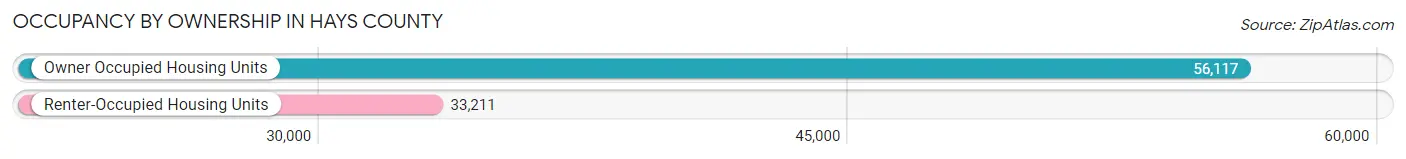
Occupancy by Ownership in Hays County
Of the total 89,328 dwellings in Hays County, owner-occupied units account for 56,117 (62.8%), while renter-occupied units make up 33,211 (37.2%).
| Occupancy | # Housing Units | % Housing Units |
| Owner Occupied Housing Units | 56,117 | 62.8% |
| Renter-Occupied Housing Units | 33,211 | 37.2% |
| Total Occupied Housing Units | 89,328 | 100.0% |
Occupancy by Household Size in Hays County
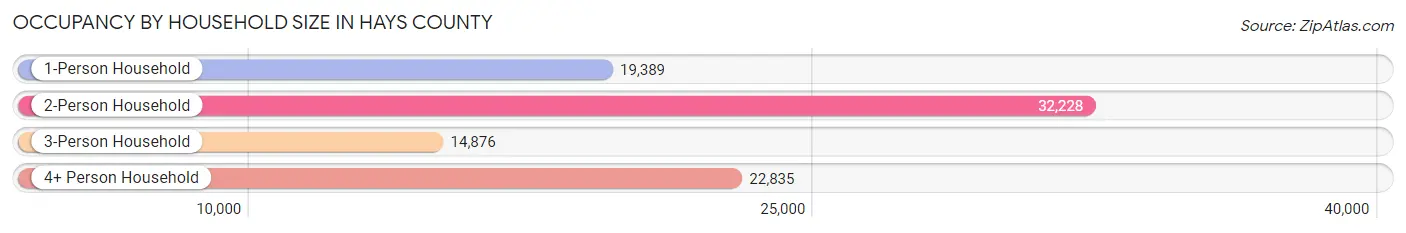
| Household Size | # Housing Units | % Housing Units |
| 1-Person Household | 19,389 | 21.7% |
| 2-Person Household | 32,228 | 36.1% |
| 3-Person Household | 14,876 | 16.7% |
| 4+ Person Household | 22,835 | 25.6% |
| Total Housing Units | 89,328 | 100.0% |
Occupancy by Ownership by Household Size in Hays County
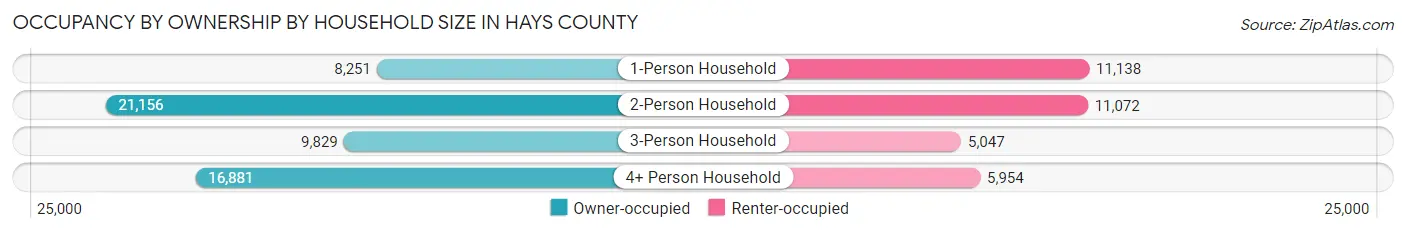
| Household Size | Owner-occupied | Renter-occupied |
| 1-Person Household | 8,251 (42.6%) | 11,138 (57.4%) |
| 2-Person Household | 21,156 (65.6%) | 11,072 (34.4%) |
| 3-Person Household | 9,829 (66.1%) | 5,047 (33.9%) |
| 4+ Person Household | 16,881 (73.9%) | 5,954 (26.1%) |
| Total Housing Units | 56,117 (62.8%) | 33,211 (37.2%) |
Occupancy by Educational Attainment in Hays County
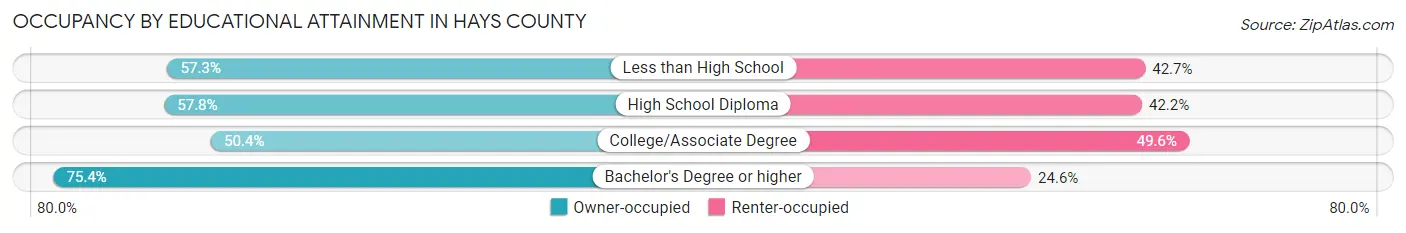
| Household Size | Owner-occupied | Renter-occupied |
| Less than High School | 3,611 (57.3%) | 2,689 (42.7%) |
| High School Diploma | 9,694 (57.8%) | 7,068 (42.2%) |
| College/Associate Degree | 14,451 (50.4%) | 14,213 (49.6%) |
| Bachelor's Degree or higher | 28,361 (75.4%) | 9,241 (24.6%) |
Occupancy by Age of Householder in Hays County
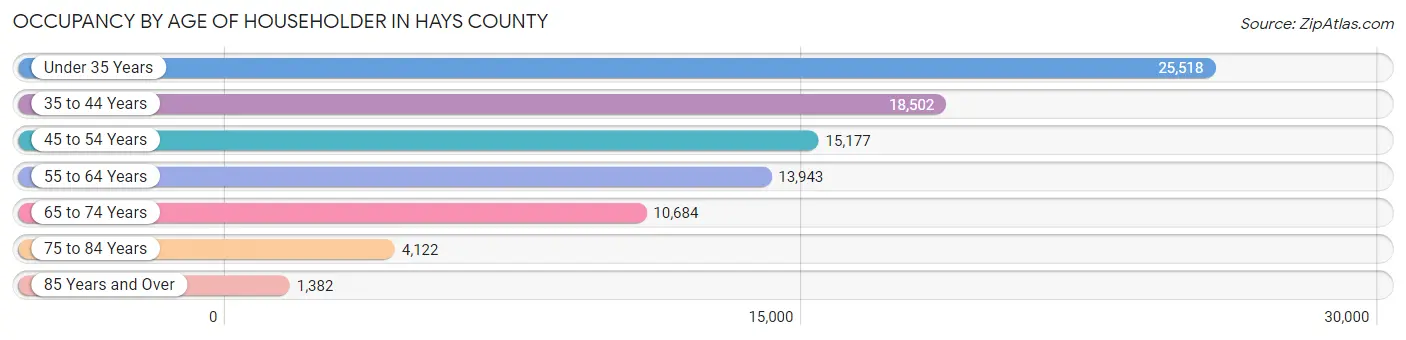
| Age Bracket | # Households | % Households |
| Under 35 Years | 25,518 | 28.6% |
| 35 to 44 Years | 18,502 | 20.7% |
| 45 to 54 Years | 15,177 | 17.0% |
| 55 to 64 Years | 13,943 | 15.6% |
| 65 to 74 Years | 10,684 | 12.0% |
| 75 to 84 Years | 4,122 | 4.6% |
| 85 Years and Over | 1,382 | 1.5% |
| Total | 89,328 | 100.0% |
Housing Finances in Hays County
Median Income by Occupancy in Hays County
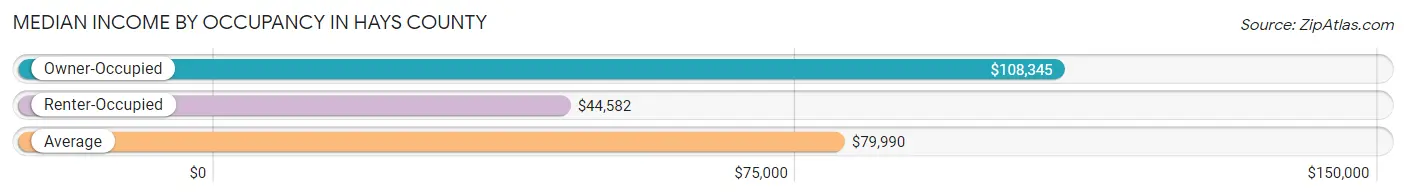
| Occupancy Type | # Households | Median Income |
| Owner-Occupied | 56,117 (62.8%) | $108,345 |
| Renter-Occupied | 33,211 (37.2%) | $44,582 |
| Average | 89,328 (100.0%) | $79,990 |
Occupancy by Householder Income Bracket in Hays County
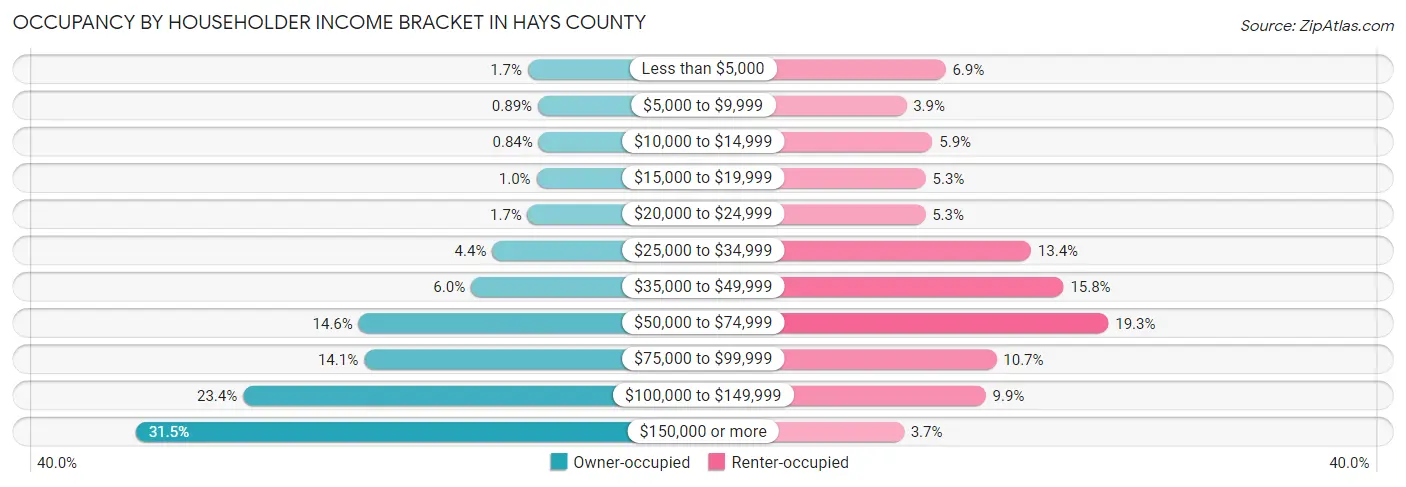
| Income Bracket | Owner-occupied | Renter-occupied |
| Less than $5,000 | 933 (1.7%) | 2,276 (6.9%) |
| $5,000 to $9,999 | 500 (0.9%) | 1,283 (3.9%) |
| $10,000 to $14,999 | 471 (0.8%) | 1,944 (5.9%) |
| $15,000 to $19,999 | 559 (1.0%) | 1,775 (5.3%) |
| $20,000 to $24,999 | 935 (1.7%) | 1,763 (5.3%) |
| $25,000 to $34,999 | 2,453 (4.4%) | 4,437 (13.4%) |
| $35,000 to $49,999 | 3,362 (6.0%) | 5,262 (15.8%) |
| $50,000 to $74,999 | 8,166 (14.5%) | 6,397 (19.3%) |
| $75,000 to $99,999 | 7,937 (14.1%) | 3,563 (10.7%) |
| $100,000 to $149,999 | 13,107 (23.4%) | 3,291 (9.9%) |
| $150,000 or more | 17,694 (31.5%) | 1,220 (3.7%) |
| Total | 56,117 (100.0%) | 33,211 (100.0%) |
Monthly Housing Cost Tiers in Hays County
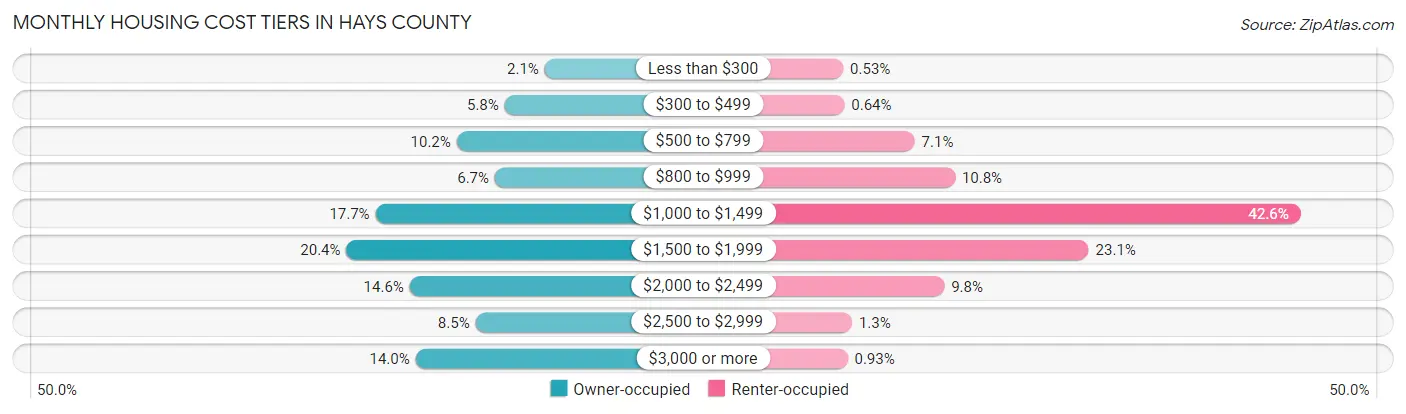
| Monthly Cost | Owner-occupied | Renter-occupied |
| Less than $300 | 1,191 (2.1%) | 177 (0.5%) |
| $300 to $499 | 3,261 (5.8%) | 214 (0.6%) |
| $500 to $799 | 5,740 (10.2%) | 2,360 (7.1%) |
| $800 to $999 | 3,768 (6.7%) | 3,594 (10.8%) |
| $1,000 to $1,499 | 9,935 (17.7%) | 14,160 (42.6%) |
| $1,500 to $1,999 | 11,437 (20.4%) | 7,682 (23.1%) |
| $2,000 to $2,499 | 8,163 (14.5%) | 3,263 (9.8%) |
| $2,500 to $2,999 | 4,762 (8.5%) | 446 (1.3%) |
| $3,000 or more | 7,860 (14.0%) | 309 (0.9%) |
| Total | 56,117 (100.0%) | 33,211 (100.0%) |
Physical Housing Characteristics in Hays County
Housing Structures in Hays County
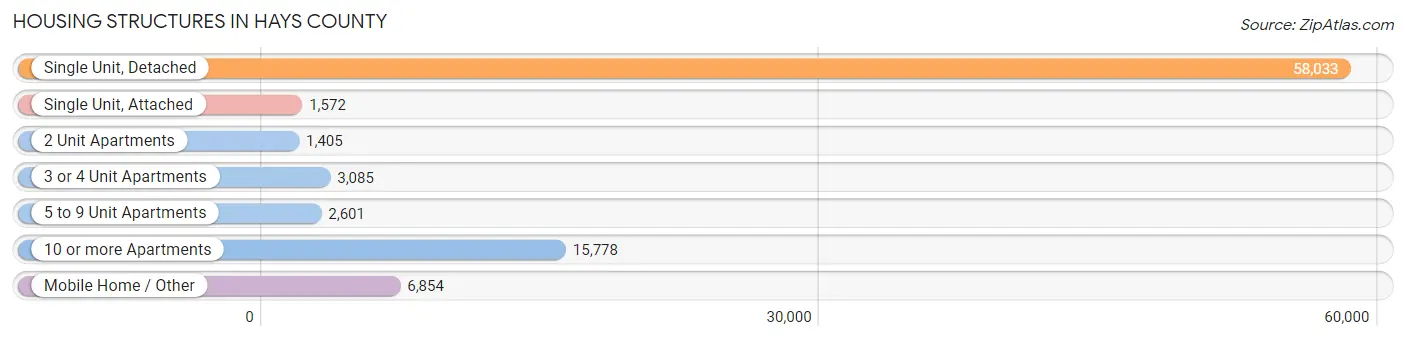
| Structure Type | # Housing Units | % Housing Units |
| Single Unit, Detached | 58,033 | 65.0% |
| Single Unit, Attached | 1,572 | 1.8% |
| 2 Unit Apartments | 1,405 | 1.6% |
| 3 or 4 Unit Apartments | 3,085 | 3.5% |
| 5 to 9 Unit Apartments | 2,601 | 2.9% |
| 10 or more Apartments | 15,778 | 17.7% |
| Mobile Home / Other | 6,854 | 7.7% |
| Total | 89,328 | 100.0% |
Housing Structures by Occupancy in Hays County
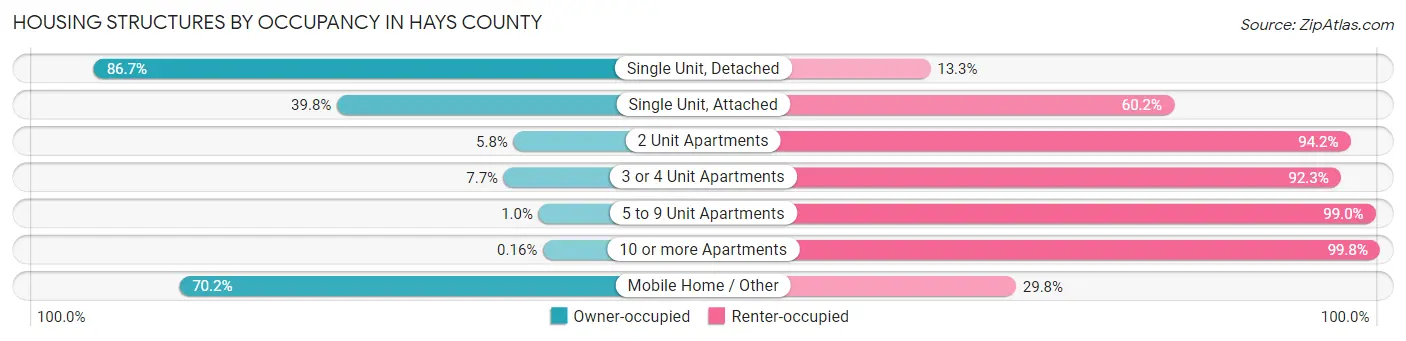
| Structure Type | Owner-occupied | Renter-occupied |
| Single Unit, Detached | 50,306 (86.7%) | 7,727 (13.3%) |
| Single Unit, Attached | 626 (39.8%) | 946 (60.2%) |
| 2 Unit Apartments | 82 (5.8%) | 1,323 (94.2%) |
| 3 or 4 Unit Apartments | 238 (7.7%) | 2,847 (92.3%) |
| 5 to 9 Unit Apartments | 26 (1.0%) | 2,575 (99.0%) |
| 10 or more Apartments | 26 (0.2%) | 15,752 (99.8%) |
| Mobile Home / Other | 4,813 (70.2%) | 2,041 (29.8%) |
| Total | 56,117 (62.8%) | 33,211 (37.2%) |
Housing Structures by Number of Rooms in Hays County
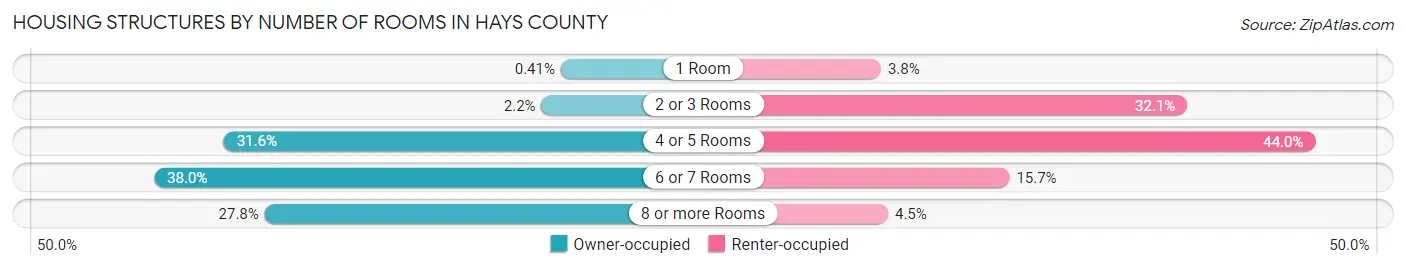
| Number of Rooms | Owner-occupied | Renter-occupied |
| 1 Room | 228 (0.4%) | 1,263 (3.8%) |
| 2 or 3 Rooms | 1,232 (2.2%) | 10,665 (32.1%) |
| 4 or 5 Rooms | 17,720 (31.6%) | 14,599 (44.0%) |
| 6 or 7 Rooms | 21,335 (38.0%) | 5,207 (15.7%) |
| 8 or more Rooms | 15,602 (27.8%) | 1,477 (4.4%) |
| Total | 56,117 (100.0%) | 33,211 (100.0%) |
Housing Structure by Heating Type in Hays County
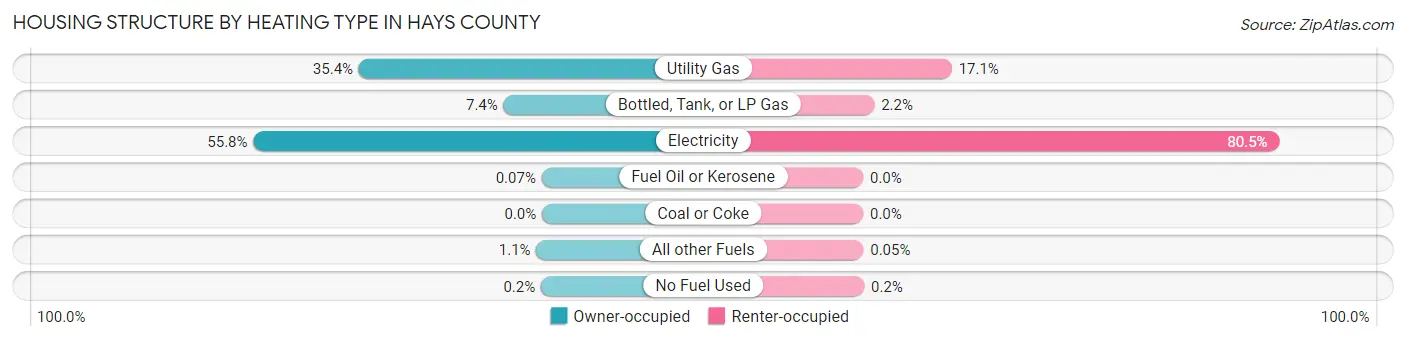
| Heating Type | Owner-occupied | Renter-occupied |
| Utility Gas | 19,863 (35.4%) | 5,690 (17.1%) |
| Bottled, Tank, or LP Gas | 4,177 (7.4%) | 718 (2.2%) |
| Electricity | 31,306 (55.8%) | 26,721 (80.5%) |
| Fuel Oil or Kerosene | 38 (0.1%) | 0 (0.0%) |
| Coal or Coke | 0 (0.0%) | 0 (0.0%) |
| All other Fuels | 620 (1.1%) | 15 (0.1%) |
| No Fuel Used | 113 (0.2%) | 67 (0.2%) |
| Total | 56,117 (100.0%) | 33,211 (100.0%) |
Household Vehicle Usage in Hays County
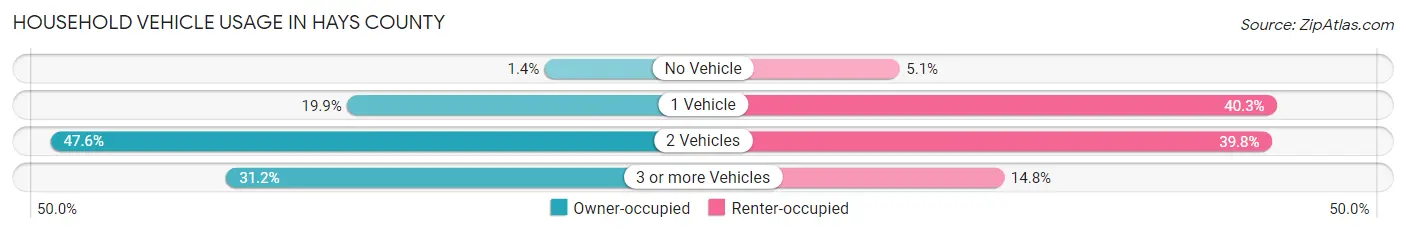
| Vehicles per Household | Owner-occupied | Renter-occupied |
| No Vehicle | 793 (1.4%) | 1,686 (5.1%) |
| 1 Vehicle | 11,138 (19.9%) | 13,379 (40.3%) |
| 2 Vehicles | 26,694 (47.6%) | 13,217 (39.8%) |
| 3 or more Vehicles | 17,492 (31.2%) | 4,929 (14.8%) |
| Total | 56,117 (100.0%) | 33,211 (100.0%) |
Real Estate & Mortgages in Hays County
Real Estate and Mortgage Overview in Hays County
| Characteristic | Without Mortgage | With Mortgage |
| Housing Units | 18,225 | 37,892 |
| Median Property Value | $329,600 | $338,200 |
| Median Household Income | $84,597 | $13,399 |
| Monthly Housing Costs | $795 | $7,839 |
| Real Estate Taxes | $5,522 | $1,148 |
Property Value by Mortgage Status in Hays County
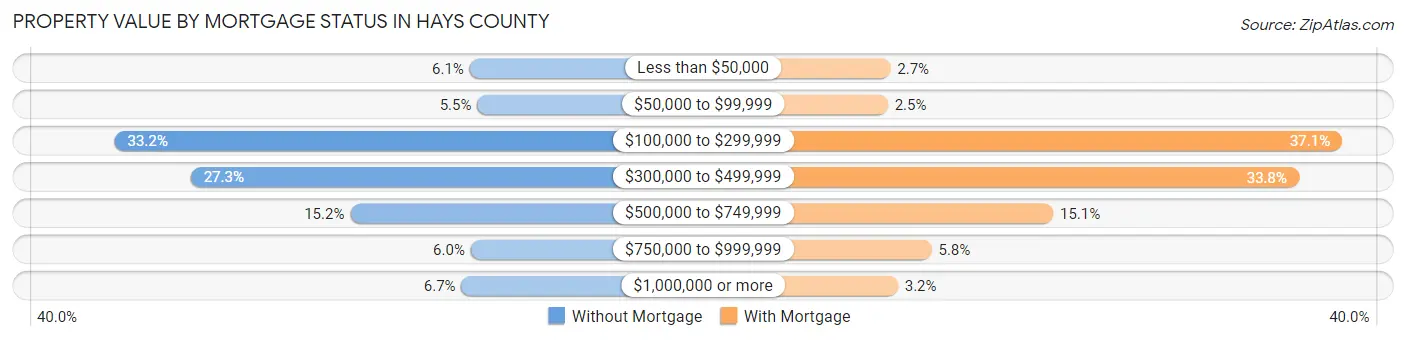
| Property Value | Without Mortgage | With Mortgage |
| Less than $50,000 | 1,110 (6.1%) | 1,004 (2.6%) |
| $50,000 to $99,999 | 1,004 (5.5%) | 929 (2.5%) |
| $100,000 to $299,999 | 6,042 (33.2%) | 14,043 (37.1%) |
| $300,000 to $499,999 | 4,982 (27.3%) | 12,798 (33.8%) |
| $500,000 to $749,999 | 2,768 (15.2%) | 5,704 (15.0%) |
| $750,000 to $999,999 | 1,095 (6.0%) | 2,195 (5.8%) |
| $1,000,000 or more | 1,224 (6.7%) | 1,219 (3.2%) |
| Total | 18,225 (100.0%) | 37,892 (100.0%) |
Household Income by Mortgage Status in Hays County
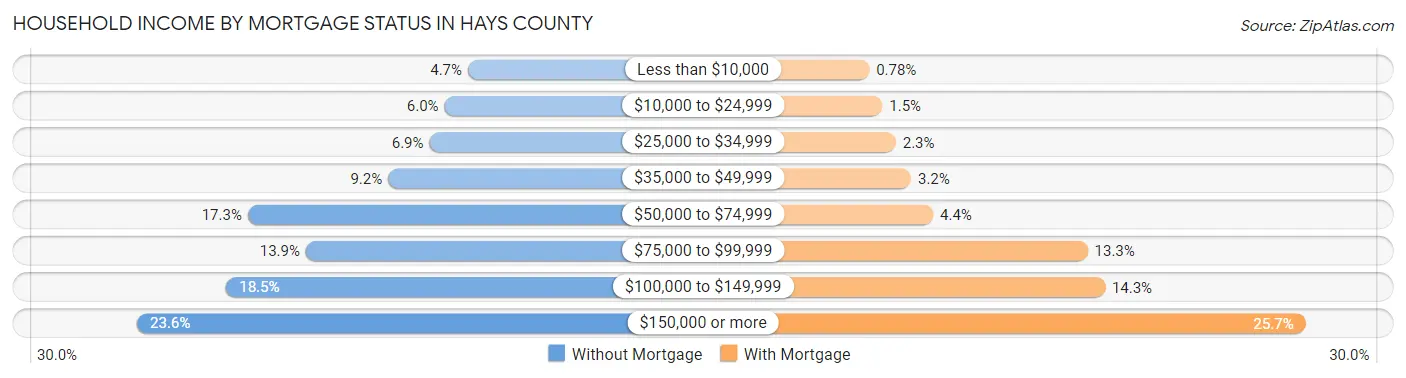
| Household Income | Without Mortgage | With Mortgage |
| Less than $10,000 | 852 (4.7%) | 296 (0.8%) |
| $10,000 to $24,999 | 1,095 (6.0%) | 581 (1.5%) |
| $25,000 to $34,999 | 1,252 (6.9%) | 870 (2.3%) |
| $35,000 to $49,999 | 1,683 (9.2%) | 1,201 (3.2%) |
| $50,000 to $74,999 | 3,143 (17.2%) | 1,679 (4.4%) |
| $75,000 to $99,999 | 2,539 (13.9%) | 5,023 (13.3%) |
| $100,000 to $149,999 | 3,366 (18.5%) | 5,398 (14.2%) |
| $150,000 or more | 4,295 (23.6%) | 9,741 (25.7%) |
| Total | 18,225 (100.0%) | 37,892 (100.0%) |
Property Value to Household Income Ratio in Hays County
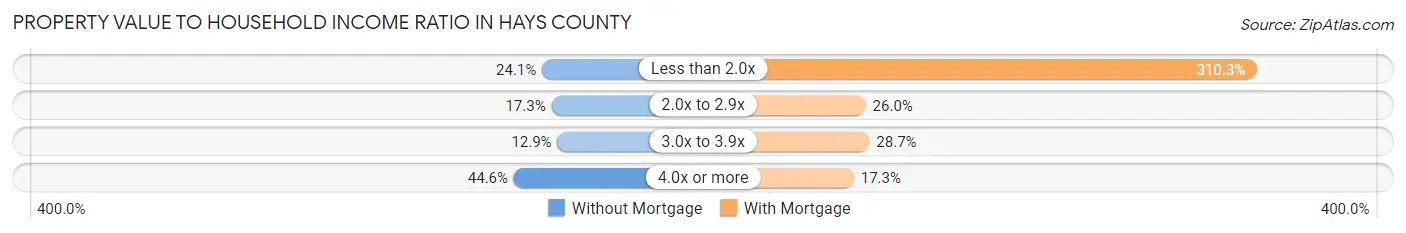
| Value-to-Income Ratio | Without Mortgage | With Mortgage |
| Less than 2.0x | 4,385 (24.1%) | 117,593 (310.3%) |
| 2.0x to 2.9x | 3,144 (17.2%) | 9,840 (26.0%) |
| 3.0x to 3.9x | 2,353 (12.9%) | 10,867 (28.7%) |
| 4.0x or more | 8,126 (44.6%) | 6,571 (17.3%) |
| Total | 18,225 (100.0%) | 37,892 (100.0%) |
Real Estate Taxes by Mortgage Status in Hays County
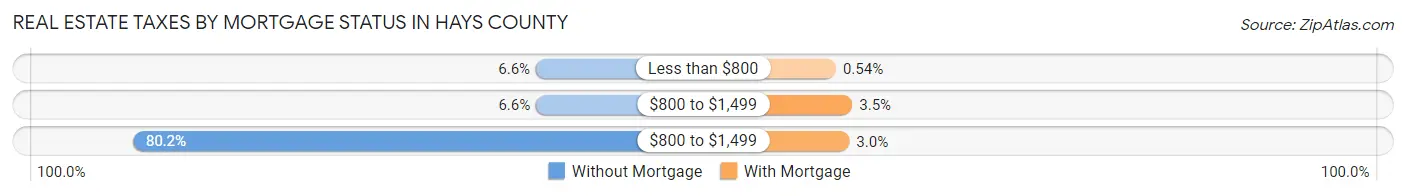
| Property Taxes | Without Mortgage | With Mortgage |
| Less than $800 | 1,204 (6.6%) | 204 (0.5%) |
| $800 to $1,499 | 1,201 (6.6%) | 1,334 (3.5%) |
| $800 to $1,499 | 14,622 (80.2%) | 1,133 (3.0%) |
| Total | 18,225 (100.0%) | 37,892 (100.0%) |
Health & Disability in Hays County
Health Insurance Coverage by Age in Hays County
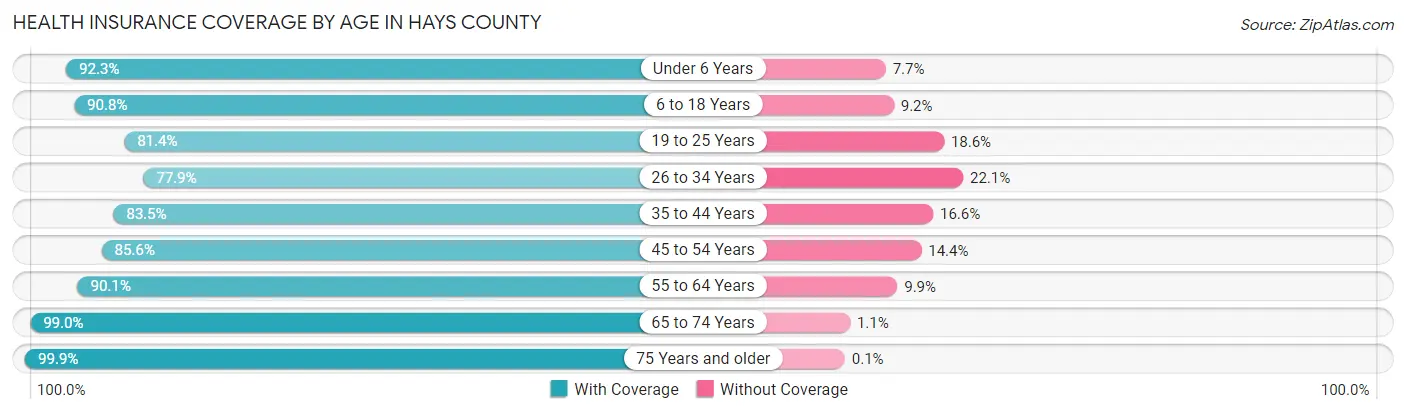
| Age Bracket | With Coverage | Without Coverage |
| Under 6 Years | 16,079 (92.3%) | 1,347 (7.7%) |
| 6 to 18 Years | 38,861 (90.8%) | 3,951 (9.2%) |
| 19 to 25 Years | 31,811 (81.4%) | 7,260 (18.6%) |
| 26 to 34 Years | 22,905 (77.9%) | 6,512 (22.1%) |
| 35 to 44 Years | 29,207 (83.5%) | 5,791 (16.6%) |
| 45 to 54 Years | 23,435 (85.6%) | 3,930 (14.4%) |
| 55 to 64 Years | 22,215 (90.1%) | 2,436 (9.9%) |
| 65 to 74 Years | 18,225 (99.0%) | 194 (1.1%) |
| 75 Years and older | 9,232 (99.9%) | 9 (0.1%) |
| Total | 211,970 (87.1%) | 31,430 (12.9%) |
Health Insurance Coverage by Citizenship Status in Hays County
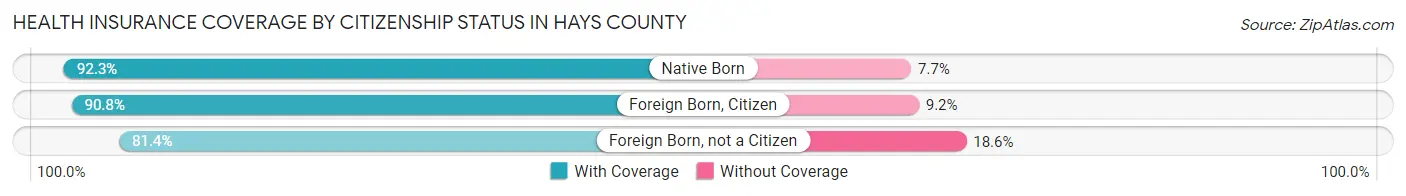
| Citizenship Status | With Coverage | Without Coverage |
| Native Born | 16,079 (92.3%) | 1,347 (7.7%) |
| Foreign Born, Citizen | 38,861 (90.8%) | 3,951 (9.2%) |
| Foreign Born, not a Citizen | 31,811 (81.4%) | 7,260 (18.6%) |
Health Insurance Coverage by Household Income in Hays County
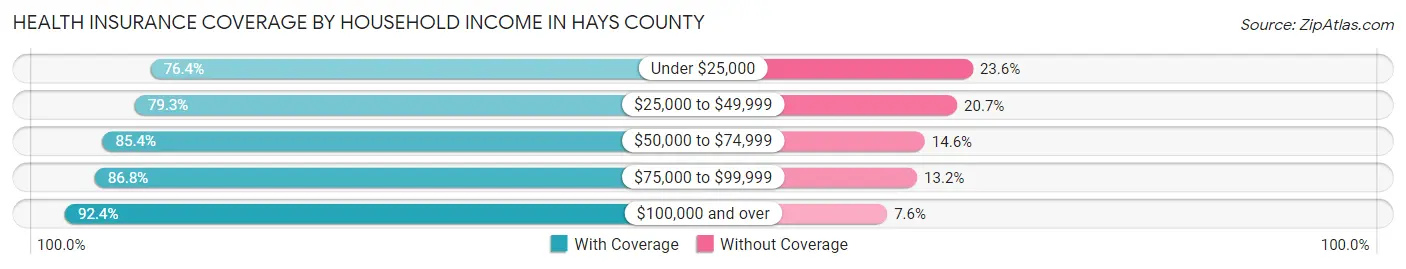
| Household Income | With Coverage | Without Coverage |
| Under $25,000 | 18,142 (76.4%) | 5,618 (23.6%) |
| $25,000 to $49,999 | 25,881 (79.3%) | 6,749 (20.7%) |
| $50,000 to $74,999 | 31,459 (85.4%) | 5,391 (14.6%) |
| $75,000 to $99,999 | 28,110 (86.8%) | 4,269 (13.2%) |
| $100,000 and over | 103,577 (92.4%) | 8,499 (7.6%) |
Public vs Private Health Insurance Coverage by Age in Hays County
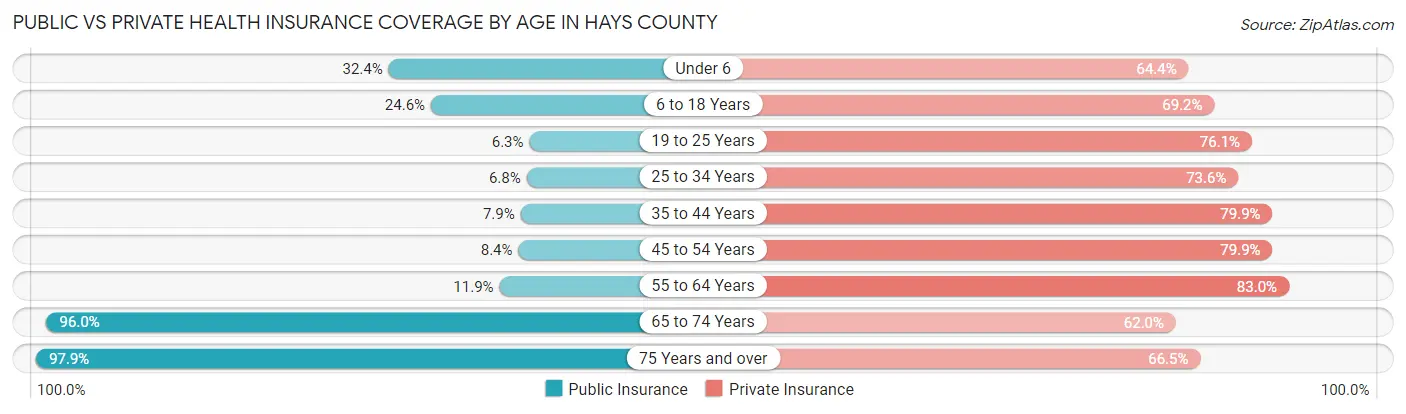
| Age Bracket | Public Insurance | Private Insurance |
| Under 6 | 5,653 (32.4%) | 11,215 (64.4%) |
| 6 to 18 Years | 10,524 (24.6%) | 29,604 (69.2%) |
| 19 to 25 Years | 2,466 (6.3%) | 29,740 (76.1%) |
| 25 to 34 Years | 2,009 (6.8%) | 21,646 (73.6%) |
| 35 to 44 Years | 2,778 (7.9%) | 27,970 (79.9%) |
| 45 to 54 Years | 2,285 (8.4%) | 21,869 (79.9%) |
| 55 to 64 Years | 2,925 (11.9%) | 20,455 (83.0%) |
| 65 to 74 Years | 17,673 (96.0%) | 11,419 (62.0%) |
| 75 Years and over | 9,046 (97.9%) | 6,148 (66.5%) |
| Total | 55,359 (22.7%) | 180,066 (74.0%) |
Disability Status by Sex by Age in Hays County
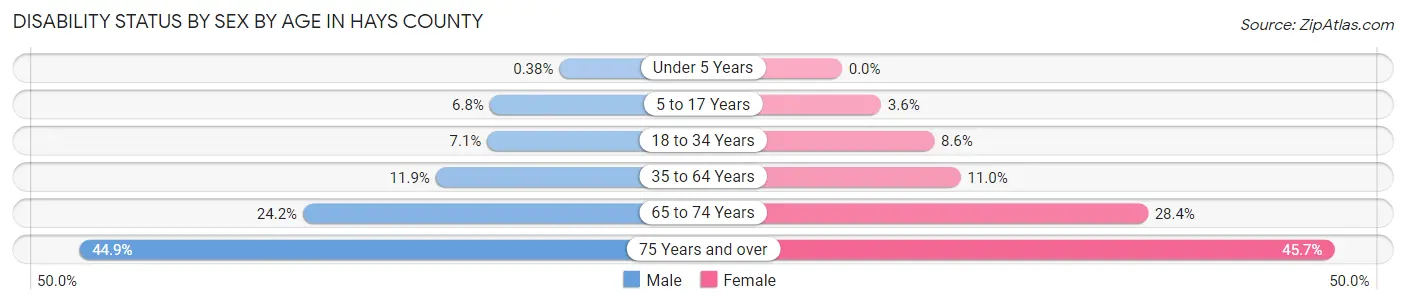
| Age Bracket | Male | Female |
| Under 5 Years | 28 (0.4%) | 0 (0.0%) |
| 5 to 17 Years | 1,426 (6.8%) | 734 (3.6%) |
| 18 to 34 Years | 2,590 (7.1%) | 3,126 (8.6%) |
| 35 to 64 Years | 5,157 (11.8%) | 4,793 (11.0%) |
| 65 to 74 Years | 2,075 (24.2%) | 2,792 (28.4%) |
| 75 Years and over | 1,854 (44.9%) | 2,338 (45.7%) |
Disability Class by Sex by Age in Hays County
Disability Class: Hearing Difficulty
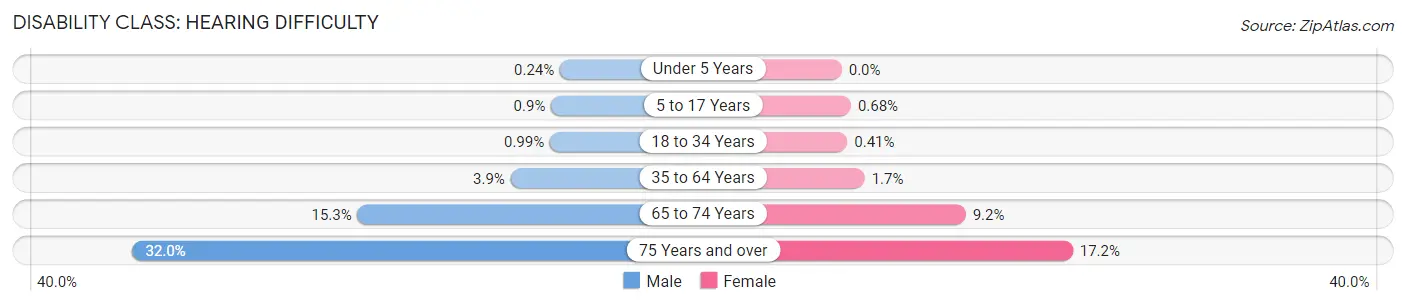
| Age Bracket | Male | Female |
| Under 5 Years | 18 (0.2%) | 0 (0.0%) |
| 5 to 17 Years | 188 (0.9%) | 138 (0.7%) |
| 18 to 34 Years | 364 (1.0%) | 148 (0.4%) |
| 35 to 64 Years | 1,703 (3.9%) | 741 (1.7%) |
| 65 to 74 Years | 1,312 (15.3%) | 905 (9.2%) |
| 75 Years and over | 1,320 (32.0%) | 877 (17.2%) |
Disability Class: Vision Difficulty
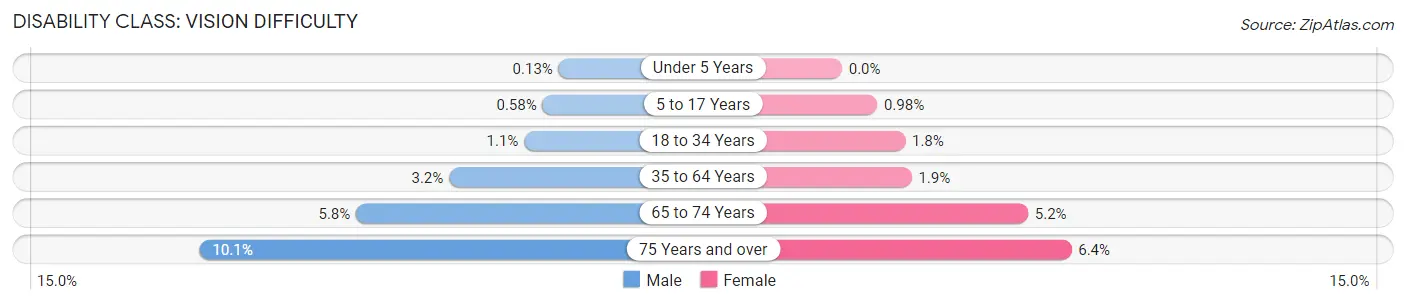
| Age Bracket | Male | Female |
| Under 5 Years | 10 (0.1%) | 0 (0.0%) |
| 5 to 17 Years | 121 (0.6%) | 198 (1.0%) |
| 18 to 34 Years | 398 (1.1%) | 643 (1.8%) |
| 35 to 64 Years | 1,384 (3.2%) | 842 (1.9%) |
| 65 to 74 Years | 495 (5.8%) | 509 (5.2%) |
| 75 Years and over | 418 (10.1%) | 327 (6.4%) |
Disability Class: Cognitive Difficulty
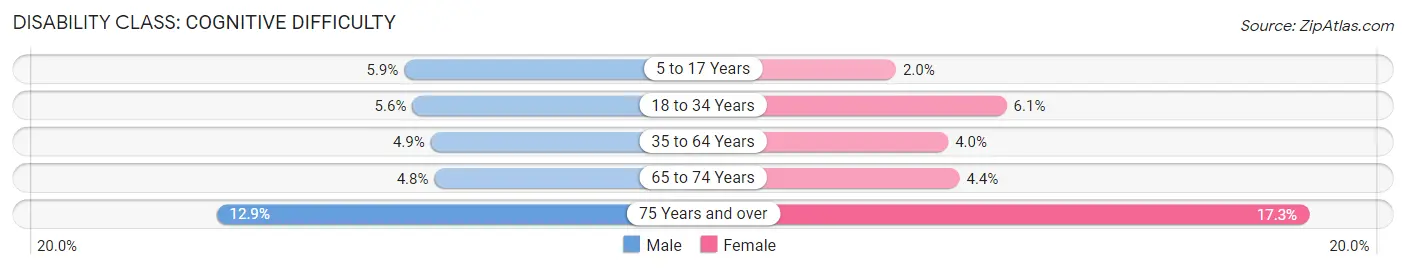
| Age Bracket | Male | Female |
| 5 to 17 Years | 1,233 (5.9%) | 406 (2.0%) |
| 18 to 34 Years | 2,056 (5.6%) | 2,234 (6.1%) |
| 35 to 64 Years | 2,144 (4.9%) | 1,720 (4.0%) |
| 65 to 74 Years | 411 (4.8%) | 430 (4.4%) |
| 75 Years and over | 531 (12.9%) | 887 (17.3%) |
Disability Class: Ambulatory Difficulty
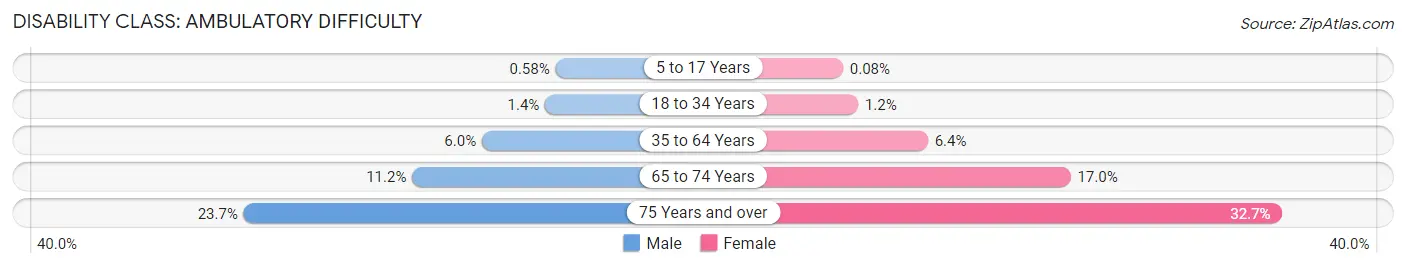
| Age Bracket | Male | Female |
| 5 to 17 Years | 121 (0.6%) | 17 (0.1%) |
| 18 to 34 Years | 496 (1.3%) | 440 (1.2%) |
| 35 to 64 Years | 2,628 (6.0%) | 2,777 (6.4%) |
| 65 to 74 Years | 963 (11.2%) | 1,670 (17.0%) |
| 75 Years and over | 979 (23.7%) | 1,673 (32.7%) |
Disability Class: Self-Care Difficulty
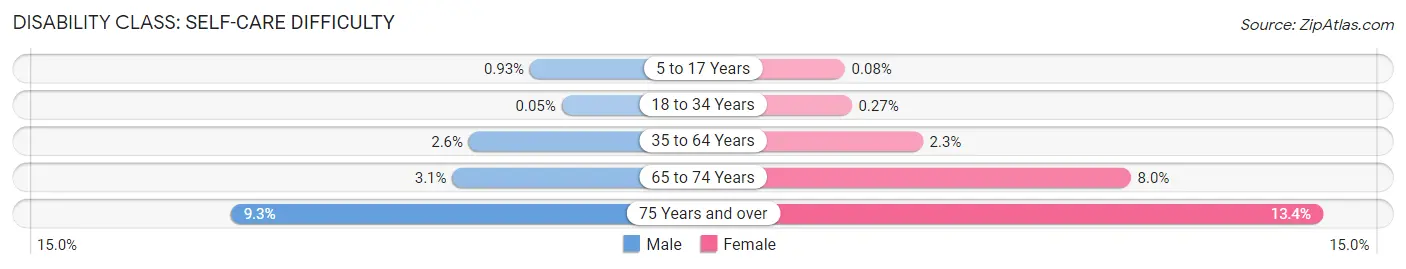
| Age Bracket | Male | Female |
| 5 to 17 Years | 193 (0.9%) | 17 (0.1%) |
| 18 to 34 Years | 20 (0.1%) | 97 (0.3%) |
| 35 to 64 Years | 1,146 (2.6%) | 977 (2.2%) |
| 65 to 74 Years | 265 (3.1%) | 791 (8.0%) |
| 75 Years and over | 382 (9.3%) | 685 (13.4%) |
Technology Access in Hays County
Computing Device Access in Hays County
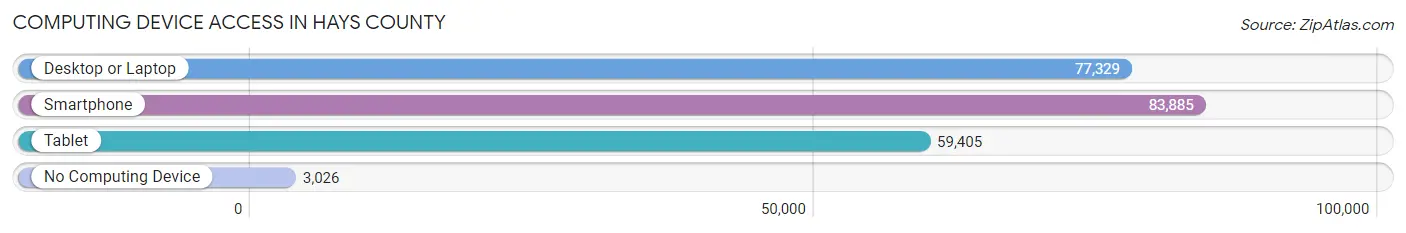
| Device Type | # Households | % Households |
| Desktop or Laptop | 77,329 | 86.6% |
| Smartphone | 83,885 | 93.9% |
| Tablet | 59,405 | 66.5% |
| No Computing Device | 3,026 | 3.4% |
| Total | 89,328 | 100.0% |
Internet Access in Hays County
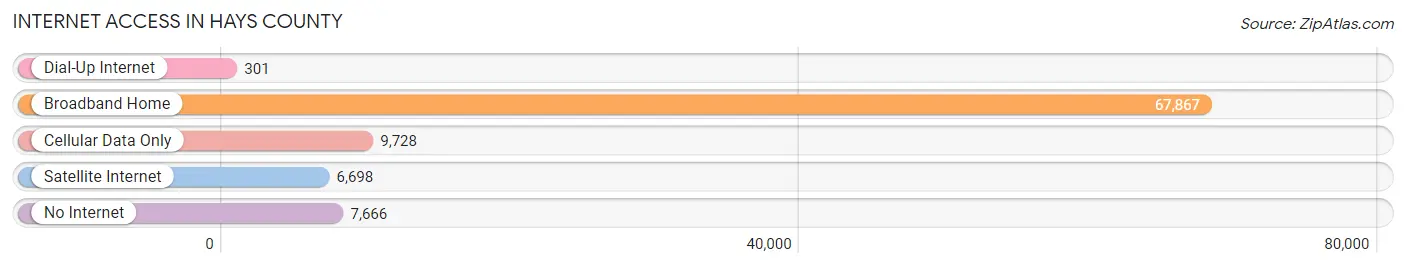
| Internet Type | # Households | % Households |
| Dial-Up Internet | 301 | 0.3% |
| Broadband Home | 67,867 | 76.0% |
| Cellular Data Only | 9,728 | 10.9% |
| Satellite Internet | 6,698 | 7.5% |
| No Internet | 7,666 | 8.6% |
| Total | 89,328 | 100.0% |
Hays County Summary
Hays County is located in Central Texas, and is part of the Austin-Round Rock metropolitan area. It is bordered by Travis County to the north, Caldwell County to the east, Guadalupe County to the south, and Blanco County to the west. The county seat is San Marcos, and the largest city is Kyle. As of the 2010 census, the population was 157,107, making it the fifth-most populous county in Texas.
History
Hays County was established in 1848 from land that was formerly part of Travis County. It was named after John Coffee Hays, a Texas Ranger and Mexican-American War hero. The county was originally populated by Native Americans, including the Tonkawa, Lipan Apache, and Comanche tribes.
In the late 19th century, the county was home to several German and Czech settlements, as well as a large number of African-American freedmen. The county was also home to a large number of Confederate veterans after the Civil War.
Geography
Hays County covers an area of 1,022 square miles, making it the 25th-largest county in Texas. It is located in the Hill Country region of Central Texas, and is characterized by rolling hills and limestone outcroppings. The county is drained by the Blanco River, which flows through the county from west to east.
The county is home to several state parks, including Pedernales Falls State Park, Blanco State Park, and McKinney Roughs Nature Park. It is also home to several lakes, including Lake Kyle, Lake Dunlap, and Lake Placid.
Economy
Hays County has a diverse economy, with a mix of agriculture, manufacturing, and services. The county is home to several large employers, including Amazon, Dell, and H-E-B.
Agriculture is an important part of the county’s economy, with cattle, hay, and cotton being the primary crops. The county is also home to several wineries and vineyards.
Demographics
As of the 2010 census, the population of Hays County was 157,107, making it the fifth-most populous county in Texas. The population is racially and ethnically diverse, with the largest racial group being White (63.3%), followed by Hispanic or Latino (30.2%), and African American (4.2%).
The median household income in the county is $63,945, and the median home value is $223,400. The poverty rate is 11.2%, and the unemployment rate is 3.7%.
Conclusion
Hays County is a diverse and vibrant county located in Central Texas. It is home to a mix of agriculture, manufacturing, and services, and is an important part of the Austin-Round Rock metropolitan area. The county is racially and ethnically diverse, with a median household income of $63,945 and a median home value of $223,400. Hays County is an important part of the Texas economy, and is an attractive place to live and work.
Common Questions
What is Per Capita Income in Hays County?
Per Capita income in Hays County is $38,909.
What is the Median Family Income in Hays County?
Median Family Income in Hays County is $100,644.
What is the Median Household income in Hays County?
Median Household Income in Hays County is $79,990.
What is Income or Wage Gap in Hays County?
Income or Wage Gap in Hays County is 29.4%.
Women in Hays County earn 70.6 cents for every dollar earned by a man.
What is Family Income Deficit in Hays County?
Family Income Deficit in Hays County is $10,402.
Families that are below poverty line in Hays County earn $10,402 less on average than the poverty threshold level.
What is Inequality or Gini Index in Hays County?
Inequality or Gini Index in Hays County is 0.45.
What is the Total Population of Hays County?
Total Population of Hays County is 245,351.
What is the Total Male Population of Hays County?
Total Male Population of Hays County is 122,589.
What is the Total Female Population of Hays County?
Total Female Population of Hays County is 122,762.
What is the Ratio of Males per 100 Females in Hays County?
There are 99.86 Males per 100 Females in Hays County.
What is the Ratio of Females per 100 Males in Hays County?
There are 100.14 Females per 100 Males in Hays County.
What is the Median Population Age in Hays County?
Median Population Age in Hays County is 33.2 Years.
What is the Average Family Size in Hays County
Average Family Size in Hays County is 3.2 People.
What is the Average Household Size in Hays County
Average Household Size in Hays County is 2.7 People.
How Large is the Labor Force in Hays County?
There are 132,574 People in the Labor Forcein in Hays County.
What is the Percentage of People in the Labor Force in Hays County?
67.9% of People are in the Labor Force in Hays County.
What is the Unemployment Rate in Hays County?
Unemployment Rate in Hays County is 5.1%.