Brownsville, TX Map & Demographics
Brownsville Map
Brownsville Overview
$19,704
PER CAPITA INCOME
$53,105
AVG FAMILY INCOME
$46,735
AVG HOUSEHOLD INCOME
29.2%
WAGE / INCOME GAP [ % ]
70.8¢/ $1
WAGE / INCOME GAP [ $ ]
$11,516
FAMILY INCOME DEFICIT
0.46
INEQUALITY / GINI INDEX
186,999
TOTAL POPULATION
90,750
MALE POPULATION
96,249
FEMALE POPULATION
94.29
MALES / 100 FEMALES
106.06
FEMALES / 100 MALES
30.7
MEDIAN AGE
3.8
AVG FAMILY SIZE
3.3
AVG HOUSEHOLD SIZE
81,074
LABOR FORCE [ PEOPLE ]
58.0%
PERCENT IN LABOR FORCE
6.3%
UNEMPLOYMENT RATE
Brownsville Area Codes
Income in Brownsville
Income Overview in Brownsville
Per Capita Income in Brownsville is $19,704, while median incomes of families and households are $53,105 and $46,735 respectively.
| Characteristic | Number | Measure |
| Per Capita Income | 186,999 | $19,704 |
| Median Family Income | 44,992 | $53,105 |
| Mean Family Income | 44,992 | $67,620 |
| Median Household Income | 56,876 | $46,735 |
| Mean Household Income | 56,876 | $62,449 |
| Income Deficit | 44,992 | $11,516 |
| Wage / Income Gap (%) | 186,999 | 29.18% |
| Wage / Income Gap ($) | 186,999 | 70.82¢ per $1 |
| Gini / Inequality Index | 186,999 | 0.46 |
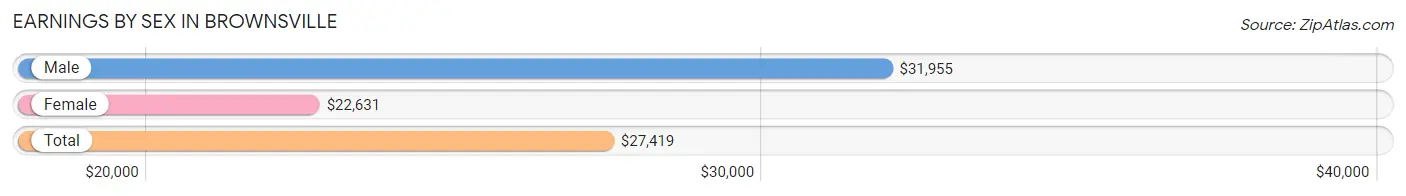
Earnings by Sex in Brownsville
Average Earnings in Brownsville are $27,419, $31,955 for men and $22,631 for women, a difference of 29.2%.
| Sex | Number | Average Earnings |
| Male | 43,168 (52.3%) | $31,955 |
| Female | 39,304 (47.7%) | $22,631 |
| Total | 82,472 (100.0%) | $27,419 |
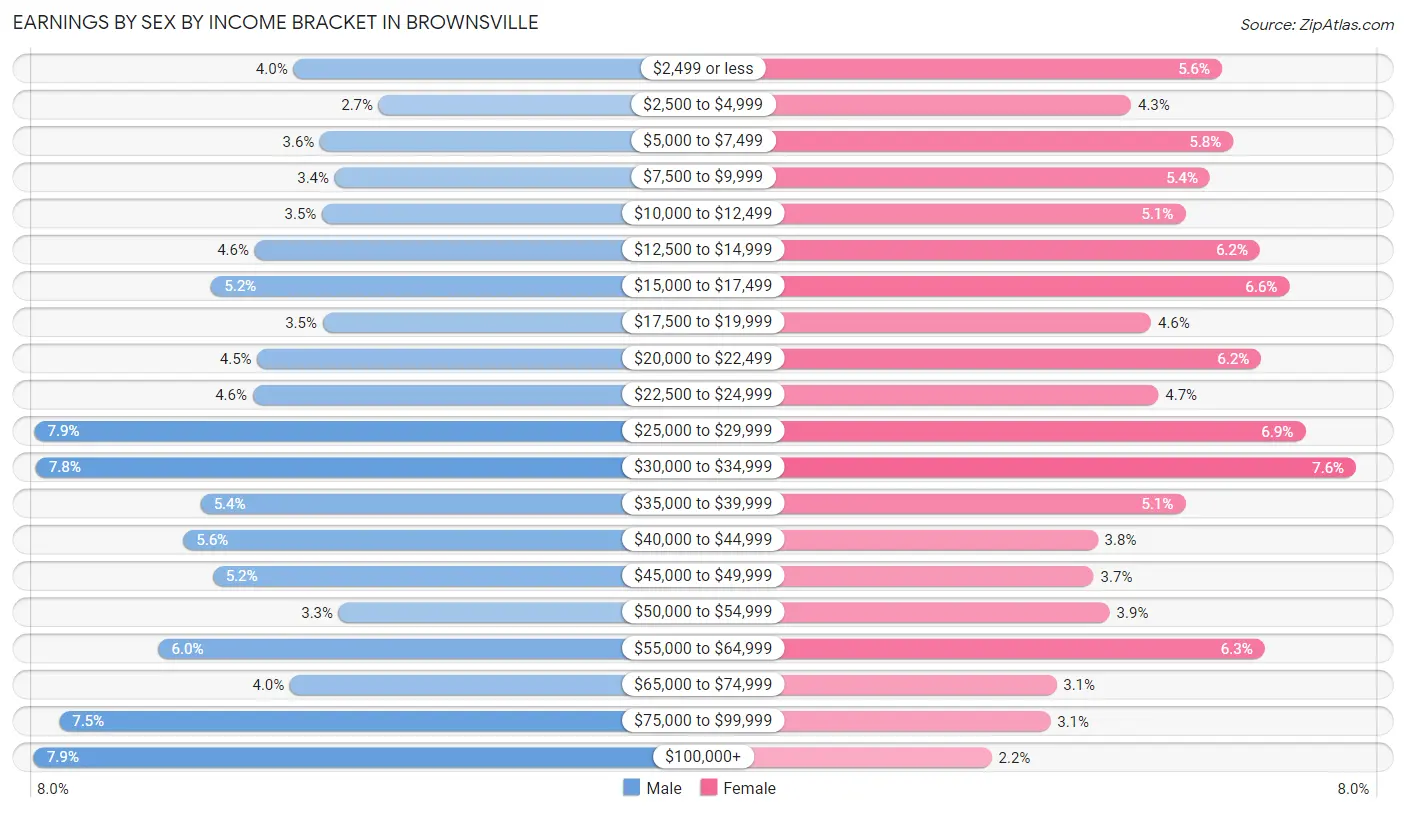
Earnings by Sex by Income Bracket in Brownsville
The most common earnings brackets in Brownsville are $100,000+ for men (3,393 | 7.9%) and $30,000 to $34,999 for women (2,999 | 7.6%).
| Income | Male | Female |
| $2,499 or less | 1,715 (4.0%) | 2,210 (5.6%) |
| $2,500 to $4,999 | 1,160 (2.7%) | 1,673 (4.3%) |
| $5,000 to $7,499 | 1,543 (3.6%) | 2,275 (5.8%) |
| $7,500 to $9,999 | 1,446 (3.4%) | 2,138 (5.4%) |
| $10,000 to $12,499 | 1,530 (3.5%) | 1,991 (5.1%) |
| $12,500 to $14,999 | 1,966 (4.5%) | 2,431 (6.2%) |
| $15,000 to $17,499 | 2,244 (5.2%) | 2,605 (6.6%) |
| $17,500 to $19,999 | 1,524 (3.5%) | 1,793 (4.6%) |
| $20,000 to $22,499 | 1,946 (4.5%) | 2,440 (6.2%) |
| $22,500 to $24,999 | 1,978 (4.6%) | 1,837 (4.7%) |
| $25,000 to $29,999 | 3,389 (7.9%) | 2,700 (6.9%) |
| $30,000 to $34,999 | 3,382 (7.8%) | 2,999 (7.6%) |
| $35,000 to $39,999 | 2,315 (5.4%) | 1,991 (5.1%) |
| $40,000 to $44,999 | 2,427 (5.6%) | 1,476 (3.8%) |
| $45,000 to $49,999 | 2,238 (5.2%) | 1,454 (3.7%) |
| $50,000 to $54,999 | 1,422 (3.3%) | 1,548 (3.9%) |
| $55,000 to $64,999 | 2,587 (6.0%) | 2,459 (6.3%) |
| $65,000 to $74,999 | 1,736 (4.0%) | 1,233 (3.1%) |
| $75,000 to $99,999 | 3,227 (7.5%) | 1,198 (3.0%) |
| $100,000+ | 3,393 (7.9%) | 853 (2.2%) |
| Total | 43,168 (100.0%) | 39,304 (100.0%) |
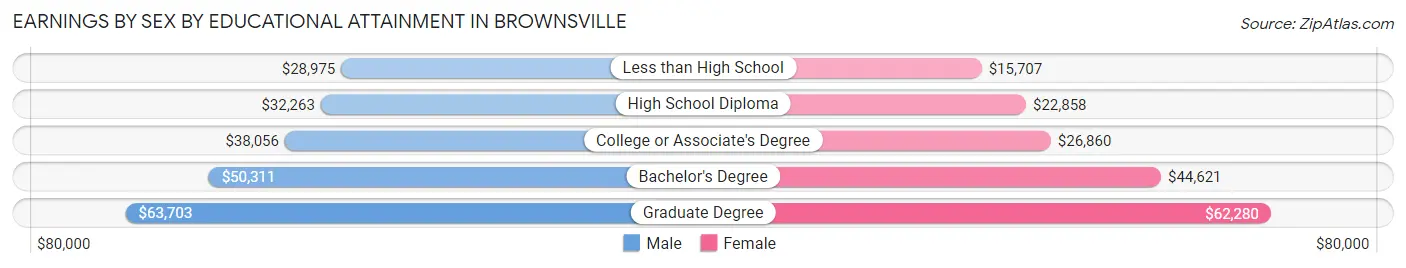
Earnings by Sex by Educational Attainment in Brownsville
Average earnings in Brownsville are $36,363 for men and $26,218 for women, a difference of 27.9%. Men with an educational attainment of graduate degree enjoy the highest average annual earnings of $63,703, while those with less than high school education earn the least with $28,975. Women with an educational attainment of graduate degree earn the most with the average annual earnings of $62,280, while those with less than high school education have the smallest earnings of $15,707.
| Educational Attainment | Male Income | Female Income |
| Less than High School | $28,975 | $15,707 |
| High School Diploma | $32,263 | $22,858 |
| College or Associate's Degree | $38,056 | $26,860 |
| Bachelor's Degree | $50,311 | $44,621 |
| Graduate Degree | $63,703 | $62,280 |
| Total | $36,363 | $26,218 |
Family Income in Brownsville
Family Income Brackets in Brownsville
According to the Brownsville family income data, there are 8,189 families falling into the $50,000 to $74,999 income range, which is the most common income bracket and makes up 18.2% of all families. Conversely, the $200,000+ income bracket is the least frequent group with only 1,350 families (3.0%) belonging to this category.
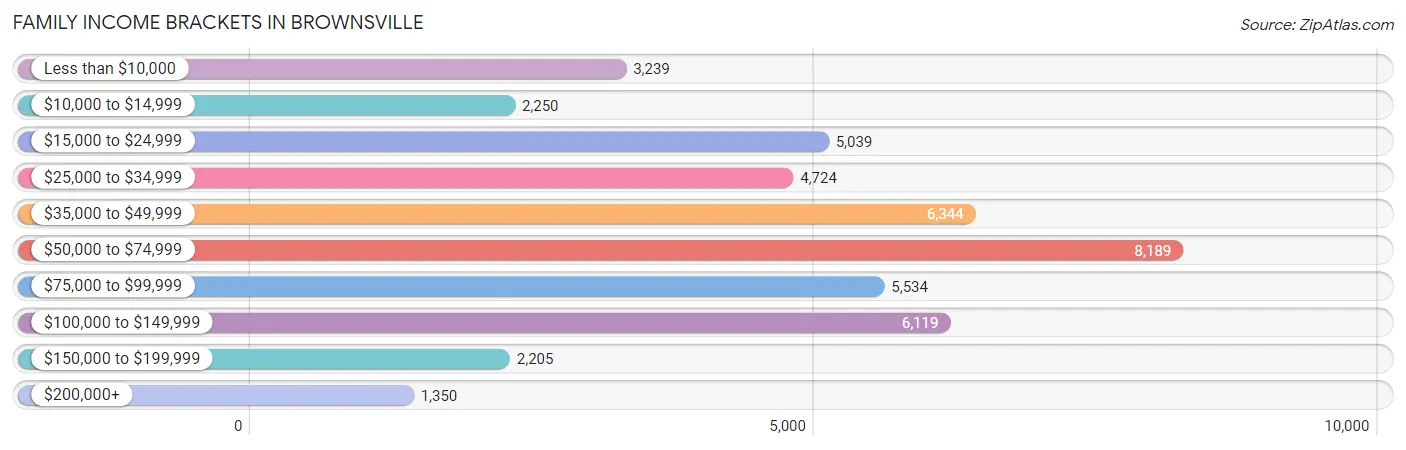
| Income Bracket | # Families | % Families |
| Less than $10,000 | 3,239 | 7.2% |
| $10,000 to $14,999 | 2,250 | 5.0% |
| $15,000 to $24,999 | 5,039 | 11.2% |
| $25,000 to $34,999 | 4,724 | 10.5% |
| $35,000 to $49,999 | 6,344 | 14.1% |
| $50,000 to $74,999 | 8,189 | 18.2% |
| $75,000 to $99,999 | 5,534 | 12.3% |
| $100,000 to $149,999 | 6,119 | 13.6% |
| $150,000 to $199,999 | 2,205 | 4.9% |
| $200,000+ | 1,350 | 3.0% |
Family Income by Famaliy Size in Brownsville
6-person families (2,522 | 5.6%) account for the highest median family income in Brownsville with $76,614 per family, while 2-person families (13,538 | 30.1%) have the highest median income of $21,765 per family member.
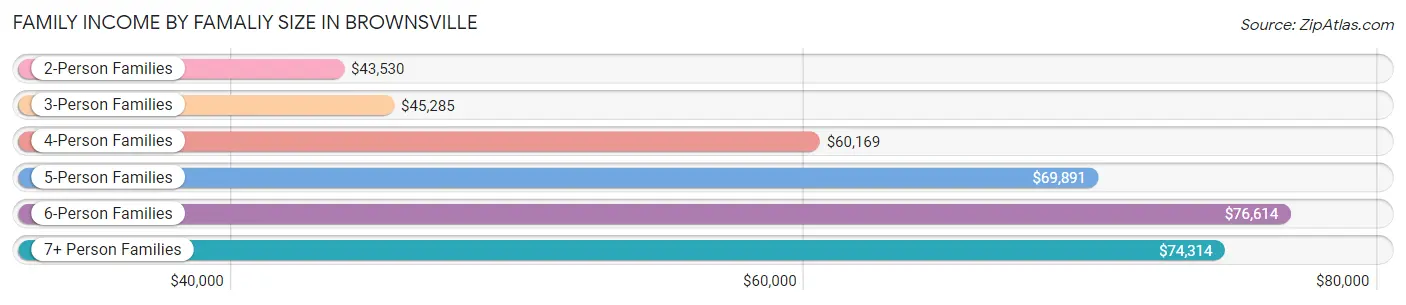
| Income Bracket | # Families | Median Income |
| 2-Person Families | 13,538 (30.1%) | $43,530 |
| 3-Person Families | 10,340 (23.0%) | $45,285 |
| 4-Person Families | 10,566 (23.5%) | $60,169 |
| 5-Person Families | 6,342 (14.1%) | $69,891 |
| 6-Person Families | 2,522 (5.6%) | $76,614 |
| 7+ Person Families | 1,684 (3.7%) | $74,314 |
| Total | 44,992 (100.0%) | $53,105 |
Family Income by Number of Earners in Brownsville
The median family income in Brownsville is $53,105, with families comprising 3+ earners (5,699) having the highest median family income of $103,183, while families with no earners (6,158) have the lowest median family income of $17,783, accounting for 12.7% and 13.7% of families, respectively.
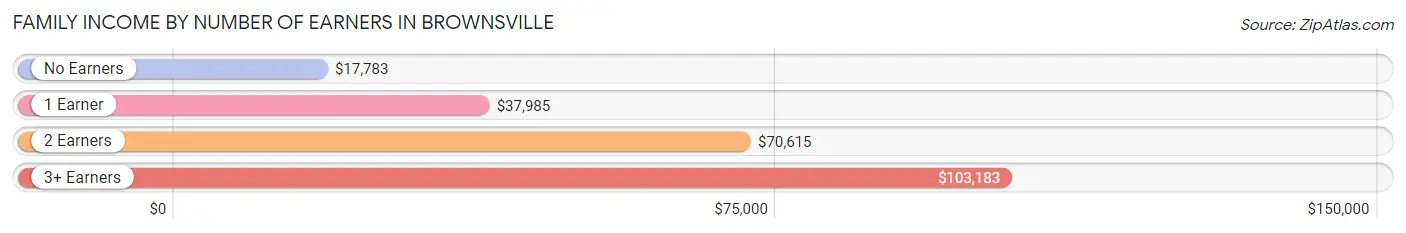
| Number of Earners | # Families | Median Income |
| No Earners | 6,158 (13.7%) | $17,783 |
| 1 Earner | 16,911 (37.6%) | $37,985 |
| 2 Earners | 16,224 (36.1%) | $70,615 |
| 3+ Earners | 5,699 (12.7%) | $103,183 |
| Total | 44,992 (100.0%) | $53,105 |
Household Income in Brownsville
Household Income Brackets in Brownsville
With 9,953 households falling in the category, the $50,000 to $74,999 income range is the most frequent in Brownsville, accounting for 17.5% of all households. In contrast, only 1,536 households (2.7%) fall into the $200,000+ income bracket, making it the least populous group.
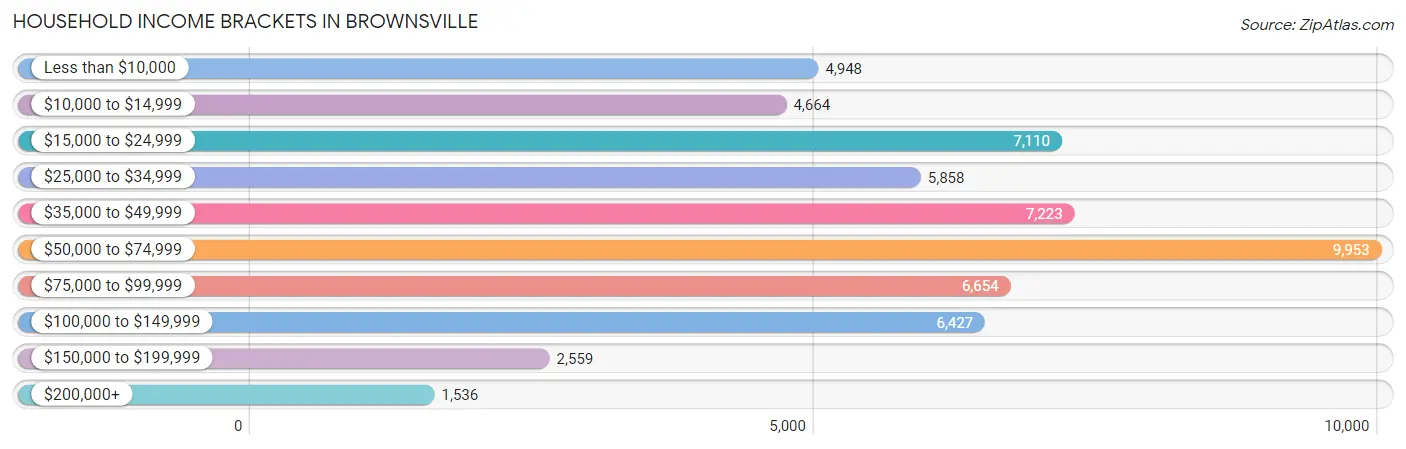
| Income Bracket | # Households | % Households |
| Less than $10,000 | 4,948 | 8.7% |
| $10,000 to $14,999 | 4,664 | 8.2% |
| $15,000 to $24,999 | 7,110 | 12.5% |
| $25,000 to $34,999 | 5,858 | 10.3% |
| $35,000 to $49,999 | 7,223 | 12.7% |
| $50,000 to $74,999 | 9,953 | 17.5% |
| $75,000 to $99,999 | 6,654 | 11.7% |
| $100,000 to $149,999 | 6,427 | 11.3% |
| $150,000 to $199,999 | 2,559 | 4.5% |
| $200,000+ | 1,536 | 2.7% |
Household Income by Householder Age in Brownsville
The median household income in Brownsville is $46,735, with the highest median household income of $57,331 found in the 45 to 64 years age bracket for the primary householder. A total of 20,563 households (36.1%) fall into this category. Meanwhile, the 65+ years age bracket for the primary householder has the lowest median household income of $29,950, with 13,877 households (24.4%) in this group.
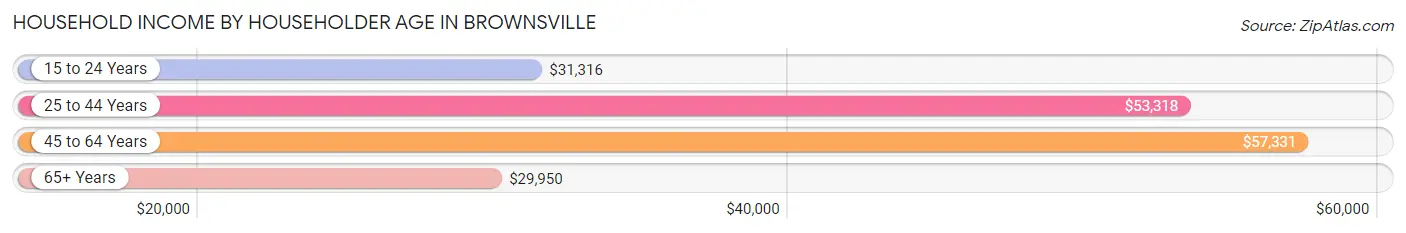
| Income Bracket | # Households | Median Income |
| 15 to 24 Years | 2,336 (4.1%) | $31,316 |
| 25 to 44 Years | 20,100 (35.3%) | $53,318 |
| 45 to 64 Years | 20,563 (36.1%) | $57,331 |
| 65+ Years | 13,877 (24.4%) | $29,950 |
| Total | 56,876 (100.0%) | $46,735 |
Poverty in Brownsville
Income Below Poverty by Sex and Age in Brownsville
With 24.0% poverty level for males and 28.1% for females among the residents of Brownsville, 6 to 11 year old males and 5 year old females are the most vulnerable to poverty, with 3,422 males (39.2%) and 741 females (48.9%) in their respective age groups living below the poverty level.
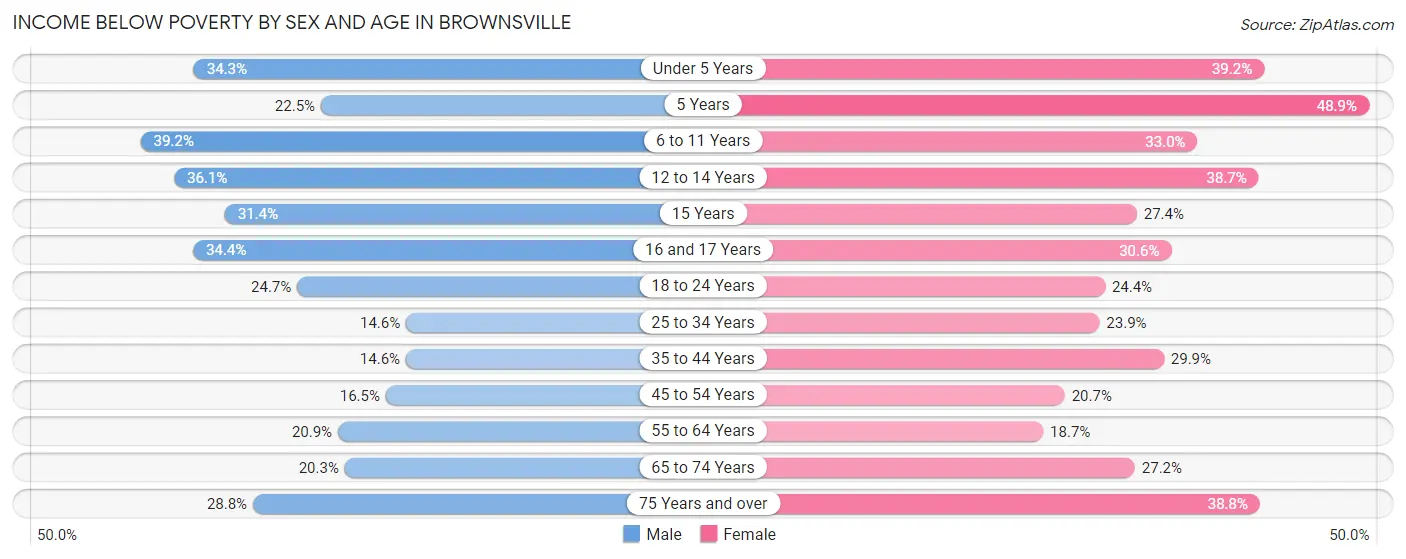
| Age Bracket | Male | Female |
| Under 5 Years | 2,580 (34.3%) | 2,590 (39.2%) |
| 5 Years | 369 (22.5%) | 741 (48.9%) |
| 6 to 11 Years | 3,422 (39.2%) | 3,061 (33.0%) |
| 12 to 14 Years | 1,650 (36.1%) | 1,546 (38.7%) |
| 15 Years | 460 (31.4%) | 405 (27.4%) |
| 16 and 17 Years | 1,267 (34.4%) | 934 (30.6%) |
| 18 to 24 Years | 2,894 (24.7%) | 2,883 (24.4%) |
| 25 to 34 Years | 1,831 (14.6%) | 2,930 (23.9%) |
| 35 to 44 Years | 1,627 (14.6%) | 3,395 (29.9%) |
| 45 to 54 Years | 1,617 (16.5%) | 2,372 (20.7%) |
| 55 to 64 Years | 1,558 (20.9%) | 1,839 (18.7%) |
| 65 to 74 Years | 1,186 (20.3%) | 2,041 (27.2%) |
| 75 Years and over | 1,092 (28.8%) | 2,063 (38.8%) |
| Total | 21,553 (24.0%) | 26,800 (28.1%) |
Income Above Poverty by Sex and Age in Brownsville
According to the poverty statistics in Brownsville, males aged 25 to 34 years and females aged 55 to 64 years are the age groups that are most secure financially, with 85.4% of males and 81.3% of females in these age groups living above the poverty line.
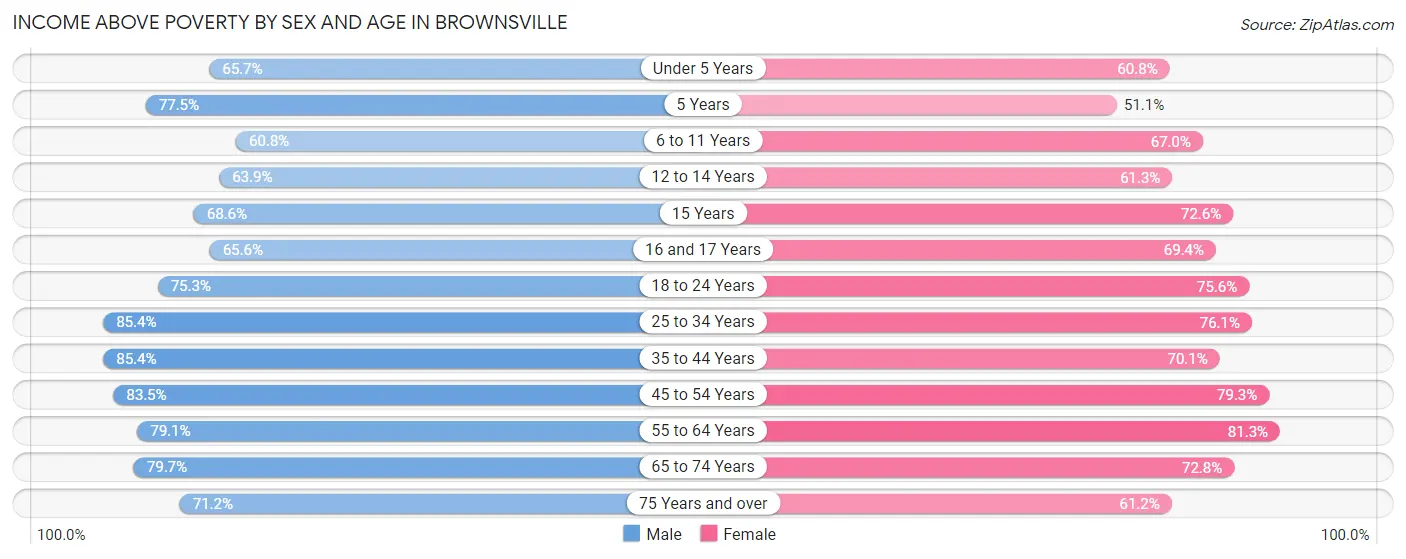
| Age Bracket | Male | Female |
| Under 5 Years | 4,944 (65.7%) | 4,021 (60.8%) |
| 5 Years | 1,271 (77.5%) | 774 (51.1%) |
| 6 to 11 Years | 5,298 (60.8%) | 6,214 (67.0%) |
| 12 to 14 Years | 2,917 (63.9%) | 2,451 (61.3%) |
| 15 Years | 1,004 (68.6%) | 1,074 (72.6%) |
| 16 and 17 Years | 2,419 (65.6%) | 2,121 (69.4%) |
| 18 to 24 Years | 8,818 (75.3%) | 8,922 (75.6%) |
| 25 to 34 Years | 10,712 (85.4%) | 9,322 (76.1%) |
| 35 to 44 Years | 9,511 (85.4%) | 7,963 (70.1%) |
| 45 to 54 Years | 8,196 (83.5%) | 9,095 (79.3%) |
| 55 to 64 Years | 5,889 (79.1%) | 8,003 (81.3%) |
| 65 to 74 Years | 4,659 (79.7%) | 5,464 (72.8%) |
| 75 Years and over | 2,698 (71.2%) | 3,255 (61.2%) |
| Total | 68,336 (76.0%) | 68,679 (71.9%) |
Income Below Poverty Among Married-Couple Families in Brownsville
The poverty statistics for married-couple families in Brownsville show that 17.4% or 4,748 of the total 27,302 families live below the poverty line. Families with 5 or more children have the highest poverty rate of 84.0%, comprising of 453 families. On the other hand, families with no children have the lowest poverty rate of 13.2%, which includes 1,579 families.
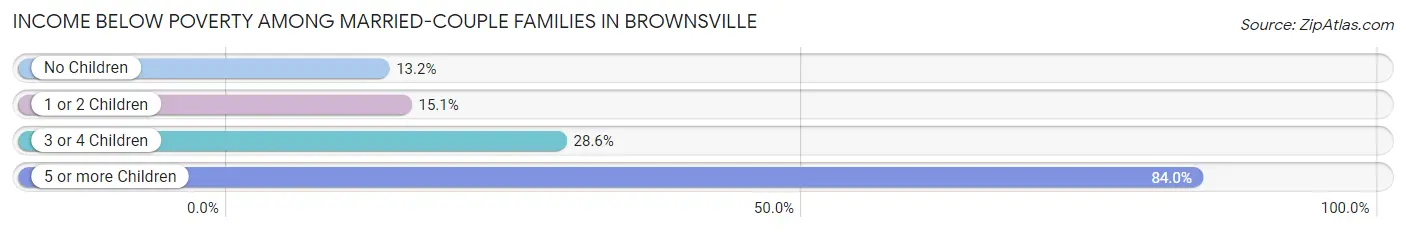
| Children | Above Poverty | Below Poverty |
| No Children | 10,420 (86.8%) | 1,579 (13.2%) |
| 1 or 2 Children | 9,472 (84.9%) | 1,684 (15.1%) |
| 3 or 4 Children | 2,576 (71.4%) | 1,032 (28.6%) |
| 5 or more Children | 86 (16.0%) | 453 (84.0%) |
| Total | 22,554 (82.6%) | 4,748 (17.4%) |
Income Below Poverty Among Single-Parent Households in Brownsville
According to the poverty data in Brownsville, 23.0% or 1,062 single-father households and 38.8% or 5,072 single-mother households are living below the poverty line. Among single-father households, those with 3 or 4 children have the highest poverty rate, with 117 households (35.2%) experiencing poverty. Likewise, among single-mother households, those with 5 or more children have the highest poverty rate, with 167 households (93.8%) falling below the poverty line.
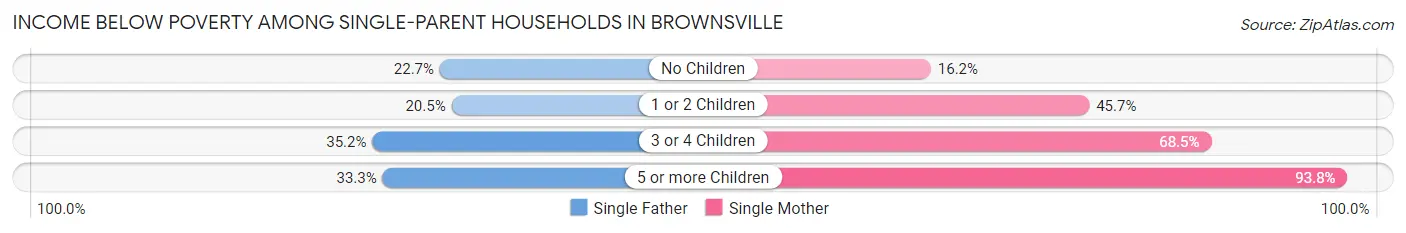
| Children | Single Father | Single Mother |
| No Children | 512 (22.7%) | 739 (16.2%) |
| 1 or 2 Children | 385 (20.5%) | 3,117 (45.7%) |
| 3 or 4 Children | 117 (35.2%) | 1,049 (68.5%) |
| 5 or more Children | 48 (33.3%) | 167 (93.8%) |
| Total | 1,062 (23.0%) | 5,072 (38.8%) |
Income Below Poverty Among Married-Couple vs Single-Parent Households in Brownsville
The poverty data for Brownsville shows that 4,748 of the married-couple family households (17.4%) and 6,134 of the single-parent households (34.7%) are living below the poverty level. Within the married-couple family households, those with 5 or more children have the highest poverty rate, with 453 households (84.0%) falling below the poverty line. Among the single-parent households, those with 5 or more children have the highest poverty rate, with 215 household (66.8%) living below poverty.
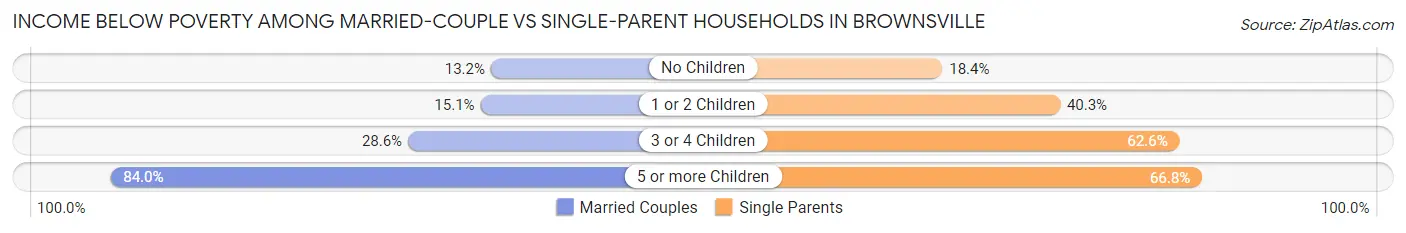
| Children | Married-Couple Families | Single-Parent Households |
| No Children | 1,579 (13.2%) | 1,251 (18.4%) |
| 1 or 2 Children | 1,684 (15.1%) | 3,502 (40.3%) |
| 3 or 4 Children | 1,032 (28.6%) | 1,166 (62.5%) |
| 5 or more Children | 453 (84.0%) | 215 (66.8%) |
| Total | 4,748 (17.4%) | 6,134 (34.7%) |
Race in Brownsville
The most populous races in Brownsville are Hispanic or Latino (176,822 | 94.6%), White / Caucasian (110,644 | 59.2%), and Two or more Races (61,402 | 32.8%).
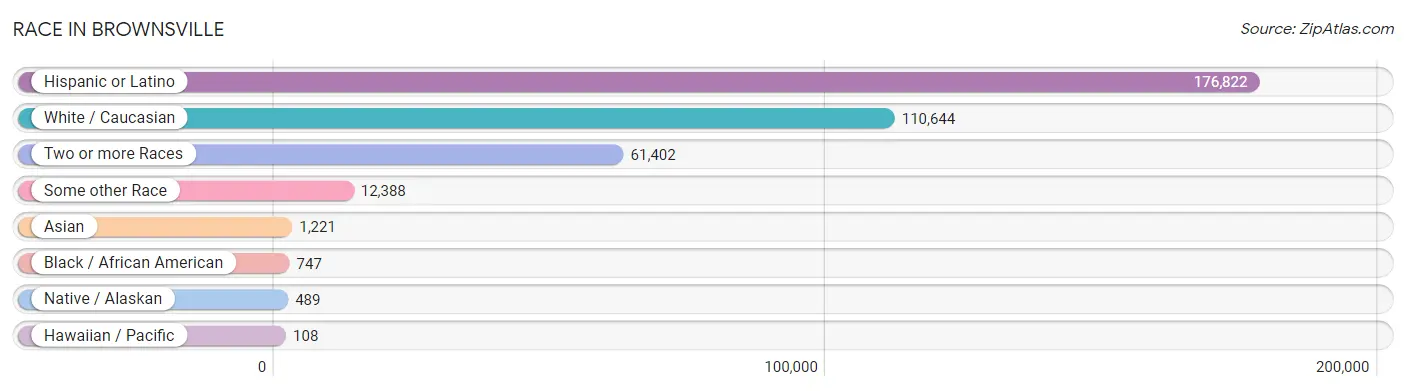
| Race | # Population | % Population |
| Asian | 1,221 | 0.6% |
| Black / African American | 747 | 0.4% |
| Hawaiian / Pacific | 108 | 0.1% |
| Hispanic or Latino | 176,822 | 94.6% |
| Native / Alaskan | 489 | 0.3% |
| White / Caucasian | 110,644 | 59.2% |
| Two or more Races | 61,402 | 32.8% |
| Some other Race | 12,388 | 6.6% |
| Total | 186,999 | 100.0% |
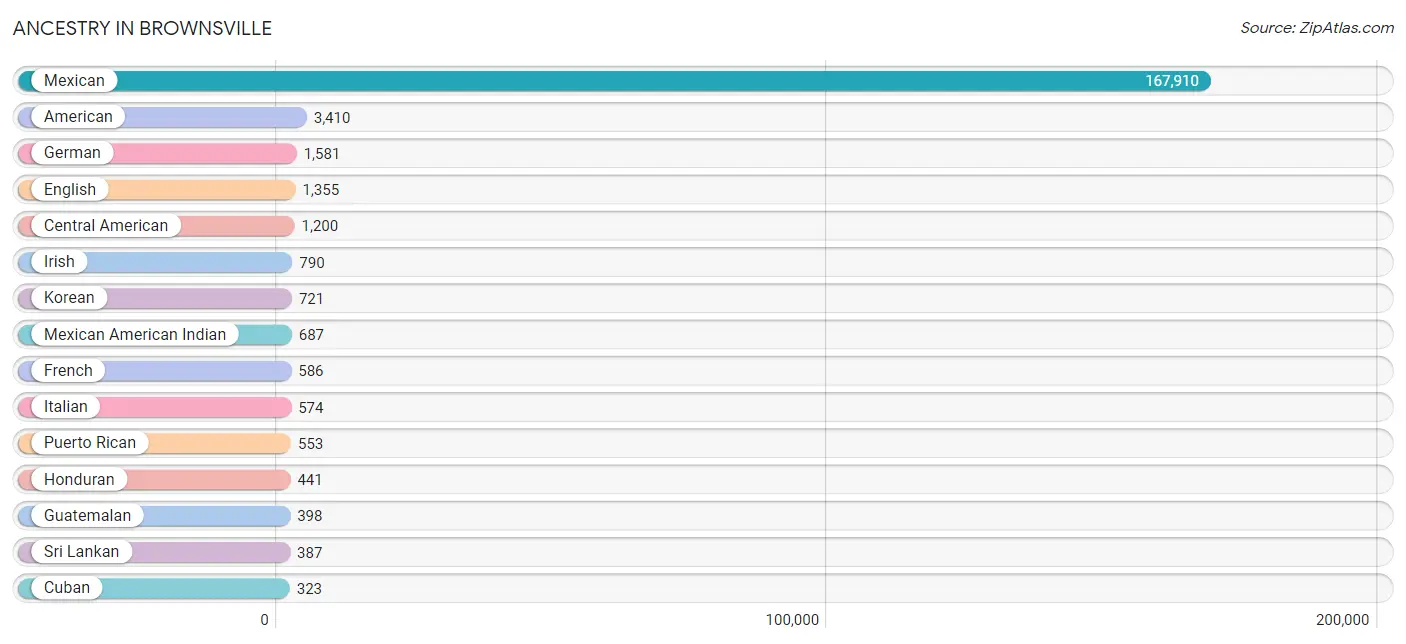
Ancestry in Brownsville
The most populous ancestries reported in Brownsville are Mexican (167,910 | 89.8%), American (3,410 | 1.8%), German (1,581 | 0.9%), English (1,355 | 0.7%), and Central American (1,200 | 0.6%), together accounting for 93.8% of all Brownsville residents.
| Ancestry | # Population | % Population |
| African | 36 | 0.0% |
| American | 3,410 | 1.8% |
| Arab | 81 | 0.0% |
| Argentinean | 30 | 0.0% |
| Armenian | 30 | 0.0% |
| Bhutanese | 34 | 0.0% |
| Bolivian | 32 | 0.0% |
| Brazilian | 6 | 0.0% |
| British | 134 | 0.1% |
| Cajun | 30 | 0.0% |
| Canadian | 18 | 0.0% |
| Central American | 1,200 | 0.6% |
| Central American Indian | 164 | 0.1% |
| Cherokee | 55 | 0.0% |
| Chilean | 43 | 0.0% |
| Colombian | 77 | 0.0% |
| Cuban | 323 | 0.2% |
| Czech | 59 | 0.0% |
| Czechoslovakian | 19 | 0.0% |
| Dominican | 266 | 0.1% |
| Dutch | 254 | 0.1% |
| Eastern European | 22 | 0.0% |
| Ecuadorian | 45 | 0.0% |
| Egyptian | 9 | 0.0% |
| English | 1,355 | 0.7% |
| European | 73 | 0.0% |
| Filipino | 1 | 0.0% |
| Finnish | 11 | 0.0% |
| French | 586 | 0.3% |
| French Canadian | 124 | 0.1% |
| German | 1,581 | 0.9% |
| Guamanian / Chamorro | 82 | 0.0% |
| Guatemalan | 398 | 0.2% |
| Honduran | 441 | 0.2% |
| Hungarian | 120 | 0.1% |
| Indian (Asian) | 207 | 0.1% |
| Irish | 790 | 0.4% |
| Iroquois | 44 | 0.0% |
| Israeli | 55 | 0.0% |
| Italian | 574 | 0.3% |
| Korean | 721 | 0.4% |
| Lebanese | 60 | 0.0% |
| Lithuanian | 12 | 0.0% |
| Mexican | 167,910 | 89.8% |
| Mexican American Indian | 687 | 0.4% |
| Native Hawaiian | 105 | 0.1% |
| Navajo | 91 | 0.1% |
| Nicaraguan | 94 | 0.1% |
| Nigerian | 16 | 0.0% |
| Northern European | 14 | 0.0% |
| Norwegian | 192 | 0.1% |
| Pakistani | 23 | 0.0% |
| Peruvian | 39 | 0.0% |
| Polish | 320 | 0.2% |
| Portuguese | 82 | 0.0% |
| Potawatomi | 13 | 0.0% |
| Puerto Rican | 553 | 0.3% |
| Romanian | 7 | 0.0% |
| Russian | 273 | 0.2% |
| Salvadoran | 267 | 0.1% |
| Samoan | 16 | 0.0% |
| Scandinavian | 13 | 0.0% |
| Scotch-Irish | 107 | 0.1% |
| Scottish | 229 | 0.1% |
| Slavic | 27 | 0.0% |
| Slovak | 37 | 0.0% |
| South American | 290 | 0.2% |
| Spaniard | 181 | 0.1% |
| Spanish | 64 | 0.0% |
| Sri Lankan | 387 | 0.2% |
| Subsaharan African | 52 | 0.0% |
| Swedish | 75 | 0.0% |
| Swiss | 16 | 0.0% |
| Thai | 268 | 0.1% |
| Ukrainian | 28 | 0.0% |
| Venezuelan | 24 | 0.0% |
| Vietnamese | 17 | 0.0% |
| Welsh | 124 | 0.1% |
| Yugoslavian | 3 | 0.0% | View All 79 Rows |
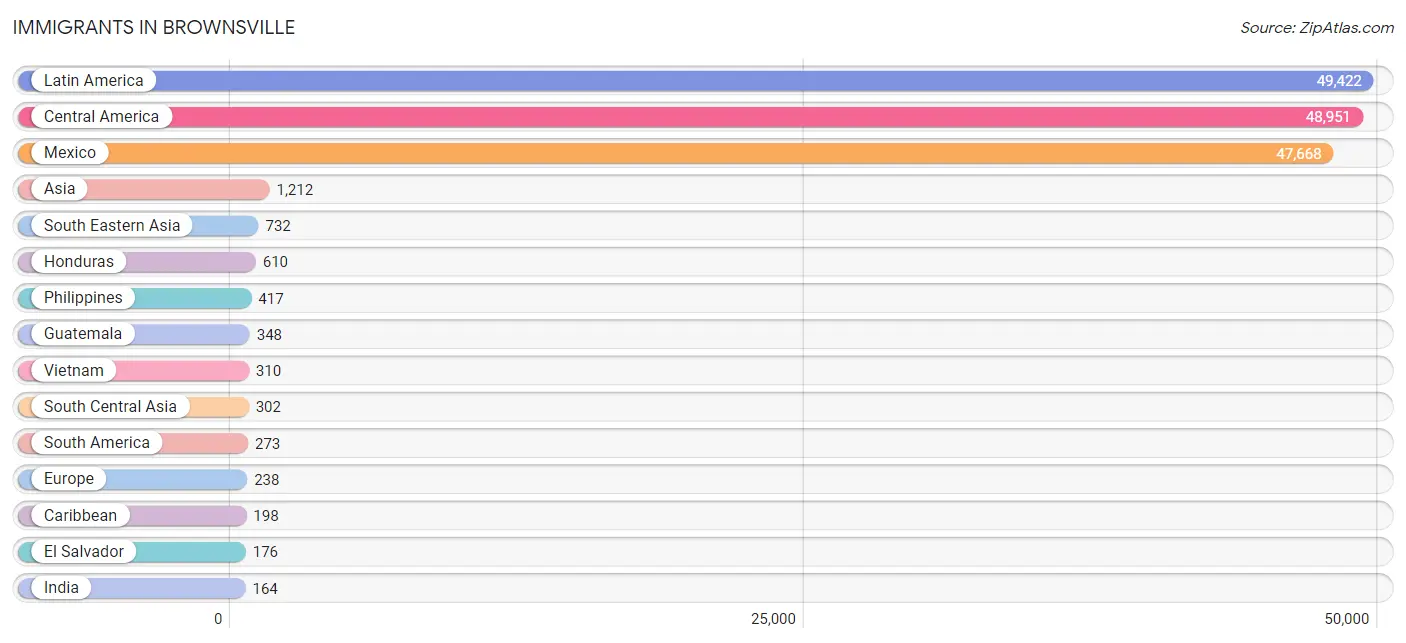
Immigrants in Brownsville
The most numerous immigrant groups reported in Brownsville came from Latin America (49,422 | 26.4%), Central America (48,951 | 26.2%), Mexico (47,668 | 25.5%), Asia (1,212 | 0.6%), and South Eastern Asia (732 | 0.4%), together accounting for 79.1% of all Brownsville residents.
| Immigration Origin | # Population | % Population |
| Africa | 27 | 0.0% |
| Argentina | 53 | 0.0% |
| Armenia | 30 | 0.0% |
| Asia | 1,212 | 0.6% |
| Australia | 15 | 0.0% |
| Bangladesh | 17 | 0.0% |
| Bolivia | 8 | 0.0% |
| Brazil | 10 | 0.0% |
| Canada | 142 | 0.1% |
| Caribbean | 198 | 0.1% |
| Central America | 48,951 | 26.2% |
| Chile | 19 | 0.0% |
| China | 75 | 0.0% |
| Colombia | 78 | 0.0% |
| Costa Rica | 21 | 0.0% |
| Cuba | 82 | 0.0% |
| Dominican Republic | 116 | 0.1% |
| Eastern Africa | 11 | 0.0% |
| Eastern Asia | 93 | 0.1% |
| Eastern Europe | 142 | 0.1% |
| Ecuador | 42 | 0.0% |
| El Salvador | 176 | 0.1% |
| England | 10 | 0.0% |
| Ethiopia | 11 | 0.0% |
| Europe | 238 | 0.1% |
| France | 31 | 0.0% |
| Germany | 10 | 0.0% |
| Guatemala | 348 | 0.2% |
| Honduras | 610 | 0.3% |
| India | 164 | 0.1% |
| Ireland | 1 | 0.0% |
| Israel | 55 | 0.0% |
| Italy | 39 | 0.0% |
| Japan | 9 | 0.0% |
| Korea | 9 | 0.0% |
| Latin America | 49,422 | 26.4% |
| Malaysia | 5 | 0.0% |
| Mexico | 47,668 | 25.5% |
| Nepal | 7 | 0.0% |
| Nicaragua | 128 | 0.1% |
| Nigeria | 16 | 0.0% |
| Northern Europe | 11 | 0.0% |
| Oceania | 15 | 0.0% |
| Pakistan | 48 | 0.0% |
| Peru | 39 | 0.0% |
| Philippines | 417 | 0.2% |
| Poland | 30 | 0.0% |
| Romania | 7 | 0.0% |
| Russia | 93 | 0.1% |
| Serbia | 12 | 0.0% |
| South America | 273 | 0.2% |
| South Central Asia | 302 | 0.2% |
| South Eastern Asia | 732 | 0.4% |
| Southern Europe | 39 | 0.0% |
| Switzerland | 5 | 0.0% |
| Taiwan | 1 | 0.0% |
| Venezuela | 24 | 0.0% |
| Vietnam | 310 | 0.2% |
| Western Africa | 16 | 0.0% |
| Western Asia | 85 | 0.1% |
| Western Europe | 46 | 0.0% | View All 61 Rows |
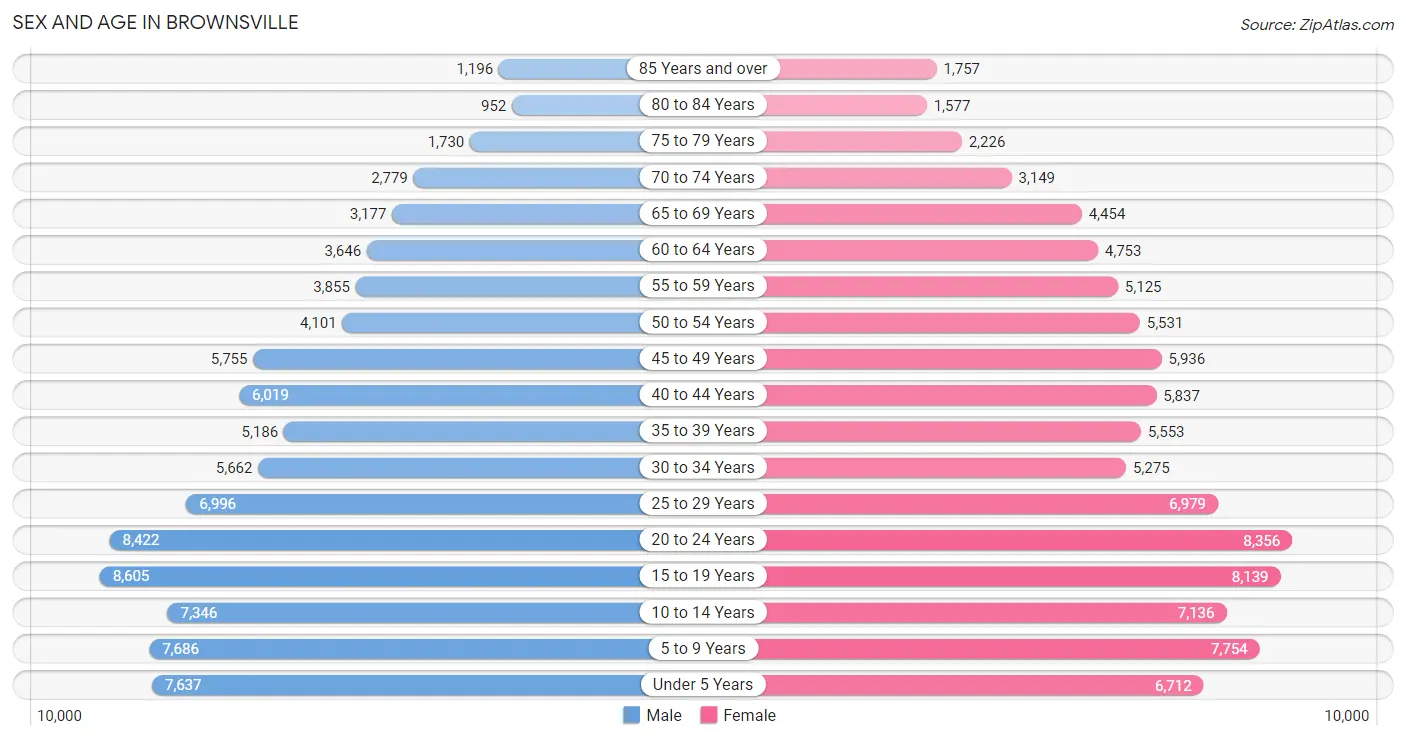
Sex and Age in Brownsville
Sex and Age in Brownsville
The most populous age groups in Brownsville are 15 to 19 Years (8,605 | 9.5%) for men and 20 to 24 Years (8,356 | 8.7%) for women.
| Age Bracket | Male | Female |
| Under 5 Years | 7,637 (8.4%) | 6,712 (7.0%) |
| 5 to 9 Years | 7,686 (8.5%) | 7,754 (8.1%) |
| 10 to 14 Years | 7,346 (8.1%) | 7,136 (7.4%) |
| 15 to 19 Years | 8,605 (9.5%) | 8,139 (8.5%) |
| 20 to 24 Years | 8,422 (9.3%) | 8,356 (8.7%) |
| 25 to 29 Years | 6,996 (7.7%) | 6,979 (7.2%) |
| 30 to 34 Years | 5,662 (6.2%) | 5,275 (5.5%) |
| 35 to 39 Years | 5,186 (5.7%) | 5,553 (5.8%) |
| 40 to 44 Years | 6,019 (6.6%) | 5,837 (6.1%) |
| 45 to 49 Years | 5,755 (6.3%) | 5,936 (6.2%) |
| 50 to 54 Years | 4,101 (4.5%) | 5,531 (5.8%) |
| 55 to 59 Years | 3,855 (4.3%) | 5,125 (5.3%) |
| 60 to 64 Years | 3,646 (4.0%) | 4,753 (4.9%) |
| 65 to 69 Years | 3,177 (3.5%) | 4,454 (4.6%) |
| 70 to 74 Years | 2,779 (3.1%) | 3,149 (3.3%) |
| 75 to 79 Years | 1,730 (1.9%) | 2,226 (2.3%) |
| 80 to 84 Years | 952 (1.1%) | 1,577 (1.6%) |
| 85 Years and over | 1,196 (1.3%) | 1,757 (1.8%) |
| Total | 90,750 (100.0%) | 96,249 (100.0%) |
Families and Households in Brownsville
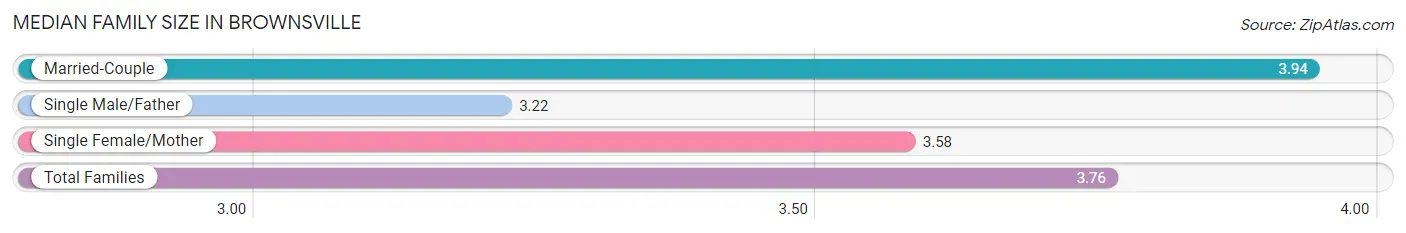
Median Family Size in Brownsville
The median family size in Brownsville is 3.76 persons per family, with married-couple families (27,302 | 60.7%) accounting for the largest median family size of 3.94 persons per family. On the other hand, single male/father families (4,615 | 10.3%) represent the smallest median family size with 3.22 persons per family.
| Family Type | # Families | Family Size |
| Married-Couple | 27,302 (60.7%) | 3.94 |
| Single Male/Father | 4,615 (10.3%) | 3.22 |
| Single Female/Mother | 13,075 (29.1%) | 3.58 |
| Total Families | 44,992 (100.0%) | 3.76 |
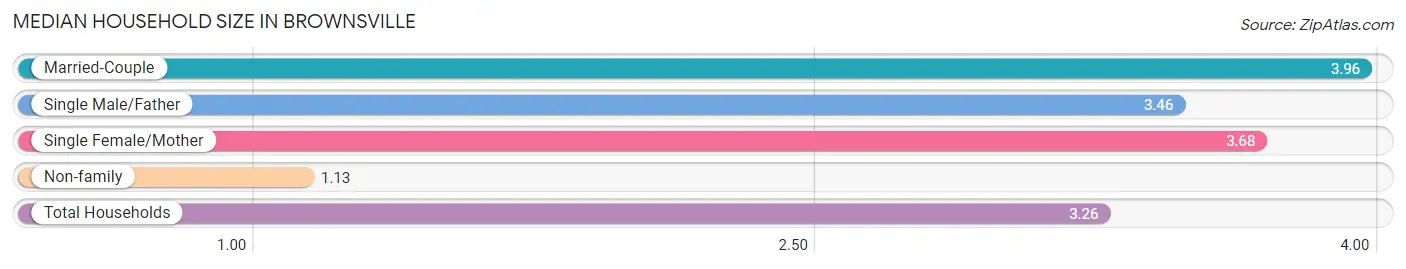
Median Household Size in Brownsville
The median household size in Brownsville is 3.26 persons per household, with married-couple households (27,302 | 48.0%) accounting for the largest median household size of 3.96 persons per household. non-family households (11,884 | 20.9%) represent the smallest median household size with 1.13 persons per household.
| Household Type | # Households | Household Size |
| Married-Couple | 27,302 (48.0%) | 3.96 |
| Single Male/Father | 4,615 (8.1%) | 3.46 |
| Single Female/Mother | 13,075 (23.0%) | 3.68 |
| Non-family | 11,884 (20.9%) | 1.13 |
| Total Households | 56,876 (100.0%) | 3.26 |
Household Size by Marriage Status in Brownsville
Out of a total of 56,876 households in Brownsville, 44,992 (79.1%) are family households, while 11,884 (20.9%) are nonfamily households. The most numerous type of family households are 2-person households, comprising 12,855, and the most common type of nonfamily households are 1-person households, comprising 10,699.
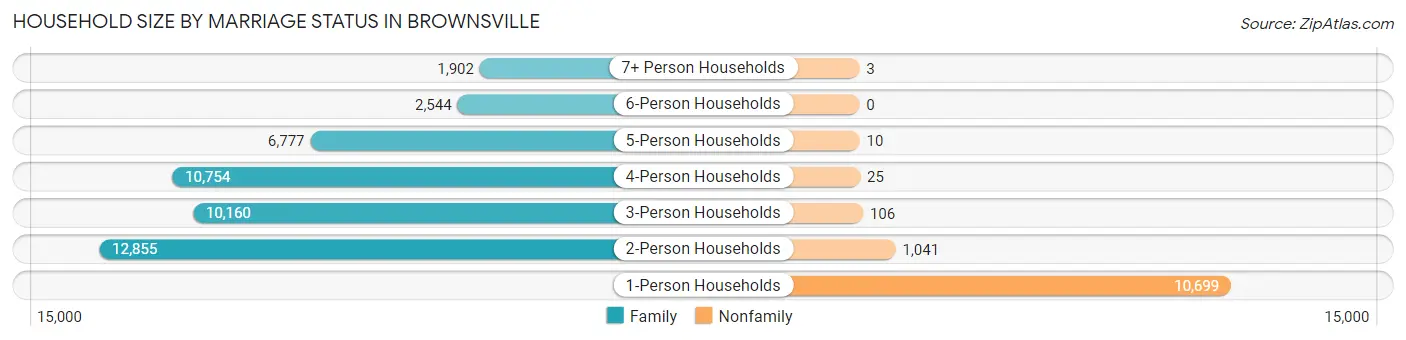
| Household Size | Family Households | Nonfamily Households |
| 1-Person Households | - | 10,699 (18.8%) |
| 2-Person Households | 12,855 (22.6%) | 1,041 (1.8%) |
| 3-Person Households | 10,160 (17.9%) | 106 (0.2%) |
| 4-Person Households | 10,754 (18.9%) | 25 (0.0%) |
| 5-Person Households | 6,777 (11.9%) | 10 (0.0%) |
| 6-Person Households | 2,544 (4.5%) | 0 (0.0%) |
| 7+ Person Households | 1,902 (3.3%) | 3 (0.0%) |
| Total | 44,992 (79.1%) | 11,884 (20.9%) |
Female Fertility in Brownsville
Fertility by Age in Brownsville
Average fertility rate in Brownsville is 52.0 births per 1,000 women. Women in the age bracket of 20 to 34 years have the highest fertility rate with 100.0 births per 1,000 women. Women in the age bracket of 20 to 34 years acount for 83.0% of all women with births.
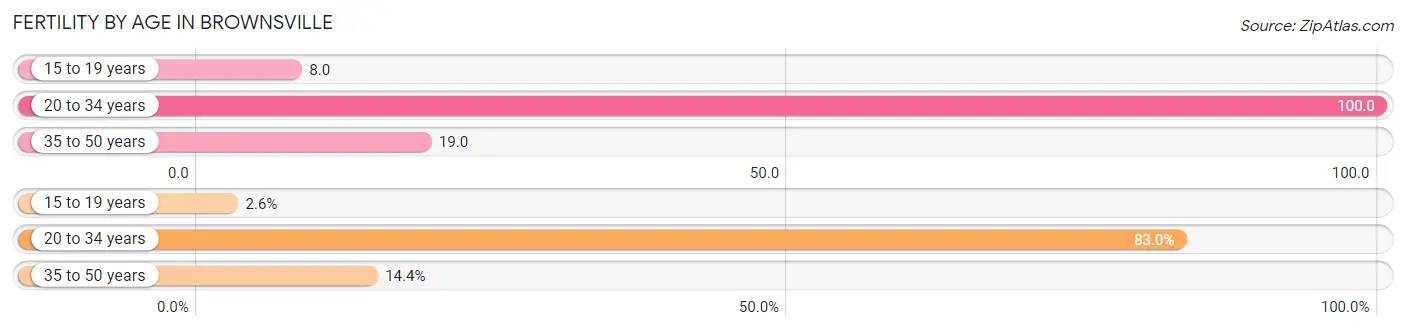
| Age Bracket | Women with Births | Births / 1,000 Women |
| 15 to 19 years | 64 (2.6%) | 8.0 |
| 20 to 34 years | 2,052 (83.0%) | 100.0 |
| 35 to 50 years | 357 (14.4%) | 19.0 |
| Total | 2,473 (100.0%) | 52.0 |
Fertility by Age by Marriage Status in Brownsville
66.9% of women with births (2,473) in Brownsville are married. The highest percentage of unmarried women with births falls into 15 to 19 years age bracket with 87.5% of them unmarried at the time of birth, while the lowest percentage of unmarried women with births belong to 20 to 34 years age bracket with 30.7% of them unmarried.
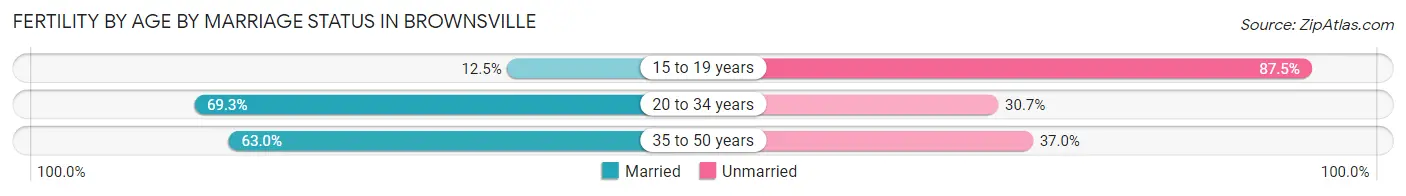
| Age Bracket | Married | Unmarried |
| 15 to 19 years | 8 (12.5%) | 56 (87.5%) |
| 20 to 34 years | 1,422 (69.3%) | 630 (30.7%) |
| 35 to 50 years | 225 (63.0%) | 132 (37.0%) |
| Total | 1,654 (66.9%) | 819 (33.1%) |
Fertility by Education in Brownsville
Average fertility rate in Brownsville is 52.0 births per 1,000 women. Women with the education attainment of bachelor's degree have the highest fertility rate of 86.0 births per 1,000 women, while women with the education attainment of less than high school have the lowest fertility at 28.0 births per 1,000 women. Women with the education attainment of high school diploma represent 32.2% of all women with births.
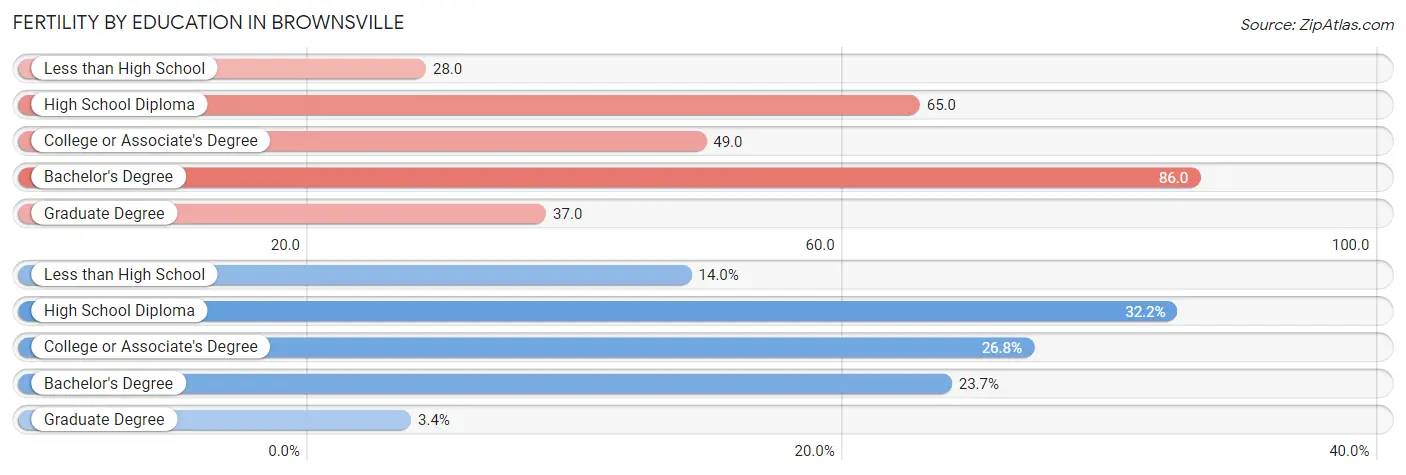
| Educational Attainment | Women with Births | Births / 1,000 Women |
| Less than High School | 345 (14.0%) | 28.0 |
| High School Diploma | 795 (32.2%) | 65.0 |
| College or Associate's Degree | 662 (26.8%) | 49.0 |
| Bachelor's Degree | 586 (23.7%) | 86.0 |
| Graduate Degree | 85 (3.4%) | 37.0 |
| Total | 2,473 (100.0%) | 52.0 |
Fertility by Education by Marriage Status in Brownsville
33.1% of women with births in Brownsville are unmarried. Women with the educational attainment of graduate degree are most likely to be married with 100.0% of them married at childbirth, while women with the educational attainment of college or associate's degree are least likely to be married with 47.0% of them unmarried at childbirth.
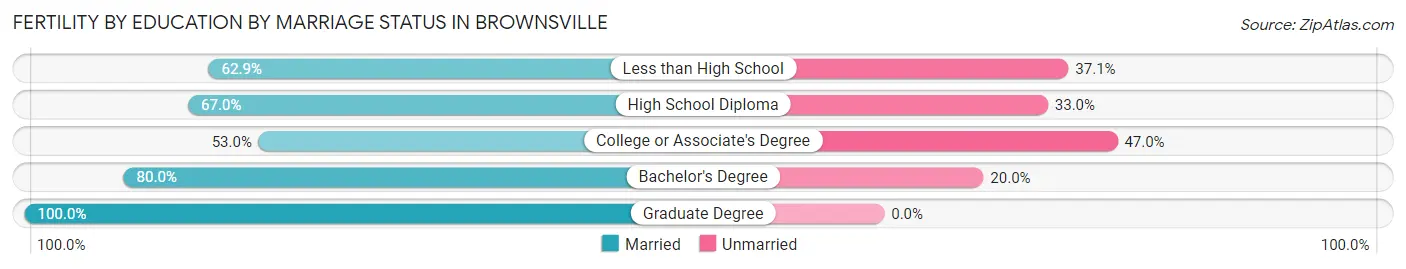
| Educational Attainment | Married | Unmarried |
| Less than High School | 217 (62.9%) | 128 (37.1%) |
| High School Diploma | 533 (67.0%) | 262 (33.0%) |
| College or Associate's Degree | 351 (53.0%) | 311 (47.0%) |
| Bachelor's Degree | 469 (80.0%) | 117 (20.0%) |
| Graduate Degree | 85 (100.0%) | 0 (0.0%) |
| Total | 1,654 (66.9%) | 819 (33.1%) |
Employment Characteristics in Brownsville
Employment by Class of Employer in Brownsville
Among the 75,031 employed individuals in Brownsville, private company employees (47,766 | 63.7%), local government employees (9,582 | 12.8%), and self-employed (not incorporated) (5,875 | 7.8%) make up the most common classes of employment.
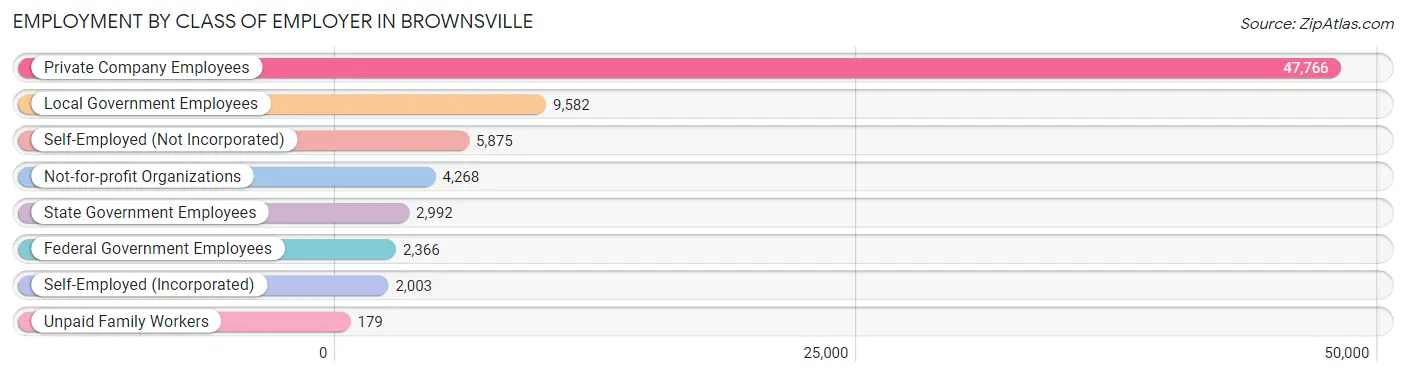
| Employer Class | # Employees | % Employees |
| Private Company Employees | 47,766 | 63.7% |
| Self-Employed (Incorporated) | 2,003 | 2.7% |
| Self-Employed (Not Incorporated) | 5,875 | 7.8% |
| Not-for-profit Organizations | 4,268 | 5.7% |
| Local Government Employees | 9,582 | 12.8% |
| State Government Employees | 2,992 | 4.0% |
| Federal Government Employees | 2,366 | 3.2% |
| Unpaid Family Workers | 179 | 0.2% |
| Total | 75,031 | 100.0% |
Employment Status by Age in Brownsville
According to the labor force statistics for Brownsville, out of the total population over 16 years of age (139,782), 58.0% or 81,074 individuals are in the labor force, with 6.3% or 5,108 of them unemployed. The age group with the highest labor force participation rate is 35 to 44 years, with 79.8% or 18,031 individuals in the labor force. Within the labor force, the 16 to 19 years age range has the highest percentage of unemployed individuals, with 19.0% or 553 of them being unemployed.
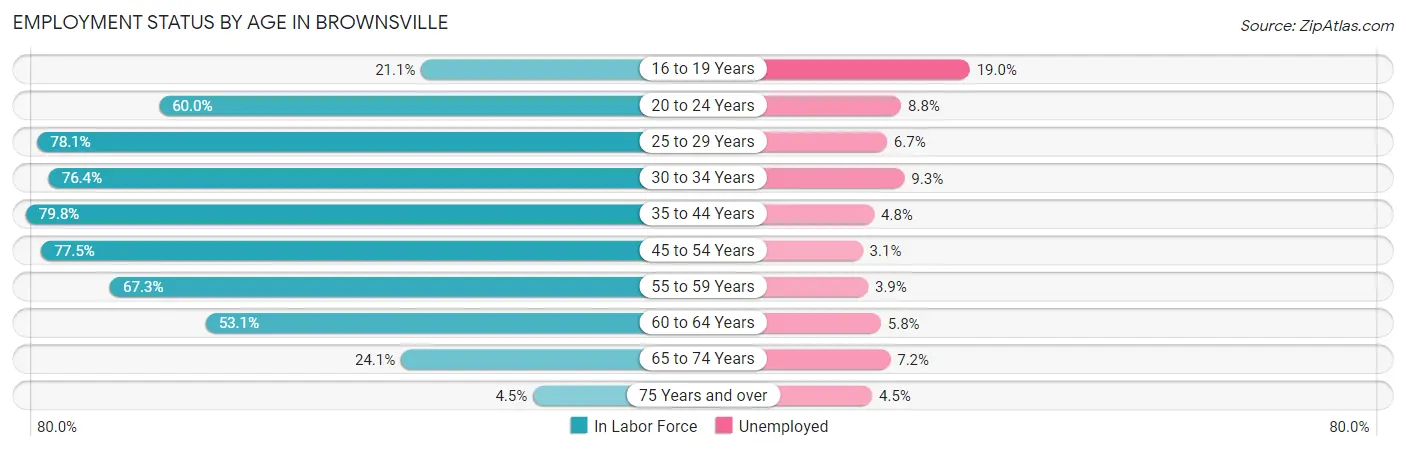
| Age Bracket | In Labor Force | Unemployed |
| 16 to 19 Years | 2,911 (21.1%) | 553 (19.0%) |
| 20 to 24 Years | 10,067 (60.0%) | 886 (8.8%) |
| 25 to 29 Years | 10,914 (78.1%) | 731 (6.7%) |
| 30 to 34 Years | 8,356 (76.4%) | 777 (9.3%) |
| 35 to 44 Years | 18,031 (79.8%) | 865 (4.8%) |
| 45 to 54 Years | 16,525 (77.5%) | 512 (3.1%) |
| 55 to 59 Years | 6,044 (67.3%) | 236 (3.9%) |
| 60 to 64 Years | 4,460 (53.1%) | 259 (5.8%) |
| 65 to 74 Years | 3,268 (24.1%) | 235 (7.2%) |
| 75 Years and over | 425 (4.5%) | 19 (4.5%) |
| Total | 81,074 (58.0%) | 5,108 (6.3%) |
Employment Status by Educational Attainment in Brownsville
According to labor force statistics for Brownsville, 74.6% of individuals (64,312) out of the total population between 25 and 64 years of age (86,209) are in the labor force, with 5.3% or 3,409 of them being unemployed. The group with the highest labor force participation rate are those with the educational attainment of bachelor's degree or higher, with 84.4% or 16,598 individuals in the labor force. Within the labor force, individuals with high school diploma education have the highest percentage of unemployment, with 6.9% or 1,102 of them being unemployed.
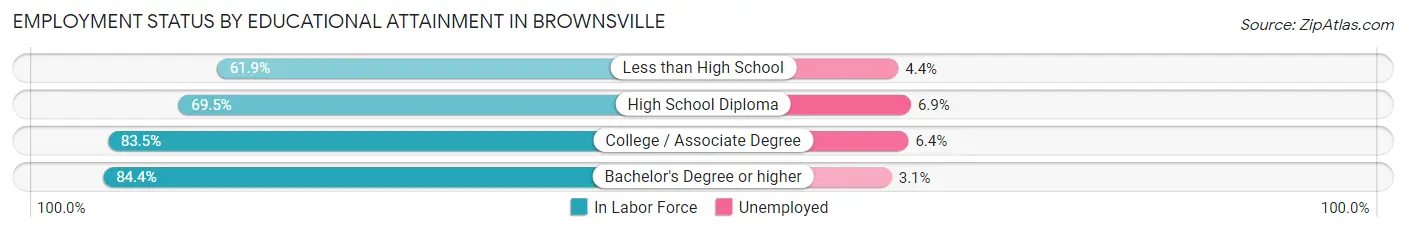
| Educational Attainment | In Labor Force | Unemployed |
| Less than High School | 13,240 (61.9%) | 941 (4.4%) |
| High School Diploma | 15,974 (69.5%) | 1,586 (6.9%) |
| College / Associate Degree | 18,511 (83.5%) | 1,419 (6.4%) |
| Bachelor's Degree or higher | 16,598 (84.4%) | 610 (3.1%) |
| Total | 64,312 (74.6%) | 4,569 (5.3%) |
Employment Occupations by Sex in Brownsville
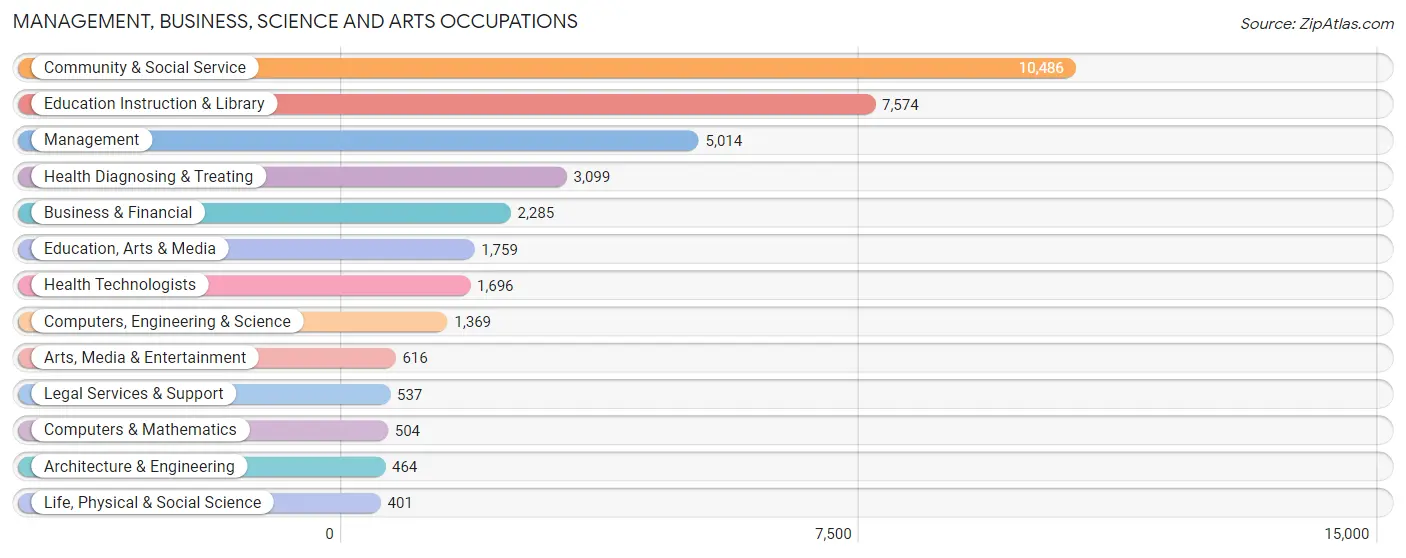
Management, Business, Science and Arts Occupations
The most common Management, Business, Science and Arts occupations in Brownsville are Community & Social Service (10,486 | 13.8%), Education Instruction & Library (7,574 | 10.0%), Management (5,014 | 6.6%), Health Diagnosing & Treating (3,099 | 4.1%), and Business & Financial (2,285 | 3.0%).
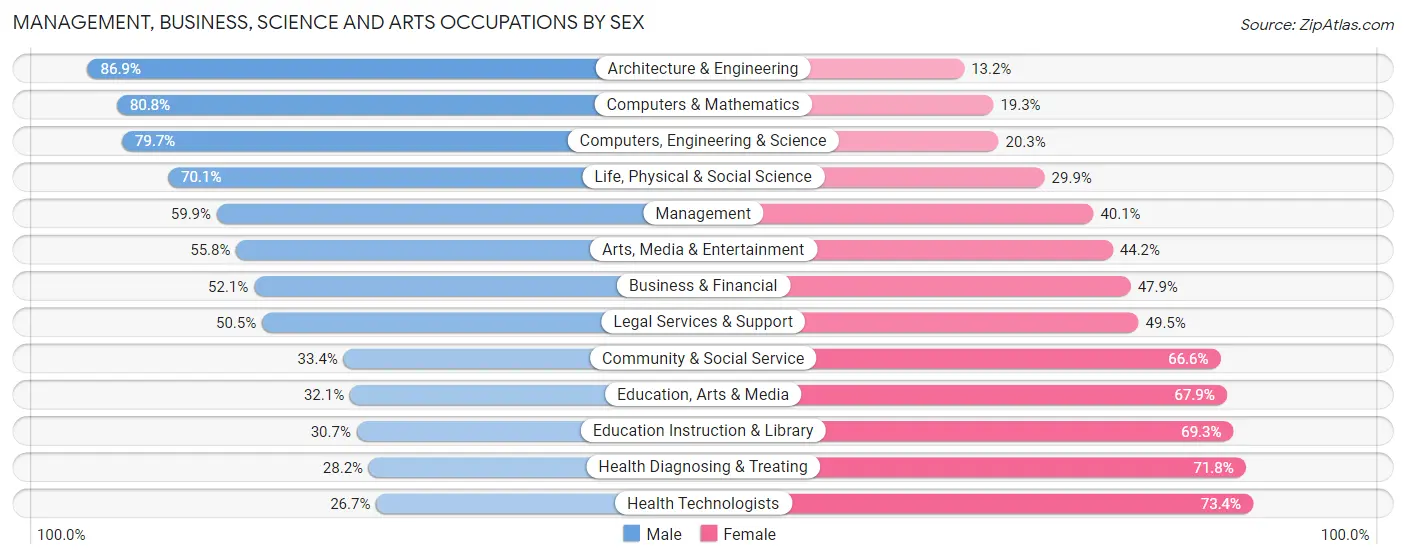
Management, Business, Science and Arts Occupations by Sex
Within the Management, Business, Science and Arts occupations in Brownsville, the most male-oriented occupations are Architecture & Engineering (86.9%), Computers & Mathematics (80.7%), and Computers, Engineering & Science (79.7%), while the most female-oriented occupations are Health Technologists (73.4%), Health Diagnosing & Treating (71.8%), and Education Instruction & Library (69.3%).
| Occupation | Male | Female |
| Management | 3,003 (59.9%) | 2,011 (40.1%) |
| Business & Financial | 1,191 (52.1%) | 1,094 (47.9%) |
| Computers, Engineering & Science | 1,091 (79.7%) | 278 (20.3%) |
| Computers & Mathematics | 407 (80.7%) | 97 (19.3%) |
| Architecture & Engineering | 403 (86.9%) | 61 (13.2%) |
| Life, Physical & Social Science | 281 (70.1%) | 120 (29.9%) |
| Community & Social Service | 3,507 (33.4%) | 6,979 (66.6%) |
| Education, Arts & Media | 565 (32.1%) | 1,194 (67.9%) |
| Legal Services & Support | 271 (50.5%) | 266 (49.5%) |
| Education Instruction & Library | 2,327 (30.7%) | 5,247 (69.3%) |
| Arts, Media & Entertainment | 344 (55.8%) | 272 (44.2%) |
| Health Diagnosing & Treating | 873 (28.2%) | 2,226 (71.8%) |
| Health Technologists | 452 (26.7%) | 1,244 (73.4%) |
| Total (Category) | 9,665 (43.4%) | 12,588 (56.6%) |
| Total (Overall) | 39,910 (52.6%) | 35,921 (47.4%) |
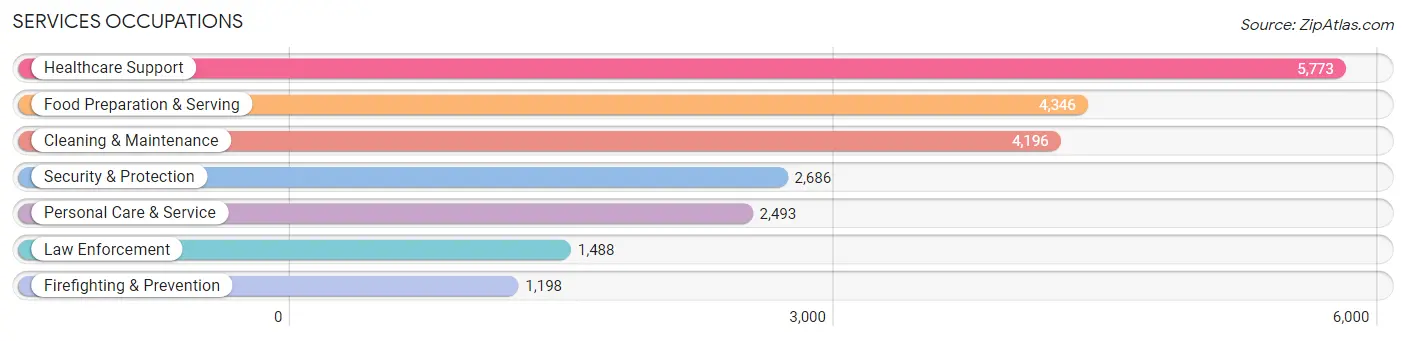
Services Occupations
The most common Services occupations in Brownsville are Healthcare Support (5,773 | 7.6%), Food Preparation & Serving (4,346 | 5.7%), Cleaning & Maintenance (4,196 | 5.5%), Security & Protection (2,686 | 3.5%), and Personal Care & Service (2,493 | 3.3%).
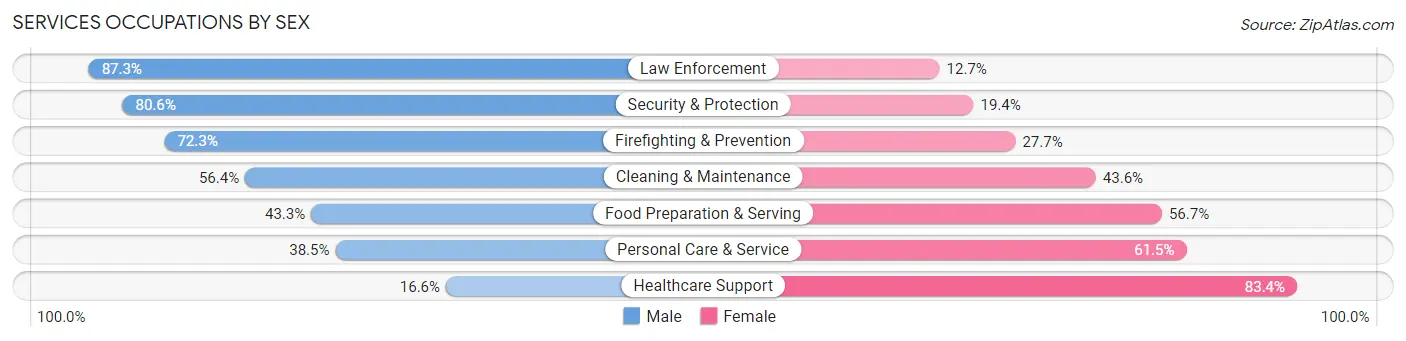
Services Occupations by Sex
Within the Services occupations in Brownsville, the most male-oriented occupations are Law Enforcement (87.3%), Security & Protection (80.6%), and Firefighting & Prevention (72.3%), while the most female-oriented occupations are Healthcare Support (83.4%), Personal Care & Service (61.5%), and Food Preparation & Serving (56.7%).
| Occupation | Male | Female |
| Healthcare Support | 957 (16.6%) | 4,816 (83.4%) |
| Security & Protection | 2,165 (80.6%) | 521 (19.4%) |
| Firefighting & Prevention | 866 (72.3%) | 332 (27.7%) |
| Law Enforcement | 1,299 (87.3%) | 189 (12.7%) |
| Food Preparation & Serving | 1,881 (43.3%) | 2,465 (56.7%) |
| Cleaning & Maintenance | 2,365 (56.4%) | 1,831 (43.6%) |
| Personal Care & Service | 959 (38.5%) | 1,534 (61.5%) |
| Total (Category) | 8,327 (42.7%) | 11,167 (57.3%) |
| Total (Overall) | 39,910 (52.6%) | 35,921 (47.4%) |
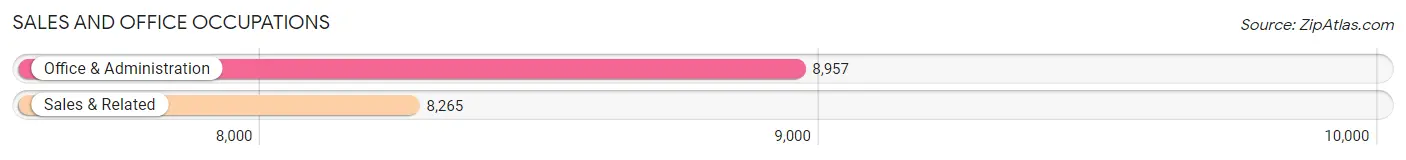
Sales and Office Occupations
The most common Sales and Office occupations in Brownsville are Office & Administration (8,957 | 11.8%), and Sales & Related (8,265 | 10.9%).
Sales and Office Occupations by Sex
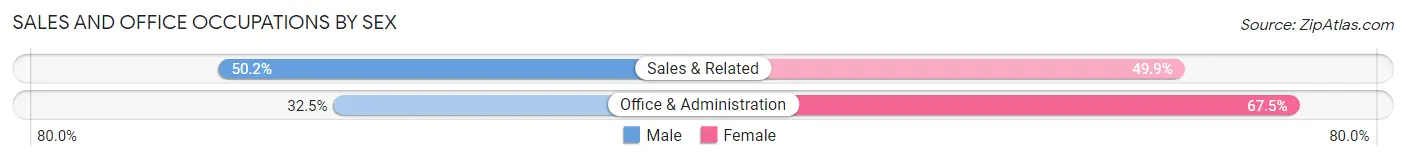
| Occupation | Male | Female |
| Sales & Related | 4,145 (50.1%) | 4,120 (49.8%) |
| Office & Administration | 2,911 (32.5%) | 6,046 (67.5%) |
| Total (Category) | 7,056 (41.0%) | 10,166 (59.0%) |
| Total (Overall) | 39,910 (52.6%) | 35,921 (47.4%) |
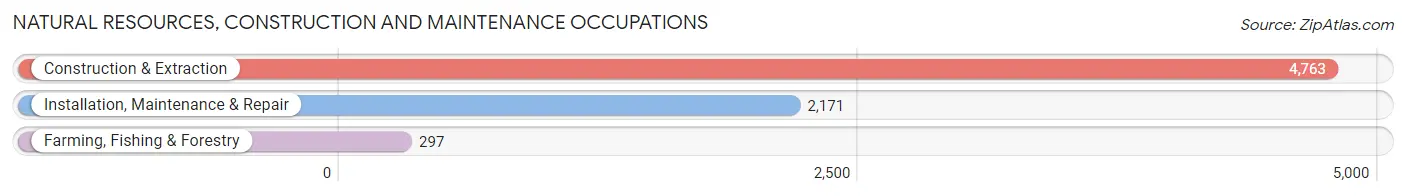
Natural Resources, Construction and Maintenance Occupations
The most common Natural Resources, Construction and Maintenance occupations in Brownsville are Construction & Extraction (4,763 | 6.3%), Installation, Maintenance & Repair (2,171 | 2.9%), and Farming, Fishing & Forestry (297 | 0.4%).
Natural Resources, Construction and Maintenance Occupations by Sex
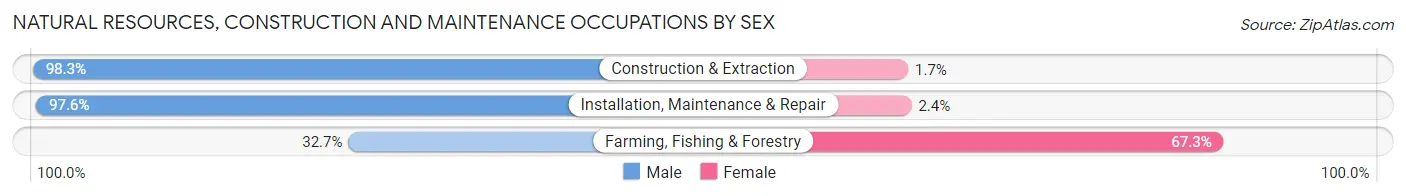
| Occupation | Male | Female |
| Farming, Fishing & Forestry | 97 (32.7%) | 200 (67.3%) |
| Construction & Extraction | 4,682 (98.3%) | 81 (1.7%) |
| Installation, Maintenance & Repair | 2,119 (97.6%) | 52 (2.4%) |
| Total (Category) | 6,898 (95.4%) | 333 (4.6%) |
| Total (Overall) | 39,910 (52.6%) | 35,921 (47.4%) |
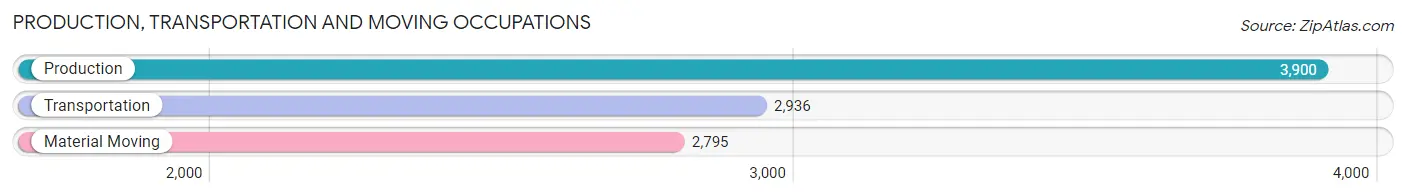
Production, Transportation and Moving Occupations
The most common Production, Transportation and Moving occupations in Brownsville are Production (3,900 | 5.1%), Transportation (2,936 | 3.9%), and Material Moving (2,795 | 3.7%).
Production, Transportation and Moving Occupations by Sex
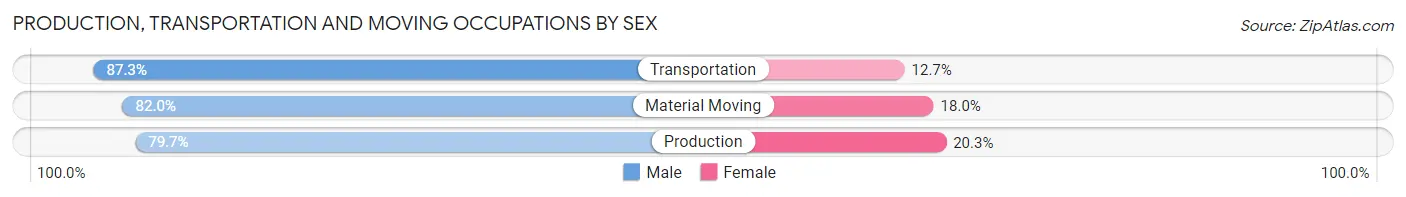
| Occupation | Male | Female |
| Production | 3,108 (79.7%) | 792 (20.3%) |
| Transportation | 2,564 (87.3%) | 372 (12.7%) |
| Material Moving | 2,292 (82.0%) | 503 (18.0%) |
| Total (Category) | 7,964 (82.7%) | 1,667 (17.3%) |
| Total (Overall) | 39,910 (52.6%) | 35,921 (47.4%) |
Employment Industries by Sex in Brownsville
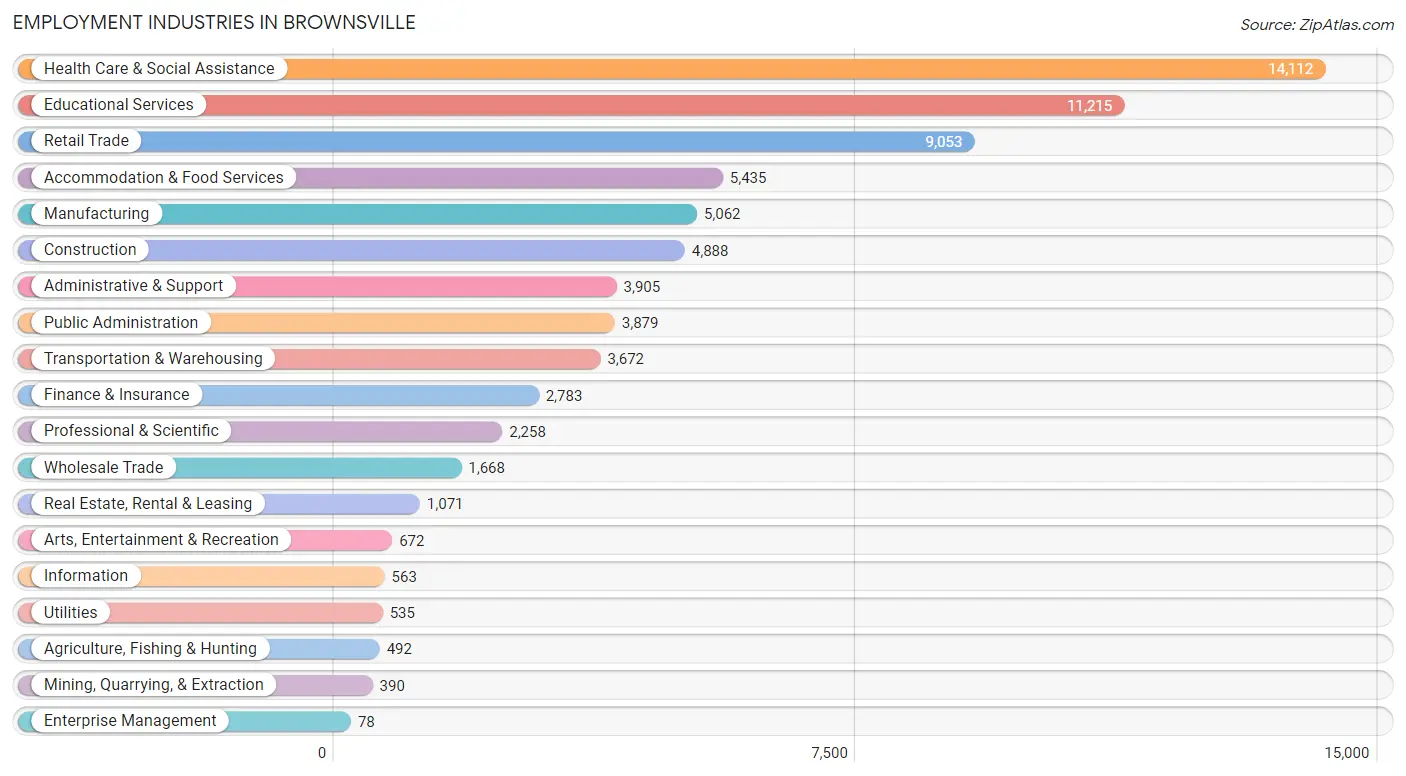
Employment Industries in Brownsville
The major employment industries in Brownsville include Health Care & Social Assistance (14,112 | 18.6%), Educational Services (11,215 | 14.8%), Retail Trade (9,053 | 11.9%), Accommodation & Food Services (5,435 | 7.2%), and Manufacturing (5,062 | 6.7%).
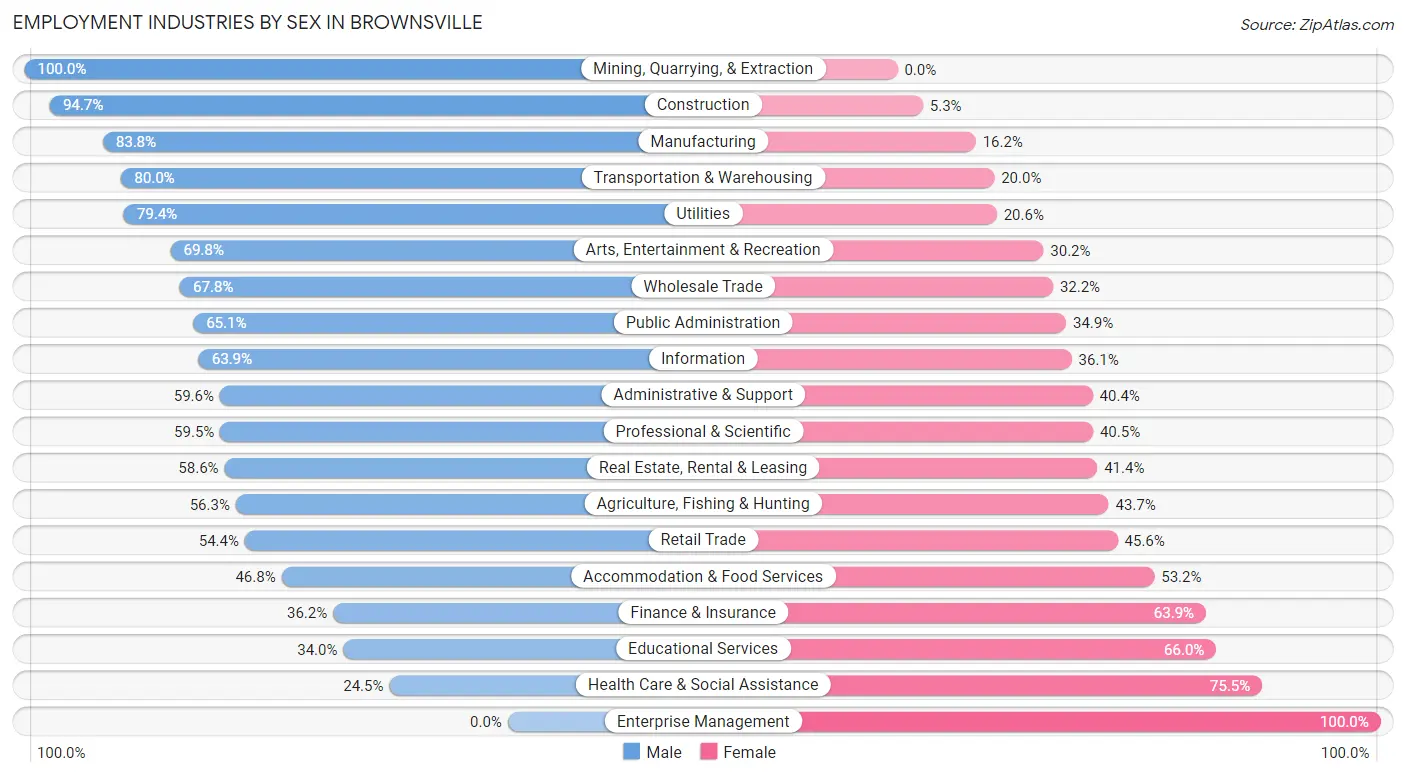
Employment Industries by Sex in Brownsville
The Brownsville industries that see more men than women are Mining, Quarrying, & Extraction (100.0%), Construction (94.7%), and Manufacturing (83.8%), whereas the industries that tend to have a higher number of women are Enterprise Management (100.0%), Health Care & Social Assistance (75.5%), and Educational Services (66.0%).
| Industry | Male | Female |
| Agriculture, Fishing & Hunting | 277 (56.3%) | 215 (43.7%) |
| Mining, Quarrying, & Extraction | 390 (100.0%) | 0 (0.0%) |
| Construction | 4,631 (94.7%) | 257 (5.3%) |
| Manufacturing | 4,242 (83.8%) | 820 (16.2%) |
| Wholesale Trade | 1,131 (67.8%) | 537 (32.2%) |
| Retail Trade | 4,927 (54.4%) | 4,126 (45.6%) |
| Transportation & Warehousing | 2,936 (80.0%) | 736 (20.0%) |
| Utilities | 425 (79.4%) | 110 (20.6%) |
| Information | 360 (63.9%) | 203 (36.1%) |
| Finance & Insurance | 1,006 (36.1%) | 1,777 (63.8%) |
| Real Estate, Rental & Leasing | 628 (58.6%) | 443 (41.4%) |
| Professional & Scientific | 1,344 (59.5%) | 914 (40.5%) |
| Enterprise Management | 0 (0.0%) | 78 (100.0%) |
| Administrative & Support | 2,327 (59.6%) | 1,578 (40.4%) |
| Educational Services | 3,816 (34.0%) | 7,399 (66.0%) |
| Health Care & Social Assistance | 3,460 (24.5%) | 10,652 (75.5%) |
| Arts, Entertainment & Recreation | 469 (69.8%) | 203 (30.2%) |
| Accommodation & Food Services | 2,545 (46.8%) | 2,890 (53.2%) |
| Public Administration | 2,525 (65.1%) | 1,354 (34.9%) |
| Total | 39,910 (52.6%) | 35,921 (47.4%) |
Education in Brownsville
School Enrollment in Brownsville
The most common levels of schooling among the 56,843 students in Brownsville are high school (12,928 | 22.7%), elementary school (12,143 | 21.4%), and college / undergraduate (11,469 | 20.2%).
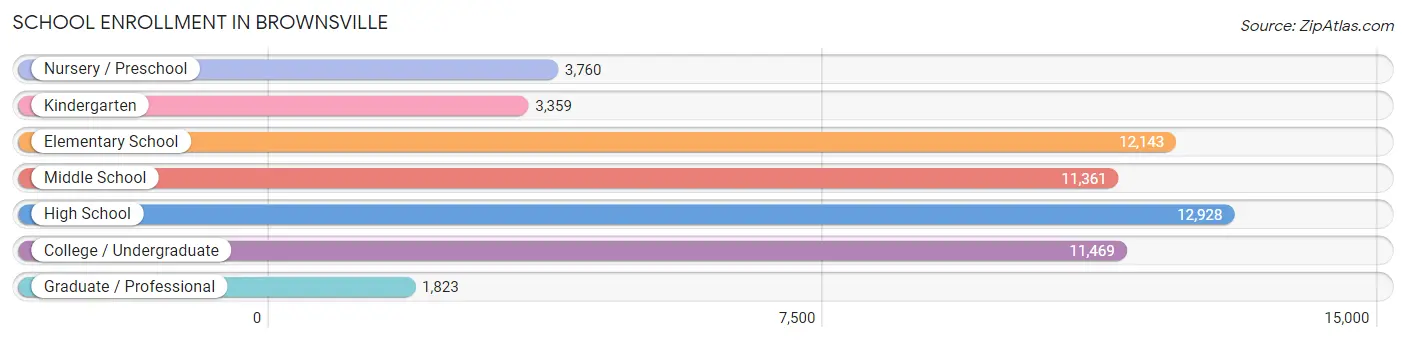
| School Level | # Students | % Students |
| Nursery / Preschool | 3,760 | 6.6% |
| Kindergarten | 3,359 | 5.9% |
| Elementary School | 12,143 | 21.4% |
| Middle School | 11,361 | 20.0% |
| High School | 12,928 | 22.7% |
| College / Undergraduate | 11,469 | 20.2% |
| Graduate / Professional | 1,823 | 3.2% |
| Total | 56,843 | 100.0% |
School Enrollment by Age by Funding Source in Brownsville
Out of a total of 56,843 students who are enrolled in schools in Brownsville, 3,183 (5.6%) attend a private institution, while the remaining 53,660 (94.4%) are enrolled in public schools. The age group of 35 years and over has the highest likelihood of being enrolled in private schools, with 266 (16.1% in the age bracket) enrolled. Conversely, the age group of 15 to 17 year olds has the lowest likelihood of being enrolled in a private school, with 8,932 (97.0% in the age bracket) attending a public institution.
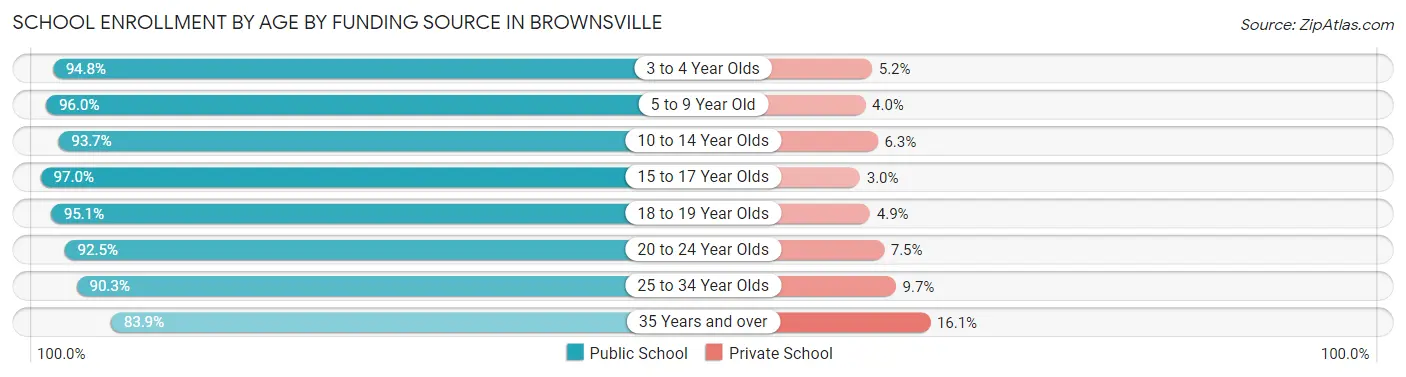
| Age Bracket | Public School | Private School |
| 3 to 4 Year Olds | 2,985 (94.8%) | 165 (5.2%) |
| 5 to 9 Year Old | 13,995 (96.0%) | 582 (4.0%) |
| 10 to 14 Year Olds | 13,022 (93.7%) | 875 (6.3%) |
| 15 to 17 Year Olds | 8,932 (97.0%) | 276 (3.0%) |
| 18 to 19 Year Olds | 4,837 (95.1%) | 248 (4.9%) |
| 20 to 24 Year Olds | 6,123 (92.5%) | 494 (7.5%) |
| 25 to 34 Year Olds | 2,397 (90.3%) | 257 (9.7%) |
| 35 Years and over | 1,389 (83.9%) | 266 (16.1%) |
| Total | 53,660 (94.4%) | 3,183 (5.6%) |
Educational Attainment by Field of Study in Brownsville
Education (5,252 | 22.1%), business (4,780 | 20.1%), science & technology (2,636 | 11.1%), bio, nature & agricultural (1,481 | 6.2%), and engineering (1,477 | 6.2%) are the most common fields of study among 23,821 individuals in Brownsville who have obtained a bachelor's degree or higher.
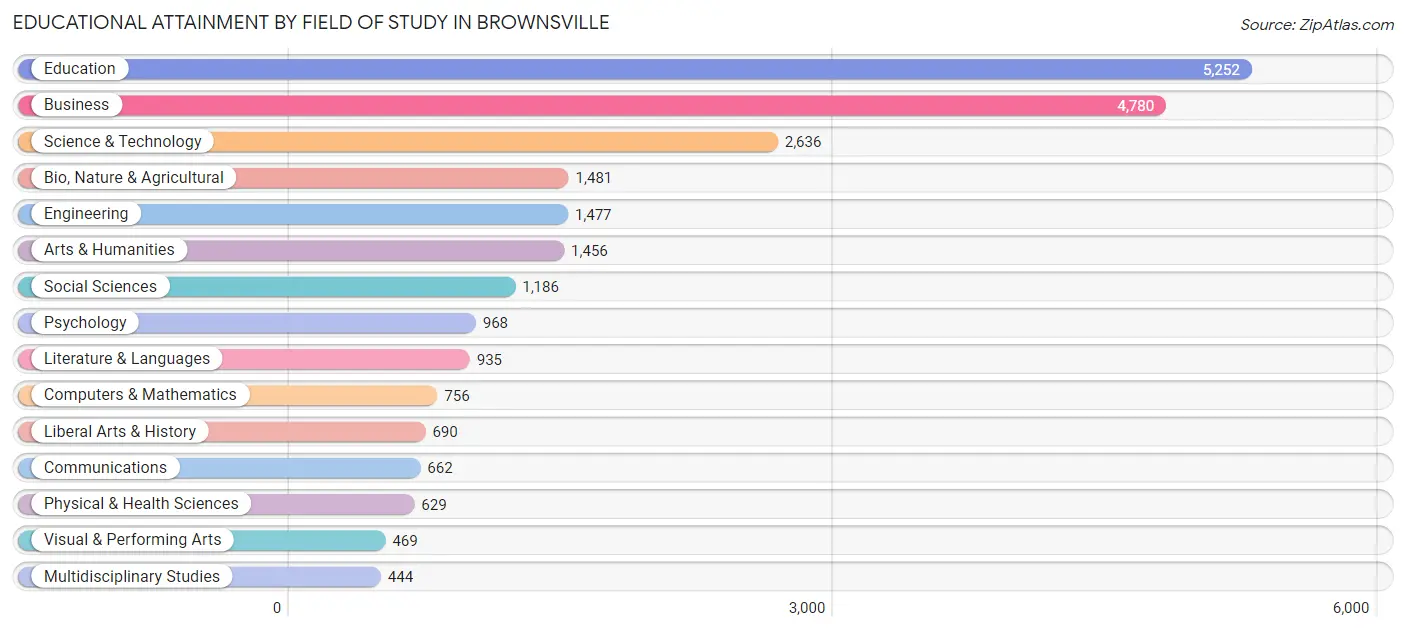
| Field of Study | # Graduates | % Graduates |
| Computers & Mathematics | 756 | 3.2% |
| Bio, Nature & Agricultural | 1,481 | 6.2% |
| Physical & Health Sciences | 629 | 2.6% |
| Psychology | 968 | 4.1% |
| Social Sciences | 1,186 | 5.0% |
| Engineering | 1,477 | 6.2% |
| Multidisciplinary Studies | 444 | 1.9% |
| Science & Technology | 2,636 | 11.1% |
| Business | 4,780 | 20.1% |
| Education | 5,252 | 22.1% |
| Literature & Languages | 935 | 3.9% |
| Liberal Arts & History | 690 | 2.9% |
| Visual & Performing Arts | 469 | 2.0% |
| Communications | 662 | 2.8% |
| Arts & Humanities | 1,456 | 6.1% |
| Total | 23,821 | 100.0% |
Transportation & Commute in Brownsville
Vehicle Availability by Sex in Brownsville
The most prevalent vehicle ownership categories in Brownsville are males with 2 vehicles (15,353, accounting for 38.9%) and females with 2 vehicles (12,027, making up 43.3%).
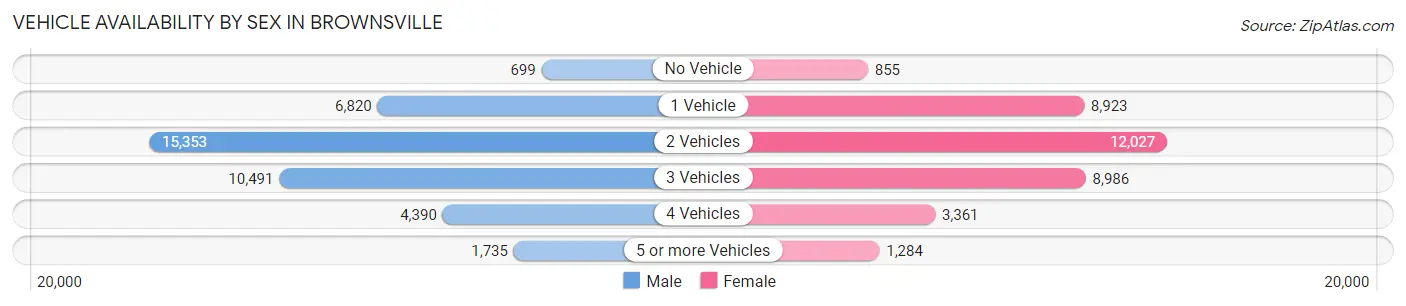
| Vehicles Available | Male | Female |
| No Vehicle | 699 (1.8%) | 855 (2.4%) |
| 1 Vehicle | 6,820 (17.3%) | 8,923 (25.2%) |
| 2 Vehicles | 15,353 (38.9%) | 12,027 (33.9%) |
| 3 Vehicles | 10,491 (26.6%) | 8,986 (25.4%) |
| 4 Vehicles | 4,390 (11.1%) | 3,361 (9.5%) |
| 5 or more Vehicles | 1,735 (4.4%) | 1,284 (3.6%) |
| Total | 39,488 (100.0%) | 35,436 (100.0%) |
Commute Time in Brownsville
The most frequently occuring commute durations in Brownsville are 20 to 24 minutes (16,334 commuters, 23.3%), 15 to 19 minutes (15,860 commuters, 22.6%), and 10 to 14 minutes (13,510 commuters, 19.3%).
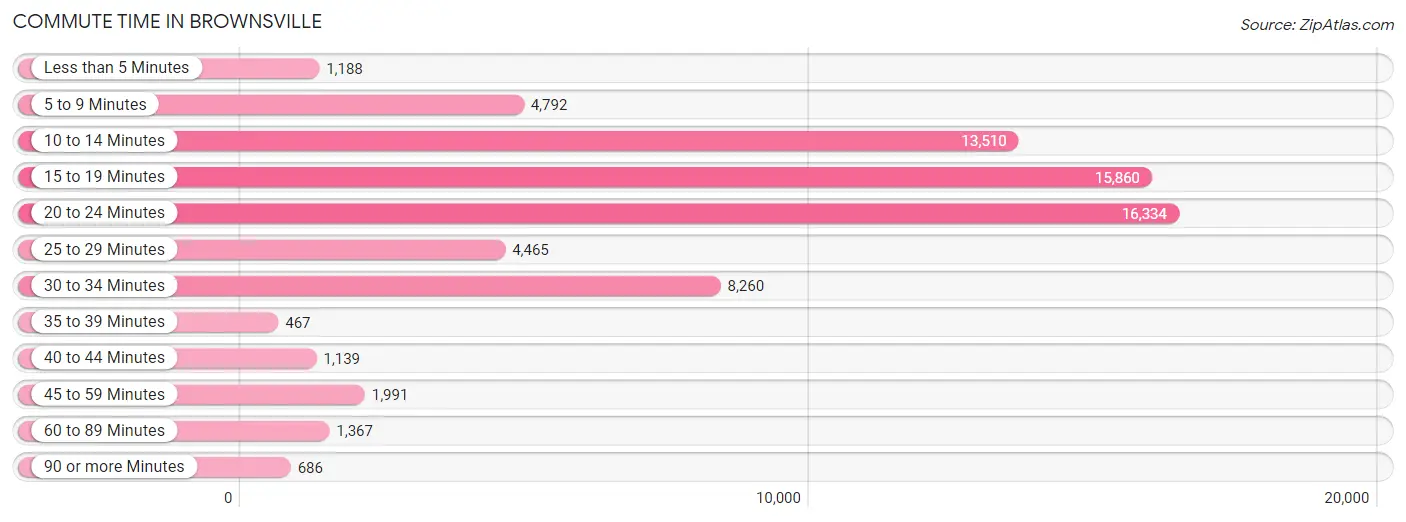
| Commute Time | # Commuters | % Commuters |
| Less than 5 Minutes | 1,188 | 1.7% |
| 5 to 9 Minutes | 4,792 | 6.8% |
| 10 to 14 Minutes | 13,510 | 19.3% |
| 15 to 19 Minutes | 15,860 | 22.6% |
| 20 to 24 Minutes | 16,334 | 23.3% |
| 25 to 29 Minutes | 4,465 | 6.4% |
| 30 to 34 Minutes | 8,260 | 11.8% |
| 35 to 39 Minutes | 467 | 0.7% |
| 40 to 44 Minutes | 1,139 | 1.6% |
| 45 to 59 Minutes | 1,991 | 2.8% |
| 60 to 89 Minutes | 1,367 | 1.9% |
| 90 or more Minutes | 686 | 1.0% |
Commute Time by Sex in Brownsville
The most common commute times in Brownsville are 20 to 24 minutes (8,582 commuters, 22.9%) for males and 15 to 19 minutes (7,995 commuters, 24.6%) for females.
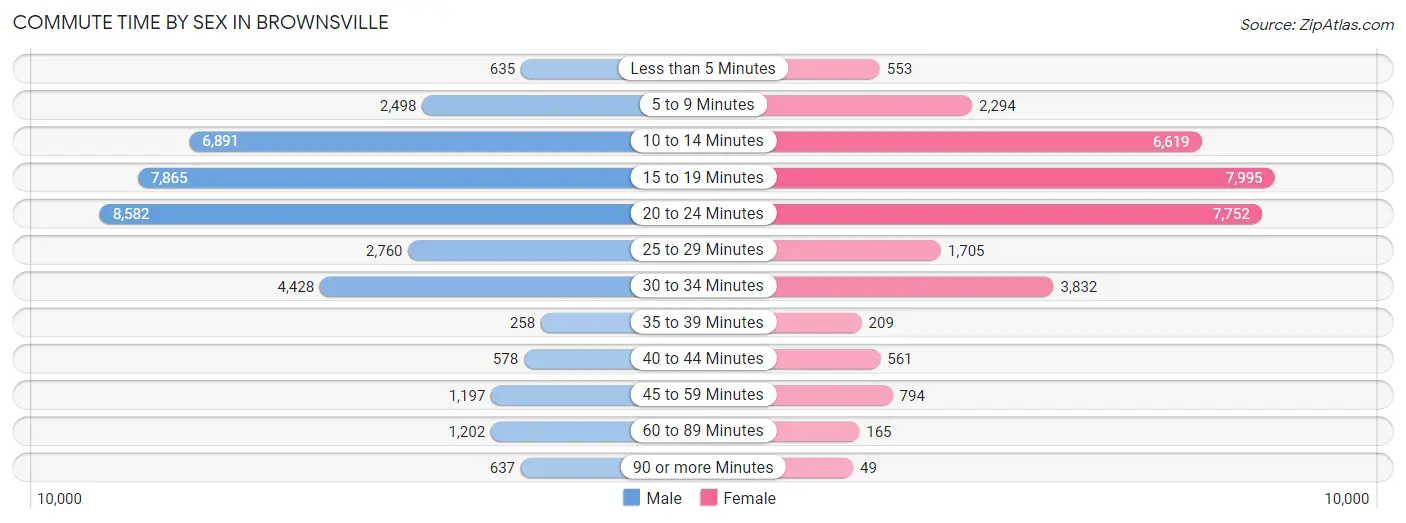
| Commute Time | Male | Female |
| Less than 5 Minutes | 635 (1.7%) | 553 (1.7%) |
| 5 to 9 Minutes | 2,498 (6.7%) | 2,294 (7.0%) |
| 10 to 14 Minutes | 6,891 (18.4%) | 6,619 (20.3%) |
| 15 to 19 Minutes | 7,865 (21.0%) | 7,995 (24.6%) |
| 20 to 24 Minutes | 8,582 (22.9%) | 7,752 (23.8%) |
| 25 to 29 Minutes | 2,760 (7.3%) | 1,705 (5.2%) |
| 30 to 34 Minutes | 4,428 (11.8%) | 3,832 (11.8%) |
| 35 to 39 Minutes | 258 (0.7%) | 209 (0.6%) |
| 40 to 44 Minutes | 578 (1.5%) | 561 (1.7%) |
| 45 to 59 Minutes | 1,197 (3.2%) | 794 (2.4%) |
| 60 to 89 Minutes | 1,202 (3.2%) | 165 (0.5%) |
| 90 or more Minutes | 637 (1.7%) | 49 (0.2%) |
Time of Departure to Work by Sex in Brownsville
The most frequent times of departure to work in Brownsville are 8:00 AM to 8:29 AM (5,592, 14.9%) for males and 7:30 AM to 7:59 AM (6,264, 19.3%) for females.
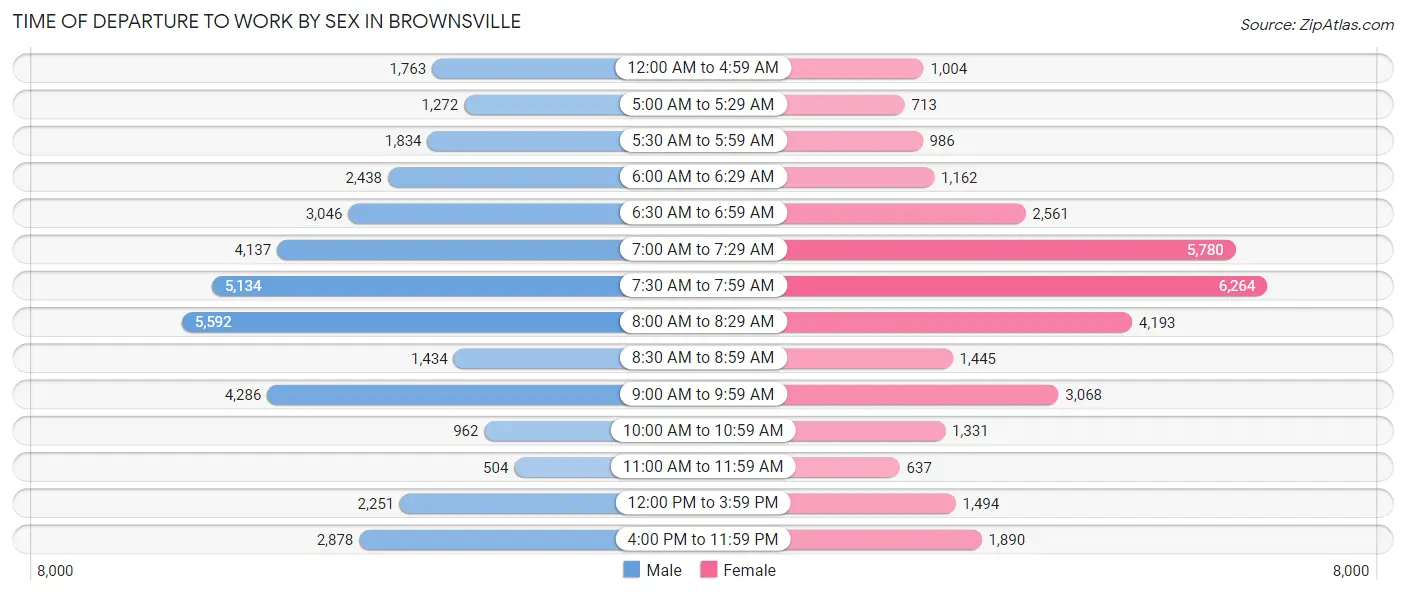
| Time of Departure | Male | Female |
| 12:00 AM to 4:59 AM | 1,763 (4.7%) | 1,004 (3.1%) |
| 5:00 AM to 5:29 AM | 1,272 (3.4%) | 713 (2.2%) |
| 5:30 AM to 5:59 AM | 1,834 (4.9%) | 986 (3.0%) |
| 6:00 AM to 6:29 AM | 2,438 (6.5%) | 1,162 (3.6%) |
| 6:30 AM to 6:59 AM | 3,046 (8.1%) | 2,561 (7.9%) |
| 7:00 AM to 7:29 AM | 4,137 (11.0%) | 5,780 (17.8%) |
| 7:30 AM to 7:59 AM | 5,134 (13.7%) | 6,264 (19.3%) |
| 8:00 AM to 8:29 AM | 5,592 (14.9%) | 4,193 (12.9%) |
| 8:30 AM to 8:59 AM | 1,434 (3.8%) | 1,445 (4.4%) |
| 9:00 AM to 9:59 AM | 4,286 (11.4%) | 3,068 (9.4%) |
| 10:00 AM to 10:59 AM | 962 (2.6%) | 1,331 (4.1%) |
| 11:00 AM to 11:59 AM | 504 (1.3%) | 637 (2.0%) |
| 12:00 PM to 3:59 PM | 2,251 (6.0%) | 1,494 (4.6%) |
| 4:00 PM to 11:59 PM | 2,878 (7.7%) | 1,890 (5.8%) |
| Total | 37,531 (100.0%) | 32,528 (100.0%) |
Housing Occupancy in Brownsville
Occupancy by Ownership in Brownsville
Of the total 56,876 dwellings in Brownsville, owner-occupied units account for 34,291 (60.3%), while renter-occupied units make up 22,585 (39.7%).
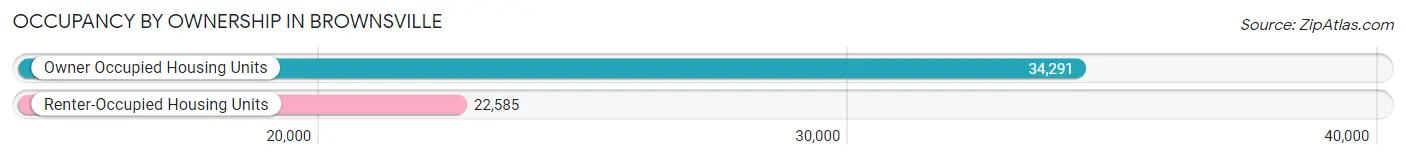
| Occupancy | # Housing Units | % Housing Units |
| Owner Occupied Housing Units | 34,291 | 60.3% |
| Renter-Occupied Housing Units | 22,585 | 39.7% |
| Total Occupied Housing Units | 56,876 | 100.0% |
Occupancy by Household Size in Brownsville
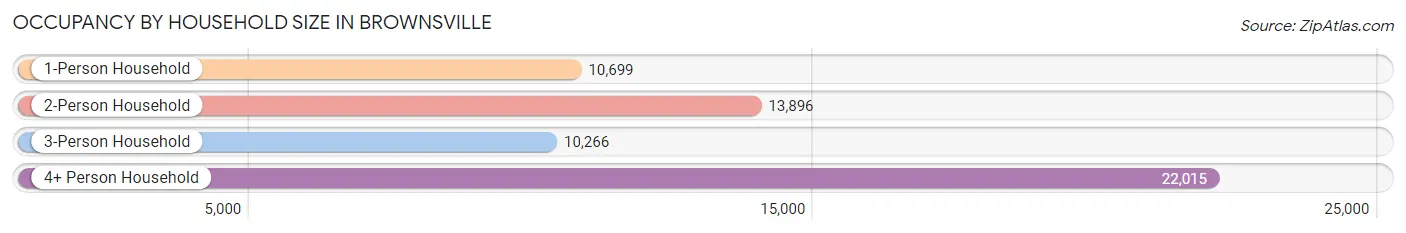
| Household Size | # Housing Units | % Housing Units |
| 1-Person Household | 10,699 | 18.8% |
| 2-Person Household | 13,896 | 24.4% |
| 3-Person Household | 10,266 | 18.0% |
| 4+ Person Household | 22,015 | 38.7% |
| Total Housing Units | 56,876 | 100.0% |
Occupancy by Ownership by Household Size in Brownsville
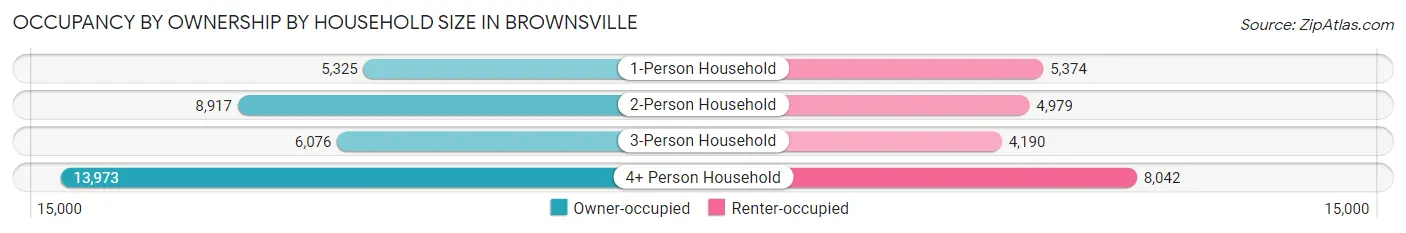
| Household Size | Owner-occupied | Renter-occupied |
| 1-Person Household | 5,325 (49.8%) | 5,374 (50.2%) |
| 2-Person Household | 8,917 (64.2%) | 4,979 (35.8%) |
| 3-Person Household | 6,076 (59.2%) | 4,190 (40.8%) |
| 4+ Person Household | 13,973 (63.5%) | 8,042 (36.5%) |
| Total Housing Units | 34,291 (60.3%) | 22,585 (39.7%) |
Occupancy by Educational Attainment in Brownsville
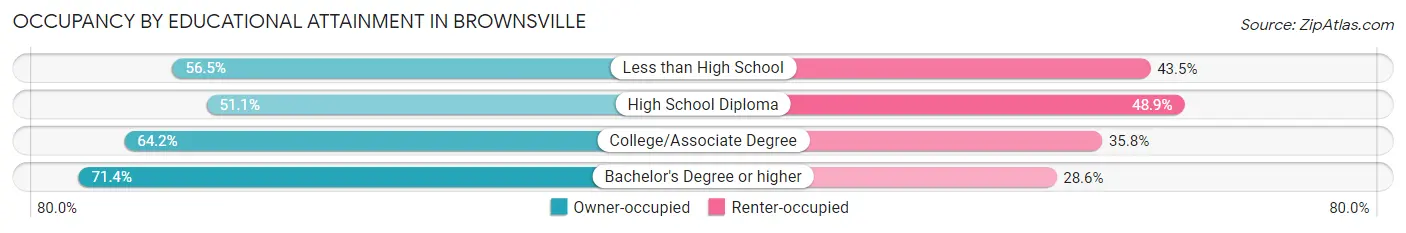
| Household Size | Owner-occupied | Renter-occupied |
| Less than High School | 9,858 (56.5%) | 7,580 (43.5%) |
| High School Diploma | 6,965 (51.1%) | 6,654 (48.9%) |
| College/Associate Degree | 8,636 (64.2%) | 4,819 (35.8%) |
| Bachelor's Degree or higher | 8,832 (71.4%) | 3,532 (28.6%) |
Occupancy by Age of Householder in Brownsville
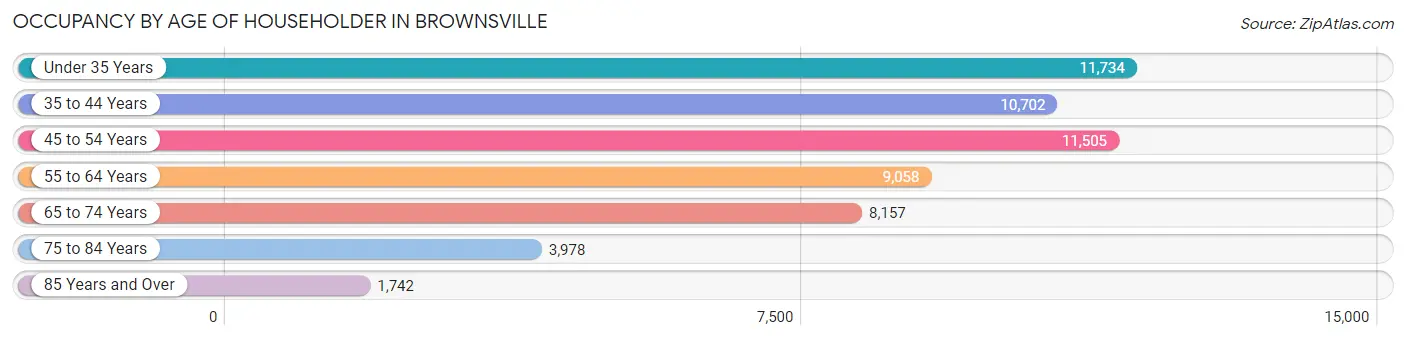
| Age Bracket | # Households | % Households |
| Under 35 Years | 11,734 | 20.6% |
| 35 to 44 Years | 10,702 | 18.8% |
| 45 to 54 Years | 11,505 | 20.2% |
| 55 to 64 Years | 9,058 | 15.9% |
| 65 to 74 Years | 8,157 | 14.3% |
| 75 to 84 Years | 3,978 | 7.0% |
| 85 Years and Over | 1,742 | 3.1% |
| Total | 56,876 | 100.0% |
Housing Finances in Brownsville
Median Income by Occupancy in Brownsville
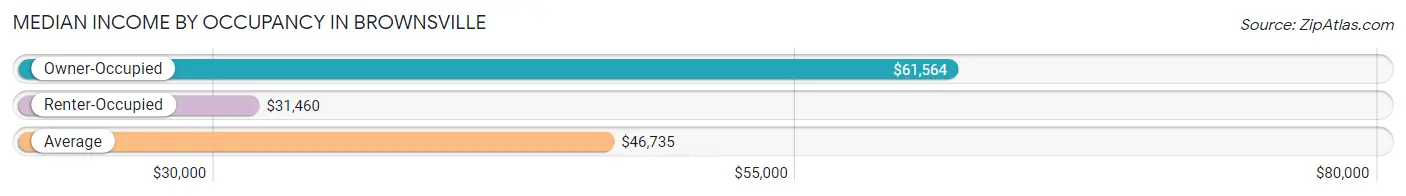
| Occupancy Type | # Households | Median Income |
| Owner-Occupied | 34,291 (60.3%) | $61,564 |
| Renter-Occupied | 22,585 (39.7%) | $31,460 |
| Average | 56,876 (100.0%) | $46,735 |
Occupancy by Householder Income Bracket in Brownsville
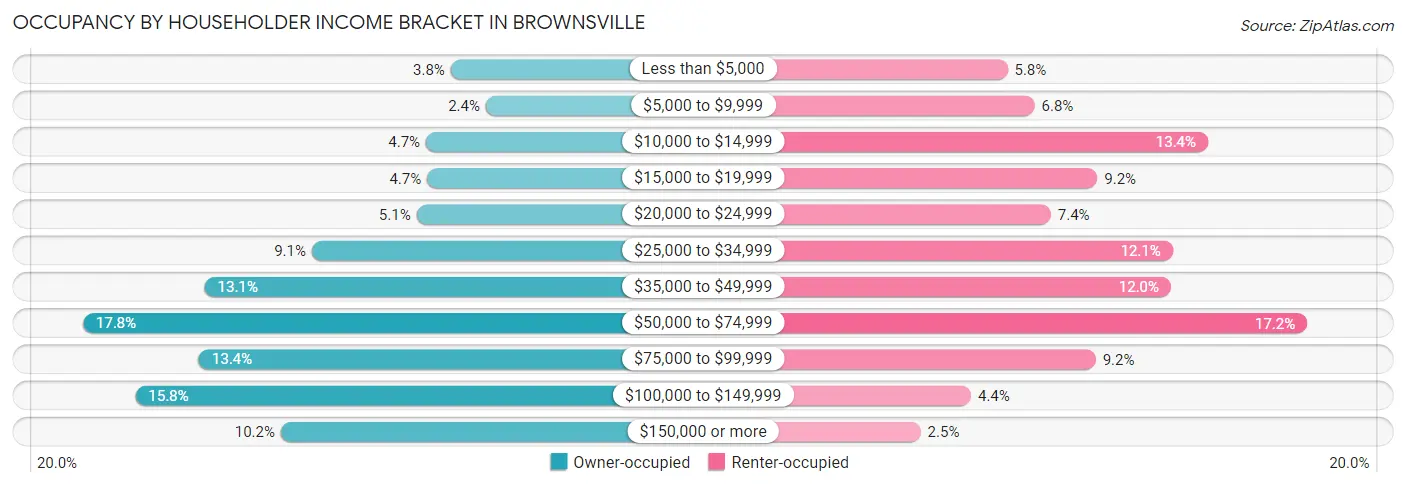
| Income Bracket | Owner-occupied | Renter-occupied |
| Less than $5,000 | 1,292 (3.8%) | 1,308 (5.8%) |
| $5,000 to $9,999 | 834 (2.4%) | 1,540 (6.8%) |
| $10,000 to $14,999 | 1,615 (4.7%) | 3,032 (13.4%) |
| $15,000 to $19,999 | 1,601 (4.7%) | 2,080 (9.2%) |
| $20,000 to $24,999 | 1,738 (5.1%) | 1,680 (7.4%) |
| $25,000 to $34,999 | 3,107 (9.1%) | 2,728 (12.1%) |
| $35,000 to $49,999 | 4,506 (13.1%) | 2,712 (12.0%) |
| $50,000 to $74,999 | 6,096 (17.8%) | 3,885 (17.2%) |
| $75,000 to $99,999 | 4,580 (13.4%) | 2,066 (9.1%) |
| $100,000 to $149,999 | 5,411 (15.8%) | 993 (4.4%) |
| $150,000 or more | 3,511 (10.2%) | 561 (2.5%) |
| Total | 34,291 (100.0%) | 22,585 (100.0%) |
Monthly Housing Cost Tiers in Brownsville
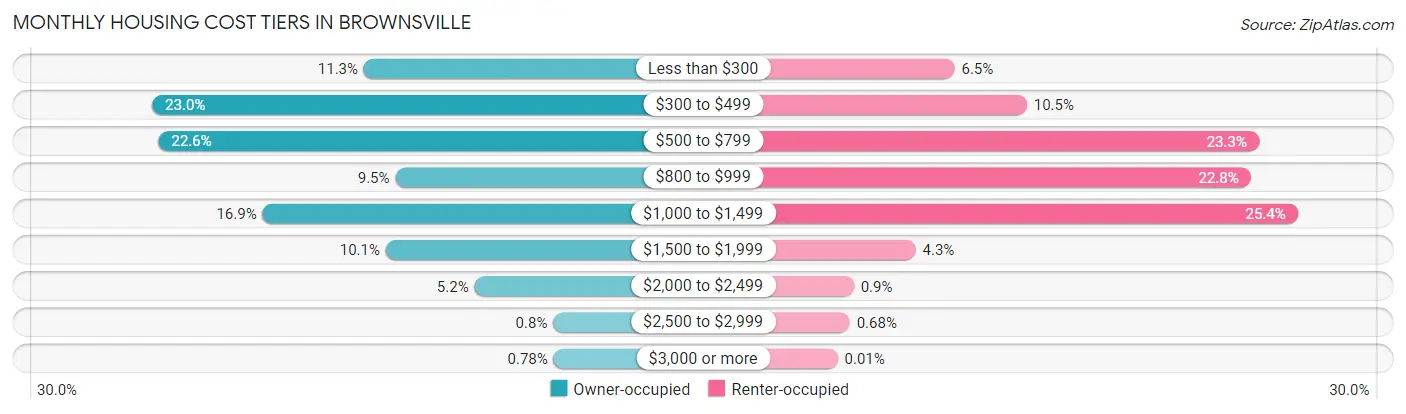
| Monthly Cost | Owner-occupied | Renter-occupied |
| Less than $300 | 3,861 (11.3%) | 1,462 (6.5%) |
| $300 to $499 | 7,874 (23.0%) | 2,362 (10.5%) |
| $500 to $799 | 7,752 (22.6%) | 5,256 (23.3%) |
| $800 to $999 | 3,266 (9.5%) | 5,154 (22.8%) |
| $1,000 to $1,499 | 5,781 (16.9%) | 5,741 (25.4%) |
| $1,500 to $1,999 | 3,446 (10.1%) | 976 (4.3%) |
| $2,000 to $2,499 | 1,767 (5.1%) | 203 (0.9%) |
| $2,500 to $2,999 | 276 (0.8%) | 153 (0.7%) |
| $3,000 or more | 268 (0.8%) | 3 (0.0%) |
| Total | 34,291 (100.0%) | 22,585 (100.0%) |
Physical Housing Characteristics in Brownsville
Housing Structures in Brownsville
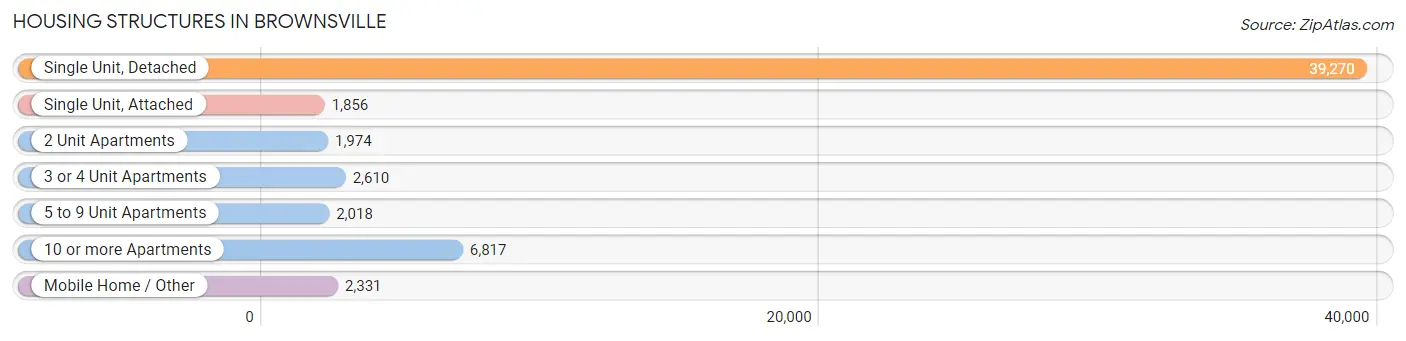
| Structure Type | # Housing Units | % Housing Units |
| Single Unit, Detached | 39,270 | 69.0% |
| Single Unit, Attached | 1,856 | 3.3% |
| 2 Unit Apartments | 1,974 | 3.5% |
| 3 or 4 Unit Apartments | 2,610 | 4.6% |
| 5 to 9 Unit Apartments | 2,018 | 3.5% |
| 10 or more Apartments | 6,817 | 12.0% |
| Mobile Home / Other | 2,331 | 4.1% |
| Total | 56,876 | 100.0% |
Housing Structures by Occupancy in Brownsville
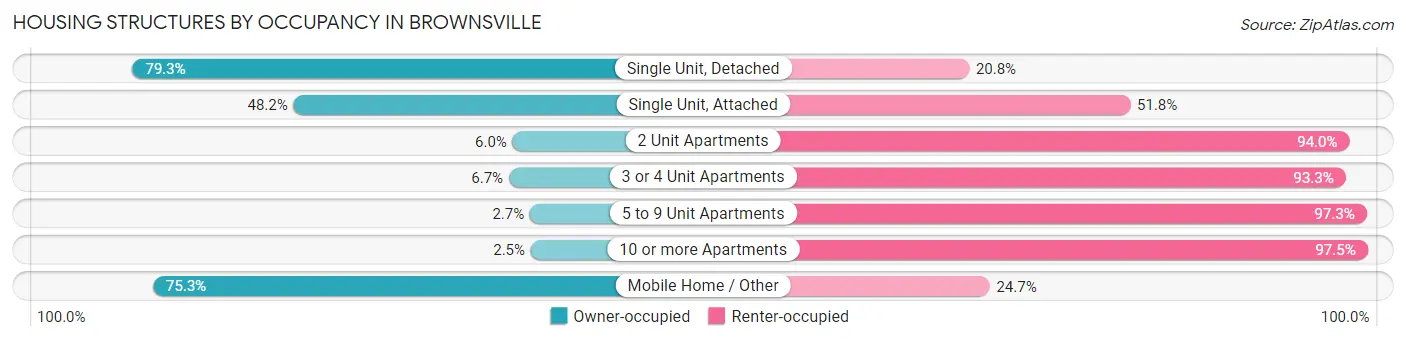
| Structure Type | Owner-occupied | Renter-occupied |
| Single Unit, Detached | 31,120 (79.2%) | 8,150 (20.7%) |
| Single Unit, Attached | 895 (48.2%) | 961 (51.8%) |
| 2 Unit Apartments | 119 (6.0%) | 1,855 (94.0%) |
| 3 or 4 Unit Apartments | 176 (6.7%) | 2,434 (93.3%) |
| 5 to 9 Unit Apartments | 54 (2.7%) | 1,964 (97.3%) |
| 10 or more Apartments | 172 (2.5%) | 6,645 (97.5%) |
| Mobile Home / Other | 1,755 (75.3%) | 576 (24.7%) |
| Total | 34,291 (60.3%) | 22,585 (39.7%) |
Housing Structures by Number of Rooms in Brownsville
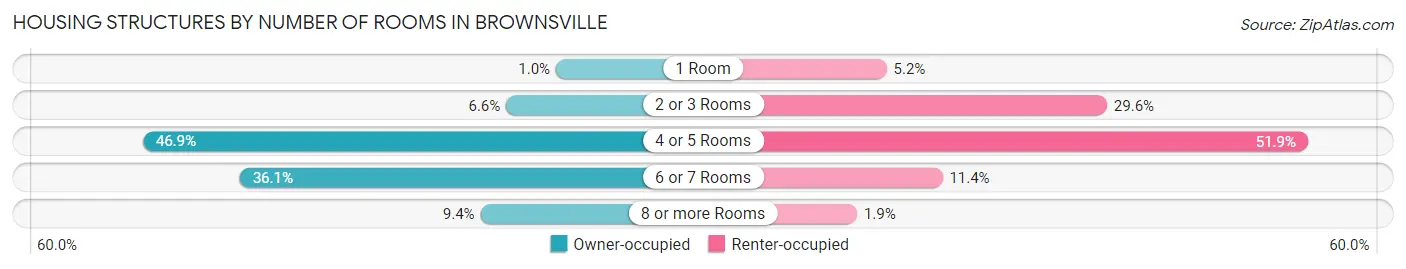
| Number of Rooms | Owner-occupied | Renter-occupied |
| 1 Room | 353 (1.0%) | 1,170 (5.2%) |
| 2 or 3 Rooms | 2,251 (6.6%) | 6,692 (29.6%) |
| 4 or 5 Rooms | 16,074 (46.9%) | 11,726 (51.9%) |
| 6 or 7 Rooms | 12,387 (36.1%) | 2,570 (11.4%) |
| 8 or more Rooms | 3,226 (9.4%) | 427 (1.9%) |
| Total | 34,291 (100.0%) | 22,585 (100.0%) |
Housing Structure by Heating Type in Brownsville
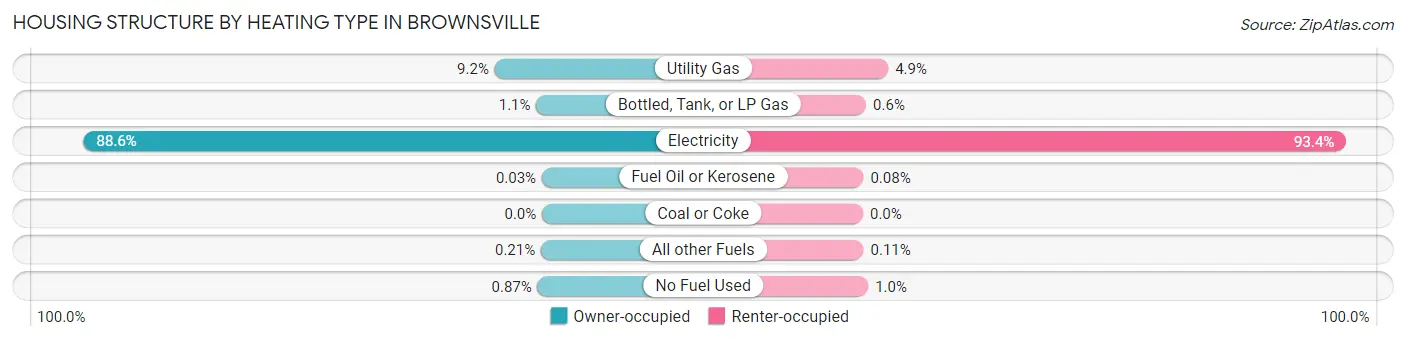
| Heating Type | Owner-occupied | Renter-occupied |
| Utility Gas | 3,139 (9.1%) | 1,099 (4.9%) |
| Bottled, Tank, or LP Gas | 380 (1.1%) | 136 (0.6%) |
| Electricity | 30,392 (88.6%) | 21,082 (93.3%) |
| Fuel Oil or Kerosene | 12 (0.0%) | 18 (0.1%) |
| Coal or Coke | 0 (0.0%) | 0 (0.0%) |
| All other Fuels | 71 (0.2%) | 25 (0.1%) |
| No Fuel Used | 297 (0.9%) | 225 (1.0%) |
| Total | 34,291 (100.0%) | 22,585 (100.0%) |
Household Vehicle Usage in Brownsville
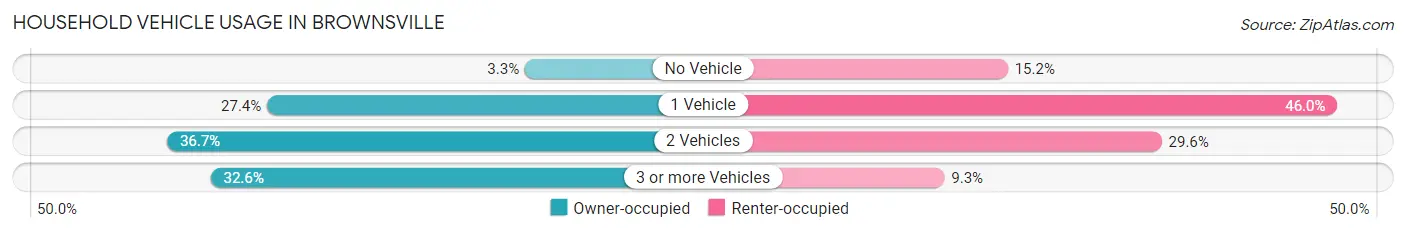
| Vehicles per Household | Owner-occupied | Renter-occupied |
| No Vehicle | 1,127 (3.3%) | 3,434 (15.2%) |
| 1 Vehicle | 9,383 (27.4%) | 10,380 (46.0%) |
| 2 Vehicles | 12,587 (36.7%) | 6,676 (29.6%) |
| 3 or more Vehicles | 11,194 (32.6%) | 2,095 (9.3%) |
| Total | 34,291 (100.0%) | 22,585 (100.0%) |
Real Estate & Mortgages in Brownsville
Real Estate and Mortgage Overview in Brownsville
| Characteristic | Without Mortgage | With Mortgage |
| Housing Units | 20,141 | 14,150 |
| Median Property Value | $94,400 | $140,500 |
| Median Household Income | $46,597 | $2,269 |
| Monthly Housing Costs | $457 | $237 |
| Real Estate Taxes | $1,629 | $303 |
Property Value by Mortgage Status in Brownsville
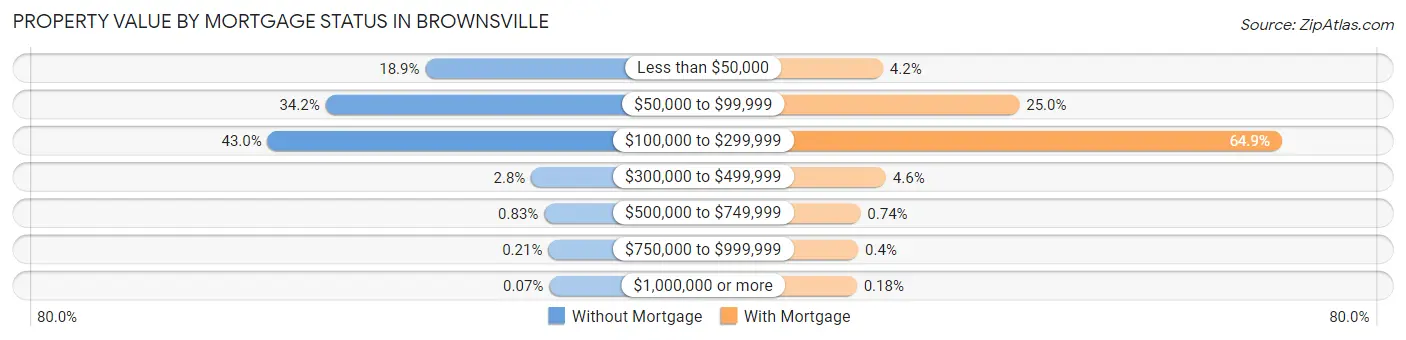
| Property Value | Without Mortgage | With Mortgage |
| Less than $50,000 | 3,815 (18.9%) | 590 (4.2%) |
| $50,000 to $99,999 | 6,879 (34.2%) | 3,530 (24.9%) |
| $100,000 to $299,999 | 8,657 (43.0%) | 9,189 (64.9%) |
| $300,000 to $499,999 | 565 (2.8%) | 655 (4.6%) |
| $500,000 to $749,999 | 167 (0.8%) | 105 (0.7%) |
| $750,000 to $999,999 | 43 (0.2%) | 56 (0.4%) |
| $1,000,000 or more | 15 (0.1%) | 25 (0.2%) |
| Total | 20,141 (100.0%) | 14,150 (100.0%) |
Household Income by Mortgage Status in Brownsville
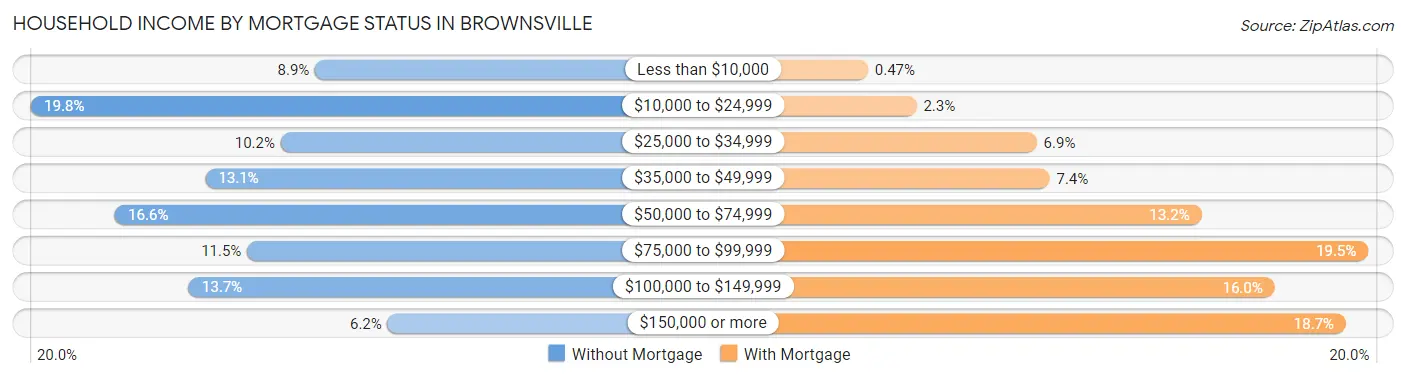
| Household Income | Without Mortgage | With Mortgage |
| Less than $10,000 | 1,798 (8.9%) | 67 (0.5%) |
| $10,000 to $24,999 | 3,977 (19.8%) | 328 (2.3%) |
| $25,000 to $34,999 | 2,062 (10.2%) | 977 (6.9%) |
| $35,000 to $49,999 | 2,641 (13.1%) | 1,045 (7.4%) |
| $50,000 to $74,999 | 3,333 (16.6%) | 1,865 (13.2%) |
| $75,000 to $99,999 | 2,320 (11.5%) | 2,763 (19.5%) |
| $100,000 to $149,999 | 2,768 (13.7%) | 2,260 (16.0%) |
| $150,000 or more | 1,242 (6.2%) | 2,643 (18.7%) |
| Total | 20,141 (100.0%) | 14,150 (100.0%) |
Property Value to Household Income Ratio in Brownsville
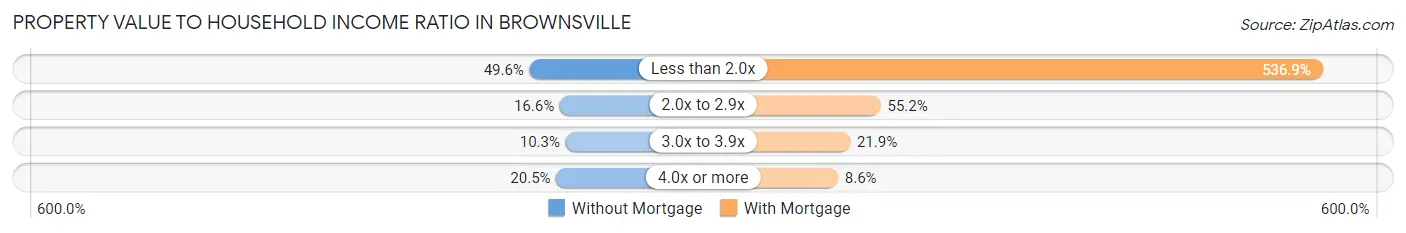
| Value-to-Income Ratio | Without Mortgage | With Mortgage |
| Less than 2.0x | 9,993 (49.6%) | 75,966 (536.9%) |
| 2.0x to 2.9x | 3,347 (16.6%) | 7,806 (55.2%) |
| 3.0x to 3.9x | 2,074 (10.3%) | 3,093 (21.9%) |
| 4.0x or more | 4,129 (20.5%) | 1,223 (8.6%) |
| Total | 20,141 (100.0%) | 14,150 (100.0%) |
Real Estate Taxes by Mortgage Status in Brownsville
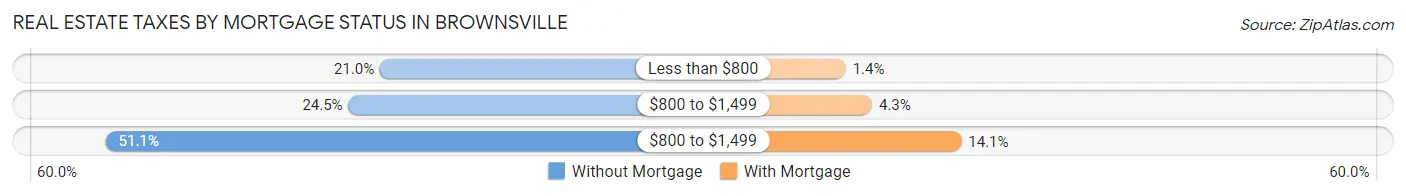
| Property Taxes | Without Mortgage | With Mortgage |
| Less than $800 | 4,237 (21.0%) | 197 (1.4%) |
| $800 to $1,499 | 4,936 (24.5%) | 604 (4.3%) |
| $800 to $1,499 | 10,297 (51.1%) | 1,989 (14.1%) |
| Total | 20,141 (100.0%) | 14,150 (100.0%) |
Health & Disability in Brownsville
Health Insurance Coverage by Age in Brownsville
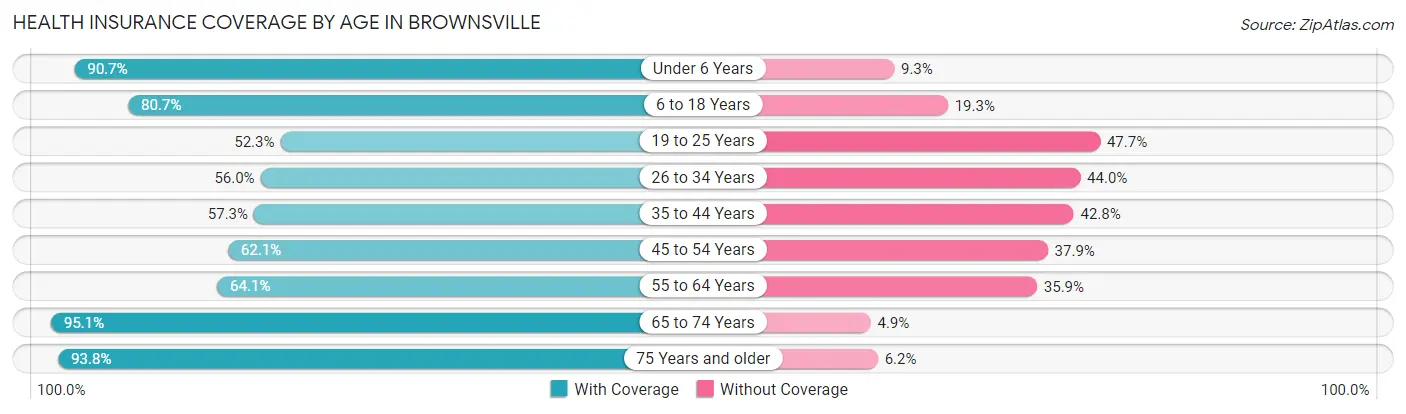
| Age Bracket | With Coverage | Without Coverage |
| Under 6 Years | 15,913 (90.7%) | 1,628 (9.3%) |
| 6 to 18 Years | 32,214 (80.7%) | 7,700 (19.3%) |
| 19 to 25 Years | 12,035 (52.3%) | 10,968 (47.7%) |
| 26 to 34 Years | 12,247 (56.0%) | 9,616 (44.0%) |
| 35 to 44 Years | 12,881 (57.3%) | 9,618 (42.7%) |
| 45 to 54 Years | 13,211 (62.1%) | 8,069 (37.9%) |
| 55 to 64 Years | 11,081 (64.1%) | 6,208 (35.9%) |
| 65 to 74 Years | 12,697 (95.1%) | 653 (4.9%) |
| 75 Years and older | 8,541 (93.8%) | 567 (6.2%) |
| Total | 130,820 (70.4%) | 55,027 (29.6%) |
Health Insurance Coverage by Citizenship Status in Brownsville
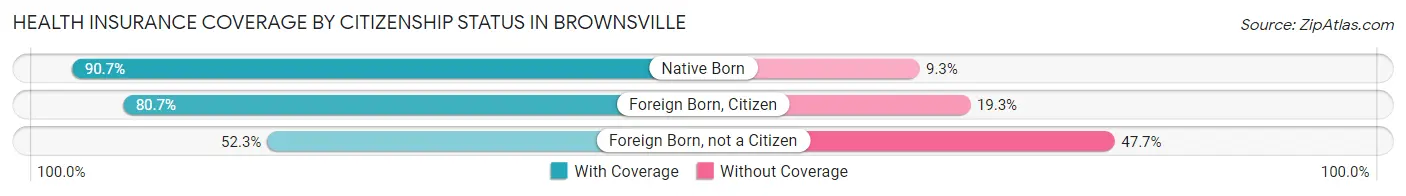
| Citizenship Status | With Coverage | Without Coverage |
| Native Born | 15,913 (90.7%) | 1,628 (9.3%) |
| Foreign Born, Citizen | 32,214 (80.7%) | 7,700 (19.3%) |
| Foreign Born, not a Citizen | 12,035 (52.3%) | 10,968 (47.7%) |
Health Insurance Coverage by Household Income in Brownsville
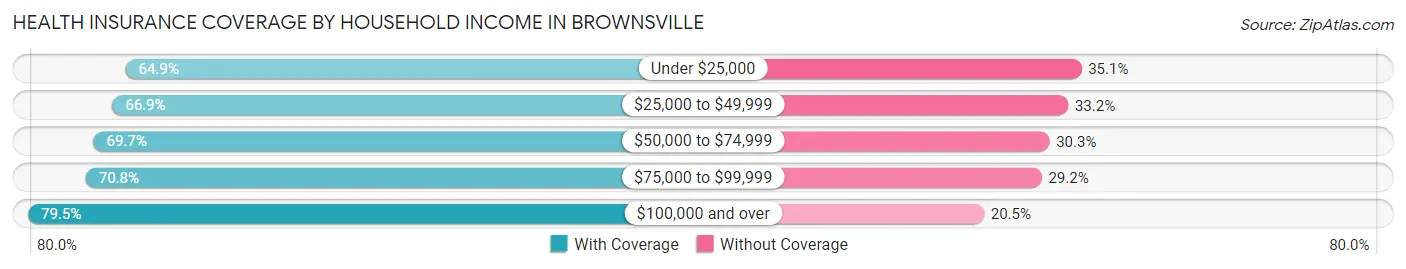
| Household Income | With Coverage | Without Coverage |
| Under $25,000 | 27,273 (64.9%) | 14,773 (35.1%) |
| $25,000 to $49,999 | 27,708 (66.8%) | 13,741 (33.2%) |
| $50,000 to $74,999 | 23,219 (69.7%) | 10,112 (30.3%) |
| $75,000 to $99,999 | 17,464 (70.8%) | 7,195 (29.2%) |
| $100,000 and over | 34,993 (79.5%) | 9,040 (20.5%) |
Public vs Private Health Insurance Coverage by Age in Brownsville
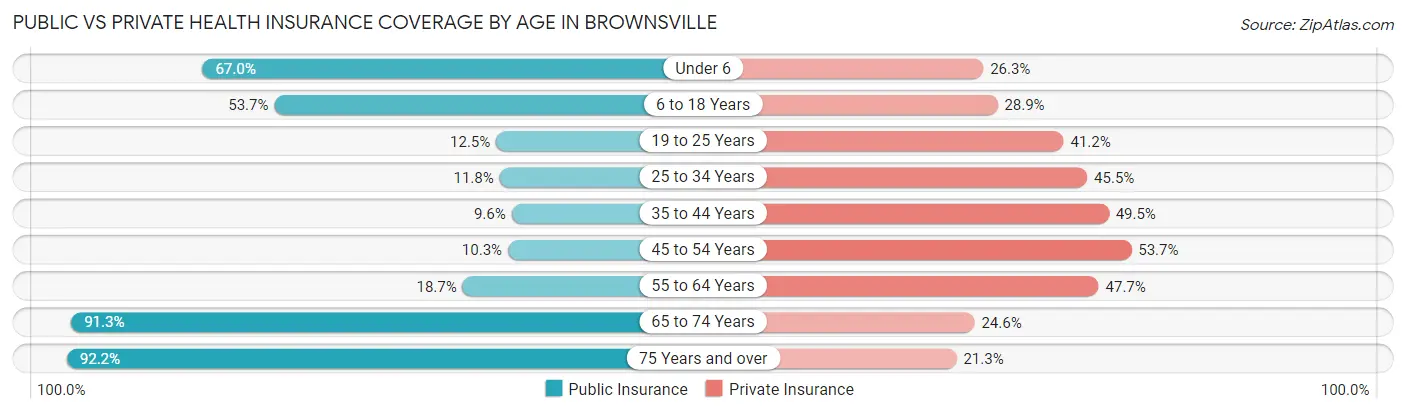
| Age Bracket | Public Insurance | Private Insurance |
| Under 6 | 11,748 (67.0%) | 4,605 (26.3%) |
| 6 to 18 Years | 21,418 (53.7%) | 11,532 (28.9%) |
| 19 to 25 Years | 2,870 (12.5%) | 9,467 (41.2%) |
| 25 to 34 Years | 2,588 (11.8%) | 9,957 (45.5%) |
| 35 to 44 Years | 2,163 (9.6%) | 11,147 (49.5%) |
| 45 to 54 Years | 2,190 (10.3%) | 11,434 (53.7%) |
| 55 to 64 Years | 3,234 (18.7%) | 8,242 (47.7%) |
| 65 to 74 Years | 12,194 (91.3%) | 3,288 (24.6%) |
| 75 Years and over | 8,393 (92.1%) | 1,939 (21.3%) |
| Total | 66,798 (35.9%) | 71,611 (38.5%) |
Disability Status by Sex by Age in Brownsville
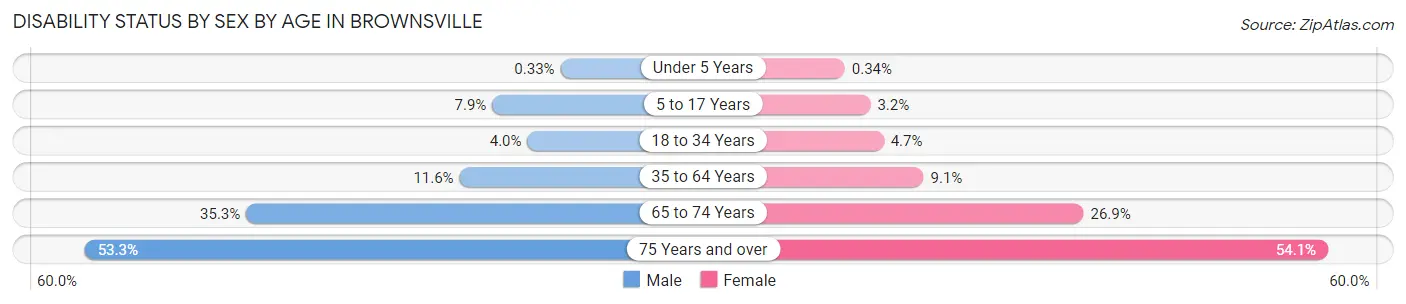
| Age Bracket | Male | Female |
| Under 5 Years | 25 (0.3%) | 23 (0.3%) |
| 5 to 17 Years | 1,598 (7.9%) | 619 (3.2%) |
| 18 to 34 Years | 971 (4.0%) | 1,129 (4.7%) |
| 35 to 64 Years | 3,287 (11.6%) | 2,975 (9.1%) |
| 65 to 74 Years | 2,065 (35.3%) | 2,020 (26.9%) |
| 75 Years and over | 2,020 (53.3%) | 2,879 (54.1%) |
Disability Class by Sex by Age in Brownsville
Disability Class: Hearing Difficulty
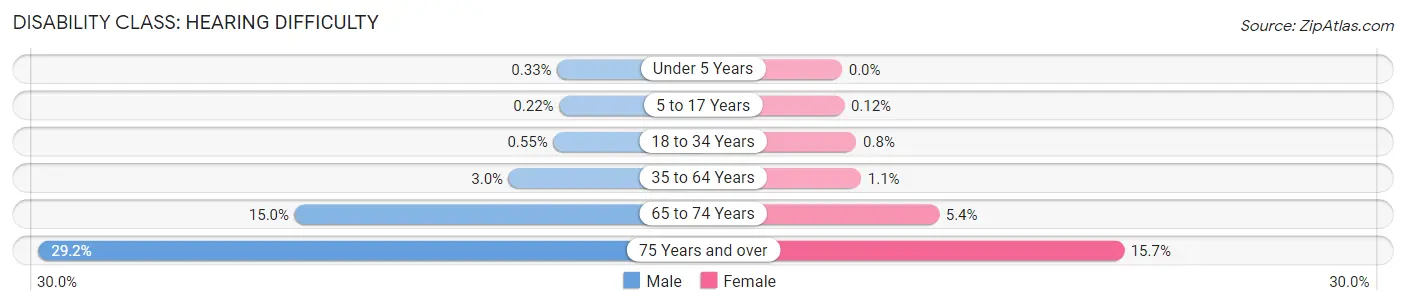
| Age Bracket | Male | Female |
| Under 5 Years | 25 (0.3%) | 0 (0.0%) |
| 5 to 17 Years | 44 (0.2%) | 24 (0.1%) |
| 18 to 34 Years | 132 (0.5%) | 193 (0.8%) |
| 35 to 64 Years | 861 (3.0%) | 346 (1.1%) |
| 65 to 74 Years | 874 (14.9%) | 405 (5.4%) |
| 75 Years and over | 1,108 (29.2%) | 835 (15.7%) |
Disability Class: Vision Difficulty
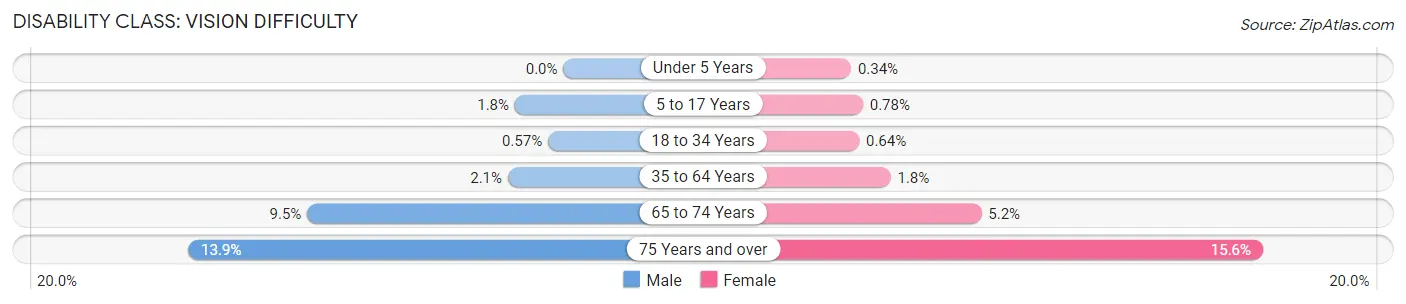
| Age Bracket | Male | Female |
| Under 5 Years | 0 (0.0%) | 23 (0.3%) |
| 5 to 17 Years | 362 (1.8%) | 151 (0.8%) |
| 18 to 34 Years | 138 (0.6%) | 154 (0.6%) |
| 35 to 64 Years | 585 (2.1%) | 590 (1.8%) |
| 65 to 74 Years | 556 (9.5%) | 389 (5.2%) |
| 75 Years and over | 528 (13.9%) | 831 (15.6%) |
Disability Class: Cognitive Difficulty
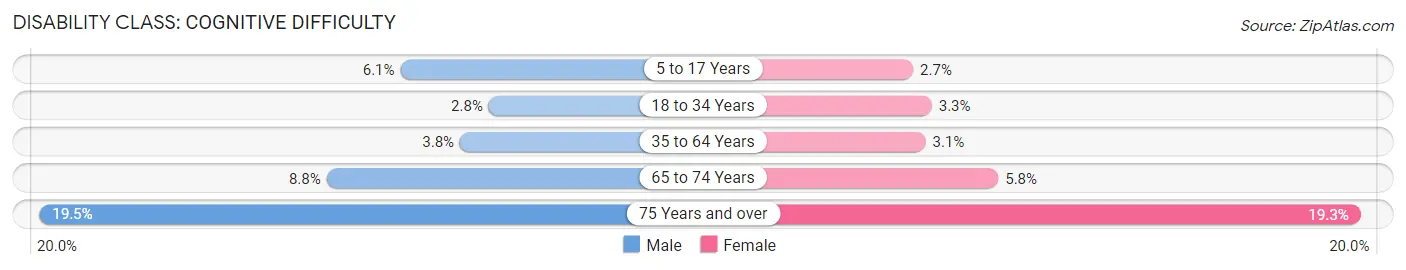
| Age Bracket | Male | Female |
| 5 to 17 Years | 1,219 (6.0%) | 515 (2.6%) |
| 18 to 34 Years | 670 (2.8%) | 809 (3.3%) |
| 35 to 64 Years | 1,091 (3.8%) | 1,016 (3.1%) |
| 65 to 74 Years | 514 (8.8%) | 436 (5.8%) |
| 75 Years and over | 737 (19.5%) | 1,024 (19.3%) |
Disability Class: Ambulatory Difficulty
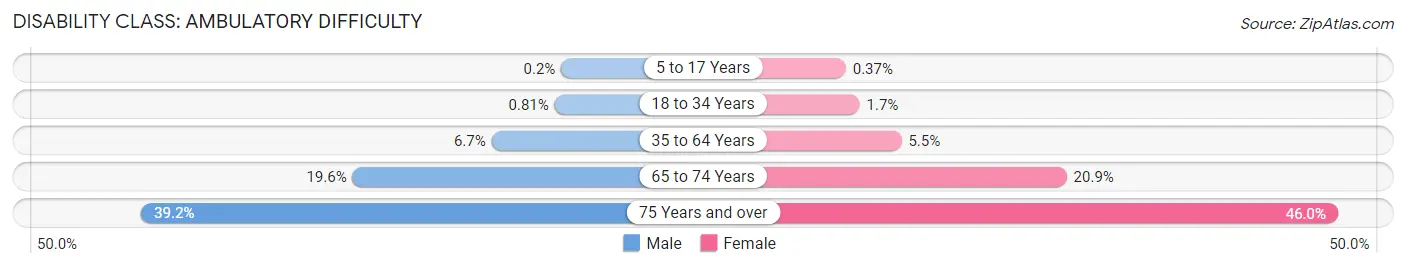
| Age Bracket | Male | Female |
| 5 to 17 Years | 40 (0.2%) | 71 (0.4%) |
| 18 to 34 Years | 196 (0.8%) | 399 (1.7%) |
| 35 to 64 Years | 1,891 (6.7%) | 1,811 (5.5%) |
| 65 to 74 Years | 1,144 (19.6%) | 1,566 (20.9%) |
| 75 Years and over | 1,485 (39.2%) | 2,448 (46.0%) |
Disability Class: Self-Care Difficulty
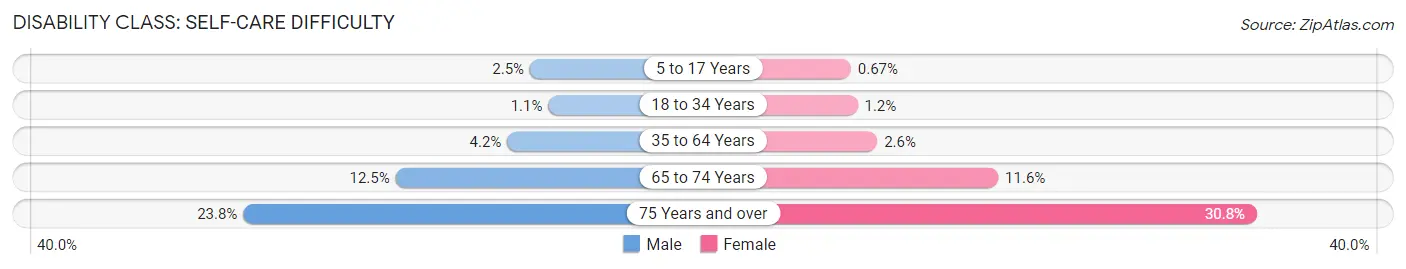
| Age Bracket | Male | Female |
| 5 to 17 Years | 499 (2.5%) | 131 (0.7%) |
| 18 to 34 Years | 270 (1.1%) | 282 (1.2%) |
| 35 to 64 Years | 1,184 (4.2%) | 858 (2.6%) |
| 65 to 74 Years | 728 (12.5%) | 871 (11.6%) |
| 75 Years and over | 901 (23.8%) | 1,639 (30.8%) |
Technology Access in Brownsville
Computing Device Access in Brownsville
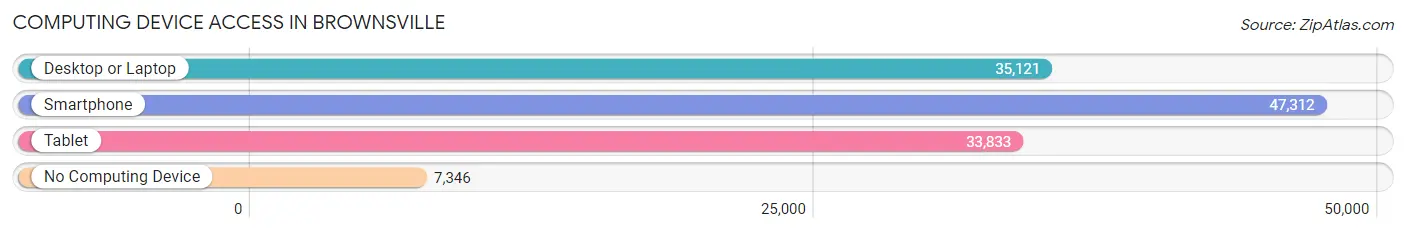
| Device Type | # Households | % Households |
| Desktop or Laptop | 35,121 | 61.8% |
| Smartphone | 47,312 | 83.2% |
| Tablet | 33,833 | 59.5% |
| No Computing Device | 7,346 | 12.9% |
| Total | 56,876 | 100.0% |
Internet Access in Brownsville
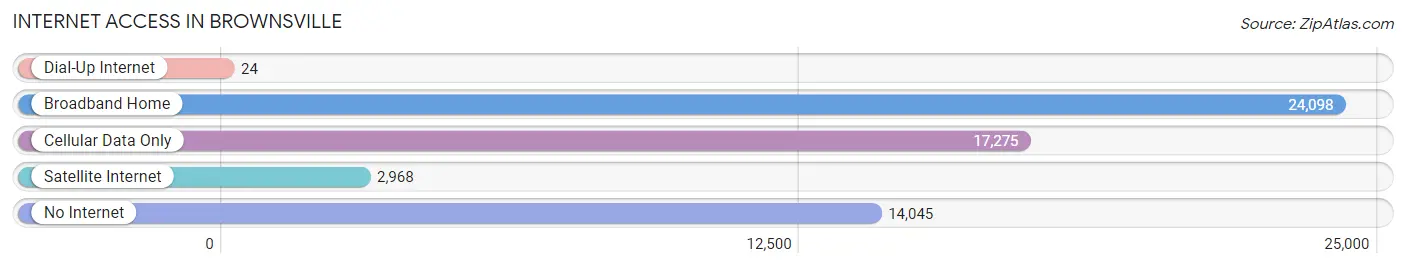
| Internet Type | # Households | % Households |
| Dial-Up Internet | 24 | 0.0% |
| Broadband Home | 24,098 | 42.4% |
| Cellular Data Only | 17,275 | 30.4% |
| Satellite Internet | 2,968 | 5.2% |
| No Internet | 14,045 | 24.7% |
| Total | 56,876 | 100.0% |
Brownsville Summary
Brownsville, Texas is a city located in the southernmost tip of Texas, in Cameron County. It is the sixteenth most populous city in the state of Texas, with a population of 183,299 as of 2019. Brownsville is the county seat of Cameron County and is part of the Brownsville–Harlingen metropolitan area. The city is situated on the northern bank of the Rio Grande, directly north and across the border from Matamoros, Tamaulipas, Mexico.
History
The area now known as Brownsville was first settled in 1765 by Don José de Escandón, a Spanish explorer. The settlement was named after Major Jacob Brown, who fought in the Mexican–American War and was later appointed as the commander of the area. The city was officially incorporated in 1848, and by 1850, it had a population of 1,200.
During the American Civil War, Brownsville was occupied by Union forces in November 1863. The city was the site of the Battle of Brownsville in July 1864, which resulted in a Confederate victory. After the war, Brownsville experienced a period of rapid growth, becoming a major port and trading center.
In the late 19th century, Brownsville was a major hub for the cattle industry, with the city becoming known as the “Cattle Capital of the World.” The city was also a major center for the cotton industry, with the Port of Brownsville becoming the largest cotton port in the world.
In the early 20th century, Brownsville was a major center for the oil industry, with the discovery of oil in the area in 1914. The city was also a major center for the aerospace industry, with the establishment of the Brownsville Aerospace Complex in the 1950s.
Geography
Brownsville is located in the southernmost tip of Texas, in Cameron County. It is situated on the northern bank of the Rio Grande, directly north and across the border from Matamoros, Tamaulipas, Mexico. The city covers an area of 77.5 square miles, with a population density of 2,364 people per square mile.
The city is located in the Lower Rio Grande Valley, a region of subtropical climate. The average temperature in Brownsville is 73°F, with an average high of 86°F and an average low of 61°F. The city receives an average of 22 inches of rain per year.
Economy
Brownsville’s economy is largely based on the service industry, with the city being home to a number of hospitals, universities, and government offices. The city is also a major center for the aerospace industry, with the Brownsville Aerospace Complex being the largest employer in the city.
The city is also a major center for the oil and gas industry, with the Port of Brownsville being the largest oil port in the United States. The city is also a major center for the tourism industry, with the city being home to a number of attractions, including the Gladys Porter Zoo, the Sabal Palm Audubon Center, and the Historic Brownsville Museum.
Demographics
As of 2019, the population of Brownsville was 183,299, with a population density of 2,364 people per square mile. The racial makeup of the city was 79.2% Hispanic or Latino, 16.2% White, 1.7% African American, 0.7% Asian, 0.2% Native American, and 2.0% from other races.
The median household income in Brownsville was $30,945, and the median family income was $37,845. The per capita income in the city was $14,945. The poverty rate in the city was 28.2%, with 22.3% of the population living below the poverty line.
Common Questions
What is Per Capita Income in Brownsville?
Per Capita income in Brownsville is $19,704.
What is the Median Family Income in Brownsville?
Median Family Income in Brownsville is $53,105.
What is the Median Household income in Brownsville?
Median Household Income in Brownsville is $46,735.
What is Income or Wage Gap in Brownsville?
Income or Wage Gap in Brownsville is 29.2%.
Women in Brownsville earn 70.8 cents for every dollar earned by a man.
What is Family Income Deficit in Brownsville?
Family Income Deficit in Brownsville is $11,516.
Families that are below poverty line in Brownsville earn $11,516 less on average than the poverty threshold level.
What is Inequality or Gini Index in Brownsville?
Inequality or Gini Index in Brownsville is 0.46.
What is the Total Population of Brownsville?
Total Population of Brownsville is 186,999.
What is the Total Male Population of Brownsville?
Total Male Population of Brownsville is 90,750.
What is the Total Female Population of Brownsville?
Total Female Population of Brownsville is 96,249.
What is the Ratio of Males per 100 Females in Brownsville?
There are 94.29 Males per 100 Females in Brownsville.
What is the Ratio of Females per 100 Males in Brownsville?
There are 106.06 Females per 100 Males in Brownsville.
What is the Median Population Age in Brownsville?
Median Population Age in Brownsville is 30.7 Years.
What is the Average Family Size in Brownsville
Average Family Size in Brownsville is 3.8 People.
What is the Average Household Size in Brownsville
Average Household Size in Brownsville is 3.3 People.
How Large is the Labor Force in Brownsville?
There are 81,074 People in the Labor Forcein in Brownsville.
What is the Percentage of People in the Labor Force in Brownsville?
58.0% of People are in the Labor Force in Brownsville.
What is the Unemployment Rate in Brownsville?
Unemployment Rate in Brownsville is 6.3%.