Montgomery County, TX Map & Demographics
Montgomery County Overview
$48,161
PER CAPITA INCOME
$114,108
AVG FAMILY INCOME
$95,946
AVG HOUSEHOLD INCOME
38.7%
WAGE / INCOME GAP [ % ]
61.3¢/ $1
WAGE / INCOME GAP [ $ ]
$10,387
FAMILY INCOME DEFICIT
0.47
INEQUALITY / GINI INDEX
629,989
TOTAL POPULATION
314,216
MALE POPULATION
315,773
FEMALE POPULATION
99.51
MALES / 100 FEMALES
100.50
FEMALES / 100 MALES
37.4
MEDIAN AGE
3.2
AVG FAMILY SIZE
2.8
AVG HOUSEHOLD SIZE
315,349
LABOR FORCE [ PEOPLE ]
64.8%
PERCENT IN LABOR FORCE
4.3%
UNEMPLOYMENT RATE
Income in Montgomery County
Income Overview in Montgomery County
Per Capita Income in Montgomery County is $48,161, while median incomes of families and households are $114,108 and $95,946 respectively.
| Characteristic | Number | Measure |
| Per Capita Income | 629,989 | $48,161 |
| Median Family Income | 167,430 | $114,108 |
| Mean Family Income | 167,430 | $151,161 |
| Median Household Income | 224,474 | $95,946 |
| Mean Household Income | 224,474 | $133,619 |
| Income Deficit | 167,430 | $10,387 |
| Wage / Income Gap (%) | 629,989 | 38.66% |
| Wage / Income Gap ($) | 629,989 | 61.34¢ per $1 |
| Gini / Inequality Index | 629,989 | 0.47 |
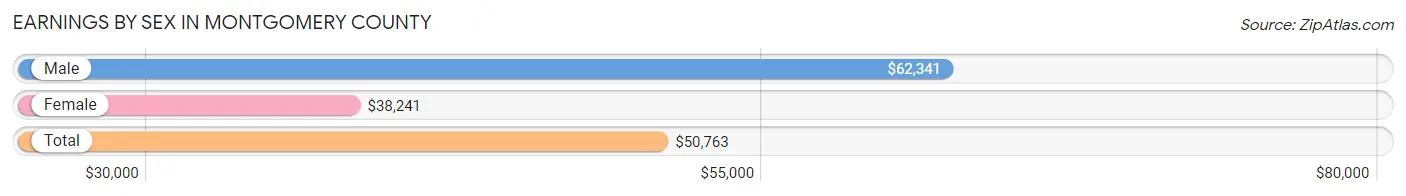
Earnings by Sex in Montgomery County
Average Earnings in Montgomery County are $50,763, $62,341 for men and $38,241 for women, a difference of 38.7%.
| Sex | Number | Average Earnings |
| Male | 181,946 (55.7%) | $62,341 |
| Female | 144,423 (44.3%) | $38,241 |
| Total | 326,369 (100.0%) | $50,763 |
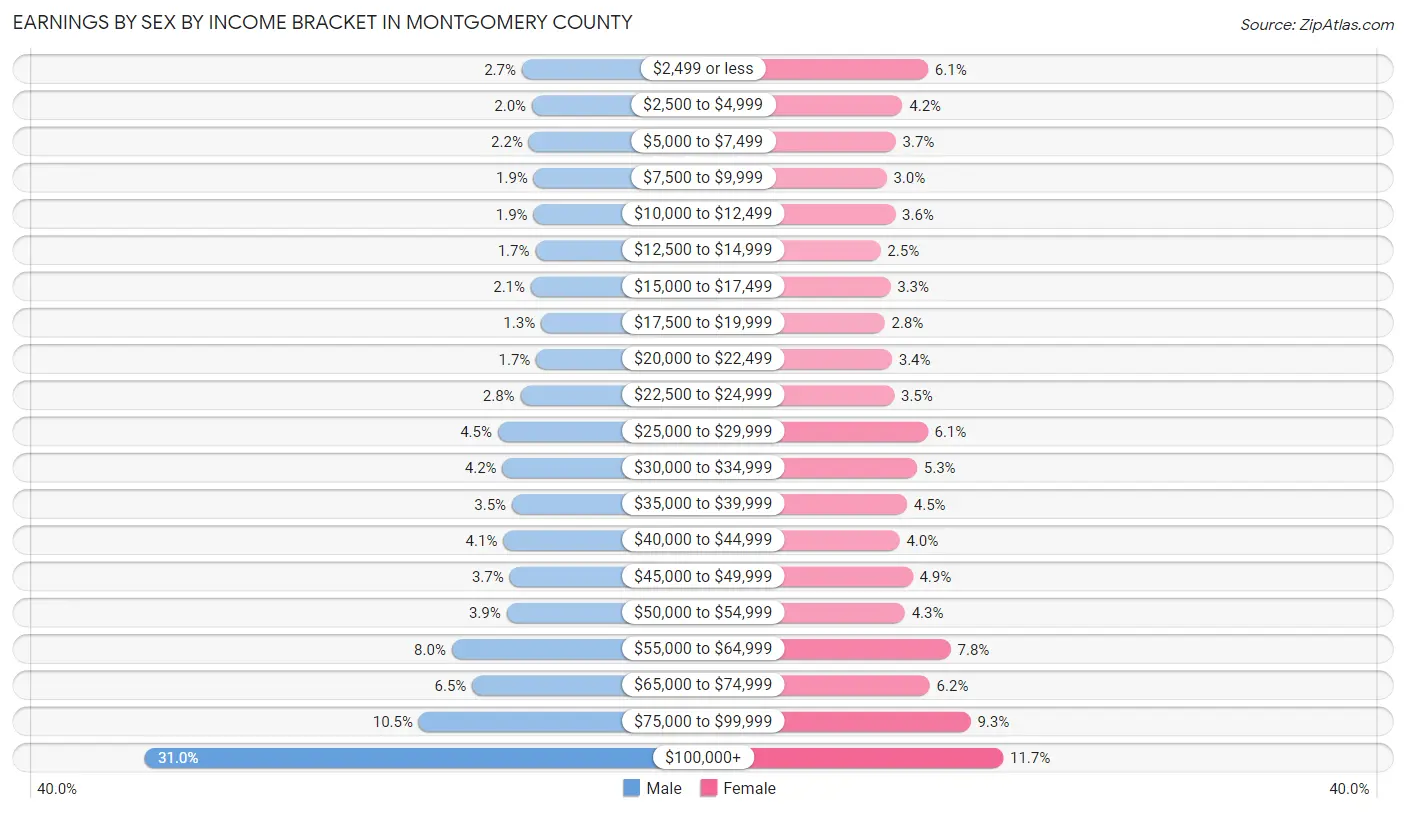
Earnings by Sex by Income Bracket in Montgomery County
The most common earnings brackets in Montgomery County are $100,000+ for men (56,355 | 31.0%) and $100,000+ for women (16,911 | 11.7%).
| Income | Male | Female |
| $2,499 or less | 4,979 (2.7%) | 8,774 (6.1%) |
| $2,500 to $4,999 | 3,596 (2.0%) | 6,007 (4.2%) |
| $5,000 to $7,499 | 4,034 (2.2%) | 5,289 (3.7%) |
| $7,500 to $9,999 | 3,373 (1.8%) | 4,290 (3.0%) |
| $10,000 to $12,499 | 3,395 (1.9%) | 5,230 (3.6%) |
| $12,500 to $14,999 | 3,153 (1.7%) | 3,639 (2.5%) |
| $15,000 to $17,499 | 3,744 (2.1%) | 4,705 (3.3%) |
| $17,500 to $19,999 | 2,357 (1.3%) | 4,094 (2.8%) |
| $20,000 to $22,499 | 3,029 (1.7%) | 4,870 (3.4%) |
| $22,500 to $24,999 | 5,162 (2.8%) | 5,115 (3.5%) |
| $25,000 to $29,999 | 8,253 (4.5%) | 8,742 (6.0%) |
| $30,000 to $34,999 | 7,622 (4.2%) | 7,589 (5.2%) |
| $35,000 to $39,999 | 6,334 (3.5%) | 6,492 (4.5%) |
| $40,000 to $44,999 | 7,514 (4.1%) | 5,709 (4.0%) |
| $45,000 to $49,999 | 6,657 (3.7%) | 7,102 (4.9%) |
| $50,000 to $54,999 | 7,064 (3.9%) | 6,265 (4.3%) |
| $55,000 to $64,999 | 14,531 (8.0%) | 11,242 (7.8%) |
| $65,000 to $74,999 | 11,761 (6.5%) | 8,967 (6.2%) |
| $75,000 to $99,999 | 19,033 (10.5%) | 13,391 (9.3%) |
| $100,000+ | 56,355 (31.0%) | 16,911 (11.7%) |
| Total | 181,946 (100.0%) | 144,423 (100.0%) |
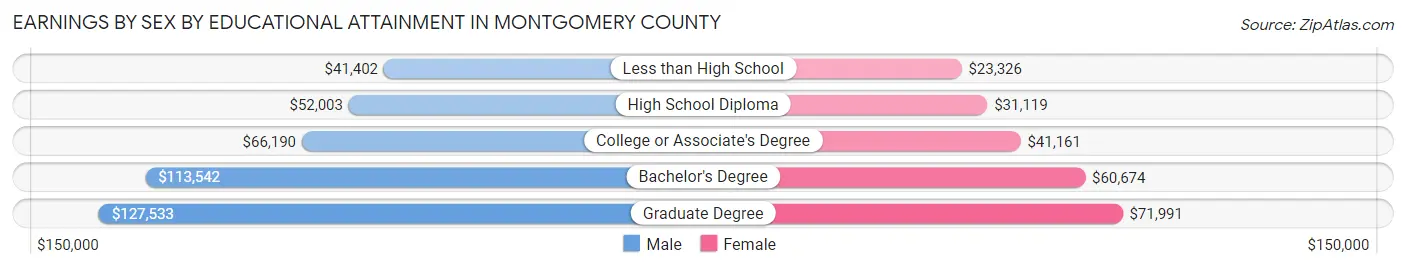
Earnings by Sex by Educational Attainment in Montgomery County
Average earnings in Montgomery County are $70,509 for men and $45,487 for women, a difference of 35.5%. Men with an educational attainment of graduate degree enjoy the highest average annual earnings of $127,533, while those with less than high school education earn the least with $41,402. Women with an educational attainment of graduate degree earn the most with the average annual earnings of $71,991, while those with less than high school education have the smallest earnings of $23,326.
| Educational Attainment | Male Income | Female Income |
| Less than High School | $41,402 | $23,326 |
| High School Diploma | $52,003 | $31,119 |
| College or Associate's Degree | $66,190 | $41,161 |
| Bachelor's Degree | $113,542 | $60,674 |
| Graduate Degree | $127,533 | $71,991 |
| Total | $70,509 | $45,487 |
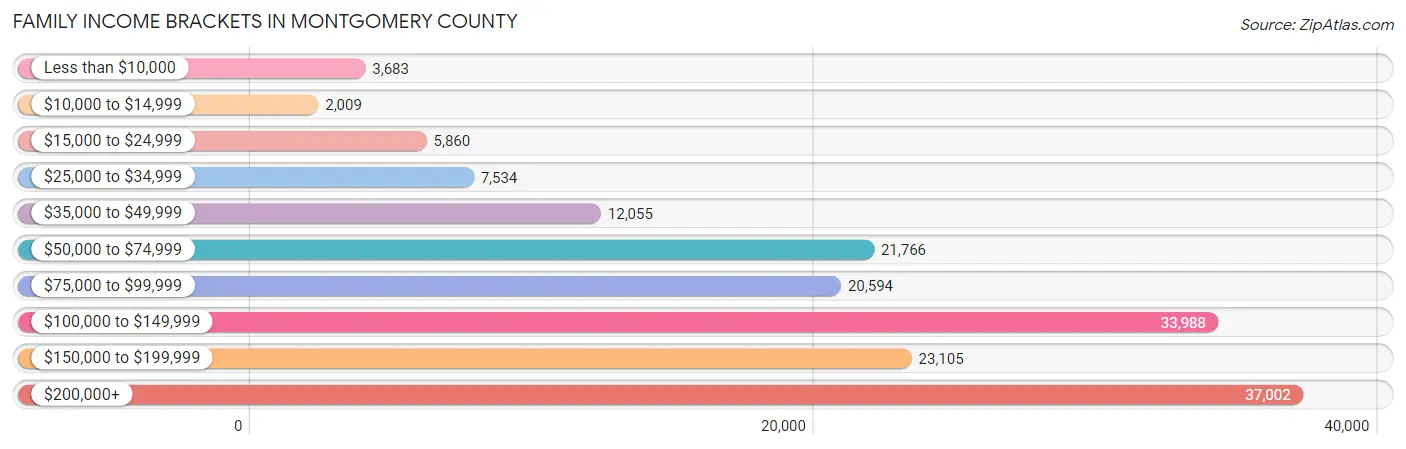
Family Income in Montgomery County
Family Income Brackets in Montgomery County
According to the Montgomery County family income data, there are 37,002 families falling into the $200,000+ income range, which is the most common income bracket and makes up 22.1% of all families. Conversely, the $10,000 to $14,999 income bracket is the least frequent group with only 2,009 families (1.2%) belonging to this category.
| Income Bracket | # Families | % Families |
| Less than $10,000 | 3,683 | 2.2% |
| $10,000 to $14,999 | 2,009 | 1.2% |
| $15,000 to $24,999 | 5,860 | 3.5% |
| $25,000 to $34,999 | 7,534 | 4.5% |
| $35,000 to $49,999 | 12,055 | 7.2% |
| $50,000 to $74,999 | 21,766 | 13.0% |
| $75,000 to $99,999 | 20,594 | 12.3% |
| $100,000 to $149,999 | 33,988 | 20.3% |
| $150,000 to $199,999 | 23,105 | 13.8% |
| $200,000+ | 37,002 | 22.1% |
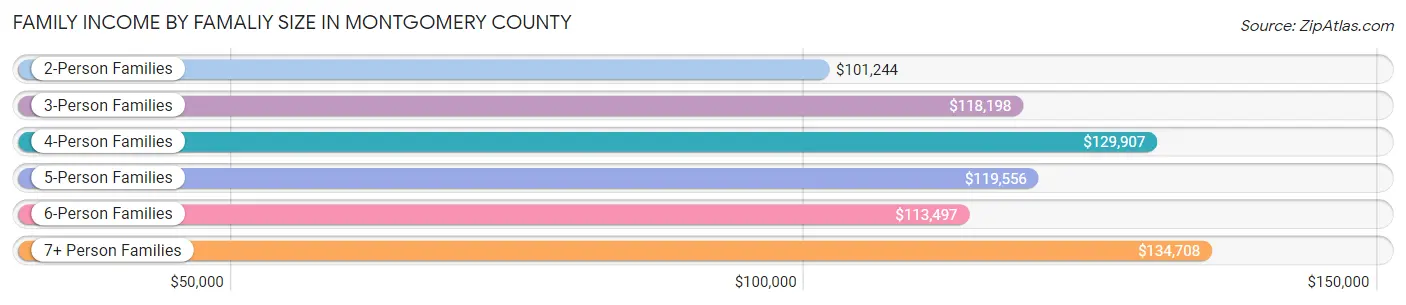
Family Income by Famaliy Size in Montgomery County
7+ person families (2,774 | 1.7%) account for the highest median family income in Montgomery County with $134,708 per family, while 2-person families (71,080 | 42.4%) have the highest median income of $50,622 per family member.
| Income Bracket | # Families | Median Income |
| 2-Person Families | 71,080 (42.4%) | $101,244 |
| 3-Person Families | 36,110 (21.6%) | $118,198 |
| 4-Person Families | 33,755 (20.2%) | $129,907 |
| 5-Person Families | 17,838 (10.6%) | $119,556 |
| 6-Person Families | 5,873 (3.5%) | $113,497 |
| 7+ Person Families | 2,774 (1.7%) | $134,708 |
| Total | 167,430 (100.0%) | $114,108 |
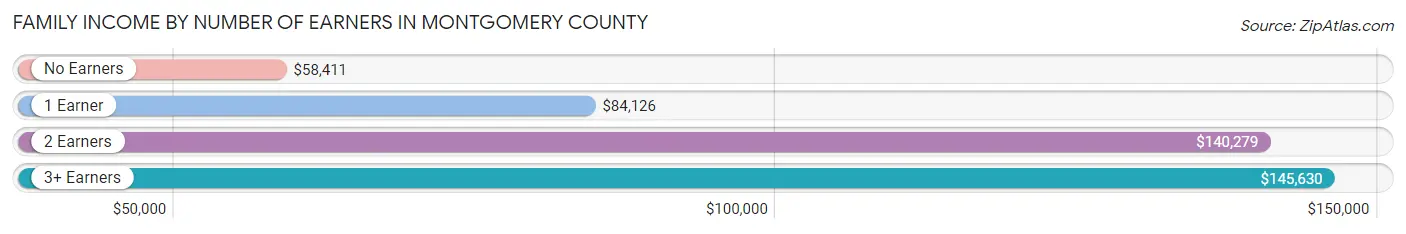
Family Income by Number of Earners in Montgomery County
The median family income in Montgomery County is $114,108, with families comprising 3+ earners (18,488) having the highest median family income of $145,630, while families with no earners (20,744) have the lowest median family income of $58,411, accounting for 11.0% and 12.4% of families, respectively.
| Number of Earners | # Families | Median Income |
| No Earners | 20,744 (12.4%) | $58,411 |
| 1 Earner | 55,545 (33.2%) | $84,126 |
| 2 Earners | 72,653 (43.4%) | $140,279 |
| 3+ Earners | 18,488 (11.0%) | $145,630 |
| Total | 167,430 (100.0%) | $114,108 |
Household Income in Montgomery County
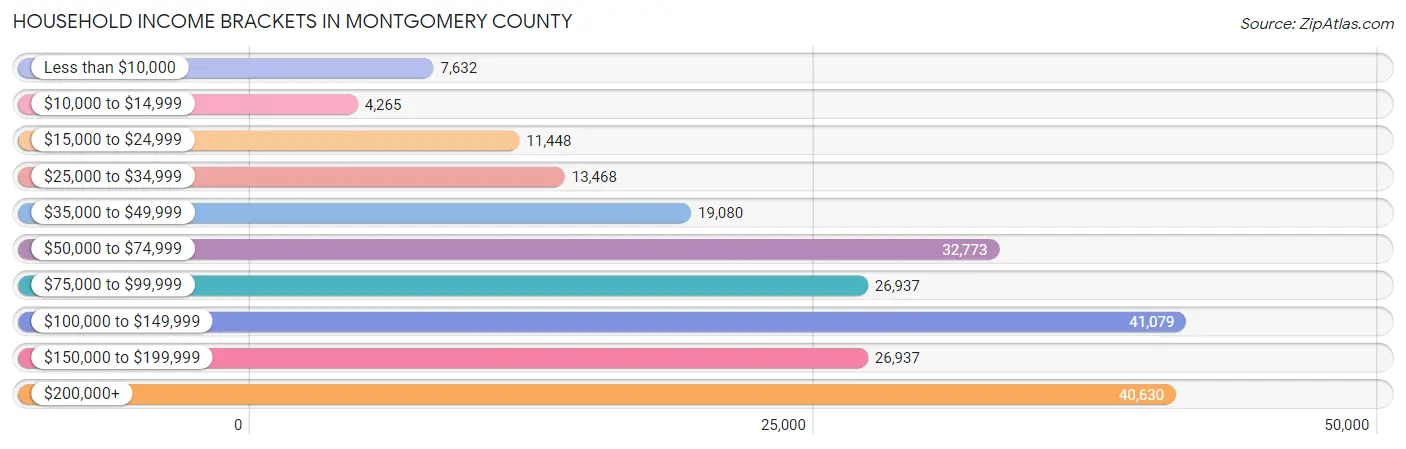
Household Income Brackets in Montgomery County
With 41,079 households falling in the category, the $100,000 to $149,999 income range is the most frequent in Montgomery County, accounting for 18.3% of all households. In contrast, only 4,265 households (1.9%) fall into the $10,000 to $14,999 income bracket, making it the least populous group.
| Income Bracket | # Households | % Households |
| Less than $10,000 | 7,632 | 3.4% |
| $10,000 to $14,999 | 4,265 | 1.9% |
| $15,000 to $24,999 | 11,448 | 5.1% |
| $25,000 to $34,999 | 13,468 | 6.0% |
| $35,000 to $49,999 | 19,080 | 8.5% |
| $50,000 to $74,999 | 32,773 | 14.6% |
| $75,000 to $99,999 | 26,937 | 12.0% |
| $100,000 to $149,999 | 41,079 | 18.3% |
| $150,000 to $199,999 | 26,937 | 12.0% |
| $200,000+ | 40,630 | 18.1% |
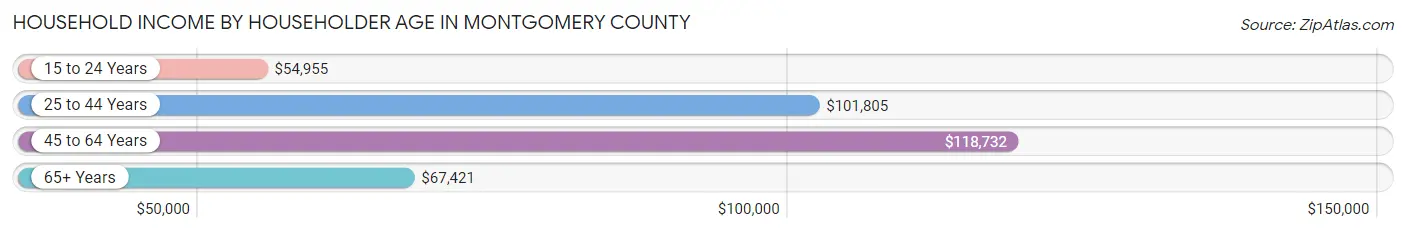
Household Income by Householder Age in Montgomery County
The median household income in Montgomery County is $95,946, with the highest median household income of $118,732 found in the 45 to 64 years age bracket for the primary householder. A total of 87,552 households (39.0%) fall into this category. Meanwhile, the 15 to 24 years age bracket for the primary householder has the lowest median household income of $54,955, with 7,329 households (3.3%) in this group.
| Income Bracket | # Households | Median Income |
| 15 to 24 Years | 7,329 (3.3%) | $54,955 |
| 25 to 44 Years | 79,650 (35.5%) | $101,805 |
| 45 to 64 Years | 87,552 (39.0%) | $118,732 |
| 65+ Years | 49,943 (22.3%) | $67,421 |
| Total | 224,474 (100.0%) | $95,946 |
Poverty in Montgomery County
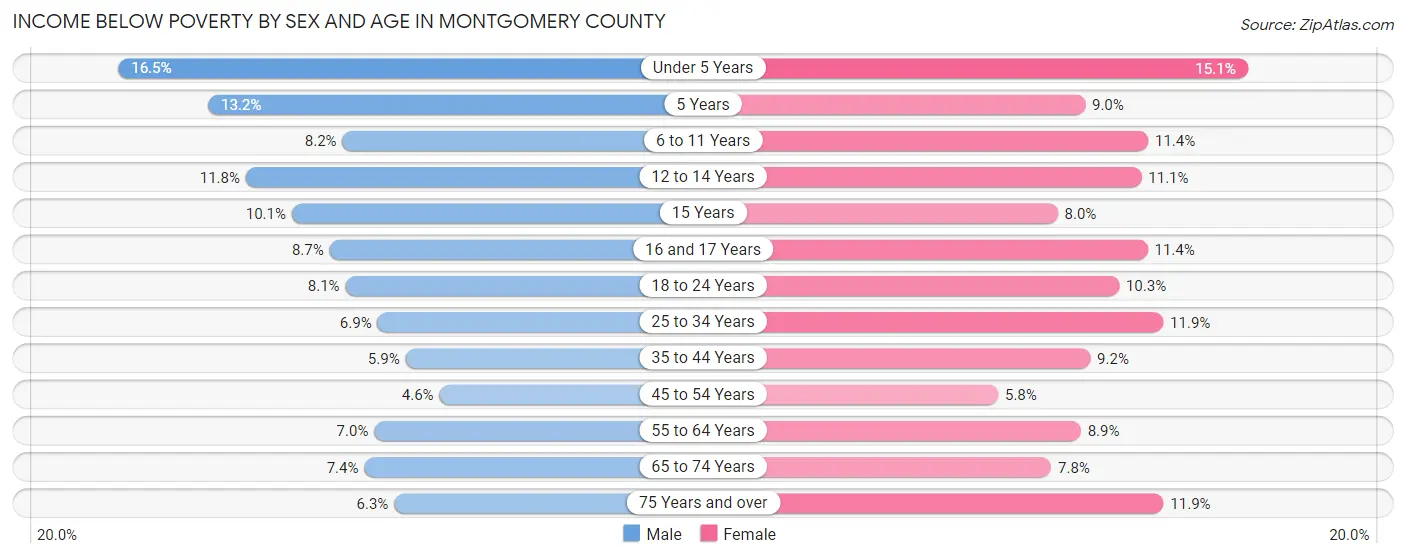
Income Below Poverty by Sex and Age in Montgomery County
With 7.8% poverty level for males and 9.9% for females among the residents of Montgomery County, under 5 year old males and under 5 year old females are the most vulnerable to poverty, with 3,386 males (16.5%) and 2,938 females (15.1%) in their respective age groups living below the poverty level.
| Age Bracket | Male | Female |
| Under 5 Years | 3,386 (16.5%) | 2,938 (15.1%) |
| 5 Years | 623 (13.2%) | 346 (9.0%) |
| 6 to 11 Years | 2,256 (8.2%) | 3,245 (11.4%) |
| 12 to 14 Years | 1,782 (11.8%) | 1,436 (11.1%) |
| 15 Years | 470 (10.1%) | 361 (8.0%) |
| 16 and 17 Years | 884 (8.7%) | 1,098 (11.4%) |
| 18 to 24 Years | 2,234 (8.1%) | 2,736 (10.3%) |
| 25 to 34 Years | 2,714 (6.9%) | 4,721 (11.9%) |
| 35 to 44 Years | 2,583 (5.9%) | 4,039 (9.2%) |
| 45 to 54 Years | 1,946 (4.6%) | 2,400 (5.8%) |
| 55 to 64 Years | 2,676 (7.0%) | 3,400 (8.9%) |
| 65 to 74 Years | 1,865 (7.4%) | 2,139 (7.8%) |
| 75 Years and over | 823 (6.3%) | 2,101 (11.9%) |
| Total | 24,242 (7.8%) | 30,960 (9.9%) |
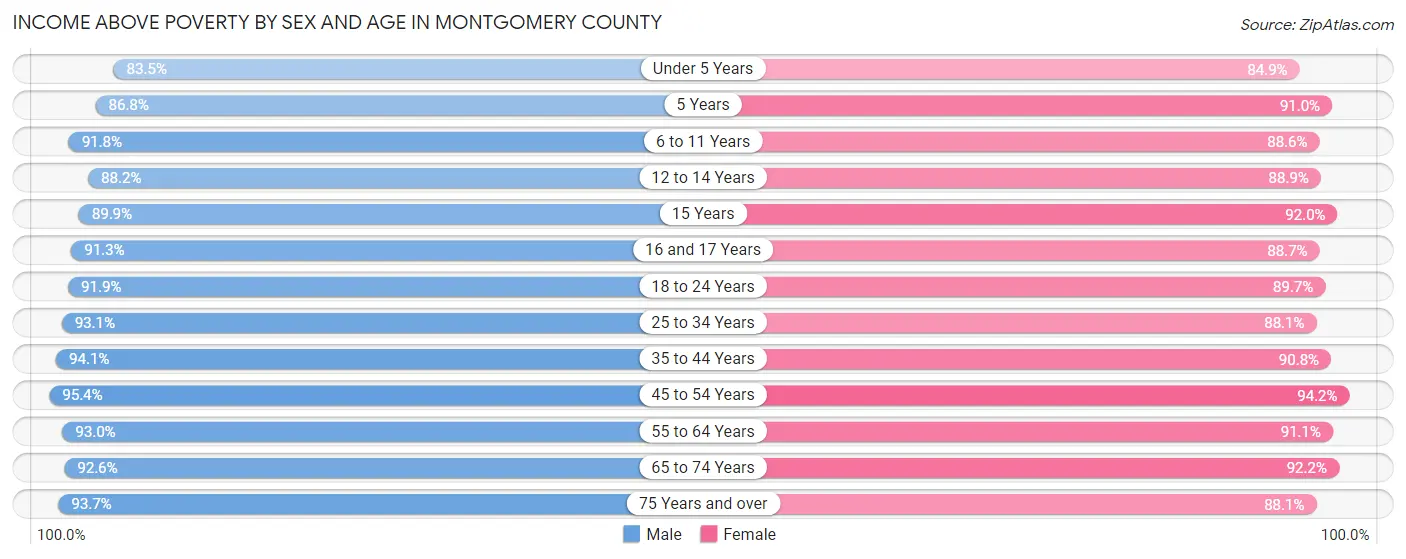
Income Above Poverty by Sex and Age in Montgomery County
According to the poverty statistics in Montgomery County, males aged 45 to 54 years and females aged 45 to 54 years are the age groups that are most secure financially, with 95.4% of males and 94.2% of females in these age groups living above the poverty line.
| Age Bracket | Male | Female |
| Under 5 Years | 17,113 (83.5%) | 16,577 (84.9%) |
| 5 Years | 4,100 (86.8%) | 3,485 (91.0%) |
| 6 to 11 Years | 25,260 (91.8%) | 25,288 (88.6%) |
| 12 to 14 Years | 13,333 (88.2%) | 11,472 (88.9%) |
| 15 Years | 4,195 (89.9%) | 4,145 (92.0%) |
| 16 and 17 Years | 9,300 (91.3%) | 8,573 (88.6%) |
| 18 to 24 Years | 25,371 (91.9%) | 23,864 (89.7%) |
| 25 to 34 Years | 36,626 (93.1%) | 34,842 (88.1%) |
| 35 to 44 Years | 41,468 (94.1%) | 39,791 (90.8%) |
| 45 to 54 Years | 40,362 (95.4%) | 38,955 (94.2%) |
| 55 to 64 Years | 35,446 (93.0%) | 34,910 (91.1%) |
| 65 to 74 Years | 23,369 (92.6%) | 25,402 (92.2%) |
| 75 Years and over | 12,286 (93.7%) | 15,492 (88.1%) |
| Total | 288,229 (92.2%) | 282,796 (90.1%) |
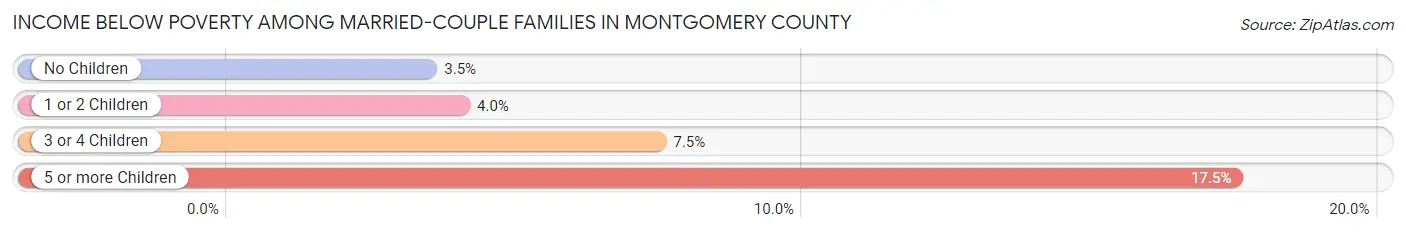
Income Below Poverty Among Married-Couple Families in Montgomery County
The poverty statistics for married-couple families in Montgomery County show that 4.2% or 5,771 of the total 137,878 families live below the poverty line. Families with 5 or more children have the highest poverty rate of 17.5%, comprising of 172 families. On the other hand, families with no children have the lowest poverty rate of 3.5%, which includes 2,529 families.
| Children | Above Poverty | Below Poverty |
| No Children | 70,336 (96.5%) | 2,529 (3.5%) |
| 1 or 2 Children | 47,967 (96.0%) | 2,022 (4.0%) |
| 3 or 4 Children | 12,993 (92.5%) | 1,048 (7.5%) |
| 5 or more Children | 811 (82.5%) | 172 (17.5%) |
| Total | 132,107 (95.8%) | 5,771 (4.2%) |
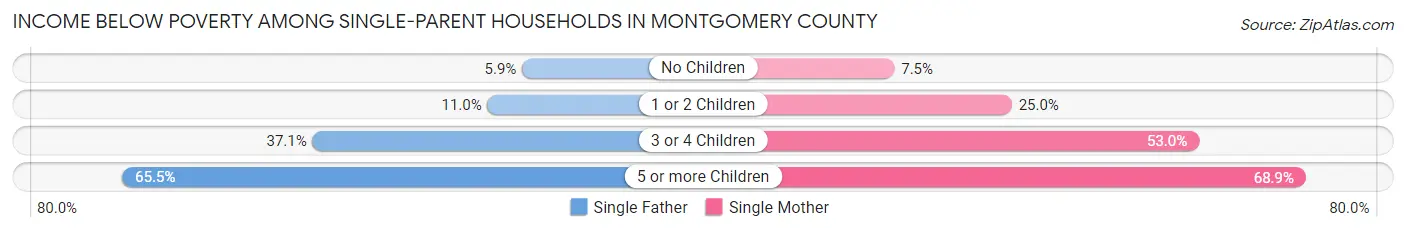
Income Below Poverty Among Single-Parent Households in Montgomery County
According to the poverty data in Montgomery County, 12.1% or 1,062 single-father households and 22.1% or 4,577 single-mother households are living below the poverty line. Among single-father households, those with 5 or more children have the highest poverty rate, with 127 households (65.5%) experiencing poverty. Likewise, among single-mother households, those with 5 or more children have the highest poverty rate, with 188 households (68.9%) falling below the poverty line.
| Children | Single Father | Single Mother |
| No Children | 195 (5.9%) | 580 (7.5%) |
| 1 or 2 Children | 513 (11.0%) | 2,660 (25.0%) |
| 3 or 4 Children | 227 (37.1%) | 1,149 (52.9%) |
| 5 or more Children | 127 (65.5%) | 188 (68.9%) |
| Total | 1,062 (12.1%) | 4,577 (22.1%) |
Income Below Poverty Among Married-Couple vs Single-Parent Households in Montgomery County
The poverty data for Montgomery County shows that 5,771 of the married-couple family households (4.2%) and 5,639 of the single-parent households (19.1%) are living below the poverty level. Within the married-couple family households, those with 5 or more children have the highest poverty rate, with 172 households (17.5%) falling below the poverty line. Among the single-parent households, those with 5 or more children have the highest poverty rate, with 315 household (67.4%) living below poverty.
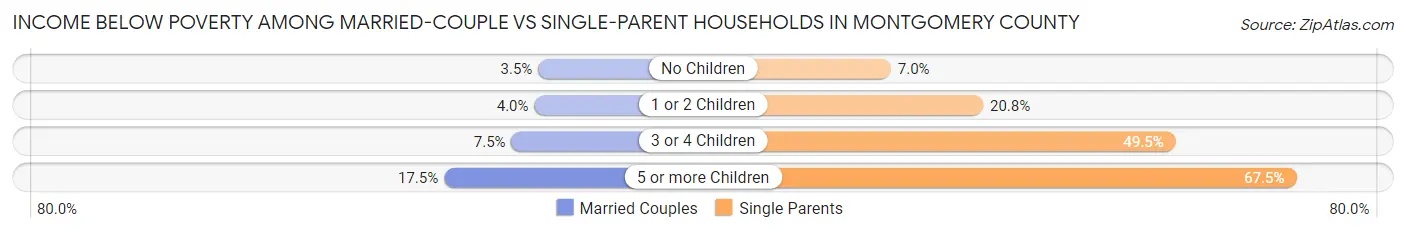
| Children | Married-Couple Families | Single-Parent Households |
| No Children | 2,529 (3.5%) | 775 (7.0%) |
| 1 or 2 Children | 2,022 (4.0%) | 3,173 (20.8%) |
| 3 or 4 Children | 1,048 (7.5%) | 1,376 (49.5%) |
| 5 or more Children | 172 (17.5%) | 315 (67.4%) |
| Total | 5,771 (4.2%) | 5,639 (19.1%) |
Race in Montgomery County
The most populous races in Montgomery County are White / Caucasian (474,627 | 75.3%), Hispanic or Latino (162,783 | 25.8%), and Two or more Races (72,898 | 11.6%).
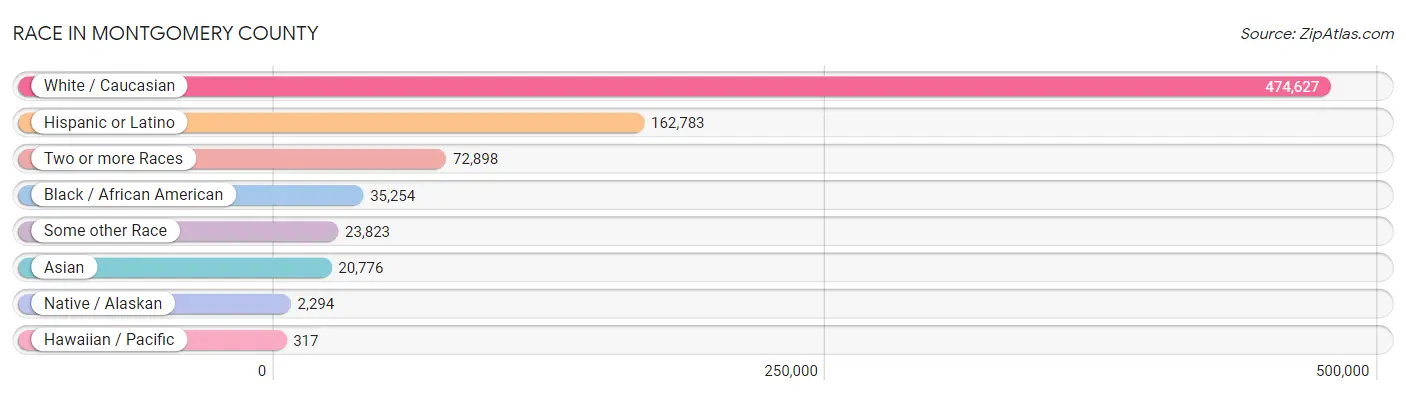
| Race | # Population | % Population |
| Asian | 20,776 | 3.3% |
| Black / African American | 35,254 | 5.6% |
| Hawaiian / Pacific | 317 | 0.1% |
| Hispanic or Latino | 162,783 | 25.8% |
| Native / Alaskan | 2,294 | 0.4% |
| White / Caucasian | 474,627 | 75.3% |
| Two or more Races | 72,898 | 11.6% |
| Some other Race | 23,823 | 3.8% |
| Total | 629,989 | 100.0% |
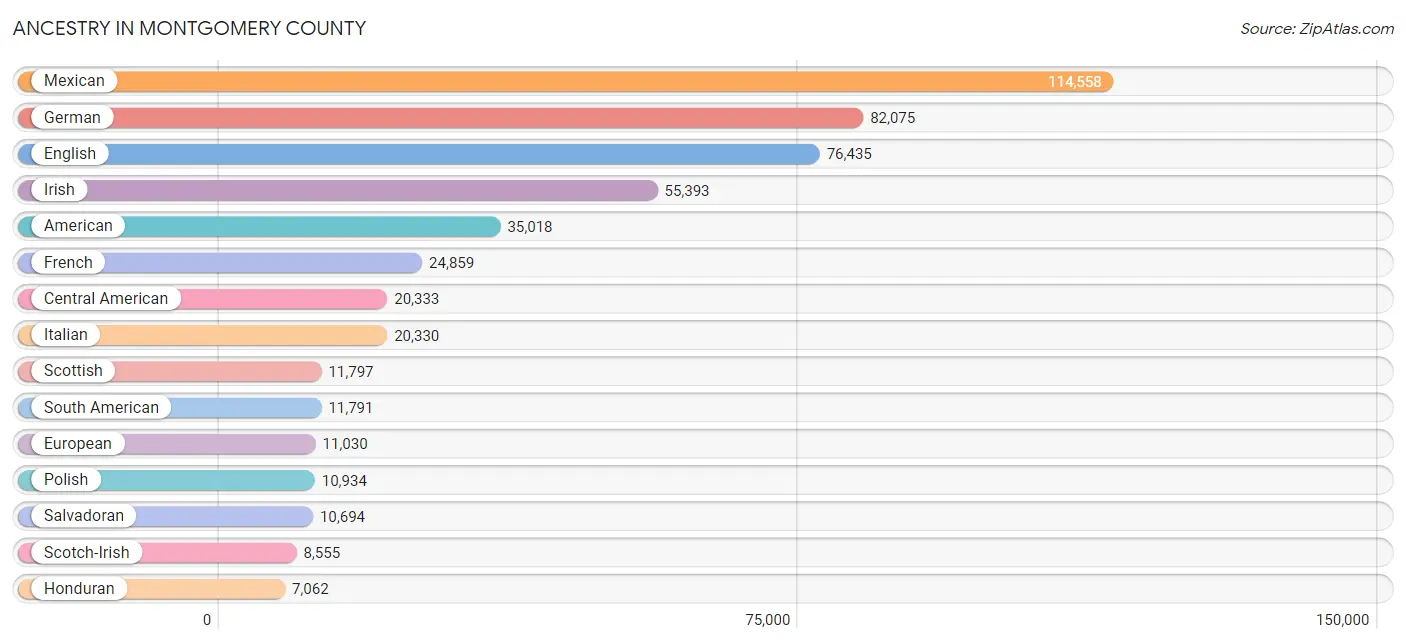
Ancestry in Montgomery County
The most populous ancestries reported in Montgomery County are Mexican (114,558 | 18.2%), German (82,075 | 13.0%), English (76,435 | 12.1%), Irish (55,393 | 8.8%), and American (35,018 | 5.6%), together accounting for 57.7% of all Montgomery County residents.
| Ancestry | # Population | % Population |
| Afghan | 152 | 0.0% |
| African | 1,562 | 0.3% |
| Alaskan Athabascan | 34 | 0.0% |
| Albanian | 143 | 0.0% |
| Alsatian | 32 | 0.0% |
| American | 35,018 | 5.6% |
| Apache | 75 | 0.0% |
| Arab | 2,283 | 0.4% |
| Argentinean | 1,326 | 0.2% |
| Armenian | 342 | 0.1% |
| Australian | 135 | 0.0% |
| Austrian | 870 | 0.1% |
| Bangladeshi | 11 | 0.0% |
| Basque | 168 | 0.0% |
| Belgian | 453 | 0.1% |
| Belizean | 91 | 0.0% |
| Bhutanese | 1,325 | 0.2% |
| Blackfeet | 129 | 0.0% |
| Bolivian | 64 | 0.0% |
| Brazilian | 601 | 0.1% |
| British | 4,606 | 0.7% |
| British West Indian | 129 | 0.0% |
| Bulgarian | 19 | 0.0% |
| Burmese | 1,478 | 0.2% |
| Cajun | 476 | 0.1% |
| Cambodian | 14 | 0.0% |
| Canadian | 1,302 | 0.2% |
| Cape Verdean | 28 | 0.0% |
| Celtic | 119 | 0.0% |
| Central American | 20,333 | 3.2% |
| Central American Indian | 411 | 0.1% |
| Cherokee | 2,206 | 0.4% |
| Chickasaw | 41 | 0.0% |
| Chilean | 331 | 0.1% |
| Chippewa | 179 | 0.0% |
| Choctaw | 579 | 0.1% |
| Colombian | 3,813 | 0.6% |
| Comanche | 19 | 0.0% |
| Costa Rican | 557 | 0.1% |
| Creek | 160 | 0.0% |
| Croatian | 748 | 0.1% |
| Cuban | 2,381 | 0.4% |
| Czech | 3,987 | 0.6% |
| Czechoslovakian | 484 | 0.1% |
| Danish | 1,269 | 0.2% |
| Delaware | 17 | 0.0% |
| Dominican | 608 | 0.1% |
| Dutch | 5,671 | 0.9% |
| Dutch West Indian | 194 | 0.0% |
| Eastern European | 897 | 0.1% |
| Ecuadorian | 901 | 0.1% |
| Egyptian | 418 | 0.1% |
| English | 76,435 | 12.1% |
| Estonian | 8 | 0.0% |
| Ethiopian | 126 | 0.0% |
| European | 11,030 | 1.8% |
| Fijian | 45 | 0.0% |
| Filipino | 205 | 0.0% |
| Finnish | 729 | 0.1% |
| French | 24,859 | 4.0% |
| French American Indian | 16 | 0.0% |
| French Canadian | 1,640 | 0.3% |
| German | 82,075 | 13.0% |
| Ghanaian | 277 | 0.0% |
| Greek | 1,400 | 0.2% |
| Guamanian / Chamorro | 326 | 0.1% |
| Guatemalan | 1,475 | 0.2% |
| Guyanese | 78 | 0.0% |
| Haitian | 195 | 0.0% |
| Honduran | 7,062 | 1.1% |
| Hungarian | 1,471 | 0.2% |
| Icelander | 65 | 0.0% |
| Indian (Asian) | 5,335 | 0.9% |
| Indonesian | 16 | 0.0% |
| Iranian | 579 | 0.1% |
| Irish | 55,393 | 8.8% |
| Iroquois | 21 | 0.0% |
| Israeli | 31 | 0.0% |
| Italian | 20,330 | 3.2% |
| Jamaican | 272 | 0.0% |
| Japanese | 194 | 0.0% |
| Jordanian | 99 | 0.0% |
| Kenyan | 548 | 0.1% |
| Kiowa | 5 | 0.0% |
| Korean | 4,866 | 0.8% |
| Laotian | 414 | 0.1% |
| Latvian | 33 | 0.0% |
| Lebanese | 624 | 0.1% |
| Lithuanian | 828 | 0.1% |
| Luxembourger | 47 | 0.0% |
| Macedonian | 52 | 0.0% |
| Maltese | 138 | 0.0% |
| Mexican | 114,558 | 18.2% |
| Mexican American Indian | 1,092 | 0.2% |
| Mongolian | 51 | 0.0% |
| Native Hawaiian | 395 | 0.1% |
| Navajo | 36 | 0.0% |
| Nicaraguan | 313 | 0.1% |
| Nigerian | 1,689 | 0.3% |
| Northern European | 513 | 0.1% |
| Norwegian | 4,077 | 0.6% |
| Okinawan | 81 | 0.0% |
| Osage | 56 | 0.0% |
| Pakistani | 358 | 0.1% |
| Palestinian | 228 | 0.0% |
| Panamanian | 221 | 0.0% |
| Paraguayan | 147 | 0.0% |
| Pennsylvania German | 33 | 0.0% |
| Peruvian | 983 | 0.2% |
| Polish | 10,934 | 1.7% |
| Portuguese | 2,214 | 0.4% |
| Potawatomi | 150 | 0.0% |
| Pueblo | 156 | 0.0% |
| Puerto Rican | 4,513 | 0.7% |
| Romanian | 917 | 0.2% |
| Russian | 2,911 | 0.5% |
| Salvadoran | 10,694 | 1.7% |
| Samoan | 101 | 0.0% |
| Scandinavian | 2,156 | 0.3% |
| Scotch-Irish | 8,555 | 1.4% |
| Scottish | 11,797 | 1.9% |
| Seminole | 14 | 0.0% |
| Serbian | 159 | 0.0% |
| Sierra Leonean | 8 | 0.0% |
| Sioux | 140 | 0.0% |
| Slavic | 374 | 0.1% |
| Slovak | 357 | 0.1% |
| Slovene | 322 | 0.1% |
| South African | 107 | 0.0% |
| South American | 11,791 | 1.9% |
| South American Indian | 9 | 0.0% |
| Spaniard | 2,964 | 0.5% |
| Spanish | 1,077 | 0.2% |
| Spanish American Indian | 11 | 0.0% |
| Sri Lankan | 2,586 | 0.4% |
| Subsaharan African | 4,598 | 0.7% |
| Swedish | 5,561 | 0.9% |
| Swiss | 1,070 | 0.2% |
| Syrian | 204 | 0.0% |
| Thai | 6,394 | 1.0% |
| Trinidadian and Tobagonian | 145 | 0.0% |
| Turkish | 57 | 0.0% |
| Ukrainian | 1,130 | 0.2% |
| Uruguayan | 283 | 0.0% |
| Ute | 13 | 0.0% |
| Venezuelan | 3,943 | 0.6% |
| Vietnamese | 186 | 0.0% |
| Welsh | 4,255 | 0.7% |
| West Indian | 194 | 0.0% |
| Yugoslavian | 300 | 0.1% |
| Zimbabwean | 8 | 0.0% | View All 151 Rows |
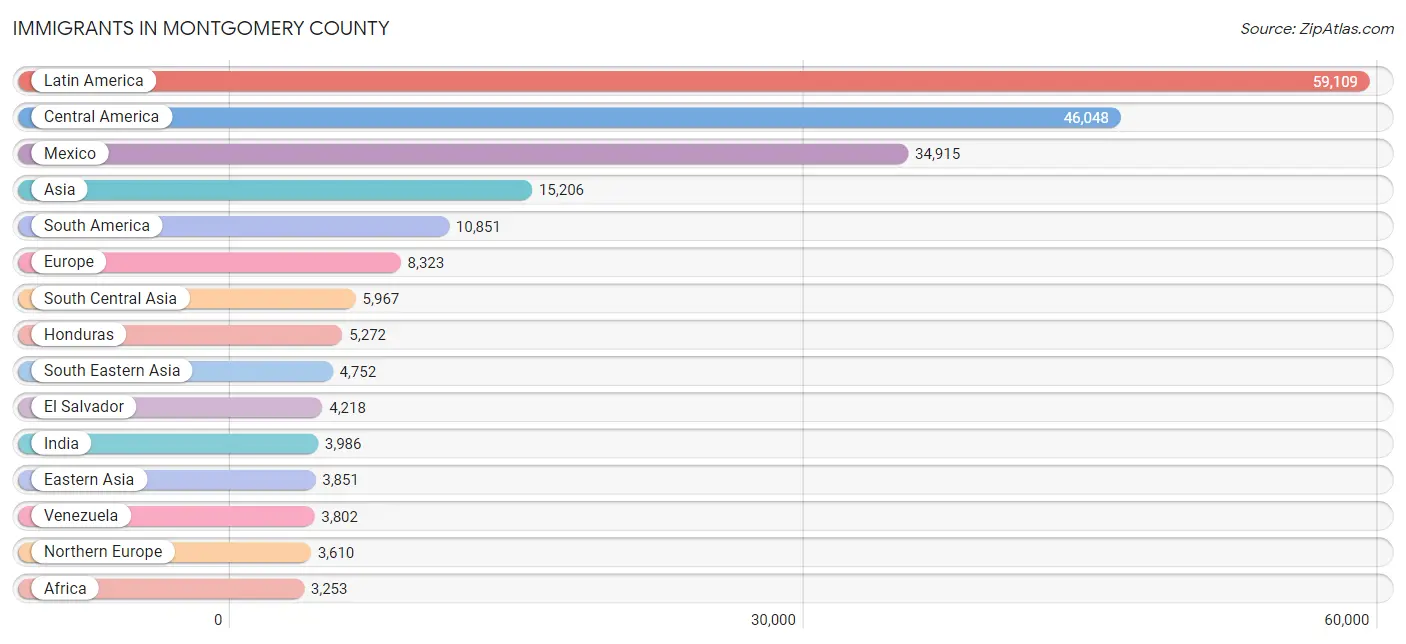
Immigrants in Montgomery County
The most numerous immigrant groups reported in Montgomery County came from Latin America (59,109 | 9.4%), Central America (46,048 | 7.3%), Mexico (34,915 | 5.5%), Asia (15,206 | 2.4%), and South America (10,851 | 1.7%), together accounting for 26.4% of all Montgomery County residents.
| Immigration Origin | # Population | % Population |
| Afghanistan | 84 | 0.0% |
| Africa | 3,253 | 0.5% |
| Albania | 19 | 0.0% |
| Argentina | 1,449 | 0.2% |
| Asia | 15,206 | 2.4% |
| Australia | 407 | 0.1% |
| Austria | 4 | 0.0% |
| Bangladesh | 114 | 0.0% |
| Belarus | 190 | 0.0% |
| Belgium | 141 | 0.0% |
| Belize | 89 | 0.0% |
| Bolivia | 9 | 0.0% |
| Brazil | 485 | 0.1% |
| Bulgaria | 10 | 0.0% |
| Cambodia | 80 | 0.0% |
| Canada | 2,753 | 0.4% |
| Caribbean | 2,210 | 0.4% |
| Central America | 46,048 | 7.3% |
| Chile | 304 | 0.1% |
| China | 2,876 | 0.5% |
| Colombia | 2,936 | 0.5% |
| Costa Rica | 299 | 0.1% |
| Cuba | 956 | 0.2% |
| Czechoslovakia | 48 | 0.0% |
| Denmark | 7 | 0.0% |
| Dominica | 61 | 0.0% |
| Dominican Republic | 231 | 0.0% |
| Eastern Africa | 991 | 0.2% |
| Eastern Asia | 3,851 | 0.6% |
| Eastern Europe | 2,560 | 0.4% |
| Ecuador | 780 | 0.1% |
| Egypt | 68 | 0.0% |
| El Salvador | 4,218 | 0.7% |
| England | 1,020 | 0.2% |
| Ethiopia | 64 | 0.0% |
| Europe | 8,323 | 1.3% |
| France | 314 | 0.1% |
| Germany | 802 | 0.1% |
| Ghana | 305 | 0.1% |
| Greece | 144 | 0.0% |
| Grenada | 15 | 0.0% |
| Guatemala | 796 | 0.1% |
| Guyana | 73 | 0.0% |
| Haiti | 123 | 0.0% |
| Honduras | 5,272 | 0.8% |
| Hong Kong | 215 | 0.0% |
| Hungary | 203 | 0.0% |
| India | 3,986 | 0.6% |
| Indonesia | 278 | 0.0% |
| Iran | 264 | 0.0% |
| Iraq | 14 | 0.0% |
| Ireland | 70 | 0.0% |
| Israel | 15 | 0.0% |
| Italy | 87 | 0.0% |
| Jamaica | 206 | 0.0% |
| Japan | 414 | 0.1% |
| Kazakhstan | 74 | 0.0% |
| Kenya | 633 | 0.1% |
| Korea | 561 | 0.1% |
| Latin America | 59,109 | 9.4% |
| Lebanon | 141 | 0.0% |
| Liberia | 131 | 0.0% |
| Malaysia | 216 | 0.0% |
| Mexico | 34,915 | 5.5% |
| Middle Africa | 53 | 0.0% |
| Moldova | 72 | 0.0% |
| Nepal | 382 | 0.1% |
| Netherlands | 262 | 0.0% |
| Nicaragua | 289 | 0.1% |
| Nigeria | 1,158 | 0.2% |
| Northern Africa | 114 | 0.0% |
| Northern Europe | 3,610 | 0.6% |
| Norway | 117 | 0.0% |
| Oceania | 438 | 0.1% |
| Pakistan | 807 | 0.1% |
| Panama | 170 | 0.0% |
| Peru | 635 | 0.1% |
| Philippines | 2,515 | 0.4% |
| Poland | 78 | 0.0% |
| Portugal | 59 | 0.0% |
| Romania | 334 | 0.1% |
| Russia | 1,008 | 0.2% |
| Saudi Arabia | 114 | 0.0% |
| Scotland | 463 | 0.1% |
| Senegal | 93 | 0.0% |
| Serbia | 68 | 0.0% |
| Singapore | 176 | 0.0% |
| South Africa | 232 | 0.0% |
| South America | 10,851 | 1.7% |
| South Central Asia | 5,967 | 0.9% |
| South Eastern Asia | 4,752 | 0.7% |
| Southern Europe | 523 | 0.1% |
| Spain | 233 | 0.0% |
| Sri Lanka | 224 | 0.0% |
| Switzerland | 90 | 0.0% |
| Syria | 140 | 0.0% |
| Taiwan | 220 | 0.0% |
| Thailand | 371 | 0.1% |
| Trinidad and Tobago | 424 | 0.1% |
| Turkey | 11 | 0.0% |
| Uganda | 44 | 0.0% |
| Ukraine | 365 | 0.1% |
| Uruguay | 240 | 0.0% |
| Uzbekistan | 21 | 0.0% |
| Venezuela | 3,802 | 0.6% |
| Vietnam | 1,093 | 0.2% |
| Western Africa | 1,692 | 0.3% |
| Western Asia | 616 | 0.1% |
| Western Europe | 1,630 | 0.3% |
| Yemen | 72 | 0.0% |
| Zimbabwe | 40 | 0.0% | View All 111 Rows |
Sex and Age in Montgomery County
Sex and Age in Montgomery County
The most populous age groups in Montgomery County are 10 to 14 Years (25,098 | 8.0%) for men and 10 to 14 Years (24,057 | 7.6%) for women.
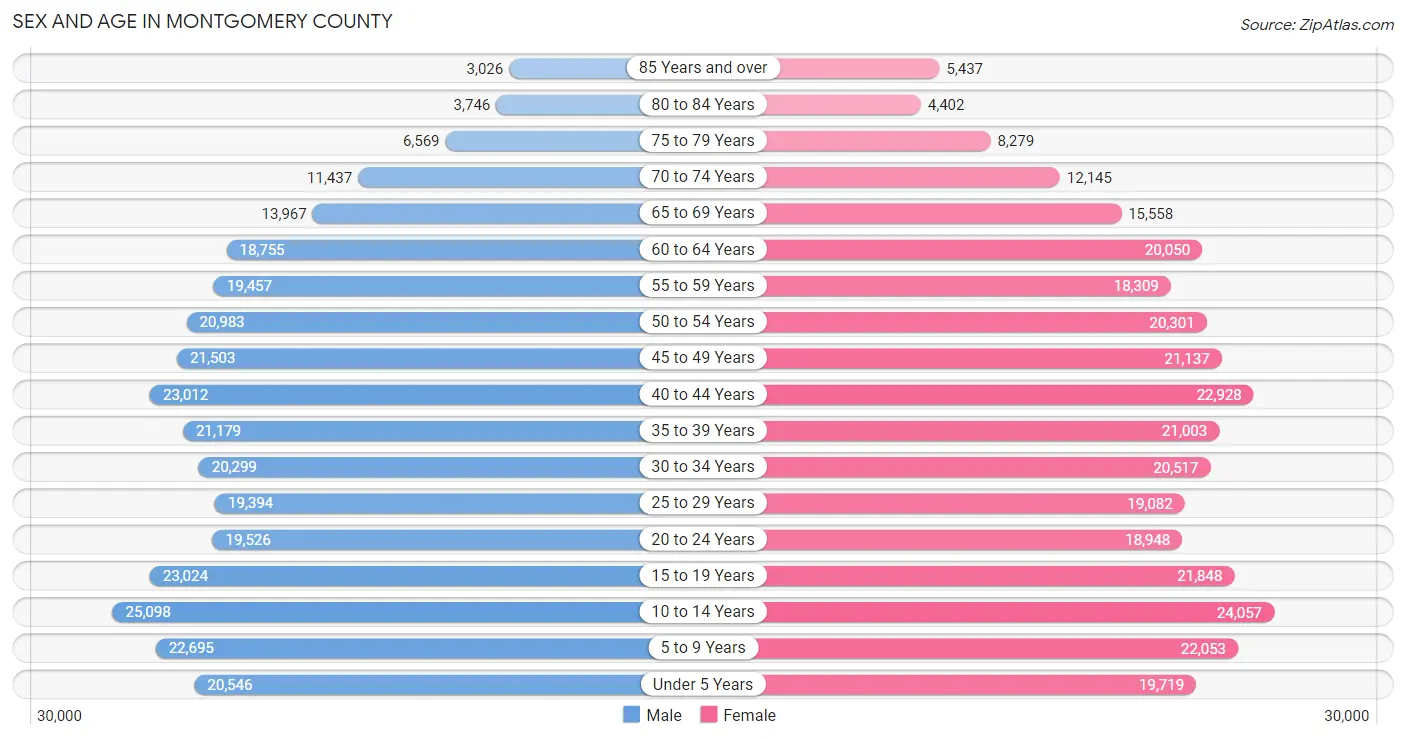
| Age Bracket | Male | Female |
| Under 5 Years | 20,546 (6.5%) | 19,719 (6.2%) |
| 5 to 9 Years | 22,695 (7.2%) | 22,053 (7.0%) |
| 10 to 14 Years | 25,098 (8.0%) | 24,057 (7.6%) |
| 15 to 19 Years | 23,024 (7.3%) | 21,848 (6.9%) |
| 20 to 24 Years | 19,526 (6.2%) | 18,948 (6.0%) |
| 25 to 29 Years | 19,394 (6.2%) | 19,082 (6.0%) |
| 30 to 34 Years | 20,299 (6.5%) | 20,517 (6.5%) |
| 35 to 39 Years | 21,179 (6.7%) | 21,003 (6.7%) |
| 40 to 44 Years | 23,012 (7.3%) | 22,928 (7.3%) |
| 45 to 49 Years | 21,503 (6.8%) | 21,137 (6.7%) |
| 50 to 54 Years | 20,983 (6.7%) | 20,301 (6.4%) |
| 55 to 59 Years | 19,457 (6.2%) | 18,309 (5.8%) |
| 60 to 64 Years | 18,755 (6.0%) | 20,050 (6.4%) |
| 65 to 69 Years | 13,967 (4.4%) | 15,558 (4.9%) |
| 70 to 74 Years | 11,437 (3.6%) | 12,145 (3.8%) |
| 75 to 79 Years | 6,569 (2.1%) | 8,279 (2.6%) |
| 80 to 84 Years | 3,746 (1.2%) | 4,402 (1.4%) |
| 85 Years and over | 3,026 (1.0%) | 5,437 (1.7%) |
| Total | 314,216 (100.0%) | 315,773 (100.0%) |
Families and Households in Montgomery County
Median Family Size in Montgomery County
The median family size in Montgomery County is 3.25 persons per family, with married-couple families (137,878 | 82.4%) accounting for the largest median family size of 3.29 persons per family. On the other hand, single male/father families (8,793 | 5.2%) represent the smallest median family size with 2.81 persons per family.
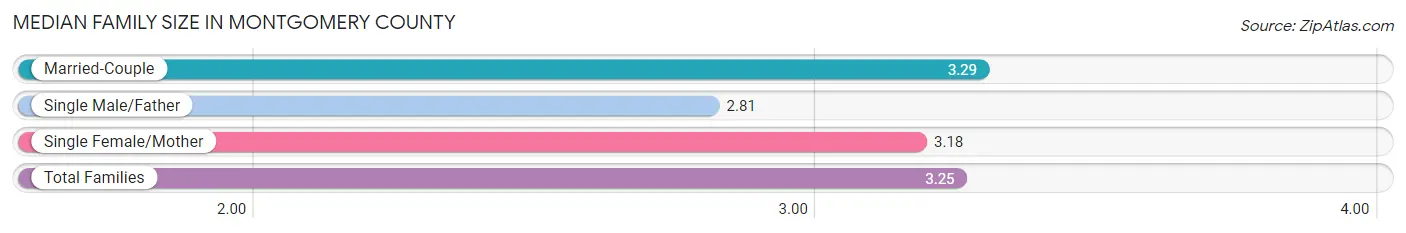
| Family Type | # Families | Family Size |
| Married-Couple | 137,878 (82.4%) | 3.29 |
| Single Male/Father | 8,793 (5.2%) | 2.81 |
| Single Female/Mother | 20,759 (12.4%) | 3.18 |
| Total Families | 167,430 (100.0%) | 3.25 |
Median Household Size in Montgomery County
The median household size in Montgomery County is 2.79 persons per household, with single female/mother households (20,759 | 9.2%) accounting for the largest median household size of 3.45 persons per household. non-family households (57,044 | 25.4%) represent the smallest median household size with 1.24 persons per household.
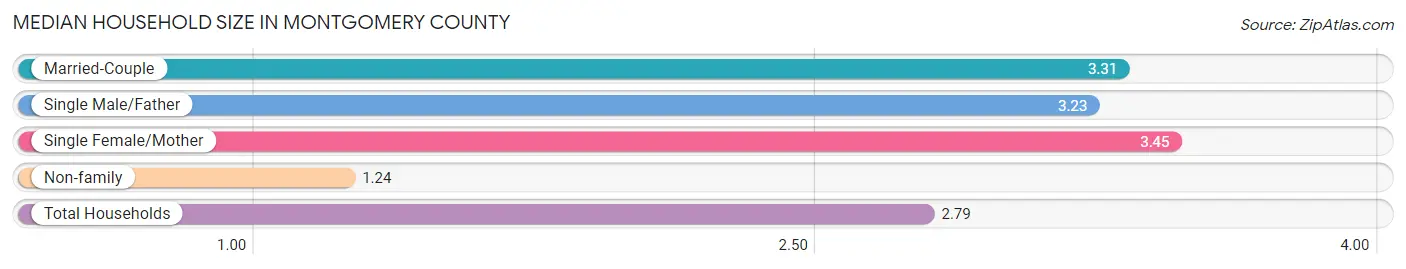
| Household Type | # Households | Household Size |
| Married-Couple | 137,878 (61.4%) | 3.31 |
| Single Male/Father | 8,793 (3.9%) | 3.23 |
| Single Female/Mother | 20,759 (9.2%) | 3.45 |
| Non-family | 57,044 (25.4%) | 1.24 |
| Total Households | 224,474 (100.0%) | 2.79 |
Household Size by Marriage Status in Montgomery County
Out of a total of 224,474 households in Montgomery County, 167,430 (74.6%) are family households, while 57,044 (25.4%) are nonfamily households. The most numerous type of family households are 2-person households, comprising 67,228, and the most common type of nonfamily households are 1-person households, comprising 46,240.
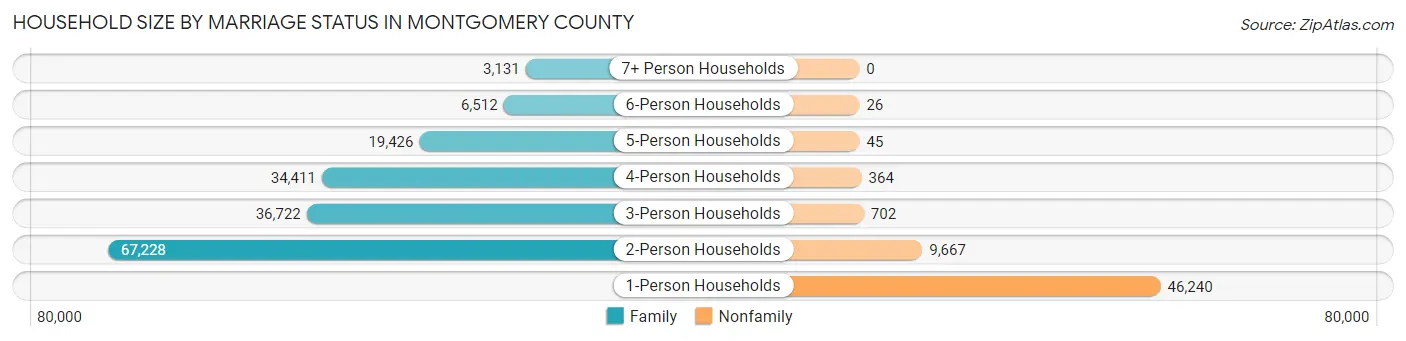
| Household Size | Family Households | Nonfamily Households |
| 1-Person Households | - | 46,240 (20.6%) |
| 2-Person Households | 67,228 (29.9%) | 9,667 (4.3%) |
| 3-Person Households | 36,722 (16.4%) | 702 (0.3%) |
| 4-Person Households | 34,411 (15.3%) | 364 (0.2%) |
| 5-Person Households | 19,426 (8.6%) | 45 (0.0%) |
| 6-Person Households | 6,512 (2.9%) | 26 (0.0%) |
| 7+ Person Households | 3,131 (1.4%) | 0 (0.0%) |
| Total | 167,430 (74.6%) | 57,044 (25.4%) |
Female Fertility in Montgomery County
Fertility by Age in Montgomery County
Average fertility rate in Montgomery County is 61.0 births per 1,000 women. Women in the age bracket of 20 to 34 years have the highest fertility rate with 113.0 births per 1,000 women. Women in the age bracket of 20 to 34 years acount for 72.7% of all women with births.
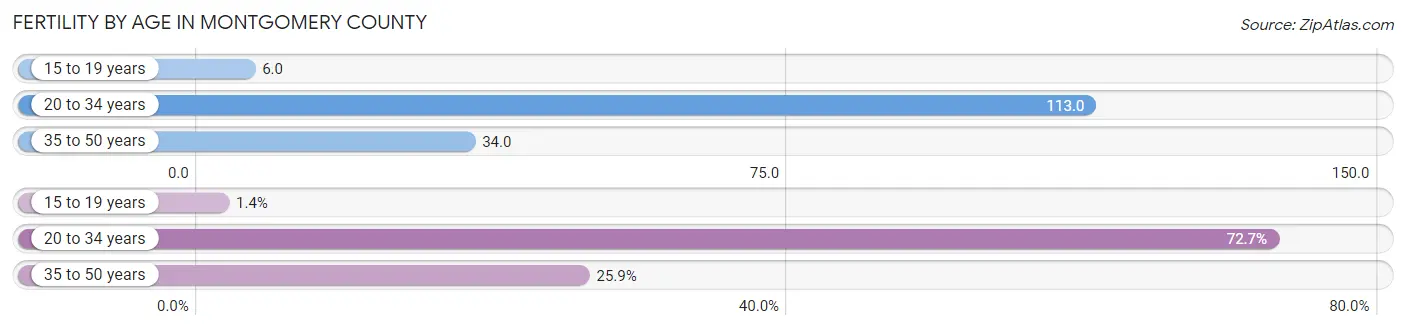
| Age Bracket | Women with Births | Births / 1,000 Women |
| 15 to 19 years | 130 (1.4%) | 6.0 |
| 20 to 34 years | 6,590 (72.7%) | 113.0 |
| 35 to 50 years | 2,348 (25.9%) | 34.0 |
| Total | 9,068 (100.0%) | 61.0 |
Fertility by Age by Marriage Status in Montgomery County
78.5% of women with births (9,068) in Montgomery County are married. The highest percentage of unmarried women with births falls into 15 to 19 years age bracket with 57.7% of them unmarried at the time of birth, while the lowest percentage of unmarried women with births belong to 35 to 50 years age bracket with 14.9% of them unmarried.
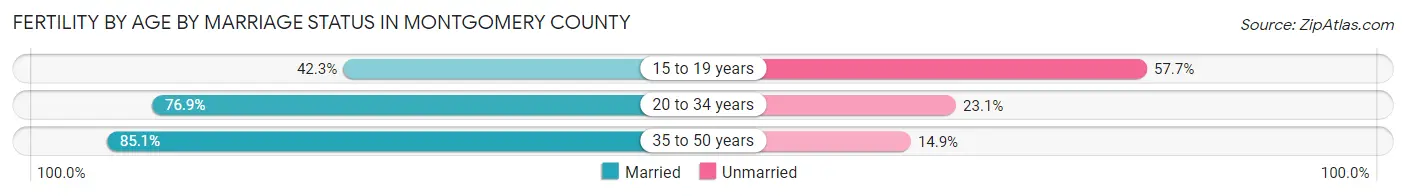
| Age Bracket | Married | Unmarried |
| 15 to 19 years | 55 (42.3%) | 75 (57.7%) |
| 20 to 34 years | 5,068 (76.9%) | 1,522 (23.1%) |
| 35 to 50 years | 1,998 (85.1%) | 350 (14.9%) |
| Total | 7,118 (78.5%) | 1,950 (21.5%) |
Fertility by Education in Montgomery County
Average fertility rate in Montgomery County is 61.0 births per 1,000 women. Women with the education attainment of high school diploma have the highest fertility rate of 81.0 births per 1,000 women, while women with the education attainment of less than high school have the lowest fertility at 31.0 births per 1,000 women. Women with the education attainment of college or associate's degree represent 27.5% of all women with births.
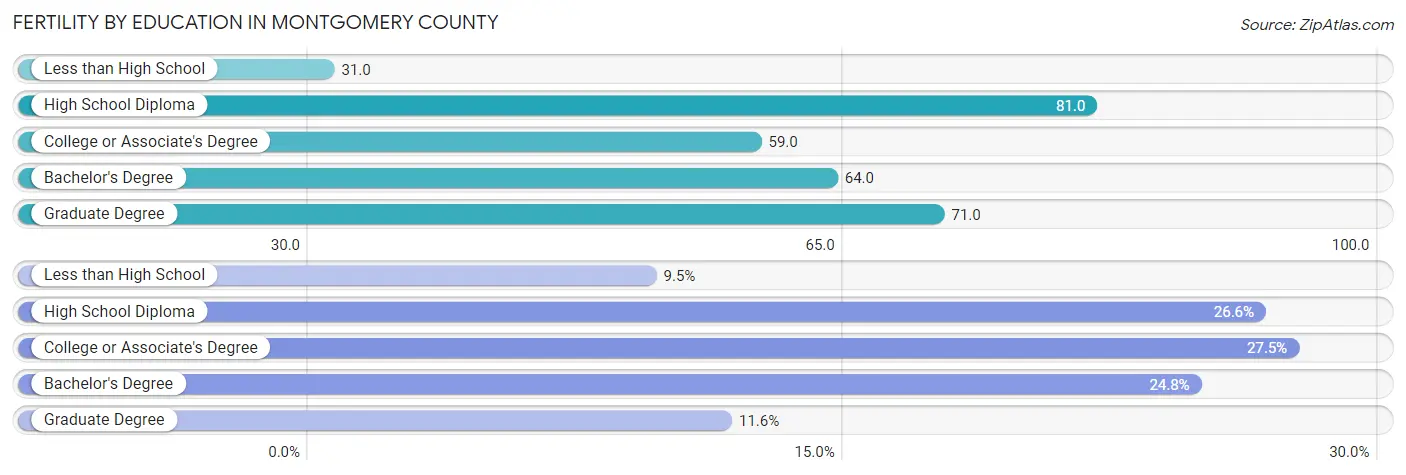
| Educational Attainment | Women with Births | Births / 1,000 Women |
| Less than High School | 860 (9.5%) | 31.0 |
| High School Diploma | 2,412 (26.6%) | 81.0 |
| College or Associate's Degree | 2,496 (27.5%) | 59.0 |
| Bachelor's Degree | 2,248 (24.8%) | 64.0 |
| Graduate Degree | 1,052 (11.6%) | 71.0 |
| Total | 9,068 (100.0%) | 61.0 |
Fertility by Education by Marriage Status in Montgomery County
21.5% of women with births in Montgomery County are unmarried. Women with the educational attainment of graduate degree are most likely to be married with 100.0% of them married at childbirth, while women with the educational attainment of high school diploma are least likely to be married with 38.3% of them unmarried at childbirth.
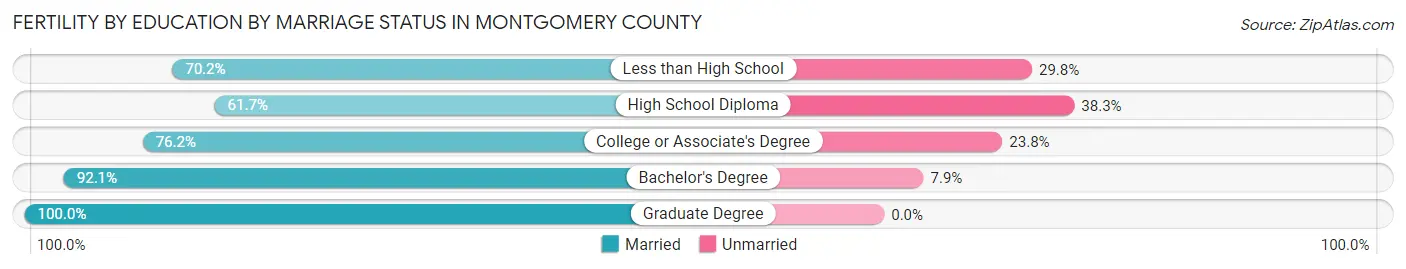
| Educational Attainment | Married | Unmarried |
| Less than High School | 604 (70.2%) | 256 (29.8%) |
| High School Diploma | 1,488 (61.7%) | 924 (38.3%) |
| College or Associate's Degree | 1,902 (76.2%) | 594 (23.8%) |
| Bachelor's Degree | 2,070 (92.1%) | 178 (7.9%) |
| Graduate Degree | 1,052 (100.0%) | 0 (0.0%) |
| Total | 7,118 (78.5%) | 1,950 (21.5%) |
Employment Characteristics in Montgomery County
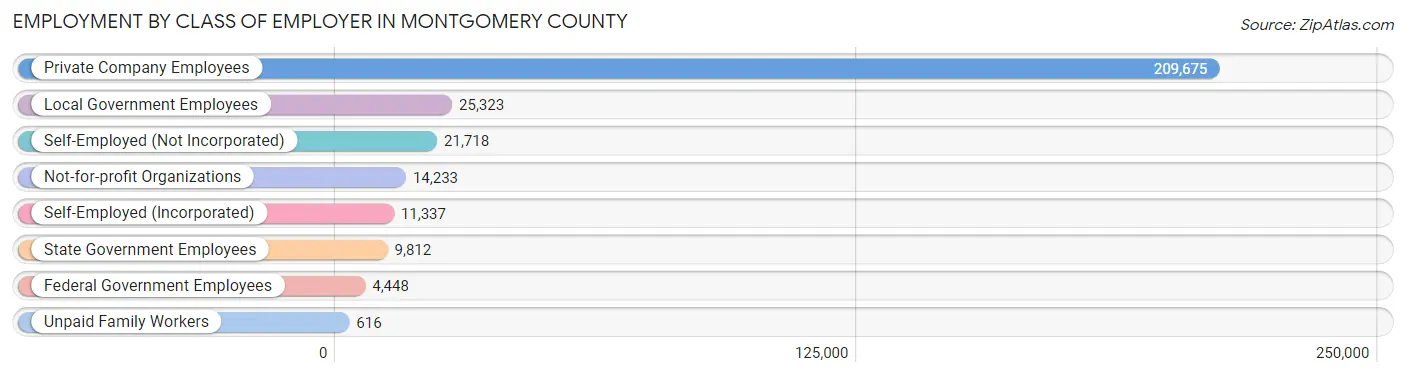
Employment by Class of Employer in Montgomery County
Among the 297,162 employed individuals in Montgomery County, private company employees (209,675 | 70.6%), local government employees (25,323 | 8.5%), and self-employed (not incorporated) (21,718 | 7.3%) make up the most common classes of employment.
| Employer Class | # Employees | % Employees |
| Private Company Employees | 209,675 | 70.6% |
| Self-Employed (Incorporated) | 11,337 | 3.8% |
| Self-Employed (Not Incorporated) | 21,718 | 7.3% |
| Not-for-profit Organizations | 14,233 | 4.8% |
| Local Government Employees | 25,323 | 8.5% |
| State Government Employees | 9,812 | 3.3% |
| Federal Government Employees | 4,448 | 1.5% |
| Unpaid Family Workers | 616 | 0.2% |
| Total | 297,162 | 100.0% |
Employment Status by Age in Montgomery County
According to the labor force statistics for Montgomery County, out of the total population over 16 years of age (486,649), 64.8% or 315,349 individuals are in the labor force, with 4.3% or 13,560 of them unemployed. The age group with the highest labor force participation rate is 30 to 34 years, with 82.2% or 33,551 individuals in the labor force. Within the labor force, the 16 to 19 years age range has the highest percentage of unemployed individuals, with 8.0% or 982 of them being unemployed.

| Age Bracket | In Labor Force | Unemployed |
| 16 to 19 Years | 12,281 (34.4%) | 982 (8.0%) |
| 20 to 24 Years | 29,510 (76.7%) | 2,272 (7.7%) |
| 25 to 29 Years | 31,166 (81.0%) | 1,558 (5.0%) |
| 30 to 34 Years | 33,551 (82.2%) | 1,208 (3.6%) |
| 35 to 44 Years | 72,436 (82.2%) | 1,956 (2.7%) |
| 45 to 54 Years | 68,398 (81.5%) | 2,531 (3.7%) |
| 55 to 59 Years | 28,173 (74.6%) | 732 (2.6%) |
| 60 to 64 Years | 23,205 (59.8%) | 1,230 (5.3%) |
| 65 to 74 Years | 13,648 (25.7%) | 873 (6.4%) |
| 75 Years and over | 2,768 (8.8%) | 144 (5.2%) |
| Total | 315,349 (64.8%) | 13,560 (4.3%) |
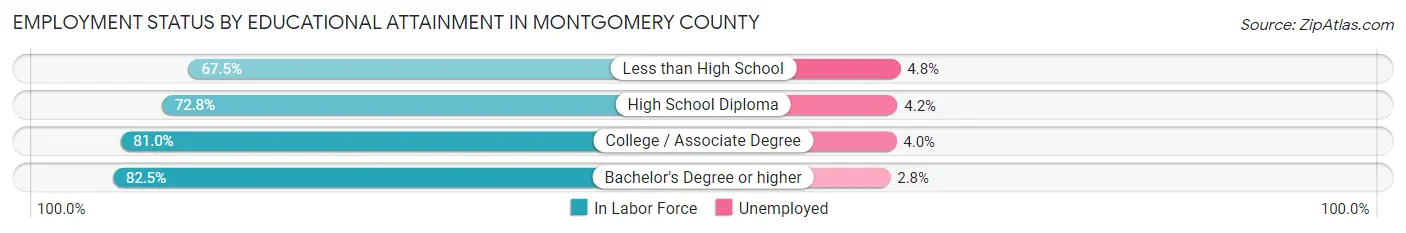
Employment Status by Educational Attainment in Montgomery County
According to labor force statistics for Montgomery County, 78.4% of individuals (257,081) out of the total population between 25 and 64 years of age (327,909) are in the labor force, with 3.6% or 9,255 of them being unemployed. The group with the highest labor force participation rate are those with the educational attainment of bachelor's degree or higher, with 82.5% or 104,881 individuals in the labor force. Within the labor force, individuals with less than high school education have the highest percentage of unemployment, with 4.8% or 1,081 of them being unemployed.
| Educational Attainment | In Labor Force | Unemployed |
| Less than High School | 22,525 (67.5%) | 1,602 (4.8%) |
| High School Diploma | 53,377 (72.8%) | 3,079 (4.2%) |
| College / Associate Degree | 76,213 (81.0%) | 3,764 (4.0%) |
| Bachelor's Degree or higher | 104,881 (82.5%) | 3,560 (2.8%) |
| Total | 257,081 (78.4%) | 11,805 (3.6%) |
Employment Occupations by Sex in Montgomery County
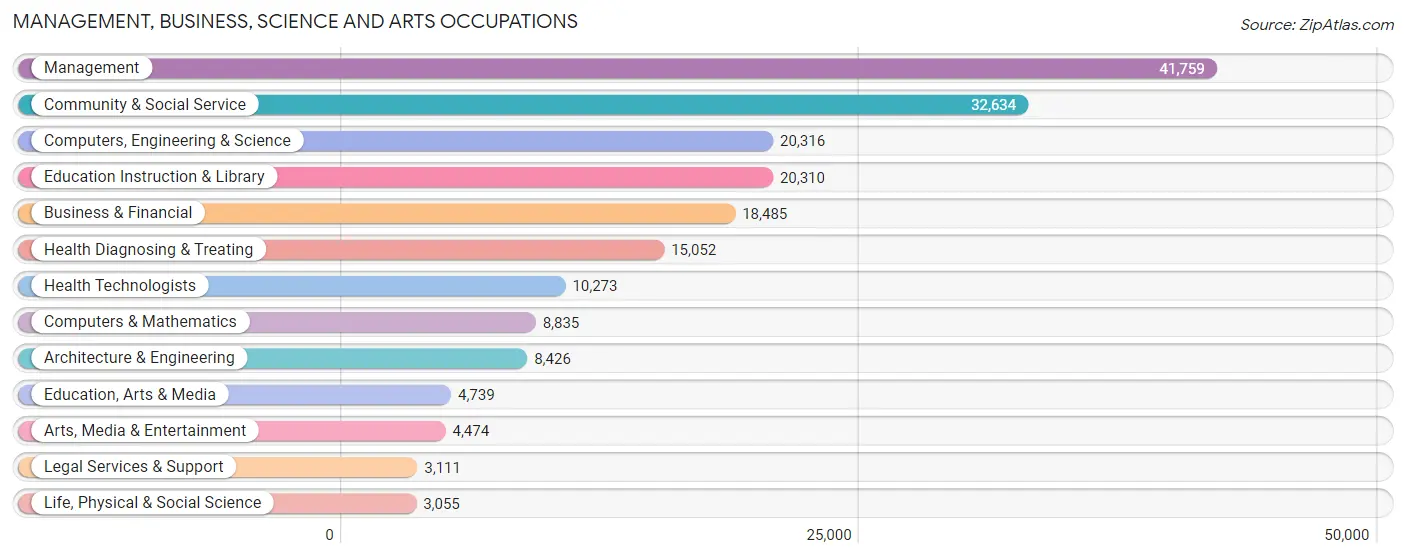
Management, Business, Science and Arts Occupations
The most common Management, Business, Science and Arts occupations in Montgomery County are Management (41,759 | 13.9%), Community & Social Service (32,634 | 10.8%), Computers, Engineering & Science (20,316 | 6.8%), Education Instruction & Library (20,310 | 6.8%), and Business & Financial (18,485 | 6.1%).
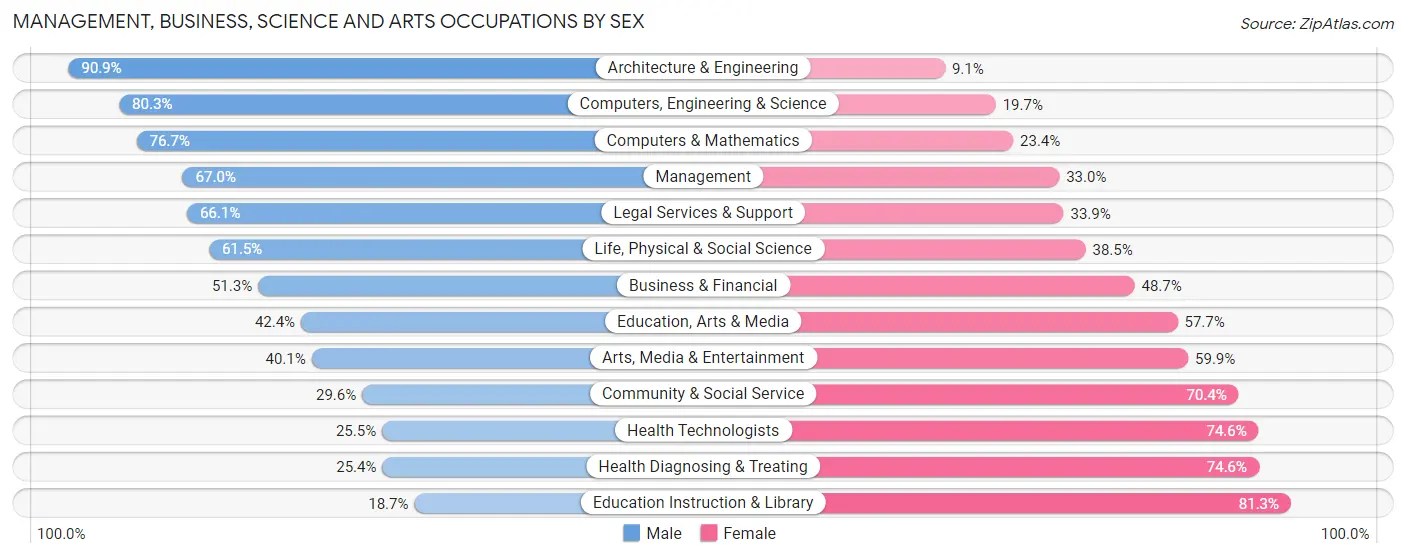
Management, Business, Science and Arts Occupations by Sex
Within the Management, Business, Science and Arts occupations in Montgomery County, the most male-oriented occupations are Architecture & Engineering (90.9%), Computers, Engineering & Science (80.3%), and Computers & Mathematics (76.6%), while the most female-oriented occupations are Education Instruction & Library (81.3%), Health Diagnosing & Treating (74.6%), and Health Technologists (74.6%).
| Occupation | Male | Female |
| Management | 27,990 (67.0%) | 13,769 (33.0%) |
| Business & Financial | 9,486 (51.3%) | 8,999 (48.7%) |
| Computers, Engineering & Science | 16,308 (80.3%) | 4,008 (19.7%) |
| Computers & Mathematics | 6,772 (76.6%) | 2,063 (23.4%) |
| Architecture & Engineering | 7,656 (90.9%) | 770 (9.1%) |
| Life, Physical & Social Science | 1,880 (61.5%) | 1,175 (38.5%) |
| Community & Social Service | 9,659 (29.6%) | 22,975 (70.4%) |
| Education, Arts & Media | 2,007 (42.3%) | 2,732 (57.7%) |
| Legal Services & Support | 2,057 (66.1%) | 1,054 (33.9%) |
| Education Instruction & Library | 3,799 (18.7%) | 16,511 (81.3%) |
| Arts, Media & Entertainment | 1,796 (40.1%) | 2,678 (59.9%) |
| Health Diagnosing & Treating | 3,821 (25.4%) | 11,231 (74.6%) |
| Health Technologists | 2,614 (25.5%) | 7,659 (74.6%) |
| Total (Category) | 67,264 (52.4%) | 60,982 (47.5%) |
| Total (Overall) | 169,957 (56.5%) | 131,058 (43.5%) |
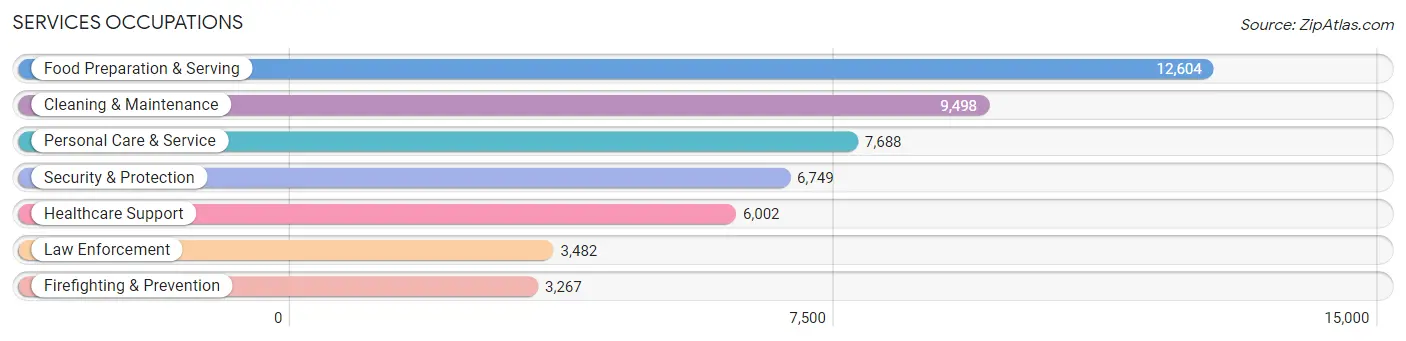
Services Occupations
The most common Services occupations in Montgomery County are Food Preparation & Serving (12,604 | 4.2%), Cleaning & Maintenance (9,498 | 3.2%), Personal Care & Service (7,688 | 2.5%), Security & Protection (6,749 | 2.2%), and Healthcare Support (6,002 | 2.0%).
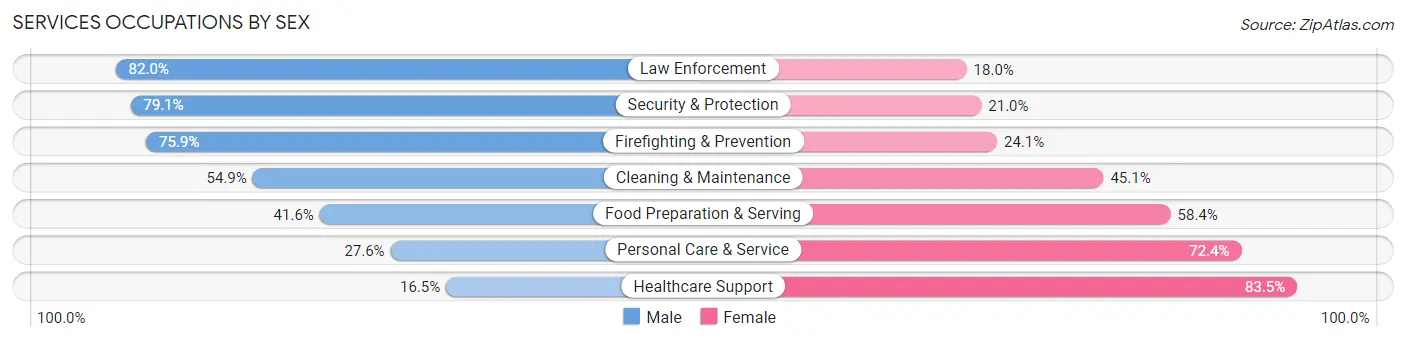
Services Occupations by Sex
Within the Services occupations in Montgomery County, the most male-oriented occupations are Law Enforcement (82.0%), Security & Protection (79.0%), and Firefighting & Prevention (75.9%), while the most female-oriented occupations are Healthcare Support (83.5%), Personal Care & Service (72.4%), and Food Preparation & Serving (58.4%).
| Occupation | Male | Female |
| Healthcare Support | 992 (16.5%) | 5,010 (83.5%) |
| Security & Protection | 5,335 (79.0%) | 1,414 (20.9%) |
| Firefighting & Prevention | 2,481 (75.9%) | 786 (24.1%) |
| Law Enforcement | 2,854 (82.0%) | 628 (18.0%) |
| Food Preparation & Serving | 5,240 (41.6%) | 7,364 (58.4%) |
| Cleaning & Maintenance | 5,211 (54.9%) | 4,287 (45.1%) |
| Personal Care & Service | 2,119 (27.6%) | 5,569 (72.4%) |
| Total (Category) | 18,897 (44.4%) | 23,644 (55.6%) |
| Total (Overall) | 169,957 (56.5%) | 131,058 (43.5%) |
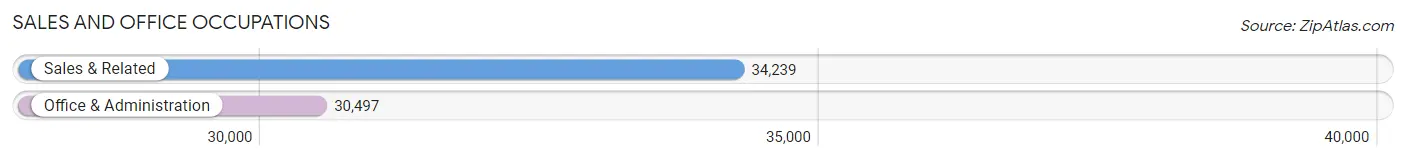
Sales and Office Occupations
The most common Sales and Office occupations in Montgomery County are Sales & Related (34,239 | 11.4%), and Office & Administration (30,497 | 10.1%).
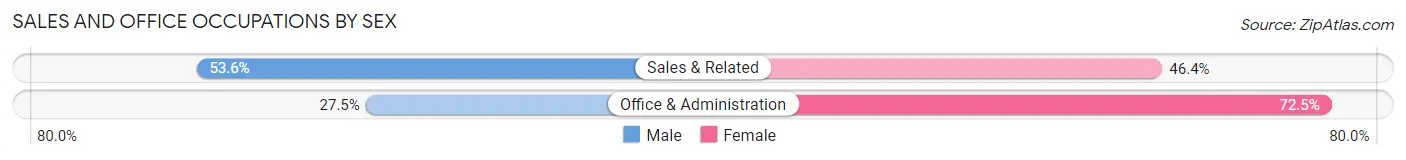
Sales and Office Occupations by Sex
| Occupation | Male | Female |
| Sales & Related | 18,338 (53.6%) | 15,901 (46.4%) |
| Office & Administration | 8,398 (27.5%) | 22,099 (72.5%) |
| Total (Category) | 26,736 (41.3%) | 38,000 (58.7%) |
| Total (Overall) | 169,957 (56.5%) | 131,058 (43.5%) |
Natural Resources, Construction and Maintenance Occupations
The most common Natural Resources, Construction and Maintenance occupations in Montgomery County are Construction & Extraction (17,985 | 6.0%), Installation, Maintenance & Repair (12,452 | 4.1%), and Farming, Fishing & Forestry (379 | 0.1%).
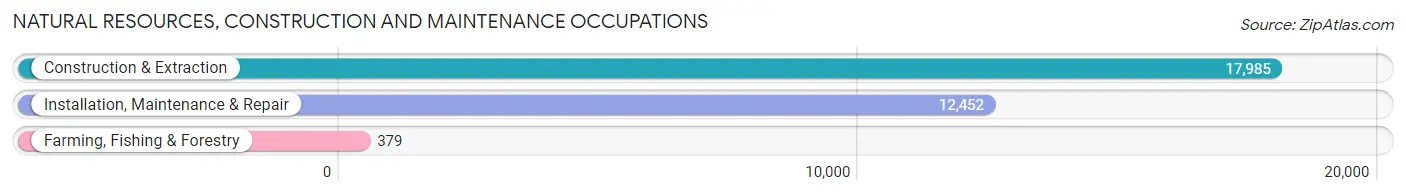
Natural Resources, Construction and Maintenance Occupations by Sex
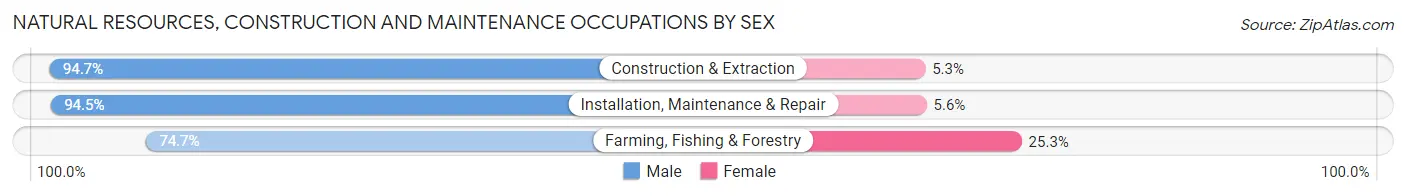
| Occupation | Male | Female |
| Farming, Fishing & Forestry | 283 (74.7%) | 96 (25.3%) |
| Construction & Extraction | 17,039 (94.7%) | 946 (5.3%) |
| Installation, Maintenance & Repair | 11,761 (94.5%) | 691 (5.6%) |
| Total (Category) | 29,083 (94.4%) | 1,733 (5.6%) |
| Total (Overall) | 169,957 (56.5%) | 131,058 (43.5%) |
Production, Transportation and Moving Occupations
The most common Production, Transportation and Moving occupations in Montgomery County are Transportation (13,231 | 4.4%), Production (11,560 | 3.8%), and Material Moving (9,885 | 3.3%).
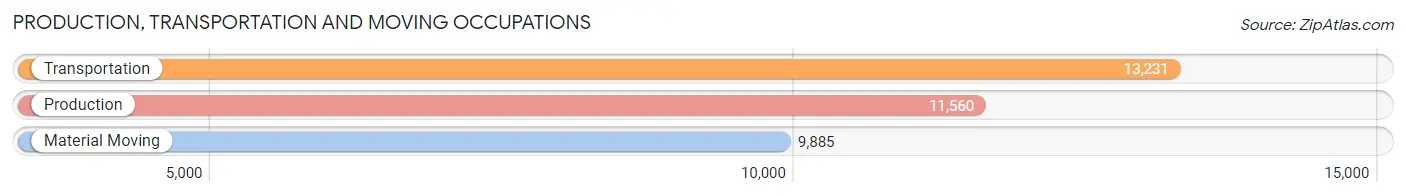
Production, Transportation and Moving Occupations by Sex
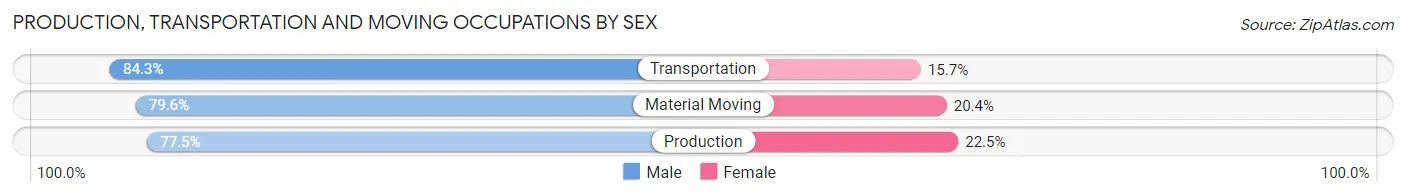
| Occupation | Male | Female |
| Production | 8,956 (77.5%) | 2,604 (22.5%) |
| Transportation | 11,155 (84.3%) | 2,076 (15.7%) |
| Material Moving | 7,866 (79.6%) | 2,019 (20.4%) |
| Total (Category) | 27,977 (80.7%) | 6,699 (19.3%) |
| Total (Overall) | 169,957 (56.5%) | 131,058 (43.5%) |
Employment Industries by Sex in Montgomery County
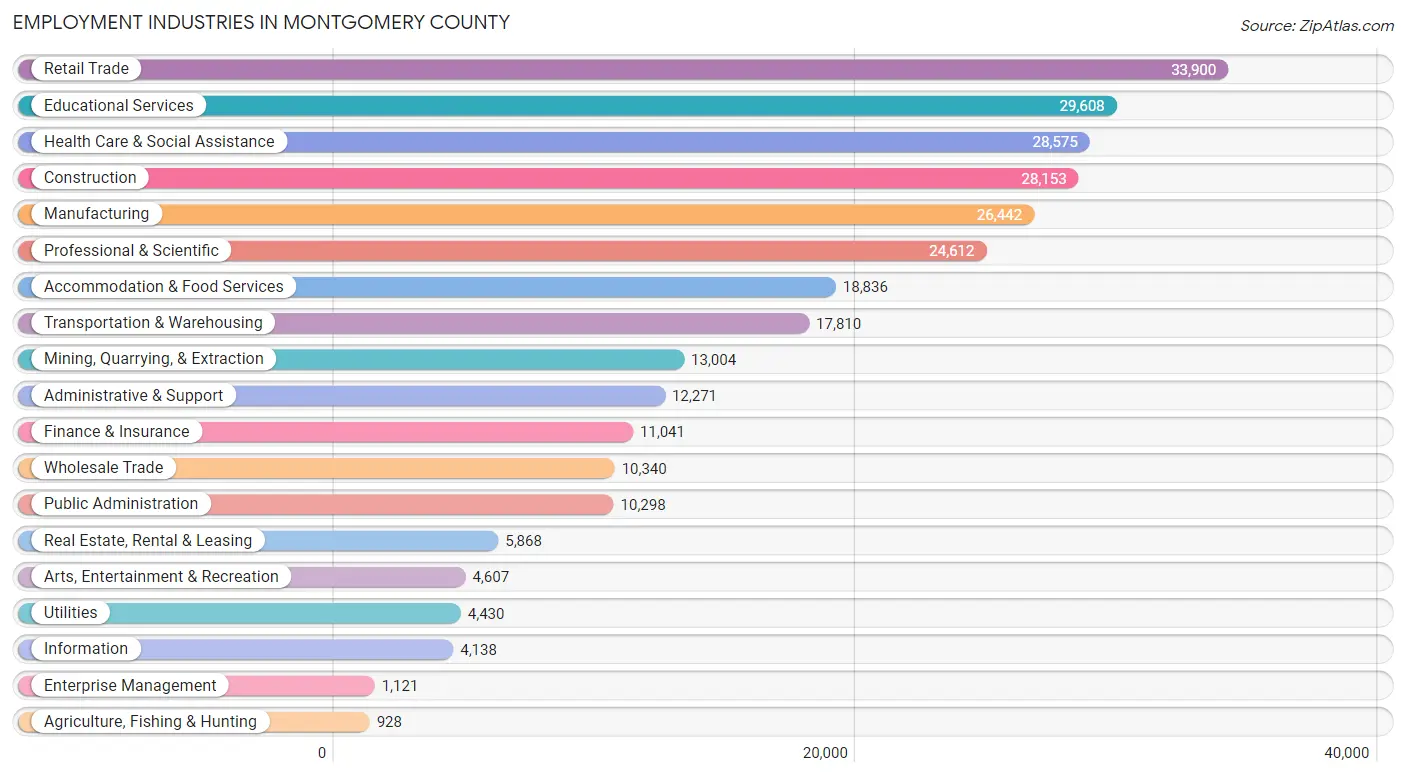
Employment Industries in Montgomery County
The major employment industries in Montgomery County include Retail Trade (33,900 | 11.3%), Educational Services (29,608 | 9.8%), Health Care & Social Assistance (28,575 | 9.5%), Construction (28,153 | 9.3%), and Manufacturing (26,442 | 8.8%).
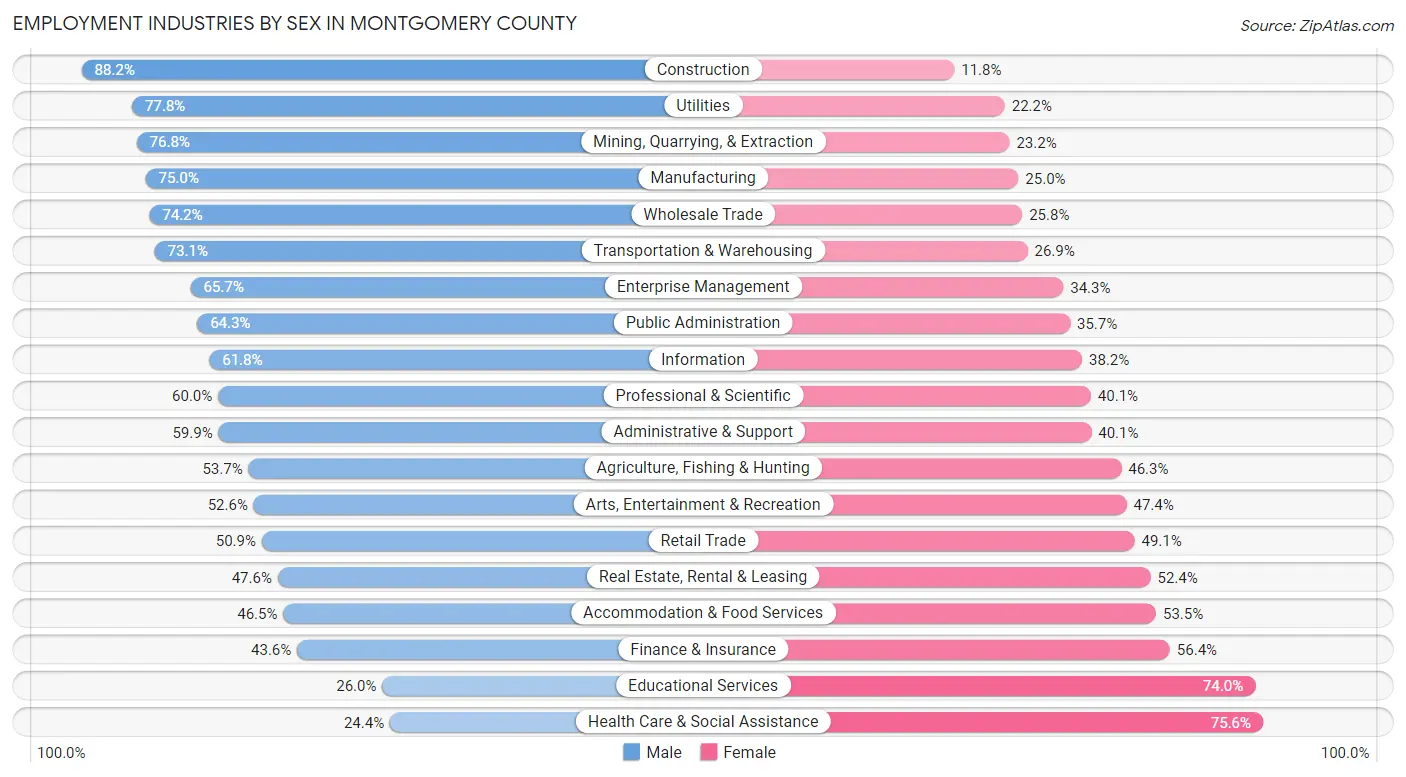
Employment Industries by Sex in Montgomery County
The Montgomery County industries that see more men than women are Construction (88.2%), Utilities (77.8%), and Mining, Quarrying, & Extraction (76.8%), whereas the industries that tend to have a higher number of women are Health Care & Social Assistance (75.6%), Educational Services (74.0%), and Finance & Insurance (56.4%).
| Industry | Male | Female |
| Agriculture, Fishing & Hunting | 498 (53.7%) | 430 (46.3%) |
| Mining, Quarrying, & Extraction | 9,987 (76.8%) | 3,017 (23.2%) |
| Construction | 24,837 (88.2%) | 3,316 (11.8%) |
| Manufacturing | 19,821 (75.0%) | 6,621 (25.0%) |
| Wholesale Trade | 7,669 (74.2%) | 2,671 (25.8%) |
| Retail Trade | 17,258 (50.9%) | 16,642 (49.1%) |
| Transportation & Warehousing | 13,014 (73.1%) | 4,796 (26.9%) |
| Utilities | 3,445 (77.8%) | 985 (22.2%) |
| Information | 2,556 (61.8%) | 1,582 (38.2%) |
| Finance & Insurance | 4,814 (43.6%) | 6,227 (56.4%) |
| Real Estate, Rental & Leasing | 2,793 (47.6%) | 3,075 (52.4%) |
| Professional & Scientific | 14,755 (60.0%) | 9,857 (40.1%) |
| Enterprise Management | 736 (65.7%) | 385 (34.3%) |
| Administrative & Support | 7,347 (59.9%) | 4,924 (40.1%) |
| Educational Services | 7,689 (26.0%) | 21,919 (74.0%) |
| Health Care & Social Assistance | 6,963 (24.4%) | 21,612 (75.6%) |
| Arts, Entertainment & Recreation | 2,422 (52.6%) | 2,185 (47.4%) |
| Accommodation & Food Services | 8,752 (46.5%) | 10,084 (53.5%) |
| Public Administration | 6,619 (64.3%) | 3,679 (35.7%) |
| Total | 169,957 (56.5%) | 131,058 (43.5%) |
Education in Montgomery County
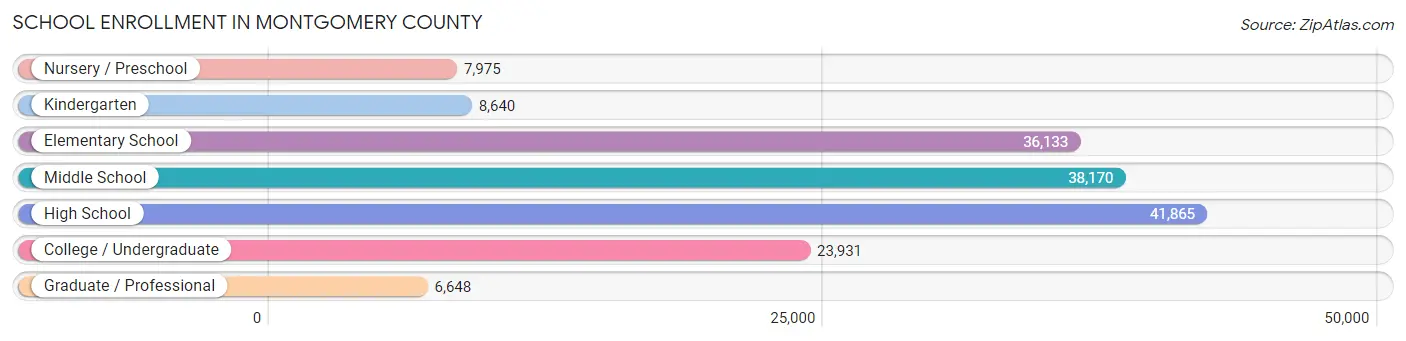
School Enrollment in Montgomery County
The most common levels of schooling among the 163,362 students in Montgomery County are high school (41,865 | 25.6%), middle school (38,170 | 23.4%), and elementary school (36,133 | 22.1%).
| School Level | # Students | % Students |
| Nursery / Preschool | 7,975 | 4.9% |
| Kindergarten | 8,640 | 5.3% |
| Elementary School | 36,133 | 22.1% |
| Middle School | 38,170 | 23.4% |
| High School | 41,865 | 25.6% |
| College / Undergraduate | 23,931 | 14.6% |
| Graduate / Professional | 6,648 | 4.1% |
| Total | 163,362 | 100.0% |
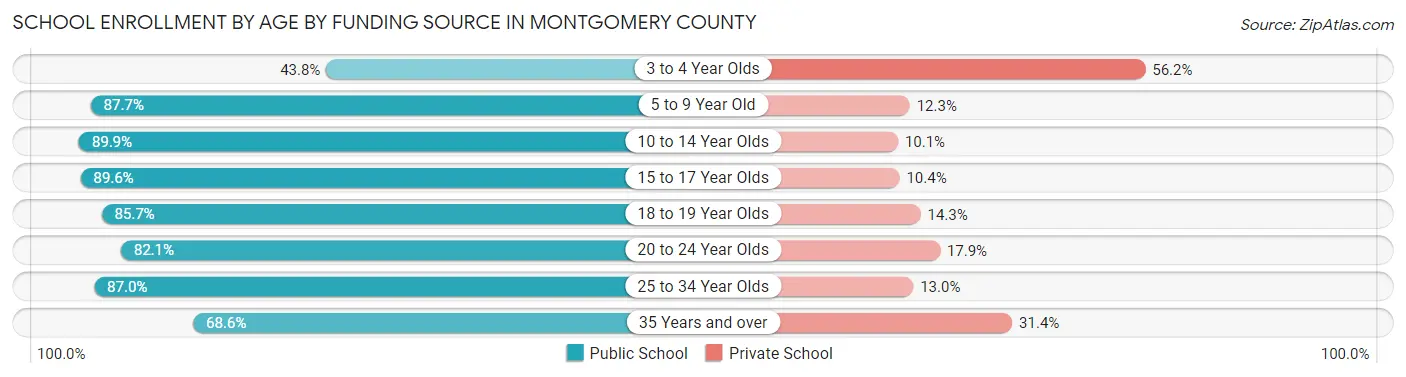
School Enrollment by Age by Funding Source in Montgomery County
Out of a total of 163,362 students who are enrolled in schools in Montgomery County, 23,524 (14.4%) attend a private institution, while the remaining 139,838 (85.6%) are enrolled in public schools. The age group of 3 to 4 year olds has the highest likelihood of being enrolled in private schools, with 3,348 (56.2% in the age bracket) enrolled. Conversely, the age group of 10 to 14 year olds has the lowest likelihood of being enrolled in a private school, with 43,281 (89.9% in the age bracket) attending a public institution.
| Age Bracket | Public School | Private School |
| 3 to 4 Year Olds | 2,611 (43.8%) | 3,348 (56.2%) |
| 5 to 9 Year Old | 36,893 (87.7%) | 5,175 (12.3%) |
| 10 to 14 Year Olds | 43,281 (89.9%) | 4,867 (10.1%) |
| 15 to 17 Year Olds | 25,518 (89.6%) | 2,963 (10.4%) |
| 18 to 19 Year Olds | 9,147 (85.7%) | 1,529 (14.3%) |
| 20 to 24 Year Olds | 11,192 (82.1%) | 2,445 (17.9%) |
| 25 to 34 Year Olds | 6,454 (87.0%) | 961 (13.0%) |
| 35 Years and over | 4,788 (68.6%) | 2,190 (31.4%) |
| Total | 139,838 (85.6%) | 23,524 (14.4%) |
Educational Attainment by Field of Study in Montgomery County
Business (41,600 | 25.2%), engineering (21,073 | 12.8%), education (18,136 | 11.0%), science & technology (14,221 | 8.6%), and arts & humanities (11,200 | 6.8%) are the most common fields of study among 164,819 individuals in Montgomery County who have obtained a bachelor's degree or higher.
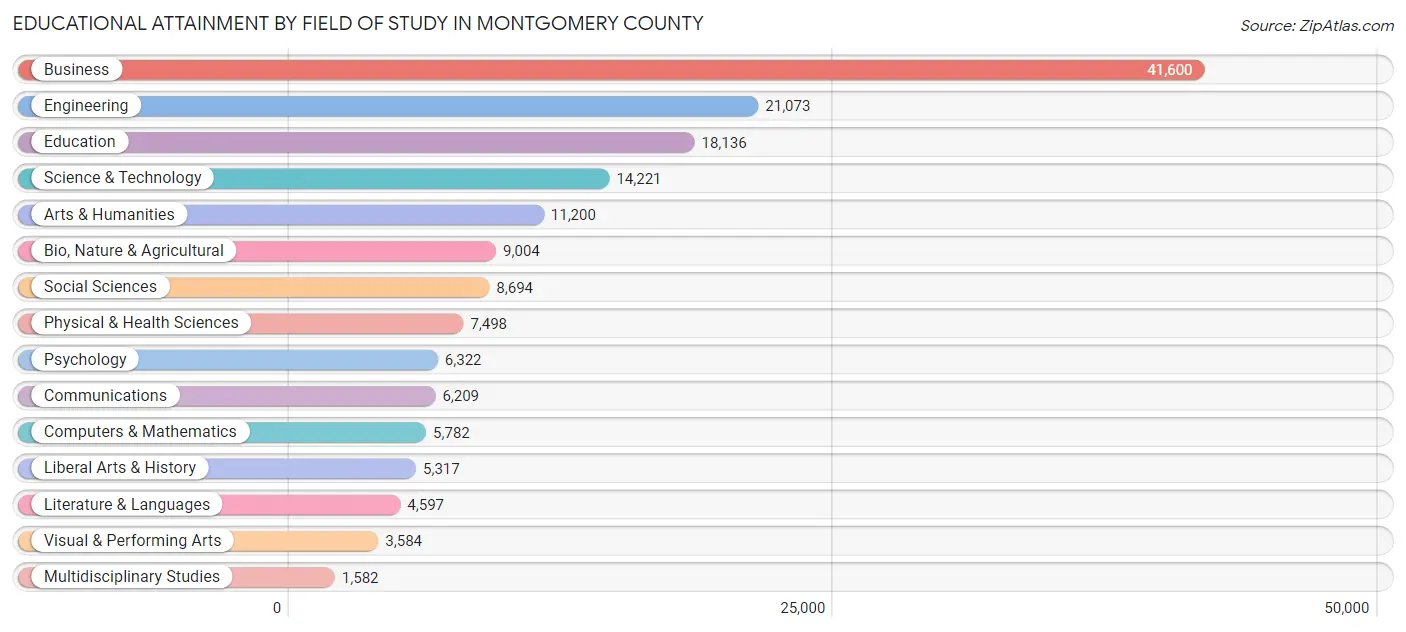
| Field of Study | # Graduates | % Graduates |
| Computers & Mathematics | 5,782 | 3.5% |
| Bio, Nature & Agricultural | 9,004 | 5.5% |
| Physical & Health Sciences | 7,498 | 4.5% |
| Psychology | 6,322 | 3.8% |
| Social Sciences | 8,694 | 5.3% |
| Engineering | 21,073 | 12.8% |
| Multidisciplinary Studies | 1,582 | 1.0% |
| Science & Technology | 14,221 | 8.6% |
| Business | 41,600 | 25.2% |
| Education | 18,136 | 11.0% |
| Literature & Languages | 4,597 | 2.8% |
| Liberal Arts & History | 5,317 | 3.2% |
| Visual & Performing Arts | 3,584 | 2.2% |
| Communications | 6,209 | 3.8% |
| Arts & Humanities | 11,200 | 6.8% |
| Total | 164,819 | 100.0% |
Transportation & Commute in Montgomery County
Vehicle Availability by Sex in Montgomery County
The most prevalent vehicle ownership categories in Montgomery County are males with 2 vehicles (77,602, accounting for 46.1%) and females with 2 vehicles (58,795, making up 60.3%).
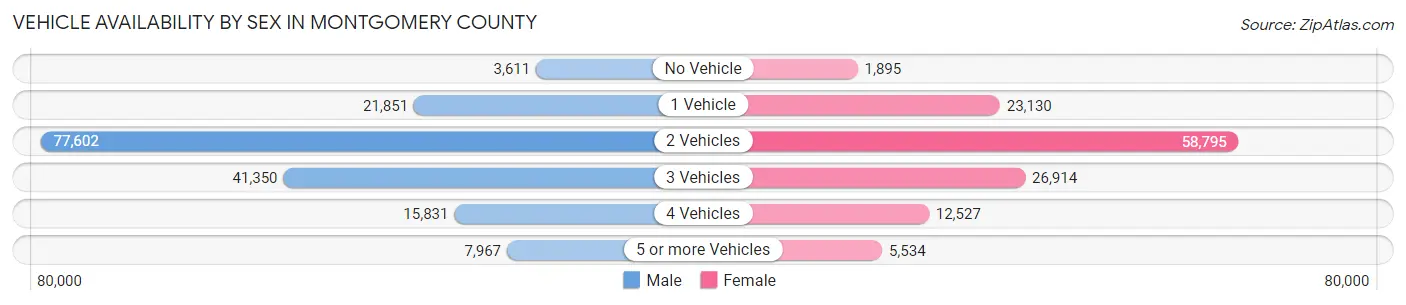
| Vehicles Available | Male | Female |
| No Vehicle | 3,611 (2.1%) | 1,895 (1.5%) |
| 1 Vehicle | 21,851 (13.0%) | 23,130 (18.0%) |
| 2 Vehicles | 77,602 (46.1%) | 58,795 (45.7%) |
| 3 Vehicles | 41,350 (24.6%) | 26,914 (20.9%) |
| 4 Vehicles | 15,831 (9.4%) | 12,527 (9.7%) |
| 5 or more Vehicles | 7,967 (4.7%) | 5,534 (4.3%) |
| Total | 168,212 (100.0%) | 128,795 (100.0%) |
Commute Time in Montgomery County
The most frequently occuring commute durations in Montgomery County are 30 to 34 minutes (38,779 commuters, 14.9%), 20 to 24 minutes (33,925 commuters, 13.0%), and 15 to 19 minutes (32,905 commuters, 12.6%).
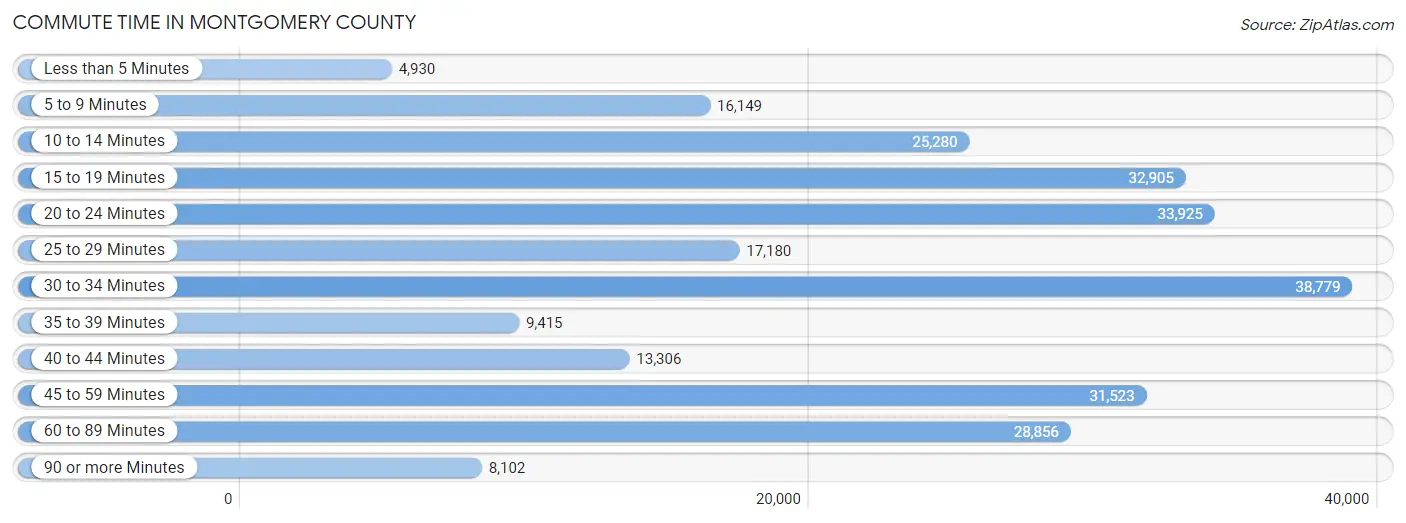
| Commute Time | # Commuters | % Commuters |
| Less than 5 Minutes | 4,930 | 1.9% |
| 5 to 9 Minutes | 16,149 | 6.2% |
| 10 to 14 Minutes | 25,280 | 9.7% |
| 15 to 19 Minutes | 32,905 | 12.6% |
| 20 to 24 Minutes | 33,925 | 13.0% |
| 25 to 29 Minutes | 17,180 | 6.6% |
| 30 to 34 Minutes | 38,779 | 14.9% |
| 35 to 39 Minutes | 9,415 | 3.6% |
| 40 to 44 Minutes | 13,306 | 5.1% |
| 45 to 59 Minutes | 31,523 | 12.1% |
| 60 to 89 Minutes | 28,856 | 11.1% |
| 90 or more Minutes | 8,102 | 3.1% |
Commute Time by Sex in Montgomery County
The most common commute times in Montgomery County are 30 to 34 minutes (22,555 commuters, 15.1%) for males and 20 to 24 minutes (16,961 commuters, 15.3%) for females.
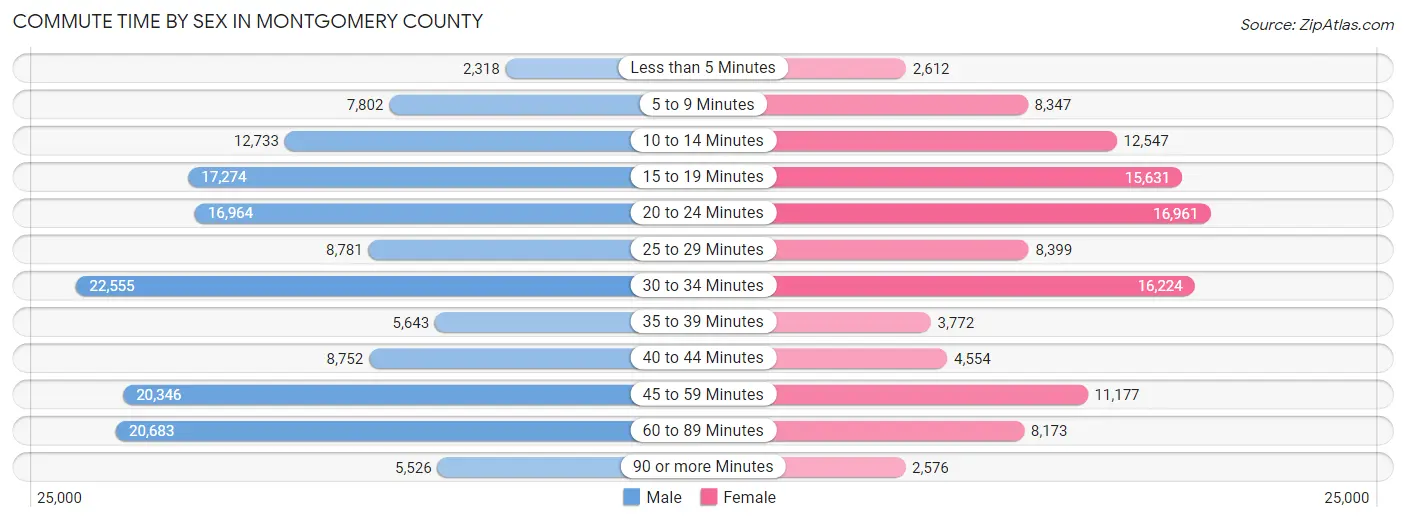
| Commute Time | Male | Female |
| Less than 5 Minutes | 2,318 (1.5%) | 2,612 (2.4%) |
| 5 to 9 Minutes | 7,802 (5.2%) | 8,347 (7.5%) |
| 10 to 14 Minutes | 12,733 (8.5%) | 12,547 (11.3%) |
| 15 to 19 Minutes | 17,274 (11.6%) | 15,631 (14.1%) |
| 20 to 24 Minutes | 16,964 (11.4%) | 16,961 (15.3%) |
| 25 to 29 Minutes | 8,781 (5.9%) | 8,399 (7.6%) |
| 30 to 34 Minutes | 22,555 (15.1%) | 16,224 (14.6%) |
| 35 to 39 Minutes | 5,643 (3.8%) | 3,772 (3.4%) |
| 40 to 44 Minutes | 8,752 (5.9%) | 4,554 (4.1%) |
| 45 to 59 Minutes | 20,346 (13.6%) | 11,177 (10.1%) |
| 60 to 89 Minutes | 20,683 (13.9%) | 8,173 (7.4%) |
| 90 or more Minutes | 5,526 (3.7%) | 2,576 (2.3%) |
Time of Departure to Work by Sex in Montgomery County
The most frequent times of departure to work in Montgomery County are 7:00 AM to 7:29 AM (26,505, 17.7%) for males and 7:00 AM to 7:29 AM (19,968, 18.0%) for females.
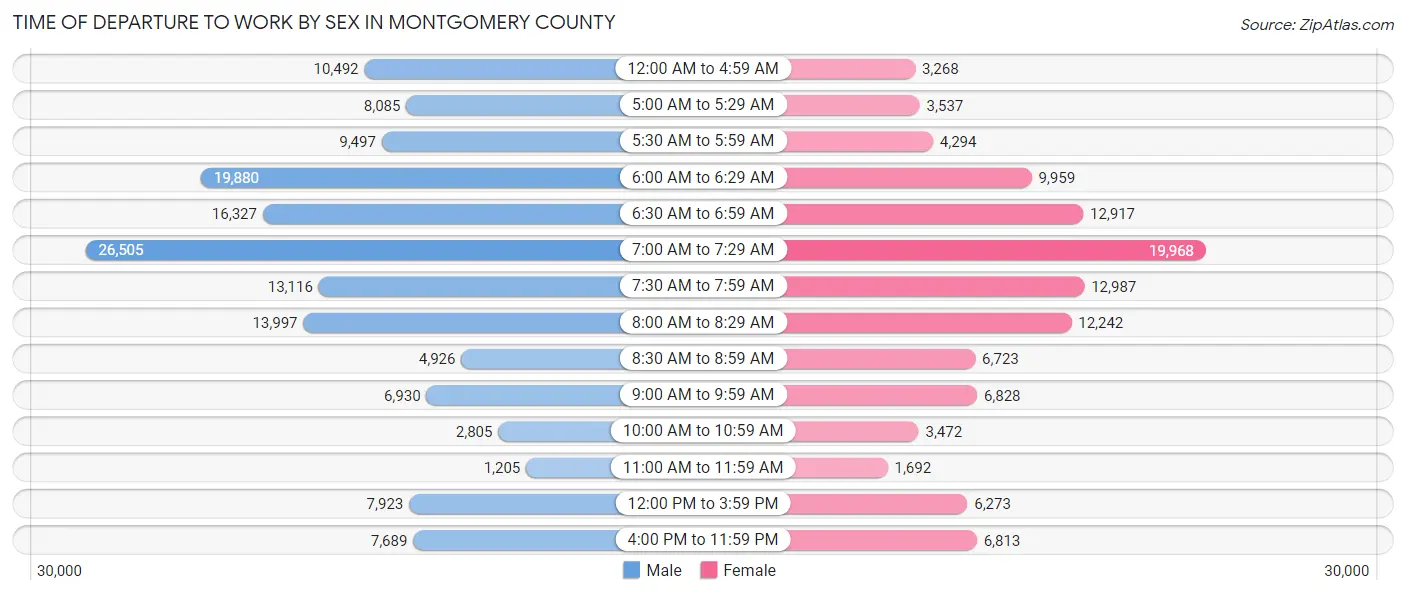
| Time of Departure | Male | Female |
| 12:00 AM to 4:59 AM | 10,492 (7.0%) | 3,268 (2.9%) |
| 5:00 AM to 5:29 AM | 8,085 (5.4%) | 3,537 (3.2%) |
| 5:30 AM to 5:59 AM | 9,497 (6.4%) | 4,294 (3.9%) |
| 6:00 AM to 6:29 AM | 19,880 (13.3%) | 9,959 (9.0%) |
| 6:30 AM to 6:59 AM | 16,327 (10.9%) | 12,917 (11.6%) |
| 7:00 AM to 7:29 AM | 26,505 (17.7%) | 19,968 (18.0%) |
| 7:30 AM to 7:59 AM | 13,116 (8.8%) | 12,987 (11.7%) |
| 8:00 AM to 8:29 AM | 13,997 (9.4%) | 12,242 (11.0%) |
| 8:30 AM to 8:59 AM | 4,926 (3.3%) | 6,723 (6.1%) |
| 9:00 AM to 9:59 AM | 6,930 (4.6%) | 6,828 (6.1%) |
| 10:00 AM to 10:59 AM | 2,805 (1.9%) | 3,472 (3.1%) |
| 11:00 AM to 11:59 AM | 1,205 (0.8%) | 1,692 (1.5%) |
| 12:00 PM to 3:59 PM | 7,923 (5.3%) | 6,273 (5.7%) |
| 4:00 PM to 11:59 PM | 7,689 (5.1%) | 6,813 (6.1%) |
| Total | 149,377 (100.0%) | 110,973 (100.0%) |
Housing Occupancy in Montgomery County
Occupancy by Ownership in Montgomery County
Of the total 224,474 dwellings in Montgomery County, owner-occupied units account for 163,258 (72.7%), while renter-occupied units make up 61,216 (27.3%).
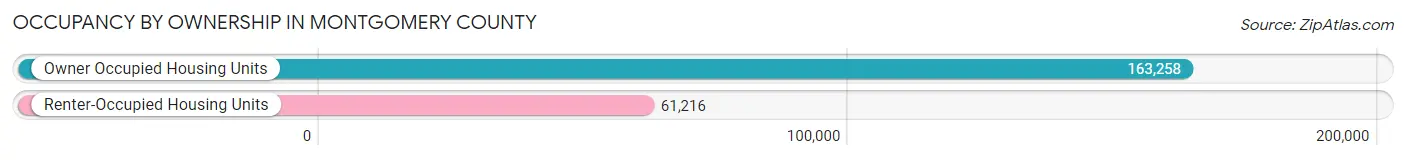
| Occupancy | # Housing Units | % Housing Units |
| Owner Occupied Housing Units | 163,258 | 72.7% |
| Renter-Occupied Housing Units | 61,216 | 27.3% |
| Total Occupied Housing Units | 224,474 | 100.0% |
Occupancy by Household Size in Montgomery County
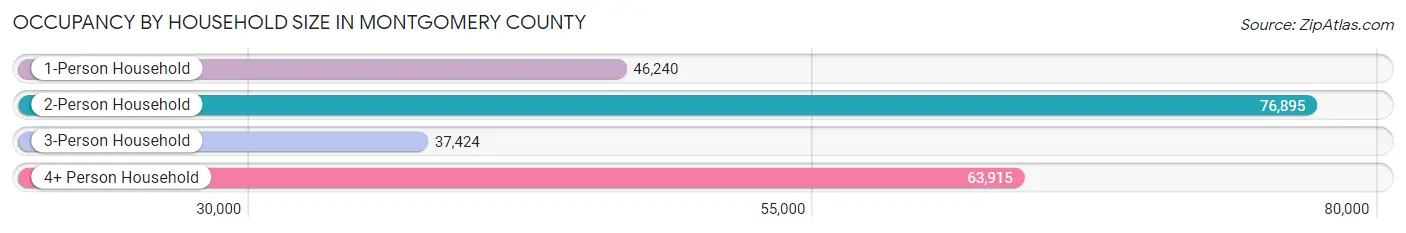
| Household Size | # Housing Units | % Housing Units |
| 1-Person Household | 46,240 | 20.6% |
| 2-Person Household | 76,895 | 34.3% |
| 3-Person Household | 37,424 | 16.7% |
| 4+ Person Household | 63,915 | 28.5% |
| Total Housing Units | 224,474 | 100.0% |
Occupancy by Ownership by Household Size in Montgomery County
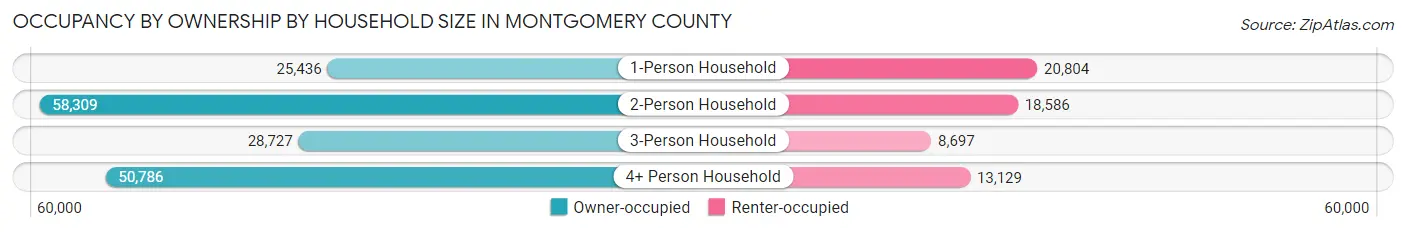
| Household Size | Owner-occupied | Renter-occupied |
| 1-Person Household | 25,436 (55.0%) | 20,804 (45.0%) |
| 2-Person Household | 58,309 (75.8%) | 18,586 (24.2%) |
| 3-Person Household | 28,727 (76.8%) | 8,697 (23.2%) |
| 4+ Person Household | 50,786 (79.5%) | 13,129 (20.5%) |
| Total Housing Units | 163,258 (72.7%) | 61,216 (27.3%) |
Occupancy by Educational Attainment in Montgomery County
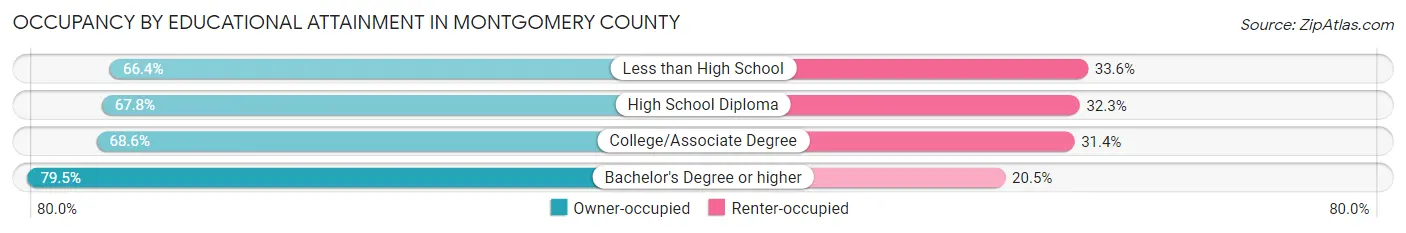
| Household Size | Owner-occupied | Renter-occupied |
| Less than High School | 13,257 (66.4%) | 6,696 (33.6%) |
| High School Diploma | 29,469 (67.7%) | 14,029 (32.3%) |
| College/Associate Degree | 47,248 (68.6%) | 21,639 (31.4%) |
| Bachelor's Degree or higher | 73,284 (79.5%) | 18,852 (20.5%) |
Occupancy by Age of Householder in Montgomery County
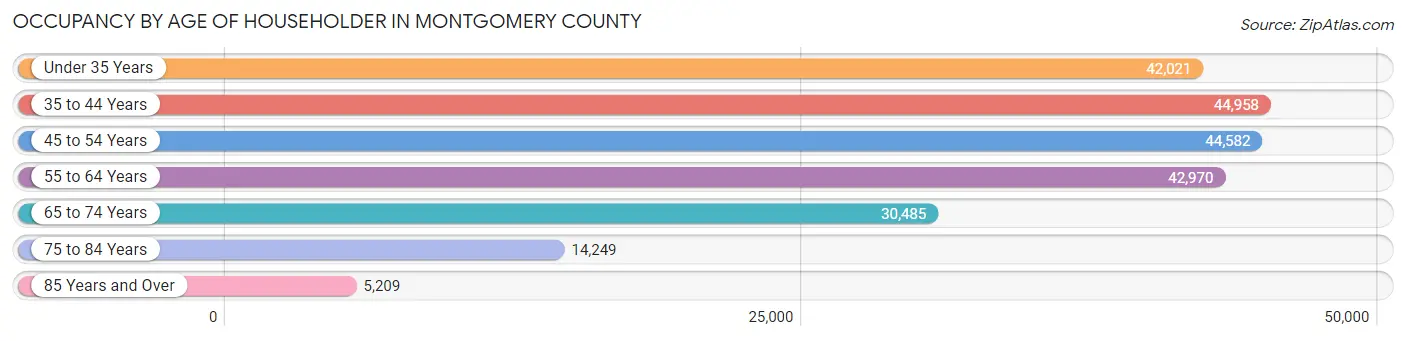
| Age Bracket | # Households | % Households |
| Under 35 Years | 42,021 | 18.7% |
| 35 to 44 Years | 44,958 | 20.0% |
| 45 to 54 Years | 44,582 | 19.9% |
| 55 to 64 Years | 42,970 | 19.1% |
| 65 to 74 Years | 30,485 | 13.6% |
| 75 to 84 Years | 14,249 | 6.4% |
| 85 Years and Over | 5,209 | 2.3% |
| Total | 224,474 | 100.0% |
Housing Finances in Montgomery County
Median Income by Occupancy in Montgomery County
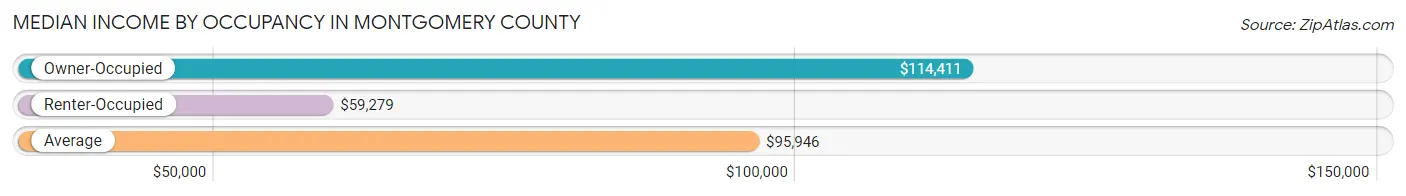
| Occupancy Type | # Households | Median Income |
| Owner-Occupied | 163,258 (72.7%) | $114,411 |
| Renter-Occupied | 61,216 (27.3%) | $59,279 |
| Average | 224,474 (100.0%) | $95,946 |
Occupancy by Householder Income Bracket in Montgomery County
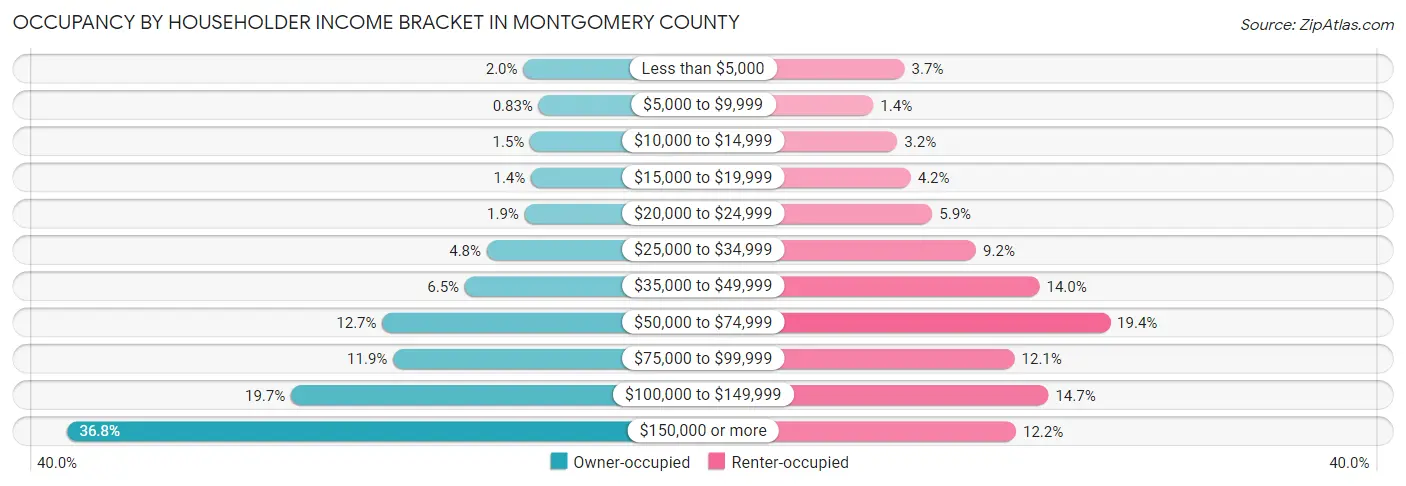
| Income Bracket | Owner-occupied | Renter-occupied |
| Less than $5,000 | 3,265 (2.0%) | 2,288 (3.7%) |
| $5,000 to $9,999 | 1,357 (0.8%) | 833 (1.4%) |
| $10,000 to $14,999 | 2,413 (1.5%) | 1,950 (3.2%) |
| $15,000 to $19,999 | 2,294 (1.4%) | 2,575 (4.2%) |
| $20,000 to $24,999 | 3,101 (1.9%) | 3,584 (5.9%) |
| $25,000 to $34,999 | 7,810 (4.8%) | 5,627 (9.2%) |
| $35,000 to $49,999 | 10,526 (6.5%) | 8,581 (14.0%) |
| $50,000 to $74,999 | 20,791 (12.7%) | 11,877 (19.4%) |
| $75,000 to $99,999 | 19,463 (11.9%) | 7,418 (12.1%) |
| $100,000 to $149,999 | 32,161 (19.7%) | 8,996 (14.7%) |
| $150,000 or more | 60,077 (36.8%) | 7,487 (12.2%) |
| Total | 163,258 (100.0%) | 61,216 (100.0%) |
Monthly Housing Cost Tiers in Montgomery County
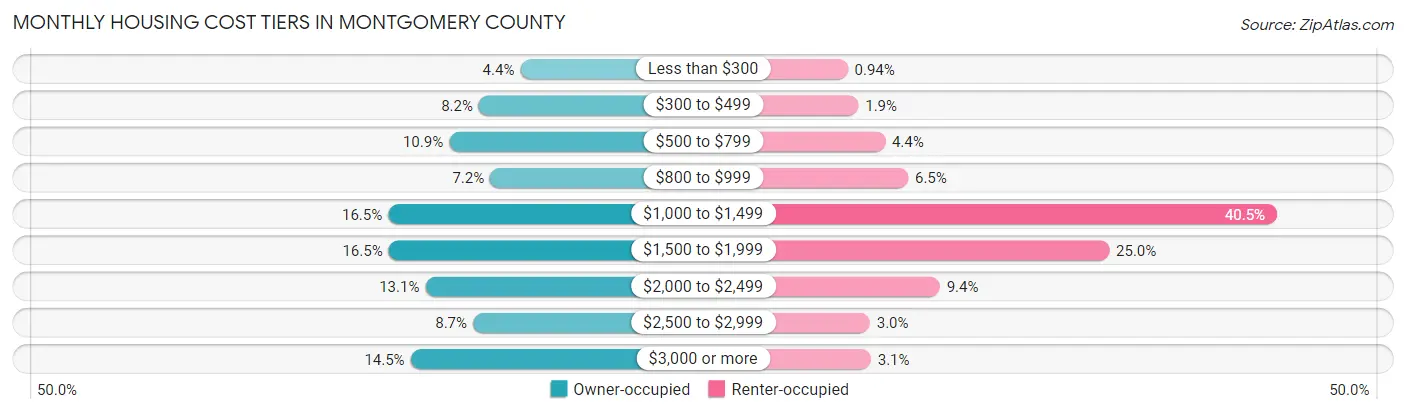
| Monthly Cost | Owner-occupied | Renter-occupied |
| Less than $300 | 7,132 (4.4%) | 575 (0.9%) |
| $300 to $499 | 13,375 (8.2%) | 1,174 (1.9%) |
| $500 to $799 | 17,841 (10.9%) | 2,679 (4.4%) |
| $800 to $999 | 11,666 (7.1%) | 3,976 (6.5%) |
| $1,000 to $1,499 | 27,003 (16.5%) | 24,766 (40.5%) |
| $1,500 to $1,999 | 26,931 (16.5%) | 15,310 (25.0%) |
| $2,000 to $2,499 | 21,419 (13.1%) | 5,764 (9.4%) |
| $2,500 to $2,999 | 14,253 (8.7%) | 1,822 (3.0%) |
| $3,000 or more | 23,638 (14.5%) | 1,878 (3.1%) |
| Total | 163,258 (100.0%) | 61,216 (100.0%) |
Physical Housing Characteristics in Montgomery County
Housing Structures in Montgomery County

| Structure Type | # Housing Units | % Housing Units |
| Single Unit, Detached | 155,719 | 69.4% |
| Single Unit, Attached | 5,304 | 2.4% |
| 2 Unit Apartments | 1,033 | 0.5% |
| 3 or 4 Unit Apartments | 2,503 | 1.1% |
| 5 to 9 Unit Apartments | 4,383 | 1.9% |
| 10 or more Apartments | 27,887 | 12.4% |
| Mobile Home / Other | 27,645 | 12.3% |
| Total | 224,474 | 100.0% |
Housing Structures by Occupancy in Montgomery County
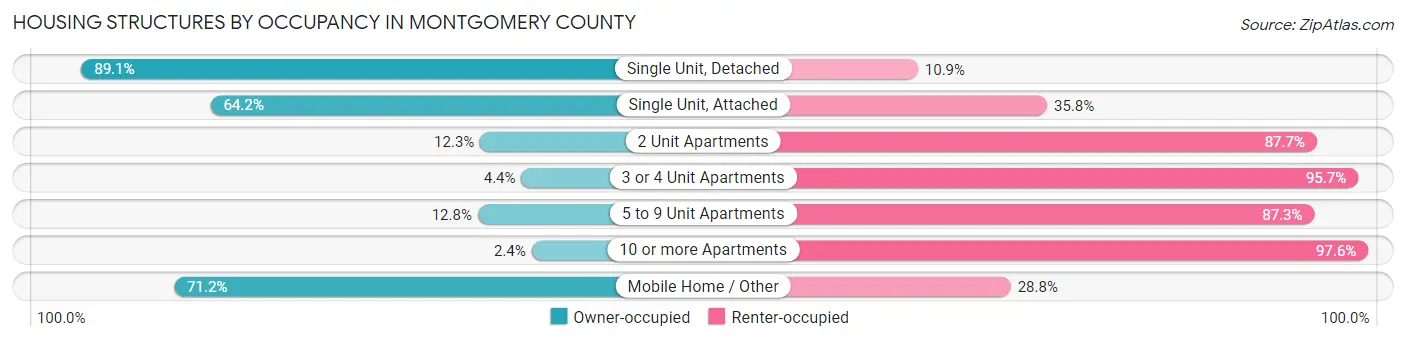
| Structure Type | Owner-occupied | Renter-occupied |
| Single Unit, Detached | 138,710 (89.1%) | 17,009 (10.9%) |
| Single Unit, Attached | 3,405 (64.2%) | 1,899 (35.8%) |
| 2 Unit Apartments | 127 (12.3%) | 906 (87.7%) |
| 3 or 4 Unit Apartments | 109 (4.3%) | 2,394 (95.7%) |
| 5 to 9 Unit Apartments | 559 (12.8%) | 3,824 (87.3%) |
| 10 or more Apartments | 666 (2.4%) | 27,221 (97.6%) |
| Mobile Home / Other | 19,682 (71.2%) | 7,963 (28.8%) |
| Total | 163,258 (72.7%) | 61,216 (27.3%) |
Housing Structures by Number of Rooms in Montgomery County
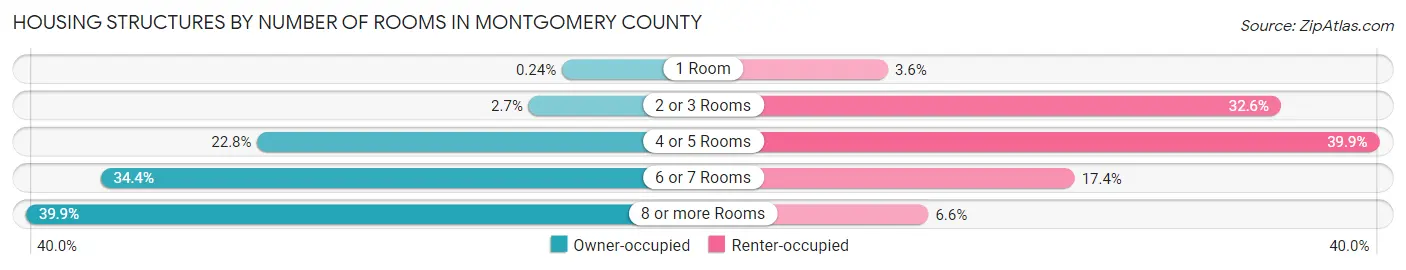
| Number of Rooms | Owner-occupied | Renter-occupied |
| 1 Room | 384 (0.2%) | 2,179 (3.6%) |
| 2 or 3 Rooms | 4,400 (2.7%) | 19,969 (32.6%) |
| 4 or 5 Rooms | 37,195 (22.8%) | 24,427 (39.9%) |
| 6 or 7 Rooms | 56,130 (34.4%) | 10,632 (17.4%) |
| 8 or more Rooms | 65,149 (39.9%) | 4,009 (6.6%) |
| Total | 163,258 (100.0%) | 61,216 (100.0%) |
Housing Structure by Heating Type in Montgomery County
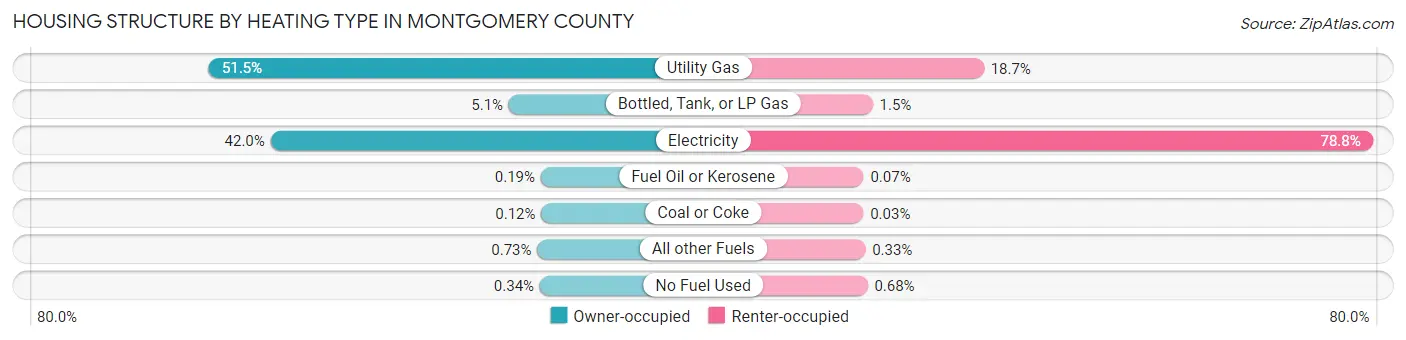
| Heating Type | Owner-occupied | Renter-occupied |
| Utility Gas | 84,090 (51.5%) | 11,415 (18.6%) |
| Bottled, Tank, or LP Gas | 8,383 (5.1%) | 908 (1.5%) |
| Electricity | 68,519 (42.0%) | 48,211 (78.8%) |
| Fuel Oil or Kerosene | 317 (0.2%) | 45 (0.1%) |
| Coal or Coke | 203 (0.1%) | 17 (0.0%) |
| All other Fuels | 1,197 (0.7%) | 203 (0.3%) |
| No Fuel Used | 549 (0.3%) | 417 (0.7%) |
| Total | 163,258 (100.0%) | 61,216 (100.0%) |
Household Vehicle Usage in Montgomery County
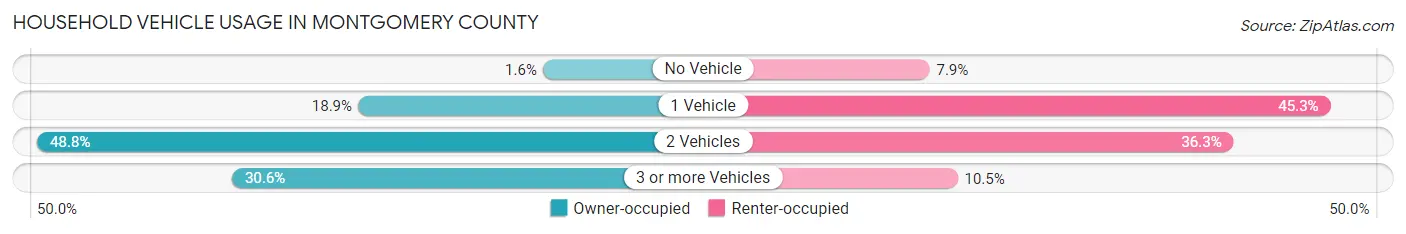
| Vehicles per Household | Owner-occupied | Renter-occupied |
| No Vehicle | 2,663 (1.6%) | 4,836 (7.9%) |
| 1 Vehicle | 30,838 (18.9%) | 27,744 (45.3%) |
| 2 Vehicles | 79,740 (48.8%) | 22,205 (36.3%) |
| 3 or more Vehicles | 50,017 (30.6%) | 6,431 (10.5%) |
| Total | 163,258 (100.0%) | 61,216 (100.0%) |
Real Estate & Mortgages in Montgomery County
Real Estate and Mortgage Overview in Montgomery County
| Characteristic | Without Mortgage | With Mortgage |
| Housing Units | 62,385 | 100,873 |
| Median Property Value | $250,500 | $317,400 |
| Median Household Income | $81,347 | $43,198 |
| Monthly Housing Costs | $714 | $23,022 |
| Real Estate Taxes | $3,708 | $3,253 |
Property Value by Mortgage Status in Montgomery County
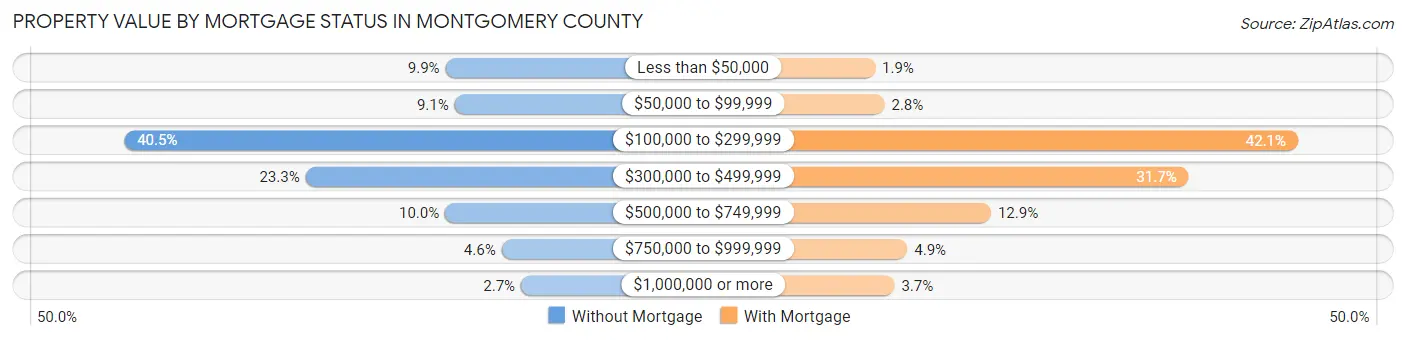
| Property Value | Without Mortgage | With Mortgage |
| Less than $50,000 | 6,188 (9.9%) | 1,877 (1.9%) |
| $50,000 to $99,999 | 5,643 (9.0%) | 2,788 (2.8%) |
| $100,000 to $299,999 | 25,274 (40.5%) | 42,487 (42.1%) |
| $300,000 to $499,999 | 14,504 (23.3%) | 31,994 (31.7%) |
| $500,000 to $749,999 | 6,213 (10.0%) | 13,013 (12.9%) |
| $750,000 to $999,999 | 2,860 (4.6%) | 4,972 (4.9%) |
| $1,000,000 or more | 1,703 (2.7%) | 3,742 (3.7%) |
| Total | 62,385 (100.0%) | 100,873 (100.0%) |
Household Income by Mortgage Status in Montgomery County
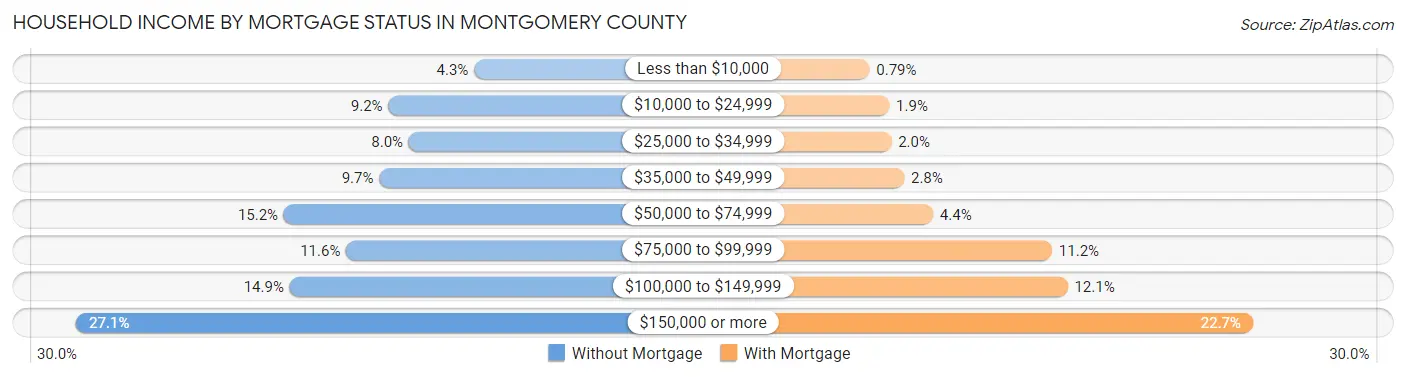
| Household Income | Without Mortgage | With Mortgage |
| Less than $10,000 | 2,689 (4.3%) | 795 (0.8%) |
| $10,000 to $24,999 | 5,748 (9.2%) | 1,933 (1.9%) |
| $25,000 to $34,999 | 5,014 (8.0%) | 2,060 (2.0%) |
| $35,000 to $49,999 | 6,068 (9.7%) | 2,796 (2.8%) |
| $50,000 to $74,999 | 9,471 (15.2%) | 4,458 (4.4%) |
| $75,000 to $99,999 | 7,252 (11.6%) | 11,320 (11.2%) |
| $100,000 to $149,999 | 9,264 (14.8%) | 12,211 (12.1%) |
| $150,000 or more | 16,879 (27.1%) | 22,897 (22.7%) |
| Total | 62,385 (100.0%) | 100,873 (100.0%) |
Property Value to Household Income Ratio in Montgomery County
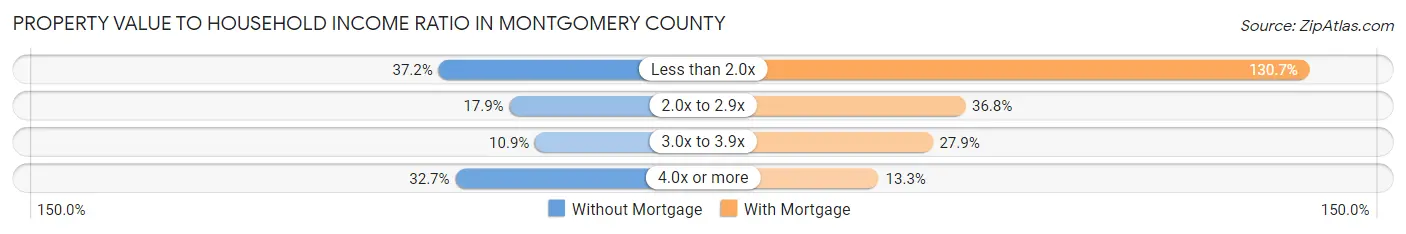
| Value-to-Income Ratio | Without Mortgage | With Mortgage |
| Less than 2.0x | 23,228 (37.2%) | 131,818 (130.7%) |
| 2.0x to 2.9x | 11,181 (17.9%) | 37,125 (36.8%) |
| 3.0x to 3.9x | 6,815 (10.9%) | 28,180 (27.9%) |
| 4.0x or more | 20,369 (32.7%) | 13,386 (13.3%) |
| Total | 62,385 (100.0%) | 100,873 (100.0%) |
Real Estate Taxes by Mortgage Status in Montgomery County
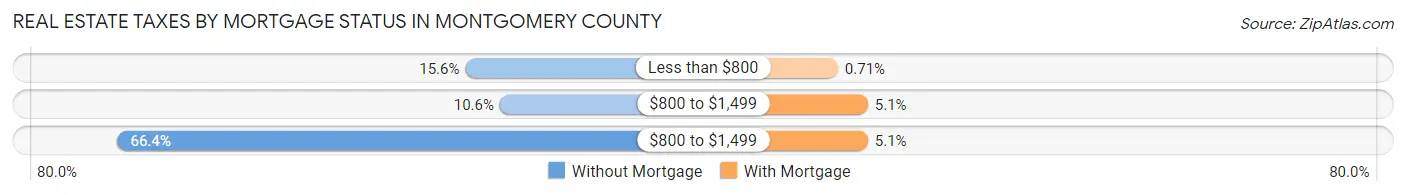
| Property Taxes | Without Mortgage | With Mortgage |
| Less than $800 | 9,737 (15.6%) | 718 (0.7%) |
| $800 to $1,499 | 6,585 (10.6%) | 5,124 (5.1%) |
| $800 to $1,499 | 41,432 (66.4%) | 5,134 (5.1%) |
| Total | 62,385 (100.0%) | 100,873 (100.0%) |
Health & Disability in Montgomery County
Health Insurance Coverage by Age in Montgomery County
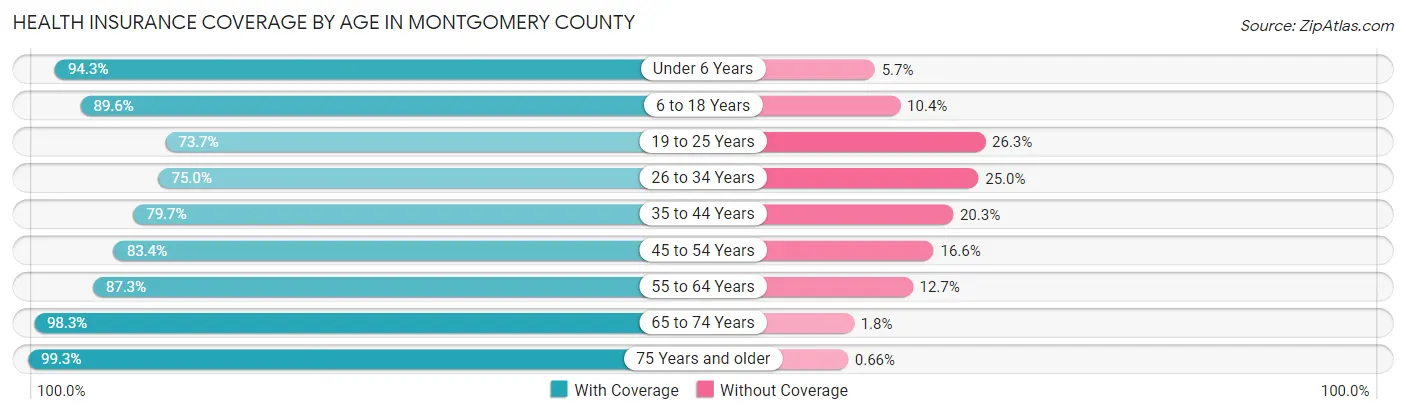
| Age Bracket | With Coverage | Without Coverage |
| Under 6 Years | 46,406 (94.3%) | 2,788 (5.7%) |
| 6 to 18 Years | 110,455 (89.6%) | 12,855 (10.4%) |
| 19 to 25 Years | 38,466 (73.7%) | 13,696 (26.3%) |
| 26 to 34 Years | 53,494 (75.0%) | 17,825 (25.0%) |
| 35 to 44 Years | 69,822 (79.7%) | 17,750 (20.3%) |
| 45 to 54 Years | 69,741 (83.4%) | 13,922 (16.6%) |
| 55 to 64 Years | 66,689 (87.3%) | 9,731 (12.7%) |
| 65 to 74 Years | 51,854 (98.3%) | 921 (1.8%) |
| 75 Years and older | 30,500 (99.3%) | 202 (0.7%) |
| Total | 537,427 (85.7%) | 89,690 (14.3%) |
Health Insurance Coverage by Citizenship Status in Montgomery County
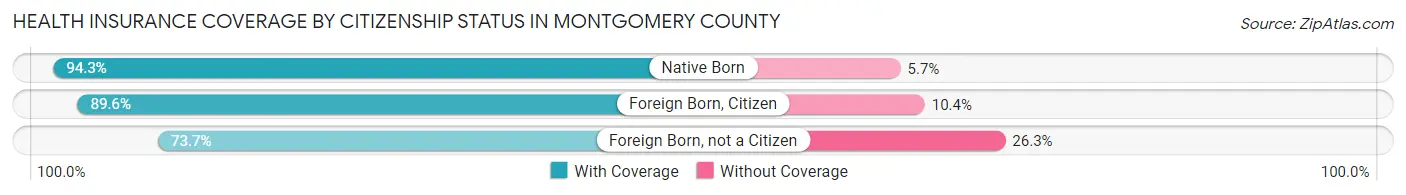
| Citizenship Status | With Coverage | Without Coverage |
| Native Born | 46,406 (94.3%) | 2,788 (5.7%) |
| Foreign Born, Citizen | 110,455 (89.6%) | 12,855 (10.4%) |
| Foreign Born, not a Citizen | 38,466 (73.7%) | 13,696 (26.3%) |
Health Insurance Coverage by Household Income in Montgomery County
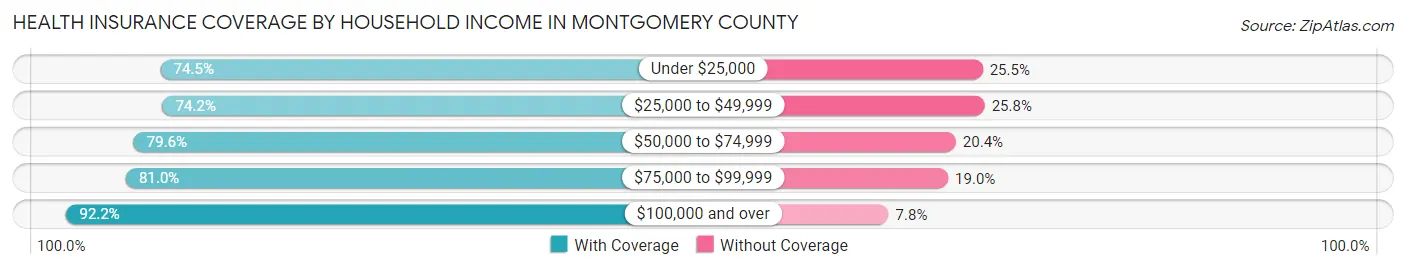
| Household Income | With Coverage | Without Coverage |
| Under $25,000 | 32,113 (74.5%) | 10,972 (25.5%) |
| $25,000 to $49,999 | 56,779 (74.2%) | 19,781 (25.8%) |
| $50,000 to $74,999 | 66,864 (79.6%) | 17,174 (20.4%) |
| $75,000 to $99,999 | 61,013 (81.0%) | 14,303 (19.0%) |
| $100,000 and over | 320,228 (92.2%) | 27,255 (7.8%) |
Public vs Private Health Insurance Coverage by Age in Montgomery County
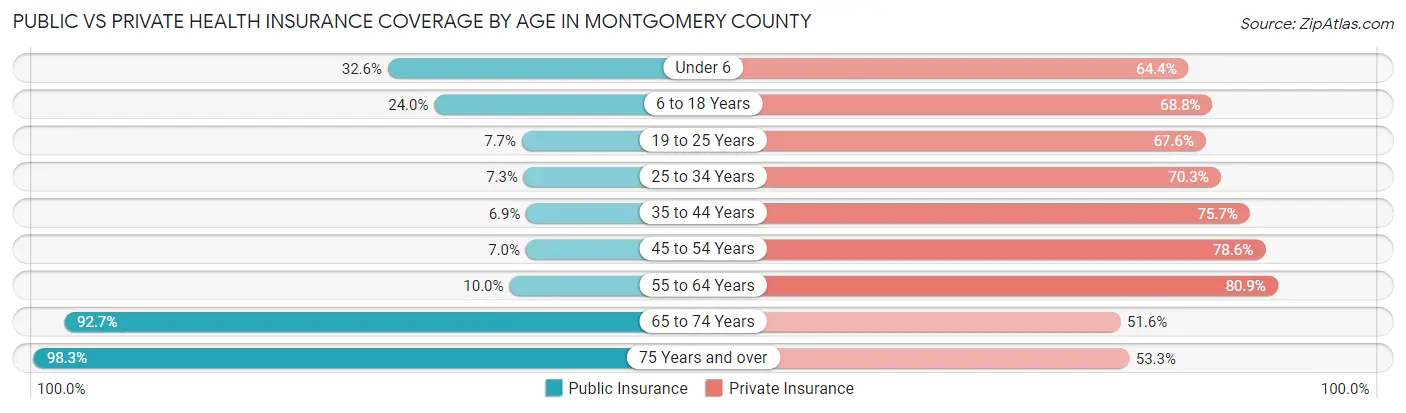
| Age Bracket | Public Insurance | Private Insurance |
| Under 6 | 16,034 (32.6%) | 31,662 (64.4%) |
| 6 to 18 Years | 29,530 (23.9%) | 84,813 (68.8%) |
| 19 to 25 Years | 4,016 (7.7%) | 35,238 (67.5%) |
| 25 to 34 Years | 5,234 (7.3%) | 50,129 (70.3%) |
| 35 to 44 Years | 6,021 (6.9%) | 66,296 (75.7%) |
| 45 to 54 Years | 5,825 (7.0%) | 65,730 (78.6%) |
| 55 to 64 Years | 7,655 (10.0%) | 61,822 (80.9%) |
| 65 to 74 Years | 48,899 (92.7%) | 27,252 (51.6%) |
| 75 Years and over | 30,177 (98.3%) | 16,356 (53.3%) |
| Total | 153,391 (24.5%) | 439,298 (70.1%) |
Disability Status by Sex by Age in Montgomery County
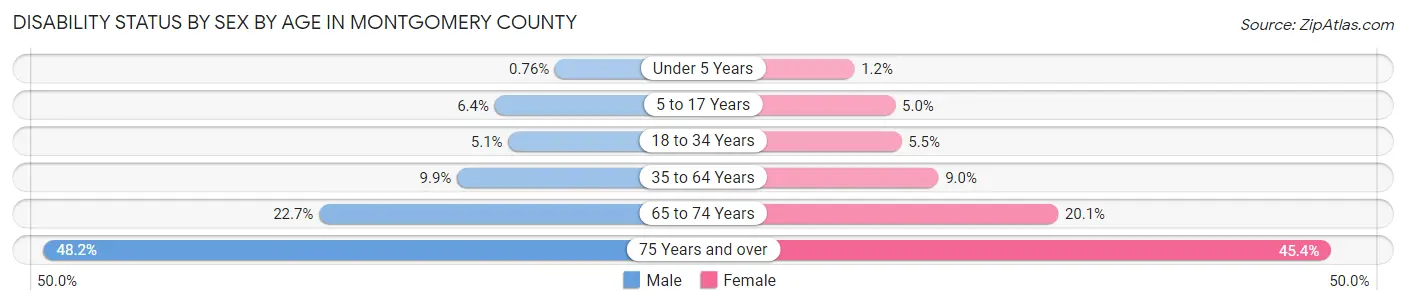
| Age Bracket | Male | Female |
| Under 5 Years | 157 (0.8%) | 226 (1.1%) |
| 5 to 17 Years | 3,986 (6.4%) | 2,982 (5.0%) |
| 18 to 34 Years | 3,400 (5.1%) | 3,650 (5.5%) |
| 35 to 64 Years | 12,235 (9.9%) | 11,051 (8.9%) |
| 65 to 74 Years | 5,718 (22.7%) | 5,525 (20.1%) |
| 75 Years and over | 6,322 (48.2%) | 7,987 (45.4%) |
Disability Class by Sex by Age in Montgomery County
Disability Class: Hearing Difficulty
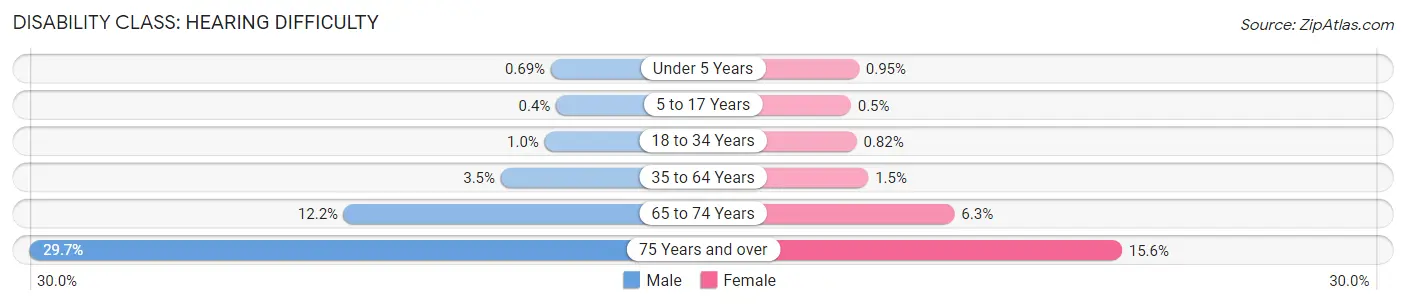
| Age Bracket | Male | Female |
| Under 5 Years | 142 (0.7%) | 187 (0.9%) |
| 5 to 17 Years | 253 (0.4%) | 303 (0.5%) |
| 18 to 34 Years | 691 (1.0%) | 541 (0.8%) |
| 35 to 64 Years | 4,325 (3.5%) | 1,817 (1.5%) |
| 65 to 74 Years | 3,084 (12.2%) | 1,727 (6.3%) |
| 75 Years and over | 3,893 (29.7%) | 2,742 (15.6%) |
Disability Class: Vision Difficulty
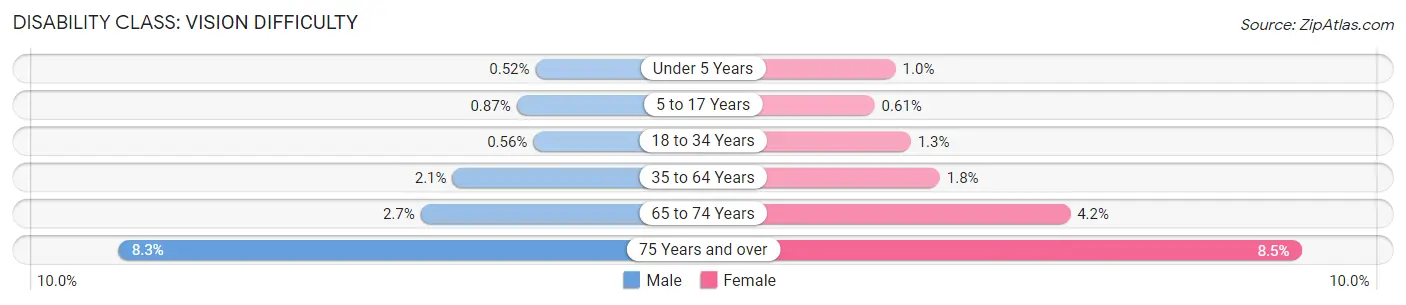
| Age Bracket | Male | Female |
| Under 5 Years | 106 (0.5%) | 197 (1.0%) |
| 5 to 17 Years | 547 (0.9%) | 368 (0.6%) |
| 18 to 34 Years | 374 (0.6%) | 844 (1.3%) |
| 35 to 64 Years | 2,554 (2.1%) | 2,248 (1.8%) |
| 65 to 74 Years | 669 (2.6%) | 1,169 (4.2%) |
| 75 Years and over | 1,081 (8.3%) | 1,500 (8.5%) |
Disability Class: Cognitive Difficulty
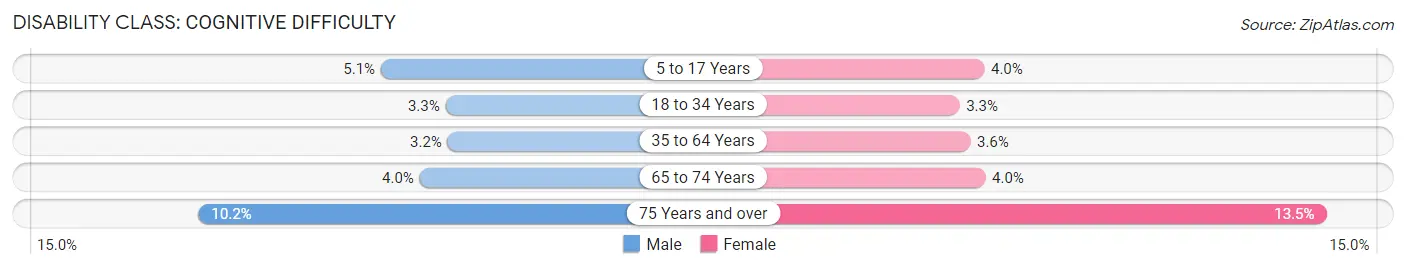
| Age Bracket | Male | Female |
| 5 to 17 Years | 3,181 (5.1%) | 2,387 (4.0%) |
| 18 to 34 Years | 2,186 (3.3%) | 2,160 (3.3%) |
| 35 to 64 Years | 3,997 (3.2%) | 4,404 (3.6%) |
| 65 to 74 Years | 1,009 (4.0%) | 1,099 (4.0%) |
| 75 Years and over | 1,332 (10.2%) | 2,374 (13.5%) |
Disability Class: Ambulatory Difficulty
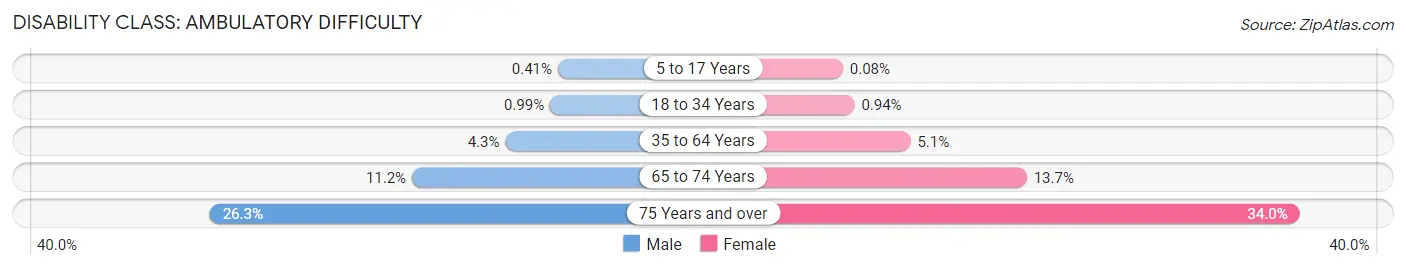
| Age Bracket | Male | Female |
| 5 to 17 Years | 256 (0.4%) | 46 (0.1%) |
| 18 to 34 Years | 659 (1.0%) | 623 (0.9%) |
| 35 to 64 Years | 5,349 (4.3%) | 6,299 (5.1%) |
| 65 to 74 Years | 2,837 (11.2%) | 3,781 (13.7%) |
| 75 Years and over | 3,441 (26.3%) | 5,980 (34.0%) |
Disability Class: Self-Care Difficulty
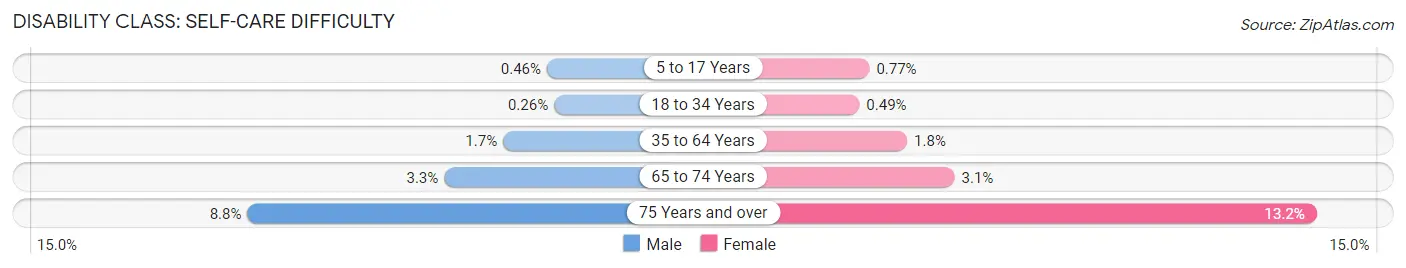
| Age Bracket | Male | Female |
| 5 to 17 Years | 288 (0.5%) | 465 (0.8%) |
| 18 to 34 Years | 172 (0.3%) | 327 (0.5%) |
| 35 to 64 Years | 2,085 (1.7%) | 2,253 (1.8%) |
| 65 to 74 Years | 837 (3.3%) | 865 (3.1%) |
| 75 Years and over | 1,153 (8.8%) | 2,326 (13.2%) |
Technology Access in Montgomery County
Computing Device Access in Montgomery County
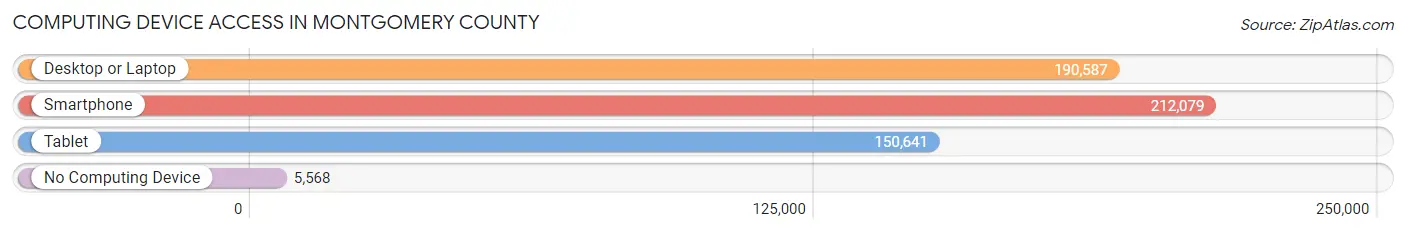
| Device Type | # Households | % Households |
| Desktop or Laptop | 190,587 | 84.9% |
| Smartphone | 212,079 | 94.5% |
| Tablet | 150,641 | 67.1% |
| No Computing Device | 5,568 | 2.5% |
| Total | 224,474 | 100.0% |
Internet Access in Montgomery County
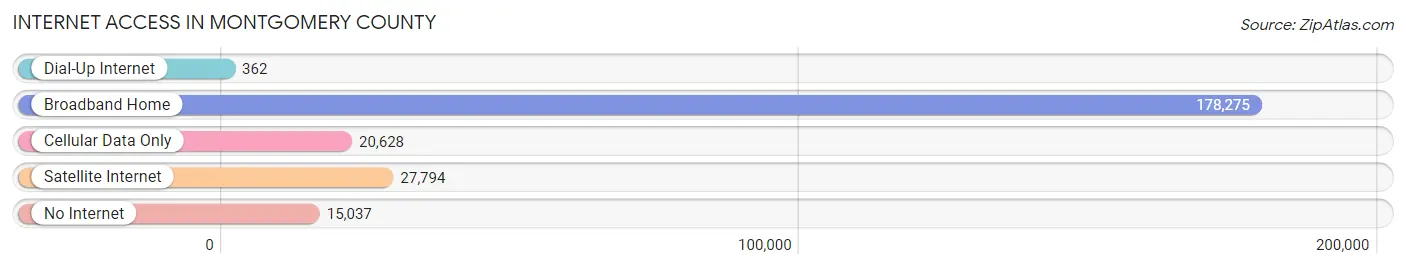
| Internet Type | # Households | % Households |
| Dial-Up Internet | 362 | 0.2% |
| Broadband Home | 178,275 | 79.4% |
| Cellular Data Only | 20,628 | 9.2% |
| Satellite Internet | 27,794 | 12.4% |
| No Internet | 15,037 | 6.7% |
| Total | 224,474 | 100.0% |
Montgomery County Summary
Montgomery County, Texas is located in the southeastern part of the state, just north of Houston. It is part of the Houston-The Woodlands-Sugar Land metropolitan area and is the third most populous county in Texas. The county seat is Conroe, and the county is named for John Montgomery, an early settler in the area.
Geography
Montgomery County covers an area of 1,077 square miles and is bordered by San Jacinto County to the north, Liberty County to the east, Harris County to the south, and Walker County to the west. The county is mostly flat, with some rolling hills in the northern part. The county is drained by the San Jacinto River and its tributaries, including the West Fork of the San Jacinto River, the East Fork of the San Jacinto River, and the Caney Creek. The county is home to several lakes, including Lake Conroe, Lake Houston, Lake Livingston, and Lake Conroe.
The climate of Montgomery County is humid subtropical, with hot summers and mild winters. The average annual temperature is 68°F, and the average annual precipitation is 48 inches.
Economy
The economy of Montgomery County is largely based on the oil and gas industry, with the county being home to several major oil and gas companies. Other major industries in the county include healthcare, manufacturing, retail, and tourism.
The county is home to several major employers, including ExxonMobil, Anadarko Petroleum, and Memorial Hermann Health System. The county also has a large number of small businesses, including restaurants, shops, and other services.
Demographics
As of the 2010 census, Montgomery County had a population of 455,746. The population is made up of a diverse mix of ethnicities, including White (71.2%), Hispanic or Latino (17.3%), African American (7.7%), and Asian (2.7%). The median household income in the county is $68,845, and the median home value is $179,400.
The county is home to several major cities, including Conroe (the county seat), The Woodlands, Magnolia, and Montgomery. The county also has several smaller towns and unincorporated communities.
Education
Montgomery County is served by the Montgomery County Independent School District, which operates more than 50 elementary, middle, and high schools. The county is also home to several private schools, including The Woodlands Christian Academy and The John Cooper School.
The county is home to several higher education institutions, including Lone Star College, Sam Houston State University, and the University of Houston-Montgomery.
Conclusion
Montgomery County, Texas is a diverse and vibrant county located in the southeastern part of the state. The county is home to several major industries, including oil and gas, healthcare, manufacturing, retail, and tourism. The county is also home to several major cities and towns, as well as several higher education institutions. With its diverse population, strong economy, and excellent educational opportunities, Montgomery County is an ideal place to live and work.
Common Questions
What is Per Capita Income in Montgomery County?
Per Capita income in Montgomery County is $48,161.
What is the Median Family Income in Montgomery County?
Median Family Income in Montgomery County is $114,108.
What is the Median Household income in Montgomery County?
Median Household Income in Montgomery County is $95,946.
What is Income or Wage Gap in Montgomery County?
Income or Wage Gap in Montgomery County is 38.7%.
Women in Montgomery County earn 61.3 cents for every dollar earned by a man.
What is Family Income Deficit in Montgomery County?
Family Income Deficit in Montgomery County is $10,387.
Families that are below poverty line in Montgomery County earn $10,387 less on average than the poverty threshold level.
What is Inequality or Gini Index in Montgomery County?
Inequality or Gini Index in Montgomery County is 0.47.
What is the Total Population of Montgomery County?
Total Population of Montgomery County is 629,989.
What is the Total Male Population of Montgomery County?
Total Male Population of Montgomery County is 314,216.
What is the Total Female Population of Montgomery County?
Total Female Population of Montgomery County is 315,773.
What is the Ratio of Males per 100 Females in Montgomery County?
There are 99.51 Males per 100 Females in Montgomery County.
What is the Ratio of Females per 100 Males in Montgomery County?
There are 100.50 Females per 100 Males in Montgomery County.
What is the Median Population Age in Montgomery County?
Median Population Age in Montgomery County is 37.4 Years.
What is the Average Family Size in Montgomery County
Average Family Size in Montgomery County is 3.2 People.
What is the Average Household Size in Montgomery County
Average Household Size in Montgomery County is 2.8 People.
How Large is the Labor Force in Montgomery County?
There are 315,349 People in the Labor Forcein in Montgomery County.
What is the Percentage of People in the Labor Force in Montgomery County?
64.8% of People are in the Labor Force in Montgomery County.
What is the Unemployment Rate in Montgomery County?
Unemployment Rate in Montgomery County is 4.3%.