Comal County, TX Map & Demographics
Comal County Map
Comal County Overview
$47,280
PER CAPITA INCOME
$110,314
AVG FAMILY INCOME
$93,744
AVG HOUSEHOLD INCOME
24.4%
WAGE / INCOME GAP [ % ]
75.6¢/ $1
WAGE / INCOME GAP [ $ ]
$10,569
FAMILY INCOME DEFICIT
0.44
INEQUALITY / GINI INDEX
165,201
TOTAL POPULATION
82,455
MALE POPULATION
82,746
FEMALE POPULATION
99.65
MALES / 100 FEMALES
100.35
FEMALES / 100 MALES
41.7
MEDIAN AGE
3.0
AVG FAMILY SIZE
2.6
AVG HOUSEHOLD SIZE
81,065
LABOR FORCE [ PEOPLE ]
60.8%
PERCENT IN LABOR FORCE
3.7%
UNEMPLOYMENT RATE
Income in Comal County
Income Overview in Comal County
Per Capita Income in Comal County is $47,280, while median incomes of families and households are $110,314 and $93,744 respectively.
| Characteristic | Number | Measure |
| Per Capita Income | 165,201 | $47,280 |
| Median Family Income | 46,622 | $110,314 |
| Mean Family Income | 46,622 | $140,692 |
| Median Household Income | 63,957 | $93,744 |
| Mean Household Income | 63,957 | $121,798 |
| Income Deficit | 46,622 | $10,569 |
| Wage / Income Gap (%) | 165,201 | 24.37% |
| Wage / Income Gap ($) | 165,201 | 75.63¢ per $1 |
| Gini / Inequality Index | 165,201 | 0.44 |
Earnings by Sex in Comal County
Average Earnings in Comal County are $47,299, $53,170 for men and $40,212 for women, a difference of 24.4%.
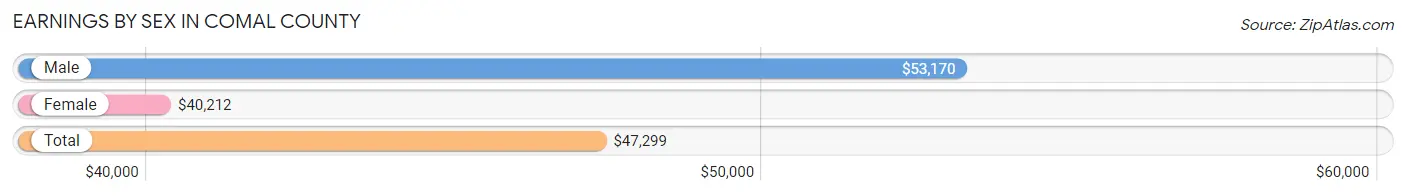
| Sex | Number | Average Earnings |
| Male | 47,439 (55.3%) | $53,170 |
| Female | 38,333 (44.7%) | $40,212 |
| Total | 85,772 (100.0%) | $47,299 |
Earnings by Sex by Income Bracket in Comal County
The most common earnings brackets in Comal County are $100,000+ for men (11,701 | 24.7%) and $100,000+ for women (4,970 | 13.0%).
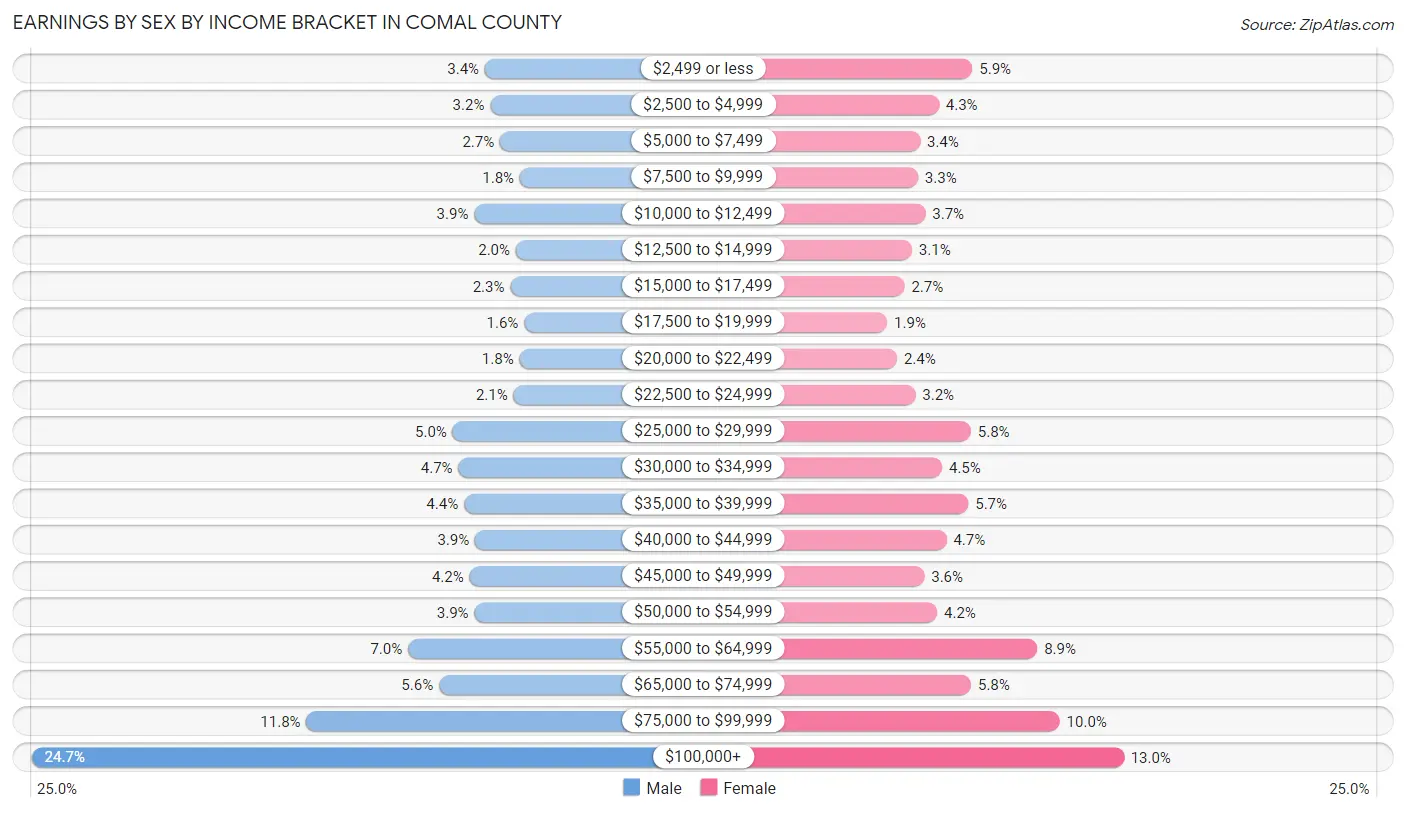
| Income | Male | Female |
| $2,499 or less | 1,632 (3.4%) | 2,253 (5.9%) |
| $2,500 to $4,999 | 1,513 (3.2%) | 1,654 (4.3%) |
| $5,000 to $7,499 | 1,297 (2.7%) | 1,315 (3.4%) |
| $7,500 to $9,999 | 855 (1.8%) | 1,275 (3.3%) |
| $10,000 to $12,499 | 1,868 (3.9%) | 1,410 (3.7%) |
| $12,500 to $14,999 | 942 (2.0%) | 1,171 (3.0%) |
| $15,000 to $17,499 | 1,069 (2.2%) | 1,036 (2.7%) |
| $17,500 to $19,999 | 761 (1.6%) | 726 (1.9%) |
| $20,000 to $22,499 | 865 (1.8%) | 902 (2.4%) |
| $22,500 to $24,999 | 997 (2.1%) | 1,229 (3.2%) |
| $25,000 to $29,999 | 2,346 (5.0%) | 2,227 (5.8%) |
| $30,000 to $34,999 | 2,219 (4.7%) | 1,709 (4.5%) |
| $35,000 to $39,999 | 2,098 (4.4%) | 2,181 (5.7%) |
| $40,000 to $44,999 | 1,849 (3.9%) | 1,791 (4.7%) |
| $45,000 to $49,999 | 1,973 (4.2%) | 1,390 (3.6%) |
| $50,000 to $54,999 | 1,863 (3.9%) | 1,623 (4.2%) |
| $55,000 to $64,999 | 3,340 (7.0%) | 3,418 (8.9%) |
| $65,000 to $74,999 | 2,653 (5.6%) | 2,230 (5.8%) |
| $75,000 to $99,999 | 5,598 (11.8%) | 3,823 (10.0%) |
| $100,000+ | 11,701 (24.7%) | 4,970 (13.0%) |
| Total | 47,439 (100.0%) | 38,333 (100.0%) |
Earnings by Sex by Educational Attainment in Comal County
Average earnings in Comal County are $63,362 for men and $45,986 for women, a difference of 27.4%. Men with an educational attainment of graduate degree enjoy the highest average annual earnings of $98,209, while those with less than high school education earn the least with $38,283. Women with an educational attainment of graduate degree earn the most with the average annual earnings of $68,229, while those with less than high school education have the smallest earnings of $24,810.
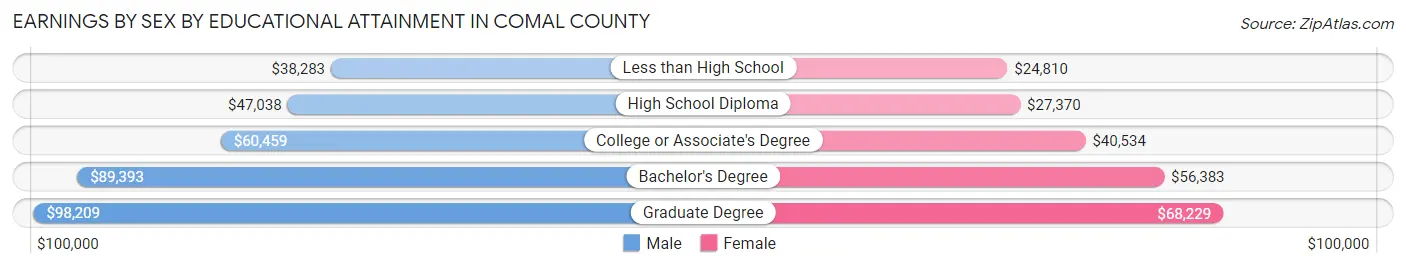
| Educational Attainment | Male Income | Female Income |
| Less than High School | $38,283 | $24,810 |
| High School Diploma | $47,038 | $27,370 |
| College or Associate's Degree | $60,459 | $40,534 |
| Bachelor's Degree | $89,393 | $56,383 |
| Graduate Degree | $98,209 | $68,229 |
| Total | $63,362 | $45,986 |
Family Income in Comal County
Family Income Brackets in Comal County
According to the Comal County family income data, there are 9,930 families falling into the $200,000+ income range, which is the most common income bracket and makes up 21.3% of all families. Conversely, the $10,000 to $14,999 income bracket is the least frequent group with only 420 families (0.9%) belonging to this category.
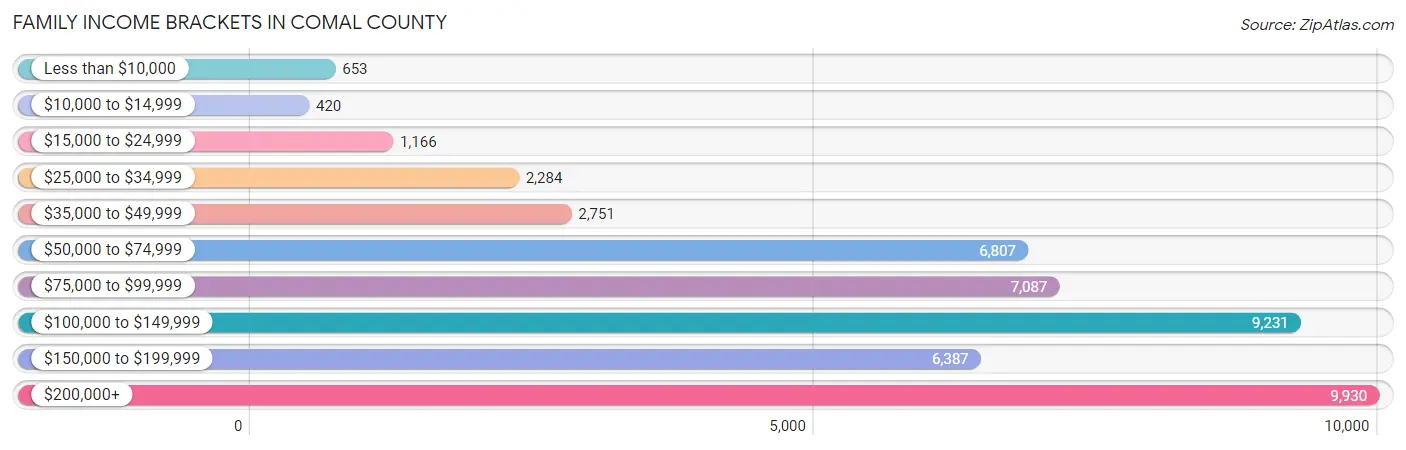
| Income Bracket | # Families | % Families |
| Less than $10,000 | 653 | 1.4% |
| $10,000 to $14,999 | 420 | 0.9% |
| $15,000 to $24,999 | 1,166 | 2.5% |
| $25,000 to $34,999 | 2,284 | 4.9% |
| $35,000 to $49,999 | 2,751 | 5.9% |
| $50,000 to $74,999 | 6,807 | 14.6% |
| $75,000 to $99,999 | 7,087 | 15.2% |
| $100,000 to $149,999 | 9,231 | 19.8% |
| $150,000 to $199,999 | 6,387 | 13.7% |
| $200,000+ | 9,930 | 21.3% |
Family Income by Famaliy Size in Comal County
7+ person families (733 | 1.6%) account for the highest median family income in Comal County with $152,917 per family, while 2-person families (23,541 | 50.5%) have the highest median income of $50,209 per family member.
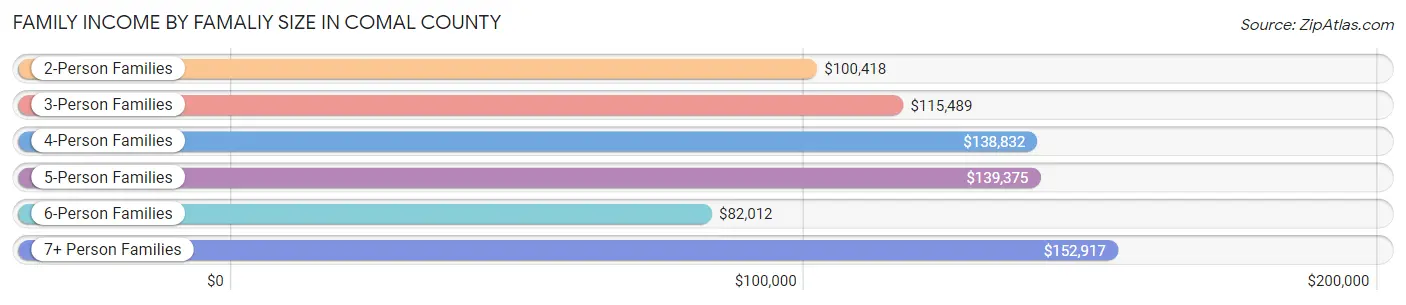
| Income Bracket | # Families | Median Income |
| 2-Person Families | 23,541 (50.5%) | $100,418 |
| 3-Person Families | 9,686 (20.8%) | $115,489 |
| 4-Person Families | 8,435 (18.1%) | $138,832 |
| 5-Person Families | 3,088 (6.6%) | $139,375 |
| 6-Person Families | 1,139 (2.4%) | $82,012 |
| 7+ Person Families | 733 (1.6%) | $152,917 |
| Total | 46,622 (100.0%) | $110,314 |
Family Income by Number of Earners in Comal County
The median family income in Comal County is $110,314, with families comprising 3+ earners (4,876) having the highest median family income of $164,020, while families with no earners (8,052) have the lowest median family income of $75,331, accounting for 10.5% and 17.3% of families, respectively.
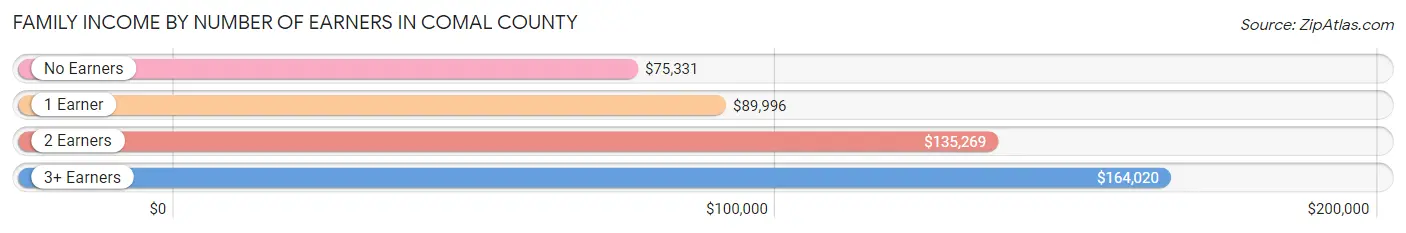
| Number of Earners | # Families | Median Income |
| No Earners | 8,052 (17.3%) | $75,331 |
| 1 Earner | 14,665 (31.5%) | $89,996 |
| 2 Earners | 19,029 (40.8%) | $135,269 |
| 3+ Earners | 4,876 (10.5%) | $164,020 |
| Total | 46,622 (100.0%) | $110,314 |
Household Income in Comal County
Household Income Brackets in Comal County
With 11,576 households falling in the category, the $100,000 to $149,999 income range is the most frequent in Comal County, accounting for 18.1% of all households. In contrast, only 1,215 households (1.9%) fall into the $10,000 to $14,999 income bracket, making it the least populous group.
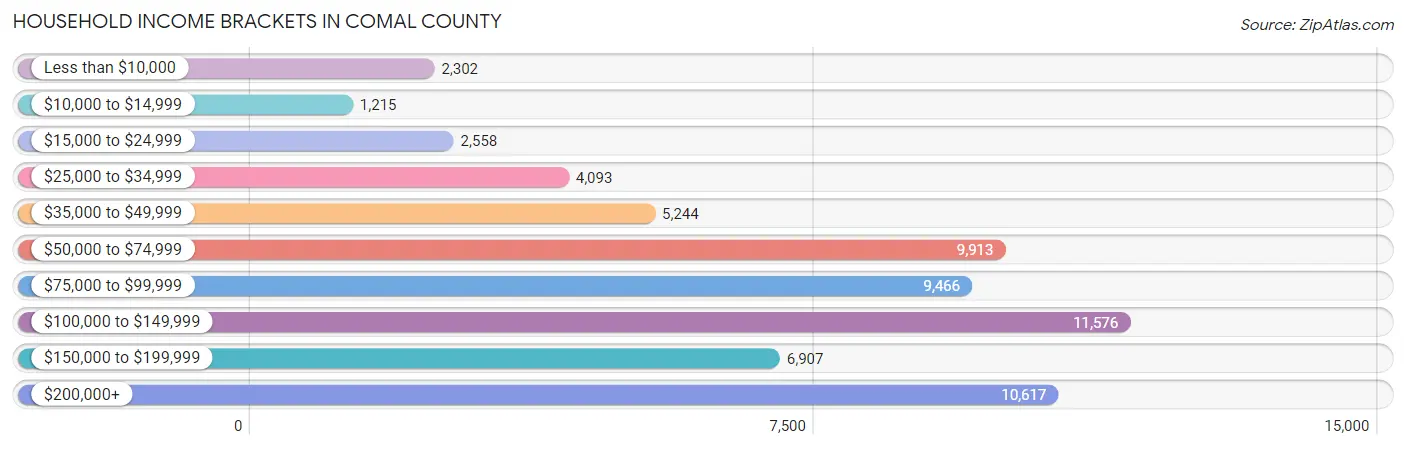
| Income Bracket | # Households | % Households |
| Less than $10,000 | 2,302 | 3.6% |
| $10,000 to $14,999 | 1,215 | 1.9% |
| $15,000 to $24,999 | 2,558 | 4.0% |
| $25,000 to $34,999 | 4,093 | 6.4% |
| $35,000 to $49,999 | 5,244 | 8.2% |
| $50,000 to $74,999 | 9,913 | 15.5% |
| $75,000 to $99,999 | 9,466 | 14.8% |
| $100,000 to $149,999 | 11,576 | 18.1% |
| $150,000 to $199,999 | 6,907 | 10.8% |
| $200,000+ | 10,617 | 16.6% |
Household Income by Householder Age in Comal County
The median household income in Comal County is $93,744, with the highest median household income of $112,078 found in the 45 to 64 years age bracket for the primary householder. A total of 25,184 households (39.4%) fall into this category. Meanwhile, the 15 to 24 years age bracket for the primary householder has the lowest median household income of $43,670, with 2,214 households (3.5%) in this group.
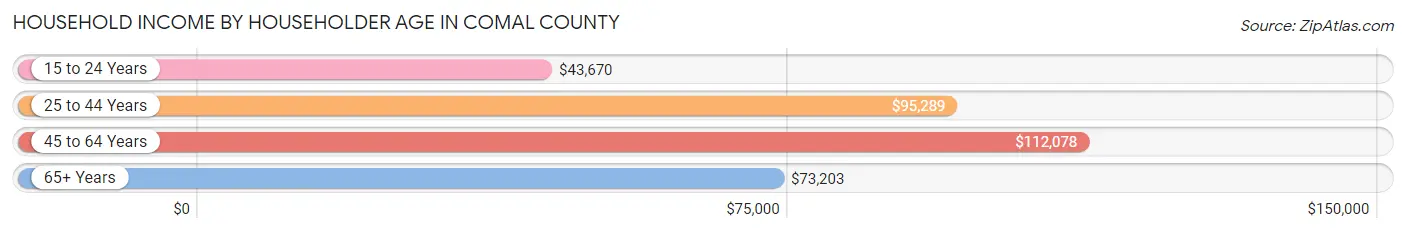
| Income Bracket | # Households | Median Income |
| 15 to 24 Years | 2,214 (3.5%) | $43,670 |
| 25 to 44 Years | 18,764 (29.3%) | $95,289 |
| 45 to 64 Years | 25,184 (39.4%) | $112,078 |
| 65+ Years | 17,795 (27.8%) | $73,203 |
| Total | 63,957 (100.0%) | $93,744 |
Poverty in Comal County
Income Below Poverty by Sex and Age in Comal County
With 5.3% poverty level for males and 6.9% for females among the residents of Comal County, 5 year old males and 18 to 24 year old females are the most vulnerable to poverty, with 74 males (8.1%) and 838 females (13.6%) in their respective age groups living below the poverty level.
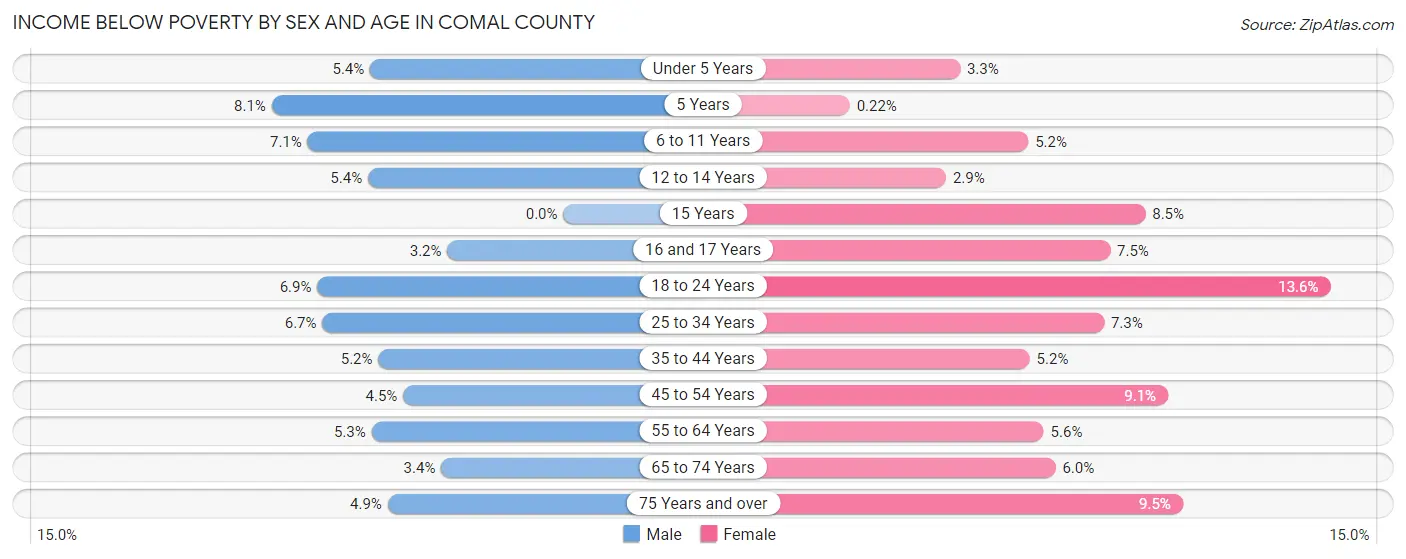
| Age Bracket | Male | Female |
| Under 5 Years | 249 (5.4%) | 134 (3.3%) |
| 5 Years | 74 (8.1%) | 2 (0.2%) |
| 6 to 11 Years | 470 (7.1%) | 310 (5.2%) |
| 12 to 14 Years | 170 (5.4%) | 99 (2.9%) |
| 15 Years | 0 (0.0%) | 87 (8.5%) |
| 16 and 17 Years | 85 (3.2%) | 165 (7.5%) |
| 18 to 24 Years | 455 (6.9%) | 838 (13.6%) |
| 25 to 34 Years | 631 (6.7%) | 665 (7.3%) |
| 35 to 44 Years | 552 (5.1%) | 548 (5.2%) |
| 45 to 54 Years | 480 (4.5%) | 984 (9.1%) |
| 55 to 64 Years | 622 (5.3%) | 681 (5.6%) |
| 65 to 74 Years | 313 (3.4%) | 576 (5.9%) |
| 75 Years and over | 238 (4.9%) | 570 (9.5%) |
| Total | 4,339 (5.3%) | 5,659 (6.9%) |
Income Above Poverty by Sex and Age in Comal County
According to the poverty statistics in Comal County, males aged 15 years and females aged 5 years are the age groups that are most secure financially, with 100.0% of males and 99.8% of females in these age groups living above the poverty line.
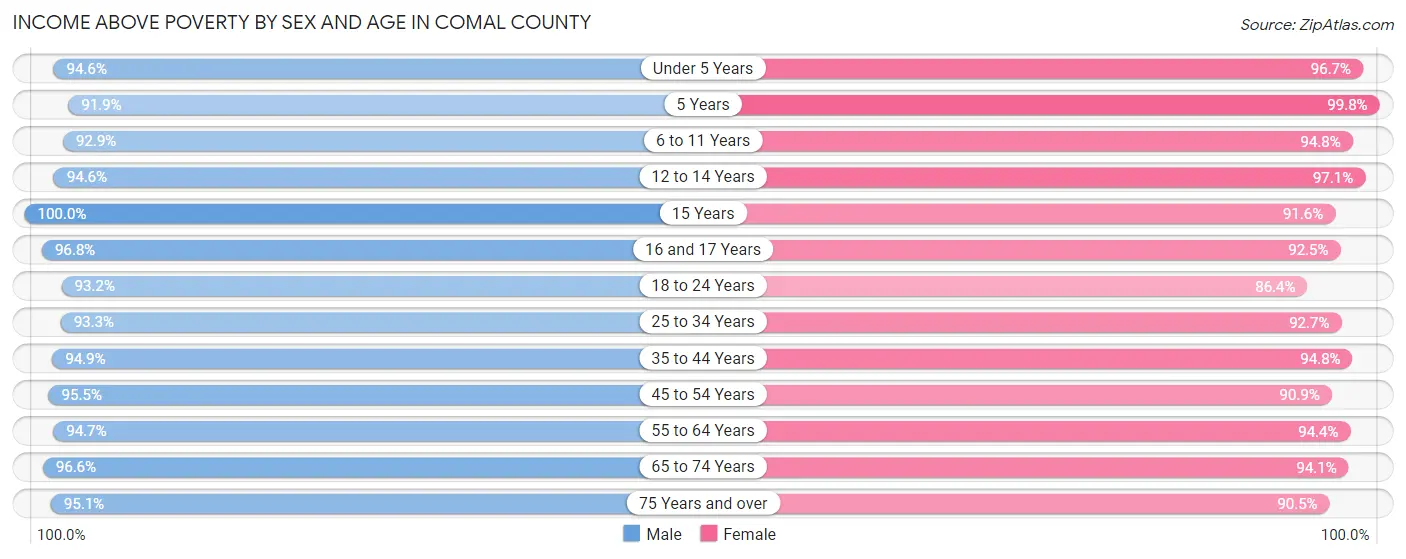
| Age Bracket | Male | Female |
| Under 5 Years | 4,376 (94.6%) | 3,940 (96.7%) |
| 5 Years | 837 (91.9%) | 887 (99.8%) |
| 6 to 11 Years | 6,128 (92.9%) | 5,667 (94.8%) |
| 12 to 14 Years | 2,955 (94.6%) | 3,315 (97.1%) |
| 15 Years | 789 (100.0%) | 943 (91.5%) |
| 16 and 17 Years | 2,550 (96.8%) | 2,043 (92.5%) |
| 18 to 24 Years | 6,186 (93.1%) | 5,324 (86.4%) |
| 25 to 34 Years | 8,773 (93.3%) | 8,449 (92.7%) |
| 35 to 44 Years | 10,157 (94.9%) | 9,925 (94.8%) |
| 45 to 54 Years | 10,283 (95.5%) | 9,858 (90.9%) |
| 55 to 64 Years | 11,022 (94.7%) | 11,428 (94.4%) |
| 65 to 74 Years | 8,884 (96.6%) | 9,104 (94.1%) |
| 75 Years and over | 4,630 (95.1%) | 5,436 (90.5%) |
| Total | 77,570 (94.7%) | 76,319 (93.1%) |
Income Below Poverty Among Married-Couple Families in Comal County
The poverty statistics for married-couple families in Comal County show that 2.7% or 1,072 of the total 39,072 families live below the poverty line. Families with 1 or 2 children have the highest poverty rate of 3.3%, comprising of 391 families. On the other hand, families with 5 or more children have the lowest poverty rate of 0.0%, which includes 0 families.
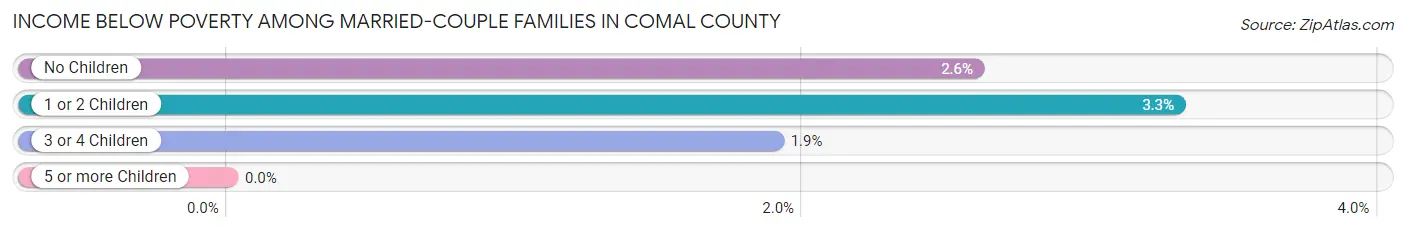
| Children | Above Poverty | Below Poverty |
| No Children | 23,515 (97.4%) | 627 (2.6%) |
| 1 or 2 Children | 11,470 (96.7%) | 391 (3.3%) |
| 3 or 4 Children | 2,793 (98.1%) | 54 (1.9%) |
| 5 or more Children | 222 (100.0%) | 0 (0.0%) |
| Total | 38,000 (97.3%) | 1,072 (2.7%) |
Income Below Poverty Among Single-Parent Households in Comal County
According to the poverty data in Comal County, 5.9% or 156 single-father households and 10.6% or 521 single-mother households are living below the poverty line. Among single-father households, those with 1 or 2 children have the highest poverty rate, with 114 households (8.8%) experiencing poverty. Likewise, among single-mother households, those with 5 or more children have the highest poverty rate, with 28 households (28.9%) falling below the poverty line.
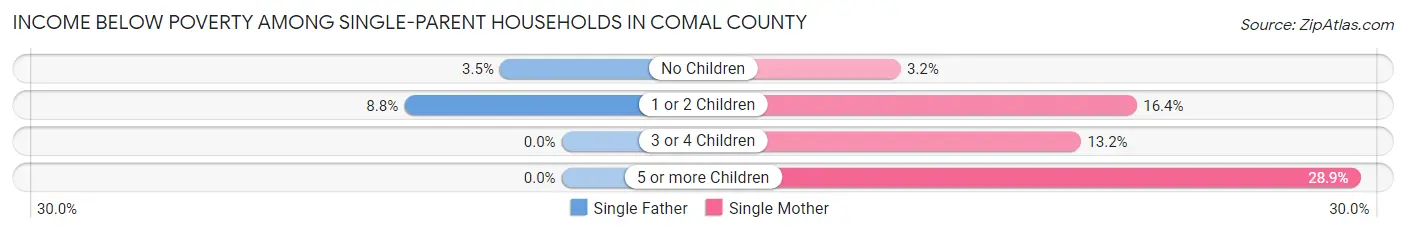
| Children | Single Father | Single Mother |
| No Children | 42 (3.5%) | 67 (3.2%) |
| 1 or 2 Children | 114 (8.8%) | 365 (16.4%) |
| 3 or 4 Children | 0 (0.0%) | 61 (13.2%) |
| 5 or more Children | 0 (0.0%) | 28 (28.9%) |
| Total | 156 (5.9%) | 521 (10.6%) |
Income Below Poverty Among Married-Couple vs Single-Parent Households in Comal County
The poverty data for Comal County shows that 1,072 of the married-couple family households (2.7%) and 677 of the single-parent households (9.0%) are living below the poverty level. Within the married-couple family households, those with 1 or 2 children have the highest poverty rate, with 391 households (3.3%) falling below the poverty line. Among the single-parent households, those with 5 or more children have the highest poverty rate, with 28 household (28.9%) living below poverty.
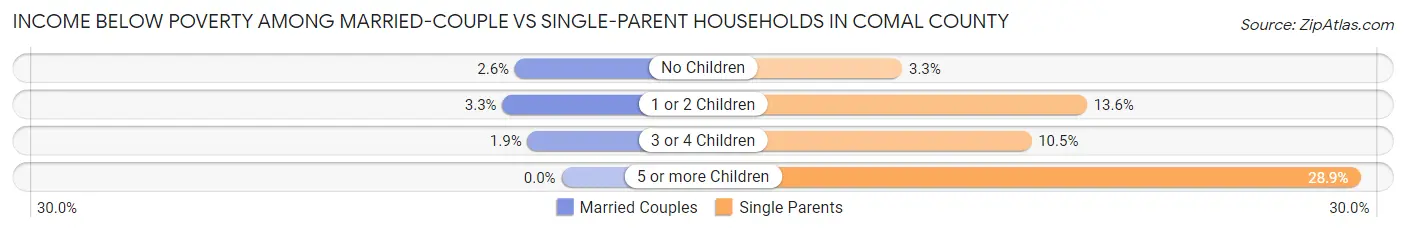
| Children | Married-Couple Families | Single-Parent Households |
| No Children | 627 (2.6%) | 109 (3.3%) |
| 1 or 2 Children | 391 (3.3%) | 479 (13.6%) |
| 3 or 4 Children | 54 (1.9%) | 61 (10.5%) |
| 5 or more Children | 0 (0.0%) | 28 (28.9%) |
| Total | 1,072 (2.7%) | 677 (9.0%) |
Race in Comal County
The most populous races in Comal County are White / Caucasian (131,280 | 79.5%), Hispanic or Latino (47,275 | 28.6%), and Two or more Races (20,984 | 12.7%).
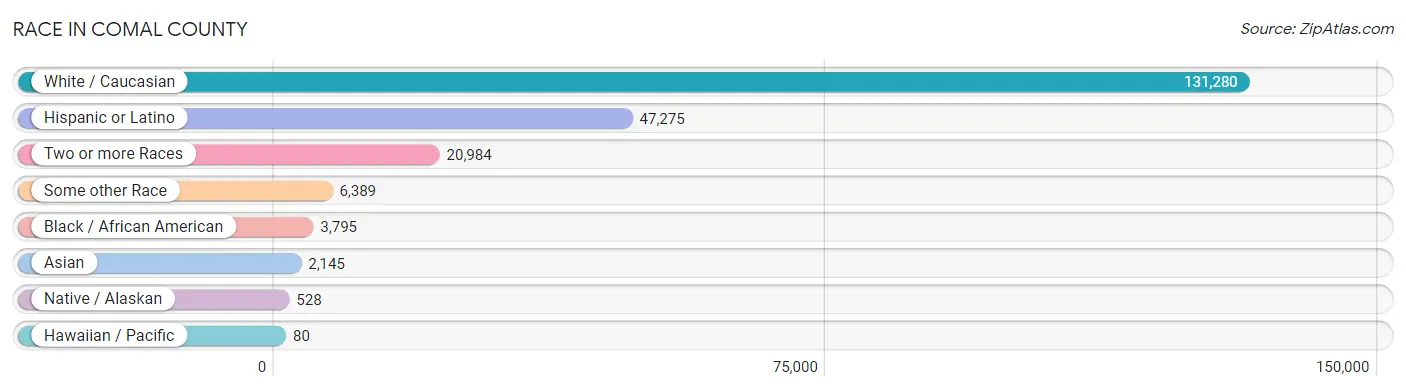
| Race | # Population | % Population |
| Asian | 2,145 | 1.3% |
| Black / African American | 3,795 | 2.3% |
| Hawaiian / Pacific | 80 | 0.1% |
| Hispanic or Latino | 47,275 | 28.6% |
| Native / Alaskan | 528 | 0.3% |
| White / Caucasian | 131,280 | 79.5% |
| Two or more Races | 20,984 | 12.7% |
| Some other Race | 6,389 | 3.9% |
| Total | 165,201 | 100.0% |
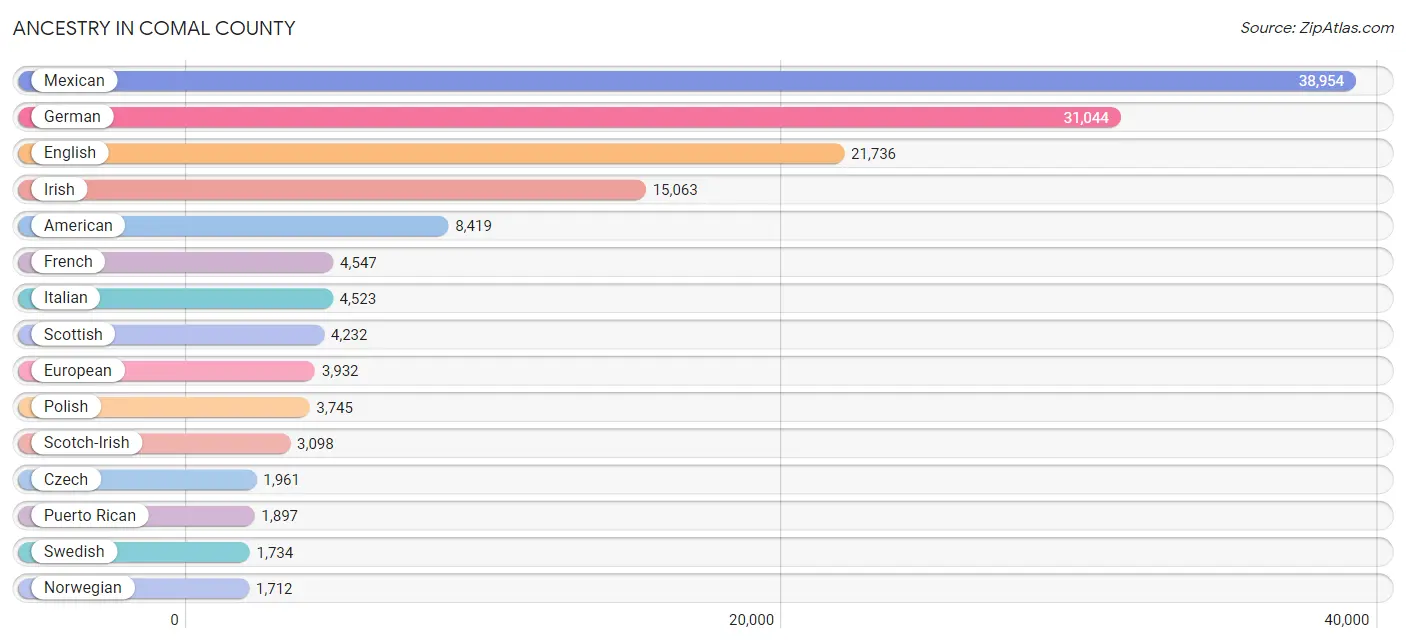
Ancestry in Comal County
The most populous ancestries reported in Comal County are Mexican (38,954 | 23.6%), German (31,044 | 18.8%), English (21,736 | 13.2%), Irish (15,063 | 9.1%), and American (8,419 | 5.1%), together accounting for 69.8% of all Comal County residents.
| Ancestry | # Population | % Population |
| African | 96 | 0.1% |
| Albanian | 19 | 0.0% |
| Alsatian | 35 | 0.0% |
| American | 8,419 | 5.1% |
| Apache | 89 | 0.1% |
| Arab | 272 | 0.2% |
| Argentinean | 51 | 0.0% |
| Armenian | 38 | 0.0% |
| Australian | 88 | 0.1% |
| Austrian | 299 | 0.2% |
| Bangladeshi | 35 | 0.0% |
| Basque | 50 | 0.0% |
| Belgian | 83 | 0.1% |
| Bhutanese | 527 | 0.3% |
| Blackfeet | 33 | 0.0% |
| Brazilian | 224 | 0.1% |
| British | 1,333 | 0.8% |
| Burmese | 340 | 0.2% |
| Cajun | 91 | 0.1% |
| Canadian | 135 | 0.1% |
| Celtic | 70 | 0.0% |
| Central American | 1,064 | 0.6% |
| Central American Indian | 52 | 0.0% |
| Cherokee | 672 | 0.4% |
| Chickasaw | 69 | 0.0% |
| Chilean | 307 | 0.2% |
| Chippewa | 2 | 0.0% |
| Choctaw | 54 | 0.0% |
| Colombian | 206 | 0.1% |
| Comanche | 31 | 0.0% |
| Costa Rican | 24 | 0.0% |
| Cree | 2 | 0.0% |
| Creek | 34 | 0.0% |
| Croatian | 51 | 0.0% |
| Cuban | 527 | 0.3% |
| Czech | 1,961 | 1.2% |
| Czechoslovakian | 396 | 0.2% |
| Danish | 482 | 0.3% |
| Dominican | 22 | 0.0% |
| Dutch | 1,164 | 0.7% |
| Eastern European | 361 | 0.2% |
| Ecuadorian | 10 | 0.0% |
| English | 21,736 | 13.2% |
| Ethiopian | 193 | 0.1% |
| European | 3,932 | 2.4% |
| Filipino | 27 | 0.0% |
| Finnish | 143 | 0.1% |
| French | 4,547 | 2.8% |
| French Canadian | 591 | 0.4% |
| German | 31,044 | 18.8% |
| Greek | 348 | 0.2% |
| Guamanian / Chamorro | 46 | 0.0% |
| Guatemalan | 115 | 0.1% |
| Haitian | 101 | 0.1% |
| Honduran | 196 | 0.1% |
| Hopi | 44 | 0.0% |
| Hungarian | 400 | 0.2% |
| Indian (Asian) | 618 | 0.4% |
| Indonesian | 60 | 0.0% |
| Iranian | 123 | 0.1% |
| Irish | 15,063 | 9.1% |
| Italian | 4,523 | 2.7% |
| Jamaican | 18 | 0.0% |
| Japanese | 77 | 0.1% |
| Jordanian | 76 | 0.1% |
| Korean | 1,124 | 0.7% |
| Laotian | 31 | 0.0% |
| Latvian | 18 | 0.0% |
| Lebanese | 145 | 0.1% |
| Lithuanian | 155 | 0.1% |
| Macedonian | 15 | 0.0% |
| Malaysian | 18 | 0.0% |
| Mexican | 38,954 | 23.6% |
| Mexican American Indian | 290 | 0.2% |
| Mongolian | 15 | 0.0% |
| Native Hawaiian | 307 | 0.2% |
| Navajo | 21 | 0.0% |
| Nicaraguan | 296 | 0.2% |
| Nigerian | 41 | 0.0% |
| Northern European | 227 | 0.1% |
| Norwegian | 1,712 | 1.0% |
| Okinawan | 15 | 0.0% |
| Pakistani | 344 | 0.2% |
| Panamanian | 190 | 0.1% |
| Peruvian | 228 | 0.1% |
| Polish | 3,745 | 2.3% |
| Portuguese | 301 | 0.2% |
| Puerto Rican | 1,897 | 1.1% |
| Romanian | 39 | 0.0% |
| Russian | 574 | 0.4% |
| Salvadoran | 243 | 0.2% |
| Scandinavian | 531 | 0.3% |
| Scotch-Irish | 3,098 | 1.9% |
| Scottish | 4,232 | 2.6% |
| Serbian | 20 | 0.0% |
| Sioux | 82 | 0.1% |
| Slavic | 63 | 0.0% |
| Slovak | 260 | 0.2% |
| Slovene | 131 | 0.1% |
| South African | 12 | 0.0% |
| South American | 890 | 0.5% |
| South American Indian | 94 | 0.1% |
| Spaniard | 738 | 0.4% |
| Spanish | 754 | 0.5% |
| Spanish American | 10 | 0.0% |
| Spanish American Indian | 18 | 0.0% |
| Sri Lankan | 109 | 0.1% |
| Subsaharan African | 539 | 0.3% |
| Swedish | 1,734 | 1.1% |
| Swiss | 339 | 0.2% |
| Syrian | 48 | 0.0% |
| Thai | 298 | 0.2% |
| Tohono O'Odham | 18 | 0.0% |
| Trinidadian and Tobagonian | 37 | 0.0% |
| Turkish | 55 | 0.0% |
| Ukrainian | 206 | 0.1% |
| Venezuelan | 88 | 0.1% |
| Welsh | 1,442 | 0.9% |
| West Indian | 129 | 0.1% |
| Yaqui | 89 | 0.1% |
| Yugoslavian | 10 | 0.0% | View All 121 Rows |
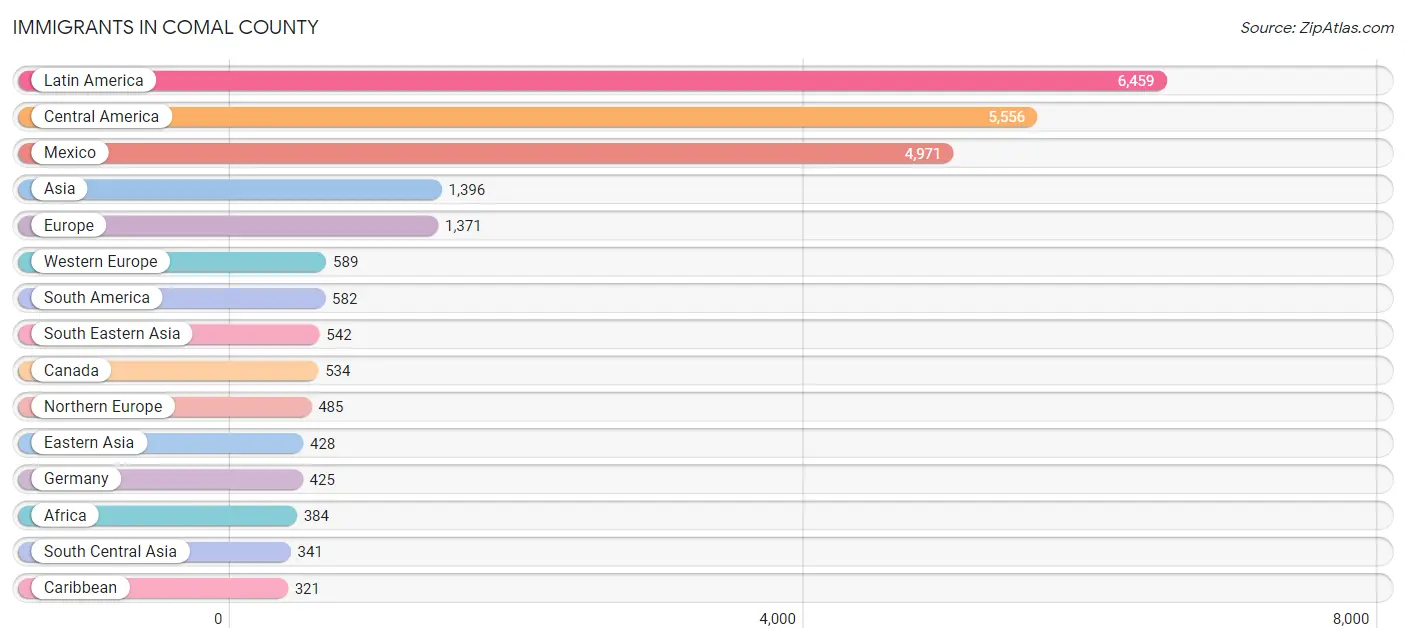
Immigrants in Comal County
The most numerous immigrant groups reported in Comal County came from Latin America (6,459 | 3.9%), Central America (5,556 | 3.4%), Mexico (4,971 | 3.0%), Asia (1,396 | 0.9%), and Europe (1,371 | 0.8%), together accounting for 12.0% of all Comal County residents.
| Immigration Origin | # Population | % Population |
| Africa | 384 | 0.2% |
| Albania | 19 | 0.0% |
| Argentina | 37 | 0.0% |
| Asia | 1,396 | 0.9% |
| Australia | 98 | 0.1% |
| Austria | 20 | 0.0% |
| Barbados | 20 | 0.0% |
| Belarus | 34 | 0.0% |
| Brazil | 65 | 0.0% |
| Cambodia | 8 | 0.0% |
| Cameroon | 43 | 0.0% |
| Canada | 534 | 0.3% |
| Caribbean | 321 | 0.2% |
| Central America | 5,556 | 3.4% |
| Chile | 29 | 0.0% |
| China | 222 | 0.1% |
| Colombia | 52 | 0.0% |
| Cuba | 143 | 0.1% |
| Denmark | 17 | 0.0% |
| Eastern Africa | 186 | 0.1% |
| Eastern Asia | 428 | 0.3% |
| Eastern Europe | 198 | 0.1% |
| El Salvador | 152 | 0.1% |
| England | 174 | 0.1% |
| Ethiopia | 153 | 0.1% |
| Europe | 1,371 | 0.8% |
| France | 136 | 0.1% |
| Germany | 425 | 0.3% |
| Guatemala | 145 | 0.1% |
| Guyana | 30 | 0.0% |
| Haiti | 101 | 0.1% |
| Honduras | 46 | 0.0% |
| India | 185 | 0.1% |
| Iran | 81 | 0.1% |
| Ireland | 27 | 0.0% |
| Italy | 7 | 0.0% |
| Japan | 89 | 0.1% |
| Korea | 117 | 0.1% |
| Kuwait | 5 | 0.0% |
| Laos | 38 | 0.0% |
| Latin America | 6,459 | 3.9% |
| Lebanon | 78 | 0.1% |
| Liberia | 28 | 0.0% |
| Malaysia | 15 | 0.0% |
| Mexico | 4,971 | 3.0% |
| Middle Africa | 43 | 0.0% |
| Moldova | 9 | 0.0% |
| Netherlands | 8 | 0.0% |
| Nicaragua | 106 | 0.1% |
| Northern Africa | 31 | 0.0% |
| Northern Europe | 485 | 0.3% |
| Oceania | 126 | 0.1% |
| Pakistan | 75 | 0.1% |
| Panama | 136 | 0.1% |
| Peru | 200 | 0.1% |
| Philippines | 320 | 0.2% |
| Poland | 36 | 0.0% |
| Romania | 51 | 0.0% |
| Russia | 23 | 0.0% |
| Scotland | 11 | 0.0% |
| Singapore | 15 | 0.0% |
| South Africa | 96 | 0.1% |
| South America | 582 | 0.4% |
| South Central Asia | 341 | 0.2% |
| South Eastern Asia | 542 | 0.3% |
| Southern Europe | 99 | 0.1% |
| Spain | 92 | 0.1% |
| Taiwan | 27 | 0.0% |
| Thailand | 45 | 0.0% |
| Trinidad and Tobago | 57 | 0.0% |
| Ukraine | 26 | 0.0% |
| Venezuela | 88 | 0.1% |
| Vietnam | 66 | 0.0% |
| Western Africa | 28 | 0.0% |
| Western Asia | 85 | 0.1% |
| Western Europe | 589 | 0.4% |
| Zimbabwe | 33 | 0.0% | View All 77 Rows |
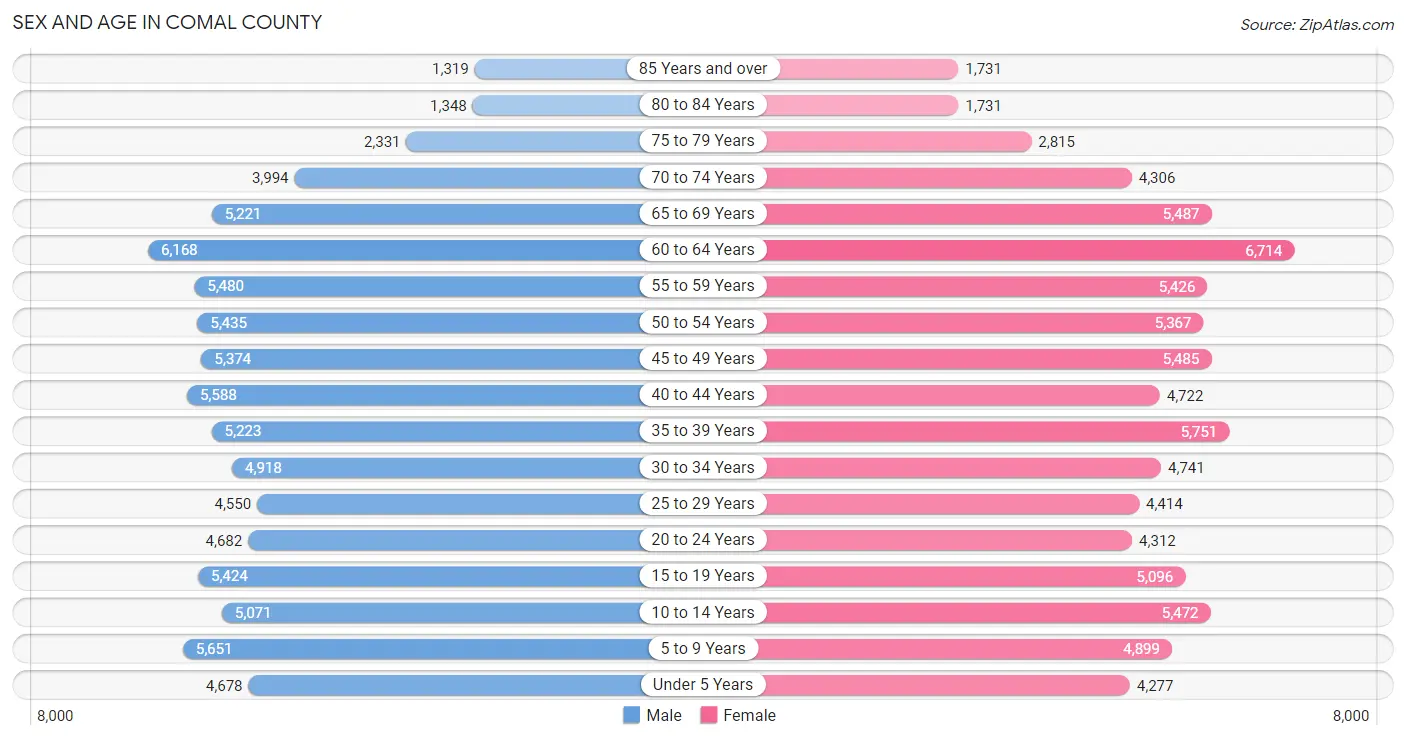
Sex and Age in Comal County
Sex and Age in Comal County
The most populous age groups in Comal County are 60 to 64 Years (6,168 | 7.5%) for men and 60 to 64 Years (6,714 | 8.1%) for women.
| Age Bracket | Male | Female |
| Under 5 Years | 4,678 (5.7%) | 4,277 (5.2%) |
| 5 to 9 Years | 5,651 (6.9%) | 4,899 (5.9%) |
| 10 to 14 Years | 5,071 (6.1%) | 5,472 (6.6%) |
| 15 to 19 Years | 5,424 (6.6%) | 5,096 (6.2%) |
| 20 to 24 Years | 4,682 (5.7%) | 4,312 (5.2%) |
| 25 to 29 Years | 4,550 (5.5%) | 4,414 (5.3%) |
| 30 to 34 Years | 4,918 (6.0%) | 4,741 (5.7%) |
| 35 to 39 Years | 5,223 (6.3%) | 5,751 (7.0%) |
| 40 to 44 Years | 5,588 (6.8%) | 4,722 (5.7%) |
| 45 to 49 Years | 5,374 (6.5%) | 5,485 (6.6%) |
| 50 to 54 Years | 5,435 (6.6%) | 5,367 (6.5%) |
| 55 to 59 Years | 5,480 (6.7%) | 5,426 (6.6%) |
| 60 to 64 Years | 6,168 (7.5%) | 6,714 (8.1%) |
| 65 to 69 Years | 5,221 (6.3%) | 5,487 (6.6%) |
| 70 to 74 Years | 3,994 (4.8%) | 4,306 (5.2%) |
| 75 to 79 Years | 2,331 (2.8%) | 2,815 (3.4%) |
| 80 to 84 Years | 1,348 (1.6%) | 1,731 (2.1%) |
| 85 Years and over | 1,319 (1.6%) | 1,731 (2.1%) |
| Total | 82,455 (100.0%) | 82,746 (100.0%) |
Families and Households in Comal County
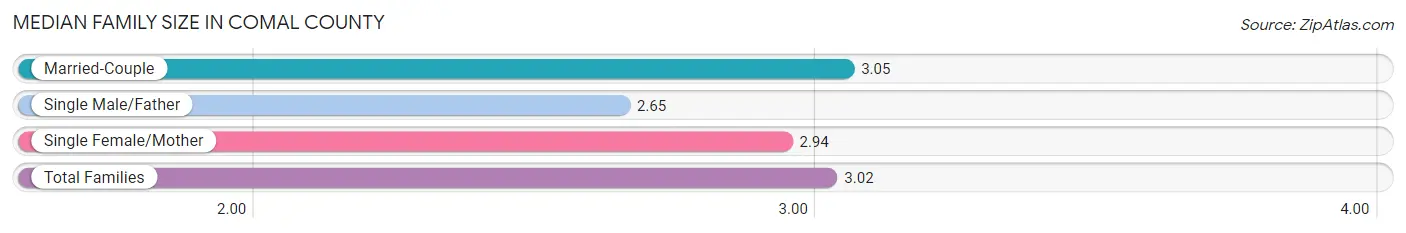
Median Family Size in Comal County
The median family size in Comal County is 3.02 persons per family, with married-couple families (39,072 | 83.8%) accounting for the largest median family size of 3.05 persons per family. On the other hand, single male/father families (2,633 | 5.7%) represent the smallest median family size with 2.65 persons per family.
| Family Type | # Families | Family Size |
| Married-Couple | 39,072 (83.8%) | 3.05 |
| Single Male/Father | 2,633 (5.7%) | 2.65 |
| Single Female/Mother | 4,917 (10.5%) | 2.94 |
| Total Families | 46,622 (100.0%) | 3.02 |
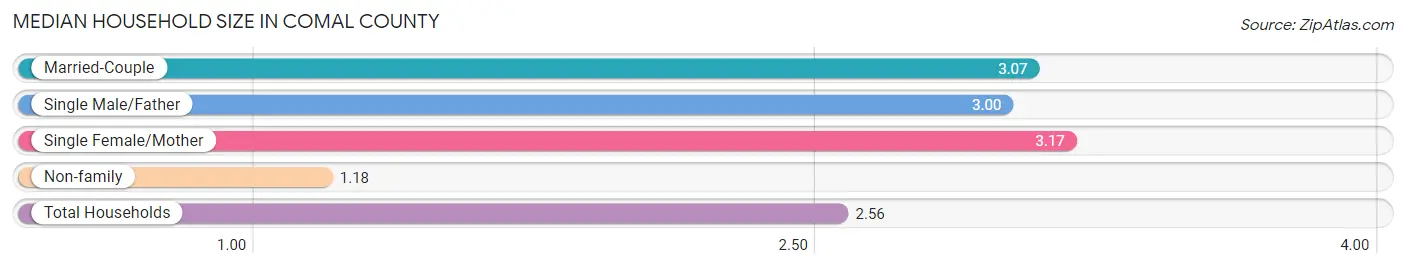
Median Household Size in Comal County
The median household size in Comal County is 2.56 persons per household, with single female/mother households (4,917 | 7.7%) accounting for the largest median household size of 3.17 persons per household. non-family households (17,335 | 27.1%) represent the smallest median household size with 1.18 persons per household.
| Household Type | # Households | Household Size |
| Married-Couple | 39,072 (61.1%) | 3.07 |
| Single Male/Father | 2,633 (4.1%) | 3.00 |
| Single Female/Mother | 4,917 (7.7%) | 3.17 |
| Non-family | 17,335 (27.1%) | 1.18 |
| Total Households | 63,957 (100.0%) | 2.56 |
Household Size by Marriage Status in Comal County
Out of a total of 63,957 households in Comal County, 46,622 (72.9%) are family households, while 17,335 (27.1%) are nonfamily households. The most numerous type of family households are 2-person households, comprising 22,377, and the most common type of nonfamily households are 1-person households, comprising 14,407.
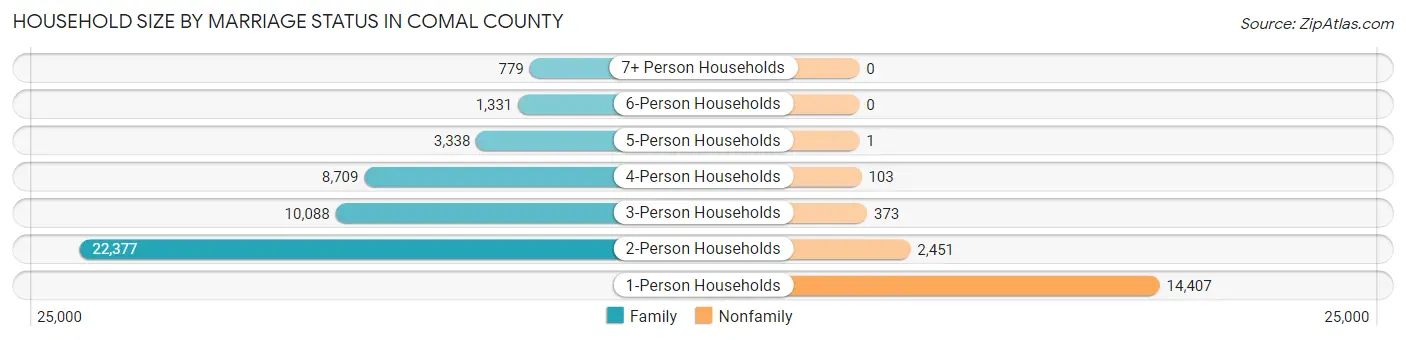
| Household Size | Family Households | Nonfamily Households |
| 1-Person Households | - | 14,407 (22.5%) |
| 2-Person Households | 22,377 (35.0%) | 2,451 (3.8%) |
| 3-Person Households | 10,088 (15.8%) | 373 (0.6%) |
| 4-Person Households | 8,709 (13.6%) | 103 (0.2%) |
| 5-Person Households | 3,338 (5.2%) | 1 (0.0%) |
| 6-Person Households | 1,331 (2.1%) | 0 (0.0%) |
| 7+ Person Households | 779 (1.2%) | 0 (0.0%) |
| Total | 46,622 (72.9%) | 17,335 (27.1%) |
Female Fertility in Comal County
Fertility by Age in Comal County
Average fertility rate in Comal County is 65.0 births per 1,000 women. Women in the age bracket of 20 to 34 years have the highest fertility rate with 108.0 births per 1,000 women. Women in the age bracket of 20 to 34 years acount for 63.1% of all women with births.
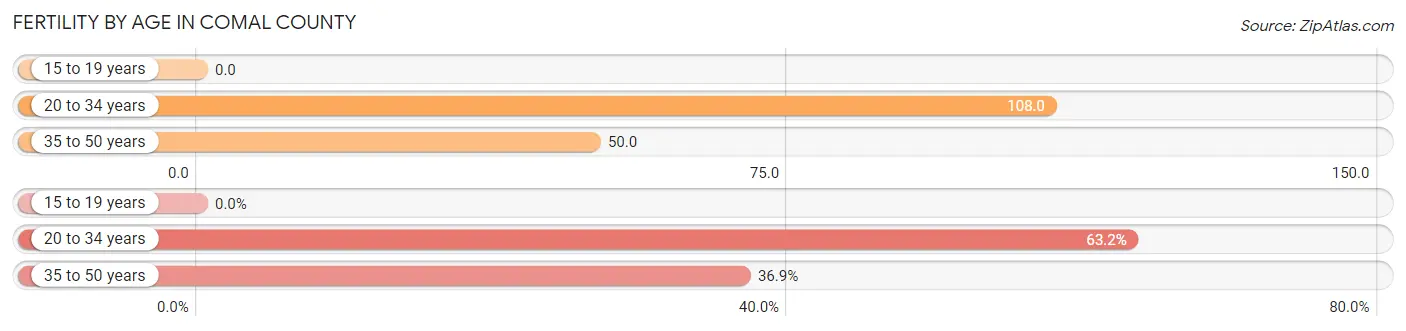
| Age Bracket | Women with Births | Births / 1,000 Women |
| 15 to 19 years | 0 (0.0%) | 0.0 |
| 20 to 34 years | 1,455 (63.1%) | 108.0 |
| 35 to 50 years | 849 (36.8%) | 50.0 |
| Total | 2,304 (100.0%) | 65.0 |
Fertility by Age by Marriage Status in Comal County
83.3% of women with births (2,304) in Comal County are married. The highest percentage of unmarried women with births falls into 20 to 34 years age bracket with 24.0% of them unmarried at the time of birth, while the lowest percentage of unmarried women with births belong to 35 to 50 years age bracket with 4.1% of them unmarried.
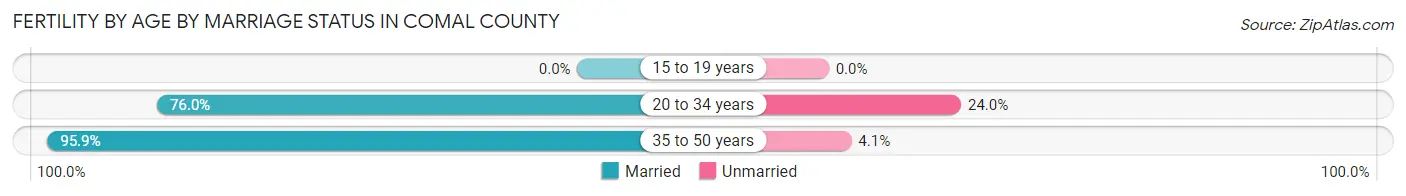
| Age Bracket | Married | Unmarried |
| 15 to 19 years | 0 (0.0%) | 0 (0.0%) |
| 20 to 34 years | 1,106 (76.0%) | 349 (24.0%) |
| 35 to 50 years | 814 (95.9%) | 35 (4.1%) |
| Total | 1,919 (83.3%) | 385 (16.7%) |
Fertility by Education in Comal County
Average fertility rate in Comal County is 65.0 births per 1,000 women. Women with the education attainment of bachelor's degree have the highest fertility rate of 123.0 births per 1,000 women, while women with the education attainment of graduate degree have the lowest fertility at 33.0 births per 1,000 women. Women with the education attainment of bachelor's degree represent 51.8% of all women with births.
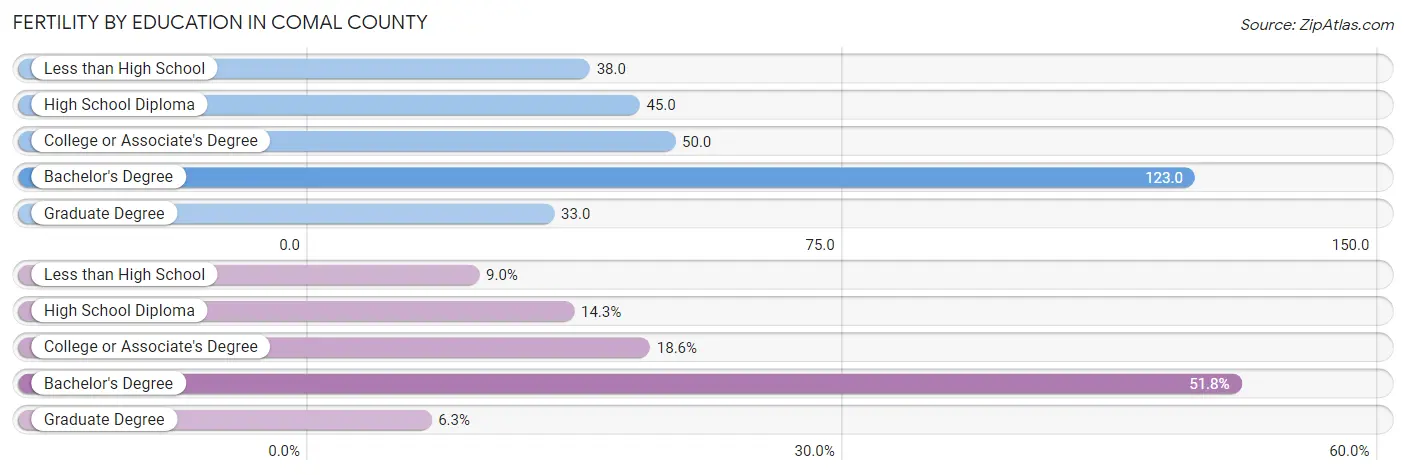
| Educational Attainment | Women with Births | Births / 1,000 Women |
| Less than High School | 207 (9.0%) | 38.0 |
| High School Diploma | 330 (14.3%) | 45.0 |
| College or Associate's Degree | 428 (18.6%) | 50.0 |
| Bachelor's Degree | 1,194 (51.8%) | 123.0 |
| Graduate Degree | 145 (6.3%) | 33.0 |
| Total | 2,304 (100.0%) | 65.0 |
Fertility by Education by Marriage Status in Comal County
16.7% of women with births in Comal County are unmarried. Women with the educational attainment of graduate degree are most likely to be married with 100.0% of them married at childbirth, while women with the educational attainment of high school diploma are least likely to be married with 39.7% of them unmarried at childbirth.
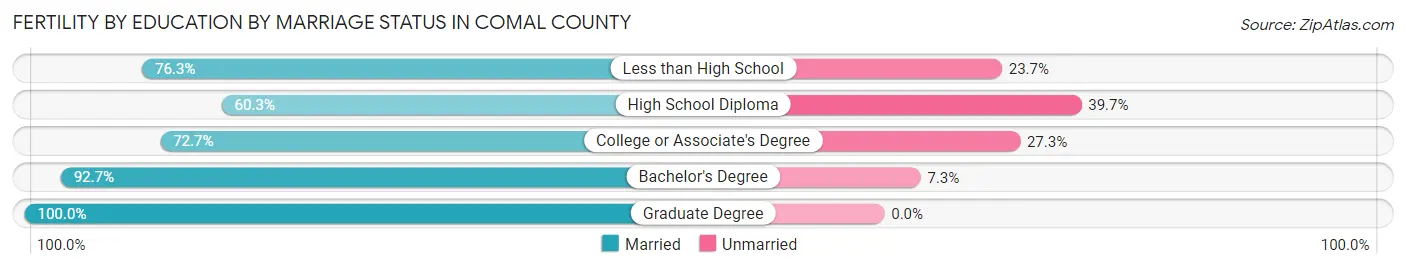
| Educational Attainment | Married | Unmarried |
| Less than High School | 158 (76.3%) | 49 (23.7%) |
| High School Diploma | 199 (60.3%) | 131 (39.7%) |
| College or Associate's Degree | 311 (72.7%) | 117 (27.3%) |
| Bachelor's Degree | 1,107 (92.7%) | 87 (7.3%) |
| Graduate Degree | 145 (100.0%) | 0 (0.0%) |
| Total | 1,919 (83.3%) | 385 (16.7%) |
Employment Characteristics in Comal County
Employment by Class of Employer in Comal County
Among the 76,950 employed individuals in Comal County, private company employees (50,680 | 65.9%), self-employed (not incorporated) (6,239 | 8.1%), and local government employees (5,796 | 7.5%) make up the most common classes of employment.
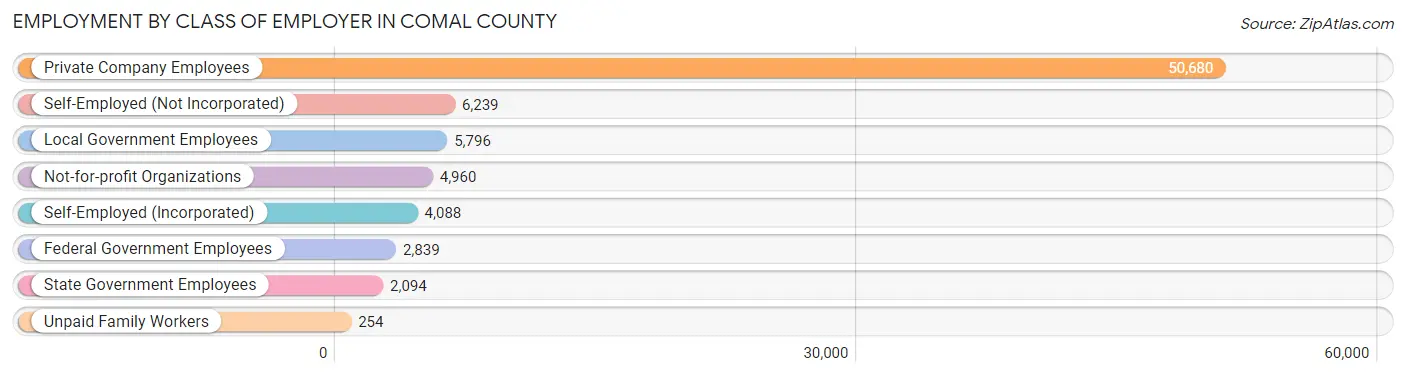
| Employer Class | # Employees | % Employees |
| Private Company Employees | 50,680 | 65.9% |
| Self-Employed (Incorporated) | 4,088 | 5.3% |
| Self-Employed (Not Incorporated) | 6,239 | 8.1% |
| Not-for-profit Organizations | 4,960 | 6.5% |
| Local Government Employees | 5,796 | 7.5% |
| State Government Employees | 2,094 | 2.7% |
| Federal Government Employees | 2,839 | 3.7% |
| Unpaid Family Workers | 254 | 0.3% |
| Total | 76,950 | 100.0% |
Employment Status by Age in Comal County
According to the labor force statistics for Comal County, out of the total population over 16 years of age (133,330), 60.8% or 81,065 individuals are in the labor force, with 3.7% or 2,999 of them unemployed. The age group with the highest labor force participation rate is 25 to 29 years, with 86.3% or 7,736 individuals in the labor force. Within the labor force, the 16 to 19 years age range has the highest percentage of unemployed individuals, with 9.3% or 322 of them being unemployed.
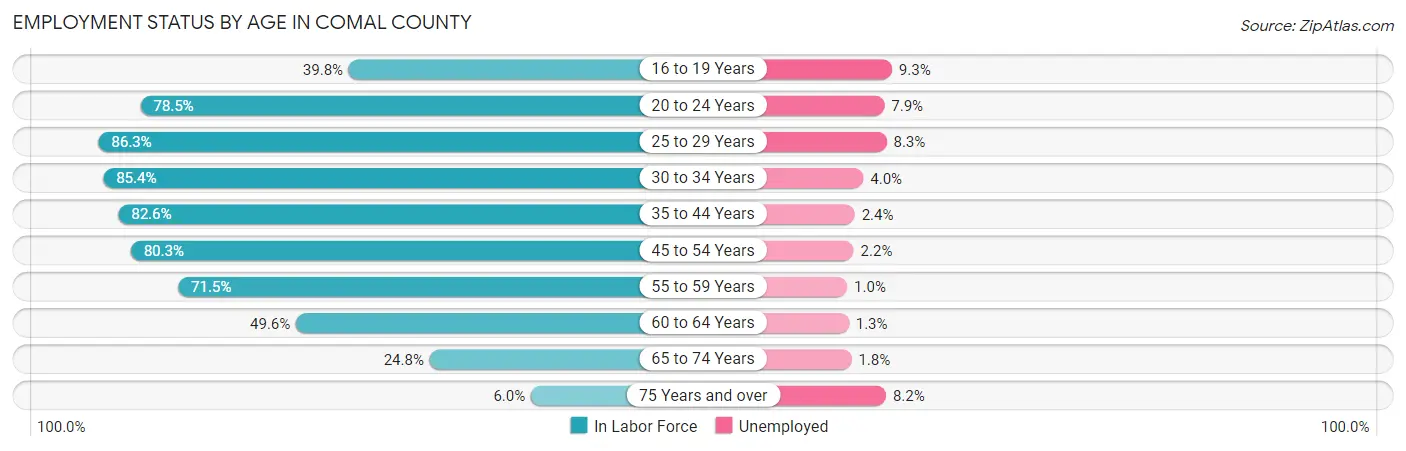
| Age Bracket | In Labor Force | Unemployed |
| 16 to 19 Years | 3,461 (39.8%) | 322 (9.3%) |
| 20 to 24 Years | 7,060 (78.5%) | 558 (7.9%) |
| 25 to 29 Years | 7,736 (86.3%) | 642 (8.3%) |
| 30 to 34 Years | 8,249 (85.4%) | 330 (4.0%) |
| 35 to 44 Years | 17,581 (82.6%) | 422 (2.4%) |
| 45 to 54 Years | 17,394 (80.3%) | 383 (2.2%) |
| 55 to 59 Years | 7,798 (71.5%) | 78 (1.0%) |
| 60 to 64 Years | 6,389 (49.6%) | 83 (1.3%) |
| 65 to 74 Years | 4,714 (24.8%) | 85 (1.8%) |
| 75 Years and over | 676 (6.0%) | 55 (8.2%) |
| Total | 81,065 (60.8%) | 2,999 (3.7%) |
Employment Status by Educational Attainment in Comal County
According to labor force statistics for Comal County, 76.3% of individuals (65,127) out of the total population between 25 and 64 years of age (85,356) are in the labor force, with 3.0% or 1,954 of them being unemployed. The group with the highest labor force participation rate are those with the educational attainment of bachelor's degree or higher, with 81.2% or 28,983 individuals in the labor force. Within the labor force, individuals with college / associate degree education have the highest percentage of unemployment, with 4.3% or 807 of them being unemployed.
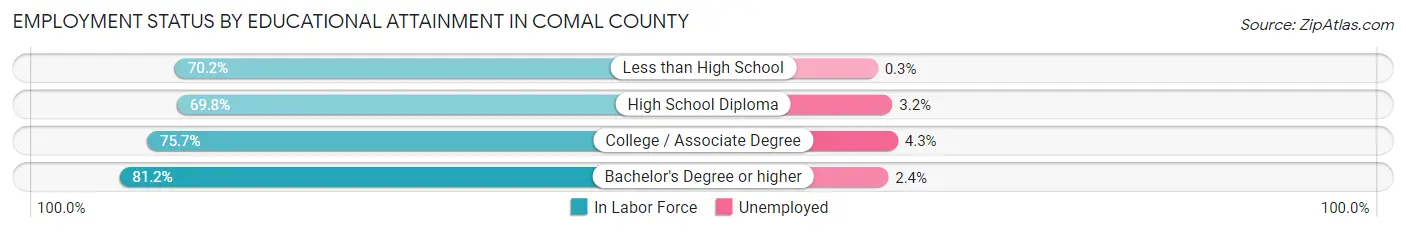
| Educational Attainment | In Labor Force | Unemployed |
| Less than High School | 3,802 (70.2%) | 16 (0.3%) |
| High School Diploma | 13,584 (69.8%) | 623 (3.2%) |
| College / Associate Degree | 18,763 (75.7%) | 1,066 (4.3%) |
| Bachelor's Degree or higher | 28,983 (81.2%) | 857 (2.4%) |
| Total | 65,127 (76.3%) | 2,561 (3.0%) |
Employment Occupations by Sex in Comal County
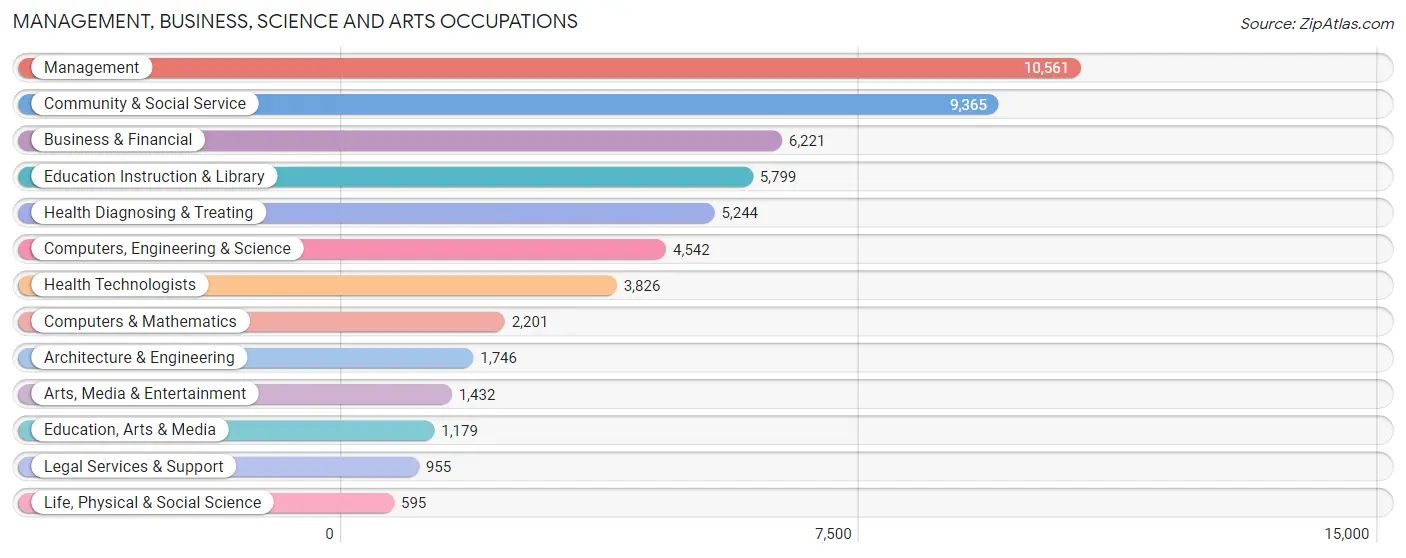
Management, Business, Science and Arts Occupations
The most common Management, Business, Science and Arts occupations in Comal County are Management (10,561 | 13.6%), Community & Social Service (9,365 | 12.1%), Business & Financial (6,221 | 8.0%), Education Instruction & Library (5,799 | 7.5%), and Health Diagnosing & Treating (5,244 | 6.8%).
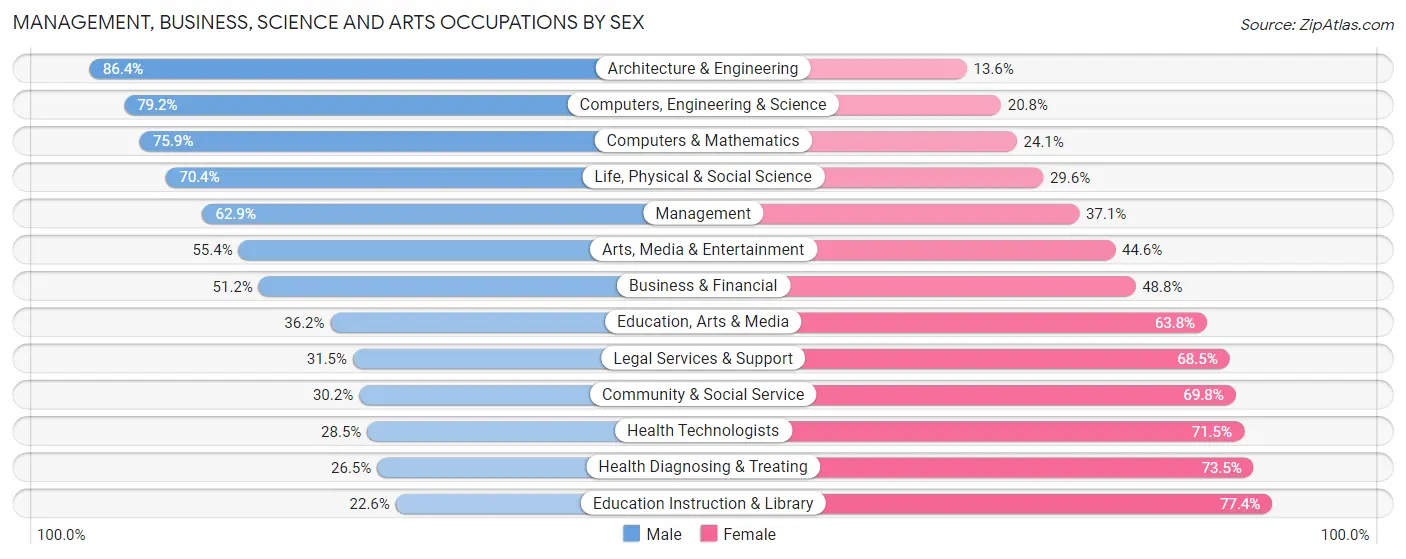
Management, Business, Science and Arts Occupations by Sex
Within the Management, Business, Science and Arts occupations in Comal County, the most male-oriented occupations are Architecture & Engineering (86.4%), Computers, Engineering & Science (79.2%), and Computers & Mathematics (75.9%), while the most female-oriented occupations are Education Instruction & Library (77.4%), Health Diagnosing & Treating (73.5%), and Health Technologists (71.5%).
| Occupation | Male | Female |
| Management | 6,640 (62.9%) | 3,921 (37.1%) |
| Business & Financial | 3,183 (51.2%) | 3,038 (48.8%) |
| Computers, Engineering & Science | 3,598 (79.2%) | 944 (20.8%) |
| Computers & Mathematics | 1,671 (75.9%) | 530 (24.1%) |
| Architecture & Engineering | 1,508 (86.4%) | 238 (13.6%) |
| Life, Physical & Social Science | 419 (70.4%) | 176 (29.6%) |
| Community & Social Service | 2,832 (30.2%) | 6,533 (69.8%) |
| Education, Arts & Media | 427 (36.2%) | 752 (63.8%) |
| Legal Services & Support | 301 (31.5%) | 654 (68.5%) |
| Education Instruction & Library | 1,311 (22.6%) | 4,488 (77.4%) |
| Arts, Media & Entertainment | 793 (55.4%) | 639 (44.6%) |
| Health Diagnosing & Treating | 1,388 (26.5%) | 3,856 (73.5%) |
| Health Technologists | 1,092 (28.5%) | 2,734 (71.5%) |
| Total (Category) | 17,641 (49.1%) | 18,292 (50.9%) |
| Total (Overall) | 43,171 (55.6%) | 34,438 (44.4%) |
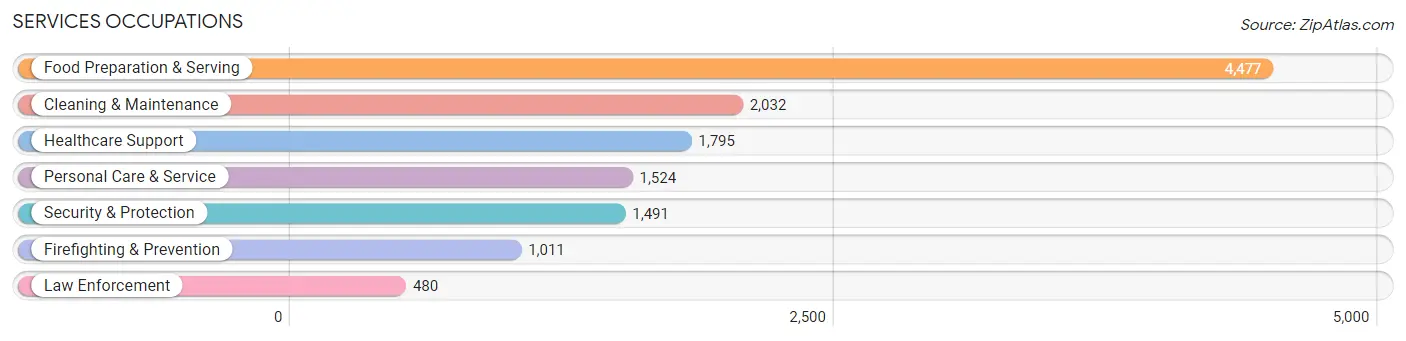
Services Occupations
The most common Services occupations in Comal County are Food Preparation & Serving (4,477 | 5.8%), Cleaning & Maintenance (2,032 | 2.6%), Healthcare Support (1,795 | 2.3%), Personal Care & Service (1,524 | 2.0%), and Security & Protection (1,491 | 1.9%).
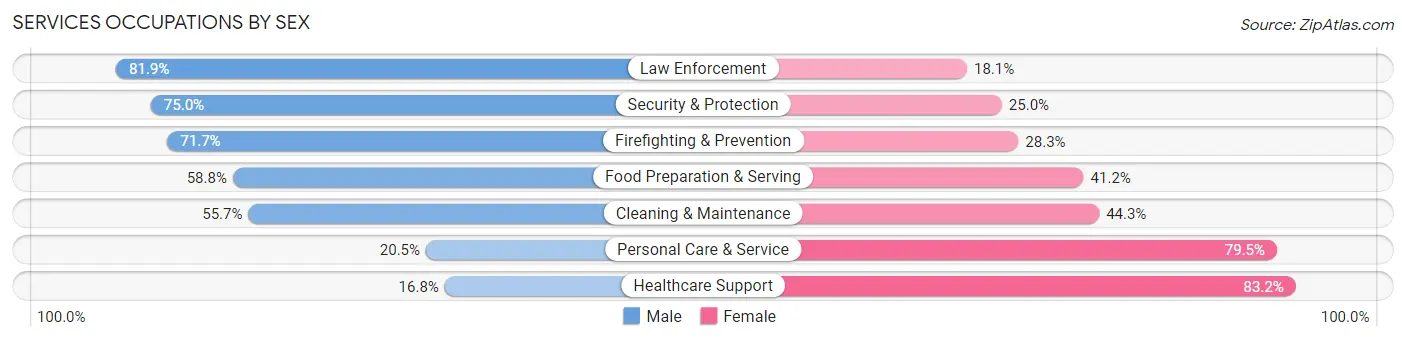
Services Occupations by Sex
Within the Services occupations in Comal County, the most male-oriented occupations are Law Enforcement (81.9%), Security & Protection (75.0%), and Firefighting & Prevention (71.7%), while the most female-oriented occupations are Healthcare Support (83.2%), Personal Care & Service (79.5%), and Cleaning & Maintenance (44.3%).
| Occupation | Male | Female |
| Healthcare Support | 302 (16.8%) | 1,493 (83.2%) |
| Security & Protection | 1,118 (75.0%) | 373 (25.0%) |
| Firefighting & Prevention | 725 (71.7%) | 286 (28.3%) |
| Law Enforcement | 393 (81.9%) | 87 (18.1%) |
| Food Preparation & Serving | 2,632 (58.8%) | 1,845 (41.2%) |
| Cleaning & Maintenance | 1,132 (55.7%) | 900 (44.3%) |
| Personal Care & Service | 313 (20.5%) | 1,211 (79.5%) |
| Total (Category) | 5,497 (48.6%) | 5,822 (51.4%) |
| Total (Overall) | 43,171 (55.6%) | 34,438 (44.4%) |
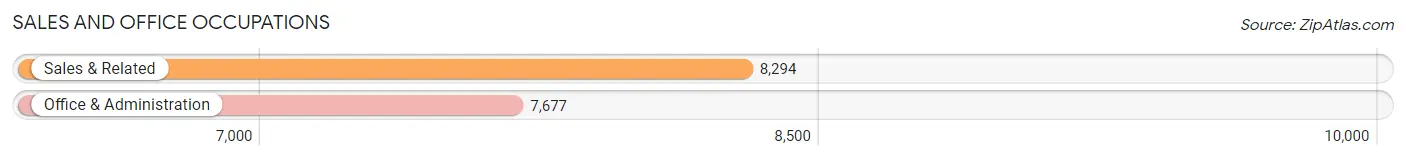
Sales and Office Occupations
The most common Sales and Office occupations in Comal County are Sales & Related (8,294 | 10.7%), and Office & Administration (7,677 | 9.9%).
Sales and Office Occupations by Sex
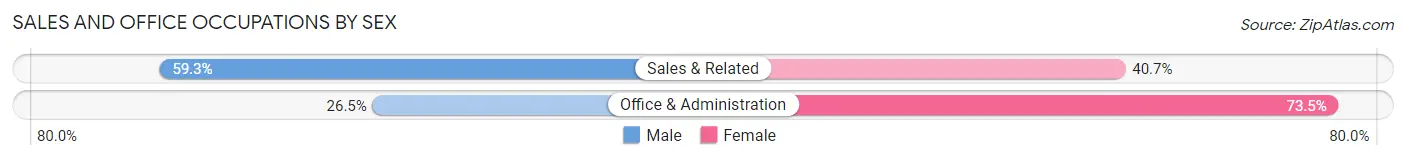
| Occupation | Male | Female |
| Sales & Related | 4,916 (59.3%) | 3,378 (40.7%) |
| Office & Administration | 2,031 (26.5%) | 5,646 (73.5%) |
| Total (Category) | 6,947 (43.5%) | 9,024 (56.5%) |
| Total (Overall) | 43,171 (55.6%) | 34,438 (44.4%) |
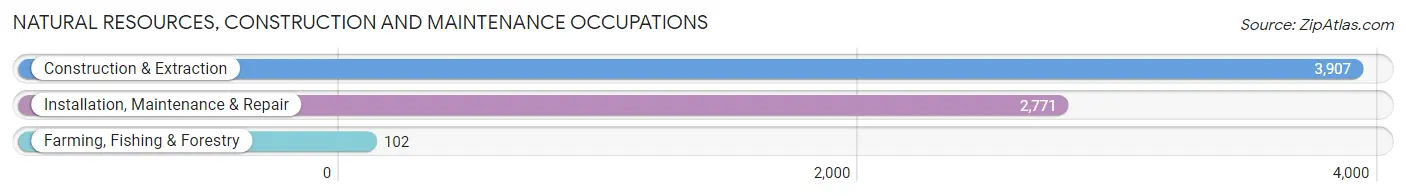
Natural Resources, Construction and Maintenance Occupations
The most common Natural Resources, Construction and Maintenance occupations in Comal County are Construction & Extraction (3,907 | 5.0%), Installation, Maintenance & Repair (2,771 | 3.6%), and Farming, Fishing & Forestry (102 | 0.1%).
Natural Resources, Construction and Maintenance Occupations by Sex
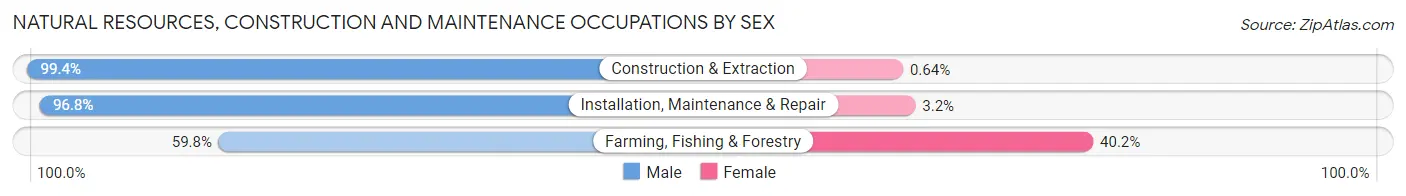
| Occupation | Male | Female |
| Farming, Fishing & Forestry | 61 (59.8%) | 41 (40.2%) |
| Construction & Extraction | 3,882 (99.4%) | 25 (0.6%) |
| Installation, Maintenance & Repair | 2,682 (96.8%) | 89 (3.2%) |
| Total (Category) | 6,625 (97.7%) | 155 (2.3%) |
| Total (Overall) | 43,171 (55.6%) | 34,438 (44.4%) |
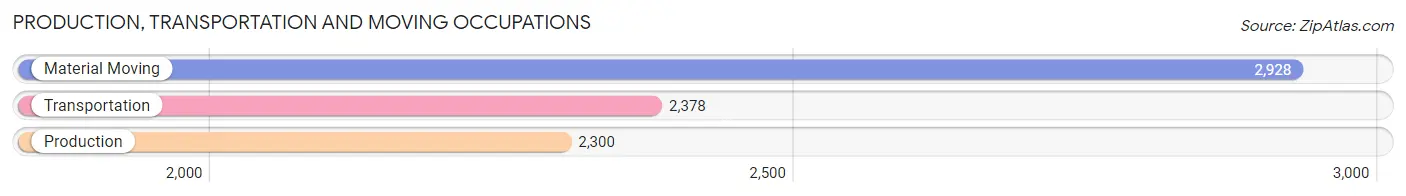
Production, Transportation and Moving Occupations
The most common Production, Transportation and Moving occupations in Comal County are Material Moving (2,928 | 3.8%), Transportation (2,378 | 3.1%), and Production (2,300 | 3.0%).
Production, Transportation and Moving Occupations by Sex
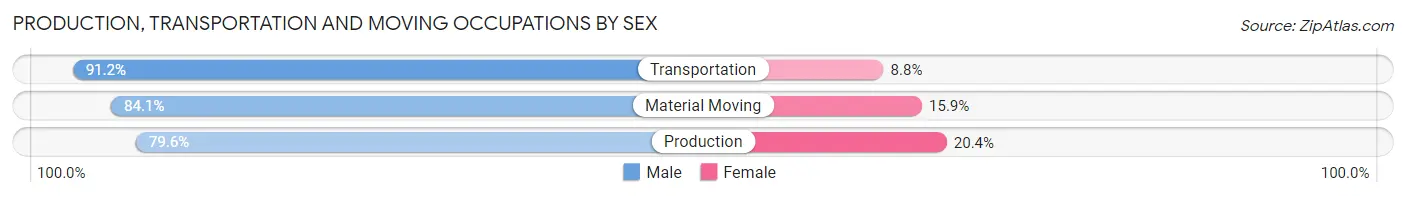
| Occupation | Male | Female |
| Production | 1,830 (79.6%) | 470 (20.4%) |
| Transportation | 2,168 (91.2%) | 210 (8.8%) |
| Material Moving | 2,463 (84.1%) | 465 (15.9%) |
| Total (Category) | 6,461 (85.0%) | 1,145 (15.0%) |
| Total (Overall) | 43,171 (55.6%) | 34,438 (44.4%) |
Employment Industries by Sex in Comal County
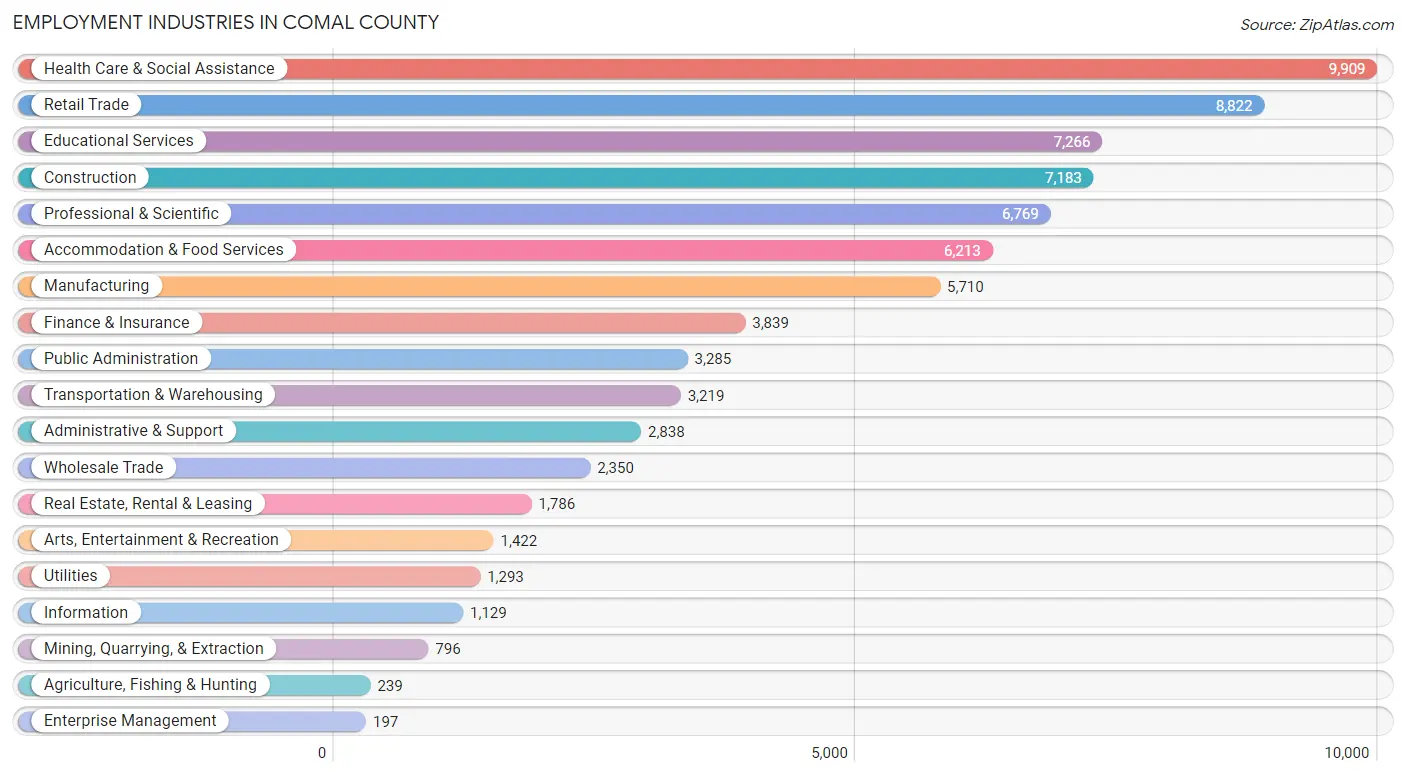
Employment Industries in Comal County
The major employment industries in Comal County include Health Care & Social Assistance (9,909 | 12.8%), Retail Trade (8,822 | 11.4%), Educational Services (7,266 | 9.4%), Construction (7,183 | 9.3%), and Professional & Scientific (6,769 | 8.7%).
Employment Industries by Sex in Comal County
The Comal County industries that see more men than women are Construction (91.5%), Mining, Quarrying, & Extraction (84.2%), and Utilities (80.9%), whereas the industries that tend to have a higher number of women are Health Care & Social Assistance (75.6%), Educational Services (74.0%), and Arts, Entertainment & Recreation (52.2%).
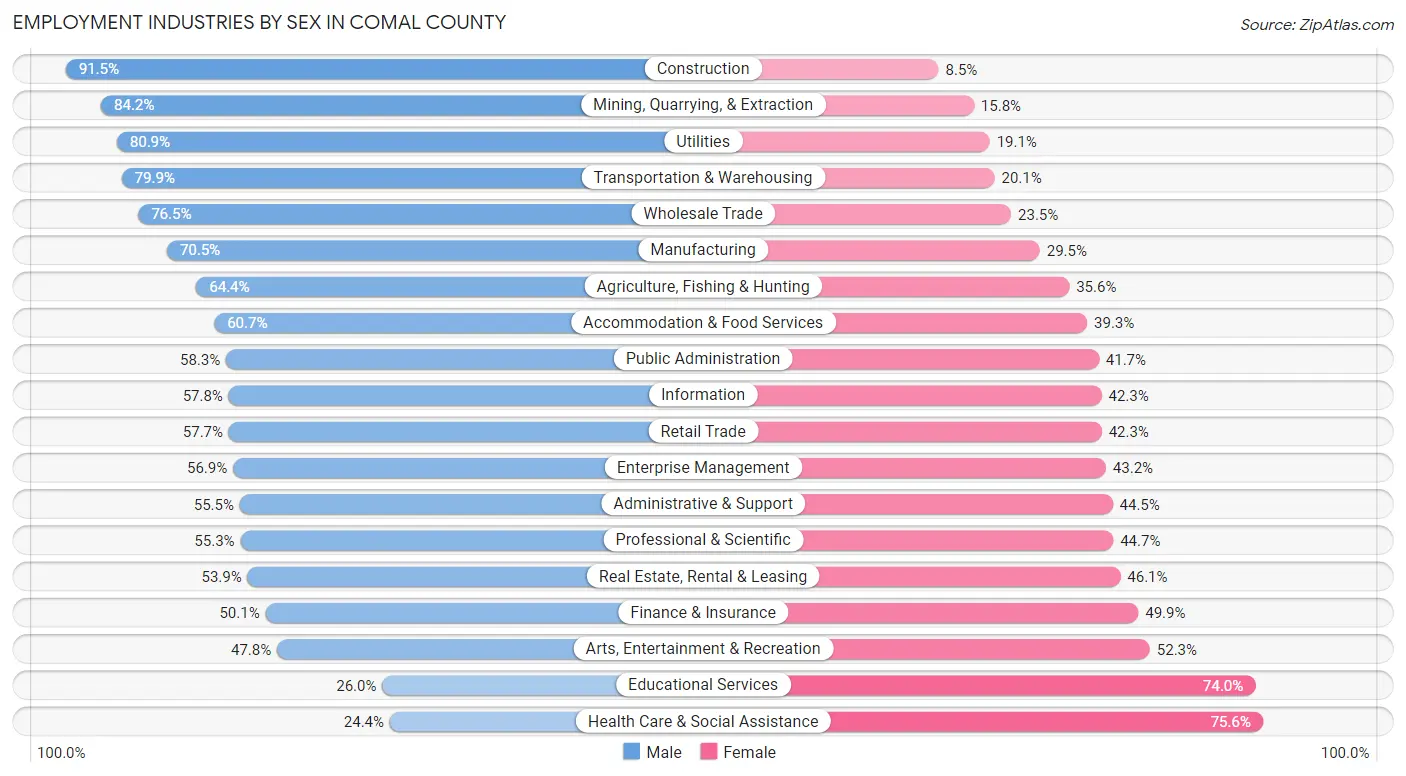
| Industry | Male | Female |
| Agriculture, Fishing & Hunting | 154 (64.4%) | 85 (35.6%) |
| Mining, Quarrying, & Extraction | 670 (84.2%) | 126 (15.8%) |
| Construction | 6,570 (91.5%) | 613 (8.5%) |
| Manufacturing | 4,027 (70.5%) | 1,683 (29.5%) |
| Wholesale Trade | 1,797 (76.5%) | 553 (23.5%) |
| Retail Trade | 5,092 (57.7%) | 3,730 (42.3%) |
| Transportation & Warehousing | 2,572 (79.9%) | 647 (20.1%) |
| Utilities | 1,046 (80.9%) | 247 (19.1%) |
| Information | 652 (57.8%) | 477 (42.2%) |
| Finance & Insurance | 1,925 (50.1%) | 1,914 (49.9%) |
| Real Estate, Rental & Leasing | 962 (53.9%) | 824 (46.1%) |
| Professional & Scientific | 3,745 (55.3%) | 3,024 (44.7%) |
| Enterprise Management | 112 (56.9%) | 85 (43.1%) |
| Administrative & Support | 1,574 (55.5%) | 1,264 (44.5%) |
| Educational Services | 1,887 (26.0%) | 5,379 (74.0%) |
| Health Care & Social Assistance | 2,417 (24.4%) | 7,492 (75.6%) |
| Arts, Entertainment & Recreation | 679 (47.7%) | 743 (52.2%) |
| Accommodation & Food Services | 3,774 (60.7%) | 2,439 (39.3%) |
| Public Administration | 1,915 (58.3%) | 1,370 (41.7%) |
| Total | 43,171 (55.6%) | 34,438 (44.4%) |
Education in Comal County
School Enrollment in Comal County
The most common levels of schooling among the 36,860 students in Comal County are middle school (8,686 | 23.6%), elementary school (8,583 | 23.3%), and high school (8,567 | 23.2%).
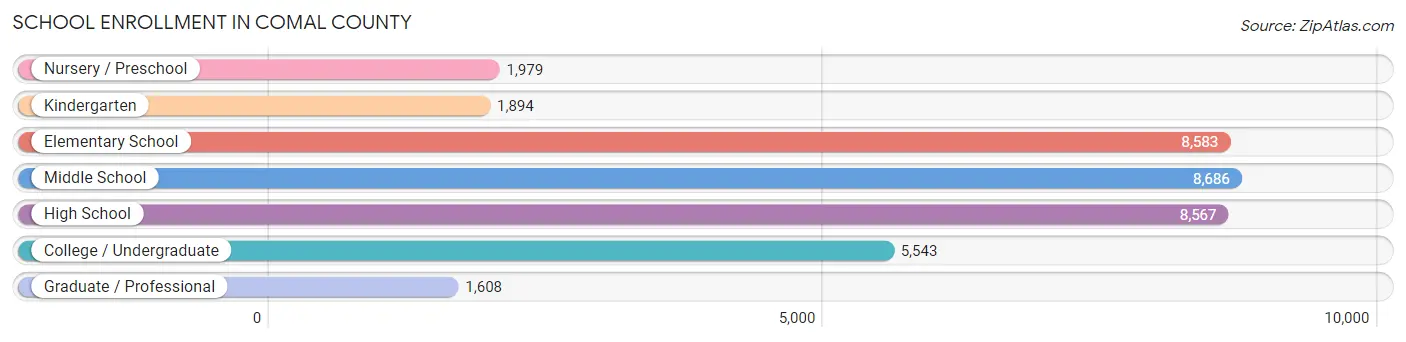
| School Level | # Students | % Students |
| Nursery / Preschool | 1,979 | 5.4% |
| Kindergarten | 1,894 | 5.1% |
| Elementary School | 8,583 | 23.3% |
| Middle School | 8,686 | 23.6% |
| High School | 8,567 | 23.2% |
| College / Undergraduate | 5,543 | 15.0% |
| Graduate / Professional | 1,608 | 4.4% |
| Total | 36,860 | 100.0% |
School Enrollment by Age by Funding Source in Comal County
Out of a total of 36,860 students who are enrolled in schools in Comal County, 6,524 (17.7%) attend a private institution, while the remaining 30,336 (82.3%) are enrolled in public schools. The age group of 3 to 4 year olds has the highest likelihood of being enrolled in private schools, with 686 (46.4% in the age bracket) enrolled. Conversely, the age group of 20 to 24 year olds has the lowest likelihood of being enrolled in a private school, with 1,983 (89.3% in the age bracket) attending a public institution.
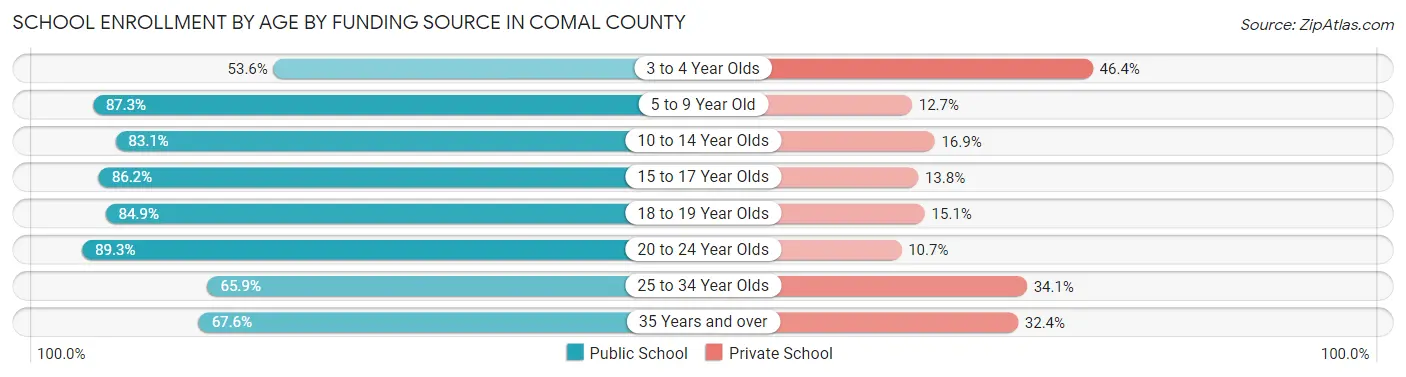
| Age Bracket | Public School | Private School |
| 3 to 4 Year Olds | 793 (53.6%) | 686 (46.4%) |
| 5 to 9 Year Old | 8,700 (87.3%) | 1,264 (12.7%) |
| 10 to 14 Year Olds | 8,597 (83.1%) | 1,751 (16.9%) |
| 15 to 17 Year Olds | 5,433 (86.2%) | 873 (13.8%) |
| 18 to 19 Year Olds | 2,112 (84.9%) | 375 (15.1%) |
| 20 to 24 Year Olds | 1,983 (89.3%) | 238 (10.7%) |
| 25 to 34 Year Olds | 1,301 (65.9%) | 673 (34.1%) |
| 35 Years and over | 1,406 (67.6%) | 675 (32.4%) |
| Total | 30,336 (82.3%) | 6,524 (17.7%) |
Educational Attainment by Field of Study in Comal County
Business (11,862 | 23.7%), education (6,442 | 12.9%), science & technology (5,430 | 10.9%), arts & humanities (4,010 | 8.0%), and engineering (3,825 | 7.7%) are the most common fields of study among 49,951 individuals in Comal County who have obtained a bachelor's degree or higher.
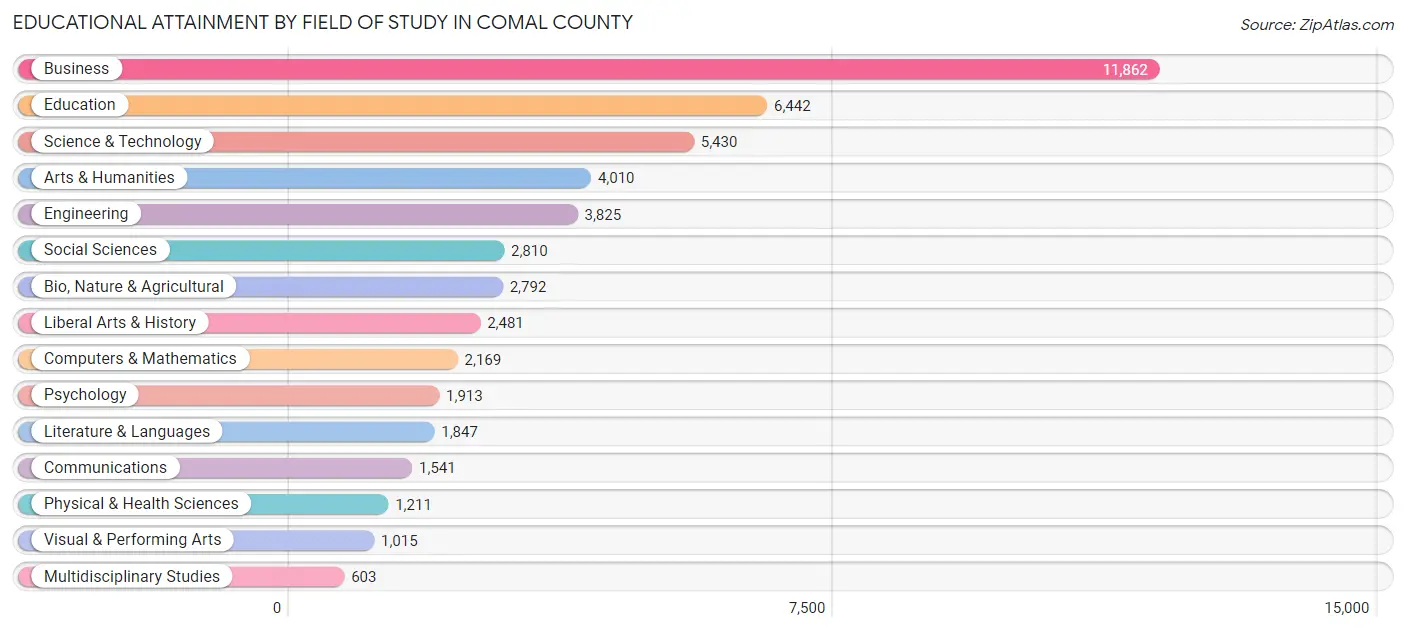
| Field of Study | # Graduates | % Graduates |
| Computers & Mathematics | 2,169 | 4.3% |
| Bio, Nature & Agricultural | 2,792 | 5.6% |
| Physical & Health Sciences | 1,211 | 2.4% |
| Psychology | 1,913 | 3.8% |
| Social Sciences | 2,810 | 5.6% |
| Engineering | 3,825 | 7.7% |
| Multidisciplinary Studies | 603 | 1.2% |
| Science & Technology | 5,430 | 10.9% |
| Business | 11,862 | 23.7% |
| Education | 6,442 | 12.9% |
| Literature & Languages | 1,847 | 3.7% |
| Liberal Arts & History | 2,481 | 5.0% |
| Visual & Performing Arts | 1,015 | 2.0% |
| Communications | 1,541 | 3.1% |
| Arts & Humanities | 4,010 | 8.0% |
| Total | 49,951 | 100.0% |
Transportation & Commute in Comal County
Vehicle Availability by Sex in Comal County
The most prevalent vehicle ownership categories in Comal County are males with 2 vehicles (18,680, accounting for 43.3%) and females with 2 vehicles (14,311, making up 55.3%).
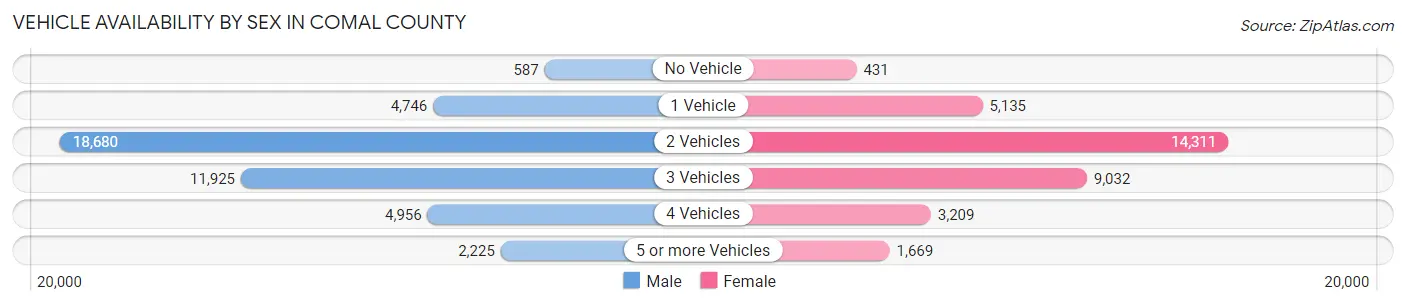
| Vehicles Available | Male | Female |
| No Vehicle | 587 (1.4%) | 431 (1.3%) |
| 1 Vehicle | 4,746 (11.0%) | 5,135 (15.2%) |
| 2 Vehicles | 18,680 (43.3%) | 14,311 (42.4%) |
| 3 Vehicles | 11,925 (27.7%) | 9,032 (26.7%) |
| 4 Vehicles | 4,956 (11.5%) | 3,209 (9.5%) |
| 5 or more Vehicles | 2,225 (5.2%) | 1,669 (4.9%) |
| Total | 43,119 (100.0%) | 33,787 (100.0%) |
Commute Time in Comal County
The most frequently occuring commute durations in Comal County are 30 to 34 minutes (9,372 commuters, 14.3%), 45 to 59 minutes (9,023 commuters, 13.8%), and 10 to 14 minutes (8,998 commuters, 13.7%).
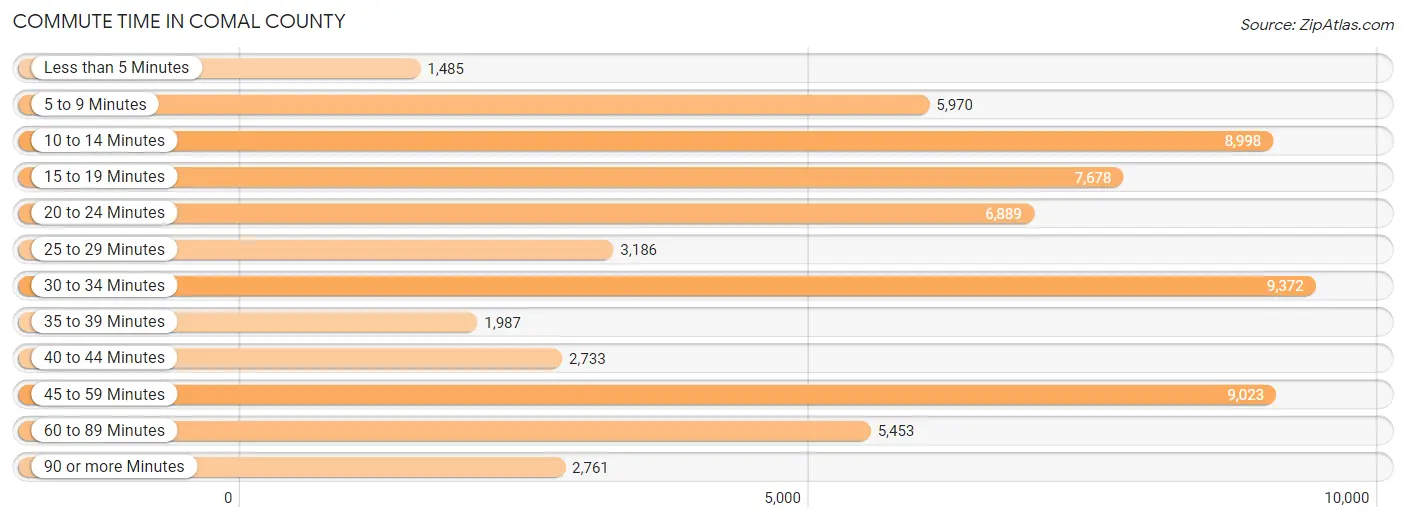
| Commute Time | # Commuters | % Commuters |
| Less than 5 Minutes | 1,485 | 2.3% |
| 5 to 9 Minutes | 5,970 | 9.1% |
| 10 to 14 Minutes | 8,998 | 13.7% |
| 15 to 19 Minutes | 7,678 | 11.7% |
| 20 to 24 Minutes | 6,889 | 10.5% |
| 25 to 29 Minutes | 3,186 | 4.9% |
| 30 to 34 Minutes | 9,372 | 14.3% |
| 35 to 39 Minutes | 1,987 | 3.0% |
| 40 to 44 Minutes | 2,733 | 4.2% |
| 45 to 59 Minutes | 9,023 | 13.8% |
| 60 to 89 Minutes | 5,453 | 8.3% |
| 90 or more Minutes | 2,761 | 4.2% |
Commute Time by Sex in Comal County
The most common commute times in Comal County are 45 to 59 minutes (5,845 commuters, 15.7%) for males and 10 to 14 minutes (4,168 commuters, 14.8%) for females.
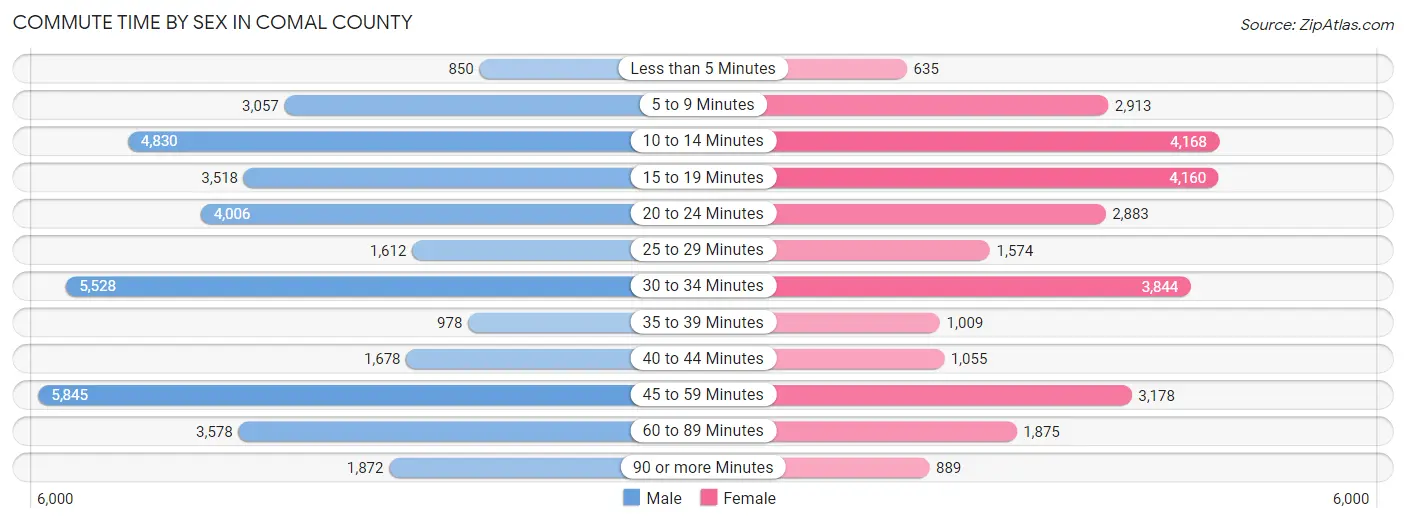
| Commute Time | Male | Female |
| Less than 5 Minutes | 850 (2.3%) | 635 (2.2%) |
| 5 to 9 Minutes | 3,057 (8.2%) | 2,913 (10.3%) |
| 10 to 14 Minutes | 4,830 (12.9%) | 4,168 (14.8%) |
| 15 to 19 Minutes | 3,518 (9.4%) | 4,160 (14.8%) |
| 20 to 24 Minutes | 4,006 (10.7%) | 2,883 (10.2%) |
| 25 to 29 Minutes | 1,612 (4.3%) | 1,574 (5.6%) |
| 30 to 34 Minutes | 5,528 (14.8%) | 3,844 (13.6%) |
| 35 to 39 Minutes | 978 (2.6%) | 1,009 (3.6%) |
| 40 to 44 Minutes | 1,678 (4.5%) | 1,055 (3.7%) |
| 45 to 59 Minutes | 5,845 (15.7%) | 3,178 (11.3%) |
| 60 to 89 Minutes | 3,578 (9.6%) | 1,875 (6.7%) |
| 90 or more Minutes | 1,872 (5.0%) | 889 (3.2%) |
Time of Departure to Work by Sex in Comal County
The most frequent times of departure to work in Comal County are 7:00 AM to 7:29 AM (6,252, 16.7%) for males and 7:00 AM to 7:29 AM (4,770, 16.9%) for females.
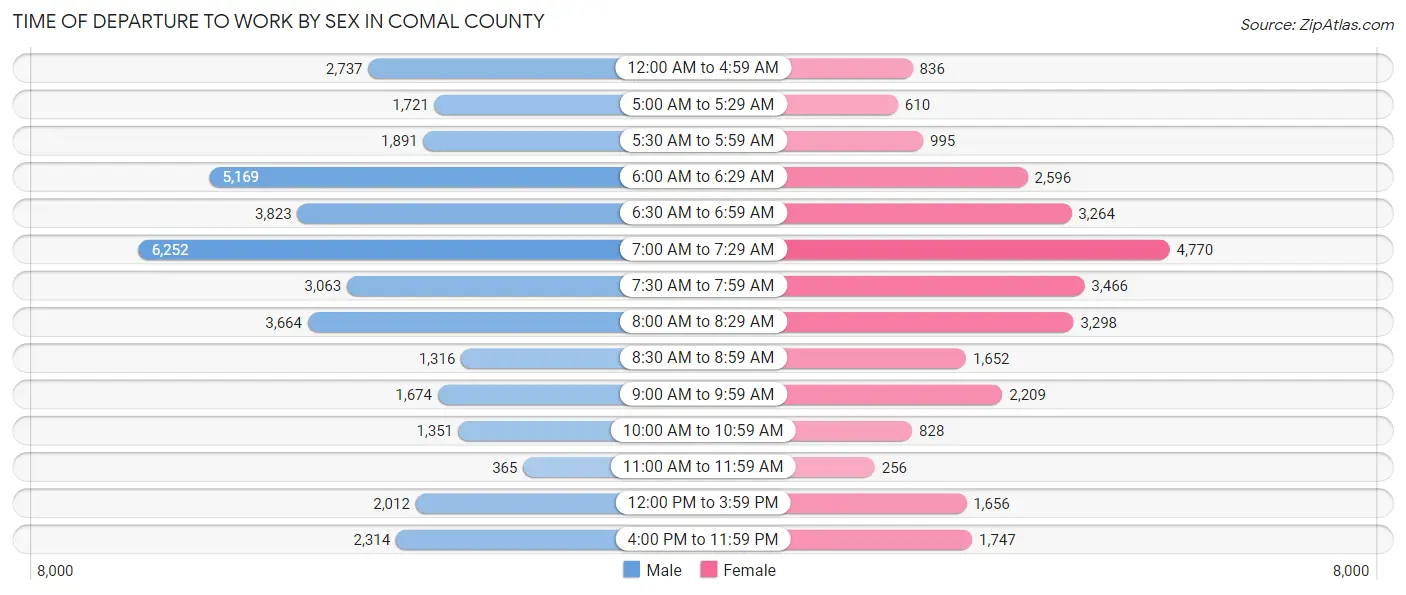
| Time of Departure | Male | Female |
| 12:00 AM to 4:59 AM | 2,737 (7.3%) | 836 (3.0%) |
| 5:00 AM to 5:29 AM | 1,721 (4.6%) | 610 (2.2%) |
| 5:30 AM to 5:59 AM | 1,891 (5.1%) | 995 (3.5%) |
| 6:00 AM to 6:29 AM | 5,169 (13.8%) | 2,596 (9.2%) |
| 6:30 AM to 6:59 AM | 3,823 (10.2%) | 3,264 (11.6%) |
| 7:00 AM to 7:29 AM | 6,252 (16.7%) | 4,770 (16.9%) |
| 7:30 AM to 7:59 AM | 3,063 (8.2%) | 3,466 (12.3%) |
| 8:00 AM to 8:29 AM | 3,664 (9.8%) | 3,298 (11.7%) |
| 8:30 AM to 8:59 AM | 1,316 (3.5%) | 1,652 (5.9%) |
| 9:00 AM to 9:59 AM | 1,674 (4.5%) | 2,209 (7.8%) |
| 10:00 AM to 10:59 AM | 1,351 (3.6%) | 828 (2.9%) |
| 11:00 AM to 11:59 AM | 365 (1.0%) | 256 (0.9%) |
| 12:00 PM to 3:59 PM | 2,012 (5.4%) | 1,656 (5.9%) |
| 4:00 PM to 11:59 PM | 2,314 (6.2%) | 1,747 (6.2%) |
| Total | 37,352 (100.0%) | 28,183 (100.0%) |
Housing Occupancy in Comal County
Occupancy by Ownership in Comal County
Of the total 63,957 dwellings in Comal County, owner-occupied units account for 48,512 (75.8%), while renter-occupied units make up 15,445 (24.1%).
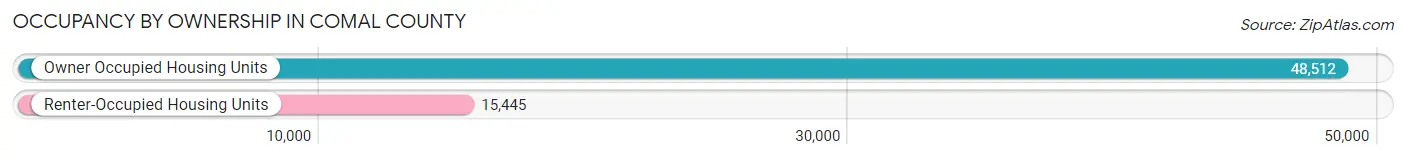
| Occupancy | # Housing Units | % Housing Units |
| Owner Occupied Housing Units | 48,512 | 75.8% |
| Renter-Occupied Housing Units | 15,445 | 24.1% |
| Total Occupied Housing Units | 63,957 | 100.0% |
Occupancy by Household Size in Comal County
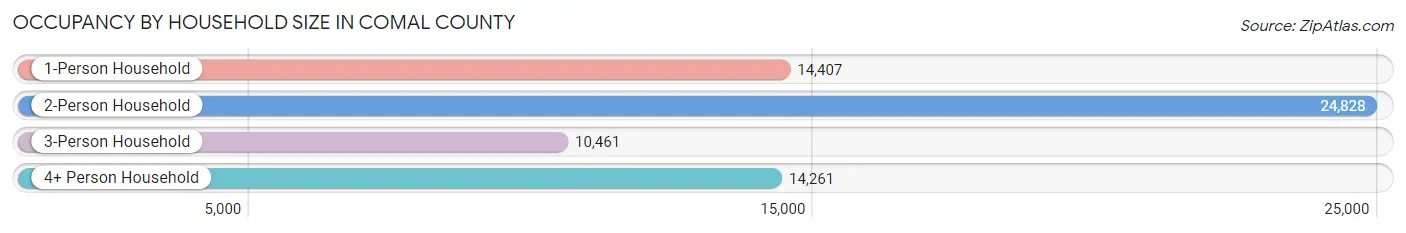
| Household Size | # Housing Units | % Housing Units |
| 1-Person Household | 14,407 | 22.5% |
| 2-Person Household | 24,828 | 38.8% |
| 3-Person Household | 10,461 | 16.4% |
| 4+ Person Household | 14,261 | 22.3% |
| Total Housing Units | 63,957 | 100.0% |
Occupancy by Ownership by Household Size in Comal County
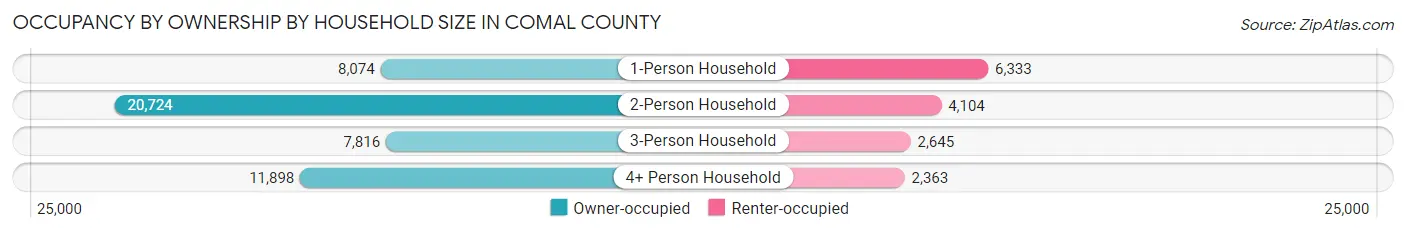
| Household Size | Owner-occupied | Renter-occupied |
| 1-Person Household | 8,074 (56.0%) | 6,333 (44.0%) |
| 2-Person Household | 20,724 (83.5%) | 4,104 (16.5%) |
| 3-Person Household | 7,816 (74.7%) | 2,645 (25.3%) |
| 4+ Person Household | 11,898 (83.4%) | 2,363 (16.6%) |
| Total Housing Units | 48,512 (75.8%) | 15,445 (24.1%) |
Occupancy by Educational Attainment in Comal County
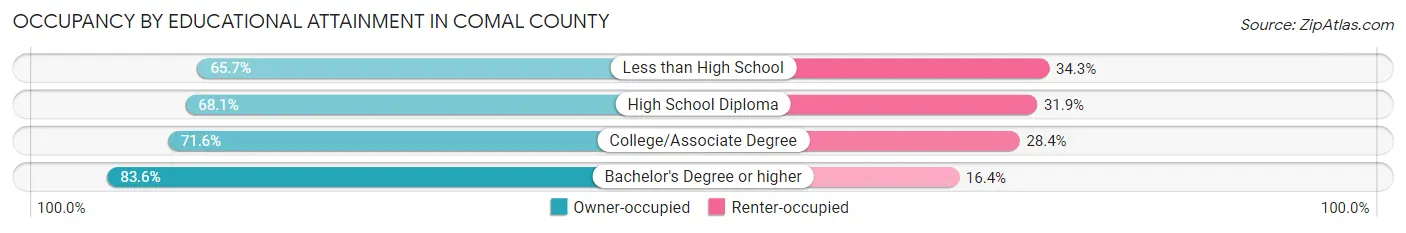
| Household Size | Owner-occupied | Renter-occupied |
| Less than High School | 2,157 (65.7%) | 1,125 (34.3%) |
| High School Diploma | 8,552 (68.1%) | 4,003 (31.9%) |
| College/Associate Degree | 14,462 (71.6%) | 5,738 (28.4%) |
| Bachelor's Degree or higher | 23,341 (83.6%) | 4,579 (16.4%) |
Occupancy by Age of Householder in Comal County
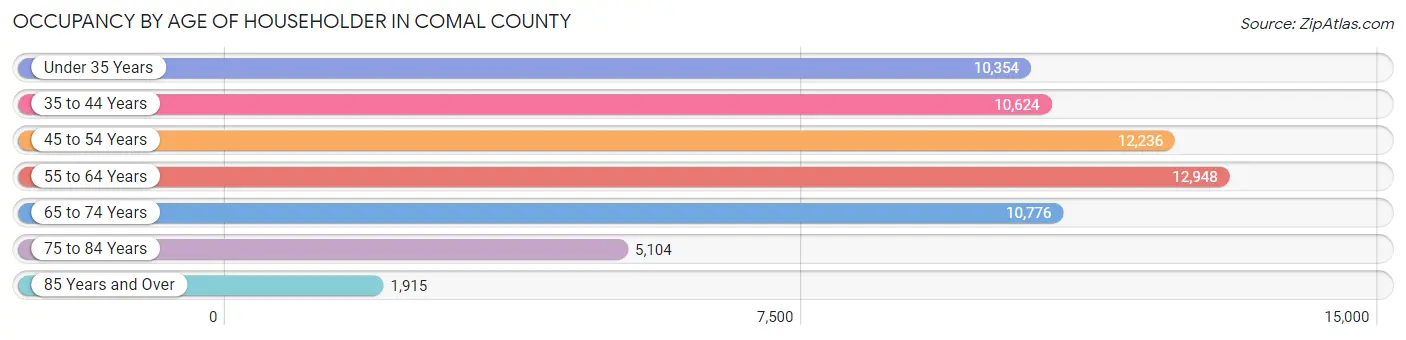
| Age Bracket | # Households | % Households |
| Under 35 Years | 10,354 | 16.2% |
| 35 to 44 Years | 10,624 | 16.6% |
| 45 to 54 Years | 12,236 | 19.1% |
| 55 to 64 Years | 12,948 | 20.2% |
| 65 to 74 Years | 10,776 | 16.9% |
| 75 to 84 Years | 5,104 | 8.0% |
| 85 Years and Over | 1,915 | 3.0% |
| Total | 63,957 | 100.0% |
Housing Finances in Comal County
Median Income by Occupancy in Comal County
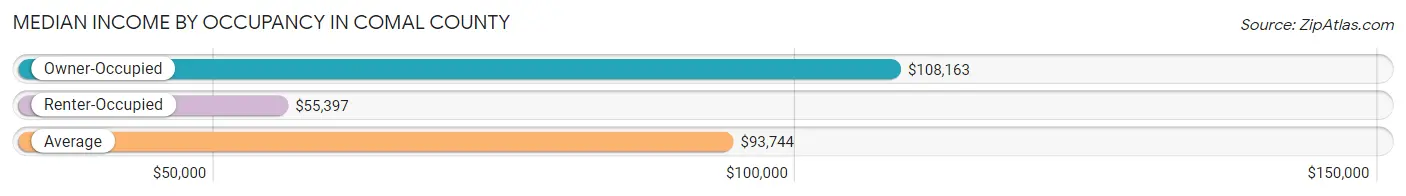
| Occupancy Type | # Households | Median Income |
| Owner-Occupied | 48,512 (75.8%) | $108,163 |
| Renter-Occupied | 15,445 (24.1%) | $55,397 |
| Average | 63,957 (100.0%) | $93,744 |
Occupancy by Householder Income Bracket in Comal County
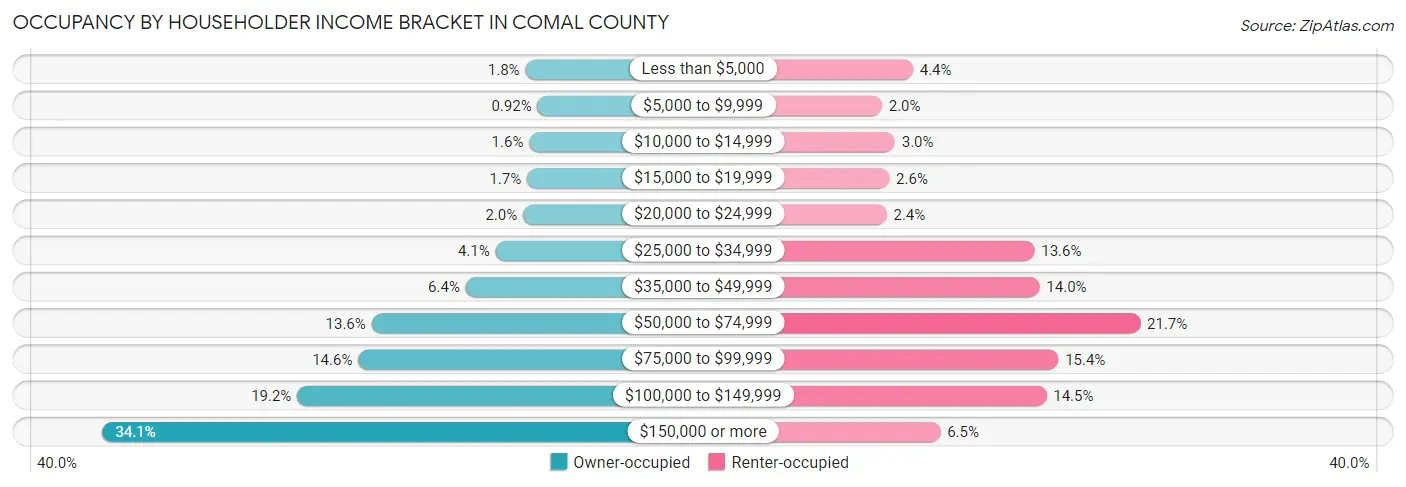
| Income Bracket | Owner-occupied | Renter-occupied |
| Less than $5,000 | 894 (1.8%) | 673 (4.4%) |
| $5,000 to $9,999 | 446 (0.9%) | 309 (2.0%) |
| $10,000 to $14,999 | 751 (1.5%) | 462 (3.0%) |
| $15,000 to $19,999 | 836 (1.7%) | 396 (2.6%) |
| $20,000 to $24,999 | 981 (2.0%) | 364 (2.4%) |
| $25,000 to $34,999 | 1,999 (4.1%) | 2,103 (13.6%) |
| $35,000 to $49,999 | 3,098 (6.4%) | 2,164 (14.0%) |
| $50,000 to $74,999 | 6,579 (13.6%) | 3,349 (21.7%) |
| $75,000 to $99,999 | 7,071 (14.6%) | 2,385 (15.4%) |
| $100,000 to $149,999 | 9,328 (19.2%) | 2,244 (14.5%) |
| $150,000 or more | 16,529 (34.1%) | 996 (6.5%) |
| Total | 48,512 (100.0%) | 15,445 (100.0%) |
Monthly Housing Cost Tiers in Comal County
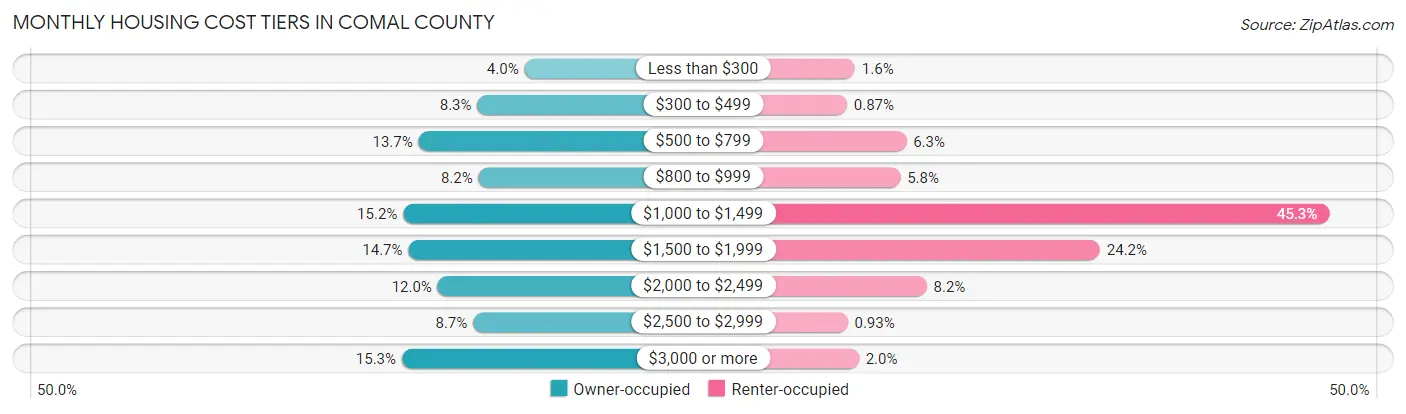
| Monthly Cost | Owner-occupied | Renter-occupied |
| Less than $300 | 1,930 (4.0%) | 249 (1.6%) |
| $300 to $499 | 4,038 (8.3%) | 134 (0.9%) |
| $500 to $799 | 6,659 (13.7%) | 978 (6.3%) |
| $800 to $999 | 3,984 (8.2%) | 893 (5.8%) |
| $1,000 to $1,499 | 7,350 (15.1%) | 6,991 (45.3%) |
| $1,500 to $1,999 | 7,115 (14.7%) | 3,732 (24.2%) |
| $2,000 to $2,499 | 5,806 (12.0%) | 1,268 (8.2%) |
| $2,500 to $2,999 | 4,223 (8.7%) | 144 (0.9%) |
| $3,000 or more | 7,407 (15.3%) | 303 (2.0%) |
| Total | 48,512 (100.0%) | 15,445 (100.0%) |
Physical Housing Characteristics in Comal County
Housing Structures in Comal County
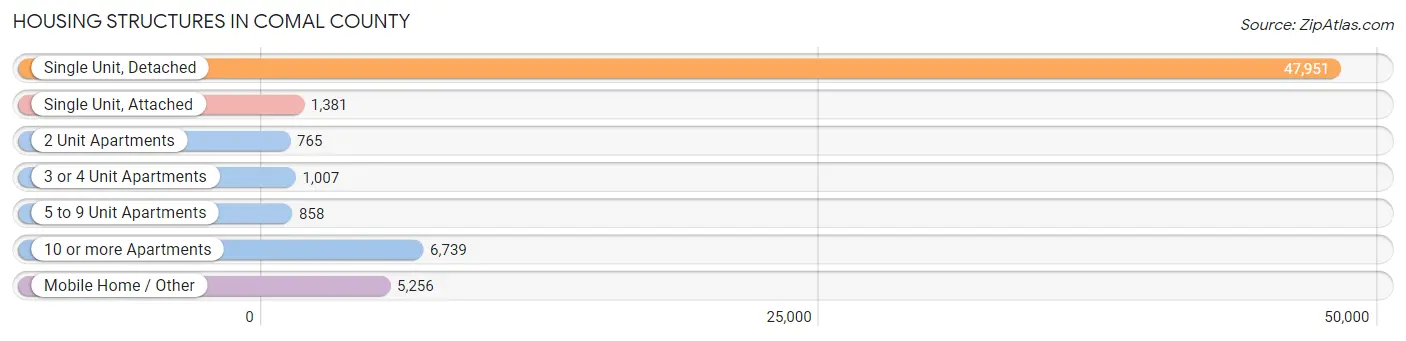
| Structure Type | # Housing Units | % Housing Units |
| Single Unit, Detached | 47,951 | 75.0% |
| Single Unit, Attached | 1,381 | 2.2% |
| 2 Unit Apartments | 765 | 1.2% |
| 3 or 4 Unit Apartments | 1,007 | 1.6% |
| 5 to 9 Unit Apartments | 858 | 1.3% |
| 10 or more Apartments | 6,739 | 10.5% |
| Mobile Home / Other | 5,256 | 8.2% |
| Total | 63,957 | 100.0% |
Housing Structures by Occupancy in Comal County
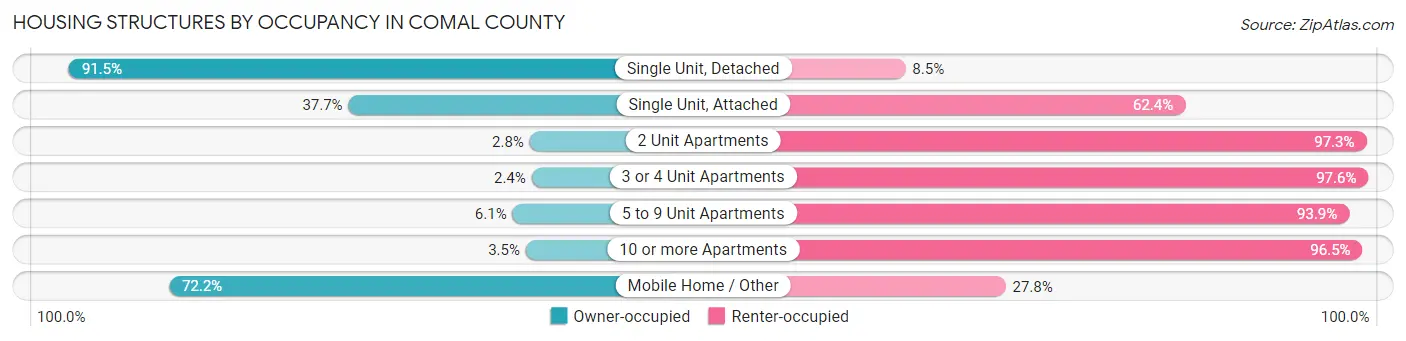
| Structure Type | Owner-occupied | Renter-occupied |
| Single Unit, Detached | 43,864 (91.5%) | 4,087 (8.5%) |
| Single Unit, Attached | 520 (37.7%) | 861 (62.4%) |
| 2 Unit Apartments | 21 (2.8%) | 744 (97.3%) |
| 3 or 4 Unit Apartments | 24 (2.4%) | 983 (97.6%) |
| 5 to 9 Unit Apartments | 52 (6.1%) | 806 (93.9%) |
| 10 or more Apartments | 236 (3.5%) | 6,503 (96.5%) |
| Mobile Home / Other | 3,795 (72.2%) | 1,461 (27.8%) |
| Total | 48,512 (75.8%) | 15,445 (24.1%) |
Housing Structures by Number of Rooms in Comal County
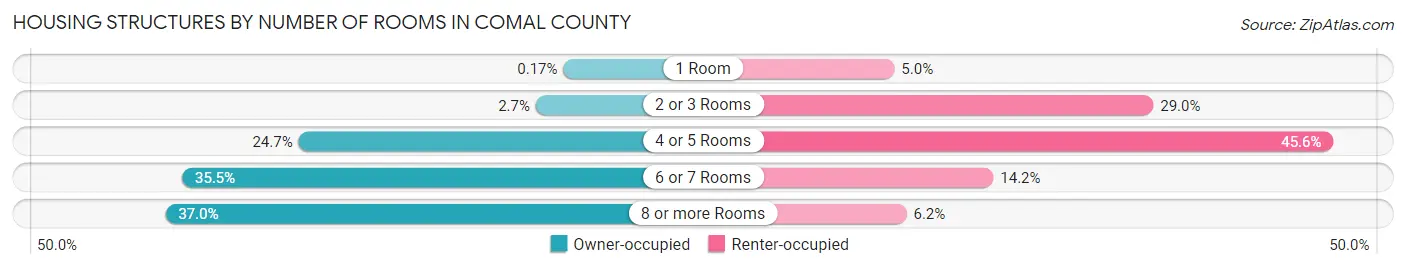
| Number of Rooms | Owner-occupied | Renter-occupied |
| 1 Room | 82 (0.2%) | 778 (5.0%) |
| 2 or 3 Rooms | 1,318 (2.7%) | 4,476 (29.0%) |
| 4 or 5 Rooms | 11,969 (24.7%) | 7,048 (45.6%) |
| 6 or 7 Rooms | 17,196 (35.4%) | 2,191 (14.2%) |
| 8 or more Rooms | 17,947 (37.0%) | 952 (6.2%) |
| Total | 48,512 (100.0%) | 15,445 (100.0%) |
Housing Structure by Heating Type in Comal County
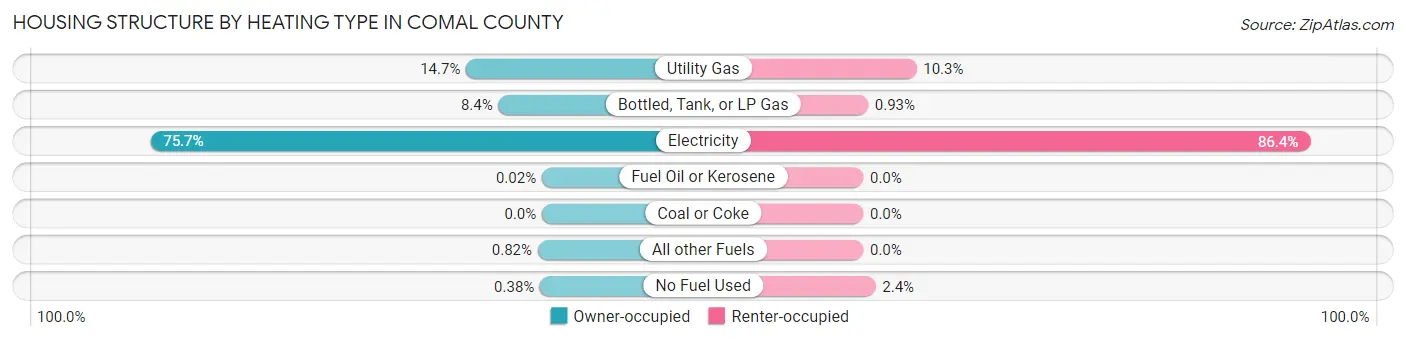
| Heating Type | Owner-occupied | Renter-occupied |
| Utility Gas | 7,114 (14.7%) | 1,590 (10.3%) |
| Bottled, Tank, or LP Gas | 4,078 (8.4%) | 144 (0.9%) |
| Electricity | 36,728 (75.7%) | 13,343 (86.4%) |
| Fuel Oil or Kerosene | 11 (0.0%) | 0 (0.0%) |
| Coal or Coke | 0 (0.0%) | 0 (0.0%) |
| All other Fuels | 399 (0.8%) | 0 (0.0%) |
| No Fuel Used | 182 (0.4%) | 368 (2.4%) |
| Total | 48,512 (100.0%) | 15,445 (100.0%) |
Household Vehicle Usage in Comal County
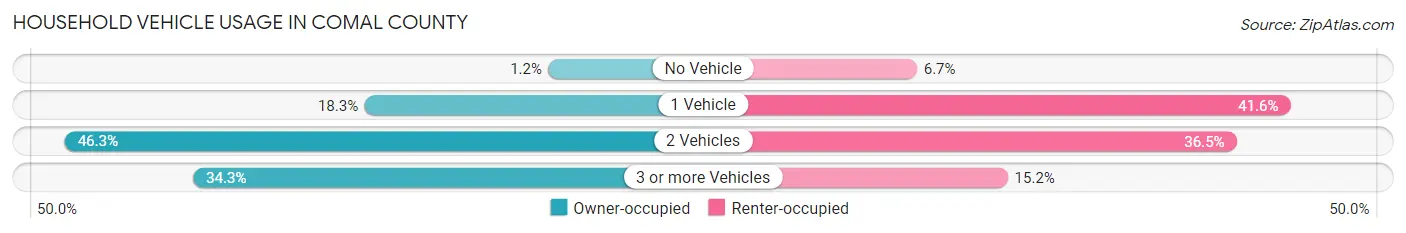
| Vehicles per Household | Owner-occupied | Renter-occupied |
| No Vehicle | 563 (1.2%) | 1,036 (6.7%) |
| 1 Vehicle | 8,885 (18.3%) | 6,420 (41.6%) |
| 2 Vehicles | 22,437 (46.3%) | 5,643 (36.5%) |
| 3 or more Vehicles | 16,627 (34.3%) | 2,346 (15.2%) |
| Total | 48,512 (100.0%) | 15,445 (100.0%) |
Real Estate & Mortgages in Comal County
Real Estate and Mortgage Overview in Comal County
| Characteristic | Without Mortgage | With Mortgage |
| Housing Units | 19,338 | 29,174 |
| Median Property Value | $312,300 | $395,100 |
| Median Household Income | $79,892 | $12,218 |
| Monthly Housing Costs | $668 | $7,349 |
| Real Estate Taxes | $3,705 | $1,885 |
Property Value by Mortgage Status in Comal County
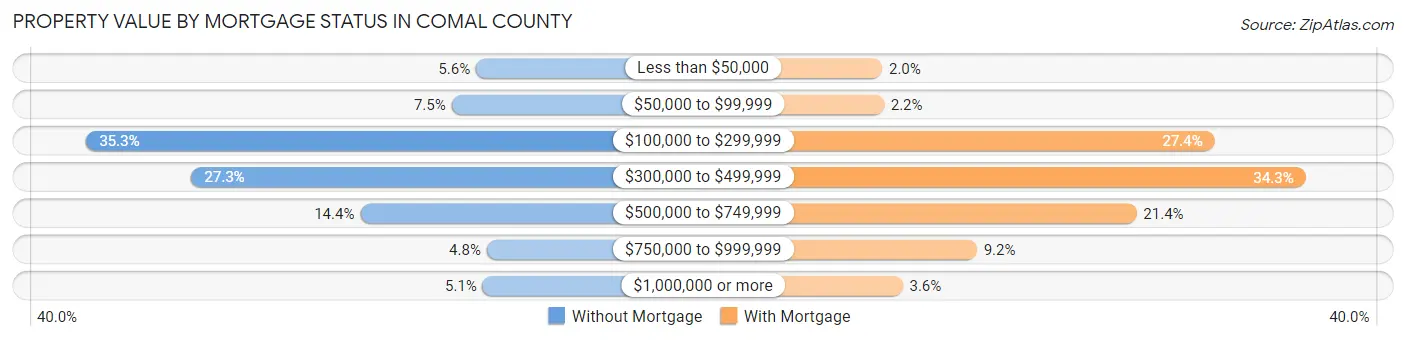
| Property Value | Without Mortgage | With Mortgage |
| Less than $50,000 | 1,085 (5.6%) | 589 (2.0%) |
| $50,000 to $99,999 | 1,445 (7.5%) | 627 (2.1%) |
| $100,000 to $299,999 | 6,827 (35.3%) | 7,978 (27.4%) |
| $300,000 to $499,999 | 5,277 (27.3%) | 10,001 (34.3%) |
| $500,000 to $749,999 | 2,791 (14.4%) | 6,243 (21.4%) |
| $750,000 to $999,999 | 926 (4.8%) | 2,693 (9.2%) |
| $1,000,000 or more | 987 (5.1%) | 1,043 (3.6%) |
| Total | 19,338 (100.0%) | 29,174 (100.0%) |
Household Income by Mortgage Status in Comal County
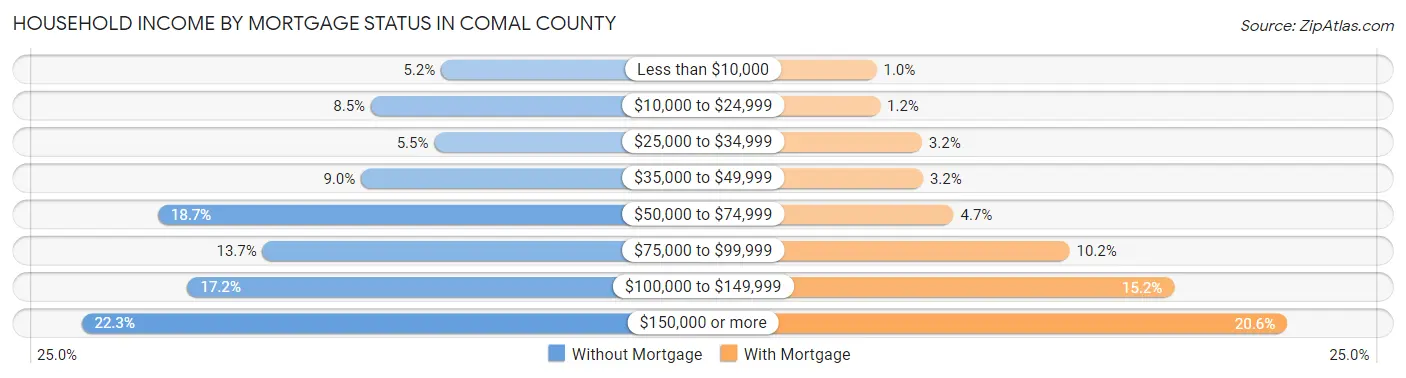
| Household Income | Without Mortgage | With Mortgage |
| Less than $10,000 | 999 (5.2%) | 293 (1.0%) |
| $10,000 to $24,999 | 1,645 (8.5%) | 341 (1.2%) |
| $25,000 to $34,999 | 1,062 (5.5%) | 923 (3.2%) |
| $35,000 to $49,999 | 1,736 (9.0%) | 937 (3.2%) |
| $50,000 to $74,999 | 3,607 (18.6%) | 1,362 (4.7%) |
| $75,000 to $99,999 | 2,644 (13.7%) | 2,972 (10.2%) |
| $100,000 to $149,999 | 3,334 (17.2%) | 4,427 (15.2%) |
| $150,000 or more | 4,311 (22.3%) | 5,994 (20.5%) |
| Total | 19,338 (100.0%) | 29,174 (100.0%) |
Property Value to Household Income Ratio in Comal County
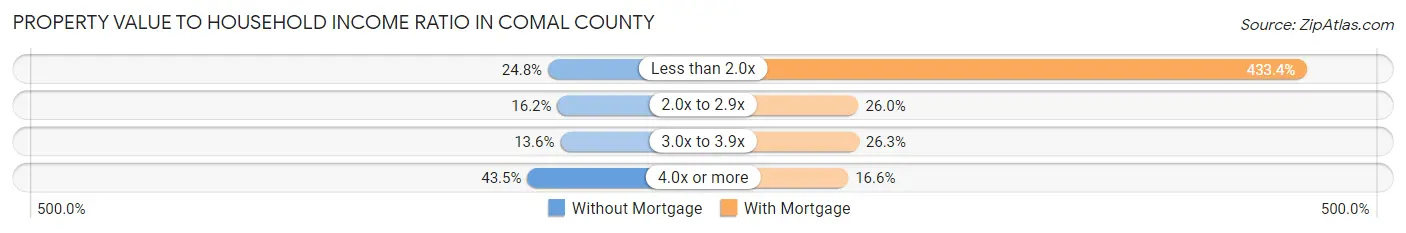
| Value-to-Income Ratio | Without Mortgage | With Mortgage |
| Less than 2.0x | 4,798 (24.8%) | 126,429 (433.4%) |
| 2.0x to 2.9x | 3,132 (16.2%) | 7,571 (26.0%) |
| 3.0x to 3.9x | 2,630 (13.6%) | 7,669 (26.3%) |
| 4.0x or more | 8,412 (43.5%) | 4,848 (16.6%) |
| Total | 19,338 (100.0%) | 29,174 (100.0%) |
Real Estate Taxes by Mortgage Status in Comal County
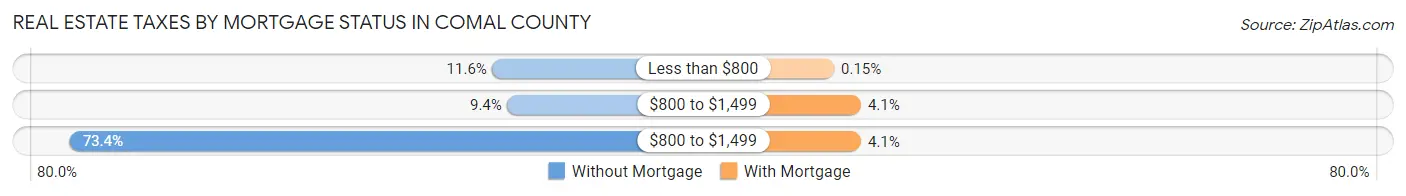
| Property Taxes | Without Mortgage | With Mortgage |
| Less than $800 | 2,245 (11.6%) | 43 (0.2%) |
| $800 to $1,499 | 1,821 (9.4%) | 1,190 (4.1%) |
| $800 to $1,499 | 14,195 (73.4%) | 1,193 (4.1%) |
| Total | 19,338 (100.0%) | 29,174 (100.0%) |
Health & Disability in Comal County
Health Insurance Coverage by Age in Comal County
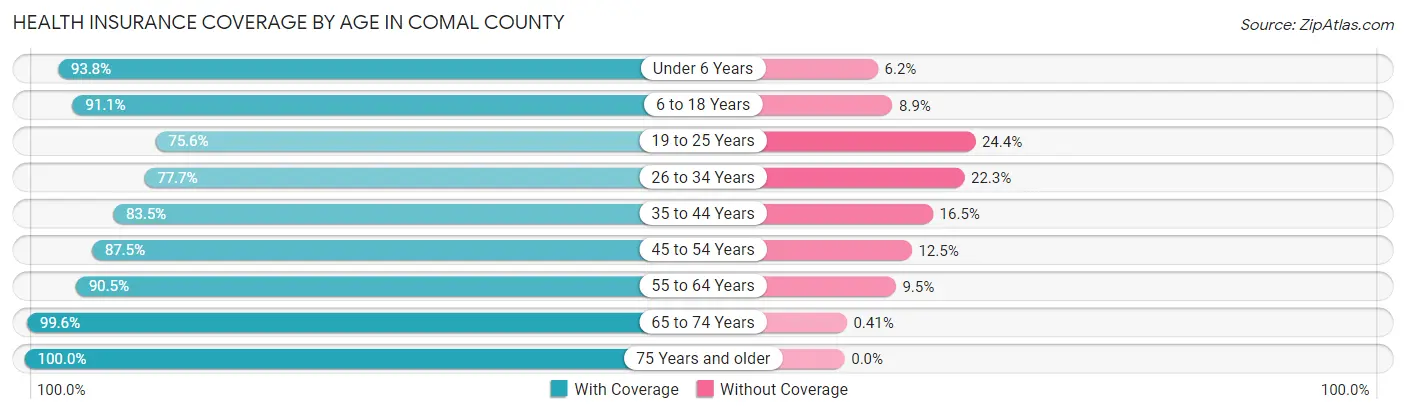
| Age Bracket | With Coverage | Without Coverage |
| Under 6 Years | 10,104 (93.8%) | 669 (6.2%) |
| 6 to 18 Years | 25,665 (91.1%) | 2,511 (8.9%) |
| 19 to 25 Years | 9,135 (75.6%) | 2,944 (24.4%) |
| 26 to 34 Years | 13,088 (77.7%) | 3,762 (22.3%) |
| 35 to 44 Years | 17,595 (83.5%) | 3,471 (16.5%) |
| 45 to 54 Years | 18,672 (87.5%) | 2,675 (12.5%) |
| 55 to 64 Years | 21,486 (90.5%) | 2,267 (9.5%) |
| 65 to 74 Years | 18,800 (99.6%) | 77 (0.4%) |
| 75 Years and older | 10,874 (100.0%) | 0 (0.0%) |
| Total | 145,419 (88.8%) | 18,376 (11.2%) |
Health Insurance Coverage by Citizenship Status in Comal County
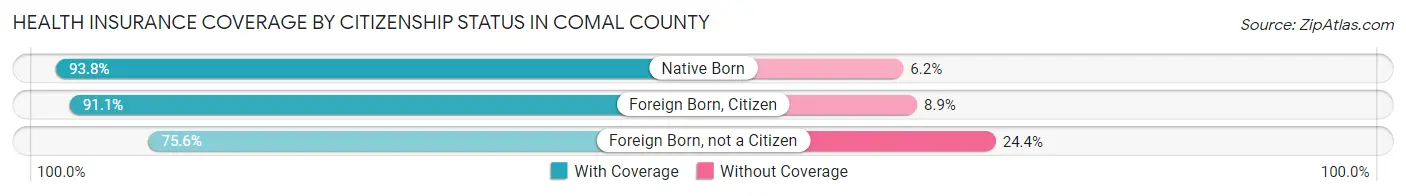
| Citizenship Status | With Coverage | Without Coverage |
| Native Born | 10,104 (93.8%) | 669 (6.2%) |
| Foreign Born, Citizen | 25,665 (91.1%) | 2,511 (8.9%) |
| Foreign Born, not a Citizen | 9,135 (75.6%) | 2,944 (24.4%) |
Health Insurance Coverage by Household Income in Comal County
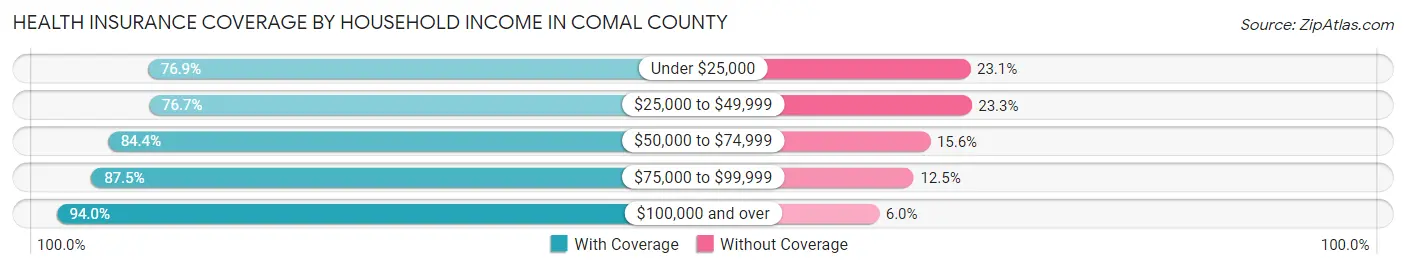
| Household Income | With Coverage | Without Coverage |
| Under $25,000 | 7,592 (76.9%) | 2,279 (23.1%) |
| $25,000 to $49,999 | 12,989 (76.7%) | 3,953 (23.3%) |
| $50,000 to $74,999 | 19,299 (84.4%) | 3,562 (15.6%) |
| $75,000 to $99,999 | 23,176 (87.5%) | 3,307 (12.5%) |
| $100,000 and over | 82,108 (94.0%) | 5,235 (6.0%) |
Public vs Private Health Insurance Coverage by Age in Comal County
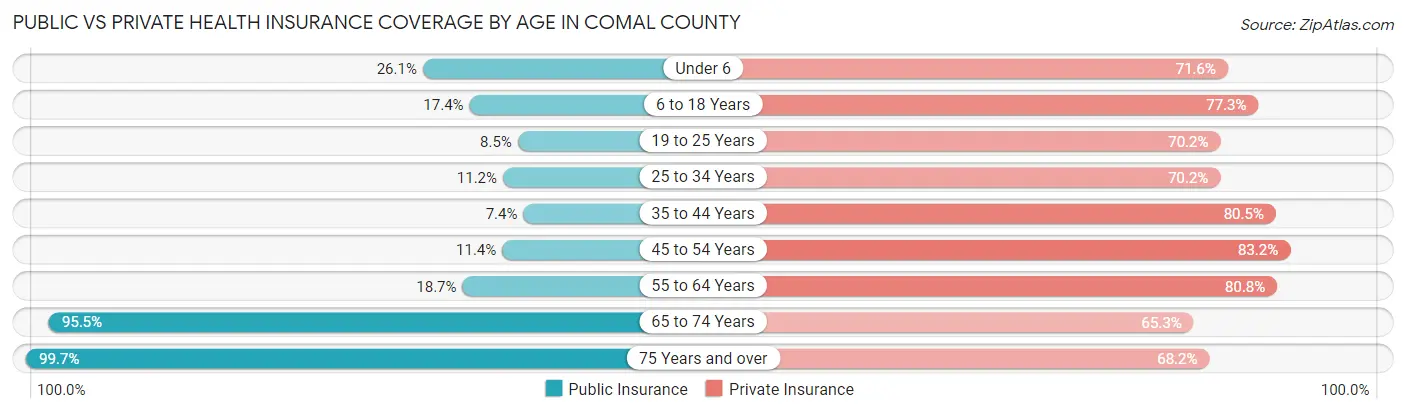
| Age Bracket | Public Insurance | Private Insurance |
| Under 6 | 2,812 (26.1%) | 7,718 (71.6%) |
| 6 to 18 Years | 4,913 (17.4%) | 21,783 (77.3%) |
| 19 to 25 Years | 1,023 (8.5%) | 8,484 (70.2%) |
| 25 to 34 Years | 1,892 (11.2%) | 11,834 (70.2%) |
| 35 to 44 Years | 1,565 (7.4%) | 16,967 (80.5%) |
| 45 to 54 Years | 2,427 (11.4%) | 17,761 (83.2%) |
| 55 to 64 Years | 4,451 (18.7%) | 19,191 (80.8%) |
| 65 to 74 Years | 18,026 (95.5%) | 12,327 (65.3%) |
| 75 Years and over | 10,844 (99.7%) | 7,416 (68.2%) |
| Total | 47,953 (29.3%) | 123,481 (75.4%) |
Disability Status by Sex by Age in Comal County
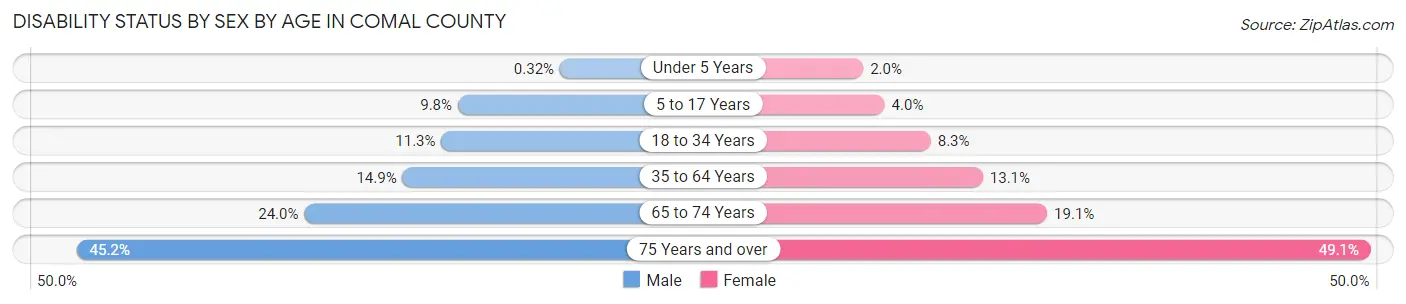
| Age Bracket | Male | Female |
| Under 5 Years | 15 (0.3%) | 85 (2.0%) |
| 5 to 17 Years | 1,382 (9.8%) | 541 (4.0%) |
| 18 to 34 Years | 1,806 (11.3%) | 1,259 (8.3%) |
| 35 to 64 Years | 4,910 (14.9%) | 4,357 (13.1%) |
| 65 to 74 Years | 2,211 (24.0%) | 1,845 (19.1%) |
| 75 Years and over | 2,199 (45.2%) | 2,949 (49.1%) |
Disability Class by Sex by Age in Comal County
Disability Class: Hearing Difficulty
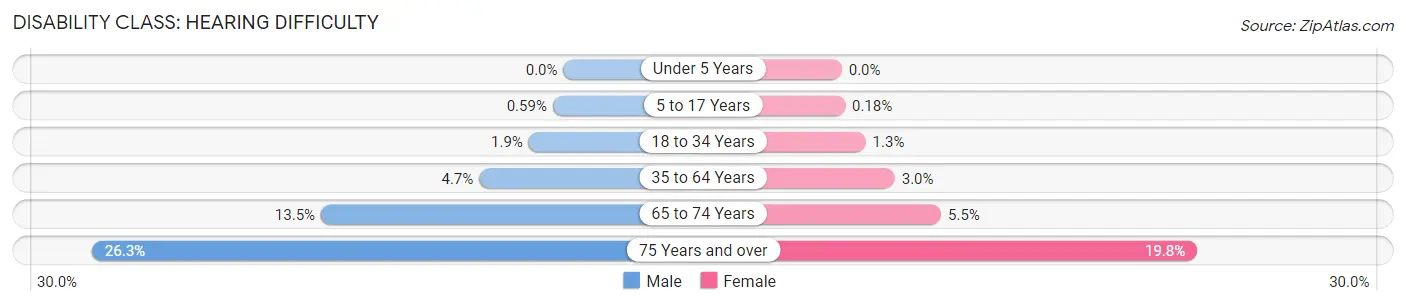
| Age Bracket | Male | Female |
| Under 5 Years | 0 (0.0%) | 0 (0.0%) |
| 5 to 17 Years | 84 (0.6%) | 24 (0.2%) |
| 18 to 34 Years | 308 (1.9%) | 202 (1.3%) |
| 35 to 64 Years | 1,543 (4.7%) | 983 (2.9%) |
| 65 to 74 Years | 1,242 (13.5%) | 535 (5.5%) |
| 75 Years and over | 1,278 (26.3%) | 1,188 (19.8%) |
Disability Class: Vision Difficulty
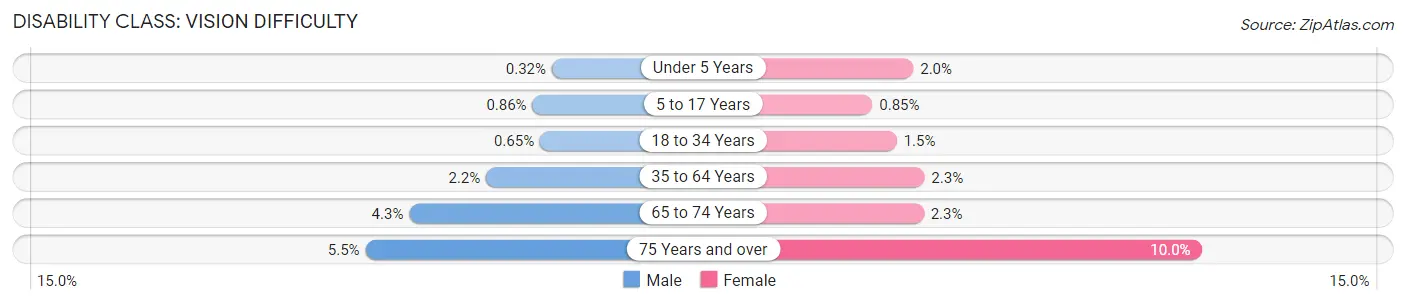
| Age Bracket | Male | Female |
| Under 5 Years | 15 (0.3%) | 85 (2.0%) |
| 5 to 17 Years | 121 (0.9%) | 116 (0.9%) |
| 18 to 34 Years | 104 (0.6%) | 233 (1.5%) |
| 35 to 64 Years | 706 (2.1%) | 764 (2.3%) |
| 65 to 74 Years | 395 (4.3%) | 221 (2.3%) |
| 75 Years and over | 268 (5.5%) | 603 (10.0%) |
Disability Class: Cognitive Difficulty
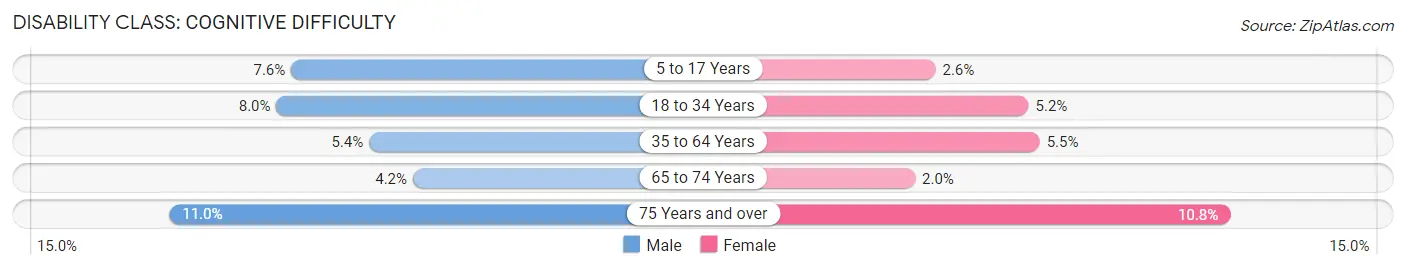
| Age Bracket | Male | Female |
| 5 to 17 Years | 1,070 (7.6%) | 355 (2.6%) |
| 18 to 34 Years | 1,275 (8.0%) | 793 (5.2%) |
| 35 to 64 Years | 1,778 (5.4%) | 1,834 (5.5%) |
| 65 to 74 Years | 385 (4.2%) | 197 (2.0%) |
| 75 Years and over | 534 (11.0%) | 649 (10.8%) |
Disability Class: Ambulatory Difficulty
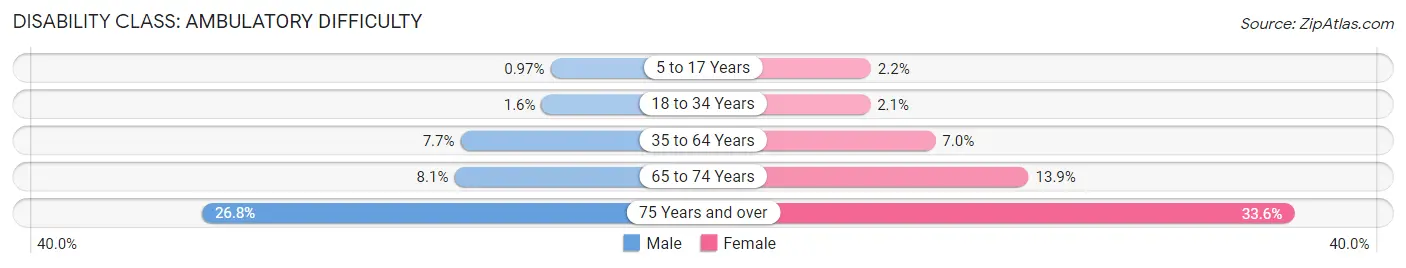
| Age Bracket | Male | Female |
| 5 to 17 Years | 137 (1.0%) | 294 (2.2%) |
| 18 to 34 Years | 260 (1.6%) | 321 (2.1%) |
| 35 to 64 Years | 2,514 (7.6%) | 2,314 (7.0%) |
| 65 to 74 Years | 745 (8.1%) | 1,343 (13.9%) |
| 75 Years and over | 1,306 (26.8%) | 2,016 (33.6%) |
Disability Class: Self-Care Difficulty
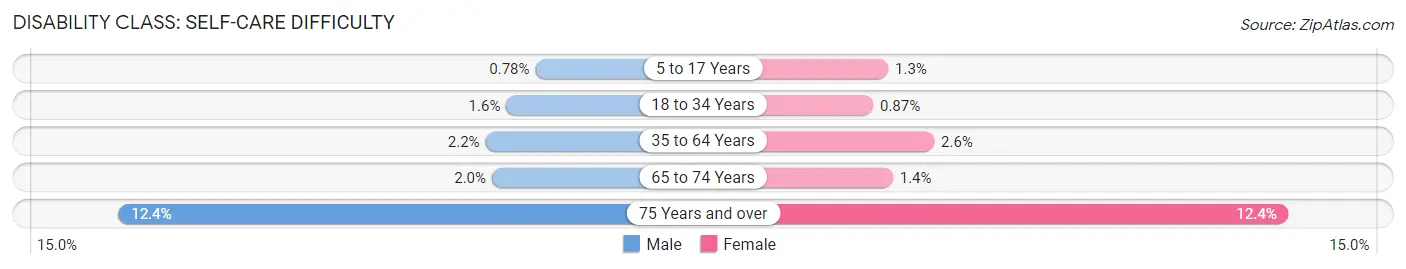
| Age Bracket | Male | Female |
| 5 to 17 Years | 110 (0.8%) | 175 (1.3%) |
| 18 to 34 Years | 253 (1.6%) | 133 (0.9%) |
| 35 to 64 Years | 714 (2.2%) | 854 (2.6%) |
| 65 to 74 Years | 183 (2.0%) | 137 (1.4%) |
| 75 Years and over | 603 (12.4%) | 747 (12.4%) |
Technology Access in Comal County
Computing Device Access in Comal County
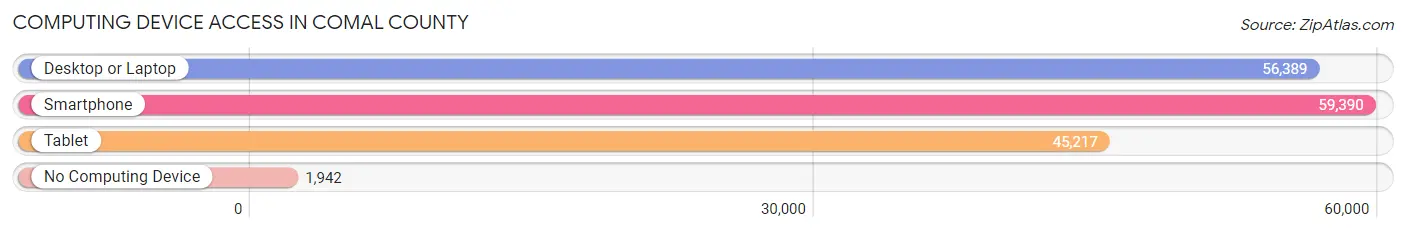
| Device Type | # Households | % Households |
| Desktop or Laptop | 56,389 | 88.2% |
| Smartphone | 59,390 | 92.9% |
| Tablet | 45,217 | 70.7% |
| No Computing Device | 1,942 | 3.0% |
| Total | 63,957 | 100.0% |
Internet Access in Comal County
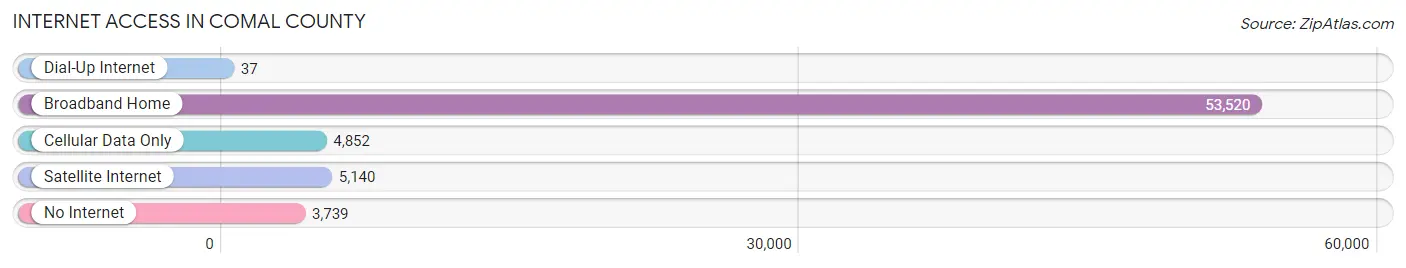
| Internet Type | # Households | % Households |
| Dial-Up Internet | 37 | 0.1% |
| Broadband Home | 53,520 | 83.7% |
| Cellular Data Only | 4,852 | 7.6% |
| Satellite Internet | 5,140 | 8.0% |
| No Internet | 3,739 | 5.9% |
| Total | 63,957 | 100.0% |
Comal County Summary
Comal County is located in the south-central region of Texas, and is part of the San Antonio-New Braunfels Metropolitan Statistical Area. The county is bordered by Kendall County to the north, Guadalupe County to the east, Hays County to the south, and Bexar County to the west. Comal County covers an area of 575 square miles and has a population of 131,086 as of the 2020 census.
History
Comal County was established in 1846, and is named after the Comal River, which runs through the county. The county was originally part of the Mexican state of Coahuila y Tejas, and was part of the Republic of Texas after the Texas Revolution. The county was organized in 1846, and the first county seat was located in New Braunfels. The county seat was moved to Comal in 1852, and then to Bulverde in 1858. The county seat was moved back to New Braunfels in 1867, where it has remained ever since.
Geography
Comal County is located in the south-central region of Texas, and is part of the San Antonio-New Braunfels Metropolitan Statistical Area. The county is bordered by Kendall County to the north, Guadalupe County to the east, Hays County to the south, and Bexar County to the west. Comal County covers an area of 575 square miles and has a population of 131,086 as of the 2020 census.
The county is located in the Edwards Plateau region of Texas, and is characterized by rolling hills and limestone outcroppings. The county is home to several rivers and streams, including the Comal River, Guadalupe River, and San Marcos River. The county is also home to several state parks, including Guadalupe River State Park, Canyon Lake State Park, and Hill Country State Natural Area.
Economy
Comal County has a diverse economy, with a mix of manufacturing, retail, and service industries. The county is home to several large employers, including Schlitterbahn Waterpark and Resort, New Braunfels Utilities, and the Comal Independent School District. The county is also home to several smaller businesses, including wineries, breweries, and restaurants.
The county is also home to several tourist attractions, including the Schlitterbahn Waterpark and Resort, Natural Bridge Caverns, and the Guadalupe River State Park. Tourism is a major contributor to the county’s economy, and the county is home to several festivals and events throughout the year, including Wurstfest, the New Braunfels Farmers Market, and the Comal County Fair.
Demographics
As of the 2020 census, Comal County had a population of 131,086. The population is predominantly white (77.2%), with smaller percentages of Hispanic (17.3%), African American (2.2%), and Asian (1.7%) residents. The median household income in the county is $63,945, and the median home value is $223,400. The county has a poverty rate of 11.2%, and the unemployment rate is 3.7%.
Conclusion
Comal County is located in the south-central region of Texas, and is part of the San Antonio-New Braunfels Metropolitan Statistical Area. The county was established in 1846, and is named after the Comal River, which runs through the county. The county has a diverse economy, with a mix of manufacturing, retail, and service industries. The county is also home to several tourist attractions, including the Schlitterbahn Waterpark and Resort, Natural Bridge Caverns, and the Guadalupe River State Park. As of the 2020 census, Comal County had a population of 131,086, with a predominantly white population. The median household income in the county is $63,945, and the median home value is $223,400.
Common Questions
What is Per Capita Income in Comal County?
Per Capita income in Comal County is $47,280.
What is the Median Family Income in Comal County?
Median Family Income in Comal County is $110,314.
What is the Median Household income in Comal County?
Median Household Income in Comal County is $93,744.
What is Income or Wage Gap in Comal County?
Income or Wage Gap in Comal County is 24.4%.
Women in Comal County earn 75.6 cents for every dollar earned by a man.
What is Family Income Deficit in Comal County?
Family Income Deficit in Comal County is $10,569.
Families that are below poverty line in Comal County earn $10,569 less on average than the poverty threshold level.
What is Inequality or Gini Index in Comal County?
Inequality or Gini Index in Comal County is 0.44.
What is the Total Population of Comal County?
Total Population of Comal County is 165,201.
What is the Total Male Population of Comal County?
Total Male Population of Comal County is 82,455.
What is the Total Female Population of Comal County?
Total Female Population of Comal County is 82,746.
What is the Ratio of Males per 100 Females in Comal County?
There are 99.65 Males per 100 Females in Comal County.
What is the Ratio of Females per 100 Males in Comal County?
There are 100.35 Females per 100 Males in Comal County.
What is the Median Population Age in Comal County?
Median Population Age in Comal County is 41.7 Years.
What is the Average Family Size in Comal County
Average Family Size in Comal County is 3.0 People.
What is the Average Household Size in Comal County
Average Household Size in Comal County is 2.6 People.
How Large is the Labor Force in Comal County?
There are 81,065 People in the Labor Forcein in Comal County.
What is the Percentage of People in the Labor Force in Comal County?
60.8% of People are in the Labor Force in Comal County.
What is the Unemployment Rate in Comal County?
Unemployment Rate in Comal County is 3.7%.