Galveston County, TX Map & Demographics
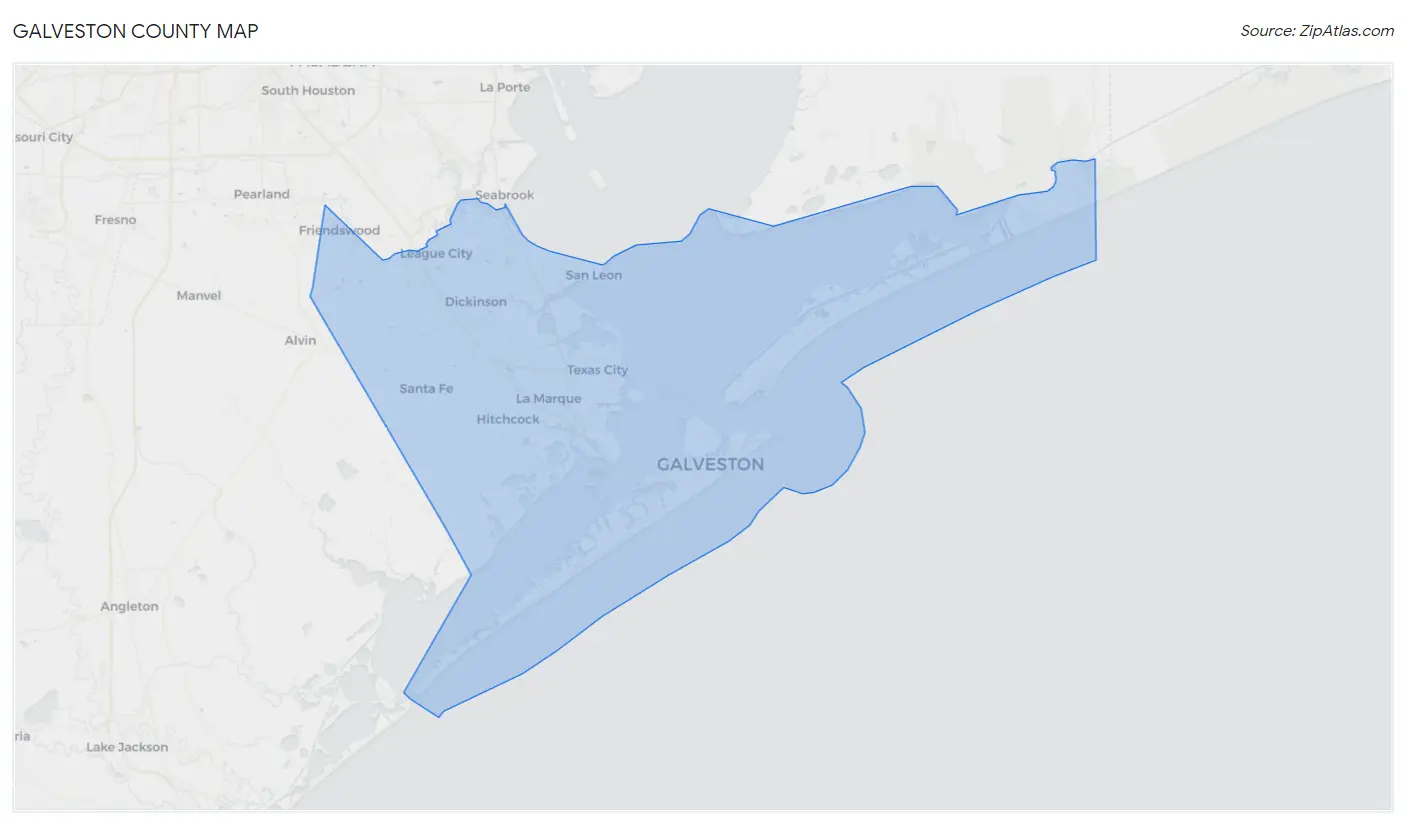
Galveston County Map
Galveston County Overview
$42,603
PER CAPITA INCOME
$104,673
AVG FAMILY INCOME
$83,913
AVG HOUSEHOLD INCOME
34.9%
WAGE / INCOME GAP [ % ]
65.1¢/ $1
WAGE / INCOME GAP [ $ ]
$11,726
FAMILY INCOME DEFICIT
0.46
INEQUALITY / GINI INDEX
350,801
TOTAL POPULATION
173,583
MALE POPULATION
177,218
FEMALE POPULATION
97.95
MALES / 100 FEMALES
102.09
FEMALES / 100 MALES
38.1
MEDIAN AGE
3.1
AVG FAMILY SIZE
2.5
AVG HOUSEHOLD SIZE
177,936
LABOR FORCE [ PEOPLE ]
64.2%
PERCENT IN LABOR FORCE
5.9%
UNEMPLOYMENT RATE
Income in Galveston County
Income Overview in Galveston County
Per Capita Income in Galveston County is $42,603, while median incomes of families and households are $104,673 and $83,913 respectively.
| Characteristic | Number | Measure |
| Per Capita Income | 350,801 | $42,603 |
| Median Family Income | 92,255 | $104,673 |
| Mean Family Income | 92,255 | $130,795 |
| Median Household Income | 135,275 | $83,913 |
| Mean Household Income | 135,275 | $110,116 |
| Income Deficit | 92,255 | $11,726 |
| Wage / Income Gap (%) | 350,801 | 34.94% |
| Wage / Income Gap ($) | 350,801 | 65.06¢ per $1 |
| Gini / Inequality Index | 350,801 | 0.46 |
Earnings by Sex in Galveston County
Average Earnings in Galveston County are $47,424, $58,304 for men and $37,930 for women, a difference of 34.9%.
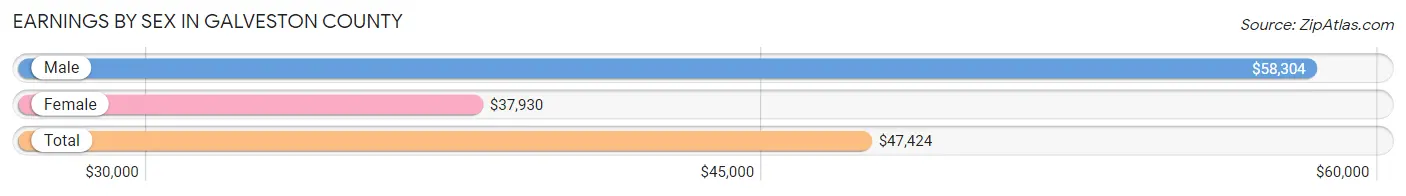
| Sex | Number | Average Earnings |
| Male | 98,578 (53.3%) | $58,304 |
| Female | 86,226 (46.7%) | $37,930 |
| Total | 184,804 (100.0%) | $47,424 |
Earnings by Sex by Income Bracket in Galveston County
The most common earnings brackets in Galveston County are $100,000+ for men (26,099 | 26.5%) and $100,000+ for women (10,726 | 12.4%).
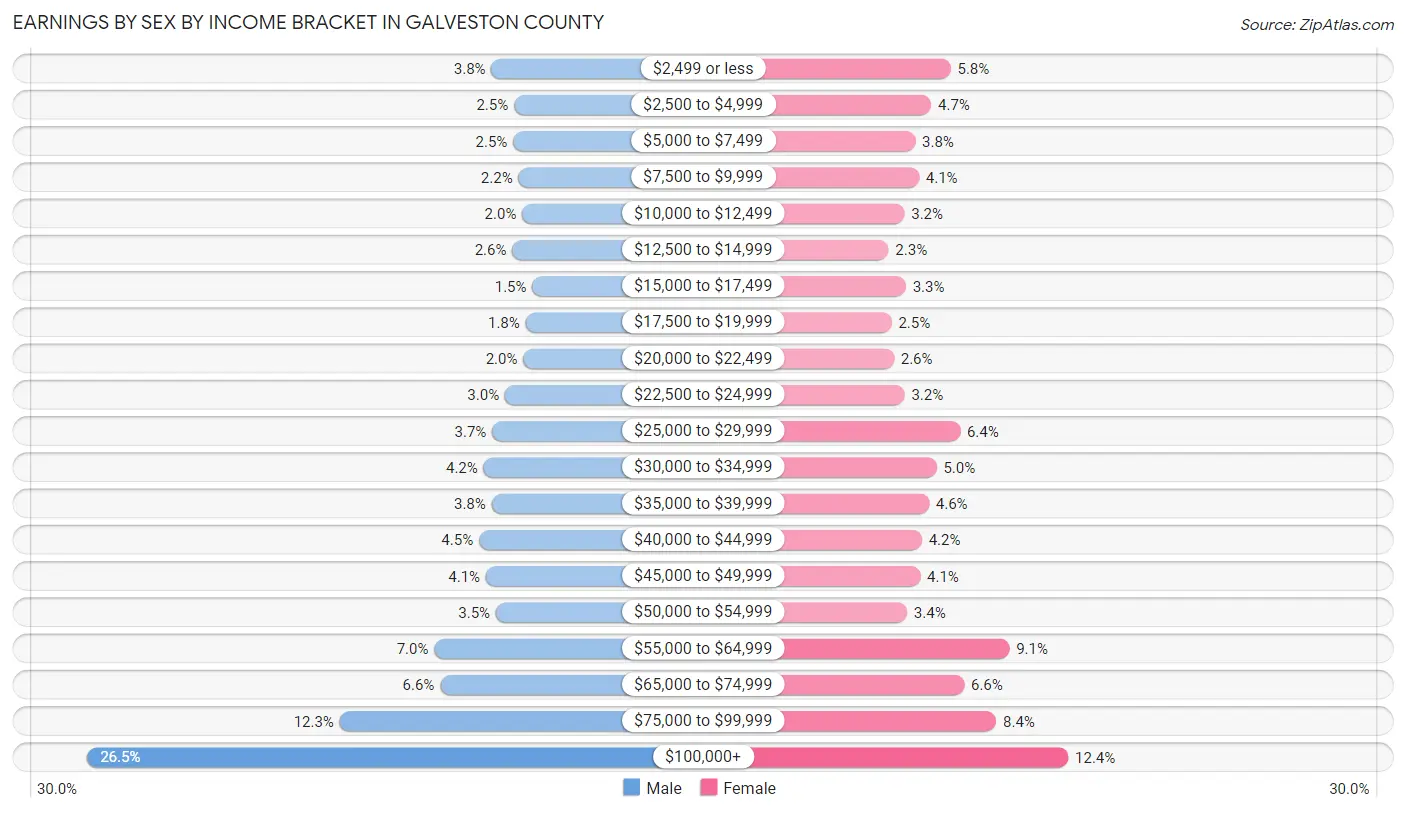
| Income | Male | Female |
| $2,499 or less | 3,705 (3.8%) | 5,028 (5.8%) |
| $2,500 to $4,999 | 2,451 (2.5%) | 4,088 (4.7%) |
| $5,000 to $7,499 | 2,499 (2.5%) | 3,314 (3.8%) |
| $7,500 to $9,999 | 2,209 (2.2%) | 3,492 (4.1%) |
| $10,000 to $12,499 | 2,000 (2.0%) | 2,782 (3.2%) |
| $12,500 to $14,999 | 2,558 (2.6%) | 2,018 (2.3%) |
| $15,000 to $17,499 | 1,436 (1.5%) | 2,858 (3.3%) |
| $17,500 to $19,999 | 1,810 (1.8%) | 2,164 (2.5%) |
| $20,000 to $22,499 | 1,942 (2.0%) | 2,275 (2.6%) |
| $22,500 to $24,999 | 2,955 (3.0%) | 2,791 (3.2%) |
| $25,000 to $29,999 | 3,672 (3.7%) | 5,485 (6.4%) |
| $30,000 to $34,999 | 4,139 (4.2%) | 4,346 (5.0%) |
| $35,000 to $39,999 | 3,699 (3.7%) | 3,979 (4.6%) |
| $40,000 to $44,999 | 4,395 (4.5%) | 3,631 (4.2%) |
| $45,000 to $49,999 | 4,014 (4.1%) | 3,552 (4.1%) |
| $50,000 to $54,999 | 3,458 (3.5%) | 2,912 (3.4%) |
| $55,000 to $64,999 | 6,873 (7.0%) | 7,870 (9.1%) |
| $65,000 to $74,999 | 6,548 (6.6%) | 5,680 (6.6%) |
| $75,000 to $99,999 | 12,116 (12.3%) | 7,235 (8.4%) |
| $100,000+ | 26,099 (26.5%) | 10,726 (12.4%) |
| Total | 98,578 (100.0%) | 86,226 (100.0%) |
Earnings by Sex by Educational Attainment in Galveston County
Average earnings in Galveston County are $67,209 for men and $44,877 for women, a difference of 33.2%. Men with an educational attainment of graduate degree enjoy the highest average annual earnings of $108,403, while those with less than high school education earn the least with $40,120. Women with an educational attainment of graduate degree earn the most with the average annual earnings of $74,859, while those with less than high school education have the smallest earnings of $19,382.
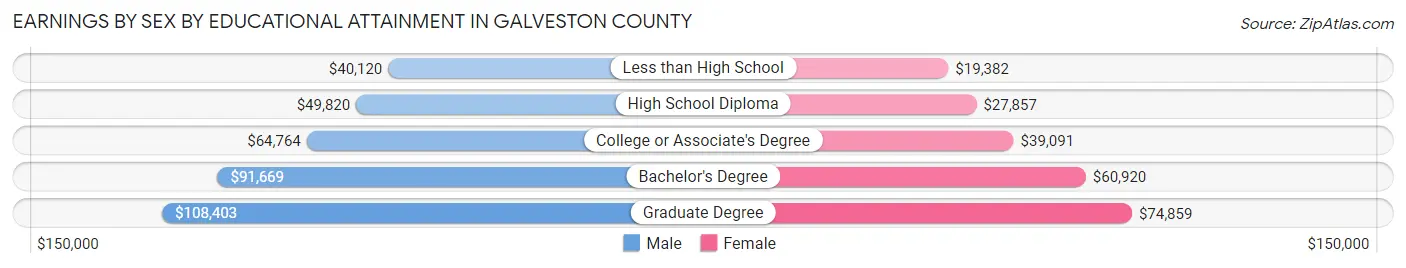
| Educational Attainment | Male Income | Female Income |
| Less than High School | $40,120 | $19,382 |
| High School Diploma | $49,820 | $27,857 |
| College or Associate's Degree | $64,764 | $39,091 |
| Bachelor's Degree | $91,669 | $60,920 |
| Graduate Degree | $108,403 | $74,859 |
| Total | $67,209 | $44,877 |
Family Income in Galveston County
Family Income Brackets in Galveston County
According to the Galveston County family income data, there are 20,296 families falling into the $100,000 to $149,999 income range, which is the most common income bracket and makes up 22.0% of all families. Conversely, the $10,000 to $14,999 income bracket is the least frequent group with only 1,661 families (1.8%) belonging to this category.
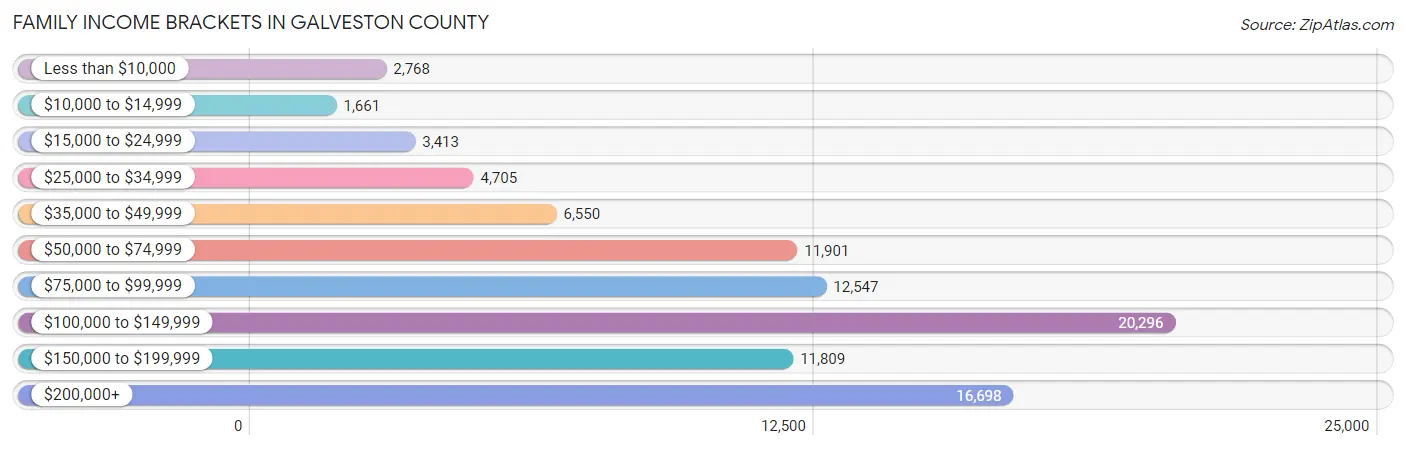
| Income Bracket | # Families | % Families |
| Less than $10,000 | 2,768 | 3.0% |
| $10,000 to $14,999 | 1,661 | 1.8% |
| $15,000 to $24,999 | 3,413 | 3.7% |
| $25,000 to $34,999 | 4,705 | 5.1% |
| $35,000 to $49,999 | 6,550 | 7.1% |
| $50,000 to $74,999 | 11,901 | 12.9% |
| $75,000 to $99,999 | 12,547 | 13.6% |
| $100,000 to $149,999 | 20,296 | 22.0% |
| $150,000 to $199,999 | 11,809 | 12.8% |
| $200,000+ | 16,698 | 18.1% |
Family Income by Famaliy Size in Galveston County
5-person families (8,364 | 9.1%) account for the highest median family income in Galveston County with $122,701 per family, while 2-person families (40,964 | 44.4%) have the highest median income of $48,459 per family member.
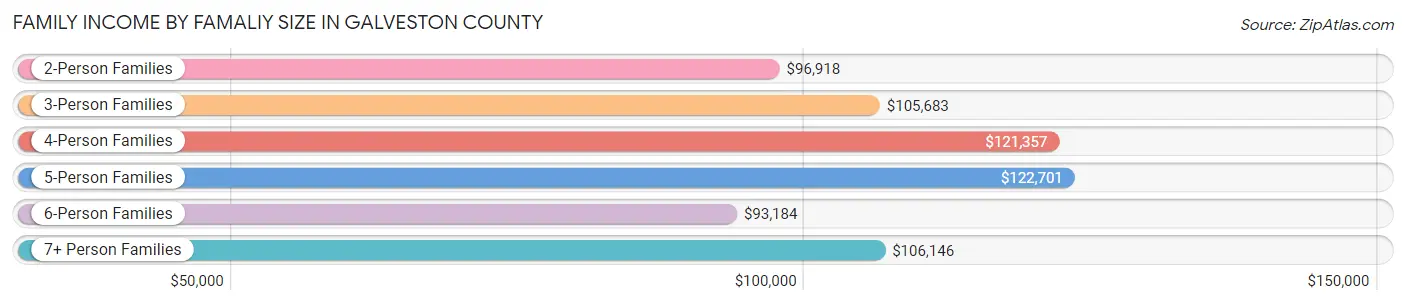
| Income Bracket | # Families | Median Income |
| 2-Person Families | 40,964 (44.4%) | $96,918 |
| 3-Person Families | 21,855 (23.7%) | $105,683 |
| 4-Person Families | 17,399 (18.9%) | $121,357 |
| 5-Person Families | 8,364 (9.1%) | $122,701 |
| 6-Person Families | 2,431 (2.6%) | $93,184 |
| 7+ Person Families | 1,242 (1.3%) | $106,146 |
| Total | 92,255 (100.0%) | $104,673 |
Family Income by Number of Earners in Galveston County
The median family income in Galveston County is $104,673, with families comprising 3+ earners (10,525) having the highest median family income of $152,764, while families with no earners (11,659) have the lowest median family income of $54,856, accounting for 11.4% and 12.6% of families, respectively.
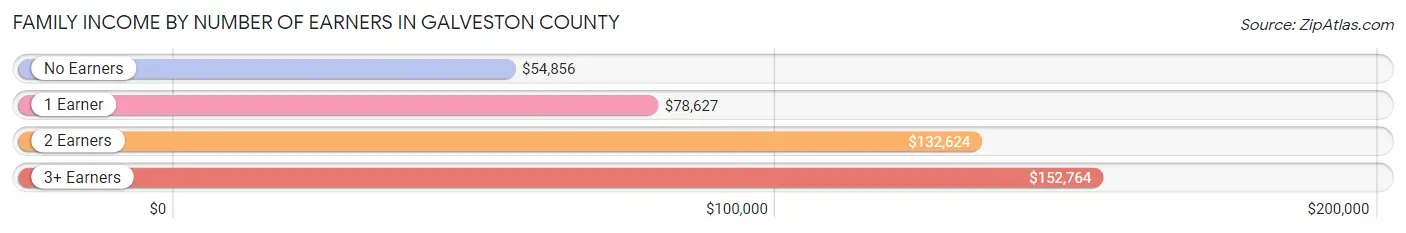
| Number of Earners | # Families | Median Income |
| No Earners | 11,659 (12.6%) | $54,856 |
| 1 Earner | 29,644 (32.1%) | $78,627 |
| 2 Earners | 40,427 (43.8%) | $132,624 |
| 3+ Earners | 10,525 (11.4%) | $152,764 |
| Total | 92,255 (100.0%) | $104,673 |
Household Income in Galveston County
Household Income Brackets in Galveston County
With 25,026 households falling in the category, the $100,000 to $149,999 income range is the most frequent in Galveston County, accounting for 18.5% of all households. In contrast, only 5,005 households (3.7%) fall into the $10,000 to $14,999 income bracket, making it the least populous group.
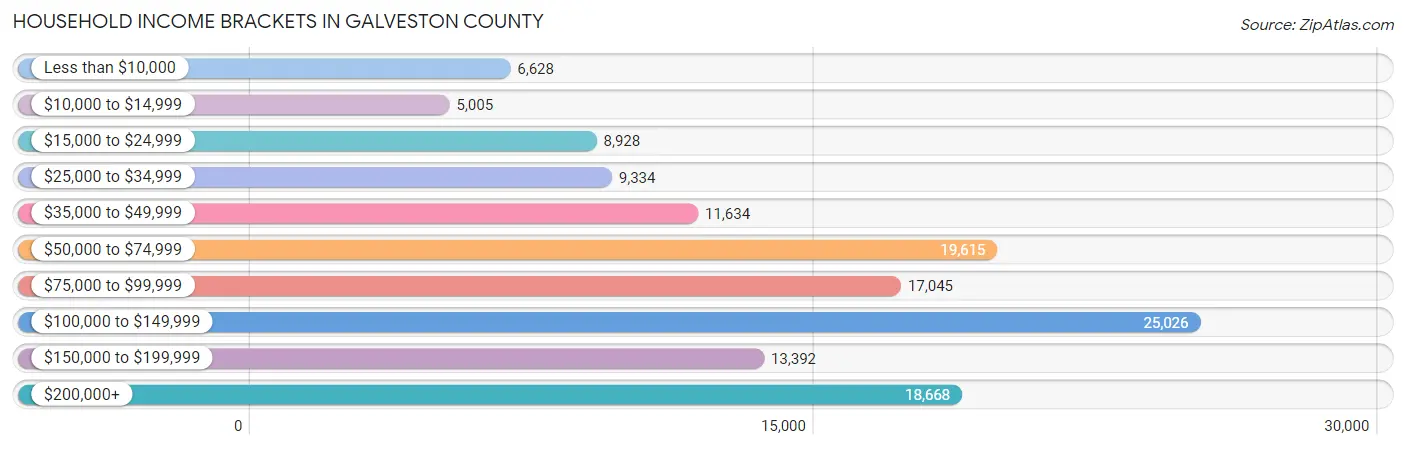
| Income Bracket | # Households | % Households |
| Less than $10,000 | 6,628 | 4.9% |
| $10,000 to $14,999 | 5,005 | 3.7% |
| $15,000 to $24,999 | 8,928 | 6.6% |
| $25,000 to $34,999 | 9,334 | 6.9% |
| $35,000 to $49,999 | 11,634 | 8.6% |
| $50,000 to $74,999 | 19,615 | 14.5% |
| $75,000 to $99,999 | 17,045 | 12.6% |
| $100,000 to $149,999 | 25,026 | 18.5% |
| $150,000 to $199,999 | 13,392 | 9.9% |
| $200,000+ | 18,668 | 13.8% |
Household Income by Householder Age in Galveston County
The median household income in Galveston County is $83,913, with the highest median household income of $102,420 found in the 45 to 64 years age bracket for the primary householder. A total of 52,820 households (39.1%) fall into this category. Meanwhile, the 15 to 24 years age bracket for the primary householder has the lowest median household income of $38,750, with 5,137 households (3.8%) in this group.
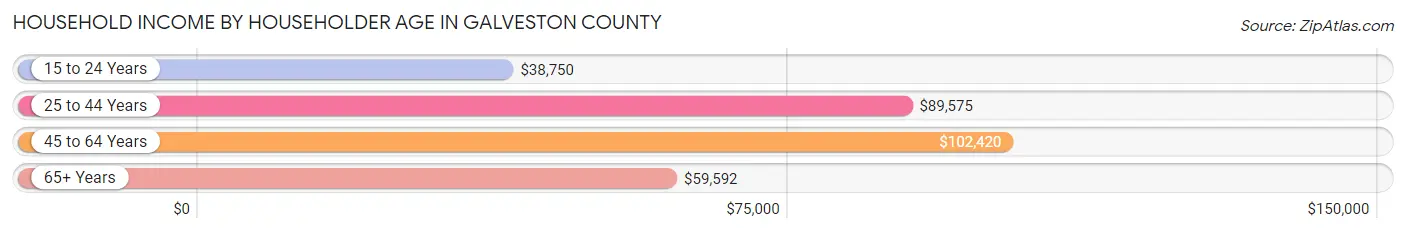
| Income Bracket | # Households | Median Income |
| 15 to 24 Years | 5,137 (3.8%) | $38,750 |
| 25 to 44 Years | 44,352 (32.8%) | $89,575 |
| 45 to 64 Years | 52,820 (39.1%) | $102,420 |
| 65+ Years | 32,966 (24.4%) | $59,592 |
| Total | 135,275 (100.0%) | $83,913 |
Poverty in Galveston County
Income Below Poverty by Sex and Age in Galveston County
With 9.8% poverty level for males and 12.2% for females among the residents of Galveston County, 15 year old males and 18 to 24 year old females are the most vulnerable to poverty, with 372 males (17.3%) and 2,827 females (19.7%) in their respective age groups living below the poverty level.
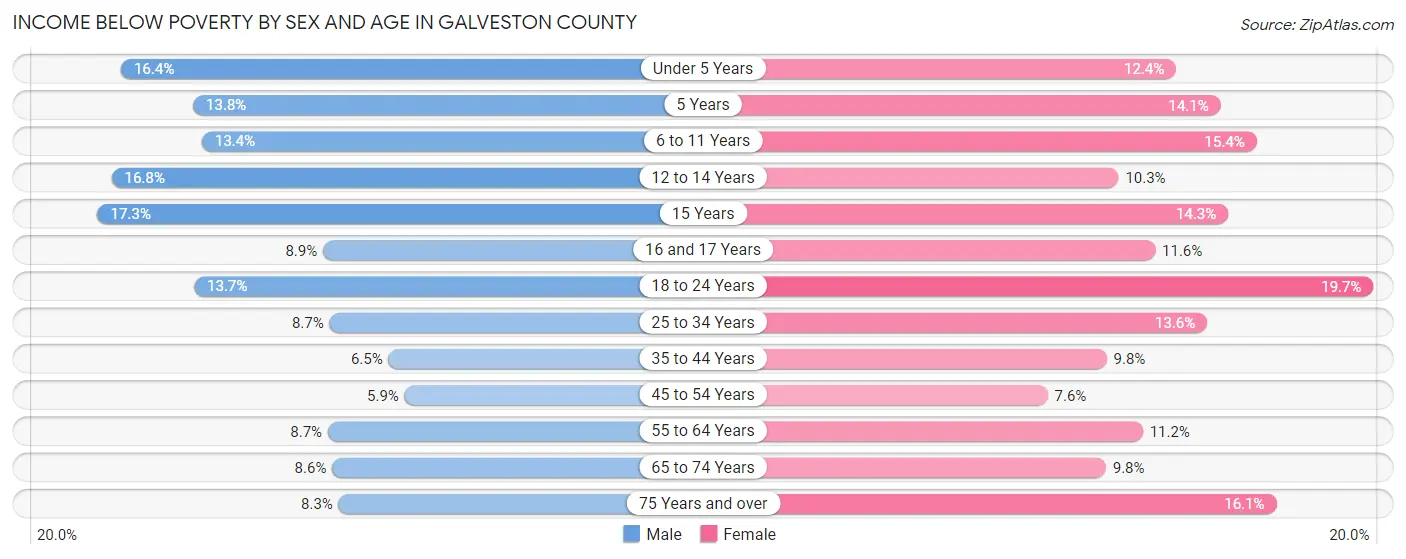
| Age Bracket | Male | Female |
| Under 5 Years | 1,694 (16.4%) | 1,251 (12.4%) |
| 5 Years | 405 (13.8%) | 245 (14.1%) |
| 6 to 11 Years | 1,974 (13.4%) | 2,101 (15.4%) |
| 12 to 14 Years | 1,135 (16.8%) | 811 (10.3%) |
| 15 Years | 372 (17.3%) | 392 (14.3%) |
| 16 and 17 Years | 486 (8.9%) | 534 (11.6%) |
| 18 to 24 Years | 1,970 (13.7%) | 2,827 (19.7%) |
| 25 to 34 Years | 1,920 (8.7%) | 3,070 (13.6%) |
| 35 to 44 Years | 1,482 (6.5%) | 2,339 (9.8%) |
| 45 to 54 Years | 1,293 (5.9%) | 1,718 (7.6%) |
| 55 to 64 Years | 1,989 (8.7%) | 2,619 (11.2%) |
| 65 to 74 Years | 1,336 (8.6%) | 1,650 (9.8%) |
| 75 Years and over | 666 (8.3%) | 1,708 (16.1%) |
| Total | 16,722 (9.8%) | 21,265 (12.2%) |
Income Above Poverty by Sex and Age in Galveston County
According to the poverty statistics in Galveston County, males aged 45 to 54 years and females aged 45 to 54 years are the age groups that are most secure financially, with 94.1% of males and 92.4% of females in these age groups living above the poverty line.
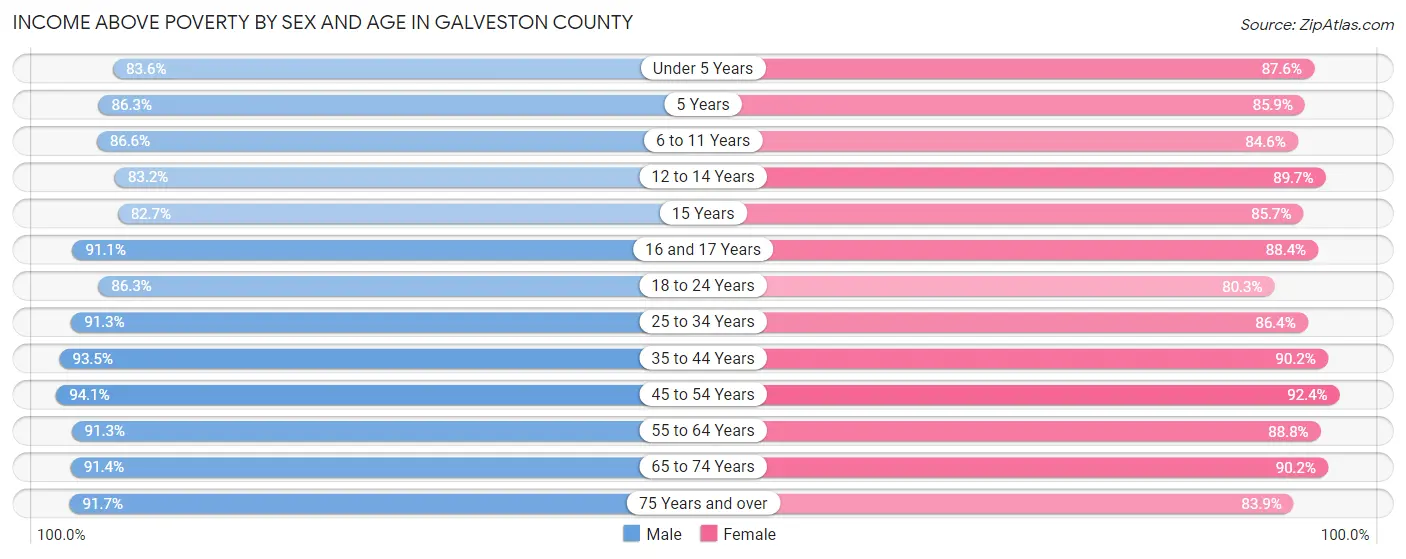
| Age Bracket | Male | Female |
| Under 5 Years | 8,623 (83.6%) | 8,828 (87.6%) |
| 5 Years | 2,541 (86.3%) | 1,498 (85.9%) |
| 6 to 11 Years | 12,730 (86.6%) | 11,542 (84.6%) |
| 12 to 14 Years | 5,632 (83.2%) | 7,084 (89.7%) |
| 15 Years | 1,780 (82.7%) | 2,341 (85.7%) |
| 16 and 17 Years | 4,962 (91.1%) | 4,057 (88.4%) |
| 18 to 24 Years | 12,397 (86.3%) | 11,498 (80.3%) |
| 25 to 34 Years | 20,189 (91.3%) | 19,567 (86.4%) |
| 35 to 44 Years | 21,359 (93.5%) | 21,465 (90.2%) |
| 45 to 54 Years | 20,673 (94.1%) | 20,773 (92.4%) |
| 55 to 64 Years | 20,771 (91.3%) | 20,834 (88.8%) |
| 65 to 74 Years | 14,242 (91.4%) | 15,182 (90.2%) |
| 75 Years and over | 7,324 (91.7%) | 8,879 (83.9%) |
| Total | 153,223 (90.2%) | 153,548 (87.8%) |
Income Below Poverty Among Married-Couple Families in Galveston County
The poverty statistics for married-couple families in Galveston County show that 4.7% or 3,305 of the total 70,342 families live below the poverty line. Families with 5 or more children have the highest poverty rate of 16.4%, comprising of 82 families. On the other hand, families with no children have the lowest poverty rate of 4.2%, which includes 1,662 families.
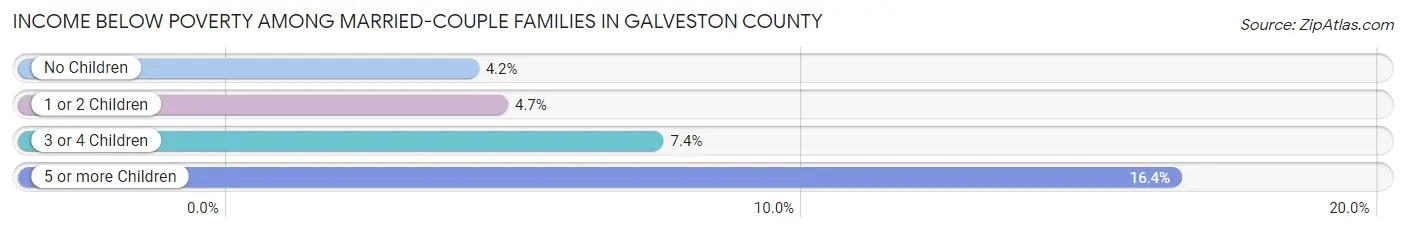
| Children | Above Poverty | Below Poverty |
| No Children | 38,037 (95.8%) | 1,662 (4.2%) |
| 1 or 2 Children | 23,632 (95.3%) | 1,165 (4.7%) |
| 3 or 4 Children | 4,951 (92.6%) | 396 (7.4%) |
| 5 or more Children | 417 (83.6%) | 82 (16.4%) |
| Total | 67,037 (95.3%) | 3,305 (4.7%) |
Income Below Poverty Among Single-Parent Households in Galveston County
According to the poverty data in Galveston County, 8.1% or 464 single-father households and 23.2% or 3,739 single-mother households are living below the poverty line. Among single-father households, those with 3 or 4 children have the highest poverty rate, with 144 households (48.5%) experiencing poverty. Likewise, among single-mother households, those with 3 or 4 children have the highest poverty rate, with 1,071 households (62.2%) falling below the poverty line.
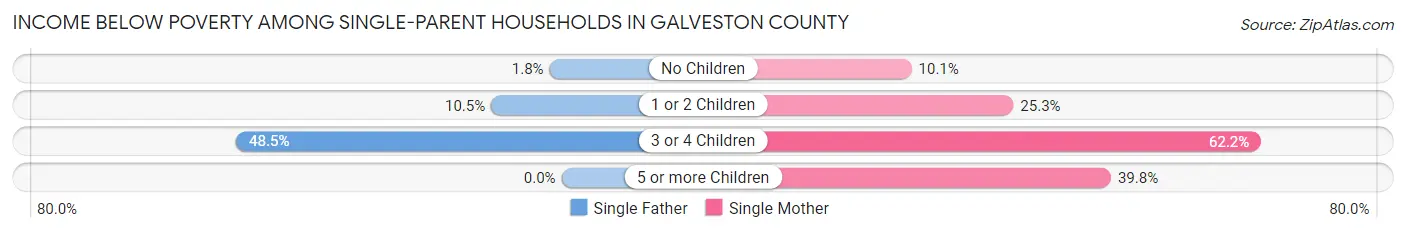
| Children | Single Father | Single Mother |
| No Children | 52 (1.8%) | 666 (10.1%) |
| 1 or 2 Children | 268 (10.5%) | 1,955 (25.3%) |
| 3 or 4 Children | 144 (48.5%) | 1,071 (62.2%) |
| 5 or more Children | 0 (0.0%) | 47 (39.8%) |
| Total | 464 (8.1%) | 3,739 (23.2%) |
Income Below Poverty Among Married-Couple vs Single-Parent Households in Galveston County
The poverty data for Galveston County shows that 3,305 of the married-couple family households (4.7%) and 4,203 of the single-parent households (19.2%) are living below the poverty level. Within the married-couple family households, those with 5 or more children have the highest poverty rate, with 82 households (16.4%) falling below the poverty line. Among the single-parent households, those with 3 or 4 children have the highest poverty rate, with 1,215 household (60.2%) living below poverty.
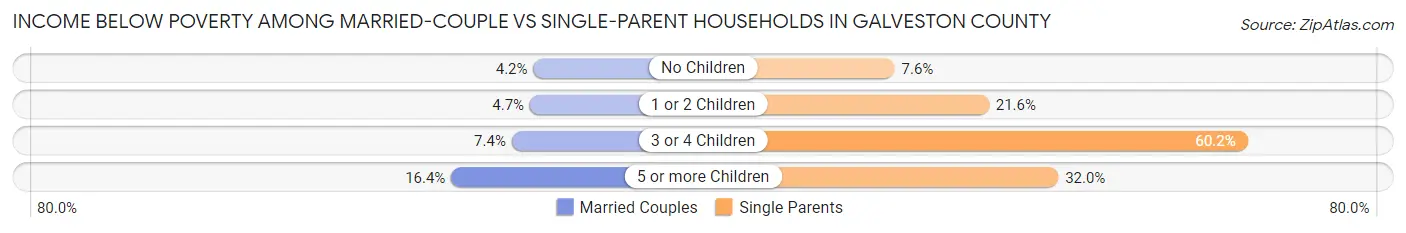
| Children | Married-Couple Families | Single-Parent Households |
| No Children | 1,662 (4.2%) | 718 (7.6%) |
| 1 or 2 Children | 1,165 (4.7%) | 2,223 (21.6%) |
| 3 or 4 Children | 396 (7.4%) | 1,215 (60.2%) |
| 5 or more Children | 82 (16.4%) | 47 (32.0%) |
| Total | 3,305 (4.7%) | 4,203 (19.2%) |
Race in Galveston County
The most populous races in Galveston County are White / Caucasian (238,656 | 68.0%), Hispanic or Latino (90,909 | 25.9%), and Black / African American (43,035 | 12.3%).
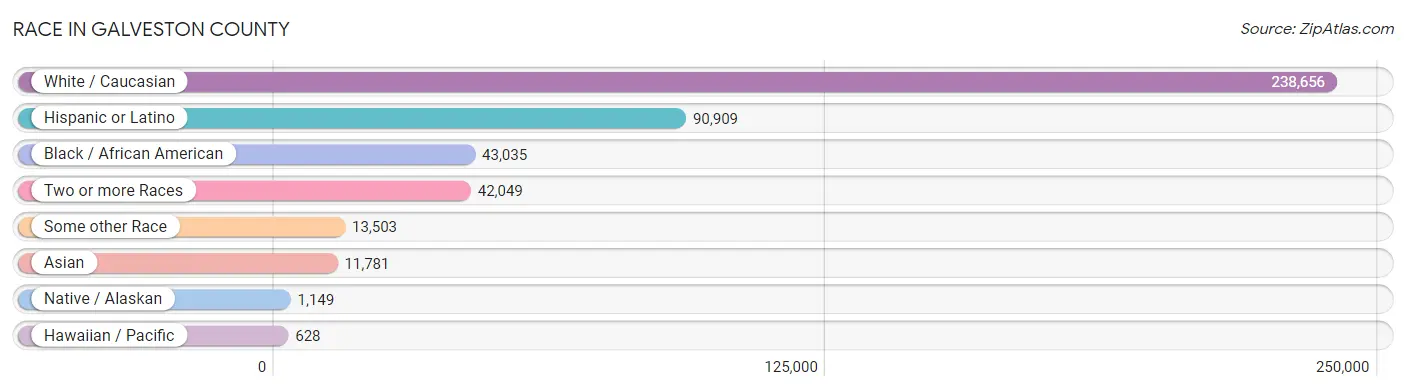
| Race | # Population | % Population |
| Asian | 11,781 | 3.4% |
| Black / African American | 43,035 | 12.3% |
| Hawaiian / Pacific | 628 | 0.2% |
| Hispanic or Latino | 90,909 | 25.9% |
| Native / Alaskan | 1,149 | 0.3% |
| White / Caucasian | 238,656 | 68.0% |
| Two or more Races | 42,049 | 12.0% |
| Some other Race | 13,503 | 3.8% |
| Total | 350,801 | 100.0% |
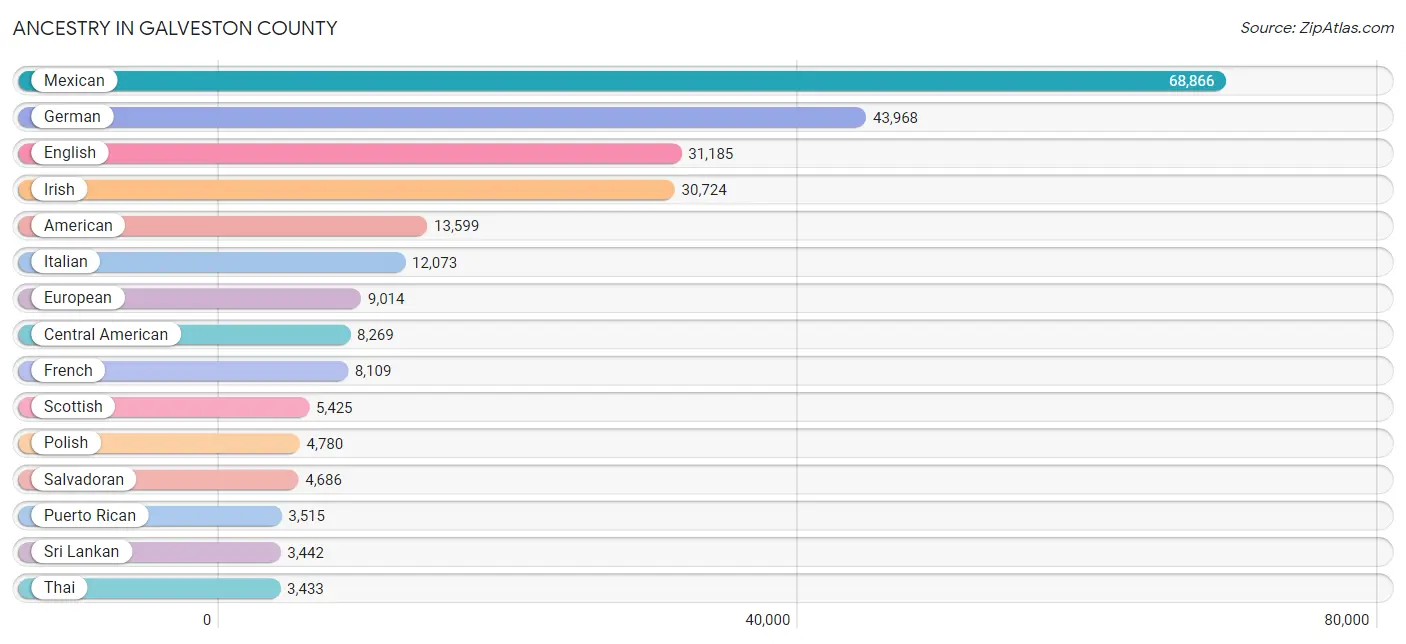
Ancestry in Galveston County
The most populous ancestries reported in Galveston County are Mexican (68,866 | 19.6%), German (43,968 | 12.5%), English (31,185 | 8.9%), Irish (30,724 | 8.8%), and American (13,599 | 3.9%), together accounting for 53.7% of all Galveston County residents.
| Ancestry | # Population | % Population |
| African | 1,446 | 0.4% |
| Albanian | 93 | 0.0% |
| Aleut | 29 | 0.0% |
| Alsatian | 64 | 0.0% |
| American | 13,599 | 3.9% |
| Apache | 148 | 0.0% |
| Arab | 1,791 | 0.5% |
| Argentinean | 93 | 0.0% |
| Armenian | 23 | 0.0% |
| Assyrian / Chaldean / Syriac | 24 | 0.0% |
| Australian | 87 | 0.0% |
| Austrian | 475 | 0.1% |
| Bahamian | 572 | 0.2% |
| Bangladeshi | 20 | 0.0% |
| Basque | 20 | 0.0% |
| Belgian | 257 | 0.1% |
| Belizean | 46 | 0.0% |
| Bhutanese | 505 | 0.1% |
| Blackfeet | 139 | 0.0% |
| Bolivian | 21 | 0.0% |
| Brazilian | 385 | 0.1% |
| British | 2,221 | 0.6% |
| British West Indian | 55 | 0.0% |
| Bulgarian | 53 | 0.0% |
| Burmese | 848 | 0.2% |
| Cajun | 708 | 0.2% |
| Canadian | 622 | 0.2% |
| Celtic | 16 | 0.0% |
| Central American | 8,269 | 2.4% |
| Central American Indian | 350 | 0.1% |
| Cherokee | 1,129 | 0.3% |
| Chickasaw | 65 | 0.0% |
| Chilean | 3 | 0.0% |
| Chippewa | 5 | 0.0% |
| Choctaw | 150 | 0.0% |
| Colombian | 1,678 | 0.5% |
| Comanche | 38 | 0.0% |
| Costa Rican | 257 | 0.1% |
| Creek | 13 | 0.0% |
| Croatian | 244 | 0.1% |
| Cuban | 1,223 | 0.4% |
| Cypriot | 4 | 0.0% |
| Czech | 2,863 | 0.8% |
| Czechoslovakian | 373 | 0.1% |
| Danish | 791 | 0.2% |
| Delaware | 62 | 0.0% |
| Dominican | 56 | 0.0% |
| Dutch | 3,065 | 0.9% |
| Dutch West Indian | 47 | 0.0% |
| Eastern European | 1,075 | 0.3% |
| Ecuadorian | 453 | 0.1% |
| Egyptian | 153 | 0.0% |
| English | 31,185 | 8.9% |
| Estonian | 19 | 0.0% |
| European | 9,014 | 2.6% |
| Filipino | 155 | 0.0% |
| Finnish | 233 | 0.1% |
| French | 8,109 | 2.3% |
| French Canadian | 1,293 | 0.4% |
| German | 43,968 | 12.5% |
| Ghanaian | 94 | 0.0% |
| Greek | 1,557 | 0.4% |
| Guamanian / Chamorro | 498 | 0.1% |
| Guatemalan | 1,103 | 0.3% |
| Haitian | 152 | 0.0% |
| Honduran | 1,574 | 0.4% |
| Hopi | 140 | 0.0% |
| Hungarian | 638 | 0.2% |
| Icelander | 92 | 0.0% |
| Indian (Asian) | 2,091 | 0.6% |
| Iranian | 595 | 0.2% |
| Iraqi | 57 | 0.0% |
| Irish | 30,724 | 8.8% |
| Iroquois | 27 | 0.0% |
| Israeli | 19 | 0.0% |
| Italian | 12,073 | 3.4% |
| Jamaican | 293 | 0.1% |
| Japanese | 12 | 0.0% |
| Jordanian | 25 | 0.0% |
| Kenyan | 33 | 0.0% |
| Korean | 2,792 | 0.8% |
| Laotian | 130 | 0.0% |
| Latvian | 24 | 0.0% |
| Lebanese | 418 | 0.1% |
| Lithuanian | 317 | 0.1% |
| Luxembourger | 23 | 0.0% |
| Malaysian | 324 | 0.1% |
| Maltese | 16 | 0.0% |
| Mexican | 68,866 | 19.6% |
| Mexican American Indian | 294 | 0.1% |
| Mongolian | 5 | 0.0% |
| Moroccan | 461 | 0.1% |
| Native Hawaiian | 209 | 0.1% |
| Navajo | 5 | 0.0% |
| New Zealander | 10 | 0.0% |
| Nicaraguan | 486 | 0.1% |
| Nigerian | 310 | 0.1% |
| Northern European | 264 | 0.1% |
| Norwegian | 2,684 | 0.8% |
| Osage | 5 | 0.0% |
| Ottawa | 7 | 0.0% |
| Paiute | 4 | 0.0% |
| Pakistani | 633 | 0.2% |
| Palestinian | 184 | 0.1% |
| Panamanian | 163 | 0.1% |
| Pennsylvania German | 97 | 0.0% |
| Peruvian | 313 | 0.1% |
| Pima | 19 | 0.0% |
| Polish | 4,780 | 1.4% |
| Portuguese | 477 | 0.1% |
| Pueblo | 26 | 0.0% |
| Puerto Rican | 3,515 | 1.0% |
| Puget Sound Salish | 21 | 0.0% |
| Romanian | 317 | 0.1% |
| Russian | 777 | 0.2% |
| Salvadoran | 4,686 | 1.3% |
| Samoan | 357 | 0.1% |
| Scandinavian | 720 | 0.2% |
| Scotch-Irish | 2,938 | 0.8% |
| Scottish | 5,425 | 1.5% |
| Seminole | 21 | 0.0% |
| Serbian | 84 | 0.0% |
| Shoshone | 6 | 0.0% |
| Sierra Leonean | 25 | 0.0% |
| Sioux | 54 | 0.0% |
| Slavic | 25 | 0.0% |
| Slovak | 112 | 0.0% |
| Slovene | 95 | 0.0% |
| Somali | 21 | 0.0% |
| South African | 46 | 0.0% |
| South American | 2,911 | 0.8% |
| Spaniard | 1,407 | 0.4% |
| Spanish | 1,136 | 0.3% |
| Spanish American | 43 | 0.0% |
| Sri Lankan | 3,442 | 1.0% |
| Subsaharan African | 2,754 | 0.8% |
| Swedish | 1,794 | 0.5% |
| Swiss | 406 | 0.1% |
| Syrian | 25 | 0.0% |
| Thai | 3,433 | 1.0% |
| Trinidadian and Tobagonian | 211 | 0.1% |
| Turkish | 204 | 0.1% |
| U.S. Virgin Islander | 7 | 0.0% |
| Ugandan | 103 | 0.0% |
| Ukrainian | 1,260 | 0.4% |
| Uruguayan | 52 | 0.0% |
| Ute | 2 | 0.0% |
| Venezuelan | 298 | 0.1% |
| Welsh | 1,900 | 0.5% |
| West Indian | 235 | 0.1% |
| Yaqui | 78 | 0.0% |
| Yugoslavian | 103 | 0.0% |
| Yup'ik | 10 | 0.0% | View All 153 Rows |
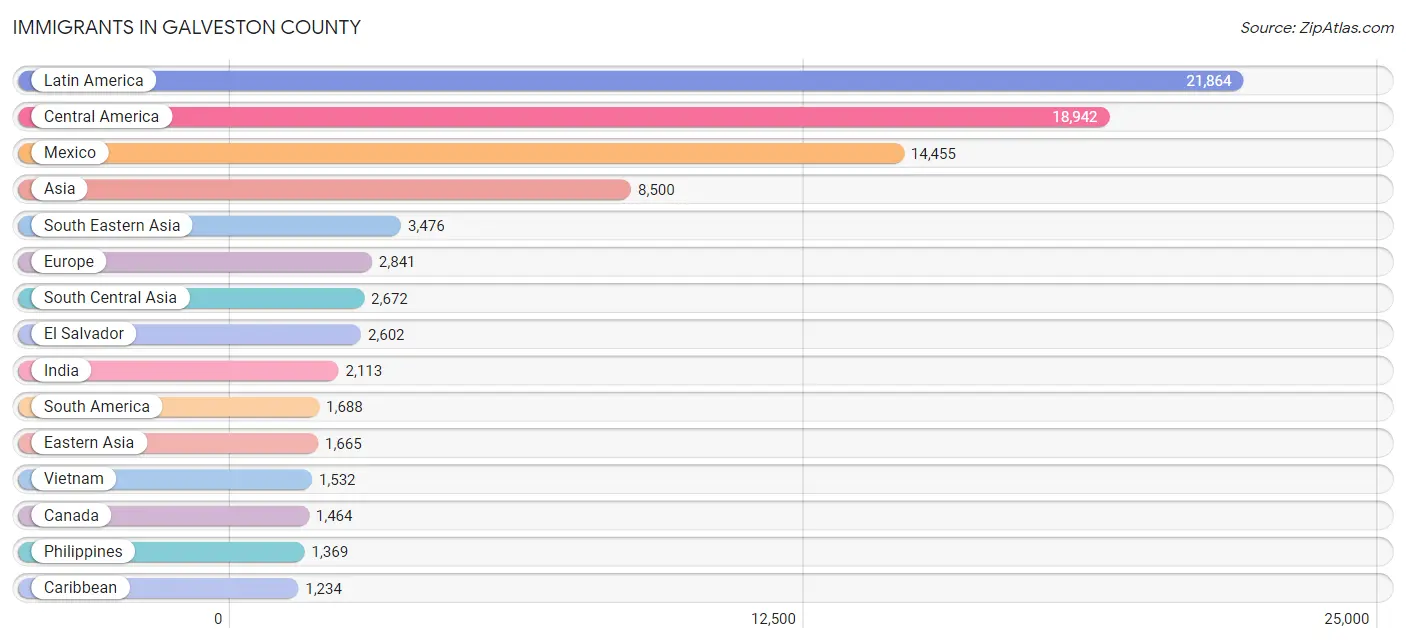
Immigrants in Galveston County
The most numerous immigrant groups reported in Galveston County came from Latin America (21,864 | 6.2%), Central America (18,942 | 5.4%), Mexico (14,455 | 4.1%), Asia (8,500 | 2.4%), and South Eastern Asia (3,476 | 1.0%), together accounting for 19.2% of all Galveston County residents.
| Immigration Origin | # Population | % Population |
| Africa | 963 | 0.3% |
| Albania | 148 | 0.0% |
| Argentina | 68 | 0.0% |
| Armenia | 17 | 0.0% |
| Asia | 8,500 | 2.4% |
| Australia | 100 | 0.0% |
| Austria | 7 | 0.0% |
| Bahamas | 245 | 0.1% |
| Bangladesh | 10 | 0.0% |
| Barbados | 9 | 0.0% |
| Belarus | 29 | 0.0% |
| Belgium | 15 | 0.0% |
| Bolivia | 8 | 0.0% |
| Brazil | 250 | 0.1% |
| Bulgaria | 29 | 0.0% |
| Cambodia | 26 | 0.0% |
| Cameroon | 8 | 0.0% |
| Canada | 1,464 | 0.4% |
| Caribbean | 1,234 | 0.4% |
| Central America | 18,942 | 5.4% |
| China | 1,109 | 0.3% |
| Colombia | 754 | 0.2% |
| Costa Rica | 57 | 0.0% |
| Croatia | 20 | 0.0% |
| Cuba | 357 | 0.1% |
| Czechoslovakia | 18 | 0.0% |
| Denmark | 18 | 0.0% |
| Dominican Republic | 42 | 0.0% |
| Eastern Africa | 84 | 0.0% |
| Eastern Asia | 1,665 | 0.5% |
| Eastern Europe | 1,096 | 0.3% |
| Ecuador | 143 | 0.0% |
| Egypt | 196 | 0.1% |
| El Salvador | 2,602 | 0.7% |
| England | 407 | 0.1% |
| Europe | 2,841 | 0.8% |
| France | 123 | 0.0% |
| Germany | 354 | 0.1% |
| Ghana | 33 | 0.0% |
| Greece | 216 | 0.1% |
| Guatemala | 661 | 0.2% |
| Haiti | 9 | 0.0% |
| Honduras | 860 | 0.3% |
| Hungary | 46 | 0.0% |
| India | 2,113 | 0.6% |
| Indonesia | 101 | 0.0% |
| Iran | 189 | 0.1% |
| Iraq | 53 | 0.0% |
| Ireland | 59 | 0.0% |
| Israel | 30 | 0.0% |
| Italy | 35 | 0.0% |
| Jamaica | 142 | 0.0% |
| Japan | 174 | 0.1% |
| Jordan | 38 | 0.0% |
| Kazakhstan | 28 | 0.0% |
| Kenya | 47 | 0.0% |
| Korea | 382 | 0.1% |
| Kuwait | 22 | 0.0% |
| Laos | 75 | 0.0% |
| Latin America | 21,864 | 6.2% |
| Lebanon | 100 | 0.0% |
| Malaysia | 65 | 0.0% |
| Mexico | 14,455 | 4.1% |
| Micronesia | 14 | 0.0% |
| Middle Africa | 227 | 0.1% |
| Moldova | 108 | 0.0% |
| Morocco | 22 | 0.0% |
| Nepal | 31 | 0.0% |
| Netherlands | 49 | 0.0% |
| Nicaragua | 199 | 0.1% |
| Nigeria | 213 | 0.1% |
| Northern Africa | 246 | 0.1% |
| Northern Europe | 912 | 0.3% |
| Oceania | 236 | 0.1% |
| Pakistan | 289 | 0.1% |
| Panama | 93 | 0.0% |
| Peru | 172 | 0.1% |
| Philippines | 1,369 | 0.4% |
| Poland | 48 | 0.0% |
| Romania | 155 | 0.0% |
| Russia | 231 | 0.1% |
| Saudi Arabia | 35 | 0.0% |
| Scotland | 94 | 0.0% |
| Senegal | 7 | 0.0% |
| Sierra Leone | 25 | 0.0% |
| Singapore | 71 | 0.0% |
| South Africa | 113 | 0.0% |
| South America | 1,688 | 0.5% |
| South Central Asia | 2,672 | 0.8% |
| South Eastern Asia | 3,476 | 1.0% |
| Southern Europe | 276 | 0.1% |
| Spain | 25 | 0.0% |
| Sri Lanka | 12 | 0.0% |
| Sweden | 11 | 0.0% |
| Switzerland | 9 | 0.0% |
| Syria | 4 | 0.0% |
| Taiwan | 197 | 0.1% |
| Thailand | 237 | 0.1% |
| Trinidad and Tobago | 195 | 0.1% |
| Turkey | 54 | 0.0% |
| Ukraine | 262 | 0.1% |
| Uruguay | 43 | 0.0% |
| Venezuela | 250 | 0.1% |
| Vietnam | 1,532 | 0.4% |
| West Indies | 29 | 0.0% |
| Western Africa | 278 | 0.1% |
| Western Asia | 461 | 0.1% |
| Western Europe | 557 | 0.2% |
| Zaire | 219 | 0.1% |
| Zimbabwe | 37 | 0.0% | View All 110 Rows |
Sex and Age in Galveston County
Sex and Age in Galveston County
The most populous age groups in Galveston County are 5 to 9 Years (12,583 | 7.2%) for men and 10 to 14 Years (12,574 | 7.1%) for women.
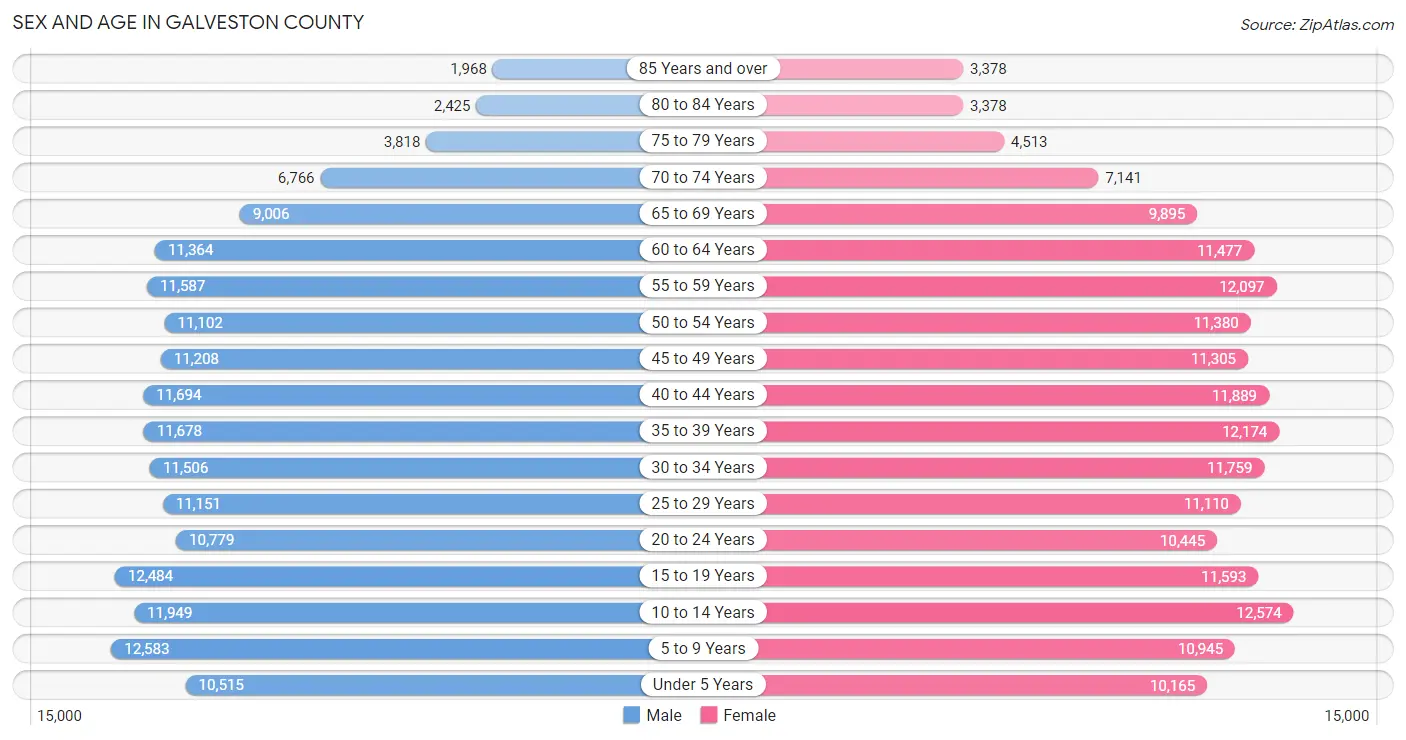
| Age Bracket | Male | Female |
| Under 5 Years | 10,515 (6.1%) | 10,165 (5.7%) |
| 5 to 9 Years | 12,583 (7.2%) | 10,945 (6.2%) |
| 10 to 14 Years | 11,949 (6.9%) | 12,574 (7.1%) |
| 15 to 19 Years | 12,484 (7.2%) | 11,593 (6.5%) |
| 20 to 24 Years | 10,779 (6.2%) | 10,445 (5.9%) |
| 25 to 29 Years | 11,151 (6.4%) | 11,110 (6.3%) |
| 30 to 34 Years | 11,506 (6.6%) | 11,759 (6.6%) |
| 35 to 39 Years | 11,678 (6.7%) | 12,174 (6.9%) |
| 40 to 44 Years | 11,694 (6.7%) | 11,889 (6.7%) |
| 45 to 49 Years | 11,208 (6.5%) | 11,305 (6.4%) |
| 50 to 54 Years | 11,102 (6.4%) | 11,380 (6.4%) |
| 55 to 59 Years | 11,587 (6.7%) | 12,097 (6.8%) |
| 60 to 64 Years | 11,364 (6.6%) | 11,477 (6.5%) |
| 65 to 69 Years | 9,006 (5.2%) | 9,895 (5.6%) |
| 70 to 74 Years | 6,766 (3.9%) | 7,141 (4.0%) |
| 75 to 79 Years | 3,818 (2.2%) | 4,513 (2.5%) |
| 80 to 84 Years | 2,425 (1.4%) | 3,378 (1.9%) |
| 85 Years and over | 1,968 (1.1%) | 3,378 (1.9%) |
| Total | 173,583 (100.0%) | 177,218 (100.0%) |
Families and Households in Galveston County
Median Family Size in Galveston County
The median family size in Galveston County is 3.11 persons per family, with married-couple families (70,342 | 76.2%) accounting for the largest median family size of 3.18 persons per family. On the other hand, single male/father families (5,763 | 6.2%) represent the smallest median family size with 2.68 persons per family.
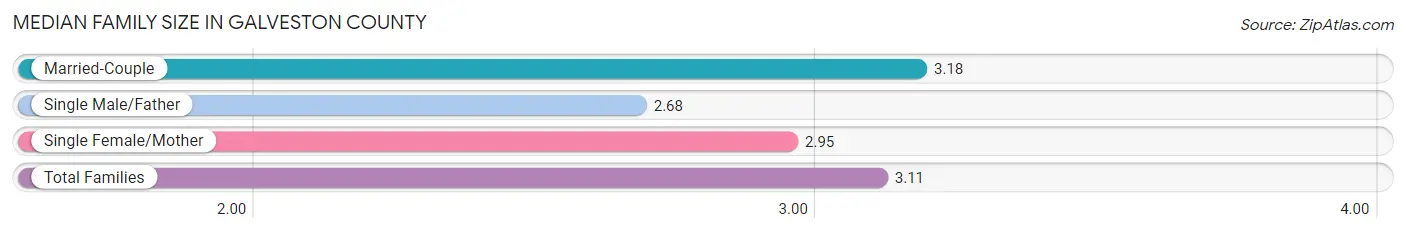
| Family Type | # Families | Family Size |
| Married-Couple | 70,342 (76.2%) | 3.18 |
| Single Male/Father | 5,763 (6.2%) | 2.68 |
| Single Female/Mother | 16,150 (17.5%) | 2.95 |
| Total Families | 92,255 (100.0%) | 3.11 |
Median Household Size in Galveston County
The median household size in Galveston County is 2.55 persons per household, with married-couple households (70,342 | 52.0%) accounting for the largest median household size of 3.2 persons per household. non-family households (43,020 | 31.8%) represent the smallest median household size with 1.23 persons per household.
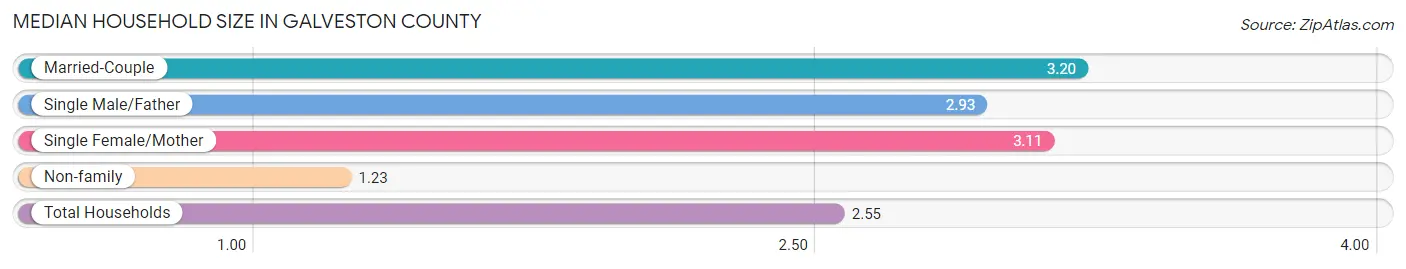
| Household Type | # Households | Household Size |
| Married-Couple | 70,342 (52.0%) | 3.20 |
| Single Male/Father | 5,763 (4.3%) | 2.93 |
| Single Female/Mother | 16,150 (11.9%) | 3.11 |
| Non-family | 43,020 (31.8%) | 1.23 |
| Total Households | 135,275 (100.0%) | 2.55 |
Household Size by Marriage Status in Galveston County
Out of a total of 135,275 households in Galveston County, 92,255 (68.2%) are family households, while 43,020 (31.8%) are nonfamily households. The most numerous type of family households are 2-person households, comprising 39,176, and the most common type of nonfamily households are 1-person households, comprising 35,235.
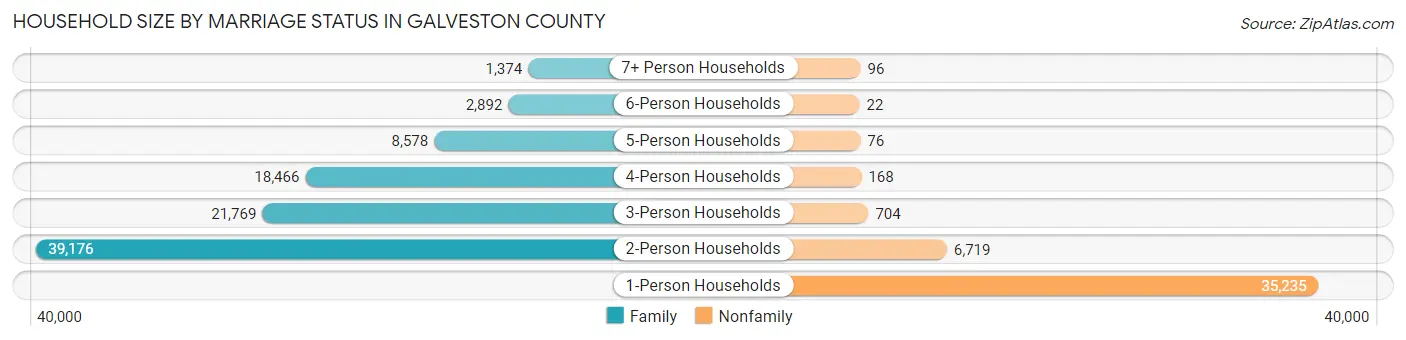
| Household Size | Family Households | Nonfamily Households |
| 1-Person Households | - | 35,235 (26.1%) |
| 2-Person Households | 39,176 (29.0%) | 6,719 (5.0%) |
| 3-Person Households | 21,769 (16.1%) | 704 (0.5%) |
| 4-Person Households | 18,466 (13.7%) | 168 (0.1%) |
| 5-Person Households | 8,578 (6.3%) | 76 (0.1%) |
| 6-Person Households | 2,892 (2.1%) | 22 (0.0%) |
| 7+ Person Households | 1,374 (1.0%) | 96 (0.1%) |
| Total | 92,255 (68.2%) | 43,020 (31.8%) |
Female Fertility in Galveston County
Fertility by Age in Galveston County
Average fertility rate in Galveston County is 56.0 births per 1,000 women. Women in the age bracket of 20 to 34 years have the highest fertility rate with 112.0 births per 1,000 women. Women in the age bracket of 20 to 34 years acount for 80.6% of all women with births.
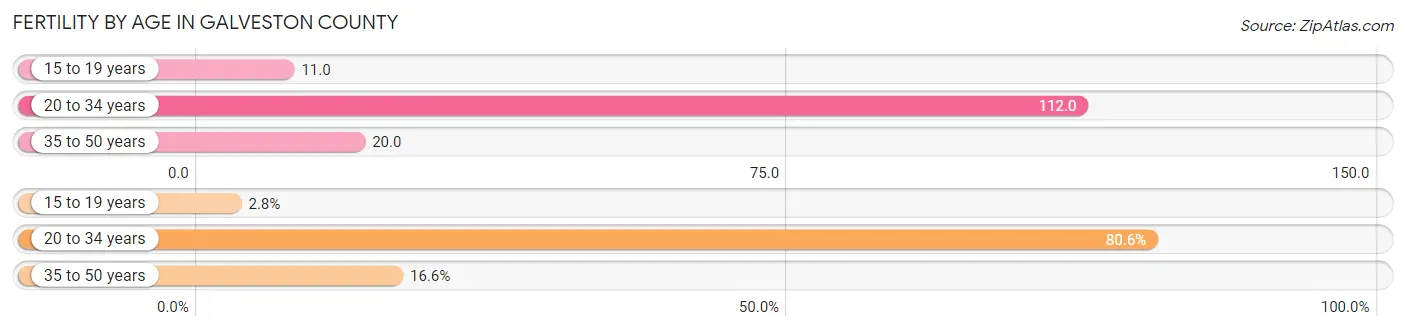
| Age Bracket | Women with Births | Births / 1,000 Women |
| 15 to 19 years | 131 (2.8%) | 11.0 |
| 20 to 34 years | 3,715 (80.6%) | 112.0 |
| 35 to 50 years | 763 (16.6%) | 20.0 |
| Total | 4,609 (100.0%) | 56.0 |
Fertility by Age by Marriage Status in Galveston County
73.4% of women with births (4,609) in Galveston County are married. The highest percentage of unmarried women with births falls into 15 to 19 years age bracket with 33.6% of them unmarried at the time of birth, while the lowest percentage of unmarried women with births belong to 35 to 50 years age bracket with 1.7% of them unmarried.
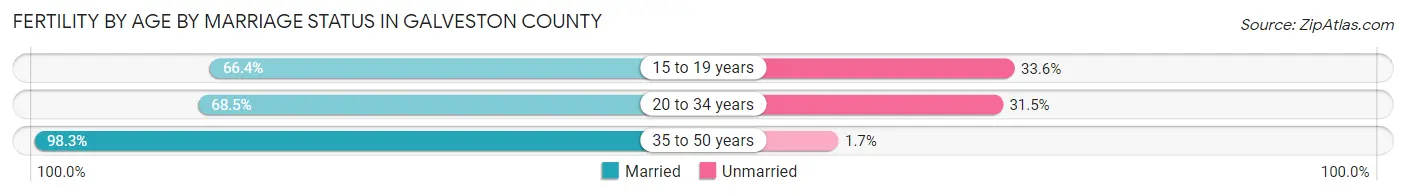
| Age Bracket | Married | Unmarried |
| 15 to 19 years | 87 (66.4%) | 44 (33.6%) |
| 20 to 34 years | 2,545 (68.5%) | 1,170 (31.5%) |
| 35 to 50 years | 750 (98.3%) | 13 (1.7%) |
| Total | 3,383 (73.4%) | 1,226 (26.6%) |
Fertility by Education in Galveston County
Average fertility rate in Galveston County is 56.0 births per 1,000 women. Women with the education attainment of bachelor's degree have the highest fertility rate of 79.0 births per 1,000 women, while women with the education attainment of less than high school have the lowest fertility at 19.0 births per 1,000 women. Women with the education attainment of bachelor's degree represent 32.5% of all women with births.
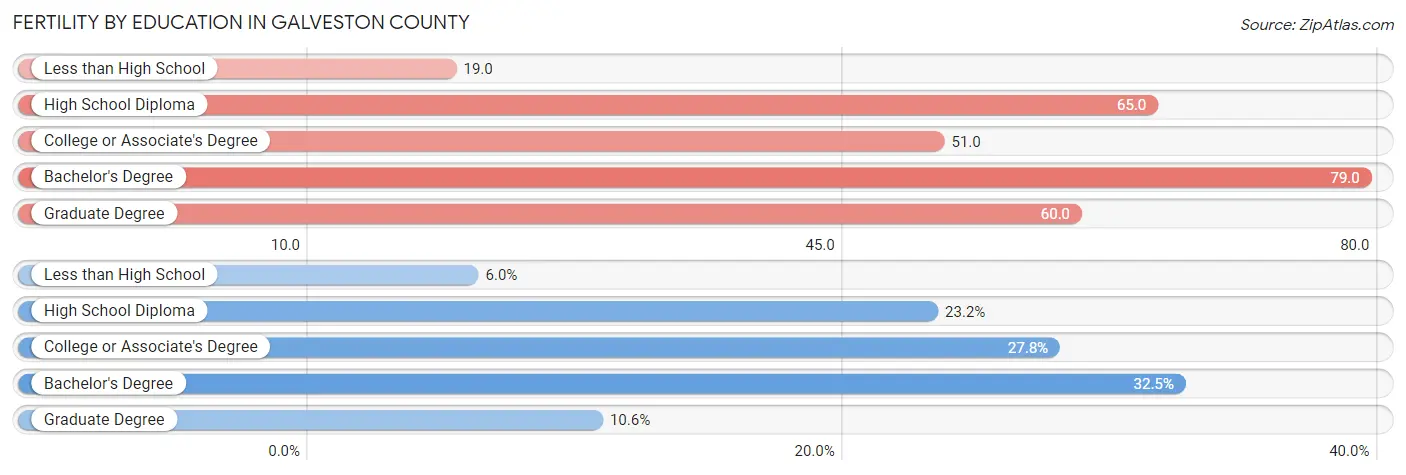
| Educational Attainment | Women with Births | Births / 1,000 Women |
| Less than High School | 275 (6.0%) | 19.0 |
| High School Diploma | 1,069 (23.2%) | 65.0 |
| College or Associate's Degree | 1,279 (27.8%) | 51.0 |
| Bachelor's Degree | 1,496 (32.5%) | 79.0 |
| Graduate Degree | 490 (10.6%) | 60.0 |
| Total | 4,609 (100.0%) | 56.0 |
Fertility by Education by Marriage Status in Galveston County
26.6% of women with births in Galveston County are unmarried. Women with the educational attainment of graduate degree are most likely to be married with 97.8% of them married at childbirth, while women with the educational attainment of less than high school are least likely to be married with 49.1% of them unmarried at childbirth.
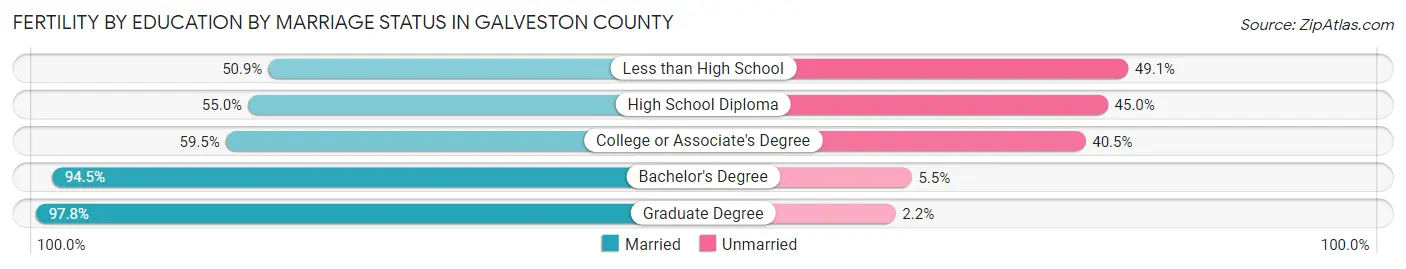
| Educational Attainment | Married | Unmarried |
| Less than High School | 140 (50.9%) | 135 (49.1%) |
| High School Diploma | 588 (55.0%) | 481 (45.0%) |
| College or Associate's Degree | 761 (59.5%) | 518 (40.5%) |
| Bachelor's Degree | 1,414 (94.5%) | 82 (5.5%) |
| Graduate Degree | 479 (97.8%) | 11 (2.2%) |
| Total | 3,383 (73.4%) | 1,226 (26.6%) |
Employment Characteristics in Galveston County
Employment by Class of Employer in Galveston County
Among the 164,431 employed individuals in Galveston County, private company employees (108,752 | 66.1%), local government employees (14,902 | 9.1%), and state government employees (11,639 | 7.1%) make up the most common classes of employment.
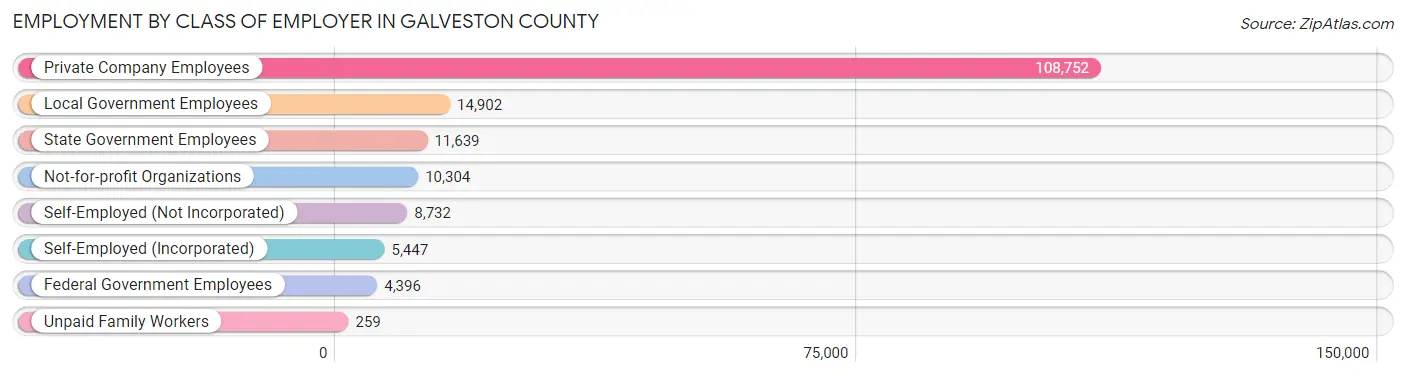
| Employer Class | # Employees | % Employees |
| Private Company Employees | 108,752 | 66.1% |
| Self-Employed (Incorporated) | 5,447 | 3.3% |
| Self-Employed (Not Incorporated) | 8,732 | 5.3% |
| Not-for-profit Organizations | 10,304 | 6.3% |
| Local Government Employees | 14,902 | 9.1% |
| State Government Employees | 11,639 | 7.1% |
| Federal Government Employees | 4,396 | 2.7% |
| Unpaid Family Workers | 259 | 0.2% |
| Total | 164,431 | 100.0% |
Employment Status by Age in Galveston County
According to the labor force statistics for Galveston County, out of the total population over 16 years of age (277,159), 64.2% or 177,936 individuals are in the labor force, with 5.9% or 10,498 of them unemployed. The age group with the highest labor force participation rate is 25 to 29 years, with 84.0% or 18,699 individuals in the labor force. Within the labor force, the 16 to 19 years age range has the highest percentage of unemployed individuals, with 13.7% or 885 of them being unemployed.
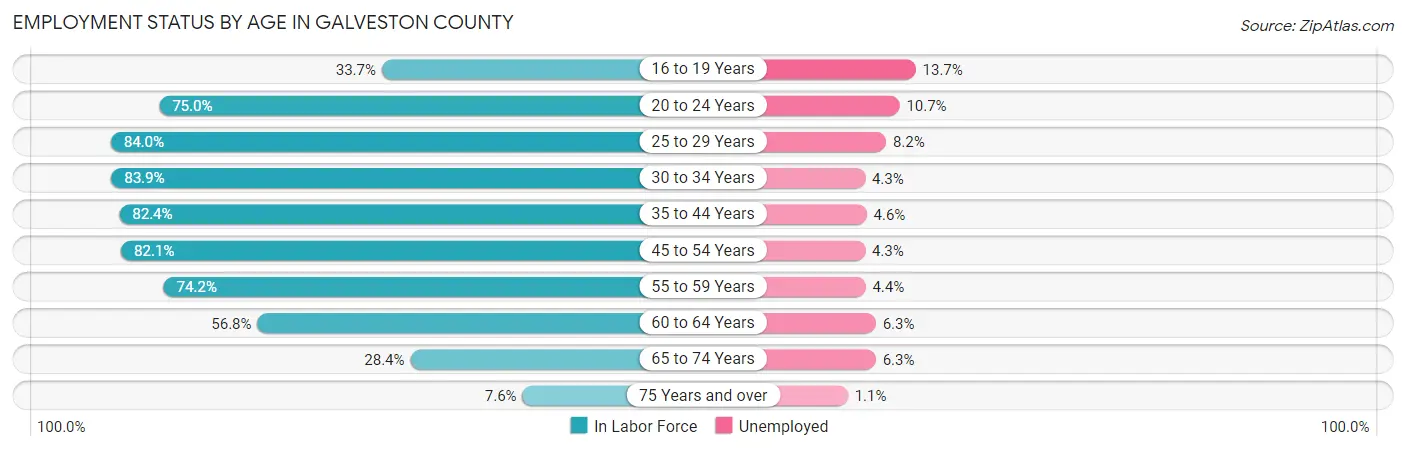
| Age Bracket | In Labor Force | Unemployed |
| 16 to 19 Years | 6,459 (33.7%) | 885 (13.7%) |
| 20 to 24 Years | 15,918 (75.0%) | 1,703 (10.7%) |
| 25 to 29 Years | 18,699 (84.0%) | 1,533 (8.2%) |
| 30 to 34 Years | 19,519 (83.9%) | 839 (4.3%) |
| 35 to 44 Years | 39,086 (82.4%) | 1,798 (4.6%) |
| 45 to 54 Years | 36,941 (82.1%) | 1,588 (4.3%) |
| 55 to 59 Years | 17,574 (74.2%) | 773 (4.4%) |
| 60 to 64 Years | 12,974 (56.8%) | 817 (6.3%) |
| 65 to 74 Years | 9,317 (28.4%) | 587 (6.3%) |
| 75 Years and over | 1,480 (7.6%) | 16 (1.1%) |
| Total | 177,936 (64.2%) | 10,498 (5.9%) |
Employment Status by Educational Attainment in Galveston County
According to labor force statistics for Galveston County, 78.5% of individuals (144,818) out of the total population between 25 and 64 years of age (184,481) are in the labor force, with 5.1% or 7,386 of them being unemployed. The group with the highest labor force participation rate are those with the educational attainment of bachelor's degree or higher, with 85.0% or 54,764 individuals in the labor force. Within the labor force, individuals with less than high school education have the highest percentage of unemployment, with 9.5% or 1,168 of them being unemployed.
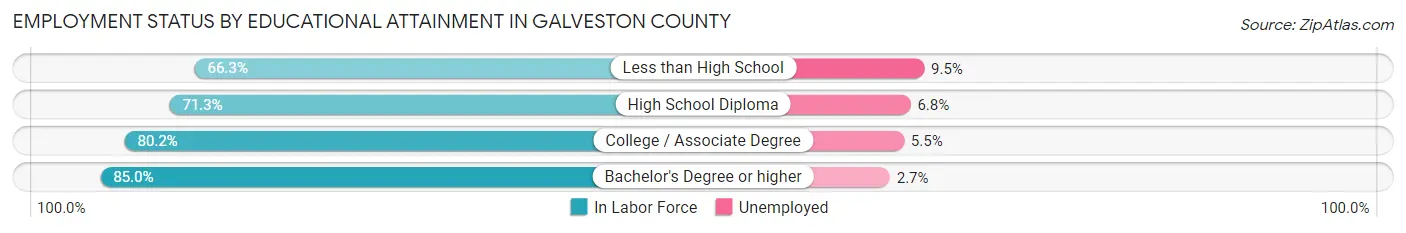
| Educational Attainment | In Labor Force | Unemployed |
| Less than High School | 12,299 (66.3%) | 1,762 (9.5%) |
| High School Diploma | 29,390 (71.3%) | 2,803 (6.8%) |
| College / Associate Degree | 48,346 (80.2%) | 3,316 (5.5%) |
| Bachelor's Degree or higher | 54,764 (85.0%) | 1,740 (2.7%) |
| Total | 144,818 (78.5%) | 9,409 (5.1%) |
Employment Occupations by Sex in Galveston County
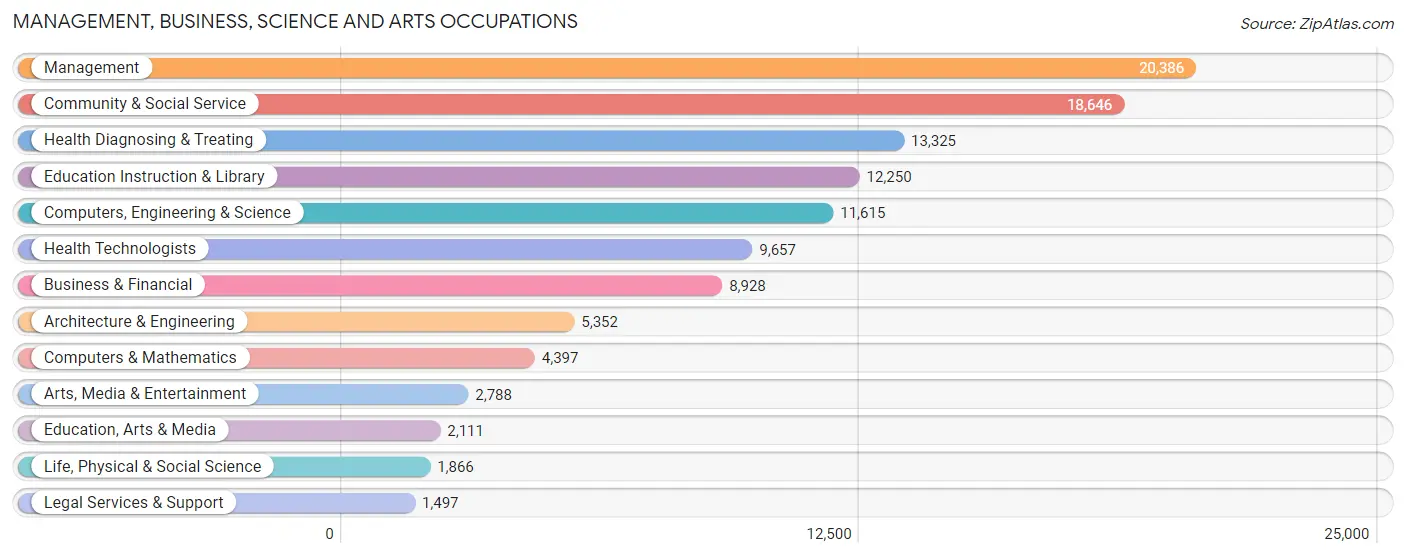
Management, Business, Science and Arts Occupations
The most common Management, Business, Science and Arts occupations in Galveston County are Management (20,386 | 12.2%), Community & Social Service (18,646 | 11.2%), Health Diagnosing & Treating (13,325 | 8.0%), Education Instruction & Library (12,250 | 7.3%), and Computers, Engineering & Science (11,615 | 7.0%).
Management, Business, Science and Arts Occupations by Sex
Within the Management, Business, Science and Arts occupations in Galveston County, the most male-oriented occupations are Architecture & Engineering (83.0%), Computers, Engineering & Science (77.0%), and Computers & Mathematics (76.7%), while the most female-oriented occupations are Health Technologists (75.6%), Health Diagnosing & Treating (73.6%), and Education Instruction & Library (72.5%).
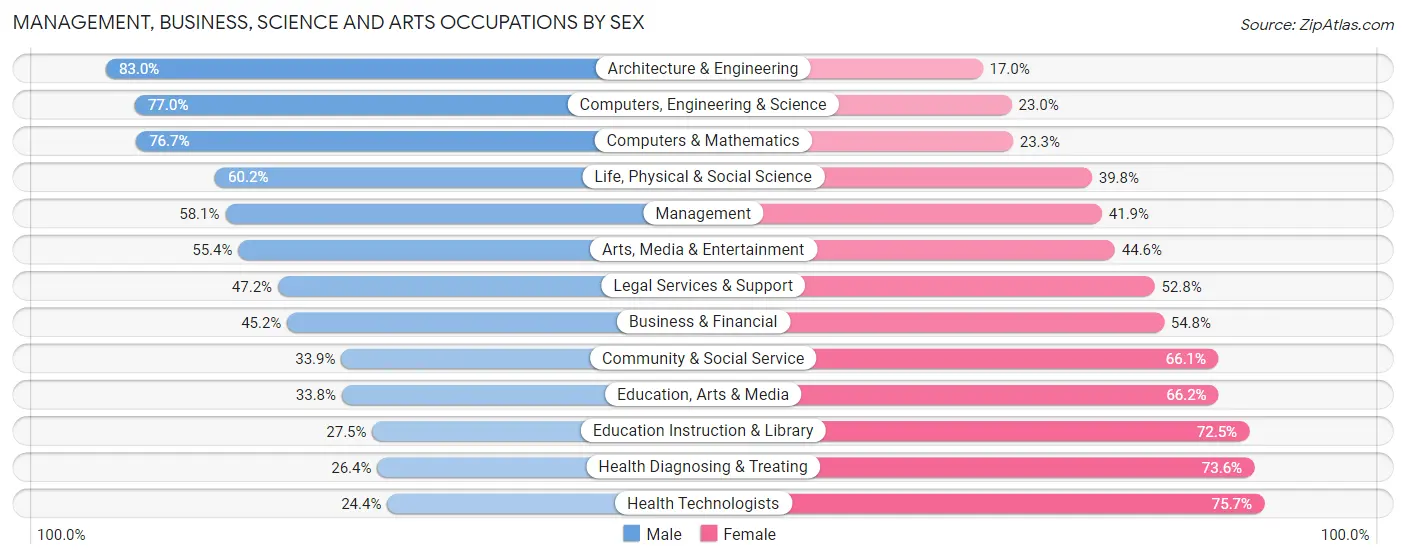
| Occupation | Male | Female |
| Management | 11,852 (58.1%) | 8,534 (41.9%) |
| Business & Financial | 4,037 (45.2%) | 4,891 (54.8%) |
| Computers, Engineering & Science | 8,940 (77.0%) | 2,675 (23.0%) |
| Computers & Mathematics | 3,373 (76.7%) | 1,024 (23.3%) |
| Architecture & Engineering | 4,443 (83.0%) | 909 (17.0%) |
| Life, Physical & Social Science | 1,124 (60.2%) | 742 (39.8%) |
| Community & Social Service | 6,329 (33.9%) | 12,317 (66.1%) |
| Education, Arts & Media | 714 (33.8%) | 1,397 (66.2%) |
| Legal Services & Support | 706 (47.2%) | 791 (52.8%) |
| Education Instruction & Library | 3,364 (27.5%) | 8,886 (72.5%) |
| Arts, Media & Entertainment | 1,545 (55.4%) | 1,243 (44.6%) |
| Health Diagnosing & Treating | 3,522 (26.4%) | 9,803 (73.6%) |
| Health Technologists | 2,351 (24.3%) | 7,306 (75.6%) |
| Total (Category) | 34,680 (47.6%) | 38,220 (52.4%) |
| Total (Overall) | 89,609 (53.7%) | 77,236 (46.3%) |
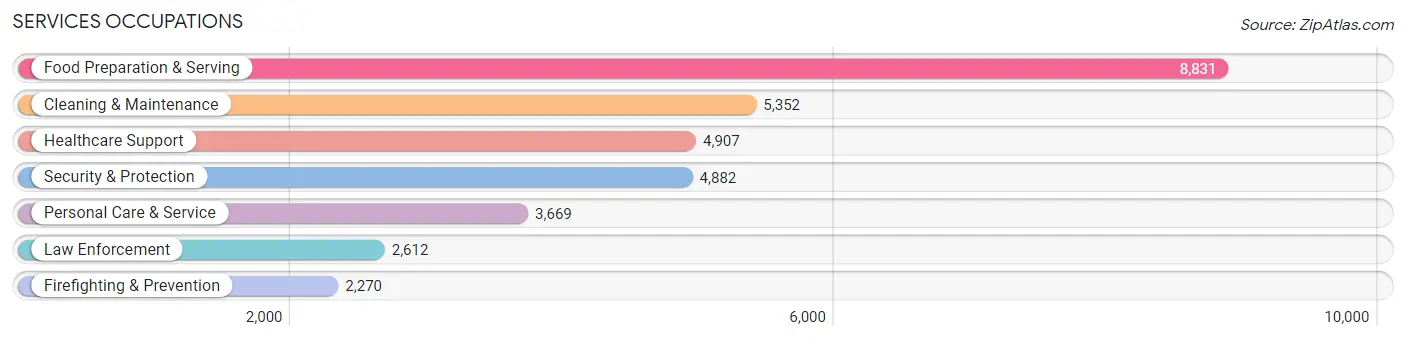
Services Occupations
The most common Services occupations in Galveston County are Food Preparation & Serving (8,831 | 5.3%), Cleaning & Maintenance (5,352 | 3.2%), Healthcare Support (4,907 | 2.9%), Security & Protection (4,882 | 2.9%), and Personal Care & Service (3,669 | 2.2%).
Services Occupations by Sex
Within the Services occupations in Galveston County, the most male-oriented occupations are Law Enforcement (78.2%), Security & Protection (74.1%), and Firefighting & Prevention (69.4%), while the most female-oriented occupations are Healthcare Support (85.6%), Personal Care & Service (76.9%), and Food Preparation & Serving (58.4%).
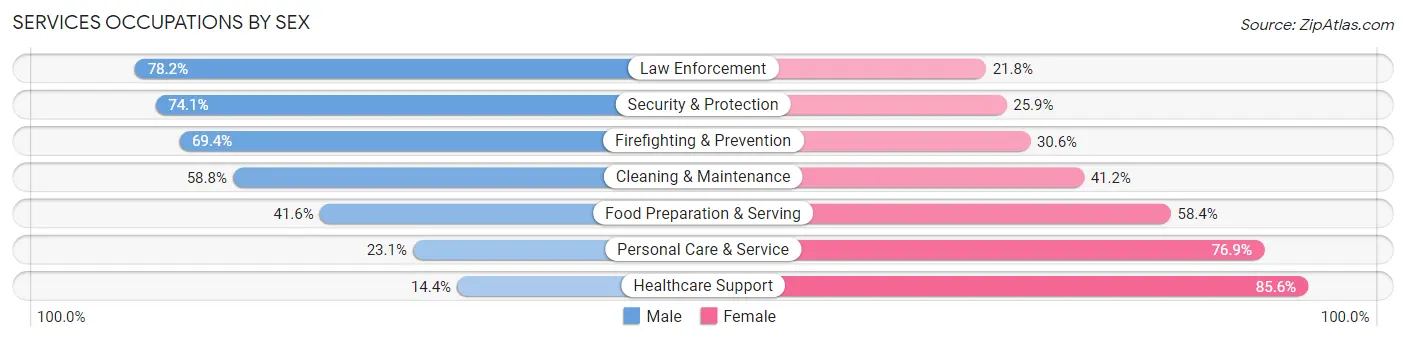
| Occupation | Male | Female |
| Healthcare Support | 706 (14.4%) | 4,201 (85.6%) |
| Security & Protection | 3,618 (74.1%) | 1,264 (25.9%) |
| Firefighting & Prevention | 1,576 (69.4%) | 694 (30.6%) |
| Law Enforcement | 2,042 (78.2%) | 570 (21.8%) |
| Food Preparation & Serving | 3,673 (41.6%) | 5,158 (58.4%) |
| Cleaning & Maintenance | 3,146 (58.8%) | 2,206 (41.2%) |
| Personal Care & Service | 849 (23.1%) | 2,820 (76.9%) |
| Total (Category) | 11,992 (43.4%) | 15,649 (56.6%) |
| Total (Overall) | 89,609 (53.7%) | 77,236 (46.3%) |
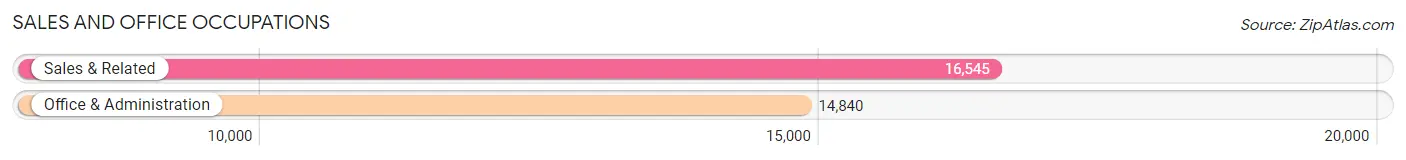
Sales and Office Occupations
The most common Sales and Office occupations in Galveston County are Sales & Related (16,545 | 9.9%), and Office & Administration (14,840 | 8.9%).
Sales and Office Occupations by Sex
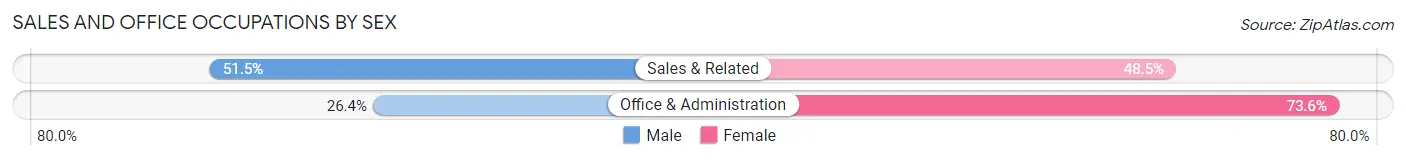
| Occupation | Male | Female |
| Sales & Related | 8,519 (51.5%) | 8,026 (48.5%) |
| Office & Administration | 3,922 (26.4%) | 10,918 (73.6%) |
| Total (Category) | 12,441 (39.6%) | 18,944 (60.4%) |
| Total (Overall) | 89,609 (53.7%) | 77,236 (46.3%) |
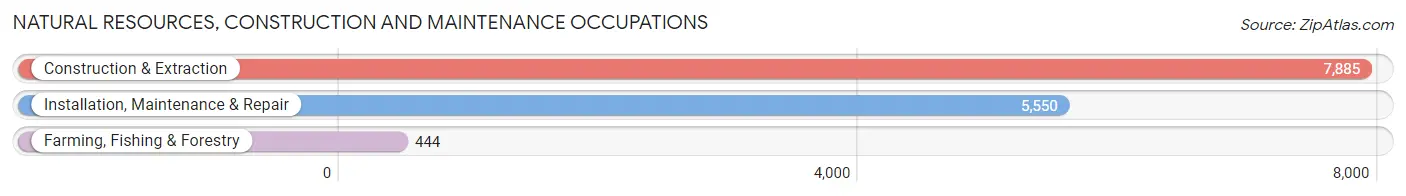
Natural Resources, Construction and Maintenance Occupations
The most common Natural Resources, Construction and Maintenance occupations in Galveston County are Construction & Extraction (7,885 | 4.7%), Installation, Maintenance & Repair (5,550 | 3.3%), and Farming, Fishing & Forestry (444 | 0.3%).
Natural Resources, Construction and Maintenance Occupations by Sex
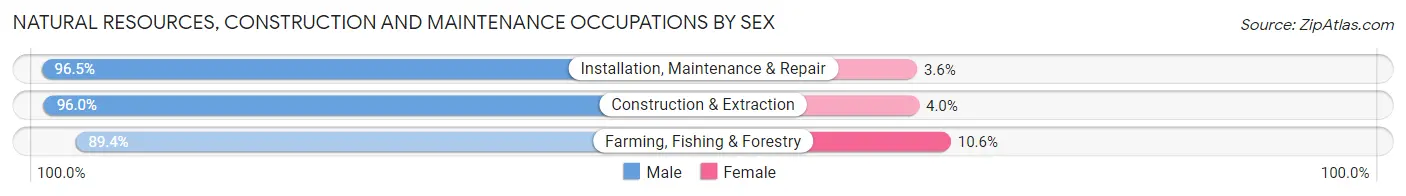
| Occupation | Male | Female |
| Farming, Fishing & Forestry | 397 (89.4%) | 47 (10.6%) |
| Construction & Extraction | 7,571 (96.0%) | 314 (4.0%) |
| Installation, Maintenance & Repair | 5,353 (96.5%) | 197 (3.5%) |
| Total (Category) | 13,321 (96.0%) | 558 (4.0%) |
| Total (Overall) | 89,609 (53.7%) | 77,236 (46.3%) |
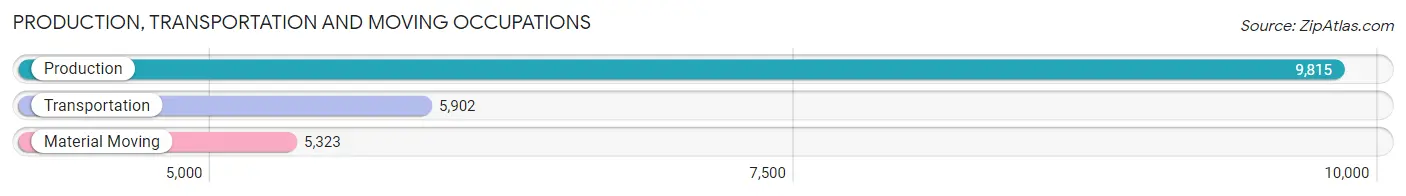
Production, Transportation and Moving Occupations
The most common Production, Transportation and Moving occupations in Galveston County are Production (9,815 | 5.9%), Transportation (5,902 | 3.5%), and Material Moving (5,323 | 3.2%).
Production, Transportation and Moving Occupations by Sex
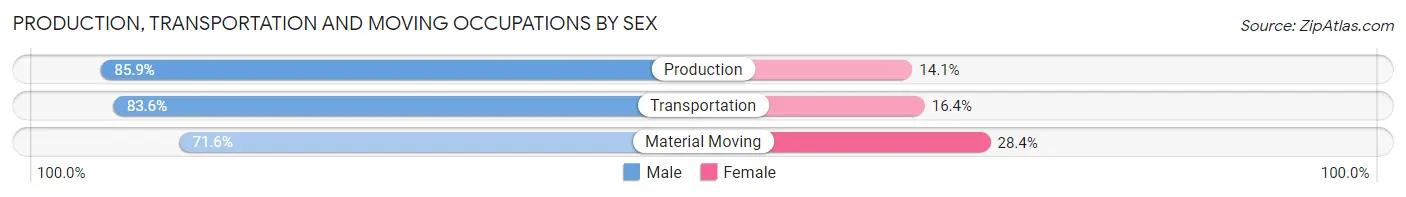
| Occupation | Male | Female |
| Production | 8,431 (85.9%) | 1,384 (14.1%) |
| Transportation | 4,935 (83.6%) | 967 (16.4%) |
| Material Moving | 3,809 (71.6%) | 1,514 (28.4%) |
| Total (Category) | 17,175 (81.6%) | 3,865 (18.4%) |
| Total (Overall) | 89,609 (53.7%) | 77,236 (46.3%) |
Employment Industries by Sex in Galveston County
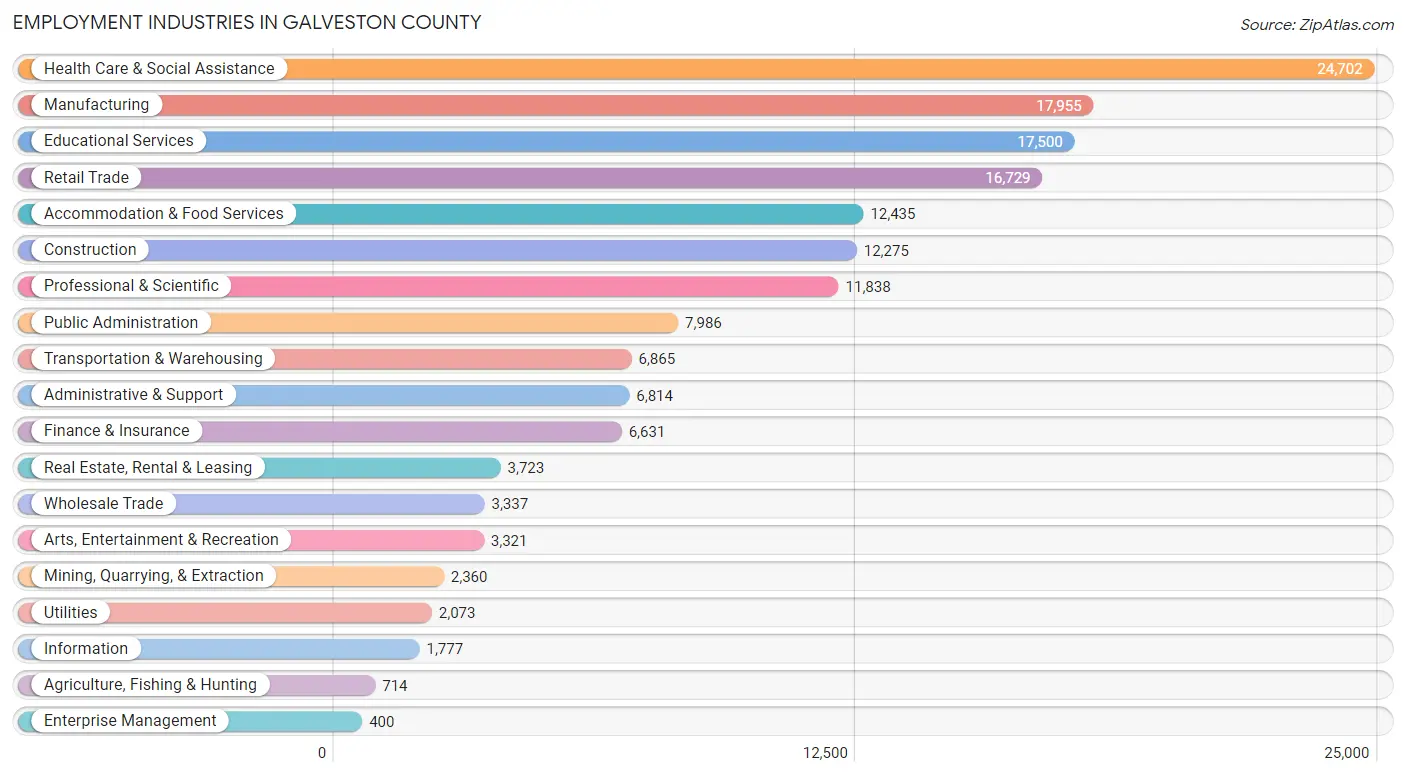
Employment Industries in Galveston County
The major employment industries in Galveston County include Health Care & Social Assistance (24,702 | 14.8%), Manufacturing (17,955 | 10.8%), Educational Services (17,500 | 10.5%), Retail Trade (16,729 | 10.0%), and Accommodation & Food Services (12,435 | 7.4%).
Employment Industries by Sex in Galveston County
The Galveston County industries that see more men than women are Utilities (93.0%), Agriculture, Fishing & Hunting (90.6%), and Construction (88.3%), whereas the industries that tend to have a higher number of women are Health Care & Social Assistance (77.5%), Educational Services (66.6%), and Enterprise Management (58.5%).
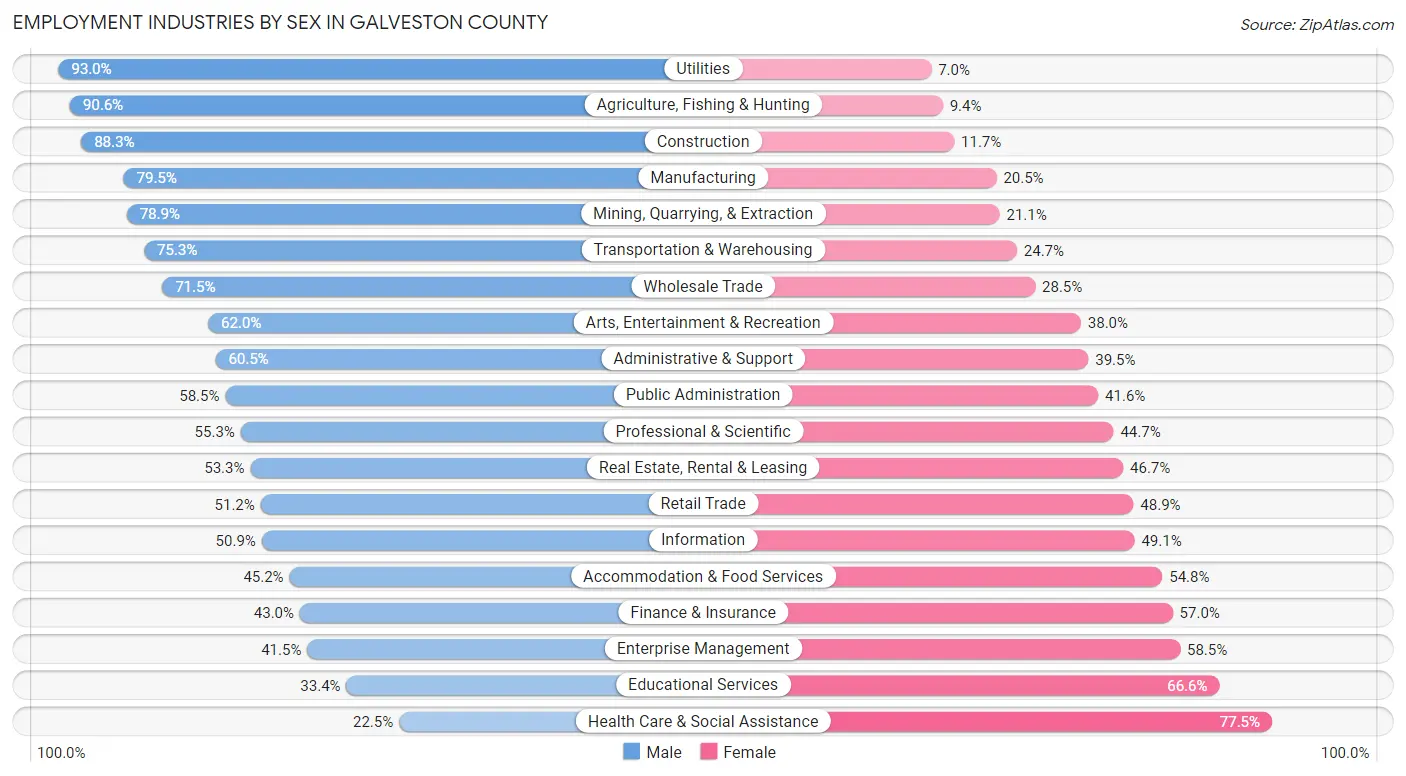
| Industry | Male | Female |
| Agriculture, Fishing & Hunting | 647 (90.6%) | 67 (9.4%) |
| Mining, Quarrying, & Extraction | 1,861 (78.9%) | 499 (21.1%) |
| Construction | 10,835 (88.3%) | 1,440 (11.7%) |
| Manufacturing | 14,275 (79.5%) | 3,680 (20.5%) |
| Wholesale Trade | 2,386 (71.5%) | 951 (28.5%) |
| Retail Trade | 8,557 (51.1%) | 8,172 (48.8%) |
| Transportation & Warehousing | 5,168 (75.3%) | 1,697 (24.7%) |
| Utilities | 1,928 (93.0%) | 145 (7.0%) |
| Information | 905 (50.9%) | 872 (49.1%) |
| Finance & Insurance | 2,853 (43.0%) | 3,778 (57.0%) |
| Real Estate, Rental & Leasing | 1,984 (53.3%) | 1,739 (46.7%) |
| Professional & Scientific | 6,544 (55.3%) | 5,294 (44.7%) |
| Enterprise Management | 166 (41.5%) | 234 (58.5%) |
| Administrative & Support | 4,122 (60.5%) | 2,692 (39.5%) |
| Educational Services | 5,843 (33.4%) | 11,657 (66.6%) |
| Health Care & Social Assistance | 5,557 (22.5%) | 19,145 (77.5%) |
| Arts, Entertainment & Recreation | 2,060 (62.0%) | 1,261 (38.0%) |
| Accommodation & Food Services | 5,618 (45.2%) | 6,817 (54.8%) |
| Public Administration | 4,668 (58.5%) | 3,318 (41.5%) |
| Total | 89,609 (53.7%) | 77,236 (46.3%) |
Education in Galveston County
School Enrollment in Galveston County
The most common levels of schooling among the 90,950 students in Galveston County are high school (20,149 | 22.2%), middle school (19,413 | 21.3%), and elementary school (19,255 | 21.2%).
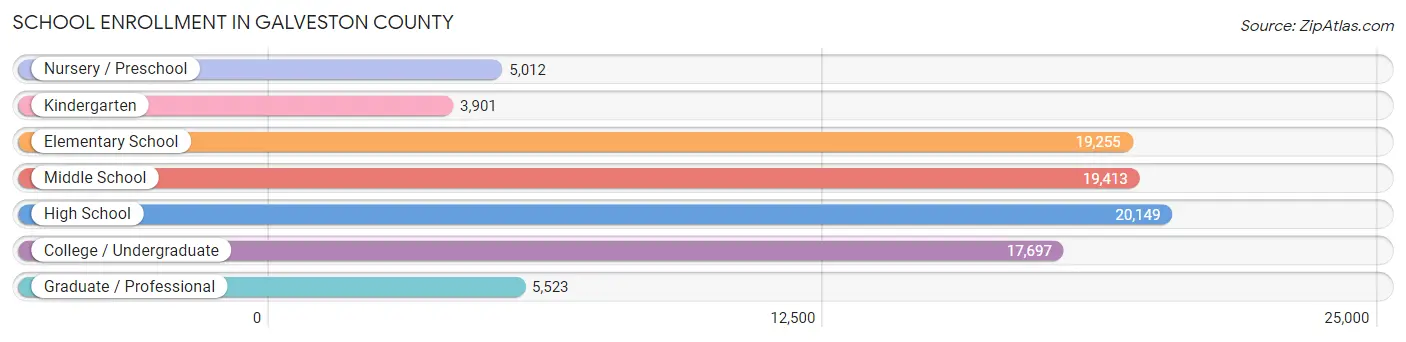
| School Level | # Students | % Students |
| Nursery / Preschool | 5,012 | 5.5% |
| Kindergarten | 3,901 | 4.3% |
| Elementary School | 19,255 | 21.2% |
| Middle School | 19,413 | 21.3% |
| High School | 20,149 | 22.2% |
| College / Undergraduate | 17,697 | 19.5% |
| Graduate / Professional | 5,523 | 6.1% |
| Total | 90,950 | 100.0% |
School Enrollment by Age by Funding Source in Galveston County
Out of a total of 90,950 students who are enrolled in schools in Galveston County, 12,278 (13.5%) attend a private institution, while the remaining 78,672 (86.5%) are enrolled in public schools. The age group of 3 to 4 year olds has the highest likelihood of being enrolled in private schools, with 2,159 (60.2% in the age bracket) enrolled. Conversely, the age group of 15 to 17 year olds has the lowest likelihood of being enrolled in a private school, with 13,703 (93.9% in the age bracket) attending a public institution.
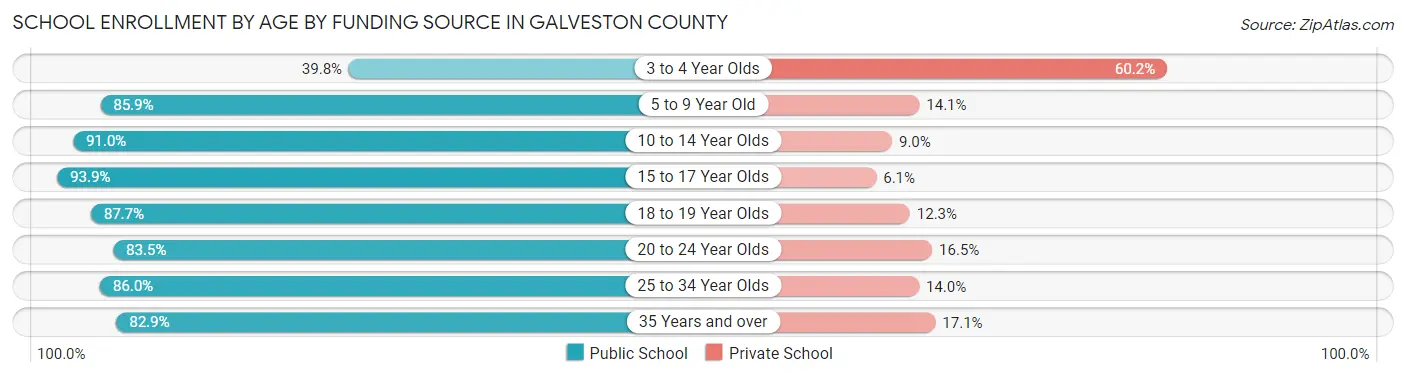
| Age Bracket | Public School | Private School |
| 3 to 4 Year Olds | 1,426 (39.8%) | 2,159 (60.2%) |
| 5 to 9 Year Old | 19,025 (85.9%) | 3,123 (14.1%) |
| 10 to 14 Year Olds | 22,032 (91.0%) | 2,181 (9.0%) |
| 15 to 17 Year Olds | 13,703 (93.9%) | 886 (6.1%) |
| 18 to 19 Year Olds | 5,866 (87.7%) | 825 (12.3%) |
| 20 to 24 Year Olds | 7,311 (83.5%) | 1,443 (16.5%) |
| 25 to 34 Year Olds | 4,768 (86.0%) | 778 (14.0%) |
| 35 Years and over | 4,497 (82.9%) | 927 (17.1%) |
| Total | 78,672 (86.5%) | 12,278 (13.5%) |
Educational Attainment by Field of Study in Galveston County
Business (16,366 | 19.3%), science & technology (10,420 | 12.3%), education (9,200 | 10.9%), engineering (9,050 | 10.7%), and bio, nature & agricultural (7,222 | 8.5%) are the most common fields of study among 84,663 individuals in Galveston County who have obtained a bachelor's degree or higher.
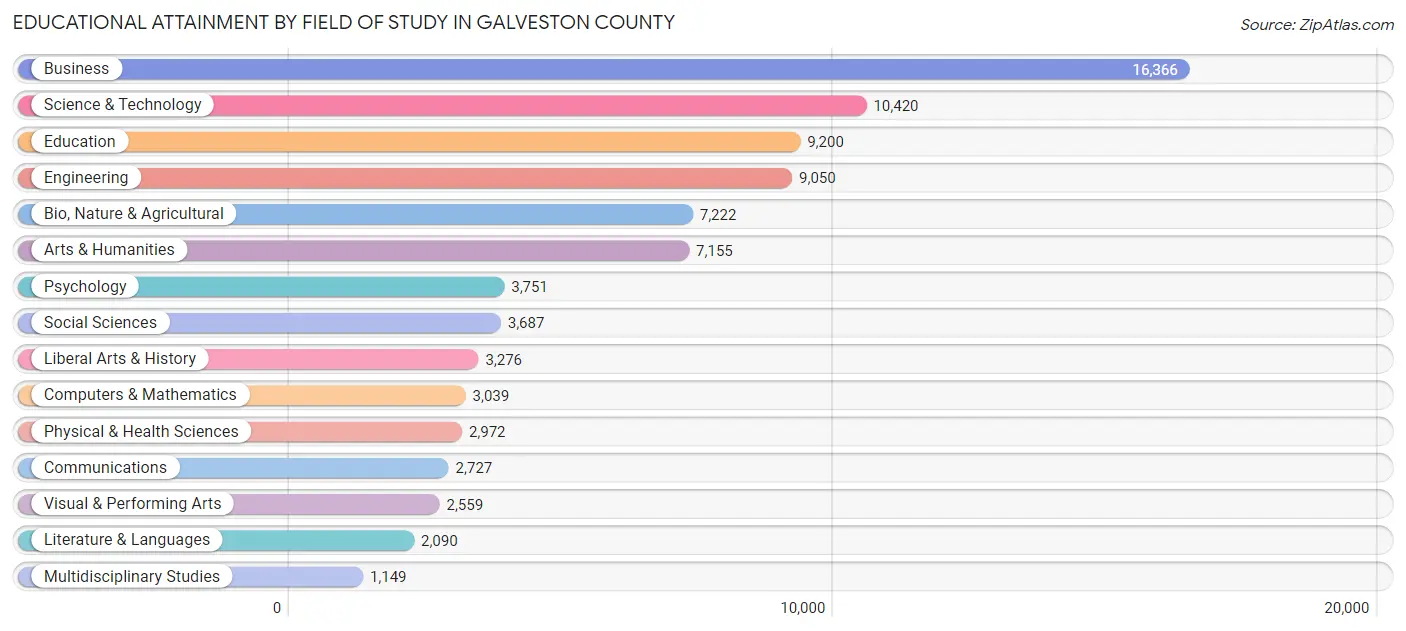
| Field of Study | # Graduates | % Graduates |
| Computers & Mathematics | 3,039 | 3.6% |
| Bio, Nature & Agricultural | 7,222 | 8.5% |
| Physical & Health Sciences | 2,972 | 3.5% |
| Psychology | 3,751 | 4.4% |
| Social Sciences | 3,687 | 4.3% |
| Engineering | 9,050 | 10.7% |
| Multidisciplinary Studies | 1,149 | 1.4% |
| Science & Technology | 10,420 | 12.3% |
| Business | 16,366 | 19.3% |
| Education | 9,200 | 10.9% |
| Literature & Languages | 2,090 | 2.5% |
| Liberal Arts & History | 3,276 | 3.9% |
| Visual & Performing Arts | 2,559 | 3.0% |
| Communications | 2,727 | 3.2% |
| Arts & Humanities | 7,155 | 8.5% |
| Total | 84,663 | 100.0% |
Transportation & Commute in Galveston County
Vehicle Availability by Sex in Galveston County
The most prevalent vehicle ownership categories in Galveston County are males with 2 vehicles (40,882, accounting for 46.2%) and females with 2 vehicles (33,013, making up 54.3%).
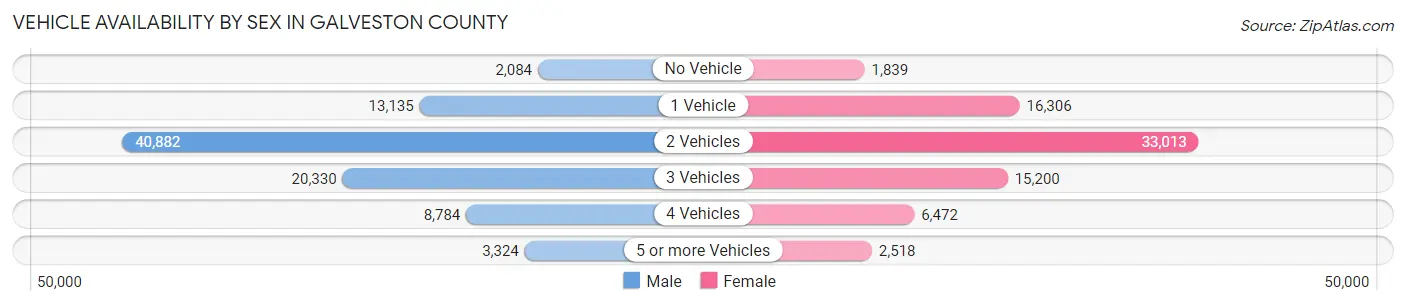
| Vehicles Available | Male | Female |
| No Vehicle | 2,084 (2.4%) | 1,839 (2.4%) |
| 1 Vehicle | 13,135 (14.8%) | 16,306 (21.6%) |
| 2 Vehicles | 40,882 (46.2%) | 33,013 (43.8%) |
| 3 Vehicles | 20,330 (23.0%) | 15,200 (20.2%) |
| 4 Vehicles | 8,784 (9.9%) | 6,472 (8.6%) |
| 5 or more Vehicles | 3,324 (3.7%) | 2,518 (3.3%) |
| Total | 88,539 (100.0%) | 75,348 (100.0%) |
Commute Time in Galveston County
The most frequently occuring commute durations in Galveston County are 15 to 19 minutes (22,059 commuters, 14.8%), 20 to 24 minutes (21,350 commuters, 14.3%), and 30 to 34 minutes (20,869 commuters, 14.0%).
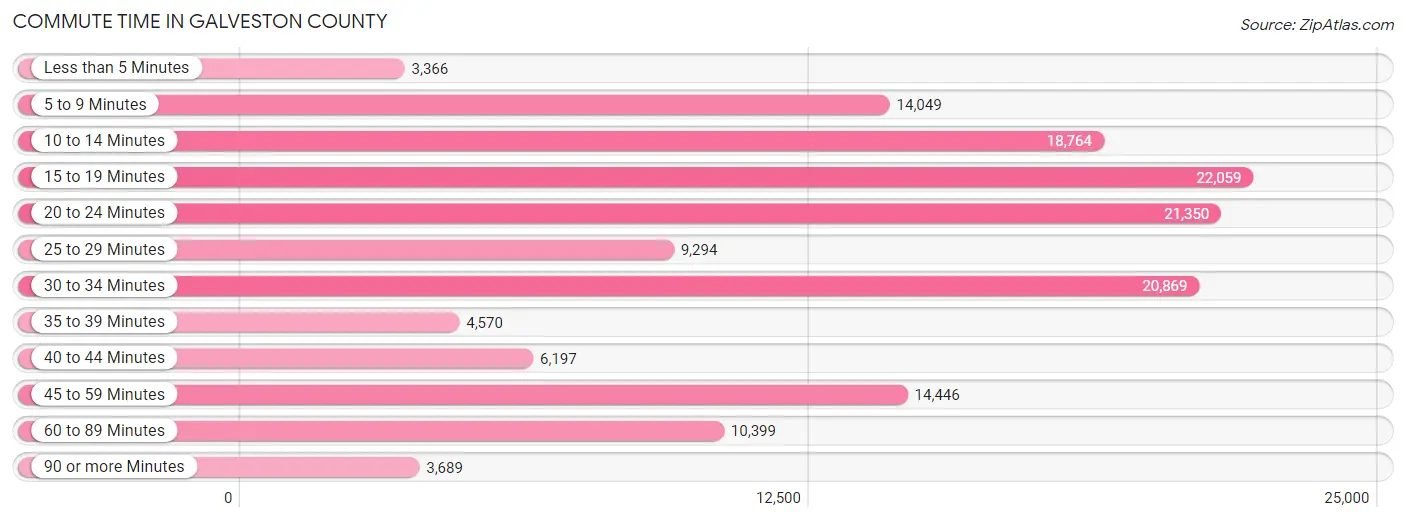
| Commute Time | # Commuters | % Commuters |
| Less than 5 Minutes | 3,366 | 2.3% |
| 5 to 9 Minutes | 14,049 | 9.4% |
| 10 to 14 Minutes | 18,764 | 12.6% |
| 15 to 19 Minutes | 22,059 | 14.8% |
| 20 to 24 Minutes | 21,350 | 14.3% |
| 25 to 29 Minutes | 9,294 | 6.2% |
| 30 to 34 Minutes | 20,869 | 14.0% |
| 35 to 39 Minutes | 4,570 | 3.1% |
| 40 to 44 Minutes | 6,197 | 4.2% |
| 45 to 59 Minutes | 14,446 | 9.7% |
| 60 to 89 Minutes | 10,399 | 7.0% |
| 90 or more Minutes | 3,689 | 2.5% |
Commute Time by Sex in Galveston County
The most common commute times in Galveston County are 20 to 24 minutes (12,023 commuters, 14.7%) for males and 15 to 19 minutes (10,878 commuters, 16.2%) for females.
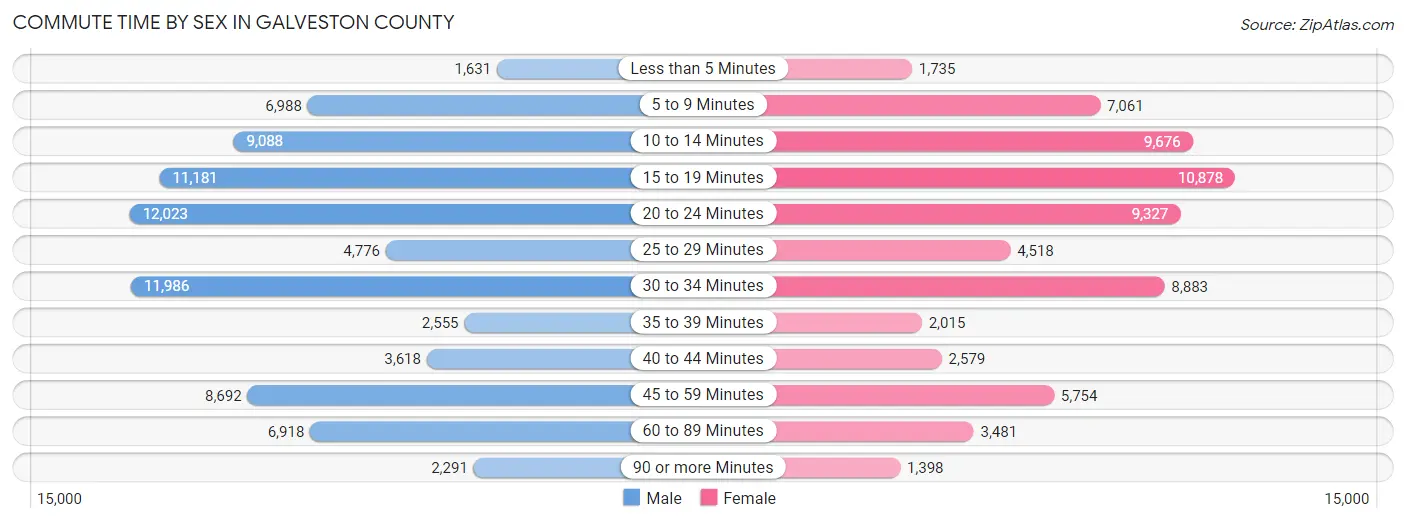
| Commute Time | Male | Female |
| Less than 5 Minutes | 1,631 (2.0%) | 1,735 (2.6%) |
| 5 to 9 Minutes | 6,988 (8.6%) | 7,061 (10.5%) |
| 10 to 14 Minutes | 9,088 (11.1%) | 9,676 (14.4%) |
| 15 to 19 Minutes | 11,181 (13.7%) | 10,878 (16.2%) |
| 20 to 24 Minutes | 12,023 (14.7%) | 9,327 (13.9%) |
| 25 to 29 Minutes | 4,776 (5.8%) | 4,518 (6.7%) |
| 30 to 34 Minutes | 11,986 (14.7%) | 8,883 (13.2%) |
| 35 to 39 Minutes | 2,555 (3.1%) | 2,015 (3.0%) |
| 40 to 44 Minutes | 3,618 (4.4%) | 2,579 (3.8%) |
| 45 to 59 Minutes | 8,692 (10.6%) | 5,754 (8.6%) |
| 60 to 89 Minutes | 6,918 (8.5%) | 3,481 (5.2%) |
| 90 or more Minutes | 2,291 (2.8%) | 1,398 (2.1%) |
Time of Departure to Work by Sex in Galveston County
The most frequent times of departure to work in Galveston County are 7:00 AM to 7:29 AM (10,404, 12.7%) for males and 7:00 AM to 7:29 AM (11,142, 16.6%) for females.
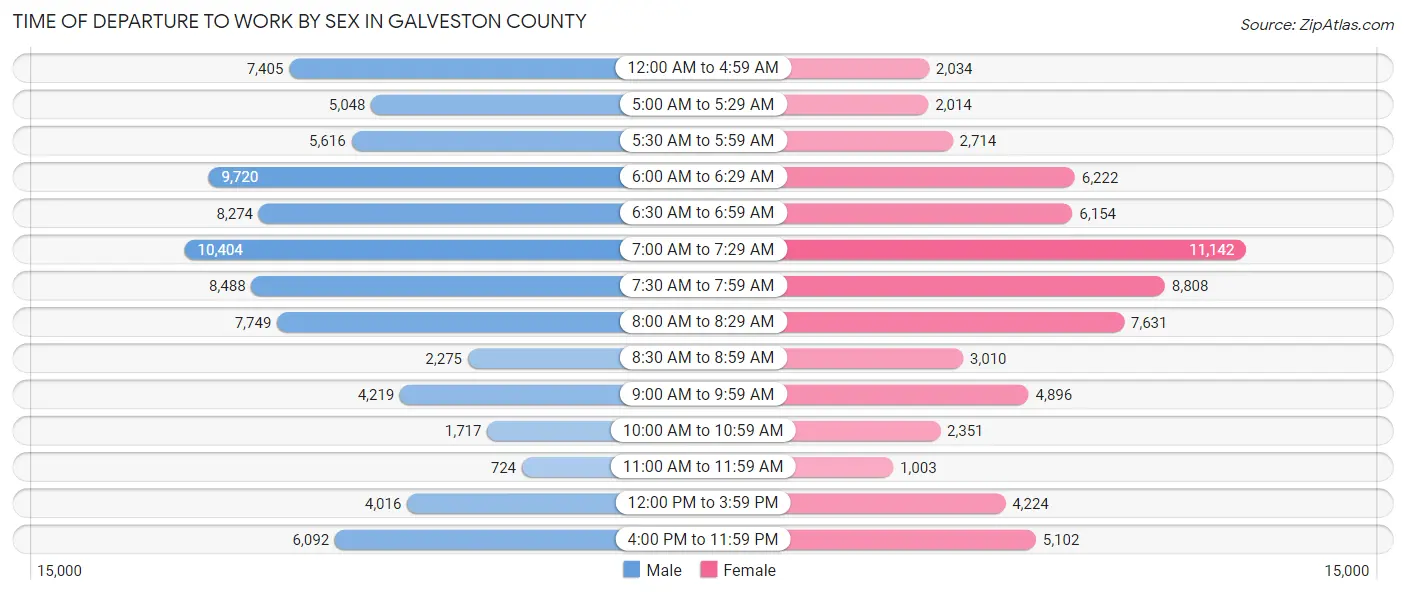
| Time of Departure | Male | Female |
| 12:00 AM to 4:59 AM | 7,405 (9.1%) | 2,034 (3.0%) |
| 5:00 AM to 5:29 AM | 5,048 (6.2%) | 2,014 (3.0%) |
| 5:30 AM to 5:59 AM | 5,616 (6.9%) | 2,714 (4.0%) |
| 6:00 AM to 6:29 AM | 9,720 (11.9%) | 6,222 (9.2%) |
| 6:30 AM to 6:59 AM | 8,274 (10.1%) | 6,154 (9.1%) |
| 7:00 AM to 7:29 AM | 10,404 (12.7%) | 11,142 (16.6%) |
| 7:30 AM to 7:59 AM | 8,488 (10.4%) | 8,808 (13.1%) |
| 8:00 AM to 8:29 AM | 7,749 (9.5%) | 7,631 (11.3%) |
| 8:30 AM to 8:59 AM | 2,275 (2.8%) | 3,010 (4.5%) |
| 9:00 AM to 9:59 AM | 4,219 (5.2%) | 4,896 (7.3%) |
| 10:00 AM to 10:59 AM | 1,717 (2.1%) | 2,351 (3.5%) |
| 11:00 AM to 11:59 AM | 724 (0.9%) | 1,003 (1.5%) |
| 12:00 PM to 3:59 PM | 4,016 (4.9%) | 4,224 (6.3%) |
| 4:00 PM to 11:59 PM | 6,092 (7.4%) | 5,102 (7.6%) |
| Total | 81,747 (100.0%) | 67,305 (100.0%) |
Housing Occupancy in Galveston County
Occupancy by Ownership in Galveston County
Of the total 135,275 dwellings in Galveston County, owner-occupied units account for 91,684 (67.8%), while renter-occupied units make up 43,591 (32.2%).
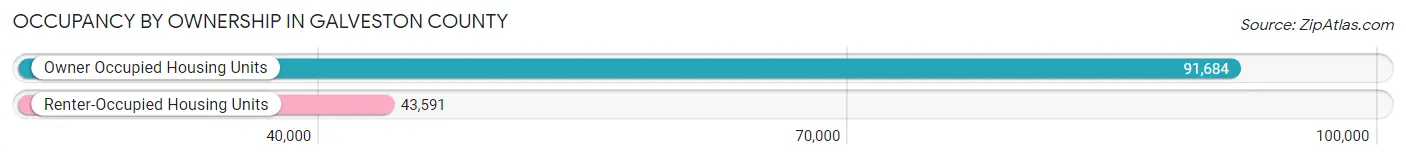
| Occupancy | # Housing Units | % Housing Units |
| Owner Occupied Housing Units | 91,684 | 67.8% |
| Renter-Occupied Housing Units | 43,591 | 32.2% |
| Total Occupied Housing Units | 135,275 | 100.0% |
Occupancy by Household Size in Galveston County
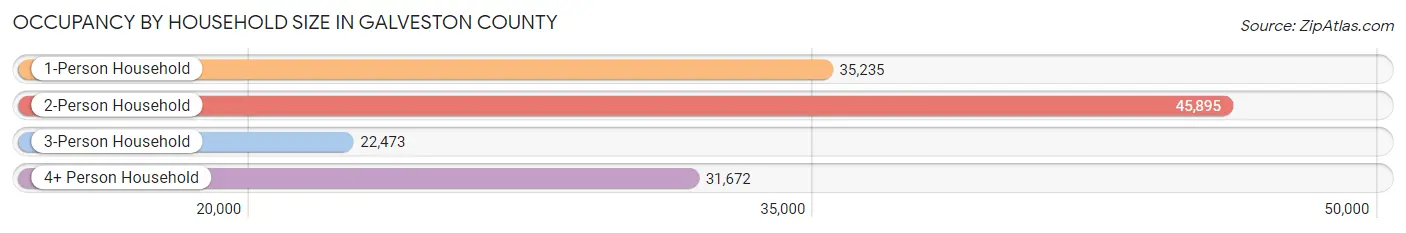
| Household Size | # Housing Units | % Housing Units |
| 1-Person Household | 35,235 | 26.1% |
| 2-Person Household | 45,895 | 33.9% |
| 3-Person Household | 22,473 | 16.6% |
| 4+ Person Household | 31,672 | 23.4% |
| Total Housing Units | 135,275 | 100.0% |
Occupancy by Ownership by Household Size in Galveston County
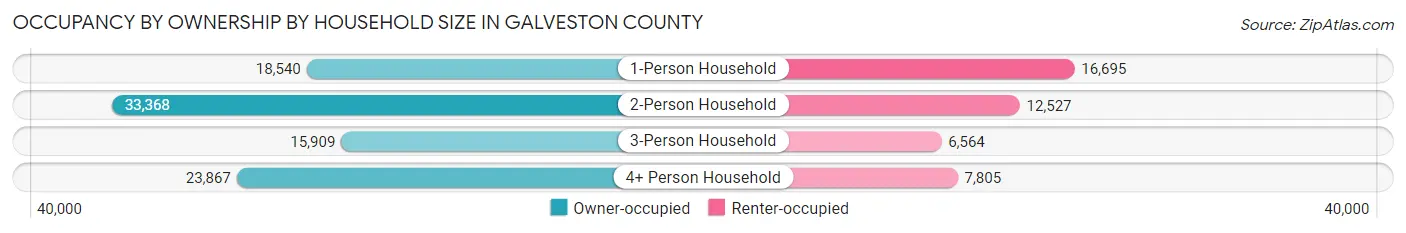
| Household Size | Owner-occupied | Renter-occupied |
| 1-Person Household | 18,540 (52.6%) | 16,695 (47.4%) |
| 2-Person Household | 33,368 (72.7%) | 12,527 (27.3%) |
| 3-Person Household | 15,909 (70.8%) | 6,564 (29.2%) |
| 4+ Person Household | 23,867 (75.4%) | 7,805 (24.6%) |
| Total Housing Units | 91,684 (67.8%) | 43,591 (32.2%) |
Occupancy by Educational Attainment in Galveston County
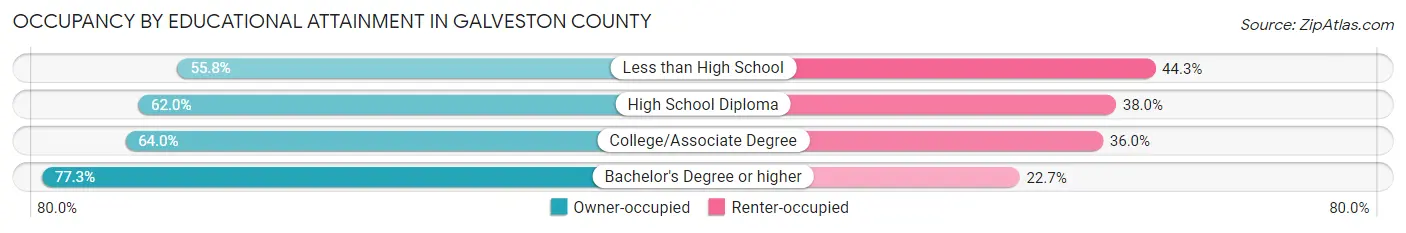
| Household Size | Owner-occupied | Renter-occupied |
| Less than High School | 6,097 (55.7%) | 4,839 (44.3%) |
| High School Diploma | 17,155 (62.0%) | 10,519 (38.0%) |
| College/Associate Degree | 30,318 (64.0%) | 17,021 (36.0%) |
| Bachelor's Degree or higher | 38,114 (77.3%) | 11,212 (22.7%) |
Occupancy by Age of Householder in Galveston County
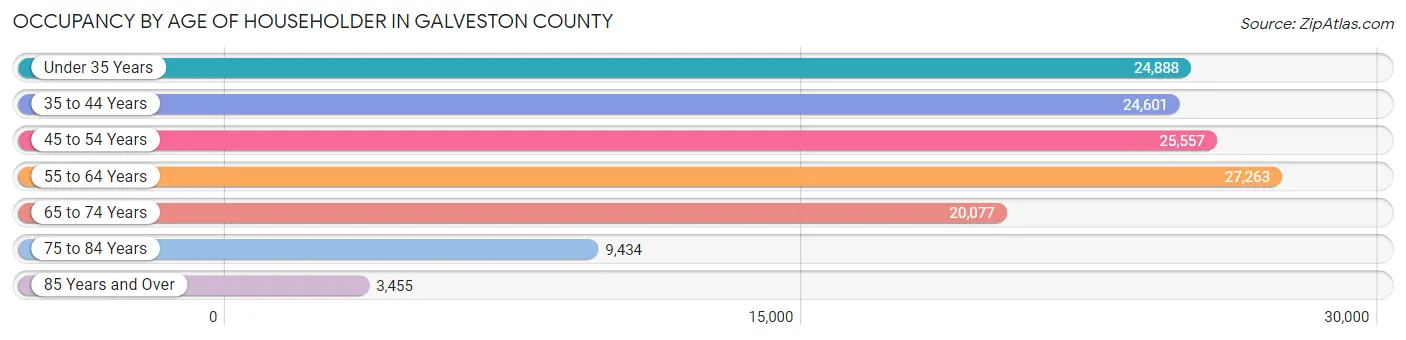
| Age Bracket | # Households | % Households |
| Under 35 Years | 24,888 | 18.4% |
| 35 to 44 Years | 24,601 | 18.2% |
| 45 to 54 Years | 25,557 | 18.9% |
| 55 to 64 Years | 27,263 | 20.2% |
| 65 to 74 Years | 20,077 | 14.8% |
| 75 to 84 Years | 9,434 | 7.0% |
| 85 Years and Over | 3,455 | 2.5% |
| Total | 135,275 | 100.0% |
Housing Finances in Galveston County
Median Income by Occupancy in Galveston County
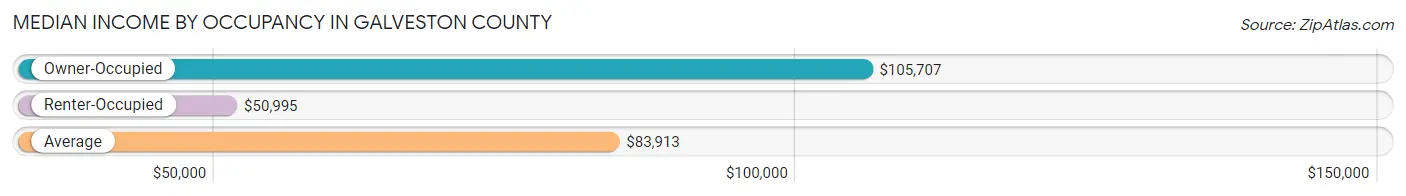
| Occupancy Type | # Households | Median Income |
| Owner-Occupied | 91,684 (67.8%) | $105,707 |
| Renter-Occupied | 43,591 (32.2%) | $50,995 |
| Average | 135,275 (100.0%) | $83,913 |
Occupancy by Householder Income Bracket in Galveston County
| Income Bracket | Owner-occupied | Renter-occupied |
| Less than $5,000 | 1,804 (2.0%) | 2,672 (6.1%) |
| $5,000 to $9,999 | 1,089 (1.2%) | 1,091 (2.5%) |
| $10,000 to $14,999 | 2,265 (2.5%) | 2,725 (6.2%) |
| $15,000 to $19,999 | 1,680 (1.8%) | 2,745 (6.3%) |
| $20,000 to $24,999 | 1,998 (2.2%) | 2,446 (5.6%) |
| $25,000 to $34,999 | 4,513 (4.9%) | 4,848 (11.1%) |
| $35,000 to $49,999 | 6,802 (7.4%) | 4,860 (11.2%) |
| $50,000 to $74,999 | 11,239 (12.3%) | 8,319 (19.1%) |
| $75,000 to $99,999 | 12,107 (13.2%) | 4,937 (11.3%) |
| $100,000 to $149,999 | 18,804 (20.5%) | 6,283 (14.4%) |
| $150,000 or more | 29,383 (32.1%) | 2,665 (6.1%) |
| Total | 91,684 (100.0%) | 43,591 (100.0%) |
Monthly Housing Cost Tiers in Galveston County
| Monthly Cost | Owner-occupied | Renter-occupied |
| Less than $300 | 4,273 (4.7%) | 567 (1.3%) |
| $300 to $499 | 7,466 (8.1%) | 942 (2.2%) |
| $500 to $799 | 11,578 (12.6%) | 3,004 (6.9%) |
| $800 to $999 | 8,364 (9.1%) | 6,067 (13.9%) |
| $1,000 to $1,499 | 15,590 (17.0%) | 17,003 (39.0%) |
| $1,500 to $1,999 | 15,686 (17.1%) | 9,993 (22.9%) |
| $2,000 to $2,499 | 12,265 (13.4%) | 2,571 (5.9%) |
| $2,500 to $2,999 | 6,543 (7.1%) | 832 (1.9%) |
| $3,000 or more | 9,919 (10.8%) | 860 (2.0%) |
| Total | 91,684 (100.0%) | 43,591 (100.0%) |
Physical Housing Characteristics in Galveston County
Housing Structures in Galveston County
| Structure Type | # Housing Units | % Housing Units |
| Single Unit, Detached | 99,664 | 73.7% |
| Single Unit, Attached | 2,265 | 1.7% |
| 2 Unit Apartments | 2,182 | 1.6% |
| 3 or 4 Unit Apartments | 3,255 | 2.4% |
| 5 to 9 Unit Apartments | 5,189 | 3.8% |
| 10 or more Apartments | 16,908 | 12.5% |
| Mobile Home / Other | 5,812 | 4.3% |
| Total | 135,275 | 100.0% |
Housing Structures by Occupancy in Galveston County
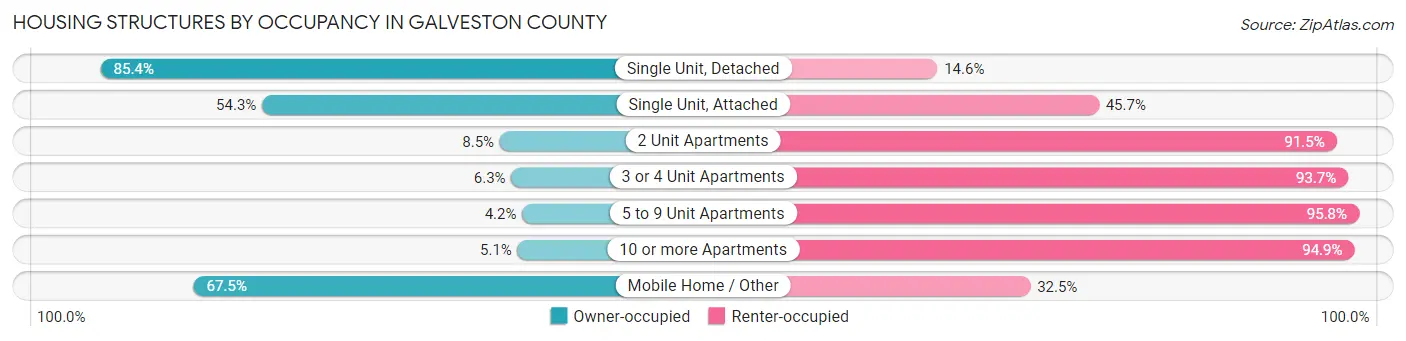
| Structure Type | Owner-occupied | Renter-occupied |
| Single Unit, Detached | 85,072 (85.4%) | 14,592 (14.6%) |
| Single Unit, Attached | 1,229 (54.3%) | 1,036 (45.7%) |
| 2 Unit Apartments | 185 (8.5%) | 1,997 (91.5%) |
| 3 or 4 Unit Apartments | 204 (6.3%) | 3,051 (93.7%) |
| 5 to 9 Unit Apartments | 217 (4.2%) | 4,972 (95.8%) |
| 10 or more Apartments | 856 (5.1%) | 16,052 (94.9%) |
| Mobile Home / Other | 3,921 (67.5%) | 1,891 (32.5%) |
| Total | 91,684 (67.8%) | 43,591 (32.2%) |
Housing Structures by Number of Rooms in Galveston County
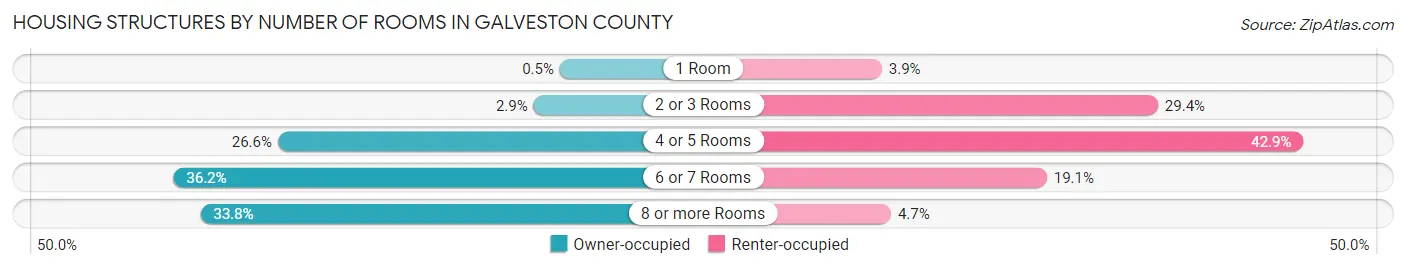
| Number of Rooms | Owner-occupied | Renter-occupied |
| 1 Room | 456 (0.5%) | 1,693 (3.9%) |
| 2 or 3 Rooms | 2,684 (2.9%) | 12,821 (29.4%) |
| 4 or 5 Rooms | 24,370 (26.6%) | 18,682 (42.9%) |
| 6 or 7 Rooms | 33,228 (36.2%) | 8,339 (19.1%) |
| 8 or more Rooms | 30,946 (33.8%) | 2,056 (4.7%) |
| Total | 91,684 (100.0%) | 43,591 (100.0%) |
Housing Structure by Heating Type in Galveston County
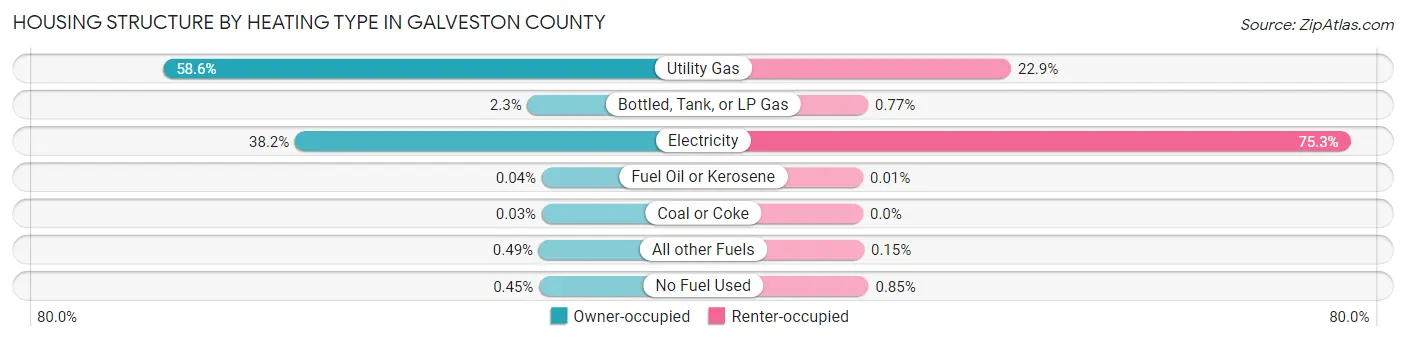
| Heating Type | Owner-occupied | Renter-occupied |
| Utility Gas | 53,696 (58.6%) | 9,974 (22.9%) |
| Bottled, Tank, or LP Gas | 2,072 (2.3%) | 335 (0.8%) |
| Electricity | 35,003 (38.2%) | 32,841 (75.3%) |
| Fuel Oil or Kerosene | 36 (0.0%) | 6 (0.0%) |
| Coal or Coke | 24 (0.0%) | 0 (0.0%) |
| All other Fuels | 445 (0.5%) | 65 (0.2%) |
| No Fuel Used | 408 (0.4%) | 370 (0.9%) |
| Total | 91,684 (100.0%) | 43,591 (100.0%) |
Household Vehicle Usage in Galveston County
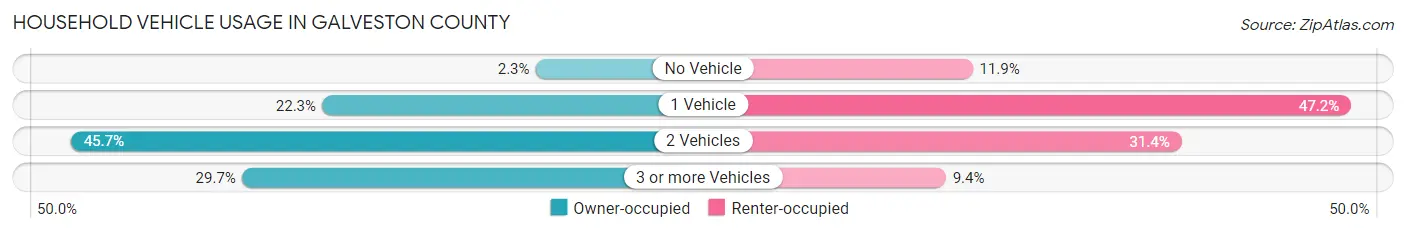
| Vehicles per Household | Owner-occupied | Renter-occupied |
| No Vehicle | 2,128 (2.3%) | 5,193 (11.9%) |
| 1 Vehicle | 20,398 (22.3%) | 20,593 (47.2%) |
| 2 Vehicles | 41,894 (45.7%) | 13,701 (31.4%) |
| 3 or more Vehicles | 27,264 (29.7%) | 4,104 (9.4%) |
| Total | 91,684 (100.0%) | 43,591 (100.0%) |
Real Estate & Mortgages in Galveston County
Real Estate and Mortgage Overview in Galveston County
| Characteristic | Without Mortgage | With Mortgage |
| Housing Units | 39,078 | 52,606 |
| Median Property Value | $224,600 | $282,700 |
| Median Household Income | $79,282 | $20,713 |
| Monthly Housing Costs | $712 | $9,756 |
| Real Estate Taxes | $2,863 | $2,152 |
Property Value by Mortgage Status in Galveston County
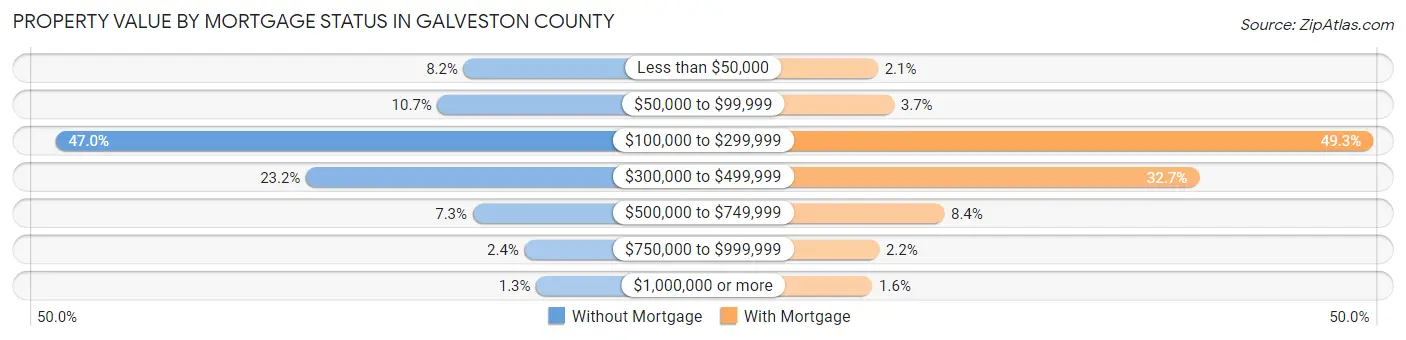
| Property Value | Without Mortgage | With Mortgage |
| Less than $50,000 | 3,193 (8.2%) | 1,112 (2.1%) |
| $50,000 to $99,999 | 4,166 (10.7%) | 1,921 (3.6%) |
| $100,000 to $299,999 | 18,383 (47.0%) | 25,922 (49.3%) |
| $300,000 to $499,999 | 9,057 (23.2%) | 17,213 (32.7%) |
| $500,000 to $749,999 | 2,858 (7.3%) | 4,436 (8.4%) |
| $750,000 to $999,999 | 927 (2.4%) | 1,173 (2.2%) |
| $1,000,000 or more | 494 (1.3%) | 829 (1.6%) |
| Total | 39,078 (100.0%) | 52,606 (100.0%) |
Household Income by Mortgage Status in Galveston County
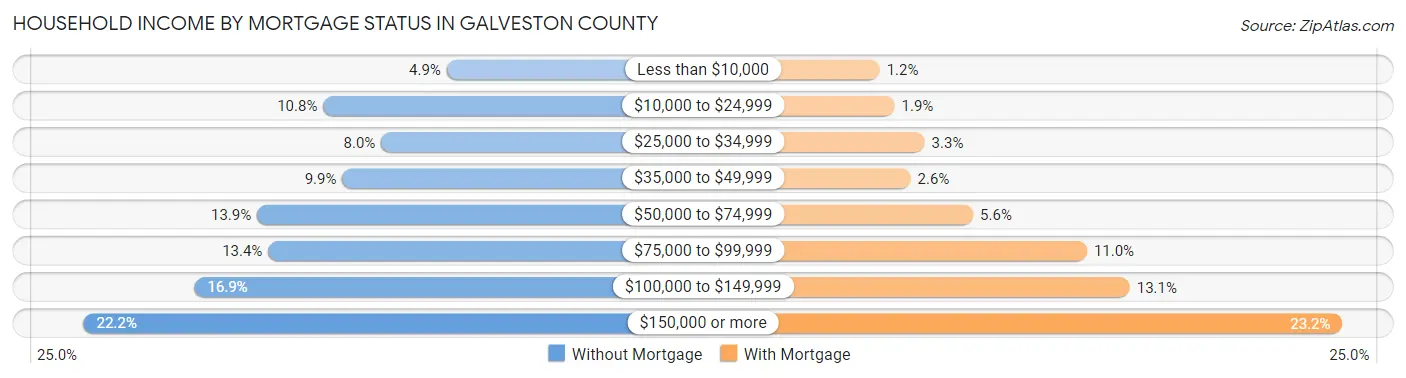
| Household Income | Without Mortgage | With Mortgage |
| Less than $10,000 | 1,915 (4.9%) | 607 (1.1%) |
| $10,000 to $24,999 | 4,213 (10.8%) | 978 (1.9%) |
| $25,000 to $34,999 | 3,136 (8.0%) | 1,730 (3.3%) |
| $35,000 to $49,999 | 3,857 (9.9%) | 1,377 (2.6%) |
| $50,000 to $74,999 | 5,444 (13.9%) | 2,945 (5.6%) |
| $75,000 to $99,999 | 5,235 (13.4%) | 5,795 (11.0%) |
| $100,000 to $149,999 | 6,608 (16.9%) | 6,872 (13.1%) |
| $150,000 or more | 8,670 (22.2%) | 12,196 (23.2%) |
| Total | 39,078 (100.0%) | 52,606 (100.0%) |
Property Value to Household Income Ratio in Galveston County
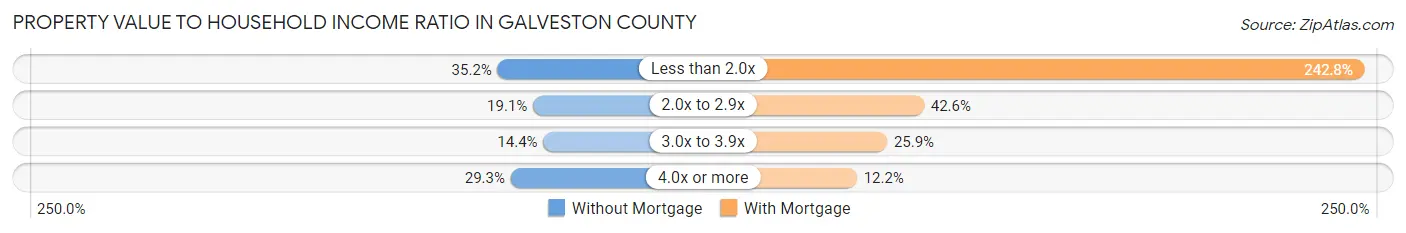
| Value-to-Income Ratio | Without Mortgage | With Mortgage |
| Less than 2.0x | 13,765 (35.2%) | 127,736 (242.8%) |
| 2.0x to 2.9x | 7,462 (19.1%) | 22,427 (42.6%) |
| 3.0x to 3.9x | 5,641 (14.4%) | 13,622 (25.9%) |
| 4.0x or more | 11,429 (29.2%) | 6,399 (12.2%) |
| Total | 39,078 (100.0%) | 52,606 (100.0%) |
Real Estate Taxes by Mortgage Status in Galveston County
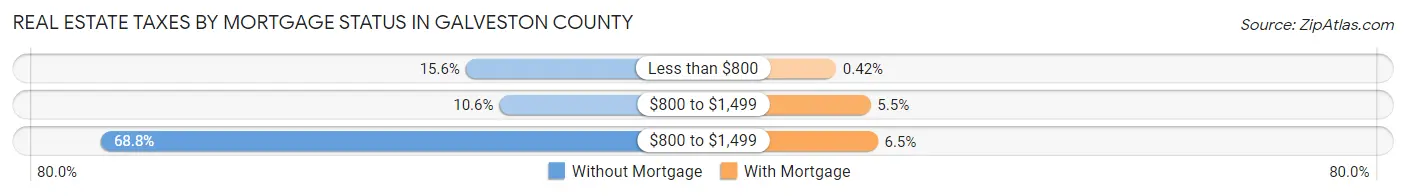
| Property Taxes | Without Mortgage | With Mortgage |
| Less than $800 | 6,077 (15.5%) | 222 (0.4%) |
| $800 to $1,499 | 4,157 (10.6%) | 2,872 (5.5%) |
| $800 to $1,499 | 26,903 (68.8%) | 3,417 (6.5%) |
| Total | 39,078 (100.0%) | 52,606 (100.0%) |
Health & Disability in Galveston County
Health Insurance Coverage by Age in Galveston County
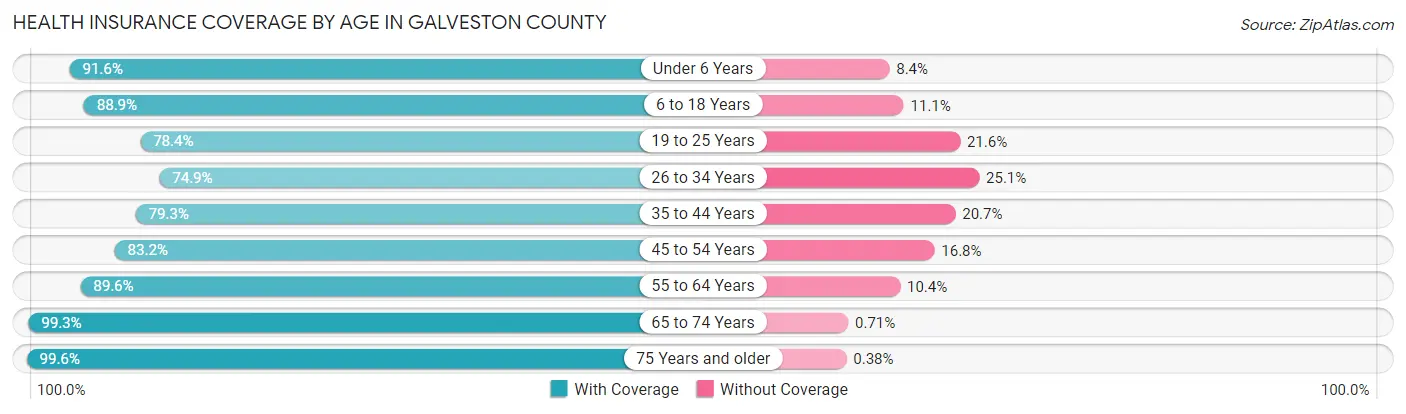
| Age Bracket | With Coverage | Without Coverage |
| Under 6 Years | 23,266 (91.6%) | 2,130 (8.4%) |
| 6 to 18 Years | 56,163 (88.9%) | 6,983 (11.1%) |
| 19 to 25 Years | 22,678 (78.4%) | 6,237 (21.6%) |
| 26 to 34 Years | 30,225 (74.9%) | 10,153 (25.1%) |
| 35 to 44 Years | 36,940 (79.3%) | 9,643 (20.7%) |
| 45 to 54 Years | 36,959 (83.2%) | 7,464 (16.8%) |
| 55 to 64 Years | 41,408 (89.6%) | 4,805 (10.4%) |
| 65 to 74 Years | 32,181 (99.3%) | 229 (0.7%) |
| 75 Years and older | 18,506 (99.6%) | 71 (0.4%) |
| Total | 298,326 (86.2%) | 47,715 (13.8%) |
Health Insurance Coverage by Citizenship Status in Galveston County
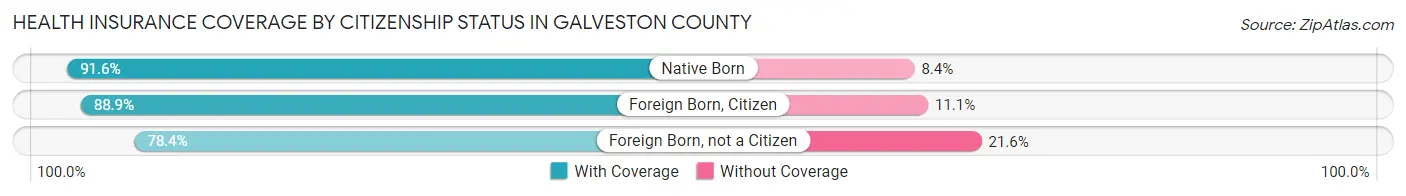
| Citizenship Status | With Coverage | Without Coverage |
| Native Born | 23,266 (91.6%) | 2,130 (8.4%) |
| Foreign Born, Citizen | 56,163 (88.9%) | 6,983 (11.1%) |
| Foreign Born, not a Citizen | 22,678 (78.4%) | 6,237 (21.6%) |
Health Insurance Coverage by Household Income in Galveston County
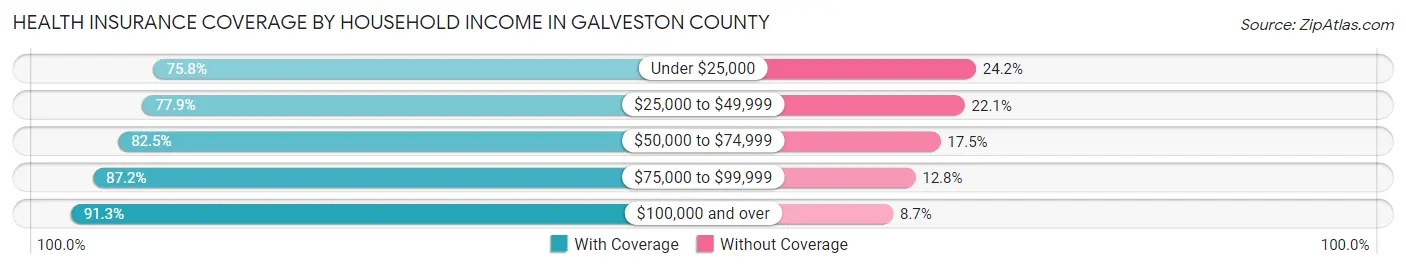
| Household Income | With Coverage | Without Coverage |
| Under $25,000 | 26,958 (75.8%) | 8,595 (24.2%) |
| $25,000 to $49,999 | 35,117 (77.9%) | 9,943 (22.1%) |
| $50,000 to $74,999 | 37,980 (82.5%) | 8,079 (17.5%) |
| $75,000 to $99,999 | 39,137 (87.2%) | 5,761 (12.8%) |
| $100,000 and over | 157,656 (91.3%) | 14,952 (8.7%) |
Public vs Private Health Insurance Coverage by Age in Galveston County
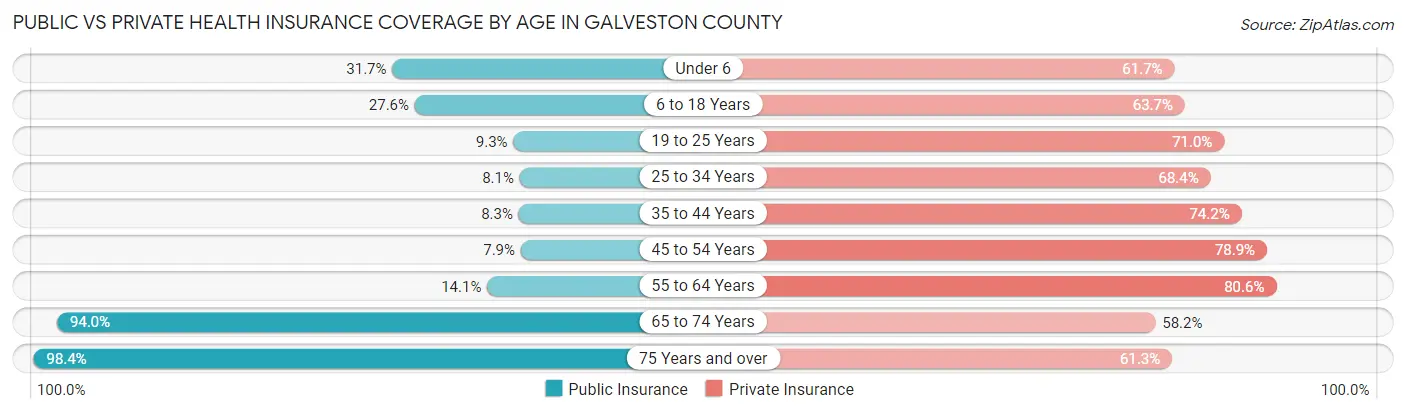
| Age Bracket | Public Insurance | Private Insurance |
| Under 6 | 8,060 (31.7%) | 15,676 (61.7%) |
| 6 to 18 Years | 17,404 (27.6%) | 40,198 (63.7%) |
| 19 to 25 Years | 2,681 (9.3%) | 20,521 (71.0%) |
| 25 to 34 Years | 3,266 (8.1%) | 27,633 (68.4%) |
| 35 to 44 Years | 3,853 (8.3%) | 34,557 (74.2%) |
| 45 to 54 Years | 3,503 (7.9%) | 35,052 (78.9%) |
| 55 to 64 Years | 6,532 (14.1%) | 37,261 (80.6%) |
| 65 to 74 Years | 30,468 (94.0%) | 18,860 (58.2%) |
| 75 Years and over | 18,273 (98.4%) | 11,390 (61.3%) |
| Total | 94,040 (27.2%) | 241,148 (69.7%) |
Disability Status by Sex by Age in Galveston County
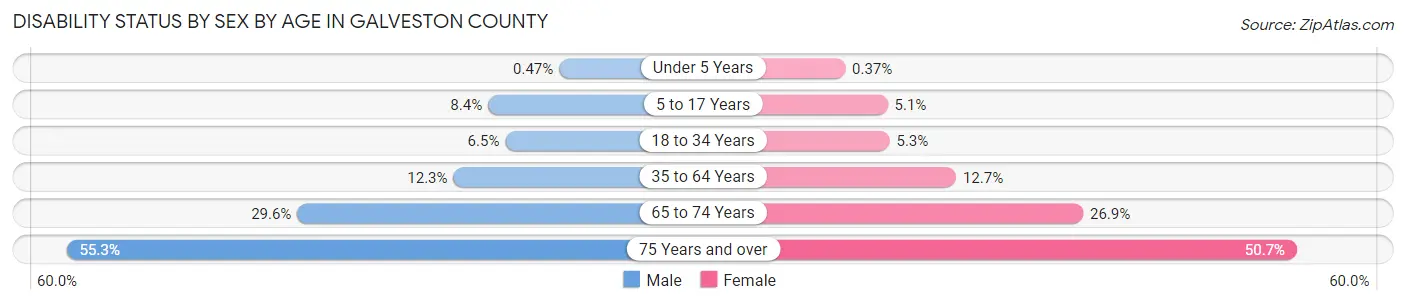
| Age Bracket | Male | Female |
| Under 5 Years | 49 (0.5%) | 38 (0.4%) |
| 5 to 17 Years | 2,701 (8.4%) | 1,572 (5.1%) |
| 18 to 34 Years | 2,398 (6.5%) | 1,973 (5.3%) |
| 35 to 64 Years | 8,271 (12.2%) | 8,871 (12.7%) |
| 65 to 74 Years | 4,617 (29.6%) | 4,522 (26.9%) |
| 75 Years and over | 4,421 (55.3%) | 5,365 (50.7%) |
Disability Class by Sex by Age in Galveston County
Disability Class: Hearing Difficulty
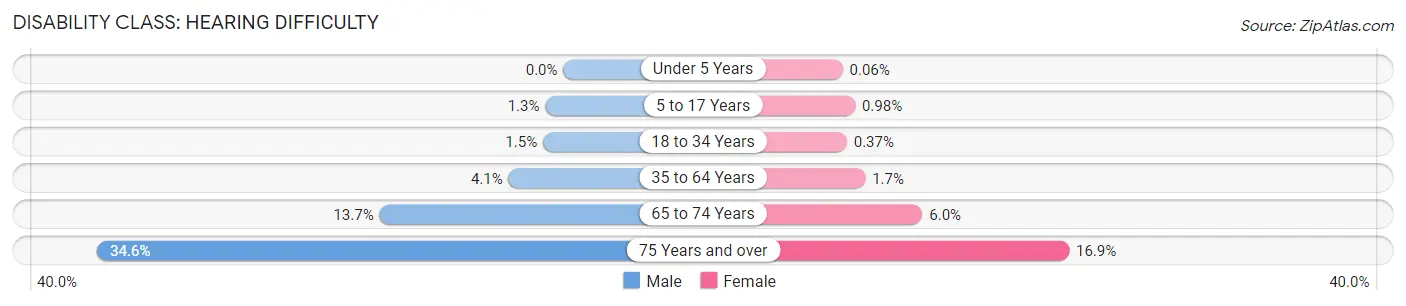
| Age Bracket | Male | Female |
| Under 5 Years | 0 (0.0%) | 6 (0.1%) |
| 5 to 17 Years | 431 (1.3%) | 303 (1.0%) |
| 18 to 34 Years | 561 (1.5%) | 138 (0.4%) |
| 35 to 64 Years | 2,750 (4.1%) | 1,210 (1.7%) |
| 65 to 74 Years | 2,126 (13.7%) | 1,007 (6.0%) |
| 75 Years and over | 2,766 (34.6%) | 1,786 (16.9%) |
Disability Class: Vision Difficulty
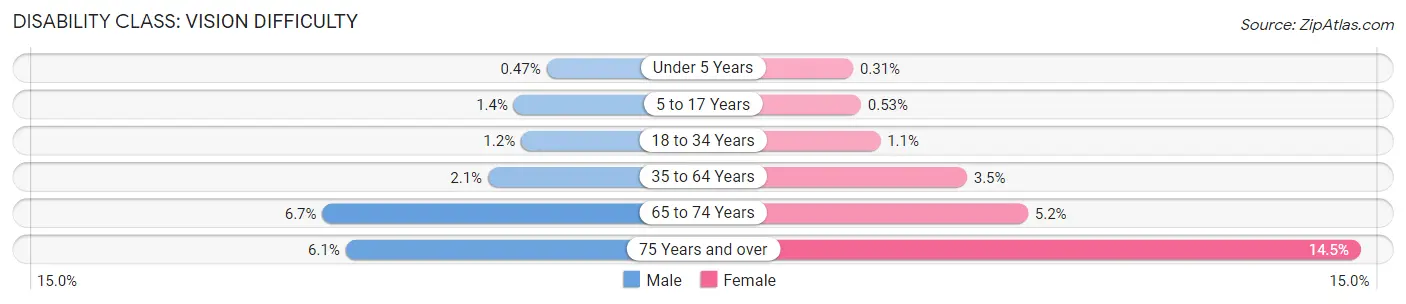
| Age Bracket | Male | Female |
| Under 5 Years | 49 (0.5%) | 32 (0.3%) |
| 5 to 17 Years | 443 (1.4%) | 162 (0.5%) |
| 18 to 34 Years | 438 (1.2%) | 397 (1.1%) |
| 35 to 64 Years | 1,419 (2.1%) | 2,424 (3.5%) |
| 65 to 74 Years | 1,046 (6.7%) | 872 (5.2%) |
| 75 Years and over | 484 (6.1%) | 1,530 (14.4%) |
Disability Class: Cognitive Difficulty
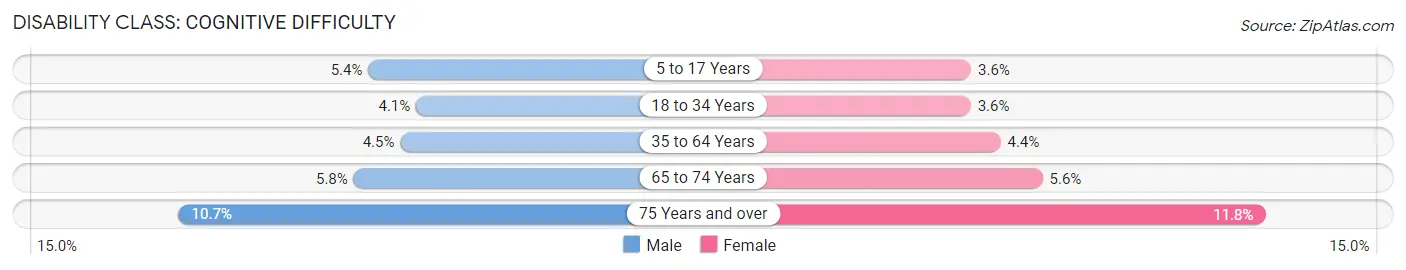
| Age Bracket | Male | Female |
| 5 to 17 Years | 1,750 (5.4%) | 1,109 (3.6%) |
| 18 to 34 Years | 1,520 (4.1%) | 1,331 (3.6%) |
| 35 to 64 Years | 3,065 (4.5%) | 3,079 (4.4%) |
| 65 to 74 Years | 909 (5.8%) | 941 (5.6%) |
| 75 Years and over | 856 (10.7%) | 1,248 (11.8%) |
Disability Class: Ambulatory Difficulty
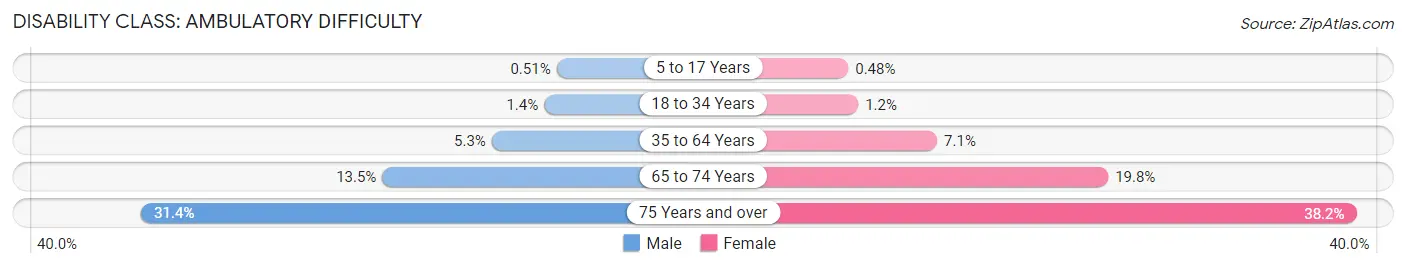
| Age Bracket | Male | Female |
| 5 to 17 Years | 163 (0.5%) | 148 (0.5%) |
| 18 to 34 Years | 531 (1.4%) | 451 (1.2%) |
| 35 to 64 Years | 3,588 (5.3%) | 4,939 (7.1%) |
| 65 to 74 Years | 2,095 (13.5%) | 3,330 (19.8%) |
| 75 Years and over | 2,505 (31.4%) | 4,044 (38.2%) |
Disability Class: Self-Care Difficulty
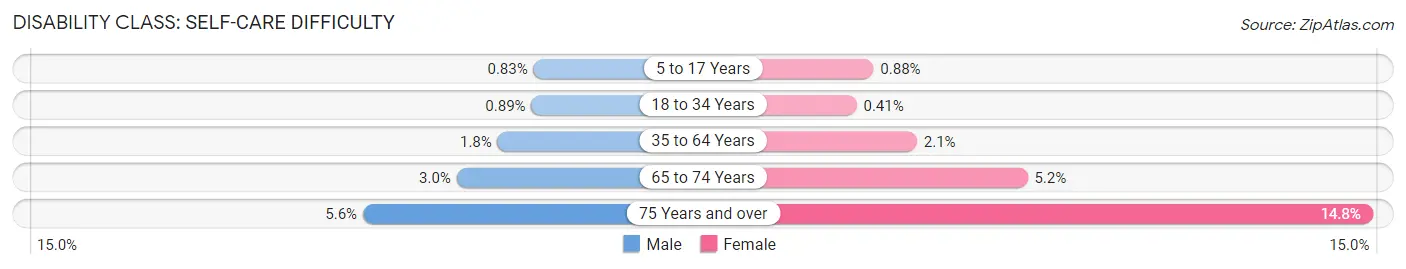
| Age Bracket | Male | Female |
| 5 to 17 Years | 266 (0.8%) | 272 (0.9%) |
| 18 to 34 Years | 330 (0.9%) | 152 (0.4%) |
| 35 to 64 Years | 1,237 (1.8%) | 1,459 (2.1%) |
| 65 to 74 Years | 463 (3.0%) | 870 (5.2%) |
| 75 Years and over | 446 (5.6%) | 1,565 (14.8%) |
Technology Access in Galveston County
Computing Device Access in Galveston County
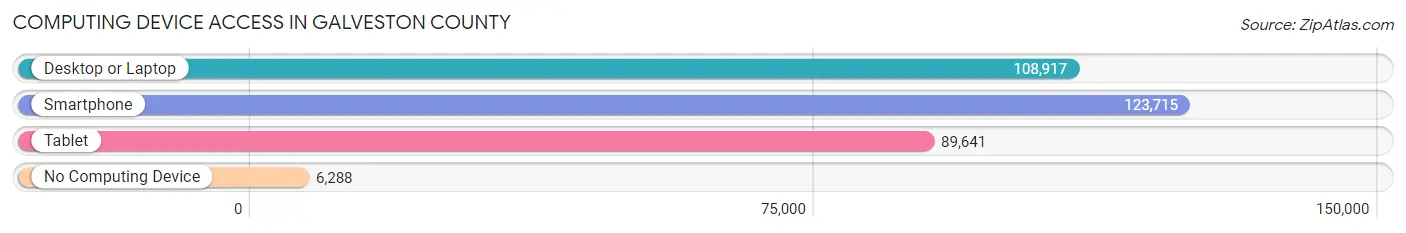
| Device Type | # Households | % Households |
| Desktop or Laptop | 108,917 | 80.5% |
| Smartphone | 123,715 | 91.4% |
| Tablet | 89,641 | 66.3% |
| No Computing Device | 6,288 | 4.6% |
| Total | 135,275 | 100.0% |
Internet Access in Galveston County
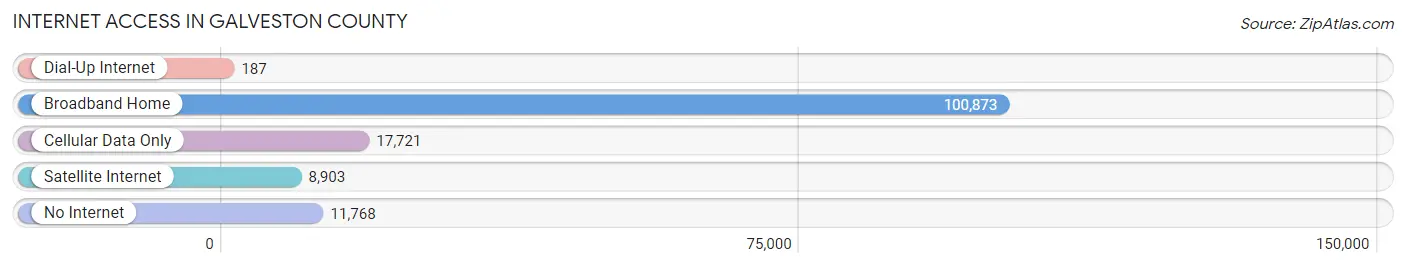
| Internet Type | # Households | % Households |
| Dial-Up Internet | 187 | 0.1% |
| Broadband Home | 100,873 | 74.6% |
| Cellular Data Only | 17,721 | 13.1% |
| Satellite Internet | 8,903 | 6.6% |
| No Internet | 11,768 | 8.7% |
| Total | 135,275 | 100.0% |
Galveston County Summary
Galveston County, Texas is located on the Gulf Coast of the United States, and is part of the Houston-The Woodlands-Sugar Land metropolitan area. The county is home to a population of over 300,000 people, and is the second most populous county in the state of Texas. Galveston County is known for its rich history, diverse geography, and vibrant economy.
History
Galveston County was established in 1838, and was named after the city of Galveston, which was founded in 1839. The county was originally part of the Republic of Texas, and was annexed by the United States in 1845. During the Civil War, Galveston County was the site of the Battle of Galveston, which was fought between Confederate and Union forces. After the war, the county experienced a period of economic growth, as the port of Galveston became a major hub for trade and commerce.
In 1900, the county was devastated by the Great Galveston Hurricane, which killed over 6,000 people and destroyed much of the city of Galveston. In the aftermath of the storm, the city was rebuilt and the county experienced a period of economic growth. In the 1950s and 1960s, the county experienced a population boom, as many people moved to the area for jobs in the oil and gas industry.
Geography
Galveston County is located on the Gulf Coast of Texas, and is bordered by Harris County to the north, Brazoria County to the east, and Chambers County to the west. The county is home to a number of islands, including Galveston Island, Pelican Island, and Bolivar Peninsula. The county is also home to a number of bayous, including Clear Creek, Dickinson Bayou, and San Jacinto River.
The county is home to a number of parks and recreational areas, including Galveston Island State Park, Galveston Island Historic Pleasure Pier, and Moody Gardens. The county is also home to a number of beaches, including East Beach, Stewart Beach, and Seawall Beach.
Economy
Galveston County is home to a vibrant economy, which is driven by a number of industries, including tourism, healthcare, and oil and gas. The county is home to a number of major employers, including the University of Texas Medical Branch, the Galveston Independent School District, and the Port of Galveston.
The county is also home to a number of tourist attractions, including Moody Gardens, the Galveston Island Historic Pleasure Pier, and the Galveston Seawall. The county is also home to a number of festivals and events, including the Galveston Island Jazz and Blues Festival, the Galveston Island Shrimp Festival, and the Galveston Island Beach Revue.
Demographics
As of the 2010 census, Galveston County had a population of 291,309. The racial makeup of the county was 68.3% White, 17.2% Hispanic or Latino, 11.2% African American, and 3.3% Asian. The median household income in the county was $50,845, and the median home value was $150,000.
Galveston County is home to a number of religious denominations, including Catholicism, Protestantism, and Judaism. The county is also home to a number of educational institutions, including the University of Texas Medical Branch, Galveston College, and Texas A&M University at Galveston.
Conclusion
Galveston County, Texas is a vibrant and diverse county located on the Gulf Coast of the United States. The county is home to a rich history, diverse geography, and vibrant economy. The county is home to a population of over 300,000 people, and is the second most populous county in the state of Texas. Galveston County is home to a number of major employers, tourist attractions, and educational institutions, and is a great place to live, work, and visit.
Common Questions
What is Per Capita Income in Galveston County?
Per Capita income in Galveston County is $42,603.
What is the Median Family Income in Galveston County?
Median Family Income in Galveston County is $104,673.
What is the Median Household income in Galveston County?
Median Household Income in Galveston County is $83,913.
What is Income or Wage Gap in Galveston County?
Income or Wage Gap in Galveston County is 34.9%.
Women in Galveston County earn 65.1 cents for every dollar earned by a man.
What is Family Income Deficit in Galveston County?
Family Income Deficit in Galveston County is $11,726.
Families that are below poverty line in Galveston County earn $11,726 less on average than the poverty threshold level.
What is Inequality or Gini Index in Galveston County?
Inequality or Gini Index in Galveston County is 0.46.
What is the Total Population of Galveston County?
Total Population of Galveston County is 350,801.
What is the Total Male Population of Galveston County?
Total Male Population of Galveston County is 173,583.
What is the Total Female Population of Galveston County?
Total Female Population of Galveston County is 177,218.
What is the Ratio of Males per 100 Females in Galveston County?
There are 97.95 Males per 100 Females in Galveston County.
What is the Ratio of Females per 100 Males in Galveston County?
There are 102.09 Females per 100 Males in Galveston County.
What is the Median Population Age in Galveston County?
Median Population Age in Galveston County is 38.1 Years.
What is the Average Family Size in Galveston County
Average Family Size in Galveston County is 3.1 People.
What is the Average Household Size in Galveston County
Average Household Size in Galveston County is 2.5 People.
How Large is the Labor Force in Galveston County?
There are 177,936 People in the Labor Forcein in Galveston County.
What is the Percentage of People in the Labor Force in Galveston County?
64.2% of People are in the Labor Force in Galveston County.
What is the Unemployment Rate in Galveston County?
Unemployment Rate in Galveston County is 5.9%.