Area Code 713 Map & Demographics
Area Code 713 Map
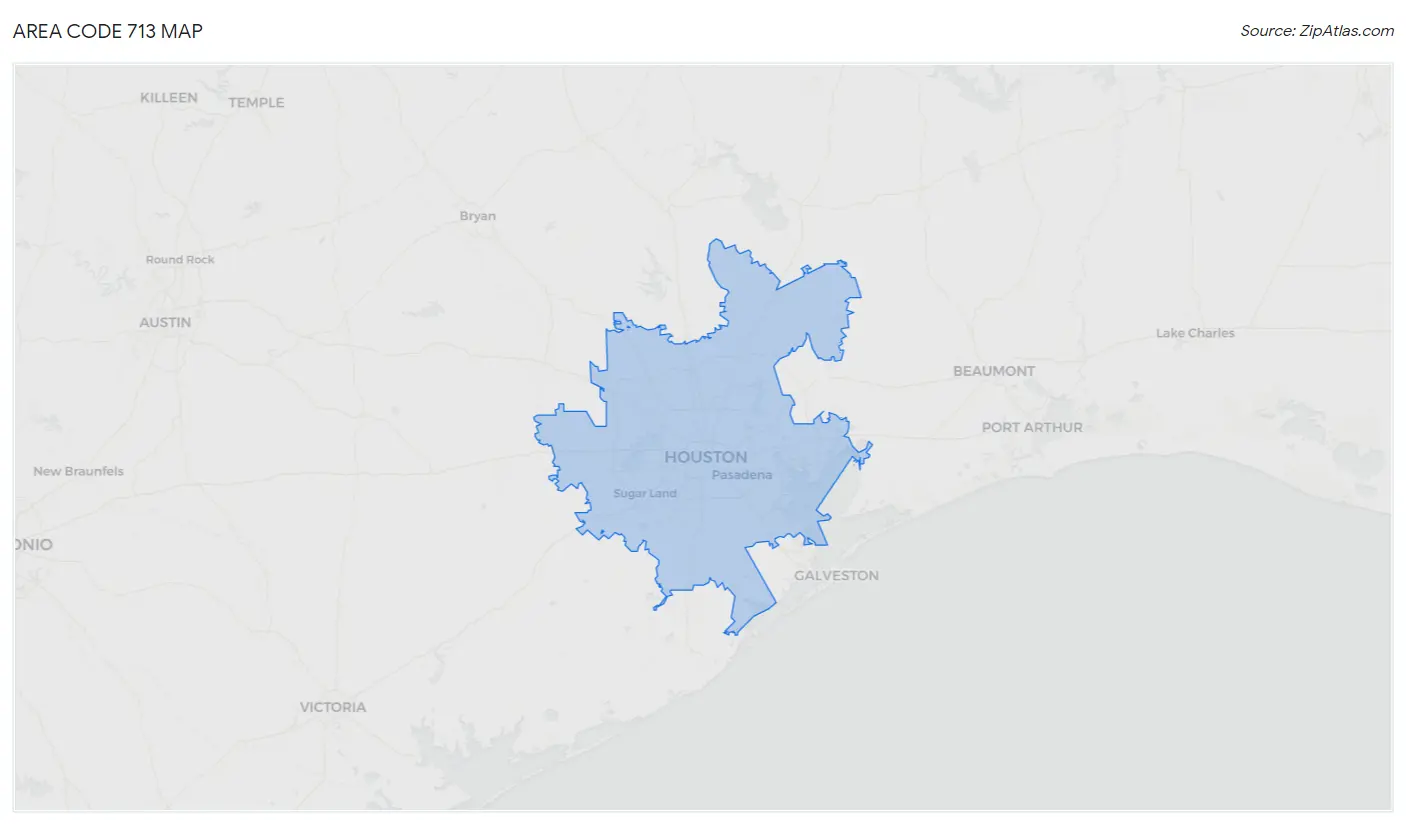
Area Code 713 Overview
$44,056
PER CAPITA INCOME
$94,609
AVG FAMILY INCOME
$77,672
AVG HOUSEHOLD INCOME
29.9%
WAGE / INCOME GAP [ % ]
70.1¢/ $1
WAGE / INCOME GAP [ $ ]
$11,486
FAMILY INCOME DEFICIT
44.68
INEQUALITY / GINI INDEX
3,267,155
TOTAL POPULATION
1,628,776
MALE POPULATION
1,638,379
FEMALE POPULATION
99.41
MALES / 100 FEMALES
100.59
FEMALES / 100 MALES
35.1
MEDIAN AGE
3.3
AVG FAMILY SIZE
2.7
AVG HOUSEHOLD SIZE
1,670,617
LABOR FORCE [ PEOPLE ]
65.7%
PERCENT IN LABOR FORCE
6.7%
UNEMPLOYMENT RATE
Income in Area Code 713
Income Overview in Area Code 713
Per Capita Income in Area Code 713 is $44,056, while median incomes of families and households are $94,609 and $77,672 respectively.
| Characteristic | Number | Measure |
| Per Capita Income | 3,267,155 | $44,056 |
| Median Family Income | 781,284 | $94,609 |
| Mean Family Income | 781,284 | $12,501,940 |
| Median Household Income | 1,206,834 | $77,672 |
| Mean Household Income | 1,206,834 | $10,497,469 |
| Income Deficit | 781,284 | $11,486 |
| Wage / Income Gap (%) | 3,267,155 | 29.86% |
| Wage / Income Gap ($) | 3,267,155 | 70.14¢ per $1 |
| Gini / Inequality Index | 3,267,155 | 44.68 |
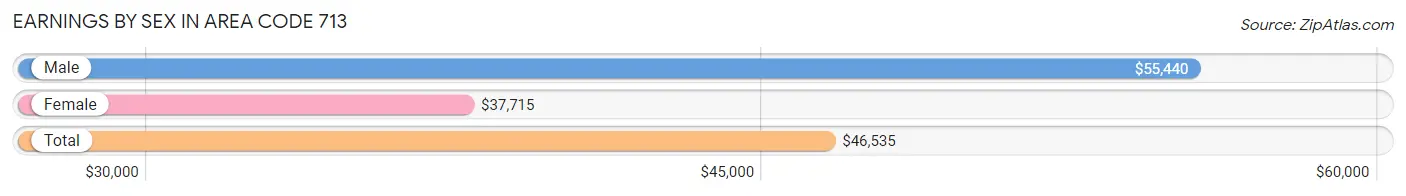
Earnings by Sex in Area Code 713
Average Earnings in Area Code 713 are $46,535, $55,440 for men and $37,715 for women, a difference of 32.0%.
| Sex | Number | Average Earnings |
| Male | 960,458 (55.2%) | $55,440 |
| Female | 778,732 (44.8%) | $37,715 |
| Total | 1,739,190 (100.0%) | $46,535 |
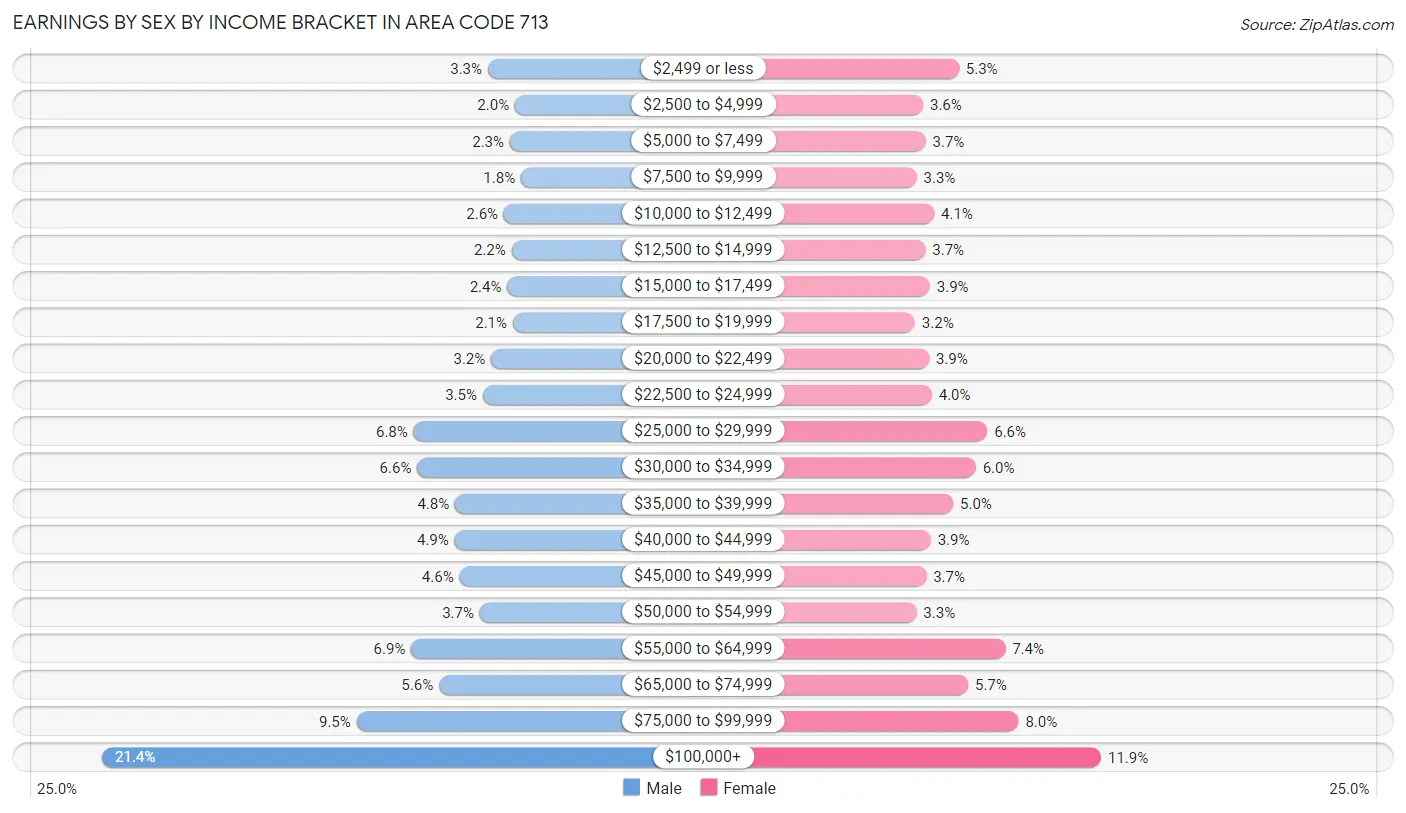
Earnings by Sex by Income Bracket in Area Code 713
The most common earnings brackets in Area Code 713 are $100,000+ for men (205,290 | 21.4%) and $100,000+ for women (92,725 | 11.9%).
| Income | Male | Female |
| $2,499 or less | 31,660 (3.3%) | 40,857 (5.2%) |
| $2,500 to $4,999 | 19,471 (2.0%) | 27,832 (3.6%) |
| $5,000 to $7,499 | 21,841 (2.3%) | 28,774 (3.7%) |
| $7,500 to $9,999 | 16,834 (1.8%) | 25,432 (3.3%) |
| $10,000 to $12,499 | 24,508 (2.5%) | 31,849 (4.1%) |
| $12,500 to $14,999 | 21,070 (2.2%) | 28,685 (3.7%) |
| $15,000 to $17,499 | 22,954 (2.4%) | 30,315 (3.9%) |
| $17,500 to $19,999 | 20,454 (2.1%) | 24,804 (3.2%) |
| $20,000 to $22,499 | 30,229 (3.2%) | 29,964 (3.8%) |
| $22,500 to $24,999 | 33,996 (3.5%) | 31,018 (4.0%) |
| $25,000 to $29,999 | 65,100 (6.8%) | 51,211 (6.6%) |
| $30,000 to $34,999 | 63,515 (6.6%) | 47,012 (6.0%) |
| $35,000 to $39,999 | 46,467 (4.8%) | 38,776 (5.0%) |
| $40,000 to $44,999 | 46,684 (4.9%) | 30,572 (3.9%) |
| $45,000 to $49,999 | 44,469 (4.6%) | 28,949 (3.7%) |
| $50,000 to $54,999 | 35,311 (3.7%) | 25,391 (3.3%) |
| $55,000 to $64,999 | 66,161 (6.9%) | 57,770 (7.4%) |
| $65,000 to $74,999 | 53,670 (5.6%) | 44,200 (5.7%) |
| $75,000 to $99,999 | 90,774 (9.5%) | 62,596 (8.0%) |
| $100,000+ | 205,290 (21.4%) | 92,725 (11.9%) |
| Total | 960,458 (100.0%) | 778,732 (100.0%) |
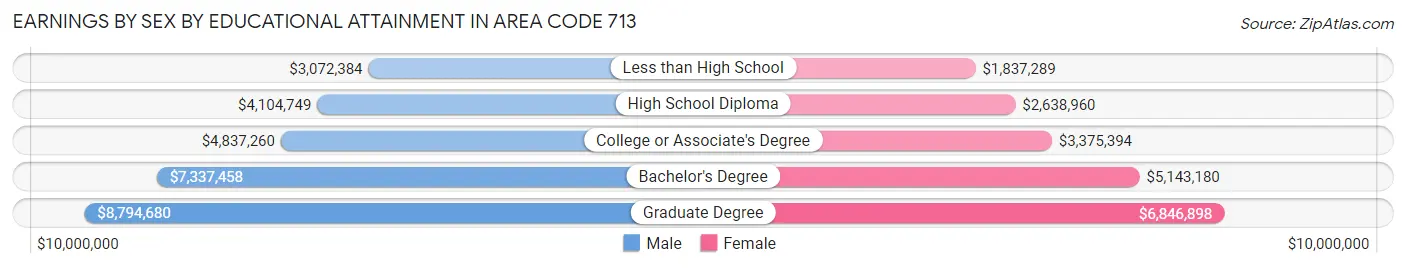
Earnings by Sex by Educational Attainment in Area Code 713
Average earnings in Area Code 713 are $6,008,128 for men and $4,161,665 for women, a difference of 30.7%. Men with an educational attainment of graduate degree enjoy the highest average annual earnings of $8,794,680, while those with less than high school education earn the least with $3,072,384. Women with an educational attainment of graduate degree earn the most with the average annual earnings of $6,846,898, while those with less than high school education have the smallest earnings of $1,837,289.
| Educational Attainment | Male Income | Female Income |
| Less than High School | $3,072,384 | $1,837,289 |
| High School Diploma | $4,104,749 | $2,638,960 |
| College or Associate's Degree | $4,837,260 | $3,375,394 |
| Bachelor's Degree | $7,337,458 | $5,143,180 |
| Graduate Degree | $8,794,680 | $6,846,898 |
| Total | $6,008,128 | $4,161,665 |
Family Income in Area Code 713
Family Income Brackets in Area Code 713
According to the Area Code 713 family income data, there are 12,423,197 families falling into the $200,000+ income range, which is the most common income bracket and makes up 1,590.1% of all families. Conversely, the $10,000 to $14,999 income bracket is the least frequent group with only 2,026,651 families (259.4%) belonging to this category.
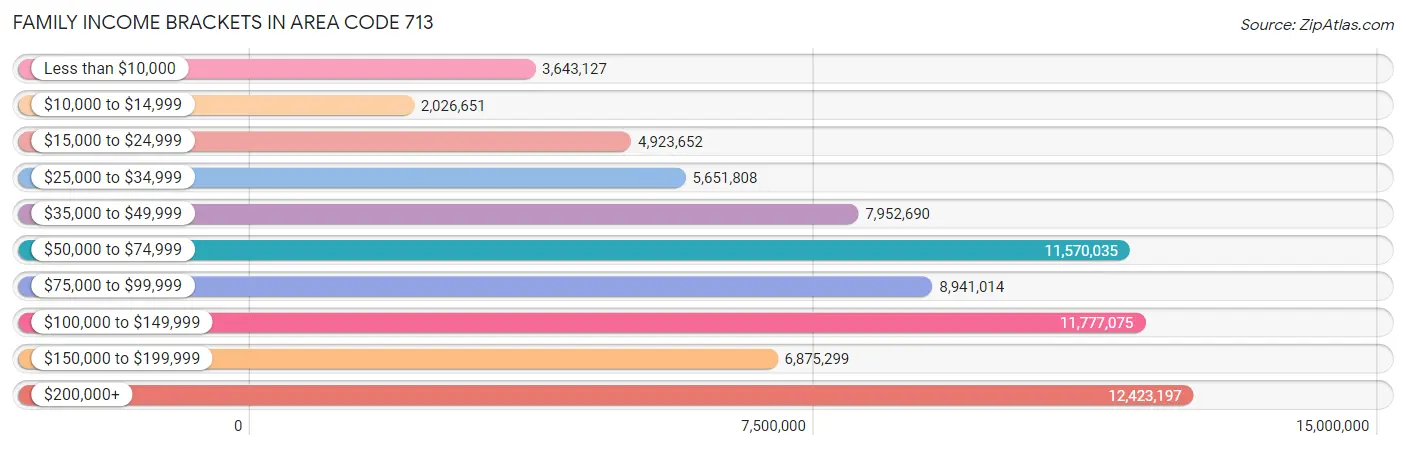
| Income Bracket | # Families | % Families |
| Less than $10,000 | 3,643,127 | 466.3% |
| $10,000 to $14,999 | 2,026,651 | 259.4% |
| $15,000 to $24,999 | 4,923,652 | 630.2% |
| $25,000 to $34,999 | 5,651,808 | 723.4% |
| $35,000 to $49,999 | 7,952,690 | 1,017.9% |
| $50,000 to $74,999 | 11,570,035 | 1,480.9% |
| $75,000 to $99,999 | 8,941,014 | 1,144.4% |
| $100,000 to $149,999 | 11,777,075 | 1,507.4% |
| $150,000 to $199,999 | 6,875,299 | 880.0% |
| $200,000+ | 12,423,197 | 1,590.1% |
Family Income by Famaliy Size in Area Code 713
5-person families (77,137 | 9.9%) account for the highest median family income in Area Code 713 with $108,463 per family, while 2-person families (310,878 | 39.8%) have the highest median income of $42,083 per family member.
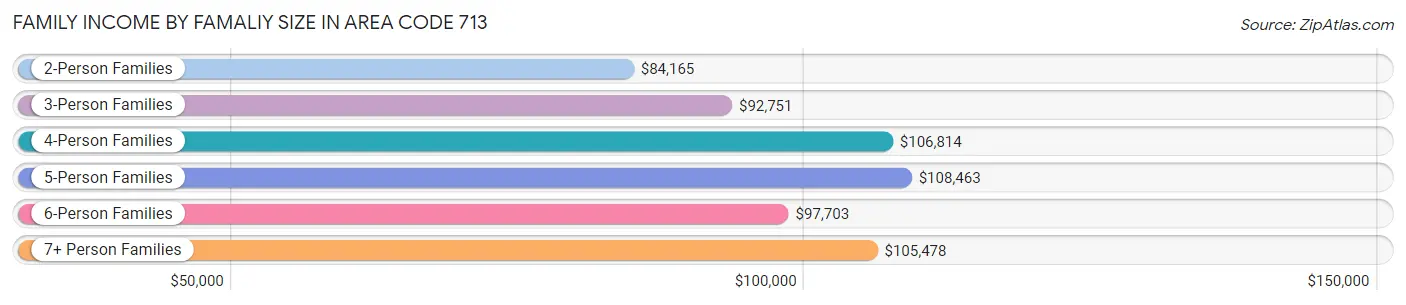
| Income Bracket | # Families | Median Income |
| 2-Person Families | 310,878 (39.8%) | $84,165 |
| 3-Person Families | 186,581 (23.9%) | $92,751 |
| 4-Person Families | 157,857 (20.2%) | $106,814 |
| 5-Person Families | 77,137 (9.9%) | $108,463 |
| 6-Person Families | 31,365 (4.0%) | $97,703 |
| 7+ Person Families | 17,466 (2.2%) | $105,478 |
| Total | 781,284 (100.0%) | $94,609 |
Family Income by Number of Earners in Area Code 713
The median family income in Area Code 713 is $94,609, with families comprising 3+ earners (94,297) having the highest median family income of $135,895, while families with no earners (83,295) have the lowest median family income of $42,396, accounting for 12.1% and 10.7% of families, respectively.
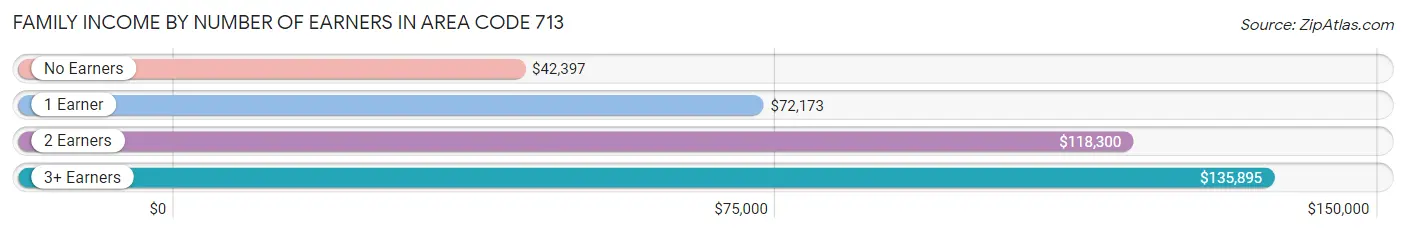
| Number of Earners | # Families | Median Income |
| No Earners | 83,295 (10.7%) | $42,396 |
| 1 Earner | 280,161 (35.9%) | $72,173 |
| 2 Earners | 323,531 (41.4%) | $118,300 |
| 3+ Earners | 94,297 (12.1%) | $135,895 |
| Total | 781,284 (100.0%) | $94,609 |
Household Income in Area Code 713
Household Income Brackets in Area Code 713
With 18,941,260 households falling in the category, the $50,000 to $74,999 income range is the most frequent in Area Code 713, accounting for 1,569.5% of all households. In contrast, only 4,636,656 households (384.2%) fall into the $10,000 to $14,999 income bracket, making it the least populous group.
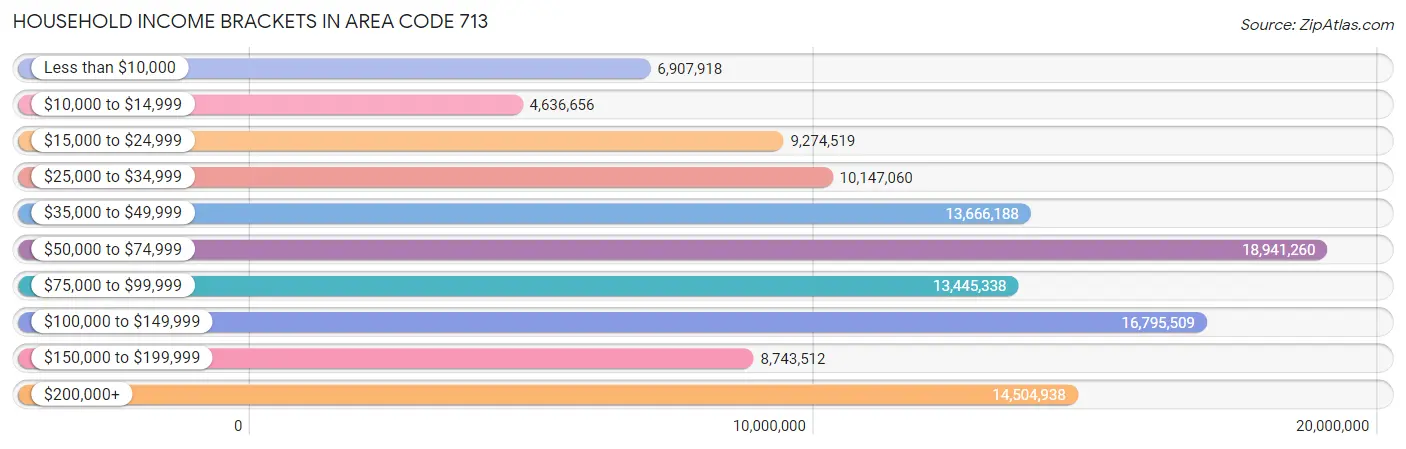
| Income Bracket | # Households | % Households |
| Less than $10,000 | 6,907,918 | 572.4% |
| $10,000 to $14,999 | 4,636,656 | 384.2% |
| $15,000 to $24,999 | 9,274,519 | 768.5% |
| $25,000 to $34,999 | 10,147,060 | 840.8% |
| $35,000 to $49,999 | 13,666,188 | 1,132.4% |
| $50,000 to $74,999 | 18,941,260 | 1,569.5% |
| $75,000 to $99,999 | 13,445,338 | 1,114.1% |
| $100,000 to $149,999 | 16,795,509 | 1,391.7% |
| $150,000 to $199,999 | 8,743,512 | 724.5% |
| $200,000+ | 14,504,938 | 1,201.9% |
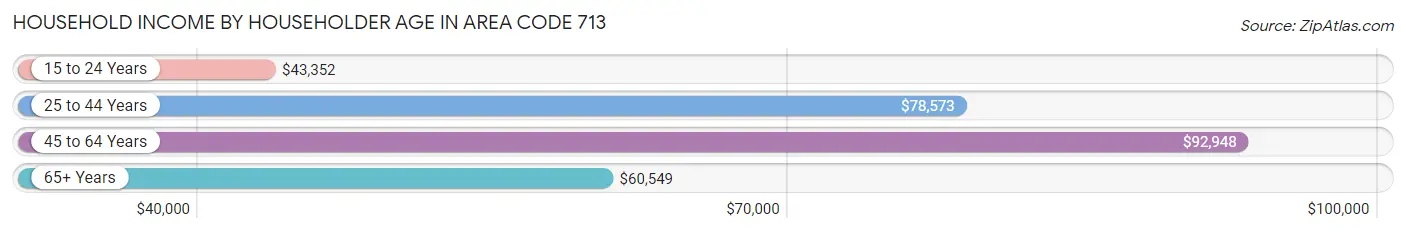
Household Income by Householder Age in Area Code 713
The median household income in Area Code 713 is $77,672, with the highest median household income of $92,948 found in the 45 to 64 years age bracket for the primary householder. A total of 429,031 households (35.5%) fall into this category. Meanwhile, the 15 to 24 years age bracket for the primary householder has the lowest median household income of $43,352, with 58,417 households (4.8%) in this group.
| Income Bracket | # Households | Median Income |
| 15 to 24 Years | 58,417 (4.8%) | $43,352 |
| 25 to 44 Years | 487,787 (40.4%) | $78,573 |
| 45 to 64 Years | 429,031 (35.5%) | $92,948 |
| 65+ Years | 231,599 (19.2%) | $60,549 |
| Total | 1,206,834 (100.0%) | $77,672 |
Poverty in Area Code 713
Income Below Poverty by Sex and Age in Area Code 713
With 14.5% poverty level for males and 18.3% for females among the residents of Area Code 713, 5 year old males and 5 year old females are the most vulnerable to poverty, with 6,836 males (29.2%) and 6,109 females (28.5%) in their respective age groups living below the poverty level.
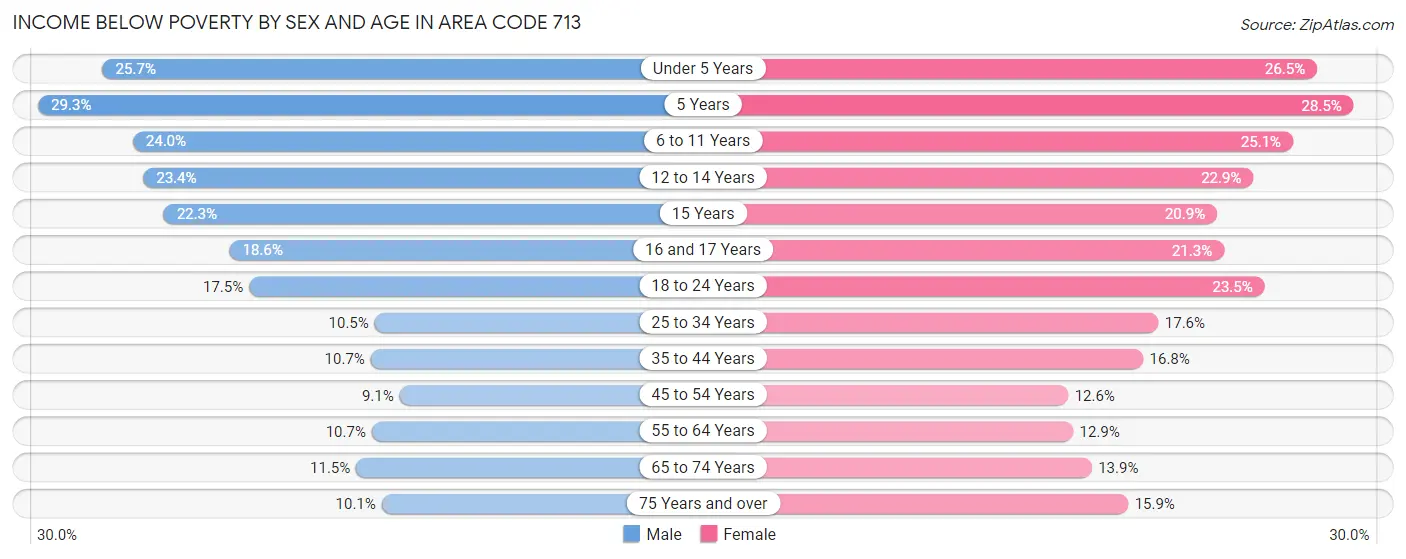
| Age Bracket | Male | Female |
| Under 5 Years | 28,647 (25.7%) | 29,061 (26.5%) |
| 5 Years | 6,836 (29.2%) | 6,109 (28.5%) |
| 6 to 11 Years | 32,507 (24.0%) | 34,008 (25.1%) |
| 12 to 14 Years | 15,336 (23.4%) | 15,736 (22.9%) |
| 15 Years | 5,541 (22.3%) | 4,233 (20.9%) |
| 16 and 17 Years | 9,033 (18.6%) | 9,613 (21.3%) |
| 18 to 24 Years | 26,726 (17.5%) | 35,528 (23.5%) |
| 25 to 34 Years | 27,824 (10.5%) | 45,756 (17.6%) |
| 35 to 44 Years | 25,133 (10.7%) | 37,841 (16.8%) |
| 45 to 54 Years | 18,368 (9.1%) | 25,181 (12.6%) |
| 55 to 64 Years | 18,821 (10.7%) | 23,027 (12.9%) |
| 65 to 74 Years | 12,641 (11.5%) | 17,039 (13.9%) |
| 75 Years and over | 5,860 (10.1%) | 12,972 (15.9%) |
| Total | 233,273 (14.5%) | 296,104 (18.3%) |
Income Above Poverty by Sex and Age in Area Code 713
According to the poverty statistics in Area Code 713, males aged 45 to 54 years and females aged 45 to 54 years are the age groups that are most secure financially, with 90.9% of males and 87.4% of females in these age groups living above the poverty line.
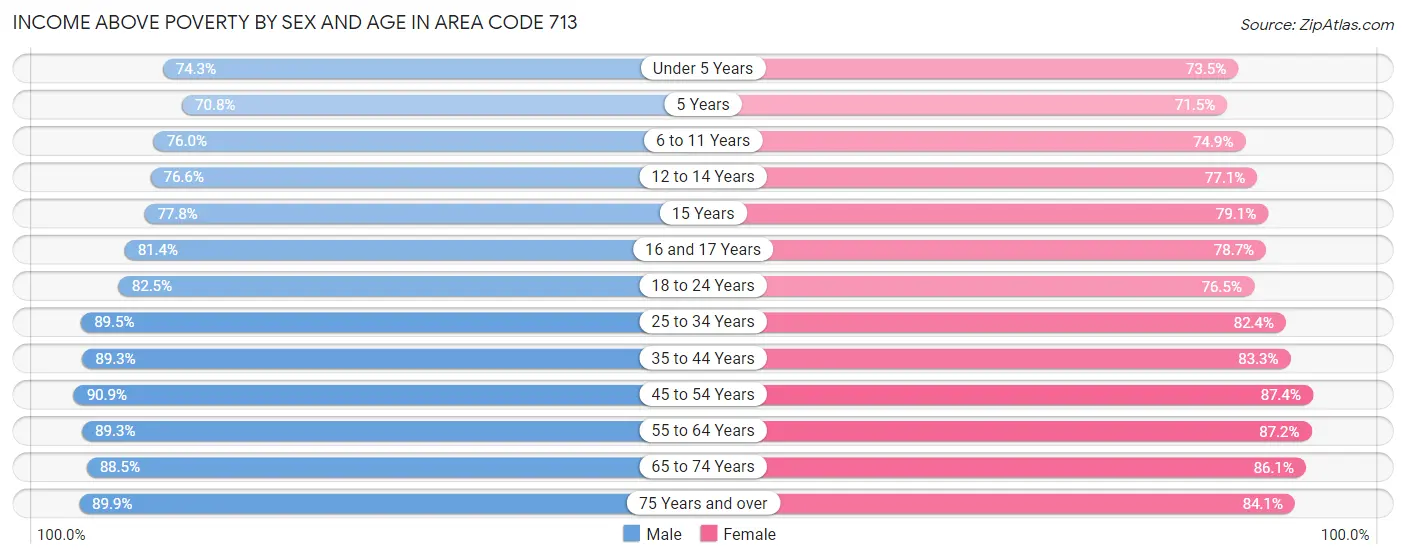
| Age Bracket | Male | Female |
| Under 5 Years | 82,974 (74.3%) | 80,779 (73.5%) |
| 5 Years | 16,532 (70.8%) | 15,327 (71.5%) |
| 6 to 11 Years | 103,099 (76.0%) | 101,381 (74.9%) |
| 12 to 14 Years | 50,233 (76.6%) | 52,963 (77.1%) |
| 15 Years | 19,361 (77.7%) | 16,028 (79.1%) |
| 16 and 17 Years | 39,565 (81.4%) | 35,562 (78.7%) |
| 18 to 24 Years | 126,014 (82.5%) | 115,411 (76.5%) |
| 25 to 34 Years | 236,790 (89.5%) | 214,246 (82.4%) |
| 35 to 44 Years | 209,167 (89.3%) | 188,067 (83.3%) |
| 45 to 54 Years | 183,086 (90.9%) | 174,971 (87.4%) |
| 55 to 64 Years | 157,524 (89.3%) | 156,241 (87.2%) |
| 65 to 74 Years | 96,868 (88.5%) | 105,595 (86.1%) |
| 75 Years and over | 52,073 (89.9%) | 68,534 (84.1%) |
| Total | 1,373,286 (85.5%) | 1,325,105 (81.7%) |
Income Below Poverty Among Married-Couple Families in Area Code 713
The poverty statistics for married-couple families in Area Code 713 show that 7.3% or 38,974 of the total 532,679 families live below the poverty line. Families with 5 or more children have the highest poverty rate of 31.0%, comprising of 1,192 families. On the other hand, families with no children have the lowest poverty rate of 5.0%, which includes 13,761 families.
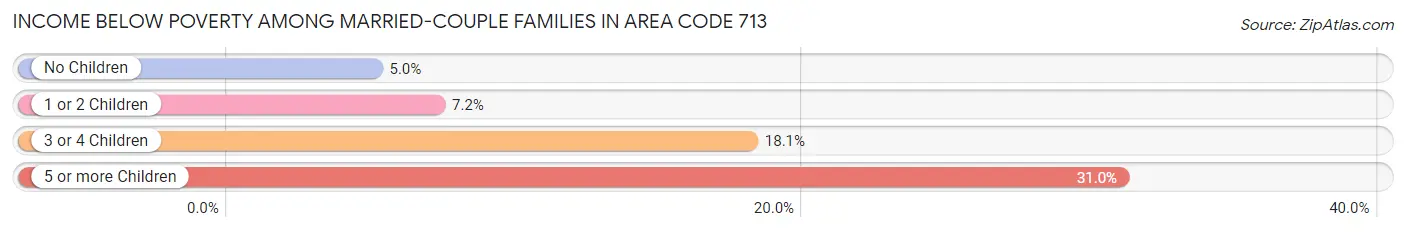
| Children | Above Poverty | Below Poverty |
| No Children | 260,075 (95.0%) | 13,761 (5.0%) |
| 1 or 2 Children | 188,524 (92.8%) | 14,641 (7.2%) |
| 3 or 4 Children | 42,455 (81.9%) | 9,380 (18.1%) |
| 5 or more Children | 2,651 (69.0%) | 1,192 (31.0%) |
| Total | 493,705 (92.7%) | 38,974 (7.3%) |
Income Below Poverty Among Single-Parent Households in Area Code 713
According to the poverty data in Area Code 713, 14.6% or 10,794 single-father households and 31.2% or 54,577 single-mother households are living below the poverty line. Among single-father households, those with 5 or more children have the highest poverty rate, with 465 households (71.8%) experiencing poverty. Likewise, among single-mother households, those with 5 or more children have the highest poverty rate, with 2,127 households (85.3%) falling below the poverty line.
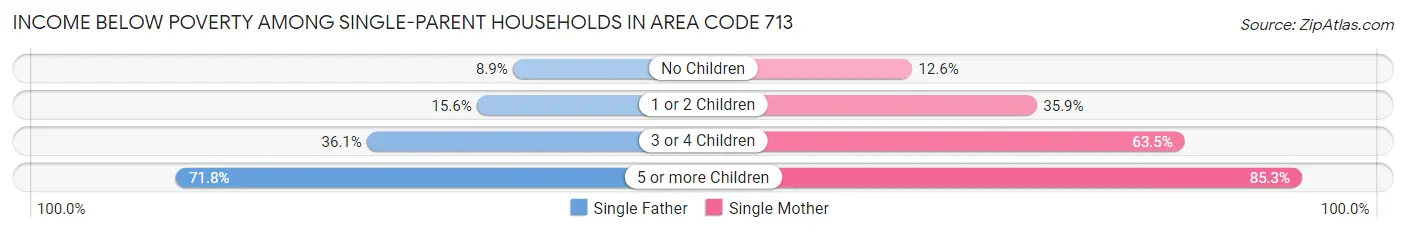
| Children | Single Father | Single Mother |
| No Children | 3,226 (8.9%) | 8,038 (12.6%) |
| 1 or 2 Children | 4,786 (15.6%) | 31,892 (35.9%) |
| 3 or 4 Children | 2,317 (36.1%) | 12,520 (63.5%) |
| 5 or more Children | 465 (71.8%) | 2,127 (85.3%) |
| Total | 10,794 (14.6%) | 54,577 (31.2%) |
Income Below Poverty Among Married-Couple vs Single-Parent Households in Area Code 713
The poverty data for Area Code 713 shows that 38,974 of the married-couple family households (7.3%) and 65,371 of the single-parent households (26.3%) are living below the poverty level. Within the married-couple family households, those with 5 or more children have the highest poverty rate, with 1,192 households (31.0%) falling below the poverty line. Among the single-parent households, those with 5 or more children have the highest poverty rate, with 2,592 household (82.5%) living below poverty.
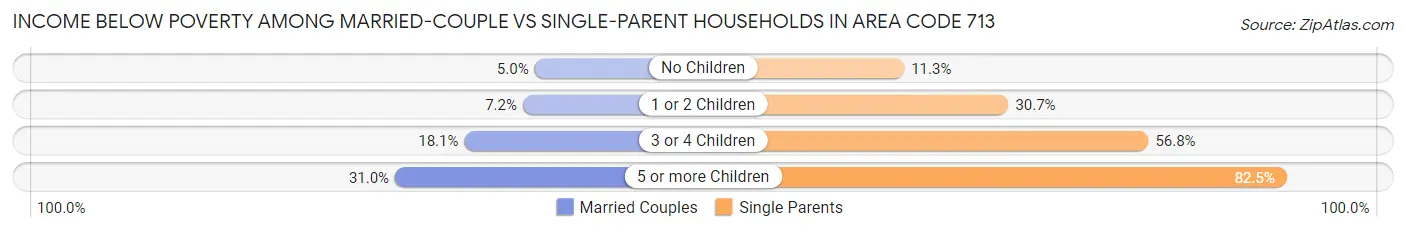
| Children | Married-Couple Families | Single-Parent Households |
| No Children | 13,761 (5.0%) | 11,264 (11.3%) |
| 1 or 2 Children | 14,641 (7.2%) | 36,678 (30.7%) |
| 3 or 4 Children | 9,380 (18.1%) | 14,837 (56.8%) |
| 5 or more Children | 1,192 (31.0%) | 2,592 (82.5%) |
| Total | 38,974 (7.3%) | 65,371 (26.3%) |
Race in Area Code 713
The most populous races in Area Code 713 are White / Caucasian (1,519,307 | 46.5%), Hispanic or Latino (1,419,315 | 43.4%), and Black / African American (586,664 | 18.0%).
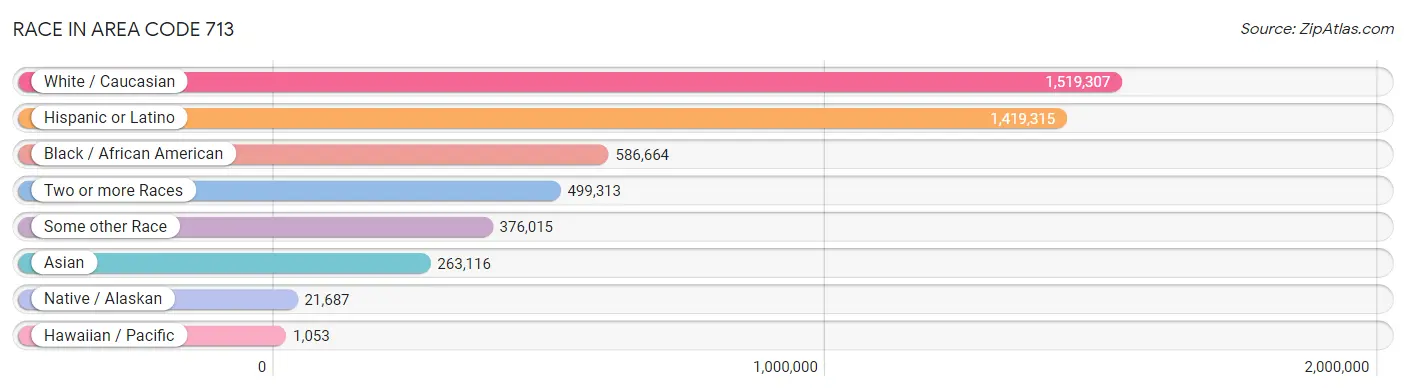
| Race | # Population | % Population |
| Asian | 263,116 | 8.1% |
| Black / African American | 586,664 | 18.0% |
| Hawaiian / Pacific | 1,053 | 0.0% |
| Hispanic or Latino | 1,419,315 | 43.4% |
| Native / Alaskan | 21,687 | 0.7% |
| White / Caucasian | 1,519,307 | 46.5% |
| Two or more Races | 499,313 | 15.3% |
| Some other Race | 376,015 | 11.5% |
| Total | 3,267,155 | 100.0% |
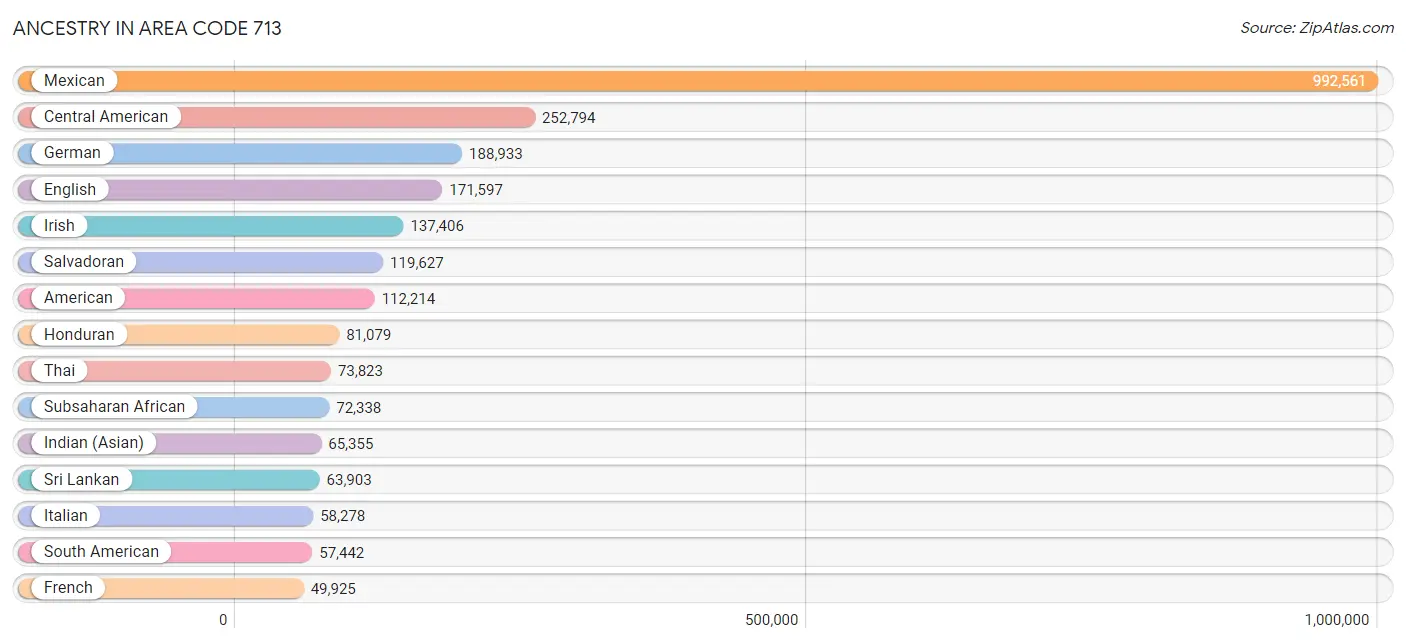
Ancestry in Area Code 713
The most populous ancestries reported in Area Code 713 are Mexican (992,561 | 30.4%), Central American (252,794 | 7.7%), German (188,933 | 5.8%), English (171,597 | 5.2%), and Irish (137,406 | 4.2%), together accounting for 53.4% of all Area Code 713 residents.
| Ancestry | # Population | % Population |
| Afghan | 2,324 | 0.1% |
| African | 31,023 | 0.9% |
| Alaska Native | 134 | 0.0% |
| Alaskan Athabascan | 63 | 0.0% |
| Albanian | 566 | 0.0% |
| Aleut | 29 | 0.0% |
| Alsatian | 133 | 0.0% |
| American | 112,214 | 3.4% |
| Apache | 1,279 | 0.0% |
| Arab | 30,739 | 0.9% |
| Arapaho | 7 | 0.0% |
| Argentinean | 4,548 | 0.1% |
| Armenian | 1,207 | 0.0% |
| Assyrian / Chaldean / Syriac | 53 | 0.0% |
| Australian | 1,451 | 0.0% |
| Austrian | 3,492 | 0.1% |
| Bahamian | 1,367 | 0.0% |
| Bangladeshi | 87 | 0.0% |
| Barbadian | 340 | 0.0% |
| Basque | 209 | 0.0% |
| Belgian | 1,885 | 0.1% |
| Belizean | 805 | 0.0% |
| Bermudan | 19 | 0.0% |
| Bhutanese | 7,550 | 0.2% |
| Blackfeet | 664 | 0.0% |
| Bolivian | 1,267 | 0.0% |
| Brazilian | 3,687 | 0.1% |
| British | 16,185 | 0.5% |
| British West Indian | 1,093 | 0.0% |
| Bulgarian | 403 | 0.0% |
| Burmese | 13,249 | 0.4% |
| Cajun | 1,302 | 0.0% |
| Cambodian | 34 | 0.0% |
| Canadian | 3,838 | 0.1% |
| Cape Verdean | 28 | 0.0% |
| Celtic | 298 | 0.0% |
| Central American | 252,794 | 7.7% |
| Central American Indian | 6,315 | 0.2% |
| Cherokee | 6,353 | 0.2% |
| Cheyenne | 75 | 0.0% |
| Chickasaw | 611 | 0.0% |
| Chilean | 2,135 | 0.1% |
| Chinese | 30 | 0.0% |
| Chippewa | 374 | 0.0% |
| Choctaw | 2,843 | 0.1% |
| Colombian | 19,485 | 0.6% |
| Comanche | 415 | 0.0% |
| Costa Rican | 1,801 | 0.1% |
| Cree | 9 | 0.0% |
| Creek | 685 | 0.0% |
| Croatian | 1,714 | 0.1% |
| Crow | 40 | 0.0% |
| Cuban | 24,191 | 0.7% |
| Cypriot | 30 | 0.0% |
| Czech | 15,822 | 0.5% |
| Czechoslovakian | 1,416 | 0.0% |
| Danish | 4,708 | 0.1% |
| Delaware | 81 | 0.0% |
| Dominican | 4,958 | 0.2% |
| Dutch | 14,913 | 0.5% |
| Dutch West Indian | 317 | 0.0% |
| Eastern European | 3,809 | 0.1% |
| Ecuadorian | 5,150 | 0.2% |
| Egyptian | 4,654 | 0.1% |
| English | 171,597 | 5.2% |
| Estonian | 54 | 0.0% |
| Ethiopian | 4,771 | 0.2% |
| European | 39,619 | 1.2% |
| Filipino | 5,916 | 0.2% |
| Finnish | 1,555 | 0.1% |
| French | 49,925 | 1.5% |
| French American Indian | 52 | 0.0% |
| French Canadian | 6,149 | 0.2% |
| German | 188,933 | 5.8% |
| German Russian | 105 | 0.0% |
| Ghanaian | 1,738 | 0.1% |
| Greek | 6,538 | 0.2% |
| Guamanian / Chamorro | 808 | 0.0% |
| Guatemalan | 40,891 | 1.3% |
| Guyanese | 451 | 0.0% |
| Haitian | 2,263 | 0.1% |
| Hmong | 28 | 0.0% |
| Honduran | 81,079 | 2.5% |
| Hopi | 61 | 0.0% |
| Houma | 58 | 0.0% |
| Hungarian | 3,619 | 0.1% |
| Icelander | 205 | 0.0% |
| Indian (Asian) | 65,355 | 2.0% |
| Indonesian | 1,318 | 0.0% |
| Inupiat | 133 | 0.0% |
| Iranian | 7,950 | 0.2% |
| Iraqi | 3,929 | 0.1% |
| Irish | 137,406 | 4.2% |
| Iroquois | 129 | 0.0% |
| Israeli | 1,087 | 0.0% |
| Italian | 58,278 | 1.8% |
| Jamaican | 4,661 | 0.1% |
| Japanese | 2,792 | 0.1% |
| Jordanian | 2,107 | 0.1% |
| Kenyan | 597 | 0.0% |
| Kiowa | 45 | 0.0% |
| Korean | 28,828 | 0.9% |
| Laotian | 1,774 | 0.1% |
| Latvian | 341 | 0.0% |
| Lebanese | 6,371 | 0.2% |
| Liberian | 205 | 0.0% |
| Lithuanian | 2,076 | 0.1% |
| Lumbee | 32 | 0.0% |
| Luxembourger | 59 | 0.0% |
| Macedonian | 743 | 0.0% |
| Malaysian | 1,247 | 0.0% |
| Maltese | 178 | 0.0% |
| Marshallese | 8 | 0.0% |
| Mexican | 992,561 | 30.4% |
| Mexican American Indian | 8,746 | 0.3% |
| Mongolian | 683 | 0.0% |
| Moroccan | 908 | 0.0% |
| Native Hawaiian | 1,845 | 0.1% |
| Navajo | 966 | 0.0% |
| New Zealander | 232 | 0.0% |
| Nicaraguan | 7,184 | 0.2% |
| Nigerian | 23,942 | 0.7% |
| Northern European | 2,437 | 0.1% |
| Norwegian | 11,582 | 0.4% |
| Okinawan | 355 | 0.0% |
| Osage | 240 | 0.0% |
| Pakistani | 2,491 | 0.1% |
| Palestinian | 2,809 | 0.1% |
| Panamanian | 1,903 | 0.1% |
| Paraguayan | 259 | 0.0% |
| Pennsylvania German | 151 | 0.0% |
| Peruvian | 4,997 | 0.2% |
| Pima | 6 | 0.0% |
| Polish | 33,136 | 1.0% |
| Portuguese | 5,399 | 0.2% |
| Potawatomi | 143 | 0.0% |
| Pueblo | 252 | 0.0% |
| Puerto Rican | 26,702 | 0.8% |
| Romanian | 2,335 | 0.1% |
| Russian | 12,942 | 0.4% |
| Salvadoran | 119,627 | 3.7% |
| Samoan | 435 | 0.0% |
| Scandinavian | 4,262 | 0.1% |
| Scotch-Irish | 19,479 | 0.6% |
| Scottish | 31,939 | 1.0% |
| Seminole | 69 | 0.0% |
| Senegalese | 185 | 0.0% |
| Serbian | 1,482 | 0.1% |
| Sierra Leonean | 830 | 0.0% |
| Sioux | 196 | 0.0% |
| Slavic | 714 | 0.0% |
| Slovak | 1,349 | 0.0% |
| Slovene | 677 | 0.0% |
| Somali | 129 | 0.0% |
| South African | 1,064 | 0.0% |
| South American | 57,442 | 1.8% |
| South American Indian | 268 | 0.0% |
| Soviet Union | 151 | 0.0% |
| Spaniard | 9,404 | 0.3% |
| Spanish | 7,230 | 0.2% |
| Spanish American | 576 | 0.0% |
| Spanish American Indian | 43 | 0.0% |
| Sri Lankan | 63,903 | 2.0% |
| Subsaharan African | 72,338 | 2.2% |
| Sudanese | 792 | 0.0% |
| Swedish | 11,631 | 0.4% |
| Swiss | 3,306 | 0.1% |
| Syrian | 2,571 | 0.1% |
| Thai | 73,823 | 2.3% |
| Tohono O'Odham | 108 | 0.0% |
| Tongan | 16 | 0.0% |
| Trinidadian and Tobagonian | 1,737 | 0.1% |
| Turkish | 3,324 | 0.1% |
| U.S. Virgin Islander | 252 | 0.0% |
| Ugandan | 251 | 0.0% |
| Ukrainian | 4,721 | 0.1% |
| Uruguayan | 561 | 0.0% |
| Ute | 39 | 0.0% |
| Venezuelan | 18,883 | 0.6% |
| Vietnamese | 1,831 | 0.1% |
| Welsh | 8,746 | 0.3% |
| West Indian | 1,968 | 0.1% |
| Yaqui | 138 | 0.0% |
| Yugoslavian | 814 | 0.0% |
| Yuman | 24 | 0.0% |
| Yup'ik | 27 | 0.0% |
| Zimbabwean | 109 | 0.0% | View All 187 Rows |
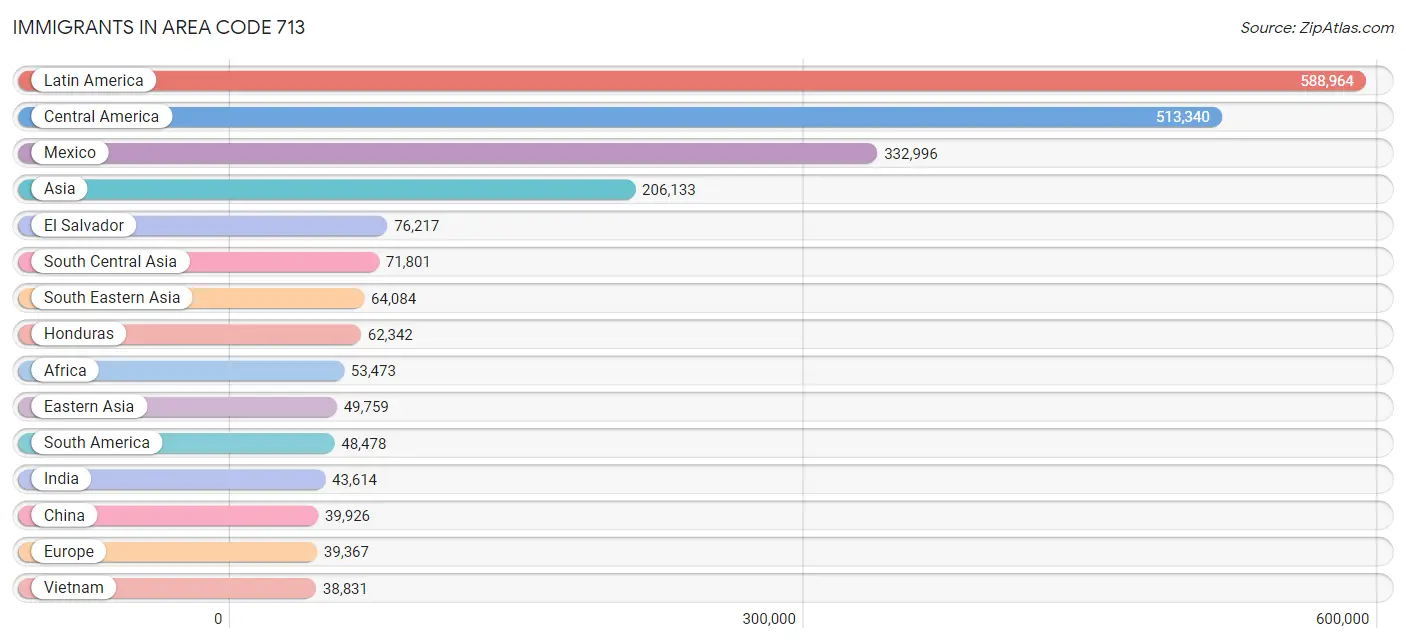
Immigrants in Area Code 713
The most numerous immigrant groups reported in Area Code 713 came from Latin America (588,964 | 18.0%), Central America (513,340 | 15.7%), Mexico (332,996 | 10.2%), Asia (206,133 | 6.3%), and El Salvador (76,217 | 2.3%), together accounting for 52.6% of all Area Code 713 residents.
| Immigration Origin | # Population | % Population |
| Afghanistan | 2,147 | 0.1% |
| Africa | 53,473 | 1.6% |
| Albania | 232 | 0.0% |
| Argentina | 3,610 | 0.1% |
| Armenia | 259 | 0.0% |
| Asia | 206,133 | 6.3% |
| Australia | 2,319 | 0.1% |
| Austria | 229 | 0.0% |
| Bahamas | 764 | 0.0% |
| Bangladesh | 2,228 | 0.1% |
| Barbados | 66 | 0.0% |
| Belarus | 315 | 0.0% |
| Belgium | 284 | 0.0% |
| Belize | 669 | 0.0% |
| Bolivia | 966 | 0.0% |
| Bosnia and Herzegovina | 883 | 0.0% |
| Brazil | 4,544 | 0.1% |
| Bulgaria | 272 | 0.0% |
| Cabo Verde | 18 | 0.0% |
| Cambodia | 1,426 | 0.0% |
| Cameroon | 3,775 | 0.1% |
| Canada | 9,253 | 0.3% |
| Caribbean | 27,146 | 0.8% |
| Central America | 513,340 | 15.7% |
| Chile | 1,485 | 0.1% |
| China | 39,926 | 1.2% |
| Colombia | 13,135 | 0.4% |
| Congo | 490 | 0.0% |
| Costa Rica | 1,322 | 0.0% |
| Croatia | 268 | 0.0% |
| Cuba | 16,103 | 0.5% |
| Czechoslovakia | 355 | 0.0% |
| Denmark | 717 | 0.0% |
| Dominica | 417 | 0.0% |
| Dominican Republic | 2,250 | 0.1% |
| Eastern Africa | 9,908 | 0.3% |
| Eastern Asia | 49,759 | 1.5% |
| Eastern Europe | 12,435 | 0.4% |
| Ecuador | 3,413 | 0.1% |
| Egypt | 3,381 | 0.1% |
| El Salvador | 76,217 | 2.3% |
| England | 2,876 | 0.1% |
| Eritrea | 2,470 | 0.1% |
| Ethiopia | 3,093 | 0.1% |
| Europe | 39,367 | 1.2% |
| Fiji | 64 | 0.0% |
| France | 3,145 | 0.1% |
| Germany | 4,126 | 0.1% |
| Ghana | 1,759 | 0.1% |
| Greece | 1,043 | 0.0% |
| Grenada | 137 | 0.0% |
| Guatemala | 33,463 | 1.0% |
| Guyana | 468 | 0.0% |
| Haiti | 600 | 0.0% |
| Honduras | 62,342 | 1.9% |
| Hong Kong | 2,433 | 0.1% |
| Hungary | 649 | 0.0% |
| India | 43,614 | 1.3% |
| Indonesia | 1,523 | 0.1% |
| Iran | 6,522 | 0.2% |
| Iraq | 4,081 | 0.1% |
| Ireland | 569 | 0.0% |
| Israel | 1,124 | 0.0% |
| Italy | 2,303 | 0.1% |
| Jamaica | 3,301 | 0.1% |
| Japan | 3,058 | 0.1% |
| Jordan | 2,005 | 0.1% |
| Kazakhstan | 910 | 0.0% |
| Kenya | 1,330 | 0.0% |
| Korea | 6,690 | 0.2% |
| Kuwait | 1,470 | 0.0% |
| Laos | 539 | 0.0% |
| Latin America | 588,964 | 18.0% |
| Latvia | 140 | 0.0% |
| Lebanon | 2,505 | 0.1% |
| Liberia | 562 | 0.0% |
| Lithuania | 43 | 0.0% |
| Malaysia | 1,422 | 0.0% |
| Mexico | 332,996 | 10.2% |
| Micronesia | 130 | 0.0% |
| Middle Africa | 6,490 | 0.2% |
| Moldova | 60 | 0.0% |
| Morocco | 944 | 0.0% |
| Nepal | 1,557 | 0.1% |
| Netherlands | 1,209 | 0.0% |
| Nicaragua | 5,408 | 0.2% |
| Nigeria | 21,793 | 0.7% |
| North Macedonia | 356 | 0.0% |
| Northern Africa | 6,095 | 0.2% |
| Northern Europe | 12,583 | 0.4% |
| Norway | 792 | 0.0% |
| Oceania | 2,851 | 0.1% |
| Pakistan | 13,602 | 0.4% |
| Panama | 923 | 0.0% |
| Peru | 3,095 | 0.1% |
| Philippines | 16,555 | 0.5% |
| Poland | 1,248 | 0.0% |
| Portugal | 237 | 0.0% |
| Romania | 1,113 | 0.0% |
| Russia | 3,809 | 0.1% |
| Saudi Arabia | 1,736 | 0.1% |
| Scotland | 1,029 | 0.0% |
| Senegal | 280 | 0.0% |
| Serbia | 459 | 0.0% |
| Sierra Leone | 1,231 | 0.0% |
| Singapore | 886 | 0.0% |
| Somalia | 153 | 0.0% |
| South Africa | 1,979 | 0.1% |
| South America | 48,478 | 1.5% |
| South Central Asia | 71,801 | 2.2% |
| South Eastern Asia | 64,084 | 2.0% |
| Southern Europe | 4,891 | 0.2% |
| Spain | 1,308 | 0.0% |
| Sri Lanka | 807 | 0.0% |
| St. Vincent and the Grenadines | 10 | 0.0% |
| Sudan | 717 | 0.0% |
| Sweden | 561 | 0.0% |
| Switzerland | 400 | 0.0% |
| Syria | 1,960 | 0.1% |
| Taiwan | 7,759 | 0.2% |
| Thailand | 1,842 | 0.1% |
| Trinidad and Tobago | 2,011 | 0.1% |
| Turkey | 2,442 | 0.1% |
| Uganda | 409 | 0.0% |
| Ukraine | 1,401 | 0.0% |
| Uruguay | 473 | 0.0% |
| Uzbekistan | 81 | 0.0% |
| Venezuela | 16,988 | 0.5% |
| Vietnam | 38,831 | 1.2% |
| West Indies | 120 | 0.0% |
| Western Africa | 27,418 | 0.8% |
| Western Asia | 19,800 | 0.6% |
| Western Europe | 9,420 | 0.3% |
| Yemen | 94 | 0.0% |
| Zaire | 851 | 0.0% |
| Zimbabwe | 477 | 0.0% | View All 136 Rows |
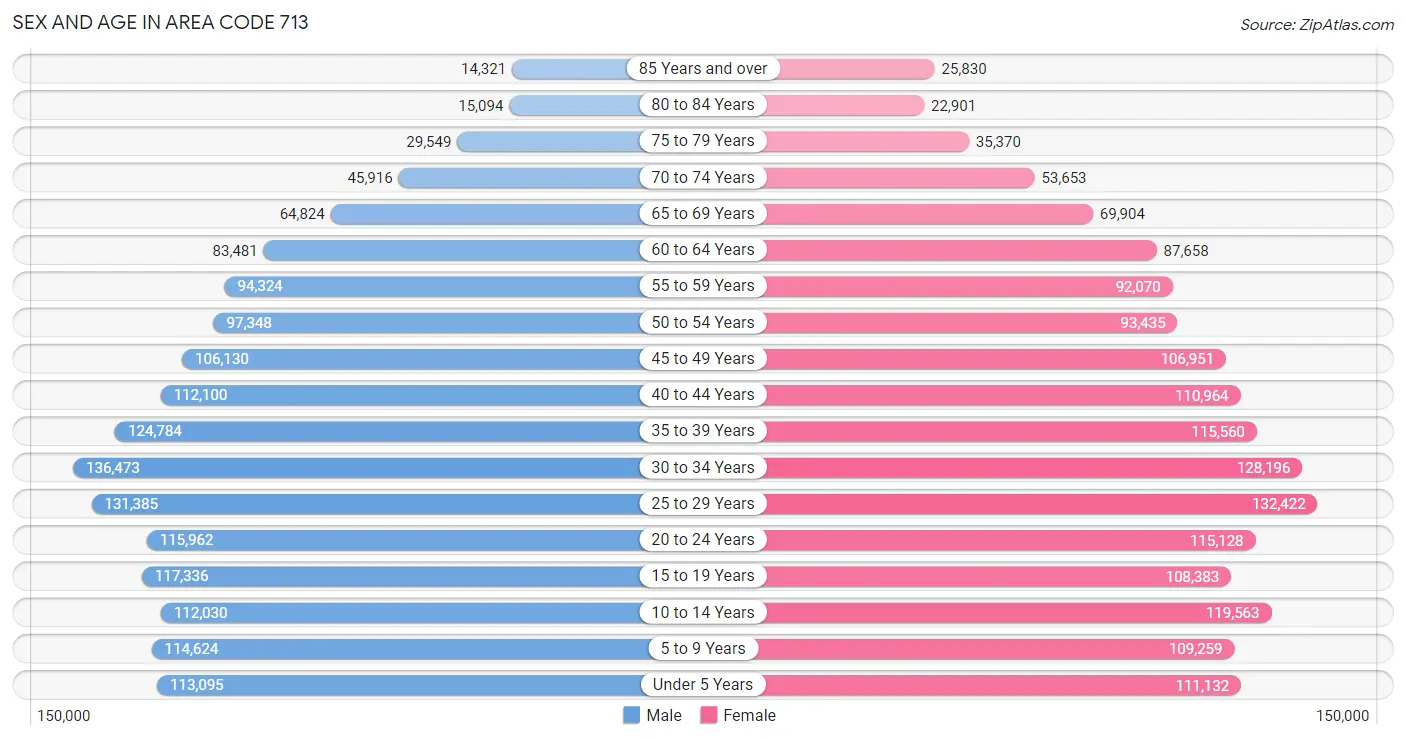
Sex and Age in Area Code 713
Sex and Age in Area Code 713
The most populous age groups in Area Code 713 are 30 to 34 Years (136,473 | 8.4%) for men and 25 to 29 Years (132,422 | 8.1%) for women.
| Age Bracket | Male | Female |
| Under 5 Years | 113,095 (6.9%) | 111,132 (6.8%) |
| 5 to 9 Years | 114,624 (7.0%) | 109,259 (6.7%) |
| 10 to 14 Years | 112,030 (6.9%) | 119,563 (7.3%) |
| 15 to 19 Years | 117,336 (7.2%) | 108,383 (6.6%) |
| 20 to 24 Years | 115,962 (7.1%) | 115,128 (7.0%) |
| 25 to 29 Years | 131,385 (8.1%) | 132,422 (8.1%) |
| 30 to 34 Years | 136,473 (8.4%) | 128,196 (7.8%) |
| 35 to 39 Years | 124,784 (7.7%) | 115,560 (7.0%) |
| 40 to 44 Years | 112,100 (6.9%) | 110,964 (6.8%) |
| 45 to 49 Years | 106,130 (6.5%) | 106,951 (6.5%) |
| 50 to 54 Years | 97,348 (6.0%) | 93,435 (5.7%) |
| 55 to 59 Years | 94,324 (5.8%) | 92,070 (5.6%) |
| 60 to 64 Years | 83,481 (5.1%) | 87,658 (5.3%) |
| 65 to 69 Years | 64,824 (4.0%) | 69,904 (4.3%) |
| 70 to 74 Years | 45,916 (2.8%) | 53,653 (3.3%) |
| 75 to 79 Years | 29,549 (1.8%) | 35,370 (2.2%) |
| 80 to 84 Years | 15,094 (0.9%) | 22,901 (1.4%) |
| 85 Years and over | 14,321 (0.9%) | 25,830 (1.6%) |
| Total | 1,628,776 (100.0%) | 1,638,379 (100.0%) |
Families and Households in Area Code 713
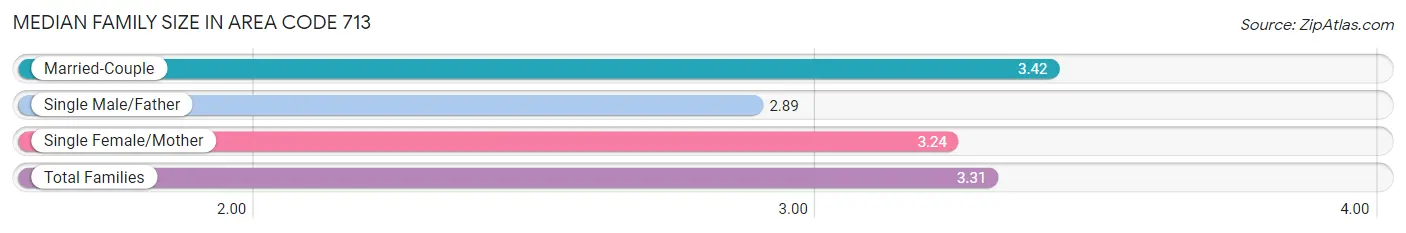
Median Family Size in Area Code 713
The median family size in Area Code 713 is 3.31 persons per family, with married-couple families (532,679 | 68.2%) accounting for the largest median family size of 3.41546 persons per family. On the other hand, single male/father families (73,887 | 9.5%) represent the smallest median family size with 2.89 persons per family.
| Family Type | # Families | Family Size |
| Married-Couple | 532,679 (68.2%) | 3.42 |
| Single Male/Father | 73,887 (9.5%) | 2.89 |
| Single Female/Mother | 174,718 (22.4%) | 3.24 |
| Total Families | 781,284 (100.0%) | 3.31 |
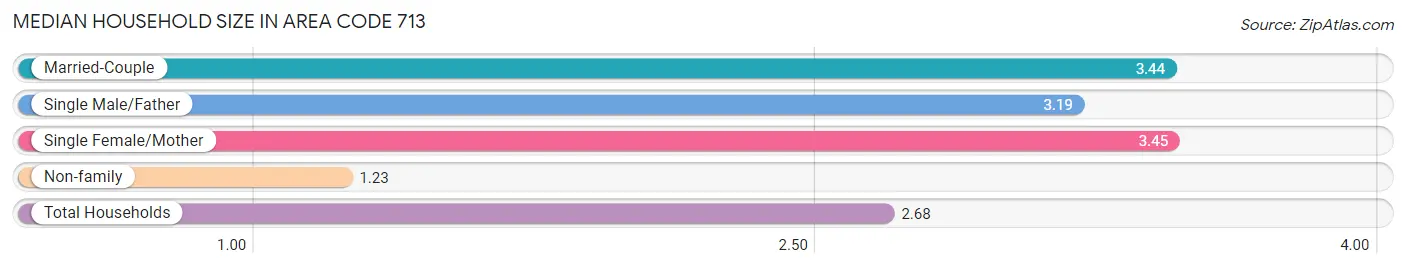
Median Household Size in Area Code 713
The median household size in Area Code 713 is 2.68 persons per household, with single female/mother households (174,718 | 14.5%) accounting for the largest median household size of 3.44642 persons per household. non-family households (425,550 | 35.3%) represent the smallest median household size with 1.23 persons per household.
| Household Type | # Households | Household Size |
| Married-Couple | 532,679 (44.1%) | 3.44 |
| Single Male/Father | 73,887 (6.1%) | 3.19 |
| Single Female/Mother | 174,718 (14.5%) | 3.45 |
| Non-family | 425,550 (35.3%) | 1.23 |
| Total Households | 1,206,834 (100.0%) | 2.68 |
Household Size by Marriage Status in Area Code 713
Out of a total of 1,206,834 households in Area Code 713, 781,284 (64.7%) are family households, while 425,550 (35.3%) are nonfamily households. The most numerous type of family households are 2-person households, comprising 285,792, and the most common type of nonfamily households are 1-person households, comprising 345,565.
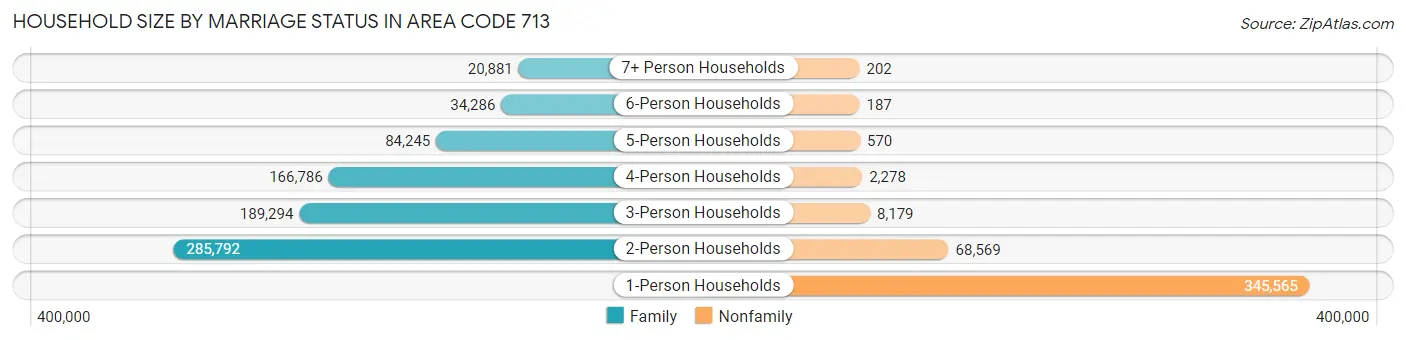
| Household Size | Family Households | Nonfamily Households |
| 1-Person Households | - | 345,565 (28.6%) |
| 2-Person Households | 285,792 (23.7%) | 68,569 (5.7%) |
| 3-Person Households | 189,294 (15.7%) | 8,179 (0.7%) |
| 4-Person Households | 166,786 (13.8%) | 2,278 (0.2%) |
| 5-Person Households | 84,245 (7.0%) | 570 (0.1%) |
| 6-Person Households | 34,286 (2.8%) | 187 (0.0%) |
| 7+ Person Households | 20,881 (1.7%) | 202 (0.0%) |
| Total | 781,284 (64.7%) | 425,550 (35.3%) |
Female Fertility in Area Code 713
Fertility by Age in Area Code 713
Average fertility rate in Area Code 713 is 56.4 births per 1,000 women. Women in the age bracket of 20 to 34 years have the highest fertility rate with 92.7 births per 1,000 women. Women in the age bracket of 20 to 34 years acount for 69.5% of all women with births.
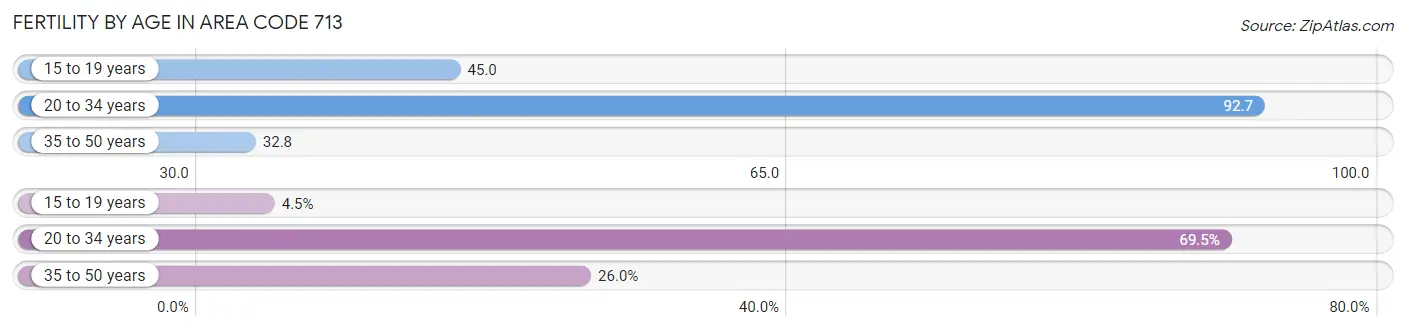
| Age Bracket | Women with Births | Births / 1,000 Women |
| 15 to 19 years | 2,160 (4.5%) | 45.0 |
| 20 to 34 years | 33,096 (69.5%) | 92.7 |
| 35 to 50 years | 12,390 (26.0%) | 32.8 |
| Total | 47,646 (100.0%) | 56.4 |
Fertility by Age by Marriage Status in Area Code 713
64.4% of women with births (47,646) in Area Code 713 are married. The highest percentage of unmarried women with births falls into 15 to 19 years age bracket with 97.4% of them unmarried at the time of birth, while the lowest percentage of unmarried women with births belong to 20 to 34 years age bracket with 36.0% of them unmarried.
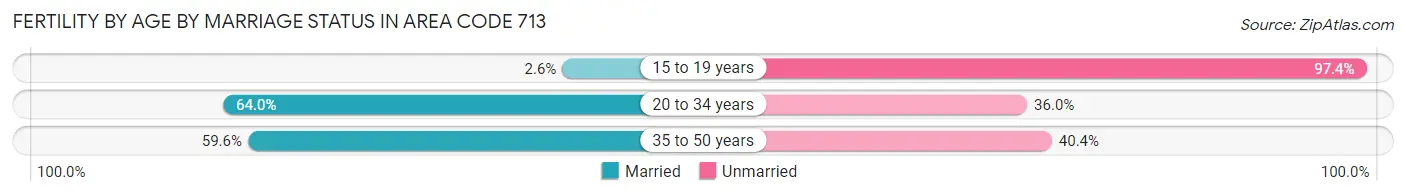
| Age Bracket | Married | Unmarried |
| 15 to 19 years | 56 (2.6%) | 2,104 (97.4%) |
| 20 to 34 years | 21,190 (64.0%) | 11,906 (36.0%) |
| 35 to 50 years | 7,379 (59.6%) | 5,011 (40.4%) |
| Total | 30,674 (64.4%) | 16,972 (35.6%) |
Fertility by Education in Area Code 713
Average fertility rate in Area Code 713 is 56.4 births per 1,000 women. Women with the education attainment of graduate degree have the highest fertility rate of 72.9 births per 1,000 women, while women with the education attainment of less than high school have the lowest fertility at 53.1 births per 1,000 women. Women with the education attainment of college or associate's degree represent 24.0% of all women with births.
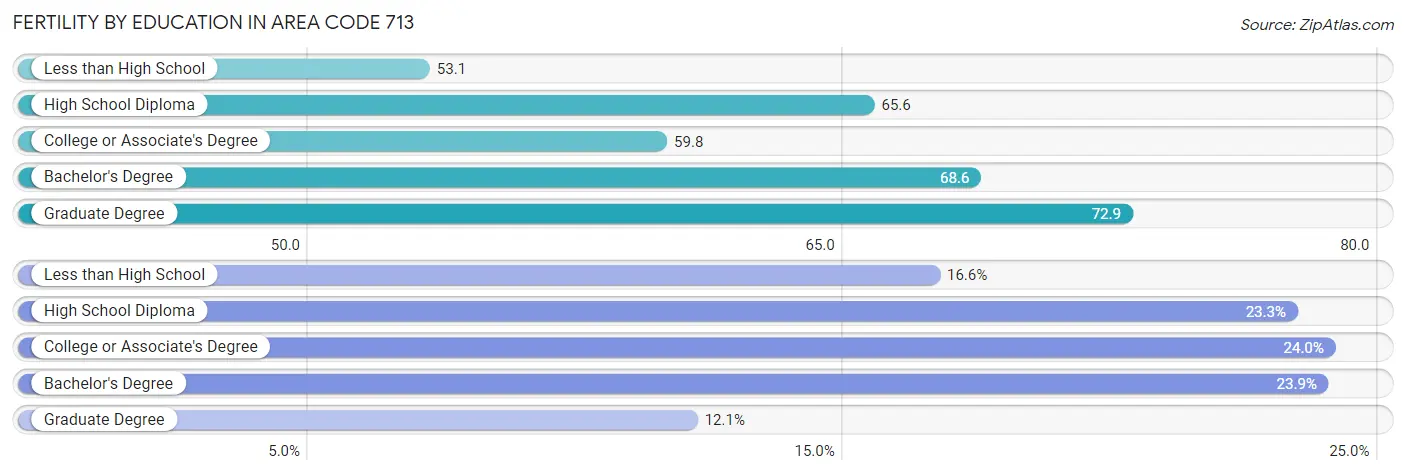
| Educational Attainment | Women with Births | Births / 1,000 Women |
| Less than High School | 7,922 (16.6%) | 53.1 |
| High School Diploma | 11,118 (23.3%) | 65.6 |
| College or Associate's Degree | 11,452 (24.0%) | 59.8 |
| Bachelor's Degree | 11,393 (23.9%) | 68.6 |
| Graduate Degree | 5,761 (12.1%) | 72.9 |
| Total | 47,646 (100.0%) | 56.4 |
Fertility by Education by Marriage Status in Area Code 713
35.6% of women with births in Area Code 713 are unmarried. Women with the educational attainment of graduate degree are most likely to be married with 64.5% of them married at childbirth, while women with the educational attainment of less than high school are least likely to be married with 62.8% of them unmarried at childbirth.
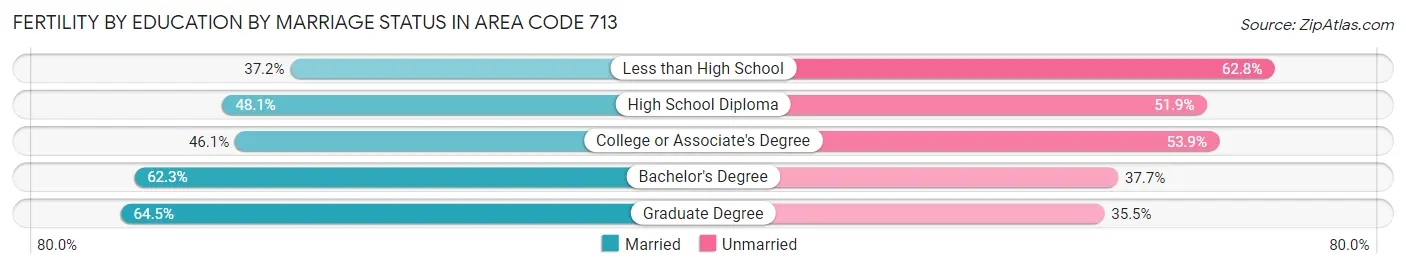
| Educational Attainment | Married | Unmarried |
| Less than High School | 2,944 (37.2%) | 4,978 (62.8%) |
| High School Diploma | 5,348 (48.1%) | 5,770 (51.9%) |
| College or Associate's Degree | 5,277 (46.1%) | 6,175 (53.9%) |
| Bachelor's Degree | 7,100 (62.3%) | 4,293 (37.7%) |
| Graduate Degree | 3,717 (64.5%) | 2,044 (35.5%) |
| Total | 30,674 (64.4%) | 16,972 (35.6%) |
Employment Characteristics in Area Code 713
Employment by Class of Employer in Area Code 713
Among the 1,563,451 employed individuals in Area Code 713, private company employees (1,140,279 | 72.9%), self-employed (not incorporated) (101,669 | 6.5%), and not-for-profit organizations (96,870 | 6.2%) make up the most common classes of employment.
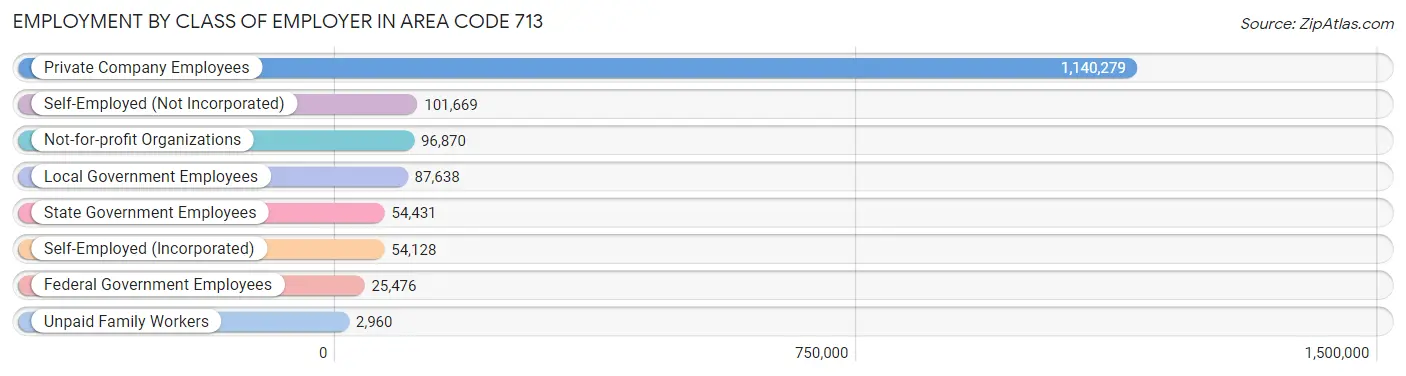
| Employer Class | # Employees | % Employees |
| Private Company Employees | 1,140,279 | 72.9% |
| Self-Employed (Incorporated) | 54,128 | 3.5% |
| Self-Employed (Not Incorporated) | 101,669 | 6.5% |
| Not-for-profit Organizations | 96,870 | 6.2% |
| Local Government Employees | 87,638 | 5.6% |
| State Government Employees | 54,431 | 3.5% |
| Federal Government Employees | 25,476 | 1.6% |
| Unpaid Family Workers | 2,960 | 0.2% |
| Total | 1,563,451 | 100.0% |
Employment Status by Age in Area Code 713
According to the labor force statistics for Area Code 713, out of the total population over 16 years of age (2,542,165), 65.7% or 1,670,711 individuals are in the labor force, with 6.7% or 112,105 of them unemployed. The age group with the highest labor force participation rate is 30 to 34 years, with 82.3% or 217,717 individuals in the labor force. Within the labor force, the 16 to 19 years age range has the highest percentage of unemployed individuals, with 2,038.4% or 1,153,775 of them being unemployed.
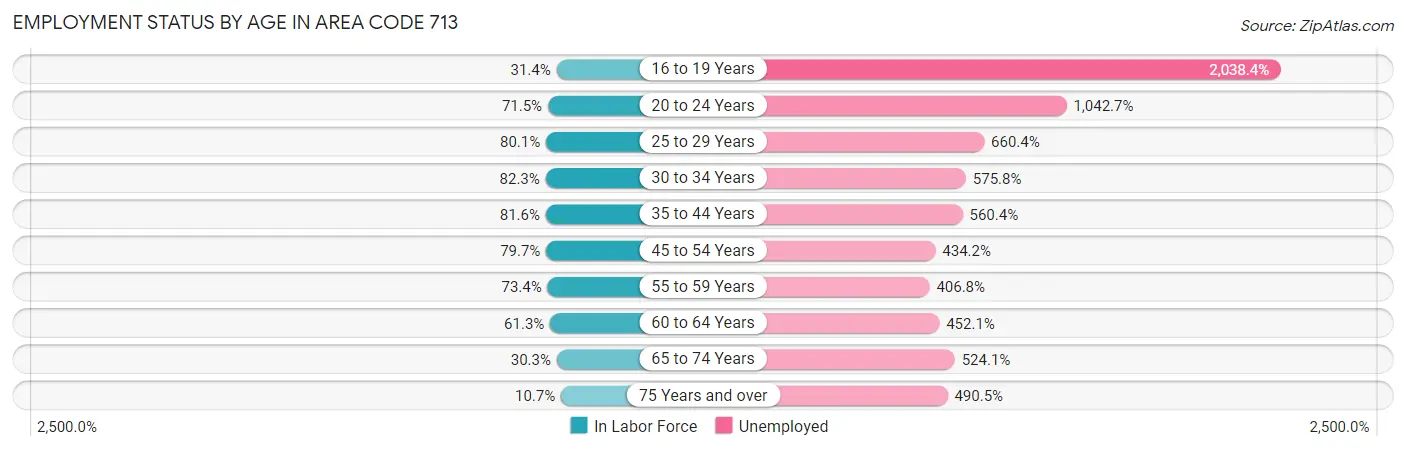
| Age Bracket | In Labor Force | Unemployed |
| 16 to 19 Years | 56,604 (31.4%) | 1,153,775 (2,038.4%) |
| 20 to 24 Years | 165,244 (71.5%) | 1,723,083 (1,042.7%) |
| 25 to 29 Years | 211,402 (80.1%) | 1,396,185 (660.4%) |
| 30 to 34 Years | 217,715 (82.3%) | 1,253,614 (575.8%) |
| 35 to 44 Years | 378,321 (81.6%) | 2,120,139 (560.4%) |
| 45 to 54 Years | 321,659 (79.6%) | 1,396,726 (434.2%) |
| 55 to 59 Years | 136,844 (73.4%) | 556,706 (406.8%) |
| 60 to 64 Years | 104,933 (61.3%) | 474,366 (452.1%) |
| 65 to 74 Years | 71,079 (30.3%) | 372,562 (524.1%) |
| 75 Years and over | 15,327 (10.7%) | 75,154 (490.5%) |
| Total | 1,670,617 (65.7%) | 112,164 (6.7%) |
Employment Status by Educational Attainment in Area Code 713
According to labor force statistics for Area Code 713, 77.9% of individuals (1,366,157) out of the total population between 25 and 64 years of age (1,753,281) are in the labor force, with 519.6% or 7,098,552 of them being unemployed. The group with the highest labor force participation rate are those with the educational attainment of bachelor's degree or higher, with 86.0% or 559,414 individuals in the labor force. Within the labor force, individuals with less than high school education have the highest percentage of unemployment, with 713.1% or 1,524,451 of them being unemployed.
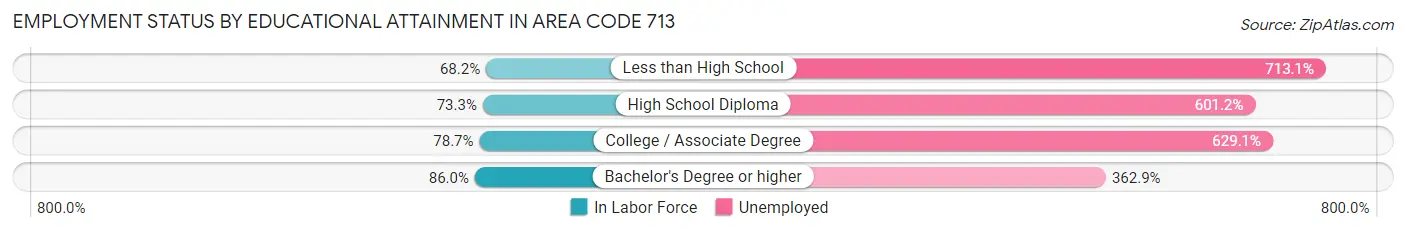
| Educational Attainment | In Labor Force | Unemployed |
| Less than High School | 213,764 (68.2%) | 2,235,597 (713.1%) |
| High School Diploma | 275,936 (73.3%) | 2,262,754 (601.2%) |
| College / Associate Degree | 324,800 (78.7%) | 2,595,314 (629.1%) |
| Bachelor's Degree or higher | 559,394 (86.0%) | 2,361,971 (362.9%) |
| Total | 1,366,181 (77.9%) | 9,110,048 (519.6%) |
Employment Occupations by Sex in Area Code 713
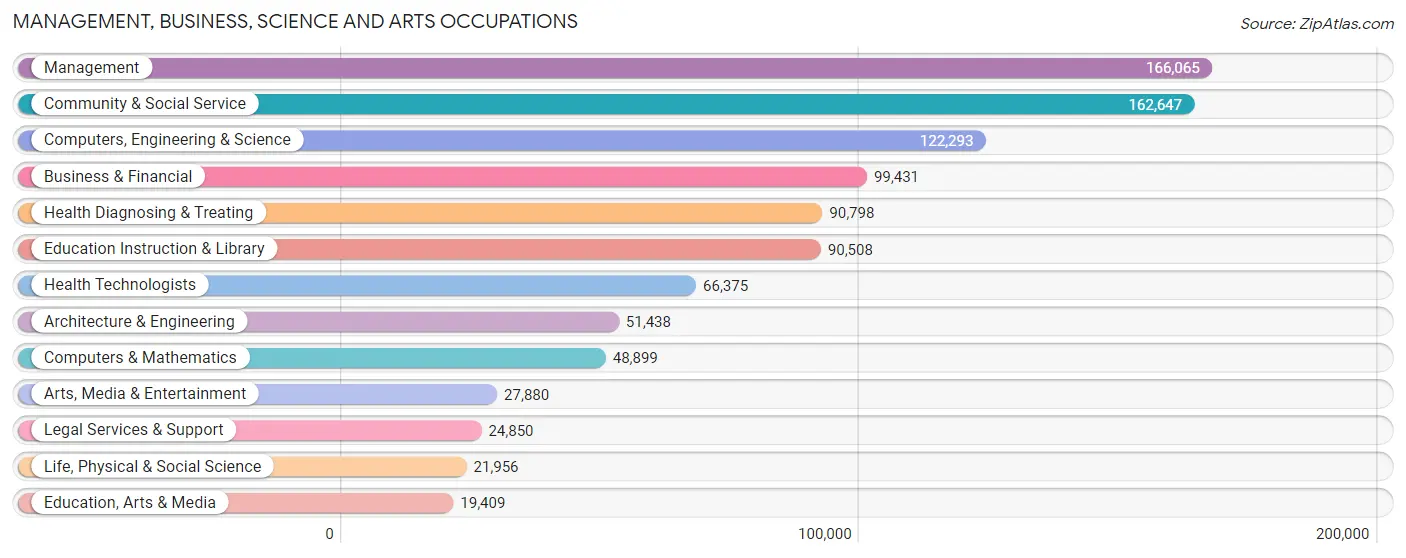
Management, Business, Science and Arts Occupations
The most common Management, Business, Science and Arts occupations in Area Code 713 are Management (166,065 | 10.4%), Community & Social Service (162,647 | 10.2%), Computers, Engineering & Science (122,293 | 7.7%), Business & Financial (99,431 | 6.2%), and Health Diagnosing & Treating (90,798 | 5.7%).
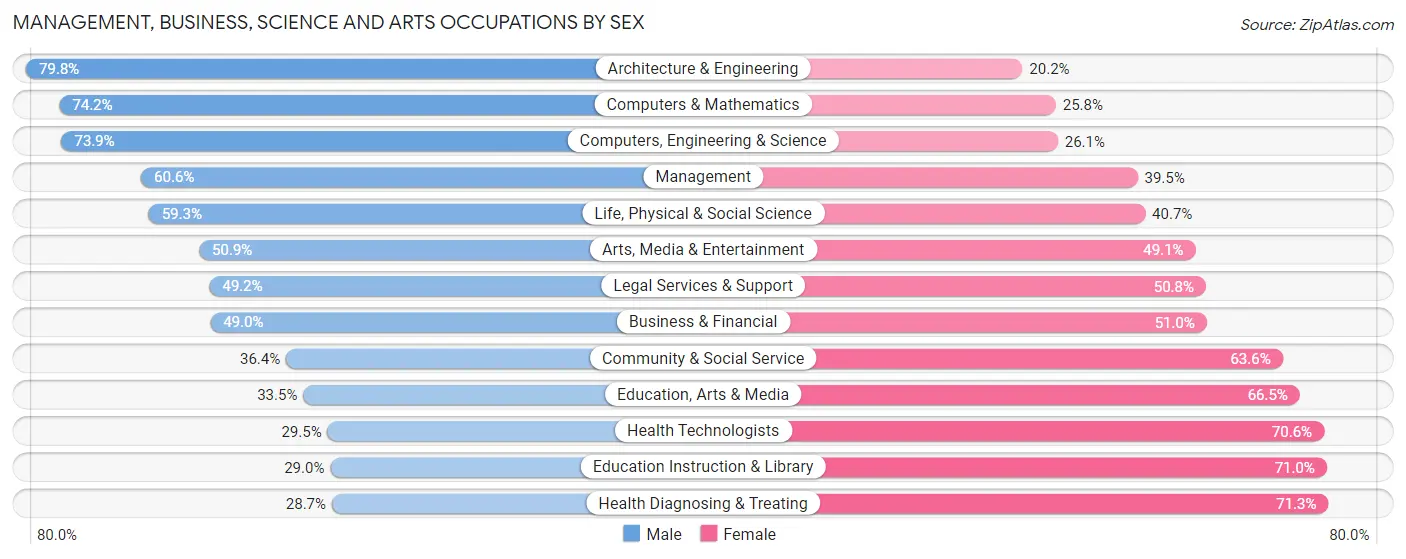
Management, Business, Science and Arts Occupations by Sex
Within the Management, Business, Science and Arts occupations in Area Code 713, the most male-oriented occupations are Architecture & Engineering (79.8%), Computers & Mathematics (74.2%), and Computers, Engineering & Science (73.9%), while the most female-oriented occupations are Health Diagnosing & Treating (71.3%), Education Instruction & Library (71.0%), and Health Technologists (70.6%).
| Occupation | Male | Female |
| Management | 100,550 (60.6%) | 65,515 (39.5%) |
| Business & Financial | 48,737 (49.0%) | 50,694 (51.0%) |
| Computers, Engineering & Science | 90,322 (73.9%) | 31,971 (26.1%) |
| Computers & Mathematics | 36,276 (74.2%) | 12,623 (25.8%) |
| Architecture & Engineering | 41,031 (79.8%) | 10,407 (20.2%) |
| Life, Physical & Social Science | 13,015 (59.3%) | 8,941 (40.7%) |
| Community & Social Service | 59,150 (36.4%) | 103,497 (63.6%) |
| Education, Arts & Media | 6,502 (33.5%) | 12,907 (66.5%) |
| Legal Services & Support | 12,219 (49.2%) | 12,631 (50.8%) |
| Education Instruction & Library | 26,238 (29.0%) | 64,270 (71.0%) |
| Arts, Media & Entertainment | 14,191 (50.9%) | 13,689 (49.1%) |
| Health Diagnosing & Treating | 26,075 (28.7%) | 64,723 (71.3%) |
| Health Technologists | 19,546 (29.4%) | 46,829 (70.6%) |
| Total (Category) | 324,834 (50.7%) | 316,400 (49.3%) |
| Total (Overall) | 886,554 (55.6%) | 706,747 (44.4%) |
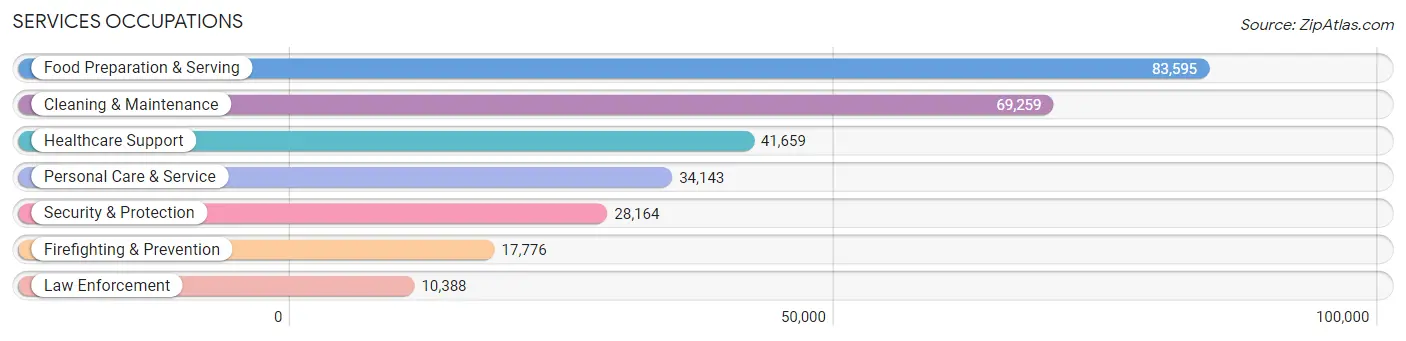
Services Occupations
The most common Services occupations in Area Code 713 are Food Preparation & Serving (83,595 | 5.2%), Cleaning & Maintenance (69,259 | 4.3%), Healthcare Support (41,659 | 2.6%), Personal Care & Service (34,143 | 2.1%), and Security & Protection (28,164 | 1.8%).
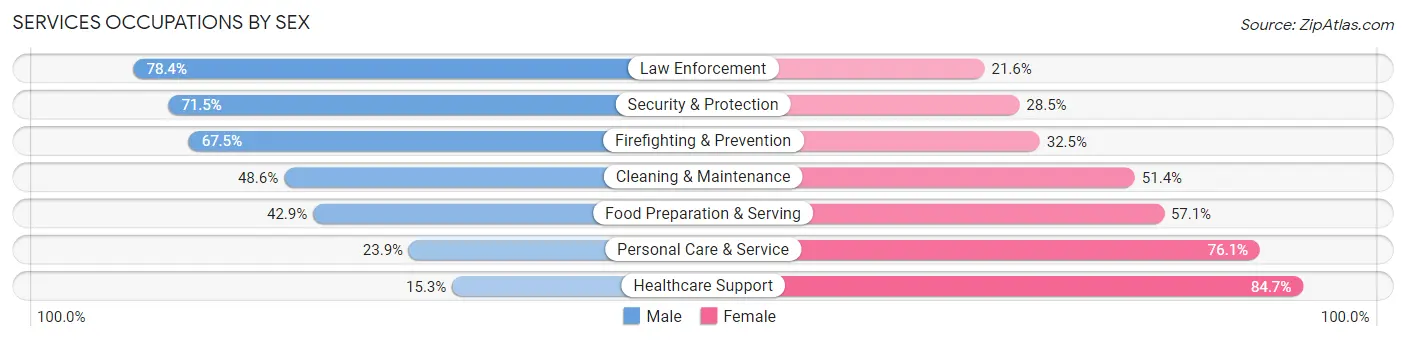
Services Occupations by Sex
Within the Services occupations in Area Code 713, the most male-oriented occupations are Law Enforcement (78.4%), Security & Protection (71.5%), and Firefighting & Prevention (67.5%), while the most female-oriented occupations are Healthcare Support (84.7%), Personal Care & Service (76.1%), and Food Preparation & Serving (57.1%).
| Occupation | Male | Female |
| Healthcare Support | 6,391 (15.3%) | 35,268 (84.7%) |
| Security & Protection | 20,139 (71.5%) | 8,025 (28.5%) |
| Firefighting & Prevention | 11,994 (67.5%) | 5,782 (32.5%) |
| Law Enforcement | 8,145 (78.4%) | 2,243 (21.6%) |
| Food Preparation & Serving | 35,854 (42.9%) | 47,741 (57.1%) |
| Cleaning & Maintenance | 33,688 (48.6%) | 35,571 (51.4%) |
| Personal Care & Service | 8,161 (23.9%) | 25,982 (76.1%) |
| Total (Category) | 104,233 (40.6%) | 152,587 (59.4%) |
| Total (Overall) | 886,554 (55.6%) | 706,747 (44.4%) |
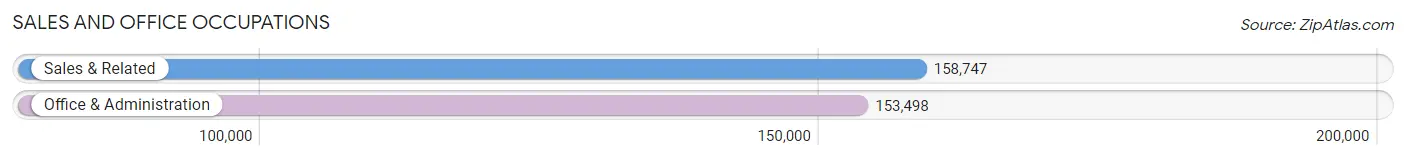
Sales and Office Occupations
The most common Sales and Office occupations in Area Code 713 are Sales & Related (158,747 | 10.0%), and Office & Administration (153,498 | 9.6%).
Sales and Office Occupations by Sex
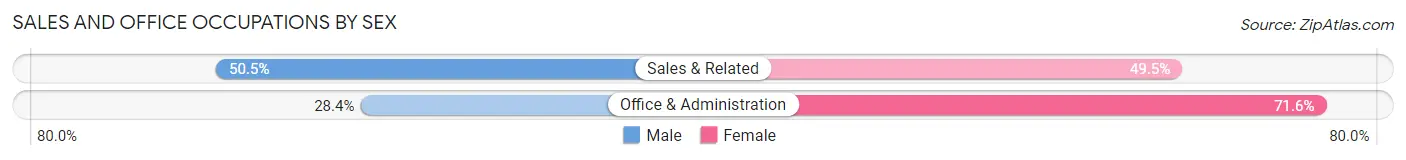
| Occupation | Male | Female |
| Sales & Related | 80,225 (50.5%) | 78,522 (49.5%) |
| Office & Administration | 43,528 (28.4%) | 109,970 (71.6%) |
| Total (Category) | 123,753 (39.6%) | 188,492 (60.4%) |
| Total (Overall) | 886,554 (55.6%) | 706,747 (44.4%) |
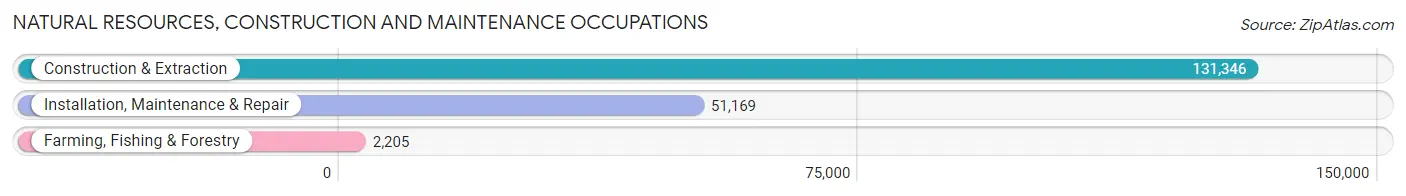
Natural Resources, Construction and Maintenance Occupations
The most common Natural Resources, Construction and Maintenance occupations in Area Code 713 are Construction & Extraction (131,346 | 8.2%), Installation, Maintenance & Repair (51,169 | 3.2%), and Farming, Fishing & Forestry (2,205 | 0.1%).
Natural Resources, Construction and Maintenance Occupations by Sex
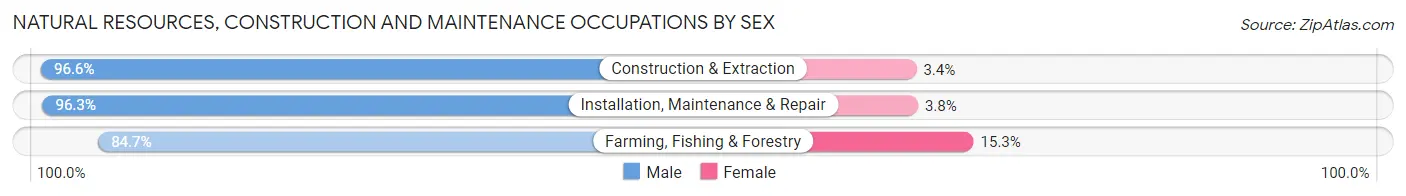
| Occupation | Male | Female |
| Farming, Fishing & Forestry | 1,867 (84.7%) | 338 (15.3%) |
| Construction & Extraction | 126,833 (96.6%) | 4,513 (3.4%) |
| Installation, Maintenance & Repair | 49,250 (96.3%) | 1,919 (3.7%) |
| Total (Category) | 177,950 (96.3%) | 6,770 (3.7%) |
| Total (Overall) | 886,554 (55.6%) | 706,747 (44.4%) |
Production, Transportation and Moving Occupations
The most common Production, Transportation and Moving occupations in Area Code 713 are Production (77,192 | 4.8%), Transportation (62,379 | 3.9%), and Material Moving (58,711 | 3.7%).
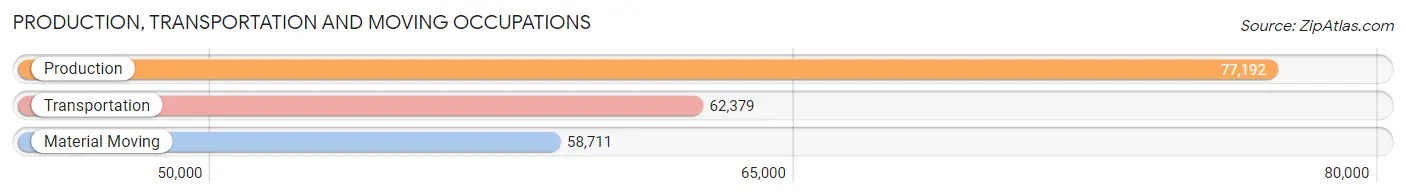
Production, Transportation and Moving Occupations by Sex
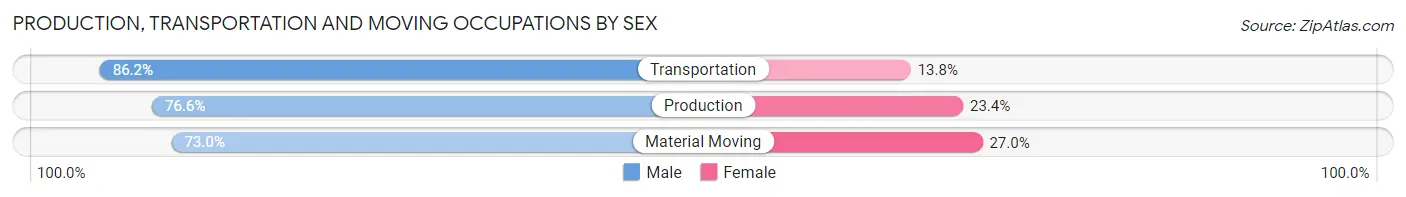
| Occupation | Male | Female |
| Production | 59,133 (76.6%) | 18,059 (23.4%) |
| Transportation | 53,770 (86.2%) | 8,609 (13.8%) |
| Material Moving | 42,881 (73.0%) | 15,830 (27.0%) |
| Total (Category) | 155,784 (78.6%) | 42,498 (21.4%) |
| Total (Overall) | 886,554 (55.6%) | 706,747 (44.4%) |
Employment Industries by Sex in Area Code 713
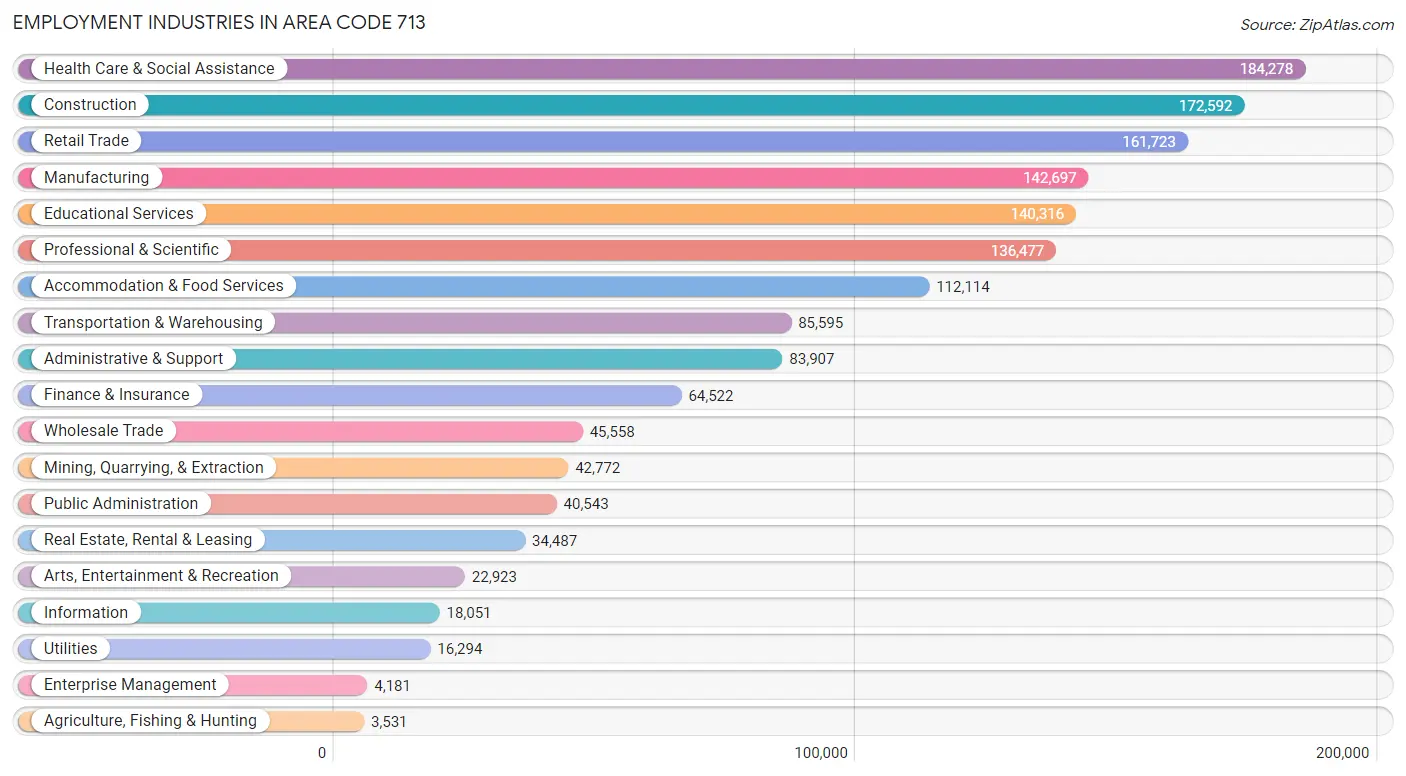
Employment Industries in Area Code 713
The major employment industries in Area Code 713 include Health Care & Social Assistance (184,278 | 11.6%), Construction (172,592 | 10.8%), Retail Trade (161,723 | 10.2%), Manufacturing (142,697 | 9.0%), and Educational Services (140,316 | 8.8%).
Employment Industries by Sex in Area Code 713
The Area Code 713 industries that see more men than women are Construction (91.3%), Transportation & Warehousing (76.0%), and Manufacturing (73.2%), whereas the industries that tend to have a higher number of women are Health Care & Social Assistance (75.7%), Educational Services (68.5%), and Accommodation & Food Services (55.2%).
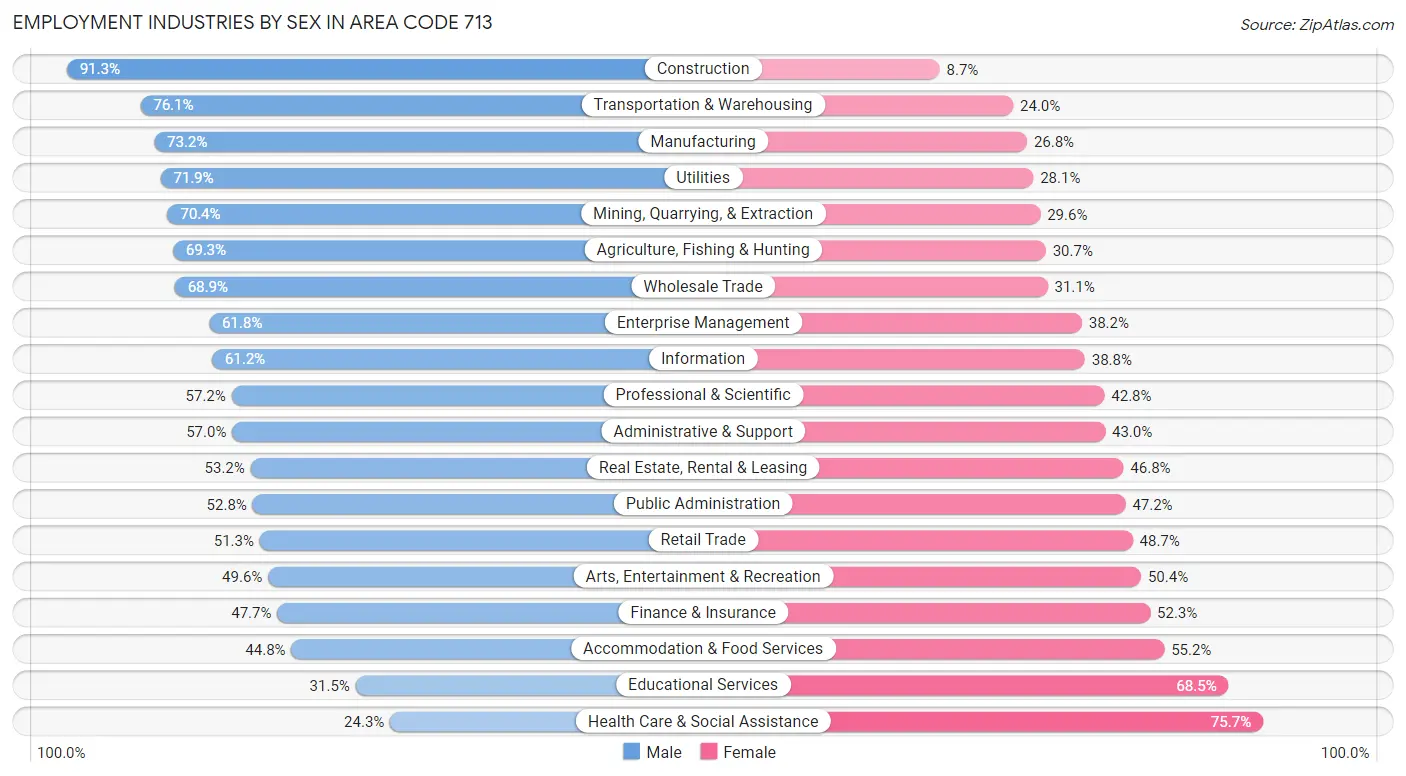
| Industry | Male | Female |
| Agriculture, Fishing & Hunting | 2,447 (69.3%) | 1,084 (30.7%) |
| Mining, Quarrying, & Extraction | 30,127 (70.4%) | 12,645 (29.6%) |
| Construction | 157,517 (91.3%) | 15,075 (8.7%) |
| Manufacturing | 104,435 (73.2%) | 38,262 (26.8%) |
| Wholesale Trade | 31,400 (68.9%) | 14,158 (31.1%) |
| Retail Trade | 83,003 (51.3%) | 78,720 (48.7%) |
| Transportation & Warehousing | 65,095 (76.0%) | 20,500 (23.9%) |
| Utilities | 11,714 (71.9%) | 4,580 (28.1%) |
| Information | 11,051 (61.2%) | 7,000 (38.8%) |
| Finance & Insurance | 30,780 (47.7%) | 33,742 (52.3%) |
| Real Estate, Rental & Leasing | 18,355 (53.2%) | 16,132 (46.8%) |
| Professional & Scientific | 78,011 (57.2%) | 58,466 (42.8%) |
| Enterprise Management | 2,585 (61.8%) | 1,596 (38.2%) |
| Administrative & Support | 47,843 (57.0%) | 36,064 (43.0%) |
| Educational Services | 44,174 (31.5%) | 96,142 (68.5%) |
| Health Care & Social Assistance | 44,861 (24.3%) | 139,417 (75.7%) |
| Arts, Entertainment & Recreation | 11,367 (49.6%) | 11,556 (50.4%) |
| Accommodation & Food Services | 50,208 (44.8%) | 61,906 (55.2%) |
| Public Administration | 21,406 (52.8%) | 19,137 (47.2%) |
| Total | 886,554 (55.6%) | 706,747 (44.4%) |
Education in Area Code 713
School Enrollment in Area Code 713
The most common levels of schooling among the 852,792 students in Area Code 713 are high school (183,992 | 21.6%), middle school (180,799 | 21.2%), and elementary school (178,495 | 20.9%).
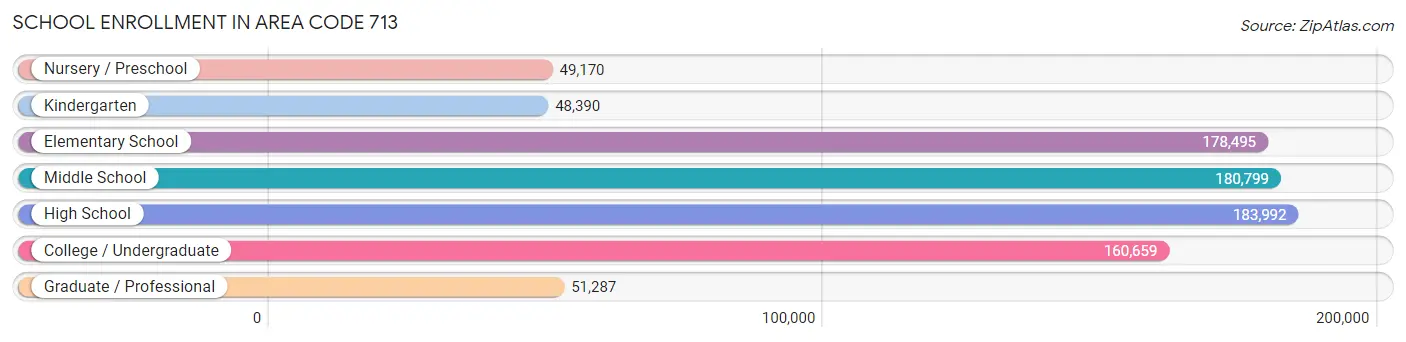
| School Level | # Students | % Students |
| Nursery / Preschool | 49,170 | 5.8% |
| Kindergarten | 48,390 | 5.7% |
| Elementary School | 178,495 | 20.9% |
| Middle School | 180,799 | 21.2% |
| High School | 183,992 | 21.6% |
| College / Undergraduate | 160,659 | 18.8% |
| Graduate / Professional | 51,287 | 6.0% |
| Total | 852,792 | 100.0% |
School Enrollment by Age by Funding Source in Area Code 713
Out of a total of 852,792 students who are enrolled in schools in Area Code 713, 117,395 (13.8%) attend a private institution, while the remaining 735,397 (86.2%) are enrolled in public schools. The age group of 3 to 4 year olds has the highest likelihood of being enrolled in private schools, with 15,997 (40.6% in the age bracket) enrolled. Conversely, the age group of 15 to 17 year olds has the lowest likelihood of being enrolled in a private school, with 122,207 (91.7% in the age bracket) attending a public institution.
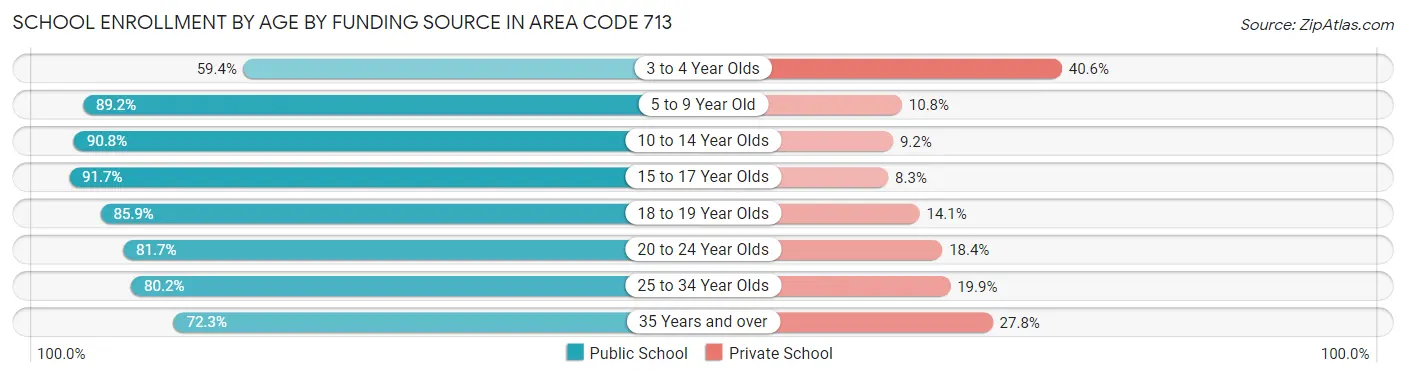
| Age Bracket | Public School | Private School |
| 3 to 4 Year Olds | 23,378 (59.4%) | 15,997 (40.6%) |
| 5 to 9 Year Old | 188,893 (89.2%) | 22,972 (10.8%) |
| 10 to 14 Year Olds | 203,967 (90.8%) | 20,615 (9.2%) |
| 15 to 17 Year Olds | 122,207 (91.7%) | 11,042 (8.3%) |
| 18 to 19 Year Olds | 52,536 (85.9%) | 8,645 (14.1%) |
| 20 to 24 Year Olds | 68,597 (81.7%) | 15,417 (18.3%) |
| 25 to 34 Year Olds | 47,081 (80.1%) | 11,662 (19.9%) |
| 35 Years and over | 28,745 (72.3%) | 11,038 (27.8%) |
| Total | 735,397 (86.2%) | 117,395 (13.8%) |
Educational Attainment by Field of Study in Area Code 713
Business (189,749 | 22.7%), engineering (111,286 | 13.3%), science & technology (74,750 | 8.9%), education (65,932 | 7.9%), and social sciences (59,495 | 7.1%) are the most common fields of study among 835,829 individuals in Area Code 713 who have obtained a bachelor's degree or higher.
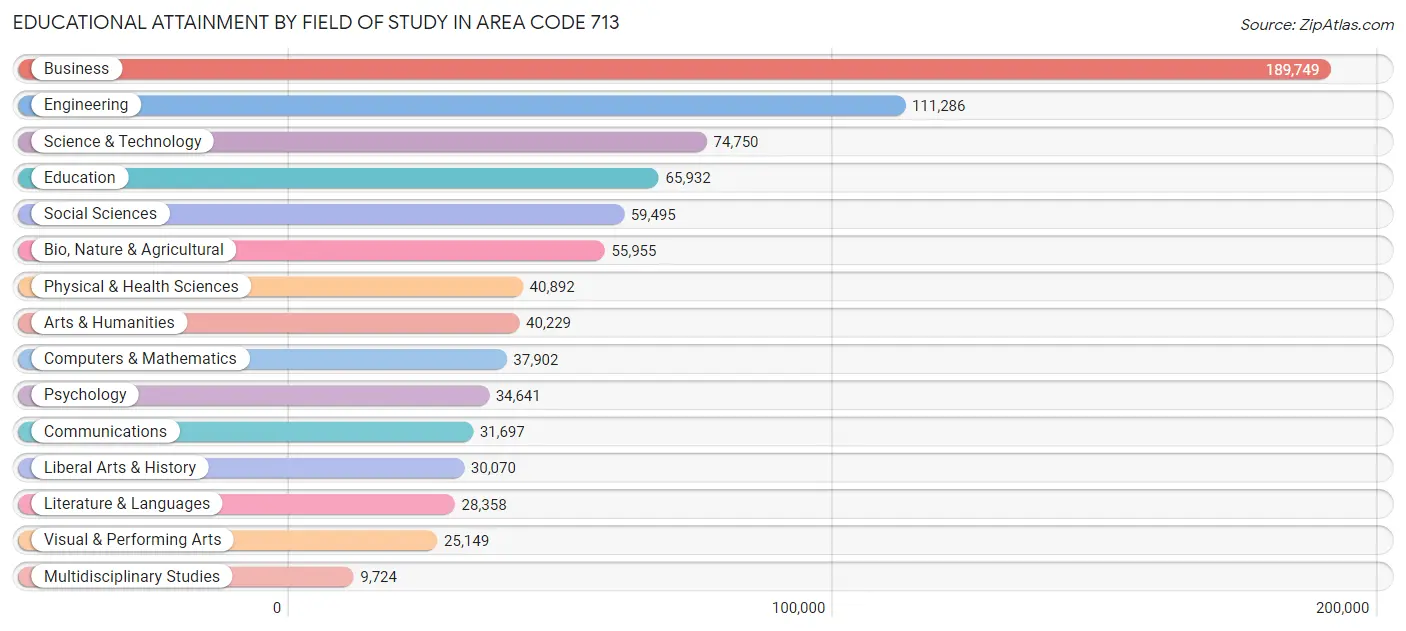
| Field of Study | # Graduates | % Graduates |
| Computers & Mathematics | 37,902 | 4.5% |
| Bio, Nature & Agricultural | 55,955 | 6.7% |
| Physical & Health Sciences | 40,892 | 4.9% |
| Psychology | 34,641 | 4.1% |
| Social Sciences | 59,495 | 7.1% |
| Engineering | 111,286 | 13.3% |
| Multidisciplinary Studies | 9,724 | 1.2% |
| Science & Technology | 74,750 | 8.9% |
| Business | 189,749 | 22.7% |
| Education | 65,932 | 7.9% |
| Literature & Languages | 28,358 | 3.4% |
| Liberal Arts & History | 30,070 | 3.6% |
| Visual & Performing Arts | 25,149 | 3.0% |
| Communications | 31,697 | 3.8% |
| Arts & Humanities | 40,229 | 4.8% |
| Total | 835,829 | 100.0% |
Transportation & Commute in Area Code 713
Vehicle Availability by Sex in Area Code 713
The most prevalent vehicle ownership categories in Area Code 713 are males with 2 vehicles (376,737, accounting for 43.3%) and females with 2 vehicles (281,590, making up 54.7%).
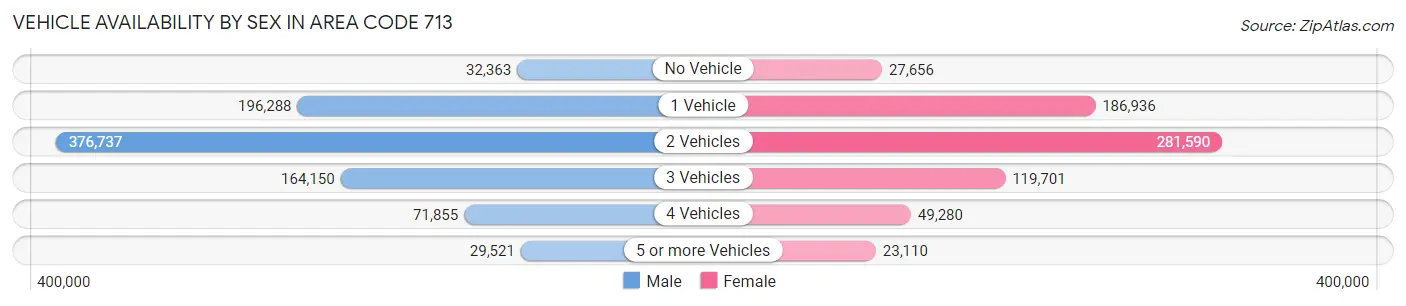
| Vehicles Available | Male | Female |
| No Vehicle | 32,363 (3.7%) | 27,656 (4.0%) |
| 1 Vehicle | 196,288 (22.5%) | 186,936 (27.2%) |
| 2 Vehicles | 376,737 (43.3%) | 281,590 (40.9%) |
| 3 Vehicles | 164,150 (18.9%) | 119,701 (17.4%) |
| 4 Vehicles | 71,855 (8.3%) | 49,280 (7.2%) |
| 5 or more Vehicles | 29,521 (3.4%) | 23,110 (3.4%) |
| Total | 870,914 (100.0%) | 688,273 (100.0%) |
Commute Time in Area Code 713
The most frequently occuring commute durations in Area Code 713 are 30 to 34 minutes (270,361 commuters, 19.2%), 20 to 24 minutes (213,582 commuters, 15.2%), and 15 to 19 minutes (199,085 commuters, 14.2%).

| Commute Time | # Commuters | % Commuters |
| Less than 5 Minutes | 18,487 | 1.3% |
| 5 to 9 Minutes | 84,028 | 6.0% |
| 10 to 14 Minutes | 145,501 | 10.3% |
| 15 to 19 Minutes | 199,085 | 14.2% |
| 20 to 24 Minutes | 213,582 | 15.2% |
| 25 to 29 Minutes | 101,861 | 7.2% |
| 30 to 34 Minutes | 270,361 | 19.2% |
| 35 to 39 Minutes | 54,145 | 3.8% |
| 40 to 44 Minutes | 66,739 | 4.8% |
| 45 to 59 Minutes | 137,145 | 9.8% |
| 60 to 89 Minutes | 88,545 | 6.3% |
| 90 or more Minutes | 25,667 | 1.8% |
Commute Time by Sex in Area Code 713
The most common commute times in Area Code 713 are 30 to 34 minutes (160,197 commuters, 20.2%) for males and 30 to 34 minutes (110,164 commuters, 18.0%) for females.
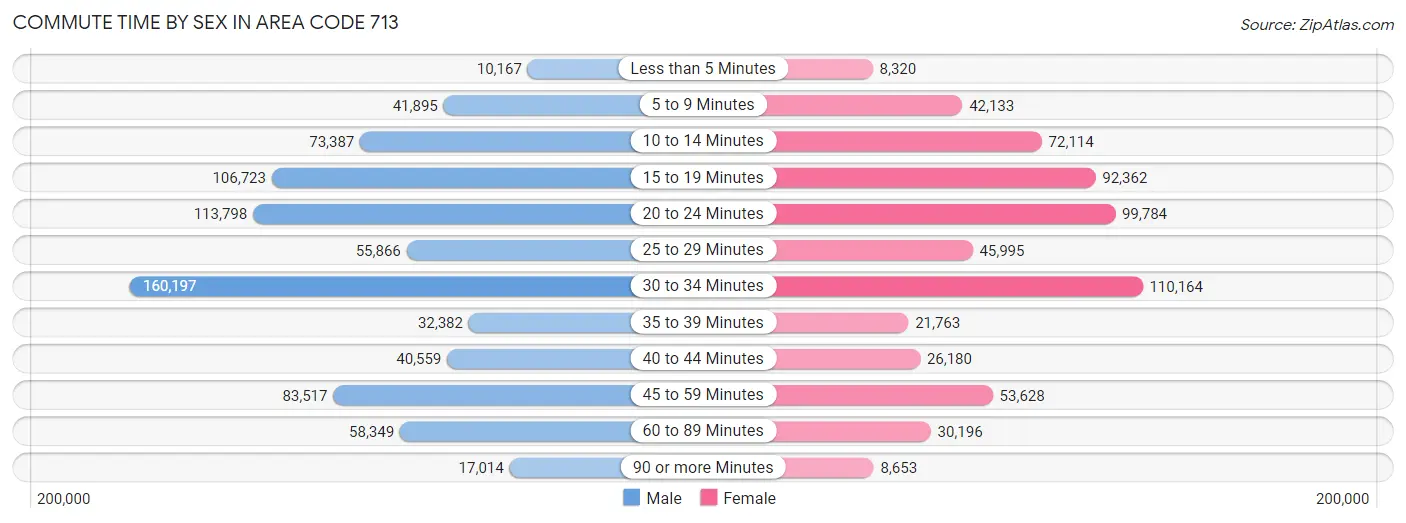
| Commute Time | Male | Female |
| Less than 5 Minutes | 10,167 (1.3%) | 8,320 (1.4%) |
| 5 to 9 Minutes | 41,895 (5.3%) | 42,133 (6.9%) |
| 10 to 14 Minutes | 73,387 (9.2%) | 72,114 (11.8%) |
| 15 to 19 Minutes | 106,723 (13.4%) | 92,362 (15.1%) |
| 20 to 24 Minutes | 113,798 (14.3%) | 99,784 (16.3%) |
| 25 to 29 Minutes | 55,866 (7.0%) | 45,995 (7.5%) |
| 30 to 34 Minutes | 160,197 (20.2%) | 110,164 (18.0%) |
| 35 to 39 Minutes | 32,382 (4.1%) | 21,763 (3.6%) |
| 40 to 44 Minutes | 40,559 (5.1%) | 26,180 (4.3%) |
| 45 to 59 Minutes | 83,517 (10.5%) | 53,628 (8.8%) |
| 60 to 89 Minutes | 58,349 (7.3%) | 30,196 (4.9%) |
| 90 or more Minutes | 17,014 (2.1%) | 8,653 (1.4%) |
Time of Departure to Work by Sex in Area Code 713
The most frequent times of departure to work in Area Code 713 are 7:00 AM to 7:29 AM (120,525, 15.2%) for males and 7:00 AM to 7:29 AM (97,847, 16.0%) for females.
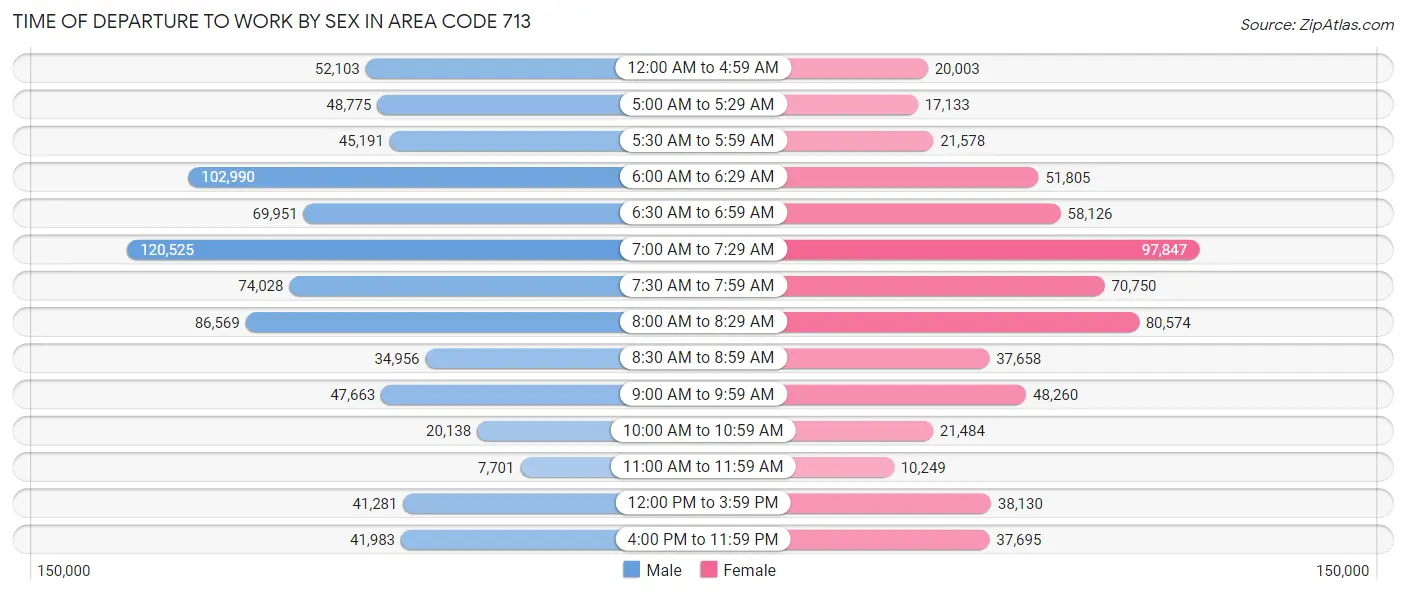
| Time of Departure | Male | Female |
| 12:00 AM to 4:59 AM | 52,103 (6.6%) | 20,003 (3.3%) |
| 5:00 AM to 5:29 AM | 48,775 (6.1%) | 17,133 (2.8%) |
| 5:30 AM to 5:59 AM | 45,191 (5.7%) | 21,578 (3.5%) |
| 6:00 AM to 6:29 AM | 102,990 (13.0%) | 51,805 (8.5%) |
| 6:30 AM to 6:59 AM | 69,951 (8.8%) | 58,126 (9.5%) |
| 7:00 AM to 7:29 AM | 120,525 (15.2%) | 97,847 (16.0%) |
| 7:30 AM to 7:59 AM | 74,028 (9.3%) | 70,750 (11.6%) |
| 8:00 AM to 8:29 AM | 86,569 (10.9%) | 80,574 (13.2%) |
| 8:30 AM to 8:59 AM | 34,956 (4.4%) | 37,658 (6.2%) |
| 9:00 AM to 9:59 AM | 47,663 (6.0%) | 48,260 (7.9%) |
| 10:00 AM to 10:59 AM | 20,138 (2.5%) | 21,484 (3.5%) |
| 11:00 AM to 11:59 AM | 7,701 (1.0%) | 10,249 (1.7%) |
| 12:00 PM to 3:59 PM | 41,281 (5.2%) | 38,130 (6.2%) |
| 4:00 PM to 11:59 PM | 41,983 (5.3%) | 37,695 (6.2%) |
| Total | 793,854 (100.0%) | 611,292 (100.0%) |
Housing Occupancy in Area Code 713
Occupancy by Ownership in Area Code 713
Of the total 1,206,834 dwellings in Area Code 713, owner-occupied units account for 627,535 (52.0%), while renter-occupied units make up 579,299 (48.0%).
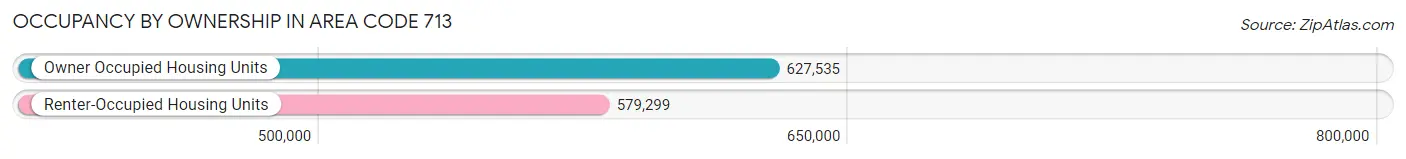
| Occupancy | # Housing Units | % Housing Units |
| Owner Occupied Housing Units | 627,535 | 52.0% |
| Renter-Occupied Housing Units | 579,299 | 48.0% |
| Total Occupied Housing Units | 1,206,834 | 100.0% |
Occupancy by Household Size in Area Code 713
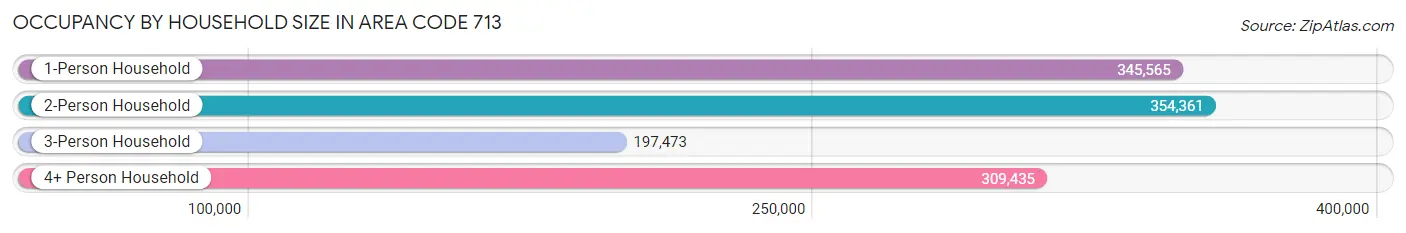
| Household Size | # Housing Units | % Housing Units |
| 1-Person Household | 345,565 | 28.6% |
| 2-Person Household | 354,361 | 29.4% |
| 3-Person Household | 197,473 | 16.4% |
| 4+ Person Household | 309,435 | 25.6% |
| Total Housing Units | 1,206,834 | 100.0% |
Occupancy by Ownership by Household Size in Area Code 713
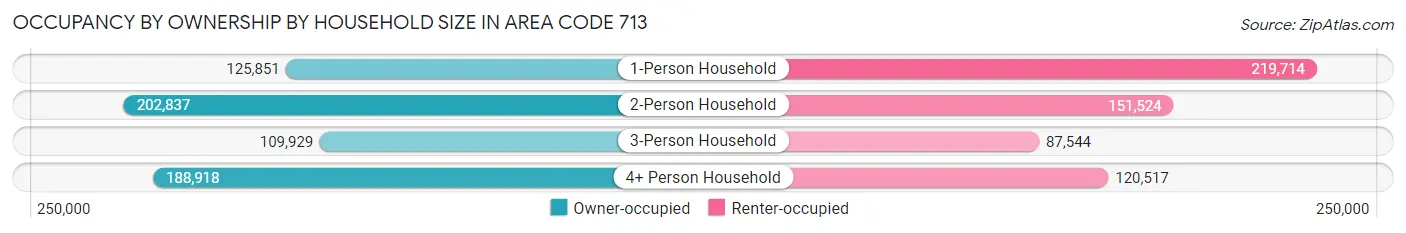
| Household Size | Owner-occupied | Renter-occupied |
| 1-Person Household | 125,851 (36.4%) | 219,714 (63.6%) |
| 2-Person Household | 202,837 (57.2%) | 151,524 (42.8%) |
| 3-Person Household | 109,929 (55.7%) | 87,544 (44.3%) |
| 4+ Person Household | 188,918 (61.1%) | 120,517 (39.0%) |
| Total Housing Units | 627,535 (52.0%) | 579,299 (48.0%) |
Occupancy by Educational Attainment in Area Code 713
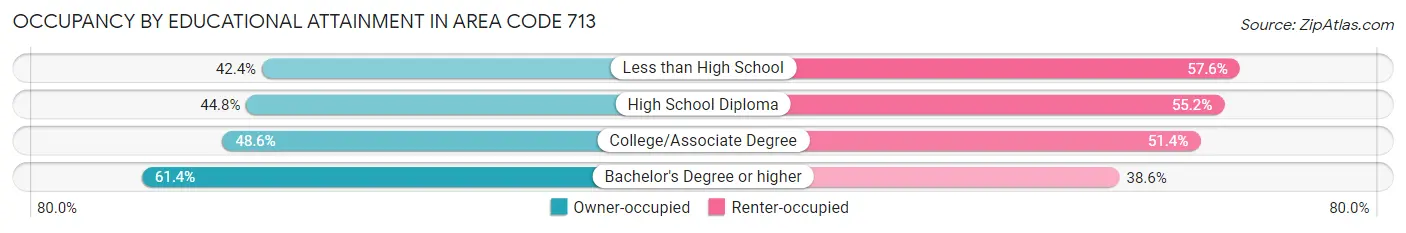
| Household Size | Owner-occupied | Renter-occupied |
| Less than High School | 82,288 (42.4%) | 111,985 (57.6%) |
| High School Diploma | 102,747 (44.8%) | 126,403 (55.2%) |
| College/Associate Degree | 146,680 (48.6%) | 154,933 (51.4%) |
| Bachelor's Degree or higher | 295,820 (61.4%) | 185,978 (38.6%) |
Occupancy by Age of Householder in Area Code 713
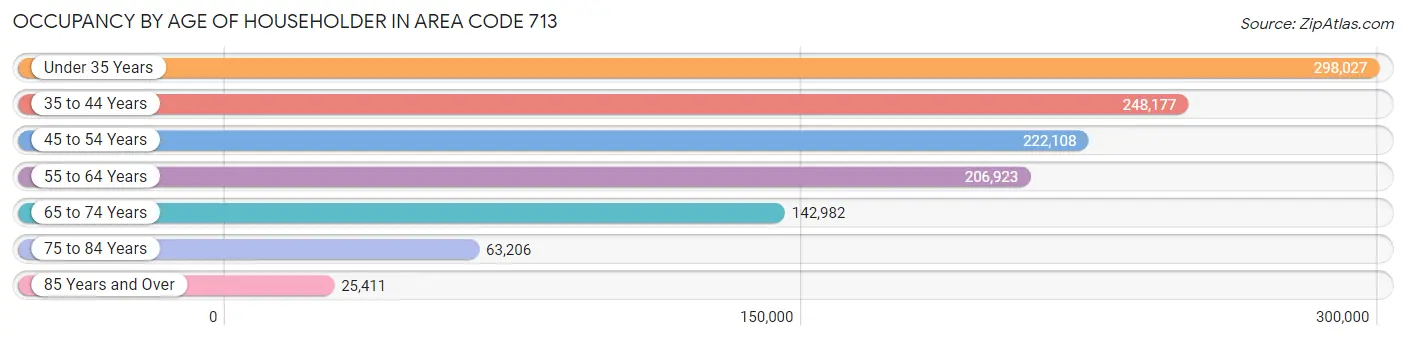
| Age Bracket | # Households | % Households |
| Under 35 Years | 298,027 | 24.7% |
| 35 to 44 Years | 248,177 | 20.6% |
| 45 to 54 Years | 222,108 | 18.4% |
| 55 to 64 Years | 206,923 | 17.2% |
| 65 to 74 Years | 142,982 | 11.8% |
| 75 to 84 Years | 63,206 | 5.2% |
| 85 Years and Over | 25,411 | 2.1% |
| Total | 1,206,834 | 100.0% |
Housing Finances in Area Code 713
Median Income by Occupancy in Area Code 713
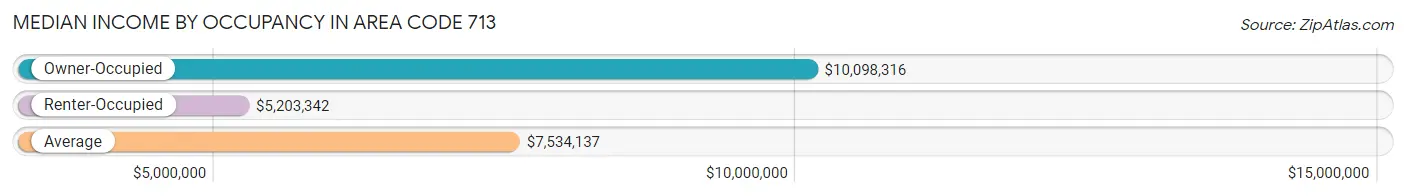
| Occupancy Type | # Households | Median Income |
| Owner-Occupied | 627,535 (52.0%) | $10,098,316 |
| Renter-Occupied | 579,299 (48.0%) | $5,203,342 |
| Average | 1,206,834 (100.0%) | $7,534,137 |
Occupancy by Householder Income Bracket in Area Code 713
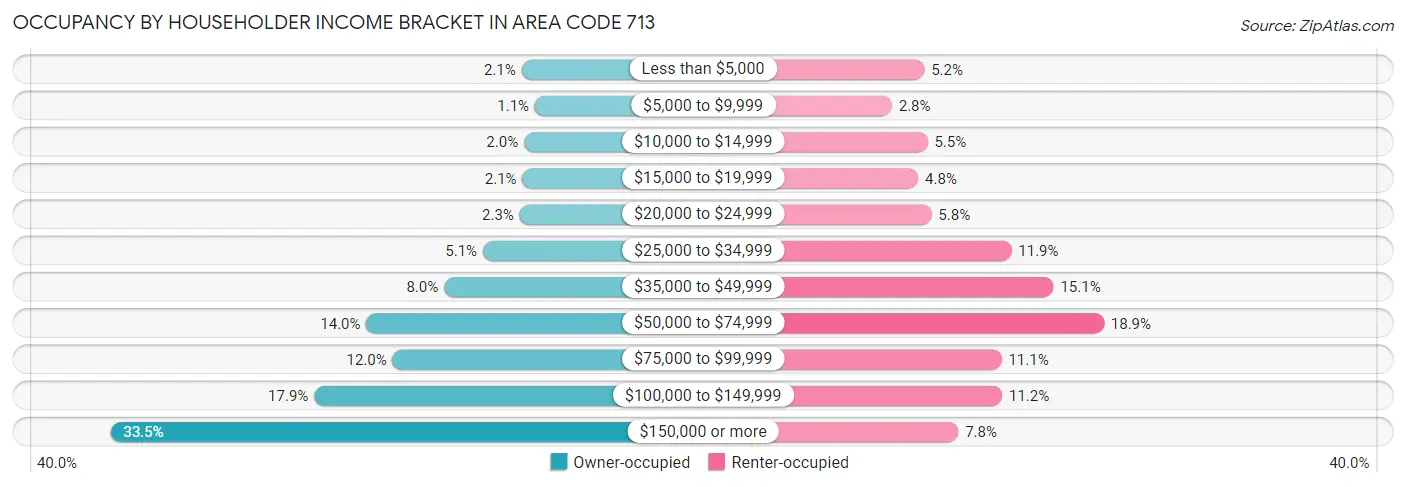
| Income Bracket | Owner-occupied | Renter-occupied |
| Less than $5,000 | 13,355 (2.1%) | 30,297 (5.2%) |
| $5,000 to $9,999 | 7,032 (1.1%) | 16,011 (2.8%) |
| $10,000 to $14,999 | 12,237 (1.9%) | 31,768 (5.5%) |
| $15,000 to $19,999 | 12,998 (2.1%) | 27,615 (4.8%) |
| $20,000 to $24,999 | 14,281 (2.3%) | 33,498 (5.8%) |
| $25,000 to $34,999 | 31,860 (5.1%) | 68,786 (11.9%) |
| $35,000 to $49,999 | 50,461 (8.0%) | 87,351 (15.1%) |
| $50,000 to $74,999 | 87,626 (14.0%) | 109,621 (18.9%) |
| $75,000 to $99,999 | 75,024 (12.0%) | 64,401 (11.1%) |
| $100,000 to $149,999 | 112,595 (17.9%) | 64,644 (11.2%) |
| $150,000 or more | 210,066 (33.5%) | 45,307 (7.8%) |
| Total | 627,535 (100.0%) | 579,299 (100.0%) |
Monthly Housing Cost Tiers in Area Code 713
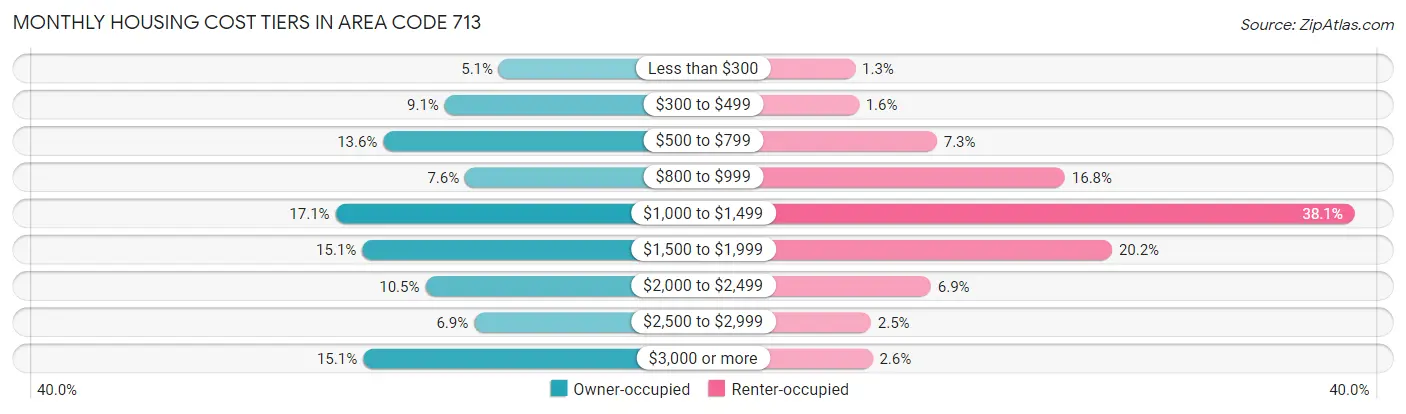
| Monthly Cost | Owner-occupied | Renter-occupied |
| Less than $300 | 31,803 (5.1%) | 7,551 (1.3%) |
| $300 to $499 | 56,854 (9.1%) | 9,119 (1.6%) |
| $500 to $799 | 85,287 (13.6%) | 42,424 (7.3%) |
| $800 to $999 | 47,423 (7.6%) | 97,026 (16.8%) |
| $1,000 to $1,499 | 107,343 (17.1%) | 220,651 (38.1%) |
| $1,500 to $1,999 | 95,029 (15.1%) | 117,129 (20.2%) |
| $2,000 to $2,499 | 65,853 (10.5%) | 39,858 (6.9%) |
| $2,500 to $2,999 | 43,320 (6.9%) | 14,222 (2.5%) |
| $3,000 or more | 94,623 (15.1%) | 14,929 (2.6%) |
| Total | 627,535 (100.0%) | 579,299 (100.0%) |
Physical Housing Characteristics in Area Code 713
Housing Structures in Area Code 713
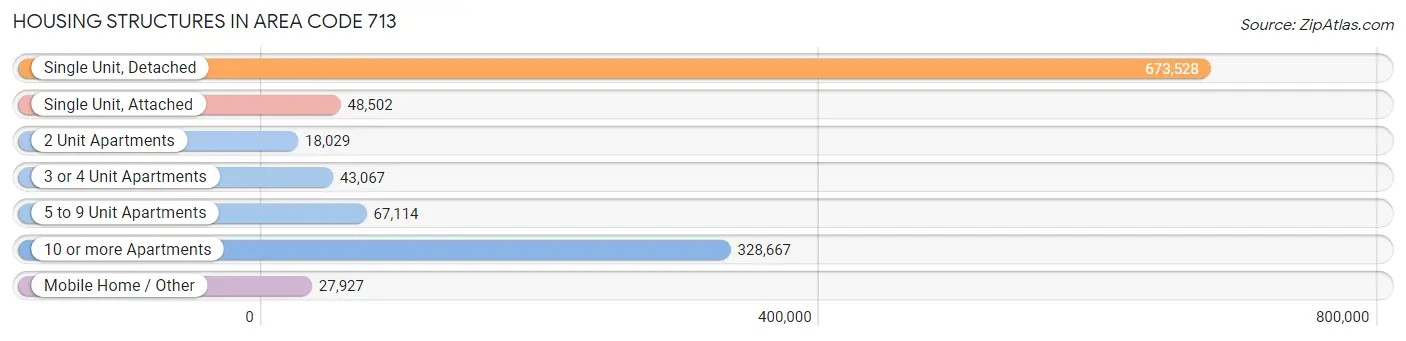
| Structure Type | # Housing Units | % Housing Units |
| Single Unit, Detached | 673,528 | 55.8% |
| Single Unit, Attached | 48,502 | 4.0% |
| 2 Unit Apartments | 18,029 | 1.5% |
| 3 or 4 Unit Apartments | 43,067 | 3.6% |
| 5 to 9 Unit Apartments | 67,114 | 5.6% |
| 10 or more Apartments | 328,667 | 27.2% |
| Mobile Home / Other | 27,927 | 2.3% |
| Total | 1,206,834 | 100.0% |
Housing Structures by Occupancy in Area Code 713
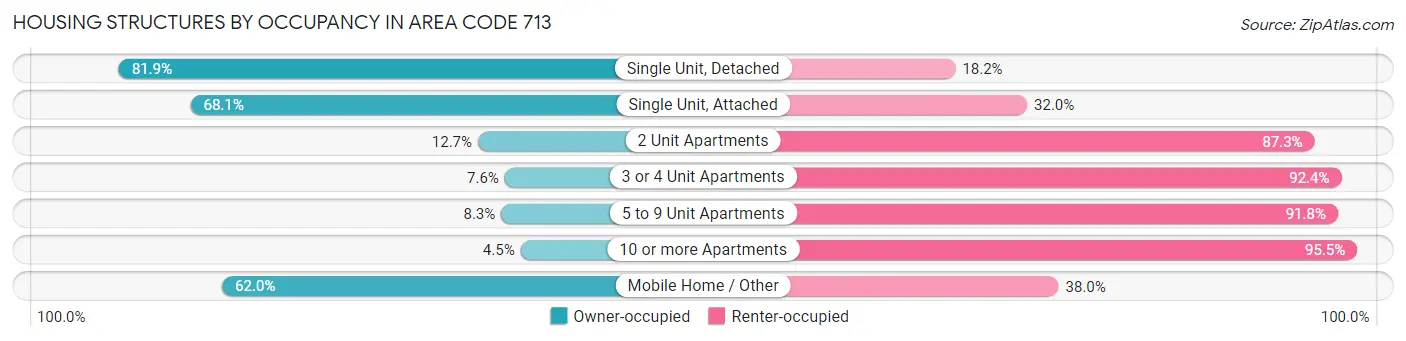
| Structure Type | Owner-occupied | Renter-occupied |
| Single Unit, Detached | 551,275 (81.9%) | 122,253 (18.1%) |
| Single Unit, Attached | 33,007 (68.0%) | 15,495 (32.0%) |
| 2 Unit Apartments | 2,295 (12.7%) | 15,734 (87.3%) |
| 3 or 4 Unit Apartments | 3,254 (7.6%) | 39,813 (92.4%) |
| 5 to 9 Unit Apartments | 5,535 (8.3%) | 61,579 (91.7%) |
| 10 or more Apartments | 14,857 (4.5%) | 313,810 (95.5%) |
| Mobile Home / Other | 17,312 (62.0%) | 10,615 (38.0%) |
| Total | 627,535 (52.0%) | 579,299 (48.0%) |
Housing Structures by Number of Rooms in Area Code 713
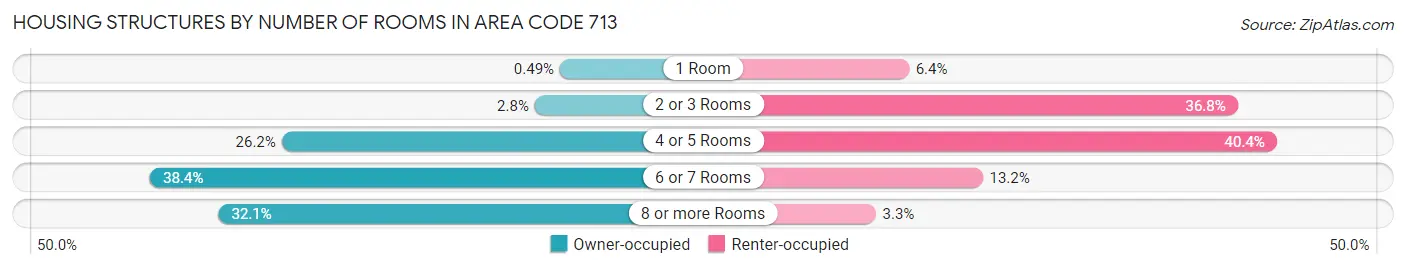
| Number of Rooms | Owner-occupied | Renter-occupied |
| 1 Room | 3,075 (0.5%) | 36,832 (6.4%) |
| 2 or 3 Rooms | 17,691 (2.8%) | 213,006 (36.8%) |
| 4 or 5 Rooms | 164,619 (26.2%) | 233,952 (40.4%) |
| 6 or 7 Rooms | 240,905 (38.4%) | 76,393 (13.2%) |
| 8 or more Rooms | 201,245 (32.1%) | 19,116 (3.3%) |
| Total | 627,535 (100.0%) | 579,299 (100.0%) |
Housing Structure by Heating Type in Area Code 713
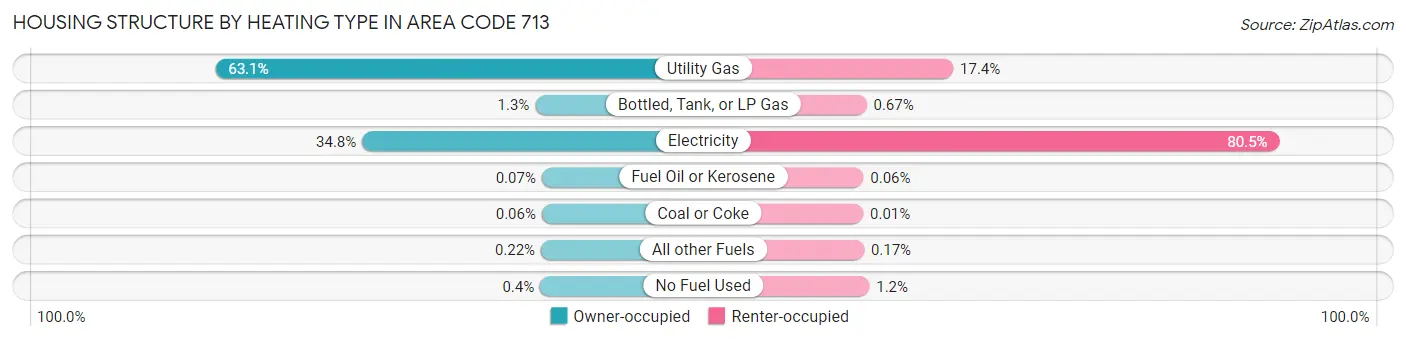
| Heating Type | Owner-occupied | Renter-occupied |
| Utility Gas | 396,241 (63.1%) | 100,846 (17.4%) |
| Bottled, Tank, or LP Gas | 8,328 (1.3%) | 3,862 (0.7%) |
| Electricity | 218,261 (34.8%) | 466,113 (80.5%) |
| Fuel Oil or Kerosene | 411 (0.1%) | 374 (0.1%) |
| Coal or Coke | 405 (0.1%) | 76 (0.0%) |
| All other Fuels | 1,382 (0.2%) | 993 (0.2%) |
| No Fuel Used | 2,507 (0.4%) | 7,035 (1.2%) |
| Total | 627,535 (100.0%) | 579,299 (100.0%) |
Household Vehicle Usage in Area Code 713
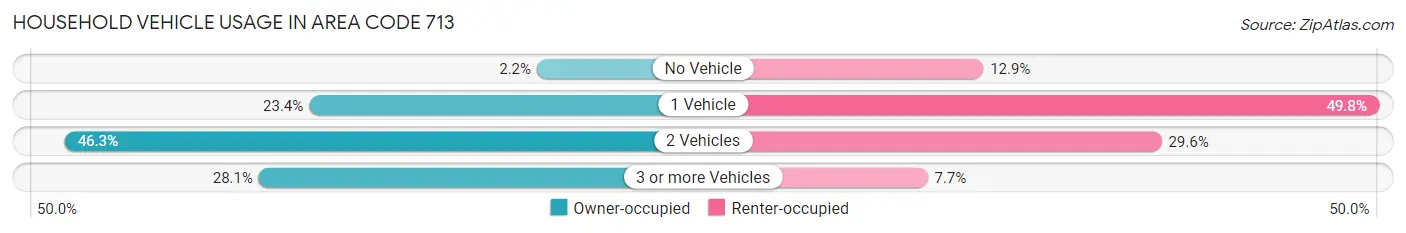
| Vehicles per Household | Owner-occupied | Renter-occupied |
| No Vehicle | 13,657 (2.2%) | 74,801 (12.9%) |
| 1 Vehicle | 147,064 (23.4%) | 288,638 (49.8%) |
| 2 Vehicles | 290,212 (46.3%) | 171,197 (29.5%) |
| 3 or more Vehicles | 176,602 (28.1%) | 44,663 (7.7%) |
| Total | 627,535 (100.0%) | 579,299 (100.0%) |
Real Estate & Mortgages in Area Code 713
Real Estate and Mortgage Overview in Area Code 713
| Characteristic | Without Mortgage | With Mortgage |
| Housing Units | 272,344 | 355,191 |
| Median Property Value | $26,308,800 | $31,326,700 |
| Median Household Income | $7,919,141 | $146,526 |
| Monthly Housing Costs | $72,162 | $86,517 |
| Real Estate Taxes | $362,275 | $14,926 |
Property Value by Mortgage Status in Area Code 713
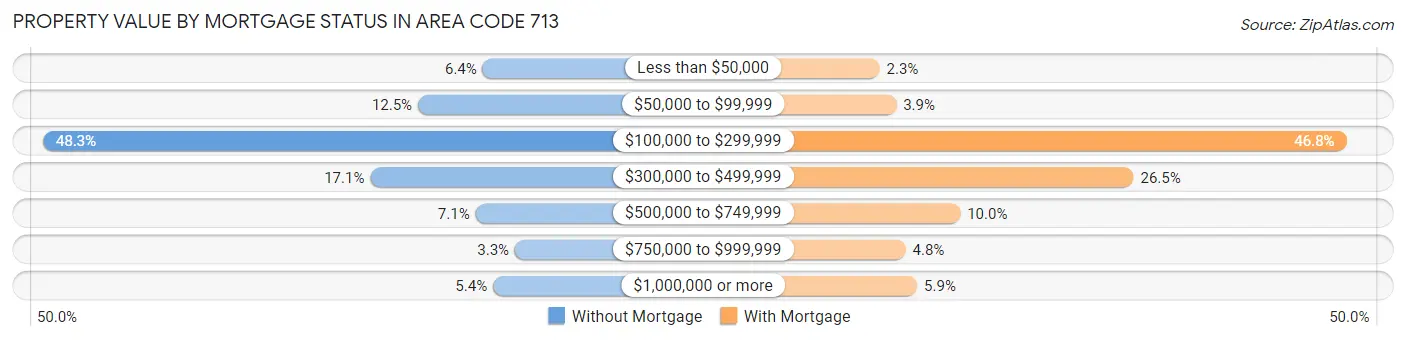
| Property Value | Without Mortgage | With Mortgage |
| Less than $50,000 | 17,362 (6.4%) | 8,145 (2.3%) |
| $50,000 to $99,999 | 34,142 (12.5%) | 13,733 (3.9%) |
| $100,000 to $299,999 | 131,421 (48.3%) | 166,047 (46.8%) |
| $300,000 to $499,999 | 46,507 (17.1%) | 94,037 (26.5%) |
| $500,000 to $749,999 | 19,239 (7.1%) | 35,426 (10.0%) |
| $750,000 to $999,999 | 8,987 (3.3%) | 16,949 (4.8%) |
| $1,000,000 or more | 14,686 (5.4%) | 20,854 (5.9%) |
| Total | 272,344 (100.0%) | 355,191 (100.0%) |
Household Income by Mortgage Status in Area Code 713
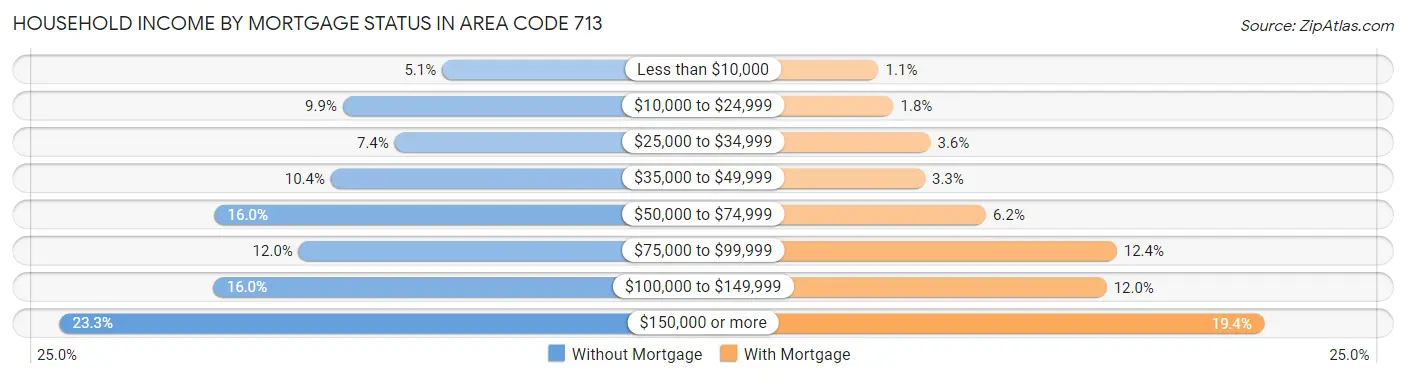
| Household Income | Without Mortgage | With Mortgage |
| Less than $10,000 | 13,950 (5.1%) | 3,891 (1.1%) |
| $10,000 to $24,999 | 26,821 (9.9%) | 6,437 (1.8%) |
| $25,000 to $34,999 | 20,112 (7.4%) | 12,695 (3.6%) |
| $35,000 to $49,999 | 28,376 (10.4%) | 11,748 (3.3%) |
| $50,000 to $74,999 | 43,447 (16.0%) | 22,085 (6.2%) |
| $75,000 to $99,999 | 32,550 (11.9%) | 44,179 (12.4%) |
| $100,000 to $149,999 | 43,548 (16.0%) | 42,474 (12.0%) |
| $150,000 or more | 63,540 (23.3%) | 69,047 (19.4%) |
| Total | 272,344 (100.0%) | 355,191 (100.0%) |
Property Value to Household Income Ratio in Area Code 713
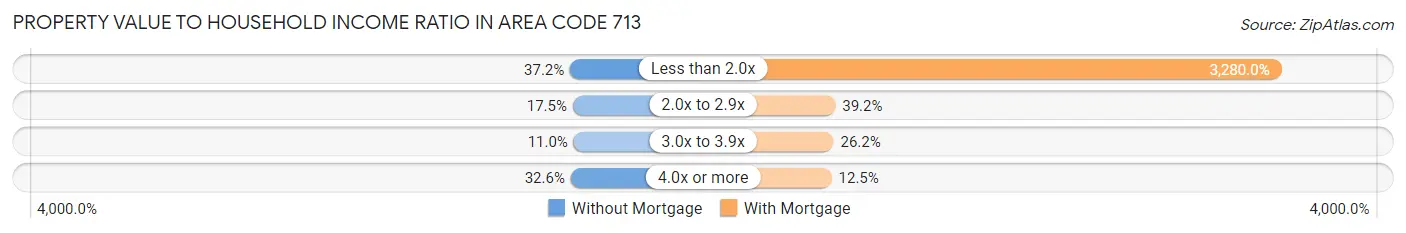
| Value-to-Income Ratio | Without Mortgage | With Mortgage |
| Less than 2.0x | 101,373 (37.2%) | 11,650,206 (3,280.0%) |
| 2.0x to 2.9x | 47,560 (17.5%) | 139,157 (39.2%) |
| 3.0x to 3.9x | 30,061 (11.0%) | 92,947 (26.2%) |
| 4.0x or more | 88,735 (32.6%) | 44,268 (12.5%) |
| Total | 272,344 (100.0%) | 355,191 (100.0%) |
Real Estate Taxes by Mortgage Status in Area Code 713
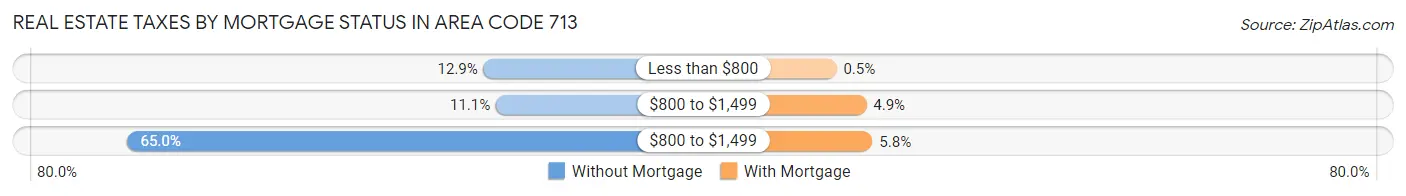
| Property Taxes | Without Mortgage | With Mortgage |
| Less than $800 | 35,204 (12.9%) | 1,762 (0.5%) |
| $800 to $1,499 | 30,269 (11.1%) | 17,282 (4.9%) |
| $800 to $1,499 | 176,876 (64.9%) | 20,441 (5.8%) |
| Total | 272,344 (100.0%) | 355,191 (100.0%) |
Health & Disability in Area Code 713
Health Insurance Coverage by Age in Area Code 713
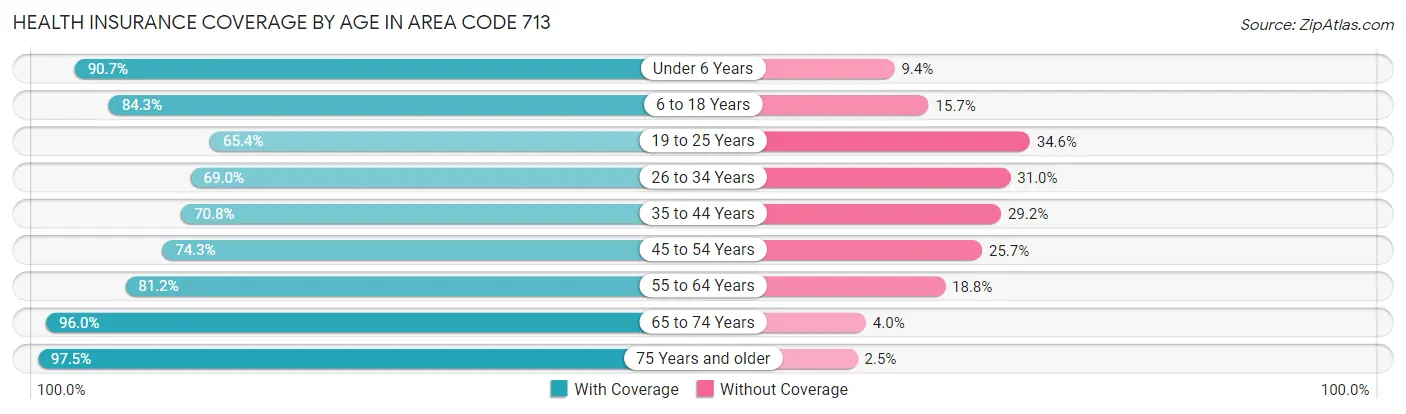
| Age Bracket | With Coverage | Without Coverage |
| Under 6 Years | 244,459 (90.6%) | 25,208 (9.3%) |
| 6 to 18 Years | 500,288 (84.3%) | 93,308 (15.7%) |
| 19 to 25 Years | 208,855 (65.4%) | 110,507 (34.6%) |
| 26 to 34 Years | 328,305 (69.0%) | 147,272 (31.0%) |
| 35 to 44 Years | 325,531 (70.8%) | 134,364 (29.2%) |
| 45 to 54 Years | 298,260 (74.3%) | 103,128 (25.7%) |
| 55 to 64 Years | 288,742 (81.2%) | 66,837 (18.8%) |
| 65 to 74 Years | 222,799 (96.0%) | 9,344 (4.0%) |
| 75 Years and older | 135,987 (97.5%) | 3,452 (2.5%) |
| Total | 2,553,226 (78.6%) | 693,420 (21.4%) |
Health Insurance Coverage by Citizenship Status in Area Code 713
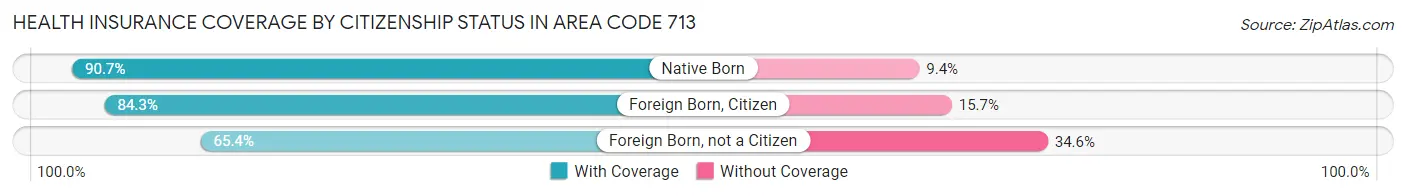
| Citizenship Status | With Coverage | Without Coverage |
| Native Born | 244,459 (90.6%) | 25,208 (9.3%) |
| Foreign Born, Citizen | 500,288 (84.3%) | 93,308 (15.7%) |
| Foreign Born, not a Citizen | 208,855 (65.4%) | 110,507 (34.6%) |
Health Insurance Coverage by Household Income in Area Code 713
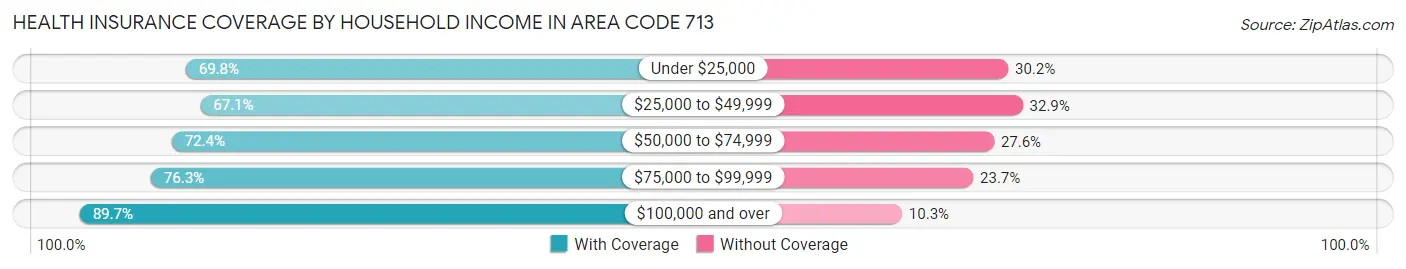
| Household Income | With Coverage | Without Coverage |
| Under $25,000 | 284,777 (69.8%) | 123,284 (30.2%) |
| $25,000 to $49,999 | 397,153 (67.1%) | 195,089 (32.9%) |
| $50,000 to $74,999 | 371,246 (72.4%) | 141,290 (27.6%) |
| $75,000 to $99,999 | 303,886 (76.3%) | 94,231 (23.7%) |
| $100,000 and over | 1,178,871 (89.7%) | 135,823 (10.3%) |
Public vs Private Health Insurance Coverage by Age in Area Code 713
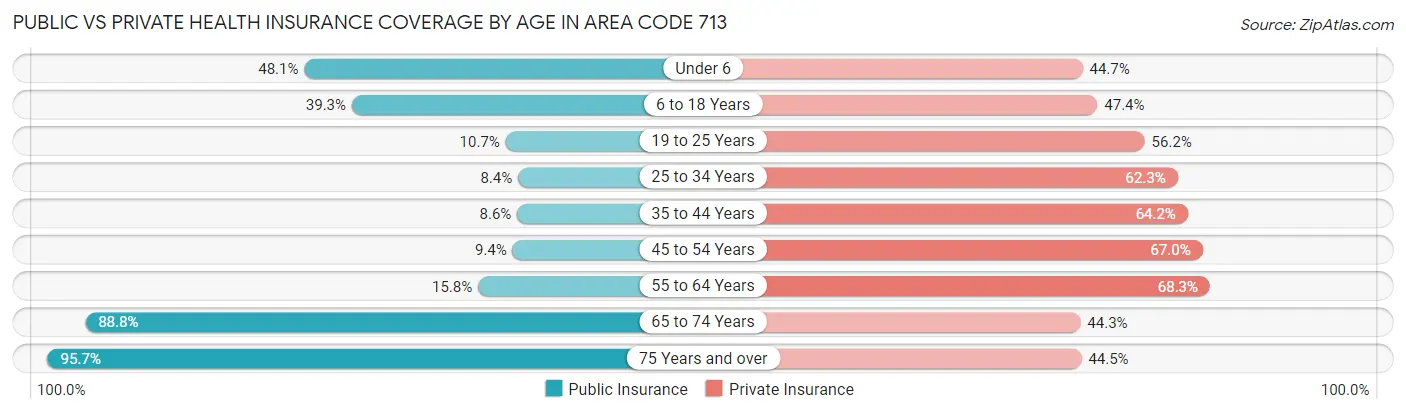
| Age Bracket | Public Insurance | Private Insurance |
| Under 6 | 129,689 (48.1%) | 120,498 (44.7%) |
| 6 to 18 Years | 233,071 (39.3%) | 281,618 (47.4%) |
| 19 to 25 Years | 34,189 (10.7%) | 179,546 (56.2%) |
| 25 to 34 Years | 39,952 (8.4%) | 296,446 (62.3%) |
| 35 to 44 Years | 39,395 (8.6%) | 295,270 (64.2%) |
| 45 to 54 Years | 37,827 (9.4%) | 268,722 (66.9%) |
| 55 to 64 Years | 56,271 (15.8%) | 242,891 (68.3%) |
| 65 to 74 Years | 206,027 (88.7%) | 102,822 (44.3%) |
| 75 Years and over | 133,496 (95.7%) | 62,023 (44.5%) |
| Total | 909,917 (28.0%) | 1,849,836 (57.0%) |
Disability Status by Sex by Age in Area Code 713
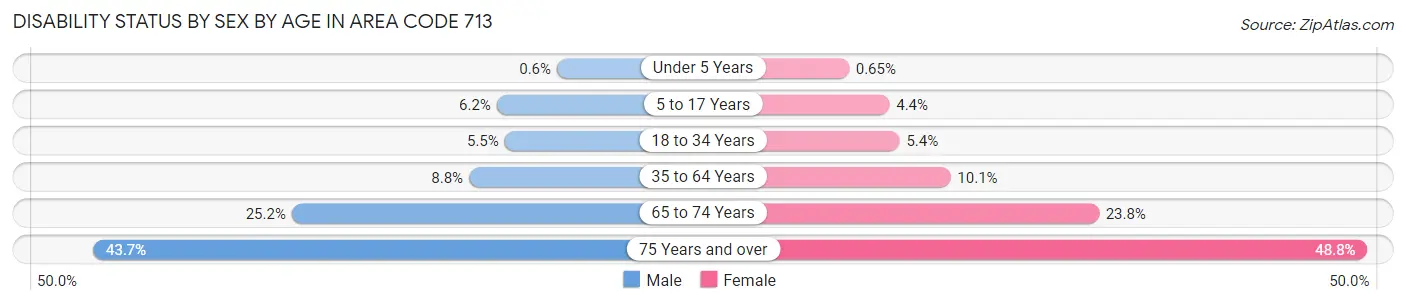
| Age Bracket | Male | Female |
| Under 5 Years | 681 (0.6%) | 725 (0.6%) |
| 5 to 17 Years | 18,592 (6.2%) | 12,977 (4.4%) |
| 18 to 34 Years | 22,987 (5.4%) | 22,327 (5.3%) |
| 35 to 64 Years | 53,545 (8.8%) | 60,989 (10.1%) |
| 65 to 74 Years | 27,602 (25.2%) | 29,238 (23.8%) |
| 75 Years and over | 25,293 (43.7%) | 39,760 (48.8%) |
Disability Class by Sex by Age in Area Code 713
Disability Class: Hearing Difficulty
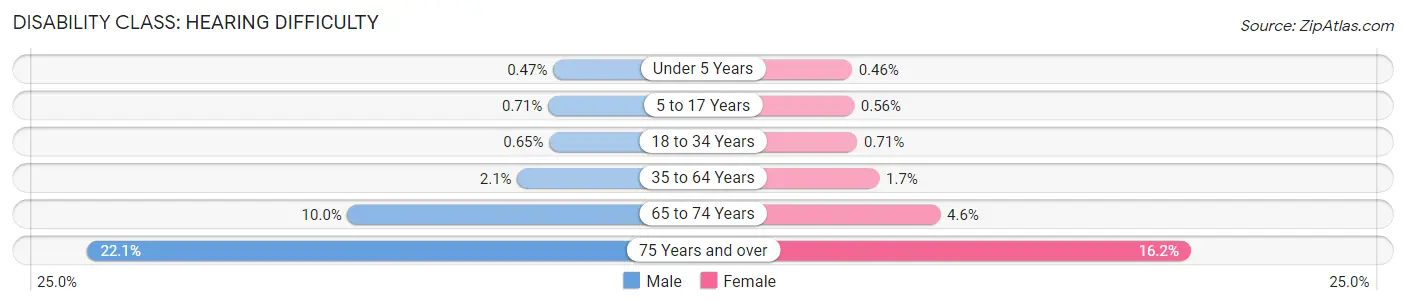
| Age Bracket | Male | Female |
| Under 5 Years | 537 (0.5%) | 507 (0.5%) |
| 5 to 17 Years | 2,125 (0.7%) | 1,655 (0.6%) |
| 18 to 34 Years | 2,753 (0.6%) | 2,965 (0.7%) |
| 35 to 64 Years | 13,040 (2.1%) | 10,471 (1.7%) |
| 65 to 74 Years | 10,961 (10.0%) | 5,591 (4.6%) |
| 75 Years and over | 12,790 (22.1%) | 13,196 (16.2%) |
Disability Class: Vision Difficulty
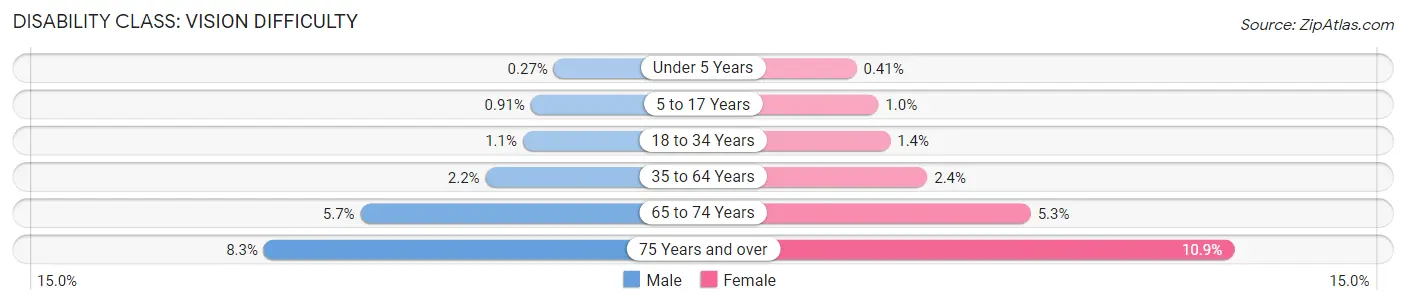
| Age Bracket | Male | Female |
| Under 5 Years | 304 (0.3%) | 461 (0.4%) |
| 5 to 17 Years | 2,730 (0.9%) | 3,011 (1.0%) |
| 18 to 34 Years | 4,754 (1.1%) | 5,634 (1.3%) |
| 35 to 64 Years | 13,249 (2.2%) | 14,407 (2.4%) |
| 65 to 74 Years | 6,186 (5.7%) | 6,451 (5.3%) |
| 75 Years and over | 4,831 (8.3%) | 8,900 (10.9%) |
Disability Class: Cognitive Difficulty
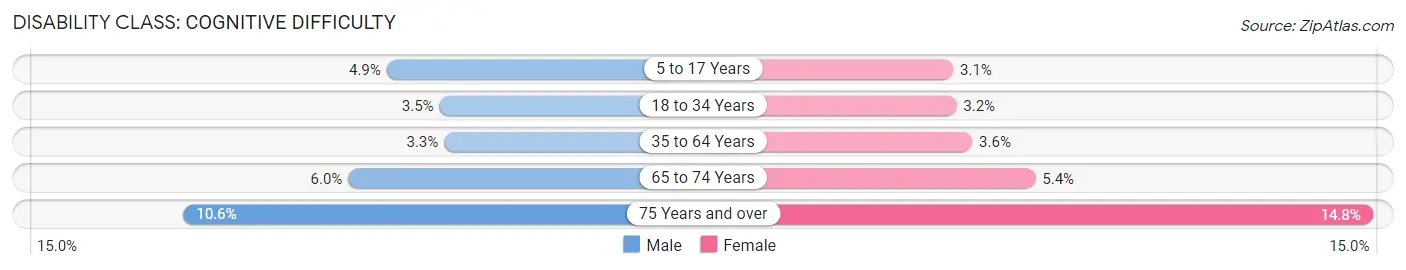
| Age Bracket | Male | Female |
| 5 to 17 Years | 14,776 (4.9%) | 9,132 (3.1%) |
| 18 to 34 Years | 14,560 (3.5%) | 13,312 (3.2%) |
| 35 to 64 Years | 20,293 (3.3%) | 21,984 (3.6%) |
| 65 to 74 Years | 6,556 (6.0%) | 6,611 (5.4%) |
| 75 Years and over | 6,130 (10.6%) | 12,048 (14.8%) |
Disability Class: Ambulatory Difficulty
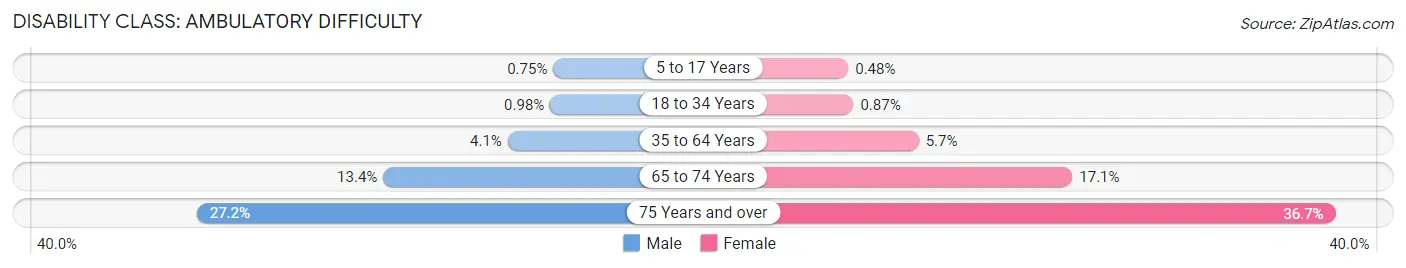
| Age Bracket | Male | Female |
| 5 to 17 Years | 2,240 (0.7%) | 1,420 (0.5%) |
| 18 to 34 Years | 4,132 (1.0%) | 3,649 (0.9%) |
| 35 to 64 Years | 25,282 (4.1%) | 34,552 (5.7%) |
| 65 to 74 Years | 14,656 (13.4%) | 20,994 (17.1%) |
| 75 Years and over | 15,763 (27.2%) | 29,869 (36.6%) |
Disability Class: Self-Care Difficulty
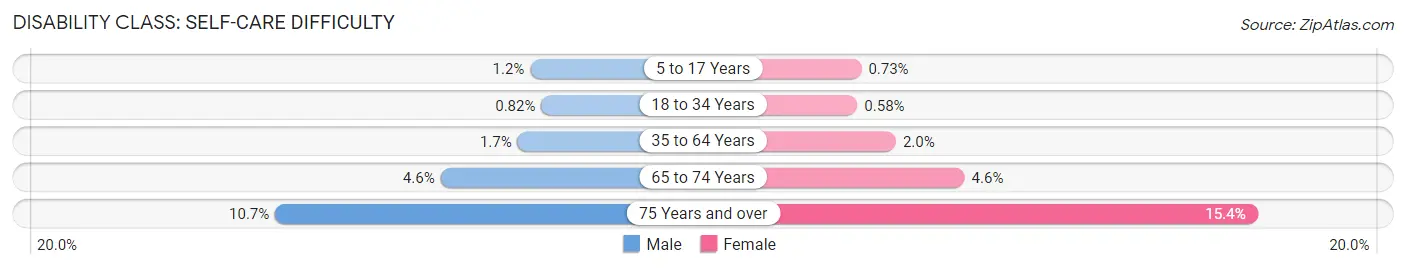
| Age Bracket | Male | Female |
| 5 to 17 Years | 3,687 (1.2%) | 2,152 (0.7%) |
| 18 to 34 Years | 3,455 (0.8%) | 2,413 (0.6%) |
| 35 to 64 Years | 10,419 (1.7%) | 12,193 (2.0%) |
| 65 to 74 Years | 4,996 (4.6%) | 5,589 (4.6%) |
| 75 Years and over | 6,200 (10.7%) | 12,573 (15.4%) |
Technology Access in Area Code 713
Computing Device Access in Area Code 713
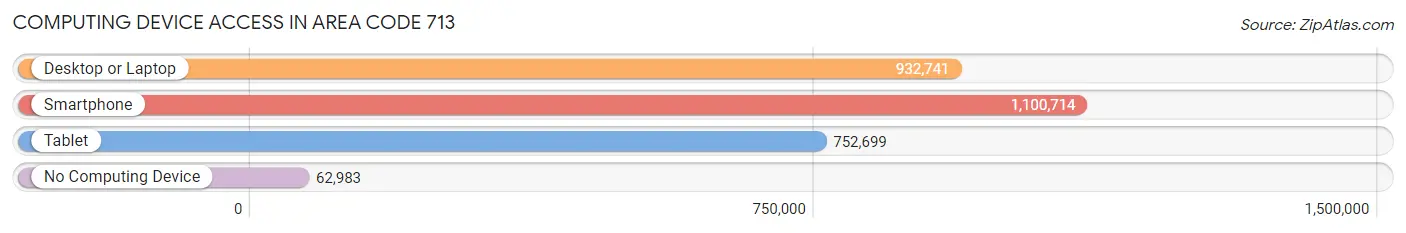
| Device Type | # Households | % Households |
| Desktop or Laptop | 932,741 | 77.3% |
| Smartphone | 1,100,714 | 91.2% |
| Tablet | 752,699 | 62.4% |
| No Computing Device | 62,983 | 5.2% |
| Total | 1,206,834 | 100.0% |
Internet Access in Area Code 713
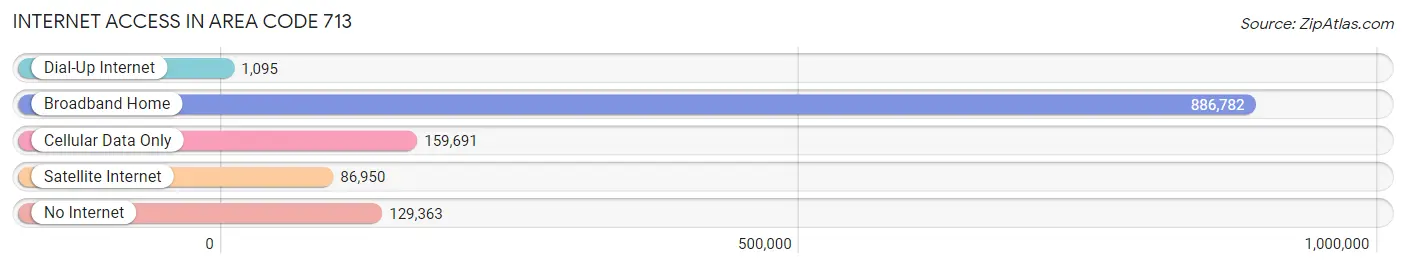
| Internet Type | # Households | % Households |
| Dial-Up Internet | 1,095 | 0.1% |
| Broadband Home | 886,782 | 73.5% |
| Cellular Data Only | 159,691 | 13.2% |
| Satellite Internet | 86,950 | 7.2% |
| No Internet | 129,363 | 10.7% |
| Total | 1,206,834 | 100.0% |
Area Code 713 Summary
Geography
Area code 713 is located in the state of Texas and covers the city of Houston and its surrounding areas. It is bordered by area codes 281, 832, and 409.
Social
Area code 713 is home to a diverse population of people from all walks of life. The city of Houston is known for its vibrant culture and is home to a variety of ethnicities, religions, and lifestyles.
Economics
Area code 713 is home to a thriving economy. The city of Houston is a major hub for the oil and gas industry, as well as a major center for healthcare, finance, and technology.
Demographics
Area code 713 is home to a population of over 2.3 million people. The population is diverse, with a majority of the population being African American, Hispanic, and Asian. The median household income is $50,000, and the median age is 33.
Common Questions
What is Per Capita Income in Area Code 713?
Per Capita income in Area Code 713 is $44,056.
What is the Median Family Income in Area Code 713?
Median Family Income in Area Code 713 is $94,609.
What is the Median Household income in Area Code 713?
Median Household Income in Area Code 713 is $77,672.
What is Income or Wage Gap in Area Code 713?
Income or Wage Gap in Area Code 713 is 29.9%.
Women in Area Code 713 earn 70.1 cents for every dollar earned by a man.
What is Family Income Deficit in Area Code 713?
Family Income Deficit in Area Code 713 is $11,486.
Families that are below poverty line in Area Code 713 earn $11,486 less on average than the poverty threshold level.
What is Inequality or Gini Index in Area Code 713?
Inequality or Gini Index in Area Code 713 is 44.68.
What is the Total Population of Area Code 713?
Total Population of Area Code 713 is 3,267,155.
What is the Total Male Population of Area Code 713?
Total Male Population of Area Code 713 is 1,628,776.
What is the Total Female Population of Area Code 713?
Total Female Population of Area Code 713 is 1,638,379.
What is the Ratio of Males per 100 Females in Area Code 713?
There are 99.41 Males per 100 Females in Area Code 713.
What is the Ratio of Females per 100 Males in Area Code 713?
There are 100.59 Females per 100 Males in Area Code 713.
What is the Median Population Age in Area Code 713?
Median Population Age in Area Code 713 is 35.1 Years.
What is the Average Family Size in Area Code 713
Average Family Size in Area Code 713 is 3.3 People.
What is the Average Household Size in Area Code 713
Average Household Size in Area Code 713 is 2.7 People.
How Large is the Labor Force in Area Code 713?
There are 1,670,617 People in the Labor Forcein in Area Code 713.
What is the Percentage of People in the Labor Force in Area Code 713?
65.7% of People are in the Labor Force in Area Code 713.
What is the Unemployment Rate in Area Code 713?
Unemployment Rate in Area Code 713 is 6.7%.