Bexar County, TX Map & Demographics
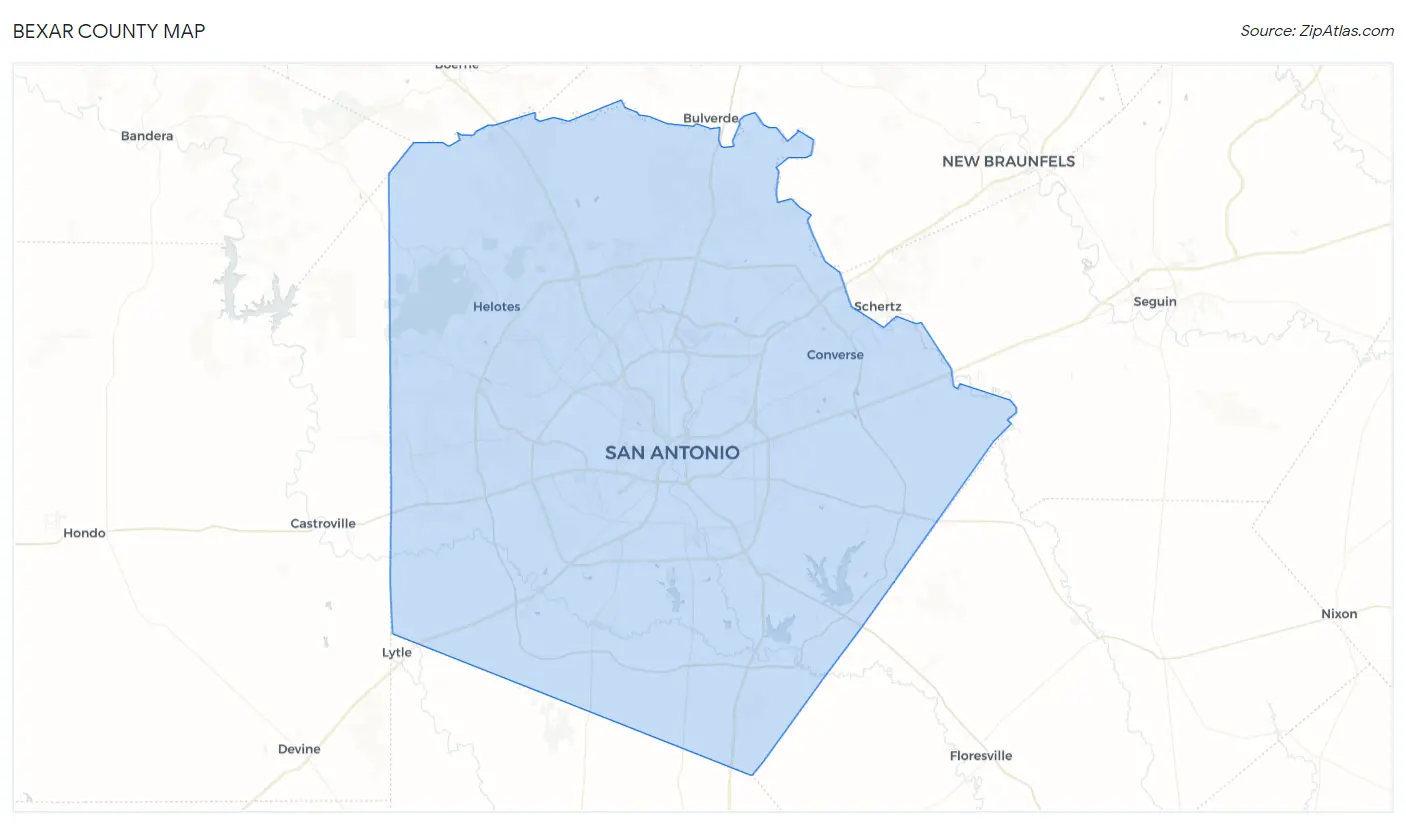
Bexar County Map
Bexar County Overview
$33,963
PER CAPITA INCOME
$80,748
AVG FAMILY INCOME
$67,275
AVG HOUSEHOLD INCOME
21.4%
WAGE / INCOME GAP [ % ]
78.6¢/ $1
WAGE / INCOME GAP [ $ ]
$11,430
FAMILY INCOME DEFICIT
0.46
INEQUALITY / GINI INDEX
2,014,059
TOTAL POPULATION
1,001,527
MALE POPULATION
1,012,532
FEMALE POPULATION
98.91
MALES / 100 FEMALES
101.10
FEMALES / 100 MALES
34.2
MEDIAN AGE
3.4
AVG FAMILY SIZE
2.7
AVG HOUSEHOLD SIZE
1,036,860
LABOR FORCE [ PEOPLE ]
66.2%
PERCENT IN LABOR FORCE
5.5%
UNEMPLOYMENT RATE
Income in Bexar County
Income Overview in Bexar County
Per Capita Income in Bexar County is $33,963, while median incomes of families and households are $80,748 and $67,275 respectively.
| Characteristic | Number | Measure |
| Per Capita Income | 2,014,059 | $33,963 |
| Median Family Income | 475,996 | $80,748 |
| Mean Family Income | 475,996 | $105,908 |
| Median Household Income | 730,119 | $67,275 |
| Mean Household Income | 730,119 | $90,894 |
| Income Deficit | 475,996 | $11,430 |
| Wage / Income Gap (%) | 2,014,059 | 21.43% |
| Wage / Income Gap ($) | 2,014,059 | 78.57¢ per $1 |
| Gini / Inequality Index | 2,014,059 | 0.46 |
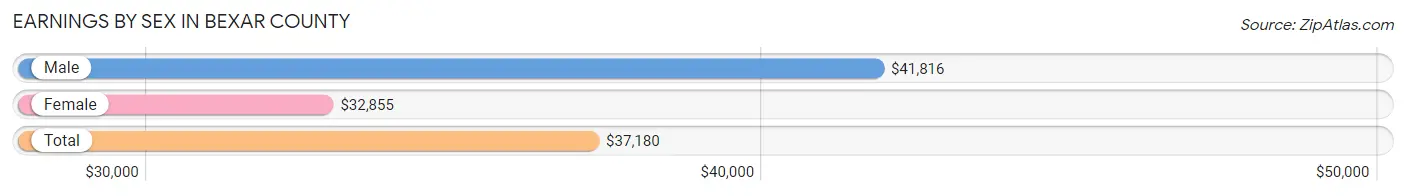
Earnings by Sex in Bexar County
Average Earnings in Bexar County are $37,180, $41,816 for men and $32,855 for women, a difference of 21.4%.
| Sex | Number | Average Earnings |
| Male | 572,147 (53.5%) | $41,816 |
| Female | 497,004 (46.5%) | $32,855 |
| Total | 1,069,151 (100.0%) | $37,180 |
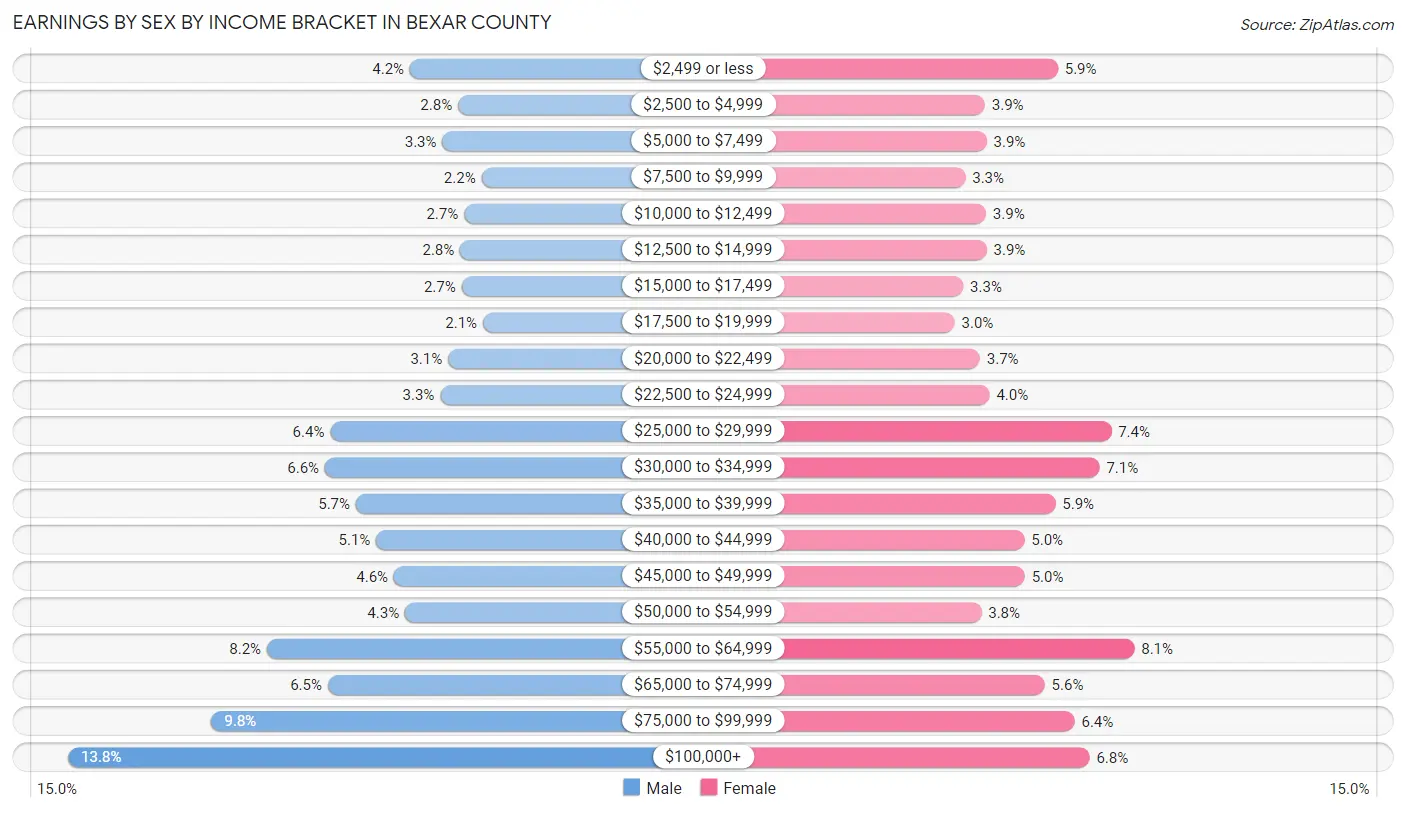
Earnings by Sex by Income Bracket in Bexar County
The most common earnings brackets in Bexar County are $100,000+ for men (78,854 | 13.8%) and $55,000 to $64,999 for women (40,171 | 8.1%).
| Income | Male | Female |
| $2,499 or less | 23,866 (4.2%) | 29,453 (5.9%) |
| $2,500 to $4,999 | 16,159 (2.8%) | 19,299 (3.9%) |
| $5,000 to $7,499 | 18,637 (3.3%) | 19,549 (3.9%) |
| $7,500 to $9,999 | 12,360 (2.2%) | 16,573 (3.3%) |
| $10,000 to $12,499 | 15,159 (2.6%) | 19,447 (3.9%) |
| $12,500 to $14,999 | 15,788 (2.8%) | 19,519 (3.9%) |
| $15,000 to $17,499 | 15,570 (2.7%) | 16,252 (3.3%) |
| $17,500 to $19,999 | 12,148 (2.1%) | 15,084 (3.0%) |
| $20,000 to $22,499 | 17,739 (3.1%) | 18,611 (3.7%) |
| $22,500 to $24,999 | 18,991 (3.3%) | 19,914 (4.0%) |
| $25,000 to $29,999 | 36,694 (6.4%) | 36,907 (7.4%) |
| $30,000 to $34,999 | 37,530 (6.6%) | 35,299 (7.1%) |
| $35,000 to $39,999 | 32,565 (5.7%) | 29,138 (5.9%) |
| $40,000 to $44,999 | 29,294 (5.1%) | 24,807 (5.0%) |
| $45,000 to $49,999 | 26,421 (4.6%) | 24,856 (5.0%) |
| $50,000 to $54,999 | 24,681 (4.3%) | 18,781 (3.8%) |
| $55,000 to $64,999 | 46,853 (8.2%) | 40,171 (8.1%) |
| $65,000 to $74,999 | 37,072 (6.5%) | 27,642 (5.6%) |
| $75,000 to $99,999 | 55,766 (9.8%) | 31,830 (6.4%) |
| $100,000+ | 78,854 (13.8%) | 33,872 (6.8%) |
| Total | 572,147 (100.0%) | 497,004 (100.0%) |
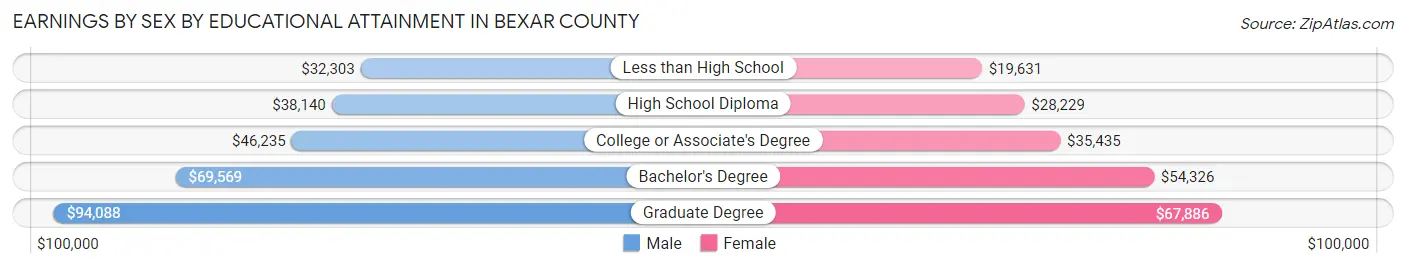
Earnings by Sex by Educational Attainment in Bexar County
Average earnings in Bexar County are $48,519 for men and $37,672 for women, a difference of 22.4%. Men with an educational attainment of graduate degree enjoy the highest average annual earnings of $94,088, while those with less than high school education earn the least with $32,303. Women with an educational attainment of graduate degree earn the most with the average annual earnings of $67,886, while those with less than high school education have the smallest earnings of $19,631.
| Educational Attainment | Male Income | Female Income |
| Less than High School | $32,303 | $19,631 |
| High School Diploma | $38,140 | $28,229 |
| College or Associate's Degree | $46,235 | $35,435 |
| Bachelor's Degree | $69,569 | $54,326 |
| Graduate Degree | $94,088 | $67,886 |
| Total | $48,519 | $37,672 |
Family Income in Bexar County
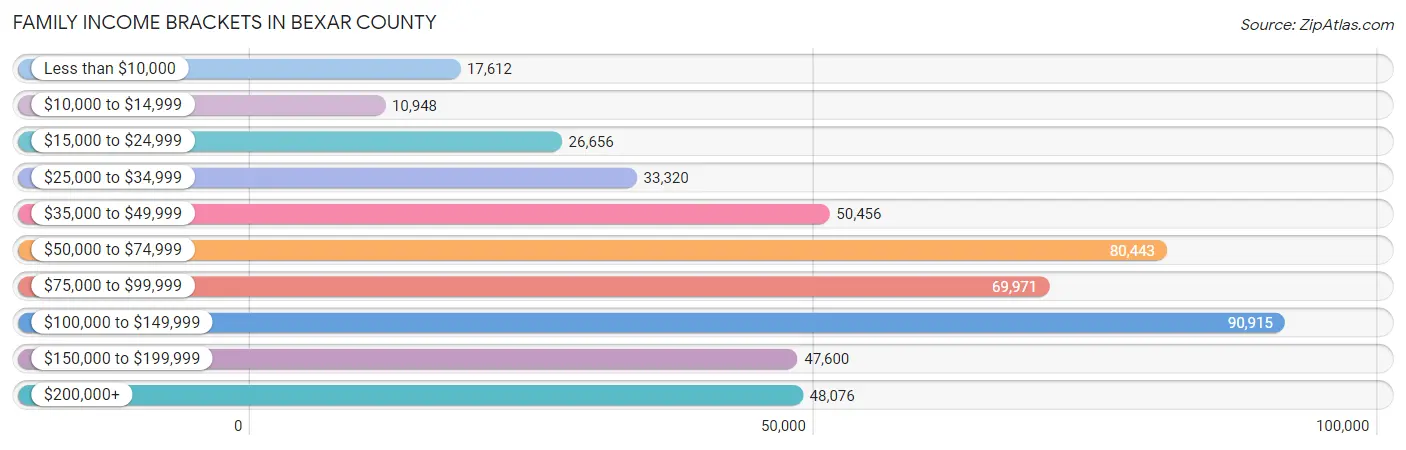
Family Income Brackets in Bexar County
According to the Bexar County family income data, there are 90,915 families falling into the $100,000 to $149,999 income range, which is the most common income bracket and makes up 19.1% of all families. Conversely, the $10,000 to $14,999 income bracket is the least frequent group with only 10,948 families (2.3%) belonging to this category.
| Income Bracket | # Families | % Families |
| Less than $10,000 | 17,612 | 3.7% |
| $10,000 to $14,999 | 10,948 | 2.3% |
| $15,000 to $24,999 | 26,656 | 5.6% |
| $25,000 to $34,999 | 33,320 | 7.0% |
| $35,000 to $49,999 | 50,456 | 10.6% |
| $50,000 to $74,999 | 80,443 | 16.9% |
| $75,000 to $99,999 | 69,971 | 14.7% |
| $100,000 to $149,999 | 90,915 | 19.1% |
| $150,000 to $199,999 | 47,600 | 10.0% |
| $200,000+ | 48,076 | 10.1% |
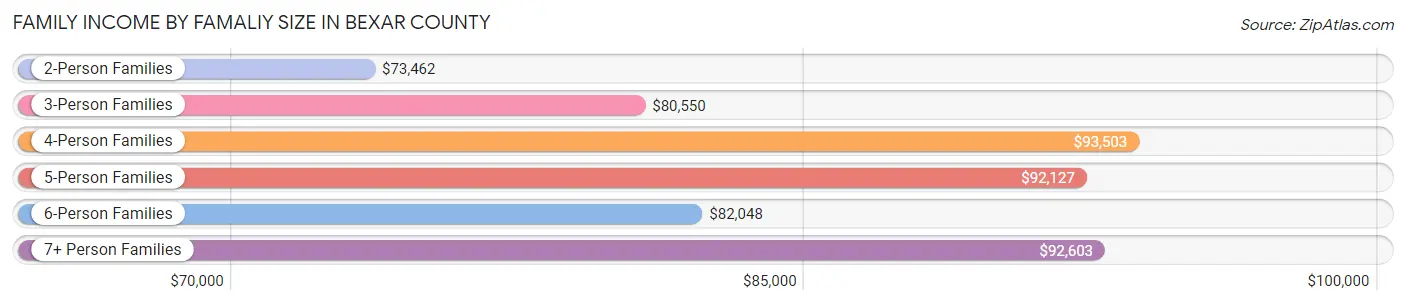
Family Income by Famaliy Size in Bexar County
4-person families (92,947 | 19.5%) account for the highest median family income in Bexar County with $93,503 per family, while 2-person families (192,536 | 40.5%) have the highest median income of $36,731 per family member.
| Income Bracket | # Families | Median Income |
| 2-Person Families | 192,536 (40.5%) | $73,462 |
| 3-Person Families | 111,055 (23.3%) | $80,550 |
| 4-Person Families | 92,947 (19.5%) | $93,503 |
| 5-Person Families | 48,927 (10.3%) | $92,127 |
| 6-Person Families | 18,447 (3.9%) | $82,048 |
| 7+ Person Families | 12,084 (2.5%) | $92,603 |
| Total | 475,996 (100.0%) | $80,748 |
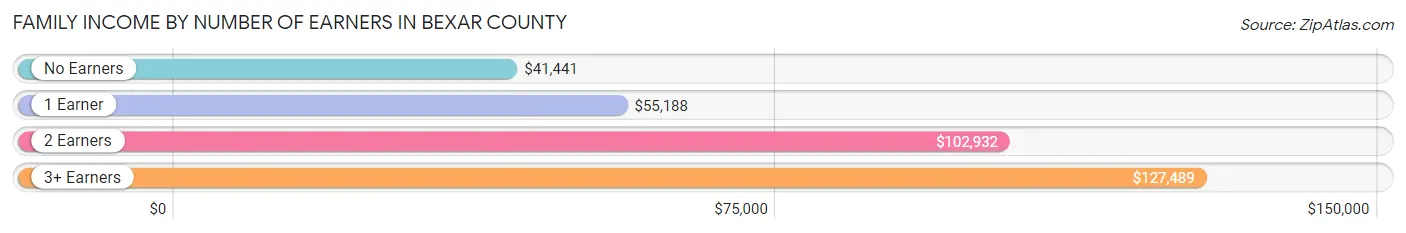
Family Income by Number of Earners in Bexar County
The median family income in Bexar County is $80,748, with families comprising 3+ earners (61,928) having the highest median family income of $127,489, while families with no earners (54,910) have the lowest median family income of $41,441, accounting for 13.0% and 11.5% of families, respectively.
| Number of Earners | # Families | Median Income |
| No Earners | 54,910 (11.5%) | $41,441 |
| 1 Earner | 168,596 (35.4%) | $55,188 |
| 2 Earners | 190,562 (40.0%) | $102,932 |
| 3+ Earners | 61,928 (13.0%) | $127,489 |
| Total | 475,996 (100.0%) | $80,748 |
Household Income in Bexar County
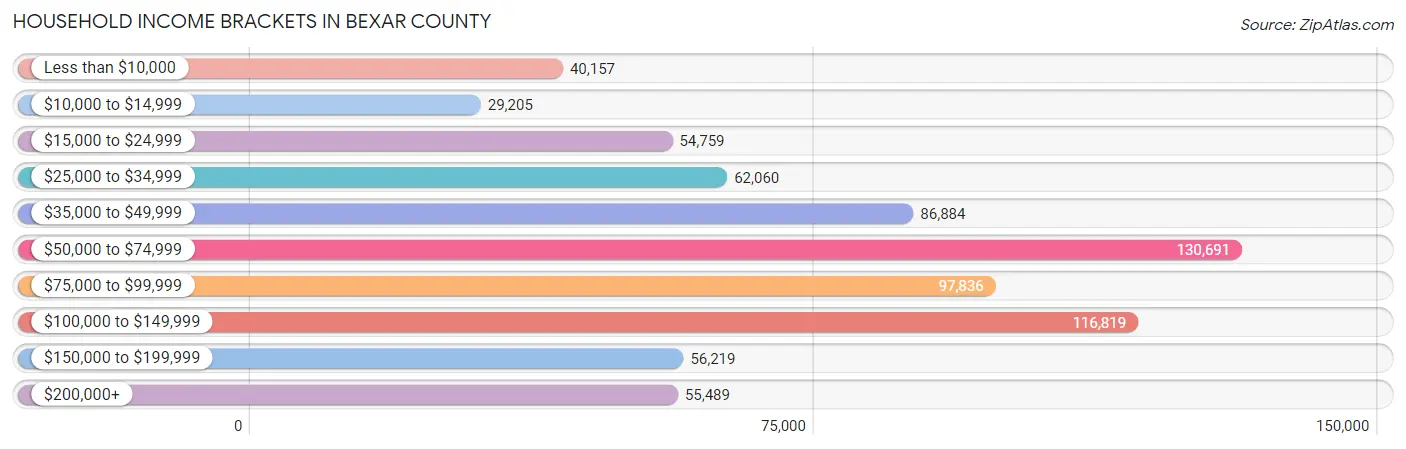
Household Income Brackets in Bexar County
With 130,691 households falling in the category, the $50,000 to $74,999 income range is the most frequent in Bexar County, accounting for 17.9% of all households. In contrast, only 29,205 households (4.0%) fall into the $10,000 to $14,999 income bracket, making it the least populous group.
| Income Bracket | # Households | % Households |
| Less than $10,000 | 40,157 | 5.5% |
| $10,000 to $14,999 | 29,205 | 4.0% |
| $15,000 to $24,999 | 54,759 | 7.5% |
| $25,000 to $34,999 | 62,060 | 8.5% |
| $35,000 to $49,999 | 86,884 | 11.9% |
| $50,000 to $74,999 | 130,691 | 17.9% |
| $75,000 to $99,999 | 97,836 | 13.4% |
| $100,000 to $149,999 | 116,819 | 16.0% |
| $150,000 to $199,999 | 56,219 | 7.7% |
| $200,000+ | 55,489 | 7.6% |
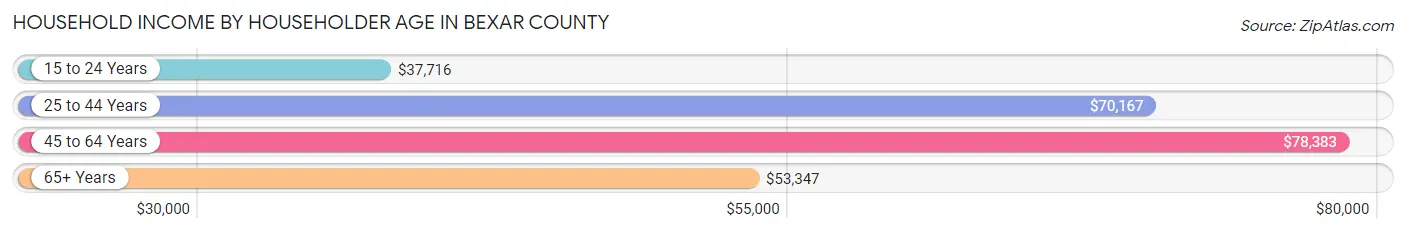
Household Income by Householder Age in Bexar County
The median household income in Bexar County is $67,275, with the highest median household income of $78,383 found in the 45 to 64 years age bracket for the primary householder. A total of 255,520 households (35.0%) fall into this category. Meanwhile, the 15 to 24 years age bracket for the primary householder has the lowest median household income of $37,716, with 36,058 households (4.9%) in this group.
| Income Bracket | # Households | Median Income |
| 15 to 24 Years | 36,058 (4.9%) | $37,716 |
| 25 to 44 Years | 285,838 (39.2%) | $70,167 |
| 45 to 64 Years | 255,520 (35.0%) | $78,383 |
| 65+ Years | 152,703 (20.9%) | $53,347 |
| Total | 730,119 (100.0%) | $67,275 |
Poverty in Bexar County
Income Below Poverty by Sex and Age in Bexar County
With 14.0% poverty level for males and 16.3% for females among the residents of Bexar County, under 5 year old males and 5 year old females are the most vulnerable to poverty, with 15,910 males (23.7%) and 3,195 females (24.2%) in their respective age groups living below the poverty level.
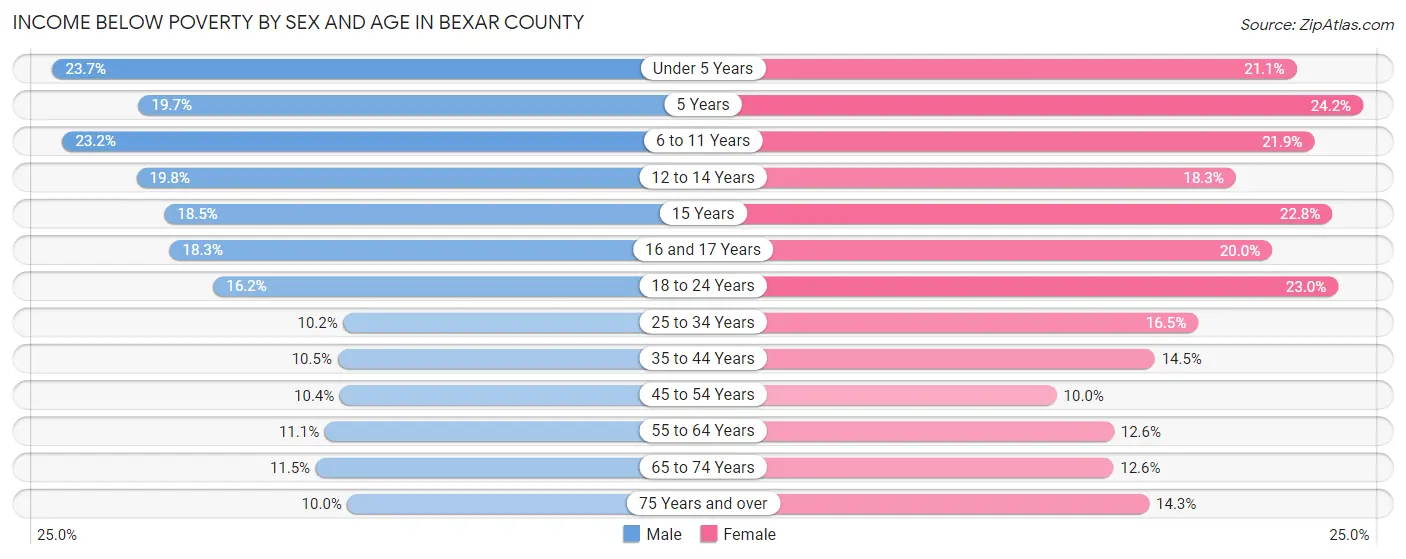
| Age Bracket | Male | Female |
| Under 5 Years | 15,910 (23.7%) | 13,610 (21.1%) |
| 5 Years | 2,650 (19.7%) | 3,195 (24.2%) |
| 6 to 11 Years | 20,270 (23.2%) | 17,389 (21.9%) |
| 12 to 14 Years | 8,368 (19.8%) | 8,104 (18.3%) |
| 15 Years | 2,663 (18.5%) | 3,256 (22.8%) |
| 16 and 17 Years | 5,298 (18.3%) | 5,574 (20.0%) |
| 18 to 24 Years | 16,169 (16.2%) | 21,921 (23.0%) |
| 25 to 34 Years | 16,187 (10.2%) | 25,262 (16.5%) |
| 35 to 44 Years | 14,884 (10.5%) | 20,141 (14.5%) |
| 45 to 54 Years | 12,207 (10.4%) | 12,035 (10.0%) |
| 55 to 64 Years | 11,239 (11.1%) | 13,759 (12.6%) |
| 65 to 74 Years | 7,810 (11.5%) | 10,211 (12.6%) |
| 75 Years and over | 3,860 (10.0%) | 8,000 (14.3%) |
| Total | 137,515 (14.0%) | 162,457 (16.3%) |
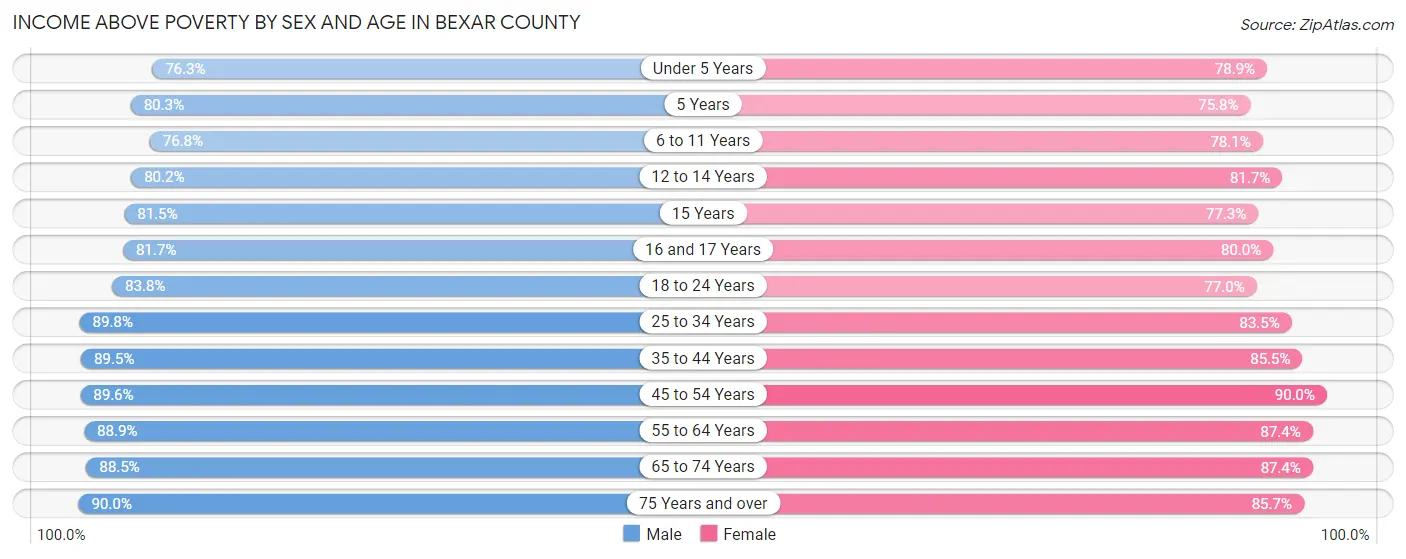
Income Above Poverty by Sex and Age in Bexar County
According to the poverty statistics in Bexar County, males aged 75 years and over and females aged 45 to 54 years are the age groups that are most secure financially, with 90.0% of males and 90.0% of females in these age groups living above the poverty line.
| Age Bracket | Male | Female |
| Under 5 Years | 51,207 (76.3%) | 50,920 (78.9%) |
| 5 Years | 10,792 (80.3%) | 10,020 (75.8%) |
| 6 to 11 Years | 66,935 (76.8%) | 61,951 (78.1%) |
| 12 to 14 Years | 33,902 (80.2%) | 36,265 (81.7%) |
| 15 Years | 11,727 (81.5%) | 11,053 (77.2%) |
| 16 and 17 Years | 23,701 (81.7%) | 22,352 (80.0%) |
| 18 to 24 Years | 83,367 (83.8%) | 73,283 (77.0%) |
| 25 to 34 Years | 142,472 (89.8%) | 127,580 (83.5%) |
| 35 to 44 Years | 127,260 (89.5%) | 118,589 (85.5%) |
| 45 to 54 Years | 105,572 (89.6%) | 108,704 (90.0%) |
| 55 to 64 Years | 90,357 (88.9%) | 95,284 (87.4%) |
| 65 to 74 Years | 60,224 (88.5%) | 70,828 (87.4%) |
| 75 Years and over | 34,708 (90.0%) | 48,107 (85.7%) |
| Total | 842,224 (86.0%) | 834,936 (83.7%) |
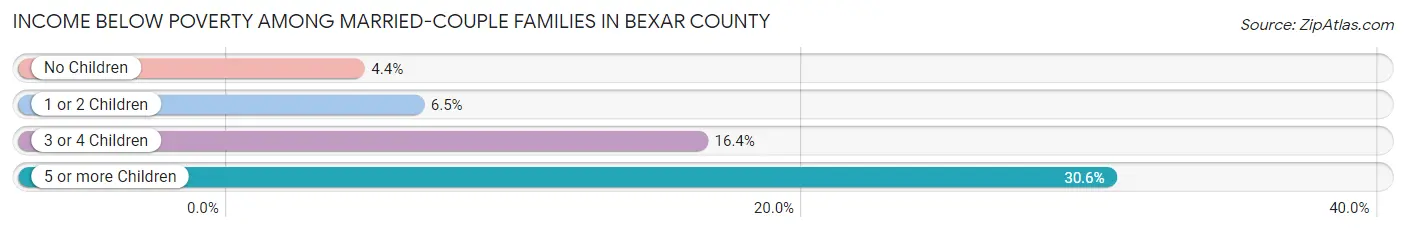
Income Below Poverty Among Married-Couple Families in Bexar County
The poverty statistics for married-couple families in Bexar County show that 6.7% or 21,184 of the total 318,199 families live below the poverty line. Families with 5 or more children have the highest poverty rate of 30.6%, comprising of 1,090 families. On the other hand, families with no children have the lowest poverty rate of 4.4%, which includes 7,289 families.
| Children | Above Poverty | Below Poverty |
| No Children | 158,480 (95.6%) | 7,289 (4.4%) |
| 1 or 2 Children | 109,193 (93.5%) | 7,554 (6.5%) |
| 3 or 4 Children | 26,867 (83.7%) | 5,251 (16.4%) |
| 5 or more Children | 2,475 (69.4%) | 1,090 (30.6%) |
| Total | 297,015 (93.3%) | 21,184 (6.7%) |
Income Below Poverty Among Single-Parent Households in Bexar County
According to the poverty data in Bexar County, 11.7% or 5,040 single-father households and 25.3% or 29,009 single-mother households are living below the poverty line. Among single-father households, those with 5 or more children have the highest poverty rate, with 219 households (59.8%) experiencing poverty. Likewise, among single-mother households, those with 5 or more children have the highest poverty rate, with 1,475 households (73.1%) falling below the poverty line.
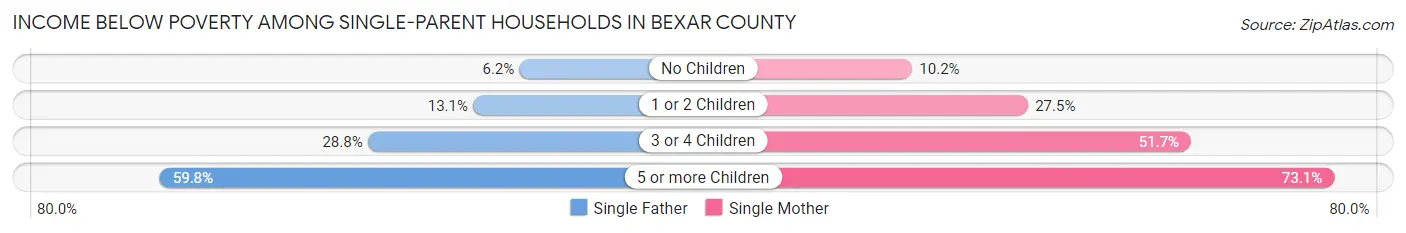
| Children | Single Father | Single Mother |
| No Children | 1,224 (6.2%) | 4,210 (10.2%) |
| 1 or 2 Children | 2,459 (13.1%) | 15,591 (27.5%) |
| 3 or 4 Children | 1,138 (28.8%) | 7,733 (51.7%) |
| 5 or more Children | 219 (59.8%) | 1,475 (73.1%) |
| Total | 5,040 (11.7%) | 29,009 (25.3%) |
Income Below Poverty Among Married-Couple vs Single-Parent Households in Bexar County
The poverty data for Bexar County shows that 21,184 of the married-couple family households (6.7%) and 34,049 of the single-parent households (21.6%) are living below the poverty level. Within the married-couple family households, those with 5 or more children have the highest poverty rate, with 1,090 households (30.6%) falling below the poverty line. Among the single-parent households, those with 5 or more children have the highest poverty rate, with 1,694 household (71.0%) living below poverty.
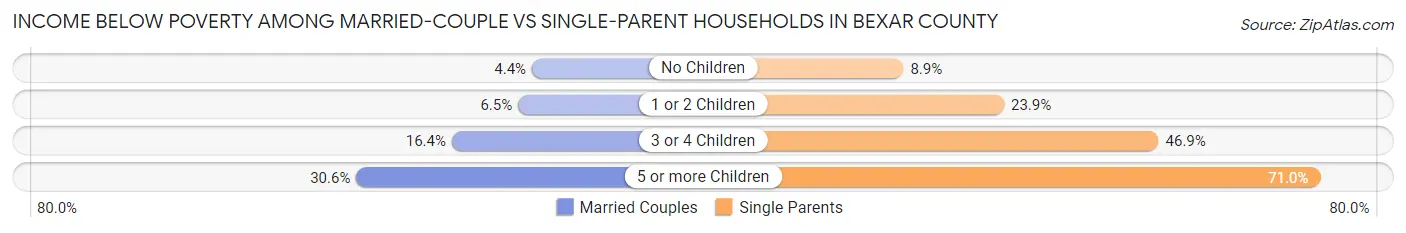
| Children | Married-Couple Families | Single-Parent Households |
| No Children | 7,289 (4.4%) | 5,434 (8.9%) |
| 1 or 2 Children | 7,554 (6.5%) | 18,050 (23.9%) |
| 3 or 4 Children | 5,251 (16.4%) | 8,871 (46.9%) |
| 5 or more Children | 1,090 (30.6%) | 1,694 (71.0%) |
| Total | 21,184 (6.7%) | 34,049 (21.6%) |
Race in Bexar County
The most populous races in Bexar County are Hispanic or Latino (1,229,072 | 61.0%), White / Caucasian (1,150,364 | 57.1%), and Two or more Races (451,396 | 22.4%).
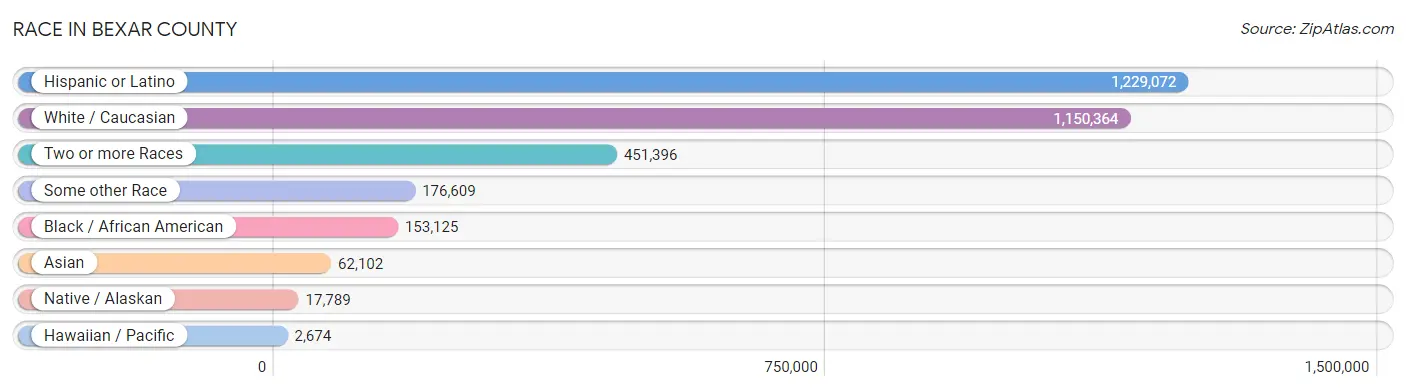
| Race | # Population | % Population |
| Asian | 62,102 | 3.1% |
| Black / African American | 153,125 | 7.6% |
| Hawaiian / Pacific | 2,674 | 0.1% |
| Hispanic or Latino | 1,229,072 | 61.0% |
| Native / Alaskan | 17,789 | 0.9% |
| White / Caucasian | 1,150,364 | 57.1% |
| Two or more Races | 451,396 | 22.4% |
| Some other Race | 176,609 | 8.8% |
| Total | 2,014,059 | 100.0% |
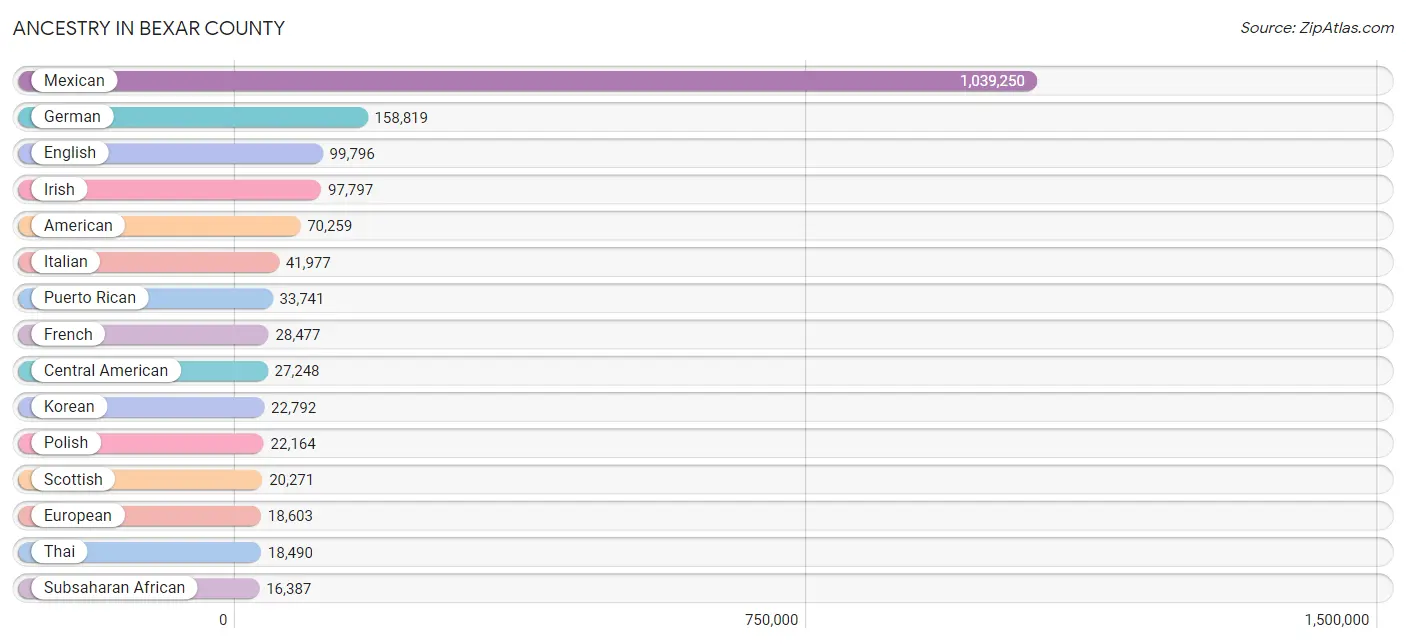
Ancestry in Bexar County
The most populous ancestries reported in Bexar County are Mexican (1,039,250 | 51.6%), German (158,819 | 7.9%), English (99,796 | 5.0%), Irish (97,797 | 4.9%), and American (70,259 | 3.5%), together accounting for 72.8% of all Bexar County residents.
| Ancestry | # Population | % Population |
| Afghan | 3,301 | 0.2% |
| African | 10,280 | 0.5% |
| Alaskan Athabascan | 7 | 0.0% |
| Albanian | 135 | 0.0% |
| Aleut | 14 | 0.0% |
| Alsatian | 444 | 0.0% |
| American | 70,259 | 3.5% |
| Apache | 2,614 | 0.1% |
| Arab | 12,405 | 0.6% |
| Argentinean | 1,494 | 0.1% |
| Armenian | 220 | 0.0% |
| Assyrian / Chaldean / Syriac | 8 | 0.0% |
| Australian | 228 | 0.0% |
| Austrian | 2,305 | 0.1% |
| Bahamian | 32 | 0.0% |
| Bangladeshi | 360 | 0.0% |
| Barbadian | 202 | 0.0% |
| Basque | 476 | 0.0% |
| Belgian | 981 | 0.1% |
| Belizean | 218 | 0.0% |
| Bermudan | 17 | 0.0% |
| Bhutanese | 6,353 | 0.3% |
| Blackfeet | 593 | 0.0% |
| Bolivian | 155 | 0.0% |
| Brazilian | 1,318 | 0.1% |
| British | 7,366 | 0.4% |
| British West Indian | 36 | 0.0% |
| Bulgarian | 328 | 0.0% |
| Burmese | 6,564 | 0.3% |
| Cajun | 307 | 0.0% |
| Cambodian | 194 | 0.0% |
| Canadian | 1,884 | 0.1% |
| Cape Verdean | 127 | 0.0% |
| Celtic | 271 | 0.0% |
| Central American | 27,248 | 1.3% |
| Central American Indian | 4,460 | 0.2% |
| Cherokee | 5,274 | 0.3% |
| Cheyenne | 12 | 0.0% |
| Chickasaw | 613 | 0.0% |
| Chilean | 822 | 0.0% |
| Chinese | 117 | 0.0% |
| Chippewa | 313 | 0.0% |
| Choctaw | 1,290 | 0.1% |
| Colombian | 5,620 | 0.3% |
| Comanche | 791 | 0.0% |
| Costa Rican | 1,112 | 0.1% |
| Creek | 199 | 0.0% |
| Croatian | 697 | 0.0% |
| Crow | 18 | 0.0% |
| Cuban | 7,128 | 0.4% |
| Czech | 6,426 | 0.3% |
| Czechoslovakian | 1,420 | 0.1% |
| Danish | 2,853 | 0.1% |
| Delaware | 73 | 0.0% |
| Dominican | 2,163 | 0.1% |
| Dutch | 8,076 | 0.4% |
| Dutch West Indian | 24 | 0.0% |
| Eastern European | 2,225 | 0.1% |
| Ecuadorian | 1,376 | 0.1% |
| Egyptian | 905 | 0.0% |
| English | 99,796 | 5.0% |
| Estonian | 56 | 0.0% |
| Ethiopian | 453 | 0.0% |
| European | 18,603 | 0.9% |
| Filipino | 730 | 0.0% |
| Finnish | 1,042 | 0.1% |
| French | 28,477 | 1.4% |
| French American Indian | 156 | 0.0% |
| French Canadian | 3,801 | 0.2% |
| German | 158,819 | 7.9% |
| German Russian | 150 | 0.0% |
| Ghanaian | 341 | 0.0% |
| Greek | 2,801 | 0.1% |
| Guamanian / Chamorro | 1,971 | 0.1% |
| Guatemalan | 4,702 | 0.2% |
| Guyanese | 319 | 0.0% |
| Haitian | 1,333 | 0.1% |
| Hmong | 23 | 0.0% |
| Honduran | 7,609 | 0.4% |
| Hopi | 42 | 0.0% |
| Hungarian | 2,249 | 0.1% |
| Icelander | 417 | 0.0% |
| Indian (Asian) | 11,227 | 0.6% |
| Indonesian | 919 | 0.1% |
| Inupiat | 48 | 0.0% |
| Iranian | 2,322 | 0.1% |
| Iraqi | 2,748 | 0.1% |
| Irish | 97,797 | 4.9% |
| Iroquois | 432 | 0.0% |
| Israeli | 282 | 0.0% |
| Italian | 41,977 | 2.1% |
| Jamaican | 2,572 | 0.1% |
| Japanese | 260 | 0.0% |
| Jordanian | 461 | 0.0% |
| Kenyan | 81 | 0.0% |
| Kiowa | 39 | 0.0% |
| Korean | 22,792 | 1.1% |
| Laotian | 450 | 0.0% |
| Latvian | 149 | 0.0% |
| Lebanese | 2,262 | 0.1% |
| Liberian | 202 | 0.0% |
| Lithuanian | 2,198 | 0.1% |
| Lumbee | 26 | 0.0% |
| Luxembourger | 178 | 0.0% |
| Macedonian | 184 | 0.0% |
| Malaysian | 215 | 0.0% |
| Maltese | 39 | 0.0% |
| Mexican | 1,039,250 | 51.6% |
| Mexican American Indian | 6,526 | 0.3% |
| Mongolian | 55 | 0.0% |
| Moroccan | 545 | 0.0% |
| Native Hawaiian | 3,125 | 0.2% |
| Navajo | 1,055 | 0.1% |
| New Zealander | 76 | 0.0% |
| Nicaraguan | 2,252 | 0.1% |
| Nigerian | 2,075 | 0.1% |
| Northern European | 2,420 | 0.1% |
| Norwegian | 8,929 | 0.4% |
| Okinawan | 63 | 0.0% |
| Osage | 62 | 0.0% |
| Ottawa | 89 | 0.0% |
| Paiute | 10 | 0.0% |
| Pakistani | 2,038 | 0.1% |
| Palestinian | 610 | 0.0% |
| Panamanian | 3,538 | 0.2% |
| Paraguayan | 164 | 0.0% |
| Pennsylvania German | 280 | 0.0% |
| Peruvian | 2,383 | 0.1% |
| Pima | 84 | 0.0% |
| Polish | 22,164 | 1.1% |
| Portuguese | 4,665 | 0.2% |
| Potawatomi | 123 | 0.0% |
| Pueblo | 299 | 0.0% |
| Puerto Rican | 33,741 | 1.7% |
| Romanian | 2,104 | 0.1% |
| Russian | 4,883 | 0.2% |
| Salvadoran | 7,949 | 0.4% |
| Samoan | 778 | 0.0% |
| Scandinavian | 3,013 | 0.2% |
| Scotch-Irish | 11,573 | 0.6% |
| Scottish | 20,271 | 1.0% |
| Seminole | 136 | 0.0% |
| Senegalese | 40 | 0.0% |
| Serbian | 201 | 0.0% |
| Shoshone | 54 | 0.0% |
| Sierra Leonean | 65 | 0.0% |
| Sioux | 510 | 0.0% |
| Slavic | 384 | 0.0% |
| Slovak | 753 | 0.0% |
| Slovene | 282 | 0.0% |
| Somali | 423 | 0.0% |
| South African | 403 | 0.0% |
| South American | 15,062 | 0.7% |
| South American Indian | 383 | 0.0% |
| Soviet Union | 22 | 0.0% |
| Spaniard | 16,048 | 0.8% |
| Spanish | 8,626 | 0.4% |
| Spanish American | 454 | 0.0% |
| Spanish American Indian | 117 | 0.0% |
| Sri Lankan | 8,538 | 0.4% |
| Subsaharan African | 16,387 | 0.8% |
| Sudanese | 774 | 0.0% |
| Swedish | 7,742 | 0.4% |
| Swiss | 2,588 | 0.1% |
| Syrian | 624 | 0.0% |
| Thai | 18,490 | 0.9% |
| Tlingit-Haida | 8 | 0.0% |
| Tohono O'Odham | 14 | 0.0% |
| Tongan | 89 | 0.0% |
| Trinidadian and Tobagonian | 135 | 0.0% |
| Turkish | 1,158 | 0.1% |
| U.S. Virgin Islander | 65 | 0.0% |
| Ugandan | 27 | 0.0% |
| Ukrainian | 2,237 | 0.1% |
| Uruguayan | 207 | 0.0% |
| Ute | 37 | 0.0% |
| Venezuelan | 2,532 | 0.1% |
| Vietnamese | 543 | 0.0% |
| Welsh | 6,518 | 0.3% |
| West Indian | 901 | 0.0% |
| Yaqui | 252 | 0.0% |
| Yugoslavian | 334 | 0.0% |
| Yuman | 8 | 0.0% | View All 183 Rows |
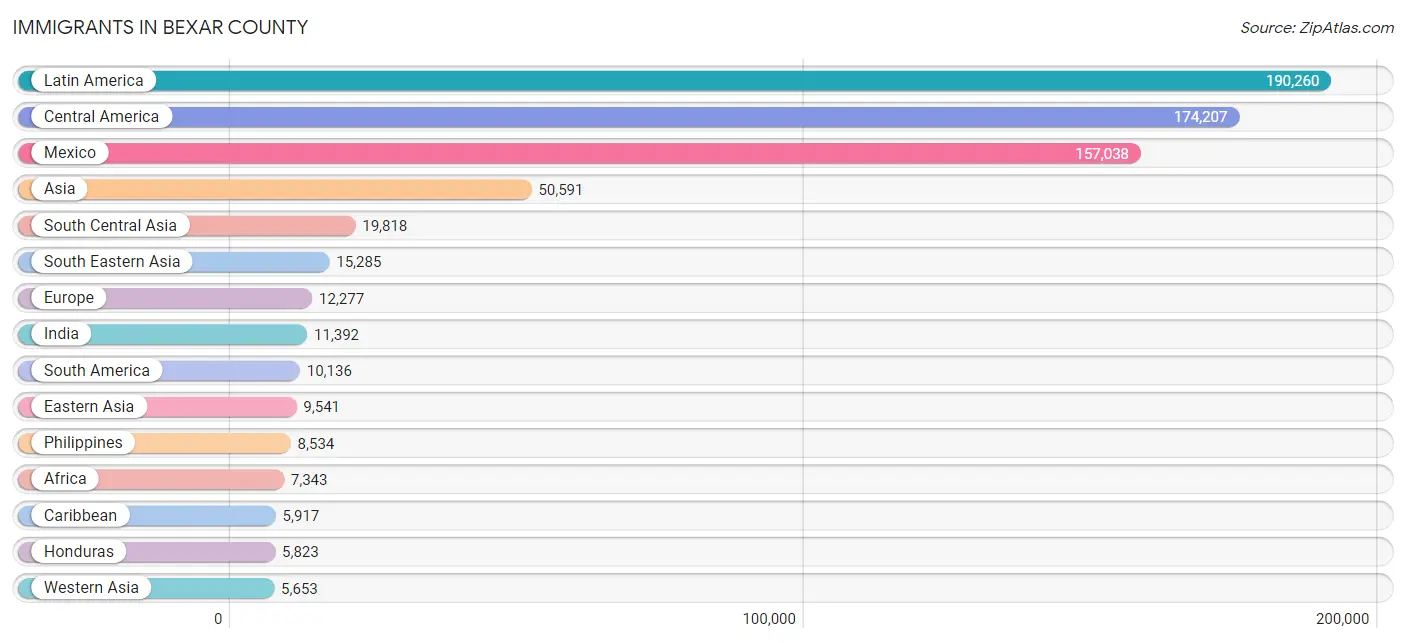
Immigrants in Bexar County
The most numerous immigrant groups reported in Bexar County came from Latin America (190,260 | 9.5%), Central America (174,207 | 8.6%), Mexico (157,038 | 7.8%), Asia (50,591 | 2.5%), and South Central Asia (19,818 | 1.0%), together accounting for 29.4% of all Bexar County residents.
| Immigration Origin | # Population | % Population |
| Afghanistan | 3,455 | 0.2% |
| Africa | 7,343 | 0.4% |
| Albania | 26 | 0.0% |
| Argentina | 871 | 0.0% |
| Asia | 50,591 | 2.5% |
| Australia | 371 | 0.0% |
| Austria | 158 | 0.0% |
| Azores | 7 | 0.0% |
| Bahamas | 4 | 0.0% |
| Bangladesh | 803 | 0.0% |
| Barbados | 208 | 0.0% |
| Belarus | 23 | 0.0% |
| Belgium | 9 | 0.0% |
| Belize | 295 | 0.0% |
| Bolivia | 160 | 0.0% |
| Bosnia and Herzegovina | 20 | 0.0% |
| Brazil | 1,061 | 0.1% |
| Bulgaria | 114 | 0.0% |
| Cambodia | 70 | 0.0% |
| Cameroon | 305 | 0.0% |
| Canada | 2,598 | 0.1% |
| Caribbean | 5,917 | 0.3% |
| Central America | 174,207 | 8.6% |
| Chile | 443 | 0.0% |
| China | 5,322 | 0.3% |
| Colombia | 3,101 | 0.2% |
| Congo | 447 | 0.0% |
| Costa Rica | 466 | 0.0% |
| Cuba | 3,065 | 0.2% |
| Czechoslovakia | 118 | 0.0% |
| Denmark | 107 | 0.0% |
| Dominican Republic | 1,005 | 0.1% |
| Eastern Africa | 1,622 | 0.1% |
| Eastern Asia | 9,541 | 0.5% |
| Eastern Europe | 3,940 | 0.2% |
| Ecuador | 549 | 0.0% |
| Egypt | 877 | 0.0% |
| El Salvador | 4,695 | 0.2% |
| England | 972 | 0.1% |
| Eritrea | 269 | 0.0% |
| Ethiopia | 305 | 0.0% |
| Europe | 12,277 | 0.6% |
| Fiji | 30 | 0.0% |
| France | 586 | 0.0% |
| Germany | 2,992 | 0.2% |
| Ghana | 330 | 0.0% |
| Greece | 97 | 0.0% |
| Guatemala | 2,766 | 0.1% |
| Guyana | 155 | 0.0% |
| Haiti | 220 | 0.0% |
| Honduras | 5,823 | 0.3% |
| Hong Kong | 229 | 0.0% |
| Hungary | 79 | 0.0% |
| India | 11,392 | 0.6% |
| Indonesia | 330 | 0.0% |
| Iran | 1,701 | 0.1% |
| Iraq | 2,988 | 0.2% |
| Ireland | 392 | 0.0% |
| Israel | 181 | 0.0% |
| Italy | 364 | 0.0% |
| Jamaica | 977 | 0.1% |
| Japan | 1,442 | 0.1% |
| Jordan | 409 | 0.0% |
| Kazakhstan | 411 | 0.0% |
| Kenya | 311 | 0.0% |
| Korea | 2,777 | 0.1% |
| Kuwait | 39 | 0.0% |
| Laos | 125 | 0.0% |
| Latin America | 190,260 | 9.5% |
| Latvia | 25 | 0.0% |
| Lebanon | 459 | 0.0% |
| Liberia | 327 | 0.0% |
| Lithuania | 39 | 0.0% |
| Malaysia | 215 | 0.0% |
| Mexico | 157,038 | 7.8% |
| Middle Africa | 1,118 | 0.1% |
| Moldova | 43 | 0.0% |
| Morocco | 320 | 0.0% |
| Nepal | 404 | 0.0% |
| Netherlands | 86 | 0.0% |
| Nicaragua | 1,363 | 0.1% |
| Nigeria | 996 | 0.1% |
| North Macedonia | 14 | 0.0% |
| Northern Africa | 2,057 | 0.1% |
| Northern Europe | 3,099 | 0.2% |
| Norway | 45 | 0.0% |
| Oceania | 730 | 0.0% |
| Pakistan | 1,263 | 0.1% |
| Panama | 1,761 | 0.1% |
| Peru | 1,471 | 0.1% |
| Philippines | 8,534 | 0.4% |
| Poland | 465 | 0.0% |
| Portugal | 109 | 0.0% |
| Romania | 403 | 0.0% |
| Russia | 1,201 | 0.1% |
| Saudi Arabia | 549 | 0.0% |
| Scotland | 467 | 0.0% |
| Senegal | 73 | 0.0% |
| Serbia | 79 | 0.0% |
| Sierra Leone | 44 | 0.0% |
| Singapore | 86 | 0.0% |
| Somalia | 197 | 0.0% |
| South Africa | 326 | 0.0% |
| South America | 10,136 | 0.5% |
| South Central Asia | 19,818 | 1.0% |
| South Eastern Asia | 15,285 | 0.8% |
| Southern Europe | 1,269 | 0.1% |
| Spain | 699 | 0.0% |
| Sri Lanka | 127 | 0.0% |
| Sudan | 399 | 0.0% |
| Sweden | 185 | 0.0% |
| Switzerland | 83 | 0.0% |
| Syria | 81 | 0.0% |
| Taiwan | 633 | 0.0% |
| Thailand | 932 | 0.1% |
| Trinidad and Tobago | 354 | 0.0% |
| Turkey | 780 | 0.0% |
| Uganda | 87 | 0.0% |
| Ukraine | 919 | 0.1% |
| Uruguay | 61 | 0.0% |
| Uzbekistan | 31 | 0.0% |
| Venezuela | 2,080 | 0.1% |
| Vietnam | 4,044 | 0.2% |
| West Indies | 53 | 0.0% |
| Western Africa | 1,973 | 0.1% |
| Western Asia | 5,653 | 0.3% |
| Western Europe | 3,914 | 0.2% |
| Zaire | 354 | 0.0% |
| Zimbabwe | 49 | 0.0% | View All 129 Rows |
Sex and Age in Bexar County
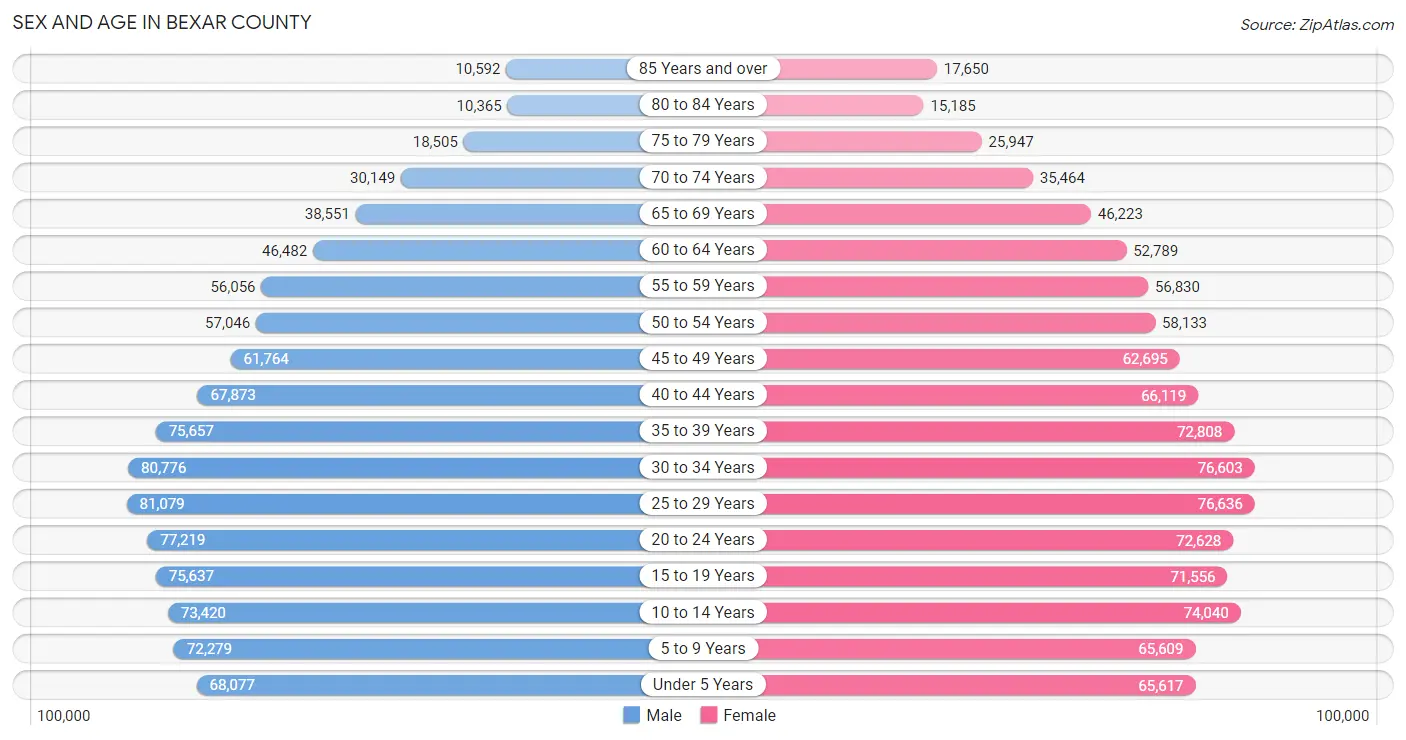
Sex and Age in Bexar County
The most populous age groups in Bexar County are 25 to 29 Years (81,079 | 8.1%) for men and 25 to 29 Years (76,636 | 7.6%) for women.
| Age Bracket | Male | Female |
| Under 5 Years | 68,077 (6.8%) | 65,617 (6.5%) |
| 5 to 9 Years | 72,279 (7.2%) | 65,609 (6.5%) |
| 10 to 14 Years | 73,420 (7.3%) | 74,040 (7.3%) |
| 15 to 19 Years | 75,637 (7.5%) | 71,556 (7.1%) |
| 20 to 24 Years | 77,219 (7.7%) | 72,628 (7.2%) |
| 25 to 29 Years | 81,079 (8.1%) | 76,636 (7.6%) |
| 30 to 34 Years | 80,776 (8.1%) | 76,603 (7.6%) |
| 35 to 39 Years | 75,657 (7.5%) | 72,808 (7.2%) |
| 40 to 44 Years | 67,873 (6.8%) | 66,119 (6.5%) |
| 45 to 49 Years | 61,764 (6.2%) | 62,695 (6.2%) |
| 50 to 54 Years | 57,046 (5.7%) | 58,133 (5.7%) |
| 55 to 59 Years | 56,056 (5.6%) | 56,830 (5.6%) |
| 60 to 64 Years | 46,482 (4.6%) | 52,789 (5.2%) |
| 65 to 69 Years | 38,551 (3.8%) | 46,223 (4.6%) |
| 70 to 74 Years | 30,149 (3.0%) | 35,464 (3.5%) |
| 75 to 79 Years | 18,505 (1.8%) | 25,947 (2.6%) |
| 80 to 84 Years | 10,365 (1.0%) | 15,185 (1.5%) |
| 85 Years and over | 10,592 (1.1%) | 17,650 (1.7%) |
| Total | 1,001,527 (100.0%) | 1,012,532 (100.0%) |
Families and Households in Bexar County
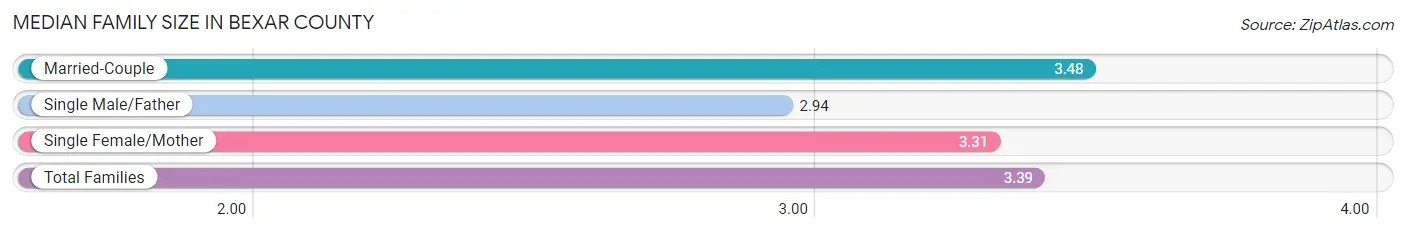
Median Family Size in Bexar County
The median family size in Bexar County is 3.39 persons per family, with married-couple families (318,199 | 66.8%) accounting for the largest median family size of 3.48 persons per family. On the other hand, single male/father families (43,025 | 9.0%) represent the smallest median family size with 2.94 persons per family.
| Family Type | # Families | Family Size |
| Married-Couple | 318,199 (66.8%) | 3.48 |
| Single Male/Father | 43,025 (9.0%) | 2.94 |
| Single Female/Mother | 114,772 (24.1%) | 3.31 |
| Total Families | 475,996 (100.0%) | 3.39 |
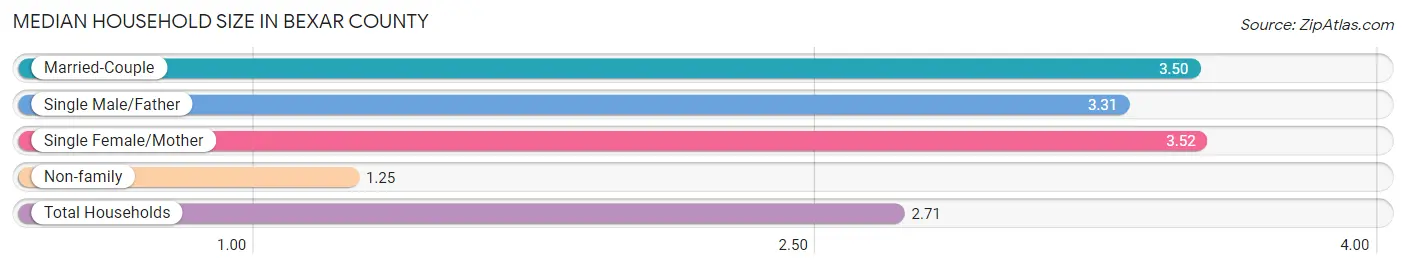
Median Household Size in Bexar County
The median household size in Bexar County is 2.71 persons per household, with single female/mother households (114,772 | 15.7%) accounting for the largest median household size of 3.52 persons per household. non-family households (254,123 | 34.8%) represent the smallest median household size with 1.25 persons per household.
| Household Type | # Households | Household Size |
| Married-Couple | 318,199 (43.6%) | 3.50 |
| Single Male/Father | 43,025 (5.9%) | 3.31 |
| Single Female/Mother | 114,772 (15.7%) | 3.52 |
| Non-family | 254,123 (34.8%) | 1.25 |
| Total Households | 730,119 (100.0%) | 2.71 |
Household Size by Marriage Status in Bexar County
Out of a total of 730,119 households in Bexar County, 475,996 (65.2%) are family households, while 254,123 (34.8%) are nonfamily households. The most numerous type of family households are 2-person households, comprising 177,185, and the most common type of nonfamily households are 1-person households, comprising 206,917.
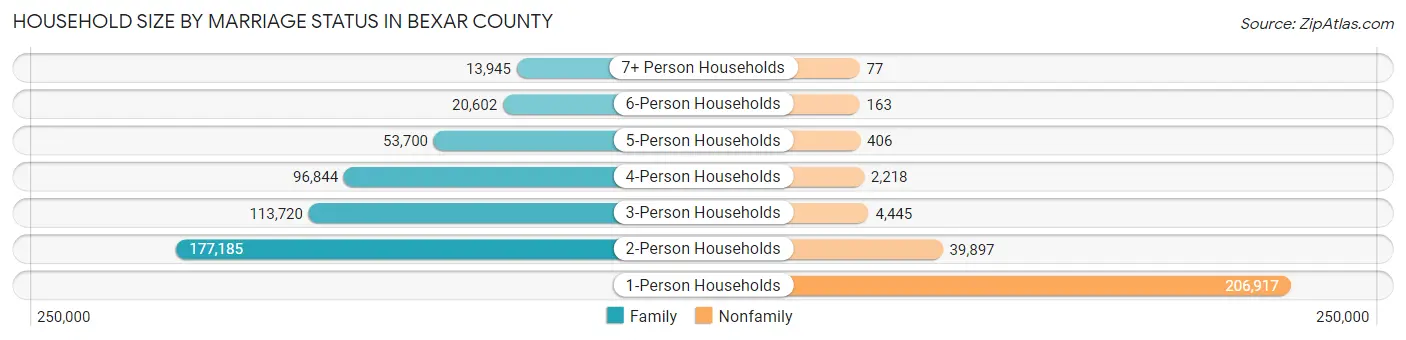
| Household Size | Family Households | Nonfamily Households |
| 1-Person Households | - | 206,917 (28.3%) |
| 2-Person Households | 177,185 (24.3%) | 39,897 (5.5%) |
| 3-Person Households | 113,720 (15.6%) | 4,445 (0.6%) |
| 4-Person Households | 96,844 (13.3%) | 2,218 (0.3%) |
| 5-Person Households | 53,700 (7.3%) | 406 (0.1%) |
| 6-Person Households | 20,602 (2.8%) | 163 (0.0%) |
| 7+ Person Households | 13,945 (1.9%) | 77 (0.0%) |
| Total | 475,996 (65.2%) | 254,123 (34.8%) |
Female Fertility in Bexar County
Fertility by Age in Bexar County
Average fertility rate in Bexar County is 56.0 births per 1,000 women. Women in the age bracket of 20 to 34 years have the highest fertility rate with 89.0 births per 1,000 women. Women in the age bracket of 20 to 34 years acount for 70.7% of all women with births.
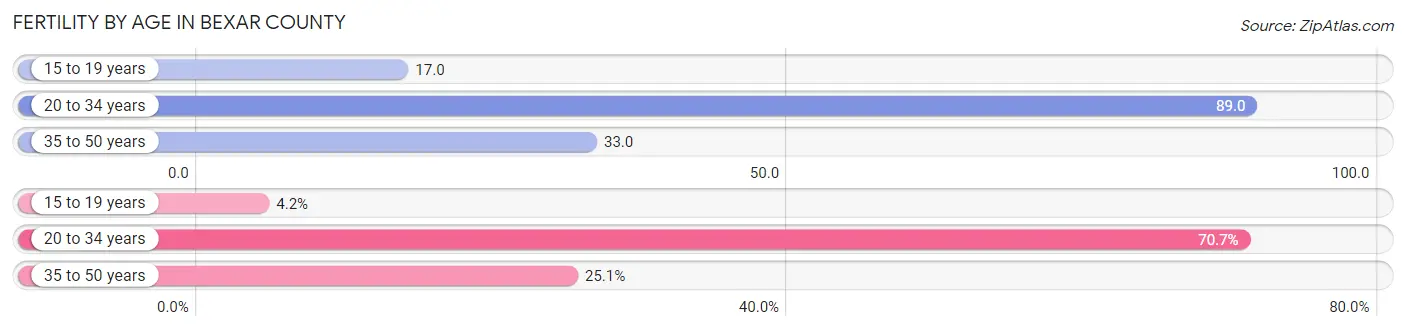
| Age Bracket | Women with Births | Births / 1,000 Women |
| 15 to 19 years | 1,181 (4.2%) | 17.0 |
| 20 to 34 years | 20,092 (70.7%) | 89.0 |
| 35 to 50 years | 7,131 (25.1%) | 33.0 |
| Total | 28,404 (100.0%) | 56.0 |
Fertility by Age by Marriage Status in Bexar County
63.6% of women with births (28,404) in Bexar County are married. The highest percentage of unmarried women with births falls into 15 to 19 years age bracket with 91.8% of them unmarried at the time of birth, while the lowest percentage of unmarried women with births belong to 35 to 50 years age bracket with 23.6% of them unmarried.
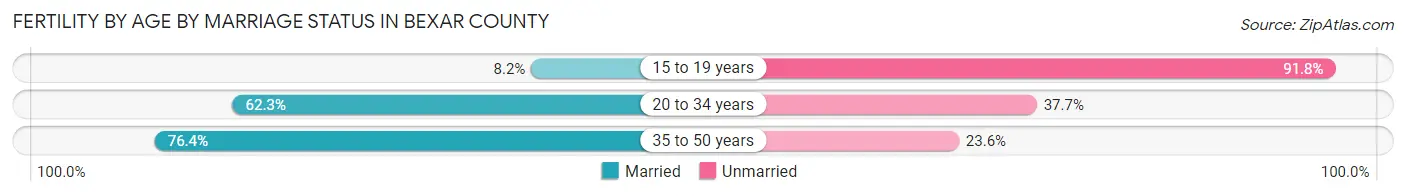
| Age Bracket | Married | Unmarried |
| 15 to 19 years | 97 (8.2%) | 1,084 (91.8%) |
| 20 to 34 years | 12,517 (62.3%) | 7,575 (37.7%) |
| 35 to 50 years | 5,448 (76.4%) | 1,683 (23.6%) |
| Total | 18,065 (63.6%) | 10,339 (36.4%) |
Fertility by Education in Bexar County
Average fertility rate in Bexar County is 56.0 births per 1,000 women. Women with the education attainment of high school diploma have the highest fertility rate of 63.0 births per 1,000 women, while women with the education attainment of less than high school have the lowest fertility at 38.0 births per 1,000 women. Women with the education attainment of college or associate's degree represent 35.1% of all women with births.
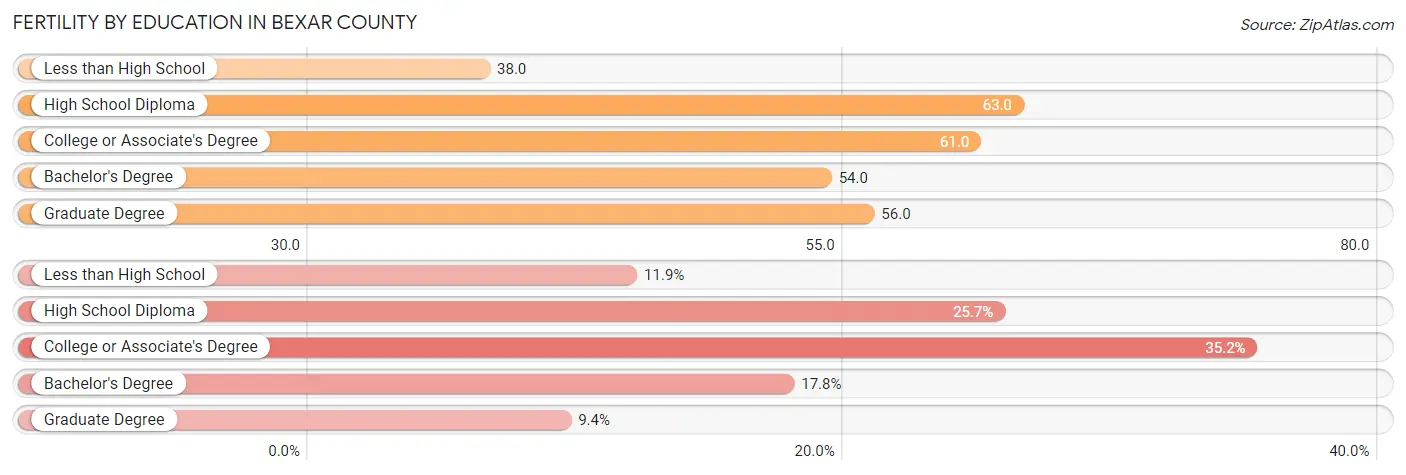
| Educational Attainment | Women with Births | Births / 1,000 Women |
| Less than High School | 3,382 (11.9%) | 38.0 |
| High School Diploma | 7,301 (25.7%) | 63.0 |
| College or Associate's Degree | 9,985 (35.1%) | 61.0 |
| Bachelor's Degree | 5,056 (17.8%) | 54.0 |
| Graduate Degree | 2,680 (9.4%) | 56.0 |
| Total | 28,404 (100.0%) | 56.0 |
Fertility by Education by Marriage Status in Bexar County
36.4% of women with births in Bexar County are unmarried. Women with the educational attainment of bachelor's degree are most likely to be married with 86.9% of them married at childbirth, while women with the educational attainment of less than high school are least likely to be married with 54.5% of them unmarried at childbirth.
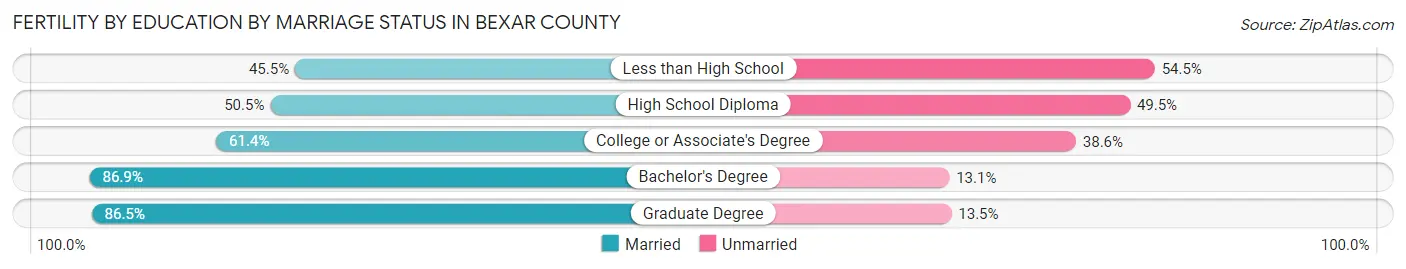
| Educational Attainment | Married | Unmarried |
| Less than High School | 1,539 (45.5%) | 1,843 (54.5%) |
| High School Diploma | 3,687 (50.5%) | 3,614 (49.5%) |
| College or Associate's Degree | 6,131 (61.4%) | 3,854 (38.6%) |
| Bachelor's Degree | 4,394 (86.9%) | 662 (13.1%) |
| Graduate Degree | 2,318 (86.5%) | 362 (13.5%) |
| Total | 18,065 (63.6%) | 10,339 (36.4%) |
Employment Characteristics in Bexar County
Employment by Class of Employer in Bexar County
Among the 960,800 employed individuals in Bexar County, private company employees (654,240 | 68.1%), local government employees (63,953 | 6.7%), and federal government employees (61,793 | 6.4%) make up the most common classes of employment.
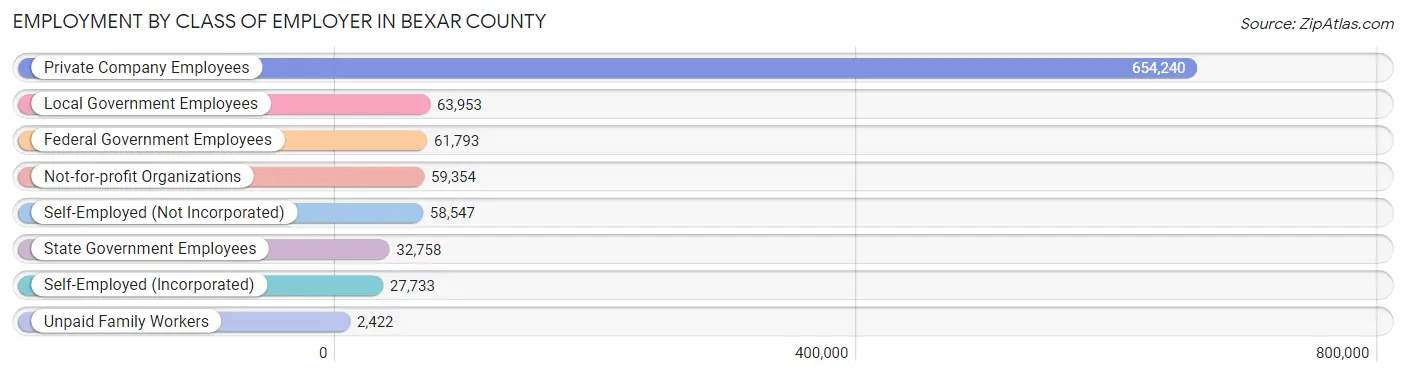
| Employer Class | # Employees | % Employees |
| Private Company Employees | 654,240 | 68.1% |
| Self-Employed (Incorporated) | 27,733 | 2.9% |
| Self-Employed (Not Incorporated) | 58,547 | 6.1% |
| Not-for-profit Organizations | 59,354 | 6.2% |
| Local Government Employees | 63,953 | 6.7% |
| State Government Employees | 32,758 | 3.4% |
| Federal Government Employees | 61,793 | 6.4% |
| Unpaid Family Workers | 2,422 | 0.3% |
| Total | 960,800 | 100.0% |
Employment Status by Age in Bexar County
According to the labor force statistics for Bexar County, out of the total population over 16 years of age (1,566,254), 66.2% or 1,036,860 individuals are in the labor force, with 5.5% or 57,027 of them unemployed. The age group with the highest labor force participation rate is 25 to 29 years, with 83.8% or 132,165 individuals in the labor force. Within the labor force, the 16 to 19 years age range has the highest percentage of unemployed individuals, with 16.0% or 7,125 of them being unemployed.
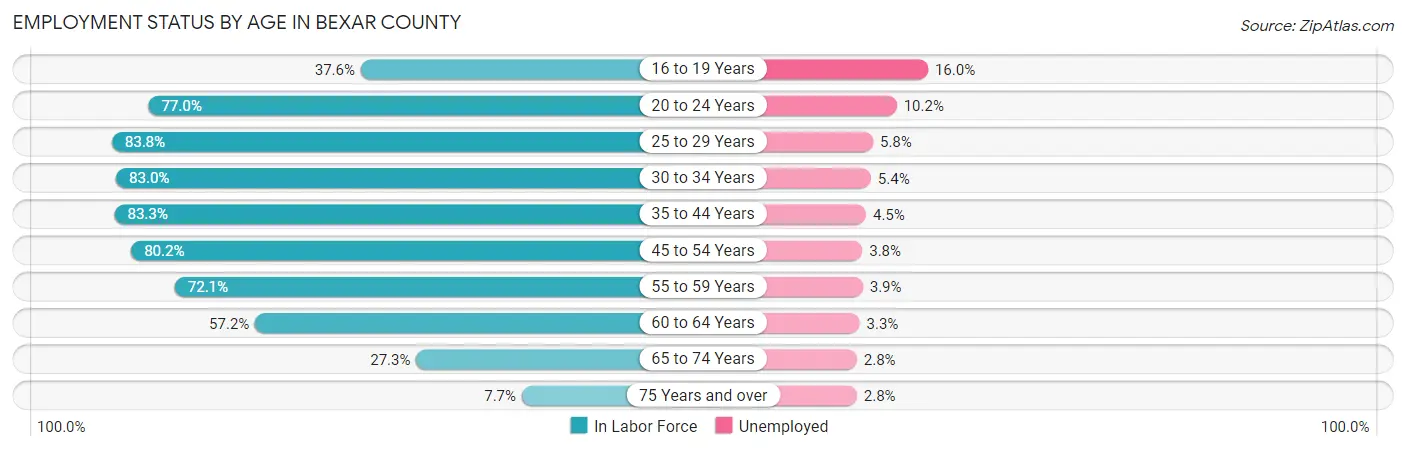
| Age Bracket | In Labor Force | Unemployed |
| 16 to 19 Years | 44,530 (37.6%) | 7,125 (16.0%) |
| 20 to 24 Years | 115,382 (77.0%) | 11,769 (10.2%) |
| 25 to 29 Years | 132,165 (83.8%) | 7,666 (5.8%) |
| 30 to 34 Years | 130,625 (83.0%) | 7,054 (5.4%) |
| 35 to 44 Years | 235,287 (83.3%) | 10,588 (4.5%) |
| 45 to 54 Years | 192,190 (80.2%) | 7,303 (3.8%) |
| 55 to 59 Years | 81,391 (72.1%) | 3,174 (3.9%) |
| 60 to 64 Years | 56,783 (57.2%) | 1,874 (3.3%) |
| 65 to 74 Years | 41,056 (27.3%) | 1,150 (2.8%) |
| 75 Years and over | 7,565 (7.7%) | 212 (2.8%) |
| Total | 1,036,860 (66.2%) | 57,027 (5.5%) |
Employment Status by Educational Attainment in Bexar County
According to labor force statistics for Bexar County, 78.9% of individuals (827,934) out of the total population between 25 and 64 years of age (1,049,346) are in the labor force, with 4.5% or 37,257 of them being unemployed. The group with the highest labor force participation rate are those with the educational attainment of bachelor's degree or higher, with 87.2% or 284,967 individuals in the labor force. Within the labor force, individuals with less than high school education have the highest percentage of unemployment, with 6.1% or 5,124 of them being unemployed.
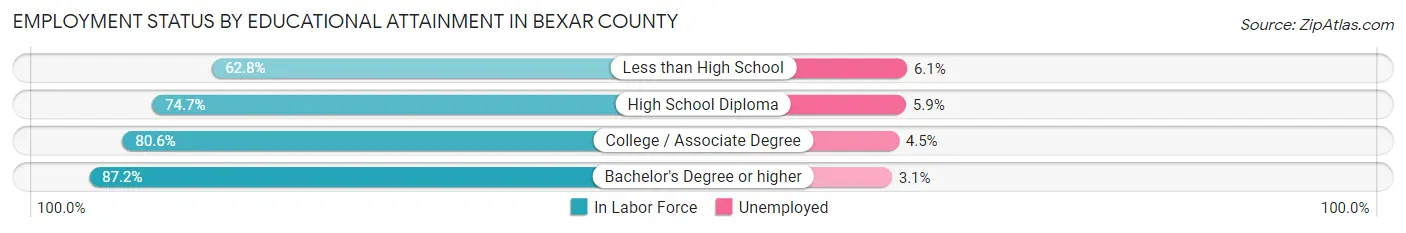
| Educational Attainment | In Labor Force | Unemployed |
| Less than High School | 83,993 (62.8%) | 8,159 (6.1%) |
| High School Diploma | 191,992 (74.7%) | 15,164 (5.9%) |
| College / Associate Degree | 267,418 (80.6%) | 14,930 (4.5%) |
| Bachelor's Degree or higher | 284,967 (87.2%) | 10,131 (3.1%) |
| Total | 827,934 (78.9%) | 47,221 (4.5%) |
Employment Occupations by Sex in Bexar County
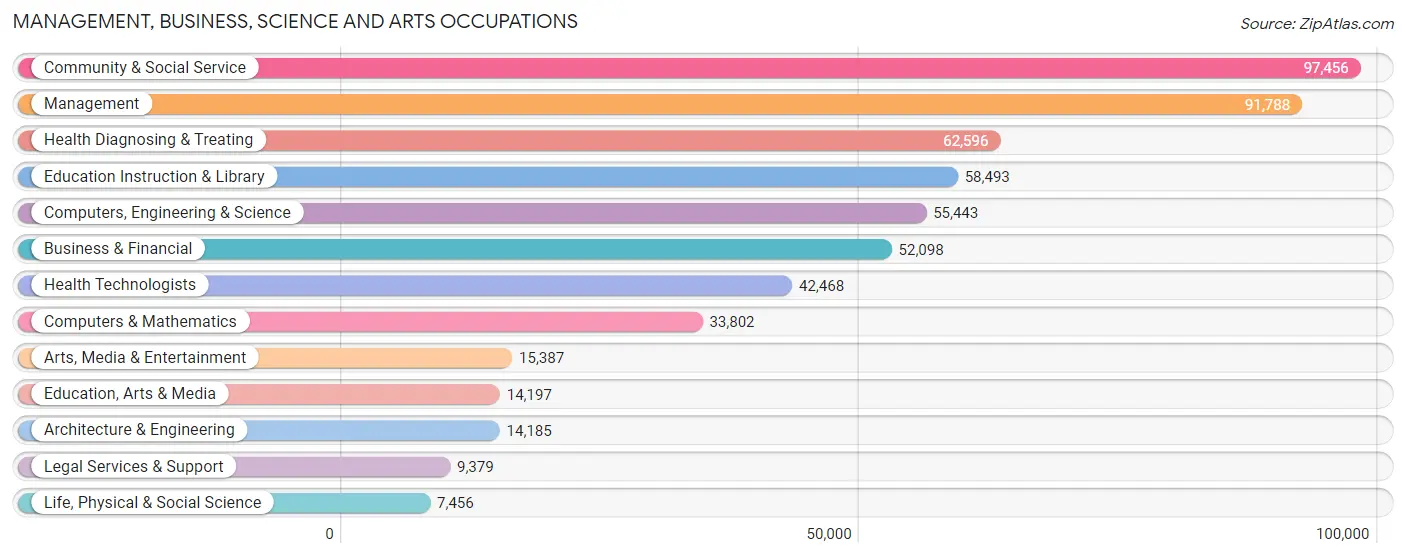
Management, Business, Science and Arts Occupations
The most common Management, Business, Science and Arts occupations in Bexar County are Community & Social Service (97,456 | 10.2%), Management (91,788 | 9.6%), Health Diagnosing & Treating (62,596 | 6.5%), Education Instruction & Library (58,493 | 6.1%), and Computers, Engineering & Science (55,443 | 5.8%).
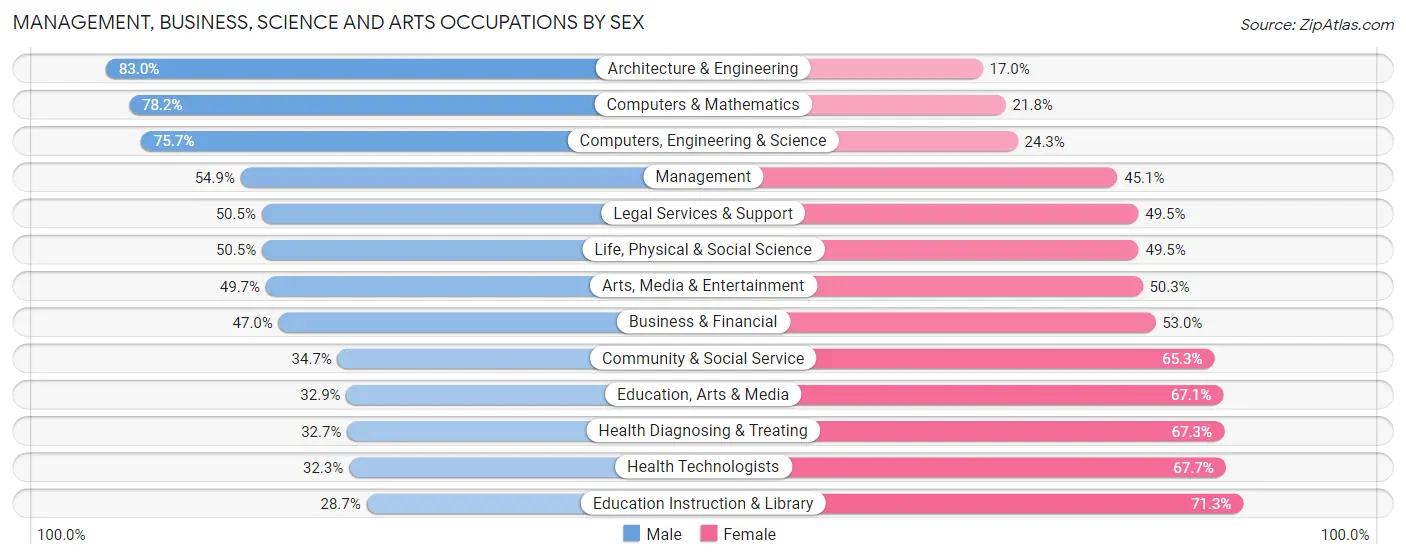
Management, Business, Science and Arts Occupations by Sex
Within the Management, Business, Science and Arts occupations in Bexar County, the most male-oriented occupations are Architecture & Engineering (83.0%), Computers & Mathematics (78.2%), and Computers, Engineering & Science (75.7%), while the most female-oriented occupations are Education Instruction & Library (71.3%), Health Technologists (67.7%), and Health Diagnosing & Treating (67.3%).
| Occupation | Male | Female |
| Management | 50,398 (54.9%) | 41,390 (45.1%) |
| Business & Financial | 24,490 (47.0%) | 27,608 (53.0%) |
| Computers, Engineering & Science | 41,975 (75.7%) | 13,468 (24.3%) |
| Computers & Mathematics | 26,433 (78.2%) | 7,369 (21.8%) |
| Architecture & Engineering | 11,778 (83.0%) | 2,407 (17.0%) |
| Life, Physical & Social Science | 3,764 (50.5%) | 3,692 (49.5%) |
| Community & Social Service | 33,812 (34.7%) | 63,644 (65.3%) |
| Education, Arts & Media | 4,666 (32.9%) | 9,531 (67.1%) |
| Legal Services & Support | 4,739 (50.5%) | 4,640 (49.5%) |
| Education Instruction & Library | 16,765 (28.7%) | 41,728 (71.3%) |
| Arts, Media & Entertainment | 7,642 (49.7%) | 7,745 (50.3%) |
| Health Diagnosing & Treating | 20,469 (32.7%) | 42,127 (67.3%) |
| Health Technologists | 13,724 (32.3%) | 28,744 (67.7%) |
| Total (Category) | 171,144 (47.6%) | 188,237 (52.4%) |
| Total (Overall) | 511,785 (53.4%) | 446,163 (46.6%) |
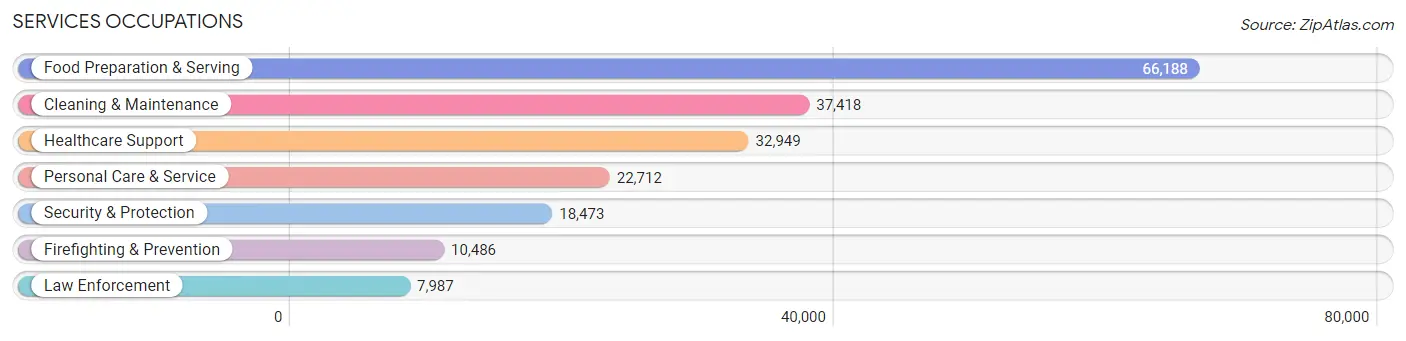
Services Occupations
The most common Services occupations in Bexar County are Food Preparation & Serving (66,188 | 6.9%), Cleaning & Maintenance (37,418 | 3.9%), Healthcare Support (32,949 | 3.4%), Personal Care & Service (22,712 | 2.4%), and Security & Protection (18,473 | 1.9%).
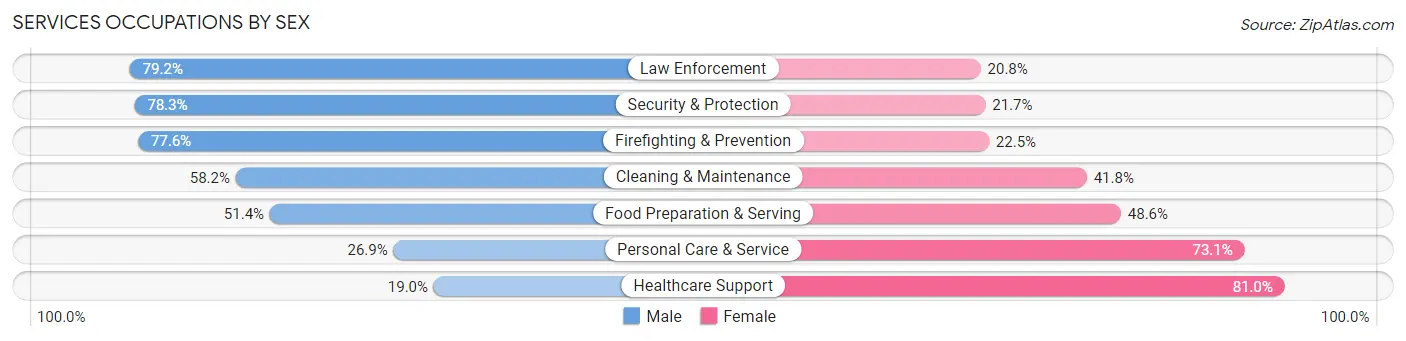
Services Occupations by Sex
Within the Services occupations in Bexar County, the most male-oriented occupations are Law Enforcement (79.2%), Security & Protection (78.3%), and Firefighting & Prevention (77.5%), while the most female-oriented occupations are Healthcare Support (81.0%), Personal Care & Service (73.1%), and Food Preparation & Serving (48.6%).
| Occupation | Male | Female |
| Healthcare Support | 6,247 (19.0%) | 26,702 (81.0%) |
| Security & Protection | 14,458 (78.3%) | 4,015 (21.7%) |
| Firefighting & Prevention | 8,132 (77.5%) | 2,354 (22.5%) |
| Law Enforcement | 6,326 (79.2%) | 1,661 (20.8%) |
| Food Preparation & Serving | 34,037 (51.4%) | 32,151 (48.6%) |
| Cleaning & Maintenance | 21,769 (58.2%) | 15,649 (41.8%) |
| Personal Care & Service | 6,118 (26.9%) | 16,594 (73.1%) |
| Total (Category) | 82,629 (46.5%) | 95,111 (53.5%) |
| Total (Overall) | 511,785 (53.4%) | 446,163 (46.6%) |
Sales and Office Occupations
The most common Sales and Office occupations in Bexar County are Office & Administration (120,952 | 12.6%), and Sales & Related (100,517 | 10.5%).

Sales and Office Occupations by Sex
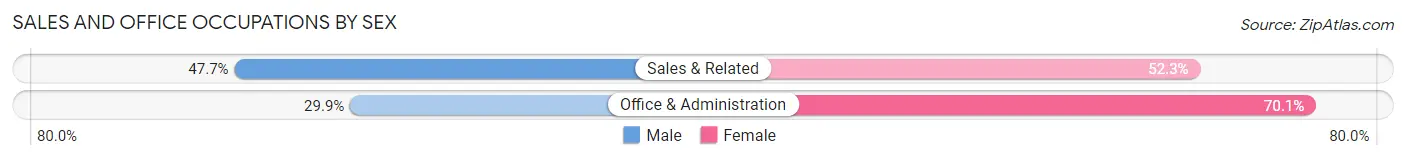
| Occupation | Male | Female |
| Sales & Related | 47,967 (47.7%) | 52,550 (52.3%) |
| Office & Administration | 36,173 (29.9%) | 84,779 (70.1%) |
| Total (Category) | 84,140 (38.0%) | 137,329 (62.0%) |
| Total (Overall) | 511,785 (53.4%) | 446,163 (46.6%) |
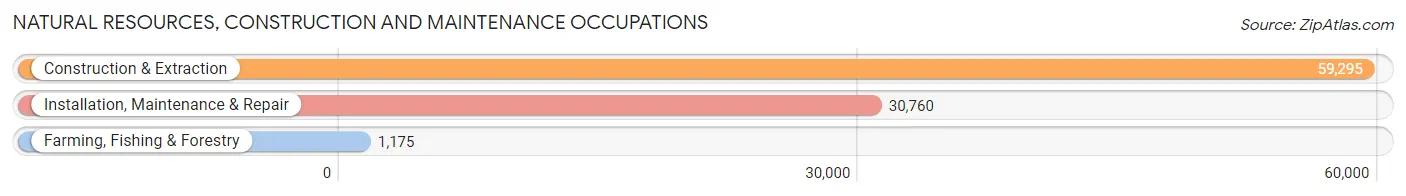
Natural Resources, Construction and Maintenance Occupations
The most common Natural Resources, Construction and Maintenance occupations in Bexar County are Construction & Extraction (59,295 | 6.2%), Installation, Maintenance & Repair (30,760 | 3.2%), and Farming, Fishing & Forestry (1,175 | 0.1%).
Natural Resources, Construction and Maintenance Occupations by Sex
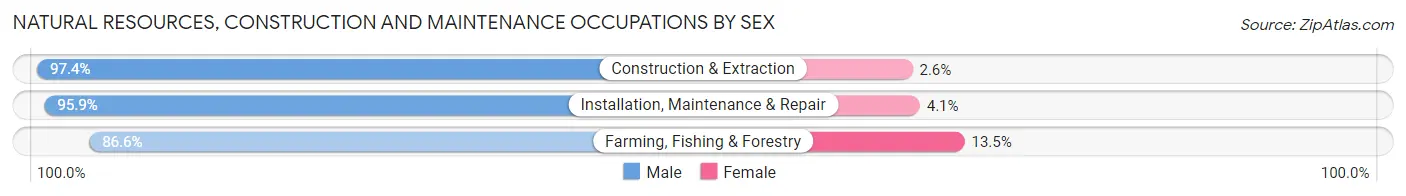
| Occupation | Male | Female |
| Farming, Fishing & Forestry | 1,017 (86.6%) | 158 (13.5%) |
| Construction & Extraction | 57,740 (97.4%) | 1,555 (2.6%) |
| Installation, Maintenance & Repair | 29,490 (95.9%) | 1,270 (4.1%) |
| Total (Category) | 88,247 (96.7%) | 2,983 (3.3%) |
| Total (Overall) | 511,785 (53.4%) | 446,163 (46.6%) |
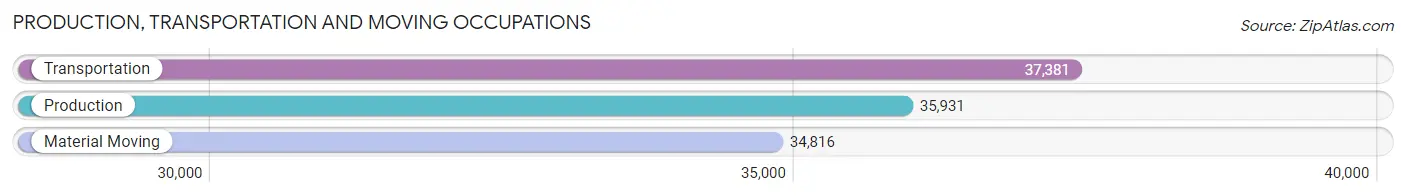
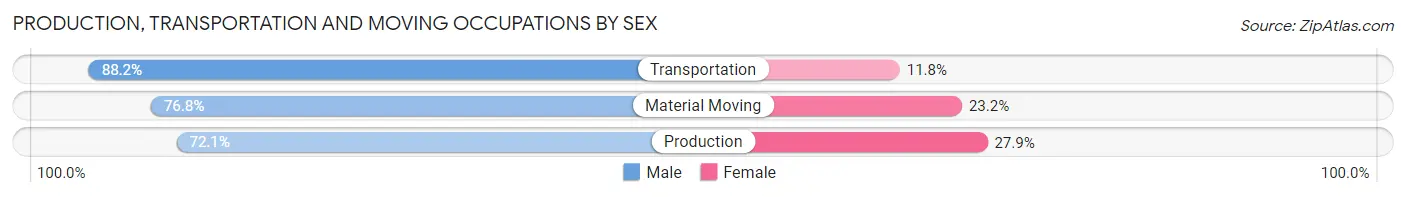
Production, Transportation and Moving Occupations
The most common Production, Transportation and Moving occupations in Bexar County are Transportation (37,381 | 3.9%), Production (35,931 | 3.7%), and Material Moving (34,816 | 3.6%).
Production, Transportation and Moving Occupations by Sex
| Occupation | Male | Female |
| Production | 25,913 (72.1%) | 10,018 (27.9%) |
| Transportation | 32,974 (88.2%) | 4,407 (11.8%) |
| Material Moving | 26,738 (76.8%) | 8,078 (23.2%) |
| Total (Category) | 85,625 (79.2%) | 22,503 (20.8%) |
| Total (Overall) | 511,785 (53.4%) | 446,163 (46.6%) |
Employment Industries by Sex in Bexar County
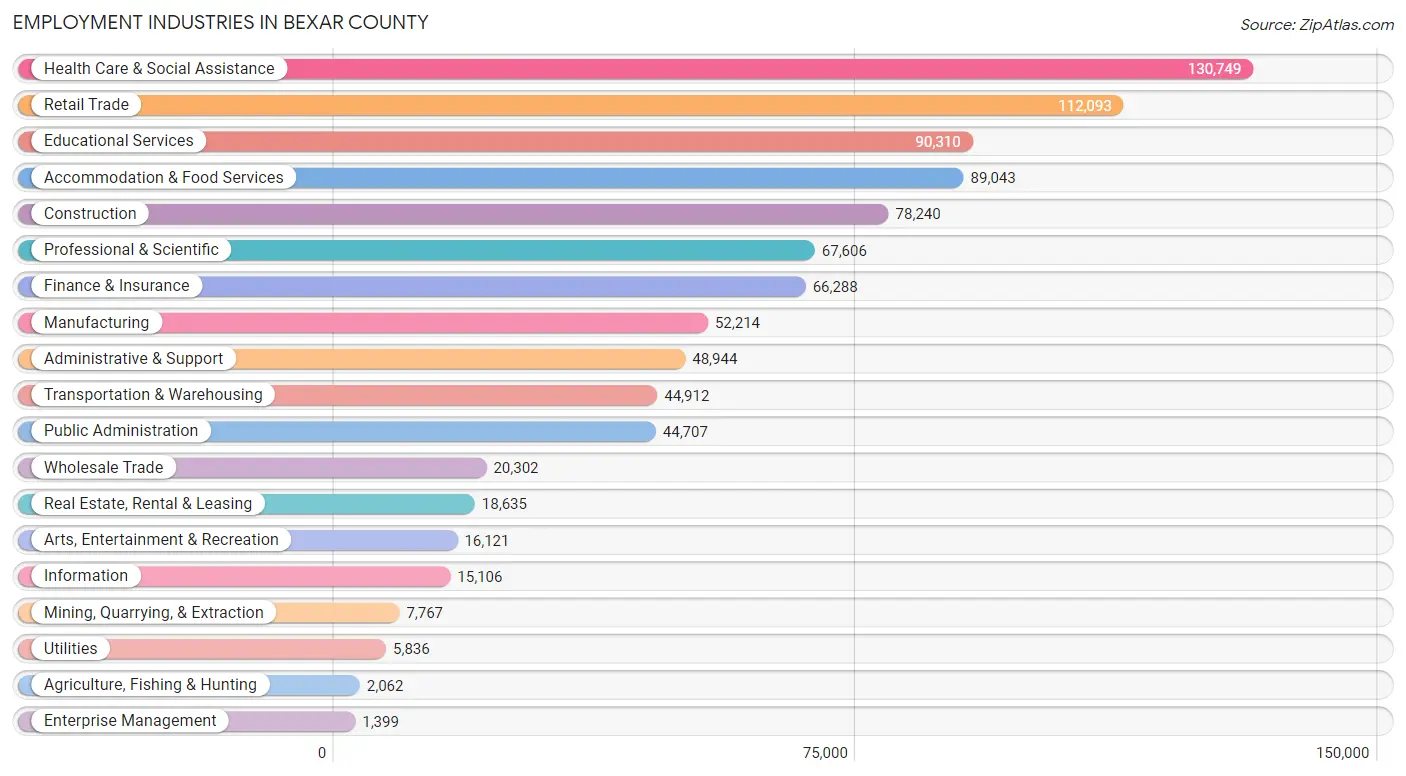
Employment Industries in Bexar County
The major employment industries in Bexar County include Health Care & Social Assistance (130,749 | 13.7%), Retail Trade (112,093 | 11.7%), Educational Services (90,310 | 9.4%), Accommodation & Food Services (89,043 | 9.3%), and Construction (78,240 | 8.2%).
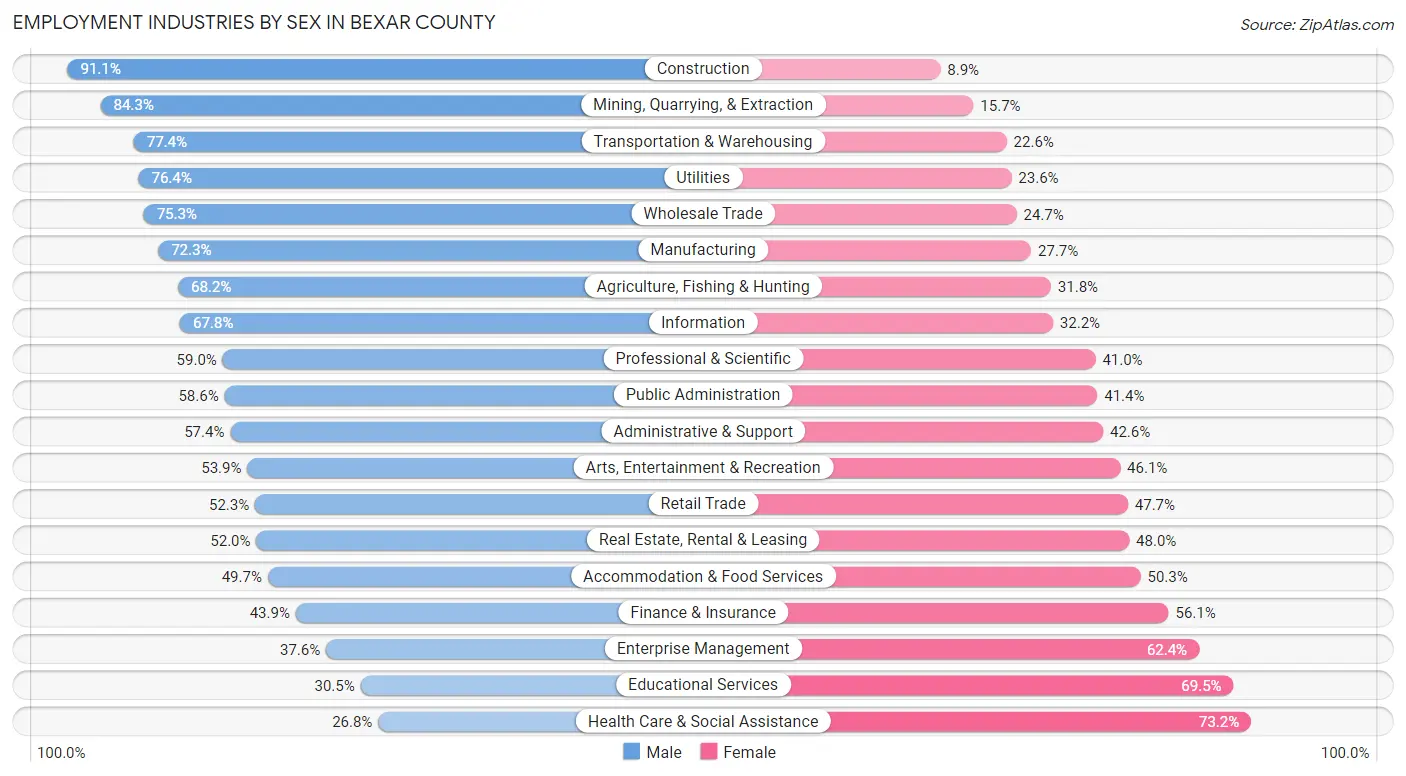
Employment Industries by Sex in Bexar County
The Bexar County industries that see more men than women are Construction (91.1%), Mining, Quarrying, & Extraction (84.3%), and Transportation & Warehousing (77.4%), whereas the industries that tend to have a higher number of women are Health Care & Social Assistance (73.2%), Educational Services (69.5%), and Enterprise Management (62.4%).
| Industry | Male | Female |
| Agriculture, Fishing & Hunting | 1,407 (68.2%) | 655 (31.8%) |
| Mining, Quarrying, & Extraction | 6,545 (84.3%) | 1,222 (15.7%) |
| Construction | 71,287 (91.1%) | 6,953 (8.9%) |
| Manufacturing | 37,768 (72.3%) | 14,446 (27.7%) |
| Wholesale Trade | 15,296 (75.3%) | 5,006 (24.7%) |
| Retail Trade | 58,628 (52.3%) | 53,465 (47.7%) |
| Transportation & Warehousing | 34,757 (77.4%) | 10,155 (22.6%) |
| Utilities | 4,459 (76.4%) | 1,377 (23.6%) |
| Information | 10,245 (67.8%) | 4,861 (32.2%) |
| Finance & Insurance | 29,084 (43.9%) | 37,204 (56.1%) |
| Real Estate, Rental & Leasing | 9,696 (52.0%) | 8,939 (48.0%) |
| Professional & Scientific | 39,895 (59.0%) | 27,711 (41.0%) |
| Enterprise Management | 526 (37.6%) | 873 (62.4%) |
| Administrative & Support | 28,114 (57.4%) | 20,830 (42.6%) |
| Educational Services | 27,504 (30.5%) | 62,806 (69.5%) |
| Health Care & Social Assistance | 35,057 (26.8%) | 95,692 (73.2%) |
| Arts, Entertainment & Recreation | 8,689 (53.9%) | 7,432 (46.1%) |
| Accommodation & Food Services | 44,231 (49.7%) | 44,812 (50.3%) |
| Public Administration | 26,210 (58.6%) | 18,497 (41.4%) |
| Total | 511,785 (53.4%) | 446,163 (46.6%) |
Education in Bexar County
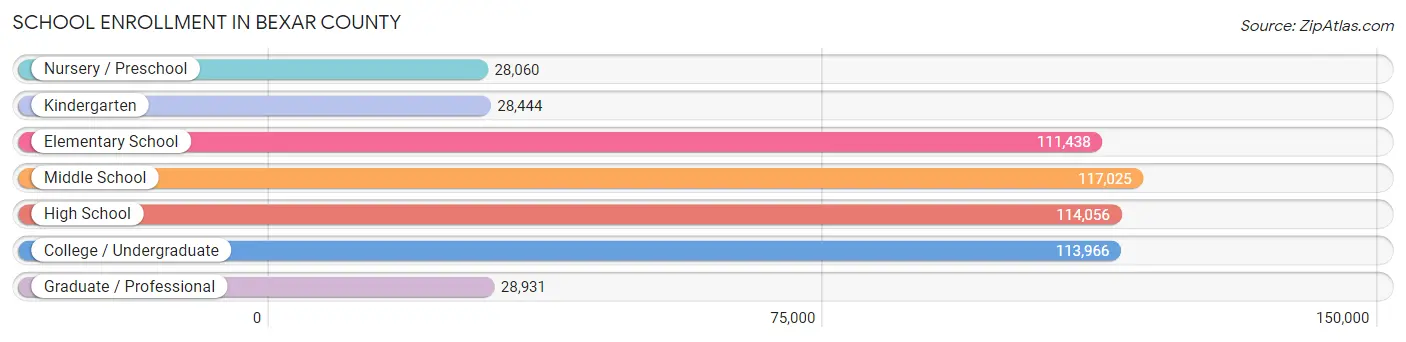
School Enrollment in Bexar County
The most common levels of schooling among the 541,920 students in Bexar County are middle school (117,025 | 21.6%), high school (114,056 | 21.0%), and college / undergraduate (113,966 | 21.0%).
| School Level | # Students | % Students |
| Nursery / Preschool | 28,060 | 5.2% |
| Kindergarten | 28,444 | 5.2% |
| Elementary School | 111,438 | 20.6% |
| Middle School | 117,025 | 21.6% |
| High School | 114,056 | 21.0% |
| College / Undergraduate | 113,966 | 21.0% |
| Graduate / Professional | 28,931 | 5.3% |
| Total | 541,920 | 100.0% |
School Enrollment by Age by Funding Source in Bexar County
Out of a total of 541,920 students who are enrolled in schools in Bexar County, 75,869 (14.0%) attend a private institution, while the remaining 466,051 (86.0%) are enrolled in public schools. The age group of 3 to 4 year olds has the highest likelihood of being enrolled in private schools, with 6,861 (31.0% in the age bracket) enrolled. Conversely, the age group of 15 to 17 year olds has the lowest likelihood of being enrolled in a private school, with 75,811 (91.5% in the age bracket) attending a public institution.
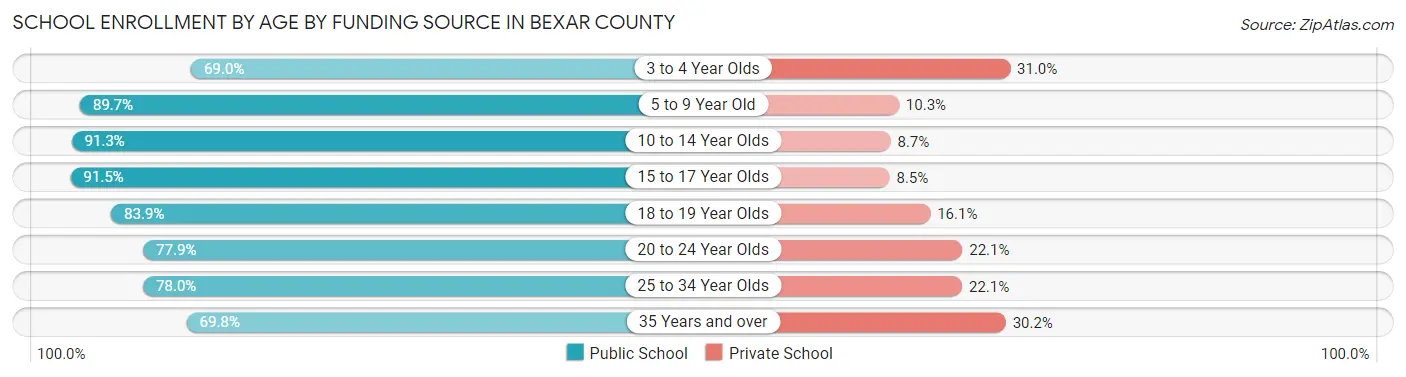
| Age Bracket | Public School | Private School |
| 3 to 4 Year Olds | 15,274 (69.0%) | 6,861 (31.0%) |
| 5 to 9 Year Old | 116,385 (89.7%) | 13,352 (10.3%) |
| 10 to 14 Year Olds | 131,727 (91.3%) | 12,602 (8.7%) |
| 15 to 17 Year Olds | 75,811 (91.5%) | 7,079 (8.5%) |
| 18 to 19 Year Olds | 33,547 (83.9%) | 6,447 (16.1%) |
| 20 to 24 Year Olds | 41,010 (77.9%) | 11,626 (22.1%) |
| 25 to 34 Year Olds | 30,892 (77.9%) | 8,736 (22.1%) |
| 35 Years and over | 21,345 (69.8%) | 9,226 (30.2%) |
| Total | 466,051 (86.0%) | 75,869 (14.0%) |
Educational Attainment by Field of Study in Bexar County
Business (93,469 | 22.1%), science & technology (46,111 | 10.9%), education (45,804 | 10.8%), bio, nature & agricultural (30,383 | 7.2%), and social sciences (27,859 | 6.6%) are the most common fields of study among 422,359 individuals in Bexar County who have obtained a bachelor's degree or higher.
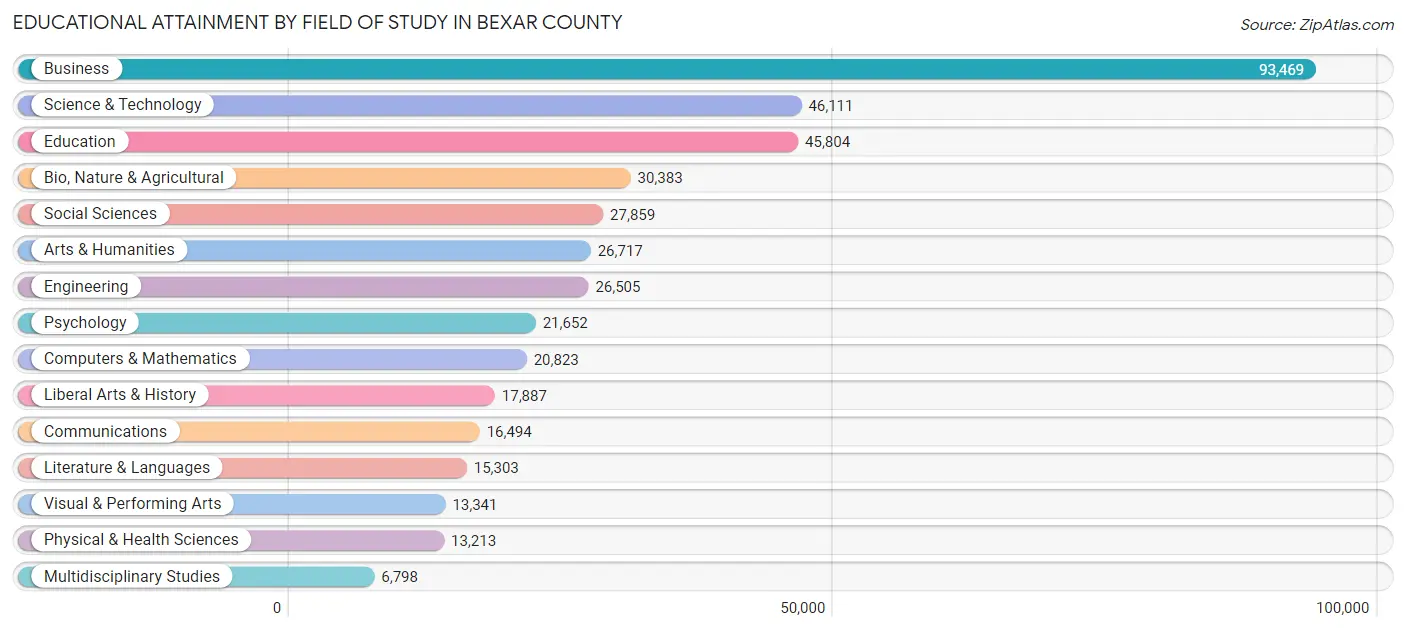
| Field of Study | # Graduates | % Graduates |
| Computers & Mathematics | 20,823 | 4.9% |
| Bio, Nature & Agricultural | 30,383 | 7.2% |
| Physical & Health Sciences | 13,213 | 3.1% |
| Psychology | 21,652 | 5.1% |
| Social Sciences | 27,859 | 6.6% |
| Engineering | 26,505 | 6.3% |
| Multidisciplinary Studies | 6,798 | 1.6% |
| Science & Technology | 46,111 | 10.9% |
| Business | 93,469 | 22.1% |
| Education | 45,804 | 10.8% |
| Literature & Languages | 15,303 | 3.6% |
| Liberal Arts & History | 17,887 | 4.2% |
| Visual & Performing Arts | 13,341 | 3.2% |
| Communications | 16,494 | 3.9% |
| Arts & Humanities | 26,717 | 6.3% |
| Total | 422,359 | 100.0% |
Transportation & Commute in Bexar County
Vehicle Availability by Sex in Bexar County
The most prevalent vehicle ownership categories in Bexar County are males with 2 vehicles (219,922, accounting for 43.0%) and females with 2 vehicles (177,890, making up 50.3%).
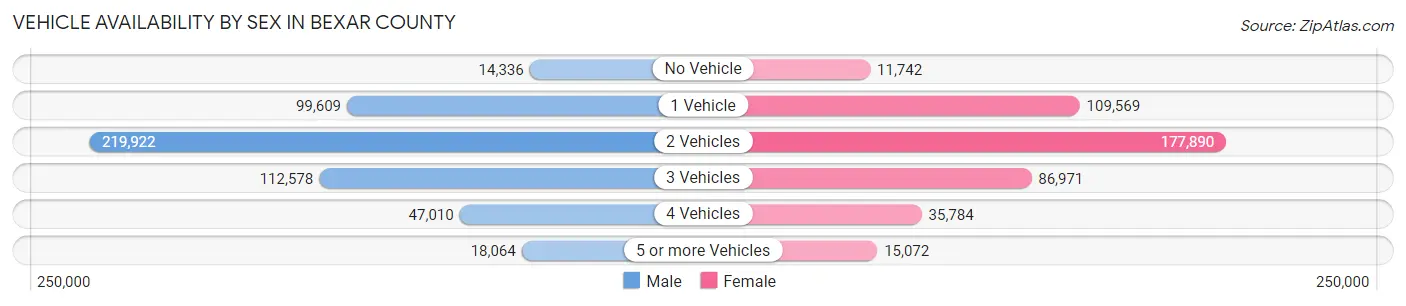
| Vehicles Available | Male | Female |
| No Vehicle | 14,336 (2.8%) | 11,742 (2.7%) |
| 1 Vehicle | 99,609 (19.5%) | 109,569 (25.1%) |
| 2 Vehicles | 219,922 (43.0%) | 177,890 (40.7%) |
| 3 Vehicles | 112,578 (22.0%) | 86,971 (19.9%) |
| 4 Vehicles | 47,010 (9.2%) | 35,784 (8.2%) |
| 5 or more Vehicles | 18,064 (3.5%) | 15,072 (3.5%) |
| Total | 511,519 (100.0%) | 437,028 (100.0%) |
Commute Time in Bexar County
The most frequently occuring commute durations in Bexar County are 20 to 24 minutes (149,511 commuters, 17.4%), 30 to 34 minutes (142,519 commuters, 16.6%), and 15 to 19 minutes (139,168 commuters, 16.2%).
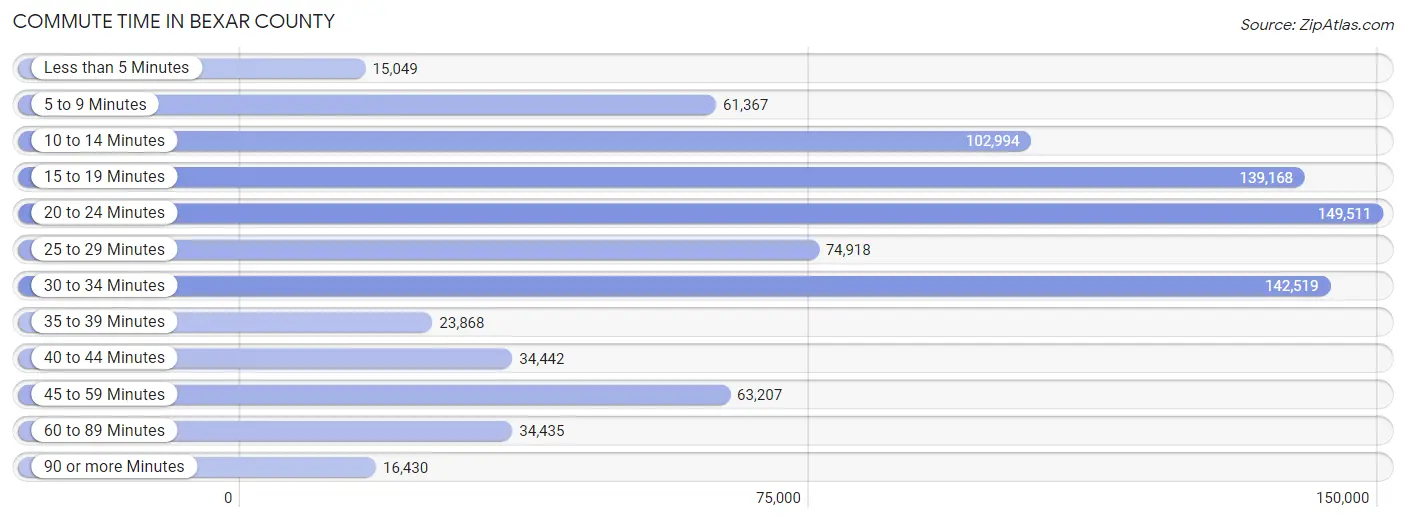
| Commute Time | # Commuters | % Commuters |
| Less than 5 Minutes | 15,049 | 1.8% |
| 5 to 9 Minutes | 61,367 | 7.1% |
| 10 to 14 Minutes | 102,994 | 12.0% |
| 15 to 19 Minutes | 139,168 | 16.2% |
| 20 to 24 Minutes | 149,511 | 17.4% |
| 25 to 29 Minutes | 74,918 | 8.7% |
| 30 to 34 Minutes | 142,519 | 16.6% |
| 35 to 39 Minutes | 23,868 | 2.8% |
| 40 to 44 Minutes | 34,442 | 4.0% |
| 45 to 59 Minutes | 63,207 | 7.4% |
| 60 to 89 Minutes | 34,435 | 4.0% |
| 90 or more Minutes | 16,430 | 1.9% |
Commute Time by Sex in Bexar County
The most common commute times in Bexar County are 30 to 34 minutes (83,980 commuters, 17.9%) for males and 20 to 24 minutes (68,886 commuters, 17.7%) for females.
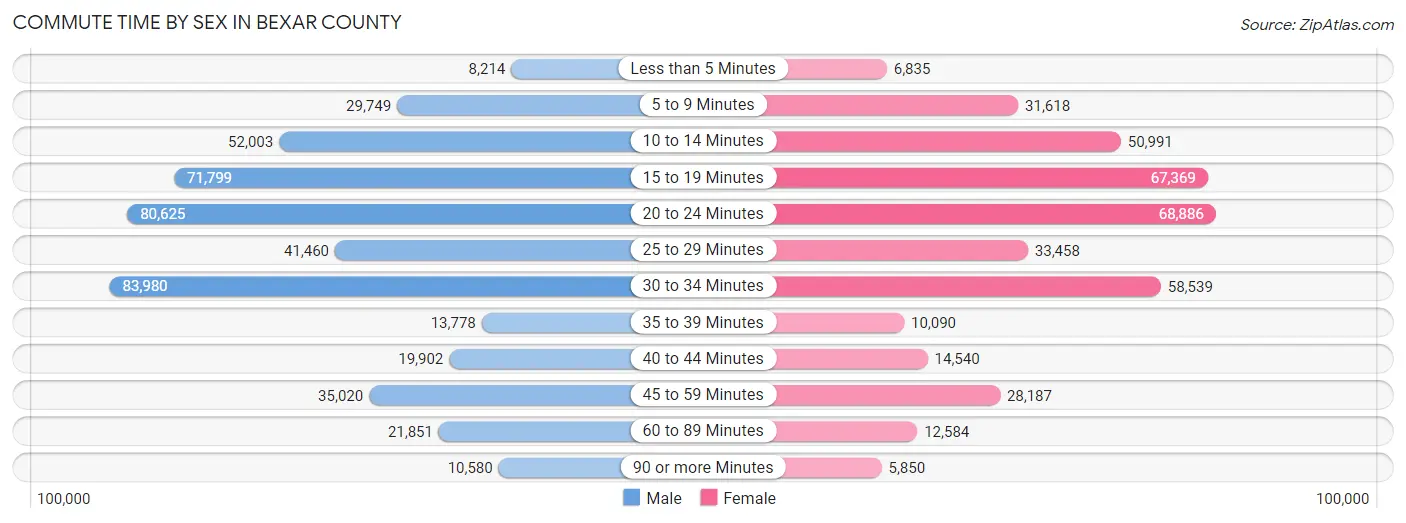
| Commute Time | Male | Female |
| Less than 5 Minutes | 8,214 (1.8%) | 6,835 (1.8%) |
| 5 to 9 Minutes | 29,749 (6.3%) | 31,618 (8.1%) |
| 10 to 14 Minutes | 52,003 (11.1%) | 50,991 (13.1%) |
| 15 to 19 Minutes | 71,799 (15.3%) | 67,369 (17.3%) |
| 20 to 24 Minutes | 80,625 (17.2%) | 68,886 (17.7%) |
| 25 to 29 Minutes | 41,460 (8.8%) | 33,458 (8.6%) |
| 30 to 34 Minutes | 83,980 (17.9%) | 58,539 (15.0%) |
| 35 to 39 Minutes | 13,778 (2.9%) | 10,090 (2.6%) |
| 40 to 44 Minutes | 19,902 (4.2%) | 14,540 (3.7%) |
| 45 to 59 Minutes | 35,020 (7.5%) | 28,187 (7.2%) |
| 60 to 89 Minutes | 21,851 (4.7%) | 12,584 (3.2%) |
| 90 or more Minutes | 10,580 (2.3%) | 5,850 (1.5%) |
Time of Departure to Work by Sex in Bexar County
The most frequent times of departure to work in Bexar County are 7:00 AM to 7:29 AM (65,691, 14.0%) for males and 7:00 AM to 7:29 AM (64,608, 16.6%) for females.
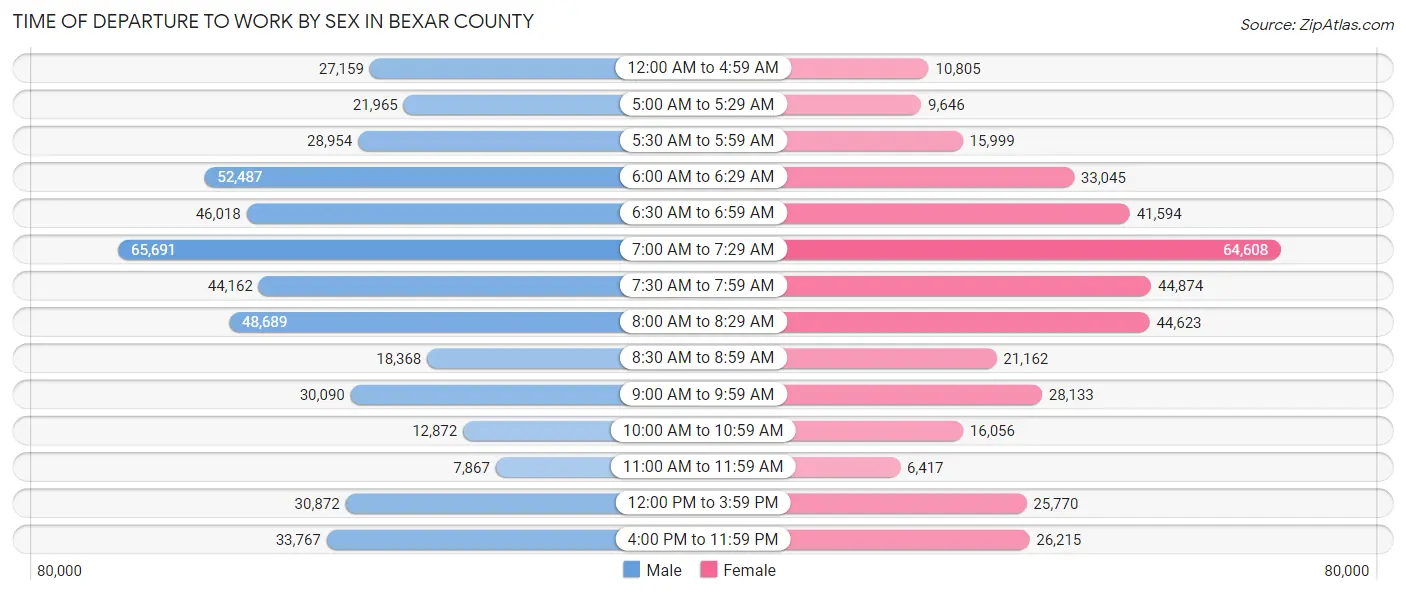
| Time of Departure | Male | Female |
| 12:00 AM to 4:59 AM | 27,159 (5.8%) | 10,805 (2.8%) |
| 5:00 AM to 5:29 AM | 21,965 (4.7%) | 9,646 (2.5%) |
| 5:30 AM to 5:59 AM | 28,954 (6.2%) | 15,999 (4.1%) |
| 6:00 AM to 6:29 AM | 52,487 (11.2%) | 33,045 (8.5%) |
| 6:30 AM to 6:59 AM | 46,018 (9.8%) | 41,594 (10.7%) |
| 7:00 AM to 7:29 AM | 65,691 (14.0%) | 64,608 (16.6%) |
| 7:30 AM to 7:59 AM | 44,162 (9.4%) | 44,874 (11.5%) |
| 8:00 AM to 8:29 AM | 48,689 (10.4%) | 44,623 (11.5%) |
| 8:30 AM to 8:59 AM | 18,368 (3.9%) | 21,162 (5.4%) |
| 9:00 AM to 9:59 AM | 30,090 (6.4%) | 28,133 (7.2%) |
| 10:00 AM to 10:59 AM | 12,872 (2.7%) | 16,056 (4.1%) |
| 11:00 AM to 11:59 AM | 7,867 (1.7%) | 6,417 (1.7%) |
| 12:00 PM to 3:59 PM | 30,872 (6.6%) | 25,770 (6.6%) |
| 4:00 PM to 11:59 PM | 33,767 (7.2%) | 26,215 (6.7%) |
| Total | 468,961 (100.0%) | 388,947 (100.0%) |
Housing Occupancy in Bexar County
Occupancy by Ownership in Bexar County
Of the total 730,119 dwellings in Bexar County, owner-occupied units account for 428,306 (58.7%), while renter-occupied units make up 301,813 (41.3%).
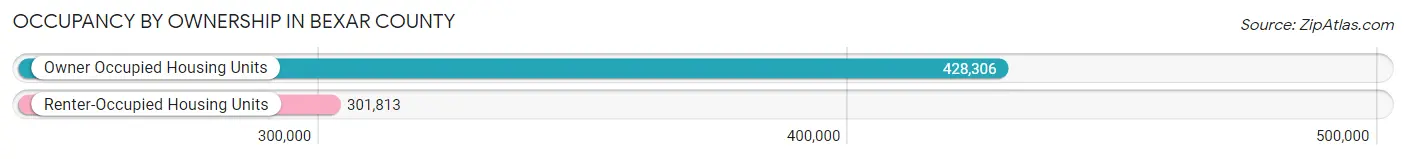
| Occupancy | # Housing Units | % Housing Units |
| Owner Occupied Housing Units | 428,306 | 58.7% |
| Renter-Occupied Housing Units | 301,813 | 41.3% |
| Total Occupied Housing Units | 730,119 | 100.0% |
Occupancy by Household Size in Bexar County
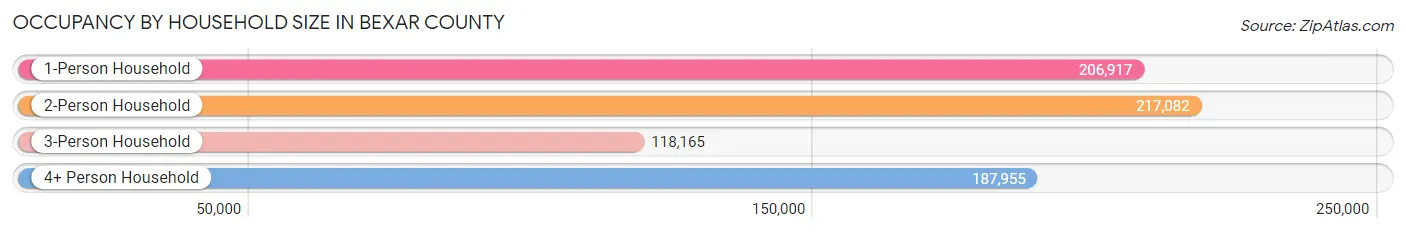
| Household Size | # Housing Units | % Housing Units |
| 1-Person Household | 206,917 | 28.3% |
| 2-Person Household | 217,082 | 29.7% |
| 3-Person Household | 118,165 | 16.2% |
| 4+ Person Household | 187,955 | 25.7% |
| Total Housing Units | 730,119 | 100.0% |
Occupancy by Ownership by Household Size in Bexar County
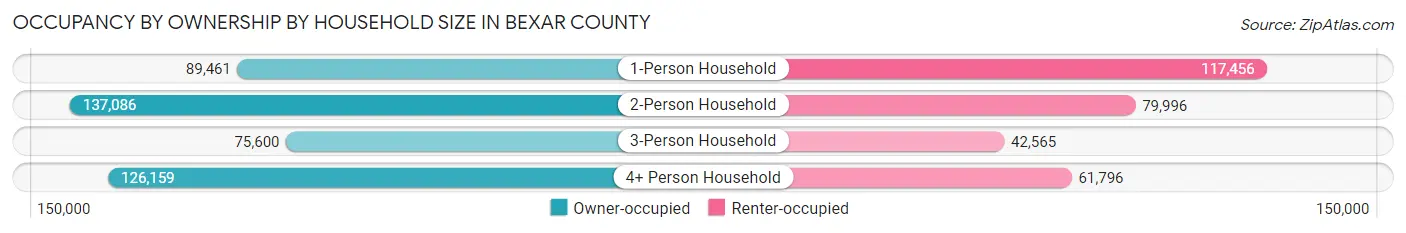
| Household Size | Owner-occupied | Renter-occupied |
| 1-Person Household | 89,461 (43.2%) | 117,456 (56.8%) |
| 2-Person Household | 137,086 (63.1%) | 79,996 (36.8%) |
| 3-Person Household | 75,600 (64.0%) | 42,565 (36.0%) |
| 4+ Person Household | 126,159 (67.1%) | 61,796 (32.9%) |
| Total Housing Units | 428,306 (58.7%) | 301,813 (41.3%) |
Occupancy by Educational Attainment in Bexar County
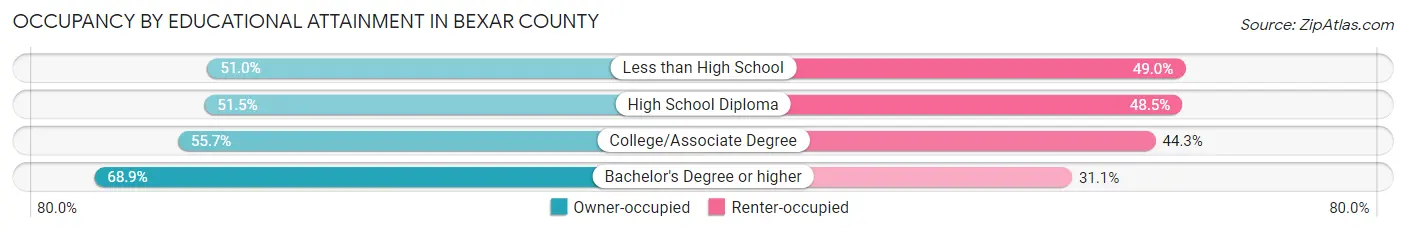
| Household Size | Owner-occupied | Renter-occupied |
| Less than High School | 44,140 (51.0%) | 42,391 (49.0%) |
| High School Diploma | 81,669 (51.5%) | 76,961 (48.5%) |
| College/Associate Degree | 133,590 (55.7%) | 106,342 (44.3%) |
| Bachelor's Degree or higher | 168,907 (68.9%) | 76,119 (31.1%) |
Occupancy by Age of Householder in Bexar County
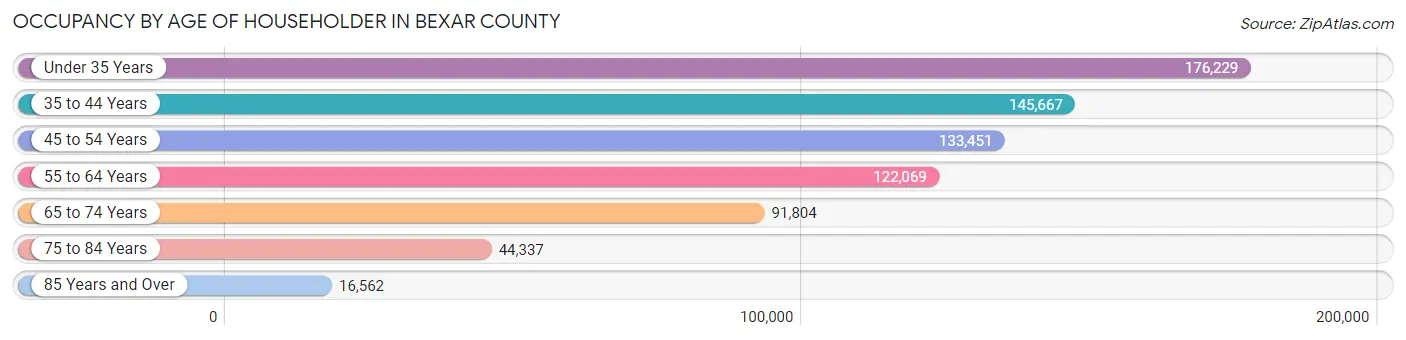
| Age Bracket | # Households | % Households |
| Under 35 Years | 176,229 | 24.1% |
| 35 to 44 Years | 145,667 | 20.0% |
| 45 to 54 Years | 133,451 | 18.3% |
| 55 to 64 Years | 122,069 | 16.7% |
| 65 to 74 Years | 91,804 | 12.6% |
| 75 to 84 Years | 44,337 | 6.1% |
| 85 Years and Over | 16,562 | 2.3% |
| Total | 730,119 | 100.0% |
Housing Finances in Bexar County
Median Income by Occupancy in Bexar County
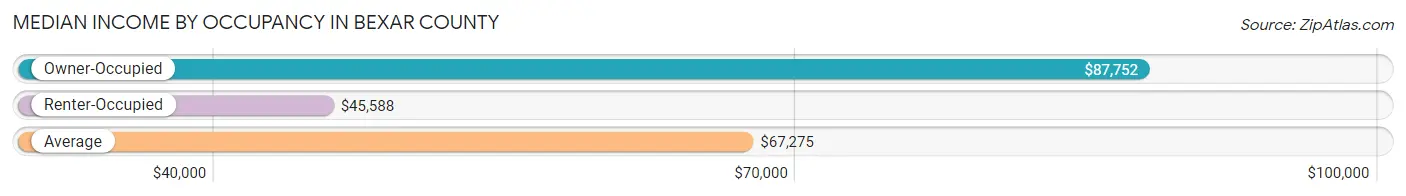
| Occupancy Type | # Households | Median Income |
| Owner-Occupied | 428,306 (58.7%) | $87,752 |
| Renter-Occupied | 301,813 (41.3%) | $45,588 |
| Average | 730,119 (100.0%) | $67,275 |
Occupancy by Householder Income Bracket in Bexar County
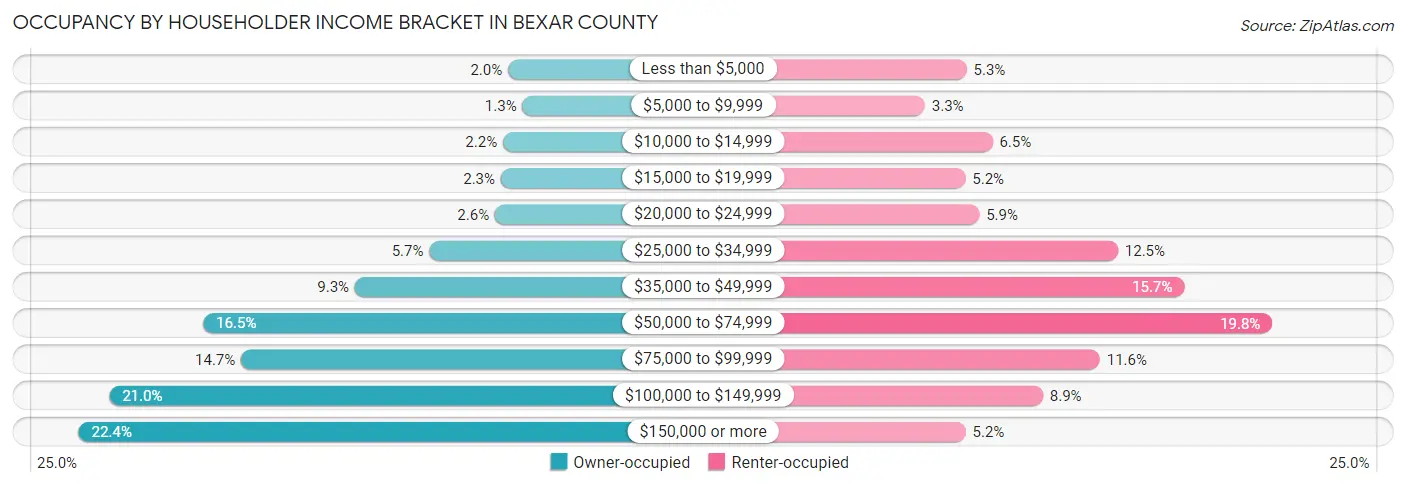
| Income Bracket | Owner-occupied | Renter-occupied |
| Less than $5,000 | 8,482 (2.0%) | 15,954 (5.3%) |
| $5,000 to $9,999 | 5,515 (1.3%) | 9,964 (3.3%) |
| $10,000 to $14,999 | 9,511 (2.2%) | 19,693 (6.5%) |
| $15,000 to $19,999 | 9,934 (2.3%) | 15,795 (5.2%) |
| $20,000 to $24,999 | 11,144 (2.6%) | 17,767 (5.9%) |
| $25,000 to $34,999 | 24,531 (5.7%) | 37,706 (12.5%) |
| $35,000 to $49,999 | 39,715 (9.3%) | 47,241 (15.7%) |
| $50,000 to $74,999 | 70,651 (16.5%) | 59,866 (19.8%) |
| $75,000 to $99,999 | 62,912 (14.7%) | 35,092 (11.6%) |
| $100,000 to $149,999 | 89,823 (21.0%) | 26,909 (8.9%) |
| $150,000 or more | 96,088 (22.4%) | 15,826 (5.2%) |
| Total | 428,306 (100.0%) | 301,813 (100.0%) |
Monthly Housing Cost Tiers in Bexar County
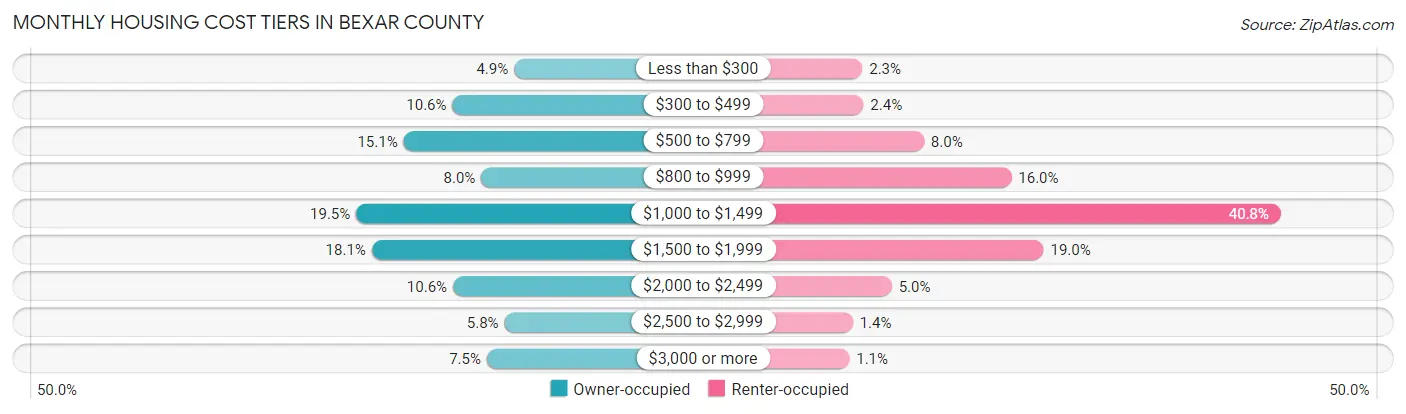
| Monthly Cost | Owner-occupied | Renter-occupied |
| Less than $300 | 21,140 (4.9%) | 6,898 (2.3%) |
| $300 to $499 | 45,485 (10.6%) | 7,203 (2.4%) |
| $500 to $799 | 64,751 (15.1%) | 24,012 (8.0%) |
| $800 to $999 | 34,122 (8.0%) | 48,334 (16.0%) |
| $1,000 to $1,499 | 83,413 (19.5%) | 123,208 (40.8%) |
| $1,500 to $1,999 | 77,295 (18.0%) | 57,299 (19.0%) |
| $2,000 to $2,499 | 45,254 (10.6%) | 15,086 (5.0%) |
| $2,500 to $2,999 | 24,955 (5.8%) | 4,242 (1.4%) |
| $3,000 or more | 31,891 (7.4%) | 3,292 (1.1%) |
| Total | 428,306 (100.0%) | 301,813 (100.0%) |
Physical Housing Characteristics in Bexar County
Housing Structures in Bexar County
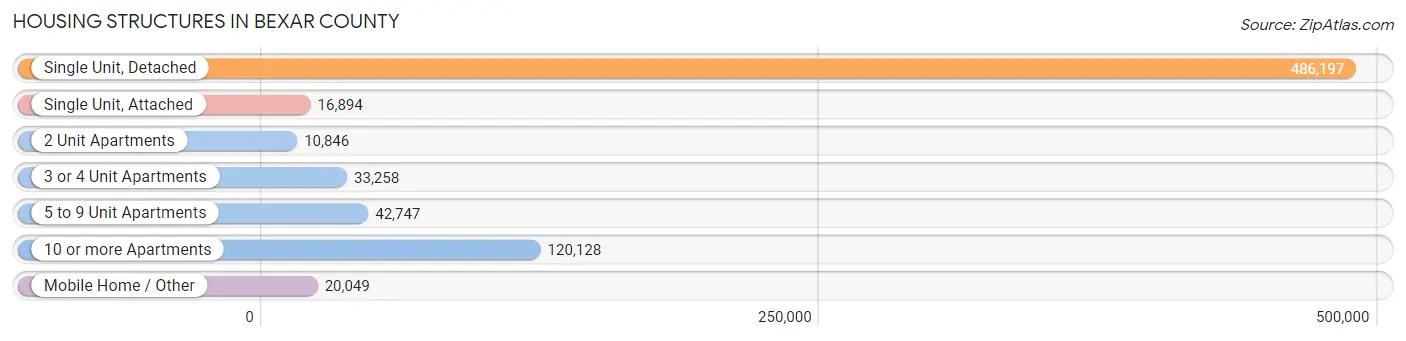
| Structure Type | # Housing Units | % Housing Units |
| Single Unit, Detached | 486,197 | 66.6% |
| Single Unit, Attached | 16,894 | 2.3% |
| 2 Unit Apartments | 10,846 | 1.5% |
| 3 or 4 Unit Apartments | 33,258 | 4.6% |
| 5 to 9 Unit Apartments | 42,747 | 5.9% |
| 10 or more Apartments | 120,128 | 16.5% |
| Mobile Home / Other | 20,049 | 2.8% |
| Total | 730,119 | 100.0% |
Housing Structures by Occupancy in Bexar County
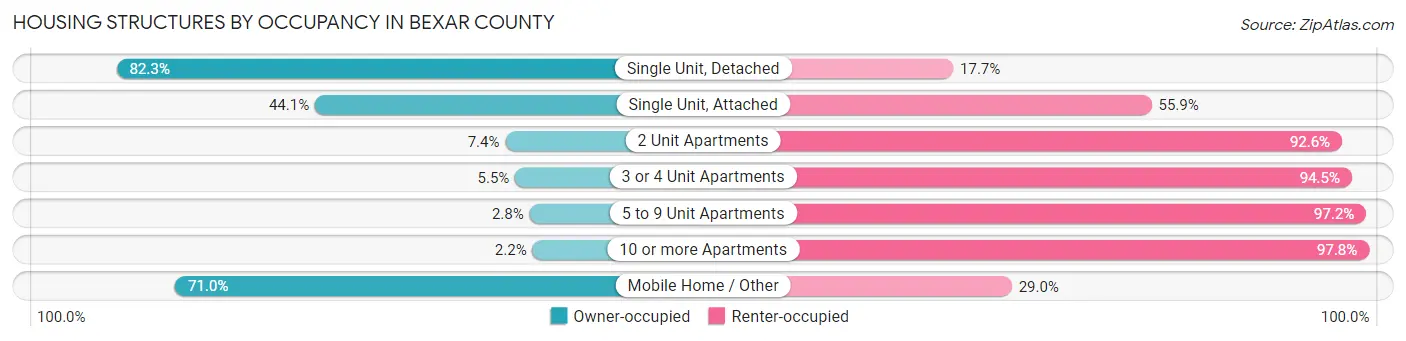
| Structure Type | Owner-occupied | Renter-occupied |
| Single Unit, Detached | 400,128 (82.3%) | 86,069 (17.7%) |
| Single Unit, Attached | 7,449 (44.1%) | 9,445 (55.9%) |
| 2 Unit Apartments | 807 (7.4%) | 10,039 (92.6%) |
| 3 or 4 Unit Apartments | 1,843 (5.5%) | 31,415 (94.5%) |
| 5 to 9 Unit Apartments | 1,189 (2.8%) | 41,558 (97.2%) |
| 10 or more Apartments | 2,651 (2.2%) | 117,477 (97.8%) |
| Mobile Home / Other | 14,239 (71.0%) | 5,810 (29.0%) |
| Total | 428,306 (58.7%) | 301,813 (41.3%) |
Housing Structures by Number of Rooms in Bexar County
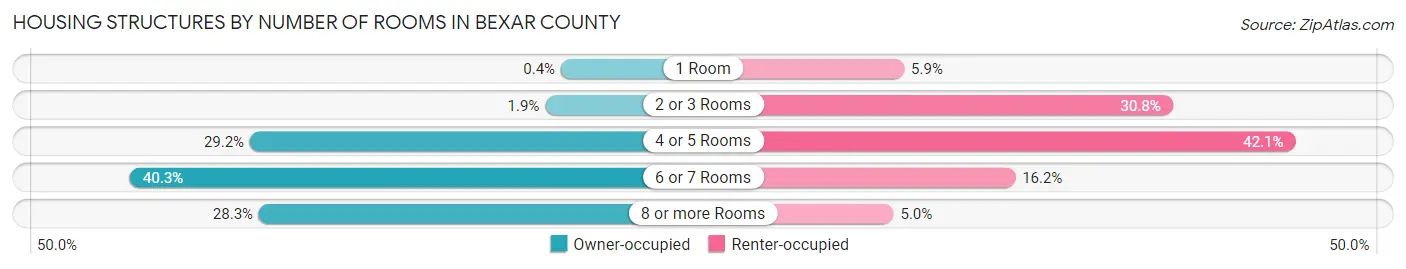
| Number of Rooms | Owner-occupied | Renter-occupied |
| 1 Room | 1,697 (0.4%) | 17,923 (5.9%) |
| 2 or 3 Rooms | 7,923 (1.8%) | 92,872 (30.8%) |
| 4 or 5 Rooms | 124,900 (29.2%) | 127,109 (42.1%) |
| 6 or 7 Rooms | 172,446 (40.3%) | 48,929 (16.2%) |
| 8 or more Rooms | 121,340 (28.3%) | 14,980 (5.0%) |
| Total | 428,306 (100.0%) | 301,813 (100.0%) |
Housing Structure by Heating Type in Bexar County
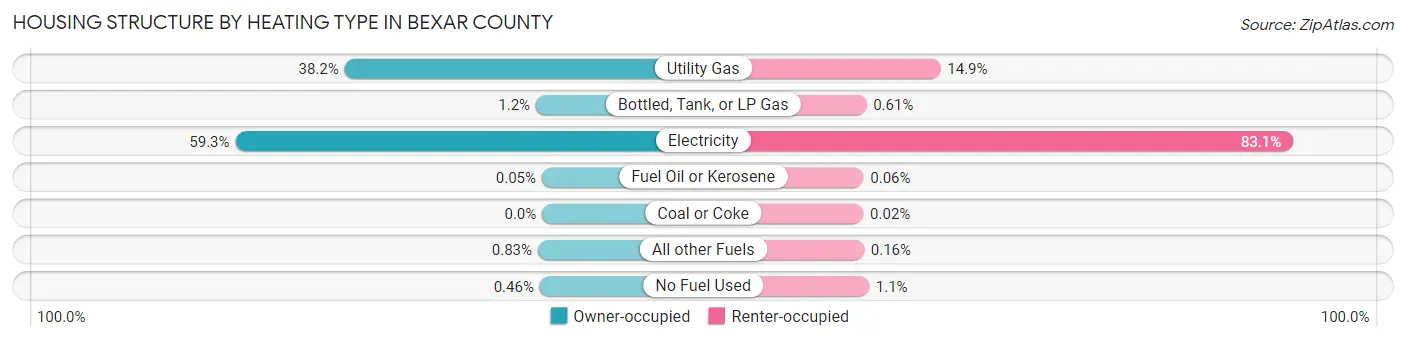
| Heating Type | Owner-occupied | Renter-occupied |
| Utility Gas | 163,529 (38.2%) | 45,097 (14.9%) |
| Bottled, Tank, or LP Gas | 5,120 (1.2%) | 1,851 (0.6%) |
| Electricity | 253,865 (59.3%) | 250,755 (83.1%) |
| Fuel Oil or Kerosene | 235 (0.1%) | 192 (0.1%) |
| Coal or Coke | 19 (0.0%) | 54 (0.0%) |
| All other Fuels | 3,571 (0.8%) | 475 (0.2%) |
| No Fuel Used | 1,967 (0.5%) | 3,389 (1.1%) |
| Total | 428,306 (100.0%) | 301,813 (100.0%) |
Household Vehicle Usage in Bexar County
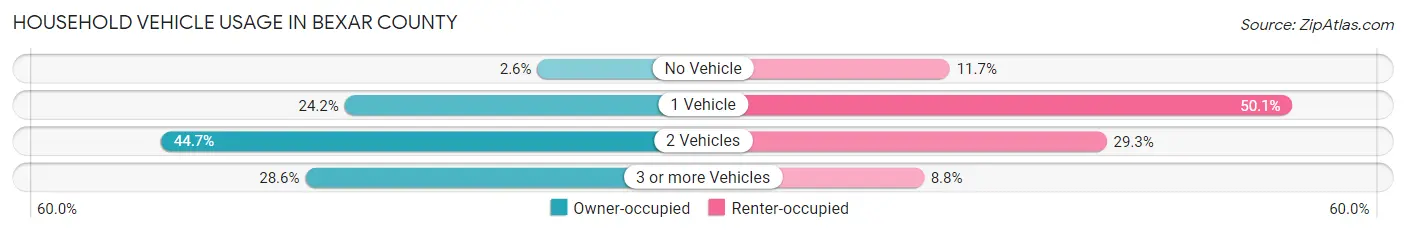
| Vehicles per Household | Owner-occupied | Renter-occupied |
| No Vehicle | 10,944 (2.6%) | 35,425 (11.7%) |
| 1 Vehicle | 103,469 (24.2%) | 151,268 (50.1%) |
| 2 Vehicles | 191,570 (44.7%) | 88,473 (29.3%) |
| 3 or more Vehicles | 122,323 (28.6%) | 26,647 (8.8%) |
| Total | 428,306 (100.0%) | 301,813 (100.0%) |
Real Estate & Mortgages in Bexar County
Real Estate and Mortgage Overview in Bexar County
| Characteristic | Without Mortgage | With Mortgage |
| Housing Units | 167,408 | 260,898 |
| Median Property Value | $179,200 | $243,700 |
| Median Household Income | $65,625 | $70,348 |
| Monthly Housing Costs | $587 | $30,967 |
| Real Estate Taxes | $2,775 | $15,054 |
Property Value by Mortgage Status in Bexar County
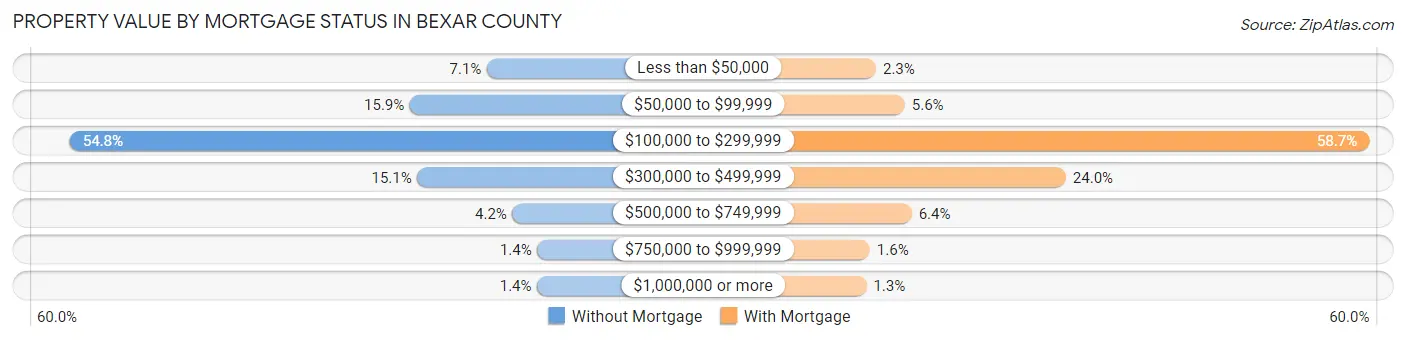
| Property Value | Without Mortgage | With Mortgage |
| Less than $50,000 | 11,930 (7.1%) | 6,115 (2.3%) |
| $50,000 to $99,999 | 26,690 (15.9%) | 14,681 (5.6%) |
| $100,000 to $299,999 | 91,791 (54.8%) | 153,104 (58.7%) |
| $300,000 to $499,999 | 25,270 (15.1%) | 62,732 (24.0%) |
| $500,000 to $749,999 | 7,066 (4.2%) | 16,738 (6.4%) |
| $750,000 to $999,999 | 2,314 (1.4%) | 4,270 (1.6%) |
| $1,000,000 or more | 2,347 (1.4%) | 3,258 (1.3%) |
| Total | 167,408 (100.0%) | 260,898 (100.0%) |
Household Income by Mortgage Status in Bexar County
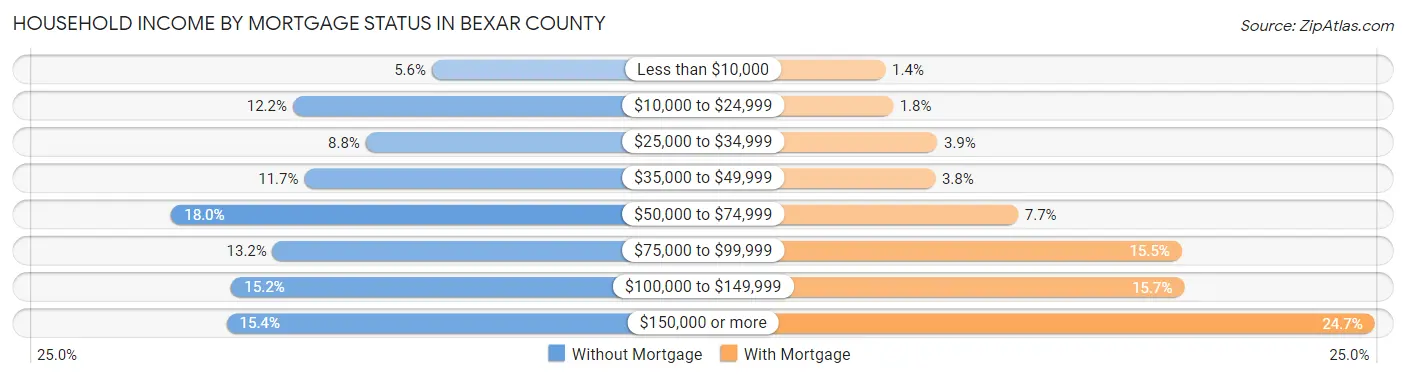
| Household Income | Without Mortgage | With Mortgage |
| Less than $10,000 | 9,386 (5.6%) | 3,680 (1.4%) |
| $10,000 to $24,999 | 20,472 (12.2%) | 4,611 (1.8%) |
| $25,000 to $34,999 | 14,662 (8.8%) | 10,117 (3.9%) |
| $35,000 to $49,999 | 19,558 (11.7%) | 9,869 (3.8%) |
| $50,000 to $74,999 | 30,145 (18.0%) | 20,157 (7.7%) |
| $75,000 to $99,999 | 22,079 (13.2%) | 40,506 (15.5%) |
| $100,000 to $149,999 | 25,366 (15.1%) | 40,833 (15.7%) |
| $150,000 or more | 25,740 (15.4%) | 64,457 (24.7%) |
| Total | 167,408 (100.0%) | 260,898 (100.0%) |
Property Value to Household Income Ratio in Bexar County
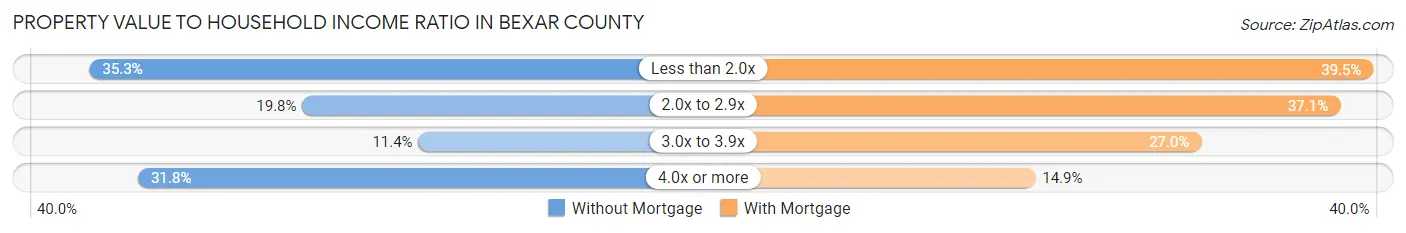
| Value-to-Income Ratio | Without Mortgage | With Mortgage |
| Less than 2.0x | 59,071 (35.3%) | 102,973 (39.5%) |
| 2.0x to 2.9x | 33,186 (19.8%) | 96,651 (37.0%) |
| 3.0x to 3.9x | 19,069 (11.4%) | 70,360 (27.0%) |
| 4.0x or more | 53,165 (31.8%) | 38,933 (14.9%) |
| Total | 167,408 (100.0%) | 260,898 (100.0%) |
Real Estate Taxes by Mortgage Status in Bexar County
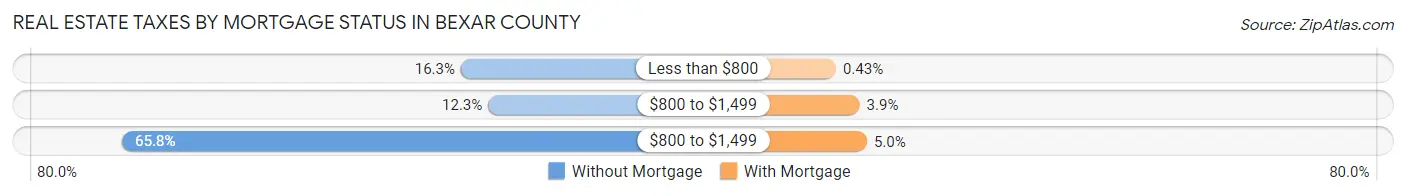
| Property Taxes | Without Mortgage | With Mortgage |
| Less than $800 | 27,223 (16.3%) | 1,131 (0.4%) |
| $800 to $1,499 | 20,544 (12.3%) | 10,153 (3.9%) |
| $800 to $1,499 | 110,073 (65.7%) | 12,928 (5.0%) |
| Total | 167,408 (100.0%) | 260,898 (100.0%) |
Health & Disability in Bexar County
Health Insurance Coverage by Age in Bexar County
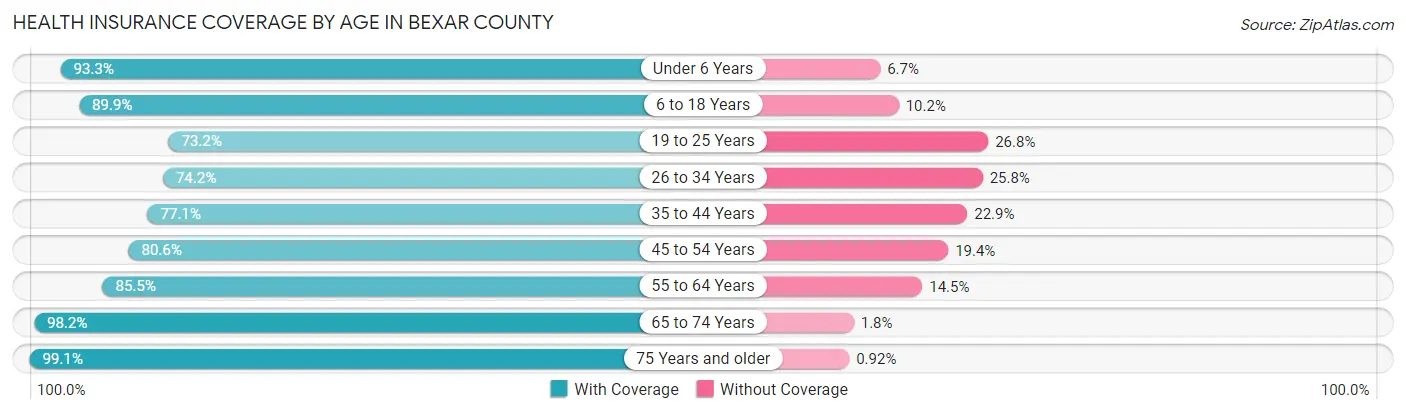
| Age Bracket | With Coverage | Without Coverage |
| Under 6 Years | 149,821 (93.3%) | 10,762 (6.7%) |
| 6 to 18 Years | 336,115 (89.8%) | 37,959 (10.2%) |
| 19 to 25 Years | 147,049 (73.2%) | 53,948 (26.8%) |
| 26 to 34 Years | 203,059 (74.2%) | 70,660 (25.8%) |
| 35 to 44 Years | 213,033 (77.1%) | 63,411 (22.9%) |
| 45 to 54 Years | 191,056 (80.6%) | 45,916 (19.4%) |
| 55 to 64 Years | 179,887 (85.5%) | 30,601 (14.5%) |
| 65 to 74 Years | 146,440 (98.2%) | 2,633 (1.8%) |
| 75 Years and older | 93,802 (99.1%) | 873 (0.9%) |
| Total | 1,660,262 (84.0%) | 316,763 (16.0%) |
Health Insurance Coverage by Citizenship Status in Bexar County
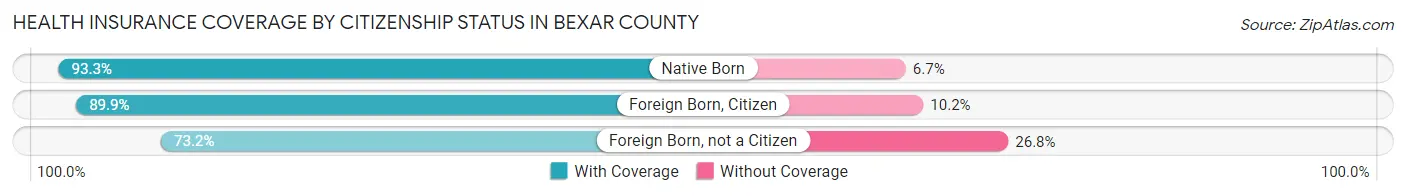
| Citizenship Status | With Coverage | Without Coverage |
| Native Born | 149,821 (93.3%) | 10,762 (6.7%) |
| Foreign Born, Citizen | 336,115 (89.8%) | 37,959 (10.2%) |
| Foreign Born, not a Citizen | 147,049 (73.2%) | 53,948 (26.8%) |
Health Insurance Coverage by Household Income in Bexar County
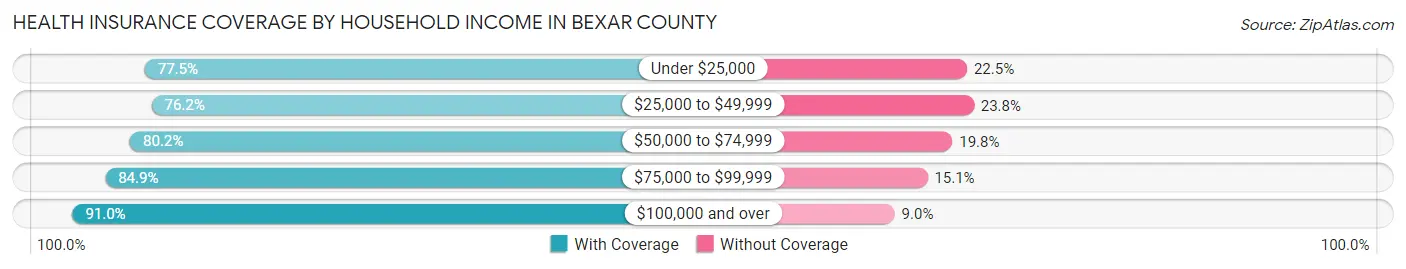
| Household Income | With Coverage | Without Coverage |
| Under $25,000 | 188,721 (77.5%) | 54,854 (22.5%) |
| $25,000 to $49,999 | 266,143 (76.2%) | 83,089 (23.8%) |
| $50,000 to $74,999 | 270,633 (80.2%) | 66,651 (19.8%) |
| $75,000 to $99,999 | 238,425 (84.9%) | 42,436 (15.1%) |
| $100,000 and over | 685,467 (91.0%) | 67,519 (9.0%) |
Public vs Private Health Insurance Coverage by Age in Bexar County
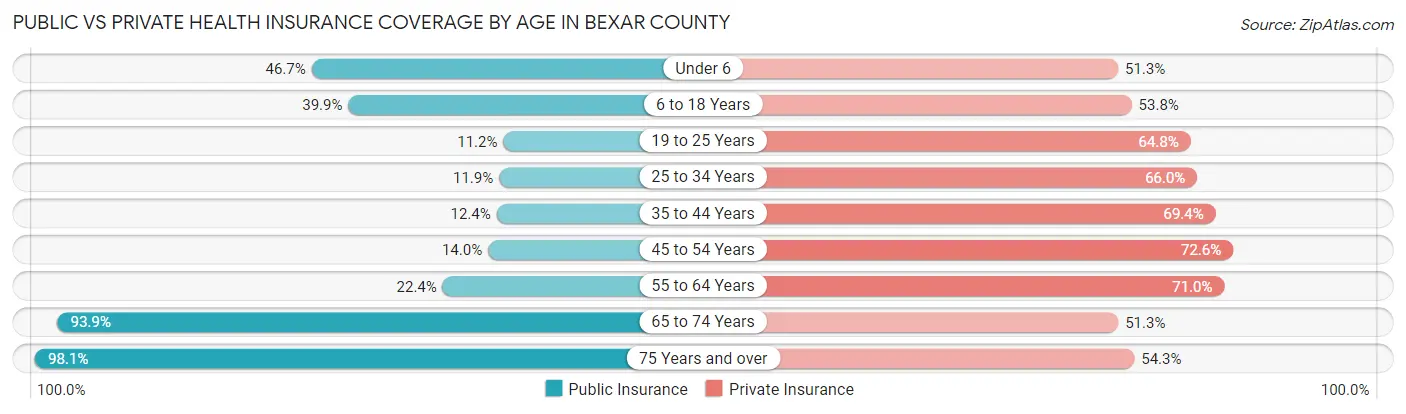
| Age Bracket | Public Insurance | Private Insurance |
| Under 6 | 75,051 (46.7%) | 82,350 (51.3%) |
| 6 to 18 Years | 149,332 (39.9%) | 201,234 (53.8%) |
| 19 to 25 Years | 22,414 (11.2%) | 130,150 (64.7%) |
| 25 to 34 Years | 32,645 (11.9%) | 180,535 (66.0%) |
| 35 to 44 Years | 34,269 (12.4%) | 191,729 (69.4%) |
| 45 to 54 Years | 33,159 (14.0%) | 172,092 (72.6%) |
| 55 to 64 Years | 47,176 (22.4%) | 149,455 (71.0%) |
| 65 to 74 Years | 139,951 (93.9%) | 76,491 (51.3%) |
| 75 Years and over | 92,835 (98.1%) | 51,400 (54.3%) |
| Total | 626,832 (31.7%) | 1,235,436 (62.5%) |
Disability Status by Sex by Age in Bexar County
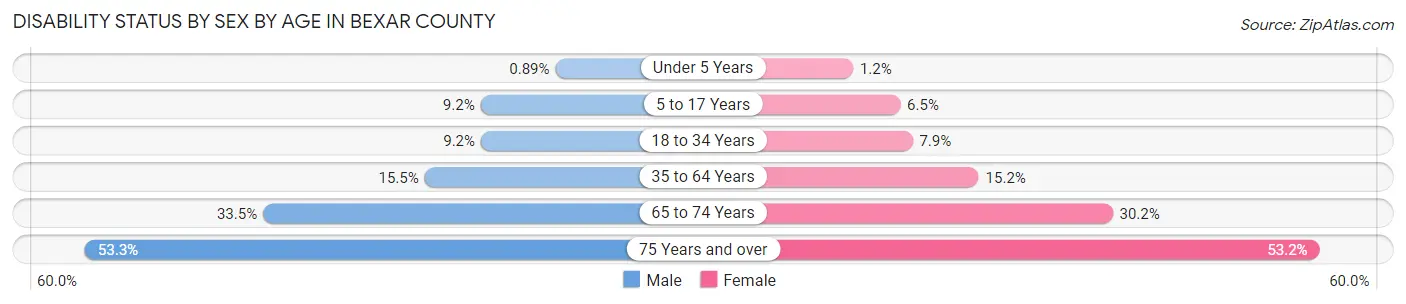
| Age Bracket | Male | Female |
| Under 5 Years | 608 (0.9%) | 813 (1.2%) |
| 5 to 17 Years | 17,439 (9.2%) | 11,825 (6.5%) |
| 18 to 34 Years | 23,460 (9.2%) | 19,661 (7.9%) |
| 35 to 64 Years | 55,193 (15.5%) | 55,910 (15.2%) |
| 65 to 74 Years | 22,760 (33.5%) | 24,436 (30.1%) |
| 75 Years and over | 20,548 (53.3%) | 29,846 (53.2%) |
Disability Class by Sex by Age in Bexar County
Disability Class: Hearing Difficulty
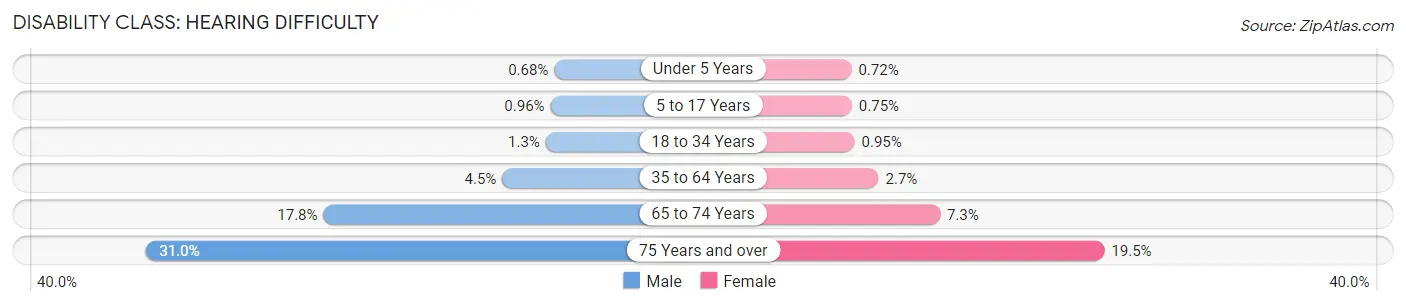
| Age Bracket | Male | Female |
| Under 5 Years | 460 (0.7%) | 470 (0.7%) |
| 5 to 17 Years | 1,817 (1.0%) | 1,362 (0.7%) |
| 18 to 34 Years | 3,331 (1.3%) | 2,369 (0.9%) |
| 35 to 64 Years | 16,203 (4.5%) | 10,033 (2.7%) |
| 65 to 74 Years | 12,124 (17.8%) | 5,906 (7.3%) |
| 75 Years and over | 11,941 (31.0%) | 10,943 (19.5%) |
Disability Class: Vision Difficulty
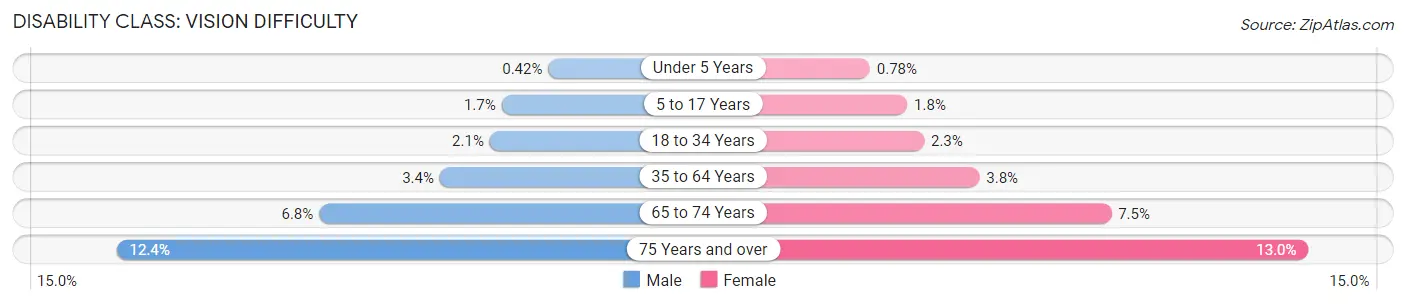
| Age Bracket | Male | Female |
| Under 5 Years | 285 (0.4%) | 510 (0.8%) |
| 5 to 17 Years | 3,241 (1.7%) | 3,304 (1.8%) |
| 18 to 34 Years | 5,238 (2.1%) | 5,724 (2.3%) |
| 35 to 64 Years | 12,292 (3.4%) | 14,055 (3.8%) |
| 65 to 74 Years | 4,628 (6.8%) | 6,077 (7.5%) |
| 75 Years and over | 4,798 (12.4%) | 7,288 (13.0%) |
Disability Class: Cognitive Difficulty
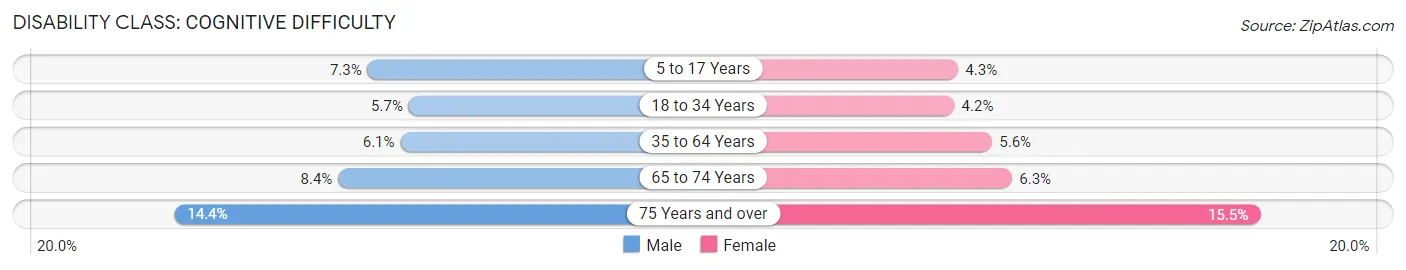
| Age Bracket | Male | Female |
| 5 to 17 Years | 13,741 (7.3%) | 7,875 (4.3%) |
| 18 to 34 Years | 14,645 (5.7%) | 10,461 (4.2%) |
| 35 to 64 Years | 21,590 (6.0%) | 20,505 (5.6%) |
| 65 to 74 Years | 5,688 (8.4%) | 5,128 (6.3%) |
| 75 Years and over | 5,570 (14.4%) | 8,714 (15.5%) |
Disability Class: Ambulatory Difficulty
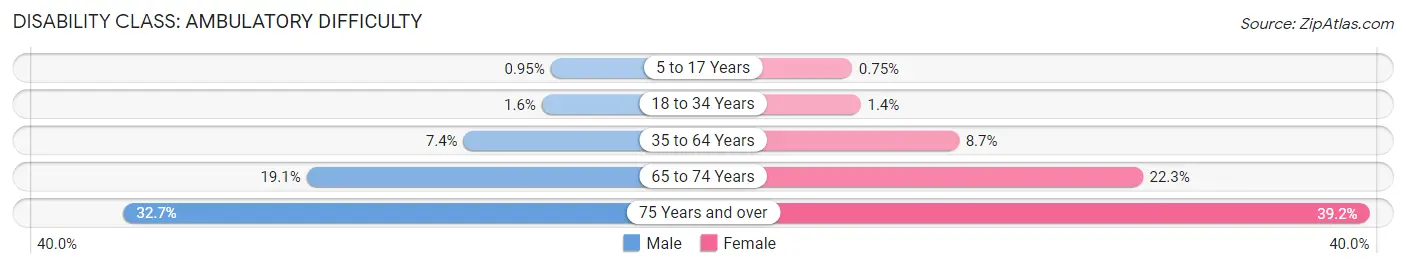
| Age Bracket | Male | Female |
| 5 to 17 Years | 1,802 (0.9%) | 1,369 (0.7%) |
| 18 to 34 Years | 4,098 (1.6%) | 3,468 (1.4%) |
| 35 to 64 Years | 26,478 (7.4%) | 31,859 (8.7%) |
| 65 to 74 Years | 12,972 (19.1%) | 18,096 (22.3%) |
| 75 Years and over | 12,597 (32.7%) | 21,976 (39.2%) |
Disability Class: Self-Care Difficulty
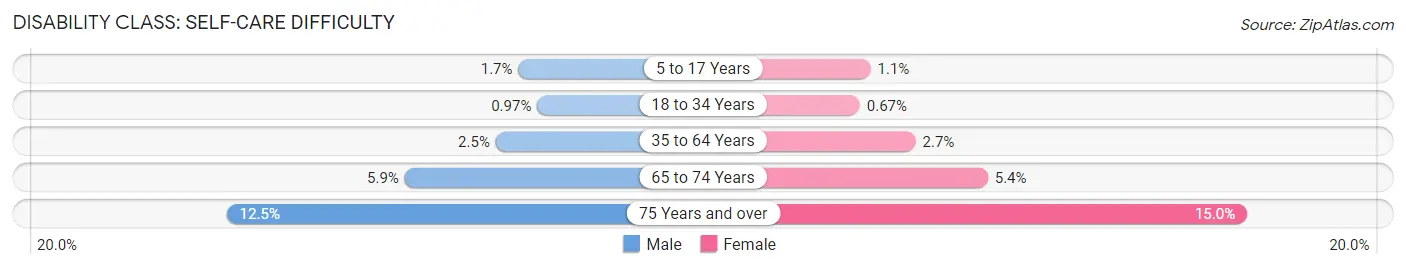
| Age Bracket | Male | Female |
| 5 to 17 Years | 3,160 (1.7%) | 1,943 (1.1%) |
| 18 to 34 Years | 2,467 (1.0%) | 1,673 (0.7%) |
| 35 to 64 Years | 8,963 (2.5%) | 10,039 (2.7%) |
| 65 to 74 Years | 4,010 (5.9%) | 4,391 (5.4%) |
| 75 Years and over | 4,820 (12.5%) | 8,441 (15.0%) |
Technology Access in Bexar County
Computing Device Access in Bexar County
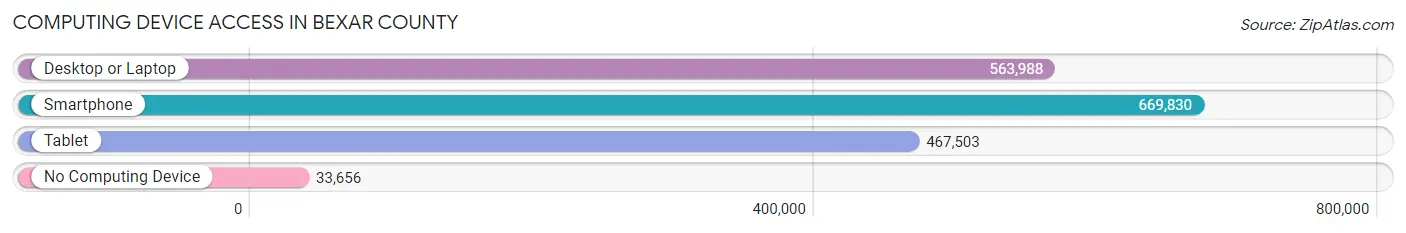
| Device Type | # Households | % Households |
| Desktop or Laptop | 563,988 | 77.2% |
| Smartphone | 669,830 | 91.7% |
| Tablet | 467,503 | 64.0% |
| No Computing Device | 33,656 | 4.6% |
| Total | 730,119 | 100.0% |
Internet Access in Bexar County
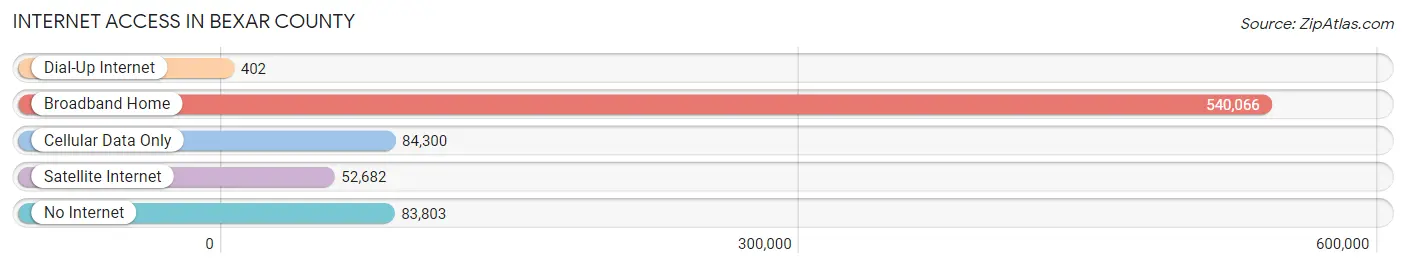
| Internet Type | # Households | % Households |
| Dial-Up Internet | 402 | 0.1% |
| Broadband Home | 540,066 | 74.0% |
| Cellular Data Only | 84,300 | 11.6% |
| Satellite Internet | 52,682 | 7.2% |
| No Internet | 83,803 | 11.5% |
| Total | 730,119 | 100.0% |
Bexar County Summary
Bexar County, Texas is located in the south-central region of the state and is the fourth most populous county in Texas. It is part of the San Antonio-New Braunfels Metropolitan Statistical Area and is home to the city of San Antonio, the seventh most populous city in the United States. Bexar County is bordered by Atascosa, Comal, Guadalupe, Karnes, and Wilson counties.
Geography
Bexar County covers an area of 1,256 square miles and is located in the Edwards Plateau region of Texas. The county is mostly flat with some rolling hills and is drained by the San Antonio River. The county is home to several parks, including Government Canyon State Natural Area, Friedrich Wilderness Park, and San Antonio Missions National Historical Park.
The climate of Bexar County is classified as humid subtropical, with hot summers and mild winters. The average annual temperature is 68°F and the average annual precipitation is 30 inches.
Economy
The economy of Bexar County is largely driven by the tourism industry, with San Antonio being a major tourist destination. The county is also home to several major employers, including USAA, Valero Energy Corporation, and H-E-B Grocery. The county’s unemployment rate was 4.2% in 2019.
Demographics
As of the 2019 census, Bexar County had a population of 2,003,945. The racial makeup of the county was 63.2% White, 5.3% African American, 0.7% Native American, 2.2% Asian, 0.1% Pacific Islander, 25.3% from other races, and 3.2% from two or more races. Hispanic or Latino of any race made up 63.7% of the population.
The median household income in Bexar County was $54,945 in 2019, and the median home value was $164,400. The county’s poverty rate was 15.2%.
Conclusion
Bexar County, Texas is a large and diverse county located in the south-central region of the state. It is home to the city of San Antonio, the seventh most populous city in the United States. The county’s economy is largely driven by the tourism industry, and it is home to several major employers. The population of Bexar County is diverse, with a majority of residents being Hispanic or Latino. The median household income and home value are both above the national average.
Common Questions
What is Per Capita Income in Bexar County?
Per Capita income in Bexar County is $33,963.
What is the Median Family Income in Bexar County?
Median Family Income in Bexar County is $80,748.
What is the Median Household income in Bexar County?
Median Household Income in Bexar County is $67,275.
What is Income or Wage Gap in Bexar County?
Income or Wage Gap in Bexar County is 21.4%.
Women in Bexar County earn 78.6 cents for every dollar earned by a man.
What is Family Income Deficit in Bexar County?
Family Income Deficit in Bexar County is $11,430.
Families that are below poverty line in Bexar County earn $11,430 less on average than the poverty threshold level.
What is Inequality or Gini Index in Bexar County?
Inequality or Gini Index in Bexar County is 0.46.
What is the Total Population of Bexar County?
Total Population of Bexar County is 2,014,059.
What is the Total Male Population of Bexar County?
Total Male Population of Bexar County is 1,001,527.
What is the Total Female Population of Bexar County?
Total Female Population of Bexar County is 1,012,532.
What is the Ratio of Males per 100 Females in Bexar County?
There are 98.91 Males per 100 Females in Bexar County.
What is the Ratio of Females per 100 Males in Bexar County?
There are 101.10 Females per 100 Males in Bexar County.
What is the Median Population Age in Bexar County?
Median Population Age in Bexar County is 34.2 Years.
What is the Average Family Size in Bexar County
Average Family Size in Bexar County is 3.4 People.
What is the Average Household Size in Bexar County
Average Household Size in Bexar County is 2.7 People.
How Large is the Labor Force in Bexar County?
There are 1,036,860 People in the Labor Forcein in Bexar County.
What is the Percentage of People in the Labor Force in Bexar County?
66.2% of People are in the Labor Force in Bexar County.
What is the Unemployment Rate in Bexar County?
Unemployment Rate in Bexar County is 5.5%.