Area Code 210 Map & Demographics
Area Code 210 Map
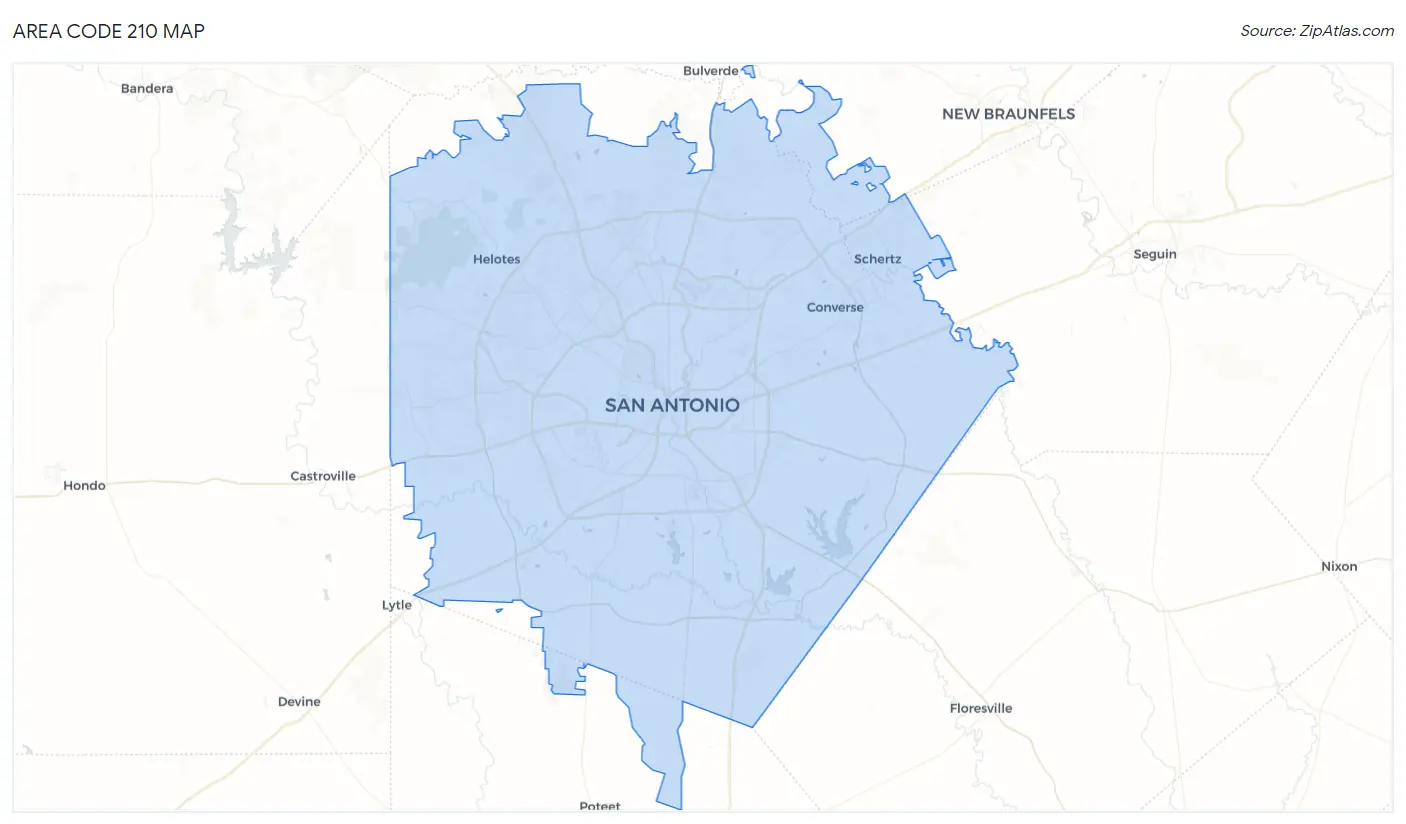
Area Code 210 Overview
$33,709
PER CAPITA INCOME
$82,000
AVG FAMILY INCOME
$65,582
AVG HOUSEHOLD INCOME
21.5%
WAGE / INCOME GAP [ % ]
78.5¢/ $1
WAGE / INCOME GAP [ $ ]
$11,606
FAMILY INCOME DEFICIT
25.71
INEQUALITY / GINI INDEX
1,818,883
TOTAL POPULATION
905,128
MALE POPULATION
913,755
FEMALE POPULATION
99.06
MALES / 100 FEMALES
100.95
FEMALES / 100 MALES
34.4
MEDIAN AGE
3.3
AVG FAMILY SIZE
2.7
AVG HOUSEHOLD SIZE
941,893
LABOR FORCE [ PEOPLE ]
66.4%
PERCENT IN LABOR FORCE
5.8%
UNEMPLOYMENT RATE
Income in Area Code 210
Income Overview in Area Code 210
Per Capita Income in Area Code 210 is $33,709, while median incomes of families and households are $82,000 and $65,582 respectively.
| Characteristic | Number | Measure |
| Per Capita Income | 1,818,883 | $33,709 |
| Median Family Income | 425,545 | $82,000 |
| Mean Family Income | 425,545 | $6,059,315 |
| Median Household Income | 664,155 | $65,582 |
| Mean Household Income | 664,155 | $5,057,017 |
| Income Deficit | 425,545 | $11,606 |
| Wage / Income Gap (%) | 1,818,883 | 21.49% |
| Wage / Income Gap ($) | 1,818,883 | 78.51¢ per $1 |
| Gini / Inequality Index | 1,818,883 | 25.71 |
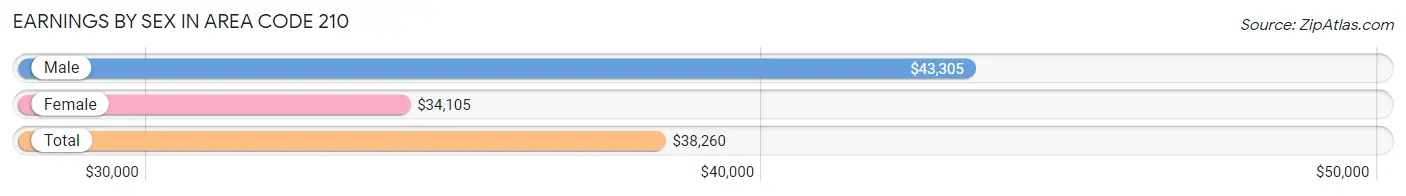
Earnings by Sex in Area Code 210
Average Earnings in Area Code 210 are $38,260, $43,305 for men and $34,105 for women, a difference of 21.2%.
| Sex | Number | Average Earnings |
| Male | 517,418 (53.4%) | $43,305 |
| Female | 450,849 (46.6%) | $34,105 |
| Total | 968,267 (100.0%) | $38,260 |
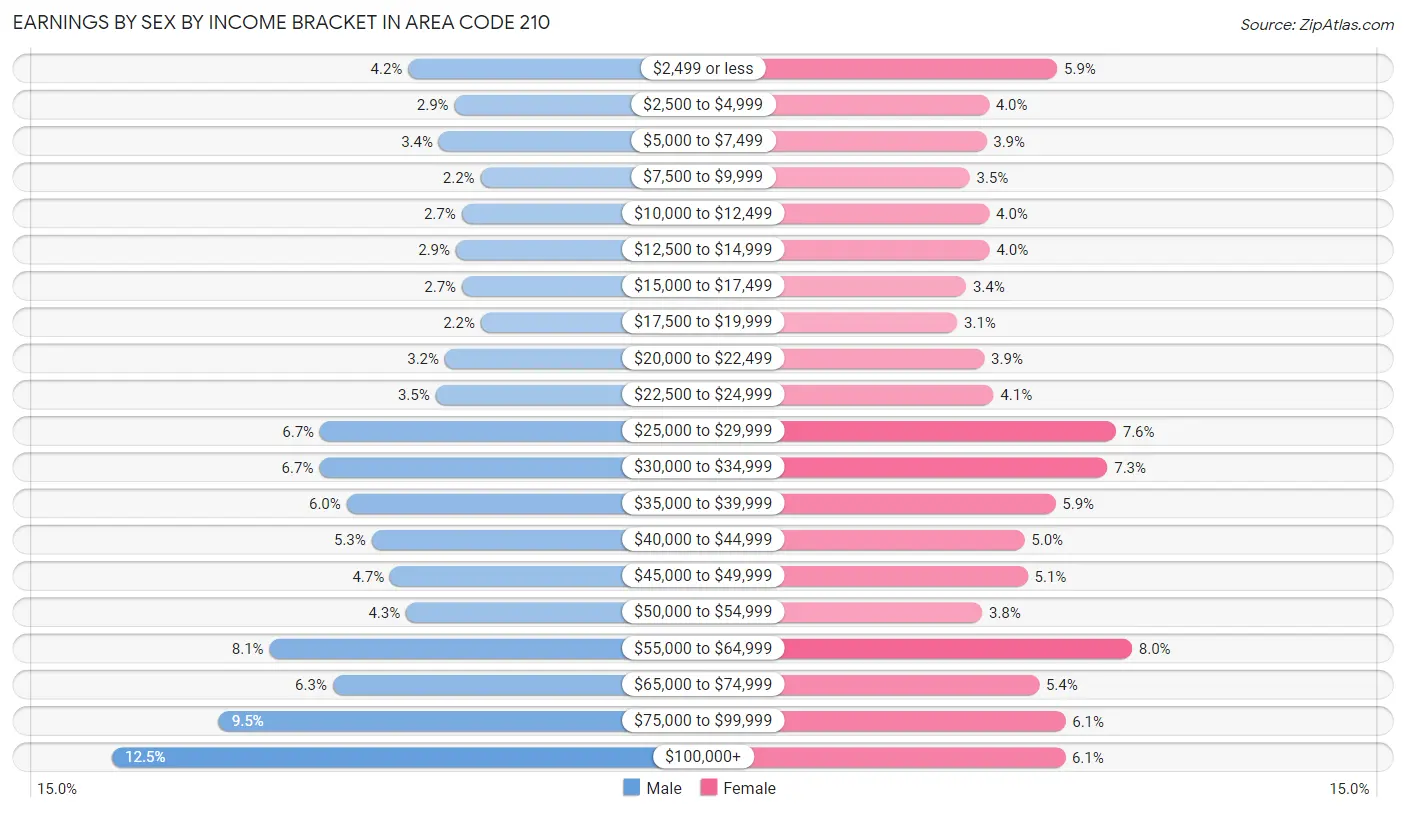
Earnings by Sex by Income Bracket in Area Code 210
The most common earnings brackets in Area Code 210 are $100,000+ for men (64,898 | 12.5%) and $55,000 to $64,999 for women (36,098 | 8.0%).
| Income | Male | Female |
| $2,499 or less | 21,853 (4.2%) | 26,656 (5.9%) |
| $2,500 to $4,999 | 15,115 (2.9%) | 17,972 (4.0%) |
| $5,000 to $7,499 | 17,398 (3.4%) | 17,663 (3.9%) |
| $7,500 to $9,999 | 11,315 (2.2%) | 15,533 (3.5%) |
| $10,000 to $12,499 | 14,073 (2.7%) | 18,044 (4.0%) |
| $12,500 to $14,999 | 14,887 (2.9%) | 18,096 (4.0%) |
| $15,000 to $17,499 | 14,013 (2.7%) | 15,101 (3.4%) |
| $17,500 to $19,999 | 11,270 (2.2%) | 13,998 (3.1%) |
| $20,000 to $22,499 | 16,527 (3.2%) | 17,408 (3.9%) |
| $22,500 to $24,999 | 17,868 (3.5%) | 18,576 (4.1%) |
| $25,000 to $29,999 | 34,676 (6.7%) | 34,098 (7.6%) |
| $30,000 to $34,999 | 34,784 (6.7%) | 32,991 (7.3%) |
| $35,000 to $39,999 | 30,797 (5.9%) | 26,439 (5.9%) |
| $40,000 to $44,999 | 27,154 (5.2%) | 22,491 (5.0%) |
| $45,000 to $49,999 | 24,487 (4.7%) | 22,889 (5.1%) |
| $50,000 to $54,999 | 22,121 (4.3%) | 17,117 (3.8%) |
| $55,000 to $64,999 | 42,026 (8.1%) | 36,098 (8.0%) |
| $65,000 to $74,999 | 32,815 (6.3%) | 24,357 (5.4%) |
| $75,000 to $99,999 | 49,341 (9.5%) | 27,694 (6.1%) |
| $100,000+ | 64,898 (12.5%) | 27,628 (6.1%) |
| Total | 517,418 (100.0%) | 450,849 (100.0%) |
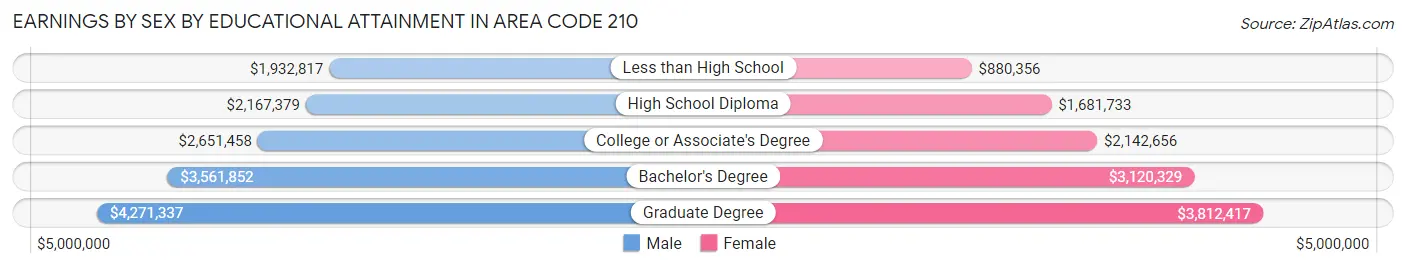
Earnings by Sex by Educational Attainment in Area Code 210
Average earnings in Area Code 210 are $2,933,808 for men and $2,293,892 for women, a difference of 21.8%. Men with an educational attainment of graduate degree enjoy the highest average annual earnings of $4,271,337, while those with less than high school education earn the least with $1,932,817. Women with an educational attainment of graduate degree earn the most with the average annual earnings of $3,812,417, while those with less than high school education have the smallest earnings of $880,356.
| Educational Attainment | Male Income | Female Income |
| Less than High School | $1,932,817 | $880,356 |
| High School Diploma | $2,167,379 | $1,681,733 |
| College or Associate's Degree | $2,651,458 | $2,142,656 |
| Bachelor's Degree | $3,561,852 | $3,120,329 |
| Graduate Degree | $4,271,337 | $3,812,417 |
| Total | $2,933,808 | $2,293,892 |
Family Income in Area Code 210
Family Income Brackets in Area Code 210
According to the Area Code 210 family income data, there are 4,353,751 families falling into the $100,000 to $149,999 income range, which is the most common income bracket and makes up 1,023.1% of all families. Conversely, the $10,000 to $14,999 income bracket is the least frequent group with only 650,658 families (152.9%) belonging to this category.
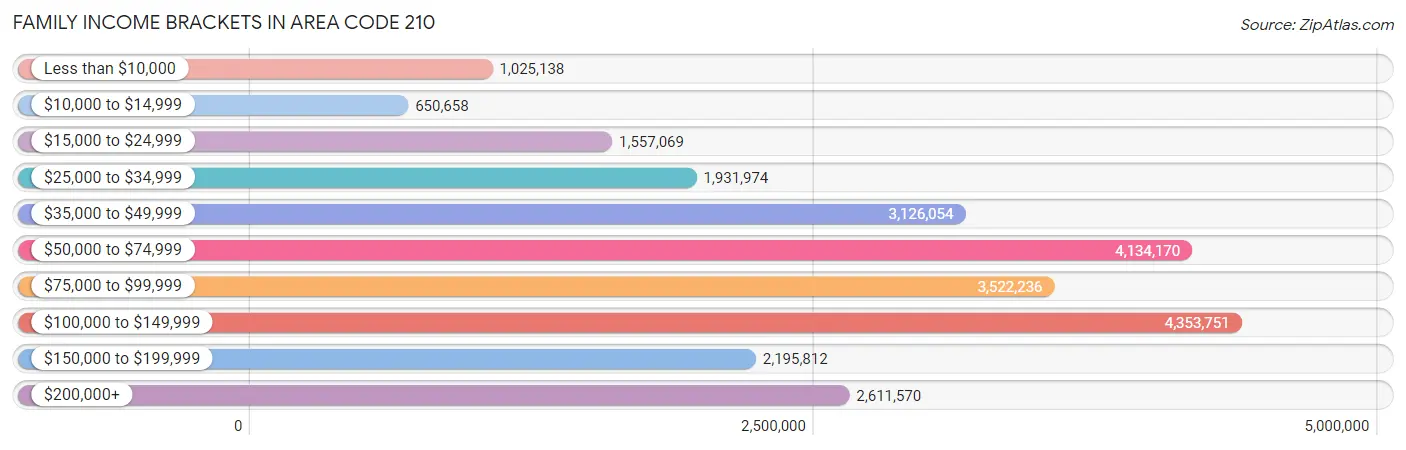
| Income Bracket | # Families | % Families |
| Less than $10,000 | 1,025,138 | 240.9% |
| $10,000 to $14,999 | 650,658 | 152.9% |
| $15,000 to $24,999 | 1,557,069 | 365.9% |
| $25,000 to $34,999 | 1,931,974 | 454.0% |
| $35,000 to $49,999 | 3,126,054 | 734.6% |
| $50,000 to $74,999 | 4,134,170 | 971.5% |
| $75,000 to $99,999 | 3,522,236 | 827.7% |
| $100,000 to $149,999 | 4,353,751 | 1,023.1% |
| $150,000 to $199,999 | 2,195,812 | 516.0% |
| $200,000+ | 2,611,570 | 613.7% |
Family Income by Famaliy Size in Area Code 210
7+ person families (10,525 | 2.5%) account for the highest median family income in Area Code 210 with $102,787 per family, while 2-person families (172,926 | 40.6%) have the highest median income of $37,105 per family member.
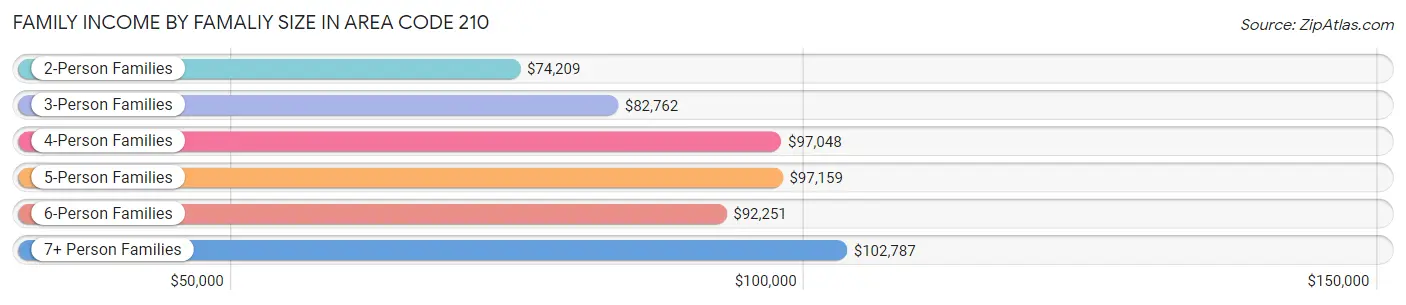
| Income Bracket | # Families | Median Income |
| 2-Person Families | 172,926 (40.6%) | $74,209 |
| 3-Person Families | 99,613 (23.4%) | $82,762 |
| 4-Person Families | 81,494 (19.2%) | $97,048 |
| 5-Person Families | 44,238 (10.4%) | $97,159 |
| 6-Person Families | 16,749 (3.9%) | $92,251 |
| 7+ Person Families | 10,525 (2.5%) | $102,787 |
| Total | 425,545 (100.0%) | $82,000 |
Family Income by Number of Earners in Area Code 210
The median family income in Area Code 210 is $82,000, with families comprising 3+ earners (55,108) having the highest median family income of $131,699, while families with no earners (49,199) have the lowest median family income of $48,740, accounting for 13.0% and 11.6% of families, respectively.
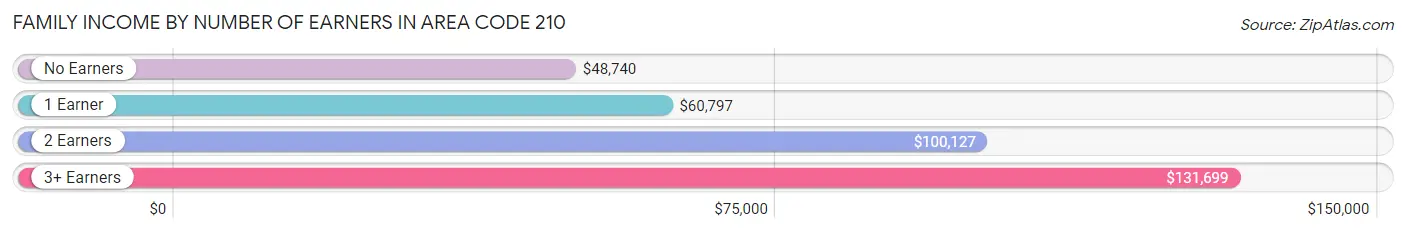
| Number of Earners | # Families | Median Income |
| No Earners | 49,199 (11.6%) | $48,740 |
| 1 Earner | 152,297 (35.8%) | $60,797 |
| 2 Earners | 168,941 (39.7%) | $100,127 |
| 3+ Earners | 55,108 (13.0%) | $131,699 |
| Total | 425,545 (100.0%) | $82,000 |
Household Income in Area Code 210
Household Income Brackets in Area Code 210
With 6,907,212 households falling in the category, the $50,000 to $74,999 income range is the most frequent in Area Code 210, accounting for 1,040.0% of all households. In contrast, only 1,880,887 households (283.2%) fall into the $10,000 to $14,999 income bracket, making it the least populous group.
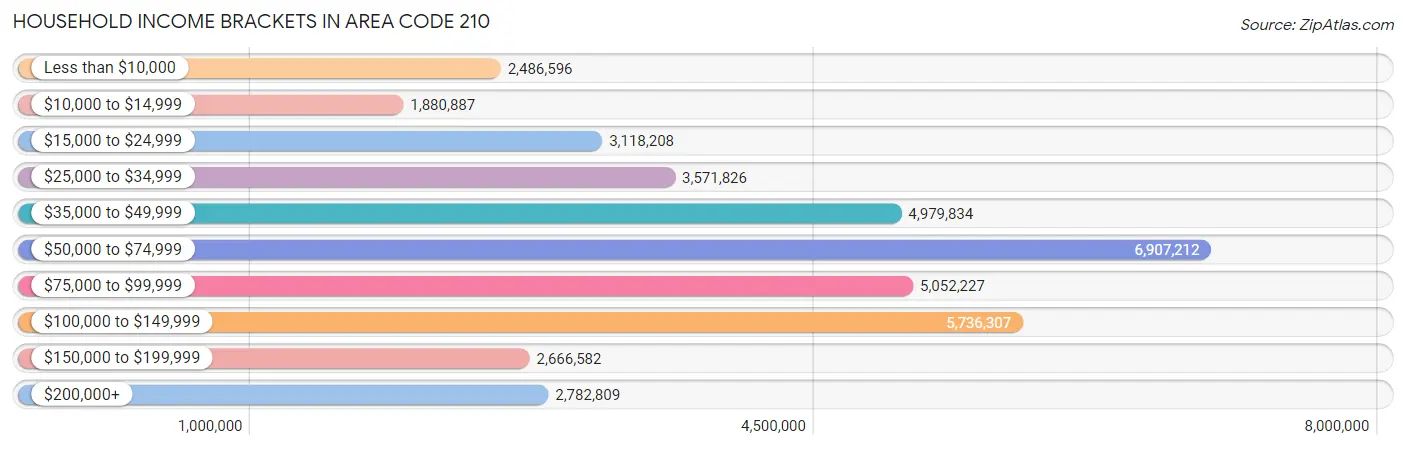
| Income Bracket | # Households | % Households |
| Less than $10,000 | 2,486,596 | 374.4% |
| $10,000 to $14,999 | 1,880,887 | 283.2% |
| $15,000 to $24,999 | 3,118,208 | 469.5% |
| $25,000 to $34,999 | 3,571,826 | 537.8% |
| $35,000 to $49,999 | 4,979,834 | 749.8% |
| $50,000 to $74,999 | 6,907,212 | 1,040.0% |
| $75,000 to $99,999 | 5,052,227 | 760.7% |
| $100,000 to $149,999 | 5,736,307 | 863.7% |
| $150,000 to $199,999 | 2,666,582 | 401.5% |
| $200,000+ | 2,782,809 | 419.0% |
Household Income by Householder Age in Area Code 210
The median household income in Area Code 210 is $65,582, with the highest median household income of $80,276 found in the 45 to 64 years age bracket for the primary householder. A total of 227,688 households (34.3%) fall into this category. Meanwhile, the 15 to 24 years age bracket for the primary householder has the lowest median household income of $37,530, with 34,803 households (5.2%) in this group.
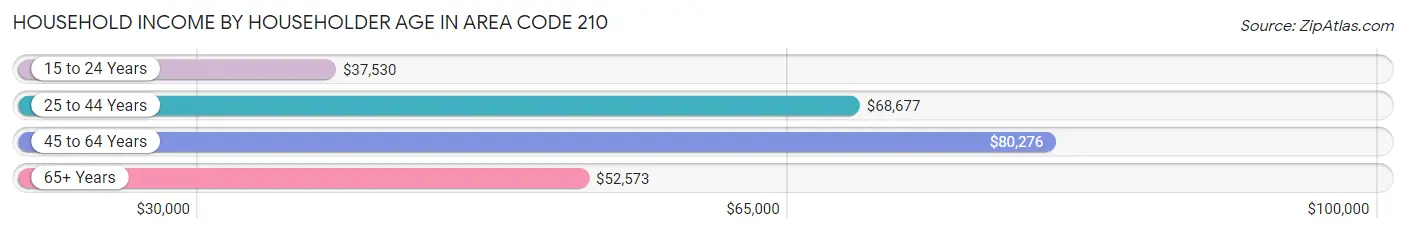
| Income Bracket | # Households | Median Income |
| 15 to 24 Years | 34,803 (5.2%) | $37,530 |
| 25 to 44 Years | 262,768 (39.6%) | $68,677 |
| 45 to 64 Years | 227,688 (34.3%) | $80,276 |
| 65+ Years | 138,896 (20.9%) | $52,573 |
| Total | 664,155 (100.0%) | $65,582 |
Poverty in Area Code 210
Income Below Poverty by Sex and Age in Area Code 210
With 14.7% poverty level for males and 17.2% for females among the residents of Area Code 210, under 5 year old males and 5 year old females are the most vulnerable to poverty, with 15,075 males (24.7%) and 3,042 females (25.8%) in their respective age groups living below the poverty level.
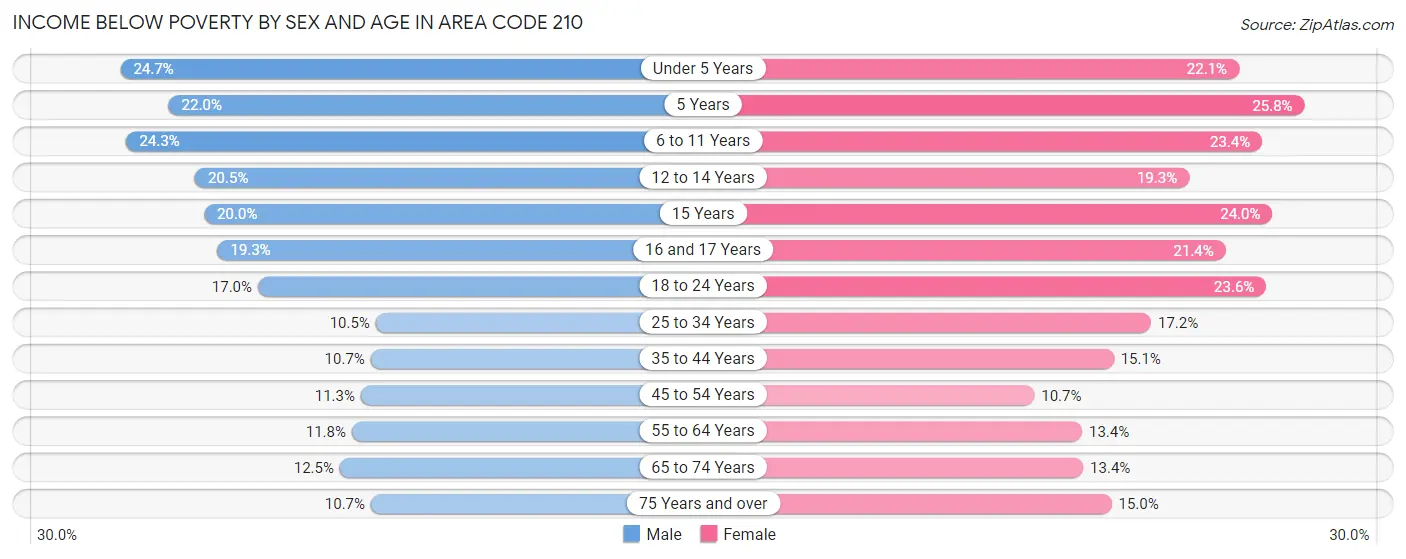
| Age Bracket | Male | Female |
| Under 5 Years | 15,075 (24.7%) | 12,760 (22.1%) |
| 5 Years | 2,650 (22.0%) | 3,042 (25.8%) |
| 6 to 11 Years | 18,793 (24.3%) | 16,642 (23.4%) |
| 12 to 14 Years | 7,839 (20.5%) | 7,541 (19.3%) |
| 15 Years | 2,562 (20.0%) | 3,069 (24.0%) |
| 16 and 17 Years | 5,084 (19.3%) | 5,284 (21.4%) |
| 18 to 24 Years | 15,455 (17.0%) | 20,810 (23.6%) |
| 25 to 34 Years | 15,343 (10.4%) | 24,210 (17.2%) |
| 35 to 44 Years | 13,847 (10.7%) | 18,920 (15.1%) |
| 45 to 54 Years | 11,687 (11.3%) | 11,425 (10.7%) |
| 55 to 64 Years | 10,727 (11.8%) | 13,026 (13.4%) |
| 65 to 74 Years | 7,448 (12.4%) | 9,748 (13.4%) |
| 75 Years and over | 3,707 (10.7%) | 7,757 (15.0%) |
| Total | 130,217 (14.7%) | 154,234 (17.2%) |
Income Above Poverty by Sex and Age in Area Code 210
According to the poverty statistics in Area Code 210, males aged 25 to 34 years and females aged 45 to 54 years are the age groups that are most secure financially, with 89.5% of males and 89.3% of females in these age groups living above the poverty line.
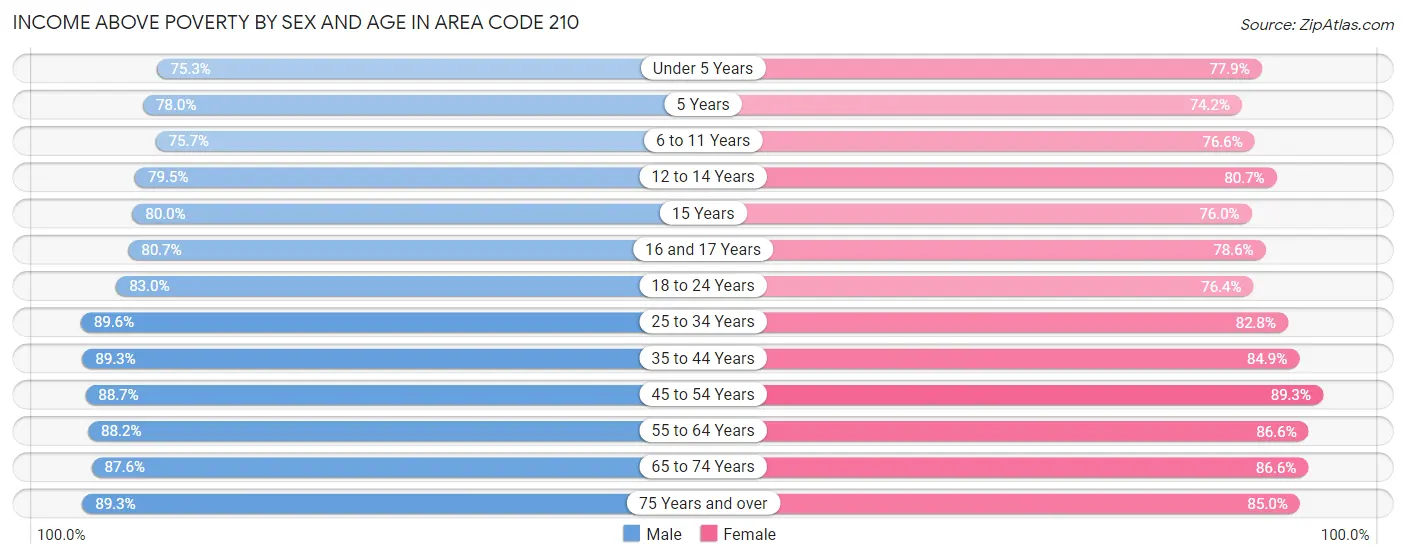
| Age Bracket | Male | Female |
| Under 5 Years | 46,056 (75.3%) | 44,940 (77.9%) |
| 5 Years | 9,408 (78.0%) | 8,767 (74.2%) |
| 6 to 11 Years | 58,452 (75.7%) | 54,486 (76.6%) |
| 12 to 14 Years | 30,386 (79.5%) | 31,467 (80.7%) |
| 15 Years | 10,244 (80.0%) | 9,732 (76.0%) |
| 16 and 17 Years | 21,307 (80.7%) | 19,441 (78.6%) |
| 18 to 24 Years | 75,397 (83.0%) | 67,254 (76.4%) |
| 25 to 34 Years | 131,546 (89.5%) | 116,420 (82.8%) |
| 35 to 44 Years | 115,193 (89.3%) | 106,077 (84.9%) |
| 45 to 54 Years | 91,895 (88.7%) | 95,102 (89.3%) |
| 55 to 64 Years | 80,310 (88.2%) | 84,359 (86.6%) |
| 65 to 74 Years | 52,361 (87.5%) | 62,776 (86.6%) |
| 75 Years and over | 30,868 (89.3%) | 43,877 (85.0%) |
| Total | 753,423 (85.3%) | 744,698 (82.8%) |
Income Below Poverty Among Married-Couple Families in Area Code 210
The poverty statistics for married-couple families in Area Code 210 show that 7.1% or 19,833 of the total 278,896 families live below the poverty line. Families with 5 or more children have the highest poverty rate of 30.5%, comprising of 899 families. On the other hand, families with no children have the lowest poverty rate of 4.7%, which includes 6,854 families.
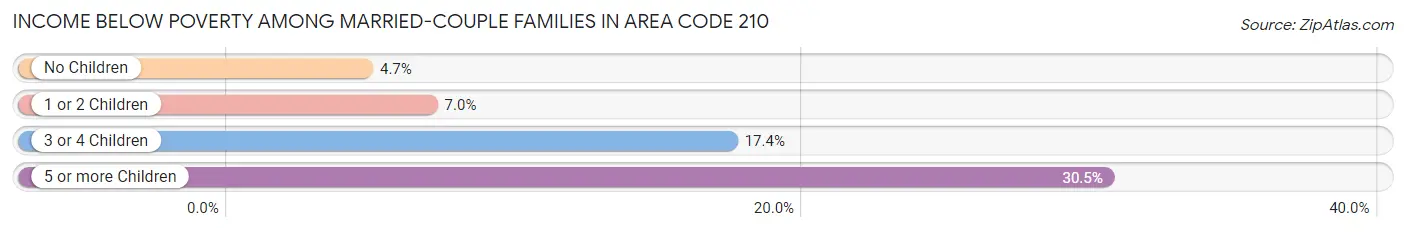
| Children | Above Poverty | Below Poverty |
| No Children | 138,827 (95.3%) | 6,854 (4.7%) |
| 1 or 2 Children | 94,273 (93.0%) | 7,041 (7.0%) |
| 3 or 4 Children | 23,916 (82.6%) | 5,039 (17.4%) |
| 5 or more Children | 2,047 (69.5%) | 899 (30.5%) |
| Total | 259,063 (92.9%) | 19,833 (7.1%) |
Income Below Poverty Among Single-Parent Households in Area Code 210
According to the poverty data in Area Code 210, 11.6% or 4,647 single-father households and 25.8% or 27,502 single-mother households are living below the poverty line. Among single-father households, those with 5 or more children have the highest poverty rate, with 219 households (69.8%) experiencing poverty. Likewise, among single-mother households, those with 5 or more children have the highest poverty rate, with 1,429 households (75.4%) falling below the poverty line.
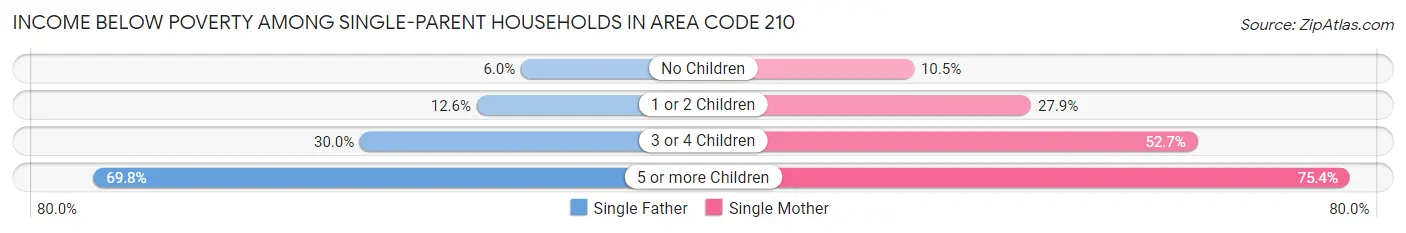
| Children | Single Father | Single Mother |
| No Children | 1,097 (6.0%) | 4,031 (10.5%) |
| 1 or 2 Children | 2,245 (12.6%) | 14,559 (27.9%) |
| 3 or 4 Children | 1,086 (30.0%) | 7,483 (52.7%) |
| 5 or more Children | 219 (69.8%) | 1,429 (75.4%) |
| Total | 4,647 (11.6%) | 27,502 (25.8%) |
Income Below Poverty Among Married-Couple vs Single-Parent Households in Area Code 210
The poverty data for Area Code 210 shows that 19,833 of the married-couple family households (7.1%) and 32,149 of the single-parent households (21.9%) are living below the poverty level. Within the married-couple family households, those with 5 or more children have the highest poverty rate, with 899 households (30.5%) falling below the poverty line. Among the single-parent households, those with 5 or more children have the highest poverty rate, with 1,648 household (74.6%) living below poverty.
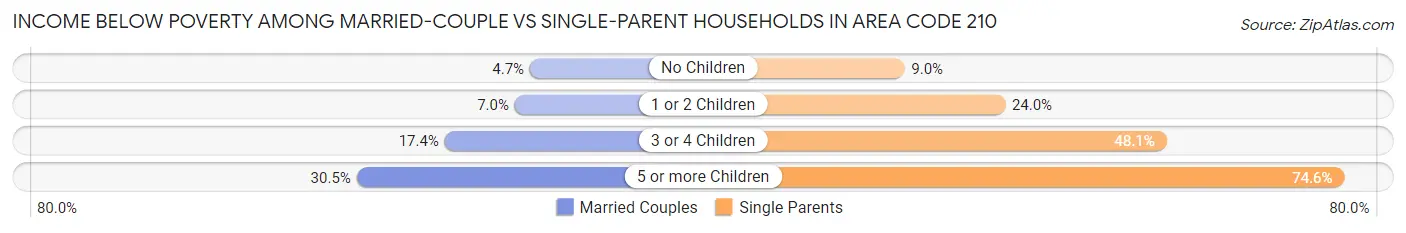
| Children | Married-Couple Families | Single-Parent Households |
| No Children | 6,854 (4.7%) | 5,128 (9.0%) |
| 1 or 2 Children | 7,041 (7.0%) | 16,804 (24.0%) |
| 3 or 4 Children | 5,039 (17.4%) | 8,569 (48.1%) |
| 5 or more Children | 899 (30.5%) | 1,648 (74.6%) |
| Total | 19,833 (7.1%) | 32,149 (21.9%) |
Race in Area Code 210
The most populous races in Area Code 210 are Hispanic or Latino (1,140,035 | 62.7%), White / Caucasian (1,031,457 | 56.7%), and Two or more Races (414,388 | 22.8%).
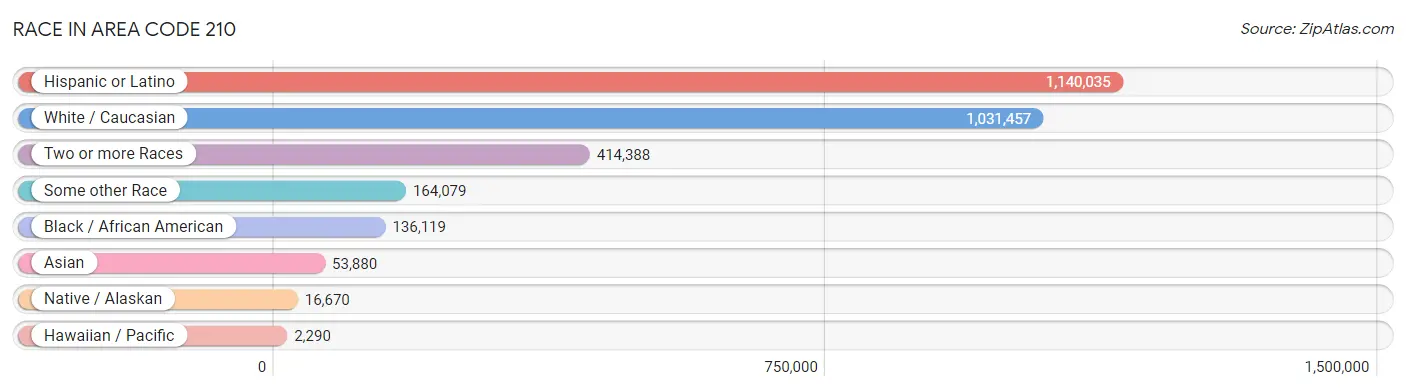
| Race | # Population | % Population |
| Asian | 53,880 | 3.0% |
| Black / African American | 136,119 | 7.5% |
| Hawaiian / Pacific | 2,290 | 0.1% |
| Hispanic or Latino | 1,140,035 | 62.7% |
| Native / Alaskan | 16,670 | 0.9% |
| White / Caucasian | 1,031,457 | 56.7% |
| Two or more Races | 414,388 | 22.8% |
| Some other Race | 164,079 | 9.0% |
| Total | 1,818,883 | 100.0% |
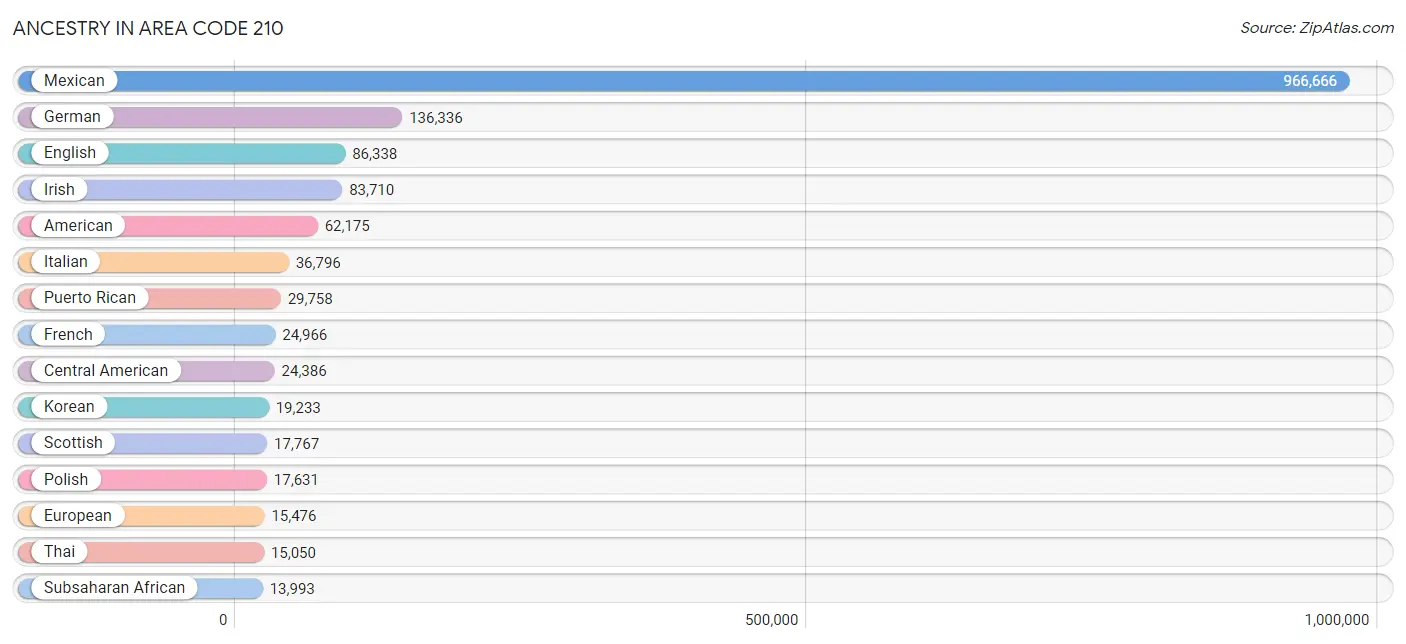
Ancestry in Area Code 210
The most populous ancestries reported in Area Code 210 are Mexican (966,666 | 53.1%), German (136,336 | 7.5%), English (86,338 | 4.8%), Irish (83,710 | 4.6%), and American (62,175 | 3.4%), together accounting for 73.4% of all Area Code 210 residents.
| Ancestry | # Population | % Population |
| Afghan | 3,146 | 0.2% |
| African | 8,975 | 0.5% |
| Alaskan Athabascan | 7 | 0.0% |
| Albanian | 47 | 0.0% |
| Aleut | 14 | 0.0% |
| Alsatian | 325 | 0.0% |
| American | 62,175 | 3.4% |
| Apache | 2,375 | 0.1% |
| Arab | 11,532 | 0.6% |
| Argentinean | 1,375 | 0.1% |
| Armenian | 217 | 0.0% |
| Assyrian / Chaldean / Syriac | 8 | 0.0% |
| Australian | 223 | 0.0% |
| Austrian | 2,135 | 0.1% |
| Bahamian | 32 | 0.0% |
| Bangladeshi | 360 | 0.0% |
| Barbadian | 172 | 0.0% |
| Basque | 449 | 0.0% |
| Belgian | 852 | 0.1% |
| Belizean | 150 | 0.0% |
| Bermudan | 17 | 0.0% |
| Bhutanese | 5,520 | 0.3% |
| Blackfeet | 393 | 0.0% |
| Bolivian | 155 | 0.0% |
| Brazilian | 1,301 | 0.1% |
| British | 6,872 | 0.4% |
| British West Indian | 36 | 0.0% |
| Bulgarian | 291 | 0.0% |
| Burmese | 6,002 | 0.3% |
| Cajun | 249 | 0.0% |
| Cambodian | 194 | 0.0% |
| Canadian | 1,699 | 0.1% |
| Cape Verdean | 127 | 0.0% |
| Celtic | 337 | 0.0% |
| Central American | 24,386 | 1.3% |
| Central American Indian | 4,098 | 0.2% |
| Cherokee | 4,859 | 0.3% |
| Cheyenne | 12 | 0.0% |
| Chickasaw | 593 | 0.0% |
| Chilean | 648 | 0.0% |
| Chinese | 117 | 0.0% |
| Chippewa | 287 | 0.0% |
| Choctaw | 1,021 | 0.1% |
| Colombian | 4,888 | 0.3% |
| Comanche | 702 | 0.0% |
| Costa Rican | 753 | 0.0% |
| Creek | 199 | 0.0% |
| Croatian | 624 | 0.0% |
| Crow | 18 | 0.0% |
| Cuban | 6,499 | 0.4% |
| Czech | 5,091 | 0.3% |
| Czechoslovakian | 1,279 | 0.1% |
| Danish | 2,156 | 0.1% |
| Delaware | 46 | 0.0% |
| Dominican | 1,630 | 0.1% |
| Dutch | 6,578 | 0.4% |
| Dutch West Indian | 24 | 0.0% |
| Eastern European | 2,133 | 0.1% |
| Ecuadorian | 1,175 | 0.1% |
| Egyptian | 820 | 0.1% |
| English | 86,338 | 4.8% |
| Estonian | 56 | 0.0% |
| Ethiopian | 453 | 0.0% |
| European | 15,476 | 0.9% |
| Filipino | 699 | 0.0% |
| Finnish | 950 | 0.1% |
| French | 24,966 | 1.4% |
| French American Indian | 101 | 0.0% |
| French Canadian | 3,169 | 0.2% |
| German | 136,336 | 7.5% |
| German Russian | 150 | 0.0% |
| Ghanaian | 287 | 0.0% |
| Greek | 2,738 | 0.2% |
| Guamanian / Chamorro | 1,500 | 0.1% |
| Guatemalan | 3,709 | 0.2% |
| Guyanese | 284 | 0.0% |
| Haitian | 1,280 | 0.1% |
| Hmong | 23 | 0.0% |
| Honduran | 7,180 | 0.4% |
| Hopi | 35 | 0.0% |
| Hungarian | 1,939 | 0.1% |
| Icelander | 417 | 0.0% |
| Indian (Asian) | 9,555 | 0.5% |
| Indonesian | 877 | 0.1% |
| Inupiat | 32 | 0.0% |
| Iranian | 1,826 | 0.1% |
| Iraqi | 2,748 | 0.2% |
| Irish | 83,710 | 4.6% |
| Iroquois | 382 | 0.0% |
| Israeli | 273 | 0.0% |
| Italian | 36,796 | 2.0% |
| Jamaican | 2,519 | 0.1% |
| Japanese | 232 | 0.0% |
| Jordanian | 430 | 0.0% |
| Kenyan | 81 | 0.0% |
| Kiowa | 39 | 0.0% |
| Korean | 19,233 | 1.1% |
| Laotian | 400 | 0.0% |
| Latvian | 95 | 0.0% |
| Lebanese | 2,034 | 0.1% |
| Liberian | 202 | 0.0% |
| Lithuanian | 1,821 | 0.1% |
| Lumbee | 26 | 0.0% |
| Luxembourger | 178 | 0.0% |
| Macedonian | 184 | 0.0% |
| Malaysian | 215 | 0.0% |
| Mexican | 966,666 | 53.1% |
| Mexican American Indian | 6,350 | 0.4% |
| Mongolian | 55 | 0.0% |
| Moroccan | 517 | 0.0% |
| Native Hawaiian | 2,670 | 0.2% |
| Navajo | 995 | 0.1% |
| New Zealander | 76 | 0.0% |
| Nicaraguan | 2,038 | 0.1% |
| Nigerian | 1,862 | 0.1% |
| Northern European | 1,958 | 0.1% |
| Norwegian | 7,860 | 0.4% |
| Okinawan | 53 | 0.0% |
| Osage | 29 | 0.0% |
| Ottawa | 15 | 0.0% |
| Paiute | 10 | 0.0% |
| Pakistani | 1,681 | 0.1% |
| Palestinian | 528 | 0.0% |
| Panamanian | 3,161 | 0.2% |
| Paraguayan | 151 | 0.0% |
| Pennsylvania German | 270 | 0.0% |
| Peruvian | 2,283 | 0.1% |
| Pima | 84 | 0.0% |
| Polish | 17,631 | 1.0% |
| Portuguese | 4,267 | 0.2% |
| Potawatomi | 99 | 0.0% |
| Pueblo | 282 | 0.0% |
| Puerto Rican | 29,758 | 1.6% |
| Romanian | 1,978 | 0.1% |
| Russian | 4,436 | 0.2% |
| Salvadoran | 7,459 | 0.4% |
| Samoan | 689 | 0.0% |
| Scandinavian | 2,755 | 0.2% |
| Scotch-Irish | 10,341 | 0.6% |
| Scottish | 17,767 | 1.0% |
| Seminole | 136 | 0.0% |
| Senegalese | 40 | 0.0% |
| Serbian | 201 | 0.0% |
| Shoshone | 54 | 0.0% |
| Sierra Leonean | 65 | 0.0% |
| Sioux | 166 | 0.0% |
| Slavic | 367 | 0.0% |
| Slovak | 674 | 0.0% |
| Slovene | 269 | 0.0% |
| Somali | 423 | 0.0% |
| South African | 336 | 0.0% |
| South American | 13,317 | 0.7% |
| South American Indian | 383 | 0.0% |
| Soviet Union | 22 | 0.0% |
| Spaniard | 13,200 | 0.7% |
| Spanish | 8,043 | 0.4% |
| Spanish American | 382 | 0.0% |
| Spanish American Indian | 78 | 0.0% |
| Sri Lankan | 8,064 | 0.4% |
| Subsaharan African | 13,993 | 0.8% |
| Sudanese | 132 | 0.0% |
| Swedish | 6,379 | 0.4% |
| Swiss | 1,772 | 0.1% |
| Syrian | 527 | 0.0% |
| Thai | 15,050 | 0.8% |
| Tlingit-Haida | 8 | 0.0% |
| Tohono O'Odham | 14 | 0.0% |
| Tongan | 16 | 0.0% |
| Trinidadian and Tobagonian | 119 | 0.0% |
| Turkish | 1,061 | 0.1% |
| U.S. Virgin Islander | 65 | 0.0% |
| Ugandan | 27 | 0.0% |
| Ukrainian | 1,976 | 0.1% |
| Uruguayan | 136 | 0.0% |
| Ute | 18 | 0.0% |
| Venezuelan | 2,197 | 0.1% |
| Vietnamese | 479 | 0.0% |
| Welsh | 5,471 | 0.3% |
| West Indian | 758 | 0.0% |
| Yaqui | 244 | 0.0% |
| Yugoslavian | 273 | 0.0% |
| Yuman | 8 | 0.0% | View All 182 Rows |
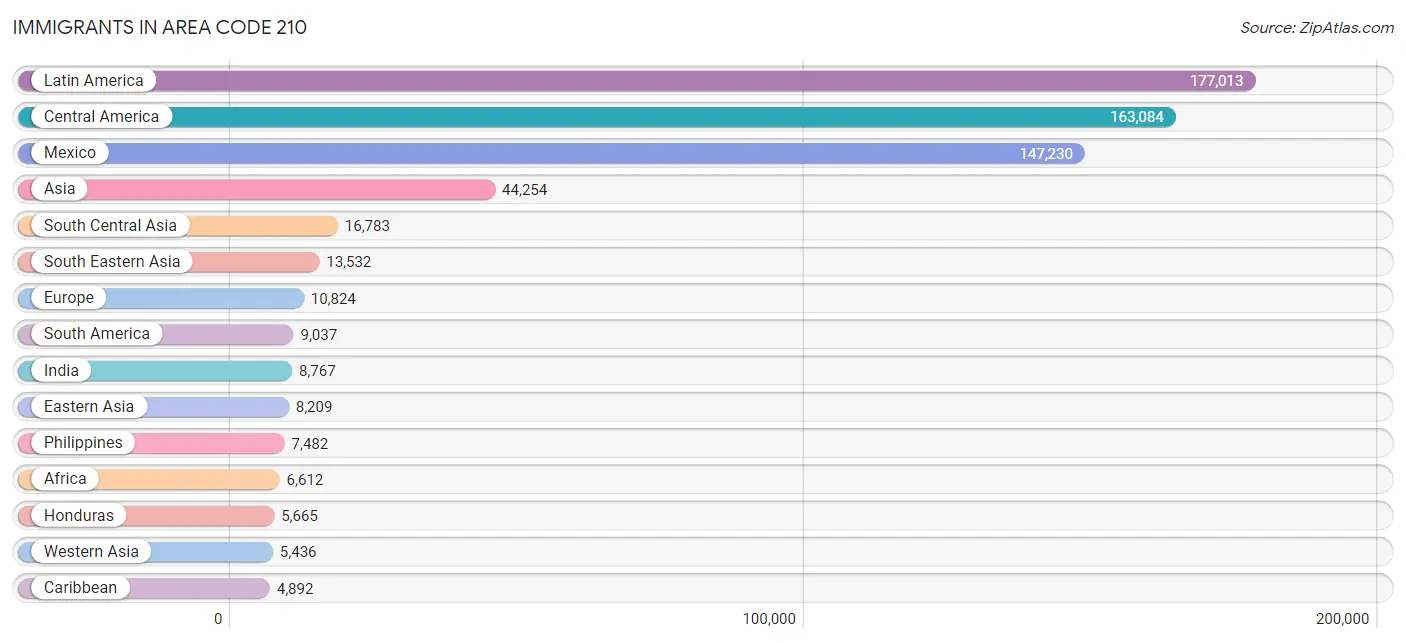
Immigrants in Area Code 210
The most numerous immigrant groups reported in Area Code 210 came from Latin America (177,013 | 9.7%), Central America (163,084 | 9.0%), Mexico (147,230 | 8.1%), Asia (44,254 | 2.4%), and South Central Asia (16,783 | 0.9%), together accounting for 30.1% of all Area Code 210 residents.
| Immigration Origin | # Population | % Population |
| Afghanistan | 3,379 | 0.2% |
| Africa | 6,612 | 0.4% |
| Argentina | 808 | 0.0% |
| Asia | 44,254 | 2.4% |
| Australia | 369 | 0.0% |
| Austria | 167 | 0.0% |
| Azores | 7 | 0.0% |
| Bahamas | 4 | 0.0% |
| Bangladesh | 715 | 0.0% |
| Barbados | 159 | 0.0% |
| Belarus | 23 | 0.0% |
| Belgium | 9 | 0.0% |
| Belize | 295 | 0.0% |
| Bolivia | 160 | 0.0% |
| Bosnia and Herzegovina | 20 | 0.0% |
| Brazil | 943 | 0.1% |
| Bulgaria | 100 | 0.0% |
| Cambodia | 56 | 0.0% |
| Cameroon | 255 | 0.0% |
| Canada | 2,272 | 0.1% |
| Caribbean | 4,892 | 0.3% |
| Central America | 163,084 | 9.0% |
| Chile | 308 | 0.0% |
| China | 4,391 | 0.2% |
| Colombia | 2,734 | 0.2% |
| Congo | 447 | 0.0% |
| Costa Rica | 306 | 0.0% |
| Cuba | 2,512 | 0.1% |
| Czechoslovakia | 107 | 0.0% |
| Denmark | 71 | 0.0% |
| Dominican Republic | 648 | 0.0% |
| Eastern Africa | 1,190 | 0.1% |
| Eastern Asia | 8,209 | 0.4% |
| Eastern Europe | 3,436 | 0.2% |
| Ecuador | 510 | 0.0% |
| Egypt | 828 | 0.1% |
| El Salvador | 4,502 | 0.3% |
| England | 876 | 0.1% |
| Eritrea | 269 | 0.0% |
| Ethiopia | 305 | 0.0% |
| Europe | 10,824 | 0.6% |
| Fiji | 30 | 0.0% |
| France | 578 | 0.0% |
| Germany | 2,649 | 0.2% |
| Ghana | 315 | 0.0% |
| Greece | 89 | 0.0% |
| Guatemala | 2,513 | 0.1% |
| Guyana | 112 | 0.0% |
| Haiti | 213 | 0.0% |
| Honduras | 5,665 | 0.3% |
| Hong Kong | 215 | 0.0% |
| Hungary | 79 | 0.0% |
| India | 8,767 | 0.5% |
| Indonesia | 265 | 0.0% |
| Iran | 1,516 | 0.1% |
| Iraq | 2,988 | 0.2% |
| Ireland | 356 | 0.0% |
| Israel | 181 | 0.0% |
| Italy | 316 | 0.0% |
| Jamaica | 941 | 0.1% |
| Japan | 1,292 | 0.1% |
| Jordan | 389 | 0.0% |
| Kazakhstan | 411 | 0.0% |
| Kenya | 216 | 0.0% |
| Korea | 2,526 | 0.1% |
| Kuwait | 34 | 0.0% |
| Laos | 111 | 0.0% |
| Latin America | 177,013 | 9.7% |
| Latvia | 25 | 0.0% |
| Lebanon | 406 | 0.0% |
| Liberia | 327 | 0.0% |
| Lithuania | 39 | 0.0% |
| Malaysia | 208 | 0.0% |
| Mexico | 147,230 | 8.1% |
| Middle Africa | 1,042 | 0.1% |
| Moldova | 20 | 0.0% |
| Morocco | 307 | 0.0% |
| Nepal | 391 | 0.0% |
| Netherlands | 79 | 0.0% |
| Nicaragua | 1,096 | 0.1% |
| Nigeria | 912 | 0.1% |
| North Macedonia | 14 | 0.0% |
| Northern Africa | 1,981 | 0.1% |
| Northern Europe | 2,661 | 0.2% |
| Norway | 16 | 0.0% |
| Oceania | 713 | 0.0% |
| Pakistan | 1,228 | 0.1% |
| Panama | 1,477 | 0.1% |
| Peru | 1,459 | 0.1% |
| Philippines | 7,482 | 0.4% |
| Poland | 296 | 0.0% |
| Portugal | 54 | 0.0% |
| Romania | 387 | 0.0% |
| Russia | 1,003 | 0.1% |
| Saudi Arabia | 534 | 0.0% |
| Scotland | 400 | 0.0% |
| Senegal | 73 | 0.0% |
| Serbia | 79 | 0.0% |
| Sierra Leone | 44 | 0.0% |
| Singapore | 76 | 0.0% |
| Somalia | 197 | 0.0% |
| South Africa | 311 | 0.0% |
| South America | 9,037 | 0.5% |
| South Central Asia | 16,783 | 0.9% |
| South Eastern Asia | 13,532 | 0.7% |
| Southern Europe | 1,131 | 0.1% |
| Spain | 672 | 0.0% |
| Sri Lanka | 127 | 0.0% |
| Sudan | 399 | 0.0% |
| Sweden | 176 | 0.0% |
| Switzerland | 59 | 0.0% |
| Syria | 56 | 0.0% |
| Taiwan | 602 | 0.0% |
| Thailand | 784 | 0.0% |
| Trinidad and Tobago | 331 | 0.0% |
| Turkey | 701 | 0.0% |
| Uganda | 87 | 0.0% |
| Ukraine | 879 | 0.1% |
| Uruguay | 61 | 0.0% |
| Uzbekistan | 31 | 0.0% |
| Venezuela | 1,849 | 0.1% |
| Vietnam | 3,669 | 0.2% |
| West Indies | 53 | 0.0% |
| Western Africa | 1,841 | 0.1% |
| Western Asia | 5,436 | 0.3% |
| Western Europe | 3,541 | 0.2% |
| Zaire | 328 | 0.0% |
| Zimbabwe | 35 | 0.0% | View All 128 Rows |
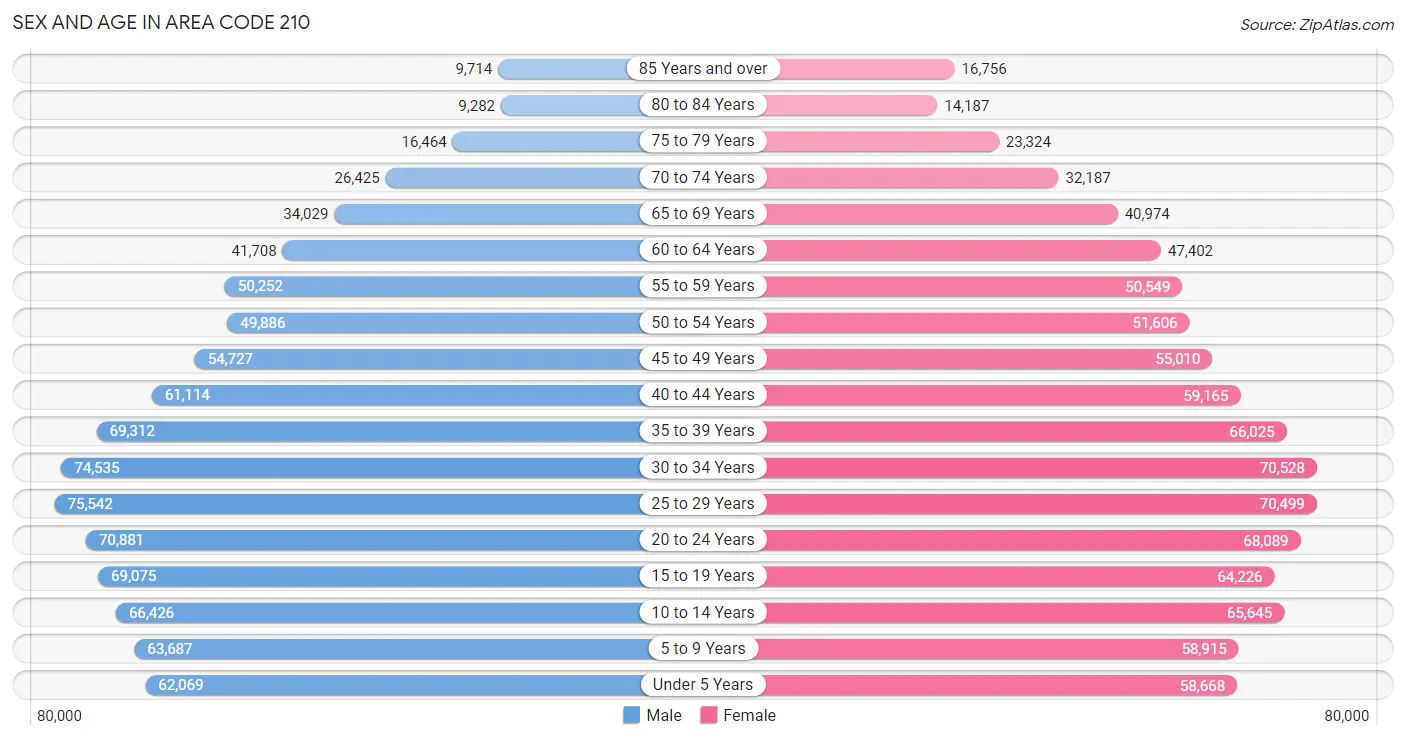
Sex and Age in Area Code 210
Sex and Age in Area Code 210
The most populous age groups in Area Code 210 are 25 to 29 Years (75,542 | 8.4%) for men and 30 to 34 Years (70,528 | 7.7%) for women.
| Age Bracket | Male | Female |
| Under 5 Years | 62,069 (6.9%) | 58,668 (6.4%) |
| 5 to 9 Years | 63,687 (7.0%) | 58,915 (6.5%) |
| 10 to 14 Years | 66,426 (7.3%) | 65,645 (7.2%) |
| 15 to 19 Years | 69,075 (7.6%) | 64,226 (7.0%) |
| 20 to 24 Years | 70,881 (7.8%) | 68,089 (7.4%) |
| 25 to 29 Years | 75,542 (8.4%) | 70,499 (7.7%) |
| 30 to 34 Years | 74,535 (8.2%) | 70,528 (7.7%) |
| 35 to 39 Years | 69,312 (7.7%) | 66,025 (7.2%) |
| 40 to 44 Years | 61,114 (6.8%) | 59,165 (6.5%) |
| 45 to 49 Years | 54,727 (6.0%) | 55,010 (6.0%) |
| 50 to 54 Years | 49,886 (5.5%) | 51,606 (5.7%) |
| 55 to 59 Years | 50,252 (5.6%) | 50,549 (5.5%) |
| 60 to 64 Years | 41,708 (4.6%) | 47,402 (5.2%) |
| 65 to 69 Years | 34,029 (3.8%) | 40,974 (4.5%) |
| 70 to 74 Years | 26,425 (2.9%) | 32,187 (3.5%) |
| 75 to 79 Years | 16,464 (1.8%) | 23,324 (2.5%) |
| 80 to 84 Years | 9,282 (1.0%) | 14,187 (1.5%) |
| 85 Years and over | 9,714 (1.1%) | 16,756 (1.8%) |
| Total | 905,128 (100.0%) | 913,755 (100.0%) |
Families and Households in Area Code 210
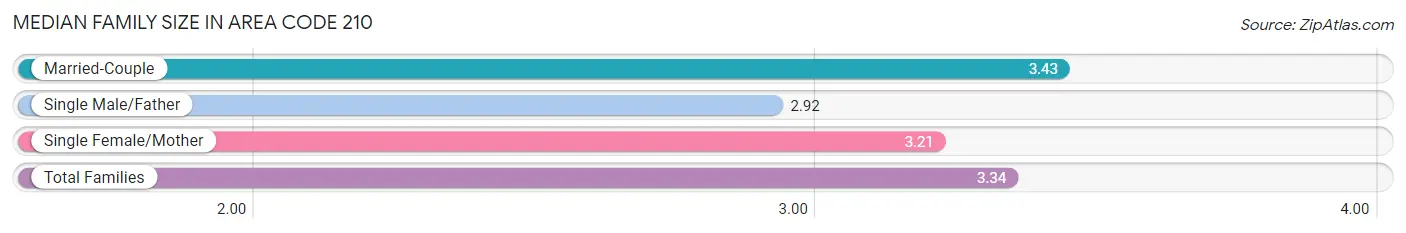
Median Family Size in Area Code 210
The median family size in Area Code 210 is 3.34 persons per family, with married-couple families (278,896 | 65.5%) accounting for the largest median family size of 3.4344 persons per family. On the other hand, single male/father families (39,946 | 9.4%) represent the smallest median family size with 2.92 persons per family.
| Family Type | # Families | Family Size |
| Married-Couple | 278,896 (65.5%) | 3.43 |
| Single Male/Father | 39,946 (9.4%) | 2.92 |
| Single Female/Mother | 106,703 (25.1%) | 3.21 |
| Total Families | 425,545 (100.0%) | 3.34 |
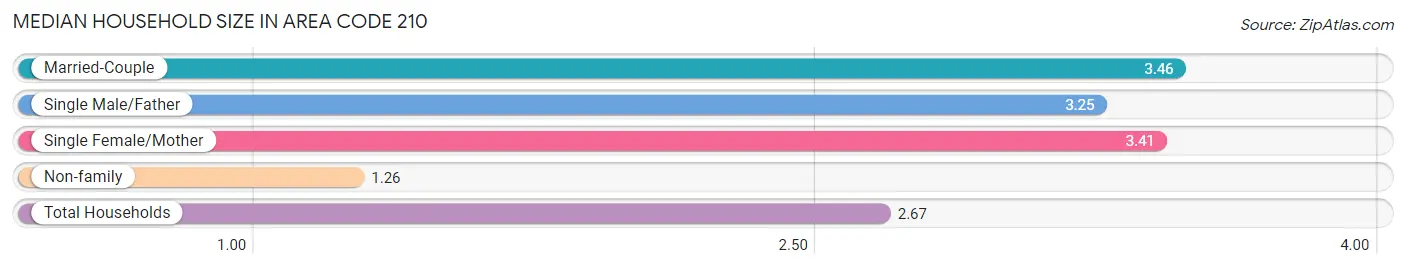
Median Household Size in Area Code 210
The median household size in Area Code 210 is 2.67 persons per household, with married-couple households (278,896 | 42.0%) accounting for the largest median household size of 3.46084 persons per household. non-family households (238,610 | 35.9%) represent the smallest median household size with 1.26 persons per household.
| Household Type | # Households | Household Size |
| Married-Couple | 278,896 (42.0%) | 3.46 |
| Single Male/Father | 39,946 (6.0%) | 3.25 |
| Single Female/Mother | 106,703 (16.1%) | 3.41 |
| Non-family | 238,610 (35.9%) | 1.26 |
| Total Households | 664,155 (100.0%) | 2.67 |
Household Size by Marriage Status in Area Code 210
Out of a total of 664,155 households in Area Code 210, 425,545 (64.1%) are family households, while 238,610 (35.9%) are nonfamily households. The most numerous type of family households are 2-person households, comprising 158,827, and the most common type of nonfamily households are 1-person households, comprising 193,846.
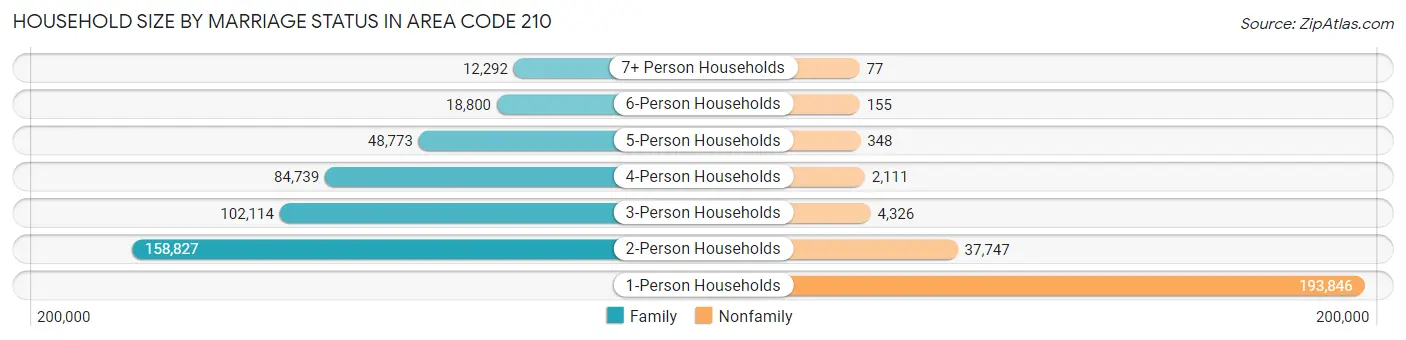
| Household Size | Family Households | Nonfamily Households |
| 1-Person Households | - | 193,846 (29.2%) |
| 2-Person Households | 158,827 (23.9%) | 37,747 (5.7%) |
| 3-Person Households | 102,114 (15.4%) | 4,326 (0.6%) |
| 4-Person Households | 84,739 (12.8%) | 2,111 (0.3%) |
| 5-Person Households | 48,773 (7.3%) | 348 (0.1%) |
| 6-Person Households | 18,800 (2.8%) | 155 (0.0%) |
| 7+ Person Households | 12,292 (1.8%) | 77 (0.0%) |
| Total | 425,545 (64.1%) | 238,610 (35.9%) |
Female Fertility in Area Code 210
Fertility by Age in Area Code 210
Average fertility rate in Area Code 210 is 56.2 births per 1,000 women. Women in the age bracket of 20 to 34 years have the highest fertility rate with 93.8 births per 1,000 women. Women in the age bracket of 20 to 34 years acount for 71.0% of all women with births.
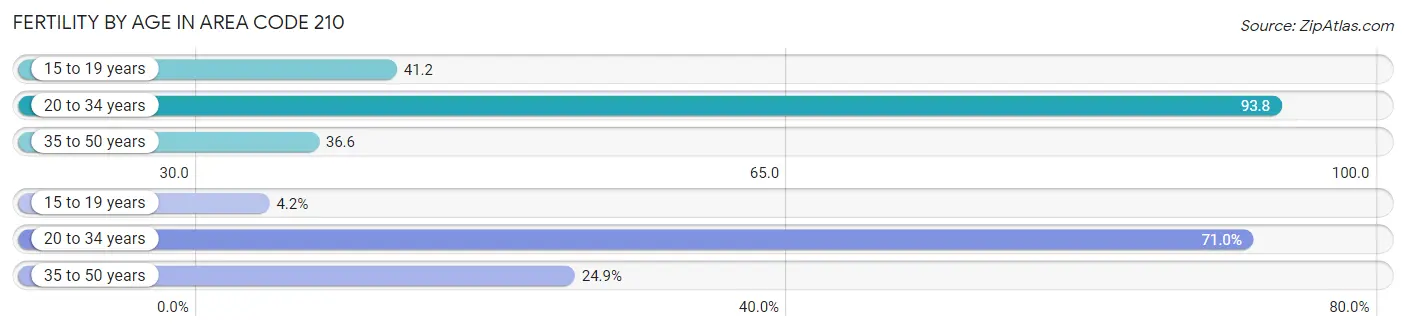
| Age Bracket | Women with Births | Births / 1,000 Women |
| 15 to 19 years | 1,078 (4.2%) | 41.2 |
| 20 to 34 years | 18,360 (71.0%) | 93.8 |
| 35 to 50 years | 6,440 (24.9%) | 36.6 |
| Total | 25,878 (100.0%) | 56.2 |
Fertility by Age by Marriage Status in Area Code 210
58.1% of women with births (25,878) in Area Code 210 are married. The highest percentage of unmarried women with births falls into 15 to 19 years age bracket with 95.2% of them unmarried at the time of birth, while the lowest percentage of unmarried women with births belong to 35 to 50 years age bracket with 42.9% of them unmarried.
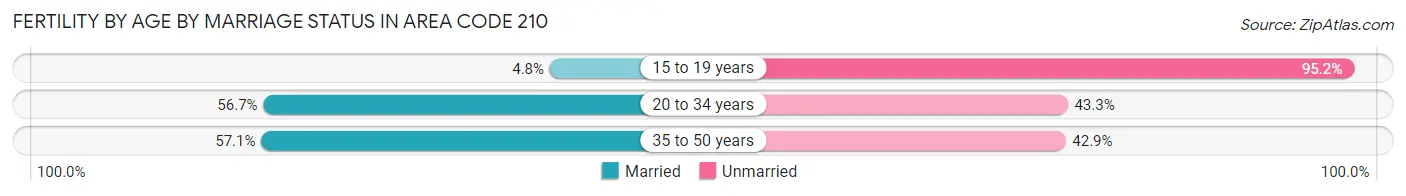
| Age Bracket | Married | Unmarried |
| 15 to 19 years | 52 (4.8%) | 1,026 (95.2%) |
| 20 to 34 years | 10,415 (56.7%) | 7,945 (43.3%) |
| 35 to 50 years | 3,678 (57.1%) | 2,762 (42.9%) |
| Total | 15,035 (58.1%) | 10,843 (41.9%) |
Fertility by Education in Area Code 210
Average fertility rate in Area Code 210 is 56.2 births per 1,000 women. Women with the education attainment of high school diploma have the highest fertility rate of 72.4 births per 1,000 women, while women with the education attainment of less than high school have the lowest fertility at 46.2 births per 1,000 women. Women with the education attainment of college or associate's degree represent 34.8% of all women with births.
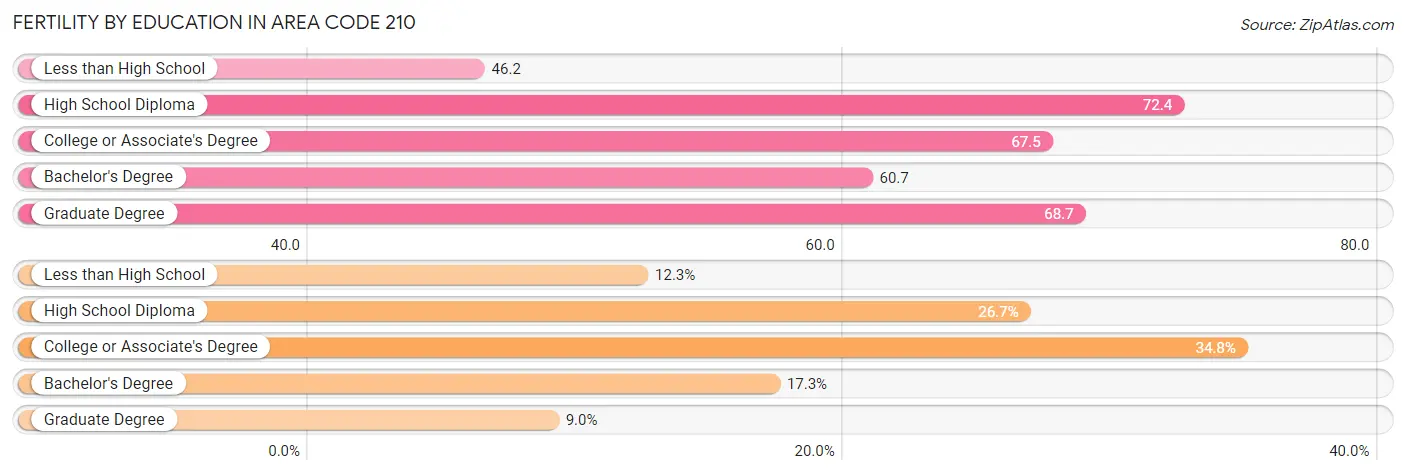
| Educational Attainment | Women with Births | Births / 1,000 Women |
| Less than High School | 3,189 (12.3%) | 46.2 |
| High School Diploma | 6,896 (26.7%) | 72.4 |
| College or Associate's Degree | 9,004 (34.8%) | 67.5 |
| Bachelor's Degree | 4,467 (17.3%) | 60.7 |
| Graduate Degree | 2,322 (9.0%) | 68.7 |
| Total | 25,878 (100.0%) | 56.2 |
Fertility by Education by Marriage Status in Area Code 210
41.9% of women with births in Area Code 210 are unmarried. Women with the educational attainment of graduate degree are most likely to be married with 62.0% of them married at childbirth, while women with the educational attainment of less than high school are least likely to be married with 70.2% of them unmarried at childbirth.
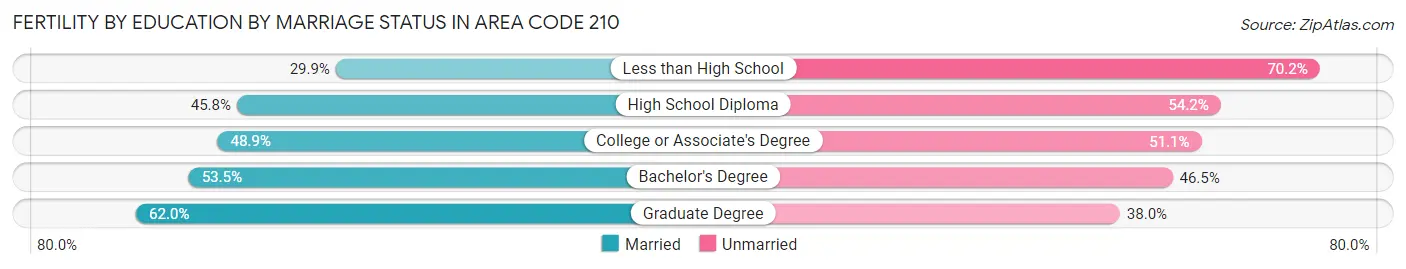
| Educational Attainment | Married | Unmarried |
| Less than High School | 952 (29.8%) | 2,237 (70.2%) |
| High School Diploma | 3,158 (45.8%) | 3,738 (54.2%) |
| College or Associate's Degree | 4,402 (48.9%) | 4,602 (51.1%) |
| Bachelor's Degree | 2,391 (53.5%) | 2,076 (46.5%) |
| Graduate Degree | 1,440 (62.0%) | 882 (38.0%) |
| Total | 15,035 (58.1%) | 10,843 (41.9%) |
Employment Characteristics in Area Code 210
Employment by Class of Employer in Area Code 210
Among the 868,524 employed individuals in Area Code 210, private company employees (594,601 | 68.5%), local government employees (57,848 | 6.7%), and not-for-profit organizations (53,967 | 6.2%) make up the most common classes of employment.
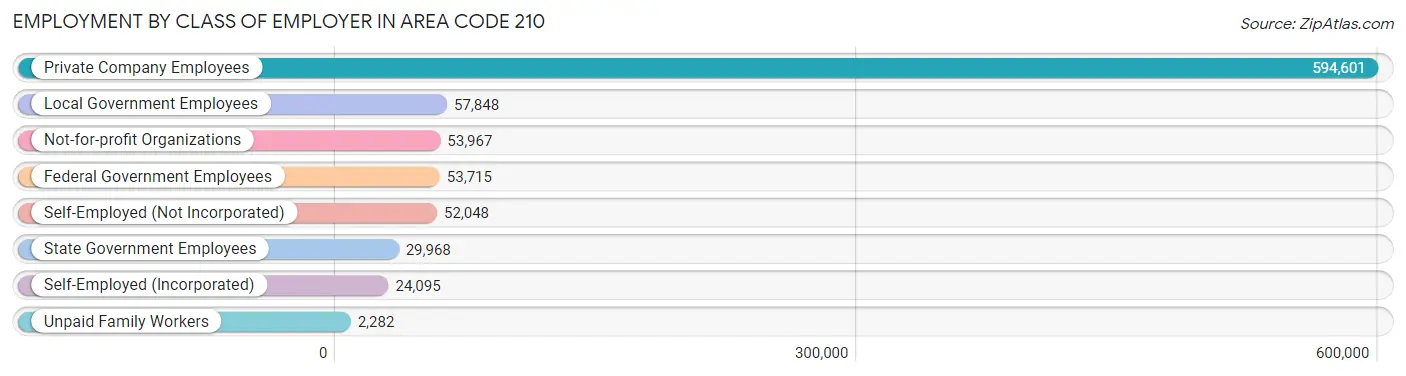
| Employer Class | # Employees | % Employees |
| Private Company Employees | 594,601 | 68.5% |
| Self-Employed (Incorporated) | 24,095 | 2.8% |
| Self-Employed (Not Incorporated) | 52,048 | 6.0% |
| Not-for-profit Organizations | 53,967 | 6.2% |
| Local Government Employees | 57,848 | 6.7% |
| State Government Employees | 29,968 | 3.5% |
| Federal Government Employees | 53,715 | 6.2% |
| Unpaid Family Workers | 2,282 | 0.3% |
| Total | 868,524 | 100.0% |
Employment Status by Age in Area Code 210
According to the labor force statistics for Area Code 210, out of the total population over 16 years of age (1,417,802), 66.4% or 941,846 individuals are in the labor force, with 5.8% or 54,439 of them unemployed. The age group with the highest labor force participation rate is 25 to 29 years, with 84.0% or 122,616 individuals in the labor force. Within the labor force, the 16 to 19 years age range has the highest percentage of unemployed individuals, with 1,120.5% or 465,030 of them being unemployed.
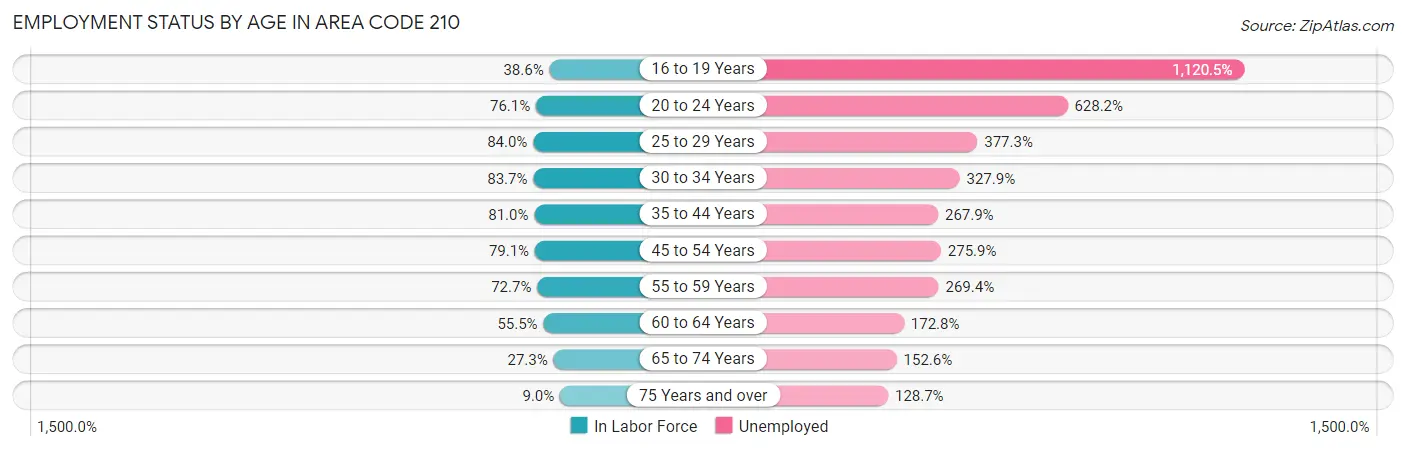
| Age Bracket | In Labor Force | Unemployed |
| 16 to 19 Years | 41,505 (38.6%) | 465,030 (1,120.5%) |
| 20 to 24 Years | 105,772 (76.1%) | 664,447 (628.2%) |
| 25 to 29 Years | 122,614 (84.0%) | 462,630 (377.3%) |
| 30 to 34 Years | 121,376 (83.7%) | 397,985 (327.9%) |
| 35 to 44 Years | 206,923 (80.9%) | 554,341 (267.9%) |
| 45 to 54 Years | 167,036 (79.1%) | 460,863 (275.9%) |
| 55 to 59 Years | 73,251 (72.7%) | 197,341 (269.4%) |
| 60 to 64 Years | 49,424 (55.5%) | 85,398 (172.8%) |
| 65 to 74 Years | 36,472 (27.3%) | 55,664 (152.6%) |
| 75 Years and over | 8,114 (9.0%) | 10,439 (128.7%) |
| Total | 941,893 (66.4%) | 54,483 (5.8%) |
Employment Status by Educational Attainment in Area Code 210
According to labor force statistics for Area Code 210, 78.3% of individuals (742,554) out of the total population between 25 and 64 years of age (947,860) are in the labor force, with 294.5% or 2,186,822 of them being unemployed. The group with the highest labor force participation rate are those with the educational attainment of bachelor's degree or higher, with 87.0% or 245,451 individuals in the labor force. Within the labor force, individuals with high school diploma education have the highest percentage of unemployment, with 409.0% or 726,875 of them being unemployed.
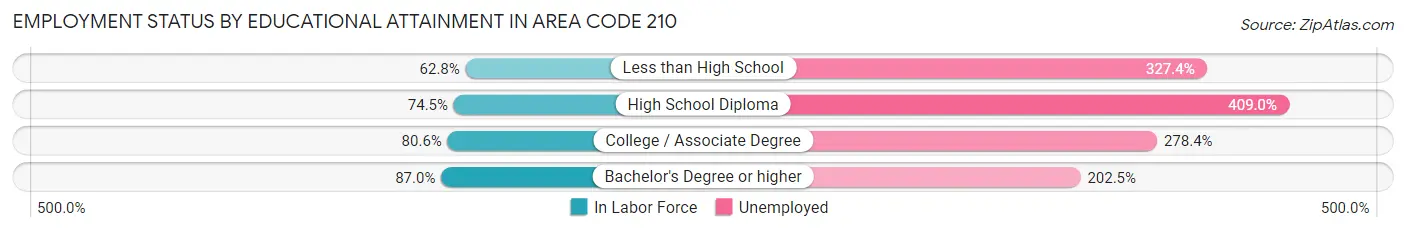
| Educational Attainment | In Labor Force | Unemployed |
| Less than High School | 79,247 (62.8%) | 413,143 (327.4%) |
| High School Diploma | 177,715 (74.5%) | 976,066 (409.0%) |
| College / Associate Degree | 242,493 (80.6%) | 837,335 (278.4%) |
| Bachelor's Degree or higher | 245,463 (87.0%) | 571,570 (202.5%) |
| Total | 742,569 (78.3%) | 2,791,448 (294.5%) |
Employment Occupations by Sex in Area Code 210
Management, Business, Science and Arts Occupations
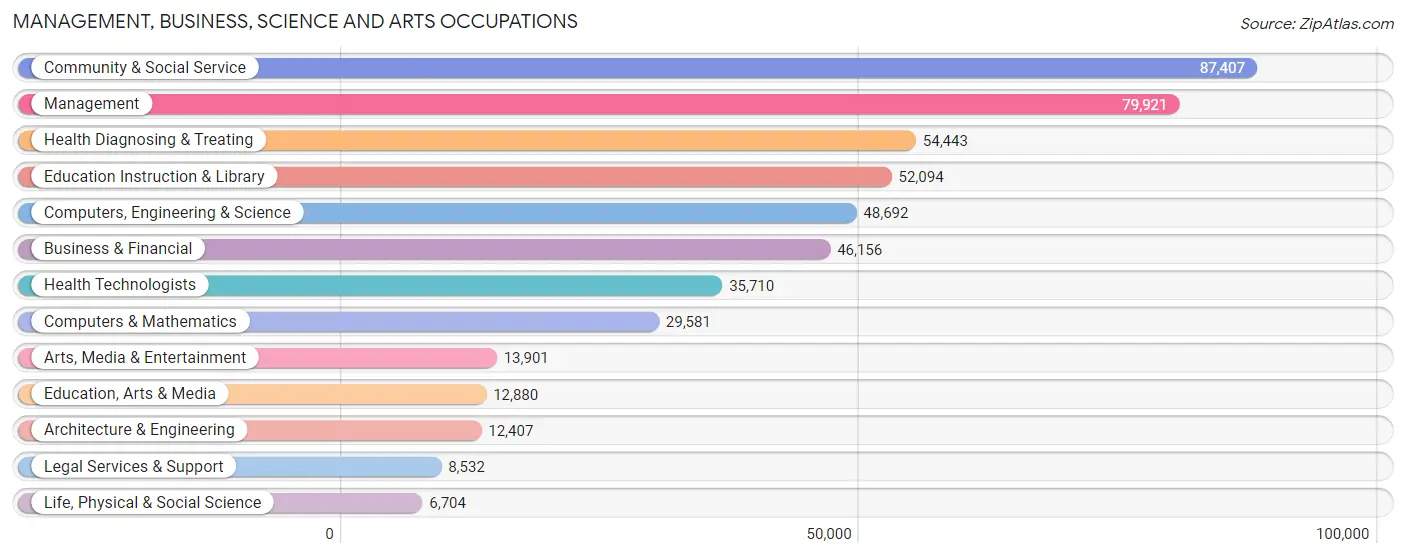
The most common Management, Business, Science and Arts occupations in Area Code 210 are Community & Social Service (87,407 | 10.1%), Management (79,921 | 9.2%), Health Diagnosing & Treating (54,443 | 6.3%), Education Instruction & Library (52,094 | 6.0%), and Computers, Engineering & Science (48,692 | 5.6%).
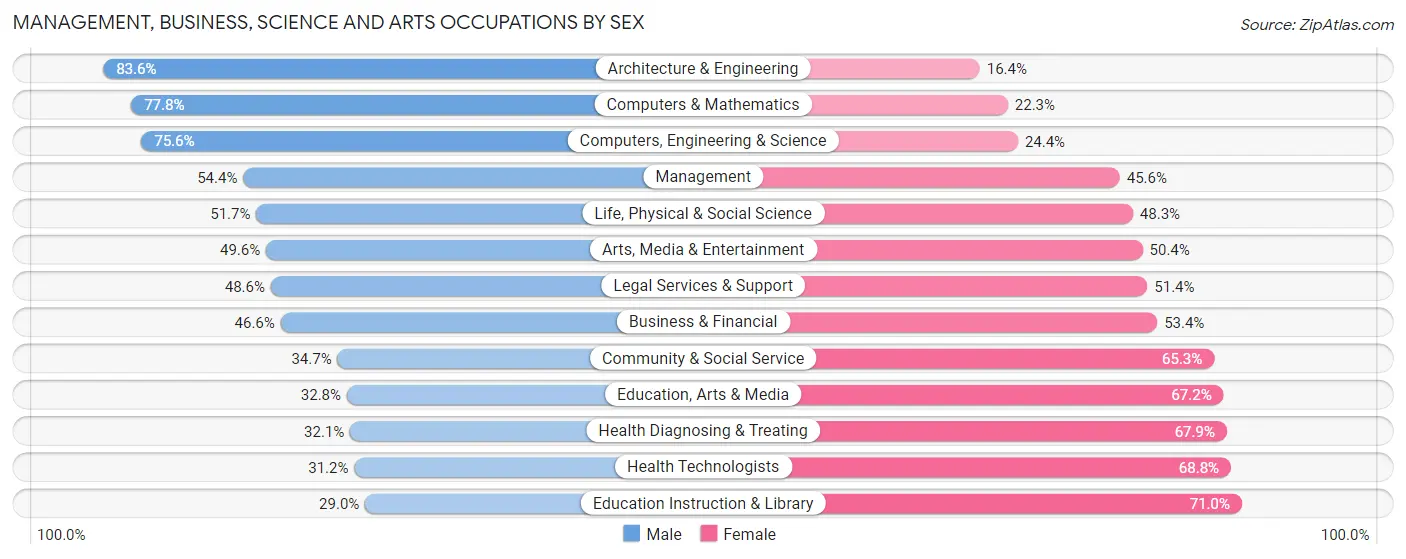
Management, Business, Science and Arts Occupations by Sex
Within the Management, Business, Science and Arts occupations in Area Code 210, the most male-oriented occupations are Architecture & Engineering (83.6%), Computers & Mathematics (77.7%), and Computers, Engineering & Science (75.6%), while the most female-oriented occupations are Education Instruction & Library (71.0%), Health Technologists (68.8%), and Health Diagnosing & Treating (67.9%).
| Occupation | Male | Female |
| Management | 43,467 (54.4%) | 36,454 (45.6%) |
| Business & Financial | 21,504 (46.6%) | 24,652 (53.4%) |
| Computers, Engineering & Science | 36,833 (75.6%) | 11,859 (24.4%) |
| Computers & Mathematics | 22,998 (77.7%) | 6,583 (22.3%) |
| Architecture & Engineering | 10,372 (83.6%) | 2,035 (16.4%) |
| Life, Physical & Social Science | 3,463 (51.7%) | 3,241 (48.3%) |
| Community & Social Service | 30,360 (34.7%) | 57,047 (65.3%) |
| Education, Arts & Media | 4,221 (32.8%) | 8,659 (67.2%) |
| Legal Services & Support | 4,150 (48.6%) | 4,382 (51.4%) |
| Education Instruction & Library | 15,088 (29.0%) | 37,006 (71.0%) |
| Arts, Media & Entertainment | 6,901 (49.6%) | 7,000 (50.4%) |
| Health Diagnosing & Treating | 17,470 (32.1%) | 36,973 (67.9%) |
| Health Technologists | 11,147 (31.2%) | 24,563 (68.8%) |
| Total (Category) | 149,634 (47.3%) | 166,985 (52.7%) |
| Total (Overall) | 461,687 (53.3%) | 404,432 (46.7%) |
Services Occupations
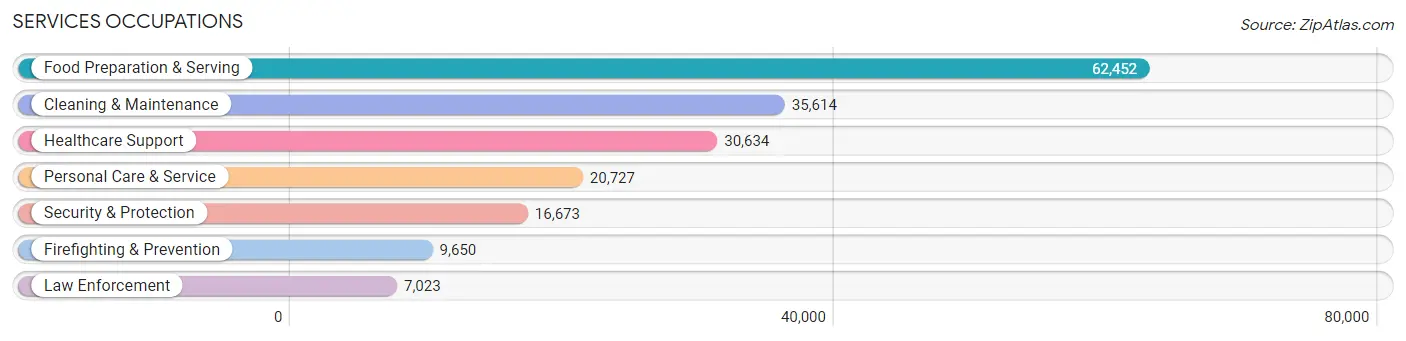
The most common Services occupations in Area Code 210 are Food Preparation & Serving (62,452 | 7.2%), Cleaning & Maintenance (35,614 | 4.1%), Healthcare Support (30,634 | 3.5%), Personal Care & Service (20,727 | 2.4%), and Security & Protection (16,673 | 1.9%).
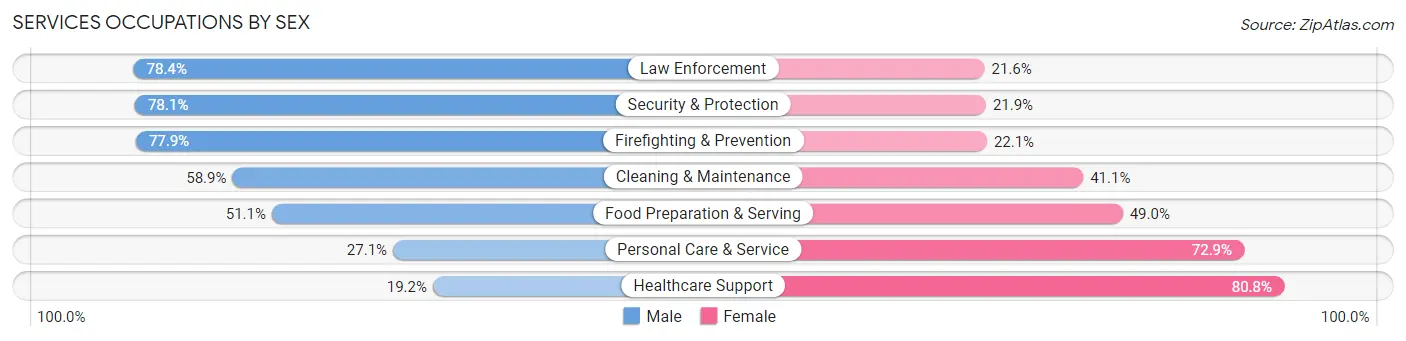
Services Occupations by Sex
Within the Services occupations in Area Code 210, the most male-oriented occupations are Law Enforcement (78.4%), Security & Protection (78.1%), and Firefighting & Prevention (77.9%), while the most female-oriented occupations are Healthcare Support (80.8%), Personal Care & Service (72.9%), and Food Preparation & Serving (48.9%).
| Occupation | Male | Female |
| Healthcare Support | 5,874 (19.2%) | 24,760 (80.8%) |
| Security & Protection | 13,028 (78.1%) | 3,645 (21.9%) |
| Firefighting & Prevention | 7,521 (77.9%) | 2,129 (22.1%) |
| Law Enforcement | 5,507 (78.4%) | 1,516 (21.6%) |
| Food Preparation & Serving | 31,880 (51.0%) | 30,572 (48.9%) |
| Cleaning & Maintenance | 20,967 (58.9%) | 14,647 (41.1%) |
| Personal Care & Service | 5,611 (27.1%) | 15,116 (72.9%) |
| Total (Category) | 77,360 (46.6%) | 88,740 (53.4%) |
| Total (Overall) | 461,687 (53.3%) | 404,432 (46.7%) |
Sales and Office Occupations
The most common Sales and Office occupations in Area Code 210 are Office & Administration (110,853 | 12.8%), and Sales & Related (89,079 | 10.3%).
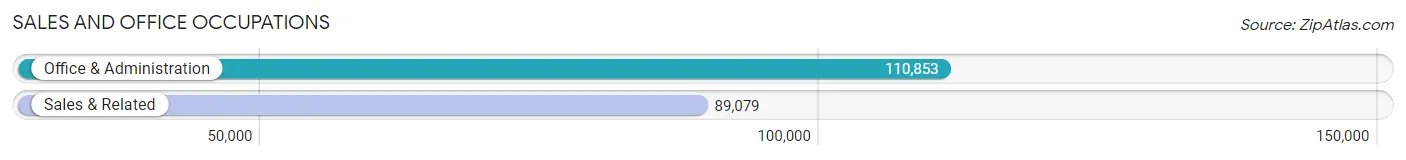
Sales and Office Occupations by Sex
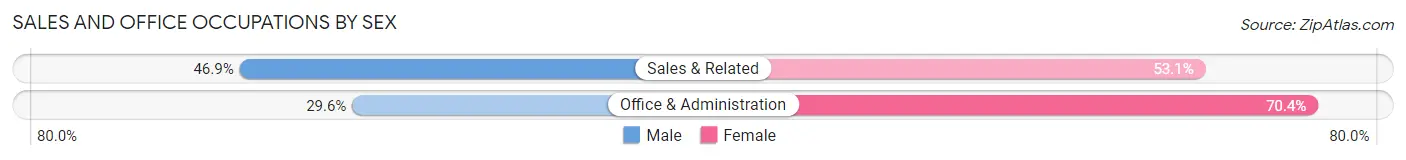
| Occupation | Male | Female |
| Sales & Related | 41,815 (46.9%) | 47,264 (53.1%) |
| Office & Administration | 32,809 (29.6%) | 78,044 (70.4%) |
| Total (Category) | 74,624 (37.3%) | 125,308 (62.7%) |
| Total (Overall) | 461,687 (53.3%) | 404,432 (46.7%) |
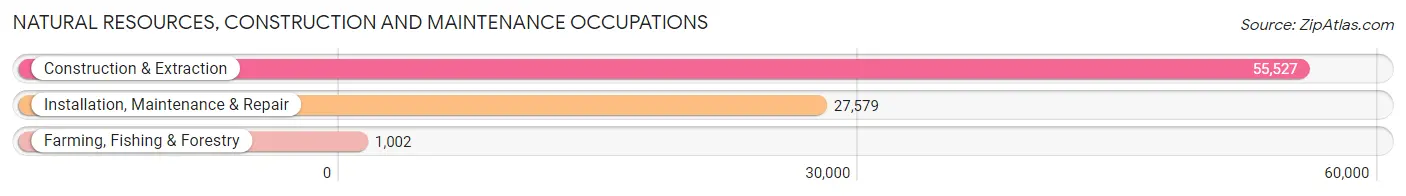
Natural Resources, Construction and Maintenance Occupations
The most common Natural Resources, Construction and Maintenance occupations in Area Code 210 are Construction & Extraction (55,527 | 6.4%), Installation, Maintenance & Repair (27,579 | 3.2%), and Farming, Fishing & Forestry (1,002 | 0.1%).
Natural Resources, Construction and Maintenance Occupations by Sex
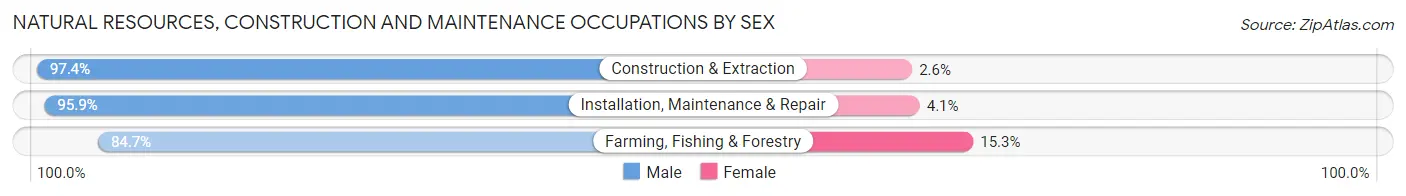
| Occupation | Male | Female |
| Farming, Fishing & Forestry | 849 (84.7%) | 153 (15.3%) |
| Construction & Extraction | 54,105 (97.4%) | 1,422 (2.6%) |
| Installation, Maintenance & Repair | 26,440 (95.9%) | 1,139 (4.1%) |
| Total (Category) | 81,394 (96.8%) | 2,714 (3.2%) |
| Total (Overall) | 461,687 (53.3%) | 404,432 (46.7%) |
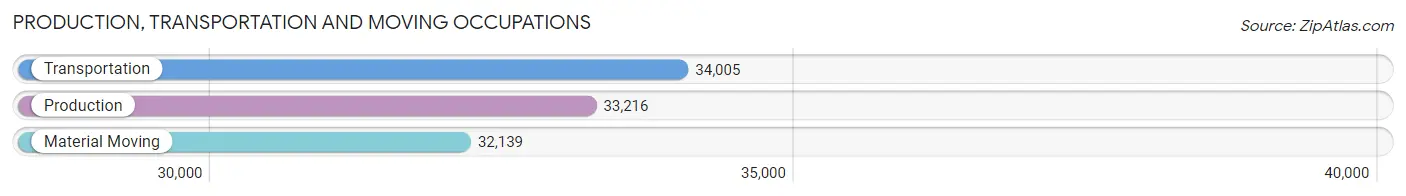
Production, Transportation and Moving Occupations
The most common Production, Transportation and Moving occupations in Area Code 210 are Transportation (34,005 | 3.9%), Production (33,216 | 3.8%), and Material Moving (32,139 | 3.7%).
Production, Transportation and Moving Occupations by Sex
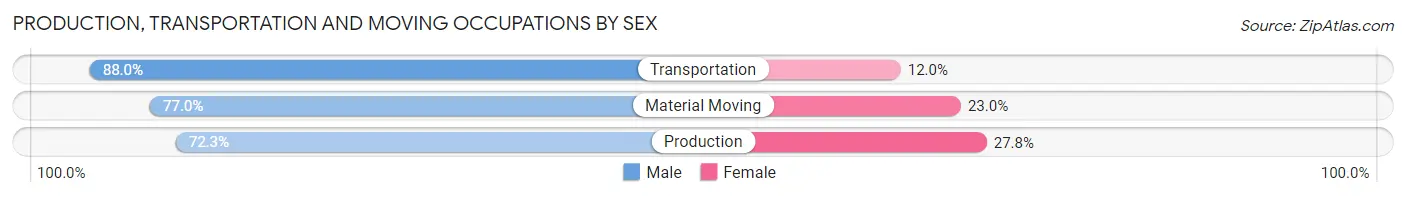
| Occupation | Male | Female |
| Production | 23,999 (72.3%) | 9,217 (27.8%) |
| Transportation | 29,935 (88.0%) | 4,070 (12.0%) |
| Material Moving | 24,741 (77.0%) | 7,398 (23.0%) |
| Total (Category) | 78,675 (79.2%) | 20,685 (20.8%) |
| Total (Overall) | 461,687 (53.3%) | 404,432 (46.7%) |
Employment Industries by Sex in Area Code 210
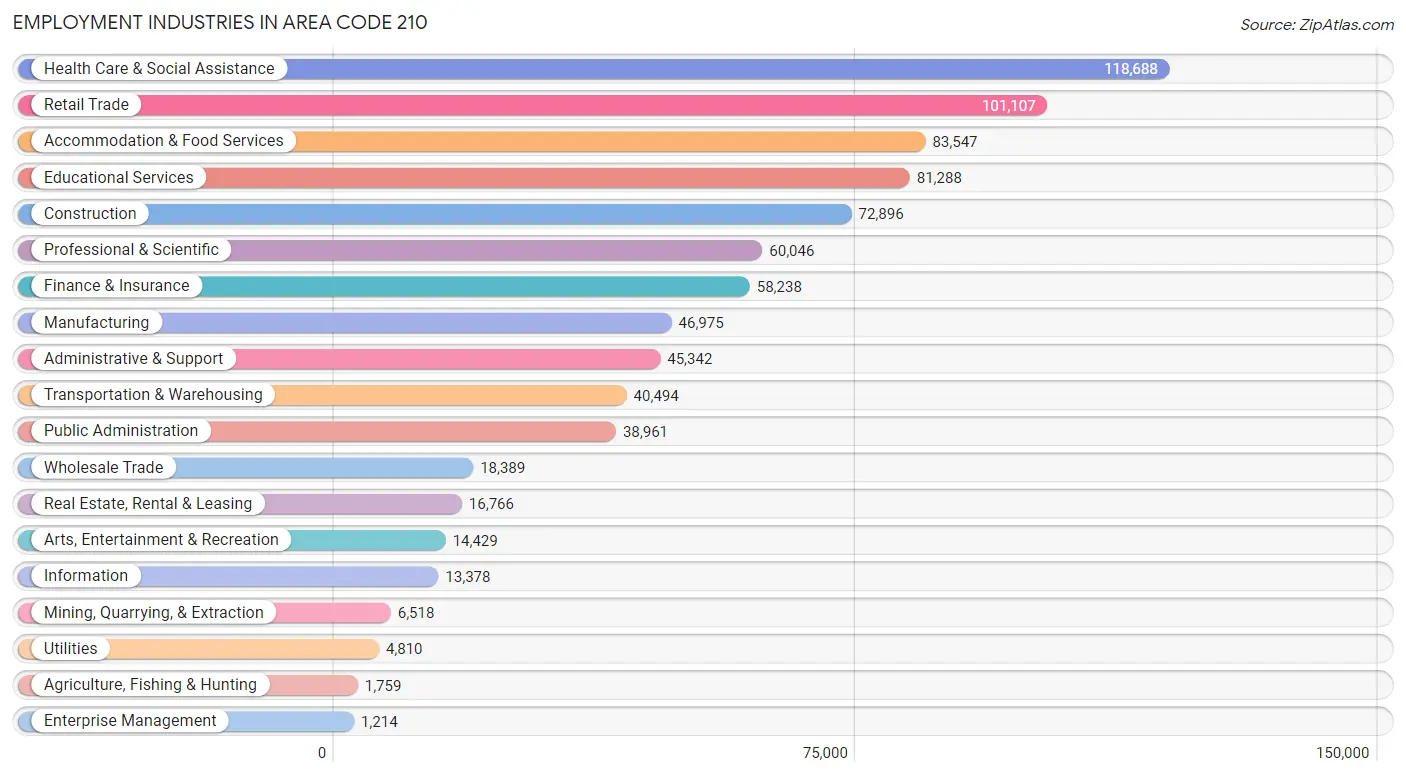
Employment Industries in Area Code 210
The major employment industries in Area Code 210 include Health Care & Social Assistance (118,688 | 13.7%), Retail Trade (101,107 | 11.7%), Accommodation & Food Services (83,547 | 9.7%), Educational Services (81,288 | 9.4%), and Construction (72,896 | 8.4%).
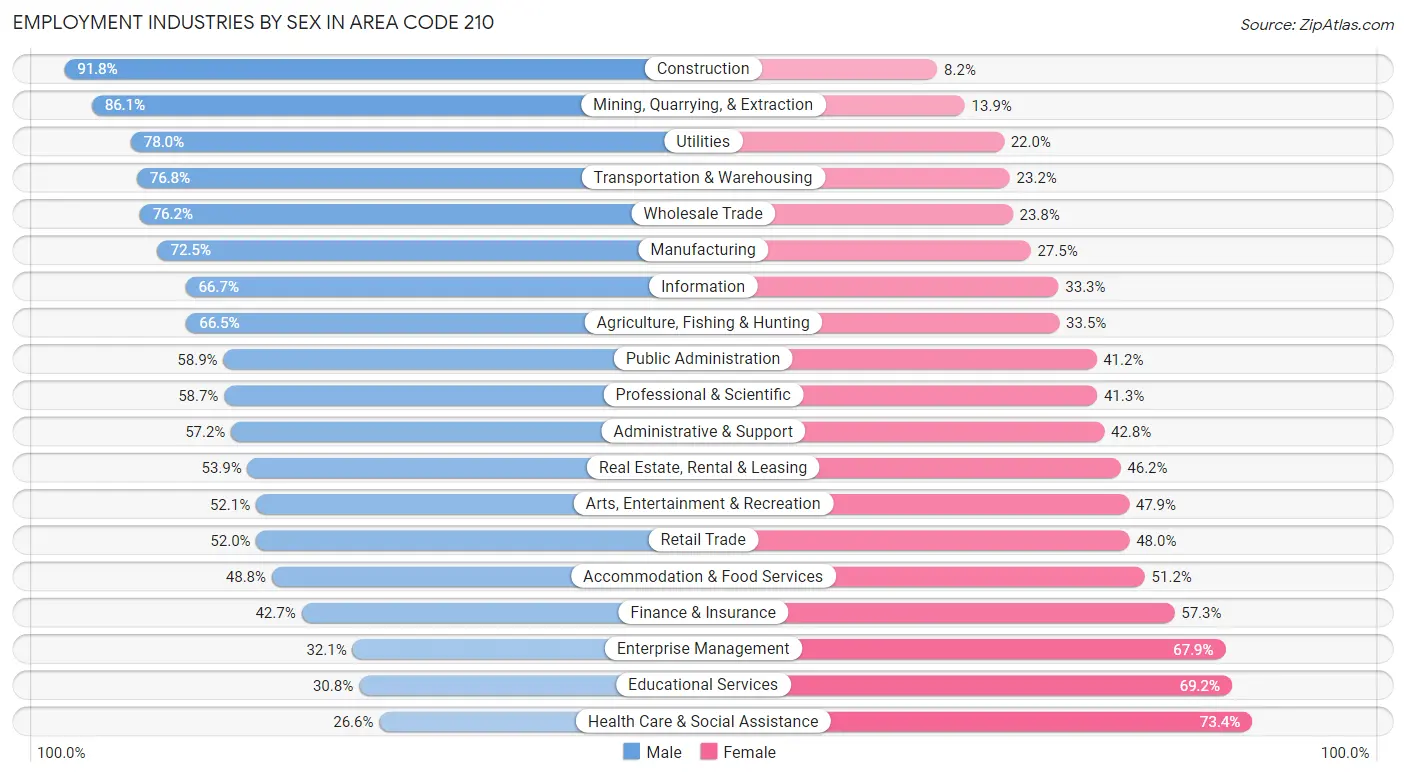
Employment Industries by Sex in Area Code 210
The Area Code 210 industries that see more men than women are Construction (91.8%), Mining, Quarrying, & Extraction (86.1%), and Utilities (78.0%), whereas the industries that tend to have a higher number of women are Health Care & Social Assistance (73.4%), Educational Services (69.2%), and Enterprise Management (67.9%).
| Industry | Male | Female |
| Agriculture, Fishing & Hunting | 1,170 (66.5%) | 589 (33.5%) |
| Mining, Quarrying, & Extraction | 5,611 (86.1%) | 907 (13.9%) |
| Construction | 66,897 (91.8%) | 5,999 (8.2%) |
| Manufacturing | 34,039 (72.5%) | 12,936 (27.5%) |
| Wholesale Trade | 14,007 (76.2%) | 4,382 (23.8%) |
| Retail Trade | 52,591 (52.0%) | 48,516 (48.0%) |
| Transportation & Warehousing | 31,087 (76.8%) | 9,407 (23.2%) |
| Utilities | 3,752 (78.0%) | 1,058 (22.0%) |
| Information | 8,922 (66.7%) | 4,456 (33.3%) |
| Finance & Insurance | 24,860 (42.7%) | 33,378 (57.3%) |
| Real Estate, Rental & Leasing | 9,029 (53.8%) | 7,737 (46.2%) |
| Professional & Scientific | 35,242 (58.7%) | 24,804 (41.3%) |
| Enterprise Management | 390 (32.1%) | 824 (67.9%) |
| Administrative & Support | 25,955 (57.2%) | 19,387 (42.8%) |
| Educational Services | 25,032 (30.8%) | 56,256 (69.2%) |
| Health Care & Social Assistance | 31,546 (26.6%) | 87,142 (73.4%) |
| Arts, Entertainment & Recreation | 7,519 (52.1%) | 6,910 (47.9%) |
| Accommodation & Food Services | 40,785 (48.8%) | 42,762 (51.2%) |
| Public Administration | 22,930 (58.9%) | 16,031 (41.1%) |
| Total | 461,687 (53.3%) | 404,432 (46.7%) |
Education in Area Code 210
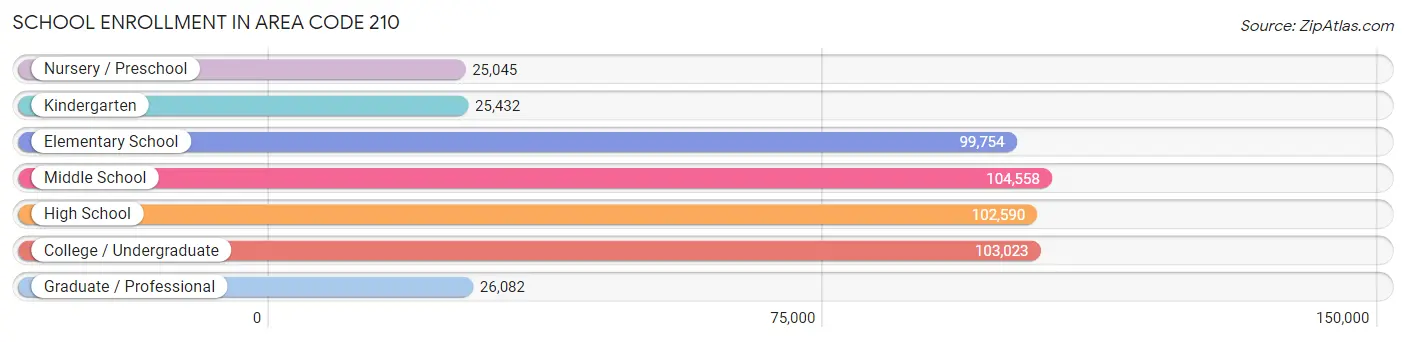
School Enrollment in Area Code 210
The most common levels of schooling among the 486,484 students in Area Code 210 are middle school (104,558 | 21.5%), college / undergraduate (103,023 | 21.2%), and high school (102,590 | 21.1%).
| School Level | # Students | % Students |
| Nursery / Preschool | 25,045 | 5.1% |
| Kindergarten | 25,432 | 5.2% |
| Elementary School | 99,754 | 20.5% |
| Middle School | 104,558 | 21.5% |
| High School | 102,590 | 21.1% |
| College / Undergraduate | 103,023 | 21.2% |
| Graduate / Professional | 26,082 | 5.4% |
| Total | 486,484 | 100.0% |
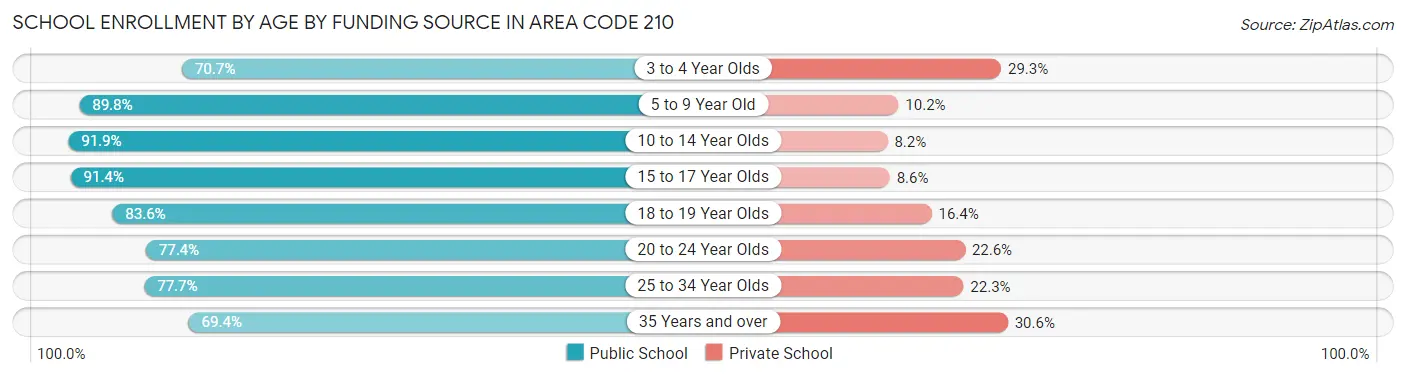
School Enrollment by Age by Funding Source in Area Code 210
Out of a total of 486,484 students who are enrolled in schools in Area Code 210, 67,610 (13.9%) attend a private institution, while the remaining 418,874 (86.1%) are enrolled in public schools. The age group of 35 years and over has the highest likelihood of being enrolled in private schools, with 8,215 (30.6% in the age bracket) enrolled. Conversely, the age group of 10 to 14 year olds has the lowest likelihood of being enrolled in a private school, with 118,928 (91.8% in the age bracket) attending a public institution.
| Age Bracket | Public School | Private School |
| 3 to 4 Year Olds | 13,962 (70.7%) | 5,792 (29.3%) |
| 5 to 9 Year Old | 103,673 (89.8%) | 11,767 (10.2%) |
| 10 to 14 Year Olds | 118,928 (91.8%) | 10,551 (8.2%) |
| 15 to 17 Year Olds | 67,808 (91.4%) | 6,361 (8.6%) |
| 18 to 19 Year Olds | 30,234 (83.6%) | 5,913 (16.4%) |
| 20 to 24 Year Olds | 37,163 (77.4%) | 10,845 (22.6%) |
| 25 to 34 Year Olds | 28,441 (77.7%) | 8,163 (22.3%) |
| 35 Years and over | 18,668 (69.4%) | 8,215 (30.6%) |
| Total | 418,874 (86.1%) | 67,610 (13.9%) |
Educational Attainment by Field of Study in Area Code 210
Business (78,241 | 21.4%), education (40,201 | 11.0%), science & technology (38,342 | 10.5%), bio, nature & agricultural (25,927 | 7.1%), and social sciences (24,352 | 6.7%) are the most common fields of study among 365,243 individuals in Area Code 210 who have obtained a bachelor's degree or higher.
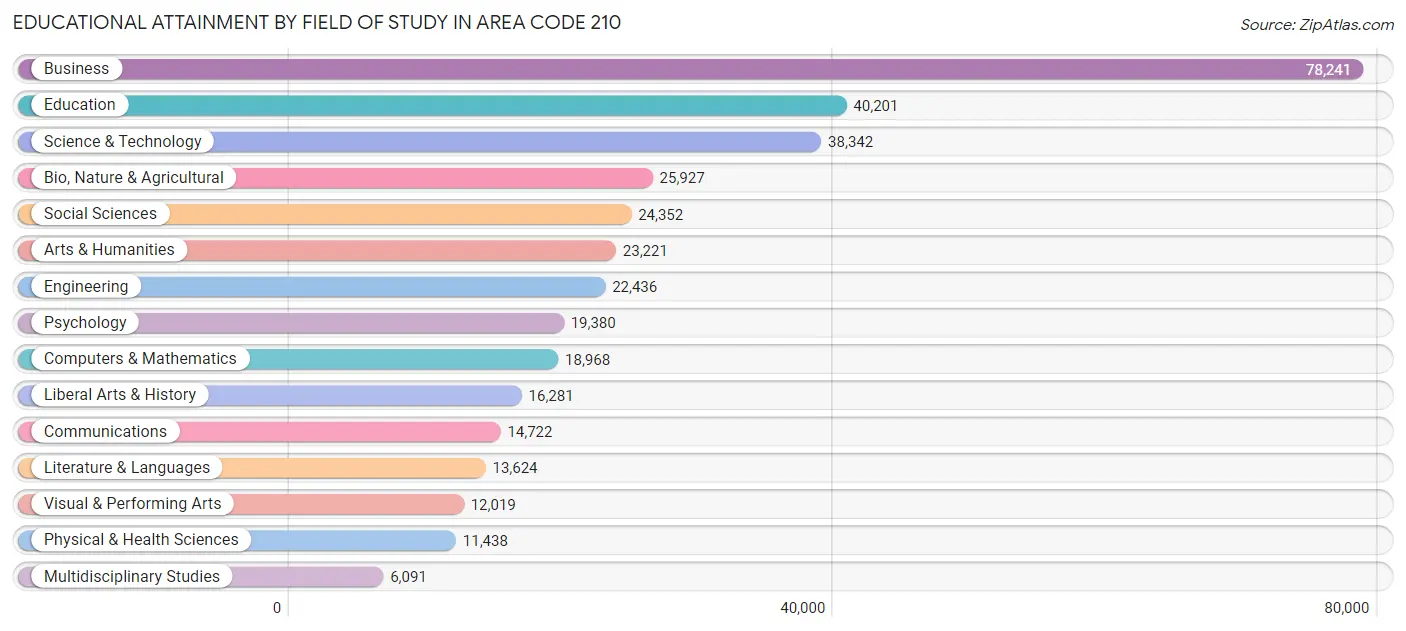
| Field of Study | # Graduates | % Graduates |
| Computers & Mathematics | 18,968 | 5.2% |
| Bio, Nature & Agricultural | 25,927 | 7.1% |
| Physical & Health Sciences | 11,438 | 3.1% |
| Psychology | 19,380 | 5.3% |
| Social Sciences | 24,352 | 6.7% |
| Engineering | 22,436 | 6.1% |
| Multidisciplinary Studies | 6,091 | 1.7% |
| Science & Technology | 38,342 | 10.5% |
| Business | 78,241 | 21.4% |
| Education | 40,201 | 11.0% |
| Literature & Languages | 13,624 | 3.7% |
| Liberal Arts & History | 16,281 | 4.5% |
| Visual & Performing Arts | 12,019 | 3.3% |
| Communications | 14,722 | 4.0% |
| Arts & Humanities | 23,221 | 6.4% |
| Total | 365,243 | 100.0% |
Transportation & Commute in Area Code 210
Vehicle Availability by Sex in Area Code 210
The most prevalent vehicle ownership categories in Area Code 210 are males with 2 vehicles (197,264, accounting for 42.8%) and females with 2 vehicles (160,387, making up 49.9%).
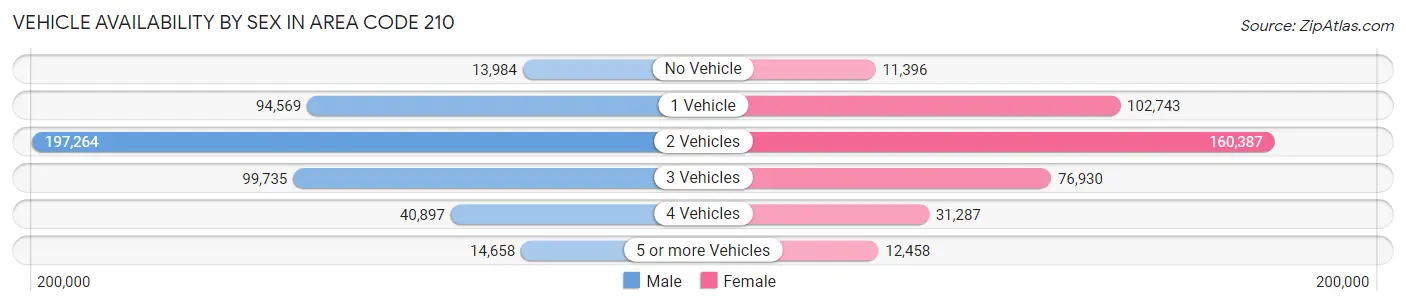
| Vehicles Available | Male | Female |
| No Vehicle | 13,984 (3.0%) | 11,396 (2.9%) |
| 1 Vehicle | 94,569 (20.5%) | 102,743 (26.0%) |
| 2 Vehicles | 197,264 (42.8%) | 160,387 (40.6%) |
| 3 Vehicles | 99,735 (21.6%) | 76,930 (19.5%) |
| 4 Vehicles | 40,897 (8.9%) | 31,287 (7.9%) |
| 5 or more Vehicles | 14,658 (3.2%) | 12,458 (3.2%) |
| Total | 461,107 (100.0%) | 395,201 (100.0%) |
Commute Time in Area Code 210
The most frequently occuring commute durations in Area Code 210 are 20 to 24 minutes (137,653 commuters, 17.7%), 15 to 19 minutes (129,182 commuters, 16.6%), and 30 to 34 minutes (126,251 commuters, 16.2%).
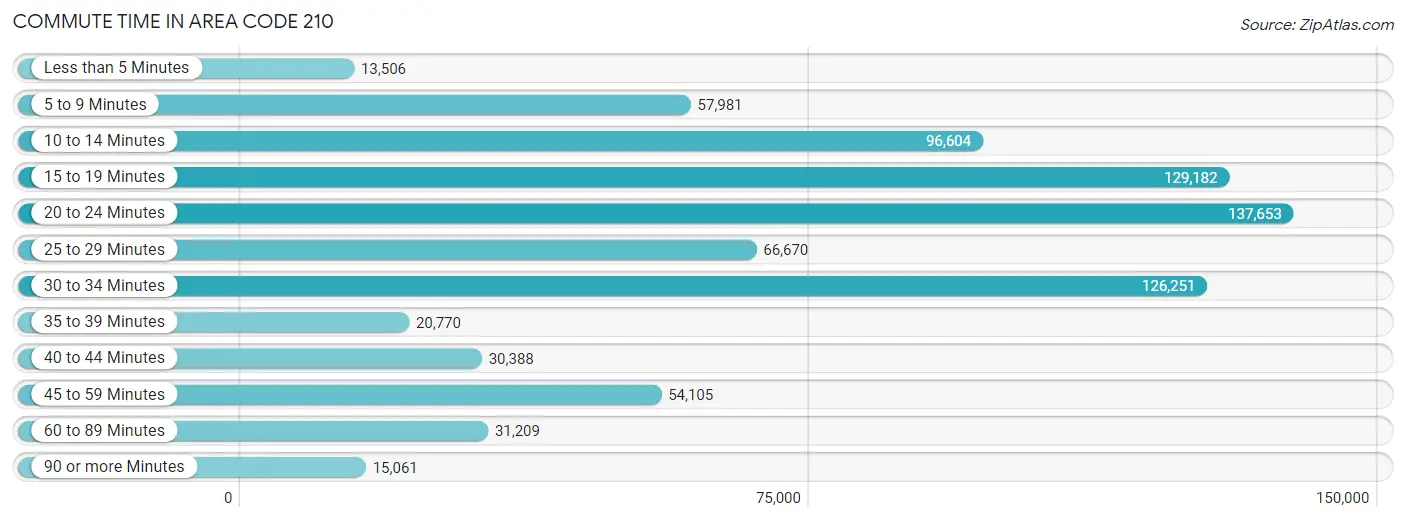
| Commute Time | # Commuters | % Commuters |
| Less than 5 Minutes | 13,506 | 1.7% |
| 5 to 9 Minutes | 57,981 | 7.4% |
| 10 to 14 Minutes | 96,604 | 12.4% |
| 15 to 19 Minutes | 129,182 | 16.6% |
| 20 to 24 Minutes | 137,653 | 17.7% |
| 25 to 29 Minutes | 66,670 | 8.6% |
| 30 to 34 Minutes | 126,251 | 16.2% |
| 35 to 39 Minutes | 20,770 | 2.7% |
| 40 to 44 Minutes | 30,388 | 3.9% |
| 45 to 59 Minutes | 54,105 | 6.9% |
| 60 to 89 Minutes | 31,209 | 4.0% |
| 90 or more Minutes | 15,061 | 1.9% |
Commute Time by Sex in Area Code 210
The most common commute times in Area Code 210 are 30 to 34 minutes (74,759 commuters, 17.6%) for males and 20 to 24 minutes (63,469 commuters, 17.9%) for females.
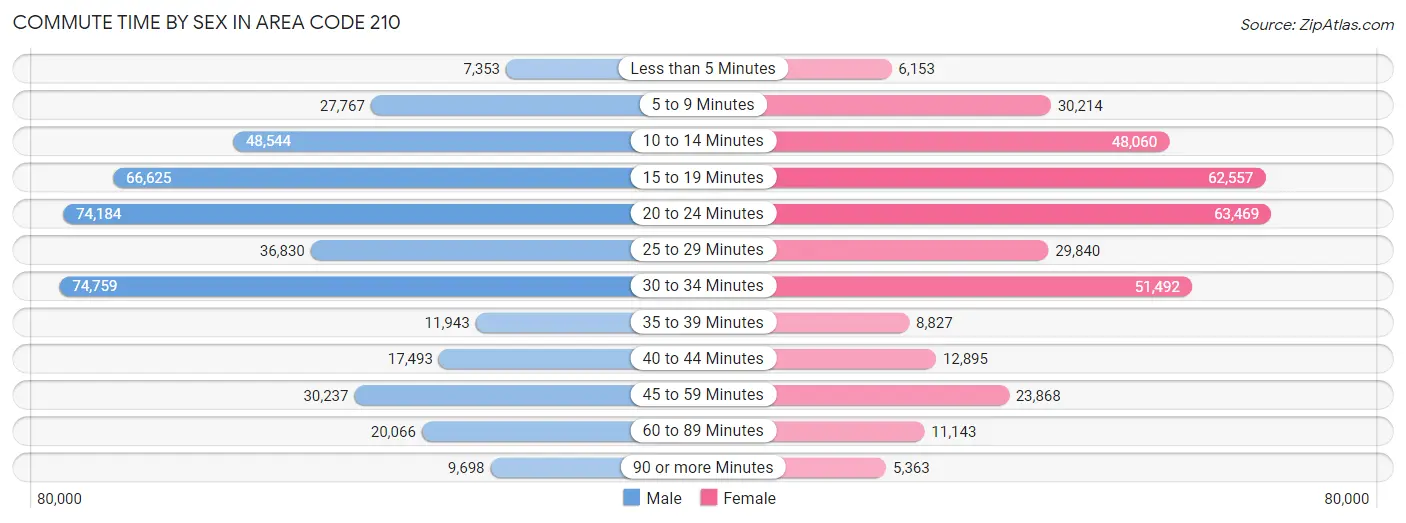
| Commute Time | Male | Female |
| Less than 5 Minutes | 7,353 (1.7%) | 6,153 (1.7%) |
| 5 to 9 Minutes | 27,767 (6.5%) | 30,214 (8.5%) |
| 10 to 14 Minutes | 48,544 (11.4%) | 48,060 (13.6%) |
| 15 to 19 Minutes | 66,625 (15.7%) | 62,557 (17.7%) |
| 20 to 24 Minutes | 74,184 (17.4%) | 63,469 (17.9%) |
| 25 to 29 Minutes | 36,830 (8.7%) | 29,840 (8.4%) |
| 30 to 34 Minutes | 74,759 (17.6%) | 51,492 (14.5%) |
| 35 to 39 Minutes | 11,943 (2.8%) | 8,827 (2.5%) |
| 40 to 44 Minutes | 17,493 (4.1%) | 12,895 (3.6%) |
| 45 to 59 Minutes | 30,237 (7.1%) | 23,868 (6.7%) |
| 60 to 89 Minutes | 20,066 (4.7%) | 11,143 (3.2%) |
| 90 or more Minutes | 9,698 (2.3%) | 5,363 (1.5%) |
Time of Departure to Work by Sex in Area Code 210
The most frequent times of departure to work in Area Code 210 are 7:00 AM to 7:29 AM (58,477, 13.7%) for males and 7:00 AM to 7:29 AM (58,655, 16.6%) for females.
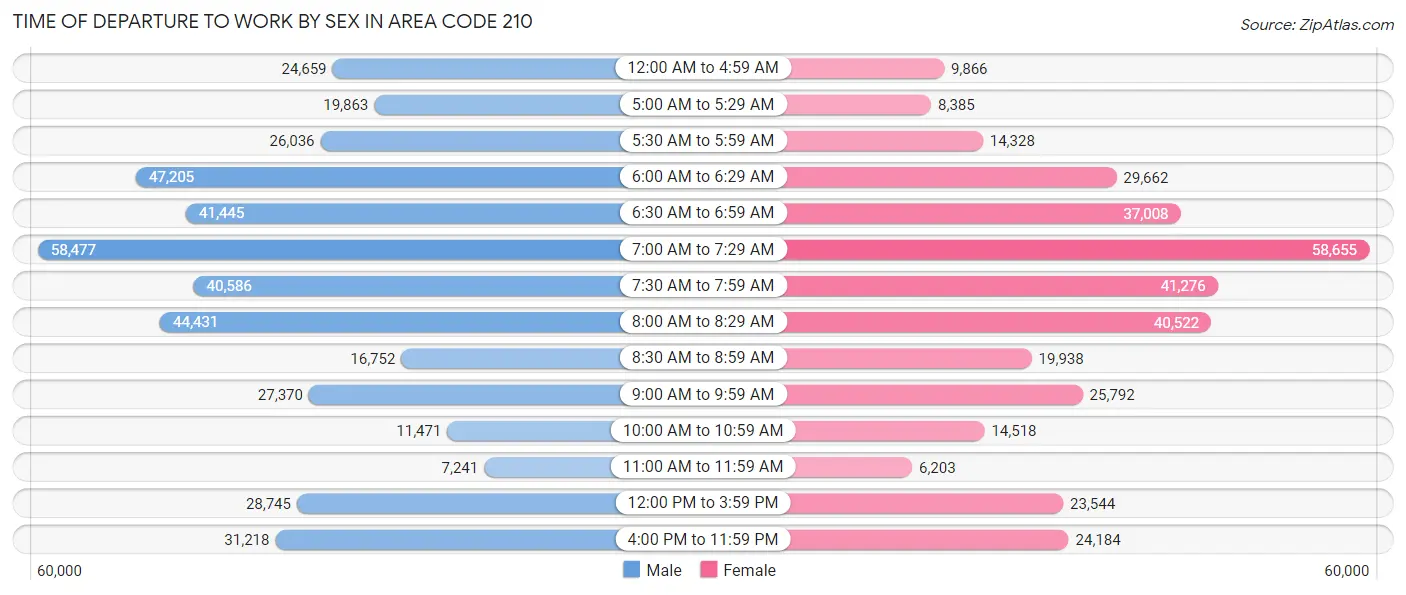
| Time of Departure | Male | Female |
| 12:00 AM to 4:59 AM | 24,659 (5.8%) | 9,866 (2.8%) |
| 5:00 AM to 5:29 AM | 19,863 (4.7%) | 8,385 (2.4%) |
| 5:30 AM to 5:59 AM | 26,036 (6.1%) | 14,328 (4.1%) |
| 6:00 AM to 6:29 AM | 47,205 (11.1%) | 29,662 (8.4%) |
| 6:30 AM to 6:59 AM | 41,445 (9.7%) | 37,008 (10.5%) |
| 7:00 AM to 7:29 AM | 58,477 (13.7%) | 58,655 (16.6%) |
| 7:30 AM to 7:59 AM | 40,586 (9.5%) | 41,276 (11.7%) |
| 8:00 AM to 8:29 AM | 44,431 (10.4%) | 40,522 (11.5%) |
| 8:30 AM to 8:59 AM | 16,752 (3.9%) | 19,938 (5.6%) |
| 9:00 AM to 9:59 AM | 27,370 (6.4%) | 25,792 (7.3%) |
| 10:00 AM to 10:59 AM | 11,471 (2.7%) | 14,518 (4.1%) |
| 11:00 AM to 11:59 AM | 7,241 (1.7%) | 6,203 (1.8%) |
| 12:00 PM to 3:59 PM | 28,745 (6.8%) | 23,544 (6.7%) |
| 4:00 PM to 11:59 PM | 31,218 (7.3%) | 24,184 (6.8%) |
| Total | 425,499 (100.0%) | 353,881 (100.0%) |
Housing Occupancy in Area Code 210
Occupancy by Ownership in Area Code 210
Of the total 664,155 dwellings in Area Code 210, owner-occupied units account for 373,918 (56.3%), while renter-occupied units make up 290,237 (43.7%).
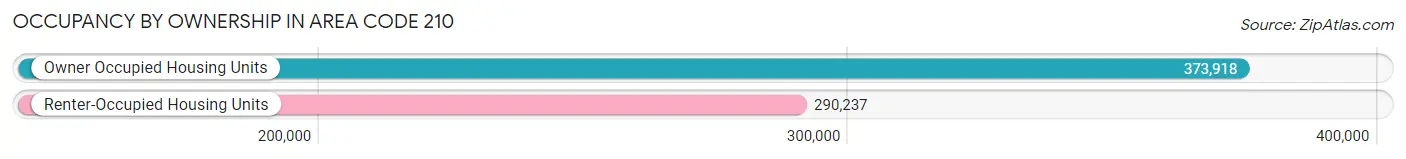
| Occupancy | # Housing Units | % Housing Units |
| Owner Occupied Housing Units | 373,918 | 56.3% |
| Renter-Occupied Housing Units | 290,237 | 43.7% |
| Total Occupied Housing Units | 664,155 | 100.0% |
Occupancy by Household Size in Area Code 210
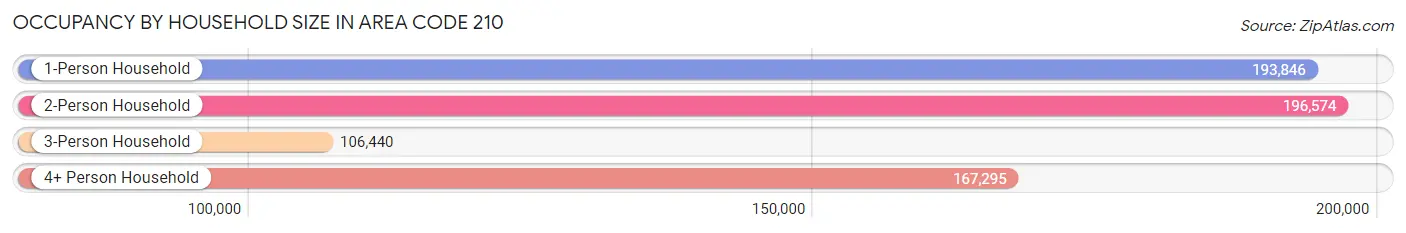
| Household Size | # Housing Units | % Housing Units |
| 1-Person Household | 193,846 | 29.2% |
| 2-Person Household | 196,574 | 29.6% |
| 3-Person Household | 106,440 | 16.0% |
| 4+ Person Household | 167,295 | 25.2% |
| Total Housing Units | 664,155 | 100.0% |
Occupancy by Ownership by Household Size in Area Code 210
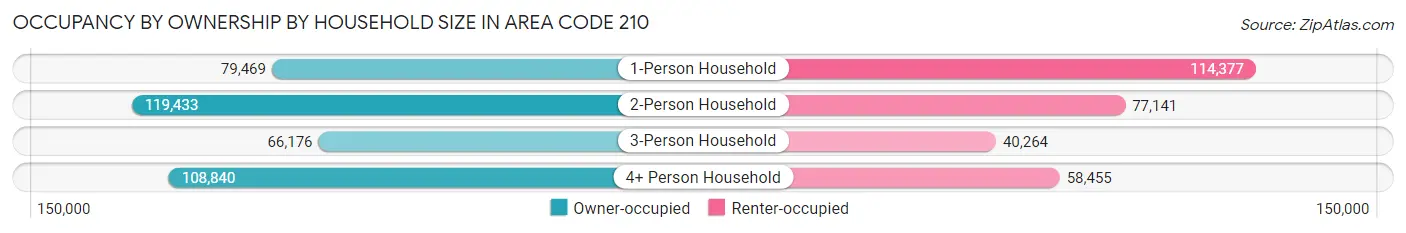
| Household Size | Owner-occupied | Renter-occupied |
| 1-Person Household | 79,469 (41.0%) | 114,377 (59.0%) |
| 2-Person Household | 119,433 (60.8%) | 77,141 (39.2%) |
| 3-Person Household | 66,176 (62.2%) | 40,264 (37.8%) |
| 4+ Person Household | 108,840 (65.1%) | 58,455 (34.9%) |
| Total Housing Units | 373,918 (56.3%) | 290,237 (43.7%) |
Occupancy by Educational Attainment in Area Code 210
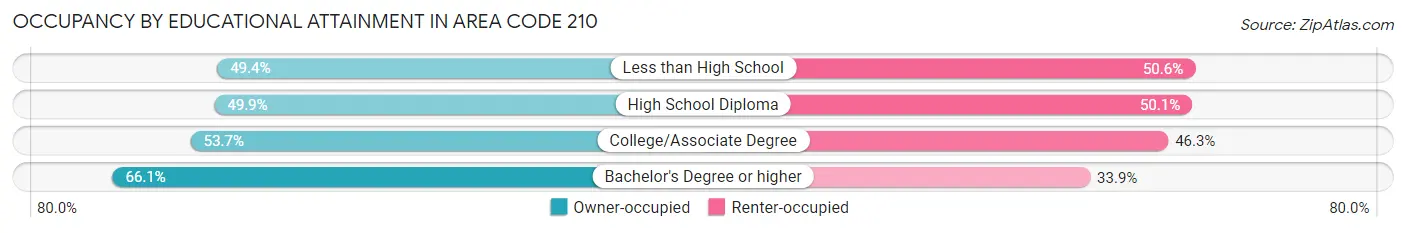
| Household Size | Owner-occupied | Renter-occupied |
| Less than High School | 40,622 (49.4%) | 41,535 (50.6%) |
| High School Diploma | 74,362 (49.9%) | 74,652 (50.1%) |
| College/Associate Degree | 117,520 (53.7%) | 101,402 (46.3%) |
| Bachelor's Degree or higher | 141,414 (66.1%) | 72,648 (33.9%) |
Occupancy by Age of Householder in Area Code 210
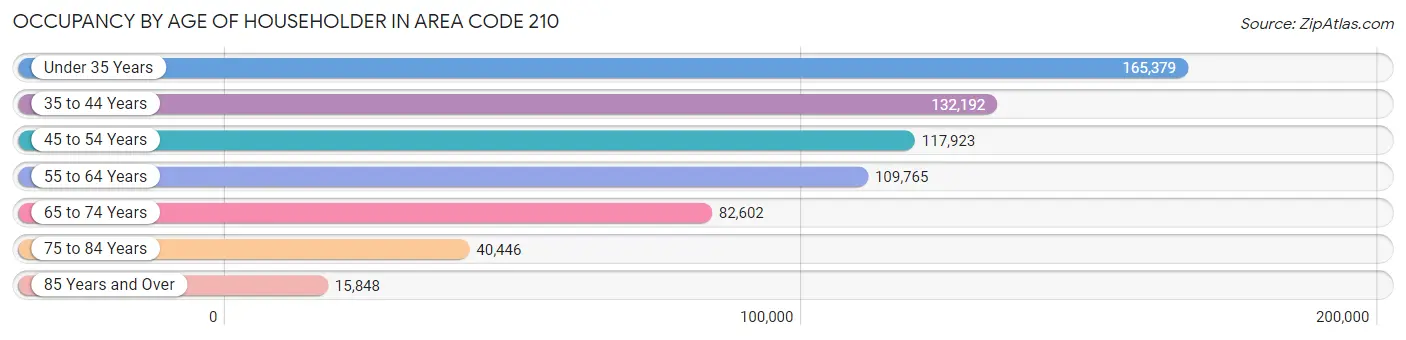
| Age Bracket | # Households | % Households |
| Under 35 Years | 165,379 | 24.9% |
| 35 to 44 Years | 132,192 | 19.9% |
| 45 to 54 Years | 117,923 | 17.8% |
| 55 to 64 Years | 109,765 | 16.5% |
| 65 to 74 Years | 82,602 | 12.4% |
| 75 to 84 Years | 40,446 | 6.1% |
| 85 Years and Over | 15,848 | 2.4% |
| Total | 664,155 | 100.0% |
Housing Finances in Area Code 210
Median Income by Occupancy in Area Code 210
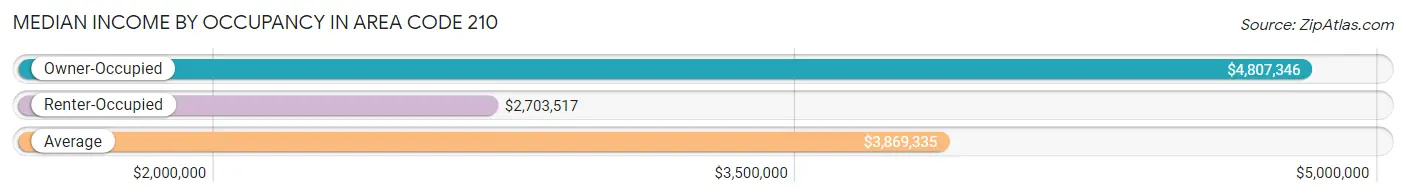
| Occupancy Type | # Households | Median Income |
| Owner-Occupied | 373,918 (56.3%) | $4,807,346 |
| Renter-Occupied | 290,237 (43.7%) | $2,703,517 |
| Average | 664,155 (100.0%) | $3,869,335 |
Occupancy by Householder Income Bracket in Area Code 210
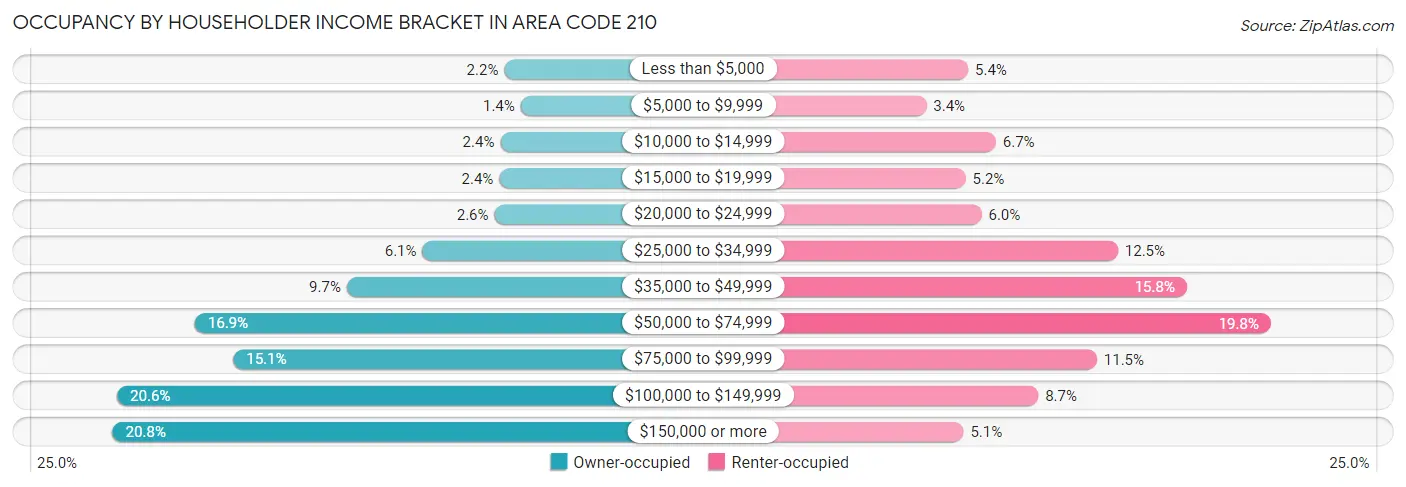
| Income Bracket | Owner-occupied | Renter-occupied |
| Less than $5,000 | 8,094 (2.2%) | 15,551 (5.4%) |
| $5,000 to $9,999 | 5,172 (1.4%) | 9,793 (3.4%) |
| $10,000 to $14,999 | 8,776 (2.4%) | 19,379 (6.7%) |
| $15,000 to $19,999 | 8,963 (2.4%) | 15,194 (5.2%) |
| $20,000 to $24,999 | 9,844 (2.6%) | 17,408 (6.0%) |
| $25,000 to $34,999 | 22,673 (6.1%) | 36,250 (12.5%) |
| $35,000 to $49,999 | 36,134 (9.7%) | 45,772 (15.8%) |
| $50,000 to $74,999 | 63,138 (16.9%) | 57,378 (19.8%) |
| $75,000 to $99,999 | 56,299 (15.1%) | 33,349 (11.5%) |
| $100,000 to $149,999 | 76,995 (20.6%) | 25,250 (8.7%) |
| $150,000 or more | 77,830 (20.8%) | 14,913 (5.1%) |
| Total | 373,918 (100.0%) | 290,237 (100.0%) |
Monthly Housing Cost Tiers in Area Code 210
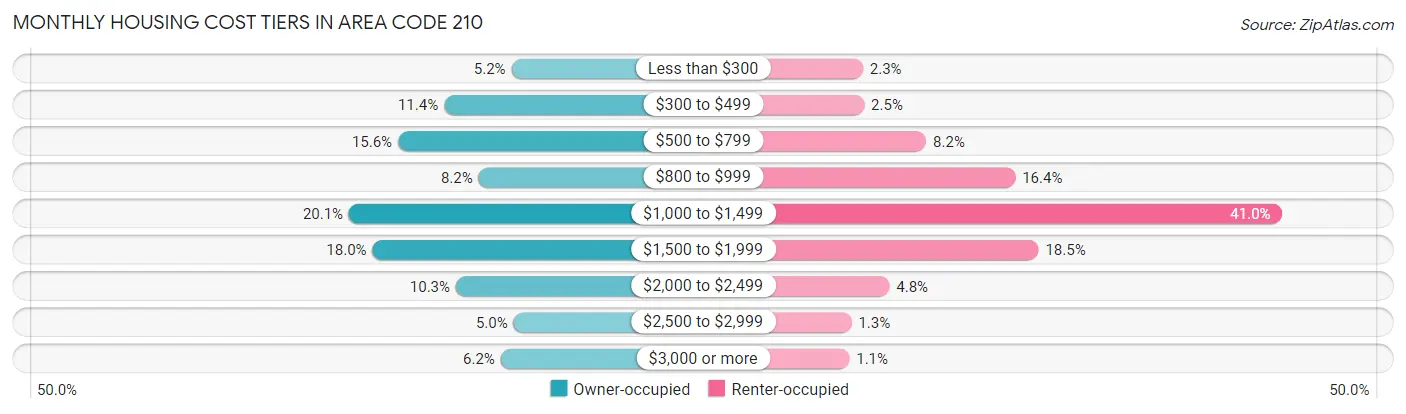
| Monthly Cost | Owner-occupied | Renter-occupied |
| Less than $300 | 19,370 (5.2%) | 6,805 (2.3%) |
| $300 to $499 | 42,600 (11.4%) | 7,151 (2.5%) |
| $500 to $799 | 58,456 (15.6%) | 23,718 (8.2%) |
| $800 to $999 | 30,702 (8.2%) | 47,510 (16.4%) |
| $1,000 to $1,499 | 75,289 (20.1%) | 118,881 (41.0%) |
| $1,500 to $1,999 | 67,248 (18.0%) | 53,713 (18.5%) |
| $2,000 to $2,499 | 38,522 (10.3%) | 13,860 (4.8%) |
| $2,500 to $2,999 | 18,646 (5.0%) | 3,742 (1.3%) |
| $3,000 or more | 23,085 (6.2%) | 3,160 (1.1%) |
| Total | 373,918 (100.0%) | 290,237 (100.0%) |
Physical Housing Characteristics in Area Code 210
Housing Structures in Area Code 210
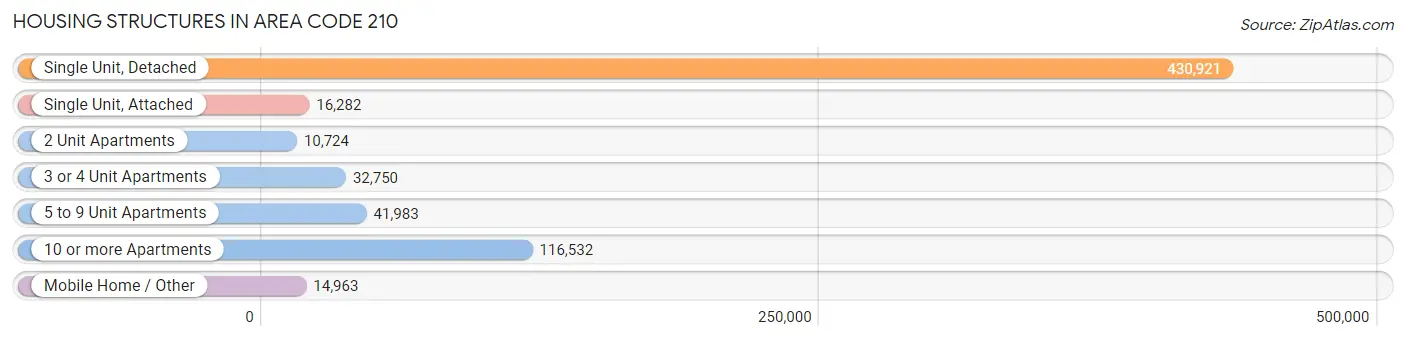
| Structure Type | # Housing Units | % Housing Units |
| Single Unit, Detached | 430,921 | 64.9% |
| Single Unit, Attached | 16,282 | 2.5% |
| 2 Unit Apartments | 10,724 | 1.6% |
| 3 or 4 Unit Apartments | 32,750 | 4.9% |
| 5 to 9 Unit Apartments | 41,983 | 6.3% |
| 10 or more Apartments | 116,532 | 17.5% |
| Mobile Home / Other | 14,963 | 2.2% |
| Total | 664,155 | 100.0% |
Housing Structures by Occupancy in Area Code 210
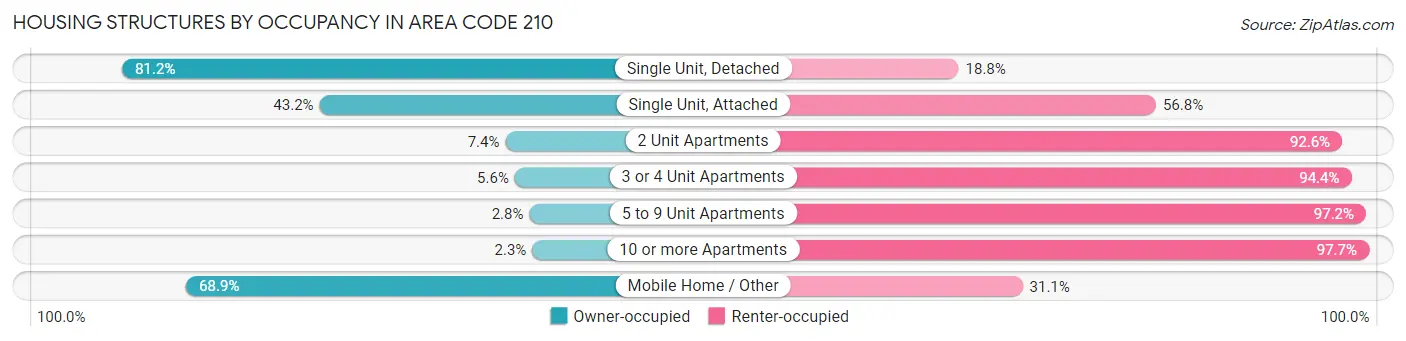
| Structure Type | Owner-occupied | Renter-occupied |
| Single Unit, Detached | 350,085 (81.2%) | 80,836 (18.8%) |
| Single Unit, Attached | 7,040 (43.2%) | 9,242 (56.8%) |
| 2 Unit Apartments | 798 (7.4%) | 9,926 (92.6%) |
| 3 or 4 Unit Apartments | 1,843 (5.6%) | 30,907 (94.4%) |
| 5 to 9 Unit Apartments | 1,189 (2.8%) | 40,794 (97.2%) |
| 10 or more Apartments | 2,651 (2.3%) | 113,881 (97.7%) |
| Mobile Home / Other | 10,312 (68.9%) | 4,651 (31.1%) |
| Total | 373,918 (56.3%) | 290,237 (43.7%) |
Housing Structures by Number of Rooms in Area Code 210
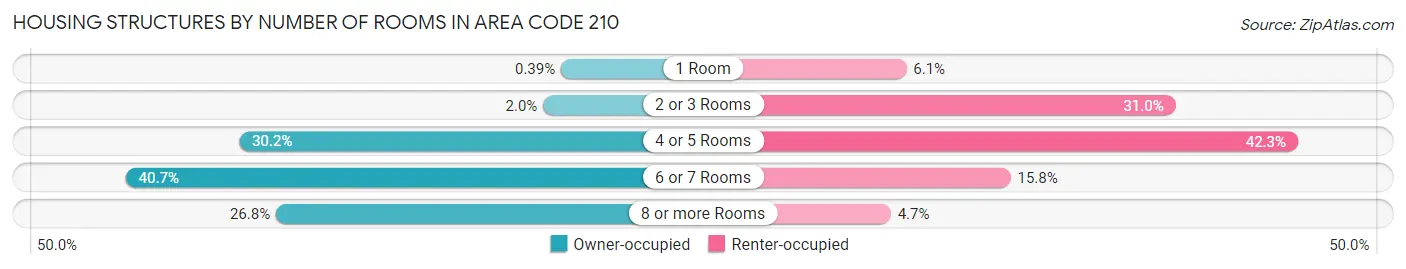
| Number of Rooms | Owner-occupied | Renter-occupied |
| 1 Room | 1,476 (0.4%) | 17,821 (6.1%) |
| 2 or 3 Rooms | 7,629 (2.0%) | 90,073 (31.0%) |
| 4 or 5 Rooms | 112,822 (30.2%) | 122,888 (42.3%) |
| 6 or 7 Rooms | 151,986 (40.6%) | 45,813 (15.8%) |
| 8 or more Rooms | 100,005 (26.8%) | 13,642 (4.7%) |
| Total | 373,918 (100.0%) | 290,237 (100.0%) |
Housing Structure by Heating Type in Area Code 210
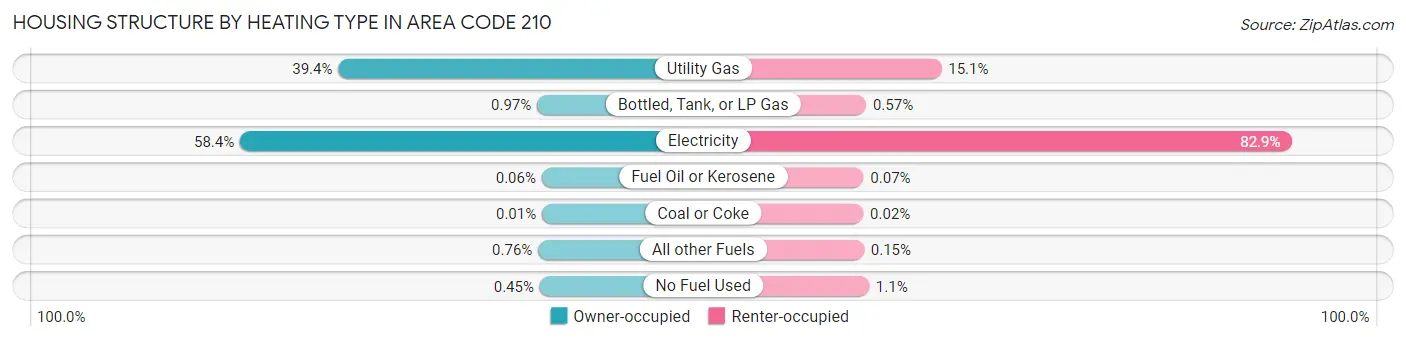
| Heating Type | Owner-occupied | Renter-occupied |
| Utility Gas | 147,271 (39.4%) | 43,887 (15.1%) |
| Bottled, Tank, or LP Gas | 3,619 (1.0%) | 1,650 (0.6%) |
| Electricity | 218,250 (58.4%) | 240,730 (82.9%) |
| Fuel Oil or Kerosene | 233 (0.1%) | 192 (0.1%) |
| Coal or Coke | 19 (0.0%) | 54 (0.0%) |
| All other Fuels | 2,838 (0.8%) | 437 (0.2%) |
| No Fuel Used | 1,688 (0.4%) | 3,287 (1.1%) |
| Total | 373,918 (100.0%) | 290,237 (100.0%) |
Household Vehicle Usage in Area Code 210
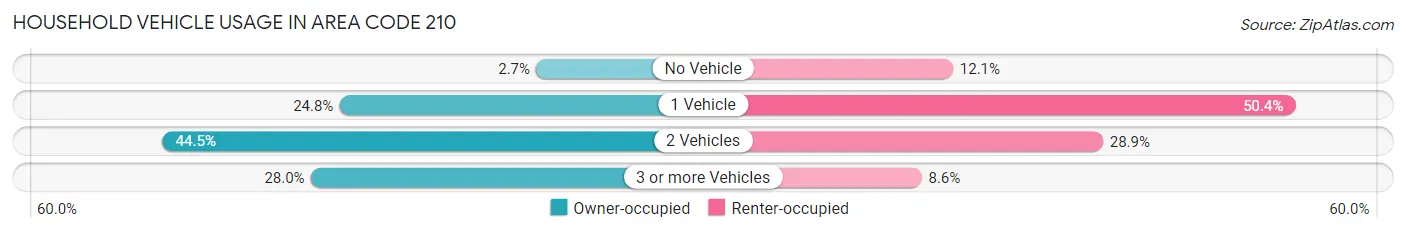
| Vehicles per Household | Owner-occupied | Renter-occupied |
| No Vehicle | 10,191 (2.7%) | 35,091 (12.1%) |
| 1 Vehicle | 92,594 (24.8%) | 146,403 (50.4%) |
| 2 Vehicles | 166,494 (44.5%) | 83,838 (28.9%) |
| 3 or more Vehicles | 104,639 (28.0%) | 24,905 (8.6%) |
| Total | 373,918 (100.0%) | 290,237 (100.0%) |
Real Estate & Mortgages in Area Code 210
Real Estate and Mortgage Overview in Area Code 210
| Characteristic | Without Mortgage | With Mortgage |
| Housing Units | 150,359 | 223,559 |
| Median Property Value | $11,113,200 | $13,315,100 |
| Median Household Income | $3,860,878 | $55,909 |
| Monthly Housing Costs | $35,863 | $22,235 |
| Real Estate Taxes | $192,292 | $12,550 |
Property Value by Mortgage Status in Area Code 210
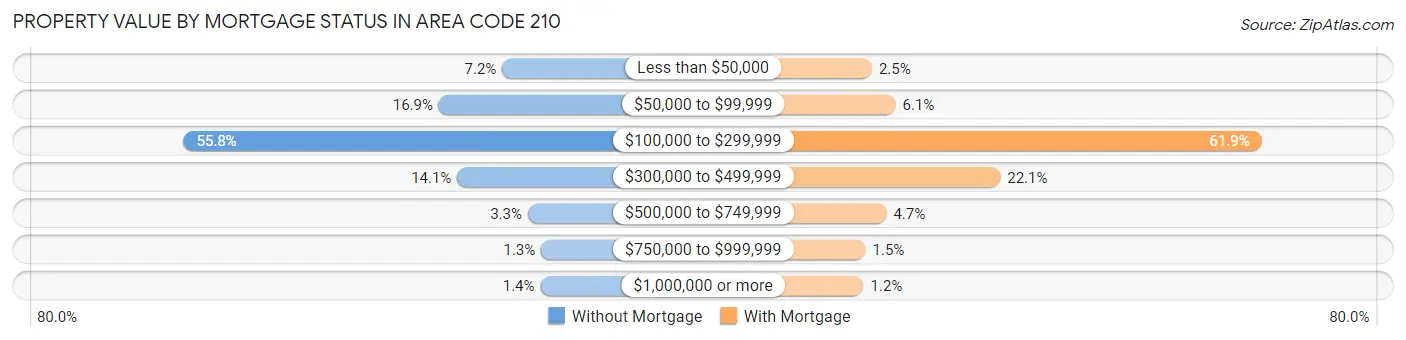
| Property Value | Without Mortgage | With Mortgage |
| Less than $50,000 | 10,871 (7.2%) | 5,578 (2.5%) |
| $50,000 to $99,999 | 25,382 (16.9%) | 13,633 (6.1%) |
| $100,000 to $299,999 | 83,878 (55.8%) | 138,325 (61.9%) |
| $300,000 to $499,999 | 21,169 (14.1%) | 49,317 (22.1%) |
| $500,000 to $749,999 | 4,998 (3.3%) | 10,538 (4.7%) |
| $750,000 to $999,999 | 1,936 (1.3%) | 3,415 (1.5%) |
| $1,000,000 or more | 2,125 (1.4%) | 2,753 (1.2%) |
| Total | 150,359 (100.0%) | 223,559 (100.0%) |
Household Income by Mortgage Status in Area Code 210
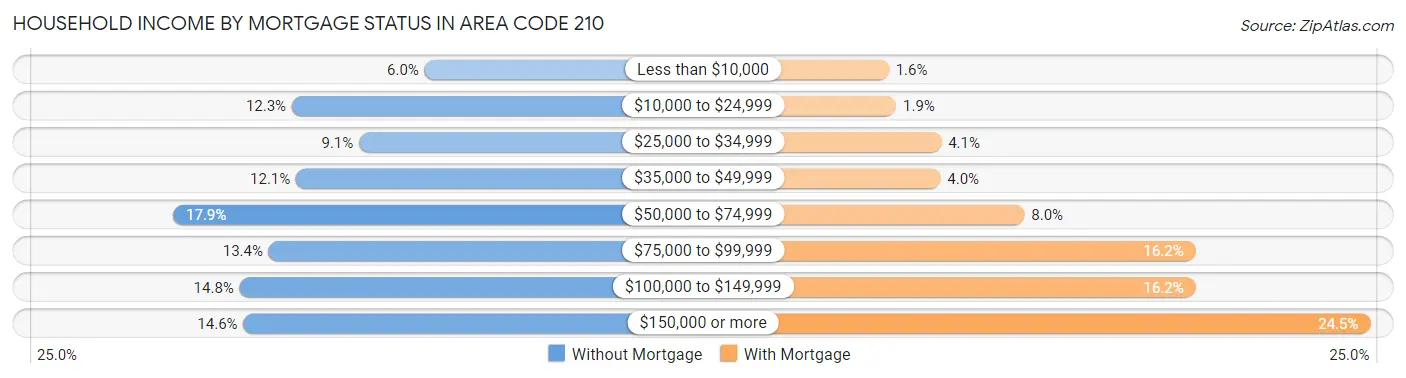
| Household Income | Without Mortgage | With Mortgage |
| Less than $10,000 | 8,950 (5.9%) | 3,536 (1.6%) |
| $10,000 to $24,999 | 18,454 (12.3%) | 4,316 (1.9%) |
| $25,000 to $34,999 | 13,634 (9.1%) | 9,129 (4.1%) |
| $35,000 to $49,999 | 18,152 (12.1%) | 9,039 (4.0%) |
| $50,000 to $74,999 | 26,952 (17.9%) | 17,982 (8.0%) |
| $75,000 to $99,999 | 20,100 (13.4%) | 36,186 (16.2%) |
| $100,000 to $149,999 | 22,196 (14.8%) | 36,199 (16.2%) |
| $150,000 or more | 21,921 (14.6%) | 54,799 (24.5%) |
| Total | 150,359 (100.0%) | 223,559 (100.0%) |
Property Value to Household Income Ratio in Area Code 210
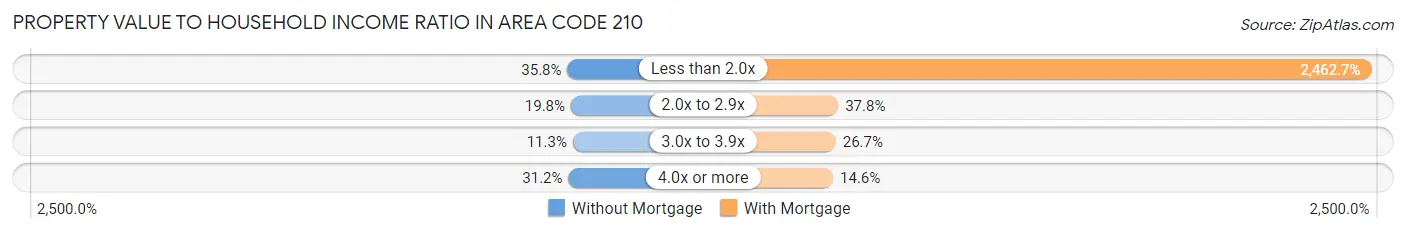
| Value-to-Income Ratio | Without Mortgage | With Mortgage |
| Less than 2.0x | 53,844 (35.8%) | 5,505,683 (2,462.7%) |
| 2.0x to 2.9x | 29,801 (19.8%) | 84,470 (37.8%) |
| 3.0x to 3.9x | 17,052 (11.3%) | 59,720 (26.7%) |
| 4.0x or more | 46,848 (31.2%) | 32,707 (14.6%) |
| Total | 150,359 (100.0%) | 223,559 (100.0%) |
Real Estate Taxes by Mortgage Status in Area Code 210
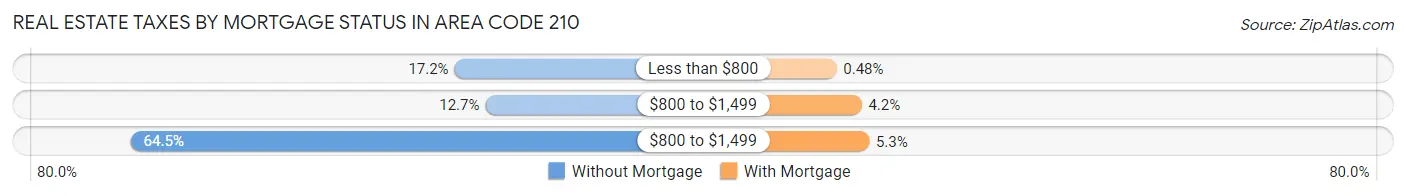
| Property Taxes | Without Mortgage | With Mortgage |
| Less than $800 | 25,841 (17.2%) | 1,062 (0.5%) |
| $800 to $1,499 | 19,068 (12.7%) | 9,274 (4.2%) |
| $800 to $1,499 | 96,975 (64.5%) | 11,747 (5.2%) |
| Total | 150,359 (100.0%) | 223,559 (100.0%) |
Health & Disability in Area Code 210
Health Insurance Coverage by Age in Area Code 210
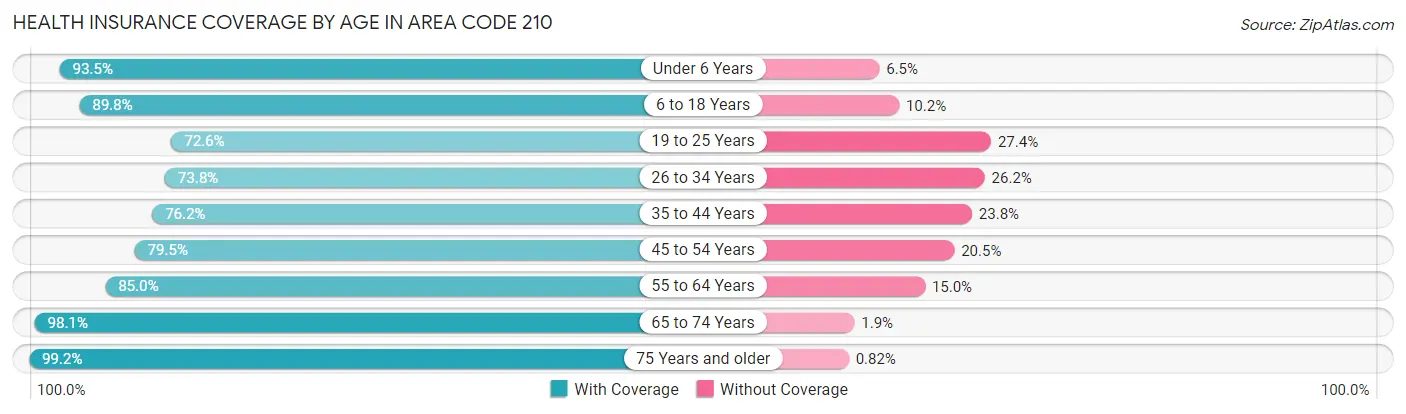
| Age Bracket | With Coverage | Without Coverage |
| Under 6 Years | 135,384 (93.5%) | 9,452 (6.5%) |
| 6 to 18 Years | 300,223 (89.8%) | 34,108 (10.2%) |
| 19 to 25 Years | 134,881 (72.6%) | 50,797 (27.4%) |
| 26 to 34 Years | 186,815 (73.8%) | 66,220 (26.2%) |
| 35 to 44 Years | 190,625 (76.2%) | 59,524 (23.8%) |
| 45 to 54 Years | 165,989 (79.5%) | 42,793 (20.5%) |
| 55 to 64 Years | 159,974 (85.0%) | 28,309 (15.0%) |
| 65 to 74 Years | 129,861 (98.1%) | 2,472 (1.9%) |
| 75 Years and older | 85,499 (99.2%) | 710 (0.8%) |
| Total | 1,489,251 (83.5%) | 294,385 (16.5%) |
Health Insurance Coverage by Citizenship Status in Area Code 210
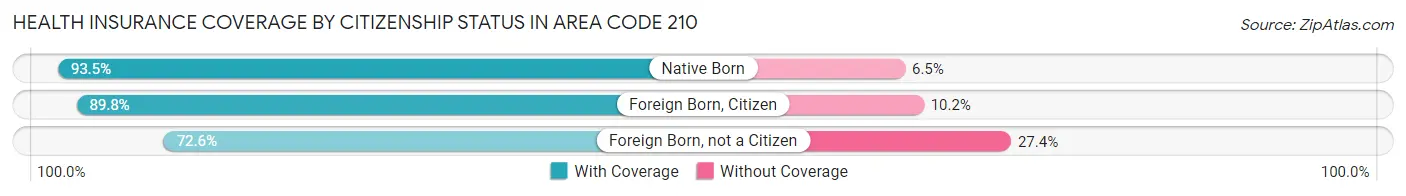
| Citizenship Status | With Coverage | Without Coverage |
| Native Born | 135,384 (93.5%) | 9,452 (6.5%) |
| Foreign Born, Citizen | 300,223 (89.8%) | 34,108 (10.2%) |
| Foreign Born, not a Citizen | 134,881 (72.6%) | 50,797 (27.4%) |
Health Insurance Coverage by Household Income in Area Code 210
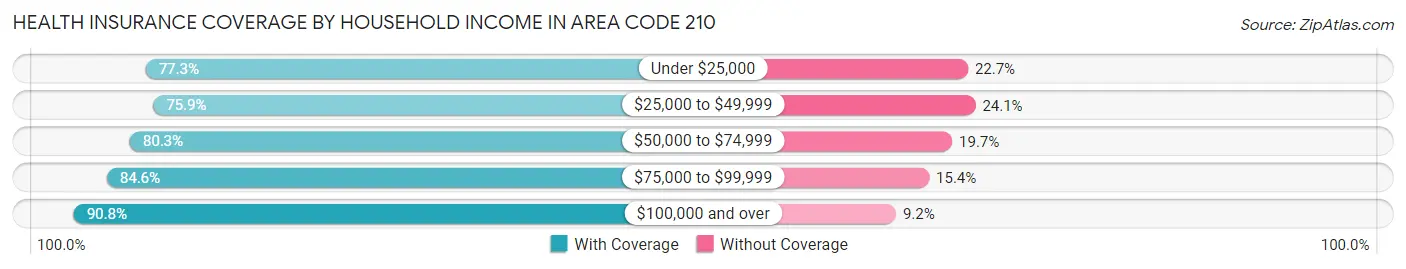
| Household Income | With Coverage | Without Coverage |
| Under $25,000 | 178,867 (77.3%) | 52,516 (22.7%) |
| $25,000 to $49,999 | 250,477 (75.9%) | 79,531 (24.1%) |
| $50,000 to $74,999 | 250,297 (80.3%) | 61,536 (19.7%) |
| $75,000 to $99,999 | 218,277 (84.6%) | 39,787 (15.4%) |
| $100,000 and over | 580,644 (90.8%) | 58,902 (9.2%) |
Public vs Private Health Insurance Coverage by Age in Area Code 210
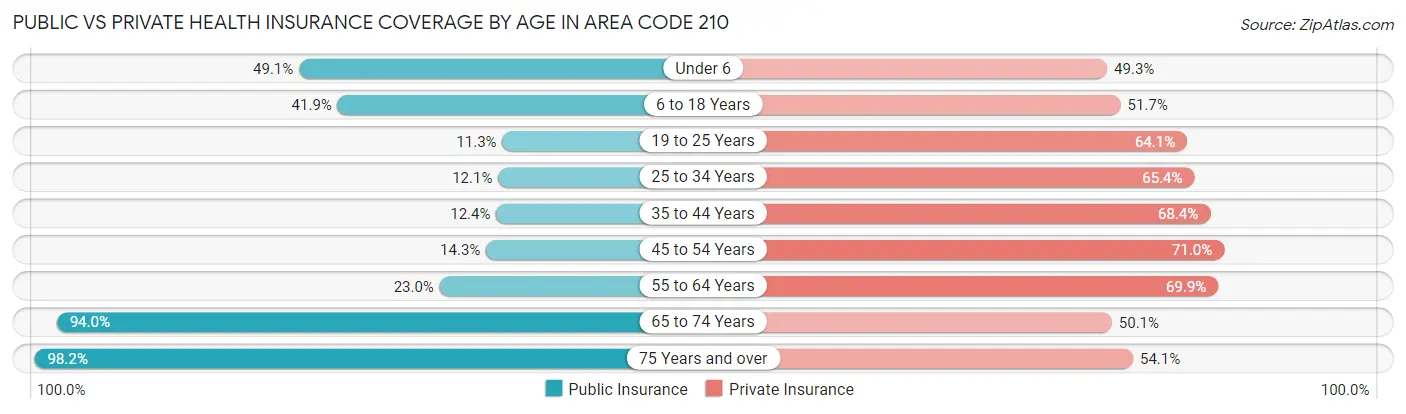
| Age Bracket | Public Insurance | Private Insurance |
| Under 6 | 71,045 (49.0%) | 71,336 (49.2%) |
| 6 to 18 Years | 140,039 (41.9%) | 172,982 (51.7%) |
| 19 to 25 Years | 20,994 (11.3%) | 118,960 (64.1%) |
| 25 to 34 Years | 30,590 (12.1%) | 165,578 (65.4%) |
| 35 to 44 Years | 31,114 (12.4%) | 170,974 (68.3%) |
| 45 to 54 Years | 29,920 (14.3%) | 148,147 (71.0%) |
| 55 to 64 Years | 43,202 (23.0%) | 131,525 (69.9%) |
| 65 to 74 Years | 124,431 (94.0%) | 66,336 (50.1%) |
| 75 Years and over | 84,620 (98.2%) | 46,608 (54.1%) |
| Total | 575,955 (32.3%) | 1,092,446 (61.3%) |
Disability Status by Sex by Age in Area Code 210
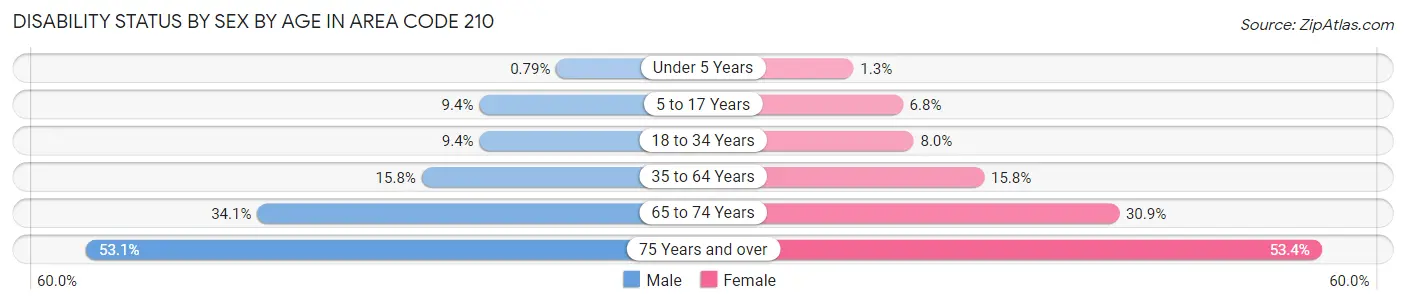
| Age Bracket | Male | Female |
| Under 5 Years | 491 (0.8%) | 754 (1.3%) |
| 5 to 17 Years | 15,855 (9.4%) | 10,989 (6.8%) |
| 18 to 34 Years | 21,988 (9.3%) | 18,431 (8.0%) |
| 35 to 64 Years | 50,463 (15.8%) | 51,856 (15.8%) |
| 65 to 74 Years | 20,387 (34.1%) | 22,386 (30.9%) |
| 75 Years and over | 18,372 (53.1%) | 27,591 (53.4%) |
Disability Class by Sex by Age in Area Code 210
Disability Class: Hearing Difficulty
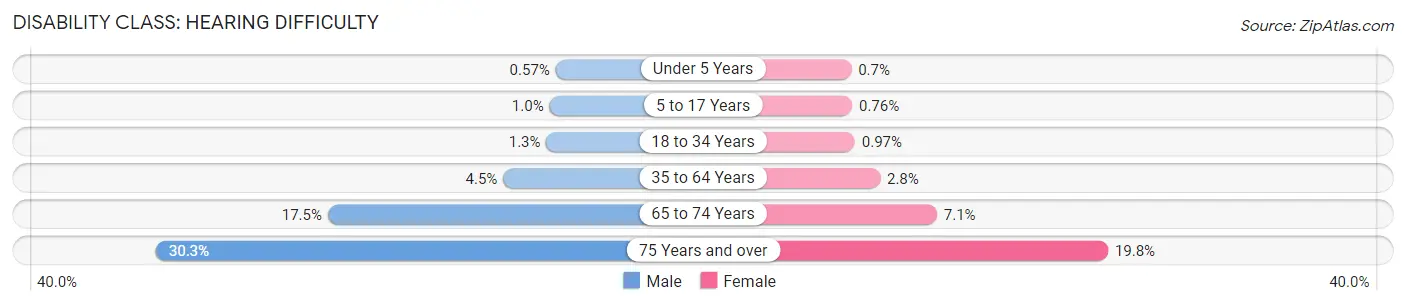
| Age Bracket | Male | Female |
| Under 5 Years | 352 (0.6%) | 411 (0.7%) |
| 5 to 17 Years | 1,736 (1.0%) | 1,239 (0.8%) |
| 18 to 34 Years | 2,969 (1.3%) | 2,234 (1.0%) |
| 35 to 64 Years | 14,303 (4.5%) | 9,312 (2.8%) |
| 65 to 74 Years | 10,459 (17.5%) | 5,117 (7.1%) |
| 75 Years and over | 10,458 (30.2%) | 10,201 (19.8%) |
Disability Class: Vision Difficulty
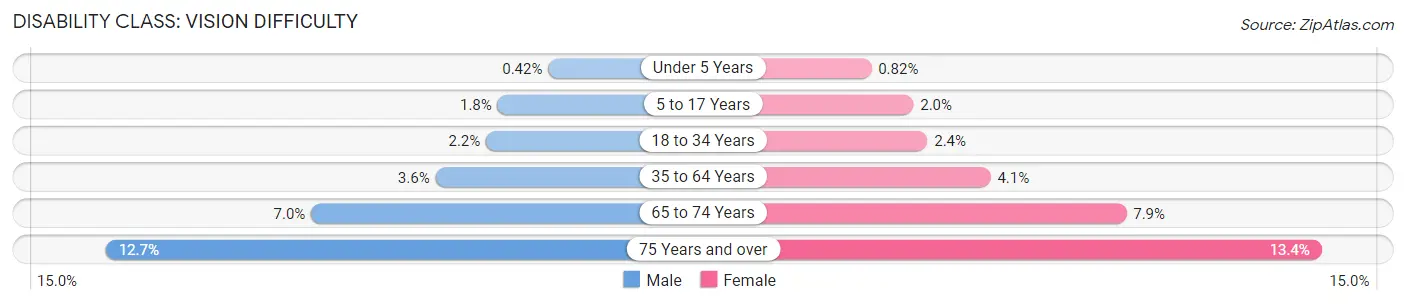
| Age Bracket | Male | Female |
| Under 5 Years | 258 (0.4%) | 484 (0.8%) |
| 5 to 17 Years | 3,095 (1.8%) | 3,222 (2.0%) |
| 18 to 34 Years | 5,049 (2.1%) | 5,482 (2.4%) |
| 35 to 64 Years | 11,368 (3.6%) | 13,553 (4.1%) |
| 65 to 74 Years | 4,200 (7.0%) | 5,746 (7.9%) |
| 75 Years and over | 4,404 (12.7%) | 6,899 (13.4%) |
Disability Class: Cognitive Difficulty
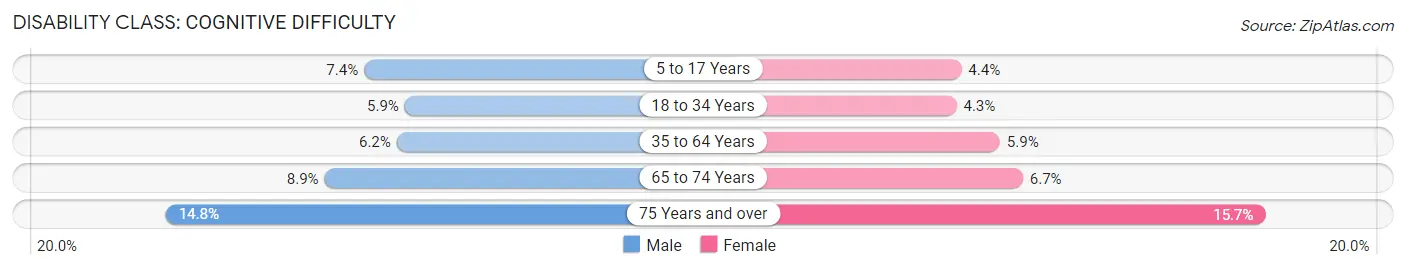
| Age Bracket | Male | Female |
| 5 to 17 Years | 12,522 (7.4%) | 7,194 (4.4%) |
| 18 to 34 Years | 13,842 (5.9%) | 9,825 (4.3%) |
| 35 to 64 Years | 19,806 (6.2%) | 19,217 (5.9%) |
| 65 to 74 Years | 5,306 (8.9%) | 4,876 (6.7%) |
| 75 Years and over | 5,103 (14.8%) | 8,117 (15.7%) |
Disability Class: Ambulatory Difficulty
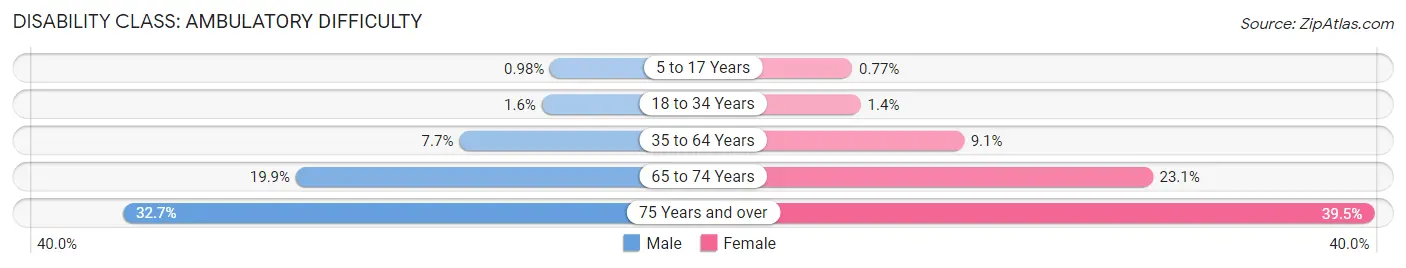
| Age Bracket | Male | Female |
| 5 to 17 Years | 1,665 (1.0%) | 1,254 (0.8%) |
| 18 to 34 Years | 3,785 (1.6%) | 3,236 (1.4%) |
| 35 to 64 Years | 24,727 (7.7%) | 29,650 (9.0%) |
| 65 to 74 Years | 11,879 (19.9%) | 16,734 (23.1%) |
| 75 Years and over | 11,301 (32.7%) | 20,407 (39.5%) |
Disability Class: Self-Care Difficulty
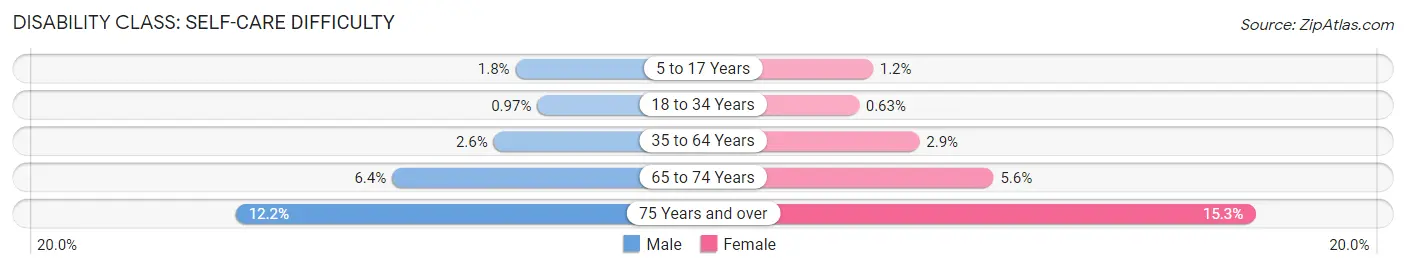
| Age Bracket | Male | Female |
| 5 to 17 Years | 3,015 (1.8%) | 1,858 (1.1%) |
| 18 to 34 Years | 2,272 (1.0%) | 1,450 (0.6%) |
| 35 to 64 Years | 8,280 (2.6%) | 9,442 (2.9%) |
| 65 to 74 Years | 3,805 (6.4%) | 4,080 (5.6%) |
| 75 Years and over | 4,206 (12.2%) | 7,922 (15.3%) |
Technology Access in Area Code 210
Computing Device Access in Area Code 210
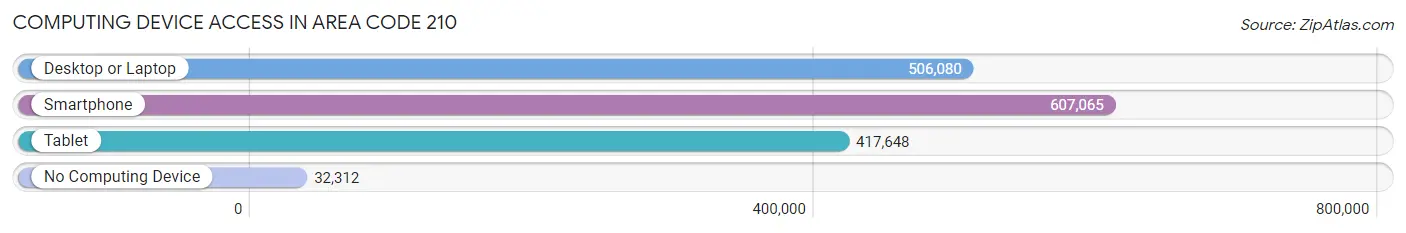
| Device Type | # Households | % Households |
| Desktop or Laptop | 506,080 | 76.2% |
| Smartphone | 607,065 | 91.4% |
| Tablet | 417,648 | 62.9% |
| No Computing Device | 32,312 | 4.9% |
| Total | 664,155 | 100.0% |
Internet Access in Area Code 210
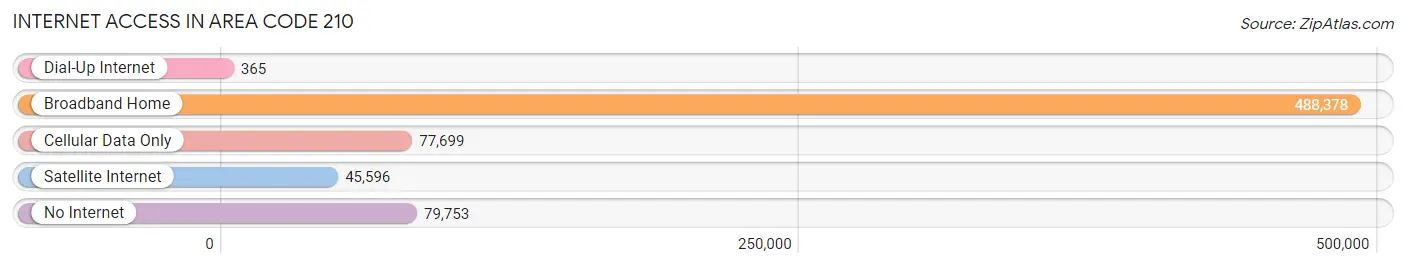
| Internet Type | # Households | % Households |
| Dial-Up Internet | 365 | 0.1% |
| Broadband Home | 488,378 | 73.5% |
| Cellular Data Only | 77,699 | 11.7% |
| Satellite Internet | 45,596 | 6.9% |
| No Internet | 79,753 | 12.0% |
| Total | 664,155 | 100.0% |
Area Code 210 Summary
Geography
Area code 210 is a telephone area code in the North American Numbering Plan (NANP) for the state of Texas. It serves the San Antonio metropolitan area, which includes all of Bexar County and portions of Comal, Guadalupe, and Atascosa counties.
Social
Area code 210 is a vibrant and diverse area, with a wide range of cultural and recreational activities. The city of San Antonio is home to the Alamo, the River Walk, and the San Antonio Spurs. The area is also home to a number of universities, including the University of Texas at San Antonio, Trinity University, and St. Mary's University.
Economics
Area code 210 is an economically prosperous area, with a strong job market and a growing population. The area is home to a number of major employers, including USAA, Valero Energy, and H-E-B. The area also has a thriving tourism industry, with a number of popular attractions, including SeaWorld San Antonio and Six Flags Fiesta Texas.
Demographics
Area code 210 is home to a diverse population, with a mix of ethnicities and cultures. According to the 2010 census, the population of the area was 1,711,703, with a median age of 33.7 years. The area is also home to a large Hispanic population, with nearly 60% of the population identifying as Hispanic or Latino.
Common Questions
What is Per Capita Income in Area Code 210?
Per Capita income in Area Code 210 is $33,709.
What is the Median Family Income in Area Code 210?
Median Family Income in Area Code 210 is $82,000.
What is the Median Household income in Area Code 210?
Median Household Income in Area Code 210 is $65,582.
What is Income or Wage Gap in Area Code 210?
Income or Wage Gap in Area Code 210 is 21.5%.
Women in Area Code 210 earn 78.5 cents for every dollar earned by a man.
What is Family Income Deficit in Area Code 210?
Family Income Deficit in Area Code 210 is $11,606.
Families that are below poverty line in Area Code 210 earn $11,606 less on average than the poverty threshold level.
What is Inequality or Gini Index in Area Code 210?
Inequality or Gini Index in Area Code 210 is 25.71.
What is the Total Population of Area Code 210?
Total Population of Area Code 210 is 1,818,883.
What is the Total Male Population of Area Code 210?
Total Male Population of Area Code 210 is 905,128.
What is the Total Female Population of Area Code 210?
Total Female Population of Area Code 210 is 913,755.
What is the Ratio of Males per 100 Females in Area Code 210?
There are 99.06 Males per 100 Females in Area Code 210.
What is the Ratio of Females per 100 Males in Area Code 210?
There are 100.95 Females per 100 Males in Area Code 210.
What is the Median Population Age in Area Code 210?
Median Population Age in Area Code 210 is 34.4 Years.
What is the Average Family Size in Area Code 210
Average Family Size in Area Code 210 is 3.3 People.
What is the Average Household Size in Area Code 210
Average Household Size in Area Code 210 is 2.7 People.
How Large is the Labor Force in Area Code 210?
There are 941,893 People in the Labor Forcein in Area Code 210.
What is the Percentage of People in the Labor Force in Area Code 210?
66.4% of People are in the Labor Force in Area Code 210.
What is the Unemployment Rate in Area Code 210?
Unemployment Rate in Area Code 210 is 5.8%.