Denton County, TX Map & Demographics
Denton County Map
Denton County Overview
$50,470
PER CAPITA INCOME
$126,543
AVG FAMILY INCOME
$104,180
AVG HOUSEHOLD INCOME
34.2%
WAGE / INCOME GAP [ % ]
65.8¢/ $1
WAGE / INCOME GAP [ $ ]
$12,446
FAMILY INCOME DEFICIT
0.43
INEQUALITY / GINI INDEX
914,870
TOTAL POPULATION
453,677
MALE POPULATION
461,193
FEMALE POPULATION
98.37
MALES / 100 FEMALES
101.66
FEMALES / 100 MALES
36.5
MEDIAN AGE
3.2
AVG FAMILY SIZE
2.7
AVG HOUSEHOLD SIZE
522,892
LABOR FORCE [ PEOPLE ]
72.3%
PERCENT IN LABOR FORCE
4.0%
UNEMPLOYMENT RATE
Income in Denton County
Income Overview in Denton County
Per Capita Income in Denton County is $50,470, while median incomes of families and households are $126,543 and $104,180 respectively.
| Characteristic | Number | Measure |
| Per Capita Income | 914,870 | $50,470 |
| Median Family Income | 238,238 | $126,543 |
| Mean Family Income | 238,238 | $157,551 |
| Median Household Income | 334,504 | $104,180 |
| Mean Household Income | 334,504 | $135,221 |
| Income Deficit | 238,238 | $12,446 |
| Wage / Income Gap (%) | 914,870 | 34.16% |
| Wage / Income Gap ($) | 914,870 | 65.84¢ per $1 |
| Gini / Inequality Index | 914,870 | 0.43 |
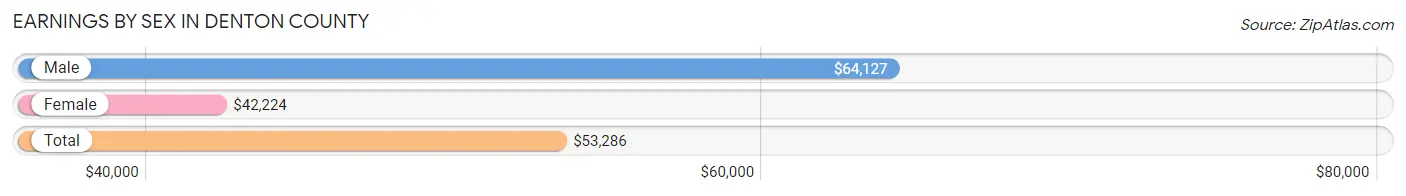
Earnings by Sex in Denton County
Average Earnings in Denton County are $53,286, $64,127 for men and $42,224 for women, a difference of 34.2%.
| Sex | Number | Average Earnings |
| Male | 287,550 (53.0%) | $64,127 |
| Female | 254,981 (47.0%) | $42,224 |
| Total | 542,531 (100.0%) | $53,286 |
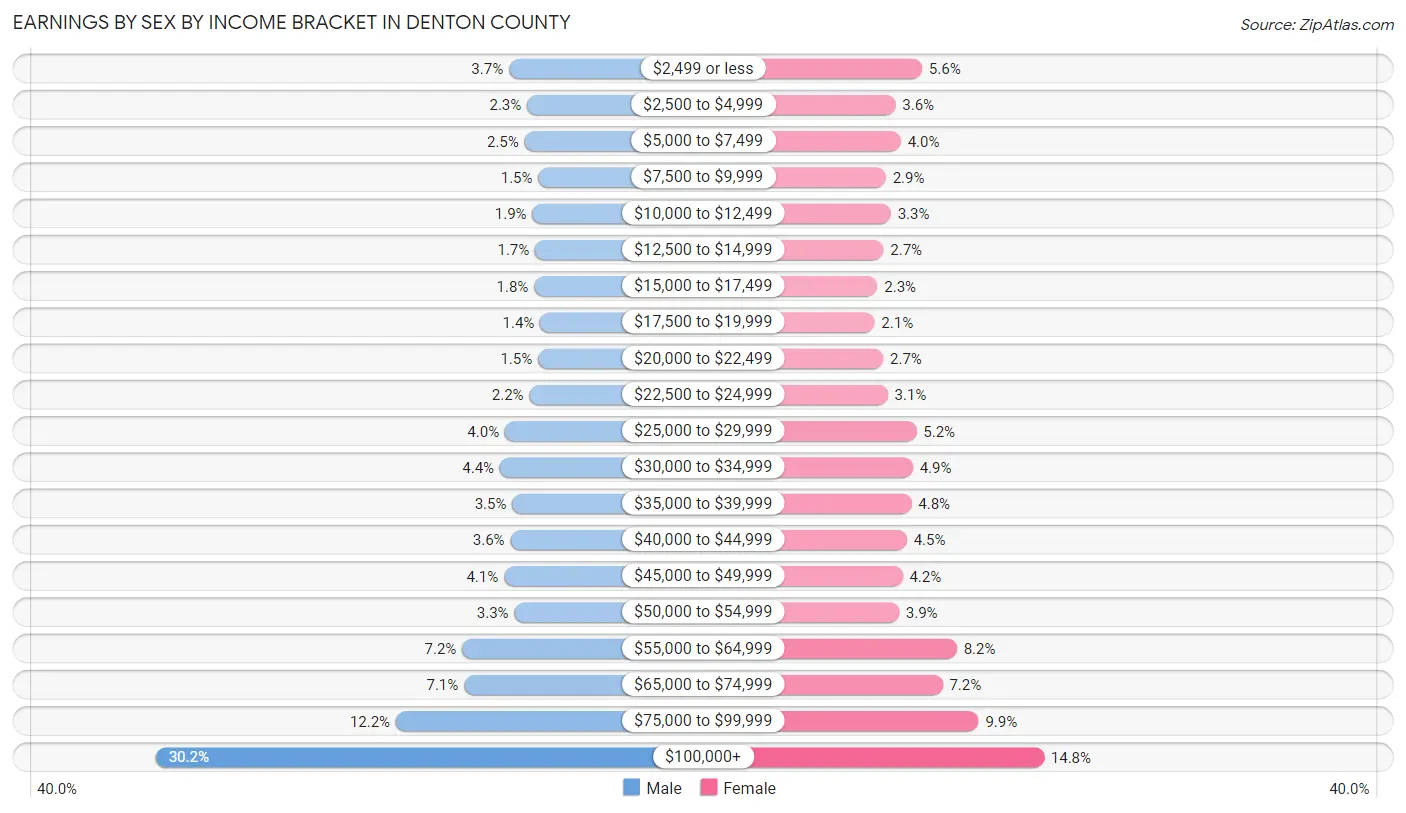
Earnings by Sex by Income Bracket in Denton County
The most common earnings brackets in Denton County are $100,000+ for men (86,756 | 30.2%) and $100,000+ for women (37,669 | 14.8%).
| Income | Male | Female |
| $2,499 or less | 10,648 (3.7%) | 14,366 (5.6%) |
| $2,500 to $4,999 | 6,735 (2.3%) | 9,291 (3.6%) |
| $5,000 to $7,499 | 7,272 (2.5%) | 10,303 (4.0%) |
| $7,500 to $9,999 | 4,310 (1.5%) | 7,458 (2.9%) |
| $10,000 to $12,499 | 5,589 (1.9%) | 8,390 (3.3%) |
| $12,500 to $14,999 | 5,012 (1.7%) | 6,986 (2.7%) |
| $15,000 to $17,499 | 5,199 (1.8%) | 5,846 (2.3%) |
| $17,500 to $19,999 | 3,918 (1.4%) | 5,290 (2.1%) |
| $20,000 to $22,499 | 4,357 (1.5%) | 6,937 (2.7%) |
| $22,500 to $24,999 | 6,235 (2.2%) | 7,795 (3.1%) |
| $25,000 to $29,999 | 11,497 (4.0%) | 13,280 (5.2%) |
| $30,000 to $34,999 | 12,601 (4.4%) | 12,586 (4.9%) |
| $35,000 to $39,999 | 9,914 (3.5%) | 12,333 (4.8%) |
| $40,000 to $44,999 | 10,332 (3.6%) | 11,441 (4.5%) |
| $45,000 to $49,999 | 11,703 (4.1%) | 10,632 (4.2%) |
| $50,000 to $54,999 | 9,453 (3.3%) | 9,935 (3.9%) |
| $55,000 to $64,999 | 20,732 (7.2%) | 20,999 (8.2%) |
| $65,000 to $74,999 | 20,305 (7.1%) | 18,271 (7.2%) |
| $75,000 to $99,999 | 34,982 (12.2%) | 25,173 (9.9%) |
| $100,000+ | 86,756 (30.2%) | 37,669 (14.8%) |
| Total | 287,550 (100.0%) | 254,981 (100.0%) |
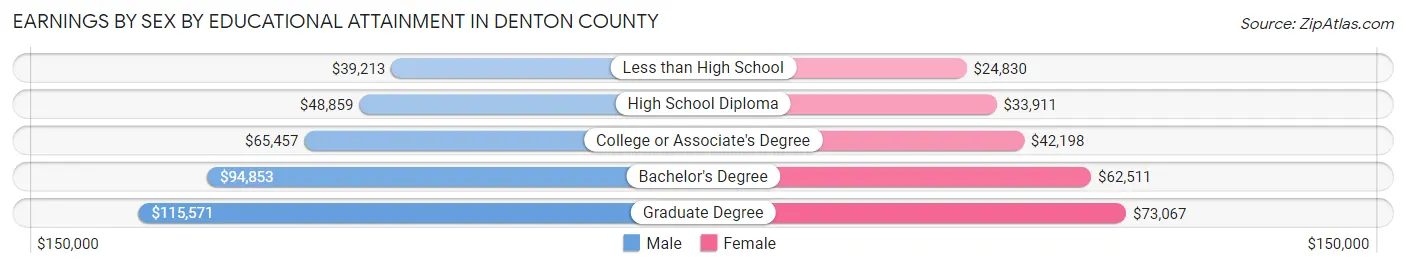
Earnings by Sex by Educational Attainment in Denton County
Average earnings in Denton County are $72,754 for men and $51,049 for women, a difference of 29.8%. Men with an educational attainment of graduate degree enjoy the highest average annual earnings of $115,571, while those with less than high school education earn the least with $39,213. Women with an educational attainment of graduate degree earn the most with the average annual earnings of $73,067, while those with less than high school education have the smallest earnings of $24,830.
| Educational Attainment | Male Income | Female Income |
| Less than High School | $39,213 | $24,830 |
| High School Diploma | $48,859 | $33,911 |
| College or Associate's Degree | $65,457 | $42,198 |
| Bachelor's Degree | $94,853 | $62,511 |
| Graduate Degree | $115,571 | $73,067 |
| Total | $72,754 | $51,049 |
Family Income in Denton County
Family Income Brackets in Denton County
According to the Denton County family income data, there are 57,654 families falling into the $200,000+ income range, which is the most common income bracket and makes up 24.2% of all families. Conversely, the $10,000 to $14,999 income bracket is the least frequent group with only 2,144 families (0.9%) belonging to this category.
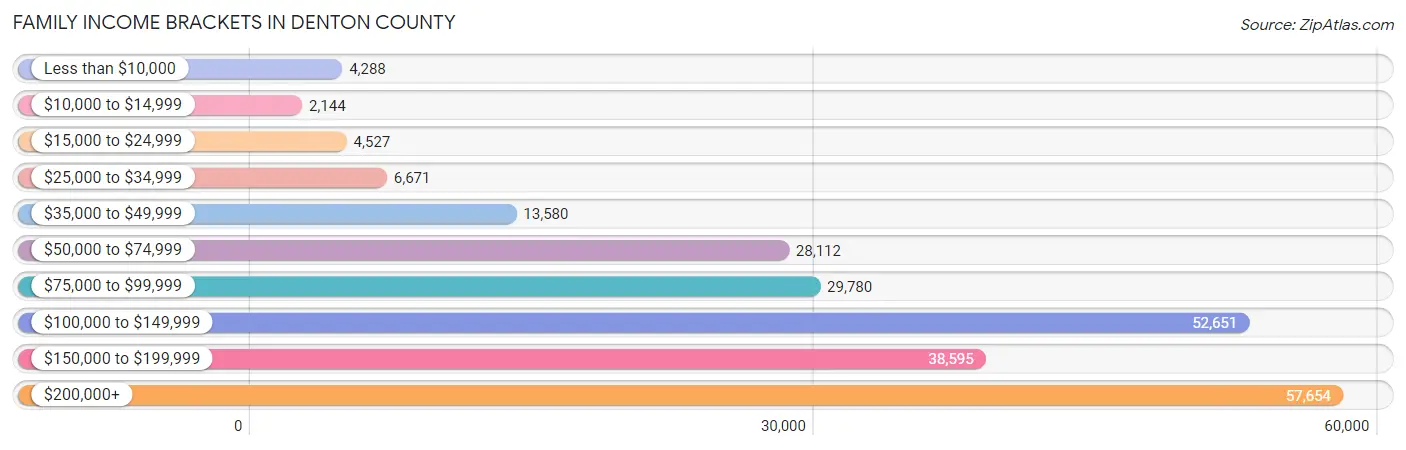
| Income Bracket | # Families | % Families |
| Less than $10,000 | 4,288 | 1.8% |
| $10,000 to $14,999 | 2,144 | 0.9% |
| $15,000 to $24,999 | 4,527 | 1.9% |
| $25,000 to $34,999 | 6,671 | 2.8% |
| $35,000 to $49,999 | 13,580 | 5.7% |
| $50,000 to $74,999 | 28,112 | 11.8% |
| $75,000 to $99,999 | 29,780 | 12.5% |
| $100,000 to $149,999 | 52,651 | 22.1% |
| $150,000 to $199,999 | 38,595 | 16.2% |
| $200,000+ | 57,654 | 24.2% |
Family Income by Famaliy Size in Denton County
4-person families (53,093 | 22.3%) account for the highest median family income in Denton County with $151,522 per family, while 2-person families (97,842 | 41.1%) have the highest median income of $54,765 per family member.
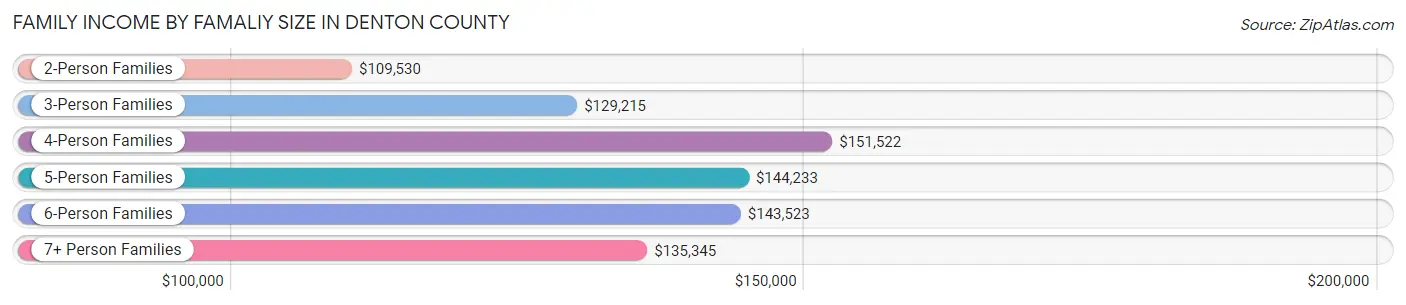
| Income Bracket | # Families | Median Income |
| 2-Person Families | 97,842 (41.1%) | $109,530 |
| 3-Person Families | 54,745 (23.0%) | $129,215 |
| 4-Person Families | 53,093 (22.3%) | $151,522 |
| 5-Person Families | 21,948 (9.2%) | $144,233 |
| 6-Person Families | 7,586 (3.2%) | $143,523 |
| 7+ Person Families | 3,024 (1.3%) | $135,345 |
| Total | 238,238 (100.0%) | $126,543 |
Family Income by Number of Earners in Denton County
The median family income in Denton County is $126,543, with families comprising 3+ earners (31,062) having the highest median family income of $172,739, while families with no earners (18,705) have the lowest median family income of $71,390, accounting for 13.0% and 7.9% of families, respectively.
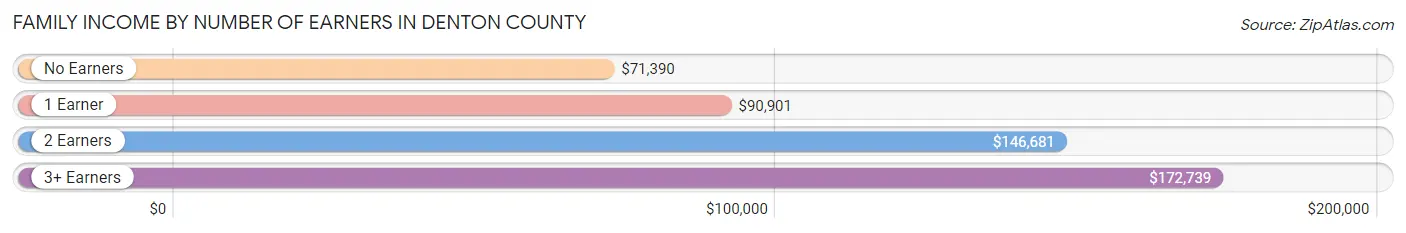
| Number of Earners | # Families | Median Income |
| No Earners | 18,705 (7.9%) | $71,390 |
| 1 Earner | 70,198 (29.5%) | $90,901 |
| 2 Earners | 118,273 (49.6%) | $146,681 |
| 3+ Earners | 31,062 (13.0%) | $172,739 |
| Total | 238,238 (100.0%) | $126,543 |
Household Income in Denton County
Household Income Brackets in Denton County
With 66,566 households falling in the category, the $100,000 to $149,999 income range is the most frequent in Denton County, accounting for 19.9% of all households. In contrast, only 6,021 households (1.8%) fall into the $10,000 to $14,999 income bracket, making it the least populous group.
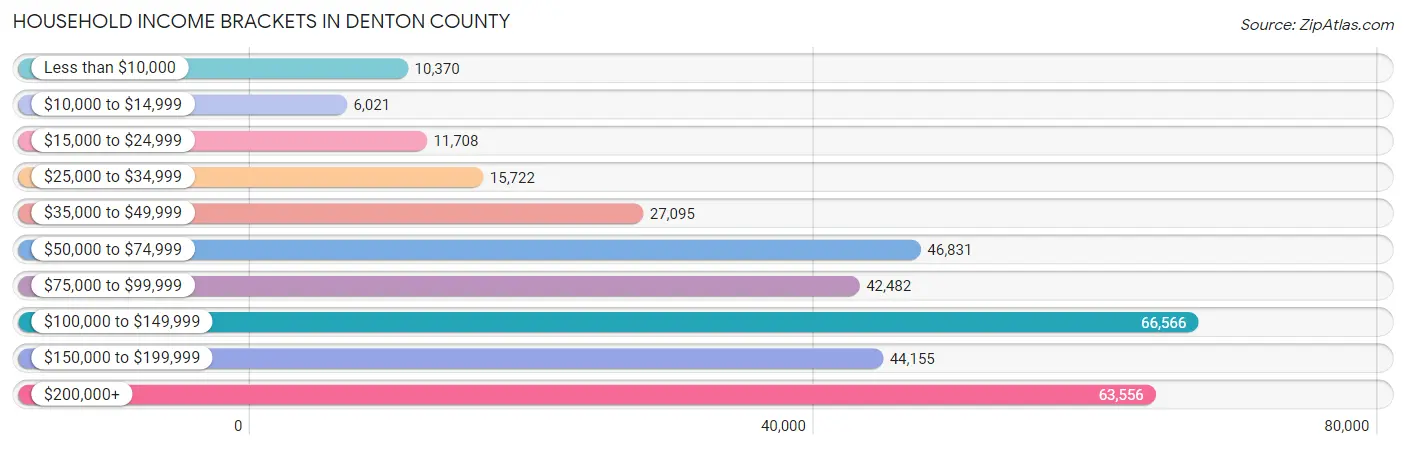
| Income Bracket | # Households | % Households |
| Less than $10,000 | 10,370 | 3.1% |
| $10,000 to $14,999 | 6,021 | 1.8% |
| $15,000 to $24,999 | 11,708 | 3.5% |
| $25,000 to $34,999 | 15,722 | 4.7% |
| $35,000 to $49,999 | 27,095 | 8.1% |
| $50,000 to $74,999 | 46,831 | 14.0% |
| $75,000 to $99,999 | 42,482 | 12.7% |
| $100,000 to $149,999 | 66,566 | 19.9% |
| $150,000 to $199,999 | 44,155 | 13.2% |
| $200,000+ | 63,556 | 19.0% |
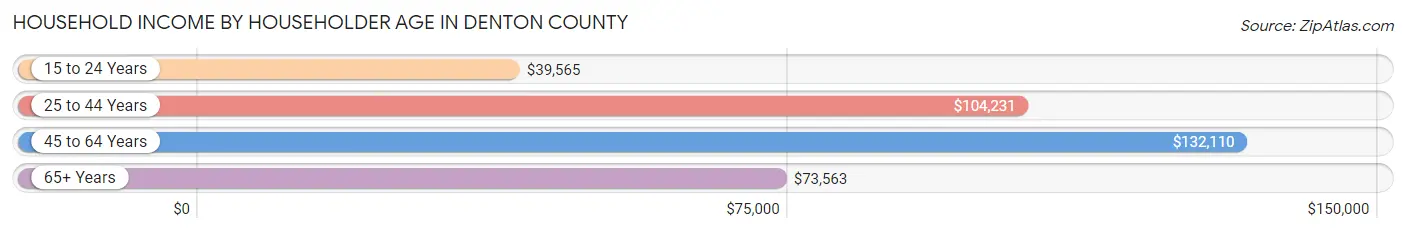
Household Income by Householder Age in Denton County
The median household income in Denton County is $104,180, with the highest median household income of $132,110 found in the 45 to 64 years age bracket for the primary householder. A total of 132,238 households (39.5%) fall into this category. Meanwhile, the 15 to 24 years age bracket for the primary householder has the lowest median household income of $39,565, with 14,167 households (4.2%) in this group.
| Income Bracket | # Households | Median Income |
| 15 to 24 Years | 14,167 (4.2%) | $39,565 |
| 25 to 44 Years | 133,445 (39.9%) | $104,231 |
| 45 to 64 Years | 132,238 (39.5%) | $132,110 |
| 65+ Years | 54,654 (16.3%) | $73,563 |
| Total | 334,504 (100.0%) | $104,180 |
Poverty in Denton County
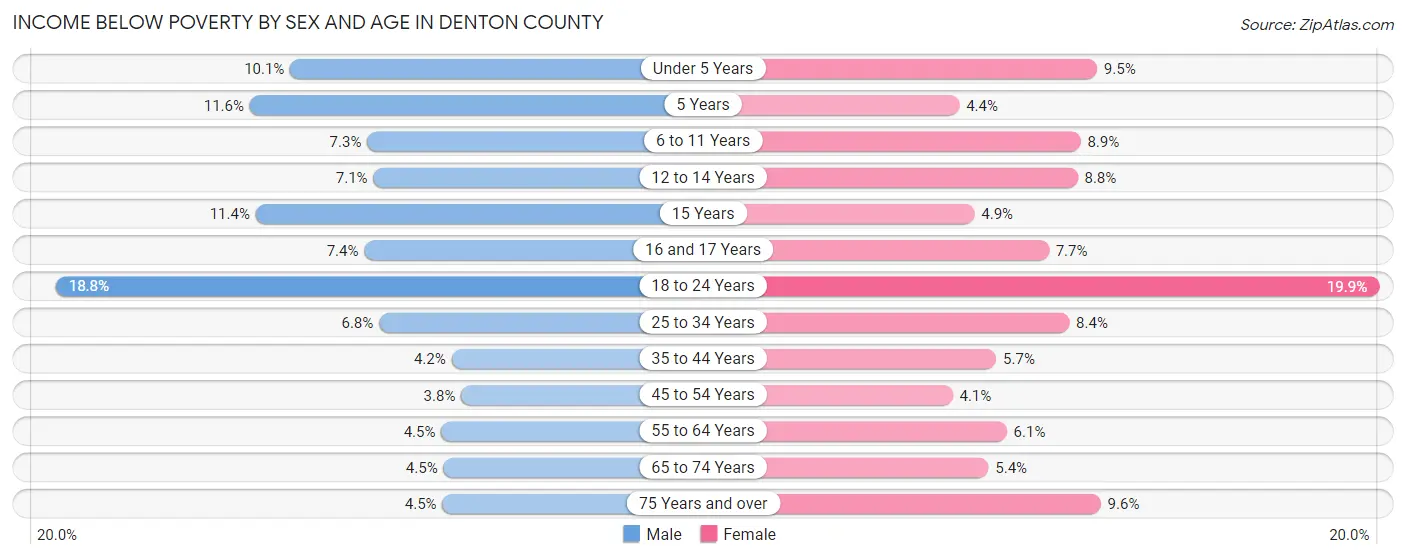
Income Below Poverty by Sex and Age in Denton County
With 6.9% poverty level for males and 7.9% for females among the residents of Denton County, 18 to 24 year old males and 18 to 24 year old females are the most vulnerable to poverty, with 7,571 males (18.8%) and 7,562 females (19.9%) in their respective age groups living below the poverty level.
| Age Bracket | Male | Female |
| Under 5 Years | 2,756 (10.1%) | 2,440 (9.5%) |
| 5 Years | 671 (11.6%) | 241 (4.4%) |
| 6 to 11 Years | 2,659 (7.3%) | 3,248 (8.9%) |
| 12 to 14 Years | 1,502 (7.0%) | 1,626 (8.7%) |
| 15 Years | 738 (11.4%) | 321 (4.9%) |
| 16 and 17 Years | 1,005 (7.4%) | 975 (7.7%) |
| 18 to 24 Years | 7,571 (18.8%) | 7,562 (19.9%) |
| 25 to 34 Years | 4,464 (6.8%) | 5,641 (8.4%) |
| 35 to 44 Years | 2,911 (4.2%) | 4,102 (5.7%) |
| 45 to 54 Years | 2,529 (3.8%) | 2,681 (4.1%) |
| 55 to 64 Years | 2,348 (4.5%) | 3,232 (6.1%) |
| 65 to 74 Years | 1,297 (4.4%) | 1,833 (5.4%) |
| 75 Years and over | 668 (4.5%) | 1,956 (9.6%) |
| Total | 31,119 (6.9%) | 35,858 (7.9%) |
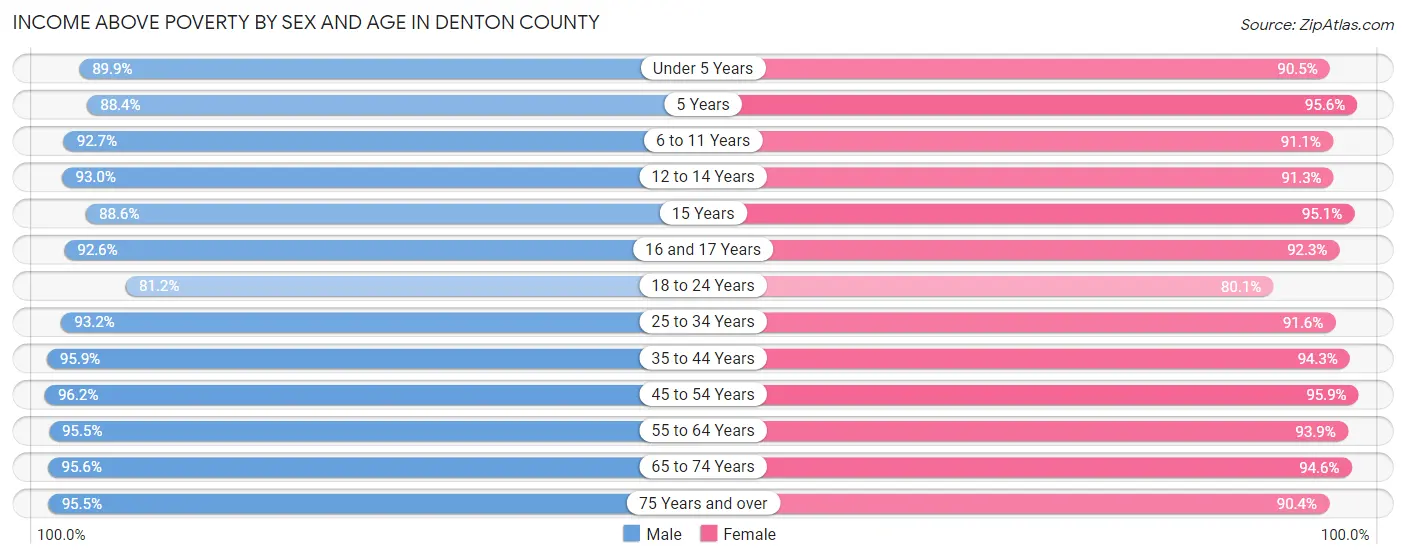
Income Above Poverty by Sex and Age in Denton County
According to the poverty statistics in Denton County, males aged 45 to 54 years and females aged 45 to 54 years are the age groups that are most secure financially, with 96.2% of males and 95.9% of females in these age groups living above the poverty line.
| Age Bracket | Male | Female |
| Under 5 Years | 24,425 (89.9%) | 23,335 (90.5%) |
| 5 Years | 5,094 (88.4%) | 5,282 (95.6%) |
| 6 to 11 Years | 33,849 (92.7%) | 33,418 (91.1%) |
| 12 to 14 Years | 19,810 (92.9%) | 16,951 (91.2%) |
| 15 Years | 5,725 (88.6%) | 6,199 (95.1%) |
| 16 and 17 Years | 12,601 (92.6%) | 11,718 (92.3%) |
| 18 to 24 Years | 32,618 (81.2%) | 30,356 (80.1%) |
| 25 to 34 Years | 60,835 (93.2%) | 61,159 (91.6%) |
| 35 to 44 Years | 67,165 (95.9%) | 67,486 (94.3%) |
| 45 to 54 Years | 64,198 (96.2%) | 62,505 (95.9%) |
| 55 to 64 Years | 49,532 (95.5%) | 49,542 (93.9%) |
| 65 to 74 Years | 27,840 (95.6%) | 31,857 (94.6%) |
| 75 Years and over | 14,208 (95.5%) | 18,389 (90.4%) |
| Total | 417,900 (93.1%) | 418,197 (92.1%) |
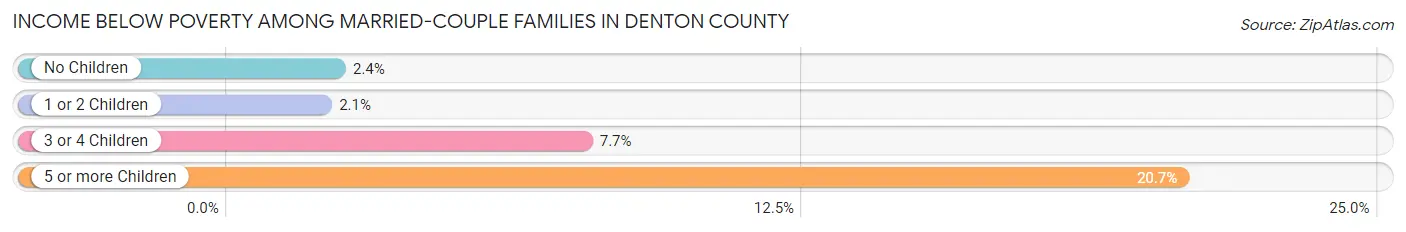
Income Below Poverty Among Married-Couple Families in Denton County
The poverty statistics for married-couple families in Denton County show that 2.8% or 5,387 of the total 192,104 families live below the poverty line. Families with 5 or more children have the highest poverty rate of 20.7%, comprising of 200 families. On the other hand, families with 1 or 2 children have the lowest poverty rate of 2.1%, which includes 1,590 families.
| Children | Above Poverty | Below Poverty |
| No Children | 94,271 (97.7%) | 2,270 (2.4%) |
| 1 or 2 Children | 75,815 (98.0%) | 1,590 (2.1%) |
| 3 or 4 Children | 15,865 (92.3%) | 1,327 (7.7%) |
| 5 or more Children | 766 (79.3%) | 200 (20.7%) |
| Total | 186,717 (97.2%) | 5,387 (2.8%) |
Income Below Poverty Among Single-Parent Households in Denton County
According to the poverty data in Denton County, 6.8% or 1,020 single-father households and 14.8% or 4,625 single-mother households are living below the poverty line. Among single-father households, those with 5 or more children have the highest poverty rate, with 25 households (100.0%) experiencing poverty. Likewise, among single-mother households, those with 5 or more children have the highest poverty rate, with 262 households (83.7%) falling below the poverty line.
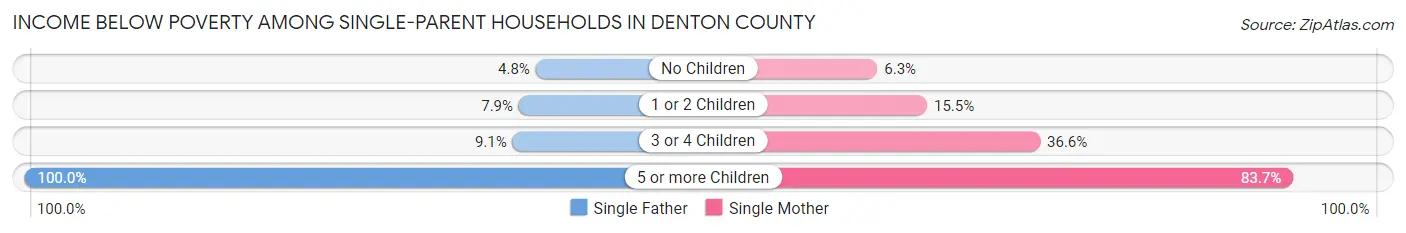
| Children | Single Father | Single Mother |
| No Children | 308 (4.8%) | 714 (6.3%) |
| 1 or 2 Children | 598 (7.9%) | 2,570 (15.5%) |
| 3 or 4 Children | 89 (9.1%) | 1,079 (36.6%) |
| 5 or more Children | 25 (100.0%) | 262 (83.7%) |
| Total | 1,020 (6.8%) | 4,625 (14.8%) |
Income Below Poverty Among Married-Couple vs Single-Parent Households in Denton County
The poverty data for Denton County shows that 5,387 of the married-couple family households (2.8%) and 5,645 of the single-parent households (12.2%) are living below the poverty level. Within the married-couple family households, those with 5 or more children have the highest poverty rate, with 200 households (20.7%) falling below the poverty line. Among the single-parent households, those with 5 or more children have the highest poverty rate, with 287 household (84.9%) living below poverty.
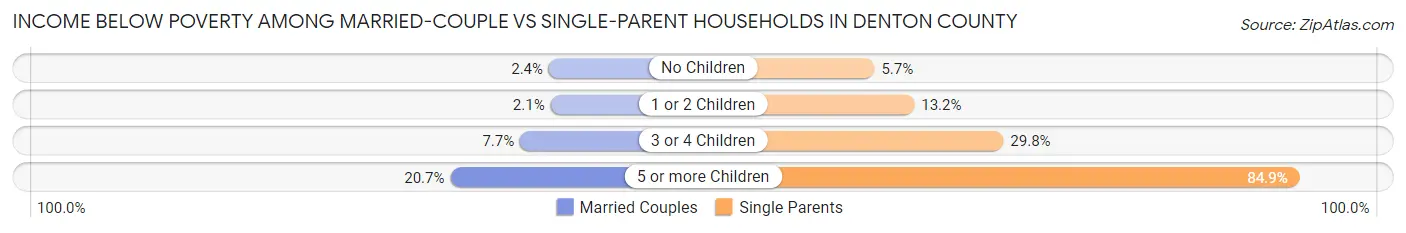
| Children | Married-Couple Families | Single-Parent Households |
| No Children | 2,270 (2.4%) | 1,022 (5.7%) |
| 1 or 2 Children | 1,590 (2.1%) | 3,168 (13.2%) |
| 3 or 4 Children | 1,327 (7.7%) | 1,168 (29.7%) |
| 5 or more Children | 200 (20.7%) | 287 (84.9%) |
| Total | 5,387 (2.8%) | 5,645 (12.2%) |
Race in Denton County
The most populous races in Denton County are White / Caucasian (591,538 | 64.7%), Hispanic or Latino (180,694 | 19.8%), and Two or more Races (96,940 | 10.6%).
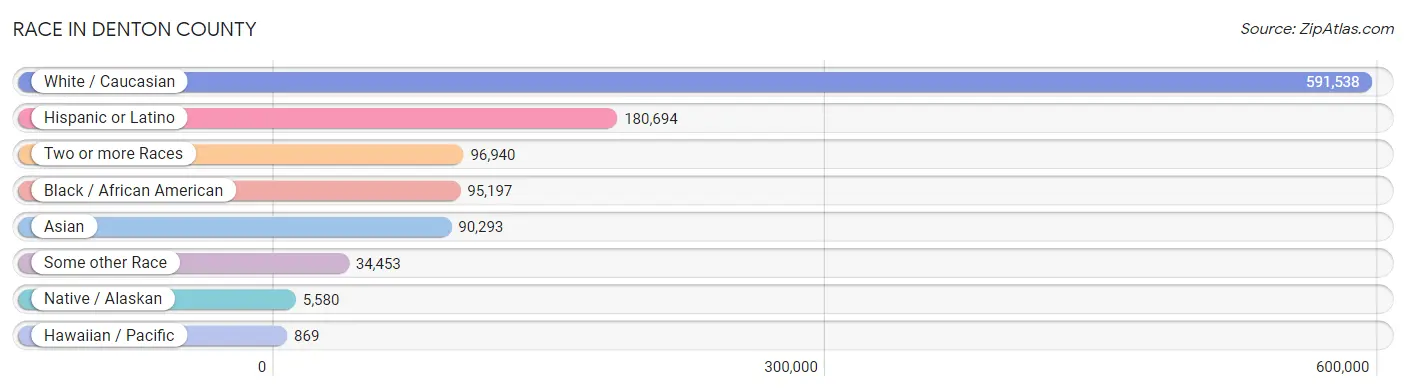
| Race | # Population | % Population |
| Asian | 90,293 | 9.9% |
| Black / African American | 95,197 | 10.4% |
| Hawaiian / Pacific | 869 | 0.1% |
| Hispanic or Latino | 180,694 | 19.8% |
| Native / Alaskan | 5,580 | 0.6% |
| White / Caucasian | 591,538 | 64.7% |
| Two or more Races | 96,940 | 10.6% |
| Some other Race | 34,453 | 3.8% |
| Total | 914,870 | 100.0% |
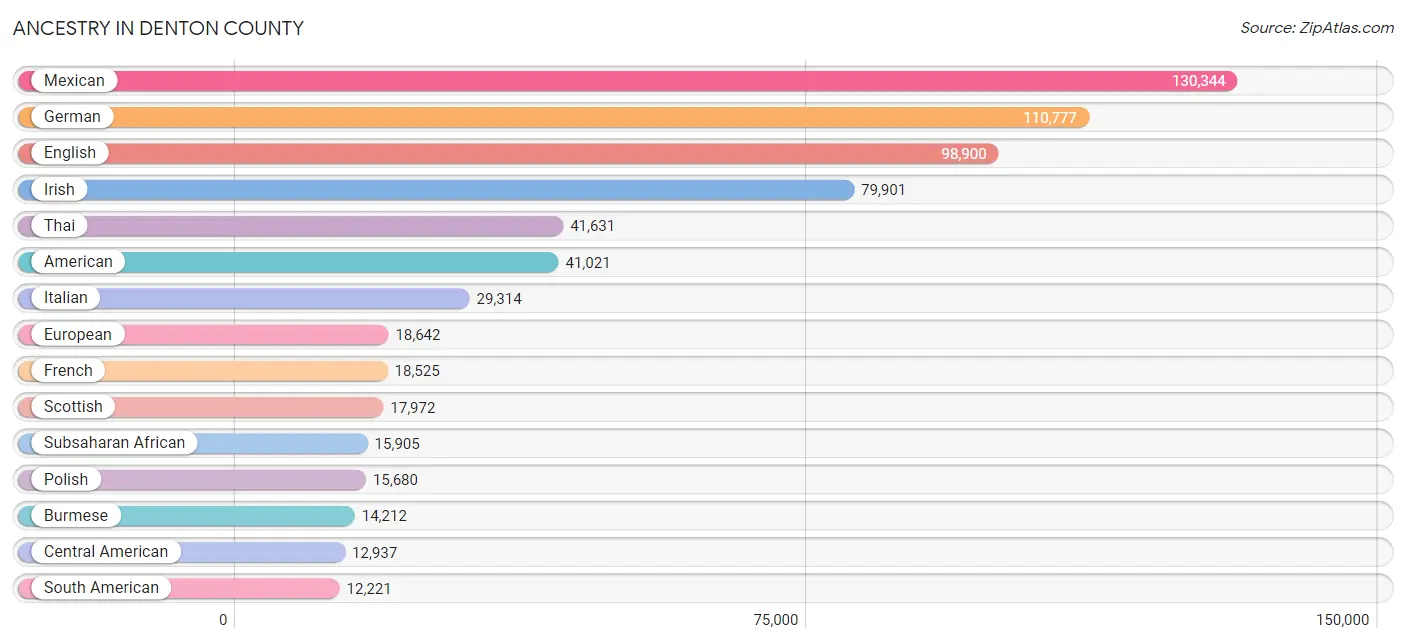
Ancestry in Denton County
The most populous ancestries reported in Denton County are Mexican (130,344 | 14.2%), German (110,777 | 12.1%), English (98,900 | 10.8%), Irish (79,901 | 8.7%), and Thai (41,631 | 4.5%), together accounting for 50.5% of all Denton County residents.
| Ancestry | # Population | % Population |
| Afghan | 29 | 0.0% |
| African | 7,410 | 0.8% |
| Alaska Native | 19 | 0.0% |
| Albanian | 554 | 0.1% |
| Alsatian | 16 | 0.0% |
| American | 41,021 | 4.5% |
| Apache | 386 | 0.0% |
| Arab | 6,174 | 0.7% |
| Argentinean | 511 | 0.1% |
| Armenian | 326 | 0.0% |
| Assyrian / Chaldean / Syriac | 510 | 0.1% |
| Australian | 205 | 0.0% |
| Austrian | 776 | 0.1% |
| Bahamian | 164 | 0.0% |
| Bangladeshi | 86 | 0.0% |
| Barbadian | 137 | 0.0% |
| Basque | 69 | 0.0% |
| Belgian | 670 | 0.1% |
| Belizean | 335 | 0.0% |
| Bermudan | 32 | 0.0% |
| Bhutanese | 3,054 | 0.3% |
| Blackfeet | 221 | 0.0% |
| Bolivian | 473 | 0.1% |
| Brazilian | 1,234 | 0.1% |
| British | 7,707 | 0.8% |
| British West Indian | 99 | 0.0% |
| Bulgarian | 665 | 0.1% |
| Burmese | 14,212 | 1.5% |
| Cajun | 460 | 0.1% |
| Cambodian | 23 | 0.0% |
| Canadian | 1,424 | 0.2% |
| Cape Verdean | 37 | 0.0% |
| Carpatho Rusyn | 3 | 0.0% |
| Celtic | 82 | 0.0% |
| Central American | 12,937 | 1.4% |
| Central American Indian | 950 | 0.1% |
| Cherokee | 3,082 | 0.3% |
| Cheyenne | 54 | 0.0% |
| Chickasaw | 645 | 0.1% |
| Chilean | 446 | 0.1% |
| Chinese | 147 | 0.0% |
| Chippewa | 53 | 0.0% |
| Choctaw | 1,267 | 0.1% |
| Colombian | 3,982 | 0.4% |
| Colville | 14 | 0.0% |
| Comanche | 259 | 0.0% |
| Costa Rican | 336 | 0.0% |
| Cree | 23 | 0.0% |
| Creek | 334 | 0.0% |
| Croatian | 393 | 0.0% |
| Crow | 40 | 0.0% |
| Cuban | 4,699 | 0.5% |
| Cypriot | 108 | 0.0% |
| Czech | 5,273 | 0.6% |
| Czechoslovakian | 710 | 0.1% |
| Danish | 2,758 | 0.3% |
| Delaware | 134 | 0.0% |
| Dominican | 1,623 | 0.2% |
| Dutch | 8,905 | 1.0% |
| Dutch West Indian | 76 | 0.0% |
| Eastern European | 1,518 | 0.2% |
| Ecuadorian | 582 | 0.1% |
| Egyptian | 859 | 0.1% |
| English | 98,900 | 10.8% |
| Estonian | 43 | 0.0% |
| Ethiopian | 520 | 0.1% |
| European | 18,642 | 2.0% |
| Fijian | 32 | 0.0% |
| Filipino | 572 | 0.1% |
| Finnish | 1,217 | 0.1% |
| French | 18,525 | 2.0% |
| French American Indian | 24 | 0.0% |
| French Canadian | 2,927 | 0.3% |
| German | 110,777 | 12.1% |
| German Russian | 14 | 0.0% |
| Ghanaian | 434 | 0.1% |
| Greek | 2,538 | 0.3% |
| Guamanian / Chamorro | 171 | 0.0% |
| Guatemalan | 2,235 | 0.2% |
| Guyanese | 74 | 0.0% |
| Haitian | 182 | 0.0% |
| Hmong | 33 | 0.0% |
| Honduran | 1,991 | 0.2% |
| Hungarian | 2,217 | 0.2% |
| Icelander | 24 | 0.0% |
| Indian (Asian) | 12,085 | 1.3% |
| Indonesian | 1,920 | 0.2% |
| Inupiat | 24 | 0.0% |
| Iranian | 2,099 | 0.2% |
| Iraqi | 266 | 0.0% |
| Irish | 79,901 | 8.7% |
| Iroquois | 154 | 0.0% |
| Israeli | 34 | 0.0% |
| Italian | 29,314 | 3.2% |
| Jamaican | 943 | 0.1% |
| Japanese | 1,656 | 0.2% |
| Jordanian | 298 | 0.0% |
| Kenyan | 724 | 0.1% |
| Kiowa | 13 | 0.0% |
| Korean | 6,535 | 0.7% |
| Laotian | 746 | 0.1% |
| Latvian | 178 | 0.0% |
| Lebanese | 1,743 | 0.2% |
| Liberian | 59 | 0.0% |
| Lithuanian | 1,029 | 0.1% |
| Luxembourger | 19 | 0.0% |
| Macedonian | 59 | 0.0% |
| Malaysian | 346 | 0.0% |
| Maltese | 37 | 0.0% |
| Mexican | 130,344 | 14.2% |
| Mexican American Indian | 2,326 | 0.3% |
| Mongolian | 188 | 0.0% |
| Moroccan | 604 | 0.1% |
| Native Hawaiian | 962 | 0.1% |
| Navajo | 559 | 0.1% |
| Nepalese | 47 | 0.0% |
| New Zealander | 92 | 0.0% |
| Nicaraguan | 862 | 0.1% |
| Nigerian | 4,306 | 0.5% |
| Northern European | 1,312 | 0.1% |
| Norwegian | 7,405 | 0.8% |
| Okinawan | 27 | 0.0% |
| Osage | 136 | 0.0% |
| Ottawa | 76 | 0.0% |
| Pakistani | 1,328 | 0.2% |
| Palestinian | 676 | 0.1% |
| Panamanian | 969 | 0.1% |
| Paraguayan | 78 | 0.0% |
| Pennsylvania German | 246 | 0.0% |
| Peruvian | 1,751 | 0.2% |
| Pima | 14 | 0.0% |
| Polish | 15,680 | 1.7% |
| Portuguese | 2,359 | 0.3% |
| Potawatomi | 4 | 0.0% |
| Pueblo | 130 | 0.0% |
| Puerto Rican | 9,251 | 1.0% |
| Romanian | 457 | 0.1% |
| Russian | 3,397 | 0.4% |
| Salvadoran | 6,505 | 0.7% |
| Samoan | 237 | 0.0% |
| Scandinavian | 3,387 | 0.4% |
| Scotch-Irish | 10,405 | 1.1% |
| Scottish | 17,972 | 2.0% |
| Seminole | 187 | 0.0% |
| Serbian | 524 | 0.1% |
| Sierra Leonean | 82 | 0.0% |
| Sioux | 224 | 0.0% |
| Slavic | 93 | 0.0% |
| Slovak | 984 | 0.1% |
| Slovene | 395 | 0.0% |
| Somali | 88 | 0.0% |
| South African | 481 | 0.1% |
| South American | 12,221 | 1.3% |
| South American Indian | 318 | 0.0% |
| Spaniard | 2,712 | 0.3% |
| Spanish | 1,987 | 0.2% |
| Spanish American | 115 | 0.0% |
| Sri Lankan | 9,195 | 1.0% |
| Subsaharan African | 15,905 | 1.7% |
| Sudanese | 248 | 0.0% |
| Swedish | 5,835 | 0.6% |
| Swiss | 1,422 | 0.2% |
| Syrian | 175 | 0.0% |
| Thai | 41,631 | 4.5% |
| Tohono O'Odham | 8 | 0.0% |
| Tongan | 108 | 0.0% |
| Trinidadian and Tobagonian | 101 | 0.0% |
| Turkish | 975 | 0.1% |
| Ugandan | 371 | 0.0% |
| Ukrainian | 1,428 | 0.2% |
| Uruguayan | 49 | 0.0% |
| Ute | 8 | 0.0% |
| Venezuelan | 4,073 | 0.4% |
| Vietnamese | 348 | 0.0% |
| Welsh | 5,239 | 0.6% |
| West Indian | 176 | 0.0% |
| Yaqui | 212 | 0.0% |
| Yugoslavian | 330 | 0.0% |
| Zimbabwean | 155 | 0.0% | View All 179 Rows |
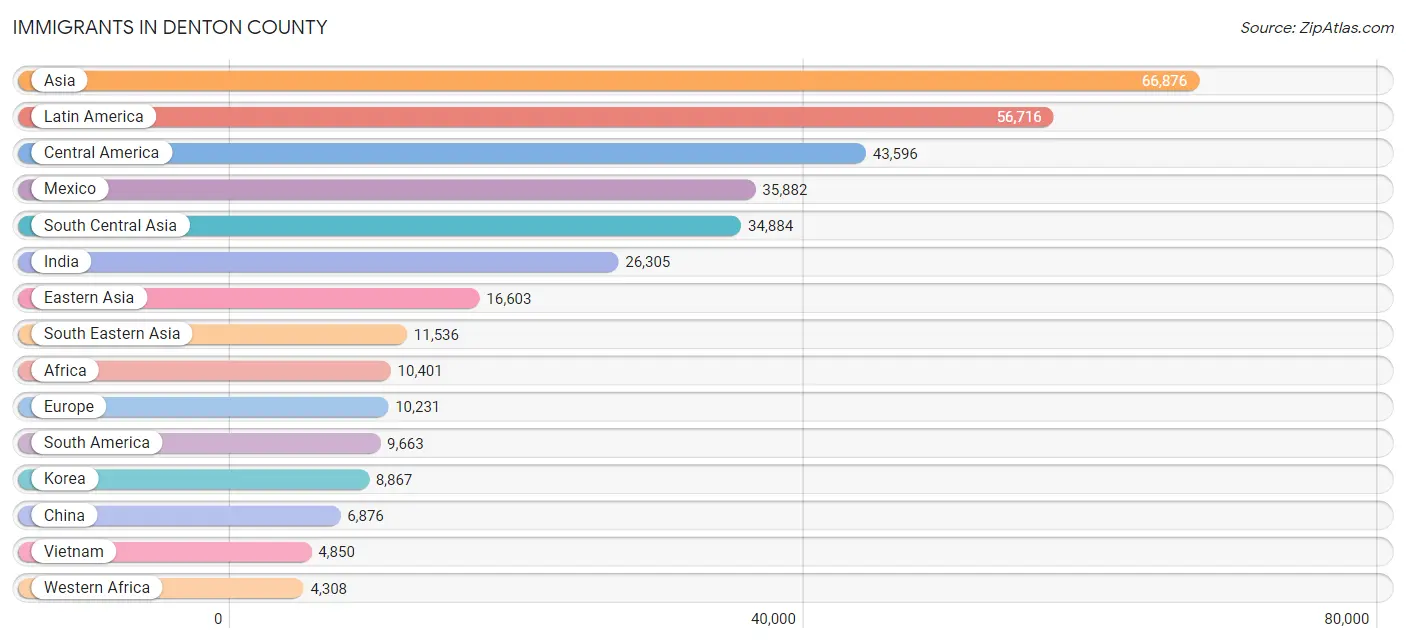
Immigrants in Denton County
The most numerous immigrant groups reported in Denton County came from Asia (66,876 | 7.3%), Latin America (56,716 | 6.2%), Central America (43,596 | 4.8%), Mexico (35,882 | 3.9%), and South Central Asia (34,884 | 3.8%), together accounting for 26.0% of all Denton County residents.
| Immigration Origin | # Population | % Population |
| Afghanistan | 21 | 0.0% |
| Africa | 10,401 | 1.1% |
| Albania | 138 | 0.0% |
| Argentina | 349 | 0.0% |
| Asia | 66,876 | 7.3% |
| Australia | 233 | 0.0% |
| Austria | 26 | 0.0% |
| Bahamas | 84 | 0.0% |
| Bangladesh | 811 | 0.1% |
| Barbados | 109 | 0.0% |
| Belgium | 50 | 0.0% |
| Belize | 156 | 0.0% |
| Bolivia | 348 | 0.0% |
| Bosnia and Herzegovina | 239 | 0.0% |
| Brazil | 1,534 | 0.2% |
| Bulgaria | 385 | 0.0% |
| Cabo Verde | 25 | 0.0% |
| Cambodia | 897 | 0.1% |
| Cameroon | 744 | 0.1% |
| Canada | 3,042 | 0.3% |
| Caribbean | 3,457 | 0.4% |
| Central America | 43,596 | 4.8% |
| Chile | 199 | 0.0% |
| China | 6,876 | 0.7% |
| Colombia | 2,085 | 0.2% |
| Congo | 37 | 0.0% |
| Costa Rica | 158 | 0.0% |
| Cuba | 1,913 | 0.2% |
| Czechoslovakia | 122 | 0.0% |
| Denmark | 144 | 0.0% |
| Dominica | 30 | 0.0% |
| Dominican Republic | 542 | 0.1% |
| Eastern Africa | 2,746 | 0.3% |
| Eastern Asia | 16,603 | 1.8% |
| Eastern Europe | 3,541 | 0.4% |
| Ecuador | 165 | 0.0% |
| Egypt | 656 | 0.1% |
| El Salvador | 3,662 | 0.4% |
| England | 1,294 | 0.1% |
| Ethiopia | 490 | 0.1% |
| Europe | 10,231 | 1.1% |
| France | 279 | 0.0% |
| Germany | 1,577 | 0.2% |
| Ghana | 296 | 0.0% |
| Greece | 284 | 0.0% |
| Grenada | 12 | 0.0% |
| Guatemala | 1,399 | 0.2% |
| Guyana | 138 | 0.0% |
| Haiti | 42 | 0.0% |
| Honduras | 1,192 | 0.1% |
| Hong Kong | 416 | 0.1% |
| Hungary | 67 | 0.0% |
| India | 26,305 | 2.9% |
| Indonesia | 326 | 0.0% |
| Iran | 1,724 | 0.2% |
| Iraq | 703 | 0.1% |
| Ireland | 91 | 0.0% |
| Israel | 62 | 0.0% |
| Italy | 434 | 0.1% |
| Jamaica | 408 | 0.0% |
| Japan | 860 | 0.1% |
| Jordan | 238 | 0.0% |
| Kazakhstan | 12 | 0.0% |
| Kenya | 1,082 | 0.1% |
| Korea | 8,867 | 1.0% |
| Kuwait | 137 | 0.0% |
| Laos | 268 | 0.0% |
| Latin America | 56,716 | 6.2% |
| Latvia | 2 | 0.0% |
| Lebanon | 357 | 0.0% |
| Liberia | 107 | 0.0% |
| Lithuania | 61 | 0.0% |
| Malaysia | 493 | 0.1% |
| Mexico | 35,882 | 3.9% |
| Micronesia | 42 | 0.0% |
| Middle Africa | 950 | 0.1% |
| Moldova | 105 | 0.0% |
| Morocco | 222 | 0.0% |
| Nepal | 1,401 | 0.2% |
| Netherlands | 178 | 0.0% |
| Nicaragua | 609 | 0.1% |
| Nigeria | 2,904 | 0.3% |
| North Macedonia | 104 | 0.0% |
| Northern Africa | 1,210 | 0.1% |
| Northern Europe | 2,979 | 0.3% |
| Norway | 15 | 0.0% |
| Oceania | 482 | 0.1% |
| Pakistan | 4,260 | 0.5% |
| Panama | 538 | 0.1% |
| Peru | 941 | 0.1% |
| Philippines | 2,715 | 0.3% |
| Poland | 431 | 0.1% |
| Portugal | 226 | 0.0% |
| Romania | 197 | 0.0% |
| Russia | 742 | 0.1% |
| Saudi Arabia | 983 | 0.1% |
| Scotland | 297 | 0.0% |
| Serbia | 126 | 0.0% |
| Sierra Leone | 201 | 0.0% |
| Singapore | 80 | 0.0% |
| Somalia | 6 | 0.0% |
| South Africa | 909 | 0.1% |
| South America | 9,663 | 1.1% |
| South Central Asia | 34,884 | 3.8% |
| South Eastern Asia | 11,536 | 1.3% |
| Southern Europe | 1,395 | 0.2% |
| Spain | 451 | 0.1% |
| Sri Lanka | 300 | 0.0% |
| Sudan | 206 | 0.0% |
| Sweden | 86 | 0.0% |
| Switzerland | 34 | 0.0% |
| Syria | 213 | 0.0% |
| Taiwan | 973 | 0.1% |
| Thailand | 380 | 0.0% |
| Trinidad and Tobago | 181 | 0.0% |
| Turkey | 567 | 0.1% |
| Uganda | 474 | 0.1% |
| Ukraine | 671 | 0.1% |
| Uruguay | 25 | 0.0% |
| Uzbekistan | 50 | 0.0% |
| Venezuela | 3,612 | 0.4% |
| Vietnam | 4,850 | 0.5% |
| West Indies | 33 | 0.0% |
| Western Africa | 4,308 | 0.5% |
| Western Asia | 3,748 | 0.4% |
| Western Europe | 2,144 | 0.2% |
| Zaire | 169 | 0.0% |
| Zimbabwe | 252 | 0.0% | View All 128 Rows |
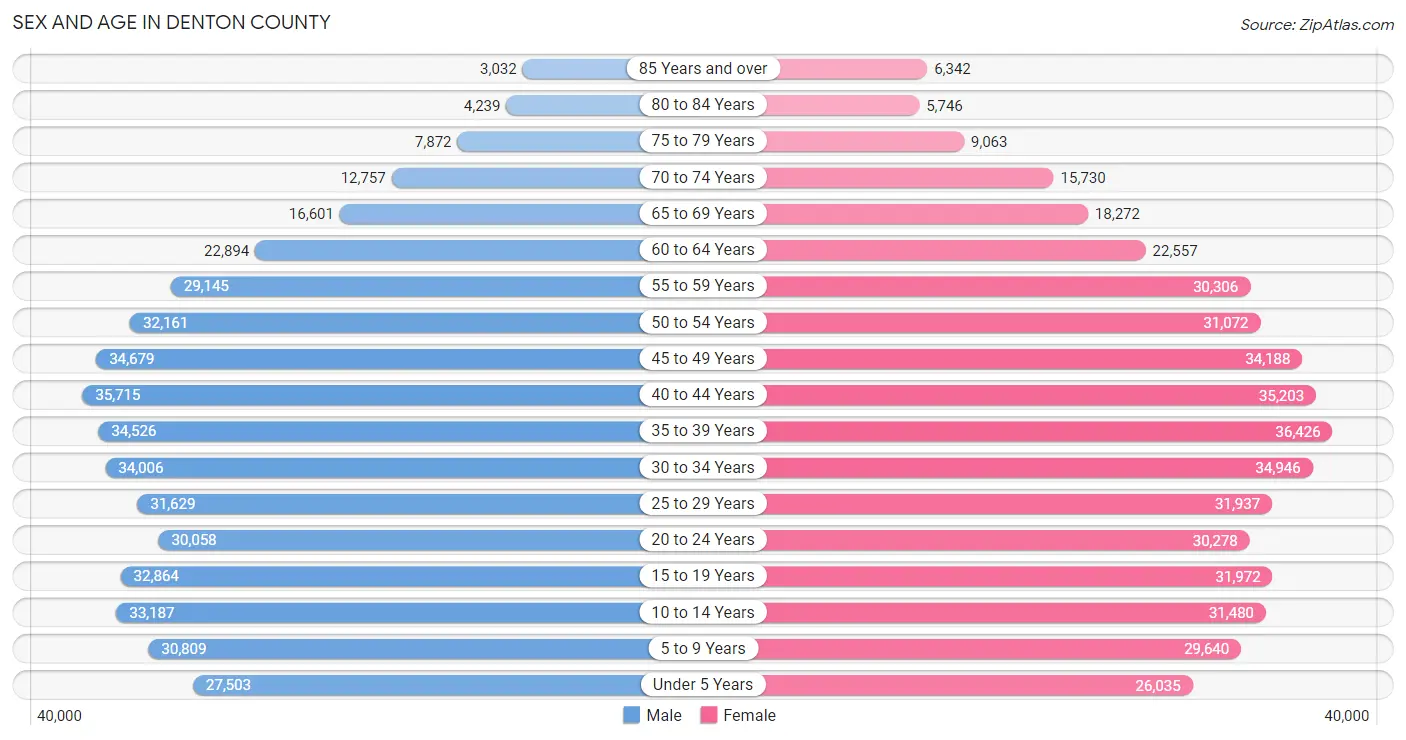
Sex and Age in Denton County
Sex and Age in Denton County
The most populous age groups in Denton County are 40 to 44 Years (35,715 | 7.9%) for men and 35 to 39 Years (36,426 | 7.9%) for women.
| Age Bracket | Male | Female |
| Under 5 Years | 27,503 (6.1%) | 26,035 (5.7%) |
| 5 to 9 Years | 30,809 (6.8%) | 29,640 (6.4%) |
| 10 to 14 Years | 33,187 (7.3%) | 31,480 (6.8%) |
| 15 to 19 Years | 32,864 (7.2%) | 31,972 (6.9%) |
| 20 to 24 Years | 30,058 (6.6%) | 30,278 (6.6%) |
| 25 to 29 Years | 31,629 (7.0%) | 31,937 (6.9%) |
| 30 to 34 Years | 34,006 (7.5%) | 34,946 (7.6%) |
| 35 to 39 Years | 34,526 (7.6%) | 36,426 (7.9%) |
| 40 to 44 Years | 35,715 (7.9%) | 35,203 (7.6%) |
| 45 to 49 Years | 34,679 (7.6%) | 34,188 (7.4%) |
| 50 to 54 Years | 32,161 (7.1%) | 31,072 (6.7%) |
| 55 to 59 Years | 29,145 (6.4%) | 30,306 (6.6%) |
| 60 to 64 Years | 22,894 (5.1%) | 22,557 (4.9%) |
| 65 to 69 Years | 16,601 (3.7%) | 18,272 (4.0%) |
| 70 to 74 Years | 12,757 (2.8%) | 15,730 (3.4%) |
| 75 to 79 Years | 7,872 (1.7%) | 9,063 (2.0%) |
| 80 to 84 Years | 4,239 (0.9%) | 5,746 (1.3%) |
| 85 Years and over | 3,032 (0.7%) | 6,342 (1.4%) |
| Total | 453,677 (100.0%) | 461,193 (100.0%) |
Families and Households in Denton County
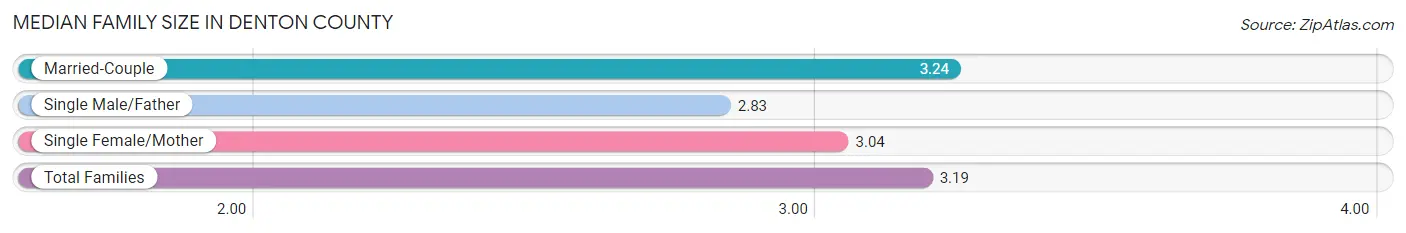
Median Family Size in Denton County
The median family size in Denton County is 3.19 persons per family, with married-couple families (192,104 | 80.6%) accounting for the largest median family size of 3.24 persons per family. On the other hand, single male/father families (14,937 | 6.3%) represent the smallest median family size with 2.83 persons per family.
| Family Type | # Families | Family Size |
| Married-Couple | 192,104 (80.6%) | 3.24 |
| Single Male/Father | 14,937 (6.3%) | 2.83 |
| Single Female/Mother | 31,197 (13.1%) | 3.04 |
| Total Families | 238,238 (100.0%) | 3.19 |
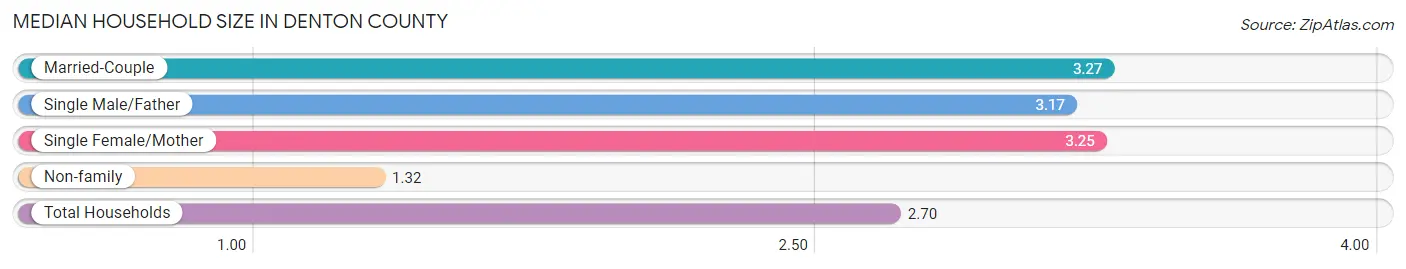
Median Household Size in Denton County
The median household size in Denton County is 2.70 persons per household, with married-couple households (192,104 | 57.4%) accounting for the largest median household size of 3.27 persons per household. non-family households (96,266 | 28.8%) represent the smallest median household size with 1.32 persons per household.
| Household Type | # Households | Household Size |
| Married-Couple | 192,104 (57.4%) | 3.27 |
| Single Male/Father | 14,937 (4.5%) | 3.17 |
| Single Female/Mother | 31,197 (9.3%) | 3.25 |
| Non-family | 96,266 (28.8%) | 1.32 |
| Total Households | 334,504 (100.0%) | 2.70 |
Household Size by Marriage Status in Denton County
Out of a total of 334,504 households in Denton County, 238,238 (71.2%) are family households, while 96,266 (28.8%) are nonfamily households. The most numerous type of family households are 2-person households, comprising 92,145, and the most common type of nonfamily households are 1-person households, comprising 75,474.
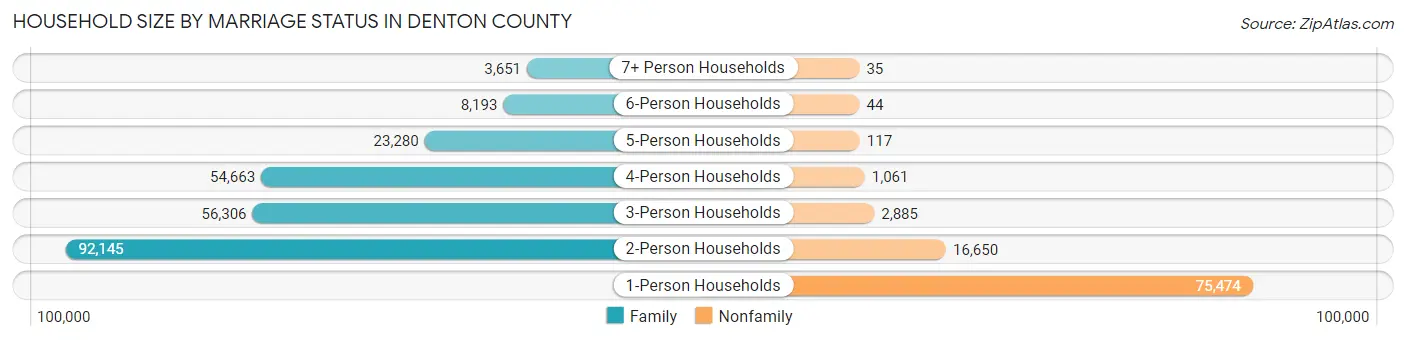
| Household Size | Family Households | Nonfamily Households |
| 1-Person Households | - | 75,474 (22.6%) |
| 2-Person Households | 92,145 (27.6%) | 16,650 (5.0%) |
| 3-Person Households | 56,306 (16.8%) | 2,885 (0.9%) |
| 4-Person Households | 54,663 (16.3%) | 1,061 (0.3%) |
| 5-Person Households | 23,280 (7.0%) | 117 (0.0%) |
| 6-Person Households | 8,193 (2.5%) | 44 (0.0%) |
| 7+ Person Households | 3,651 (1.1%) | 35 (0.0%) |
| Total | 238,238 (71.2%) | 96,266 (28.8%) |
Female Fertility in Denton County
Fertility by Age in Denton County
Average fertility rate in Denton County is 47.0 births per 1,000 women. Women in the age bracket of 20 to 34 years have the highest fertility rate with 75.0 births per 1,000 women. Women in the age bracket of 20 to 34 years acount for 63.8% of all women with births.
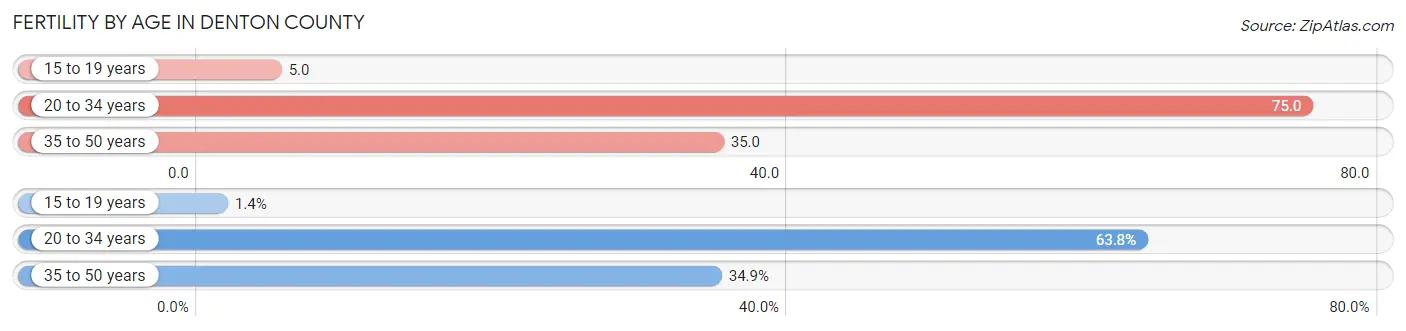
| Age Bracket | Women with Births | Births / 1,000 Women |
| 15 to 19 years | 155 (1.3%) | 5.0 |
| 20 to 34 years | 7,299 (63.8%) | 75.0 |
| 35 to 50 years | 3,990 (34.9%) | 35.0 |
| Total | 11,444 (100.0%) | 47.0 |
Fertility by Age by Marriage Status in Denton County
83.3% of women with births (11,444) in Denton County are married. The highest percentage of unmarried women with births falls into 15 to 19 years age bracket with 23.9% of them unmarried at the time of birth, while the lowest percentage of unmarried women with births belong to 35 to 50 years age bracket with 12.6% of them unmarried.
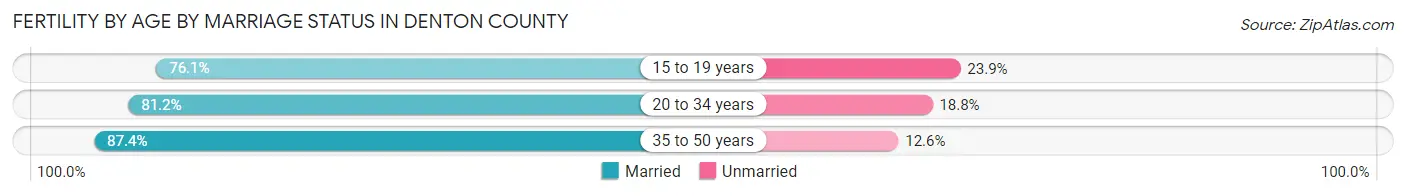
| Age Bracket | Married | Unmarried |
| 15 to 19 years | 118 (76.1%) | 37 (23.9%) |
| 20 to 34 years | 5,927 (81.2%) | 1,372 (18.8%) |
| 35 to 50 years | 3,487 (87.4%) | 503 (12.6%) |
| Total | 9,533 (83.3%) | 1,911 (16.7%) |
Fertility by Education in Denton County
Average fertility rate in Denton County is 47.0 births per 1,000 women. Women with the education attainment of bachelor's degree have the highest fertility rate of 60.0 births per 1,000 women, while women with the education attainment of less than high school have the lowest fertility at 16.0 births per 1,000 women. Women with the education attainment of bachelor's degree represent 37.6% of all women with births.
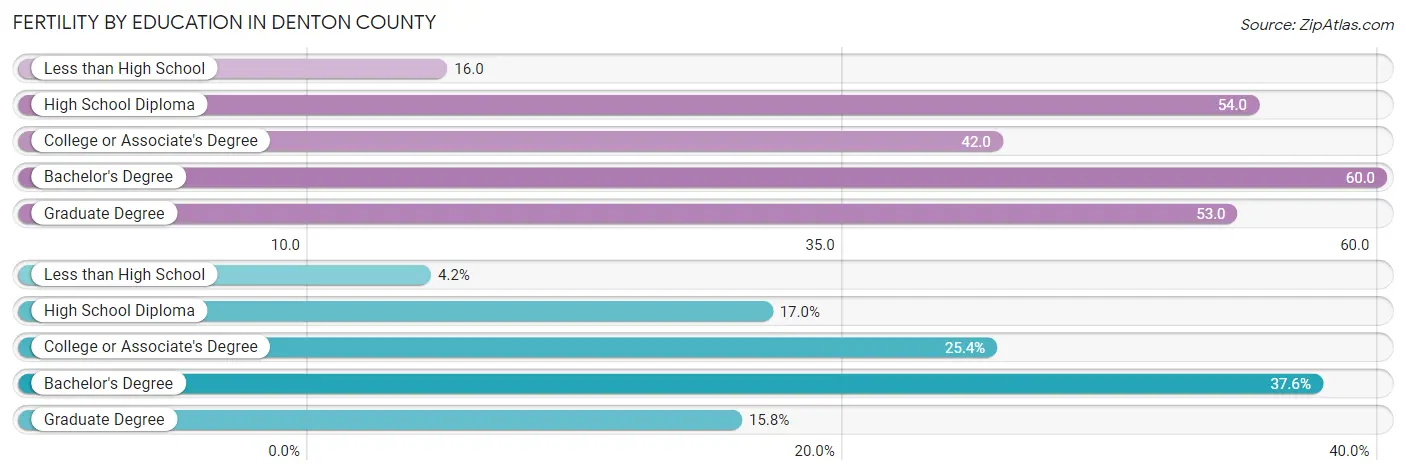
| Educational Attainment | Women with Births | Births / 1,000 Women |
| Less than High School | 479 (4.2%) | 16.0 |
| High School Diploma | 1,944 (17.0%) | 54.0 |
| College or Associate's Degree | 2,906 (25.4%) | 42.0 |
| Bachelor's Degree | 4,302 (37.6%) | 60.0 |
| Graduate Degree | 1,813 (15.8%) | 53.0 |
| Total | 11,444 (100.0%) | 47.0 |
Fertility by Education by Marriage Status in Denton County
16.7% of women with births in Denton County are unmarried. Women with the educational attainment of graduate degree are most likely to be married with 95.4% of them married at childbirth, while women with the educational attainment of less than high school are least likely to be married with 55.7% of them unmarried at childbirth.
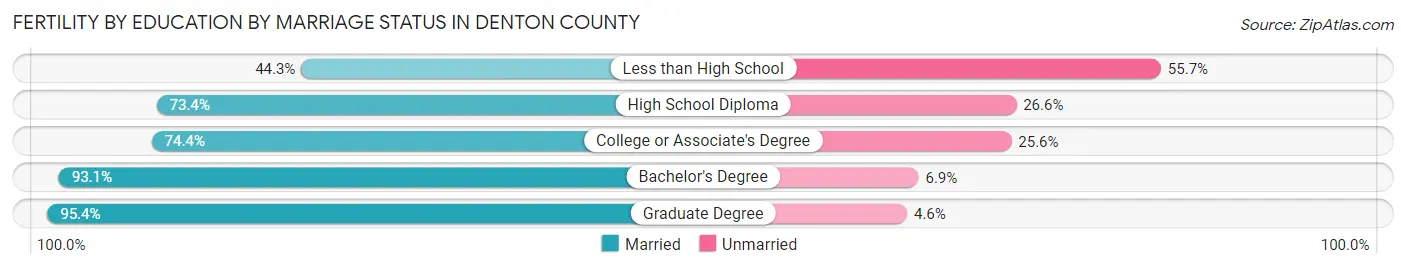
| Educational Attainment | Married | Unmarried |
| Less than High School | 212 (44.3%) | 267 (55.7%) |
| High School Diploma | 1,427 (73.4%) | 517 (26.6%) |
| College or Associate's Degree | 2,162 (74.4%) | 744 (25.6%) |
| Bachelor's Degree | 4,005 (93.1%) | 297 (6.9%) |
| Graduate Degree | 1,730 (95.4%) | 83 (4.6%) |
| Total | 9,533 (83.3%) | 1,911 (16.7%) |
Employment Characteristics in Denton County
Employment by Class of Employer in Denton County
Among the 492,599 employed individuals in Denton County, private company employees (358,901 | 72.9%), local government employees (32,613 | 6.6%), and self-employed (not incorporated) (28,623 | 5.8%) make up the most common classes of employment.
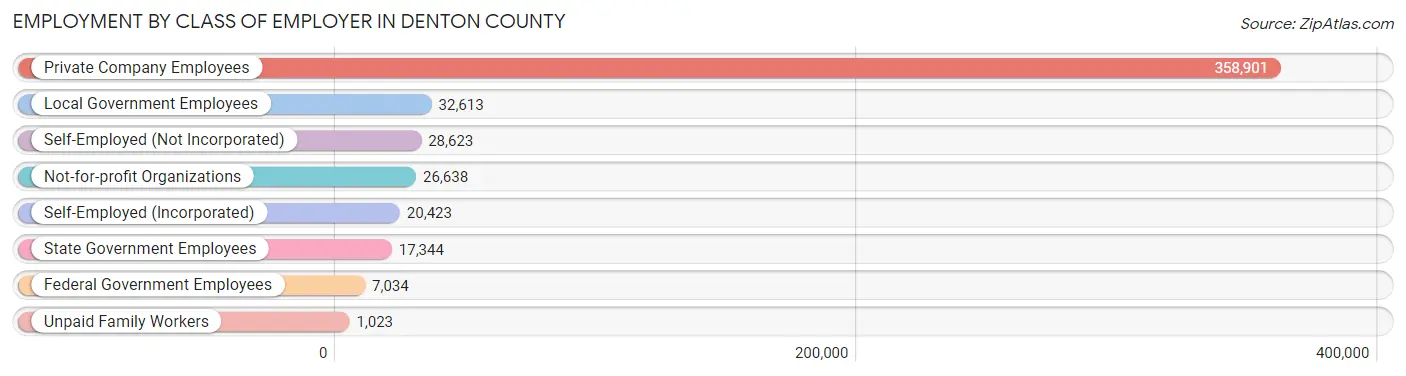
| Employer Class | # Employees | % Employees |
| Private Company Employees | 358,901 | 72.9% |
| Self-Employed (Incorporated) | 20,423 | 4.2% |
| Self-Employed (Not Incorporated) | 28,623 | 5.8% |
| Not-for-profit Organizations | 26,638 | 5.4% |
| Local Government Employees | 32,613 | 6.6% |
| State Government Employees | 17,344 | 3.5% |
| Federal Government Employees | 7,034 | 1.4% |
| Unpaid Family Workers | 1,023 | 0.2% |
| Total | 492,599 | 100.0% |
Employment Status by Age in Denton County
According to the labor force statistics for Denton County, out of the total population over 16 years of age (723,225), 72.3% or 522,892 individuals are in the labor force, with 4.0% or 20,916 of them unemployed. The age group with the highest labor force participation rate is 30 to 34 years, with 87.7% or 60,471 individuals in the labor force. Within the labor force, the 16 to 19 years age range has the highest percentage of unemployed individuals, with 10.9% or 2,272 of them being unemployed.
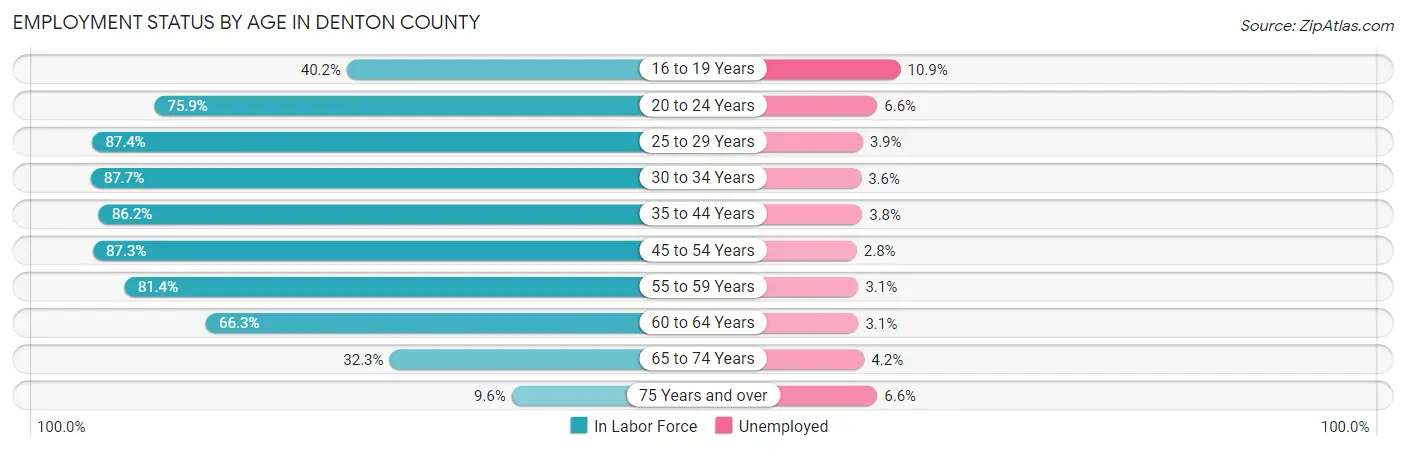
| Age Bracket | In Labor Force | Unemployed |
| 16 to 19 Years | 20,842 (40.2%) | 2,272 (10.9%) |
| 20 to 24 Years | 45,795 (75.9%) | 3,022 (6.6%) |
| 25 to 29 Years | 55,557 (87.4%) | 2,167 (3.9%) |
| 30 to 34 Years | 60,471 (87.7%) | 2,177 (3.6%) |
| 35 to 44 Years | 122,292 (86.2%) | 4,647 (3.8%) |
| 45 to 54 Years | 115,323 (87.3%) | 3,229 (2.8%) |
| 55 to 59 Years | 48,393 (81.4%) | 1,500 (3.1%) |
| 60 to 64 Years | 30,134 (66.3%) | 934 (3.1%) |
| 65 to 74 Years | 20,465 (32.3%) | 860 (4.2%) |
| 75 Years and over | 3,484 (9.6%) | 230 (6.6%) |
| Total | 522,892 (72.3%) | 20,916 (4.0%) |
Employment Status by Educational Attainment in Denton County
According to labor force statistics for Denton County, 84.5% of individuals (432,125) out of the total population between 25 and 64 years of age (511,390) are in the labor force, with 3.4% or 14,692 of them being unemployed. The group with the highest labor force participation rate are those with the educational attainment of bachelor's degree or higher, with 87.5% or 221,100 individuals in the labor force. Within the labor force, individuals with college / associate degree education have the highest percentage of unemployment, with 4.2% or 5,164 of them being unemployed.
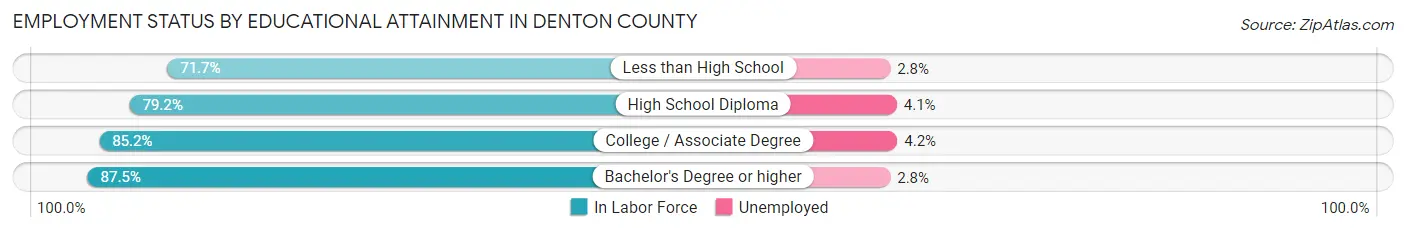
| Educational Attainment | In Labor Force | Unemployed |
| Less than High School | 23,874 (71.7%) | 932 (2.8%) |
| High School Diploma | 64,218 (79.2%) | 3,324 (4.1%) |
| College / Associate Degree | 122,964 (85.2%) | 6,062 (4.2%) |
| Bachelor's Degree or higher | 221,100 (87.5%) | 7,075 (2.8%) |
| Total | 432,125 (84.5%) | 17,387 (3.4%) |
Employment Occupations by Sex in Denton County
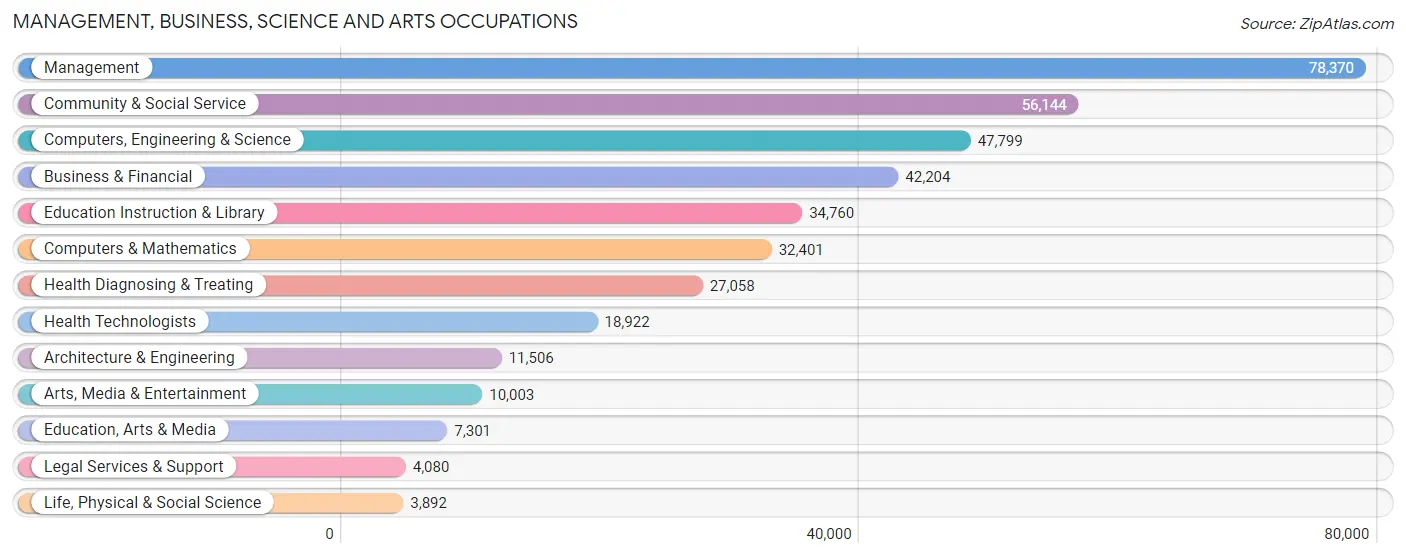
Management, Business, Science and Arts Occupations
The most common Management, Business, Science and Arts occupations in Denton County are Management (78,370 | 15.6%), Community & Social Service (56,144 | 11.2%), Computers, Engineering & Science (47,799 | 9.5%), Business & Financial (42,204 | 8.4%), and Education Instruction & Library (34,760 | 6.9%).
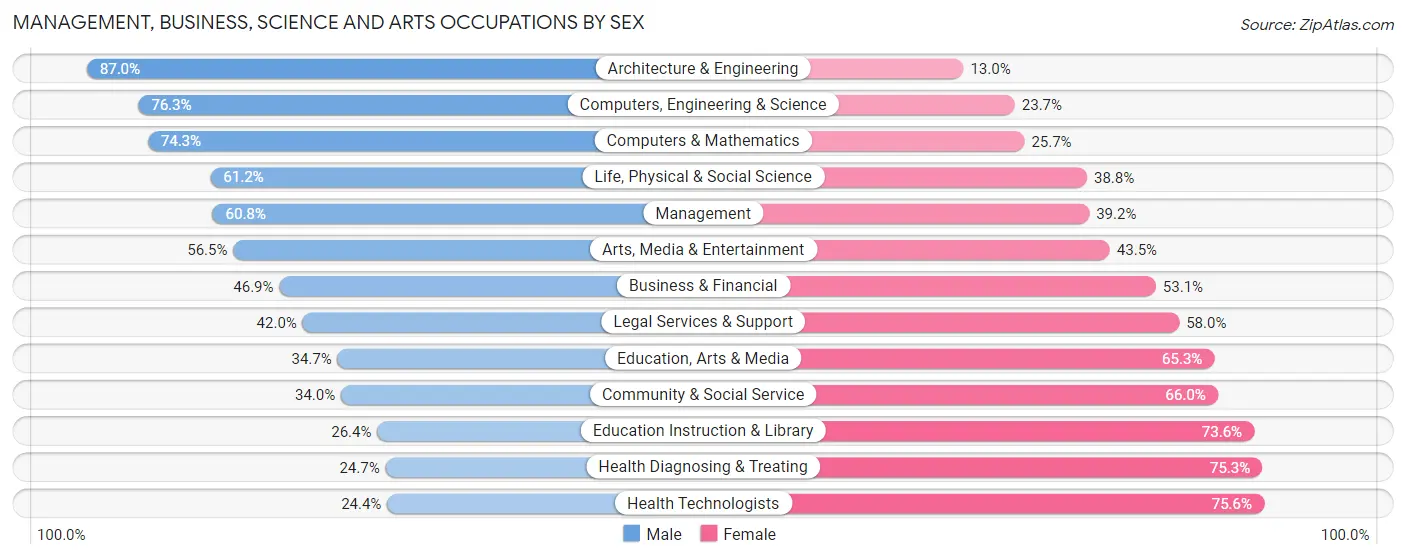
Management, Business, Science and Arts Occupations by Sex
Within the Management, Business, Science and Arts occupations in Denton County, the most male-oriented occupations are Architecture & Engineering (87.0%), Computers, Engineering & Science (76.3%), and Computers & Mathematics (74.3%), while the most female-oriented occupations are Health Technologists (75.6%), Health Diagnosing & Treating (75.3%), and Education Instruction & Library (73.6%).
| Occupation | Male | Female |
| Management | 47,626 (60.8%) | 30,744 (39.2%) |
| Business & Financial | 19,776 (46.9%) | 22,428 (53.1%) |
| Computers, Engineering & Science | 36,462 (76.3%) | 11,337 (23.7%) |
| Computers & Mathematics | 24,069 (74.3%) | 8,332 (25.7%) |
| Architecture & Engineering | 10,010 (87.0%) | 1,496 (13.0%) |
| Life, Physical & Social Science | 2,383 (61.2%) | 1,509 (38.8%) |
| Community & Social Service | 19,084 (34.0%) | 37,060 (66.0%) |
| Education, Arts & Media | 2,535 (34.7%) | 4,766 (65.3%) |
| Legal Services & Support | 1,713 (42.0%) | 2,367 (58.0%) |
| Education Instruction & Library | 9,188 (26.4%) | 25,572 (73.6%) |
| Arts, Media & Entertainment | 5,648 (56.5%) | 4,355 (43.5%) |
| Health Diagnosing & Treating | 6,690 (24.7%) | 20,368 (75.3%) |
| Health Technologists | 4,610 (24.4%) | 14,312 (75.6%) |
| Total (Category) | 129,638 (51.5%) | 121,937 (48.5%) |
| Total (Overall) | 267,486 (53.3%) | 233,972 (46.7%) |
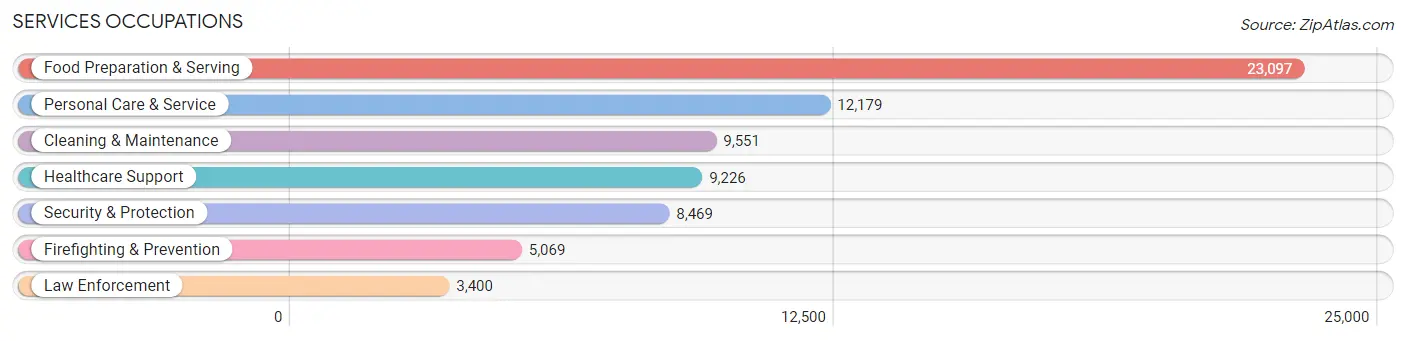
Services Occupations
The most common Services occupations in Denton County are Food Preparation & Serving (23,097 | 4.6%), Personal Care & Service (12,179 | 2.4%), Cleaning & Maintenance (9,551 | 1.9%), Healthcare Support (9,226 | 1.8%), and Security & Protection (8,469 | 1.7%).
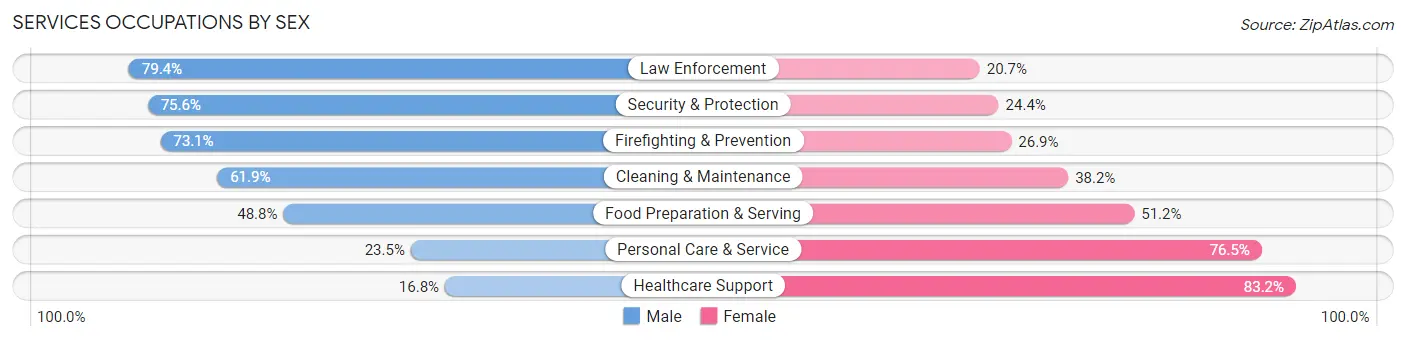
Services Occupations by Sex
Within the Services occupations in Denton County, the most male-oriented occupations are Law Enforcement (79.3%), Security & Protection (75.6%), and Firefighting & Prevention (73.1%), while the most female-oriented occupations are Healthcare Support (83.2%), Personal Care & Service (76.5%), and Food Preparation & Serving (51.2%).
| Occupation | Male | Female |
| Healthcare Support | 1,547 (16.8%) | 7,679 (83.2%) |
| Security & Protection | 6,404 (75.6%) | 2,065 (24.4%) |
| Firefighting & Prevention | 3,706 (73.1%) | 1,363 (26.9%) |
| Law Enforcement | 2,698 (79.3%) | 702 (20.6%) |
| Food Preparation & Serving | 11,265 (48.8%) | 11,832 (51.2%) |
| Cleaning & Maintenance | 5,907 (61.9%) | 3,644 (38.2%) |
| Personal Care & Service | 2,867 (23.5%) | 9,312 (76.5%) |
| Total (Category) | 27,990 (44.8%) | 34,532 (55.2%) |
| Total (Overall) | 267,486 (53.3%) | 233,972 (46.7%) |
Sales and Office Occupations
The most common Sales and Office occupations in Denton County are Office & Administration (55,941 | 11.2%), and Sales & Related (55,356 | 11.0%).

Sales and Office Occupations by Sex
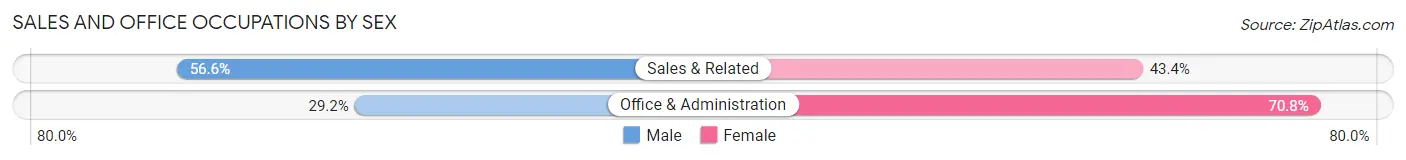
| Occupation | Male | Female |
| Sales & Related | 31,325 (56.6%) | 24,031 (43.4%) |
| Office & Administration | 16,358 (29.2%) | 39,583 (70.8%) |
| Total (Category) | 47,683 (42.8%) | 63,614 (57.2%) |
| Total (Overall) | 267,486 (53.3%) | 233,972 (46.7%) |
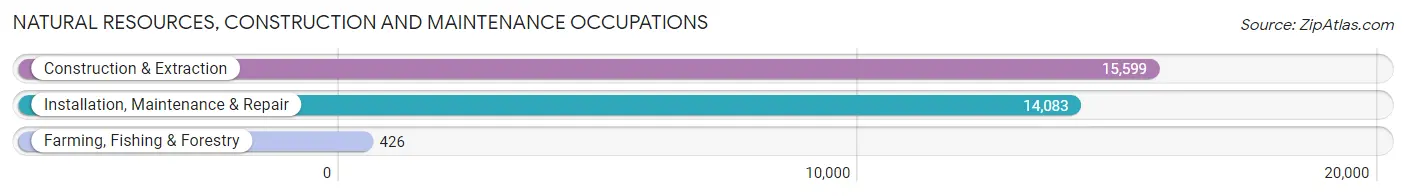
Natural Resources, Construction and Maintenance Occupations
The most common Natural Resources, Construction and Maintenance occupations in Denton County are Construction & Extraction (15,599 | 3.1%), Installation, Maintenance & Repair (14,083 | 2.8%), and Farming, Fishing & Forestry (426 | 0.1%).
Natural Resources, Construction and Maintenance Occupations by Sex
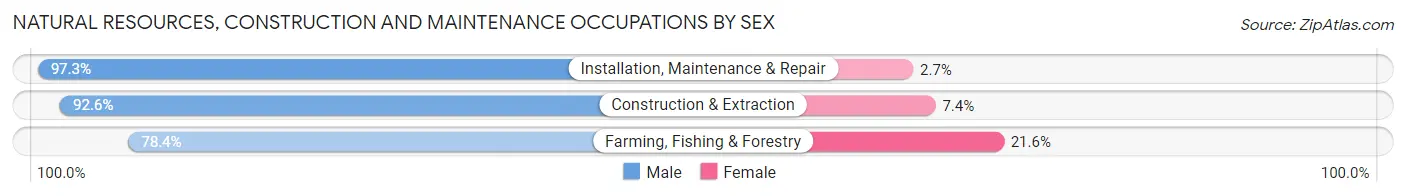
| Occupation | Male | Female |
| Farming, Fishing & Forestry | 334 (78.4%) | 92 (21.6%) |
| Construction & Extraction | 14,445 (92.6%) | 1,154 (7.4%) |
| Installation, Maintenance & Repair | 13,697 (97.3%) | 386 (2.7%) |
| Total (Category) | 28,476 (94.6%) | 1,632 (5.4%) |
| Total (Overall) | 267,486 (53.3%) | 233,972 (46.7%) |
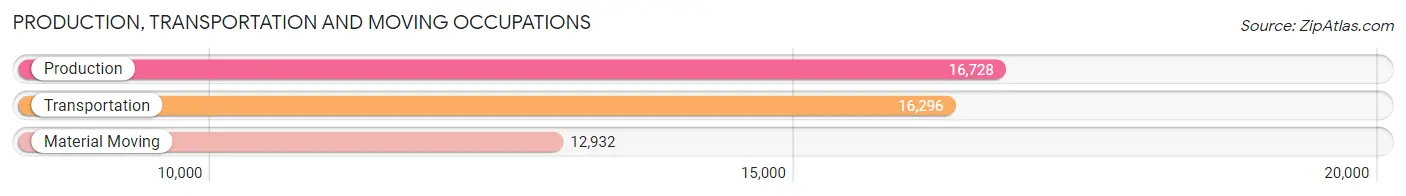
Production, Transportation and Moving Occupations
The most common Production, Transportation and Moving occupations in Denton County are Production (16,728 | 3.3%), Transportation (16,296 | 3.3%), and Material Moving (12,932 | 2.6%).
Production, Transportation and Moving Occupations by Sex
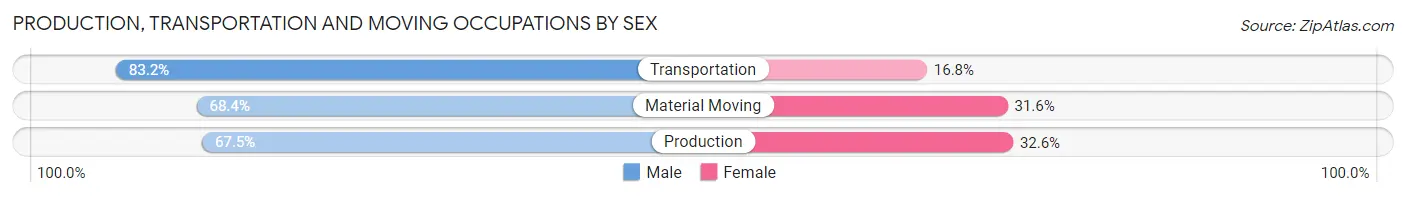
| Occupation | Male | Female |
| Production | 11,283 (67.4%) | 5,445 (32.6%) |
| Transportation | 13,565 (83.2%) | 2,731 (16.8%) |
| Material Moving | 8,851 (68.4%) | 4,081 (31.6%) |
| Total (Category) | 33,699 (73.3%) | 12,257 (26.7%) |
| Total (Overall) | 267,486 (53.3%) | 233,972 (46.7%) |
Employment Industries by Sex in Denton County
Employment Industries in Denton County
The major employment industries in Denton County include Retail Trade (55,571 | 11.1%), Health Care & Social Assistance (55,420 | 11.1%), Professional & Scientific (53,429 | 10.6%), Educational Services (49,400 | 9.9%), and Finance & Insurance (43,624 | 8.7%).

Employment Industries by Sex in Denton County
The Denton County industries that see more men than women are Construction (83.0%), Agriculture, Fishing & Hunting (78.0%), and Mining, Quarrying, & Extraction (75.4%), whereas the industries that tend to have a higher number of women are Health Care & Social Assistance (77.0%), Educational Services (70.6%), and Enterprise Management (55.8%).
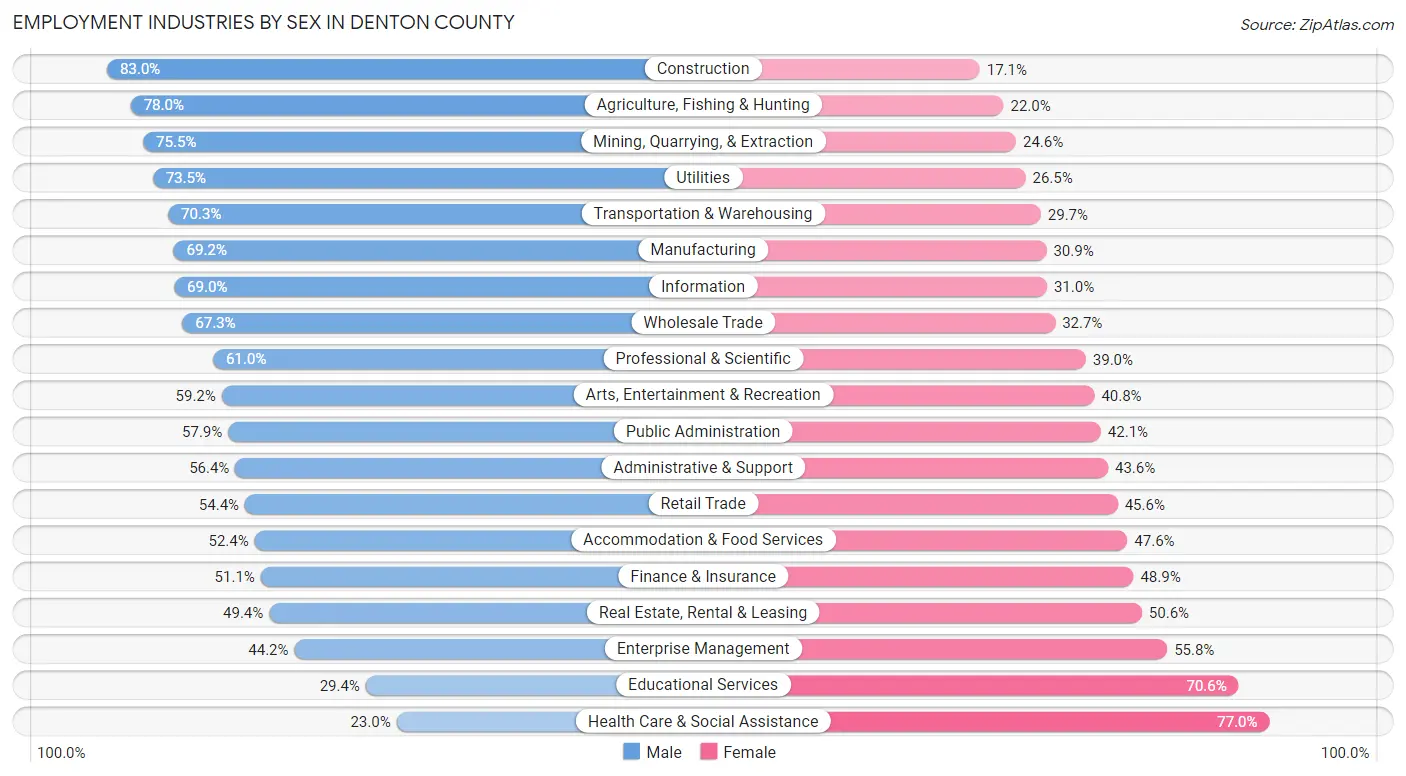
| Industry | Male | Female |
| Agriculture, Fishing & Hunting | 945 (78.0%) | 266 (22.0%) |
| Mining, Quarrying, & Extraction | 1,856 (75.4%) | 604 (24.5%) |
| Construction | 25,334 (83.0%) | 5,207 (17.1%) |
| Manufacturing | 28,624 (69.2%) | 12,773 (30.8%) |
| Wholesale Trade | 10,313 (67.3%) | 5,002 (32.7%) |
| Retail Trade | 30,233 (54.4%) | 25,338 (45.6%) |
| Transportation & Warehousing | 19,379 (70.3%) | 8,184 (29.7%) |
| Utilities | 2,070 (73.5%) | 747 (26.5%) |
| Information | 8,522 (69.0%) | 3,821 (31.0%) |
| Finance & Insurance | 22,310 (51.1%) | 21,314 (48.9%) |
| Real Estate, Rental & Leasing | 6,407 (49.4%) | 6,564 (50.6%) |
| Professional & Scientific | 32,594 (61.0%) | 20,835 (39.0%) |
| Enterprise Management | 579 (44.2%) | 732 (55.8%) |
| Administrative & Support | 10,182 (56.4%) | 7,869 (43.6%) |
| Educational Services | 14,522 (29.4%) | 34,878 (70.6%) |
| Health Care & Social Assistance | 12,756 (23.0%) | 42,664 (77.0%) |
| Arts, Entertainment & Recreation | 5,868 (59.2%) | 4,041 (40.8%) |
| Accommodation & Food Services | 17,083 (52.4%) | 15,517 (47.6%) |
| Public Administration | 7,867 (57.9%) | 5,725 (42.1%) |
| Total | 267,486 (53.3%) | 233,972 (46.7%) |
Education in Denton County
School Enrollment in Denton County
The most common levels of schooling among the 248,503 students in Denton County are college / undergraduate (56,728 | 22.8%), high school (50,680 | 20.4%), and middle school (50,315 | 20.3%).
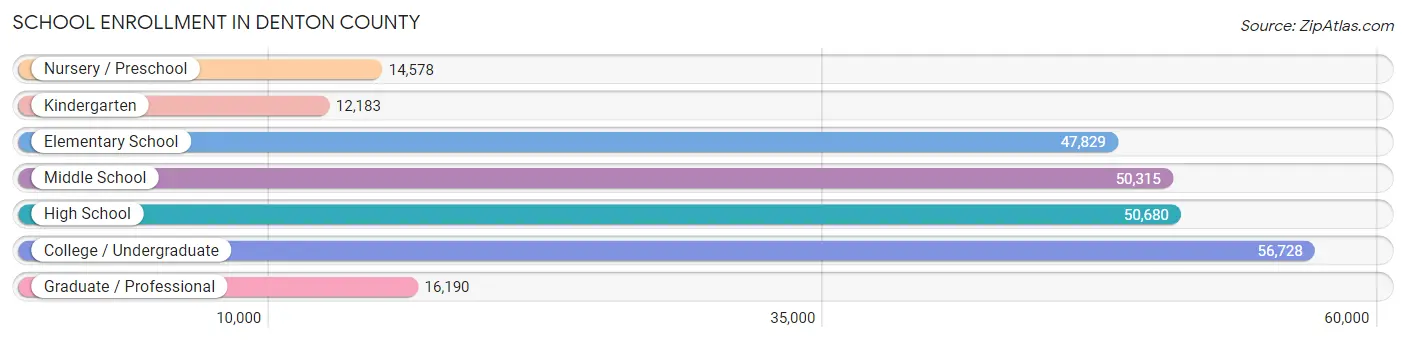
| School Level | # Students | % Students |
| Nursery / Preschool | 14,578 | 5.9% |
| Kindergarten | 12,183 | 4.9% |
| Elementary School | 47,829 | 19.3% |
| Middle School | 50,315 | 20.3% |
| High School | 50,680 | 20.4% |
| College / Undergraduate | 56,728 | 22.8% |
| Graduate / Professional | 16,190 | 6.5% |
| Total | 248,503 | 100.0% |
School Enrollment by Age by Funding Source in Denton County
Out of a total of 248,503 students who are enrolled in schools in Denton County, 33,051 (13.3%) attend a private institution, while the remaining 215,452 (86.7%) are enrolled in public schools. The age group of 3 to 4 year olds has the highest likelihood of being enrolled in private schools, with 5,537 (48.9% in the age bracket) enrolled. Conversely, the age group of 10 to 14 year olds has the lowest likelihood of being enrolled in a private school, with 58,455 (92.0% in the age bracket) attending a public institution.
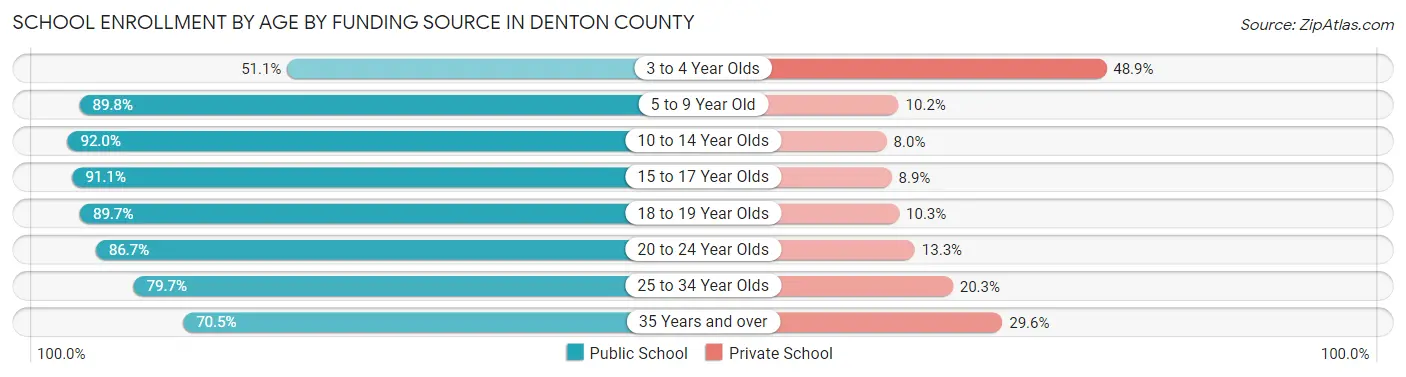
| Age Bracket | Public School | Private School |
| 3 to 4 Year Olds | 5,783 (51.1%) | 5,537 (48.9%) |
| 5 to 9 Year Old | 50,483 (89.8%) | 5,762 (10.2%) |
| 10 to 14 Year Olds | 58,455 (92.0%) | 5,088 (8.0%) |
| 15 to 17 Year Olds | 35,184 (91.1%) | 3,451 (8.9%) |
| 18 to 19 Year Olds | 17,947 (89.7%) | 2,067 (10.3%) |
| 20 to 24 Year Olds | 25,230 (86.7%) | 3,859 (13.3%) |
| 25 to 34 Year Olds | 12,129 (79.7%) | 3,093 (20.3%) |
| 35 Years and over | 10,169 (70.5%) | 4,266 (29.5%) |
| Total | 215,452 (86.7%) | 33,051 (13.3%) |
Educational Attainment by Field of Study in Denton County
Business (84,722 | 27.1%), engineering (28,270 | 9.0%), education (26,936 | 8.6%), science & technology (26,760 | 8.6%), and computers & mathematics (21,306 | 6.8%) are the most common fields of study among 312,896 individuals in Denton County who have obtained a bachelor's degree or higher.
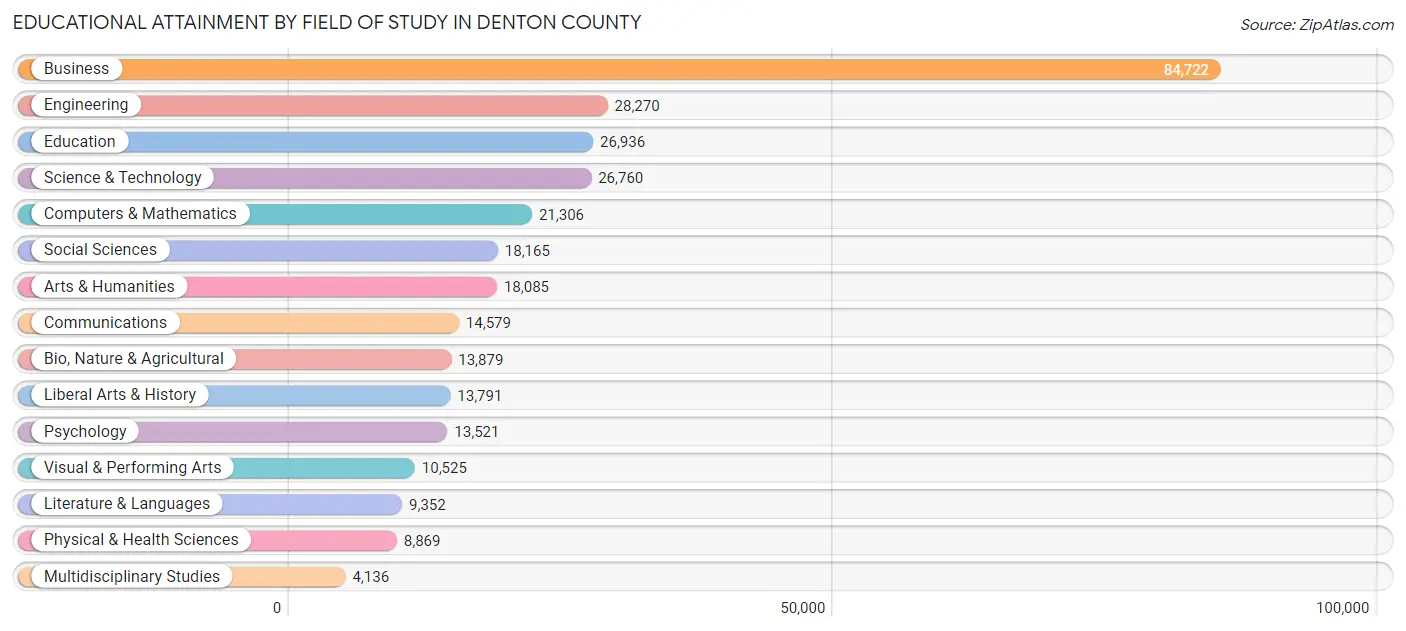
| Field of Study | # Graduates | % Graduates |
| Computers & Mathematics | 21,306 | 6.8% |
| Bio, Nature & Agricultural | 13,879 | 4.4% |
| Physical & Health Sciences | 8,869 | 2.8% |
| Psychology | 13,521 | 4.3% |
| Social Sciences | 18,165 | 5.8% |
| Engineering | 28,270 | 9.0% |
| Multidisciplinary Studies | 4,136 | 1.3% |
| Science & Technology | 26,760 | 8.6% |
| Business | 84,722 | 27.1% |
| Education | 26,936 | 8.6% |
| Literature & Languages | 9,352 | 3.0% |
| Liberal Arts & History | 13,791 | 4.4% |
| Visual & Performing Arts | 10,525 | 3.4% |
| Communications | 14,579 | 4.7% |
| Arts & Humanities | 18,085 | 5.8% |
| Total | 312,896 | 100.0% |
Transportation & Commute in Denton County
Vehicle Availability by Sex in Denton County
The most prevalent vehicle ownership categories in Denton County are males with 2 vehicles (124,869, accounting for 47.4%) and females with 2 vehicles (102,088, making up 55.3%).
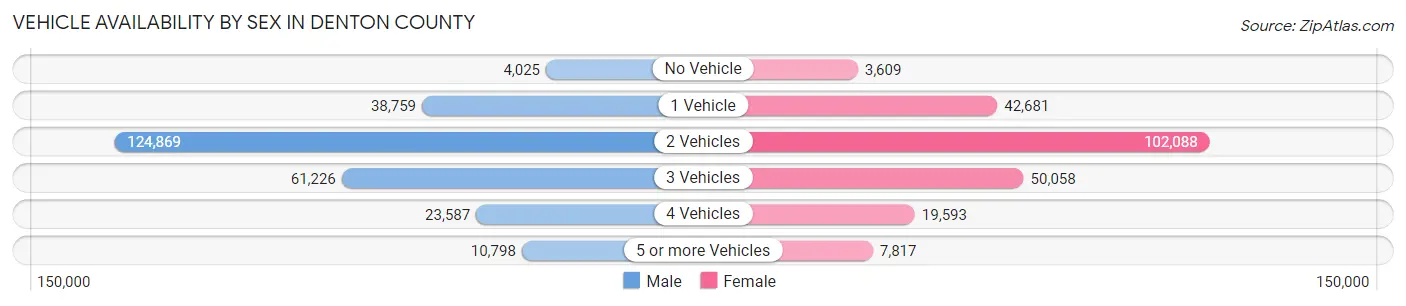
| Vehicles Available | Male | Female |
| No Vehicle | 4,025 (1.5%) | 3,609 (1.6%) |
| 1 Vehicle | 38,759 (14.7%) | 42,681 (18.9%) |
| 2 Vehicles | 124,869 (47.4%) | 102,088 (45.2%) |
| 3 Vehicles | 61,226 (23.3%) | 50,058 (22.2%) |
| 4 Vehicles | 23,587 (9.0%) | 19,593 (8.7%) |
| 5 or more Vehicles | 10,798 (4.1%) | 7,817 (3.5%) |
| Total | 263,264 (100.0%) | 225,846 (100.0%) |
Commute Time in Denton County
The most frequently occuring commute durations in Denton County are 30 to 34 minutes (63,284 commuters, 15.7%), 15 to 19 minutes (56,807 commuters, 14.1%), and 20 to 24 minutes (56,691 commuters, 14.1%).
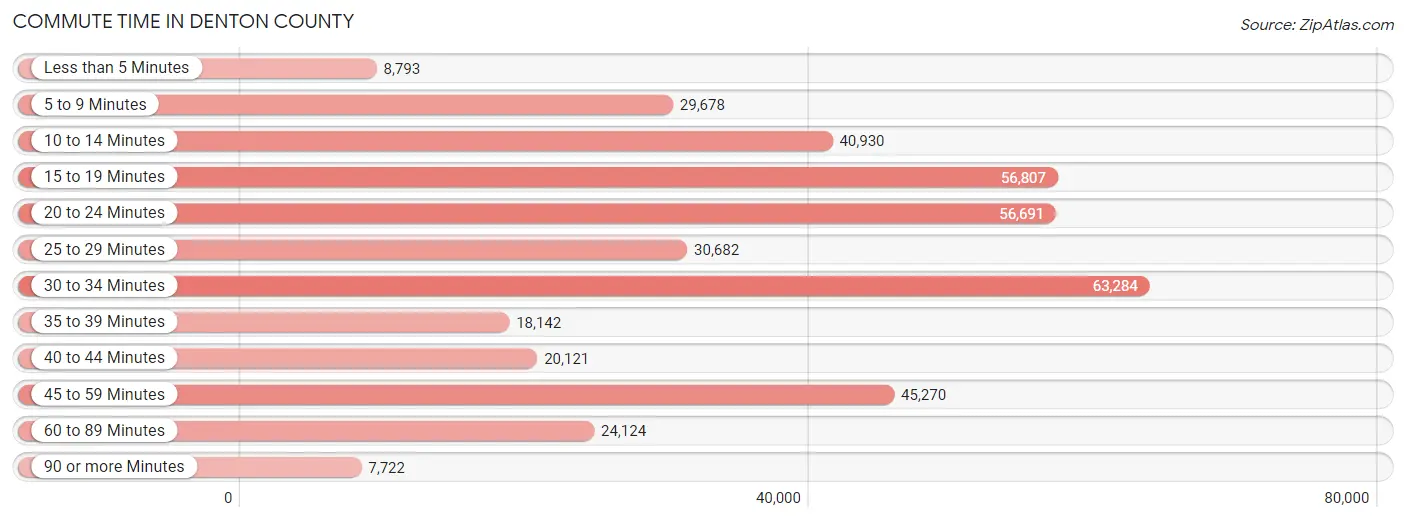
| Commute Time | # Commuters | % Commuters |
| Less than 5 Minutes | 8,793 | 2.2% |
| 5 to 9 Minutes | 29,678 | 7.4% |
| 10 to 14 Minutes | 40,930 | 10.2% |
| 15 to 19 Minutes | 56,807 | 14.1% |
| 20 to 24 Minutes | 56,691 | 14.1% |
| 25 to 29 Minutes | 30,682 | 7.6% |
| 30 to 34 Minutes | 63,284 | 15.7% |
| 35 to 39 Minutes | 18,142 | 4.5% |
| 40 to 44 Minutes | 20,121 | 5.0% |
| 45 to 59 Minutes | 45,270 | 11.3% |
| 60 to 89 Minutes | 24,124 | 6.0% |
| 90 or more Minutes | 7,722 | 1.9% |
Commute Time by Sex in Denton County
The most common commute times in Denton County are 30 to 34 minutes (36,304 commuters, 16.7%) for males and 15 to 19 minutes (29,583 commuters, 16.0%) for females.
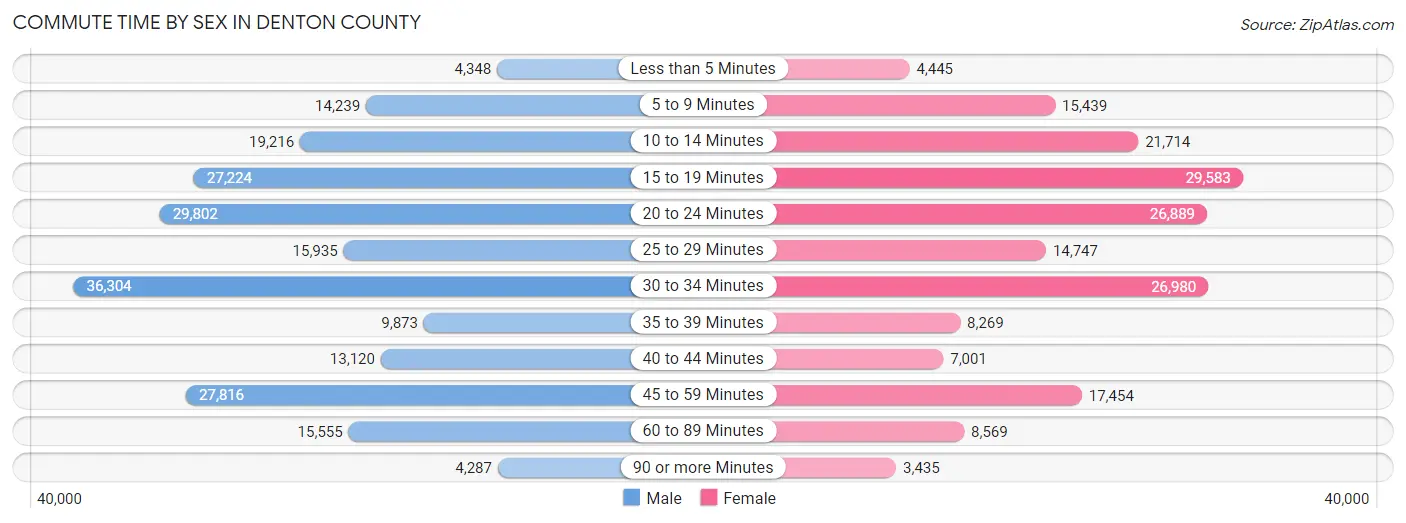
| Commute Time | Male | Female |
| Less than 5 Minutes | 4,348 (2.0%) | 4,445 (2.4%) |
| 5 to 9 Minutes | 14,239 (6.5%) | 15,439 (8.4%) |
| 10 to 14 Minutes | 19,216 (8.8%) | 21,714 (11.8%) |
| 15 to 19 Minutes | 27,224 (12.5%) | 29,583 (16.0%) |
| 20 to 24 Minutes | 29,802 (13.7%) | 26,889 (14.6%) |
| 25 to 29 Minutes | 15,935 (7.3%) | 14,747 (8.0%) |
| 30 to 34 Minutes | 36,304 (16.7%) | 26,980 (14.6%) |
| 35 to 39 Minutes | 9,873 (4.5%) | 8,269 (4.5%) |
| 40 to 44 Minutes | 13,120 (6.0%) | 7,001 (3.8%) |
| 45 to 59 Minutes | 27,816 (12.8%) | 17,454 (9.5%) |
| 60 to 89 Minutes | 15,555 (7.1%) | 8,569 (4.6%) |
| 90 or more Minutes | 4,287 (2.0%) | 3,435 (1.9%) |
Time of Departure to Work by Sex in Denton County
The most frequent times of departure to work in Denton County are 7:00 AM to 7:29 AM (30,646, 14.1%) for males and 7:00 AM to 7:29 AM (27,987, 15.2%) for females.
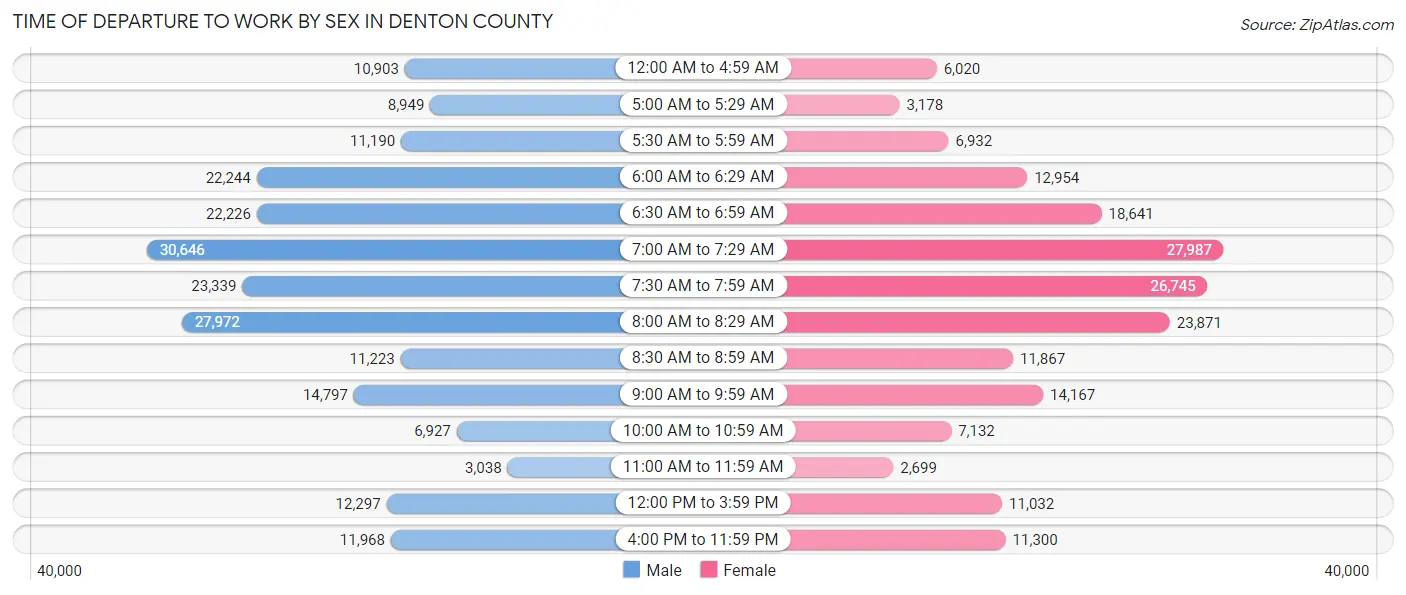
| Time of Departure | Male | Female |
| 12:00 AM to 4:59 AM | 10,903 (5.0%) | 6,020 (3.3%) |
| 5:00 AM to 5:29 AM | 8,949 (4.1%) | 3,178 (1.7%) |
| 5:30 AM to 5:59 AM | 11,190 (5.1%) | 6,932 (3.8%) |
| 6:00 AM to 6:29 AM | 22,244 (10.2%) | 12,954 (7.0%) |
| 6:30 AM to 6:59 AM | 22,226 (10.2%) | 18,641 (10.1%) |
| 7:00 AM to 7:29 AM | 30,646 (14.1%) | 27,987 (15.2%) |
| 7:30 AM to 7:59 AM | 23,339 (10.7%) | 26,745 (14.5%) |
| 8:00 AM to 8:29 AM | 27,972 (12.9%) | 23,871 (12.9%) |
| 8:30 AM to 8:59 AM | 11,223 (5.1%) | 11,867 (6.4%) |
| 9:00 AM to 9:59 AM | 14,797 (6.8%) | 14,167 (7.7%) |
| 10:00 AM to 10:59 AM | 6,927 (3.2%) | 7,132 (3.9%) |
| 11:00 AM to 11:59 AM | 3,038 (1.4%) | 2,699 (1.5%) |
| 12:00 PM to 3:59 PM | 12,297 (5.7%) | 11,032 (6.0%) |
| 4:00 PM to 11:59 PM | 11,968 (5.5%) | 11,300 (6.1%) |
| Total | 217,719 (100.0%) | 184,525 (100.0%) |
Housing Occupancy in Denton County
Occupancy by Ownership in Denton County
Of the total 334,504 dwellings in Denton County, owner-occupied units account for 217,961 (65.2%), while renter-occupied units make up 116,543 (34.8%).
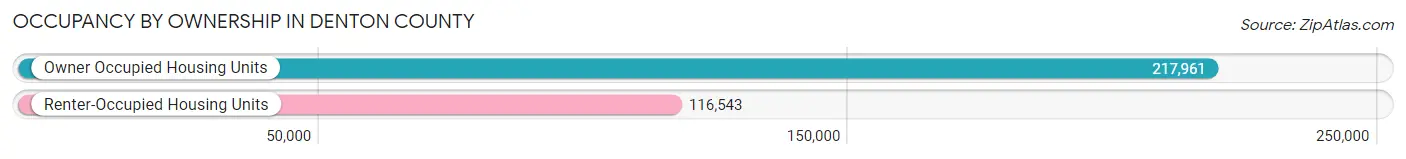
| Occupancy | # Housing Units | % Housing Units |
| Owner Occupied Housing Units | 217,961 | 65.2% |
| Renter-Occupied Housing Units | 116,543 | 34.8% |
| Total Occupied Housing Units | 334,504 | 100.0% |
Occupancy by Household Size in Denton County
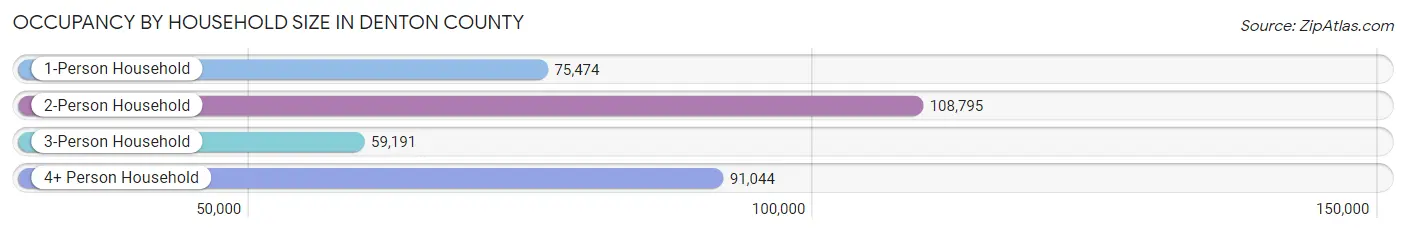
| Household Size | # Housing Units | % Housing Units |
| 1-Person Household | 75,474 | 22.6% |
| 2-Person Household | 108,795 | 32.5% |
| 3-Person Household | 59,191 | 17.7% |
| 4+ Person Household | 91,044 | 27.2% |
| Total Housing Units | 334,504 | 100.0% |
Occupancy by Ownership by Household Size in Denton County
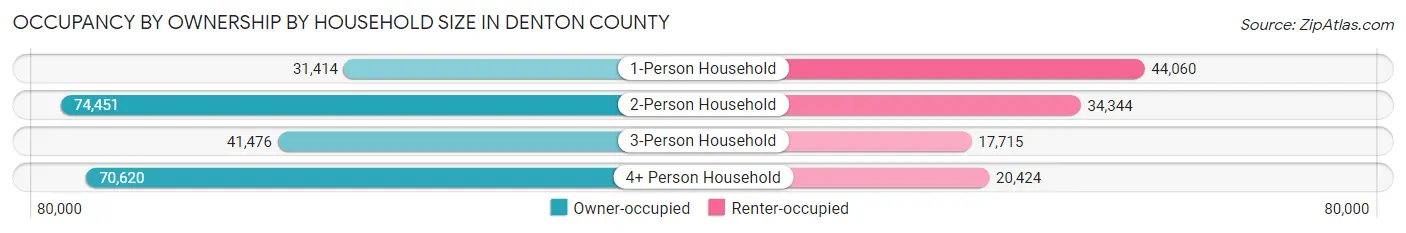
| Household Size | Owner-occupied | Renter-occupied |
| 1-Person Household | 31,414 (41.6%) | 44,060 (58.4%) |
| 2-Person Household | 74,451 (68.4%) | 34,344 (31.6%) |
| 3-Person Household | 41,476 (70.1%) | 17,715 (29.9%) |
| 4+ Person Household | 70,620 (77.6%) | 20,424 (22.4%) |
| Total Housing Units | 217,961 (65.2%) | 116,543 (34.8%) |
Occupancy by Educational Attainment in Denton County
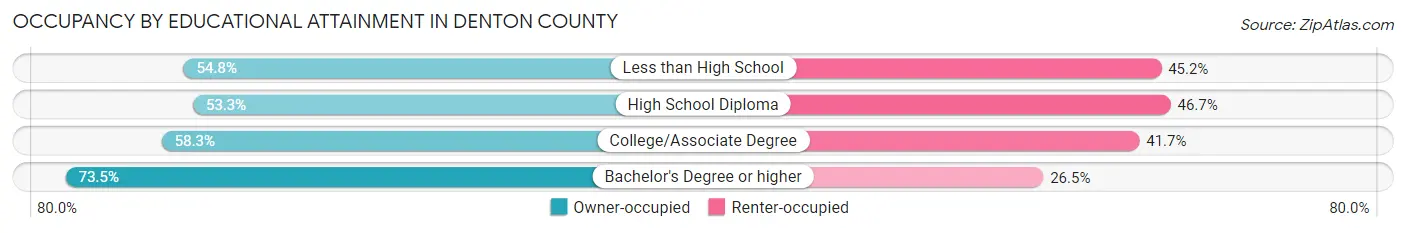
| Household Size | Owner-occupied | Renter-occupied |
| Less than High School | 8,802 (54.8%) | 7,263 (45.2%) |
| High School Diploma | 25,061 (53.3%) | 21,951 (46.7%) |
| College/Associate Degree | 58,880 (58.3%) | 42,192 (41.7%) |
| Bachelor's Degree or higher | 125,218 (73.5%) | 45,137 (26.5%) |
Occupancy by Age of Householder in Denton County
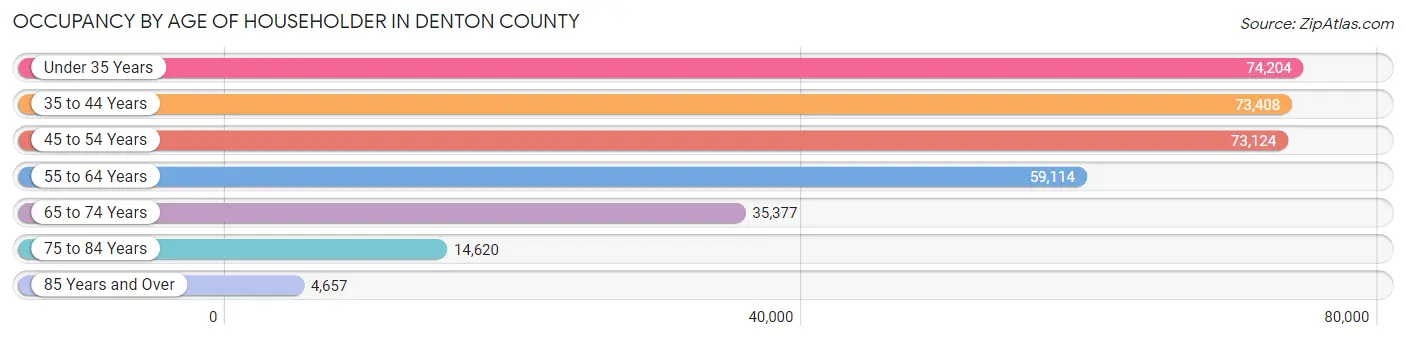
| Age Bracket | # Households | % Households |
| Under 35 Years | 74,204 | 22.2% |
| 35 to 44 Years | 73,408 | 22.0% |
| 45 to 54 Years | 73,124 | 21.9% |
| 55 to 64 Years | 59,114 | 17.7% |
| 65 to 74 Years | 35,377 | 10.6% |
| 75 to 84 Years | 14,620 | 4.4% |
| 85 Years and Over | 4,657 | 1.4% |
| Total | 334,504 | 100.0% |
Housing Finances in Denton County
Median Income by Occupancy in Denton County
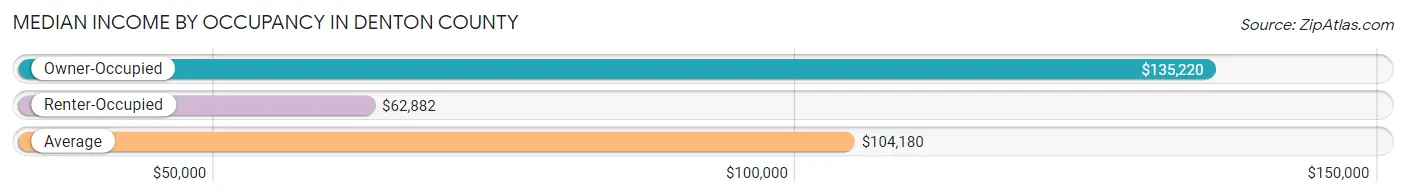
| Occupancy Type | # Households | Median Income |
| Owner-Occupied | 217,961 (65.2%) | $135,220 |
| Renter-Occupied | 116,543 (34.8%) | $62,882 |
| Average | 334,504 (100.0%) | $104,180 |
Occupancy by Householder Income Bracket in Denton County
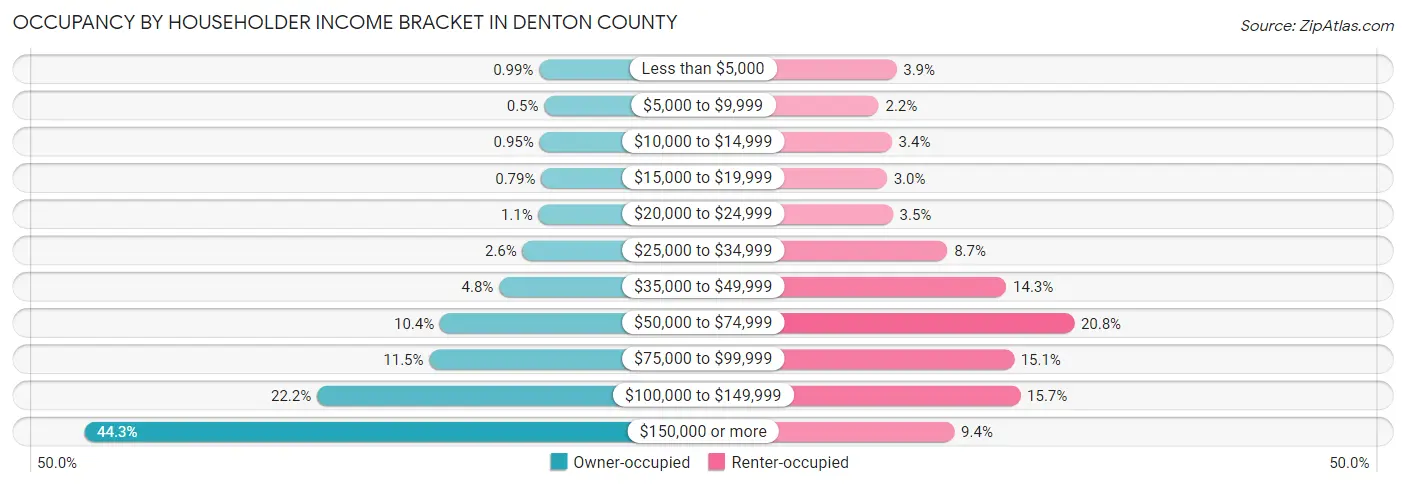
| Income Bracket | Owner-occupied | Renter-occupied |
| Less than $5,000 | 2,154 (1.0%) | 4,527 (3.9%) |
| $5,000 to $9,999 | 1,095 (0.5%) | 2,551 (2.2%) |
| $10,000 to $14,999 | 2,074 (0.9%) | 4,011 (3.4%) |
| $15,000 to $19,999 | 1,719 (0.8%) | 3,458 (3.0%) |
| $20,000 to $24,999 | 2,286 (1.1%) | 4,112 (3.5%) |
| $25,000 to $34,999 | 5,599 (2.6%) | 10,173 (8.7%) |
| $35,000 to $49,999 | 10,453 (4.8%) | 16,709 (14.3%) |
| $50,000 to $74,999 | 22,735 (10.4%) | 24,236 (20.8%) |
| $75,000 to $99,999 | 24,961 (11.5%) | 17,556 (15.1%) |
| $100,000 to $149,999 | 48,269 (22.2%) | 18,263 (15.7%) |
| $150,000 or more | 96,616 (44.3%) | 10,947 (9.4%) |
| Total | 217,961 (100.0%) | 116,543 (100.0%) |
Monthly Housing Cost Tiers in Denton County
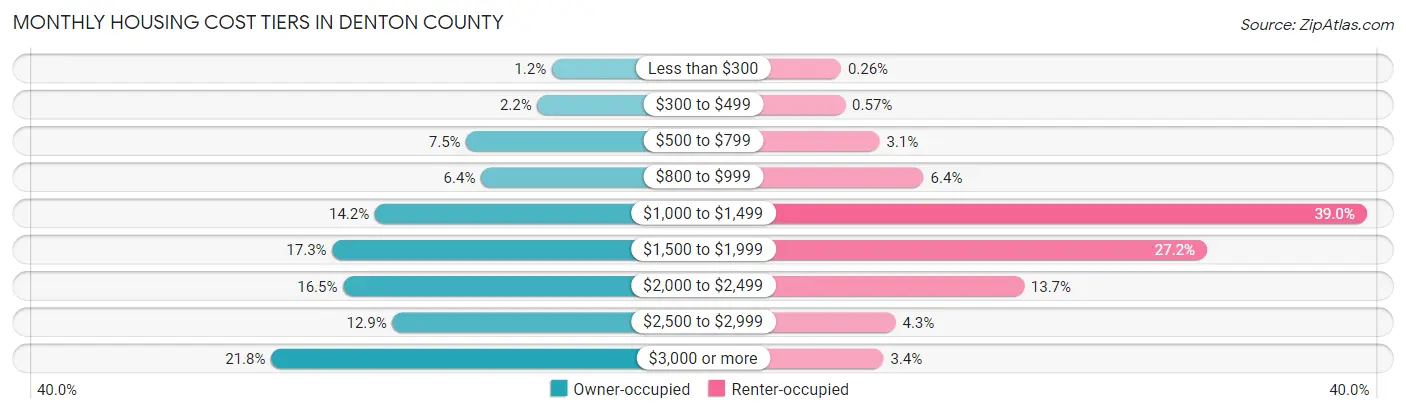
| Monthly Cost | Owner-occupied | Renter-occupied |
| Less than $300 | 2,535 (1.2%) | 307 (0.3%) |
| $300 to $499 | 4,849 (2.2%) | 662 (0.6%) |
| $500 to $799 | 16,267 (7.5%) | 3,617 (3.1%) |
| $800 to $999 | 13,875 (6.4%) | 7,402 (6.4%) |
| $1,000 to $1,499 | 30,936 (14.2%) | 45,432 (39.0%) |
| $1,500 to $1,999 | 37,772 (17.3%) | 31,716 (27.2%) |
| $2,000 to $2,499 | 36,022 (16.5%) | 16,007 (13.7%) |
| $2,500 to $2,999 | 28,127 (12.9%) | 4,993 (4.3%) |
| $3,000 or more | 47,578 (21.8%) | 3,950 (3.4%) |
| Total | 217,961 (100.0%) | 116,543 (100.0%) |
Physical Housing Characteristics in Denton County
Housing Structures in Denton County
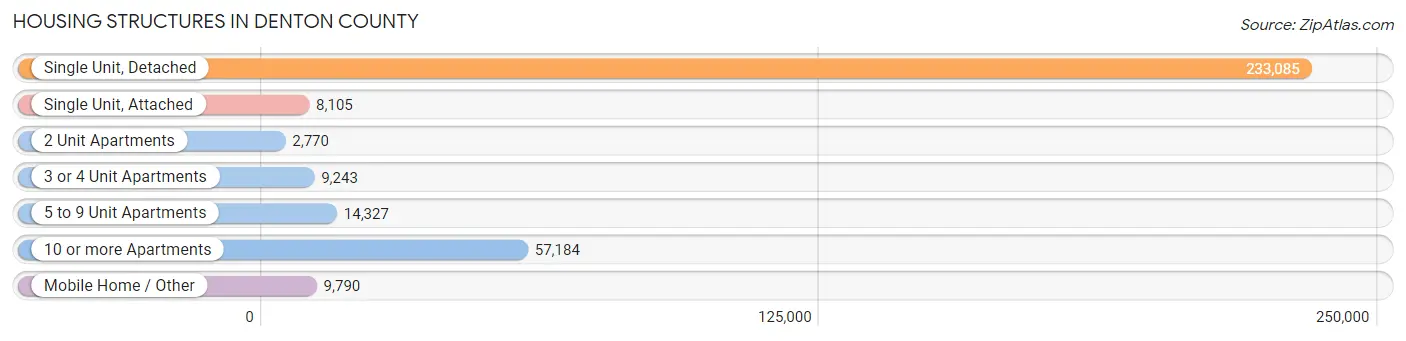
| Structure Type | # Housing Units | % Housing Units |
| Single Unit, Detached | 233,085 | 69.7% |
| Single Unit, Attached | 8,105 | 2.4% |
| 2 Unit Apartments | 2,770 | 0.8% |
| 3 or 4 Unit Apartments | 9,243 | 2.8% |
| 5 to 9 Unit Apartments | 14,327 | 4.3% |
| 10 or more Apartments | 57,184 | 17.1% |
| Mobile Home / Other | 9,790 | 2.9% |
| Total | 334,504 | 100.0% |
Housing Structures by Occupancy in Denton County
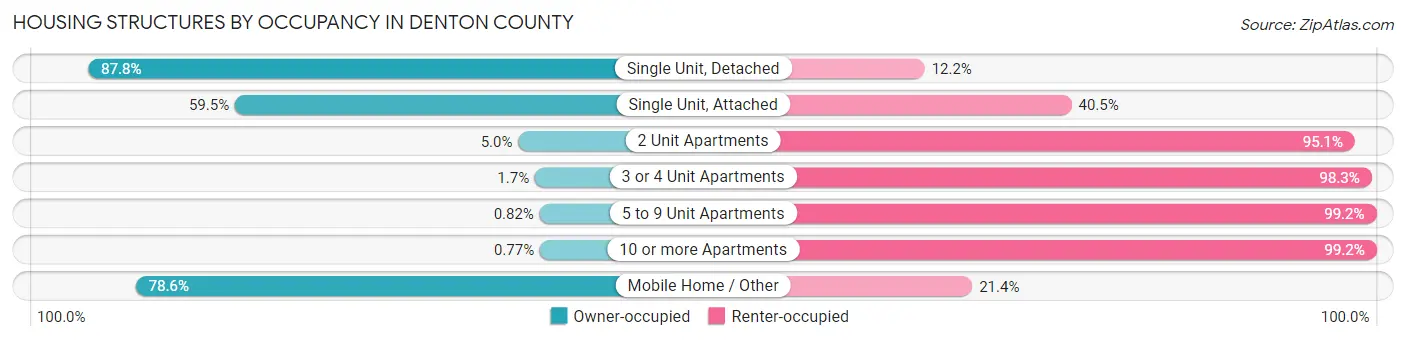
| Structure Type | Owner-occupied | Renter-occupied |
| Single Unit, Detached | 204,589 (87.8%) | 28,496 (12.2%) |
| Single Unit, Attached | 4,822 (59.5%) | 3,283 (40.5%) |
| 2 Unit Apartments | 137 (5.0%) | 2,633 (95.1%) |
| 3 or 4 Unit Apartments | 160 (1.7%) | 9,083 (98.3%) |
| 5 to 9 Unit Apartments | 117 (0.8%) | 14,210 (99.2%) |
| 10 or more Apartments | 439 (0.8%) | 56,745 (99.2%) |
| Mobile Home / Other | 7,697 (78.6%) | 2,093 (21.4%) |
| Total | 217,961 (65.2%) | 116,543 (34.8%) |
Housing Structures by Number of Rooms in Denton County
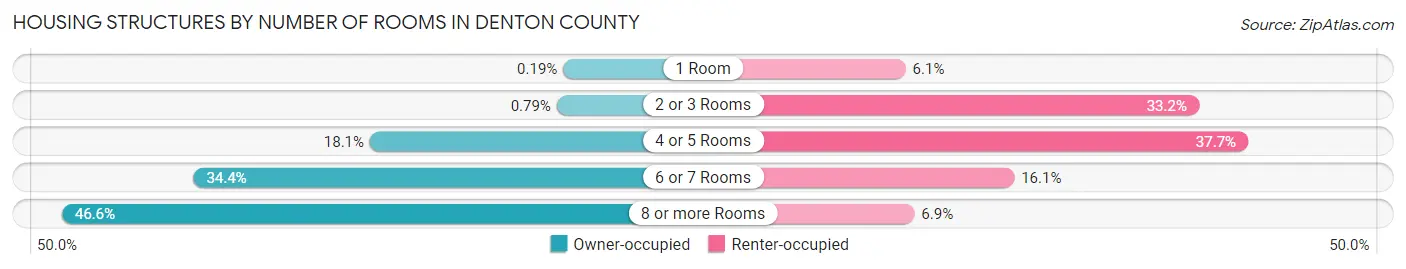
| Number of Rooms | Owner-occupied | Renter-occupied |
| 1 Room | 414 (0.2%) | 7,086 (6.1%) |
| 2 or 3 Rooms | 1,719 (0.8%) | 38,664 (33.2%) |
| 4 or 5 Rooms | 39,394 (18.1%) | 43,972 (37.7%) |
| 6 or 7 Rooms | 74,945 (34.4%) | 18,787 (16.1%) |
| 8 or more Rooms | 101,489 (46.6%) | 8,034 (6.9%) |
| Total | 217,961 (100.0%) | 116,543 (100.0%) |
Housing Structure by Heating Type in Denton County
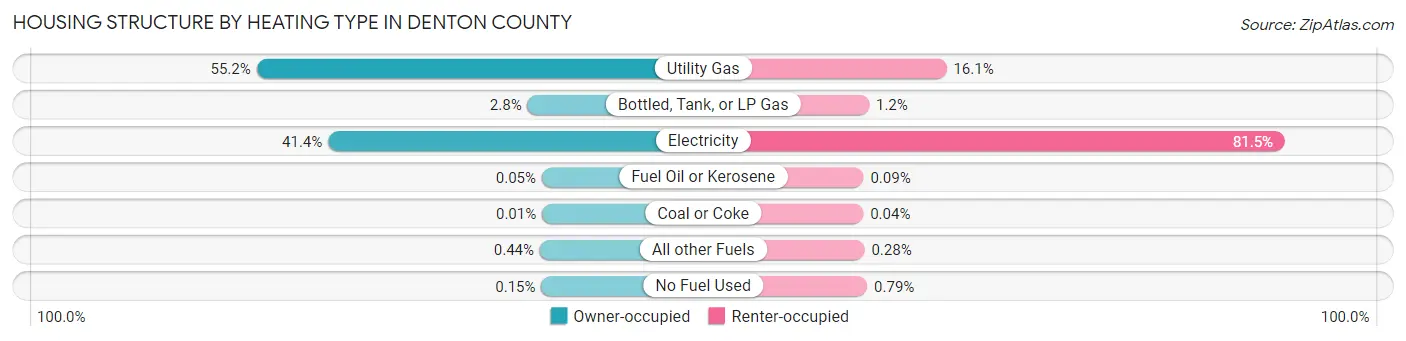
| Heating Type | Owner-occupied | Renter-occupied |
| Utility Gas | 120,268 (55.2%) | 18,786 (16.1%) |
| Bottled, Tank, or LP Gas | 6,151 (2.8%) | 1,351 (1.2%) |
| Electricity | 90,120 (41.3%) | 95,007 (81.5%) |
| Fuel Oil or Kerosene | 108 (0.1%) | 107 (0.1%) |
| Coal or Coke | 27 (0.0%) | 45 (0.0%) |
| All other Fuels | 956 (0.4%) | 326 (0.3%) |
| No Fuel Used | 331 (0.2%) | 921 (0.8%) |
| Total | 217,961 (100.0%) | 116,543 (100.0%) |
Household Vehicle Usage in Denton County
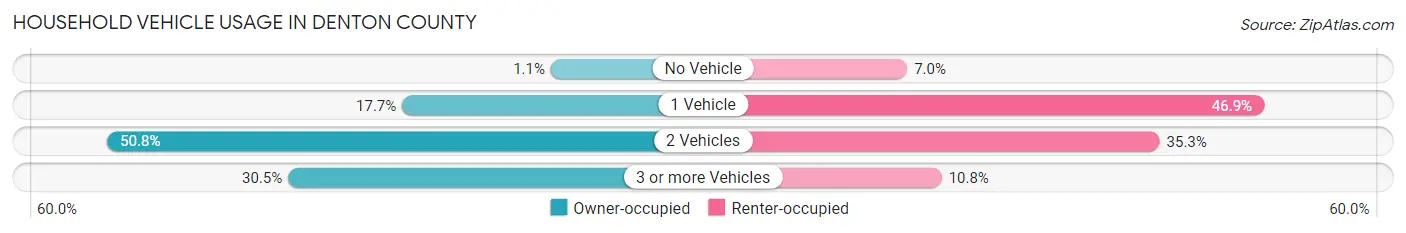
| Vehicles per Household | Owner-occupied | Renter-occupied |
| No Vehicle | 2,321 (1.1%) | 8,137 (7.0%) |
| 1 Vehicle | 38,595 (17.7%) | 54,698 (46.9%) |
| 2 Vehicles | 110,621 (50.7%) | 41,078 (35.2%) |
| 3 or more Vehicles | 66,424 (30.5%) | 12,630 (10.8%) |
| Total | 217,961 (100.0%) | 116,543 (100.0%) |
Real Estate & Mortgages in Denton County
Real Estate and Mortgage Overview in Denton County
| Characteristic | Without Mortgage | With Mortgage |
| Housing Units | 60,839 | 157,122 |
| Median Property Value | $350,400 | $386,300 |
| Median Household Income | $105,370 | $76,255 |
| Monthly Housing Costs | $941 | $46,740 |
| Real Estate Taxes | $5,610 | $2,384 |
Property Value by Mortgage Status in Denton County
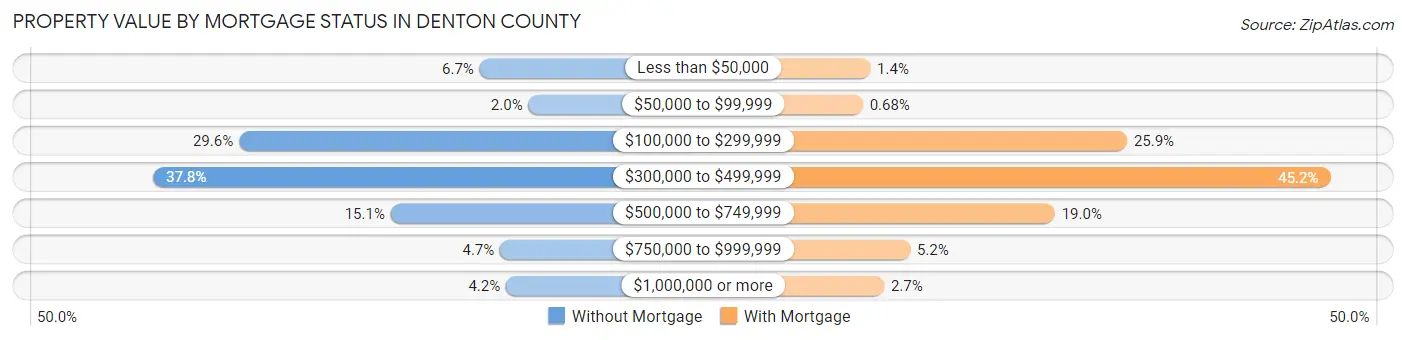
| Property Value | Without Mortgage | With Mortgage |
| Less than $50,000 | 4,054 (6.7%) | 2,191 (1.4%) |
| $50,000 to $99,999 | 1,220 (2.0%) | 1,061 (0.7%) |
| $100,000 to $299,999 | 17,999 (29.6%) | 40,621 (25.9%) |
| $300,000 to $499,999 | 22,974 (37.8%) | 71,029 (45.2%) |
| $500,000 to $749,999 | 9,204 (15.1%) | 29,800 (19.0%) |
| $750,000 to $999,999 | 2,866 (4.7%) | 8,160 (5.2%) |
| $1,000,000 or more | 2,522 (4.2%) | 4,260 (2.7%) |
| Total | 60,839 (100.0%) | 157,122 (100.0%) |
Household Income by Mortgage Status in Denton County
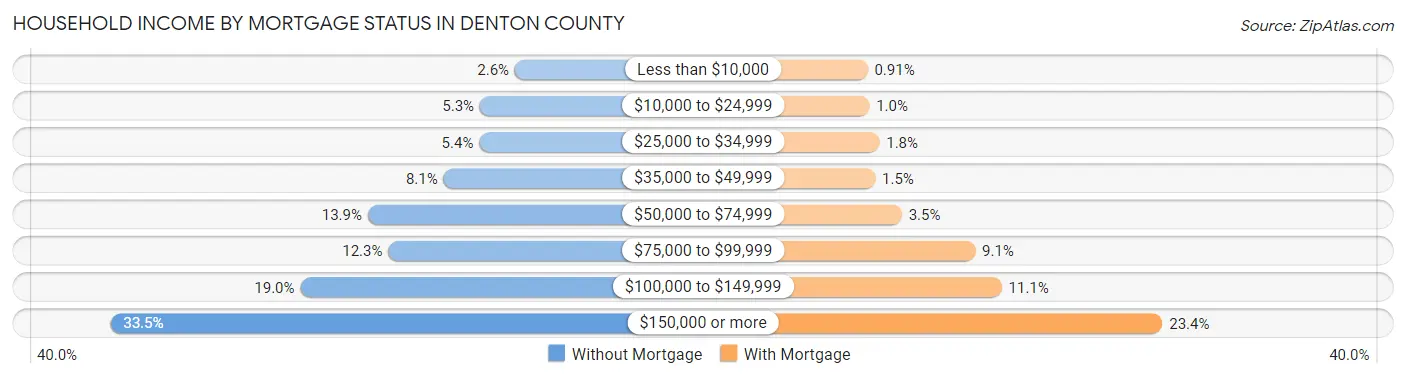
| Household Income | Without Mortgage | With Mortgage |
| Less than $10,000 | 1,608 (2.6%) | 1,427 (0.9%) |
| $10,000 to $24,999 | 3,231 (5.3%) | 1,641 (1.0%) |
| $25,000 to $34,999 | 3,260 (5.4%) | 2,848 (1.8%) |
| $35,000 to $49,999 | 4,915 (8.1%) | 2,339 (1.5%) |
| $50,000 to $74,999 | 8,428 (13.9%) | 5,538 (3.5%) |
| $75,000 to $99,999 | 7,480 (12.3%) | 14,307 (9.1%) |
| $100,000 to $149,999 | 11,556 (19.0%) | 17,481 (11.1%) |
| $150,000 or more | 20,361 (33.5%) | 36,713 (23.4%) |
| Total | 60,839 (100.0%) | 157,122 (100.0%) |
Property Value to Household Income Ratio in Denton County
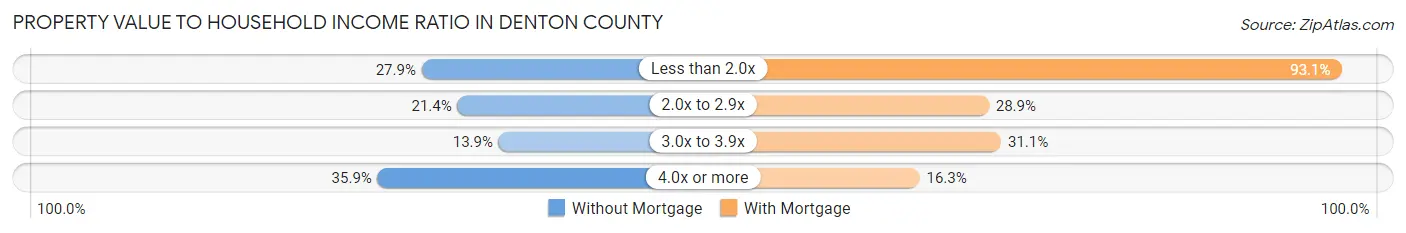
| Value-to-Income Ratio | Without Mortgage | With Mortgage |
| Less than 2.0x | 16,961 (27.9%) | 146,199 (93.0%) |
| 2.0x to 2.9x | 13,003 (21.4%) | 45,326 (28.8%) |
| 3.0x to 3.9x | 8,443 (13.9%) | 48,826 (31.1%) |
| 4.0x or more | 21,830 (35.9%) | 25,581 (16.3%) |
| Total | 60,839 (100.0%) | 157,122 (100.0%) |
Real Estate Taxes by Mortgage Status in Denton County
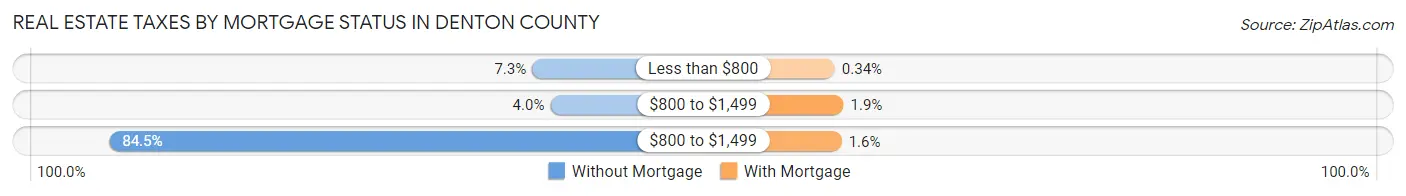
| Property Taxes | Without Mortgage | With Mortgage |
| Less than $800 | 4,446 (7.3%) | 542 (0.3%) |
| $800 to $1,499 | 2,427 (4.0%) | 3,028 (1.9%) |
| $800 to $1,499 | 51,421 (84.5%) | 2,504 (1.6%) |
| Total | 60,839 (100.0%) | 157,122 (100.0%) |
Health & Disability in Denton County
Health Insurance Coverage by Age in Denton County
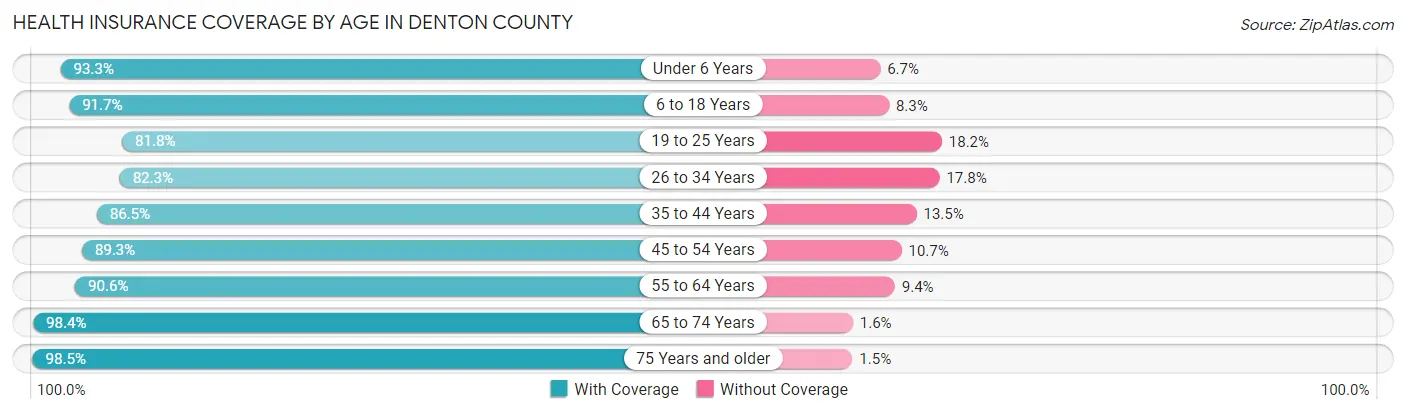
| Age Bracket | With Coverage | Without Coverage |
| Under 6 Years | 60,602 (93.3%) | 4,349 (6.7%) |
| 6 to 18 Years | 152,081 (91.7%) | 13,811 (8.3%) |
| 19 to 25 Years | 70,083 (81.8%) | 15,589 (18.2%) |
| 26 to 34 Years | 97,606 (82.3%) | 21,068 (17.7%) |
| 35 to 44 Years | 122,473 (86.5%) | 19,064 (13.5%) |
| 45 to 54 Years | 117,793 (89.3%) | 14,079 (10.7%) |
| 55 to 64 Years | 94,782 (90.6%) | 9,872 (9.4%) |
| 65 to 74 Years | 61,824 (98.4%) | 1,003 (1.6%) |
| 75 Years and older | 34,689 (98.5%) | 532 (1.5%) |
| Total | 811,933 (89.1%) | 99,367 (10.9%) |
Health Insurance Coverage by Citizenship Status in Denton County
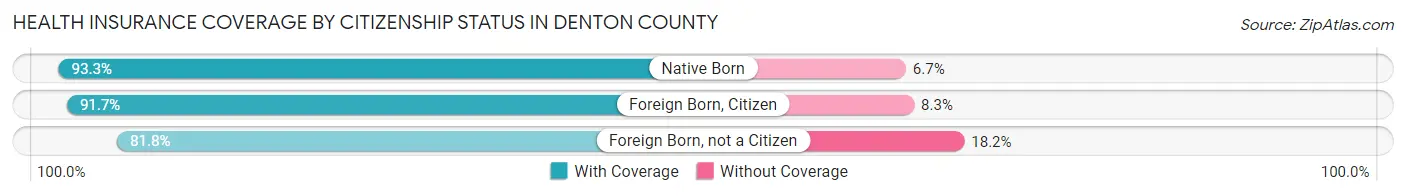
| Citizenship Status | With Coverage | Without Coverage |
| Native Born | 60,602 (93.3%) | 4,349 (6.7%) |
| Foreign Born, Citizen | 152,081 (91.7%) | 13,811 (8.3%) |
| Foreign Born, not a Citizen | 70,083 (81.8%) | 15,589 (18.2%) |
Health Insurance Coverage by Household Income in Denton County
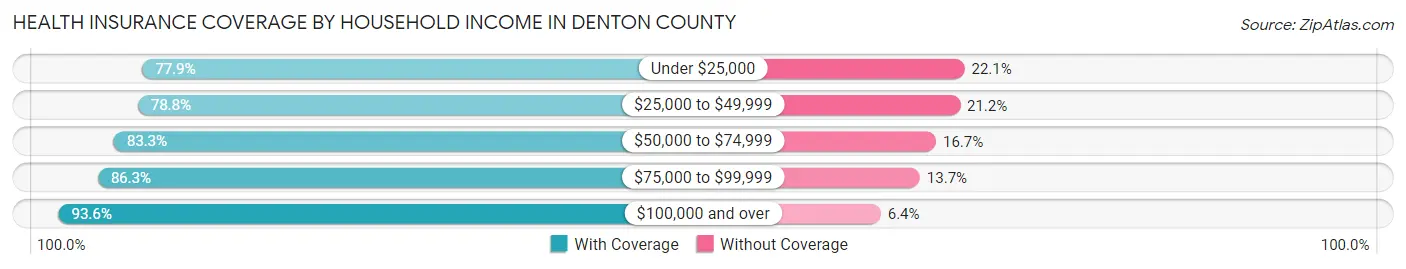
| Household Income | With Coverage | Without Coverage |
| Under $25,000 | 41,383 (77.9%) | 11,714 (22.1%) |
| $25,000 to $49,999 | 68,365 (78.8%) | 18,409 (21.2%) |
| $50,000 to $74,999 | 90,621 (83.3%) | 18,189 (16.7%) |
| $75,000 to $99,999 | 96,349 (86.3%) | 15,298 (13.7%) |
| $100,000 and over | 508,185 (93.6%) | 34,550 (6.4%) |
Public vs Private Health Insurance Coverage by Age in Denton County
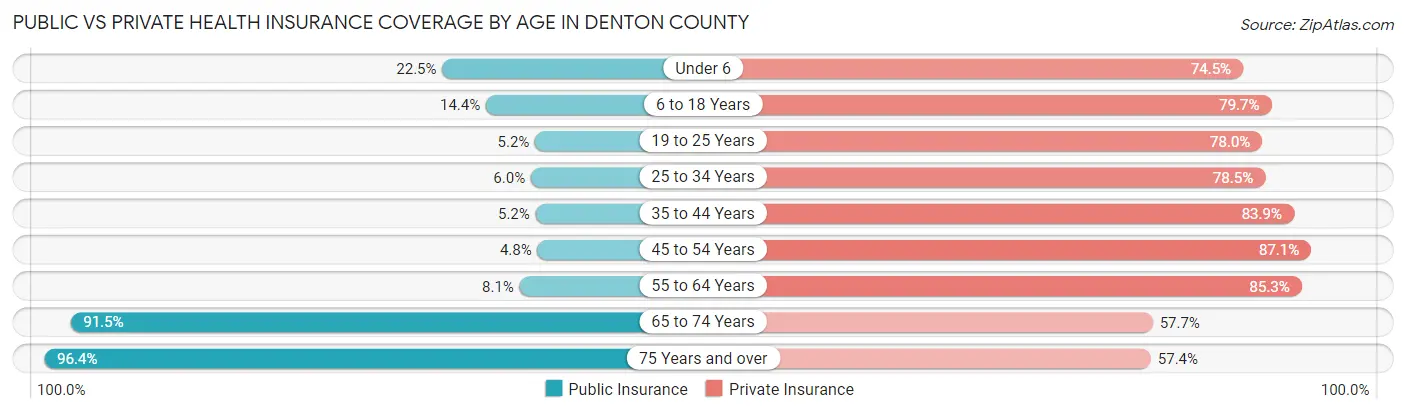
| Age Bracket | Public Insurance | Private Insurance |
| Under 6 | 14,587 (22.5%) | 48,358 (74.5%) |
| 6 to 18 Years | 23,813 (14.3%) | 132,228 (79.7%) |
| 19 to 25 Years | 4,478 (5.2%) | 66,845 (78.0%) |
| 25 to 34 Years | 7,138 (6.0%) | 93,203 (78.5%) |
| 35 to 44 Years | 7,287 (5.1%) | 118,723 (83.9%) |
| 45 to 54 Years | 6,313 (4.8%) | 114,855 (87.1%) |
| 55 to 64 Years | 8,486 (8.1%) | 89,315 (85.3%) |
| 65 to 74 Years | 57,496 (91.5%) | 36,258 (57.7%) |
| 75 Years and over | 33,948 (96.4%) | 20,208 (57.4%) |
| Total | 163,546 (17.9%) | 719,993 (79.0%) |
Disability Status by Sex by Age in Denton County
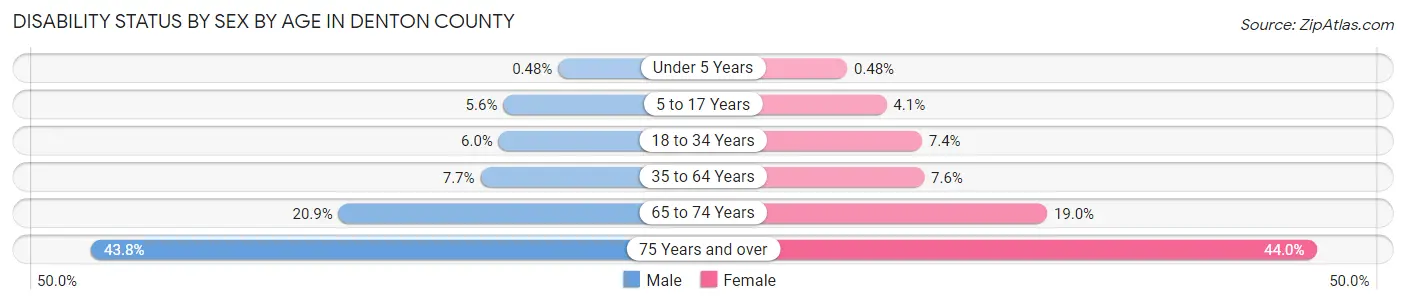
| Age Bracket | Male | Female |
| Under 5 Years | 132 (0.5%) | 125 (0.5%) |
| 5 to 17 Years | 4,697 (5.6%) | 3,337 (4.1%) |
| 18 to 34 Years | 6,444 (6.0%) | 8,120 (7.4%) |
| 35 to 64 Years | 14,522 (7.7%) | 14,473 (7.6%) |
| 65 to 74 Years | 6,078 (20.9%) | 6,416 (19.0%) |
| 75 Years and over | 6,518 (43.8%) | 8,959 (44.0%) |
Disability Class by Sex by Age in Denton County
Disability Class: Hearing Difficulty
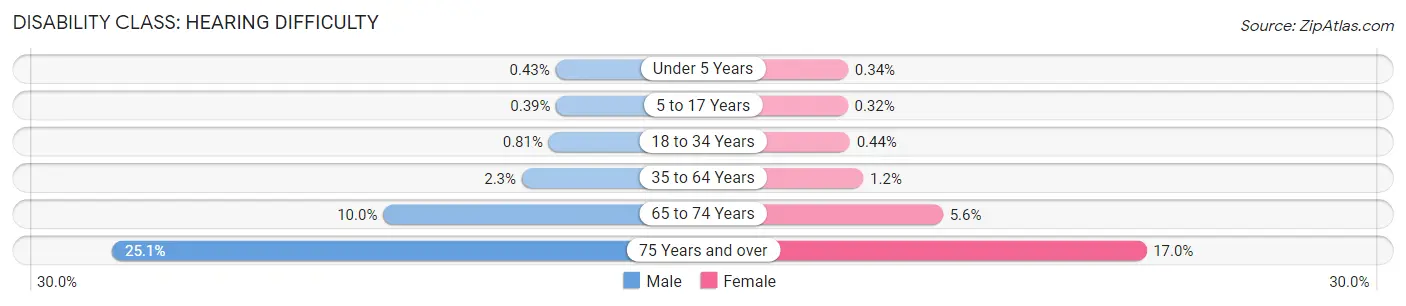
| Age Bracket | Male | Female |
| Under 5 Years | 117 (0.4%) | 89 (0.3%) |
| 5 to 17 Years | 325 (0.4%) | 257 (0.3%) |
| 18 to 34 Years | 869 (0.8%) | 479 (0.4%) |
| 35 to 64 Years | 4,360 (2.3%) | 2,251 (1.2%) |
| 65 to 74 Years | 2,923 (10.0%) | 1,894 (5.6%) |
| 75 Years and over | 3,738 (25.1%) | 3,448 (17.0%) |
Disability Class: Vision Difficulty
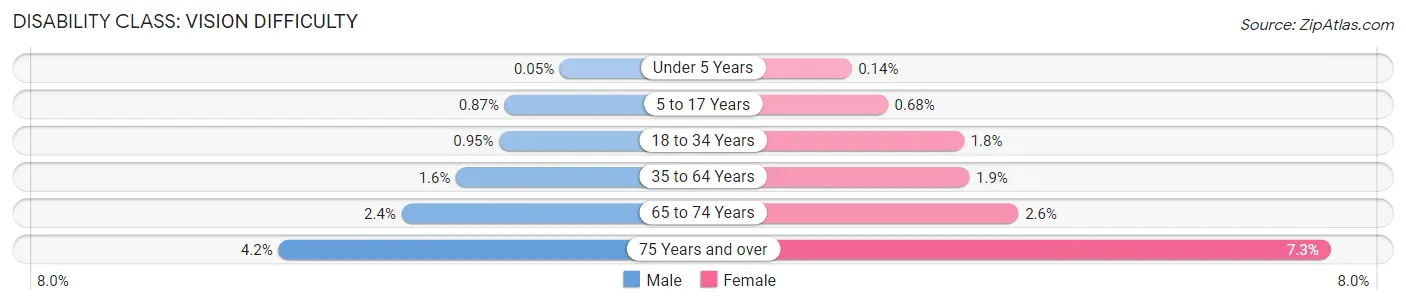
| Age Bracket | Male | Female |
| Under 5 Years | 15 (0.1%) | 36 (0.1%) |
| 5 to 17 Years | 733 (0.9%) | 549 (0.7%) |
| 18 to 34 Years | 1,021 (0.9%) | 1,979 (1.8%) |
| 35 to 64 Years | 3,007 (1.6%) | 3,576 (1.9%) |
| 65 to 74 Years | 700 (2.4%) | 883 (2.6%) |
| 75 Years and over | 629 (4.2%) | 1,477 (7.3%) |
Disability Class: Cognitive Difficulty
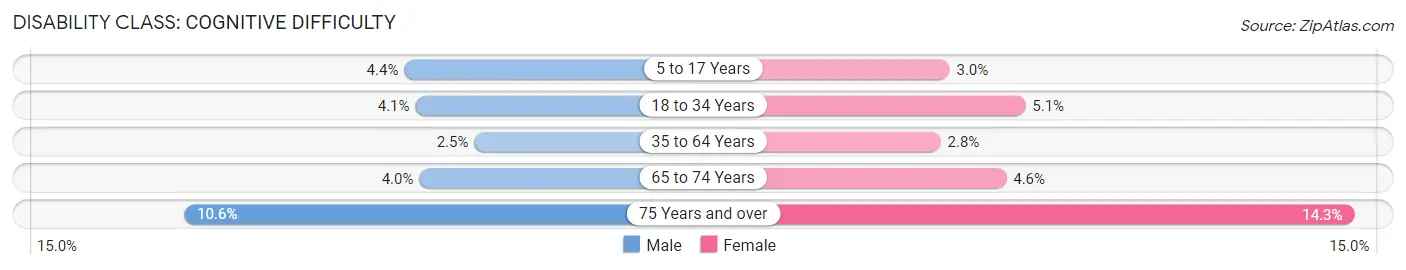
| Age Bracket | Male | Female |
| 5 to 17 Years | 3,730 (4.4%) | 2,421 (3.0%) |
| 18 to 34 Years | 4,429 (4.1%) | 5,583 (5.1%) |
| 35 to 64 Years | 4,669 (2.5%) | 5,209 (2.8%) |
| 65 to 74 Years | 1,168 (4.0%) | 1,542 (4.6%) |
| 75 Years and over | 1,571 (10.6%) | 2,904 (14.3%) |
Disability Class: Ambulatory Difficulty
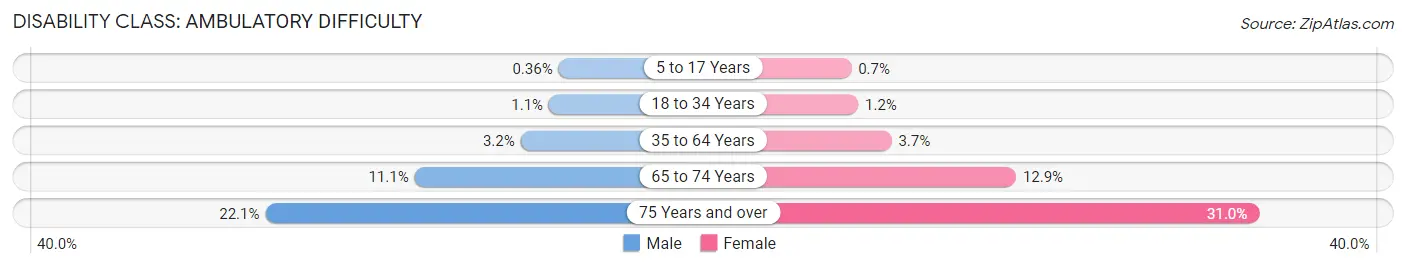
| Age Bracket | Male | Female |
| 5 to 17 Years | 303 (0.4%) | 568 (0.7%) |
| 18 to 34 Years | 1,151 (1.1%) | 1,323 (1.2%) |
| 35 to 64 Years | 5,997 (3.2%) | 6,984 (3.7%) |
| 65 to 74 Years | 3,221 (11.1%) | 4,356 (12.9%) |
| 75 Years and over | 3,292 (22.1%) | 6,303 (31.0%) |
Disability Class: Self-Care Difficulty
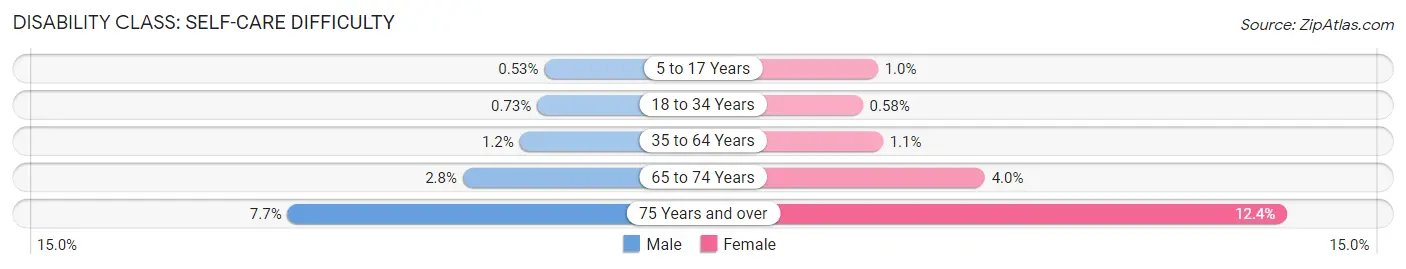
| Age Bracket | Male | Female |
| 5 to 17 Years | 446 (0.5%) | 810 (1.0%) |
| 18 to 34 Years | 781 (0.7%) | 638 (0.6%) |
| 35 to 64 Years | 2,298 (1.2%) | 2,156 (1.1%) |
| 65 to 74 Years | 816 (2.8%) | 1,342 (4.0%) |
| 75 Years and over | 1,143 (7.7%) | 2,523 (12.4%) |
Technology Access in Denton County
Computing Device Access in Denton County
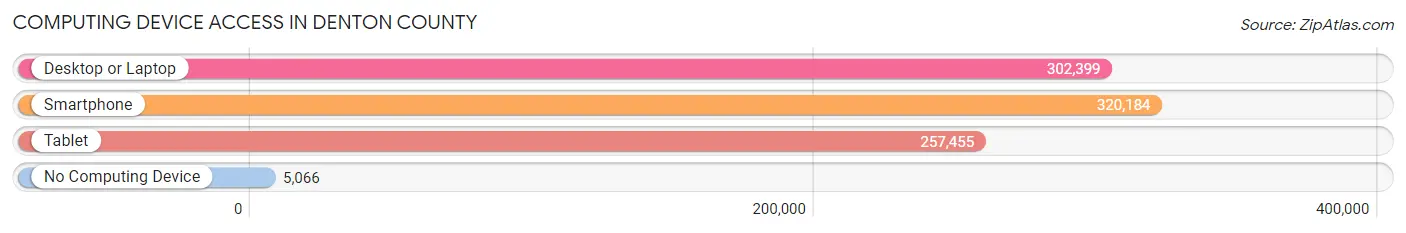
| Device Type | # Households | % Households |
| Desktop or Laptop | 302,399 | 90.4% |
| Smartphone | 320,184 | 95.7% |
| Tablet | 257,455 | 77.0% |
| No Computing Device | 5,066 | 1.5% |
| Total | 334,504 | 100.0% |
Internet Access in Denton County
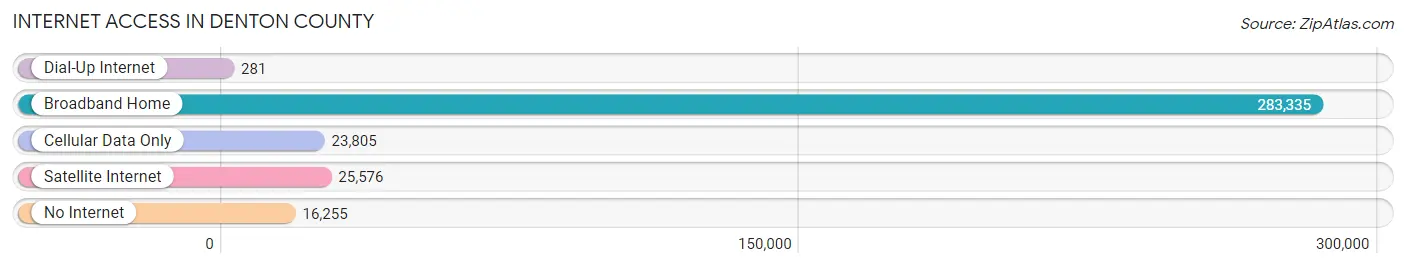
| Internet Type | # Households | % Households |
| Dial-Up Internet | 281 | 0.1% |
| Broadband Home | 283,335 | 84.7% |
| Cellular Data Only | 23,805 | 7.1% |
| Satellite Internet | 25,576 | 7.6% |
| No Internet | 16,255 | 4.9% |
| Total | 334,504 | 100.0% |
Denton County Summary
Denton County, Texas is located in the north-central part of the state, just north of the Dallas-Fort Worth Metroplex. It is bordered by Collin, Cooke, Grayson, and Wise counties. The county seat is Denton, and the county is home to over 859,000 people.
History
Denton County was established in 1846, and was named after John B. Denton, a soldier and lawyer who died in the Battle of the Alamo. The county was originally part of Fannin County, and was later divided into Denton and Cooke counties. The first settlers in the area were mostly farmers and ranchers, and the county was largely rural until the 1950s.
In the 1950s, the population of Denton County began to grow rapidly due to the expansion of the Dallas-Fort Worth Metroplex. The county experienced a population boom in the 1970s and 1980s, and by 2000, the population had grown to over 859,000.
Geography
Denton County covers an area of 945 square miles, and is located in the north-central part of the state. The county is bordered by Collin, Cooke, Grayson, and Wise counties. The terrain is mostly flat, with some rolling hills in the western part of the county. The county is home to several lakes, including Lake Lewisville, Lake Ray Roberts, and Lake Ray Hubbard.
The climate in Denton County is generally mild, with hot summers and cool winters. The average annual temperature is around 65°F, and the average annual precipitation is around 37 inches.
Economy
Denton County has a diverse economy, with a mix of manufacturing, technology, and service industries. The county is home to several large companies, including Texas Instruments, Frito-Lay, and Dr Pepper Snapple Group. The county is also home to several universities, including the University of North Texas, Texas Woman’s University, and Texas A&M University-Commerce.
The county’s largest employers are the University of North Texas, Texas Woman’s University, and the Denton Independent School District. The county’s unemployment rate is around 3.5%, which is lower than the national average.
Demographics
As of 2020, Denton County had a population of 859,000. The population is mostly white (77.3%), followed by Hispanic (14.2%), African American (4.7%), and Asian (2.7%). The median household income is around $68,000, and the median home value is around $220,000.
The county is home to several cities, including Denton (the county seat), Lewisville, Flower Mound, and Highland Village. The county is also home to several unincorporated communities, including Argyle, Bartonville, and Copper Canyon.
Conclusion
Denton County, Texas is located in the north-central part of the state, just north of the Dallas-Fort Worth Metroplex. It was established in 1846, and is home to over 859,000 people. The county has a diverse economy, with a mix of manufacturing, technology, and service industries. The population is mostly white, followed by Hispanic, African American, and Asian. The median household income is around $68,000, and the median home value is around $220,000. The county is home to several cities, including Denton (the county seat), Lewisville, Flower Mound, and Highland Village.
Common Questions
What is Per Capita Income in Denton County?
Per Capita income in Denton County is $50,470.
What is the Median Family Income in Denton County?
Median Family Income in Denton County is $126,543.
What is the Median Household income in Denton County?
Median Household Income in Denton County is $104,180.
What is Income or Wage Gap in Denton County?
Income or Wage Gap in Denton County is 34.2%.
Women in Denton County earn 65.8 cents for every dollar earned by a man.
What is Family Income Deficit in Denton County?
Family Income Deficit in Denton County is $12,446.
Families that are below poverty line in Denton County earn $12,446 less on average than the poverty threshold level.
What is Inequality or Gini Index in Denton County?
Inequality or Gini Index in Denton County is 0.43.
What is the Total Population of Denton County?
Total Population of Denton County is 914,870.
What is the Total Male Population of Denton County?
Total Male Population of Denton County is 453,677.
What is the Total Female Population of Denton County?
Total Female Population of Denton County is 461,193.
What is the Ratio of Males per 100 Females in Denton County?
There are 98.37 Males per 100 Females in Denton County.
What is the Ratio of Females per 100 Males in Denton County?
There are 101.66 Females per 100 Males in Denton County.
What is the Median Population Age in Denton County?
Median Population Age in Denton County is 36.5 Years.
What is the Average Family Size in Denton County
Average Family Size in Denton County is 3.2 People.
What is the Average Household Size in Denton County
Average Household Size in Denton County is 2.7 People.
How Large is the Labor Force in Denton County?
There are 522,892 People in the Labor Forcein in Denton County.
What is the Percentage of People in the Labor Force in Denton County?
72.3% of People are in the Labor Force in Denton County.
What is the Unemployment Rate in Denton County?
Unemployment Rate in Denton County is 4.0%.