Brazoria County, TX Map & Demographics
Brazoria County Map
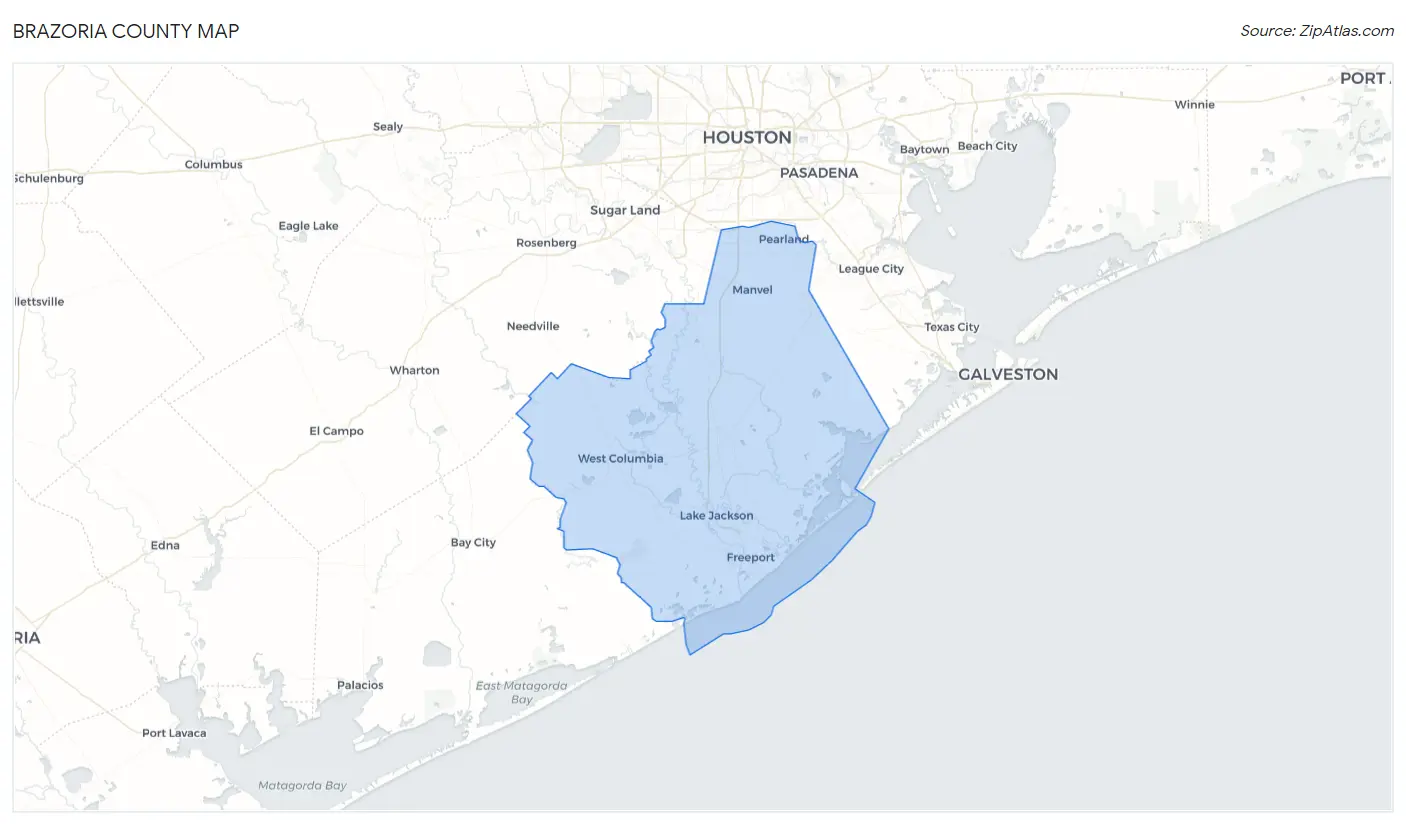
Brazoria County Overview
$39,891
PER CAPITA INCOME
$106,243
AVG FAMILY INCOME
$91,972
AVG HOUSEHOLD INCOME
34.9%
WAGE / INCOME GAP [ % ]
65.1¢/ $1
WAGE / INCOME GAP [ $ ]
$10,379
FAMILY INCOME DEFICIT
0.42
INEQUALITY / GINI INDEX
374,600
TOTAL POPULATION
190,008
MALE POPULATION
184,592
FEMALE POPULATION
102.93
MALES / 100 FEMALES
97.15
FEMALES / 100 MALES
36.3
MEDIAN AGE
3.4
AVG FAMILY SIZE
2.9
AVG HOUSEHOLD SIZE
183,378
LABOR FORCE [ PEOPLE ]
63.4%
PERCENT IN LABOR FORCE
4.6%
UNEMPLOYMENT RATE
Income in Brazoria County
Income Overview in Brazoria County
Per Capita Income in Brazoria County is $39,891, while median incomes of families and households are $106,243 and $91,972 respectively.
| Characteristic | Number | Measure |
| Per Capita Income | 374,600 | $39,891 |
| Median Family Income | 93,439 | $106,243 |
| Mean Family Income | 93,439 | $129,693 |
| Median Household Income | 127,264 | $91,972 |
| Mean Household Income | 127,264 | $115,494 |
| Income Deficit | 93,439 | $10,379 |
| Wage / Income Gap (%) | 374,600 | 34.93% |
| Wage / Income Gap ($) | 374,600 | 65.07¢ per $1 |
| Gini / Inequality Index | 374,600 | 0.42 |
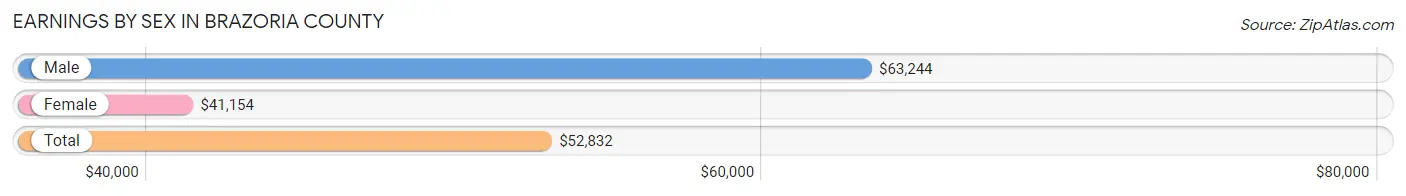
Earnings by Sex in Brazoria County
Average Earnings in Brazoria County are $52,832, $63,244 for men and $41,154 for women, a difference of 34.9%.
| Sex | Number | Average Earnings |
| Male | 102,173 (54.2%) | $63,244 |
| Female | 86,395 (45.8%) | $41,154 |
| Total | 188,568 (100.0%) | $52,832 |
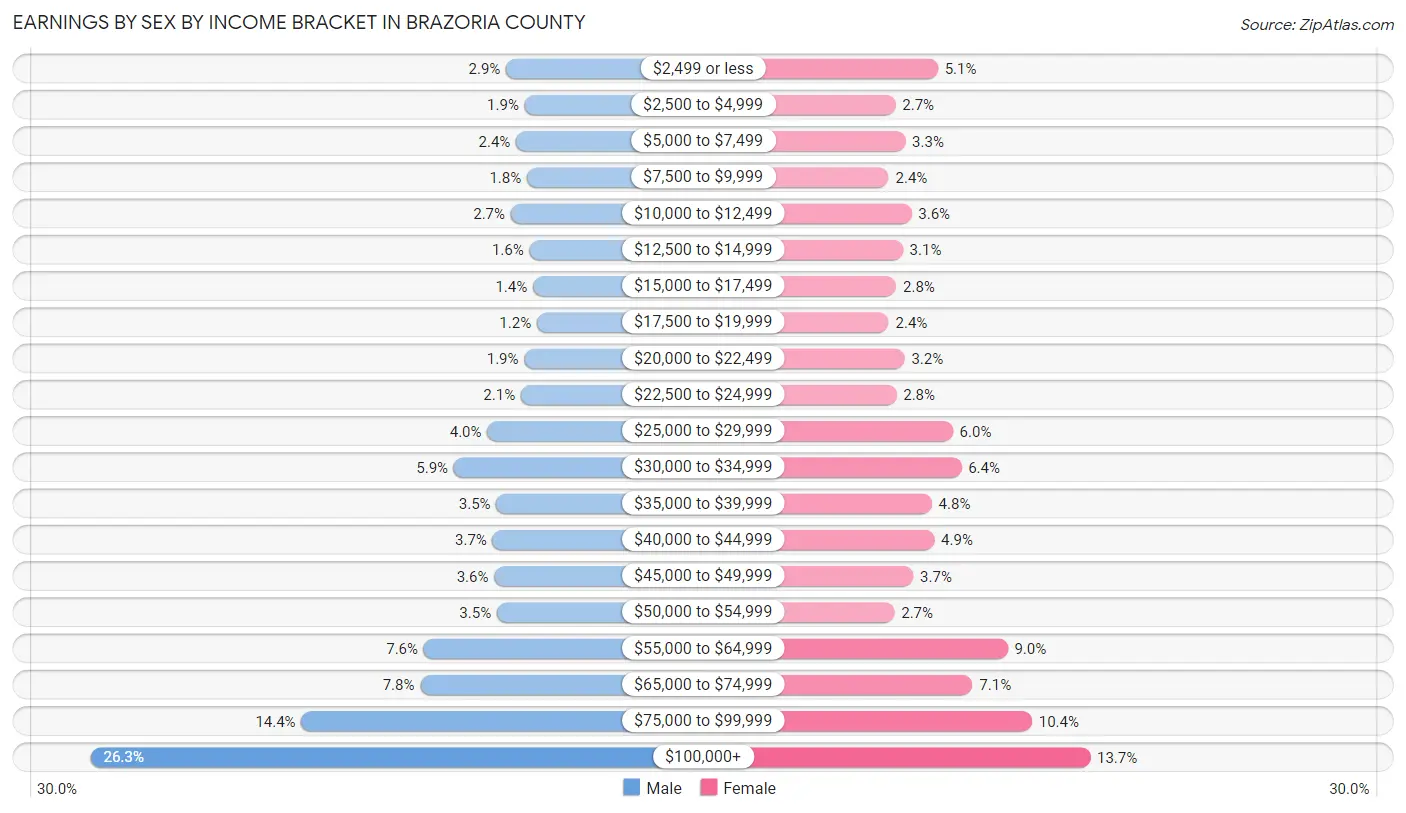
Earnings by Sex by Income Bracket in Brazoria County
The most common earnings brackets in Brazoria County are $100,000+ for men (26,863 | 26.3%) and $100,000+ for women (11,807 | 13.7%).
| Income | Male | Female |
| $2,499 or less | 2,992 (2.9%) | 4,411 (5.1%) |
| $2,500 to $4,999 | 1,934 (1.9%) | 2,361 (2.7%) |
| $5,000 to $7,499 | 2,420 (2.4%) | 2,838 (3.3%) |
| $7,500 to $9,999 | 1,794 (1.8%) | 2,028 (2.4%) |
| $10,000 to $12,499 | 2,726 (2.7%) | 3,137 (3.6%) |
| $12,500 to $14,999 | 1,654 (1.6%) | 2,717 (3.1%) |
| $15,000 to $17,499 | 1,453 (1.4%) | 2,396 (2.8%) |
| $17,500 to $19,999 | 1,227 (1.2%) | 2,034 (2.4%) |
| $20,000 to $22,499 | 1,947 (1.9%) | 2,801 (3.2%) |
| $22,500 to $24,999 | 2,150 (2.1%) | 2,402 (2.8%) |
| $25,000 to $29,999 | 4,075 (4.0%) | 5,139 (5.9%) |
| $30,000 to $34,999 | 6,000 (5.9%) | 5,552 (6.4%) |
| $35,000 to $39,999 | 3,558 (3.5%) | 4,121 (4.8%) |
| $40,000 to $44,999 | 3,773 (3.7%) | 4,240 (4.9%) |
| $45,000 to $49,999 | 3,678 (3.6%) | 3,226 (3.7%) |
| $50,000 to $54,999 | 3,521 (3.5%) | 2,303 (2.7%) |
| $55,000 to $64,999 | 7,720 (7.6%) | 7,802 (9.0%) |
| $65,000 to $74,999 | 7,931 (7.8%) | 6,096 (7.1%) |
| $75,000 to $99,999 | 14,757 (14.4%) | 8,984 (10.4%) |
| $100,000+ | 26,863 (26.3%) | 11,807 (13.7%) |
| Total | 102,173 (100.0%) | 86,395 (100.0%) |
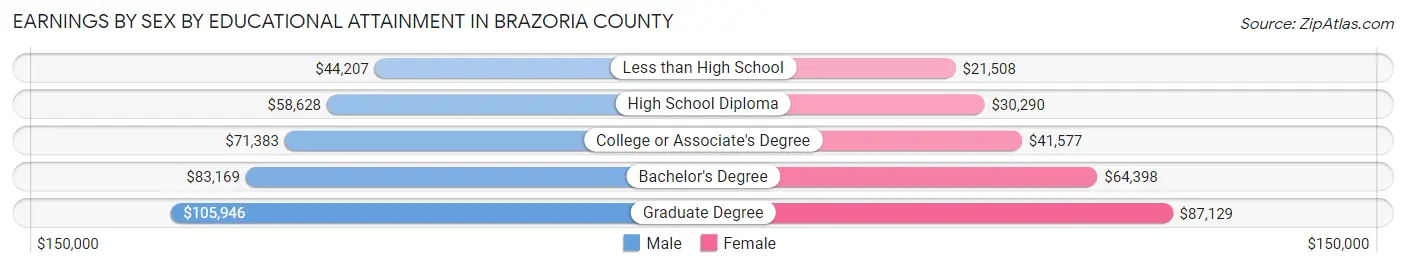
Earnings by Sex by Educational Attainment in Brazoria County
Average earnings in Brazoria County are $69,985 for men and $47,460 for women, a difference of 32.2%. Men with an educational attainment of graduate degree enjoy the highest average annual earnings of $105,946, while those with less than high school education earn the least with $44,207. Women with an educational attainment of graduate degree earn the most with the average annual earnings of $87,129, while those with less than high school education have the smallest earnings of $21,508.
| Educational Attainment | Male Income | Female Income |
| Less than High School | $44,207 | $21,508 |
| High School Diploma | $58,628 | $30,290 |
| College or Associate's Degree | $71,383 | $41,577 |
| Bachelor's Degree | $83,169 | $64,398 |
| Graduate Degree | $105,946 | $87,129 |
| Total | $69,985 | $47,460 |
Family Income in Brazoria County
Family Income Brackets in Brazoria County
According to the Brazoria County family income data, there are 20,930 families falling into the $100,000 to $149,999 income range, which is the most common income bracket and makes up 22.4% of all families. Conversely, the $10,000 to $14,999 income bracket is the least frequent group with only 1,121 families (1.2%) belonging to this category.
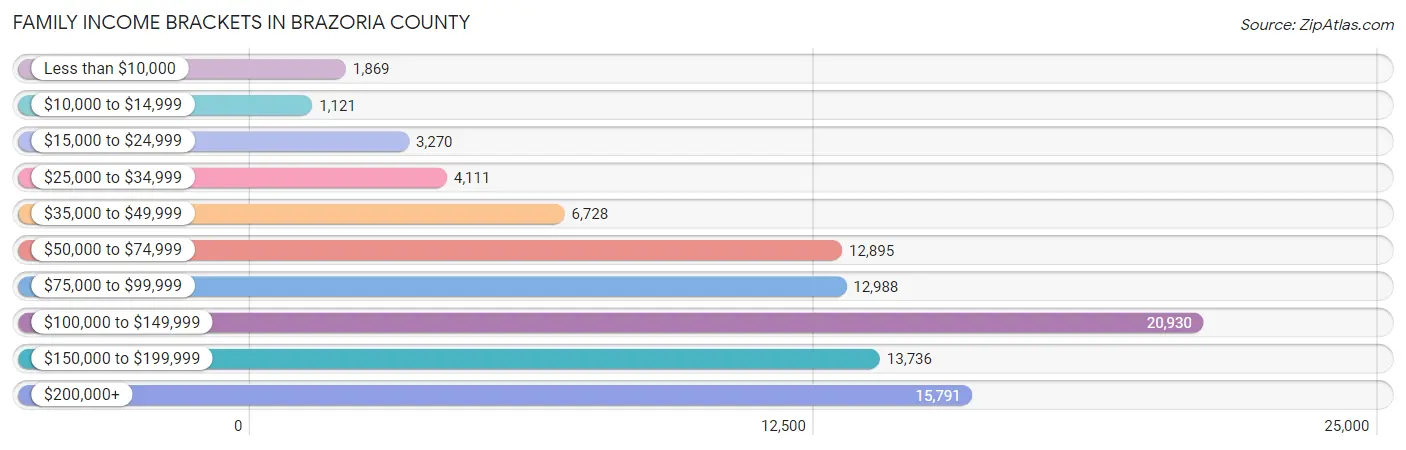
| Income Bracket | # Families | % Families |
| Less than $10,000 | 1,869 | 2.0% |
| $10,000 to $14,999 | 1,121 | 1.2% |
| $15,000 to $24,999 | 3,270 | 3.5% |
| $25,000 to $34,999 | 4,111 | 4.4% |
| $35,000 to $49,999 | 6,728 | 7.2% |
| $50,000 to $74,999 | 12,895 | 13.8% |
| $75,000 to $99,999 | 12,988 | 13.9% |
| $100,000 to $149,999 | 20,930 | 22.4% |
| $150,000 to $199,999 | 13,736 | 14.7% |
| $200,000+ | 15,791 | 16.9% |
Family Income by Famaliy Size in Brazoria County
7+ person families (1,392 | 1.5%) account for the highest median family income in Brazoria County with $153,522 per family, while 2-person families (35,871 | 38.4%) have the highest median income of $44,068 per family member.
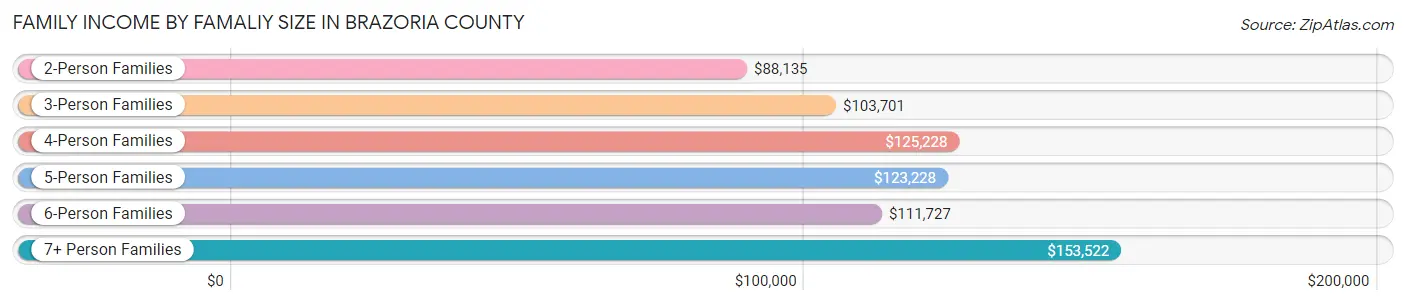
| Income Bracket | # Families | Median Income |
| 2-Person Families | 35,871 (38.4%) | $88,135 |
| 3-Person Families | 21,838 (23.4%) | $103,701 |
| 4-Person Families | 21,481 (23.0%) | $125,228 |
| 5-Person Families | 9,193 (9.8%) | $123,228 |
| 6-Person Families | 3,664 (3.9%) | $111,727 |
| 7+ Person Families | 1,392 (1.5%) | $153,522 |
| Total | 93,439 (100.0%) | $106,243 |
Family Income by Number of Earners in Brazoria County
The median family income in Brazoria County is $106,243, with families comprising 3+ earners (10,765) having the highest median family income of $164,456, while families with no earners (9,952) have the lowest median family income of $52,901, accounting for 11.5% and 10.6% of families, respectively.
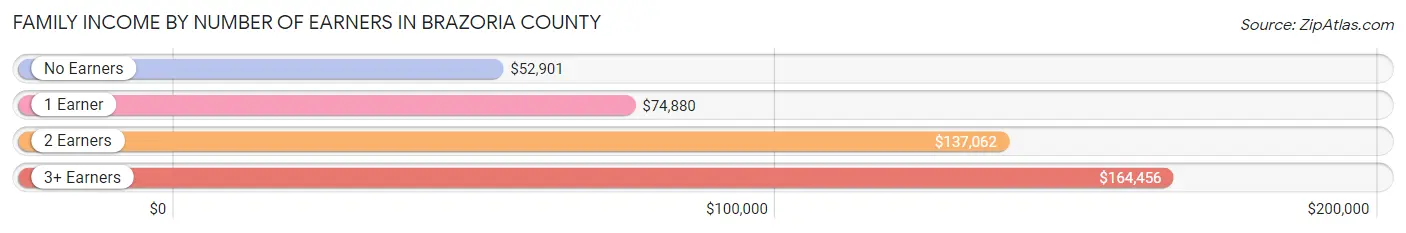
| Number of Earners | # Families | Median Income |
| No Earners | 9,952 (10.6%) | $52,901 |
| 1 Earner | 31,782 (34.0%) | $74,880 |
| 2 Earners | 40,940 (43.8%) | $137,062 |
| 3+ Earners | 10,765 (11.5%) | $164,456 |
| Total | 93,439 (100.0%) | $106,243 |
Household Income in Brazoria County
Household Income Brackets in Brazoria County
With 26,089 households falling in the category, the $100,000 to $149,999 income range is the most frequent in Brazoria County, accounting for 20.5% of all households. In contrast, only 2,673 households (2.1%) fall into the $10,000 to $14,999 income bracket, making it the least populous group.
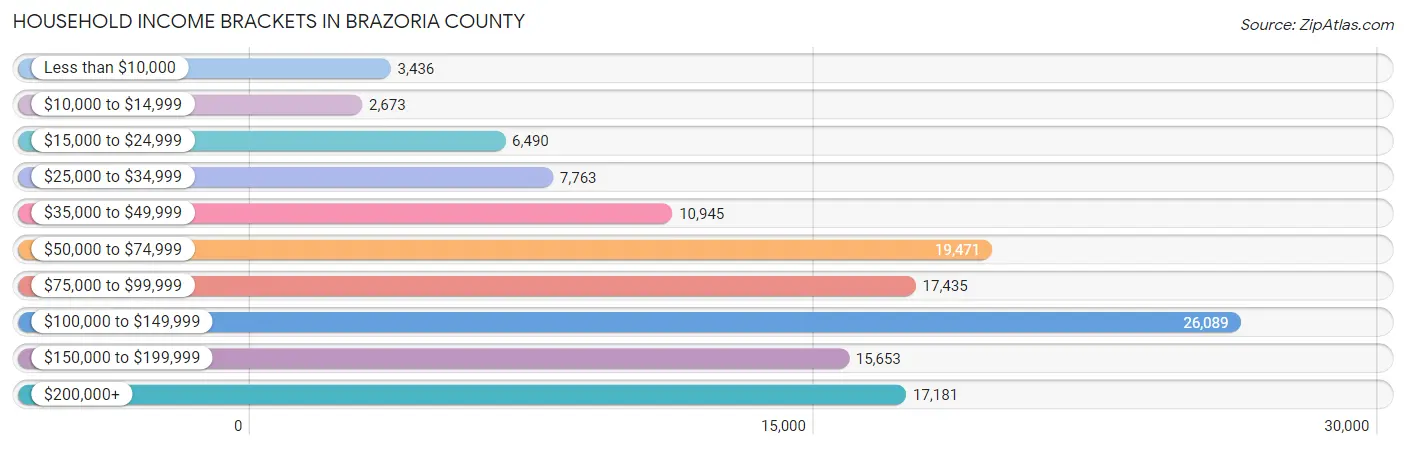
| Income Bracket | # Households | % Households |
| Less than $10,000 | 3,436 | 2.7% |
| $10,000 to $14,999 | 2,673 | 2.1% |
| $15,000 to $24,999 | 6,490 | 5.1% |
| $25,000 to $34,999 | 7,763 | 6.1% |
| $35,000 to $49,999 | 10,945 | 8.6% |
| $50,000 to $74,999 | 19,471 | 15.3% |
| $75,000 to $99,999 | 17,435 | 13.7% |
| $100,000 to $149,999 | 26,089 | 20.5% |
| $150,000 to $199,999 | 15,653 | 12.3% |
| $200,000+ | 17,181 | 13.5% |
Household Income by Householder Age in Brazoria County
The median household income in Brazoria County is $91,972, with the highest median household income of $109,988 found in the 45 to 64 years age bracket for the primary householder. A total of 47,433 households (37.3%) fall into this category. Meanwhile, the 15 to 24 years age bracket for the primary householder has the lowest median household income of $49,072, with 4,001 households (3.1%) in this group.
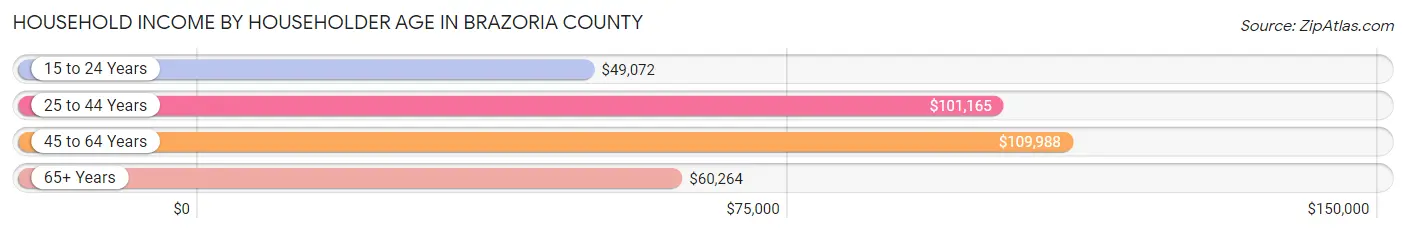
| Income Bracket | # Households | Median Income |
| 15 to 24 Years | 4,001 (3.1%) | $49,072 |
| 25 to 44 Years | 49,138 (38.6%) | $101,165 |
| 45 to 64 Years | 47,433 (37.3%) | $109,988 |
| 65+ Years | 26,692 (21.0%) | $60,264 |
| Total | 127,264 (100.0%) | $91,972 |
Poverty in Brazoria County
Income Below Poverty by Sex and Age in Brazoria County
With 6.5% poverty level for males and 8.6% for females among the residents of Brazoria County, 16 and 17 year old males and 18 to 24 year old females are the most vulnerable to poverty, with 797 males (12.9%) and 2,116 females (13.8%) in their respective age groups living below the poverty level.
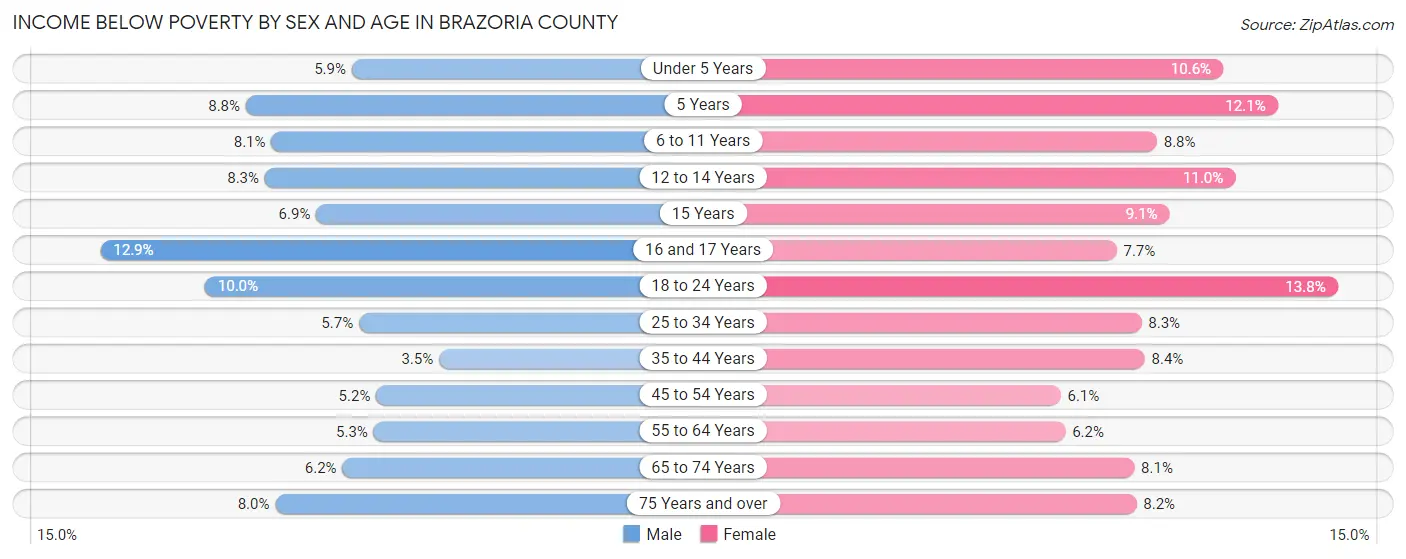
| Age Bracket | Male | Female |
| Under 5 Years | 729 (5.9%) | 1,240 (10.6%) |
| 5 Years | 246 (8.8%) | 257 (12.1%) |
| 6 to 11 Years | 1,417 (8.1%) | 1,425 (8.8%) |
| 12 to 14 Years | 696 (8.3%) | 935 (11.0%) |
| 15 Years | 167 (6.9%) | 248 (9.1%) |
| 16 and 17 Years | 797 (12.9%) | 423 (7.6%) |
| 18 to 24 Years | 1,576 (10.0%) | 2,116 (13.8%) |
| 25 to 34 Years | 1,332 (5.7%) | 2,063 (8.3%) |
| 35 to 44 Years | 905 (3.5%) | 2,306 (8.4%) |
| 45 to 54 Years | 1,209 (5.2%) | 1,447 (6.1%) |
| 55 to 64 Years | 1,059 (5.3%) | 1,321 (6.2%) |
| 65 to 74 Years | 833 (6.1%) | 1,187 (8.1%) |
| 75 Years and over | 550 (8.0%) | 787 (8.2%) |
| Total | 11,516 (6.5%) | 15,755 (8.6%) |
Income Above Poverty by Sex and Age in Brazoria County
According to the poverty statistics in Brazoria County, males aged 35 to 44 years and females aged 45 to 54 years are the age groups that are most secure financially, with 96.5% of males and 93.9% of females in these age groups living above the poverty line.
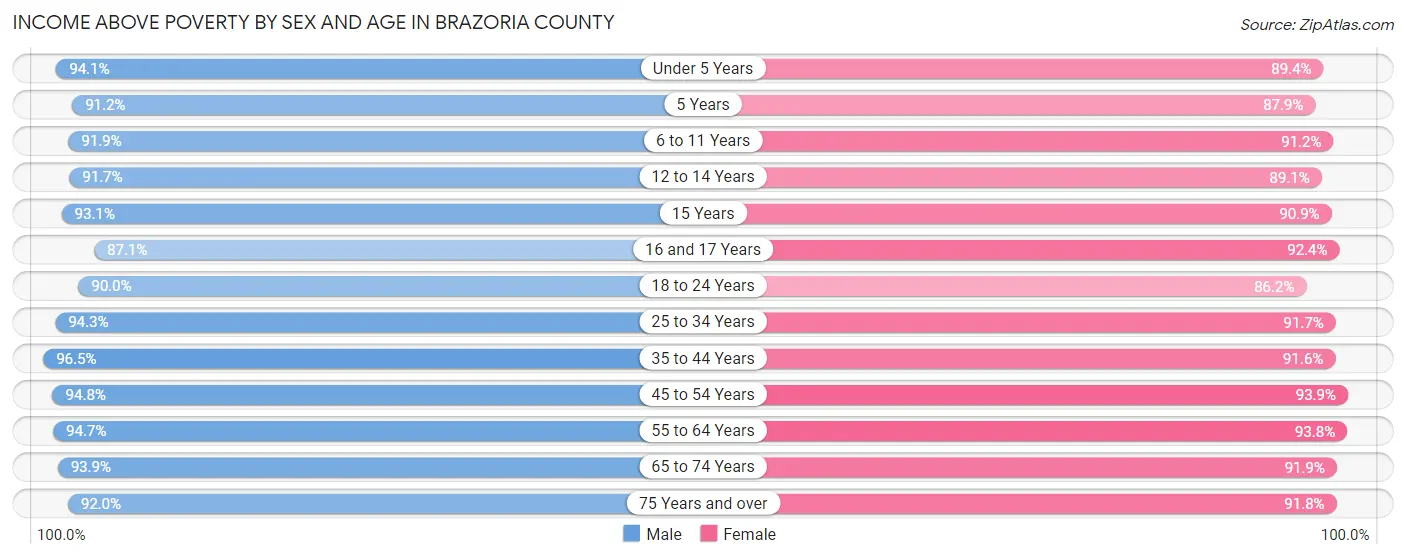
| Age Bracket | Male | Female |
| Under 5 Years | 11,646 (94.1%) | 10,445 (89.4%) |
| 5 Years | 2,538 (91.2%) | 1,862 (87.9%) |
| 6 to 11 Years | 16,006 (91.9%) | 14,818 (91.2%) |
| 12 to 14 Years | 7,684 (91.7%) | 7,603 (89.0%) |
| 15 Years | 2,260 (93.1%) | 2,471 (90.9%) |
| 16 and 17 Years | 5,387 (87.1%) | 5,107 (92.3%) |
| 18 to 24 Years | 14,223 (90.0%) | 13,213 (86.2%) |
| 25 to 34 Years | 22,073 (94.3%) | 22,665 (91.7%) |
| 35 to 44 Years | 25,267 (96.5%) | 25,053 (91.6%) |
| 45 to 54 Years | 21,998 (94.8%) | 22,315 (93.9%) |
| 55 to 64 Years | 18,998 (94.7%) | 19,914 (93.8%) |
| 65 to 74 Years | 12,715 (93.9%) | 13,391 (91.9%) |
| 75 Years and over | 6,309 (92.0%) | 8,815 (91.8%) |
| Total | 167,104 (93.5%) | 167,672 (91.4%) |
Income Below Poverty Among Married-Couple Families in Brazoria County
The poverty statistics for married-couple families in Brazoria County show that 3.4% or 2,482 of the total 72,486 families live below the poverty line. Families with 3 or 4 children have the highest poverty rate of 6.1%, comprising of 385 families. On the other hand, families with no children have the lowest poverty rate of 3.2%, which includes 1,143 families.
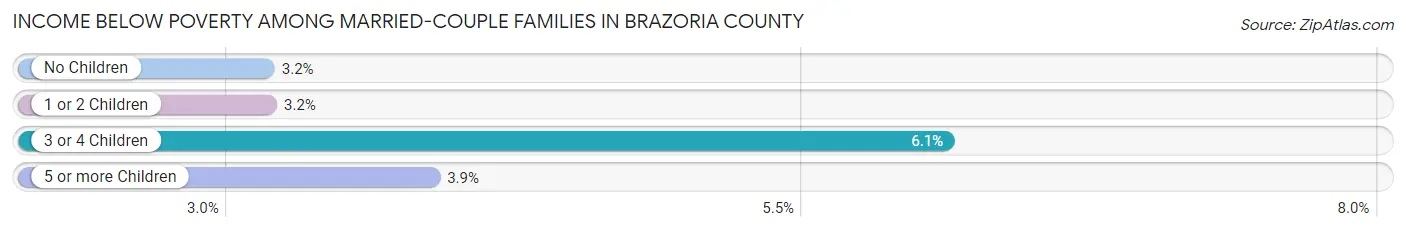
| Children | Above Poverty | Below Poverty |
| No Children | 35,039 (96.8%) | 1,143 (3.2%) |
| 1 or 2 Children | 28,692 (96.8%) | 939 (3.2%) |
| 3 or 4 Children | 5,901 (93.9%) | 385 (6.1%) |
| 5 or more Children | 372 (96.1%) | 15 (3.9%) |
| Total | 70,004 (96.6%) | 2,482 (3.4%) |
Income Below Poverty Among Single-Parent Households in Brazoria County
According to the poverty data in Brazoria County, 5.1% or 352 single-father households and 18.9% or 2,669 single-mother households are living below the poverty line. Among single-father households, those with 1 or 2 children have the highest poverty rate, with 194 households (6.0%) experiencing poverty. Likewise, among single-mother households, those with 5 or more children have the highest poverty rate, with 24 households (60.0%) falling below the poverty line.
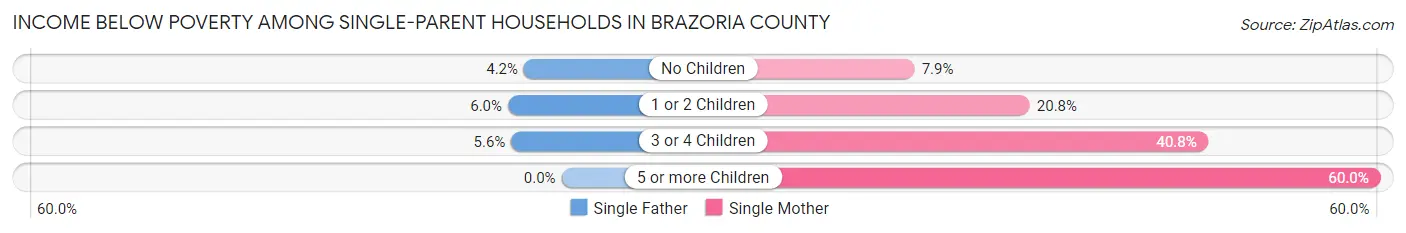
| Children | Single Father | Single Mother |
| No Children | 122 (4.2%) | 374 (7.9%) |
| 1 or 2 Children | 194 (6.0%) | 1,615 (20.8%) |
| 3 or 4 Children | 36 (5.6%) | 656 (40.8%) |
| 5 or more Children | 0 (0.0%) | 24 (60.0%) |
| Total | 352 (5.1%) | 2,669 (18.9%) |
Income Below Poverty Among Married-Couple vs Single-Parent Households in Brazoria County
The poverty data for Brazoria County shows that 2,482 of the married-couple family households (3.4%) and 3,021 of the single-parent households (14.4%) are living below the poverty level. Within the married-couple family households, those with 3 or 4 children have the highest poverty rate, with 385 households (6.1%) falling below the poverty line. Among the single-parent households, those with 3 or 4 children have the highest poverty rate, with 692 household (30.8%) living below poverty.
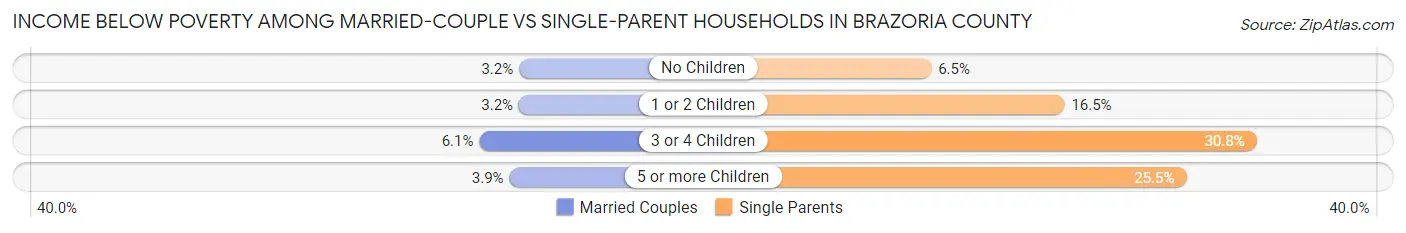
| Children | Married-Couple Families | Single-Parent Households |
| No Children | 1,143 (3.2%) | 496 (6.5%) |
| 1 or 2 Children | 939 (3.2%) | 1,809 (16.5%) |
| 3 or 4 Children | 385 (6.1%) | 692 (30.8%) |
| 5 or more Children | 15 (3.9%) | 24 (25.5%) |
| Total | 2,482 (3.4%) | 3,021 (14.4%) |
Race in Brazoria County
The most populous races in Brazoria County are White / Caucasian (218,834 | 58.4%), Hispanic or Latino (119,553 | 31.9%), and Black / African American (57,108 | 15.2%).
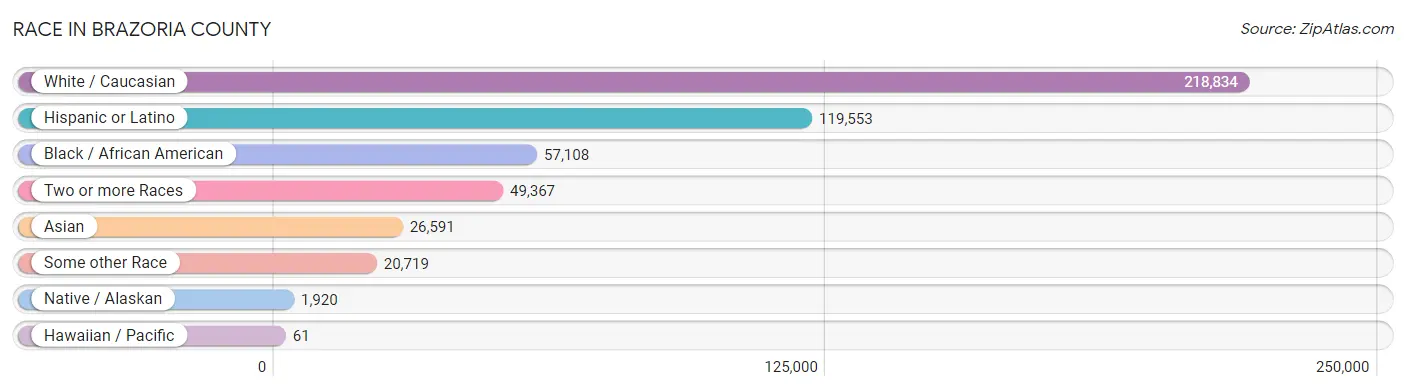
| Race | # Population | % Population |
| Asian | 26,591 | 7.1% |
| Black / African American | 57,108 | 15.2% |
| Hawaiian / Pacific | 61 | 0.0% |
| Hispanic or Latino | 119,553 | 31.9% |
| Native / Alaskan | 1,920 | 0.5% |
| White / Caucasian | 218,834 | 58.4% |
| Two or more Races | 49,367 | 13.2% |
| Some other Race | 20,719 | 5.5% |
| Total | 374,600 | 100.0% |
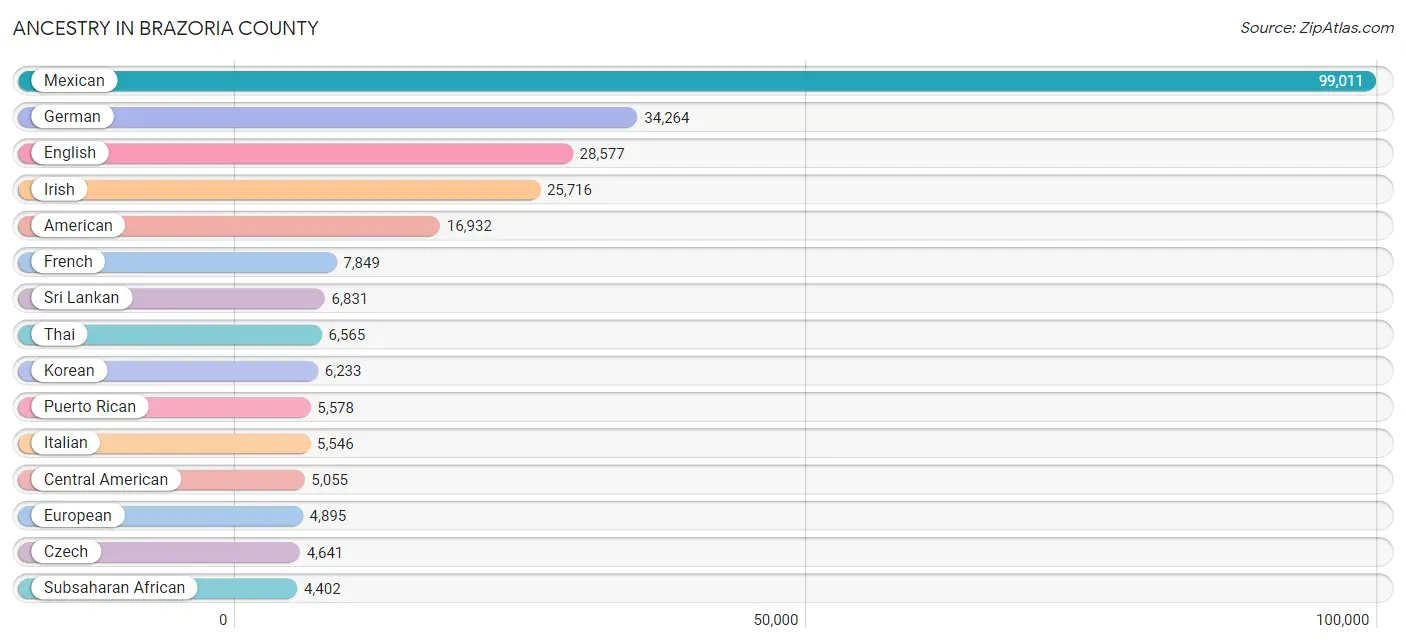
Ancestry in Brazoria County
The most populous ancestries reported in Brazoria County are Mexican (99,011 | 26.4%), German (34,264 | 9.1%), English (28,577 | 7.6%), Irish (25,716 | 6.9%), and American (16,932 | 4.5%), together accounting for 54.6% of all Brazoria County residents.
| Ancestry | # Population | % Population |
| African | 1,803 | 0.5% |
| Alaska Native | 10 | 0.0% |
| Albanian | 67 | 0.0% |
| American | 16,932 | 4.5% |
| Apache | 95 | 0.0% |
| Arab | 1,323 | 0.4% |
| Argentinean | 39 | 0.0% |
| Armenian | 27 | 0.0% |
| Australian | 17 | 0.0% |
| Austrian | 542 | 0.1% |
| Barbadian | 19 | 0.0% |
| Basque | 22 | 0.0% |
| Belgian | 266 | 0.1% |
| Bhutanese | 938 | 0.3% |
| Blackfeet | 88 | 0.0% |
| Bolivian | 8 | 0.0% |
| Brazilian | 159 | 0.0% |
| British | 3,267 | 0.9% |
| Bulgarian | 4 | 0.0% |
| Burmese | 1,847 | 0.5% |
| Cajun | 313 | 0.1% |
| Canadian | 538 | 0.1% |
| Celtic | 6 | 0.0% |
| Central American | 5,055 | 1.3% |
| Central American Indian | 415 | 0.1% |
| Cherokee | 961 | 0.3% |
| Chickasaw | 228 | 0.1% |
| Chilean | 7 | 0.0% |
| Chippewa | 41 | 0.0% |
| Choctaw | 145 | 0.0% |
| Colombian | 760 | 0.2% |
| Comanche | 24 | 0.0% |
| Costa Rican | 251 | 0.1% |
| Creek | 44 | 0.0% |
| Croatian | 139 | 0.0% |
| Cuban | 800 | 0.2% |
| Czech | 4,641 | 1.2% |
| Czechoslovakian | 461 | 0.1% |
| Danish | 538 | 0.1% |
| Delaware | 16 | 0.0% |
| Dominican | 210 | 0.1% |
| Dutch | 2,414 | 0.6% |
| Dutch West Indian | 16 | 0.0% |
| Eastern European | 280 | 0.1% |
| Ecuadorian | 341 | 0.1% |
| Egyptian | 75 | 0.0% |
| English | 28,577 | 7.6% |
| Ethiopian | 110 | 0.0% |
| European | 4,895 | 1.3% |
| Filipino | 652 | 0.2% |
| Finnish | 164 | 0.0% |
| French | 7,849 | 2.1% |
| French Canadian | 778 | 0.2% |
| German | 34,264 | 9.1% |
| German Russian | 93 | 0.0% |
| Ghanaian | 128 | 0.0% |
| Greek | 754 | 0.2% |
| Guamanian / Chamorro | 182 | 0.1% |
| Guatemalan | 854 | 0.2% |
| Haitian | 453 | 0.1% |
| Honduran | 762 | 0.2% |
| Hungarian | 584 | 0.2% |
| Icelander | 163 | 0.0% |
| Indian (Asian) | 3,980 | 1.1% |
| Indonesian | 133 | 0.0% |
| Inupiat | 103 | 0.0% |
| Iranian | 118 | 0.0% |
| Iraqi | 122 | 0.0% |
| Irish | 25,716 | 6.9% |
| Iroquois | 13 | 0.0% |
| Israeli | 47 | 0.0% |
| Italian | 5,546 | 1.5% |
| Jamaican | 395 | 0.1% |
| Japanese | 1,207 | 0.3% |
| Jordanian | 41 | 0.0% |
| Korean | 6,233 | 1.7% |
| Laotian | 13 | 0.0% |
| Latvian | 38 | 0.0% |
| Lebanese | 247 | 0.1% |
| Lithuanian | 248 | 0.1% |
| Malaysian | 13 | 0.0% |
| Maltese | 36 | 0.0% |
| Mexican | 99,011 | 26.4% |
| Mexican American Indian | 923 | 0.3% |
| Mongolian | 38 | 0.0% |
| Native Hawaiian | 284 | 0.1% |
| Navajo | 53 | 0.0% |
| Nicaraguan | 179 | 0.1% |
| Nigerian | 1,590 | 0.4% |
| Northern European | 631 | 0.2% |
| Norwegian | 1,109 | 0.3% |
| Okinawan | 5 | 0.0% |
| Osage | 37 | 0.0% |
| Pakistani | 139 | 0.0% |
| Palestinian | 125 | 0.0% |
| Panamanian | 135 | 0.0% |
| Paraguayan | 59 | 0.0% |
| Pennsylvania German | 8 | 0.0% |
| Peruvian | 102 | 0.0% |
| Pima | 14 | 0.0% |
| Polish | 3,839 | 1.0% |
| Portuguese | 611 | 0.2% |
| Potawatomi | 56 | 0.0% |
| Pueblo | 55 | 0.0% |
| Puerto Rican | 5,578 | 1.5% |
| Romanian | 37 | 0.0% |
| Russian | 1,170 | 0.3% |
| Salvadoran | 2,874 | 0.8% |
| Samoan | 33 | 0.0% |
| Scandinavian | 513 | 0.1% |
| Scotch-Irish | 3,107 | 0.8% |
| Scottish | 4,005 | 1.1% |
| Serbian | 14 | 0.0% |
| Sierra Leonean | 1 | 0.0% |
| Sioux | 10 | 0.0% |
| Slavic | 25 | 0.0% |
| Slovak | 218 | 0.1% |
| Slovene | 41 | 0.0% |
| South African | 202 | 0.1% |
| South American | 2,788 | 0.7% |
| Spaniard | 1,322 | 0.4% |
| Spanish | 730 | 0.2% |
| Spanish American | 83 | 0.0% |
| Sri Lankan | 6,831 | 1.8% |
| Subsaharan African | 4,402 | 1.2% |
| Swedish | 1,374 | 0.4% |
| Swiss | 658 | 0.2% |
| Syrian | 58 | 0.0% |
| Thai | 6,565 | 1.8% |
| Tongan | 14 | 0.0% |
| Trinidadian and Tobagonian | 189 | 0.1% |
| Turkish | 149 | 0.0% |
| Ukrainian | 379 | 0.1% |
| Venezuelan | 1,472 | 0.4% |
| Vietnamese | 150 | 0.0% |
| Welsh | 1,286 | 0.3% |
| West Indian | 28 | 0.0% |
| Yaqui | 111 | 0.0% |
| Yugoslavian | 2 | 0.0% | View All 139 Rows |
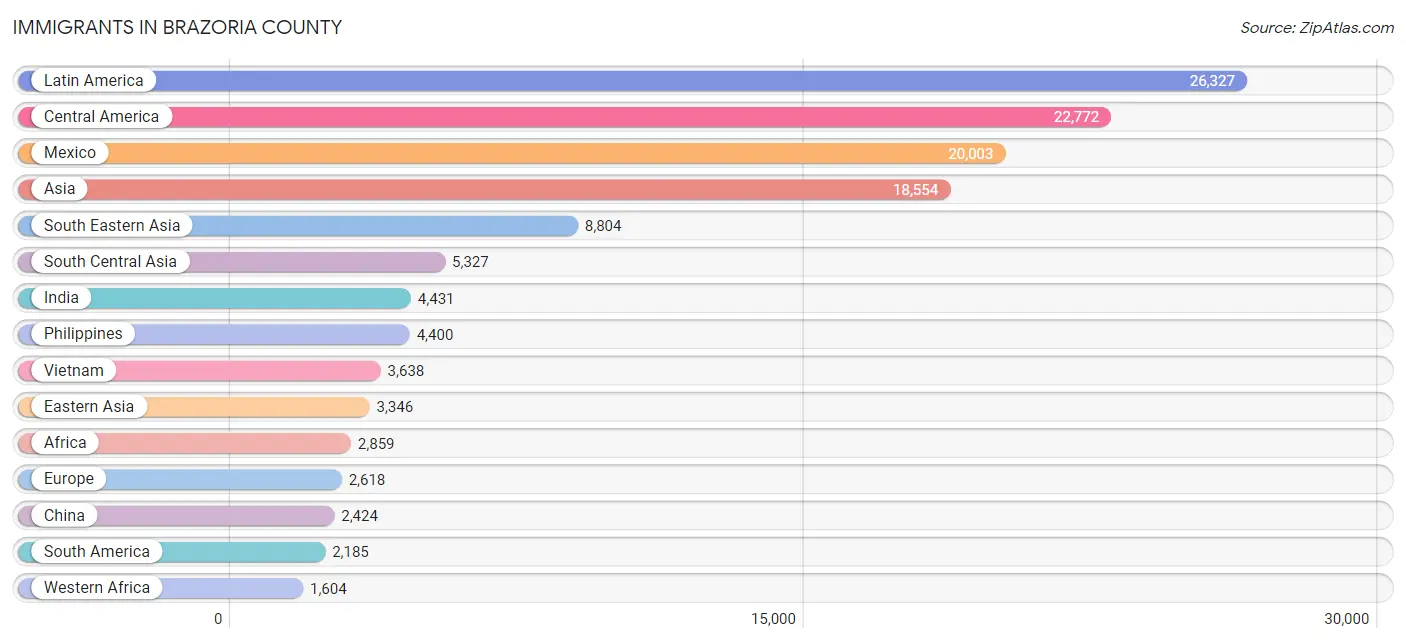
Immigrants in Brazoria County
The most numerous immigrant groups reported in Brazoria County came from Latin America (26,327 | 7.0%), Central America (22,772 | 6.1%), Mexico (20,003 | 5.3%), Asia (18,554 | 5.0%), and South Eastern Asia (8,804 | 2.4%), together accounting for 25.8% of all Brazoria County residents.
| Immigration Origin | # Population | % Population |
| Africa | 2,859 | 0.8% |
| Albania | 31 | 0.0% |
| Argentina | 36 | 0.0% |
| Asia | 18,554 | 5.0% |
| Australia | 24 | 0.0% |
| Bangladesh | 131 | 0.0% |
| Barbados | 19 | 0.0% |
| Brazil | 179 | 0.1% |
| Cambodia | 524 | 0.1% |
| Cameroon | 438 | 0.1% |
| Canada | 562 | 0.2% |
| Caribbean | 1,370 | 0.4% |
| Central America | 22,772 | 6.1% |
| Chile | 6 | 0.0% |
| China | 2,424 | 0.6% |
| Colombia | 314 | 0.1% |
| Costa Rica | 221 | 0.1% |
| Croatia | 4 | 0.0% |
| Cuba | 434 | 0.1% |
| Czechoslovakia | 8 | 0.0% |
| Denmark | 12 | 0.0% |
| Dominican Republic | 197 | 0.1% |
| Eastern Africa | 325 | 0.1% |
| Eastern Asia | 3,346 | 0.9% |
| Eastern Europe | 757 | 0.2% |
| Ecuador | 194 | 0.1% |
| Egypt | 211 | 0.1% |
| El Salvador | 1,339 | 0.4% |
| England | 238 | 0.1% |
| Eritrea | 92 | 0.0% |
| Ethiopia | 127 | 0.0% |
| Europe | 2,618 | 0.7% |
| France | 444 | 0.1% |
| Germany | 576 | 0.2% |
| Greece | 36 | 0.0% |
| Guatemala | 386 | 0.1% |
| Guyana | 104 | 0.0% |
| Haiti | 245 | 0.1% |
| Honduras | 613 | 0.2% |
| Hong Kong | 6 | 0.0% |
| Hungary | 145 | 0.0% |
| India | 4,431 | 1.2% |
| Indonesia | 35 | 0.0% |
| Iran | 3 | 0.0% |
| Iraq | 184 | 0.1% |
| Ireland | 5 | 0.0% |
| Israel | 37 | 0.0% |
| Italy | 71 | 0.0% |
| Jamaica | 335 | 0.1% |
| Japan | 156 | 0.0% |
| Jordan | 44 | 0.0% |
| Kenya | 48 | 0.0% |
| Korea | 766 | 0.2% |
| Kuwait | 260 | 0.1% |
| Latin America | 26,327 | 7.0% |
| Latvia | 11 | 0.0% |
| Lebanon | 118 | 0.0% |
| Malaysia | 53 | 0.0% |
| Mexico | 20,003 | 5.3% |
| Middle Africa | 479 | 0.1% |
| Nepal | 167 | 0.0% |
| Netherlands | 19 | 0.0% |
| Nicaragua | 163 | 0.0% |
| Nigeria | 1,593 | 0.4% |
| Northern Africa | 220 | 0.1% |
| Northern Europe | 584 | 0.2% |
| Oceania | 32 | 0.0% |
| Pakistan | 517 | 0.1% |
| Panama | 47 | 0.0% |
| Peru | 89 | 0.0% |
| Philippines | 4,400 | 1.2% |
| Poland | 23 | 0.0% |
| Romania | 16 | 0.0% |
| Russia | 324 | 0.1% |
| Saudi Arabia | 236 | 0.1% |
| Scotland | 59 | 0.0% |
| Sierra Leone | 1 | 0.0% |
| Singapore | 5 | 0.0% |
| Somalia | 3 | 0.0% |
| South Africa | 227 | 0.1% |
| South America | 2,185 | 0.6% |
| South Central Asia | 5,327 | 1.4% |
| South Eastern Asia | 8,804 | 2.4% |
| Southern Europe | 145 | 0.0% |
| Spain | 38 | 0.0% |
| Sri Lanka | 3 | 0.0% |
| Sweden | 13 | 0.0% |
| Switzerland | 67 | 0.0% |
| Syria | 21 | 0.0% |
| Taiwan | 336 | 0.1% |
| Thailand | 34 | 0.0% |
| Trinidad and Tobago | 67 | 0.0% |
| Uganda | 19 | 0.0% |
| Ukraine | 85 | 0.0% |
| Uzbekistan | 75 | 0.0% |
| Venezuela | 1,212 | 0.3% |
| Vietnam | 3,638 | 1.0% |
| West Indies | 36 | 0.0% |
| Western Africa | 1,604 | 0.4% |
| Western Asia | 1,077 | 0.3% |
| Western Europe | 1,106 | 0.3% |
| Zaire | 41 | 0.0% |
| Zimbabwe | 19 | 0.0% | View All 103 Rows |
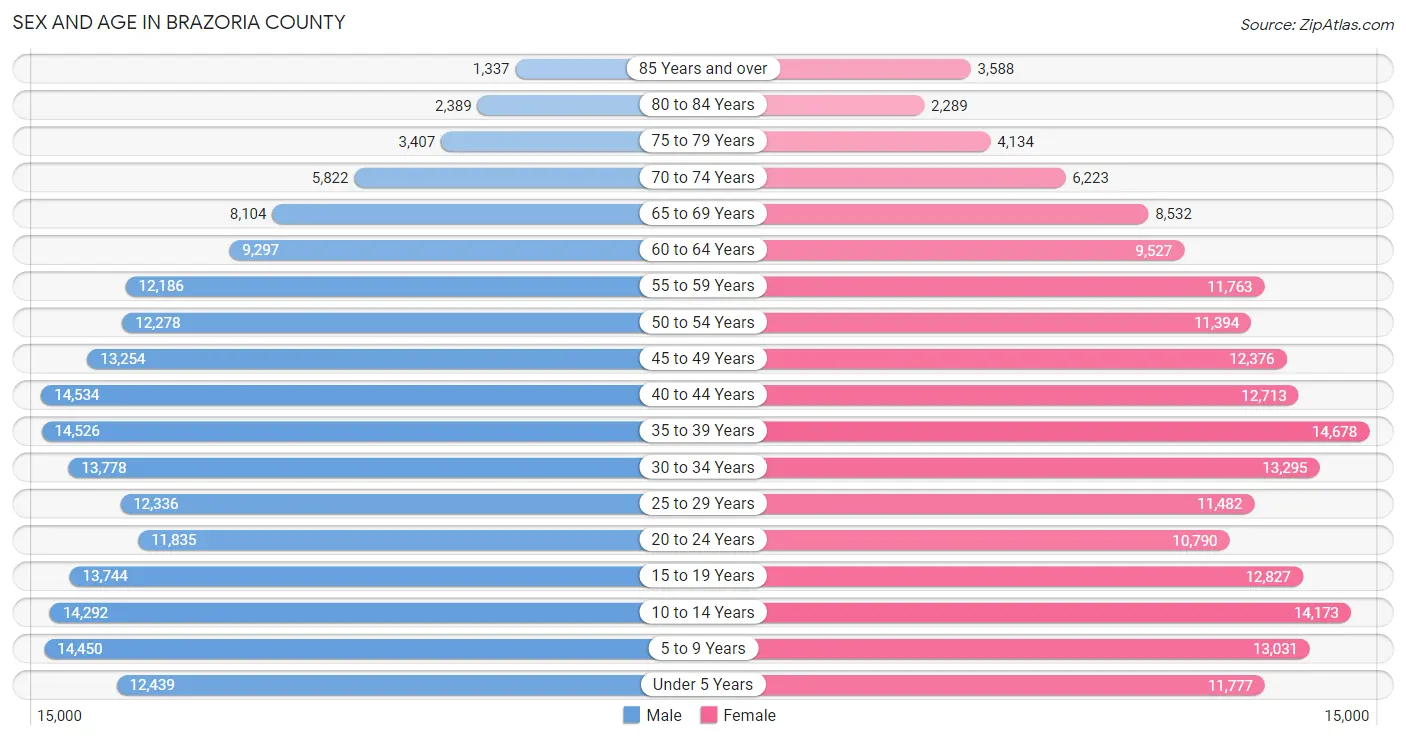
Sex and Age in Brazoria County
Sex and Age in Brazoria County
The most populous age groups in Brazoria County are 40 to 44 Years (14,534 | 7.6%) for men and 35 to 39 Years (14,678 | 8.0%) for women.
| Age Bracket | Male | Female |
| Under 5 Years | 12,439 (6.6%) | 11,777 (6.4%) |
| 5 to 9 Years | 14,450 (7.6%) | 13,031 (7.1%) |
| 10 to 14 Years | 14,292 (7.5%) | 14,173 (7.7%) |
| 15 to 19 Years | 13,744 (7.2%) | 12,827 (7.0%) |
| 20 to 24 Years | 11,835 (6.2%) | 10,790 (5.9%) |
| 25 to 29 Years | 12,336 (6.5%) | 11,482 (6.2%) |
| 30 to 34 Years | 13,778 (7.2%) | 13,295 (7.2%) |
| 35 to 39 Years | 14,526 (7.6%) | 14,678 (8.0%) |
| 40 to 44 Years | 14,534 (7.6%) | 12,713 (6.9%) |
| 45 to 49 Years | 13,254 (7.0%) | 12,376 (6.7%) |
| 50 to 54 Years | 12,278 (6.5%) | 11,394 (6.2%) |
| 55 to 59 Years | 12,186 (6.4%) | 11,763 (6.4%) |
| 60 to 64 Years | 9,297 (4.9%) | 9,527 (5.2%) |
| 65 to 69 Years | 8,104 (4.3%) | 8,532 (4.6%) |
| 70 to 74 Years | 5,822 (3.1%) | 6,223 (3.4%) |
| 75 to 79 Years | 3,407 (1.8%) | 4,134 (2.2%) |
| 80 to 84 Years | 2,389 (1.3%) | 2,289 (1.2%) |
| 85 Years and over | 1,337 (0.7%) | 3,588 (1.9%) |
| Total | 190,008 (100.0%) | 184,592 (100.0%) |
Families and Households in Brazoria County
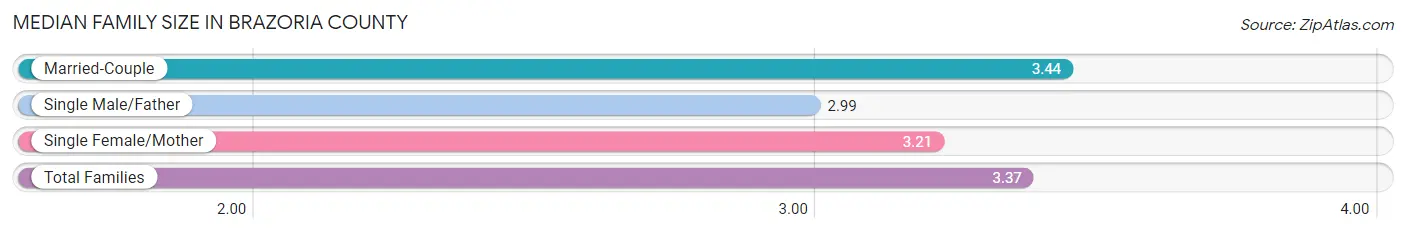
Median Family Size in Brazoria County
The median family size in Brazoria County is 3.37 persons per family, with married-couple families (72,486 | 77.6%) accounting for the largest median family size of 3.44 persons per family. On the other hand, single male/father families (6,837 | 7.3%) represent the smallest median family size with 2.99 persons per family.
| Family Type | # Families | Family Size |
| Married-Couple | 72,486 (77.6%) | 3.44 |
| Single Male/Father | 6,837 (7.3%) | 2.99 |
| Single Female/Mother | 14,116 (15.1%) | 3.21 |
| Total Families | 93,439 (100.0%) | 3.37 |
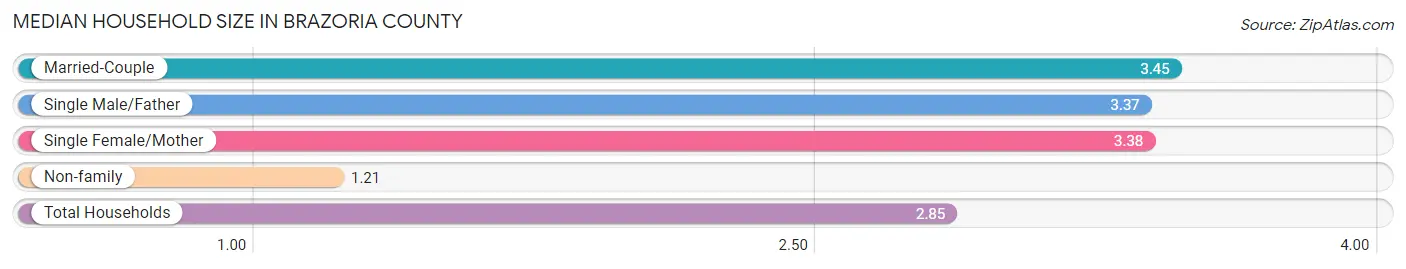
Median Household Size in Brazoria County
The median household size in Brazoria County is 2.85 persons per household, with married-couple households (72,486 | 57.0%) accounting for the largest median household size of 3.45 persons per household. non-family households (33,825 | 26.6%) represent the smallest median household size with 1.21 persons per household.
| Household Type | # Households | Household Size |
| Married-Couple | 72,486 (57.0%) | 3.45 |
| Single Male/Father | 6,837 (5.4%) | 3.37 |
| Single Female/Mother | 14,116 (11.1%) | 3.38 |
| Non-family | 33,825 (26.6%) | 1.21 |
| Total Households | 127,264 (100.0%) | 2.85 |
Household Size by Marriage Status in Brazoria County
Out of a total of 127,264 households in Brazoria County, 93,439 (73.4%) are family households, while 33,825 (26.6%) are nonfamily households. The most numerous type of family households are 2-person households, comprising 33,304, and the most common type of nonfamily households are 1-person households, comprising 27,874.
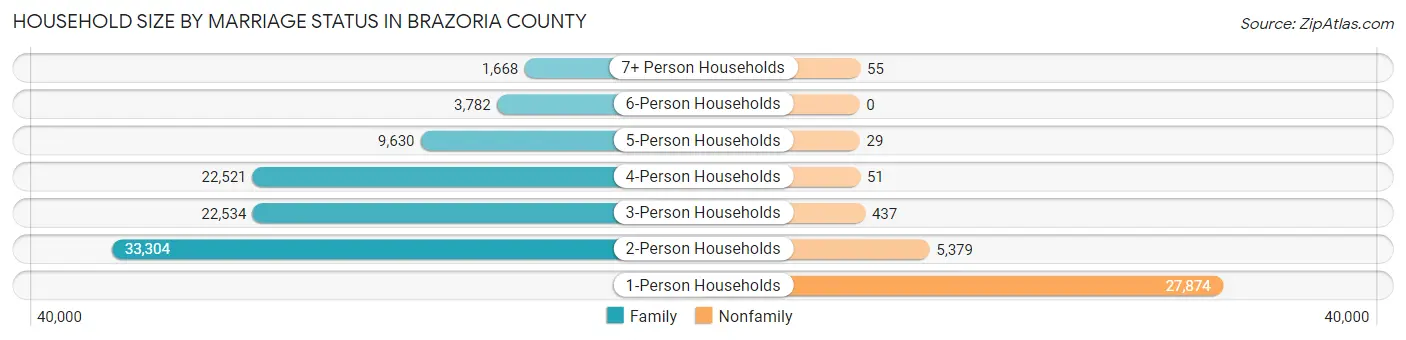
| Household Size | Family Households | Nonfamily Households |
| 1-Person Households | - | 27,874 (21.9%) |
| 2-Person Households | 33,304 (26.2%) | 5,379 (4.2%) |
| 3-Person Households | 22,534 (17.7%) | 437 (0.3%) |
| 4-Person Households | 22,521 (17.7%) | 51 (0.0%) |
| 5-Person Households | 9,630 (7.6%) | 29 (0.0%) |
| 6-Person Households | 3,782 (3.0%) | 0 (0.0%) |
| 7+ Person Households | 1,668 (1.3%) | 55 (0.0%) |
| Total | 93,439 (73.4%) | 33,825 (26.6%) |
Female Fertility in Brazoria County
Fertility by Age in Brazoria County
Average fertility rate in Brazoria County is 56.0 births per 1,000 women. Women in the age bracket of 20 to 34 years have the highest fertility rate with 85.0 births per 1,000 women. Women in the age bracket of 20 to 34 years acount for 60.0% of all women with births.
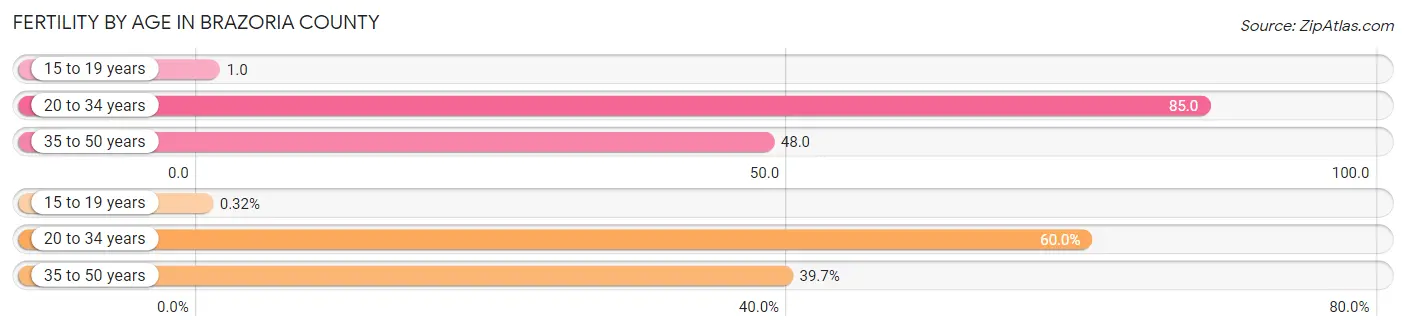
| Age Bracket | Women with Births | Births / 1,000 Women |
| 15 to 19 years | 16 (0.3%) | 1.0 |
| 20 to 34 years | 3,033 (60.0%) | 85.0 |
| 35 to 50 years | 2,005 (39.7%) | 48.0 |
| Total | 5,054 (100.0%) | 56.0 |
Fertility by Age by Marriage Status in Brazoria County
71.3% of women with births (5,054) in Brazoria County are married. The highest percentage of unmarried women with births falls into 15 to 19 years age bracket with 100.0% of them unmarried at the time of birth, while the lowest percentage of unmarried women with births belong to 35 to 50 years age bracket with 15.6% of them unmarried.
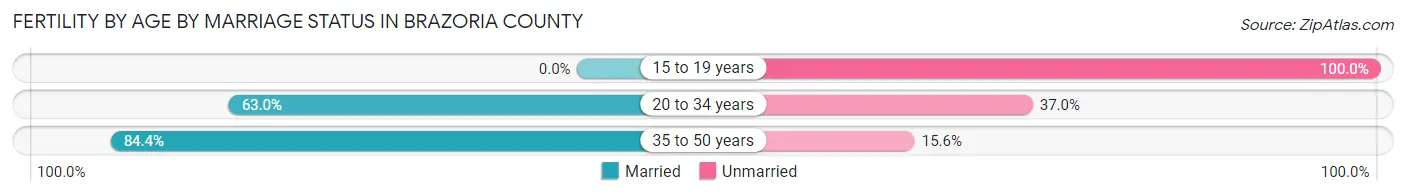
| Age Bracket | Married | Unmarried |
| 15 to 19 years | 0 (0.0%) | 16 (100.0%) |
| 20 to 34 years | 1,911 (63.0%) | 1,122 (37.0%) |
| 35 to 50 years | 1,692 (84.4%) | 313 (15.6%) |
| Total | 3,604 (71.3%) | 1,450 (28.7%) |
Fertility by Education in Brazoria County
Average fertility rate in Brazoria County is 56.0 births per 1,000 women. Women with the education attainment of bachelor's degree have the highest fertility rate of 91.0 births per 1,000 women, while women with the education attainment of less than high school have the lowest fertility at 21.0 births per 1,000 women. Women with the education attainment of bachelor's degree represent 34.1% of all women with births.
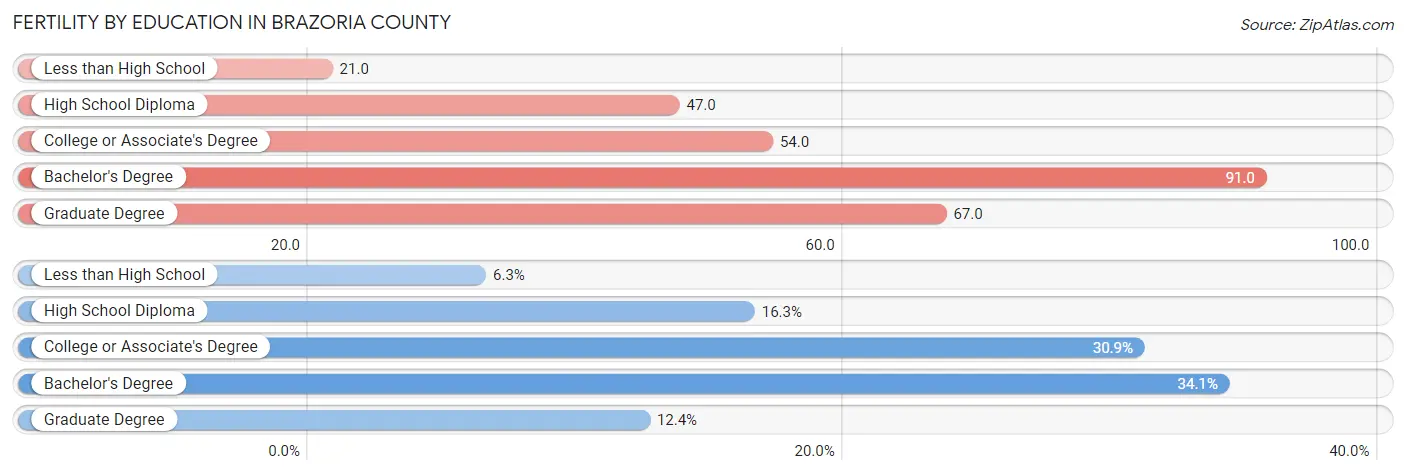
| Educational Attainment | Women with Births | Births / 1,000 Women |
| Less than High School | 316 (6.2%) | 21.0 |
| High School Diploma | 825 (16.3%) | 47.0 |
| College or Associate's Degree | 1,563 (30.9%) | 54.0 |
| Bachelor's Degree | 1,724 (34.1%) | 91.0 |
| Graduate Degree | 626 (12.4%) | 67.0 |
| Total | 5,054 (100.0%) | 56.0 |
Fertility by Education by Marriage Status in Brazoria County
28.7% of women with births in Brazoria County are unmarried. Women with the educational attainment of graduate degree are most likely to be married with 84.2% of them married at childbirth, while women with the educational attainment of less than high school are least likely to be married with 75.6% of them unmarried at childbirth.
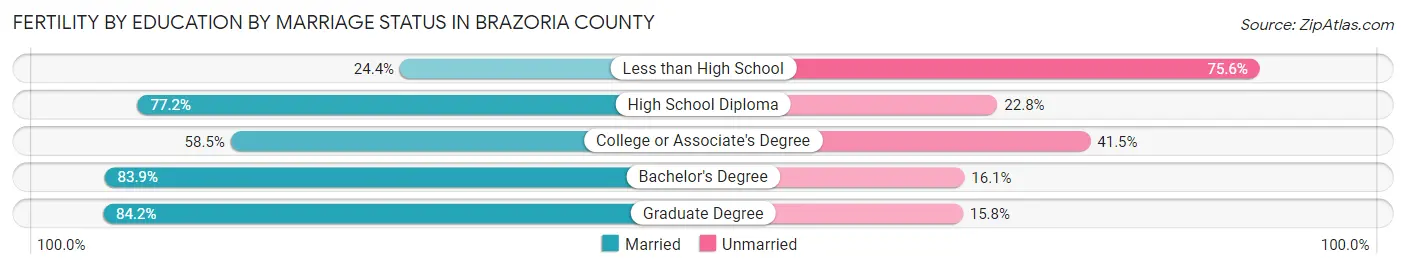
| Educational Attainment | Married | Unmarried |
| Less than High School | 77 (24.4%) | 239 (75.6%) |
| High School Diploma | 637 (77.2%) | 188 (22.8%) |
| College or Associate's Degree | 914 (58.5%) | 649 (41.5%) |
| Bachelor's Degree | 1,446 (83.9%) | 278 (16.1%) |
| Graduate Degree | 527 (84.2%) | 99 (15.8%) |
| Total | 3,604 (71.3%) | 1,450 (28.7%) |
Employment Characteristics in Brazoria County
Employment by Class of Employer in Brazoria County
Among the 171,722 employed individuals in Brazoria County, private company employees (118,645 | 69.1%), local government employees (14,057 | 8.2%), and not-for-profit organizations (11,039 | 6.4%) make up the most common classes of employment.
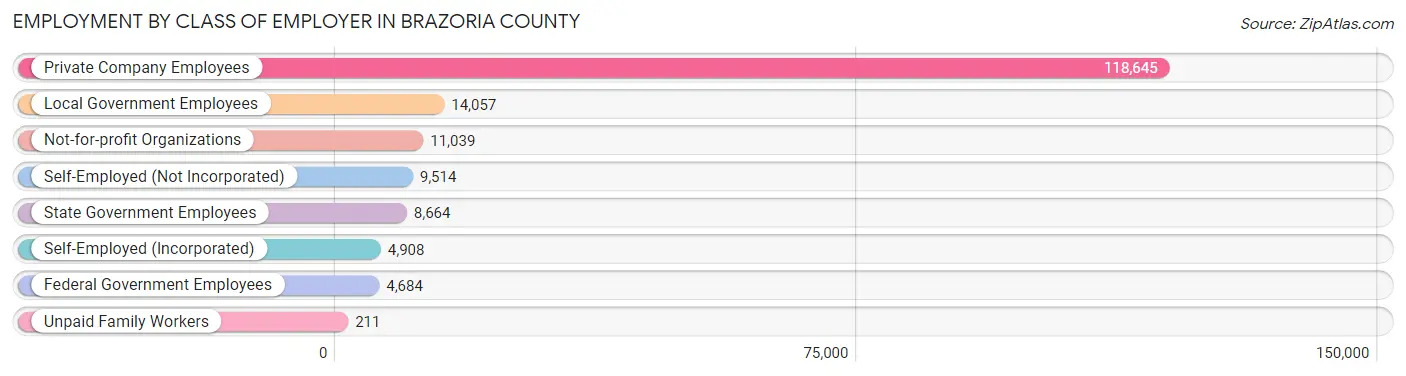
| Employer Class | # Employees | % Employees |
| Private Company Employees | 118,645 | 69.1% |
| Self-Employed (Incorporated) | 4,908 | 2.9% |
| Self-Employed (Not Incorporated) | 9,514 | 5.5% |
| Not-for-profit Organizations | 11,039 | 6.4% |
| Local Government Employees | 14,057 | 8.2% |
| State Government Employees | 8,664 | 5.1% |
| Federal Government Employees | 4,684 | 2.7% |
| Unpaid Family Workers | 211 | 0.1% |
| Total | 171,722 | 100.0% |
Employment Status by Age in Brazoria County
According to the labor force statistics for Brazoria County, out of the total population over 16 years of age (289,240), 63.4% or 183,378 individuals are in the labor force, with 4.6% or 8,435 of them unemployed. The age group with the highest labor force participation rate is 30 to 34 years, with 80.4% or 21,767 individuals in the labor force. Within the labor force, the 16 to 19 years age range has the highest percentage of unemployed individuals, with 23.9% or 1,522 of them being unemployed.
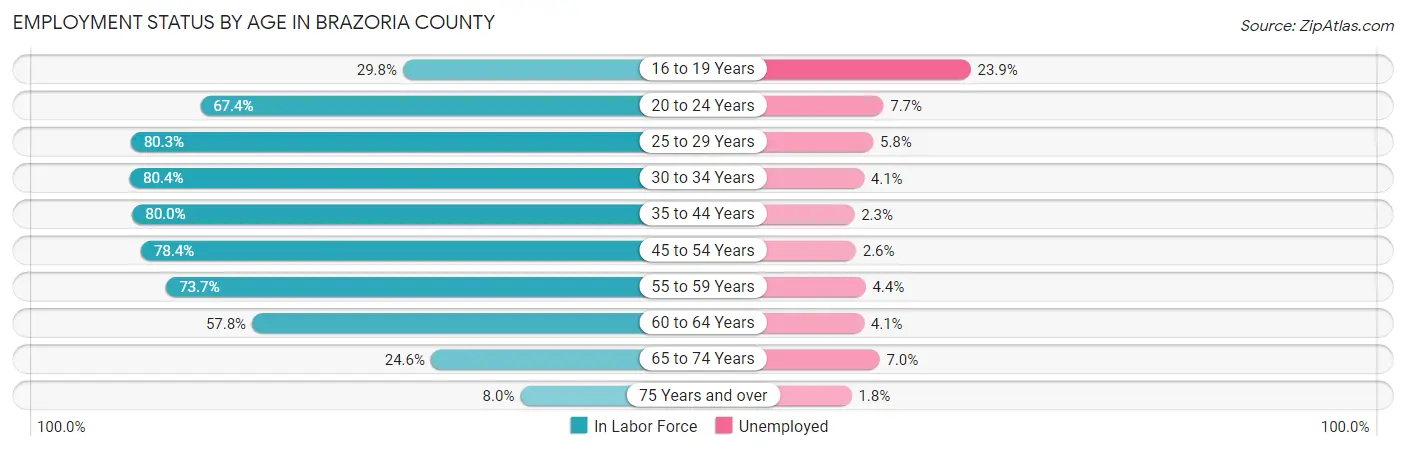
| Age Bracket | In Labor Force | Unemployed |
| 16 to 19 Years | 6,369 (29.8%) | 1,522 (23.9%) |
| 20 to 24 Years | 15,249 (67.4%) | 1,174 (7.7%) |
| 25 to 29 Years | 19,126 (80.3%) | 1,109 (5.8%) |
| 30 to 34 Years | 21,767 (80.4%) | 892 (4.1%) |
| 35 to 44 Years | 45,161 (80.0%) | 1,039 (2.3%) |
| 45 to 54 Years | 38,653 (78.4%) | 1,005 (2.6%) |
| 55 to 59 Years | 17,650 (73.7%) | 777 (4.4%) |
| 60 to 64 Years | 10,880 (57.8%) | 446 (4.1%) |
| 65 to 74 Years | 7,056 (24.6%) | 494 (7.0%) |
| 75 Years and over | 1,372 (8.0%) | 25 (1.8%) |
| Total | 183,378 (63.4%) | 8,435 (4.6%) |
Employment Status by Educational Attainment in Brazoria County
According to labor force statistics for Brazoria County, 76.8% of individuals (153,152) out of the total population between 25 and 64 years of age (199,417) are in the labor force, with 3.5% or 5,360 of them being unemployed. The group with the highest labor force participation rate are those with the educational attainment of bachelor's degree or higher, with 88.5% or 57,038 individuals in the labor force. Within the labor force, individuals with less than high school education have the highest percentage of unemployment, with 6.2% or 721 of them being unemployed.
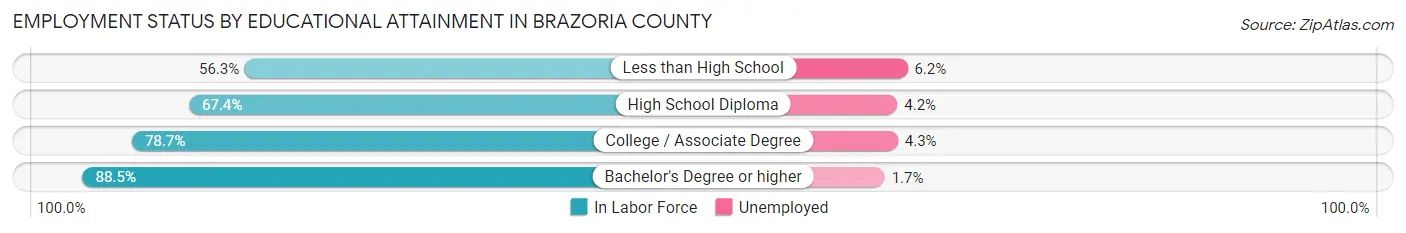
| Educational Attainment | In Labor Force | Unemployed |
| Less than High School | 11,628 (56.3%) | 1,280 (6.2%) |
| High School Diploma | 32,126 (67.4%) | 2,002 (4.2%) |
| College / Associate Degree | 52,454 (78.7%) | 2,866 (4.3%) |
| Bachelor's Degree or higher | 57,038 (88.5%) | 1,096 (1.7%) |
| Total | 153,152 (76.8%) | 6,980 (3.5%) |
Employment Occupations by Sex in Brazoria County
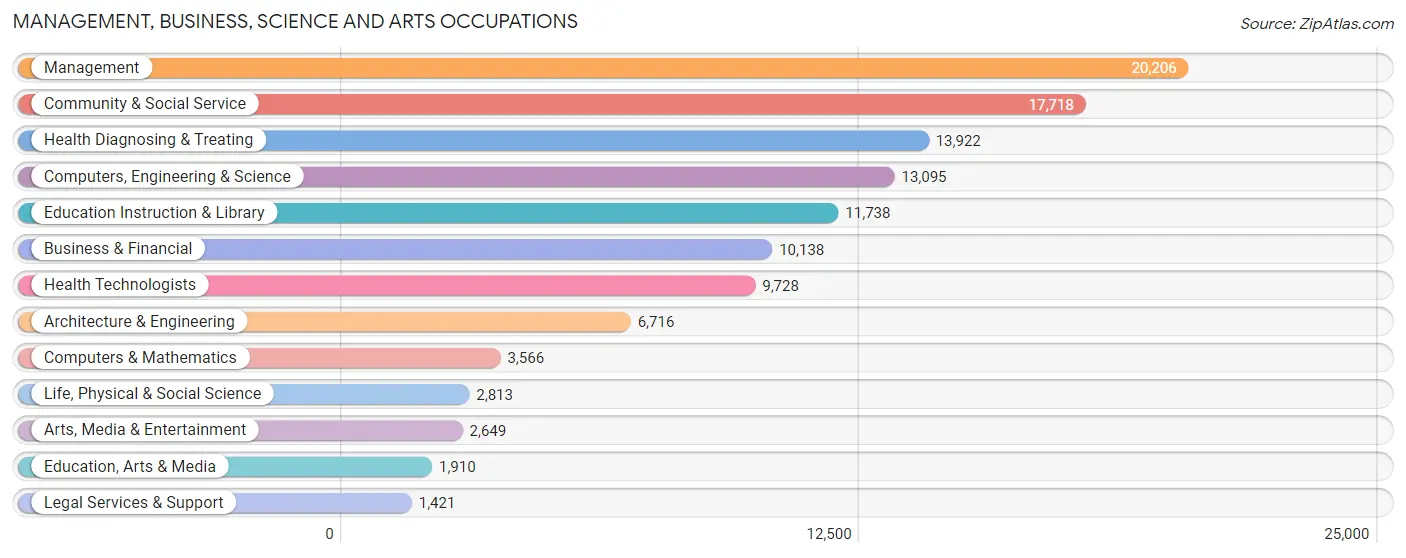
Management, Business, Science and Arts Occupations
The most common Management, Business, Science and Arts occupations in Brazoria County are Management (20,206 | 11.6%), Community & Social Service (17,718 | 10.2%), Health Diagnosing & Treating (13,922 | 8.0%), Computers, Engineering & Science (13,095 | 7.5%), and Education Instruction & Library (11,738 | 6.7%).
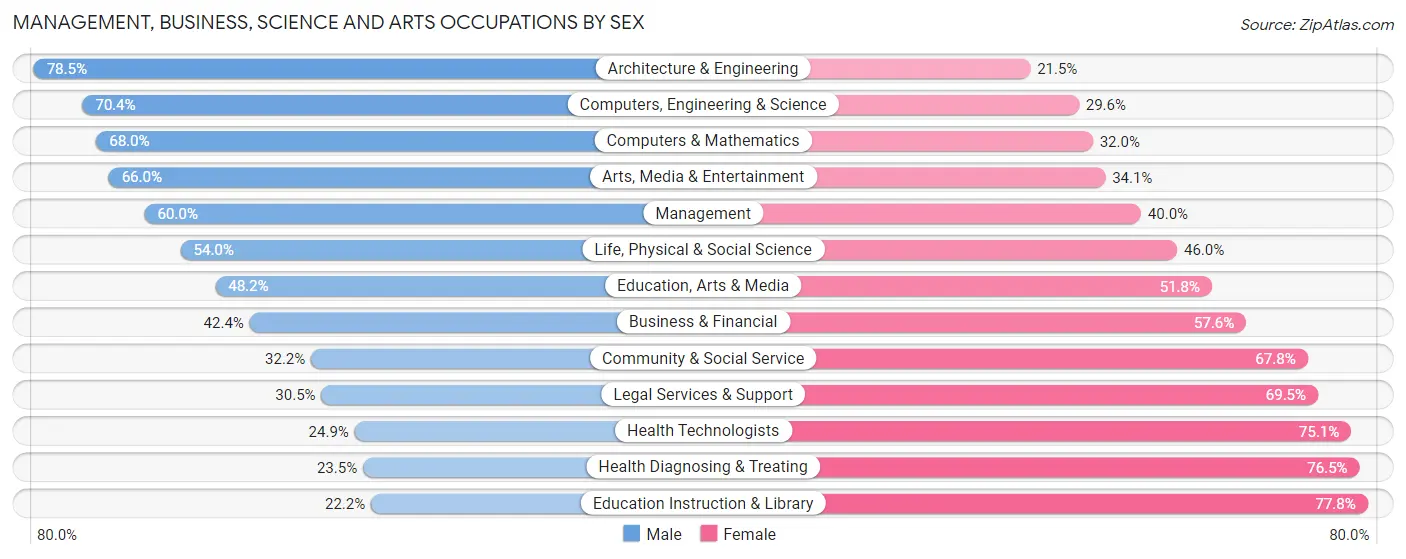
Management, Business, Science and Arts Occupations by Sex
Within the Management, Business, Science and Arts occupations in Brazoria County, the most male-oriented occupations are Architecture & Engineering (78.5%), Computers, Engineering & Science (70.4%), and Computers & Mathematics (68.0%), while the most female-oriented occupations are Education Instruction & Library (77.8%), Health Diagnosing & Treating (76.5%), and Health Technologists (75.1%).
| Occupation | Male | Female |
| Management | 12,122 (60.0%) | 8,084 (40.0%) |
| Business & Financial | 4,303 (42.4%) | 5,835 (57.6%) |
| Computers, Engineering & Science | 9,214 (70.4%) | 3,881 (29.6%) |
| Computers & Mathematics | 2,426 (68.0%) | 1,140 (32.0%) |
| Architecture & Engineering | 5,270 (78.5%) | 1,446 (21.5%) |
| Life, Physical & Social Science | 1,518 (54.0%) | 1,295 (46.0%) |
| Community & Social Service | 5,703 (32.2%) | 12,015 (67.8%) |
| Education, Arts & Media | 920 (48.2%) | 990 (51.8%) |
| Legal Services & Support | 433 (30.5%) | 988 (69.5%) |
| Education Instruction & Library | 2,603 (22.2%) | 9,135 (77.8%) |
| Arts, Media & Entertainment | 1,747 (65.9%) | 902 (34.1%) |
| Health Diagnosing & Treating | 3,276 (23.5%) | 10,646 (76.5%) |
| Health Technologists | 2,424 (24.9%) | 7,304 (75.1%) |
| Total (Category) | 34,618 (46.1%) | 40,461 (53.9%) |
| Total (Overall) | 94,347 (54.1%) | 79,983 (45.9%) |
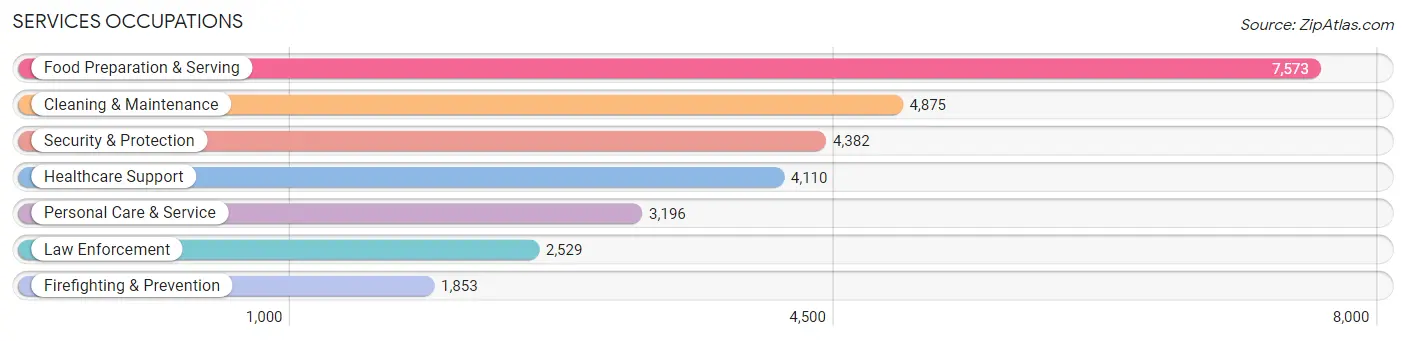
Services Occupations
The most common Services occupations in Brazoria County are Food Preparation & Serving (7,573 | 4.3%), Cleaning & Maintenance (4,875 | 2.8%), Security & Protection (4,382 | 2.5%), Healthcare Support (4,110 | 2.4%), and Personal Care & Service (3,196 | 1.8%).
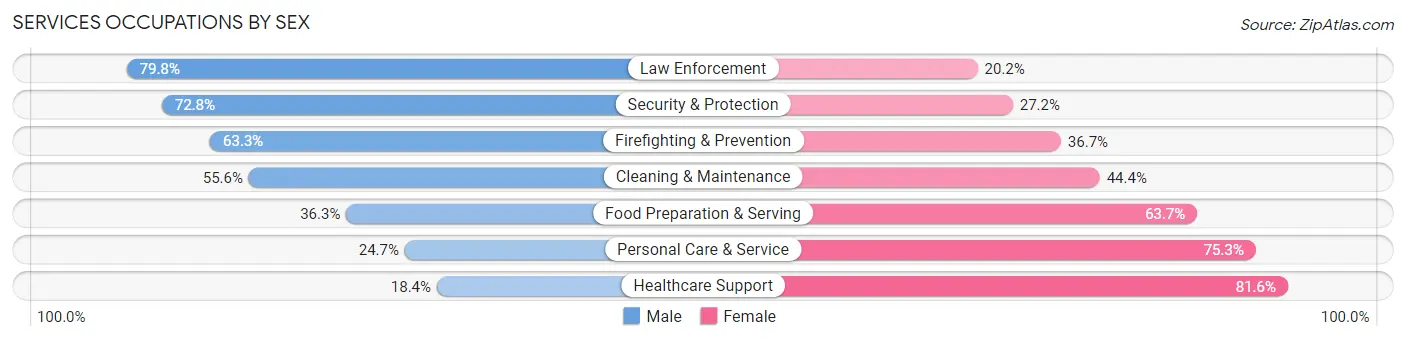
Services Occupations by Sex
Within the Services occupations in Brazoria County, the most male-oriented occupations are Law Enforcement (79.8%), Security & Protection (72.8%), and Firefighting & Prevention (63.3%), while the most female-oriented occupations are Healthcare Support (81.6%), Personal Care & Service (75.3%), and Food Preparation & Serving (63.7%).
| Occupation | Male | Female |
| Healthcare Support | 755 (18.4%) | 3,355 (81.6%) |
| Security & Protection | 3,191 (72.8%) | 1,191 (27.2%) |
| Firefighting & Prevention | 1,173 (63.3%) | 680 (36.7%) |
| Law Enforcement | 2,018 (79.8%) | 511 (20.2%) |
| Food Preparation & Serving | 2,750 (36.3%) | 4,823 (63.7%) |
| Cleaning & Maintenance | 2,711 (55.6%) | 2,164 (44.4%) |
| Personal Care & Service | 790 (24.7%) | 2,406 (75.3%) |
| Total (Category) | 10,197 (42.2%) | 13,939 (57.8%) |
| Total (Overall) | 94,347 (54.1%) | 79,983 (45.9%) |
Sales and Office Occupations
The most common Sales and Office occupations in Brazoria County are Office & Administration (18,432 | 10.6%), and Sales & Related (14,793 | 8.5%).

Sales and Office Occupations by Sex

| Occupation | Male | Female |
| Sales & Related | 7,360 (49.7%) | 7,433 (50.2%) |
| Office & Administration | 4,370 (23.7%) | 14,062 (76.3%) |
| Total (Category) | 11,730 (35.3%) | 21,495 (64.7%) |
| Total (Overall) | 94,347 (54.1%) | 79,983 (45.9%) |
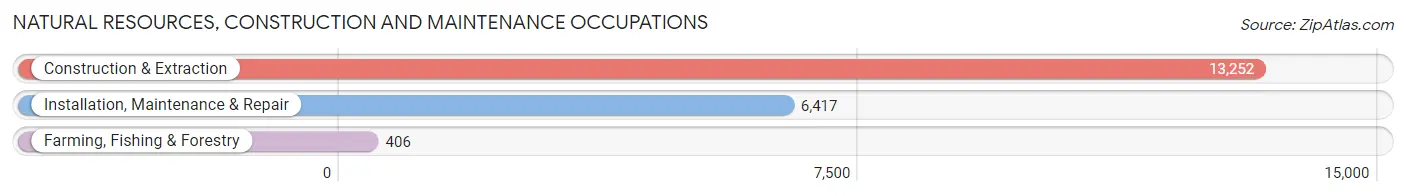
Natural Resources, Construction and Maintenance Occupations
The most common Natural Resources, Construction and Maintenance occupations in Brazoria County are Construction & Extraction (13,252 | 7.6%), Installation, Maintenance & Repair (6,417 | 3.7%), and Farming, Fishing & Forestry (406 | 0.2%).
Natural Resources, Construction and Maintenance Occupations by Sex
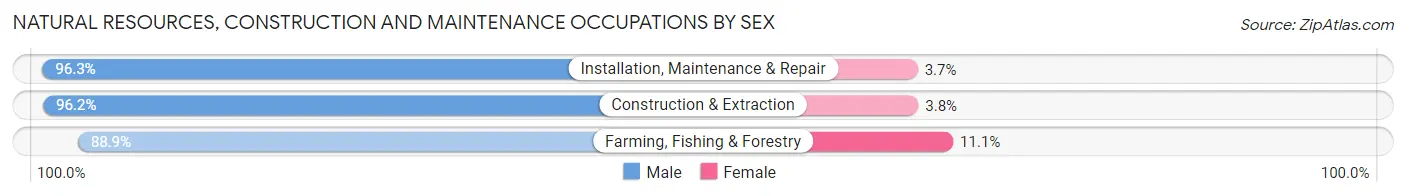
| Occupation | Male | Female |
| Farming, Fishing & Forestry | 361 (88.9%) | 45 (11.1%) |
| Construction & Extraction | 12,743 (96.2%) | 509 (3.8%) |
| Installation, Maintenance & Repair | 6,179 (96.3%) | 238 (3.7%) |
| Total (Category) | 19,283 (96.1%) | 792 (4.0%) |
| Total (Overall) | 94,347 (54.1%) | 79,983 (45.9%) |
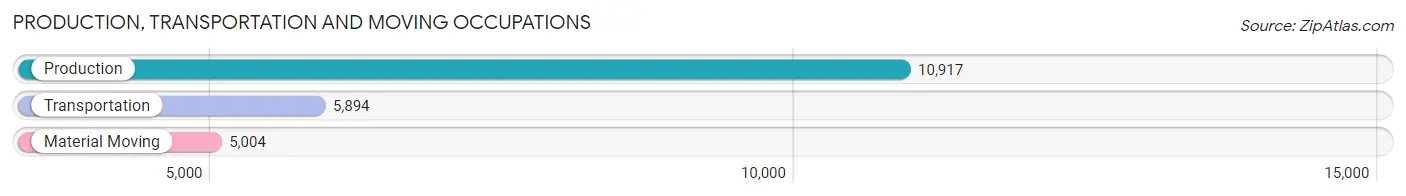
Production, Transportation and Moving Occupations
The most common Production, Transportation and Moving occupations in Brazoria County are Production (10,917 | 6.3%), Transportation (5,894 | 3.4%), and Material Moving (5,004 | 2.9%).
Production, Transportation and Moving Occupations by Sex
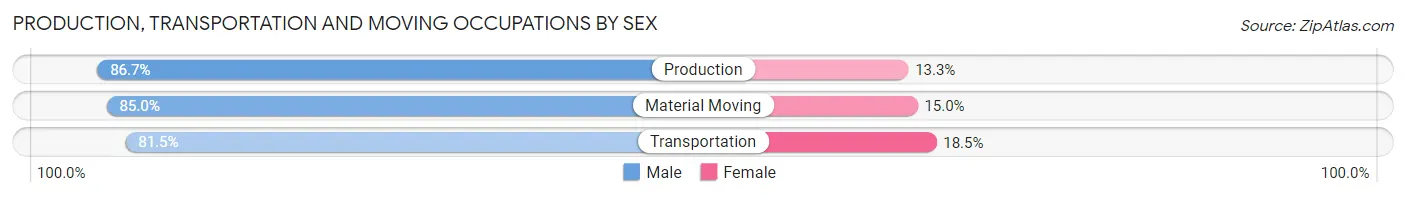
| Occupation | Male | Female |
| Production | 9,462 (86.7%) | 1,455 (13.3%) |
| Transportation | 4,805 (81.5%) | 1,089 (18.5%) |
| Material Moving | 4,252 (85.0%) | 752 (15.0%) |
| Total (Category) | 18,519 (84.9%) | 3,296 (15.1%) |
| Total (Overall) | 94,347 (54.1%) | 79,983 (45.9%) |
Employment Industries by Sex in Brazoria County
Employment Industries in Brazoria County
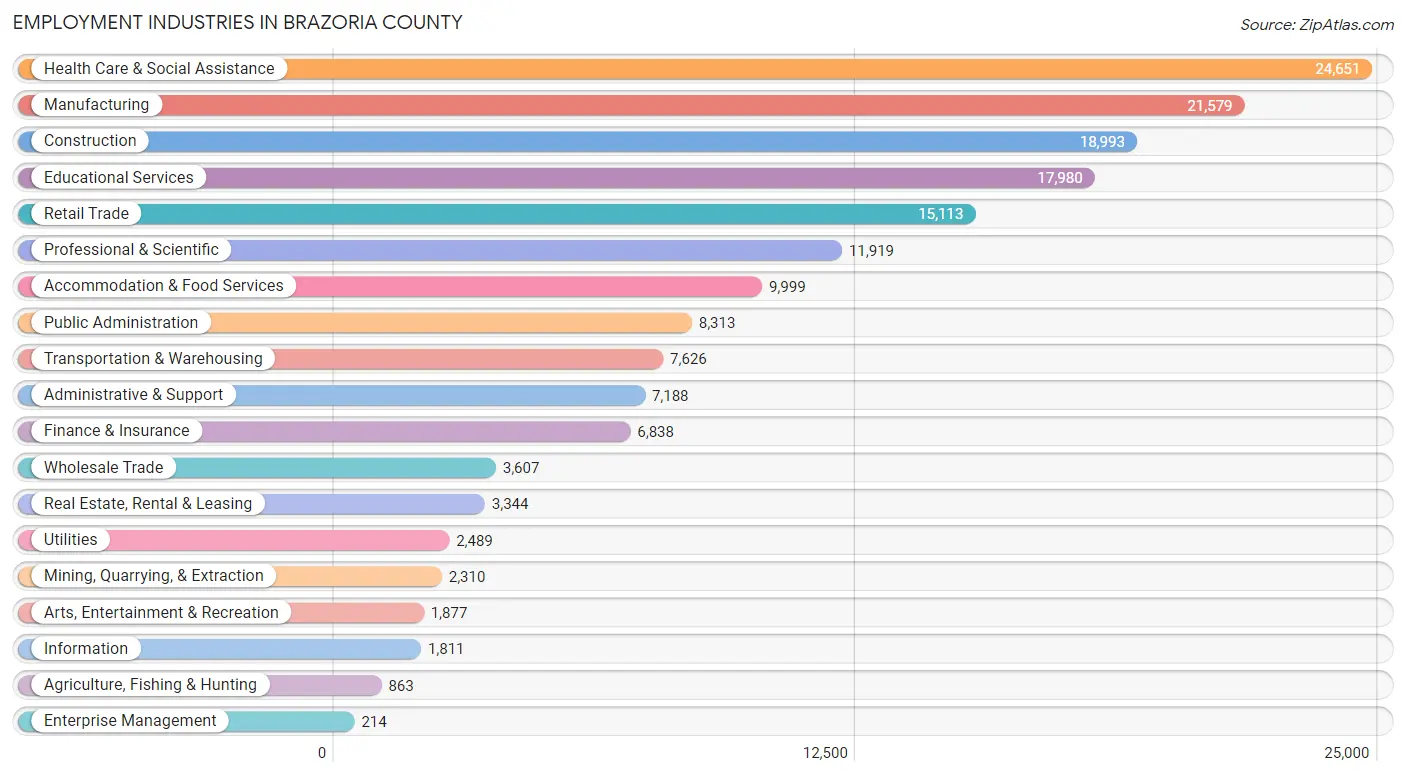
The major employment industries in Brazoria County include Health Care & Social Assistance (24,651 | 14.1%), Manufacturing (21,579 | 12.4%), Construction (18,993 | 10.9%), Educational Services (17,980 | 10.3%), and Retail Trade (15,113 | 8.7%).
Employment Industries by Sex in Brazoria County
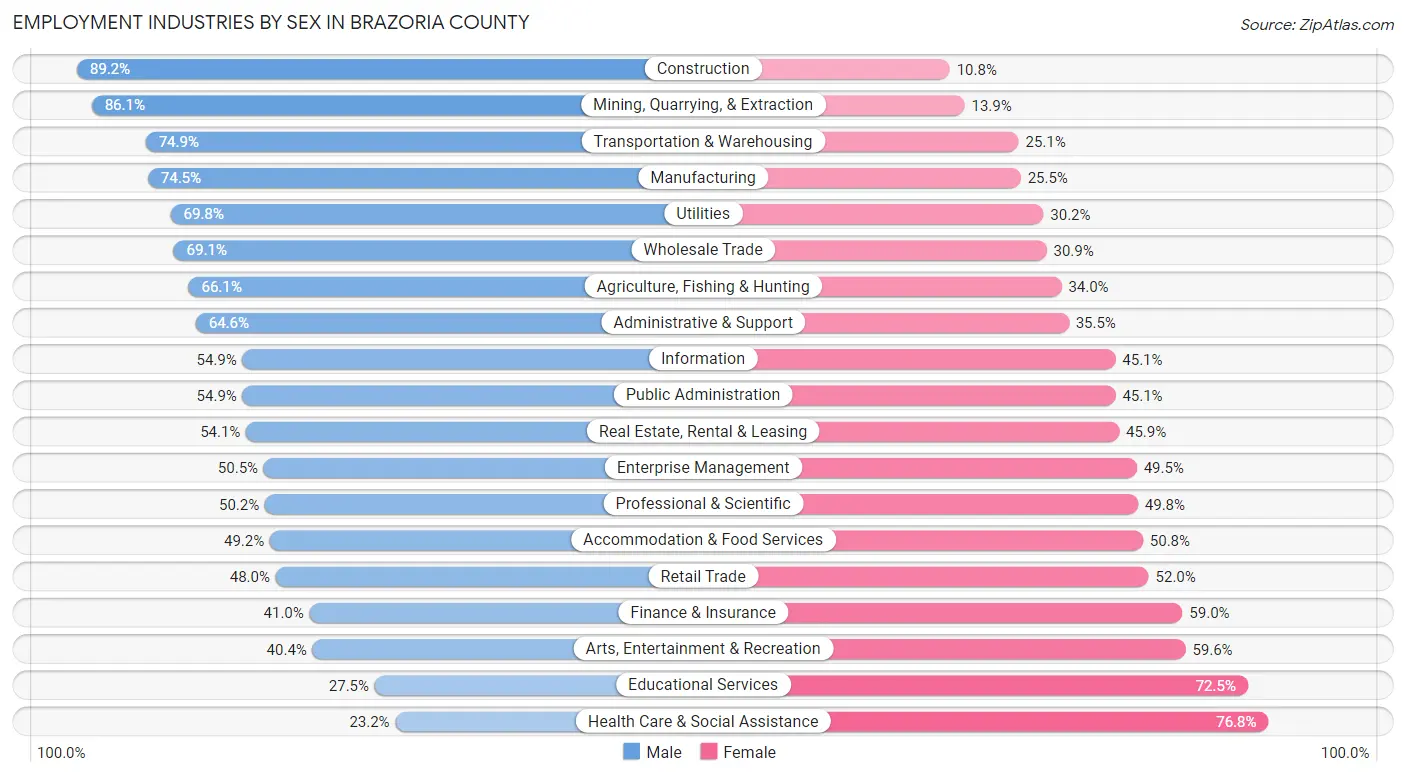
The Brazoria County industries that see more men than women are Construction (89.2%), Mining, Quarrying, & Extraction (86.1%), and Transportation & Warehousing (74.9%), whereas the industries that tend to have a higher number of women are Health Care & Social Assistance (76.8%), Educational Services (72.5%), and Arts, Entertainment & Recreation (59.6%).
| Industry | Male | Female |
| Agriculture, Fishing & Hunting | 570 (66.0%) | 293 (34.0%) |
| Mining, Quarrying, & Extraction | 1,989 (86.1%) | 321 (13.9%) |
| Construction | 16,936 (89.2%) | 2,057 (10.8%) |
| Manufacturing | 16,071 (74.5%) | 5,508 (25.5%) |
| Wholesale Trade | 2,494 (69.1%) | 1,113 (30.9%) |
| Retail Trade | 7,255 (48.0%) | 7,858 (52.0%) |
| Transportation & Warehousing | 5,714 (74.9%) | 1,912 (25.1%) |
| Utilities | 1,737 (69.8%) | 752 (30.2%) |
| Information | 994 (54.9%) | 817 (45.1%) |
| Finance & Insurance | 2,804 (41.0%) | 4,034 (59.0%) |
| Real Estate, Rental & Leasing | 1,810 (54.1%) | 1,534 (45.9%) |
| Professional & Scientific | 5,987 (50.2%) | 5,932 (49.8%) |
| Enterprise Management | 108 (50.5%) | 106 (49.5%) |
| Administrative & Support | 4,640 (64.5%) | 2,548 (35.4%) |
| Educational Services | 4,945 (27.5%) | 13,035 (72.5%) |
| Health Care & Social Assistance | 5,729 (23.2%) | 18,922 (76.8%) |
| Arts, Entertainment & Recreation | 758 (40.4%) | 1,119 (59.6%) |
| Accommodation & Food Services | 4,920 (49.2%) | 5,079 (50.8%) |
| Public Administration | 4,561 (54.9%) | 3,752 (45.1%) |
| Total | 94,347 (54.1%) | 79,983 (45.9%) |
Education in Brazoria County
School Enrollment in Brazoria County
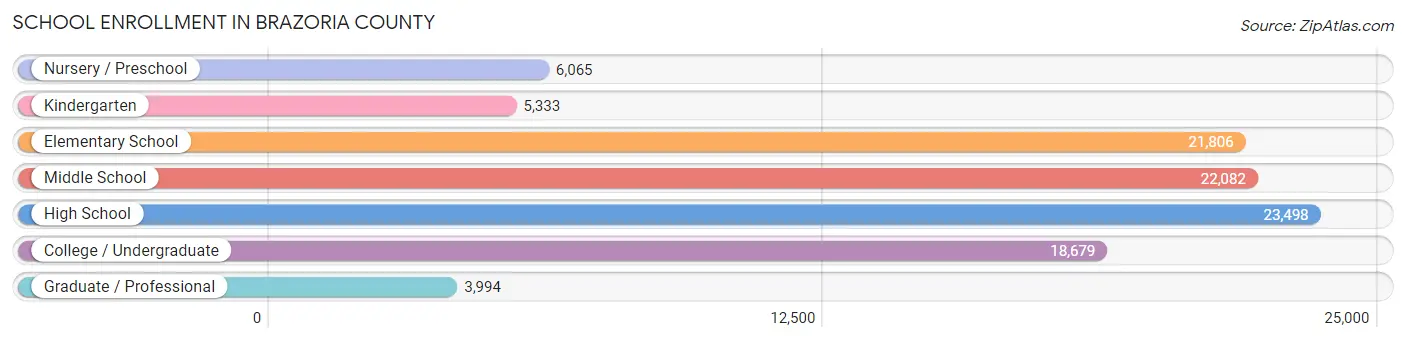
The most common levels of schooling among the 101,457 students in Brazoria County are high school (23,498 | 23.2%), middle school (22,082 | 21.8%), and elementary school (21,806 | 21.5%).
| School Level | # Students | % Students |
| Nursery / Preschool | 6,065 | 6.0% |
| Kindergarten | 5,333 | 5.3% |
| Elementary School | 21,806 | 21.5% |
| Middle School | 22,082 | 21.8% |
| High School | 23,498 | 23.2% |
| College / Undergraduate | 18,679 | 18.4% |
| Graduate / Professional | 3,994 | 3.9% |
| Total | 101,457 | 100.0% |
School Enrollment by Age by Funding Source in Brazoria County
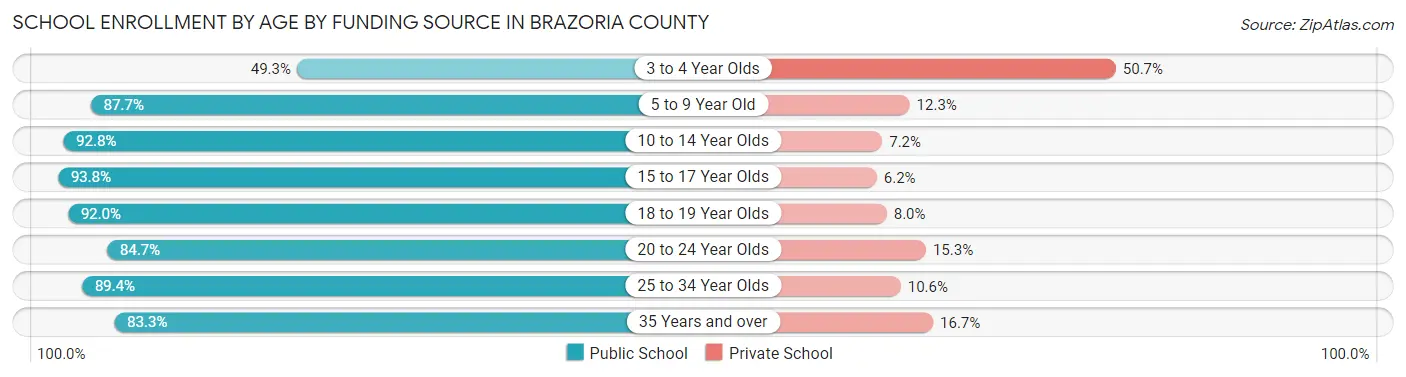
Out of a total of 101,457 students who are enrolled in schools in Brazoria County, 11,870 (11.7%) attend a private institution, while the remaining 89,587 (88.3%) are enrolled in public schools. The age group of 3 to 4 year olds has the highest likelihood of being enrolled in private schools, with 2,255 (50.7% in the age bracket) enrolled. Conversely, the age group of 15 to 17 year olds has the lowest likelihood of being enrolled in a private school, with 15,421 (93.8% in the age bracket) attending a public institution.
| Age Bracket | Public School | Private School |
| 3 to 4 Year Olds | 2,193 (49.3%) | 2,255 (50.7%) |
| 5 to 9 Year Old | 23,113 (87.7%) | 3,239 (12.3%) |
| 10 to 14 Year Olds | 25,958 (92.8%) | 2,011 (7.2%) |
| 15 to 17 Year Olds | 15,421 (93.8%) | 1,016 (6.2%) |
| 18 to 19 Year Olds | 6,411 (92.0%) | 560 (8.0%) |
| 20 to 24 Year Olds | 7,018 (84.7%) | 1,271 (15.3%) |
| 25 to 34 Year Olds | 5,006 (89.4%) | 596 (10.6%) |
| 35 Years and over | 4,491 (83.3%) | 898 (16.7%) |
| Total | 89,587 (88.3%) | 11,870 (11.7%) |
Educational Attainment by Field of Study in Brazoria County
Business (16,011 | 19.8%), science & technology (11,261 | 13.9%), engineering (10,712 | 13.2%), education (8,859 | 10.9%), and bio, nature & agricultural (6,126 | 7.6%) are the most common fields of study among 81,024 individuals in Brazoria County who have obtained a bachelor's degree or higher.
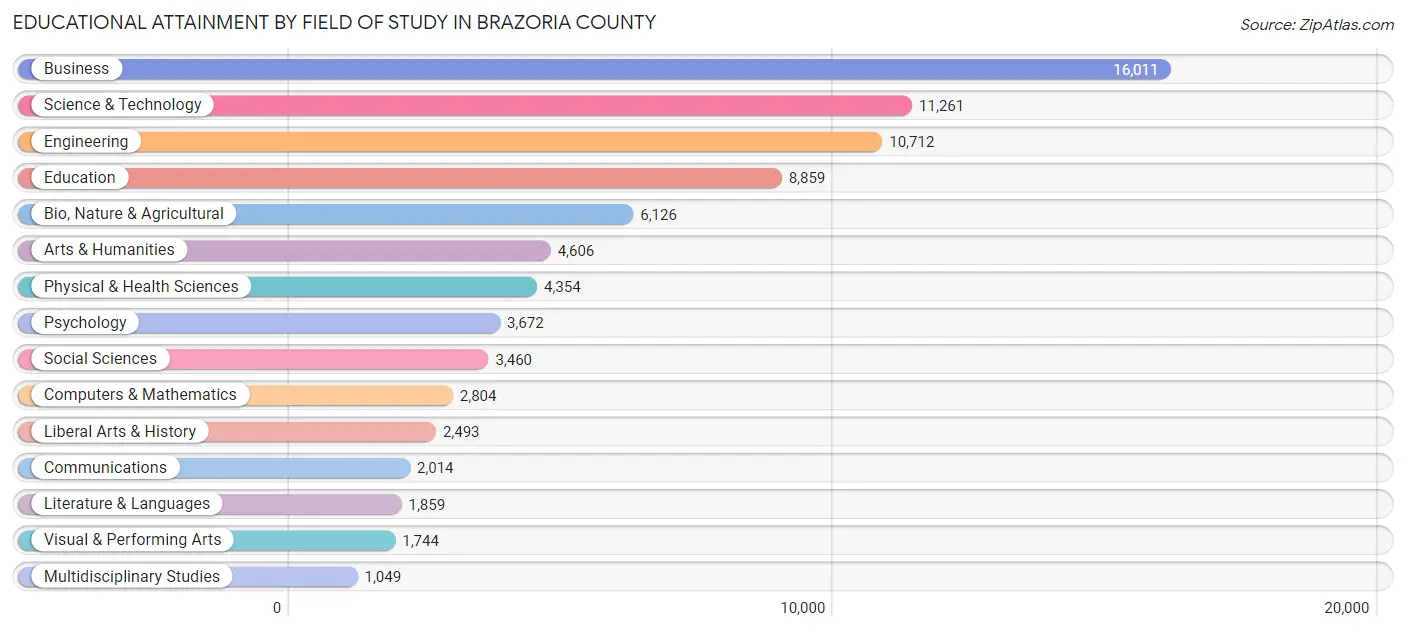
| Field of Study | # Graduates | % Graduates |
| Computers & Mathematics | 2,804 | 3.5% |
| Bio, Nature & Agricultural | 6,126 | 7.6% |
| Physical & Health Sciences | 4,354 | 5.4% |
| Psychology | 3,672 | 4.5% |
| Social Sciences | 3,460 | 4.3% |
| Engineering | 10,712 | 13.2% |
| Multidisciplinary Studies | 1,049 | 1.3% |
| Science & Technology | 11,261 | 13.9% |
| Business | 16,011 | 19.8% |
| Education | 8,859 | 10.9% |
| Literature & Languages | 1,859 | 2.3% |
| Liberal Arts & History | 2,493 | 3.1% |
| Visual & Performing Arts | 1,744 | 2.1% |
| Communications | 2,014 | 2.5% |
| Arts & Humanities | 4,606 | 5.7% |
| Total | 81,024 | 100.0% |
Transportation & Commute in Brazoria County
Vehicle Availability by Sex in Brazoria County
The most prevalent vehicle ownership categories in Brazoria County are males with 2 vehicles (43,007, accounting for 46.1%) and females with 2 vehicles (34,028, making up 54.9%).
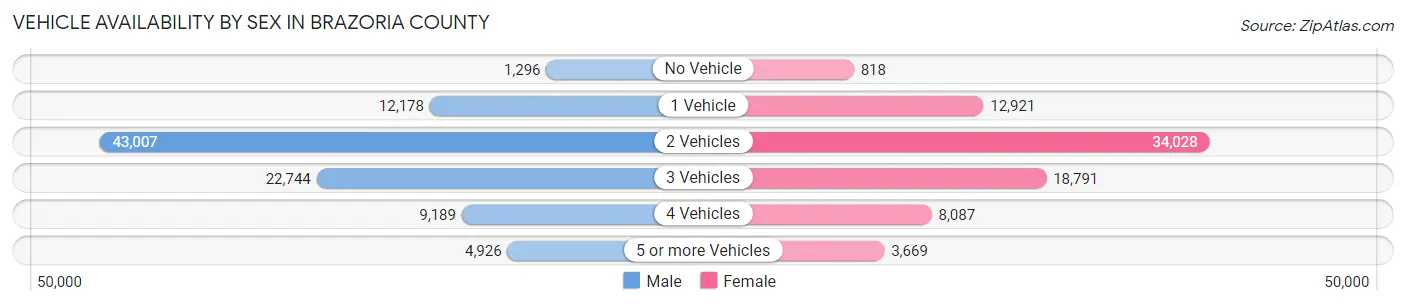
| Vehicles Available | Male | Female |
| No Vehicle | 1,296 (1.4%) | 818 (1.0%) |
| 1 Vehicle | 12,178 (13.1%) | 12,921 (16.5%) |
| 2 Vehicles | 43,007 (46.1%) | 34,028 (43.4%) |
| 3 Vehicles | 22,744 (24.4%) | 18,791 (24.0%) |
| 4 Vehicles | 9,189 (9.8%) | 8,087 (10.3%) |
| 5 or more Vehicles | 4,926 (5.3%) | 3,669 (4.7%) |
| Total | 93,340 (100.0%) | 78,314 (100.0%) |
Commute Time in Brazoria County
The most frequently occuring commute durations in Brazoria County are 30 to 34 minutes (25,774 commuters, 16.4%), 45 to 59 minutes (20,134 commuters, 12.8%), and 20 to 24 minutes (17,981 commuters, 11.5%).
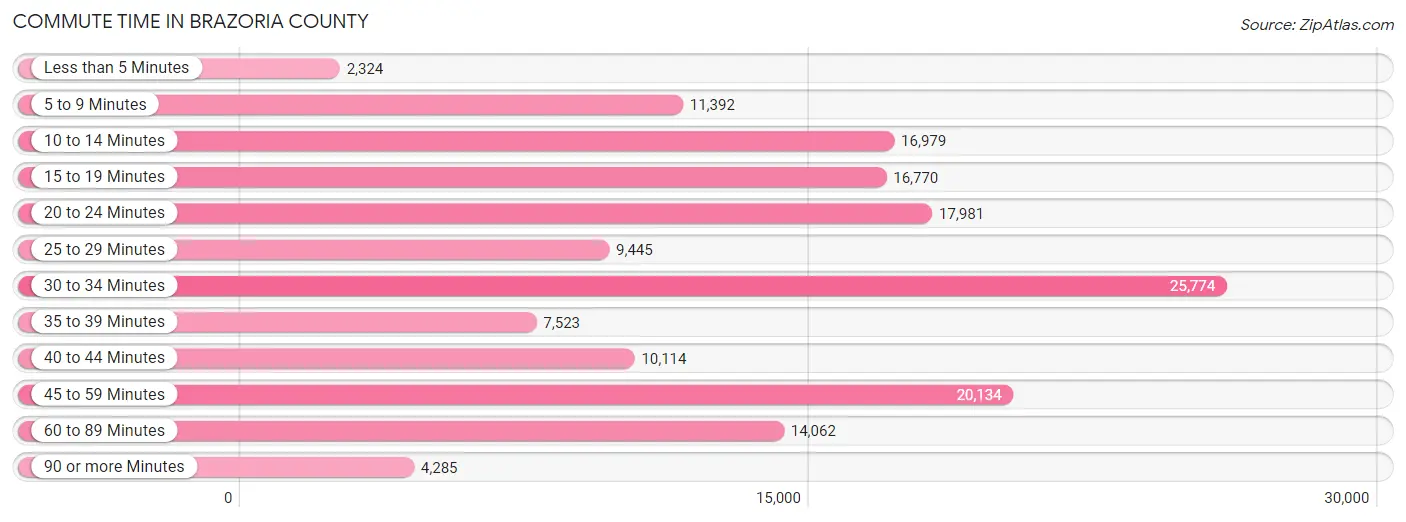
| Commute Time | # Commuters | % Commuters |
| Less than 5 Minutes | 2,324 | 1.5% |
| 5 to 9 Minutes | 11,392 | 7.3% |
| 10 to 14 Minutes | 16,979 | 10.8% |
| 15 to 19 Minutes | 16,770 | 10.7% |
| 20 to 24 Minutes | 17,981 | 11.5% |
| 25 to 29 Minutes | 9,445 | 6.0% |
| 30 to 34 Minutes | 25,774 | 16.4% |
| 35 to 39 Minutes | 7,523 | 4.8% |
| 40 to 44 Minutes | 10,114 | 6.5% |
| 45 to 59 Minutes | 20,134 | 12.8% |
| 60 to 89 Minutes | 14,062 | 9.0% |
| 90 or more Minutes | 4,285 | 2.7% |
Commute Time by Sex in Brazoria County
The most common commute times in Brazoria County are 30 to 34 minutes (14,965 commuters, 17.4%) for males and 30 to 34 minutes (10,809 commuters, 15.3%) for females.
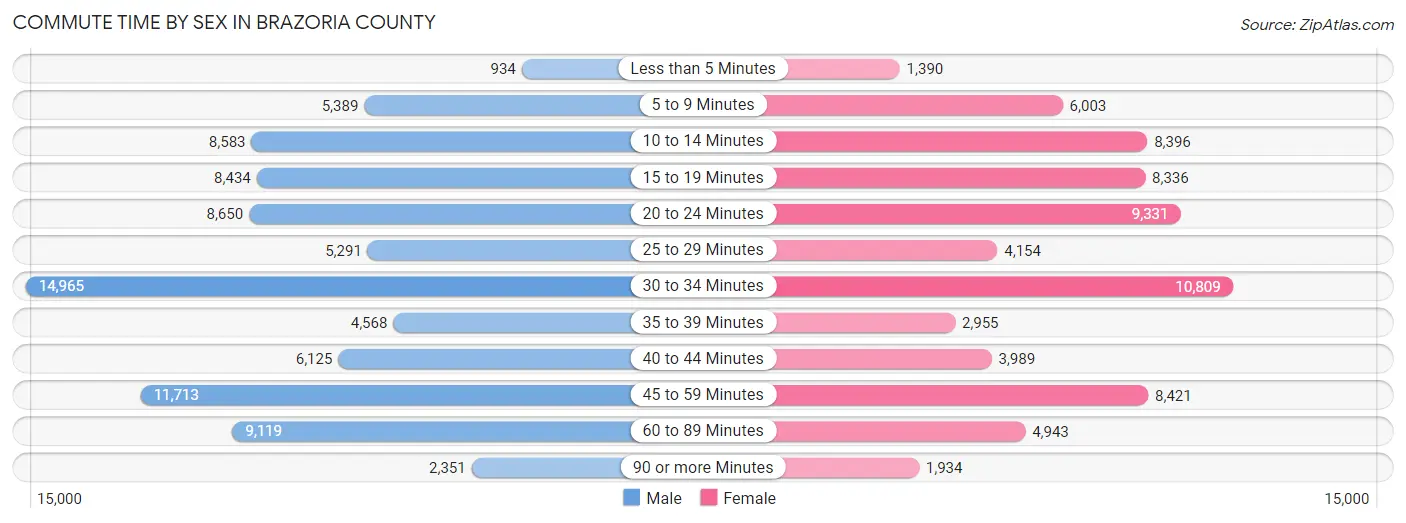
| Commute Time | Male | Female |
| Less than 5 Minutes | 934 (1.1%) | 1,390 (2.0%) |
| 5 to 9 Minutes | 5,389 (6.3%) | 6,003 (8.5%) |
| 10 to 14 Minutes | 8,583 (10.0%) | 8,396 (11.9%) |
| 15 to 19 Minutes | 8,434 (9.8%) | 8,336 (11.8%) |
| 20 to 24 Minutes | 8,650 (10.0%) | 9,331 (13.2%) |
| 25 to 29 Minutes | 5,291 (6.1%) | 4,154 (5.9%) |
| 30 to 34 Minutes | 14,965 (17.4%) | 10,809 (15.3%) |
| 35 to 39 Minutes | 4,568 (5.3%) | 2,955 (4.2%) |
| 40 to 44 Minutes | 6,125 (7.1%) | 3,989 (5.7%) |
| 45 to 59 Minutes | 11,713 (13.6%) | 8,421 (11.9%) |
| 60 to 89 Minutes | 9,119 (10.6%) | 4,943 (7.0%) |
| 90 or more Minutes | 2,351 (2.7%) | 1,934 (2.7%) |
Time of Departure to Work by Sex in Brazoria County
The most frequent times of departure to work in Brazoria County are 6:00 AM to 6:29 AM (13,533, 15.7%) for males and 7:00 AM to 7:29 AM (10,826, 15.3%) for females.
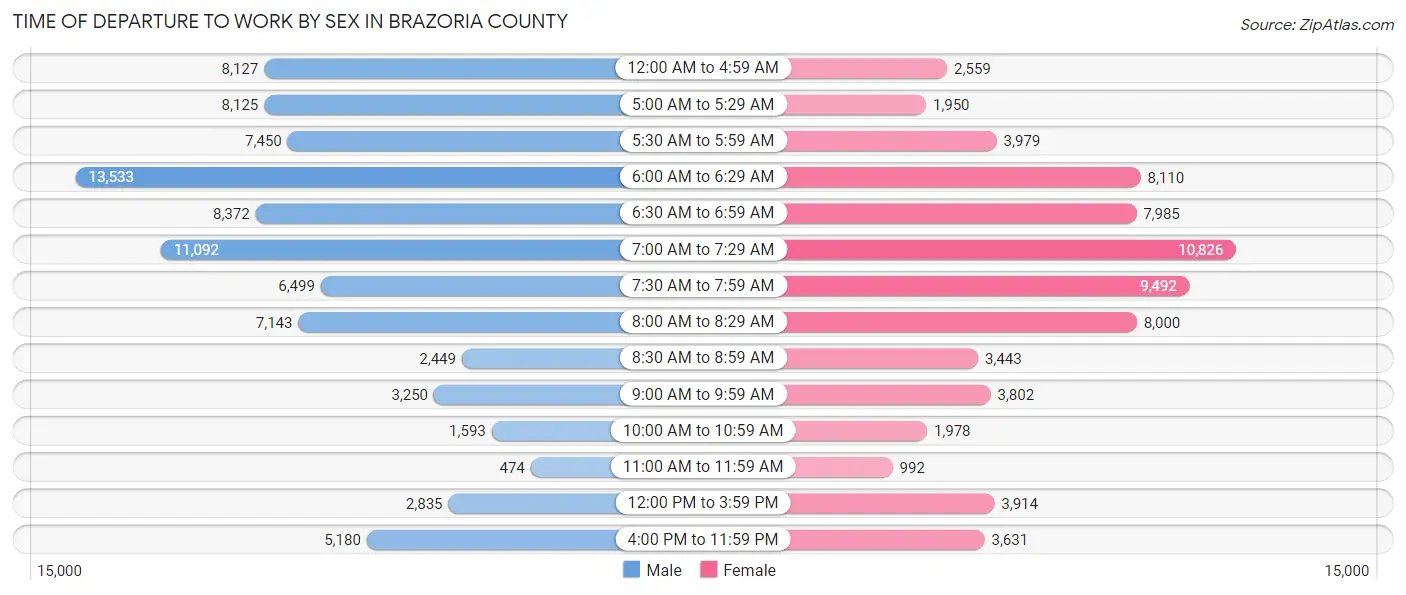
| Time of Departure | Male | Female |
| 12:00 AM to 4:59 AM | 8,127 (9.4%) | 2,559 (3.6%) |
| 5:00 AM to 5:29 AM | 8,125 (9.4%) | 1,950 (2.8%) |
| 5:30 AM to 5:59 AM | 7,450 (8.6%) | 3,979 (5.6%) |
| 6:00 AM to 6:29 AM | 13,533 (15.7%) | 8,110 (11.5%) |
| 6:30 AM to 6:59 AM | 8,372 (9.7%) | 7,985 (11.3%) |
| 7:00 AM to 7:29 AM | 11,092 (12.9%) | 10,826 (15.3%) |
| 7:30 AM to 7:59 AM | 6,499 (7.5%) | 9,492 (13.4%) |
| 8:00 AM to 8:29 AM | 7,143 (8.3%) | 8,000 (11.3%) |
| 8:30 AM to 8:59 AM | 2,449 (2.8%) | 3,443 (4.9%) |
| 9:00 AM to 9:59 AM | 3,250 (3.8%) | 3,802 (5.4%) |
| 10:00 AM to 10:59 AM | 1,593 (1.8%) | 1,978 (2.8%) |
| 11:00 AM to 11:59 AM | 474 (0.5%) | 992 (1.4%) |
| 12:00 PM to 3:59 PM | 2,835 (3.3%) | 3,914 (5.5%) |
| 4:00 PM to 11:59 PM | 5,180 (6.0%) | 3,631 (5.1%) |
| Total | 86,122 (100.0%) | 70,661 (100.0%) |
Housing Occupancy in Brazoria County
Occupancy by Ownership in Brazoria County
Of the total 127,264 dwellings in Brazoria County, owner-occupied units account for 94,249 (74.1%), while renter-occupied units make up 33,015 (25.9%).
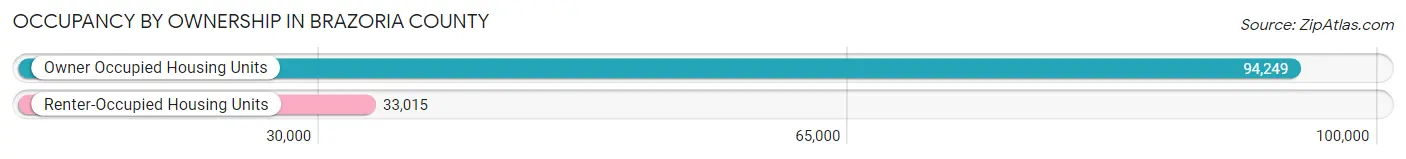
| Occupancy | # Housing Units | % Housing Units |
| Owner Occupied Housing Units | 94,249 | 74.1% |
| Renter-Occupied Housing Units | 33,015 | 25.9% |
| Total Occupied Housing Units | 127,264 | 100.0% |
Occupancy by Household Size in Brazoria County
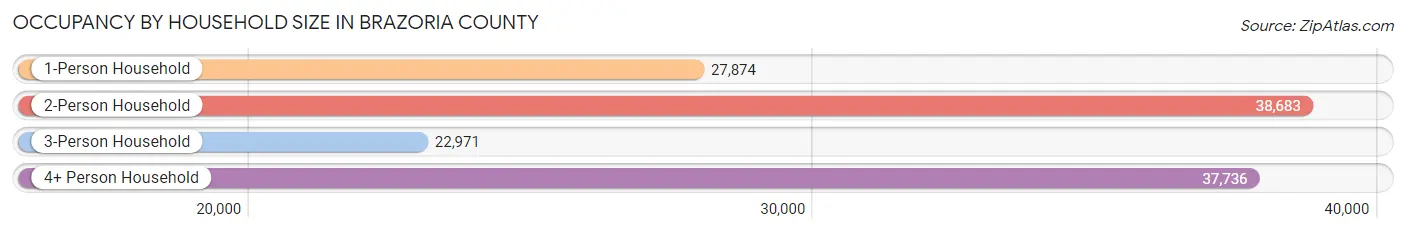
| Household Size | # Housing Units | % Housing Units |
| 1-Person Household | 27,874 | 21.9% |
| 2-Person Household | 38,683 | 30.4% |
| 3-Person Household | 22,971 | 18.0% |
| 4+ Person Household | 37,736 | 29.6% |
| Total Housing Units | 127,264 | 100.0% |
Occupancy by Ownership by Household Size in Brazoria County
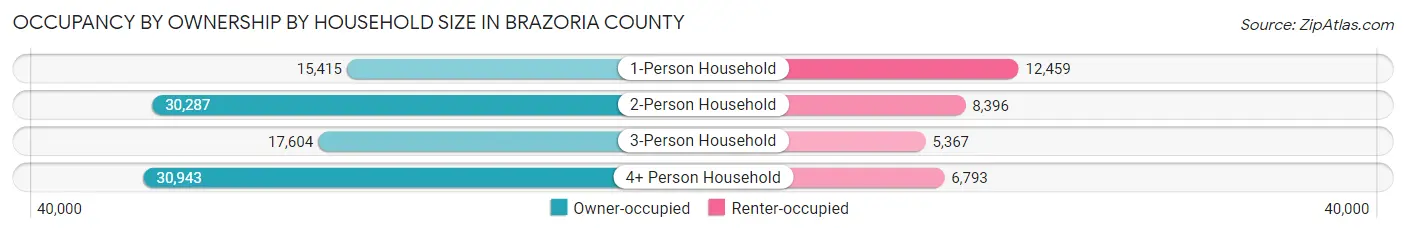
| Household Size | Owner-occupied | Renter-occupied |
| 1-Person Household | 15,415 (55.3%) | 12,459 (44.7%) |
| 2-Person Household | 30,287 (78.3%) | 8,396 (21.7%) |
| 3-Person Household | 17,604 (76.6%) | 5,367 (23.4%) |
| 4+ Person Household | 30,943 (82.0%) | 6,793 (18.0%) |
| Total Housing Units | 94,249 (74.1%) | 33,015 (25.9%) |
Occupancy by Educational Attainment in Brazoria County
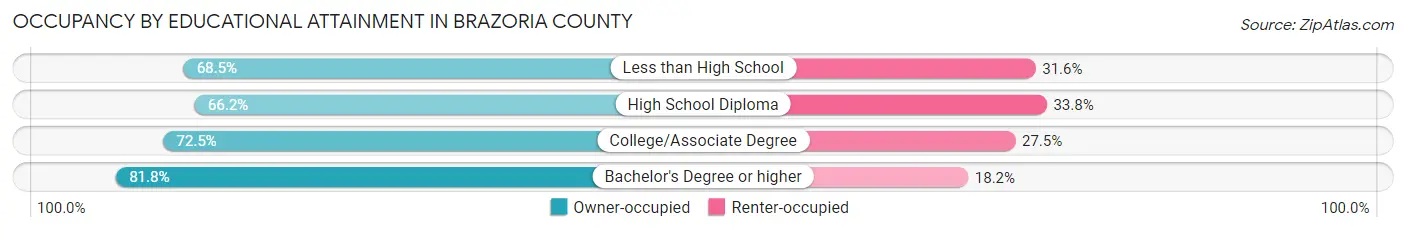
| Household Size | Owner-occupied | Renter-occupied |
| Less than High School | 7,482 (68.4%) | 3,449 (31.6%) |
| High School Diploma | 18,016 (66.2%) | 9,186 (33.8%) |
| College/Associate Degree | 32,387 (72.5%) | 12,301 (27.5%) |
| Bachelor's Degree or higher | 36,364 (81.8%) | 8,079 (18.2%) |
Occupancy by Age of Householder in Brazoria County
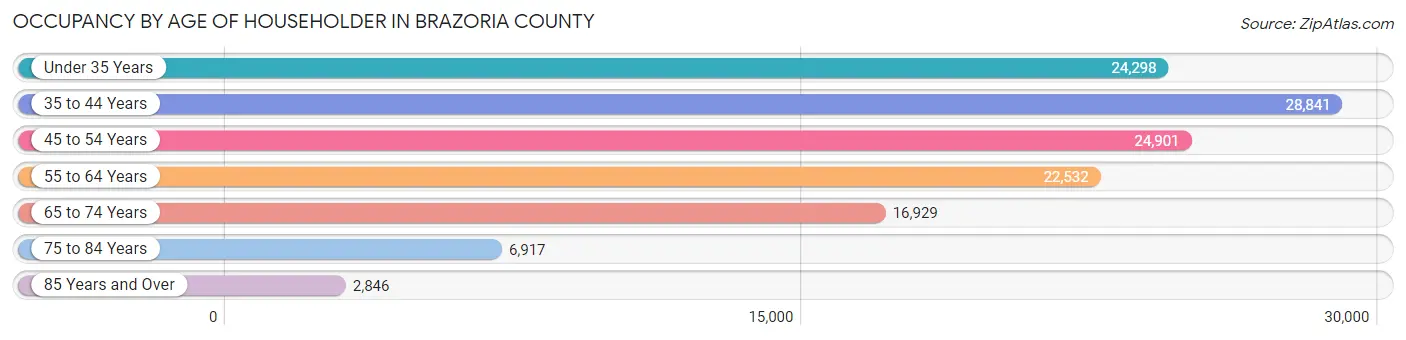
| Age Bracket | # Households | % Households |
| Under 35 Years | 24,298 | 19.1% |
| 35 to 44 Years | 28,841 | 22.7% |
| 45 to 54 Years | 24,901 | 19.6% |
| 55 to 64 Years | 22,532 | 17.7% |
| 65 to 74 Years | 16,929 | 13.3% |
| 75 to 84 Years | 6,917 | 5.4% |
| 85 Years and Over | 2,846 | 2.2% |
| Total | 127,264 | 100.0% |
Housing Finances in Brazoria County
Median Income by Occupancy in Brazoria County
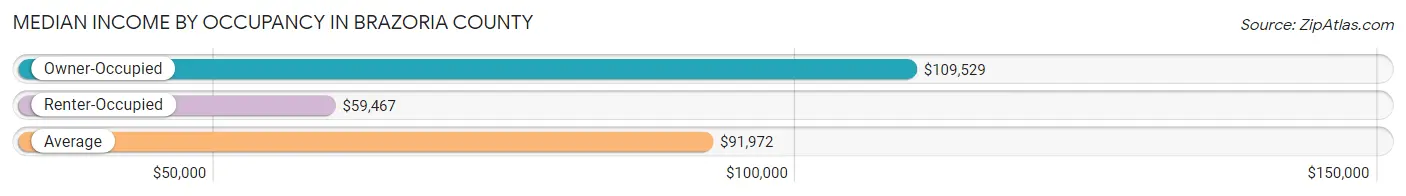
| Occupancy Type | # Households | Median Income |
| Owner-Occupied | 94,249 (74.1%) | $109,529 |
| Renter-Occupied | 33,015 (25.9%) | $59,467 |
| Average | 127,264 (100.0%) | $91,972 |
Occupancy by Householder Income Bracket in Brazoria County
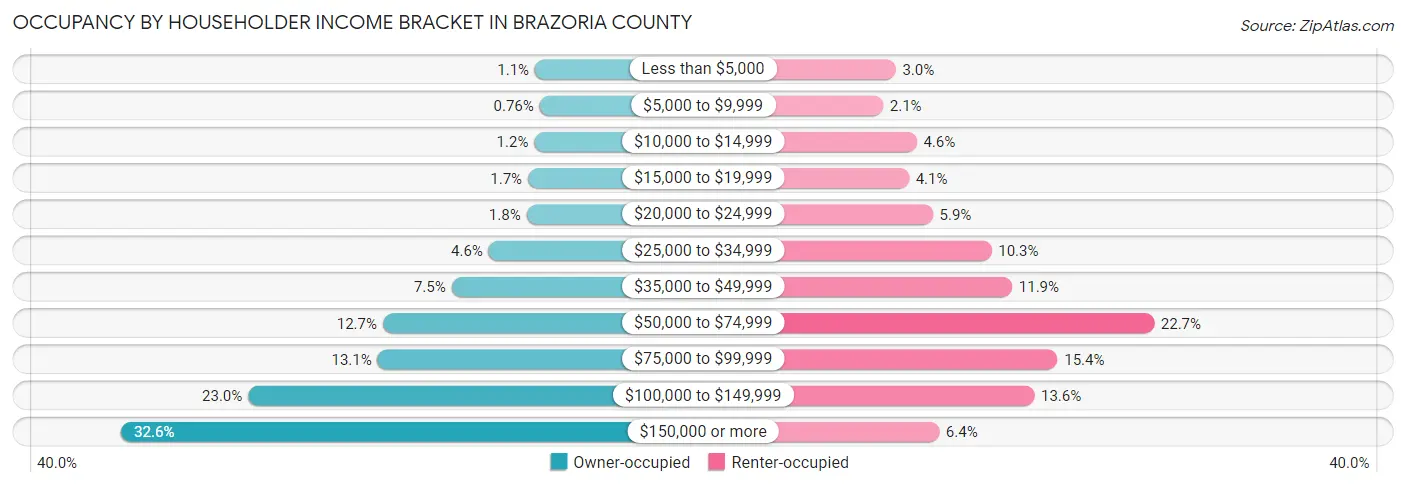
| Income Bracket | Owner-occupied | Renter-occupied |
| Less than $5,000 | 1,057 (1.1%) | 1,003 (3.0%) |
| $5,000 to $9,999 | 716 (0.8%) | 688 (2.1%) |
| $10,000 to $14,999 | 1,101 (1.2%) | 1,532 (4.6%) |
| $15,000 to $19,999 | 1,559 (1.7%) | 1,337 (4.1%) |
| $20,000 to $24,999 | 1,661 (1.8%) | 1,939 (5.9%) |
| $25,000 to $34,999 | 4,373 (4.6%) | 3,414 (10.3%) |
| $35,000 to $49,999 | 7,040 (7.5%) | 3,933 (11.9%) |
| $50,000 to $74,999 | 11,976 (12.7%) | 7,505 (22.7%) |
| $75,000 to $99,999 | 12,357 (13.1%) | 5,076 (15.4%) |
| $100,000 to $149,999 | 21,650 (23.0%) | 4,491 (13.6%) |
| $150,000 or more | 30,759 (32.6%) | 2,097 (6.4%) |
| Total | 94,249 (100.0%) | 33,015 (100.0%) |
Monthly Housing Cost Tiers in Brazoria County
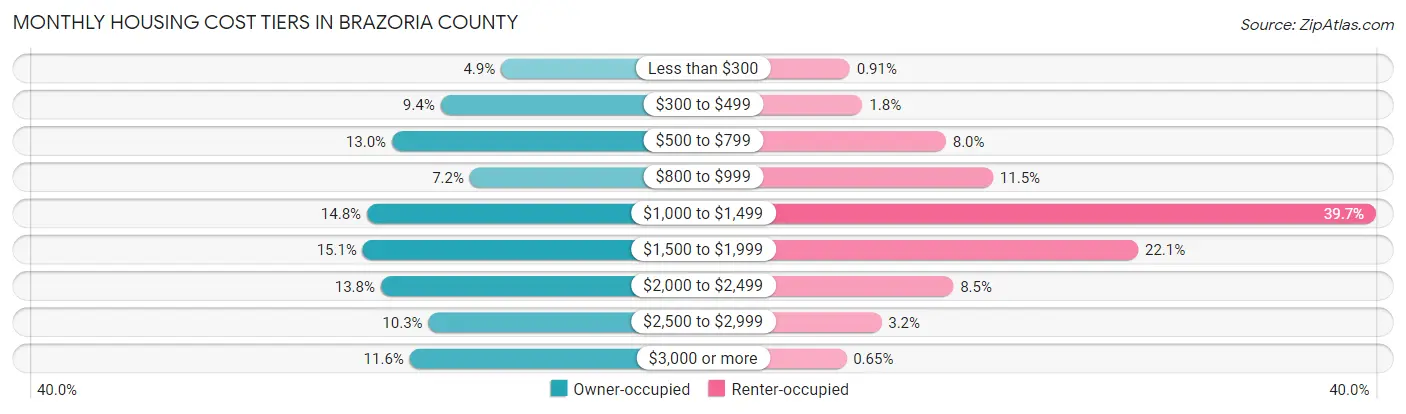
| Monthly Cost | Owner-occupied | Renter-occupied |
| Less than $300 | 4,626 (4.9%) | 302 (0.9%) |
| $300 to $499 | 8,829 (9.4%) | 607 (1.8%) |
| $500 to $799 | 12,201 (13.0%) | 2,633 (8.0%) |
| $800 to $999 | 6,795 (7.2%) | 3,780 (11.5%) |
| $1,000 to $1,499 | 13,942 (14.8%) | 13,095 (39.7%) |
| $1,500 to $1,999 | 14,236 (15.1%) | 7,311 (22.1%) |
| $2,000 to $2,499 | 12,976 (13.8%) | 2,817 (8.5%) |
| $2,500 to $2,999 | 9,671 (10.3%) | 1,068 (3.2%) |
| $3,000 or more | 10,973 (11.6%) | 213 (0.6%) |
| Total | 94,249 (100.0%) | 33,015 (100.0%) |
Physical Housing Characteristics in Brazoria County
Housing Structures in Brazoria County
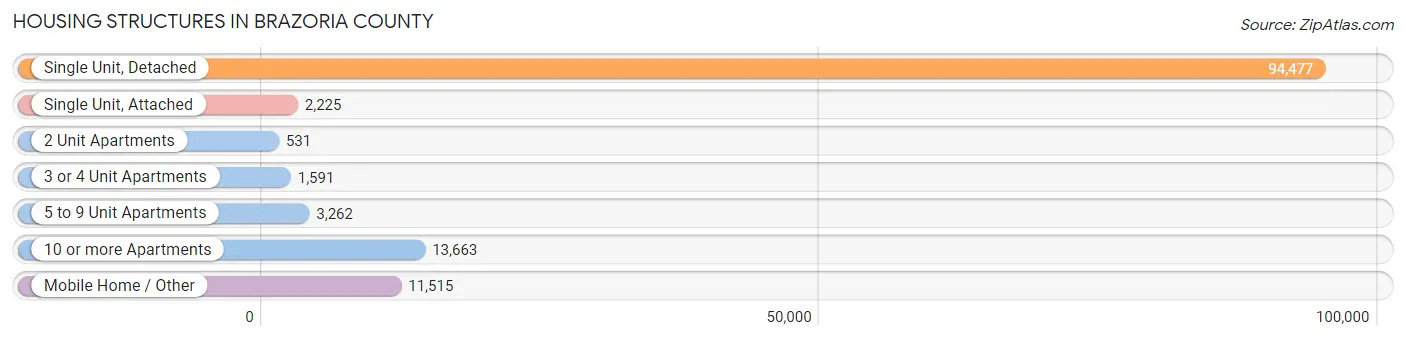
| Structure Type | # Housing Units | % Housing Units |
| Single Unit, Detached | 94,477 | 74.2% |
| Single Unit, Attached | 2,225 | 1.8% |
| 2 Unit Apartments | 531 | 0.4% |
| 3 or 4 Unit Apartments | 1,591 | 1.3% |
| 5 to 9 Unit Apartments | 3,262 | 2.6% |
| 10 or more Apartments | 13,663 | 10.7% |
| Mobile Home / Other | 11,515 | 9.0% |
| Total | 127,264 | 100.0% |
Housing Structures by Occupancy in Brazoria County
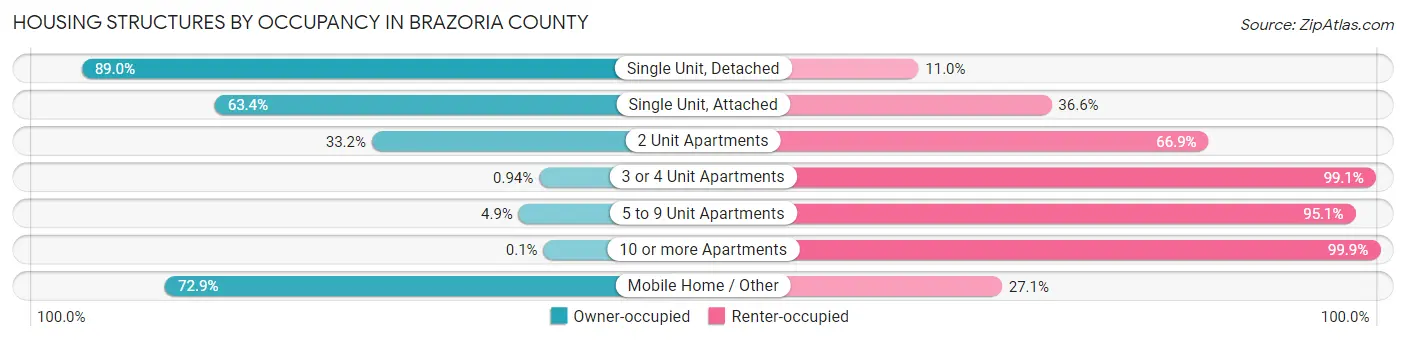
| Structure Type | Owner-occupied | Renter-occupied |
| Single Unit, Detached | 84,078 (89.0%) | 10,399 (11.0%) |
| Single Unit, Attached | 1,410 (63.4%) | 815 (36.6%) |
| 2 Unit Apartments | 176 (33.2%) | 355 (66.8%) |
| 3 or 4 Unit Apartments | 15 (0.9%) | 1,576 (99.1%) |
| 5 to 9 Unit Apartments | 159 (4.9%) | 3,103 (95.1%) |
| 10 or more Apartments | 13 (0.1%) | 13,650 (99.9%) |
| Mobile Home / Other | 8,398 (72.9%) | 3,117 (27.1%) |
| Total | 94,249 (74.1%) | 33,015 (25.9%) |
Housing Structures by Number of Rooms in Brazoria County
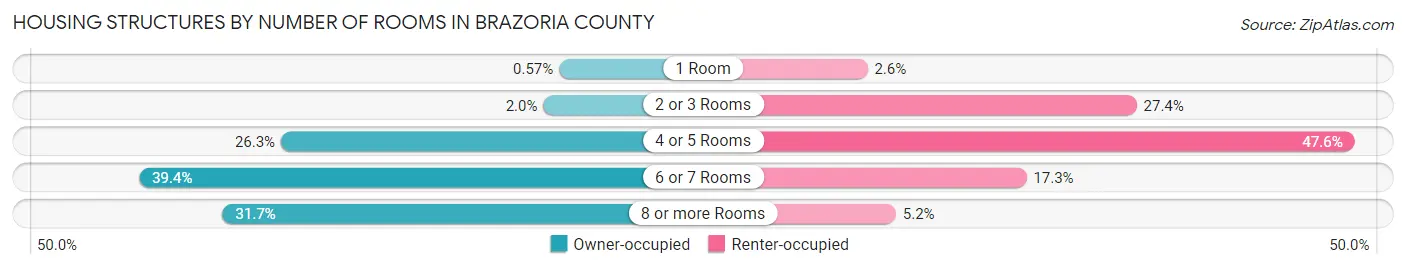
| Number of Rooms | Owner-occupied | Renter-occupied |
| 1 Room | 535 (0.6%) | 842 (2.5%) |
| 2 or 3 Rooms | 1,909 (2.0%) | 9,059 (27.4%) |
| 4 or 5 Rooms | 24,782 (26.3%) | 15,713 (47.6%) |
| 6 or 7 Rooms | 37,150 (39.4%) | 5,694 (17.2%) |
| 8 or more Rooms | 29,873 (31.7%) | 1,707 (5.2%) |
| Total | 94,249 (100.0%) | 33,015 (100.0%) |
Housing Structure by Heating Type in Brazoria County
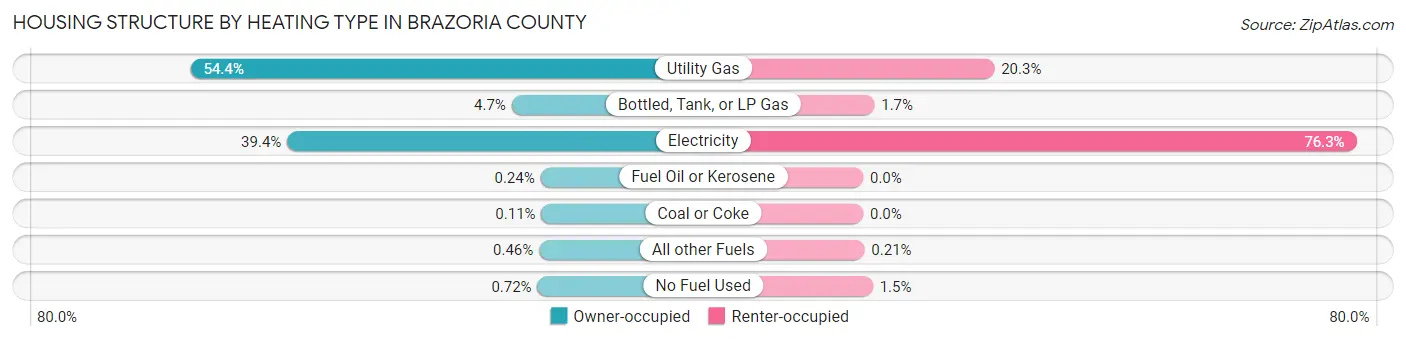
| Heating Type | Owner-occupied | Renter-occupied |
| Utility Gas | 51,229 (54.3%) | 6,696 (20.3%) |
| Bottled, Tank, or LP Gas | 4,434 (4.7%) | 575 (1.7%) |
| Electricity | 37,139 (39.4%) | 25,180 (76.3%) |
| Fuel Oil or Kerosene | 224 (0.2%) | 0 (0.0%) |
| Coal or Coke | 106 (0.1%) | 0 (0.0%) |
| All other Fuels | 434 (0.5%) | 68 (0.2%) |
| No Fuel Used | 683 (0.7%) | 496 (1.5%) |
| Total | 94,249 (100.0%) | 33,015 (100.0%) |
Household Vehicle Usage in Brazoria County
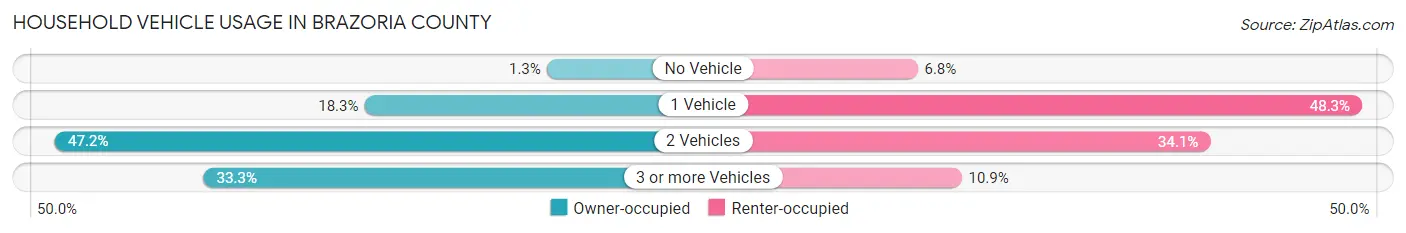
| Vehicles per Household | Owner-occupied | Renter-occupied |
| No Vehicle | 1,199 (1.3%) | 2,237 (6.8%) |
| 1 Vehicle | 17,241 (18.3%) | 15,930 (48.2%) |
| 2 Vehicles | 44,434 (47.1%) | 11,254 (34.1%) |
| 3 or more Vehicles | 31,375 (33.3%) | 3,594 (10.9%) |
| Total | 94,249 (100.0%) | 33,015 (100.0%) |
Real Estate & Mortgages in Brazoria County
Real Estate and Mortgage Overview in Brazoria County
| Characteristic | Without Mortgage | With Mortgage |
| Housing Units | 36,853 | 57,396 |
| Median Property Value | $200,000 | $286,800 |
| Median Household Income | $75,746 | $23,384 |
| Monthly Housing Costs | $639 | $10,835 |
| Real Estate Taxes | $2,752 | $1,916 |
Property Value by Mortgage Status in Brazoria County
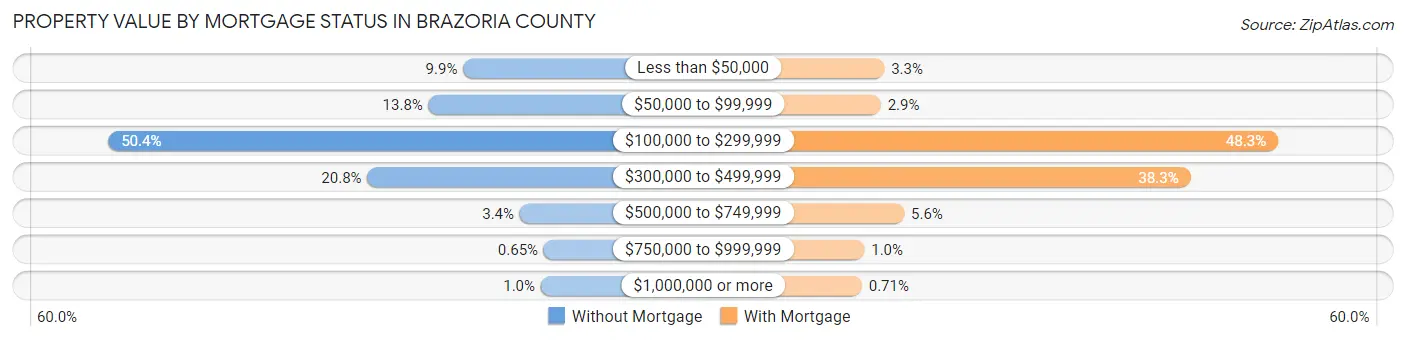
| Property Value | Without Mortgage | With Mortgage |
| Less than $50,000 | 3,637 (9.9%) | 1,883 (3.3%) |
| $50,000 to $99,999 | 5,092 (13.8%) | 1,653 (2.9%) |
| $100,000 to $299,999 | 18,590 (50.4%) | 27,718 (48.3%) |
| $300,000 to $499,999 | 7,671 (20.8%) | 21,972 (38.3%) |
| $500,000 to $749,999 | 1,254 (3.4%) | 3,188 (5.6%) |
| $750,000 to $999,999 | 239 (0.6%) | 574 (1.0%) |
| $1,000,000 or more | 370 (1.0%) | 408 (0.7%) |
| Total | 36,853 (100.0%) | 57,396 (100.0%) |
Household Income by Mortgage Status in Brazoria County
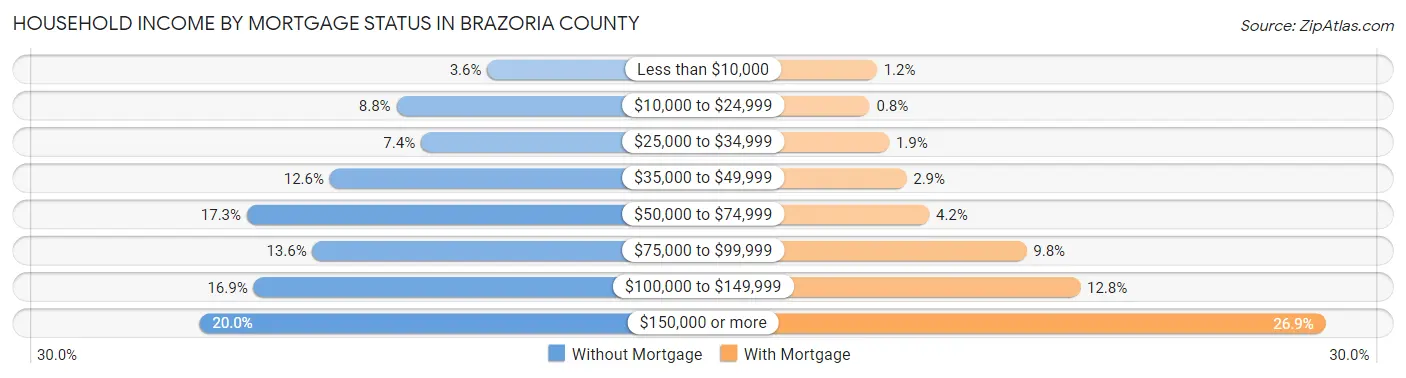
| Household Income | Without Mortgage | With Mortgage |
| Less than $10,000 | 1,312 (3.6%) | 692 (1.2%) |
| $10,000 to $24,999 | 3,226 (8.7%) | 461 (0.8%) |
| $25,000 to $34,999 | 2,708 (7.3%) | 1,095 (1.9%) |
| $35,000 to $49,999 | 4,629 (12.6%) | 1,665 (2.9%) |
| $50,000 to $74,999 | 6,376 (17.3%) | 2,411 (4.2%) |
| $75,000 to $99,999 | 4,992 (13.6%) | 5,600 (9.8%) |
| $100,000 to $149,999 | 6,235 (16.9%) | 7,365 (12.8%) |
| $150,000 or more | 7,375 (20.0%) | 15,415 (26.9%) |
| Total | 36,853 (100.0%) | 57,396 (100.0%) |
Property Value to Household Income Ratio in Brazoria County
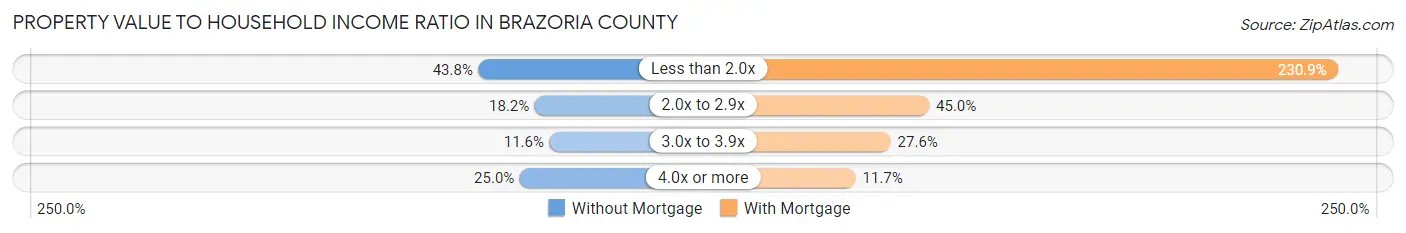
| Value-to-Income Ratio | Without Mortgage | With Mortgage |
| Less than 2.0x | 16,147 (43.8%) | 132,534 (230.9%) |
| 2.0x to 2.9x | 6,712 (18.2%) | 25,849 (45.0%) |
| 3.0x to 3.9x | 4,259 (11.6%) | 15,831 (27.6%) |
| 4.0x or more | 9,211 (25.0%) | 6,699 (11.7%) |
| Total | 36,853 (100.0%) | 57,396 (100.0%) |
Real Estate Taxes by Mortgage Status in Brazoria County

| Property Taxes | Without Mortgage | With Mortgage |
| Less than $800 | 6,343 (17.2%) | 39 (0.1%) |
| $800 to $1,499 | 4,820 (13.1%) | 2,237 (3.9%) |
| $800 to $1,499 | 23,396 (63.5%) | 2,439 (4.3%) |
| Total | 36,853 (100.0%) | 57,396 (100.0%) |
Health & Disability in Brazoria County
Health Insurance Coverage by Age in Brazoria County
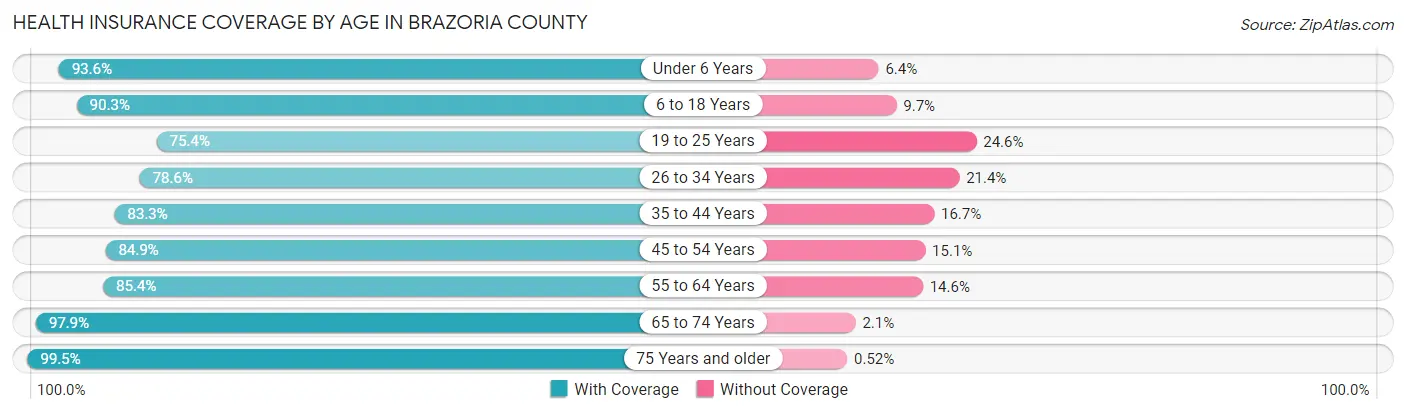
| Age Bracket | With Coverage | Without Coverage |
| Under 6 Years | 27,293 (93.6%) | 1,856 (6.4%) |
| 6 to 18 Years | 66,385 (90.3%) | 7,135 (9.7%) |
| 19 to 25 Years | 22,478 (75.4%) | 7,339 (24.6%) |
| 26 to 34 Years | 34,241 (78.6%) | 9,341 (21.4%) |
| 35 to 44 Years | 44,544 (83.3%) | 8,953 (16.7%) |
| 45 to 54 Years | 39,733 (84.9%) | 7,053 (15.1%) |
| 55 to 64 Years | 35,201 (85.4%) | 6,034 (14.6%) |
| 65 to 74 Years | 27,538 (97.9%) | 588 (2.1%) |
| 75 Years and older | 16,376 (99.5%) | 85 (0.5%) |
| Total | 313,789 (86.6%) | 48,384 (13.4%) |
Health Insurance Coverage by Citizenship Status in Brazoria County

| Citizenship Status | With Coverage | Without Coverage |
| Native Born | 27,293 (93.6%) | 1,856 (6.4%) |
| Foreign Born, Citizen | 66,385 (90.3%) | 7,135 (9.7%) |
| Foreign Born, not a Citizen | 22,478 (75.4%) | 7,339 (24.6%) |
Health Insurance Coverage by Household Income in Brazoria County
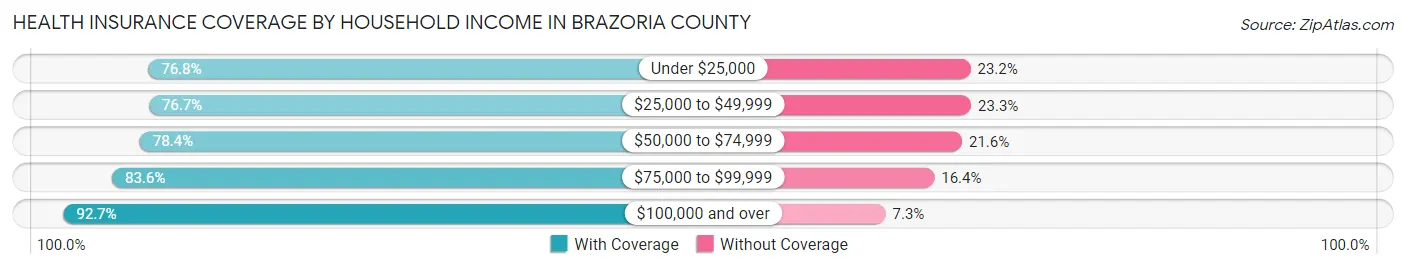
| Household Income | With Coverage | Without Coverage |
| Under $25,000 | 18,482 (76.8%) | 5,577 (23.2%) |
| $25,000 to $49,999 | 31,163 (76.7%) | 9,465 (23.3%) |
| $50,000 to $74,999 | 38,673 (78.4%) | 10,651 (21.6%) |
| $75,000 to $99,999 | 42,102 (83.6%) | 8,255 (16.4%) |
| $100,000 and over | 183,005 (92.7%) | 14,341 (7.3%) |
Public vs Private Health Insurance Coverage by Age in Brazoria County
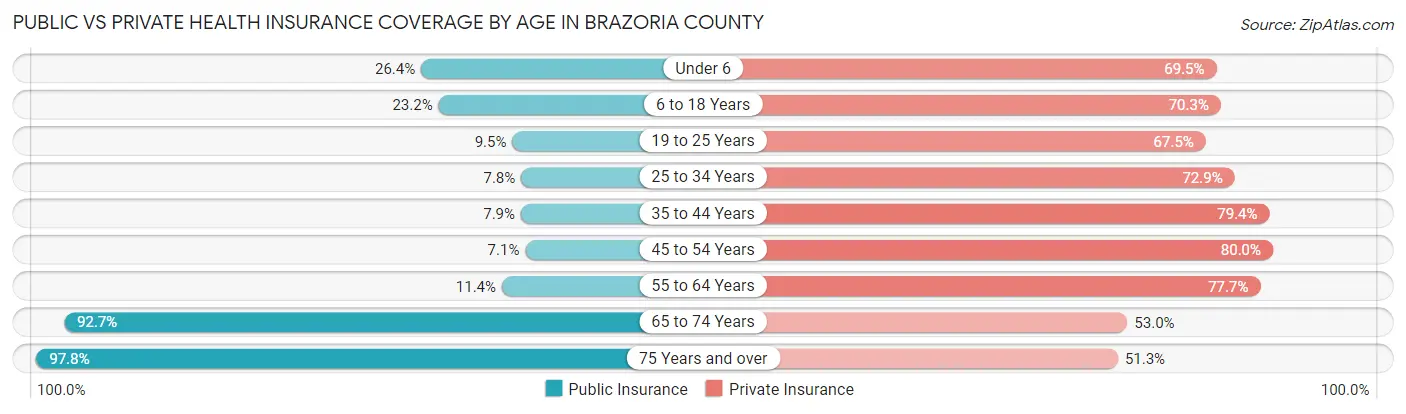
| Age Bracket | Public Insurance | Private Insurance |
| Under 6 | 7,698 (26.4%) | 20,264 (69.5%) |
| 6 to 18 Years | 17,039 (23.2%) | 51,708 (70.3%) |
| 19 to 25 Years | 2,826 (9.5%) | 20,134 (67.5%) |
| 25 to 34 Years | 3,419 (7.8%) | 31,764 (72.9%) |
| 35 to 44 Years | 4,221 (7.9%) | 42,455 (79.4%) |
| 45 to 54 Years | 3,310 (7.1%) | 37,432 (80.0%) |
| 55 to 64 Years | 4,705 (11.4%) | 32,022 (77.7%) |
| 65 to 74 Years | 26,071 (92.7%) | 14,910 (53.0%) |
| 75 Years and over | 16,102 (97.8%) | 8,438 (51.3%) |
| Total | 85,391 (23.6%) | 259,127 (71.6%) |
Disability Status by Sex by Age in Brazoria County
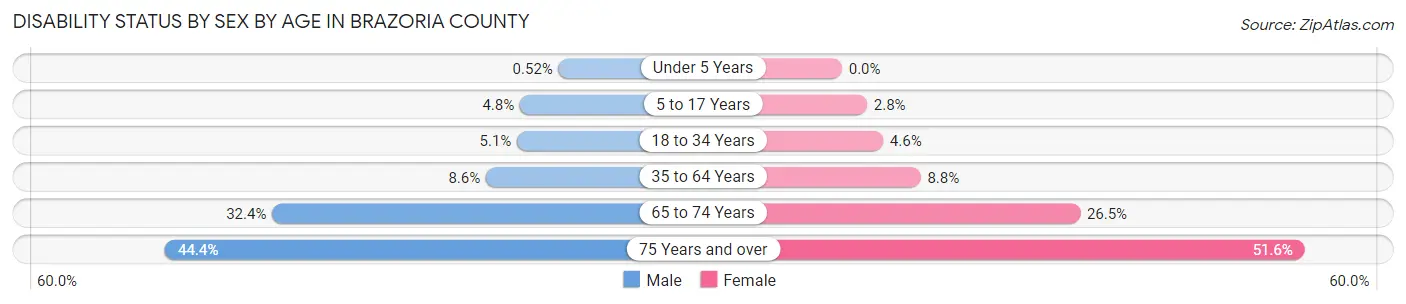
| Age Bracket | Male | Female |
| Under 5 Years | 65 (0.5%) | 0 (0.0%) |
| 5 to 17 Years | 1,798 (4.8%) | 989 (2.8%) |
| 18 to 34 Years | 2,007 (5.1%) | 1,833 (4.6%) |
| 35 to 64 Years | 5,955 (8.6%) | 6,339 (8.8%) |
| 65 to 74 Years | 4,392 (32.4%) | 3,866 (26.5%) |
| 75 Years and over | 3,042 (44.4%) | 4,950 (51.5%) |
Disability Class by Sex by Age in Brazoria County
Disability Class: Hearing Difficulty
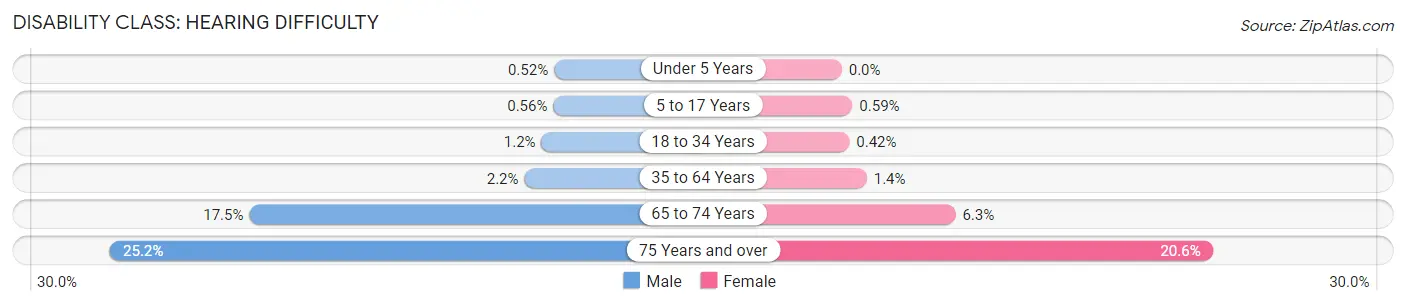
| Age Bracket | Male | Female |
| Under 5 Years | 65 (0.5%) | 0 (0.0%) |
| 5 to 17 Years | 208 (0.6%) | 208 (0.6%) |
| 18 to 34 Years | 477 (1.2%) | 168 (0.4%) |
| 35 to 64 Years | 1,500 (2.2%) | 1,004 (1.4%) |
| 65 to 74 Years | 2,370 (17.5%) | 923 (6.3%) |
| 75 Years and over | 1,731 (25.2%) | 1,982 (20.6%) |
Disability Class: Vision Difficulty
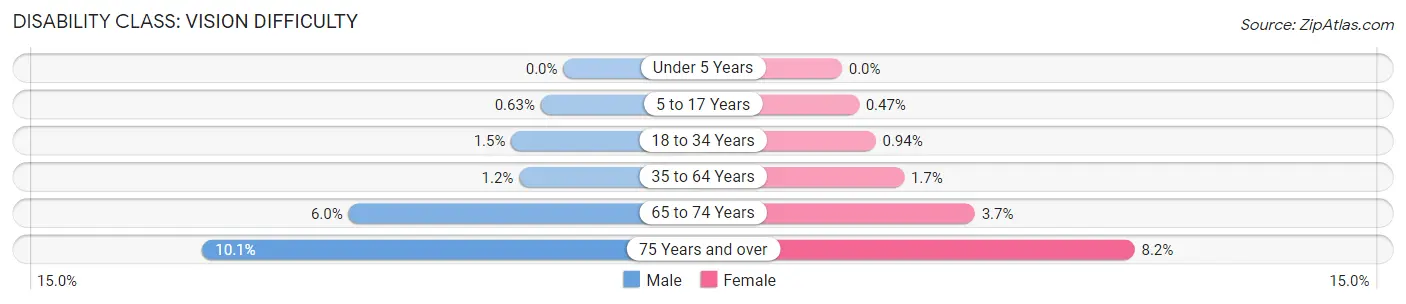
| Age Bracket | Male | Female |
| Under 5 Years | 0 (0.0%) | 0 (0.0%) |
| 5 to 17 Years | 236 (0.6%) | 168 (0.5%) |
| 18 to 34 Years | 566 (1.5%) | 378 (0.9%) |
| 35 to 64 Years | 852 (1.2%) | 1,251 (1.7%) |
| 65 to 74 Years | 810 (6.0%) | 539 (3.7%) |
| 75 Years and over | 689 (10.1%) | 783 (8.2%) |
Disability Class: Cognitive Difficulty
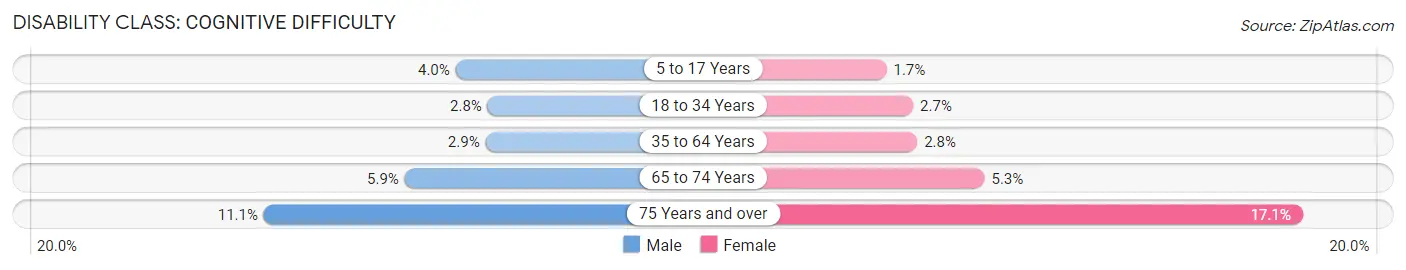
| Age Bracket | Male | Female |
| 5 to 17 Years | 1,492 (4.0%) | 587 (1.7%) |
| 18 to 34 Years | 1,097 (2.8%) | 1,060 (2.6%) |
| 35 to 64 Years | 2,001 (2.9%) | 2,025 (2.8%) |
| 65 to 74 Years | 798 (5.9%) | 773 (5.3%) |
| 75 Years and over | 763 (11.1%) | 1,643 (17.1%) |
Disability Class: Ambulatory Difficulty
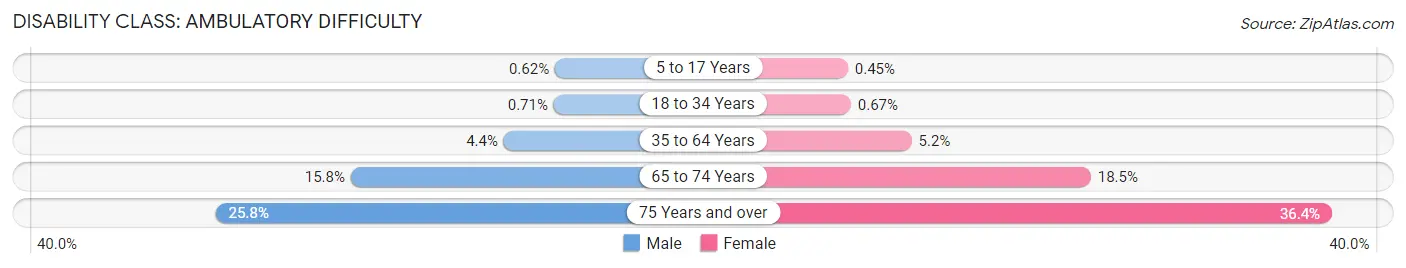
| Age Bracket | Male | Female |
| 5 to 17 Years | 233 (0.6%) | 158 (0.4%) |
| 18 to 34 Years | 278 (0.7%) | 269 (0.7%) |
| 35 to 64 Years | 3,061 (4.4%) | 3,750 (5.2%) |
| 65 to 74 Years | 2,138 (15.8%) | 2,695 (18.5%) |
| 75 Years and over | 1,771 (25.8%) | 3,494 (36.4%) |
Disability Class: Self-Care Difficulty
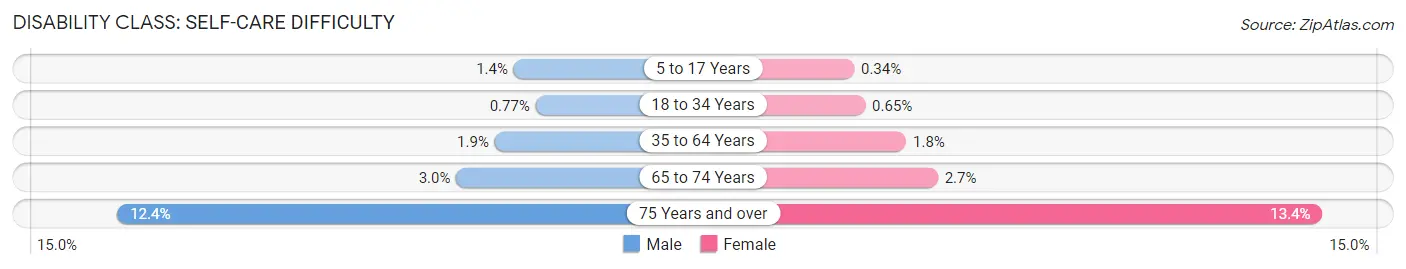
| Age Bracket | Male | Female |
| 5 to 17 Years | 515 (1.4%) | 119 (0.3%) |
| 18 to 34 Years | 302 (0.8%) | 260 (0.6%) |
| 35 to 64 Years | 1,325 (1.9%) | 1,294 (1.8%) |
| 65 to 74 Years | 404 (3.0%) | 389 (2.7%) |
| 75 Years and over | 852 (12.4%) | 1,285 (13.4%) |
Technology Access in Brazoria County
Computing Device Access in Brazoria County
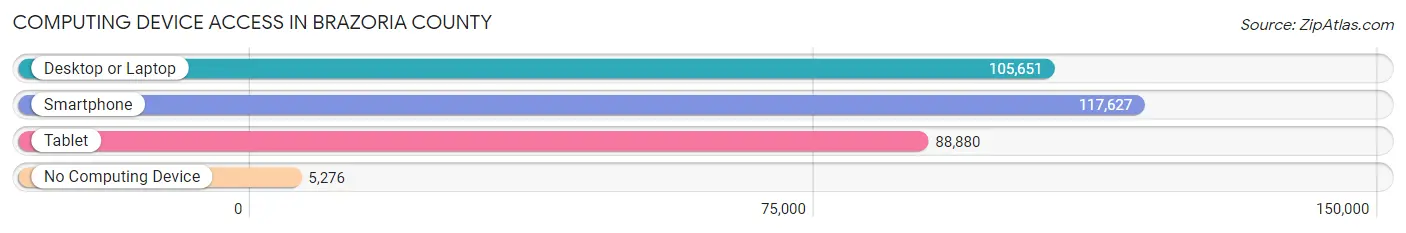
| Device Type | # Households | % Households |
| Desktop or Laptop | 105,651 | 83.0% |
| Smartphone | 117,627 | 92.4% |
| Tablet | 88,880 | 69.8% |
| No Computing Device | 5,276 | 4.2% |
| Total | 127,264 | 100.0% |
Internet Access in Brazoria County
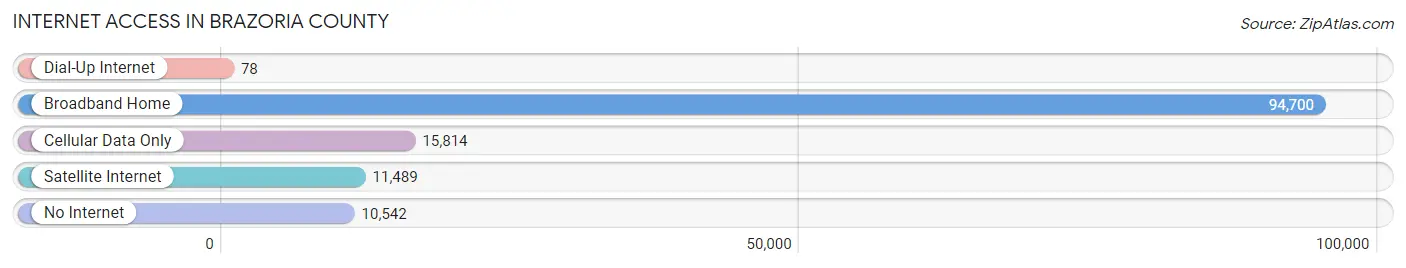
| Internet Type | # Households | % Households |
| Dial-Up Internet | 78 | 0.1% |
| Broadband Home | 94,700 | 74.4% |
| Cellular Data Only | 15,814 | 12.4% |
| Satellite Internet | 11,489 | 9.0% |
| No Internet | 10,542 | 8.3% |
| Total | 127,264 | 100.0% |
Brazoria County Summary
Brazoria County is located in the southeastern part of Texas, along the Gulf Coast. It is part of the Houston–The Woodlands–Sugar Land metropolitan area and is one of the fastest-growing counties in the United States. The county seat is Angleton, and the largest city is Pearland. As of the 2010 census, the population was 313,166.
History
Brazoria County was established in 1836 and is named for the Brazos River, which forms its western boundary. The county was originally part of Austin's colony and was part of the Mexican state of Coahuila y Tejas. After Texas declared its independence from Mexico in 1836, the county was organized and named Brazoria.
The county was the site of several battles during the Texas Revolution, including the Battle of Velasco and the Battle of San Jacinto. During the Civil War, Brazoria County was part of the Third Military District of Texas and was home to several Confederate units.
Geography
Brazoria County covers an area of 1,609 square miles and is located in the southeastern part of Texas, along the Gulf Coast. It is bordered by Galveston County to the north, Matagorda County to the west, and the Gulf of Mexico to the south and east. The county is divided into four distinct regions: the coastal plains, the Brazos River valley, the Gulf Coast, and the prairies.
The coastal plains are located along the Gulf Coast and are characterized by flat terrain and sandy soils. The Brazos River valley is located in the northern part of the county and is characterized by rolling hills and fertile soils. The Gulf Coast is located along the southern part of the county and is characterized by marshlands and estuaries. The prairies are located in the western part of the county and are characterized by flat terrain and sandy soils.
Economy
Brazoria County has a diverse economy that is driven by the oil and gas industry, manufacturing, agriculture, and tourism. The county is home to several major oil and gas companies, including Chevron, Shell, and ExxonMobil. Manufacturing is also a major part of the economy, with companies such as Dow Chemical and BASF having a presence in the county.
Agriculture is also an important part of the economy, with crops such as cotton, corn, and soybeans being grown in the county. Tourism is also a major part of the economy, with the county being home to several popular attractions, such as the Brazoria National Wildlife Refuge and the San Bernard National Wildlife Refuge.
Demographics
As of the 2010 census, the population of Brazoria County was 313,166. The population is made up of a diverse mix of ethnicities, with the largest groups being White (63.2%), Hispanic or Latino (25.3%), and African American (7.2%). The median household income in the county is $63,945, and the median home value is $164,400.
Conclusion
Brazoria County is a diverse and rapidly growing county located in the southeastern part of Texas, along the Gulf Coast. The county is home to a diverse economy that is driven by the oil and gas industry, manufacturing, agriculture, and tourism. The population of the county is made up of a diverse mix of ethnicities, with the largest groups being White, Hispanic or Latino, and African American. The county is home to several popular attractions, such as the Brazoria National Wildlife Refuge and the San Bernard National Wildlife Refuge.
Common Questions
What is Per Capita Income in Brazoria County?
Per Capita income in Brazoria County is $39,891.
What is the Median Family Income in Brazoria County?
Median Family Income in Brazoria County is $106,243.
What is the Median Household income in Brazoria County?
Median Household Income in Brazoria County is $91,972.
What is Income or Wage Gap in Brazoria County?
Income or Wage Gap in Brazoria County is 34.9%.
Women in Brazoria County earn 65.1 cents for every dollar earned by a man.
What is Family Income Deficit in Brazoria County?
Family Income Deficit in Brazoria County is $10,379.
Families that are below poverty line in Brazoria County earn $10,379 less on average than the poverty threshold level.
What is Inequality or Gini Index in Brazoria County?
Inequality or Gini Index in Brazoria County is 0.42.
What is the Total Population of Brazoria County?
Total Population of Brazoria County is 374,600.
What is the Total Male Population of Brazoria County?
Total Male Population of Brazoria County is 190,008.
What is the Total Female Population of Brazoria County?
Total Female Population of Brazoria County is 184,592.
What is the Ratio of Males per 100 Females in Brazoria County?
There are 102.93 Males per 100 Females in Brazoria County.
What is the Ratio of Females per 100 Males in Brazoria County?
There are 97.15 Females per 100 Males in Brazoria County.
What is the Median Population Age in Brazoria County?
Median Population Age in Brazoria County is 36.3 Years.
What is the Average Family Size in Brazoria County
Average Family Size in Brazoria County is 3.4 People.
What is the Average Household Size in Brazoria County
Average Household Size in Brazoria County is 2.9 People.
How Large is the Labor Force in Brazoria County?
There are 183,378 People in the Labor Forcein in Brazoria County.
What is the Percentage of People in the Labor Force in Brazoria County?
63.4% of People are in the Labor Force in Brazoria County.
What is the Unemployment Rate in Brazoria County?
Unemployment Rate in Brazoria County is 4.6%.