Tarrant County, TX Map & Demographics
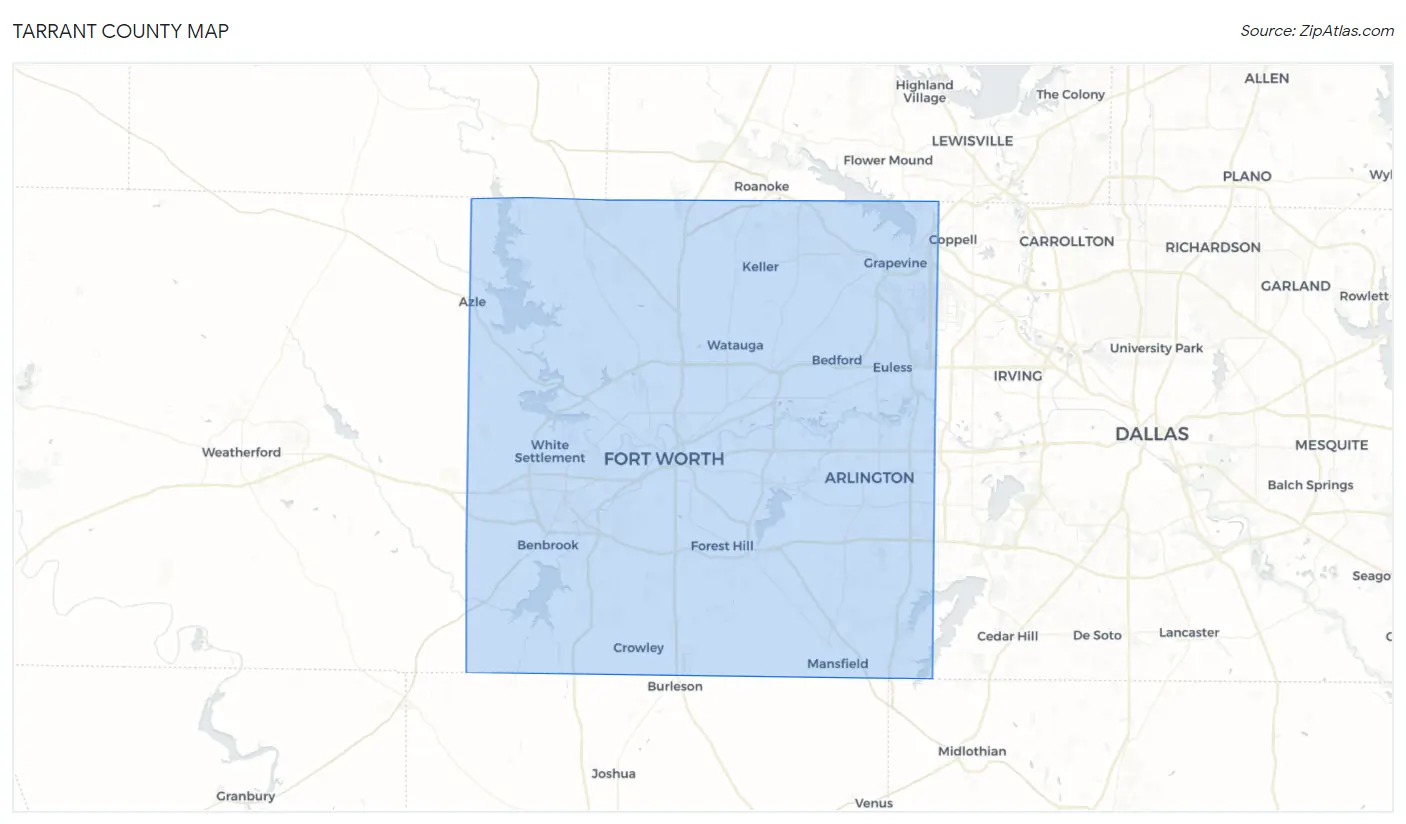
Tarrant County Map
Tarrant County Overview
$39,407
PER CAPITA INCOME
$94,733
AVG FAMILY INCOME
$78,872
AVG HOUSEHOLD INCOME
27.0%
WAGE / INCOME GAP [ % ]
73.0¢/ $1
WAGE / INCOME GAP [ $ ]
$11,132
FAMILY INCOME DEFICIT
0.46
INEQUALITY / GINI INDEX
2,113,854
TOTAL POPULATION
1,041,366
MALE POPULATION
1,072,488
FEMALE POPULATION
97.10
MALES / 100 FEMALES
102.99
FEMALES / 100 MALES
34.9
MEDIAN AGE
3.4
AVG FAMILY SIZE
2.8
AVG HOUSEHOLD SIZE
1,122,897
LABOR FORCE [ PEOPLE ]
68.7%
PERCENT IN LABOR FORCE
4.9%
UNEMPLOYMENT RATE
Income in Tarrant County
Income Overview in Tarrant County
Per Capita Income in Tarrant County is $39,407, while median incomes of families and households are $94,733 and $78,872 respectively.
| Characteristic | Number | Measure |
| Per Capita Income | 2,113,854 | $39,407 |
| Median Family Income | 513,325 | $94,733 |
| Mean Family Income | 513,325 | $124,774 |
| Median Household Income | 754,969 | $78,872 |
| Mean Household Income | 754,969 | $107,434 |
| Income Deficit | 513,325 | $11,132 |
| Wage / Income Gap (%) | 2,113,854 | 27.04% |
| Wage / Income Gap ($) | 2,113,854 | 72.96¢ per $1 |
| Gini / Inequality Index | 2,113,854 | 0.46 |
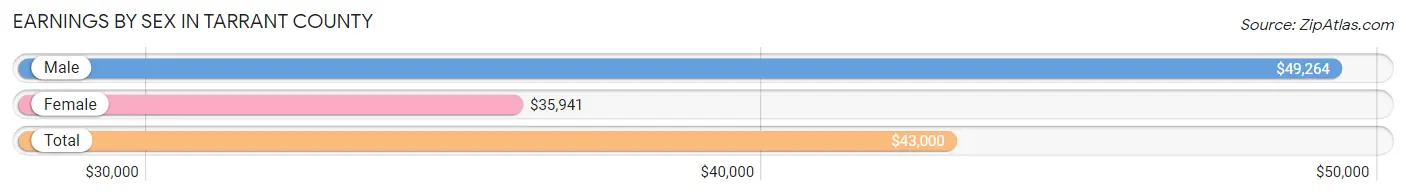
Earnings by Sex in Tarrant County
Average Earnings in Tarrant County are $43,000, $49,264 for men and $35,941 for women, a difference of 27.0%.
| Sex | Number | Average Earnings |
| Male | 620,044 (53.4%) | $49,264 |
| Female | 539,982 (46.6%) | $35,941 |
| Total | 1,160,026 (100.0%) | $43,000 |
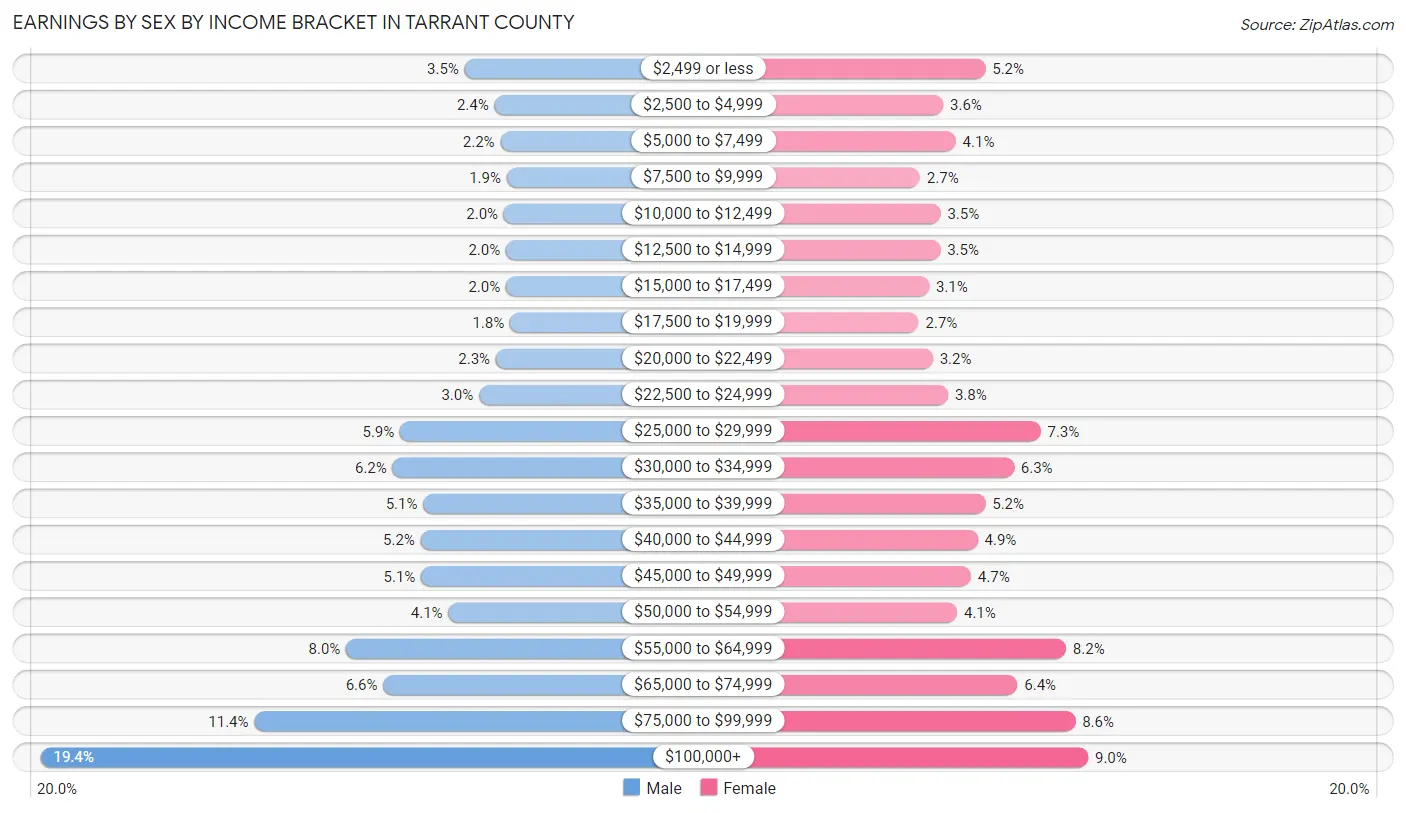
Earnings by Sex by Income Bracket in Tarrant County
The most common earnings brackets in Tarrant County are $100,000+ for men (120,304 | 19.4%) and $100,000+ for women (48,819 | 9.0%).
| Income | Male | Female |
| $2,499 or less | 21,745 (3.5%) | 28,037 (5.2%) |
| $2,500 to $4,999 | 14,820 (2.4%) | 19,487 (3.6%) |
| $5,000 to $7,499 | 13,436 (2.2%) | 22,025 (4.1%) |
| $7,500 to $9,999 | 11,994 (1.9%) | 14,788 (2.7%) |
| $10,000 to $12,499 | 12,676 (2.0%) | 18,972 (3.5%) |
| $12,500 to $14,999 | 12,122 (2.0%) | 18,917 (3.5%) |
| $15,000 to $17,499 | 12,174 (2.0%) | 16,608 (3.1%) |
| $17,500 to $19,999 | 11,221 (1.8%) | 14,538 (2.7%) |
| $20,000 to $22,499 | 14,491 (2.3%) | 17,382 (3.2%) |
| $22,500 to $24,999 | 18,439 (3.0%) | 20,456 (3.8%) |
| $25,000 to $29,999 | 36,748 (5.9%) | 39,212 (7.3%) |
| $30,000 to $34,999 | 38,507 (6.2%) | 33,789 (6.3%) |
| $35,000 to $39,999 | 31,344 (5.1%) | 28,019 (5.2%) |
| $40,000 to $44,999 | 32,009 (5.2%) | 26,462 (4.9%) |
| $45,000 to $49,999 | 31,878 (5.1%) | 25,116 (4.6%) |
| $50,000 to $54,999 | 25,552 (4.1%) | 22,301 (4.1%) |
| $55,000 to $64,999 | 49,312 (8.0%) | 44,321 (8.2%) |
| $65,000 to $74,999 | 40,663 (6.6%) | 34,521 (6.4%) |
| $75,000 to $99,999 | 70,609 (11.4%) | 46,212 (8.6%) |
| $100,000+ | 120,304 (19.4%) | 48,819 (9.0%) |
| Total | 620,044 (100.0%) | 539,982 (100.0%) |
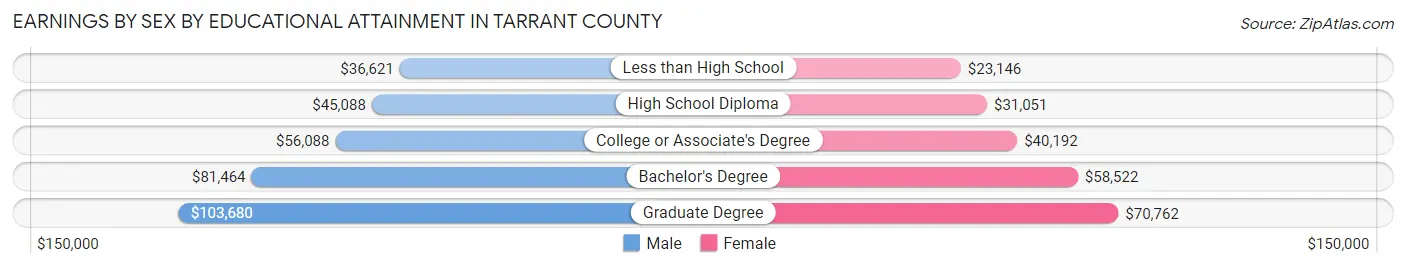
Earnings by Sex by Educational Attainment in Tarrant County
Average earnings in Tarrant County are $56,837 for men and $42,024 for women, a difference of 26.1%. Men with an educational attainment of graduate degree enjoy the highest average annual earnings of $103,680, while those with less than high school education earn the least with $36,621. Women with an educational attainment of graduate degree earn the most with the average annual earnings of $70,762, while those with less than high school education have the smallest earnings of $23,146.
| Educational Attainment | Male Income | Female Income |
| Less than High School | $36,621 | $23,146 |
| High School Diploma | $45,088 | $31,051 |
| College or Associate's Degree | $56,088 | $40,192 |
| Bachelor's Degree | $81,464 | $58,522 |
| Graduate Degree | $103,680 | $70,762 |
| Total | $56,837 | $42,024 |
Family Income in Tarrant County
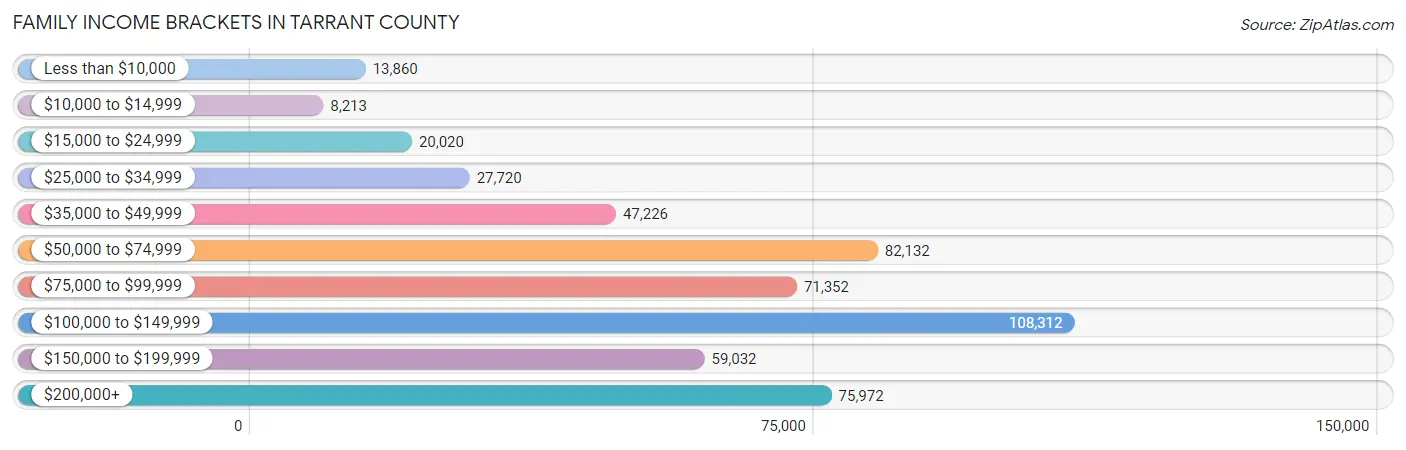
Family Income Brackets in Tarrant County
According to the Tarrant County family income data, there are 108,312 families falling into the $100,000 to $149,999 income range, which is the most common income bracket and makes up 21.1% of all families. Conversely, the $10,000 to $14,999 income bracket is the least frequent group with only 8,213 families (1.6%) belonging to this category.
| Income Bracket | # Families | % Families |
| Less than $10,000 | 13,860 | 2.7% |
| $10,000 to $14,999 | 8,213 | 1.6% |
| $15,000 to $24,999 | 20,020 | 3.9% |
| $25,000 to $34,999 | 27,720 | 5.4% |
| $35,000 to $49,999 | 47,226 | 9.2% |
| $50,000 to $74,999 | 82,132 | 16.0% |
| $75,000 to $99,999 | 71,352 | 13.9% |
| $100,000 to $149,999 | 108,312 | 21.1% |
| $150,000 to $199,999 | 59,032 | 11.5% |
| $200,000+ | 75,972 | 14.8% |
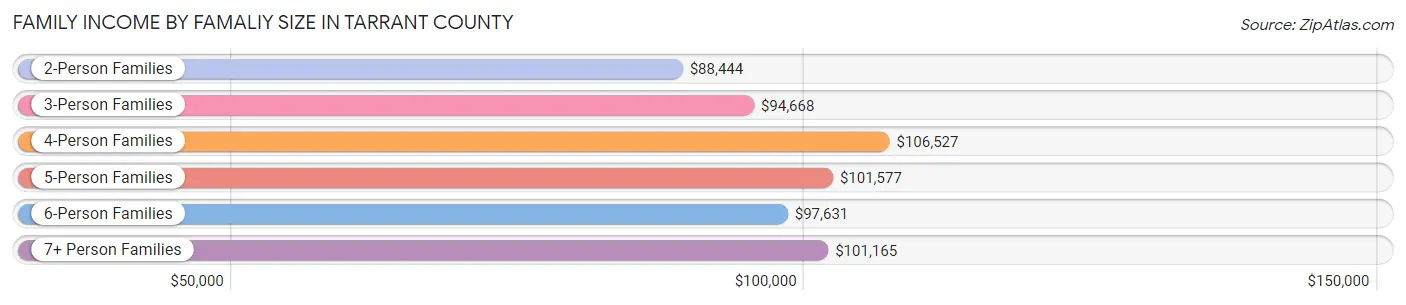
Family Income by Famaliy Size in Tarrant County
4-person families (98,947 | 19.3%) account for the highest median family income in Tarrant County with $106,527 per family, while 2-person families (213,316 | 41.6%) have the highest median income of $44,222 per family member.
| Income Bracket | # Families | Median Income |
| 2-Person Families | 213,316 (41.6%) | $88,444 |
| 3-Person Families | 118,426 (23.1%) | $94,668 |
| 4-Person Families | 98,947 (19.3%) | $106,527 |
| 5-Person Families | 50,748 (9.9%) | $101,577 |
| 6-Person Families | 20,503 (4.0%) | $97,631 |
| 7+ Person Families | 11,385 (2.2%) | $101,165 |
| Total | 513,325 (100.0%) | $94,733 |
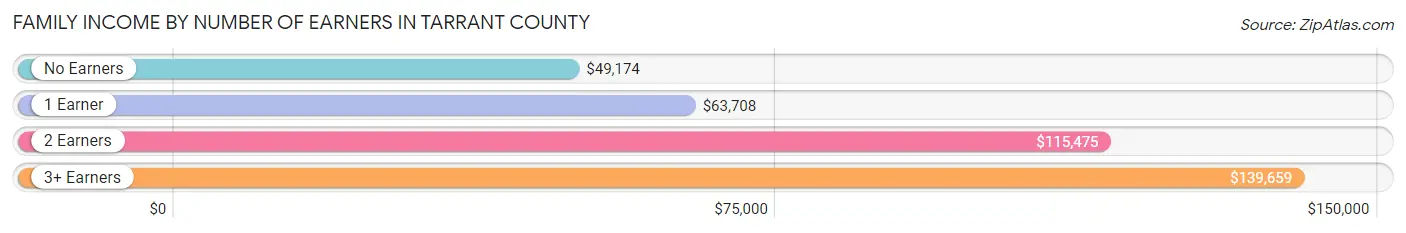
Family Income by Number of Earners in Tarrant County
The median family income in Tarrant County is $94,733, with families comprising 3+ earners (68,660) having the highest median family income of $139,659, while families with no earners (50,612) have the lowest median family income of $49,174, accounting for 13.4% and 9.9% of families, respectively.
| Number of Earners | # Families | Median Income |
| No Earners | 50,612 (9.9%) | $49,174 |
| 1 Earner | 166,298 (32.4%) | $63,708 |
| 2 Earners | 227,755 (44.4%) | $115,475 |
| 3+ Earners | 68,660 (13.4%) | $139,659 |
| Total | 513,325 (100.0%) | $94,733 |
Household Income in Tarrant County
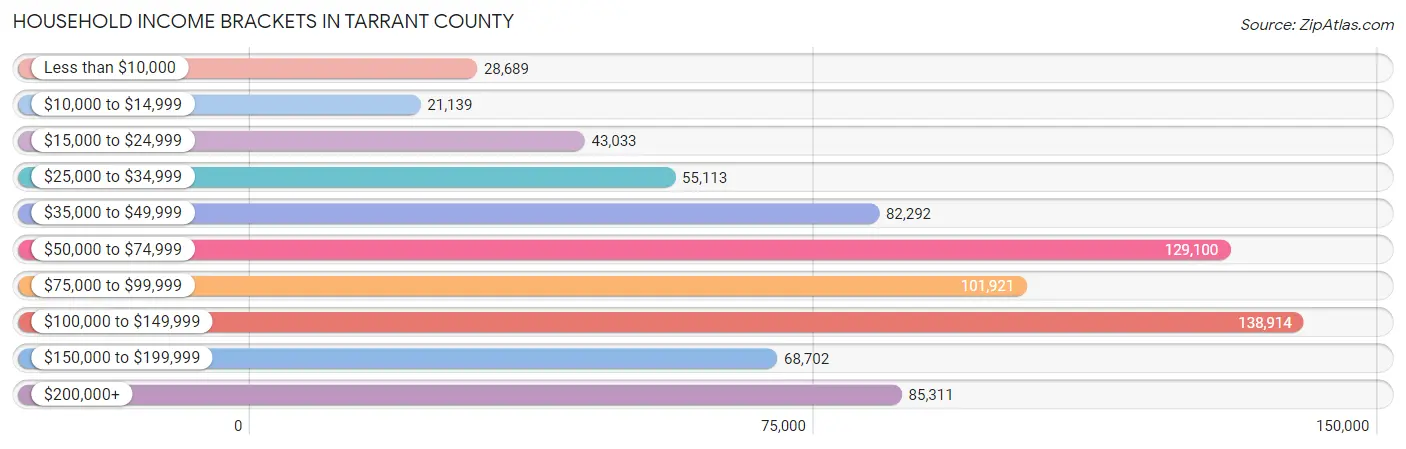
Household Income Brackets in Tarrant County
With 138,914 households falling in the category, the $100,000 to $149,999 income range is the most frequent in Tarrant County, accounting for 18.4% of all households. In contrast, only 21,139 households (2.8%) fall into the $10,000 to $14,999 income bracket, making it the least populous group.
| Income Bracket | # Households | % Households |
| Less than $10,000 | 28,689 | 3.8% |
| $10,000 to $14,999 | 21,139 | 2.8% |
| $15,000 to $24,999 | 43,033 | 5.7% |
| $25,000 to $34,999 | 55,113 | 7.3% |
| $35,000 to $49,999 | 82,292 | 10.9% |
| $50,000 to $74,999 | 129,100 | 17.1% |
| $75,000 to $99,999 | 101,921 | 13.5% |
| $100,000 to $149,999 | 138,914 | 18.4% |
| $150,000 to $199,999 | 68,702 | 9.1% |
| $200,000+ | 85,311 | 11.3% |
Household Income by Householder Age in Tarrant County
The median household income in Tarrant County is $78,872, with the highest median household income of $97,531 found in the 45 to 64 years age bracket for the primary householder. A total of 285,329 households (37.8%) fall into this category. Meanwhile, the 15 to 24 years age bracket for the primary householder has the lowest median household income of $46,113, with 32,710 households (4.3%) in this group.
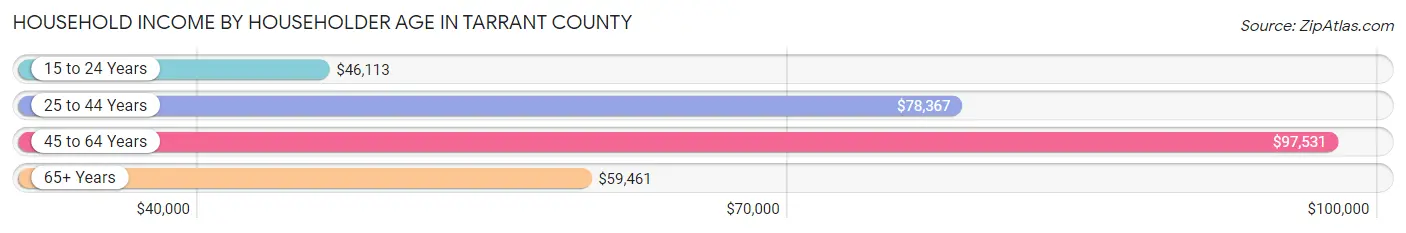
| Income Bracket | # Households | Median Income |
| 15 to 24 Years | 32,710 (4.3%) | $46,113 |
| 25 to 44 Years | 288,790 (38.3%) | $78,367 |
| 45 to 64 Years | 285,329 (37.8%) | $97,531 |
| 65+ Years | 148,140 (19.6%) | $59,461 |
| Total | 754,969 (100.0%) | $78,872 |
Poverty in Tarrant County
Income Below Poverty by Sex and Age in Tarrant County
With 9.8% poverty level for males and 12.2% for females among the residents of Tarrant County, 5 year old males and under 5 year old females are the most vulnerable to poverty, with 2,608 males (18.0%) and 12,391 females (18.5%) in their respective age groups living below the poverty level.
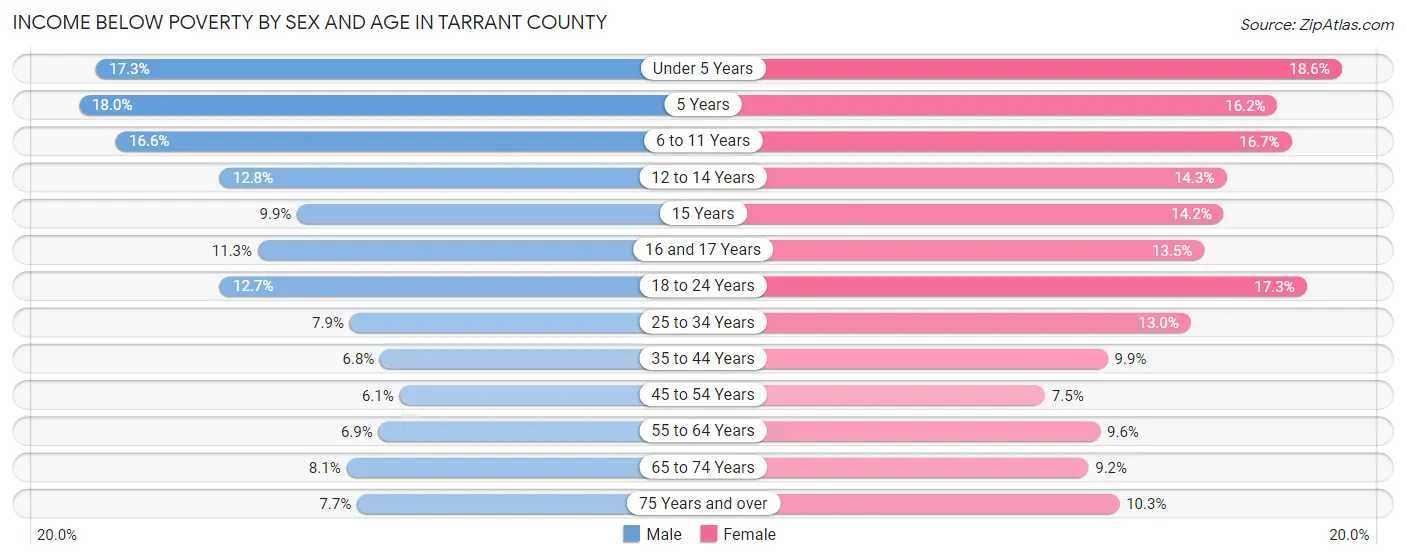
| Age Bracket | Male | Female |
| Under 5 Years | 12,064 (17.3%) | 12,391 (18.5%) |
| 5 Years | 2,608 (18.0%) | 2,310 (16.2%) |
| 6 to 11 Years | 15,257 (16.6%) | 14,961 (16.7%) |
| 12 to 14 Years | 6,320 (12.8%) | 6,528 (14.3%) |
| 15 Years | 1,518 (9.9%) | 2,228 (14.2%) |
| 16 and 17 Years | 3,800 (11.3%) | 4,231 (13.5%) |
| 18 to 24 Years | 12,536 (12.7%) | 16,635 (17.2%) |
| 25 to 34 Years | 12,139 (7.9%) | 20,238 (13.0%) |
| 35 to 44 Years | 9,763 (6.8%) | 14,640 (9.9%) |
| 45 to 54 Years | 8,015 (6.1%) | 10,169 (7.5%) |
| 55 to 64 Years | 8,165 (6.9%) | 11,696 (9.6%) |
| 65 to 74 Years | 5,665 (8.1%) | 7,477 (9.1%) |
| 75 Years and over | 2,816 (7.7%) | 5,473 (10.3%) |
| Total | 100,666 (9.8%) | 128,977 (12.2%) |
Income Above Poverty by Sex and Age in Tarrant County
According to the poverty statistics in Tarrant County, males aged 45 to 54 years and females aged 45 to 54 years are the age groups that are most secure financially, with 93.9% of males and 92.5% of females in these age groups living above the poverty line.
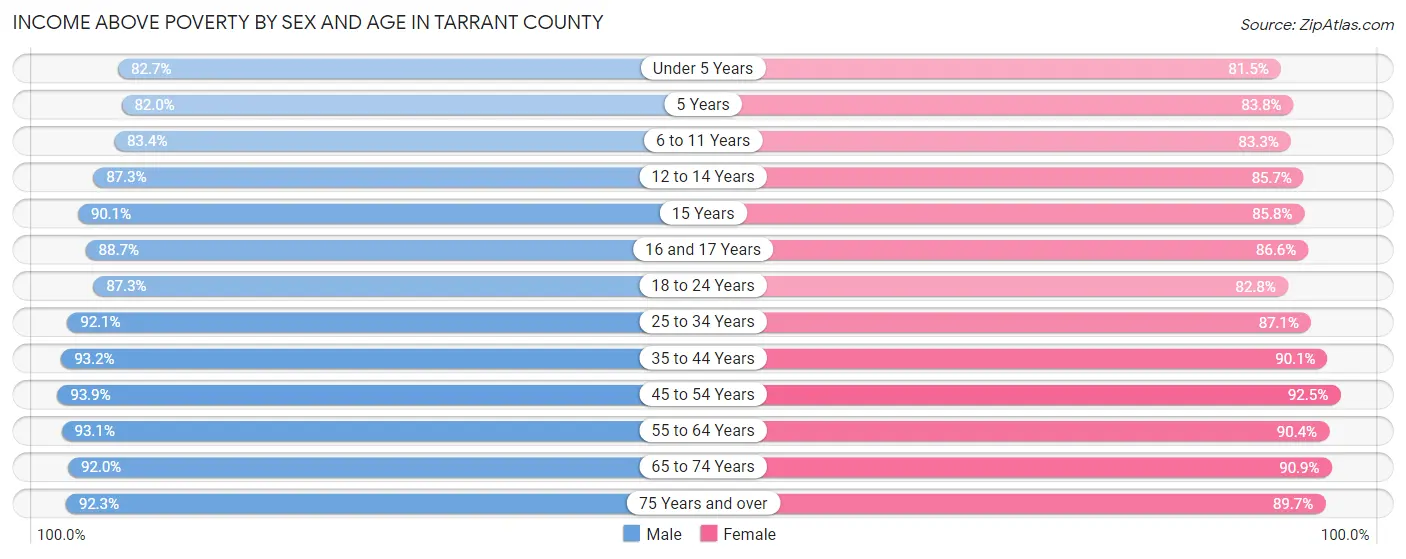
| Age Bracket | Male | Female |
| Under 5 Years | 57,497 (82.7%) | 54,394 (81.5%) |
| 5 Years | 11,900 (82.0%) | 11,979 (83.8%) |
| 6 to 11 Years | 76,639 (83.4%) | 74,669 (83.3%) |
| 12 to 14 Years | 43,245 (87.3%) | 39,216 (85.7%) |
| 15 Years | 13,844 (90.1%) | 13,496 (85.8%) |
| 16 and 17 Years | 29,705 (88.7%) | 27,218 (86.6%) |
| 18 to 24 Years | 85,889 (87.3%) | 79,810 (82.8%) |
| 25 to 34 Years | 140,843 (92.1%) | 136,066 (87.1%) |
| 35 to 44 Years | 133,791 (93.2%) | 133,748 (90.1%) |
| 45 to 54 Years | 123,785 (93.9%) | 124,779 (92.5%) |
| 55 to 64 Years | 110,837 (93.1%) | 110,253 (90.4%) |
| 65 to 74 Years | 64,687 (91.9%) | 74,205 (90.8%) |
| 75 Years and over | 33,938 (92.3%) | 47,684 (89.7%) |
| Total | 926,600 (90.2%) | 927,517 (87.8%) |
Income Below Poverty Among Married-Couple Families in Tarrant County
The poverty statistics for married-couple families in Tarrant County show that 4.3% or 15,974 of the total 372,195 families live below the poverty line. Families with 5 or more children have the highest poverty rate of 23.4%, comprising of 766 families. On the other hand, families with no children have the lowest poverty rate of 2.8%, which includes 5,509 families.
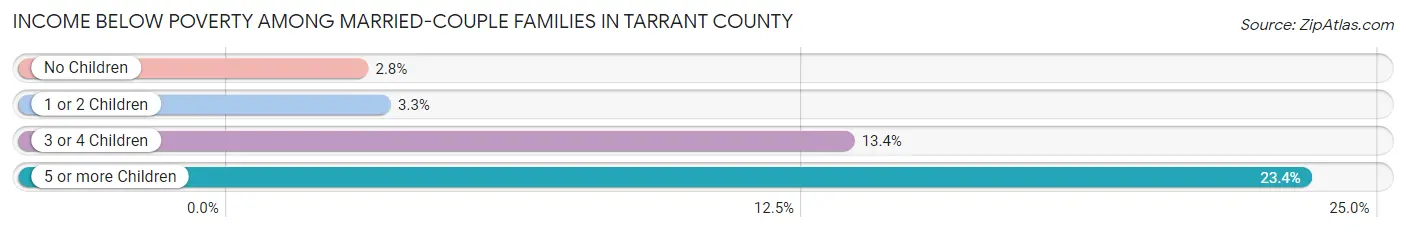
| Children | Above Poverty | Below Poverty |
| No Children | 188,386 (97.2%) | 5,509 (2.8%) |
| 1 or 2 Children | 132,134 (96.7%) | 4,553 (3.3%) |
| 3 or 4 Children | 33,190 (86.6%) | 5,146 (13.4%) |
| 5 or more Children | 2,511 (76.6%) | 766 (23.4%) |
| Total | 356,221 (95.7%) | 15,974 (4.3%) |
Income Below Poverty Among Single-Parent Households in Tarrant County
According to the poverty data in Tarrant County, 10.2% or 3,965 single-father households and 21.4% or 21,917 single-mother households are living below the poverty line. Among single-father households, those with 5 or more children have the highest poverty rate, with 293 households (54.3%) experiencing poverty. Likewise, among single-mother households, those with 5 or more children have the highest poverty rate, with 860 households (55.2%) falling below the poverty line.
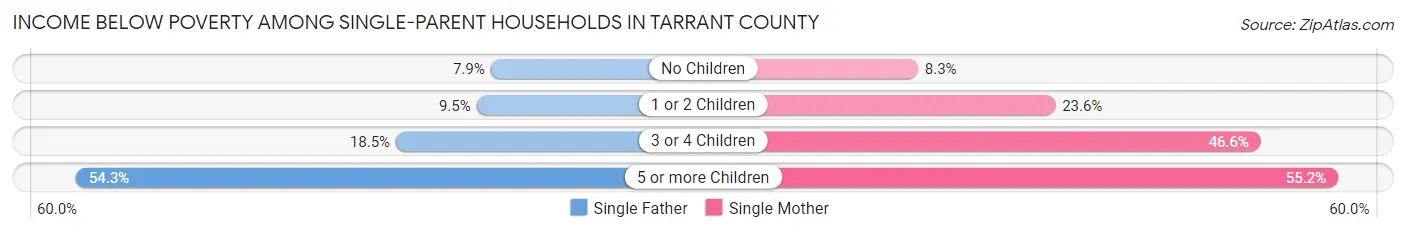
| Children | Single Father | Single Mother |
| No Children | 1,355 (7.9%) | 2,987 (8.3%) |
| 1 or 2 Children | 1,704 (9.5%) | 12,405 (23.6%) |
| 3 or 4 Children | 613 (18.5%) | 5,665 (46.6%) |
| 5 or more Children | 293 (54.3%) | 860 (55.2%) |
| Total | 3,965 (10.2%) | 21,917 (21.4%) |
Income Below Poverty Among Married-Couple vs Single-Parent Households in Tarrant County
The poverty data for Tarrant County shows that 15,974 of the married-couple family households (4.3%) and 25,882 of the single-parent households (18.3%) are living below the poverty level. Within the married-couple family households, those with 5 or more children have the highest poverty rate, with 766 households (23.4%) falling below the poverty line. Among the single-parent households, those with 5 or more children have the highest poverty rate, with 1,153 household (55.0%) living below poverty.
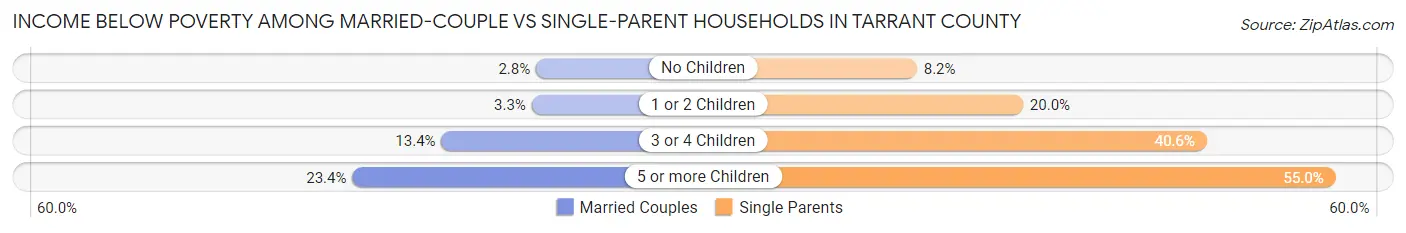
| Children | Married-Couple Families | Single-Parent Households |
| No Children | 5,509 (2.8%) | 4,342 (8.2%) |
| 1 or 2 Children | 4,553 (3.3%) | 14,109 (20.0%) |
| 3 or 4 Children | 5,146 (13.4%) | 6,278 (40.6%) |
| 5 or more Children | 766 (23.4%) | 1,153 (55.0%) |
| Total | 15,974 (4.3%) | 25,882 (18.3%) |
Race in Tarrant County
The most populous races in Tarrant County are White / Caucasian (1,178,474 | 55.7%), Hispanic or Latino (630,175 | 29.8%), and Black / African American (364,924 | 17.3%).
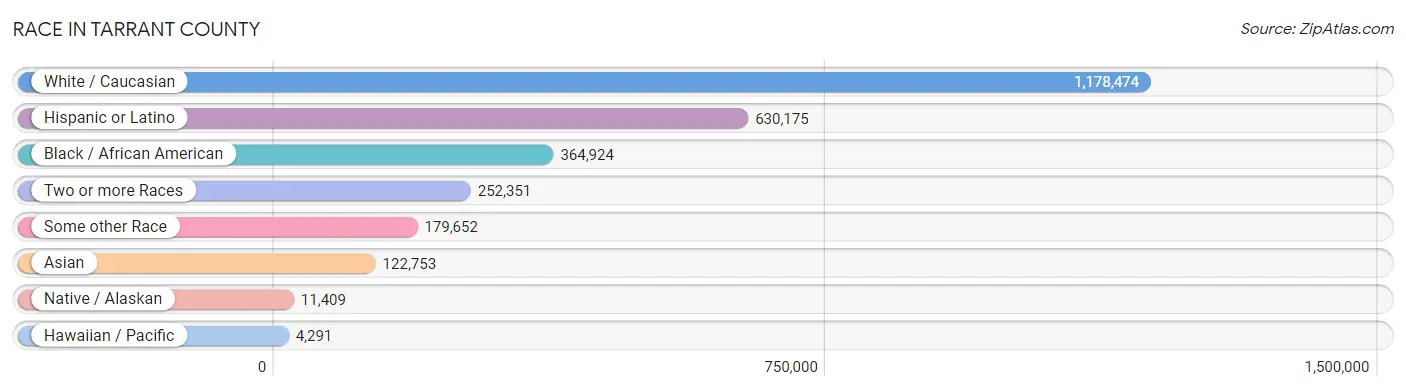
| Race | # Population | % Population |
| Asian | 122,753 | 5.8% |
| Black / African American | 364,924 | 17.3% |
| Hawaiian / Pacific | 4,291 | 0.2% |
| Hispanic or Latino | 630,175 | 29.8% |
| Native / Alaskan | 11,409 | 0.5% |
| White / Caucasian | 1,178,474 | 55.7% |
| Two or more Races | 252,351 | 11.9% |
| Some other Race | 179,652 | 8.5% |
| Total | 2,113,854 | 100.0% |
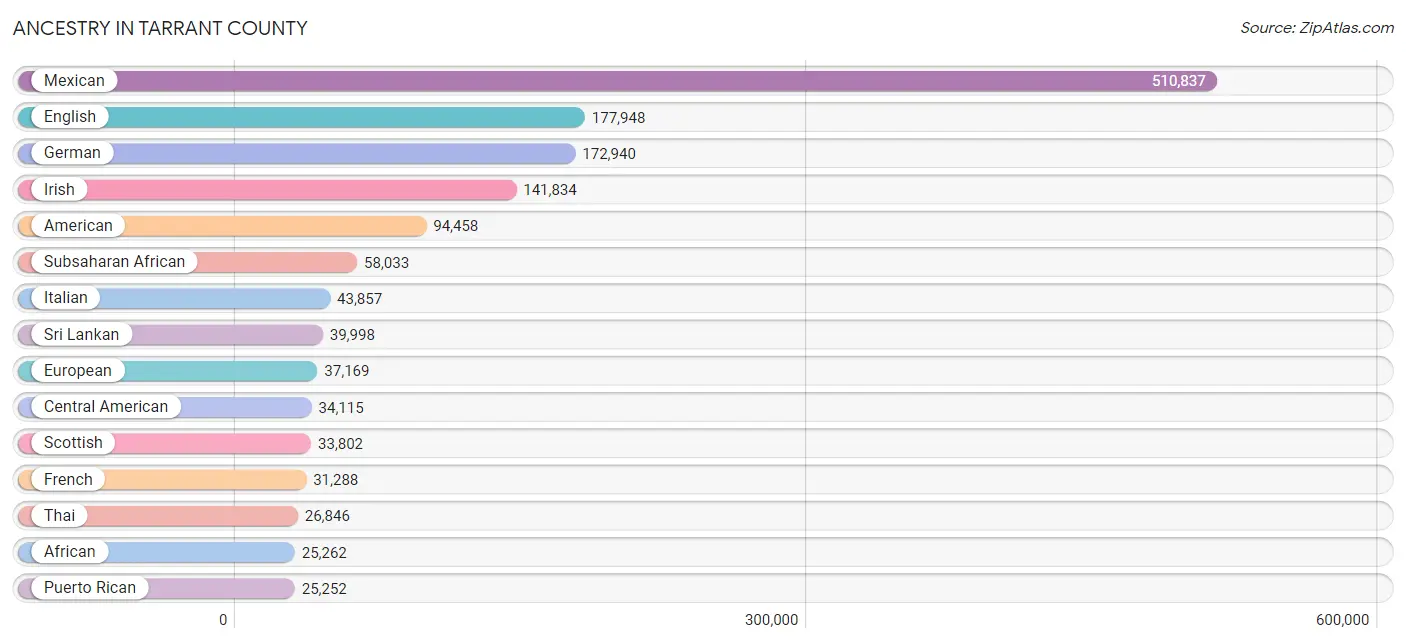
Ancestry in Tarrant County
The most populous ancestries reported in Tarrant County are Mexican (510,837 | 24.2%), English (177,948 | 8.4%), German (172,940 | 8.2%), Irish (141,834 | 6.7%), and American (94,458 | 4.5%), together accounting for 51.9% of all Tarrant County residents.
| Ancestry | # Population | % Population |
| Afghan | 1,501 | 0.1% |
| African | 25,262 | 1.2% |
| Alaska Native | 69 | 0.0% |
| Alaskan Athabascan | 30 | 0.0% |
| Albanian | 890 | 0.0% |
| Aleut | 93 | 0.0% |
| Alsatian | 39 | 0.0% |
| American | 94,458 | 4.5% |
| Apache | 883 | 0.0% |
| Arab | 20,084 | 0.9% |
| Arapaho | 211 | 0.0% |
| Argentinean | 884 | 0.0% |
| Armenian | 402 | 0.0% |
| Assyrian / Chaldean / Syriac | 26 | 0.0% |
| Australian | 345 | 0.0% |
| Austrian | 1,989 | 0.1% |
| Bahamian | 180 | 0.0% |
| Bangladeshi | 727 | 0.0% |
| Barbadian | 155 | 0.0% |
| Basque | 491 | 0.0% |
| Belgian | 966 | 0.1% |
| Belizean | 384 | 0.0% |
| Bermudan | 85 | 0.0% |
| Bhutanese | 5,093 | 0.2% |
| Blackfeet | 1,456 | 0.1% |
| Bolivian | 62 | 0.0% |
| Brazilian | 1,923 | 0.1% |
| British | 14,510 | 0.7% |
| British West Indian | 374 | 0.0% |
| Bulgarian | 239 | 0.0% |
| Burmese | 8,787 | 0.4% |
| Cajun | 545 | 0.0% |
| Cambodian | 68 | 0.0% |
| Canadian | 2,226 | 0.1% |
| Cape Verdean | 47 | 0.0% |
| Carpatho Rusyn | 31 | 0.0% |
| Celtic | 221 | 0.0% |
| Central American | 34,115 | 1.6% |
| Central American Indian | 2,094 | 0.1% |
| Cherokee | 7,485 | 0.4% |
| Cheyenne | 70 | 0.0% |
| Chickasaw | 661 | 0.0% |
| Chilean | 548 | 0.0% |
| Chinese | 13 | 0.0% |
| Chippewa | 100 | 0.0% |
| Choctaw | 3,121 | 0.2% |
| Colombian | 5,992 | 0.3% |
| Comanche | 624 | 0.0% |
| Costa Rican | 718 | 0.0% |
| Cree | 34 | 0.0% |
| Creek | 358 | 0.0% |
| Croatian | 1,263 | 0.1% |
| Crow | 81 | 0.0% |
| Cuban | 8,065 | 0.4% |
| Cypriot | 38 | 0.0% |
| Czech | 9,955 | 0.5% |
| Czechoslovakian | 1,343 | 0.1% |
| Danish | 3,672 | 0.2% |
| Delaware | 139 | 0.0% |
| Dominican | 2,038 | 0.1% |
| Dutch | 13,448 | 0.6% |
| Dutch West Indian | 446 | 0.0% |
| Eastern European | 2,078 | 0.1% |
| Ecuadorian | 2,375 | 0.1% |
| Egyptian | 3,268 | 0.2% |
| English | 177,948 | 8.4% |
| Estonian | 124 | 0.0% |
| Ethiopian | 1,395 | 0.1% |
| European | 37,169 | 1.8% |
| Fijian | 12 | 0.0% |
| Filipino | 1,143 | 0.1% |
| Finnish | 1,916 | 0.1% |
| French | 31,288 | 1.5% |
| French American Indian | 213 | 0.0% |
| French Canadian | 4,322 | 0.2% |
| German | 172,940 | 8.2% |
| German Russian | 580 | 0.0% |
| Ghanaian | 2,747 | 0.1% |
| Greek | 4,678 | 0.2% |
| Guamanian / Chamorro | 1,469 | 0.1% |
| Guatemalan | 5,872 | 0.3% |
| Guyanese | 233 | 0.0% |
| Haitian | 1,770 | 0.1% |
| Honduran | 8,091 | 0.4% |
| Hopi | 43 | 0.0% |
| Houma | 25 | 0.0% |
| Hungarian | 2,934 | 0.1% |
| Icelander | 65 | 0.0% |
| Indian (Asian) | 14,474 | 0.7% |
| Indonesian | 1,892 | 0.1% |
| Inupiat | 184 | 0.0% |
| Iranian | 2,867 | 0.1% |
| Iraqi | 2,282 | 0.1% |
| Irish | 141,834 | 6.7% |
| Iroquois | 297 | 0.0% |
| Israeli | 979 | 0.1% |
| Italian | 43,857 | 2.1% |
| Jamaican | 2,538 | 0.1% |
| Japanese | 999 | 0.1% |
| Jordanian | 2,731 | 0.1% |
| Kenyan | 3,395 | 0.2% |
| Kiowa | 50 | 0.0% |
| Korean | 15,653 | 0.7% |
| Laotian | 699 | 0.0% |
| Latvian | 249 | 0.0% |
| Lebanese | 3,039 | 0.1% |
| Liberian | 1,686 | 0.1% |
| Lithuanian | 1,113 | 0.1% |
| Lumbee | 50 | 0.0% |
| Luxembourger | 59 | 0.0% |
| Macedonian | 95 | 0.0% |
| Malaysian | 6,186 | 0.3% |
| Maltese | 202 | 0.0% |
| Mexican | 510,837 | 24.2% |
| Mexican American Indian | 3,638 | 0.2% |
| Mongolian | 618 | 0.0% |
| Moroccan | 668 | 0.0% |
| Native Hawaiian | 1,809 | 0.1% |
| Navajo | 906 | 0.0% |
| New Zealander | 76 | 0.0% |
| Nicaraguan | 1,390 | 0.1% |
| Nigerian | 10,575 | 0.5% |
| Northern European | 2,104 | 0.1% |
| Norwegian | 13,112 | 0.6% |
| Osage | 194 | 0.0% |
| Ottawa | 57 | 0.0% |
| Pakistani | 2,156 | 0.1% |
| Palestinian | 1,884 | 0.1% |
| Panamanian | 1,383 | 0.1% |
| Pennsylvania German | 155 | 0.0% |
| Peruvian | 3,241 | 0.2% |
| Pima | 2 | 0.0% |
| Polish | 20,201 | 1.0% |
| Portuguese | 3,411 | 0.2% |
| Potawatomi | 116 | 0.0% |
| Pueblo | 343 | 0.0% |
| Puerto Rican | 25,252 | 1.2% |
| Puget Sound Salish | 37 | 0.0% |
| Romanian | 983 | 0.1% |
| Russian | 4,910 | 0.2% |
| Salvadoran | 16,661 | 0.8% |
| Samoan | 1,441 | 0.1% |
| Scandinavian | 4,084 | 0.2% |
| Scotch-Irish | 17,699 | 0.8% |
| Scottish | 33,802 | 1.6% |
| Seminole | 82 | 0.0% |
| Senegalese | 164 | 0.0% |
| Serbian | 489 | 0.0% |
| Shoshone | 10 | 0.0% |
| Sioux | 474 | 0.0% |
| Slavic | 623 | 0.0% |
| Slovak | 1,215 | 0.1% |
| Slovene | 316 | 0.0% |
| Somali | 1,455 | 0.1% |
| South African | 635 | 0.0% |
| South American | 16,750 | 0.8% |
| South American Indian | 158 | 0.0% |
| Spaniard | 8,191 | 0.4% |
| Spanish | 5,324 | 0.3% |
| Spanish American | 60 | 0.0% |
| Spanish American Indian | 57 | 0.0% |
| Sri Lankan | 39,998 | 1.9% |
| Subsaharan African | 58,033 | 2.8% |
| Sudanese | 1,811 | 0.1% |
| Swedish | 11,717 | 0.5% |
| Swiss | 2,149 | 0.1% |
| Syrian | 337 | 0.0% |
| Taiwanese | 77 | 0.0% |
| Thai | 26,846 | 1.3% |
| Tlingit-Haida | 49 | 0.0% |
| Tongan | 1,408 | 0.1% |
| Trinidadian and Tobagonian | 1,289 | 0.1% |
| Turkish | 968 | 0.1% |
| U.S. Virgin Islander | 87 | 0.0% |
| Ugandan | 485 | 0.0% |
| Ukrainian | 2,108 | 0.1% |
| Uruguayan | 224 | 0.0% |
| Ute | 8 | 0.0% |
| Venezuelan | 3,316 | 0.2% |
| Vietnamese | 825 | 0.0% |
| Welsh | 8,902 | 0.4% |
| West Indian | 562 | 0.0% |
| Yakama | 7 | 0.0% |
| Yaqui | 262 | 0.0% |
| Yugoslavian | 789 | 0.0% |
| Yup'ik | 123 | 0.0% |
| Zimbabwean | 905 | 0.0% | View All 187 Rows |
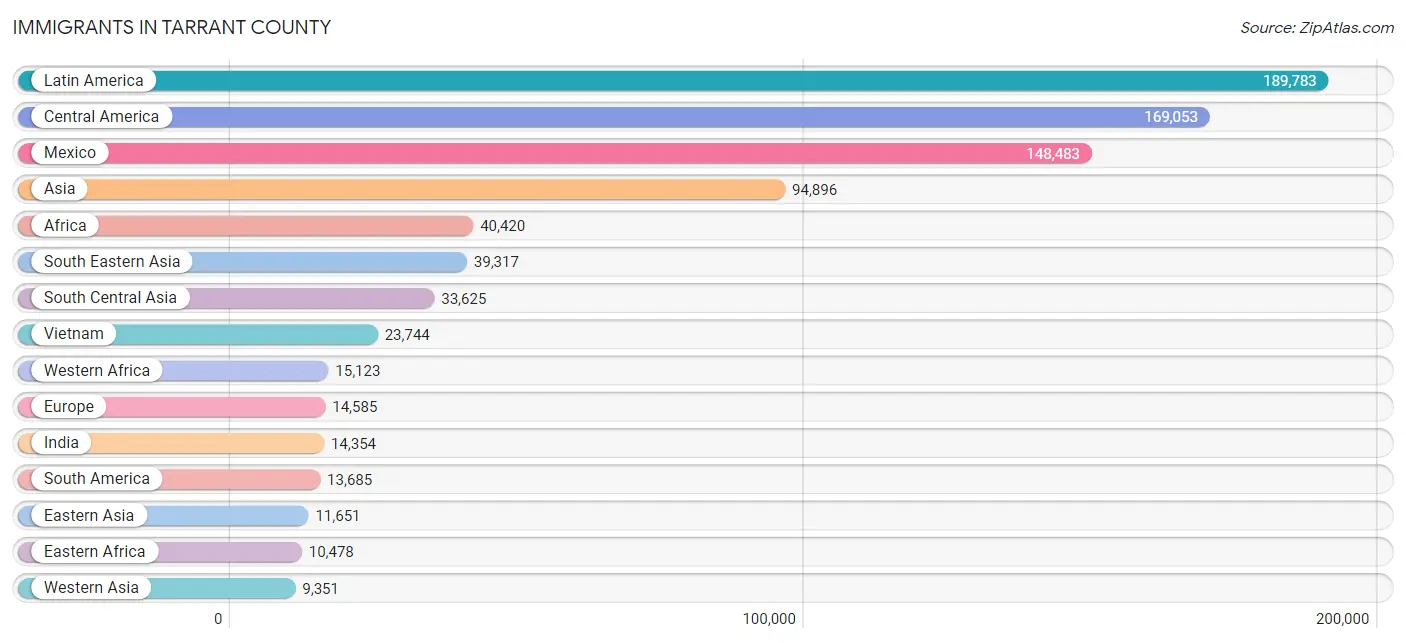
Immigrants in Tarrant County
The most numerous immigrant groups reported in Tarrant County came from Latin America (189,783 | 9.0%), Central America (169,053 | 8.0%), Mexico (148,483 | 7.0%), Asia (94,896 | 4.5%), and Africa (40,420 | 1.9%), together accounting for 30.4% of all Tarrant County residents.
| Immigration Origin | # Population | % Population |
| Afghanistan | 1,891 | 0.1% |
| Africa | 40,420 | 1.9% |
| Albania | 310 | 0.0% |
| Argentina | 844 | 0.0% |
| Armenia | 14 | 0.0% |
| Asia | 94,896 | 4.5% |
| Australia | 245 | 0.0% |
| Austria | 225 | 0.0% |
| Bahamas | 137 | 0.0% |
| Bangladesh | 1,480 | 0.1% |
| Barbados | 75 | 0.0% |
| Belarus | 74 | 0.0% |
| Belgium | 194 | 0.0% |
| Belize | 201 | 0.0% |
| Bolivia | 54 | 0.0% |
| Bosnia and Herzegovina | 562 | 0.0% |
| Brazil | 2,019 | 0.1% |
| Bulgaria | 87 | 0.0% |
| Cambodia | 476 | 0.0% |
| Cameroon | 1,922 | 0.1% |
| Canada | 3,079 | 0.2% |
| Caribbean | 7,045 | 0.3% |
| Central America | 169,053 | 8.0% |
| Chile | 325 | 0.0% |
| China | 5,837 | 0.3% |
| Colombia | 3,870 | 0.2% |
| Congo | 2,397 | 0.1% |
| Costa Rica | 282 | 0.0% |
| Croatia | 130 | 0.0% |
| Cuba | 3,903 | 0.2% |
| Czechoslovakia | 124 | 0.0% |
| Denmark | 153 | 0.0% |
| Dominica | 36 | 0.0% |
| Dominican Republic | 724 | 0.0% |
| Eastern Africa | 10,478 | 0.5% |
| Eastern Asia | 11,651 | 0.5% |
| Eastern Europe | 3,642 | 0.2% |
| Ecuador | 1,445 | 0.1% |
| Egypt | 3,144 | 0.2% |
| El Salvador | 9,291 | 0.4% |
| England | 1,260 | 0.1% |
| Eritrea | 165 | 0.0% |
| Ethiopia | 1,354 | 0.1% |
| Europe | 14,585 | 0.7% |
| France | 941 | 0.0% |
| Germany | 2,228 | 0.1% |
| Ghana | 3,066 | 0.2% |
| Greece | 251 | 0.0% |
| Grenada | 86 | 0.0% |
| Guatemala | 3,618 | 0.2% |
| Guyana | 274 | 0.0% |
| Haiti | 453 | 0.0% |
| Honduras | 6,050 | 0.3% |
| Hong Kong | 510 | 0.0% |
| Hungary | 79 | 0.0% |
| India | 14,354 | 0.7% |
| Indonesia | 566 | 0.0% |
| Iran | 1,741 | 0.1% |
| Iraq | 3,370 | 0.2% |
| Ireland | 275 | 0.0% |
| Israel | 392 | 0.0% |
| Italy | 590 | 0.0% |
| Jamaica | 951 | 0.0% |
| Japan | 1,141 | 0.1% |
| Jordan | 1,337 | 0.1% |
| Kazakhstan | 7 | 0.0% |
| Kenya | 4,296 | 0.2% |
| Korea | 4,673 | 0.2% |
| Kuwait | 872 | 0.0% |
| Laos | 3,605 | 0.2% |
| Latin America | 189,783 | 9.0% |
| Latvia | 127 | 0.0% |
| Lebanon | 739 | 0.0% |
| Liberia | 1,761 | 0.1% |
| Lithuania | 19 | 0.0% |
| Malaysia | 817 | 0.0% |
| Mexico | 148,483 | 7.0% |
| Micronesia | 406 | 0.0% |
| Middle Africa | 6,466 | 0.3% |
| Moldova | 24 | 0.0% |
| Morocco | 444 | 0.0% |
| Nepal | 7,653 | 0.4% |
| Netherlands | 255 | 0.0% |
| Nicaragua | 559 | 0.0% |
| Nigeria | 9,149 | 0.4% |
| North Macedonia | 32 | 0.0% |
| Northern Africa | 5,692 | 0.3% |
| Northern Europe | 5,171 | 0.2% |
| Norway | 21 | 0.0% |
| Oceania | 1,352 | 0.1% |
| Pakistan | 5,128 | 0.2% |
| Panama | 569 | 0.0% |
| Peru | 1,709 | 0.1% |
| Philippines | 7,255 | 0.3% |
| Poland | 466 | 0.0% |
| Portugal | 88 | 0.0% |
| Romania | 251 | 0.0% |
| Russia | 672 | 0.0% |
| Saudi Arabia | 1,019 | 0.1% |
| Scotland | 316 | 0.0% |
| Senegal | 139 | 0.0% |
| Serbia | 116 | 0.0% |
| Sierra Leone | 53 | 0.0% |
| Singapore | 154 | 0.0% |
| Somalia | 1,292 | 0.1% |
| South Africa | 878 | 0.0% |
| South America | 13,685 | 0.6% |
| South Central Asia | 33,625 | 1.6% |
| South Eastern Asia | 39,317 | 1.9% |
| Southern Europe | 1,709 | 0.1% |
| Spain | 780 | 0.0% |
| Sri Lanka | 673 | 0.0% |
| St. Vincent and the Grenadines | 40 | 0.0% |
| Sudan | 1,114 | 0.1% |
| Sweden | 157 | 0.0% |
| Switzerland | 160 | 0.0% |
| Syria | 557 | 0.0% |
| Taiwan | 1,602 | 0.1% |
| Thailand | 1,354 | 0.1% |
| Trinidad and Tobago | 495 | 0.0% |
| Turkey | 588 | 0.0% |
| Uganda | 478 | 0.0% |
| Ukraine | 336 | 0.0% |
| Uruguay | 202 | 0.0% |
| Uzbekistan | 16 | 0.0% |
| Venezuela | 2,943 | 0.1% |
| Vietnam | 23,744 | 1.1% |
| Western Africa | 15,123 | 0.7% |
| Western Asia | 9,351 | 0.4% |
| Western Europe | 4,022 | 0.2% |
| Yemen | 13 | 0.0% |
| Zaire | 2,000 | 0.1% |
| Zimbabwe | 487 | 0.0% | View All 133 Rows |
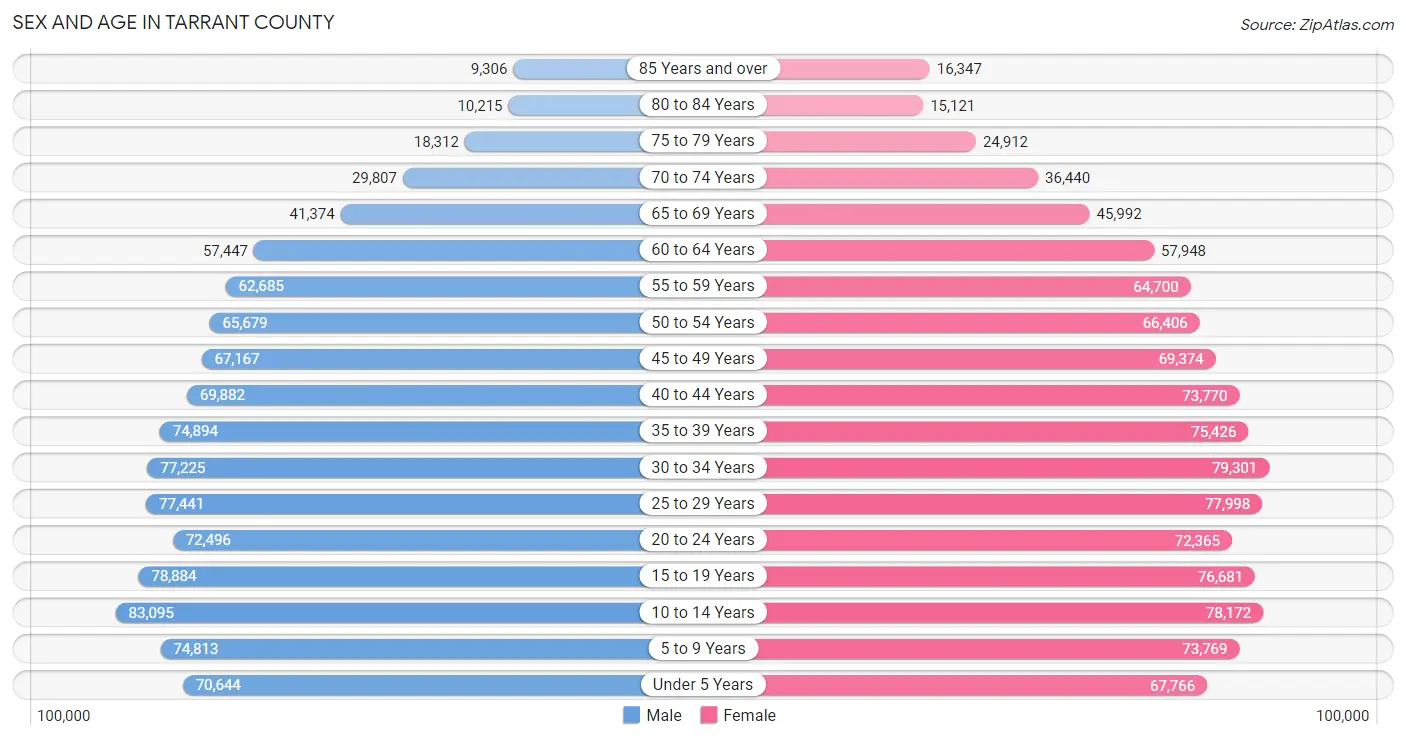
Sex and Age in Tarrant County
Sex and Age in Tarrant County
The most populous age groups in Tarrant County are 10 to 14 Years (83,095 | 8.0%) for men and 30 to 34 Years (79,301 | 7.4%) for women.
| Age Bracket | Male | Female |
| Under 5 Years | 70,644 (6.8%) | 67,766 (6.3%) |
| 5 to 9 Years | 74,813 (7.2%) | 73,769 (6.9%) |
| 10 to 14 Years | 83,095 (8.0%) | 78,172 (7.3%) |
| 15 to 19 Years | 78,884 (7.6%) | 76,681 (7.1%) |
| 20 to 24 Years | 72,496 (7.0%) | 72,365 (6.8%) |
| 25 to 29 Years | 77,441 (7.4%) | 77,998 (7.3%) |
| 30 to 34 Years | 77,225 (7.4%) | 79,301 (7.4%) |
| 35 to 39 Years | 74,894 (7.2%) | 75,426 (7.0%) |
| 40 to 44 Years | 69,882 (6.7%) | 73,770 (6.9%) |
| 45 to 49 Years | 67,167 (6.5%) | 69,374 (6.5%) |
| 50 to 54 Years | 65,679 (6.3%) | 66,406 (6.2%) |
| 55 to 59 Years | 62,685 (6.0%) | 64,700 (6.0%) |
| 60 to 64 Years | 57,447 (5.5%) | 57,948 (5.4%) |
| 65 to 69 Years | 41,374 (4.0%) | 45,992 (4.3%) |
| 70 to 74 Years | 29,807 (2.9%) | 36,440 (3.4%) |
| 75 to 79 Years | 18,312 (1.8%) | 24,912 (2.3%) |
| 80 to 84 Years | 10,215 (1.0%) | 15,121 (1.4%) |
| 85 Years and over | 9,306 (0.9%) | 16,347 (1.5%) |
| Total | 1,041,366 (100.0%) | 1,072,488 (100.0%) |
Families and Households in Tarrant County
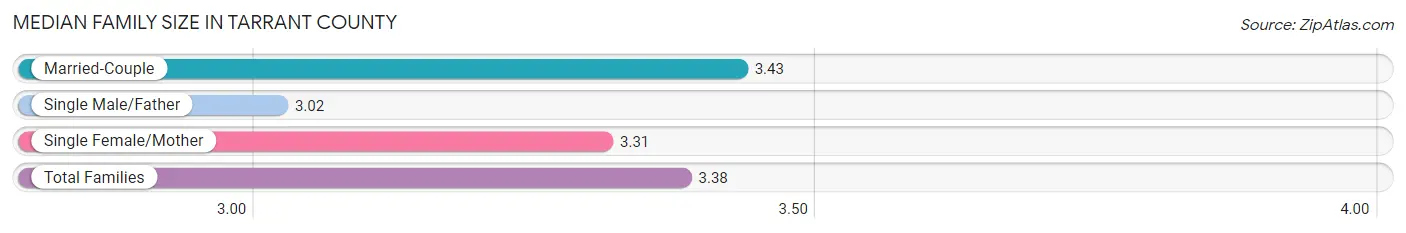
Median Family Size in Tarrant County
The median family size in Tarrant County is 3.38 persons per family, with married-couple families (372,195 | 72.5%) accounting for the largest median family size of 3.43 persons per family. On the other hand, single male/father families (38,910 | 7.6%) represent the smallest median family size with 3.02 persons per family.
| Family Type | # Families | Family Size |
| Married-Couple | 372,195 (72.5%) | 3.43 |
| Single Male/Father | 38,910 (7.6%) | 3.02 |
| Single Female/Mother | 102,220 (19.9%) | 3.31 |
| Total Families | 513,325 (100.0%) | 3.38 |
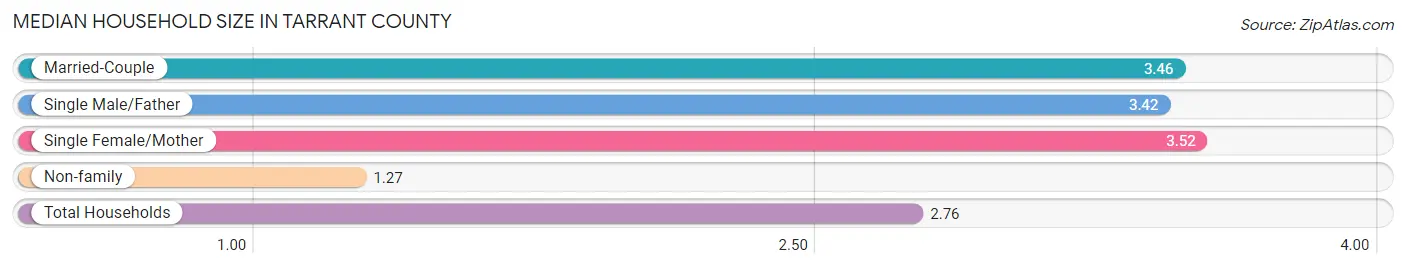
Median Household Size in Tarrant County
The median household size in Tarrant County is 2.76 persons per household, with single female/mother households (102,220 | 13.5%) accounting for the largest median household size of 3.52 persons per household. non-family households (241,644 | 32.0%) represent the smallest median household size with 1.27 persons per household.
| Household Type | # Households | Household Size |
| Married-Couple | 372,195 (49.3%) | 3.46 |
| Single Male/Father | 38,910 (5.1%) | 3.42 |
| Single Female/Mother | 102,220 (13.5%) | 3.52 |
| Non-family | 241,644 (32.0%) | 1.27 |
| Total Households | 754,969 (100.0%) | 2.76 |
Household Size by Marriage Status in Tarrant County
Out of a total of 754,969 households in Tarrant County, 513,325 (68.0%) are family households, while 241,644 (32.0%) are nonfamily households. The most numerous type of family households are 2-person households, comprising 197,469, and the most common type of nonfamily households are 1-person households, comprising 196,344.
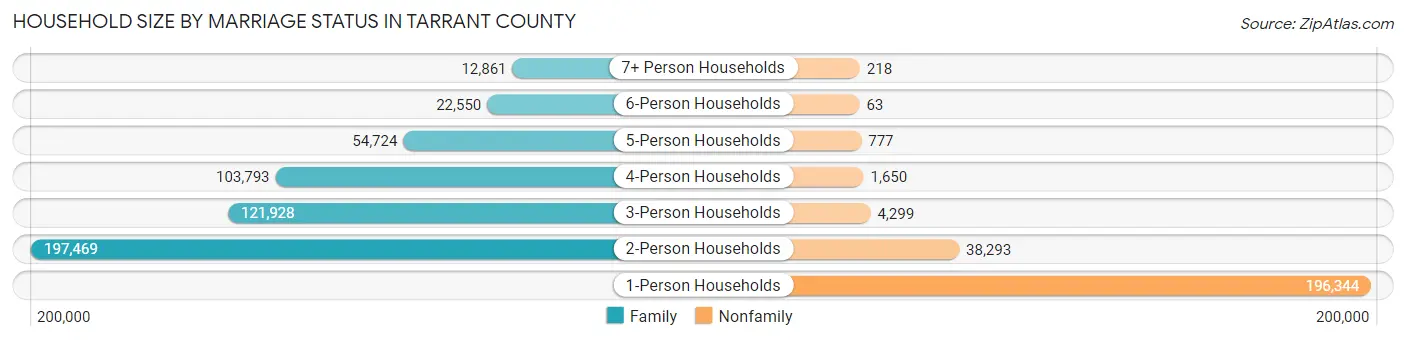
| Household Size | Family Households | Nonfamily Households |
| 1-Person Households | - | 196,344 (26.0%) |
| 2-Person Households | 197,469 (26.2%) | 38,293 (5.1%) |
| 3-Person Households | 121,928 (16.2%) | 4,299 (0.6%) |
| 4-Person Households | 103,793 (13.8%) | 1,650 (0.2%) |
| 5-Person Households | 54,724 (7.2%) | 777 (0.1%) |
| 6-Person Households | 22,550 (3.0%) | 63 (0.0%) |
| 7+ Person Households | 12,861 (1.7%) | 218 (0.0%) |
| Total | 513,325 (68.0%) | 241,644 (32.0%) |
Female Fertility in Tarrant County
Fertility by Age in Tarrant County
Average fertility rate in Tarrant County is 55.0 births per 1,000 women. Women in the age bracket of 20 to 34 years have the highest fertility rate with 91.0 births per 1,000 women. Women in the age bracket of 20 to 34 years acount for 69.9% of all women with births.
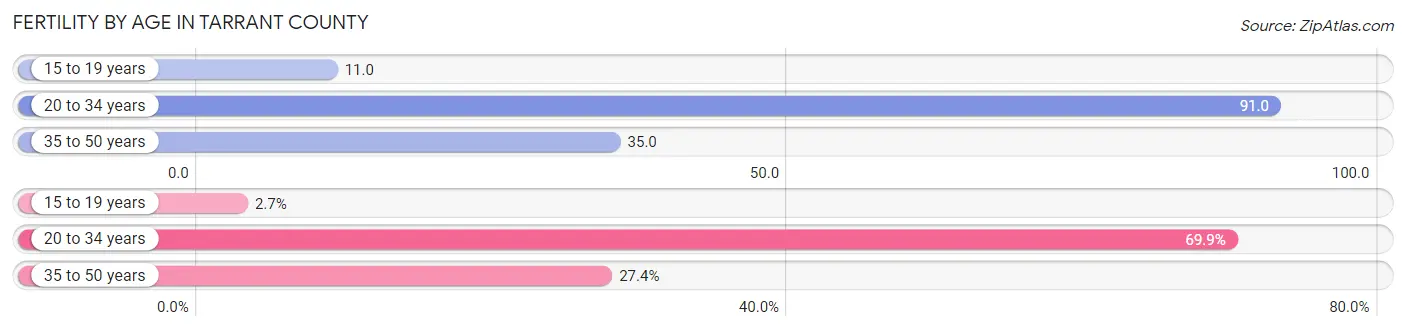
| Age Bracket | Women with Births | Births / 1,000 Women |
| 15 to 19 years | 810 (2.7%) | 11.0 |
| 20 to 34 years | 20,910 (69.9%) | 91.0 |
| 35 to 50 years | 8,208 (27.4%) | 35.0 |
| Total | 29,928 (100.0%) | 55.0 |
Fertility by Age by Marriage Status in Tarrant County
67.7% of women with births (29,928) in Tarrant County are married. The highest percentage of unmarried women with births falls into 15 to 19 years age bracket with 83.7% of them unmarried at the time of birth, while the lowest percentage of unmarried women with births belong to 35 to 50 years age bracket with 20.7% of them unmarried.
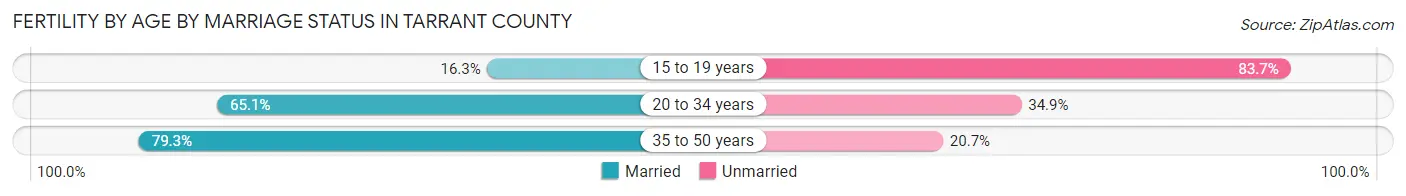
| Age Bracket | Married | Unmarried |
| 15 to 19 years | 132 (16.3%) | 678 (83.7%) |
| 20 to 34 years | 13,612 (65.1%) | 7,298 (34.9%) |
| 35 to 50 years | 6,509 (79.3%) | 1,699 (20.7%) |
| Total | 20,261 (67.7%) | 9,667 (32.3%) |
Fertility by Education in Tarrant County
Average fertility rate in Tarrant County is 55.0 births per 1,000 women. Women with the education attainment of graduate degree have the highest fertility rate of 62.0 births per 1,000 women, while women with the education attainment of less than high school have the lowest fertility at 39.0 births per 1,000 women. Women with the education attainment of college or associate's degree represent 29.9% of all women with births.
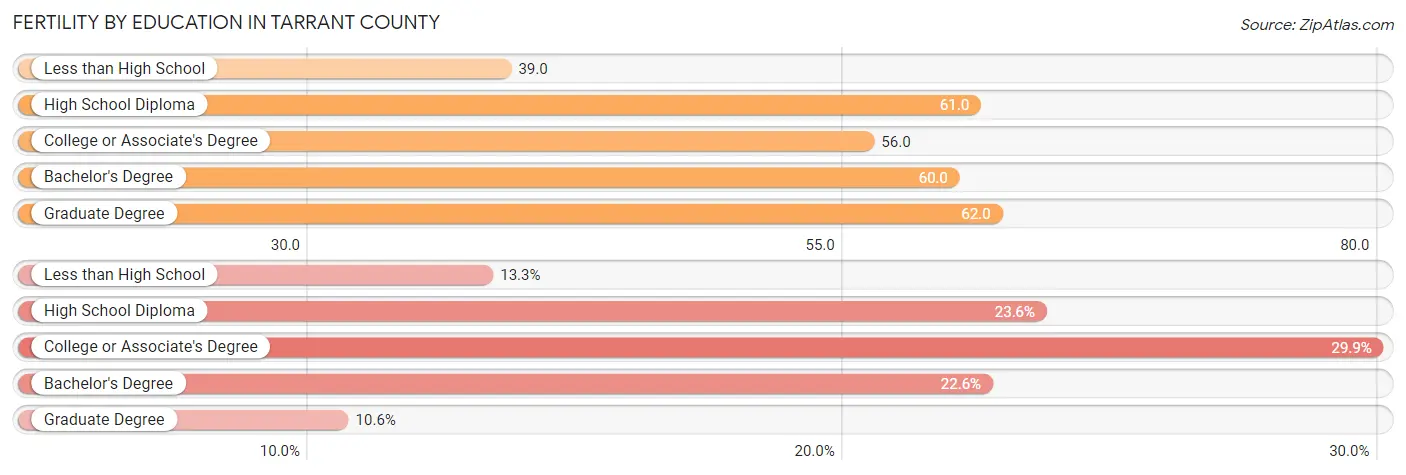
| Educational Attainment | Women with Births | Births / 1,000 Women |
| Less than High School | 3,969 (13.3%) | 39.0 |
| High School Diploma | 7,071 (23.6%) | 61.0 |
| College or Associate's Degree | 8,960 (29.9%) | 56.0 |
| Bachelor's Degree | 6,771 (22.6%) | 60.0 |
| Graduate Degree | 3,157 (10.5%) | 62.0 |
| Total | 29,928 (100.0%) | 55.0 |
Fertility by Education by Marriage Status in Tarrant County
32.3% of women with births in Tarrant County are unmarried. Women with the educational attainment of graduate degree are most likely to be married with 90.6% of them married at childbirth, while women with the educational attainment of high school diploma are least likely to be married with 47.7% of them unmarried at childbirth.
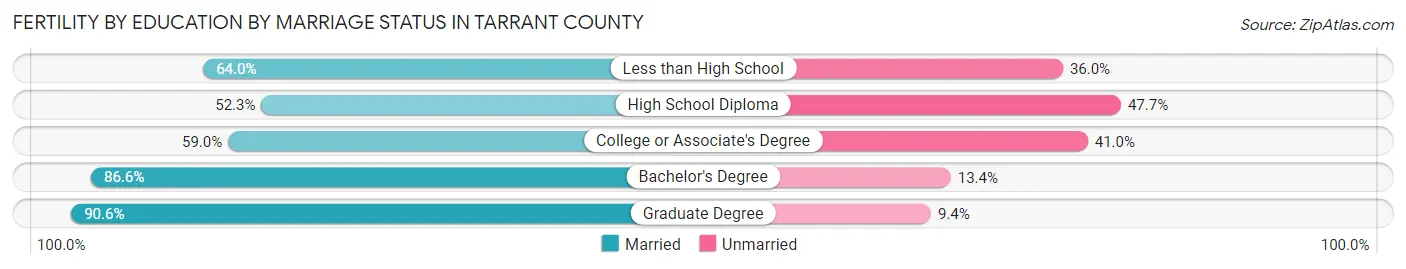
| Educational Attainment | Married | Unmarried |
| Less than High School | 2,540 (64.0%) | 1,429 (36.0%) |
| High School Diploma | 3,698 (52.3%) | 3,373 (47.7%) |
| College or Associate's Degree | 5,286 (59.0%) | 3,674 (41.0%) |
| Bachelor's Degree | 5,864 (86.6%) | 907 (13.4%) |
| Graduate Degree | 2,860 (90.6%) | 297 (9.4%) |
| Total | 20,261 (67.7%) | 9,667 (32.3%) |
Employment Characteristics in Tarrant County
Employment by Class of Employer in Tarrant County
Among the 1,050,372 employed individuals in Tarrant County, private company employees (768,343 | 73.2%), local government employees (71,312 | 6.8%), and self-employed (not incorporated) (63,829 | 6.1%) make up the most common classes of employment.
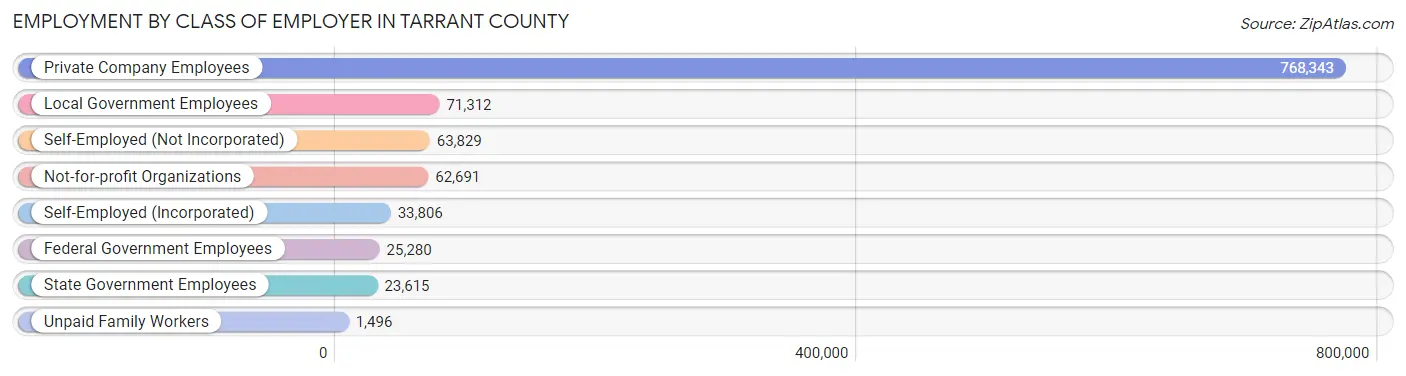
| Employer Class | # Employees | % Employees |
| Private Company Employees | 768,343 | 73.2% |
| Self-Employed (Incorporated) | 33,806 | 3.2% |
| Self-Employed (Not Incorporated) | 63,829 | 6.1% |
| Not-for-profit Organizations | 62,691 | 6.0% |
| Local Government Employees | 71,312 | 6.8% |
| State Government Employees | 23,615 | 2.2% |
| Federal Government Employees | 25,280 | 2.4% |
| Unpaid Family Workers | 1,496 | 0.1% |
| Total | 1,050,372 | 100.0% |
Employment Status by Age in Tarrant County
According to the labor force statistics for Tarrant County, out of the total population over 16 years of age (1,634,493), 68.7% or 1,122,897 individuals are in the labor force, with 4.9% or 55,022 of them unemployed. The age group with the highest labor force participation rate is 25 to 29 years, with 84.6% or 131,501 individuals in the labor force. Within the labor force, the 16 to 19 years age range has the highest percentage of unemployed individuals, with 13.2% or 6,210 of them being unemployed.
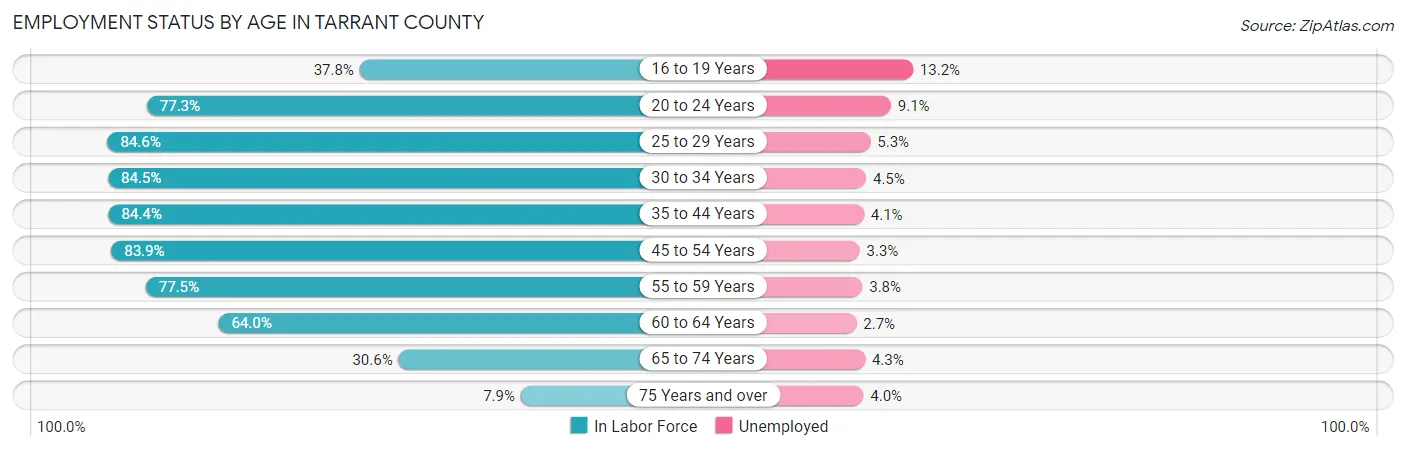
| Age Bracket | In Labor Force | Unemployed |
| 16 to 19 Years | 47,047 (37.8%) | 6,210 (13.2%) |
| 20 to 24 Years | 111,978 (77.3%) | 10,190 (9.1%) |
| 25 to 29 Years | 131,501 (84.6%) | 6,970 (5.3%) |
| 30 to 34 Years | 132,264 (84.5%) | 5,952 (4.5%) |
| 35 to 44 Years | 248,112 (84.4%) | 10,173 (4.1%) |
| 45 to 54 Years | 225,377 (83.9%) | 7,437 (3.3%) |
| 55 to 59 Years | 98,723 (77.5%) | 3,751 (3.8%) |
| 60 to 64 Years | 73,853 (64.0%) | 1,994 (2.7%) |
| 65 to 74 Years | 47,006 (30.6%) | 2,021 (4.3%) |
| 75 Years and over | 7,443 (7.9%) | 298 (4.0%) |
| Total | 1,122,897 (68.7%) | 55,022 (4.9%) |
Employment Status by Educational Attainment in Tarrant County
According to labor force statistics for Tarrant County, 81.4% of individuals (909,517) out of the total population between 25 and 64 years of age (1,117,343) are in the labor force, with 4.0% or 36,381 of them being unemployed. The group with the highest labor force participation rate are those with the educational attainment of bachelor's degree or higher, with 87.2% or 335,829 individuals in the labor force. Within the labor force, individuals with high school diploma education have the highest percentage of unemployment, with 5.1% or 10,286 of them being unemployed.
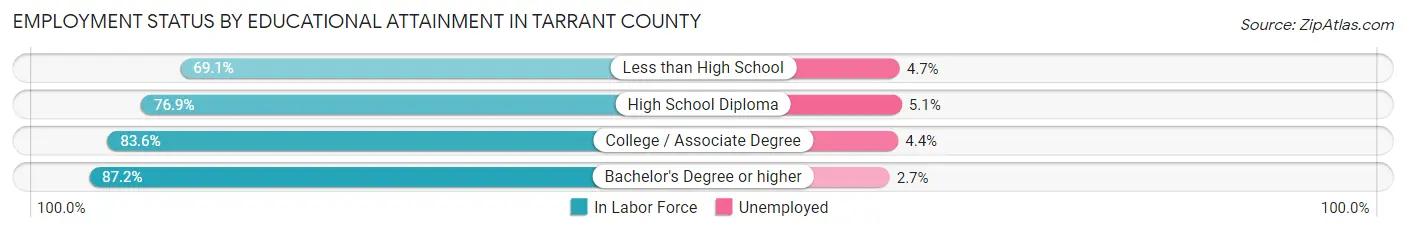
| Educational Attainment | In Labor Force | Unemployed |
| Less than High School | 97,844 (69.1%) | 6,655 (4.7%) |
| High School Diploma | 201,692 (76.9%) | 13,376 (5.1%) |
| College / Associate Degree | 274,495 (83.6%) | 14,447 (4.4%) |
| Bachelor's Degree or higher | 335,829 (87.2%) | 10,398 (2.7%) |
| Total | 909,517 (81.4%) | 44,694 (4.0%) |
Employment Occupations by Sex in Tarrant County
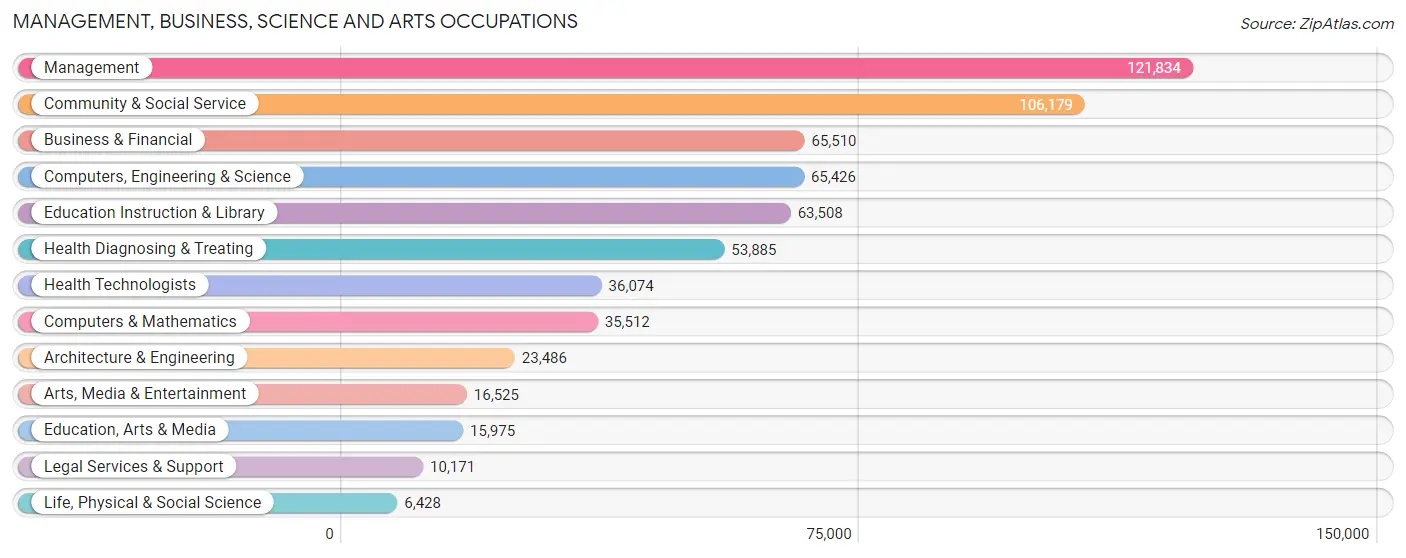
Management, Business, Science and Arts Occupations
The most common Management, Business, Science and Arts occupations in Tarrant County are Management (121,834 | 11.4%), Community & Social Service (106,179 | 10.0%), Business & Financial (65,510 | 6.1%), Computers, Engineering & Science (65,426 | 6.1%), and Education Instruction & Library (63,508 | 6.0%).
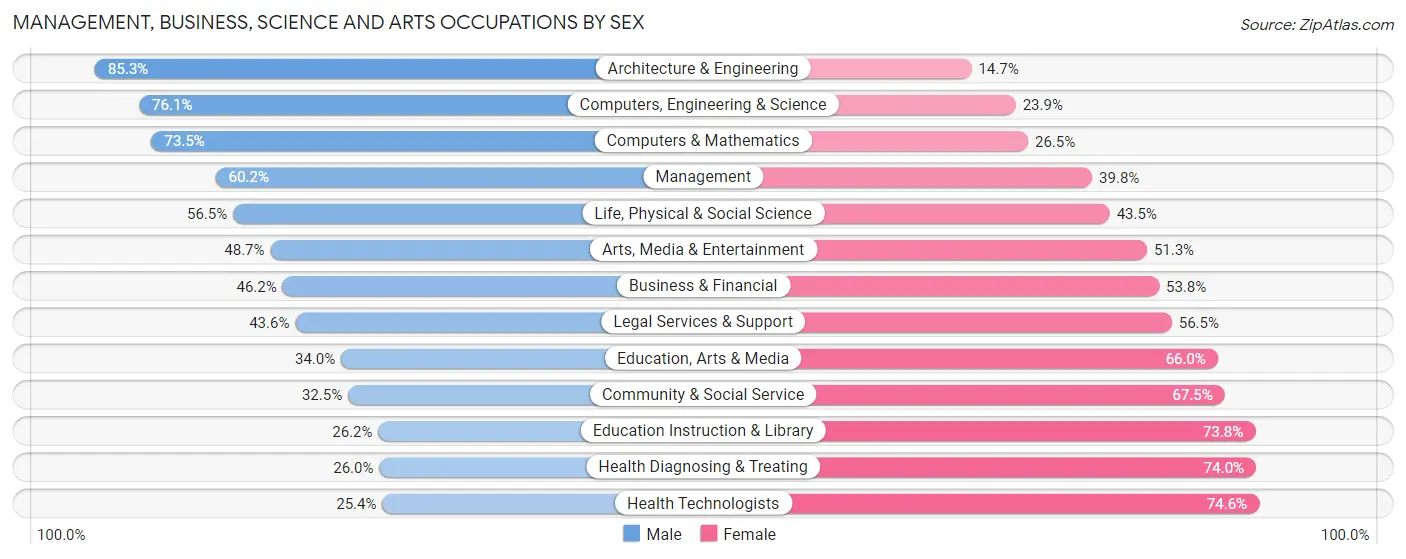
Management, Business, Science and Arts Occupations by Sex
Within the Management, Business, Science and Arts occupations in Tarrant County, the most male-oriented occupations are Architecture & Engineering (85.3%), Computers, Engineering & Science (76.1%), and Computers & Mathematics (73.5%), while the most female-oriented occupations are Health Technologists (74.6%), Health Diagnosing & Treating (74.0%), and Education Instruction & Library (73.8%).
| Occupation | Male | Female |
| Management | 73,301 (60.2%) | 48,533 (39.8%) |
| Business & Financial | 30,262 (46.2%) | 35,248 (53.8%) |
| Computers, Engineering & Science | 49,789 (76.1%) | 15,637 (23.9%) |
| Computers & Mathematics | 26,116 (73.5%) | 9,396 (26.5%) |
| Architecture & Engineering | 20,041 (85.3%) | 3,445 (14.7%) |
| Life, Physical & Social Science | 3,632 (56.5%) | 2,796 (43.5%) |
| Community & Social Service | 34,550 (32.5%) | 71,629 (67.5%) |
| Education, Arts & Media | 5,429 (34.0%) | 10,546 (66.0%) |
| Legal Services & Support | 4,429 (43.5%) | 5,742 (56.5%) |
| Education Instruction & Library | 16,640 (26.2%) | 46,868 (73.8%) |
| Arts, Media & Entertainment | 8,052 (48.7%) | 8,473 (51.3%) |
| Health Diagnosing & Treating | 14,014 (26.0%) | 39,871 (74.0%) |
| Health Technologists | 9,155 (25.4%) | 26,919 (74.6%) |
| Total (Category) | 201,916 (48.9%) | 210,918 (51.1%) |
| Total (Overall) | 575,891 (54.0%) | 489,826 (46.0%) |
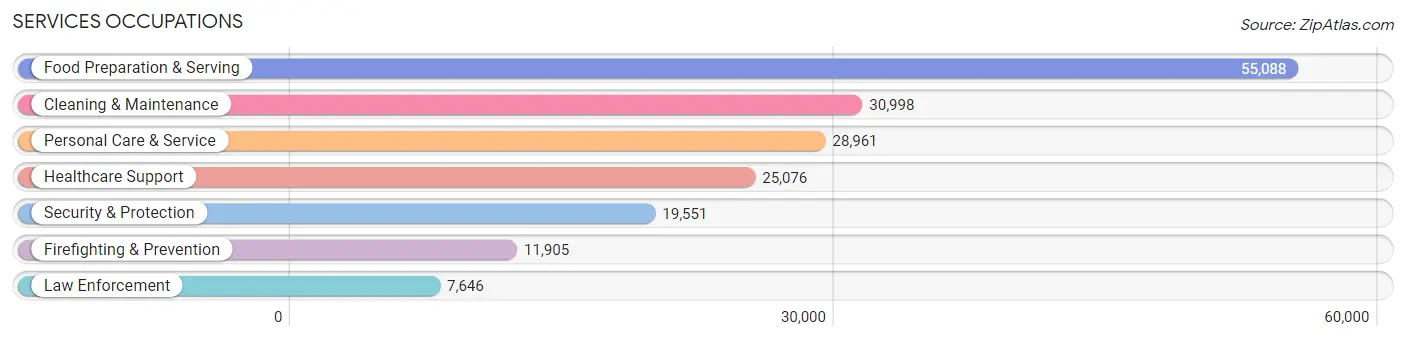
Services Occupations
The most common Services occupations in Tarrant County are Food Preparation & Serving (55,088 | 5.2%), Cleaning & Maintenance (30,998 | 2.9%), Personal Care & Service (28,961 | 2.7%), Healthcare Support (25,076 | 2.4%), and Security & Protection (19,551 | 1.8%).
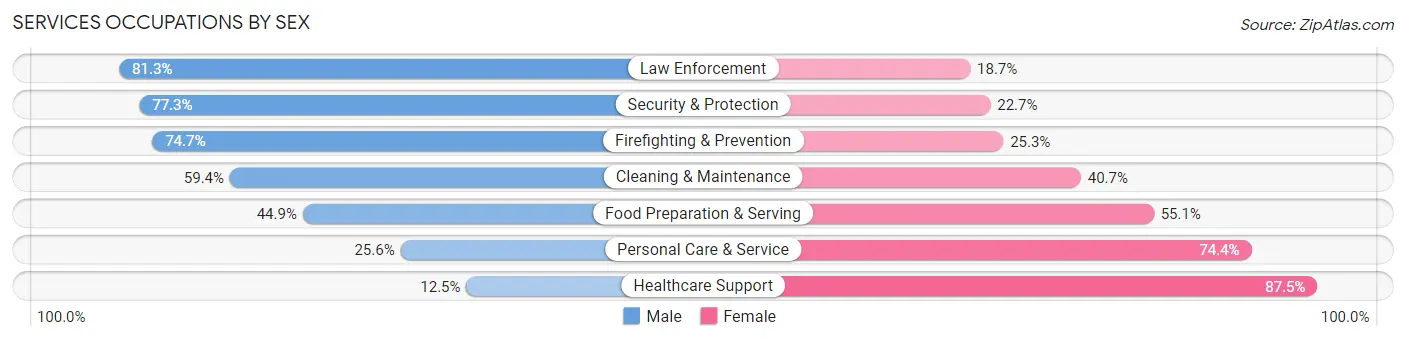
Services Occupations by Sex
Within the Services occupations in Tarrant County, the most male-oriented occupations are Law Enforcement (81.3%), Security & Protection (77.3%), and Firefighting & Prevention (74.7%), while the most female-oriented occupations are Healthcare Support (87.5%), Personal Care & Service (74.4%), and Food Preparation & Serving (55.1%).
| Occupation | Male | Female |
| Healthcare Support | 3,140 (12.5%) | 21,936 (87.5%) |
| Security & Protection | 15,109 (77.3%) | 4,442 (22.7%) |
| Firefighting & Prevention | 8,895 (74.7%) | 3,010 (25.3%) |
| Law Enforcement | 6,214 (81.3%) | 1,432 (18.7%) |
| Food Preparation & Serving | 24,745 (44.9%) | 30,343 (55.1%) |
| Cleaning & Maintenance | 18,398 (59.4%) | 12,600 (40.6%) |
| Personal Care & Service | 7,404 (25.6%) | 21,557 (74.4%) |
| Total (Category) | 68,796 (43.1%) | 90,878 (56.9%) |
| Total (Overall) | 575,891 (54.0%) | 489,826 (46.0%) |
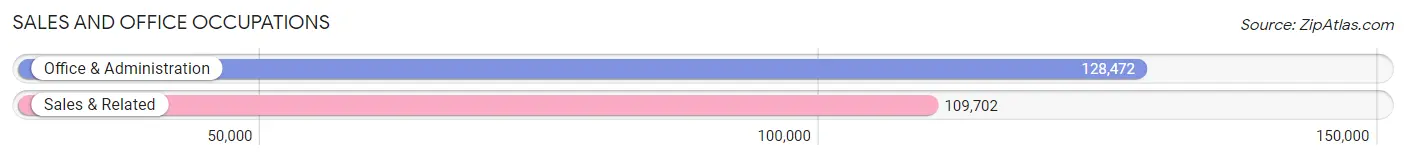
Sales and Office Occupations
The most common Sales and Office occupations in Tarrant County are Office & Administration (128,472 | 12.0%), and Sales & Related (109,702 | 10.3%).
Sales and Office Occupations by Sex
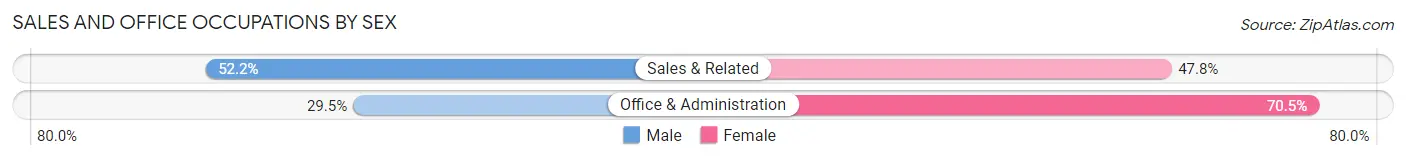
| Occupation | Male | Female |
| Sales & Related | 57,275 (52.2%) | 52,427 (47.8%) |
| Office & Administration | 37,869 (29.5%) | 90,603 (70.5%) |
| Total (Category) | 95,144 (40.0%) | 143,030 (60.1%) |
| Total (Overall) | 575,891 (54.0%) | 489,826 (46.0%) |
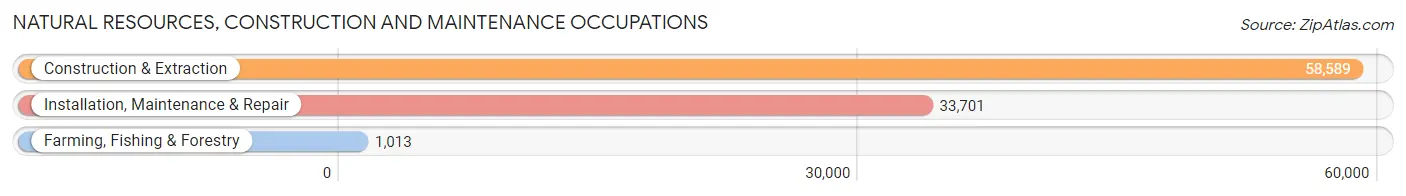
Natural Resources, Construction and Maintenance Occupations
The most common Natural Resources, Construction and Maintenance occupations in Tarrant County are Construction & Extraction (58,589 | 5.5%), Installation, Maintenance & Repair (33,701 | 3.2%), and Farming, Fishing & Forestry (1,013 | 0.1%).
Natural Resources, Construction and Maintenance Occupations by Sex
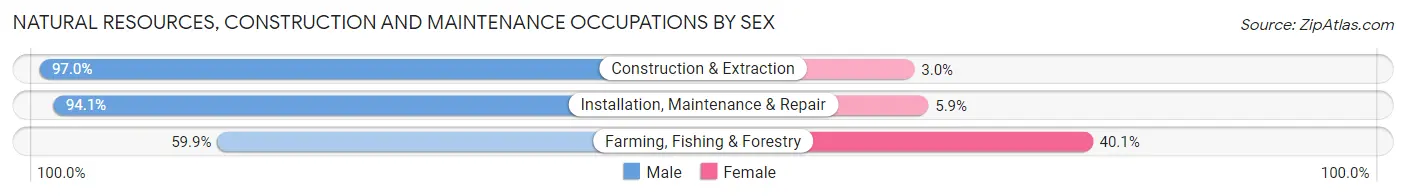
| Occupation | Male | Female |
| Farming, Fishing & Forestry | 607 (59.9%) | 406 (40.1%) |
| Construction & Extraction | 56,829 (97.0%) | 1,760 (3.0%) |
| Installation, Maintenance & Repair | 31,711 (94.1%) | 1,990 (5.9%) |
| Total (Category) | 89,147 (95.6%) | 4,156 (4.4%) |
| Total (Overall) | 575,891 (54.0%) | 489,826 (46.0%) |
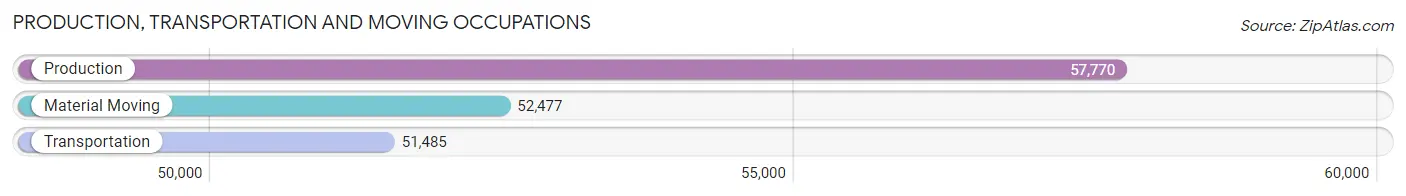
Production, Transportation and Moving Occupations
The most common Production, Transportation and Moving occupations in Tarrant County are Production (57,770 | 5.4%), Material Moving (52,477 | 4.9%), and Transportation (51,485 | 4.8%).
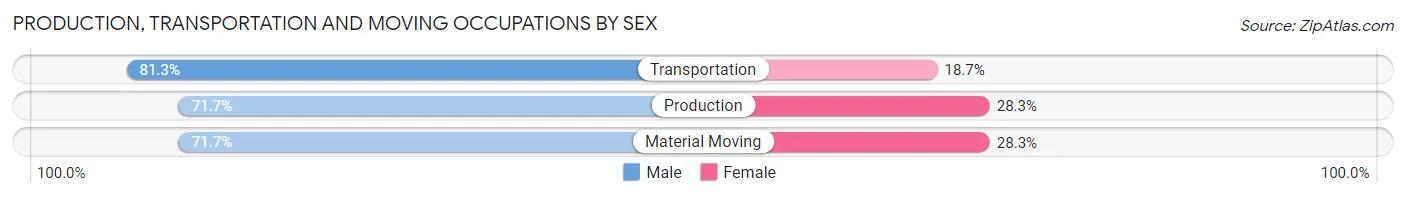
Production, Transportation and Moving Occupations by Sex
| Occupation | Male | Female |
| Production | 41,418 (71.7%) | 16,352 (28.3%) |
| Transportation | 41,852 (81.3%) | 9,633 (18.7%) |
| Material Moving | 37,618 (71.7%) | 14,859 (28.3%) |
| Total (Category) | 120,888 (74.8%) | 40,844 (25.3%) |
| Total (Overall) | 575,891 (54.0%) | 489,826 (46.0%) |
Employment Industries by Sex in Tarrant County
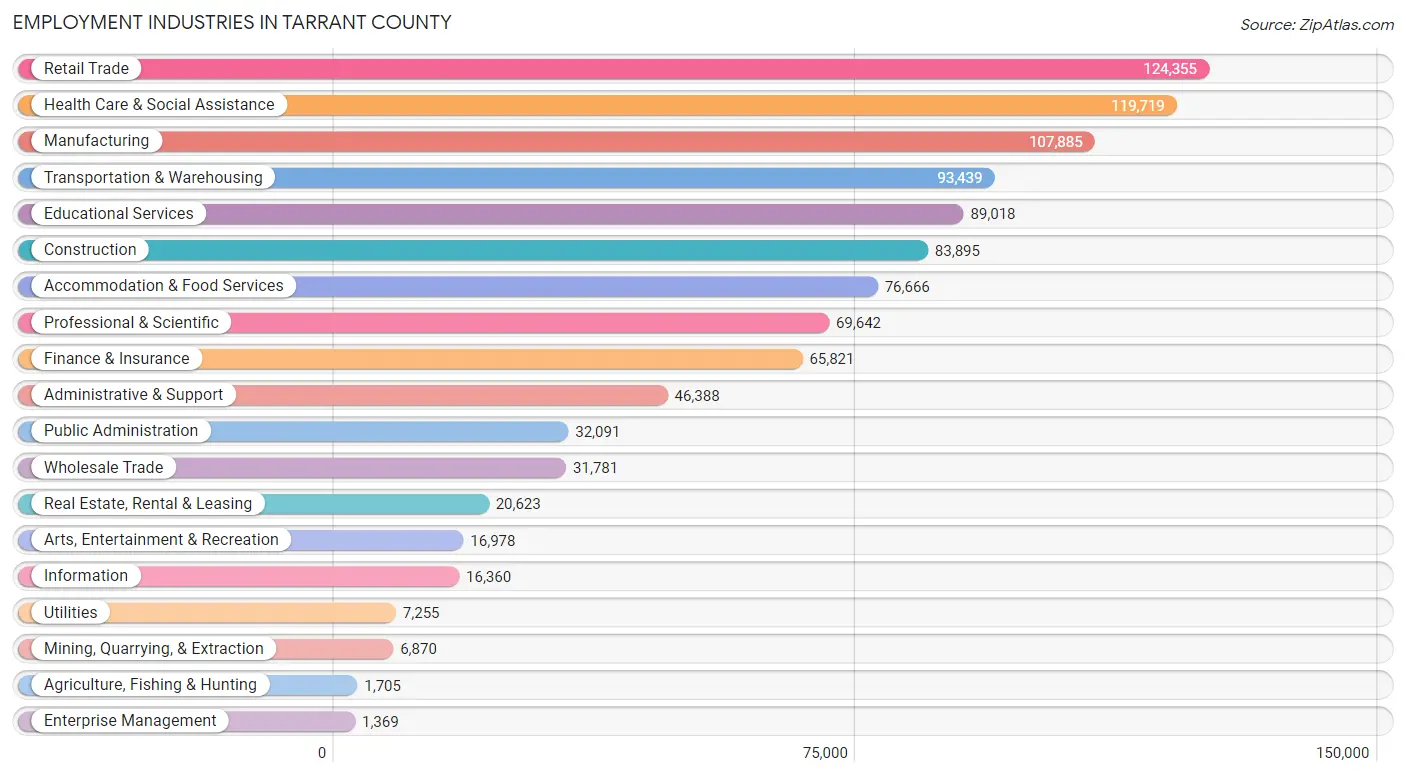
Employment Industries in Tarrant County
The major employment industries in Tarrant County include Retail Trade (124,355 | 11.7%), Health Care & Social Assistance (119,719 | 11.2%), Manufacturing (107,885 | 10.1%), Transportation & Warehousing (93,439 | 8.8%), and Educational Services (89,018 | 8.4%).
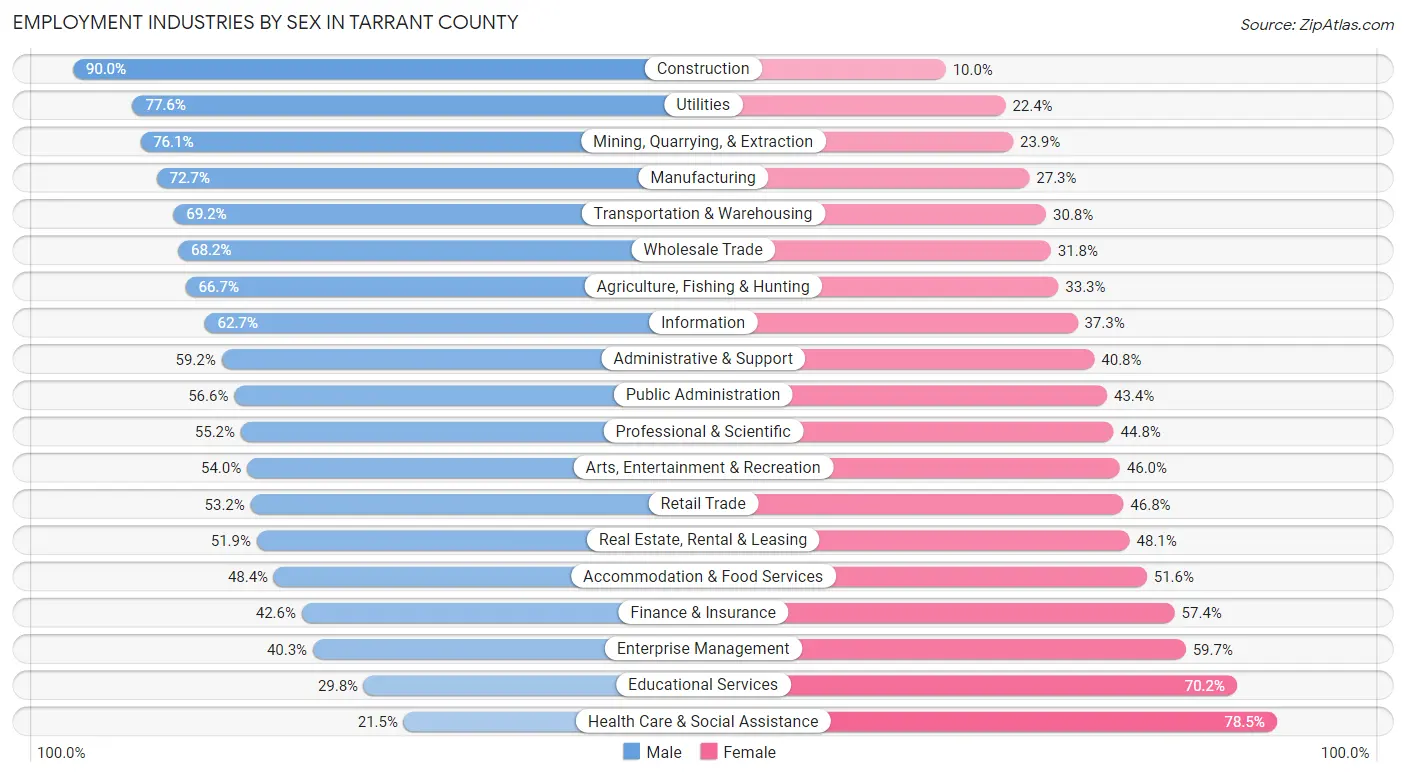
Employment Industries by Sex in Tarrant County
The Tarrant County industries that see more men than women are Construction (90.0%), Utilities (77.6%), and Mining, Quarrying, & Extraction (76.1%), whereas the industries that tend to have a higher number of women are Health Care & Social Assistance (78.5%), Educational Services (70.2%), and Enterprise Management (59.7%).
| Industry | Male | Female |
| Agriculture, Fishing & Hunting | 1,137 (66.7%) | 568 (33.3%) |
| Mining, Quarrying, & Extraction | 5,225 (76.1%) | 1,645 (23.9%) |
| Construction | 75,516 (90.0%) | 8,379 (10.0%) |
| Manufacturing | 78,420 (72.7%) | 29,465 (27.3%) |
| Wholesale Trade | 21,686 (68.2%) | 10,095 (31.8%) |
| Retail Trade | 66,178 (53.2%) | 58,177 (46.8%) |
| Transportation & Warehousing | 64,681 (69.2%) | 28,758 (30.8%) |
| Utilities | 5,633 (77.6%) | 1,622 (22.4%) |
| Information | 10,262 (62.7%) | 6,098 (37.3%) |
| Finance & Insurance | 28,054 (42.6%) | 37,767 (57.4%) |
| Real Estate, Rental & Leasing | 10,712 (51.9%) | 9,911 (48.1%) |
| Professional & Scientific | 38,472 (55.2%) | 31,170 (44.8%) |
| Enterprise Management | 552 (40.3%) | 817 (59.7%) |
| Administrative & Support | 27,478 (59.2%) | 18,910 (40.8%) |
| Educational Services | 26,488 (29.8%) | 62,530 (70.2%) |
| Health Care & Social Assistance | 25,753 (21.5%) | 93,966 (78.5%) |
| Arts, Entertainment & Recreation | 9,162 (54.0%) | 7,816 (46.0%) |
| Accommodation & Food Services | 37,099 (48.4%) | 39,567 (51.6%) |
| Public Administration | 18,166 (56.6%) | 13,925 (43.4%) |
| Total | 575,891 (54.0%) | 489,826 (46.0%) |
Education in Tarrant County
School Enrollment in Tarrant County
The most common levels of schooling among the 572,431 students in Tarrant County are high school (128,968 | 22.5%), middle school (127,452 | 22.3%), and elementary school (116,405 | 20.3%).
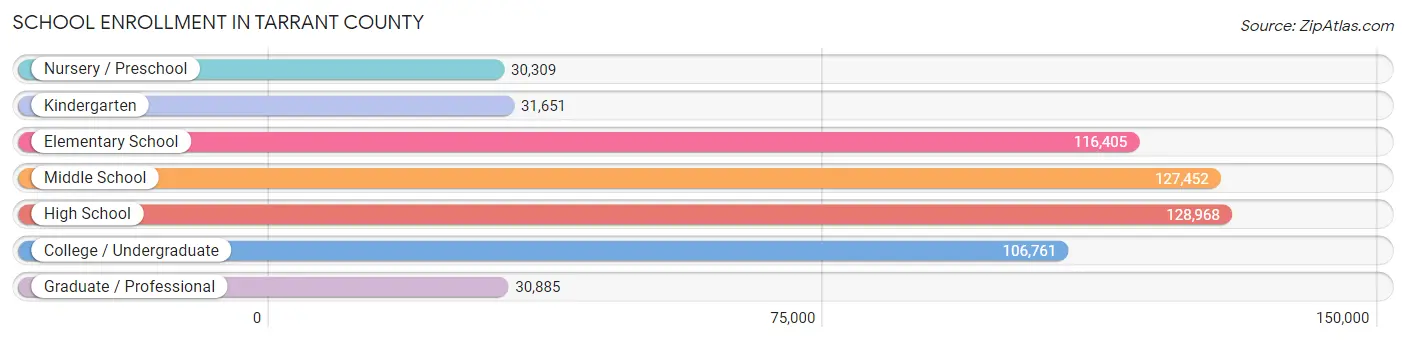
| School Level | # Students | % Students |
| Nursery / Preschool | 30,309 | 5.3% |
| Kindergarten | 31,651 | 5.5% |
| Elementary School | 116,405 | 20.3% |
| Middle School | 127,452 | 22.3% |
| High School | 128,968 | 22.5% |
| College / Undergraduate | 106,761 | 18.6% |
| Graduate / Professional | 30,885 | 5.4% |
| Total | 572,431 | 100.0% |
School Enrollment by Age by Funding Source in Tarrant County
Out of a total of 572,431 students who are enrolled in schools in Tarrant County, 80,140 (14.0%) attend a private institution, while the remaining 492,291 (86.0%) are enrolled in public schools. The age group of 3 to 4 year olds has the highest likelihood of being enrolled in private schools, with 10,006 (42.5% in the age bracket) enrolled. Conversely, the age group of 15 to 17 year olds has the lowest likelihood of being enrolled in a private school, with 86,289 (92.5% in the age bracket) attending a public institution.
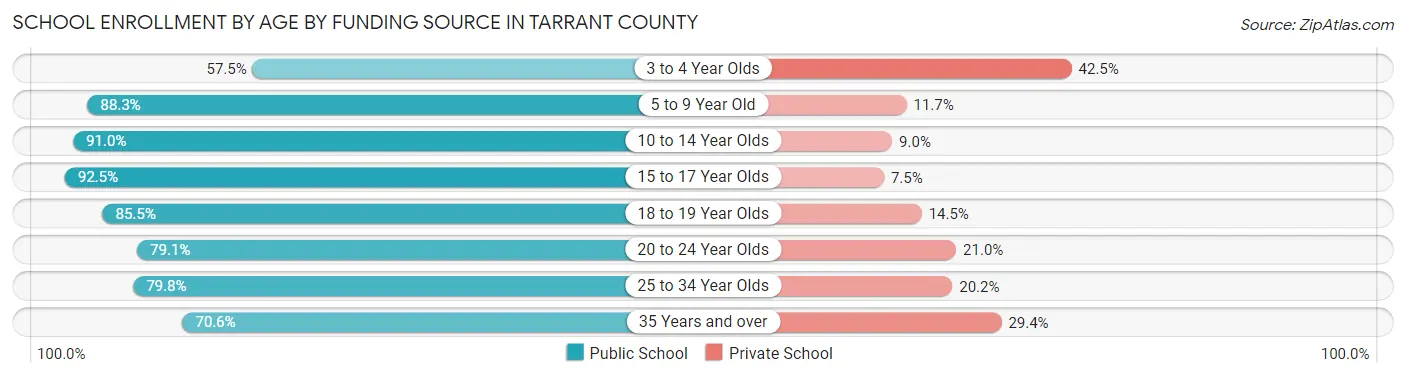
| Age Bracket | Public School | Private School |
| 3 to 4 Year Olds | 13,557 (57.5%) | 10,006 (42.5%) |
| 5 to 9 Year Old | 123,197 (88.3%) | 16,333 (11.7%) |
| 10 to 14 Year Olds | 143,057 (91.0%) | 14,192 (9.0%) |
| 15 to 17 Year Olds | 86,289 (92.5%) | 6,998 (7.5%) |
| 18 to 19 Year Olds | 35,340 (85.5%) | 6,009 (14.5%) |
| 20 to 24 Year Olds | 41,508 (79.0%) | 11,003 (20.9%) |
| 25 to 34 Year Olds | 28,151 (79.8%) | 7,145 (20.2%) |
| 35 Years and over | 20,932 (70.6%) | 8,714 (29.4%) |
| Total | 492,291 (86.0%) | 80,140 (14.0%) |
Educational Attainment by Field of Study in Tarrant County
Business (126,635 | 25.7%), education (49,901 | 10.1%), science & technology (46,774 | 9.5%), engineering (39,636 | 8.1%), and arts & humanities (33,737 | 6.9%) are the most common fields of study among 492,398 individuals in Tarrant County who have obtained a bachelor's degree or higher.
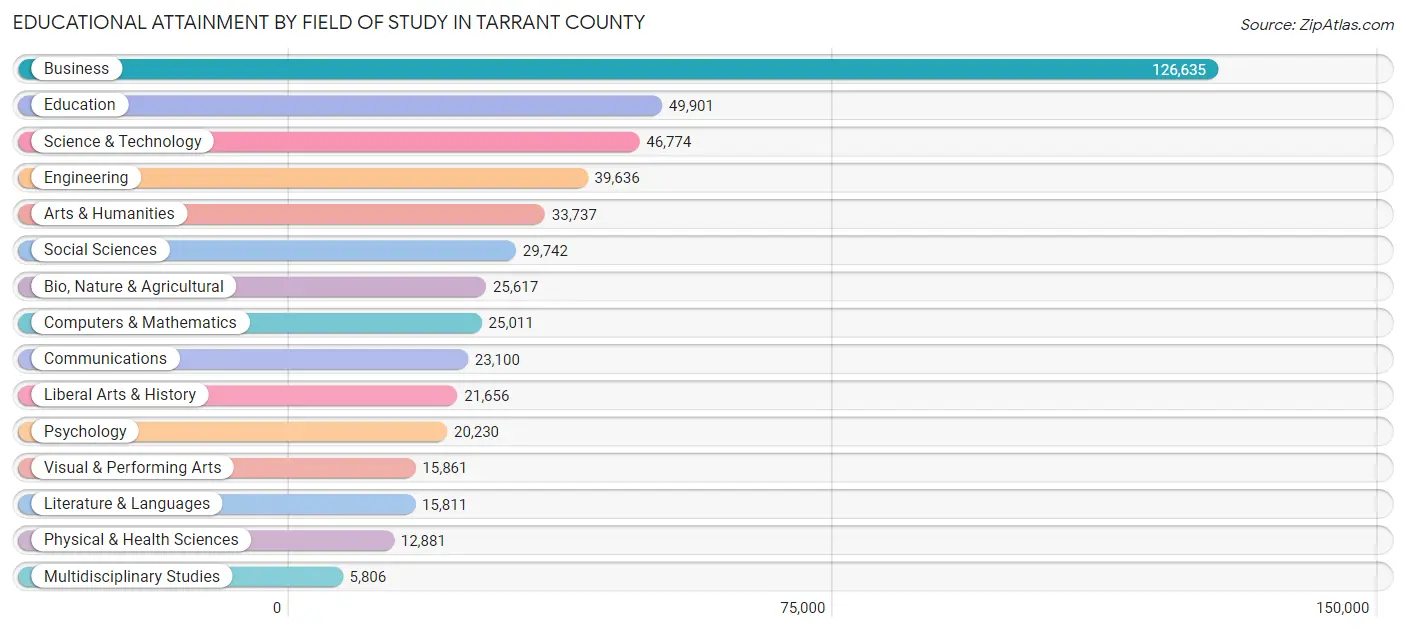
| Field of Study | # Graduates | % Graduates |
| Computers & Mathematics | 25,011 | 5.1% |
| Bio, Nature & Agricultural | 25,617 | 5.2% |
| Physical & Health Sciences | 12,881 | 2.6% |
| Psychology | 20,230 | 4.1% |
| Social Sciences | 29,742 | 6.0% |
| Engineering | 39,636 | 8.1% |
| Multidisciplinary Studies | 5,806 | 1.2% |
| Science & Technology | 46,774 | 9.5% |
| Business | 126,635 | 25.7% |
| Education | 49,901 | 10.1% |
| Literature & Languages | 15,811 | 3.2% |
| Liberal Arts & History | 21,656 | 4.4% |
| Visual & Performing Arts | 15,861 | 3.2% |
| Communications | 23,100 | 4.7% |
| Arts & Humanities | 33,737 | 6.9% |
| Total | 492,398 | 100.0% |
Transportation & Commute in Tarrant County
Vehicle Availability by Sex in Tarrant County
The most prevalent vehicle ownership categories in Tarrant County are males with 2 vehicles (254,324, accounting for 44.7%) and females with 2 vehicles (203,638, making up 53.2%).
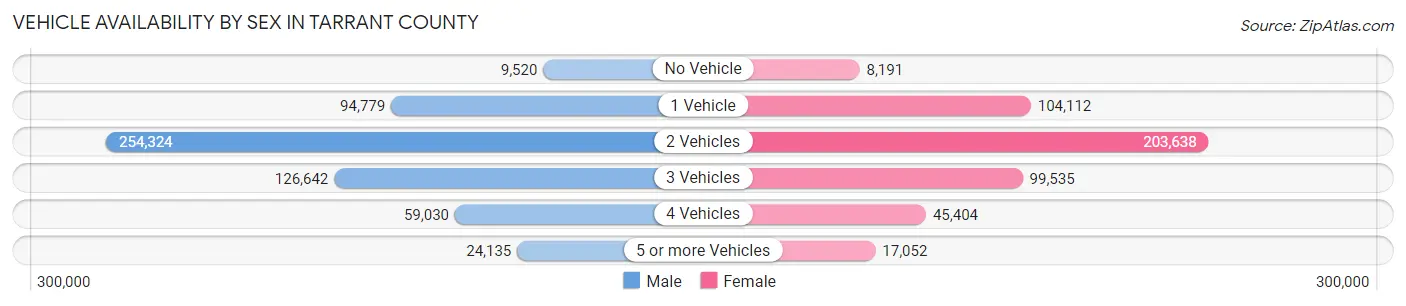
| Vehicles Available | Male | Female |
| No Vehicle | 9,520 (1.7%) | 8,191 (1.7%) |
| 1 Vehicle | 94,779 (16.7%) | 104,112 (21.8%) |
| 2 Vehicles | 254,324 (44.7%) | 203,638 (42.6%) |
| 3 Vehicles | 126,642 (22.3%) | 99,535 (20.8%) |
| 4 Vehicles | 59,030 (10.4%) | 45,404 (9.5%) |
| 5 or more Vehicles | 24,135 (4.3%) | 17,052 (3.6%) |
| Total | 568,430 (100.0%) | 477,932 (100.0%) |
Commute Time in Tarrant County
The most frequently occuring commute durations in Tarrant County are 30 to 34 minutes (152,983 commuters, 16.5%), 20 to 24 minutes (148,007 commuters, 15.9%), and 15 to 19 minutes (137,667 commuters, 14.8%).
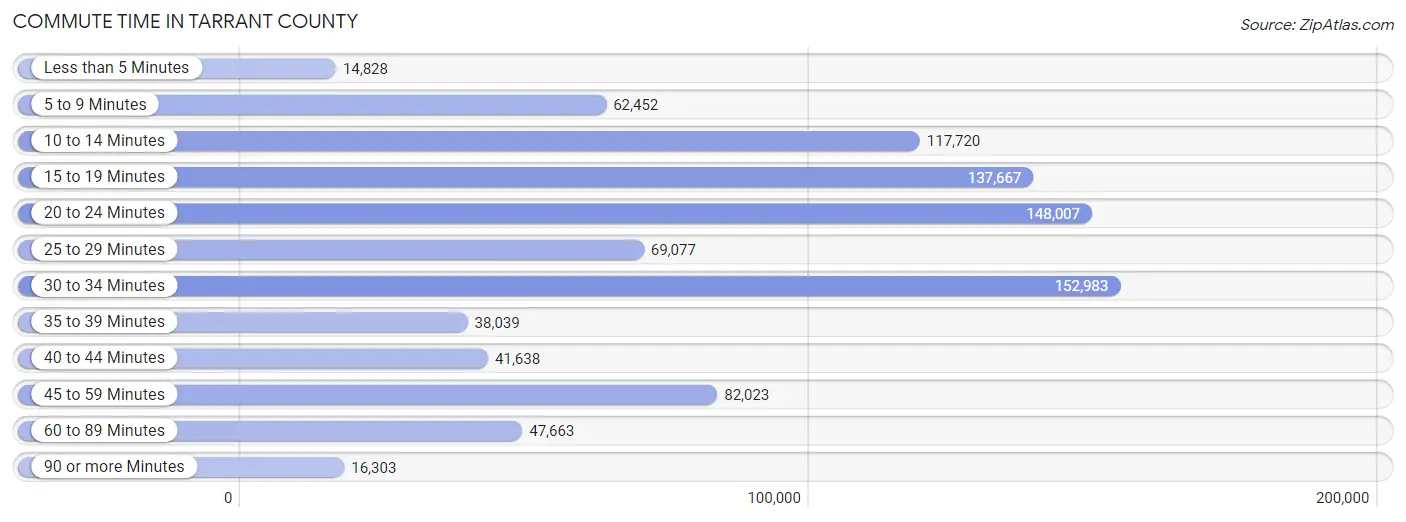
| Commute Time | # Commuters | % Commuters |
| Less than 5 Minutes | 14,828 | 1.6% |
| 5 to 9 Minutes | 62,452 | 6.7% |
| 10 to 14 Minutes | 117,720 | 12.7% |
| 15 to 19 Minutes | 137,667 | 14.8% |
| 20 to 24 Minutes | 148,007 | 15.9% |
| 25 to 29 Minutes | 69,077 | 7.4% |
| 30 to 34 Minutes | 152,983 | 16.5% |
| 35 to 39 Minutes | 38,039 | 4.1% |
| 40 to 44 Minutes | 41,638 | 4.5% |
| 45 to 59 Minutes | 82,023 | 8.8% |
| 60 to 89 Minutes | 47,663 | 5.1% |
| 90 or more Minutes | 16,303 | 1.8% |
Commute Time by Sex in Tarrant County
The most common commute times in Tarrant County are 30 to 34 minutes (91,414 commuters, 17.8%) for males and 20 to 24 minutes (68,860 commuters, 16.6%) for females.
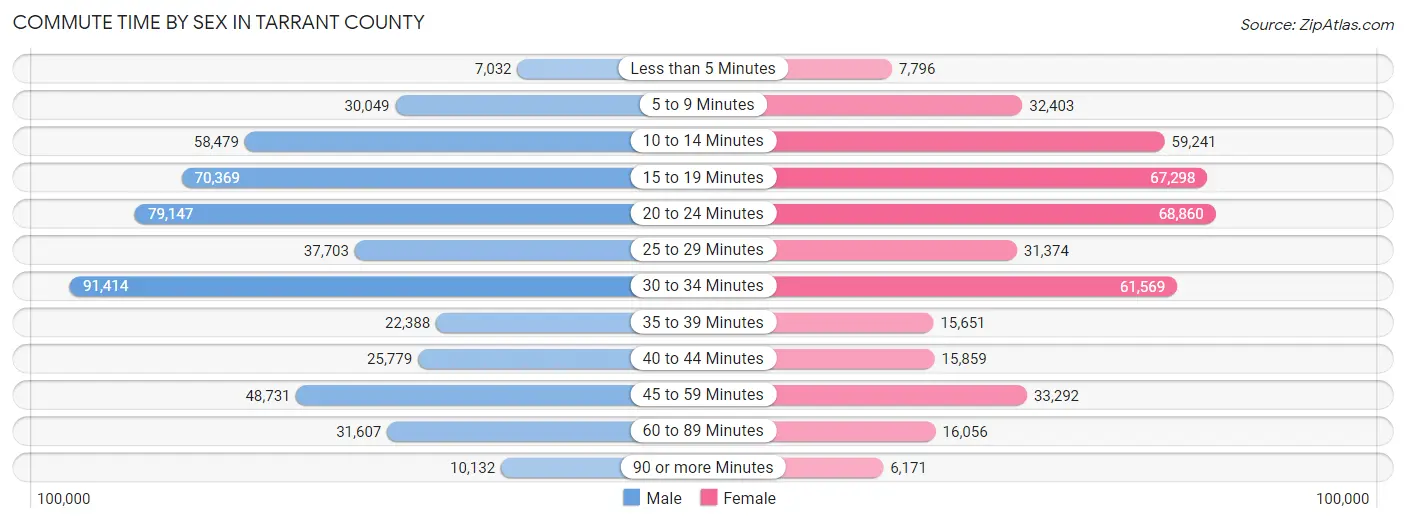
| Commute Time | Male | Female |
| Less than 5 Minutes | 7,032 (1.4%) | 7,796 (1.9%) |
| 5 to 9 Minutes | 30,049 (5.9%) | 32,403 (7.8%) |
| 10 to 14 Minutes | 58,479 (11.4%) | 59,241 (14.3%) |
| 15 to 19 Minutes | 70,369 (13.7%) | 67,298 (16.2%) |
| 20 to 24 Minutes | 79,147 (15.4%) | 68,860 (16.6%) |
| 25 to 29 Minutes | 37,703 (7.3%) | 31,374 (7.5%) |
| 30 to 34 Minutes | 91,414 (17.8%) | 61,569 (14.8%) |
| 35 to 39 Minutes | 22,388 (4.4%) | 15,651 (3.8%) |
| 40 to 44 Minutes | 25,779 (5.0%) | 15,859 (3.8%) |
| 45 to 59 Minutes | 48,731 (9.5%) | 33,292 (8.0%) |
| 60 to 89 Minutes | 31,607 (6.2%) | 16,056 (3.9%) |
| 90 or more Minutes | 10,132 (2.0%) | 6,171 (1.5%) |
Time of Departure to Work by Sex in Tarrant County
The most frequent times of departure to work in Tarrant County are 7:00 AM to 7:29 AM (72,678, 14.2%) for males and 7:00 AM to 7:29 AM (68,781, 16.6%) for females.
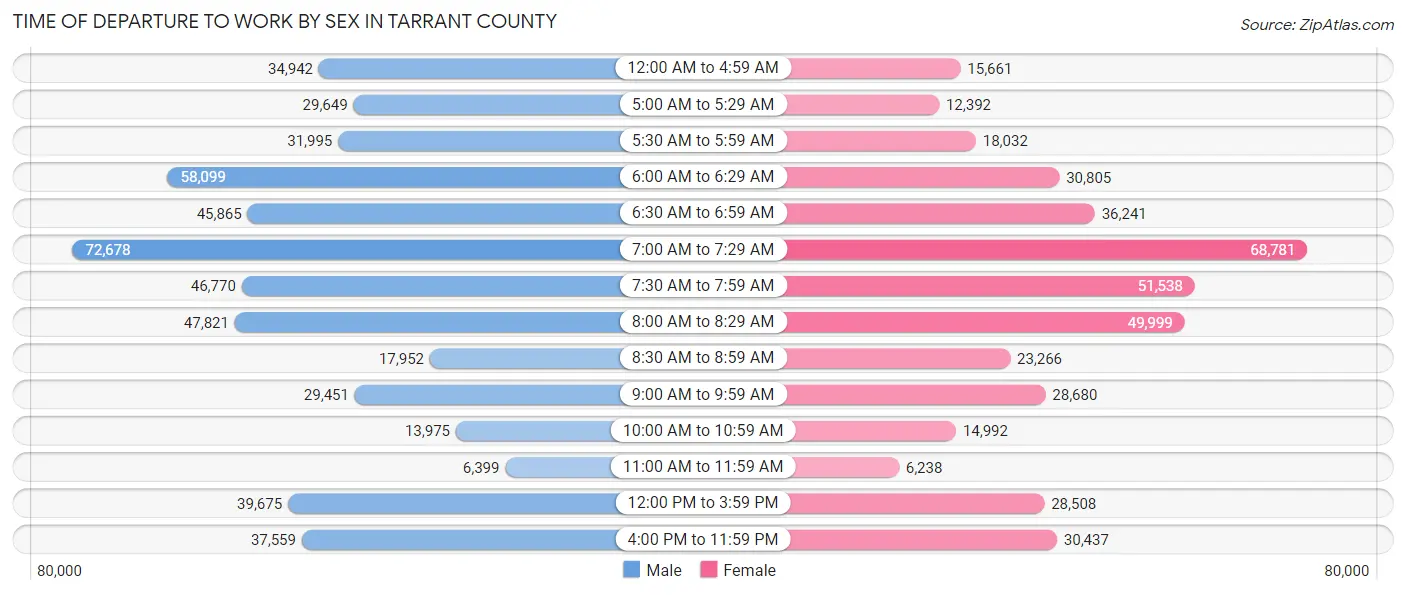
| Time of Departure | Male | Female |
| 12:00 AM to 4:59 AM | 34,942 (6.8%) | 15,661 (3.8%) |
| 5:00 AM to 5:29 AM | 29,649 (5.8%) | 12,392 (3.0%) |
| 5:30 AM to 5:59 AM | 31,995 (6.2%) | 18,032 (4.3%) |
| 6:00 AM to 6:29 AM | 58,099 (11.3%) | 30,805 (7.4%) |
| 6:30 AM to 6:59 AM | 45,865 (8.9%) | 36,241 (8.7%) |
| 7:00 AM to 7:29 AM | 72,678 (14.2%) | 68,781 (16.6%) |
| 7:30 AM to 7:59 AM | 46,770 (9.1%) | 51,538 (12.4%) |
| 8:00 AM to 8:29 AM | 47,821 (9.3%) | 49,999 (12.0%) |
| 8:30 AM to 8:59 AM | 17,952 (3.5%) | 23,266 (5.6%) |
| 9:00 AM to 9:59 AM | 29,451 (5.7%) | 28,680 (6.9%) |
| 10:00 AM to 10:59 AM | 13,975 (2.7%) | 14,992 (3.6%) |
| 11:00 AM to 11:59 AM | 6,399 (1.3%) | 6,238 (1.5%) |
| 12:00 PM to 3:59 PM | 39,675 (7.7%) | 28,508 (6.9%) |
| 4:00 PM to 11:59 PM | 37,559 (7.3%) | 30,437 (7.3%) |
| Total | 512,830 (100.0%) | 415,570 (100.0%) |
Housing Occupancy in Tarrant County
Occupancy by Ownership in Tarrant County
Of the total 754,969 dwellings in Tarrant County, owner-occupied units account for 450,549 (59.7%), while renter-occupied units make up 304,420 (40.3%).
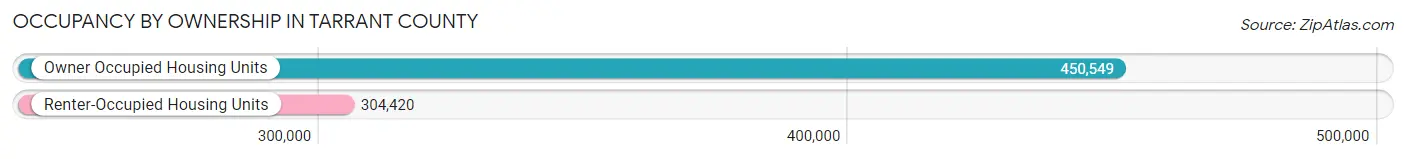
| Occupancy | # Housing Units | % Housing Units |
| Owner Occupied Housing Units | 450,549 | 59.7% |
| Renter-Occupied Housing Units | 304,420 | 40.3% |
| Total Occupied Housing Units | 754,969 | 100.0% |
Occupancy by Household Size in Tarrant County
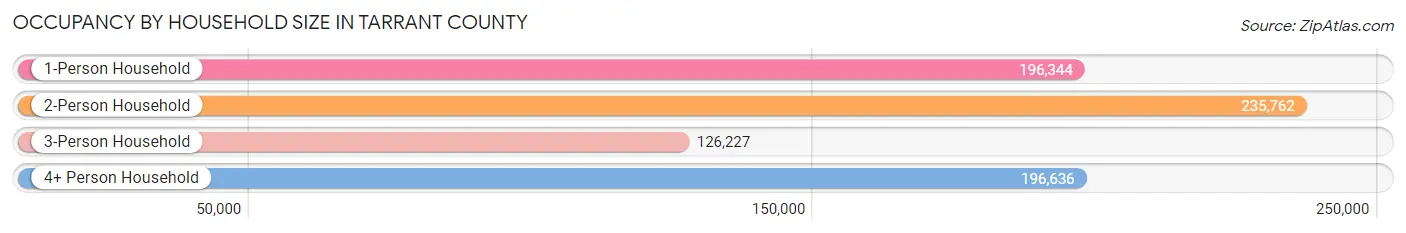
| Household Size | # Housing Units | % Housing Units |
| 1-Person Household | 196,344 | 26.0% |
| 2-Person Household | 235,762 | 31.2% |
| 3-Person Household | 126,227 | 16.7% |
| 4+ Person Household | 196,636 | 26.1% |
| Total Housing Units | 754,969 | 100.0% |
Occupancy by Ownership by Household Size in Tarrant County
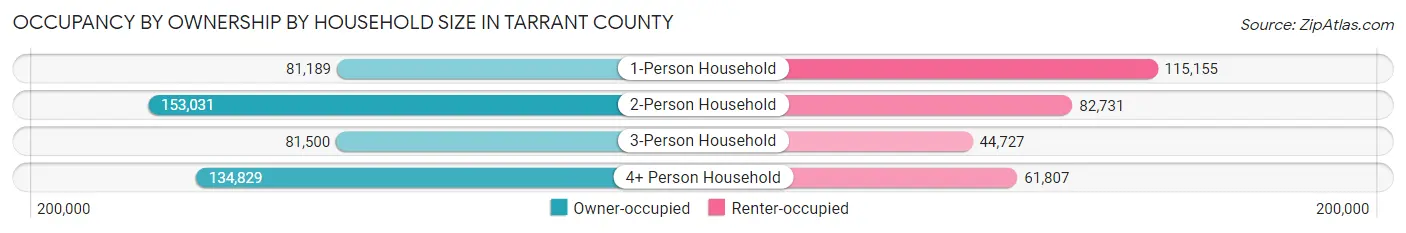
| Household Size | Owner-occupied | Renter-occupied |
| 1-Person Household | 81,189 (41.3%) | 115,155 (58.7%) |
| 2-Person Household | 153,031 (64.9%) | 82,731 (35.1%) |
| 3-Person Household | 81,500 (64.6%) | 44,727 (35.4%) |
| 4+ Person Household | 134,829 (68.6%) | 61,807 (31.4%) |
| Total Housing Units | 450,549 (59.7%) | 304,420 (40.3%) |
Occupancy by Educational Attainment in Tarrant County
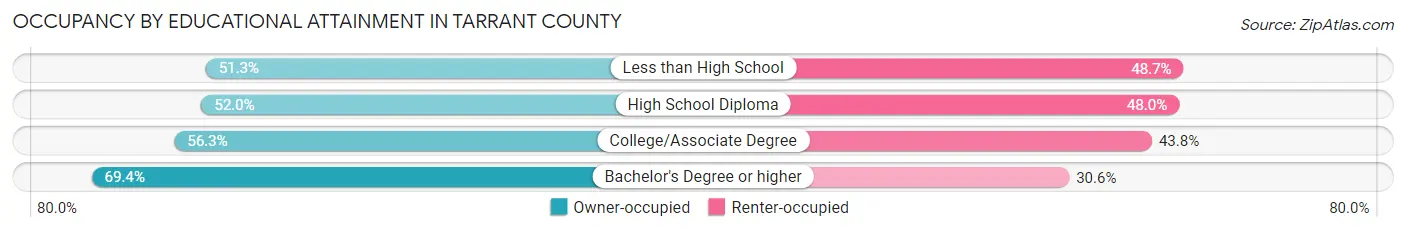
| Household Size | Owner-occupied | Renter-occupied |
| Less than High School | 41,373 (51.3%) | 39,322 (48.7%) |
| High School Diploma | 82,694 (52.0%) | 76,428 (48.0%) |
| College/Associate Degree | 132,511 (56.2%) | 103,059 (43.8%) |
| Bachelor's Degree or higher | 193,971 (69.4%) | 85,611 (30.6%) |
Occupancy by Age of Householder in Tarrant County
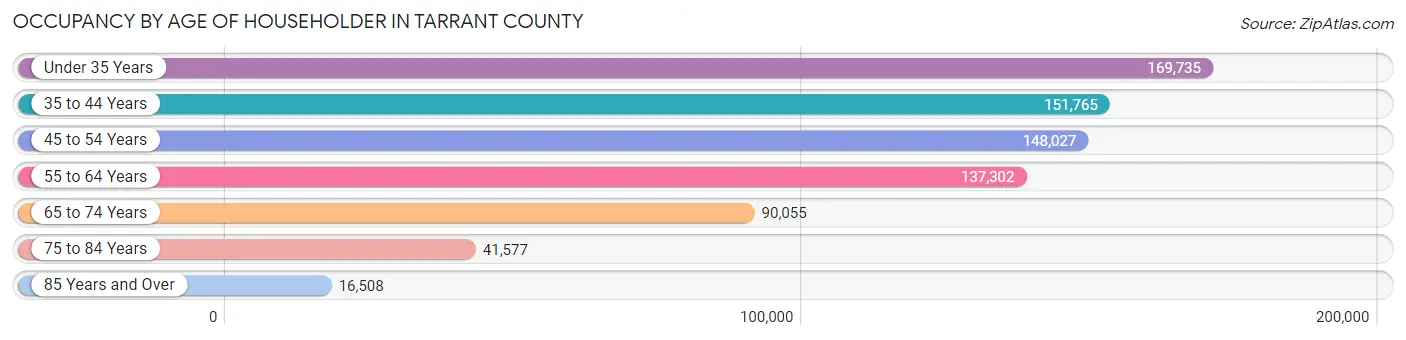
| Age Bracket | # Households | % Households |
| Under 35 Years | 169,735 | 22.5% |
| 35 to 44 Years | 151,765 | 20.1% |
| 45 to 54 Years | 148,027 | 19.6% |
| 55 to 64 Years | 137,302 | 18.2% |
| 65 to 74 Years | 90,055 | 11.9% |
| 75 to 84 Years | 41,577 | 5.5% |
| 85 Years and Over | 16,508 | 2.2% |
| Total | 754,969 | 100.0% |
Housing Finances in Tarrant County
Median Income by Occupancy in Tarrant County
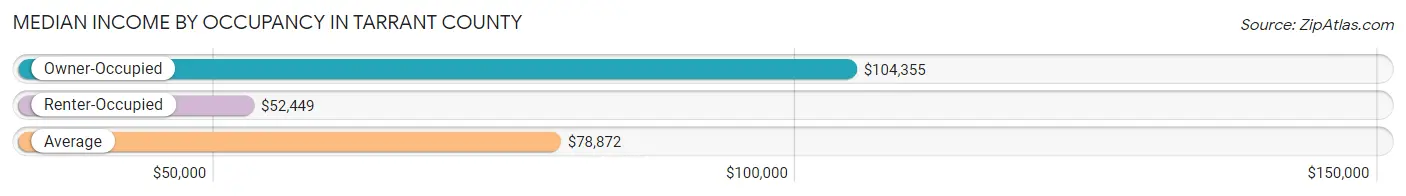
| Occupancy Type | # Households | Median Income |
| Owner-Occupied | 450,549 (59.7%) | $104,355 |
| Renter-Occupied | 304,420 (40.3%) | $52,449 |
| Average | 754,969 (100.0%) | $78,872 |
Occupancy by Householder Income Bracket in Tarrant County
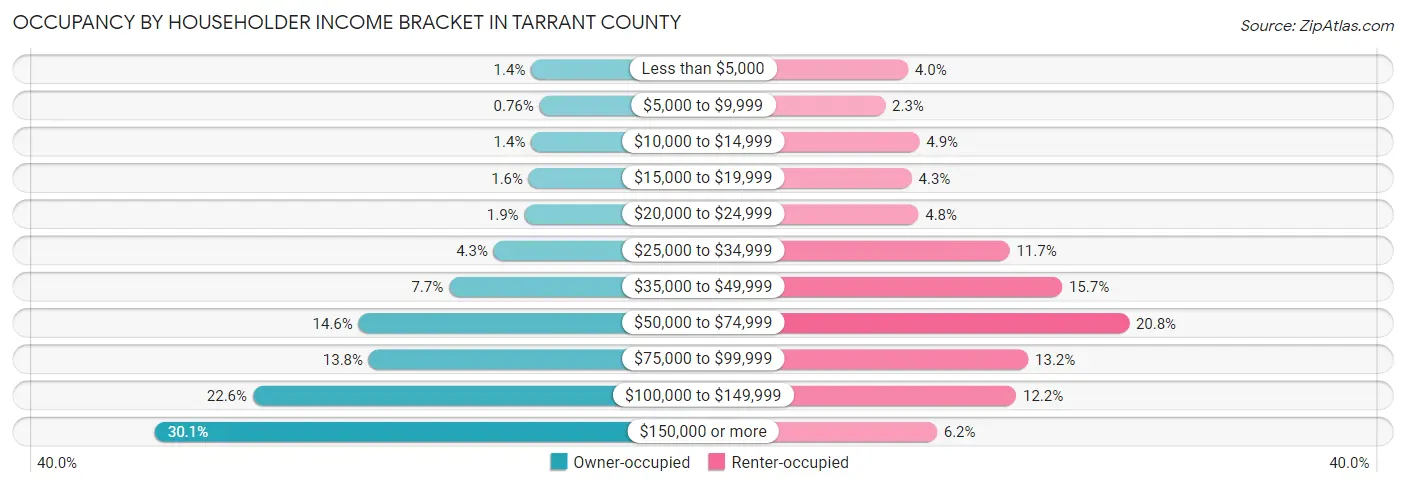
| Income Bracket | Owner-occupied | Renter-occupied |
| Less than $5,000 | 6,320 (1.4%) | 12,135 (4.0%) |
| $5,000 to $9,999 | 3,444 (0.8%) | 6,839 (2.2%) |
| $10,000 to $14,999 | 6,318 (1.4%) | 14,781 (4.9%) |
| $15,000 to $19,999 | 7,133 (1.6%) | 12,986 (4.3%) |
| $20,000 to $24,999 | 8,656 (1.9%) | 14,558 (4.8%) |
| $25,000 to $34,999 | 19,141 (4.3%) | 35,696 (11.7%) |
| $35,000 to $49,999 | 34,514 (7.7%) | 47,880 (15.7%) |
| $50,000 to $74,999 | 65,572 (14.5%) | 63,413 (20.8%) |
| $75,000 to $99,999 | 62,050 (13.8%) | 40,038 (13.2%) |
| $100,000 to $149,999 | 101,881 (22.6%) | 37,245 (12.2%) |
| $150,000 or more | 135,520 (30.1%) | 18,849 (6.2%) |
| Total | 450,549 (100.0%) | 304,420 (100.0%) |
Monthly Housing Cost Tiers in Tarrant County
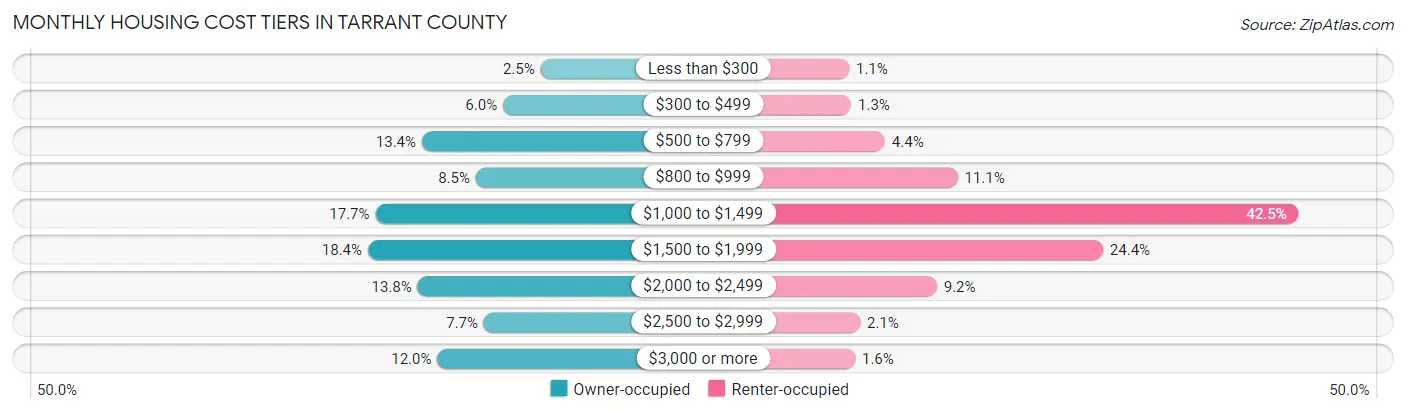
| Monthly Cost | Owner-occupied | Renter-occupied |
| Less than $300 | 11,247 (2.5%) | 3,260 (1.1%) |
| $300 to $499 | 26,854 (6.0%) | 3,845 (1.3%) |
| $500 to $799 | 60,496 (13.4%) | 13,316 (4.4%) |
| $800 to $999 | 38,105 (8.5%) | 33,683 (11.1%) |
| $1,000 to $1,499 | 79,777 (17.7%) | 129,233 (42.4%) |
| $1,500 to $1,999 | 82,890 (18.4%) | 74,391 (24.4%) |
| $2,000 to $2,499 | 62,253 (13.8%) | 27,845 (9.1%) |
| $2,500 to $2,999 | 34,803 (7.7%) | 6,340 (2.1%) |
| $3,000 or more | 54,124 (12.0%) | 4,921 (1.6%) |
| Total | 450,549 (100.0%) | 304,420 (100.0%) |
Physical Housing Characteristics in Tarrant County
Housing Structures in Tarrant County
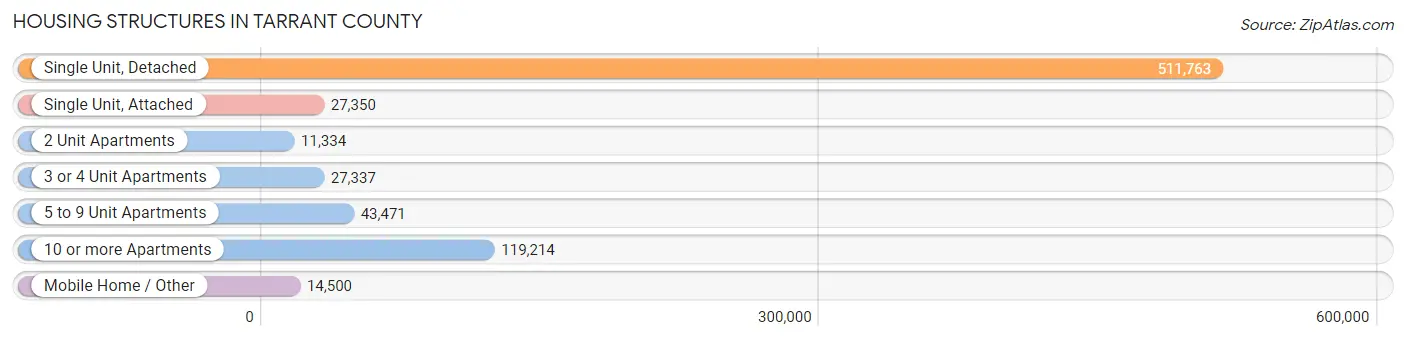
| Structure Type | # Housing Units | % Housing Units |
| Single Unit, Detached | 511,763 | 67.8% |
| Single Unit, Attached | 27,350 | 3.6% |
| 2 Unit Apartments | 11,334 | 1.5% |
| 3 or 4 Unit Apartments | 27,337 | 3.6% |
| 5 to 9 Unit Apartments | 43,471 | 5.8% |
| 10 or more Apartments | 119,214 | 15.8% |
| Mobile Home / Other | 14,500 | 1.9% |
| Total | 754,969 | 100.0% |
Housing Structures by Occupancy in Tarrant County
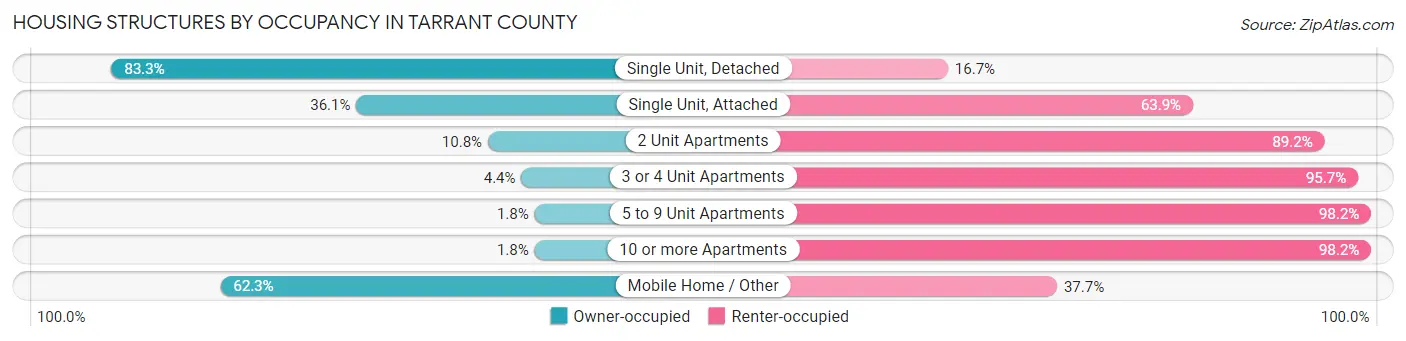
| Structure Type | Owner-occupied | Renter-occupied |
| Single Unit, Detached | 426,278 (83.3%) | 85,485 (16.7%) |
| Single Unit, Attached | 9,882 (36.1%) | 17,468 (63.9%) |
| 2 Unit Apartments | 1,224 (10.8%) | 10,110 (89.2%) |
| 3 or 4 Unit Apartments | 1,188 (4.3%) | 26,149 (95.7%) |
| 5 to 9 Unit Apartments | 792 (1.8%) | 42,679 (98.2%) |
| 10 or more Apartments | 2,152 (1.8%) | 117,062 (98.2%) |
| Mobile Home / Other | 9,033 (62.3%) | 5,467 (37.7%) |
| Total | 450,549 (59.7%) | 304,420 (40.3%) |
Housing Structures by Number of Rooms in Tarrant County
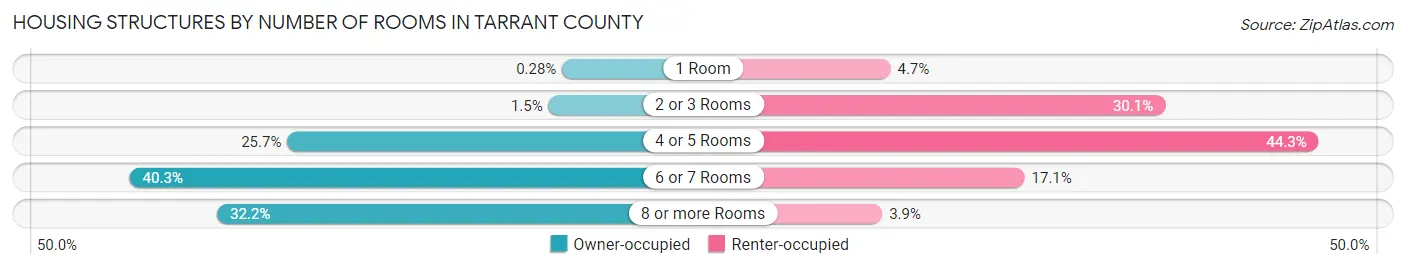
| Number of Rooms | Owner-occupied | Renter-occupied |
| 1 Room | 1,260 (0.3%) | 14,239 (4.7%) |
| 2 or 3 Rooms | 6,956 (1.5%) | 91,530 (30.1%) |
| 4 or 5 Rooms | 115,823 (25.7%) | 134,765 (44.3%) |
| 6 or 7 Rooms | 181,497 (40.3%) | 51,992 (17.1%) |
| 8 or more Rooms | 145,013 (32.2%) | 11,894 (3.9%) |
| Total | 450,549 (100.0%) | 304,420 (100.0%) |
Housing Structure by Heating Type in Tarrant County
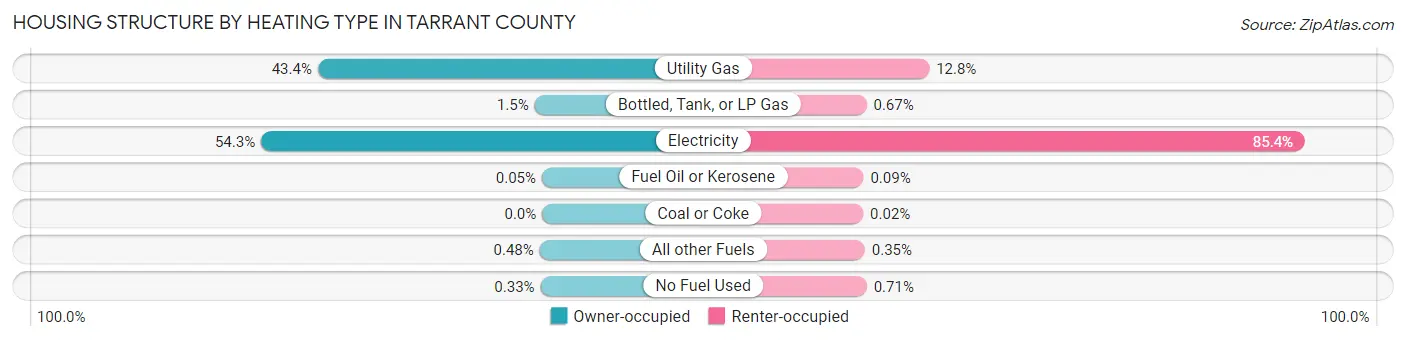
| Heating Type | Owner-occupied | Renter-occupied |
| Utility Gas | 195,341 (43.4%) | 38,895 (12.8%) |
| Bottled, Tank, or LP Gas | 6,596 (1.5%) | 2,046 (0.7%) |
| Electricity | 244,746 (54.3%) | 259,921 (85.4%) |
| Fuel Oil or Kerosene | 204 (0.1%) | 267 (0.1%) |
| Coal or Coke | 20 (0.0%) | 61 (0.0%) |
| All other Fuels | 2,144 (0.5%) | 1,066 (0.4%) |
| No Fuel Used | 1,498 (0.3%) | 2,164 (0.7%) |
| Total | 450,549 (100.0%) | 304,420 (100.0%) |
Household Vehicle Usage in Tarrant County
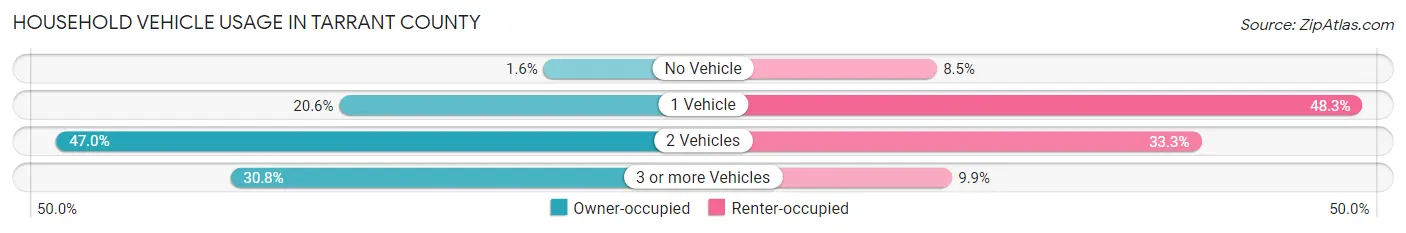
| Vehicles per Household | Owner-occupied | Renter-occupied |
| No Vehicle | 6,974 (1.5%) | 25,923 (8.5%) |
| 1 Vehicle | 92,892 (20.6%) | 147,033 (48.3%) |
| 2 Vehicles | 211,943 (47.0%) | 101,240 (33.3%) |
| 3 or more Vehicles | 138,740 (30.8%) | 30,224 (9.9%) |
| Total | 450,549 (100.0%) | 304,420 (100.0%) |
Real Estate & Mortgages in Tarrant County
Real Estate and Mortgage Overview in Tarrant County
| Characteristic | Without Mortgage | With Mortgage |
| Housing Units | 165,652 | 284,897 |
| Median Property Value | $231,600 | $287,600 |
| Median Household Income | $78,281 | $101,675 |
| Monthly Housing Costs | $746 | $51,705 |
| Real Estate Taxes | $3,590 | $8,604 |
Property Value by Mortgage Status in Tarrant County
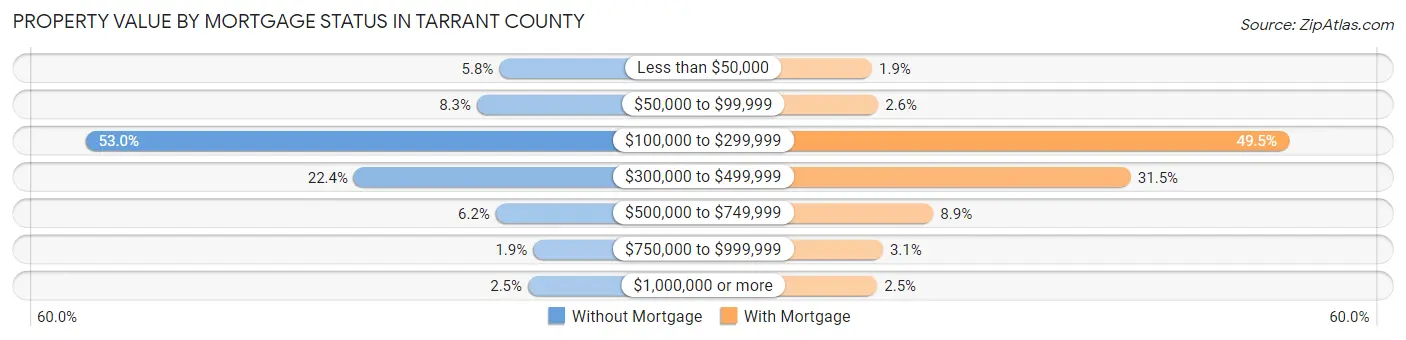
| Property Value | Without Mortgage | With Mortgage |
| Less than $50,000 | 9,542 (5.8%) | 5,380 (1.9%) |
| $50,000 to $99,999 | 13,787 (8.3%) | 7,404 (2.6%) |
| $100,000 to $299,999 | 87,824 (53.0%) | 141,055 (49.5%) |
| $300,000 to $499,999 | 37,067 (22.4%) | 89,652 (31.5%) |
| $500,000 to $749,999 | 10,198 (6.2%) | 25,370 (8.9%) |
| $750,000 to $999,999 | 3,123 (1.9%) | 8,929 (3.1%) |
| $1,000,000 or more | 4,111 (2.5%) | 7,107 (2.5%) |
| Total | 165,652 (100.0%) | 284,897 (100.0%) |
Household Income by Mortgage Status in Tarrant County
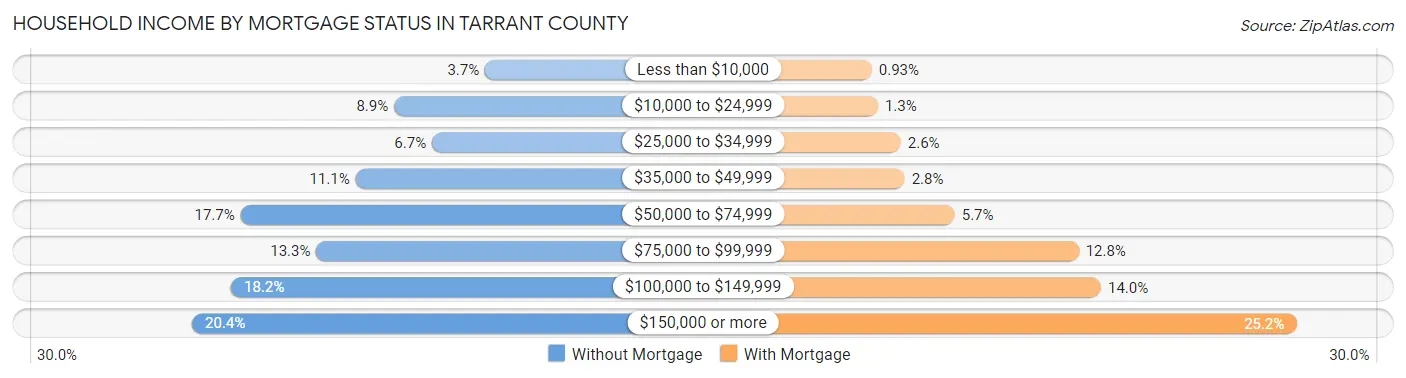
| Household Income | Without Mortgage | With Mortgage |
| Less than $10,000 | 6,108 (3.7%) | 2,646 (0.9%) |
| $10,000 to $24,999 | 14,729 (8.9%) | 3,656 (1.3%) |
| $25,000 to $34,999 | 11,137 (6.7%) | 7,378 (2.6%) |
| $35,000 to $49,999 | 18,365 (11.1%) | 8,004 (2.8%) |
| $50,000 to $74,999 | 29,249 (17.7%) | 16,149 (5.7%) |
| $75,000 to $99,999 | 22,075 (13.3%) | 36,323 (12.8%) |
| $100,000 to $149,999 | 30,144 (18.2%) | 39,975 (14.0%) |
| $150,000 or more | 33,845 (20.4%) | 71,737 (25.2%) |
| Total | 165,652 (100.0%) | 284,897 (100.0%) |
Property Value to Household Income Ratio in Tarrant County
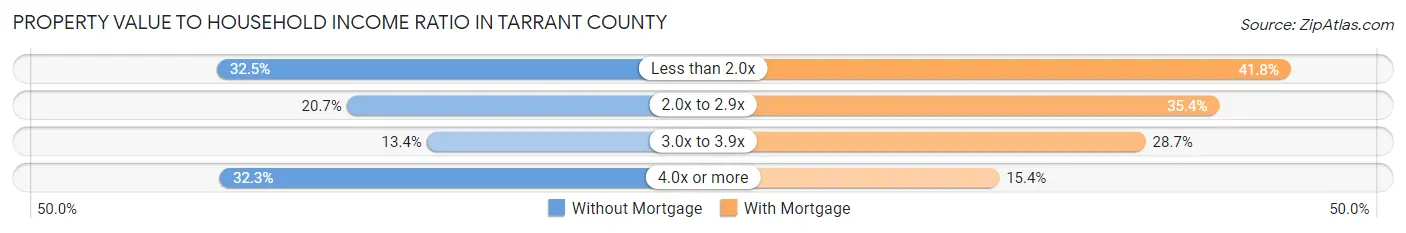
| Value-to-Income Ratio | Without Mortgage | With Mortgage |
| Less than 2.0x | 53,904 (32.5%) | 119,198 (41.8%) |
| 2.0x to 2.9x | 34,241 (20.7%) | 100,698 (35.3%) |
| 3.0x to 3.9x | 22,203 (13.4%) | 81,667 (28.7%) |
| 4.0x or more | 53,431 (32.3%) | 43,793 (15.4%) |
| Total | 165,652 (100.0%) | 284,897 (100.0%) |
Real Estate Taxes by Mortgage Status in Tarrant County
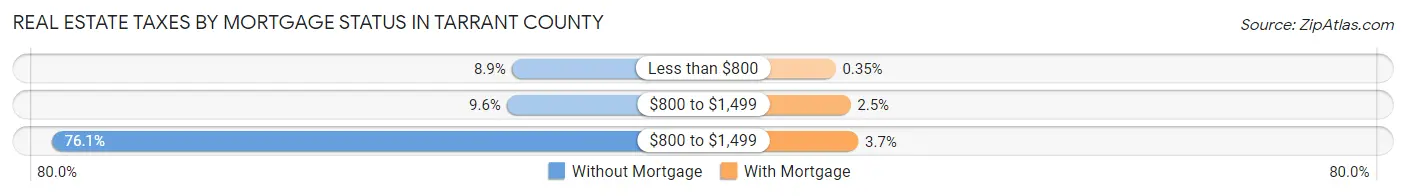
| Property Taxes | Without Mortgage | With Mortgage |
| Less than $800 | 14,652 (8.8%) | 995 (0.4%) |
| $800 to $1,499 | 15,837 (9.6%) | 7,204 (2.5%) |
| $800 to $1,499 | 125,978 (76.0%) | 10,418 (3.7%) |
| Total | 165,652 (100.0%) | 284,897 (100.0%) |
Health & Disability in Tarrant County
Health Insurance Coverage by Age in Tarrant County
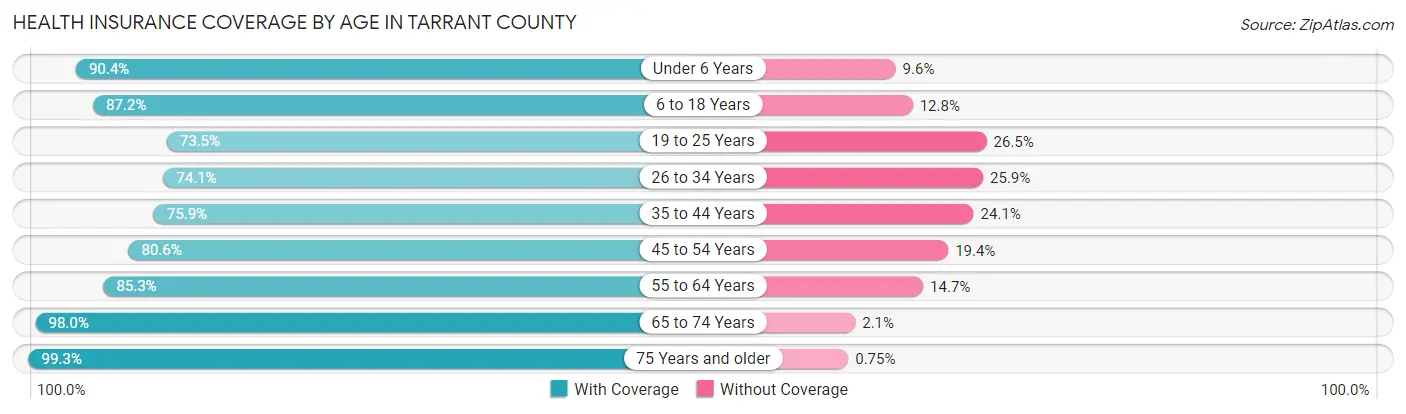
| Age Bracket | With Coverage | Without Coverage |
| Under 6 Years | 151,452 (90.4%) | 16,045 (9.6%) |
| 6 to 18 Years | 356,899 (87.2%) | 52,185 (12.8%) |
| 19 to 25 Years | 149,359 (73.5%) | 53,967 (26.5%) |
| 26 to 34 Years | 204,259 (74.1%) | 71,359 (25.9%) |
| 35 to 44 Years | 220,777 (75.9%) | 70,164 (24.1%) |
| 45 to 54 Years | 214,950 (80.6%) | 51,658 (19.4%) |
| 55 to 64 Years | 205,478 (85.3%) | 35,441 (14.7%) |
| 65 to 74 Years | 148,914 (98.0%) | 3,120 (2.1%) |
| 75 Years and older | 89,240 (99.3%) | 671 (0.7%) |
| Total | 1,741,328 (83.1%) | 354,610 (16.9%) |
Health Insurance Coverage by Citizenship Status in Tarrant County
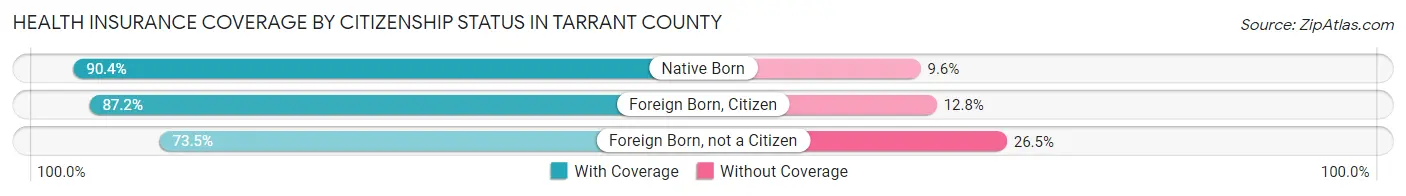
| Citizenship Status | With Coverage | Without Coverage |
| Native Born | 151,452 (90.4%) | 16,045 (9.6%) |
| Foreign Born, Citizen | 356,899 (87.2%) | 52,185 (12.8%) |
| Foreign Born, not a Citizen | 149,359 (73.5%) | 53,967 (26.5%) |
Health Insurance Coverage by Household Income in Tarrant County
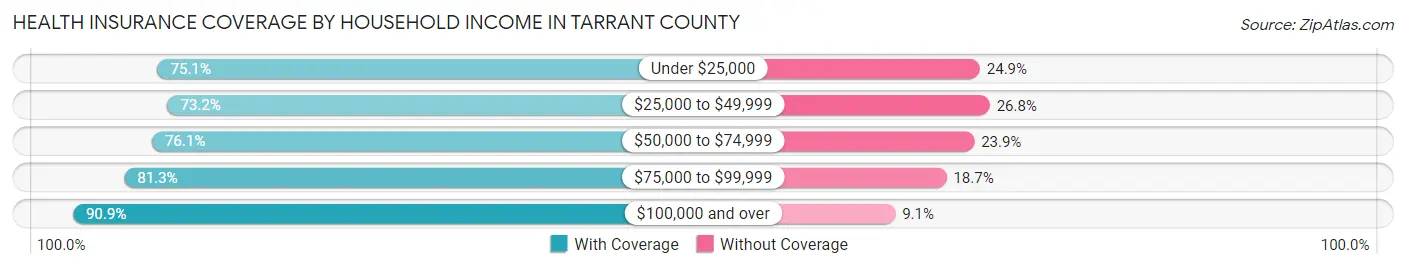
| Household Income | With Coverage | Without Coverage |
| Under $25,000 | 136,146 (75.1%) | 45,221 (24.9%) |
| $25,000 to $49,999 | 232,886 (73.2%) | 85,172 (26.8%) |
| $50,000 to $74,999 | 259,287 (76.1%) | 81,276 (23.9%) |
| $75,000 to $99,999 | 236,233 (81.3%) | 54,268 (18.7%) |
| $100,000 and over | 866,903 (90.9%) | 86,516 (9.1%) |
Public vs Private Health Insurance Coverage by Age in Tarrant County
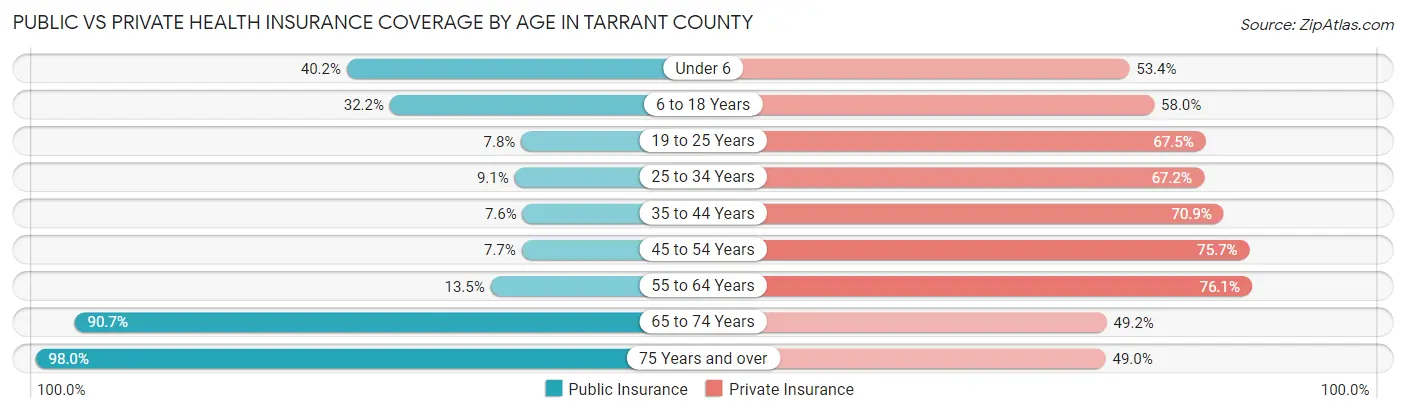
| Age Bracket | Public Insurance | Private Insurance |
| Under 6 | 67,334 (40.2%) | 89,375 (53.4%) |
| 6 to 18 Years | 131,810 (32.2%) | 237,133 (58.0%) |
| 19 to 25 Years | 15,907 (7.8%) | 137,257 (67.5%) |
| 25 to 34 Years | 24,967 (9.1%) | 185,146 (67.2%) |
| 35 to 44 Years | 22,042 (7.6%) | 206,203 (70.9%) |
| 45 to 54 Years | 20,626 (7.7%) | 201,683 (75.6%) |
| 55 to 64 Years | 32,538 (13.5%) | 183,326 (76.1%) |
| 65 to 74 Years | 137,926 (90.7%) | 74,737 (49.2%) |
| 75 Years and over | 88,071 (98.0%) | 44,010 (48.9%) |
| Total | 541,221 (25.8%) | 1,358,870 (64.8%) |
Disability Status by Sex by Age in Tarrant County
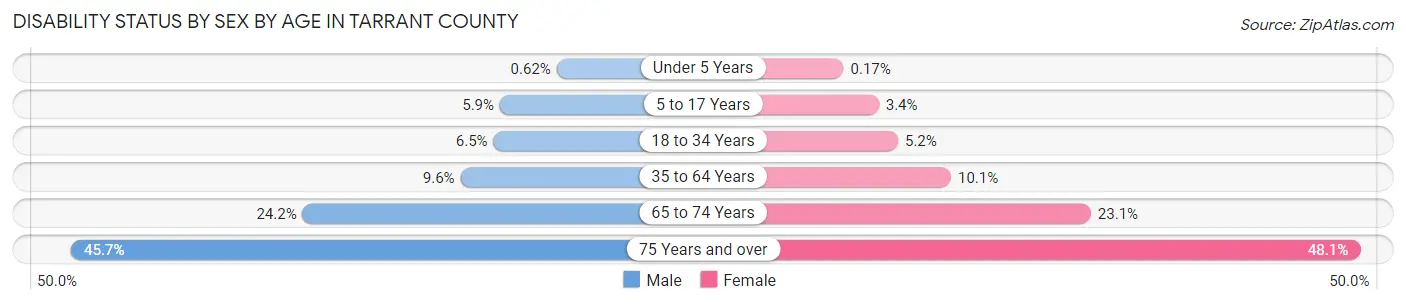
| Age Bracket | Male | Female |
| Under 5 Years | 440 (0.6%) | 112 (0.2%) |
| 5 to 17 Years | 12,180 (5.9%) | 6,840 (3.4%) |
| 18 to 34 Years | 16,447 (6.5%) | 13,454 (5.2%) |
| 35 to 64 Years | 37,554 (9.6%) | 41,076 (10.1%) |
| 65 to 74 Years | 17,033 (24.2%) | 18,887 (23.1%) |
| 75 Years and over | 16,789 (45.7%) | 25,565 (48.1%) |
Disability Class by Sex by Age in Tarrant County
Disability Class: Hearing Difficulty
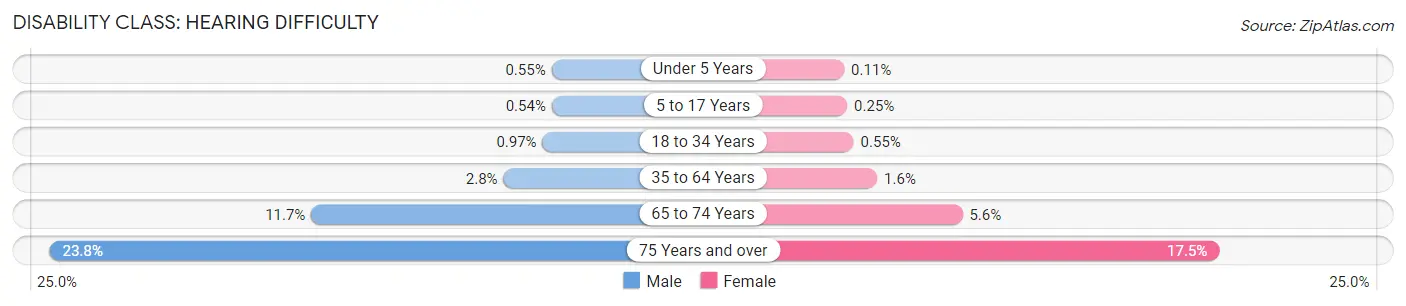
| Age Bracket | Male | Female |
| Under 5 Years | 390 (0.5%) | 75 (0.1%) |
| 5 to 17 Years | 1,126 (0.5%) | 503 (0.3%) |
| 18 to 34 Years | 2,447 (1.0%) | 1,414 (0.5%) |
| 35 to 64 Years | 10,937 (2.8%) | 6,657 (1.6%) |
| 65 to 74 Years | 8,229 (11.7%) | 4,573 (5.6%) |
| 75 Years and over | 8,761 (23.8%) | 9,309 (17.5%) |
Disability Class: Vision Difficulty
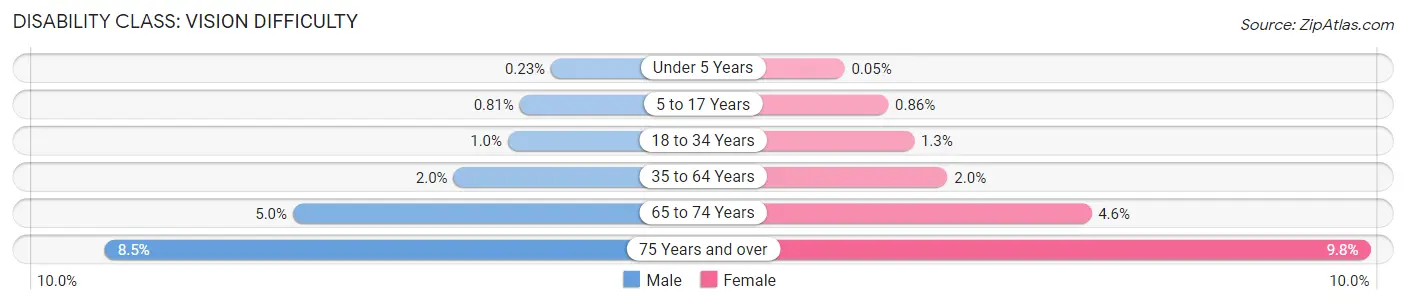
| Age Bracket | Male | Female |
| Under 5 Years | 161 (0.2%) | 37 (0.1%) |
| 5 to 17 Years | 1,676 (0.8%) | 1,708 (0.9%) |
| 18 to 34 Years | 2,617 (1.0%) | 3,446 (1.3%) |
| 35 to 64 Years | 8,022 (2.0%) | 7,928 (2.0%) |
| 65 to 74 Years | 3,535 (5.0%) | 3,778 (4.6%) |
| 75 Years and over | 3,129 (8.5%) | 5,217 (9.8%) |
Disability Class: Cognitive Difficulty
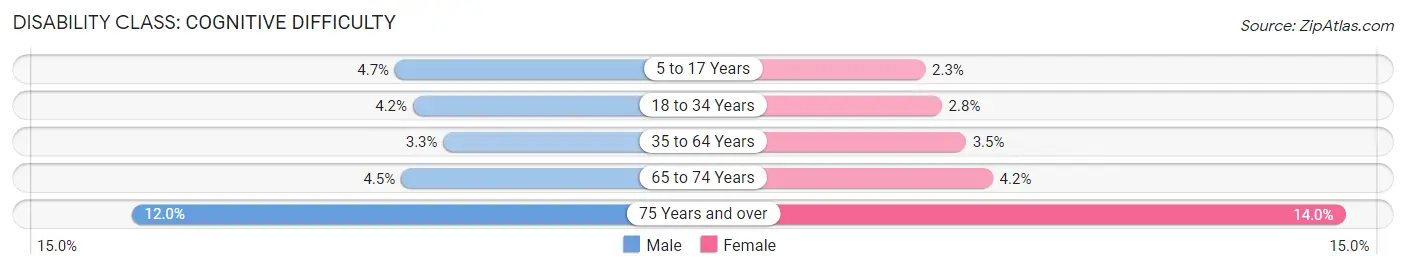
| Age Bracket | Male | Female |
| 5 to 17 Years | 9,688 (4.7%) | 4,614 (2.3%) |
| 18 to 34 Years | 10,615 (4.2%) | 7,175 (2.8%) |
| 35 to 64 Years | 13,135 (3.3%) | 13,984 (3.5%) |
| 65 to 74 Years | 3,180 (4.5%) | 3,433 (4.2%) |
| 75 Years and over | 4,419 (12.0%) | 7,453 (14.0%) |
Disability Class: Ambulatory Difficulty
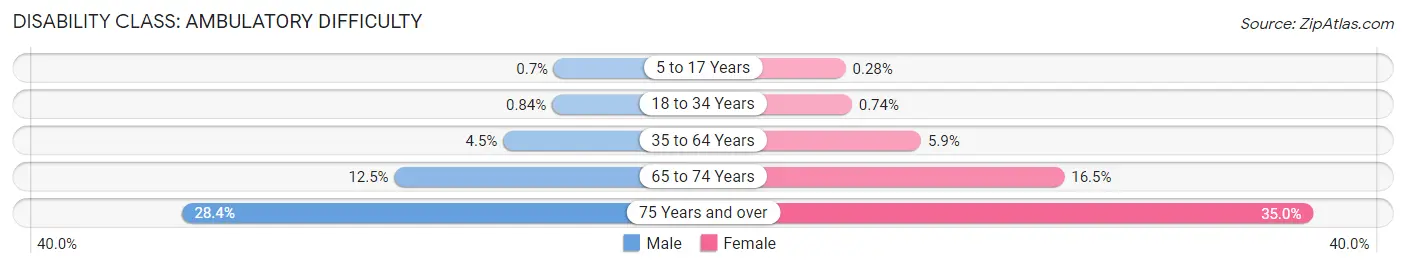
| Age Bracket | Male | Female |
| 5 to 17 Years | 1,447 (0.7%) | 553 (0.3%) |
| 18 to 34 Years | 2,123 (0.8%) | 1,915 (0.7%) |
| 35 to 64 Years | 17,592 (4.5%) | 23,822 (5.9%) |
| 65 to 74 Years | 8,821 (12.5%) | 13,494 (16.5%) |
| 75 Years and over | 10,418 (28.3%) | 18,603 (35.0%) |
Disability Class: Self-Care Difficulty
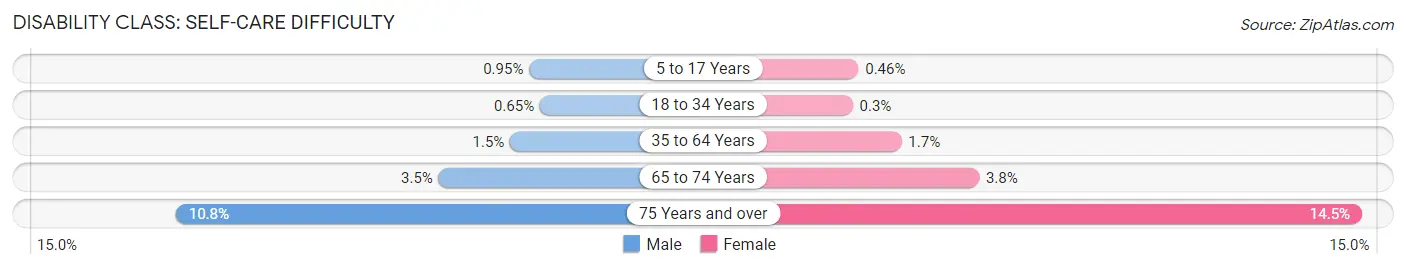
| Age Bracket | Male | Female |
| 5 to 17 Years | 1,955 (0.9%) | 920 (0.5%) |
| 18 to 34 Years | 1,645 (0.6%) | 768 (0.3%) |
| 35 to 64 Years | 5,817 (1.5%) | 6,735 (1.7%) |
| 65 to 74 Years | 2,441 (3.5%) | 3,120 (3.8%) |
| 75 Years and over | 3,967 (10.8%) | 7,695 (14.5%) |
Technology Access in Tarrant County
Computing Device Access in Tarrant County
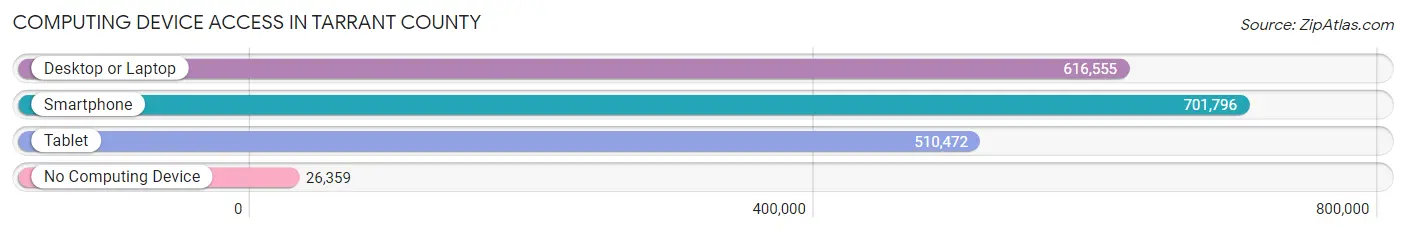
| Device Type | # Households | % Households |
| Desktop or Laptop | 616,555 | 81.7% |
| Smartphone | 701,796 | 93.0% |
| Tablet | 510,472 | 67.6% |
| No Computing Device | 26,359 | 3.5% |
| Total | 754,969 | 100.0% |
Internet Access in Tarrant County
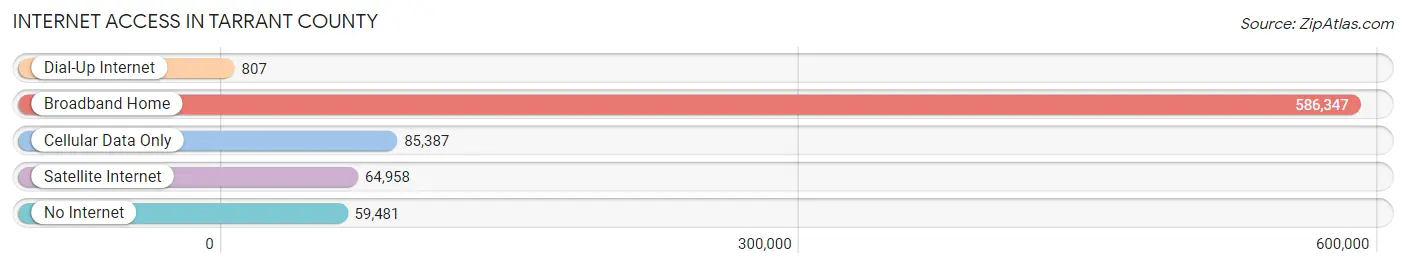
| Internet Type | # Households | % Households |
| Dial-Up Internet | 807 | 0.1% |
| Broadband Home | 586,347 | 77.7% |
| Cellular Data Only | 85,387 | 11.3% |
| Satellite Internet | 64,958 | 8.6% |
| No Internet | 59,481 | 7.9% |
| Total | 754,969 | 100.0% |
Tarrant County Summary
Tarrant County, Texas is located in the north-central part of the state and is part of the Dallas-Fort Worth-Arlington metropolitan area. It is the third-most populous county in Texas, with a population of 2,054,475 as of the 2020 census. The county seat is Fort Worth, the fifth-largest city in Texas.
Geography
Tarrant County covers 873 square miles and is bordered by Johnson County to the north, Parker County to the west, Hood County to the south, and Dallas County to the east. The county is divided into four distinct regions: the Fort Worth Metroplex, the Mid-Cities, the Eastern Region, and the Western Region. The Fort Worth Metroplex is the most populous region, with the cities of Fort Worth, Arlington, and Grand Prairie. The Mid-Cities region includes the cities of Hurst, Euless, and Bedford. The Eastern Region includes the cities of Mansfield, Kennedale, and Crowley. The Western Region includes the cities of Azle, Weatherford, and Aledo.
The county is home to several bodies of water, including Lake Worth, Eagle Mountain Lake, Lake Arlington, and Lake Grapevine. The Trinity River runs through the county, and the Trinity River Authority manages the river and its tributaries.
Climate
Tarrant County has a humid subtropical climate, with hot summers and mild winters. The average annual temperature is 68°F, and the average annual precipitation is 33.5 inches.
Demographics
As of the 2020 census, Tarrant County had a population of 2,054,475, making it the third-most populous county in Texas. The population is 53.2% White, 24.3% Hispanic or Latino, 18.2% Black or African American, 3.2% Asian, and 0.9% Native American. The median household income is $60,945, and the median home value is $203,400.
Economy
Tarrant County is home to a diverse economy, with major industries including healthcare, manufacturing, retail, and education. The county is home to several major employers, including American Airlines, Lockheed Martin, and Bell Helicopter. The county is also home to several major universities, including the University of Texas at Arlington, Texas Christian University, and Texas Wesleyan University.
The county is home to several major attractions, including the Fort Worth Zoo, the Fort Worth Stockyards, and the Fort Worth Museum of Science and History. The county is also home to several professional sports teams, including the Dallas Cowboys, the Texas Rangers, and the Dallas Stars.
Conclusion
Tarrant County, Texas is a vibrant and diverse county located in the north-central part of the state. It is home to a diverse population and a diverse economy, with major industries including healthcare, manufacturing, retail, and education. The county is home to several major attractions, including the Fort Worth Zoo, the Fort Worth Stockyards, and the Fort Worth Museum of Science and History. Tarrant County is an important part of the Dallas-Fort Worth-Arlington metropolitan area and is an important part of the state of Texas.
Common Questions
What is Per Capita Income in Tarrant County?
Per Capita income in Tarrant County is $39,407.
What is the Median Family Income in Tarrant County?
Median Family Income in Tarrant County is $94,733.
What is the Median Household income in Tarrant County?
Median Household Income in Tarrant County is $78,872.
What is Income or Wage Gap in Tarrant County?
Income or Wage Gap in Tarrant County is 27.0%.
Women in Tarrant County earn 73.0 cents for every dollar earned by a man.
What is Family Income Deficit in Tarrant County?
Family Income Deficit in Tarrant County is $11,132.
Families that are below poverty line in Tarrant County earn $11,132 less on average than the poverty threshold level.
What is Inequality or Gini Index in Tarrant County?
Inequality or Gini Index in Tarrant County is 0.46.
What is the Total Population of Tarrant County?
Total Population of Tarrant County is 2,113,854.
What is the Total Male Population of Tarrant County?
Total Male Population of Tarrant County is 1,041,366.
What is the Total Female Population of Tarrant County?
Total Female Population of Tarrant County is 1,072,488.
What is the Ratio of Males per 100 Females in Tarrant County?
There are 97.10 Males per 100 Females in Tarrant County.
What is the Ratio of Females per 100 Males in Tarrant County?
There are 102.99 Females per 100 Males in Tarrant County.
What is the Median Population Age in Tarrant County?
Median Population Age in Tarrant County is 34.9 Years.
What is the Average Family Size in Tarrant County
Average Family Size in Tarrant County is 3.4 People.
What is the Average Household Size in Tarrant County
Average Household Size in Tarrant County is 2.8 People.
How Large is the Labor Force in Tarrant County?
There are 1,122,897 People in the Labor Forcein in Tarrant County.
What is the Percentage of People in the Labor Force in Tarrant County?
68.7% of People are in the Labor Force in Tarrant County.
What is the Unemployment Rate in Tarrant County?
Unemployment Rate in Tarrant County is 4.9%.