Area Code 817 Map & Demographics
Area Code 817 Map
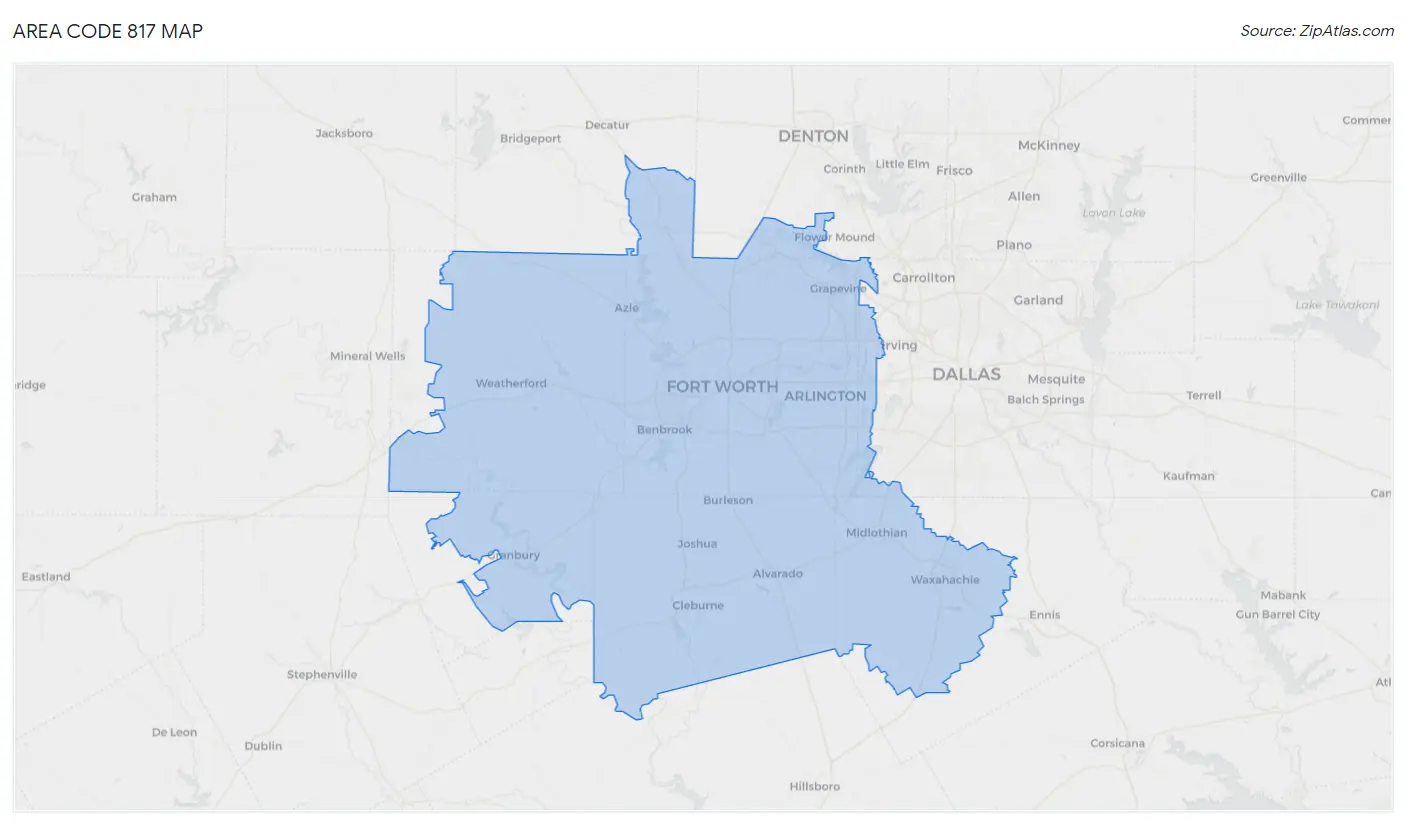
Area Code 817 Overview
$36,831
PER CAPITA INCOME
$91,340
AVG FAMILY INCOME
$78,843
AVG HOUSEHOLD INCOME
29.8%
WAGE / INCOME GAP [ % ]
70.2¢/ $1
WAGE / INCOME GAP [ $ ]
$10,547
FAMILY INCOME DEFICIT
33.81
INEQUALITY / GINI INDEX
2,464,037
TOTAL POPULATION
1,219,649
MALE POPULATION
1,244,388
FEMALE POPULATION
98.01
MALES / 100 FEMALES
102.03
FEMALES / 100 MALES
35.8
MEDIAN AGE
3.3
AVG FAMILY SIZE
2.7
AVG HOUSEHOLD SIZE
1,271,519
LABOR FORCE [ PEOPLE ]
66.4%
PERCENT IN LABOR FORCE
5.2%
UNEMPLOYMENT RATE
Income in Area Code 817
Income Overview in Area Code 817
Per Capita Income in Area Code 817 is $36,831, while median incomes of families and households are $91,340 and $78,843 respectively.
| Characteristic | Number | Measure |
| Per Capita Income | 2,464,037 | $36,831 |
| Median Family Income | 600,895 | $91,340 |
| Mean Family Income | 600,895 | $9,201,317 |
| Median Household Income | 889,303 | $78,843 |
| Mean Household Income | 889,303 | $8,168,171 |
| Income Deficit | 600,895 | $10,547 |
| Wage / Income Gap (%) | 2,464,037 | 29.84% |
| Wage / Income Gap ($) | 2,464,037 | 70.16¢ per $1 |
| Gini / Inequality Index | 2,464,037 | 33.81 |
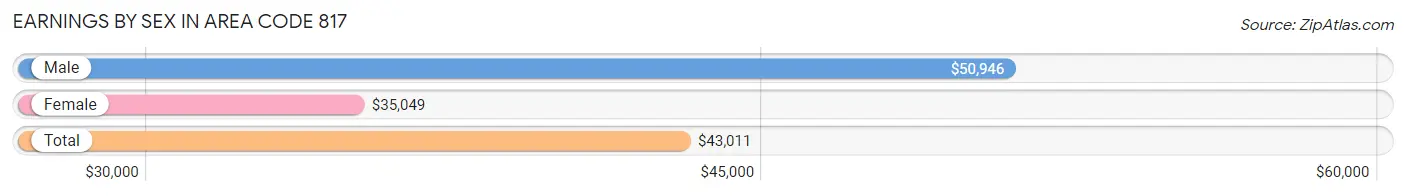
Earnings by Sex in Area Code 817
Average Earnings in Area Code 817 are $43,011, $50,946 for men and $35,049 for women, a difference of 31.2%.
| Sex | Number | Average Earnings |
| Male | 726,423 (53.9%) | $50,946 |
| Female | 621,537 (46.1%) | $35,049 |
| Total | 1,347,960 (100.0%) | $43,011 |
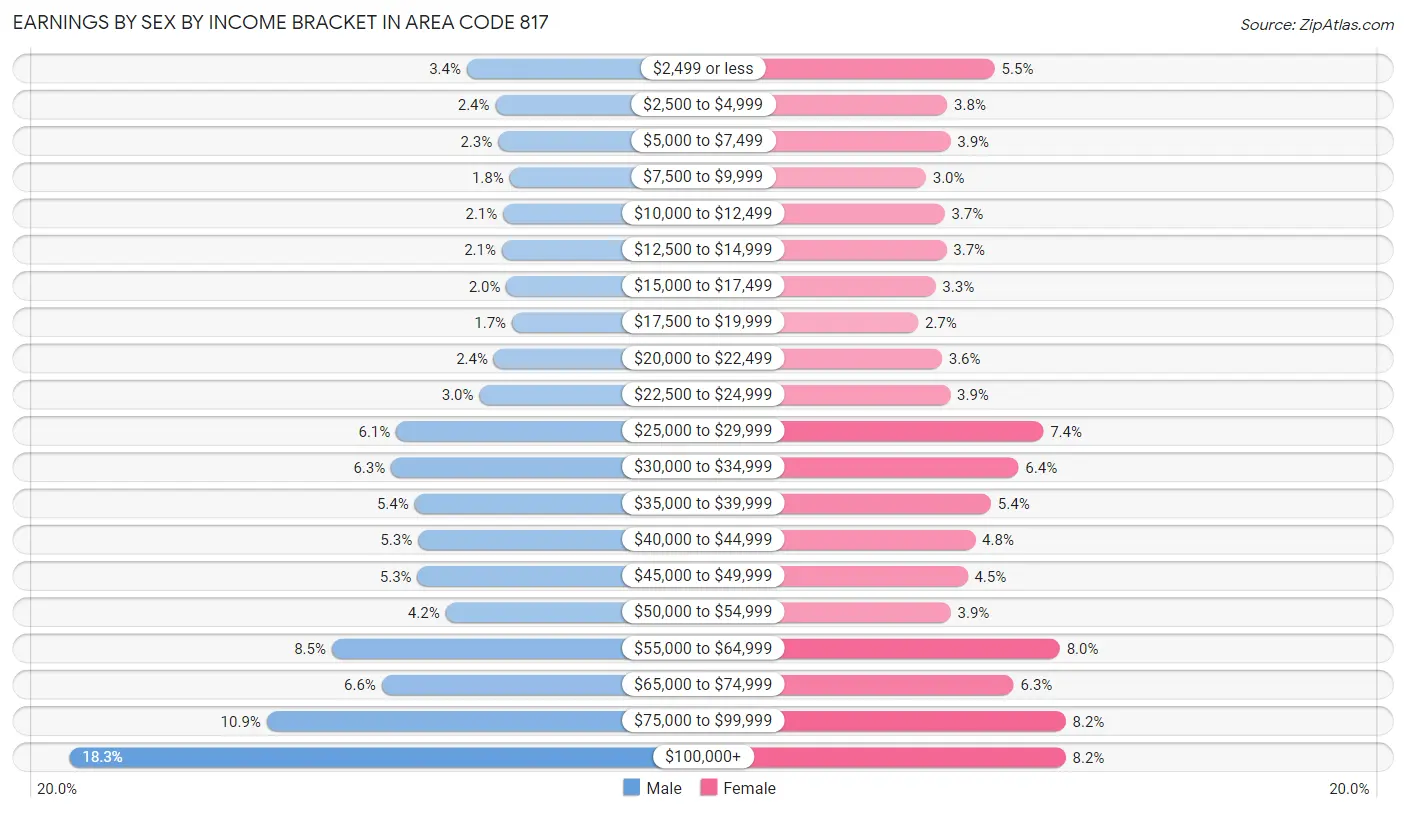
Earnings by Sex by Income Bracket in Area Code 817
The most common earnings brackets in Area Code 817 are $100,000+ for men (133,063 | 18.3%) and $75,000 to $99,999 for women (50,975 | 8.2%).
| Income | Male | Female |
| $2,499 or less | 24,938 (3.4%) | 34,447 (5.5%) |
| $2,500 to $4,999 | 17,136 (2.4%) | 23,397 (3.8%) |
| $5,000 to $7,499 | 16,446 (2.3%) | 24,101 (3.9%) |
| $7,500 to $9,999 | 13,267 (1.8%) | 18,387 (3.0%) |
| $10,000 to $12,499 | 15,045 (2.1%) | 22,736 (3.7%) |
| $12,500 to $14,999 | 15,368 (2.1%) | 23,188 (3.7%) |
| $15,000 to $17,499 | 14,149 (1.9%) | 20,637 (3.3%) |
| $17,500 to $19,999 | 12,631 (1.7%) | 16,582 (2.7%) |
| $20,000 to $22,499 | 17,588 (2.4%) | 22,148 (3.6%) |
| $22,500 to $24,999 | 21,493 (3.0%) | 24,052 (3.9%) |
| $25,000 to $29,999 | 44,201 (6.1%) | 45,720 (7.4%) |
| $30,000 to $34,999 | 45,541 (6.3%) | 39,981 (6.4%) |
| $35,000 to $39,999 | 39,160 (5.4%) | 33,568 (5.4%) |
| $40,000 to $44,999 | 38,198 (5.3%) | 29,880 (4.8%) |
| $45,000 to $49,999 | 38,331 (5.3%) | 28,122 (4.5%) |
| $50,000 to $54,999 | 30,710 (4.2%) | 24,191 (3.9%) |
| $55,000 to $64,999 | 61,663 (8.5%) | 49,619 (8.0%) |
| $65,000 to $74,999 | 48,099 (6.6%) | 38,842 (6.2%) |
| $75,000 to $99,999 | 79,396 (10.9%) | 50,975 (8.2%) |
| $100,000+ | 133,063 (18.3%) | 50,964 (8.2%) |
| Total | 726,423 (100.0%) | 621,537 (100.0%) |
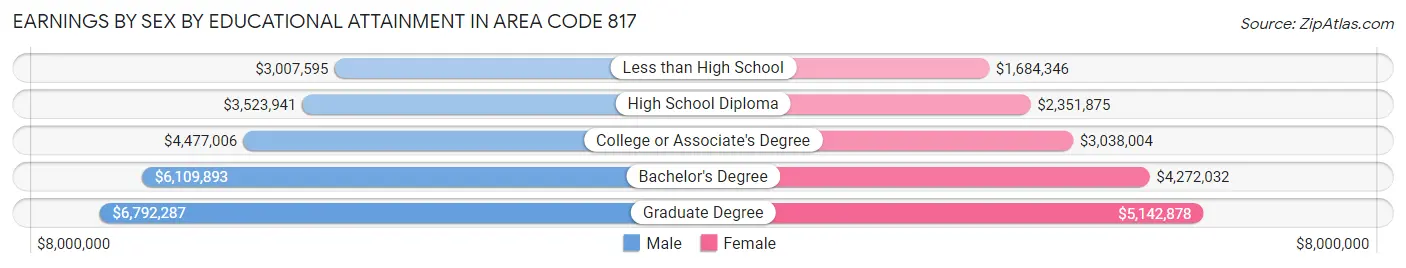
Earnings by Sex by Educational Attainment in Area Code 817
Average earnings in Area Code 817 are $4,698,827 for men and $3,261,624 for women, a difference of 30.6%. Men with an educational attainment of graduate degree enjoy the highest average annual earnings of $6,792,287, while those with less than high school education earn the least with $3,007,595. Women with an educational attainment of graduate degree earn the most with the average annual earnings of $5,142,878, while those with less than high school education have the smallest earnings of $1,684,346.
| Educational Attainment | Male Income | Female Income |
| Less than High School | $3,007,595 | $1,684,346 |
| High School Diploma | $3,523,941 | $2,351,875 |
| College or Associate's Degree | $4,477,006 | $3,038,004 |
| Bachelor's Degree | $6,109,893 | $4,272,032 |
| Graduate Degree | $6,792,287 | $5,142,878 |
| Total | $4,698,827 | $3,261,624 |
Family Income in Area Code 817
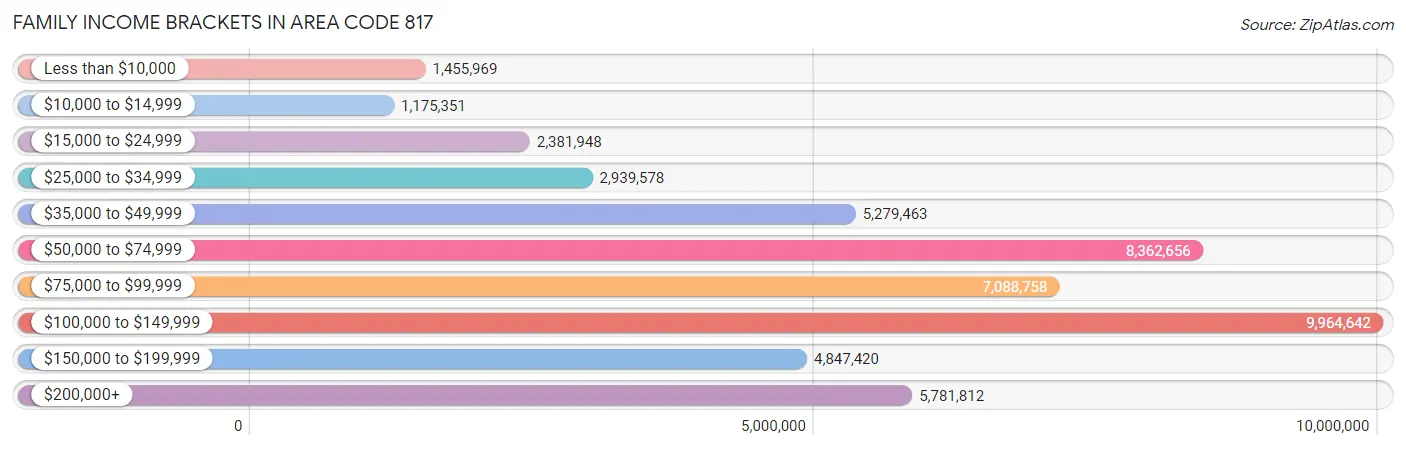
Family Income Brackets in Area Code 817
According to the Area Code 817 family income data, there are 9,964,642 families falling into the $100,000 to $149,999 income range, which is the most common income bracket and makes up 1,658.3% of all families. Conversely, the $10,000 to $14,999 income bracket is the least frequent group with only 1,175,351 families (195.6%) belonging to this category.
| Income Bracket | # Families | % Families |
| Less than $10,000 | 1,455,969 | 242.3% |
| $10,000 to $14,999 | 1,175,351 | 195.6% |
| $15,000 to $24,999 | 2,381,948 | 396.4% |
| $25,000 to $34,999 | 2,939,578 | 489.2% |
| $35,000 to $49,999 | 5,279,463 | 878.6% |
| $50,000 to $74,999 | 8,362,656 | 1,391.7% |
| $75,000 to $99,999 | 7,088,758 | 1,179.7% |
| $100,000 to $149,999 | 9,964,642 | 1,658.3% |
| $150,000 to $199,999 | 4,847,420 | 806.7% |
| $200,000+ | 5,781,812 | 962.2% |
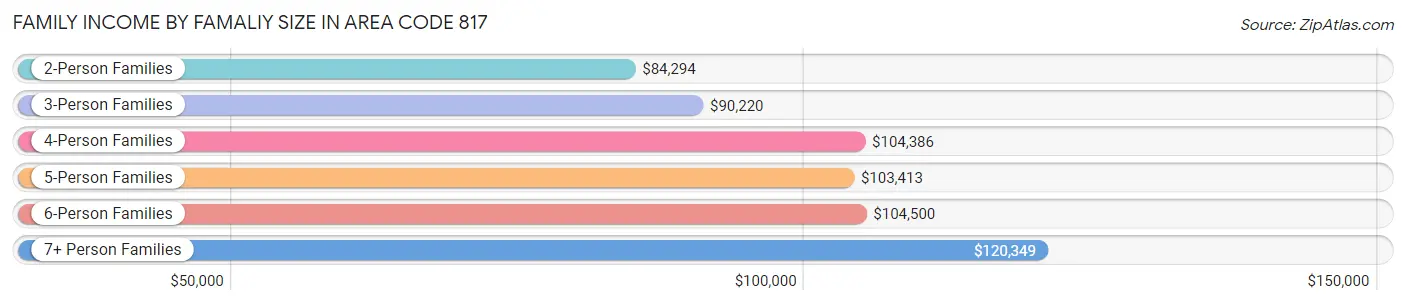
Family Income by Famaliy Size in Area Code 817
7+ person families (13,348 | 2.2%) account for the highest median family income in Area Code 817 with $120,348 per family, while 2-person families (253,218 | 42.1%) have the highest median income of $42,147 per family member.
| Income Bracket | # Families | Median Income |
| 2-Person Families | 253,218 (42.1%) | $84,294 |
| 3-Person Families | 135,608 (22.6%) | $90,220 |
| 4-Person Families | 116,377 (19.4%) | $104,386 |
| 5-Person Families | 58,779 (9.8%) | $103,413 |
| 6-Person Families | 23,565 (3.9%) | $104,500 |
| 7+ Person Families | 13,348 (2.2%) | $120,348 |
| Total | 600,895 (100.0%) | $91,340 |
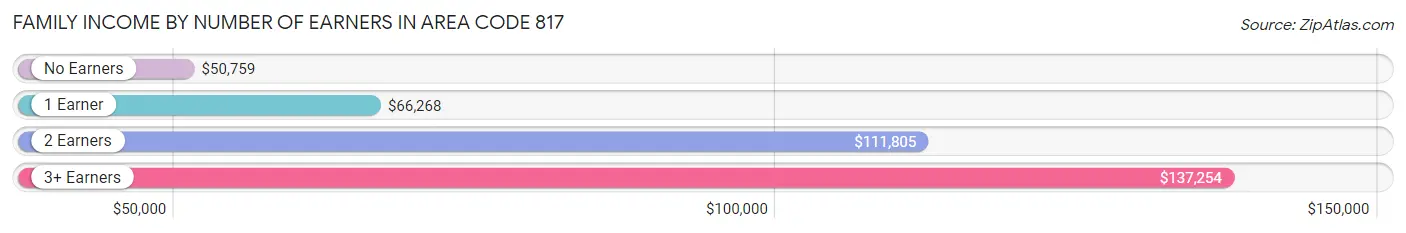
Family Income by Number of Earners in Area Code 817
The median family income in Area Code 817 is $91,340, with families comprising 3+ earners (78,783) having the highest median family income of $137,254, while families with no earners (61,492) have the lowest median family income of $50,759, accounting for 13.1% and 10.2% of families, respectively.
| Number of Earners | # Families | Median Income |
| No Earners | 61,492 (10.2%) | $50,759 |
| 1 Earner | 200,221 (33.3%) | $66,268 |
| 2 Earners | 260,399 (43.3%) | $111,805 |
| 3+ Earners | 78,783 (13.1%) | $137,254 |
| Total | 600,895 (100.0%) | $91,340 |
Household Income in Area Code 817
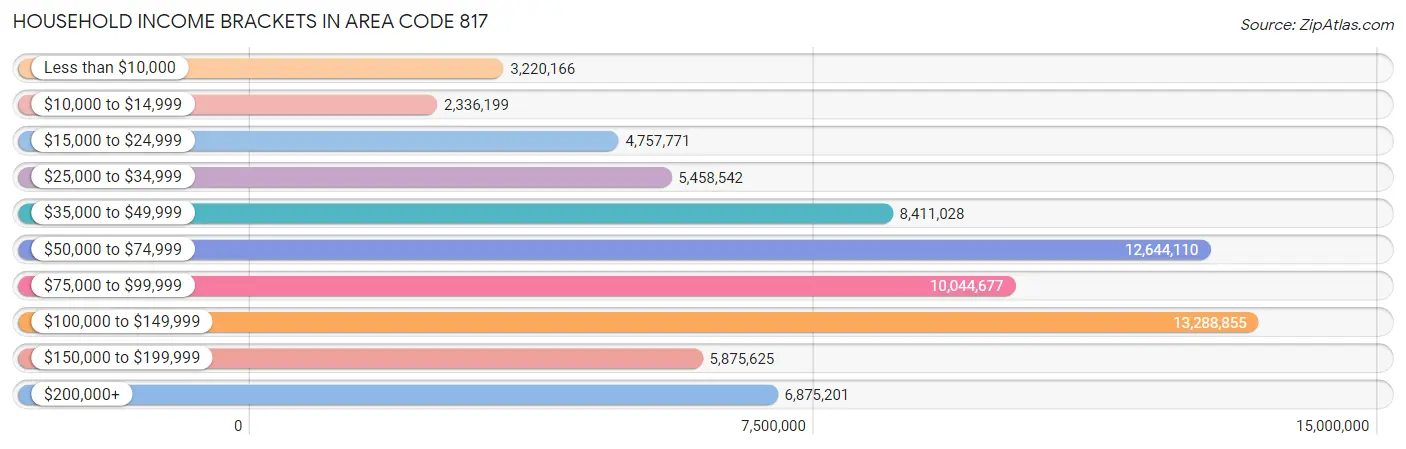
Household Income Brackets in Area Code 817
With 13,288,855 households falling in the category, the $100,000 to $149,999 income range is the most frequent in Area Code 817, accounting for 1,494.3% of all households. In contrast, only 2,336,199 households (262.7%) fall into the $10,000 to $14,999 income bracket, making it the least populous group.
| Income Bracket | # Households | % Households |
| Less than $10,000 | 3,220,166 | 362.1% |
| $10,000 to $14,999 | 2,336,199 | 262.7% |
| $15,000 to $24,999 | 4,757,771 | 535.0% |
| $25,000 to $34,999 | 5,458,542 | 613.8% |
| $35,000 to $49,999 | 8,411,028 | 945.8% |
| $50,000 to $74,999 | 12,644,110 | 1,421.8% |
| $75,000 to $99,999 | 10,044,677 | 1,129.5% |
| $100,000 to $149,999 | 13,288,855 | 1,494.3% |
| $150,000 to $199,999 | 5,875,625 | 660.7% |
| $200,000+ | 6,875,201 | 773.1% |
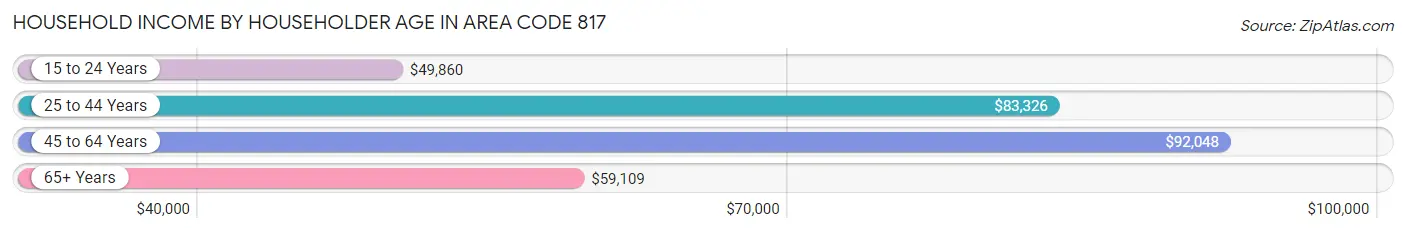
Household Income by Householder Age in Area Code 817
The median household income in Area Code 817 is $78,843, with the highest median household income of $92,048 found in the 45 to 64 years age bracket for the primary householder. A total of 326,406 households (36.7%) fall into this category. Meanwhile, the 15 to 24 years age bracket for the primary householder has the lowest median household income of $49,860, with 44,285 households (5.0%) in this group.
| Income Bracket | # Households | Median Income |
| 15 to 24 Years | 44,285 (5.0%) | $49,860 |
| 25 to 44 Years | 342,552 (38.5%) | $83,326 |
| 45 to 64 Years | 326,406 (36.7%) | $92,048 |
| 65+ Years | 176,060 (19.8%) | $59,109 |
| Total | 889,303 (100.0%) | $78,843 |
Poverty in Area Code 817
Income Below Poverty by Sex and Age in Area Code 817
With 10.3% poverty level for males and 12.8% for females among the residents of Area Code 817, 5 year old males and 18 to 24 year old females are the most vulnerable to poverty, with 2,852 males (17.8%) and 22,769 females (19.6%) in their respective age groups living below the poverty level.
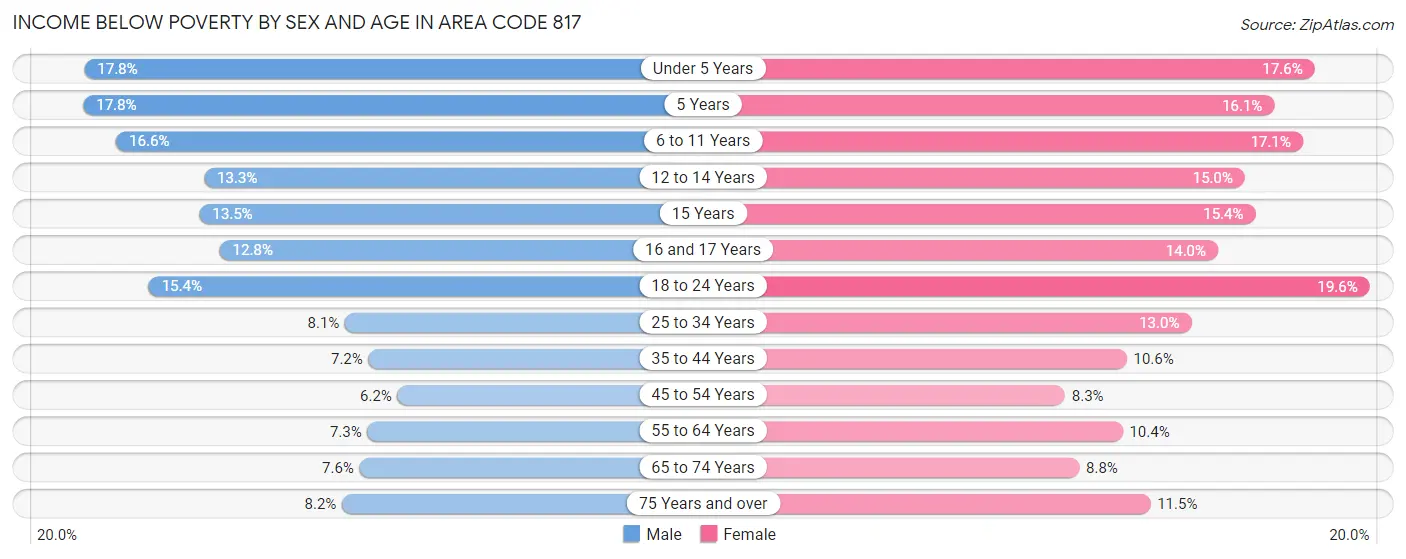
| Age Bracket | Male | Female |
| Under 5 Years | 14,598 (17.8%) | 13,851 (17.5%) |
| 5 Years | 2,852 (17.8%) | 2,729 (16.1%) |
| 6 to 11 Years | 17,383 (16.6%) | 17,249 (17.1%) |
| 12 to 14 Years | 7,528 (13.3%) | 7,823 (15.0%) |
| 15 Years | 2,357 (13.5%) | 2,593 (15.3%) |
| 16 and 17 Years | 4,763 (12.8%) | 4,941 (14.0%) |
| 18 to 24 Years | 18,291 (15.4%) | 22,769 (19.6%) |
| 25 to 34 Years | 14,802 (8.1%) | 24,166 (13.0%) |
| 35 to 44 Years | 12,158 (7.2%) | 17,927 (10.6%) |
| 45 to 54 Years | 9,337 (6.1%) | 12,553 (8.3%) |
| 55 to 64 Years | 9,979 (7.3%) | 14,629 (10.4%) |
| 65 to 74 Years | 6,359 (7.6%) | 8,500 (8.8%) |
| 75 Years and over | 3,799 (8.2%) | 7,221 (11.5%) |
| Total | 124,206 (10.3%) | 156,951 (12.8%) |
Income Above Poverty by Sex and Age in Area Code 817
According to the poverty statistics in Area Code 817, males aged 45 to 54 years and females aged 45 to 54 years are the age groups that are most secure financially, with 93.9% of males and 91.7% of females in these age groups living above the poverty line.
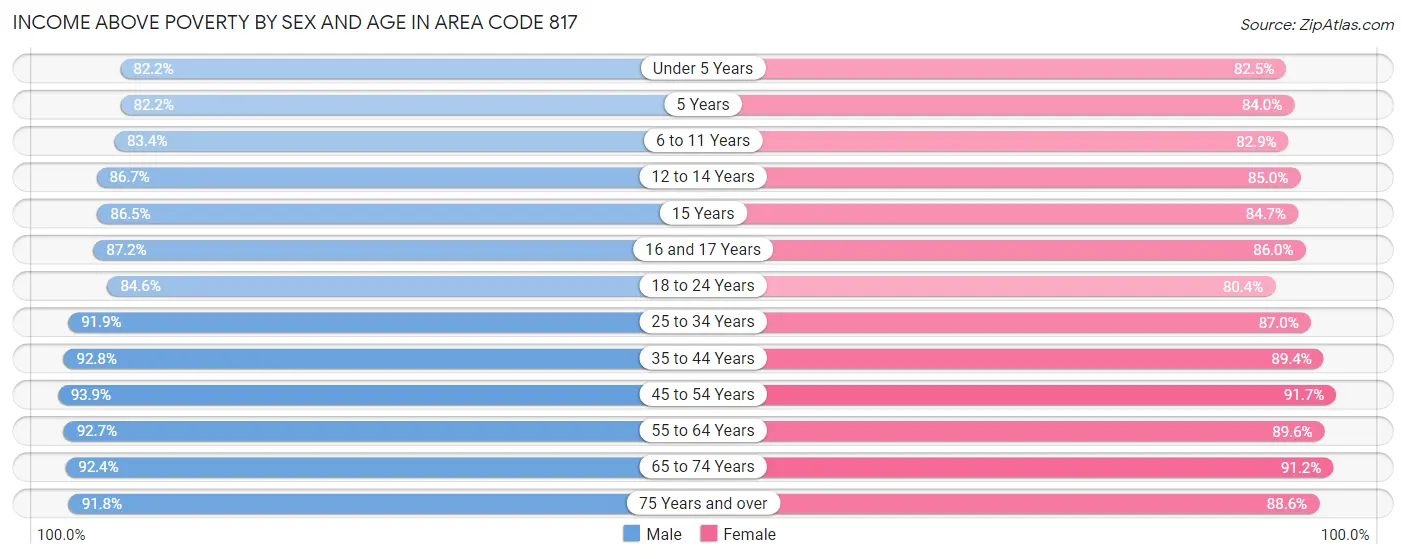
| Age Bracket | Male | Female |
| Under 5 Years | 67,498 (82.2%) | 65,076 (82.5%) |
| 5 Years | 13,151 (82.2%) | 14,276 (84.0%) |
| 6 to 11 Years | 87,330 (83.4%) | 83,545 (82.9%) |
| 12 to 14 Years | 48,914 (86.7%) | 44,473 (85.0%) |
| 15 Years | 15,095 (86.5%) | 14,295 (84.7%) |
| 16 and 17 Years | 32,572 (87.2%) | 30,447 (86.0%) |
| 18 to 24 Years | 100,546 (84.6%) | 93,446 (80.4%) |
| 25 to 34 Years | 168,044 (91.9%) | 162,175 (87.0%) |
| 35 to 44 Years | 156,086 (92.8%) | 151,732 (89.4%) |
| 45 to 54 Years | 142,461 (93.9%) | 139,035 (91.7%) |
| 55 to 64 Years | 127,361 (92.7%) | 125,742 (89.6%) |
| 65 to 74 Years | 77,795 (92.4%) | 88,014 (91.2%) |
| 75 Years and over | 42,472 (91.8%) | 55,837 (88.5%) |
| Total | 1,079,325 (89.7%) | 1,068,093 (87.2%) |
Income Below Poverty Among Married-Couple Families in Area Code 817
The poverty statistics for married-couple families in Area Code 817 show that 4.7% or 20,883 of the total 440,332 families live below the poverty line. Families with 5 or more children have the highest poverty rate of 25.8%, comprising of 1,014 families. On the other hand, families with no children have the lowest poverty rate of 3.2%, which includes 7,480 families.
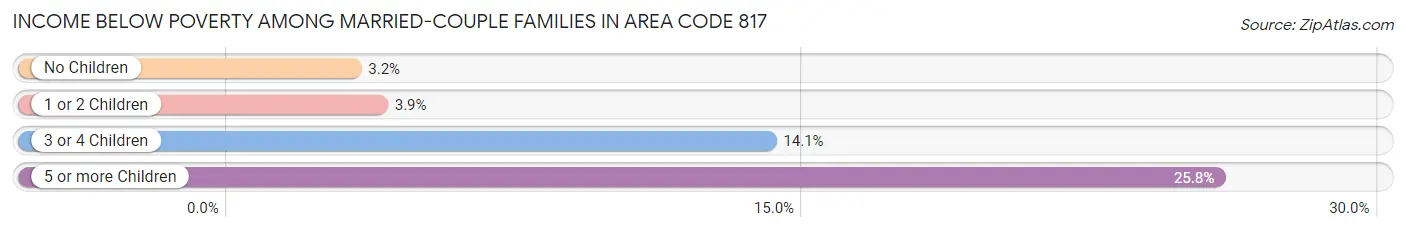
| Children | Above Poverty | Below Poverty |
| No Children | 224,752 (96.8%) | 7,480 (3.2%) |
| 1 or 2 Children | 154,488 (96.1%) | 6,286 (3.9%) |
| 3 or 4 Children | 37,293 (85.9%) | 6,103 (14.1%) |
| 5 or more Children | 2,916 (74.2%) | 1,014 (25.8%) |
| Total | 419,449 (95.3%) | 20,883 (4.7%) |
Income Below Poverty Among Single-Parent Households in Area Code 817
According to the poverty data in Area Code 817, 9.6% or 4,475 single-father households and 22.5% or 25,556 single-mother households are living below the poverty line. Among single-father households, those with 5 or more children have the highest poverty rate, with 268 households (53.8%) experiencing poverty. Likewise, among single-mother households, those with 5 or more children have the highest poverty rate, with 949 households (58.1%) falling below the poverty line.
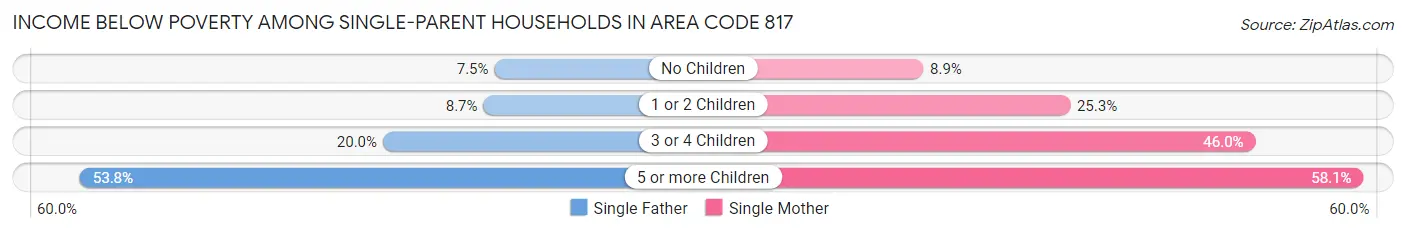
| Children | Single Father | Single Mother |
| No Children | 1,598 (7.5%) | 3,540 (8.9%) |
| 1 or 2 Children | 1,857 (8.7%) | 14,845 (25.3%) |
| 3 or 4 Children | 752 (20.0%) | 6,222 (46.0%) |
| 5 or more Children | 268 (53.8%) | 949 (58.1%) |
| Total | 4,475 (9.6%) | 25,556 (22.5%) |
Income Below Poverty Among Married-Couple vs Single-Parent Households in Area Code 817
The poverty data for Area Code 817 shows that 20,883 of the married-couple family households (4.7%) and 30,031 of the single-parent households (18.7%) are living below the poverty level. Within the married-couple family households, those with 5 or more children have the highest poverty rate, with 1,014 households (25.8%) falling below the poverty line. Among the single-parent households, those with 5 or more children have the highest poverty rate, with 1,217 household (57.1%) living below poverty.
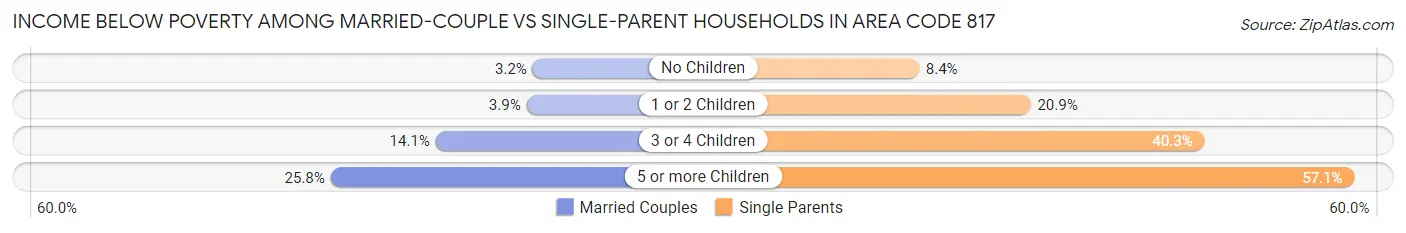
| Children | Married-Couple Families | Single-Parent Households |
| No Children | 7,480 (3.2%) | 5,138 (8.4%) |
| 1 or 2 Children | 6,286 (3.9%) | 16,702 (20.9%) |
| 3 or 4 Children | 6,103 (14.1%) | 6,974 (40.3%) |
| 5 or more Children | 1,014 (25.8%) | 1,217 (57.1%) |
| Total | 20,883 (4.7%) | 30,031 (18.7%) |
Race in Area Code 817
The most populous races in Area Code 817 are White / Caucasian (1,419,887 | 57.6%), Hispanic or Latino (770,425 | 31.3%), and Black / African American (370,217 | 15.0%).
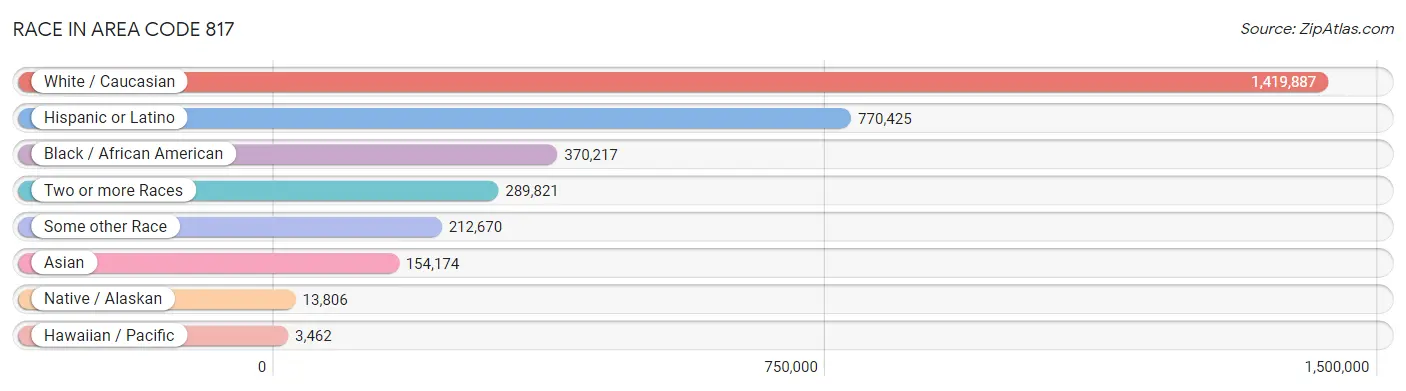
| Race | # Population | % Population |
| Asian | 154,174 | 6.3% |
| Black / African American | 370,217 | 15.0% |
| Hawaiian / Pacific | 3,462 | 0.1% |
| Hispanic or Latino | 770,425 | 31.3% |
| Native / Alaskan | 13,806 | 0.6% |
| White / Caucasian | 1,419,887 | 57.6% |
| Two or more Races | 289,821 | 11.8% |
| Some other Race | 212,670 | 8.6% |
| Total | 2,464,037 | 100.0% |
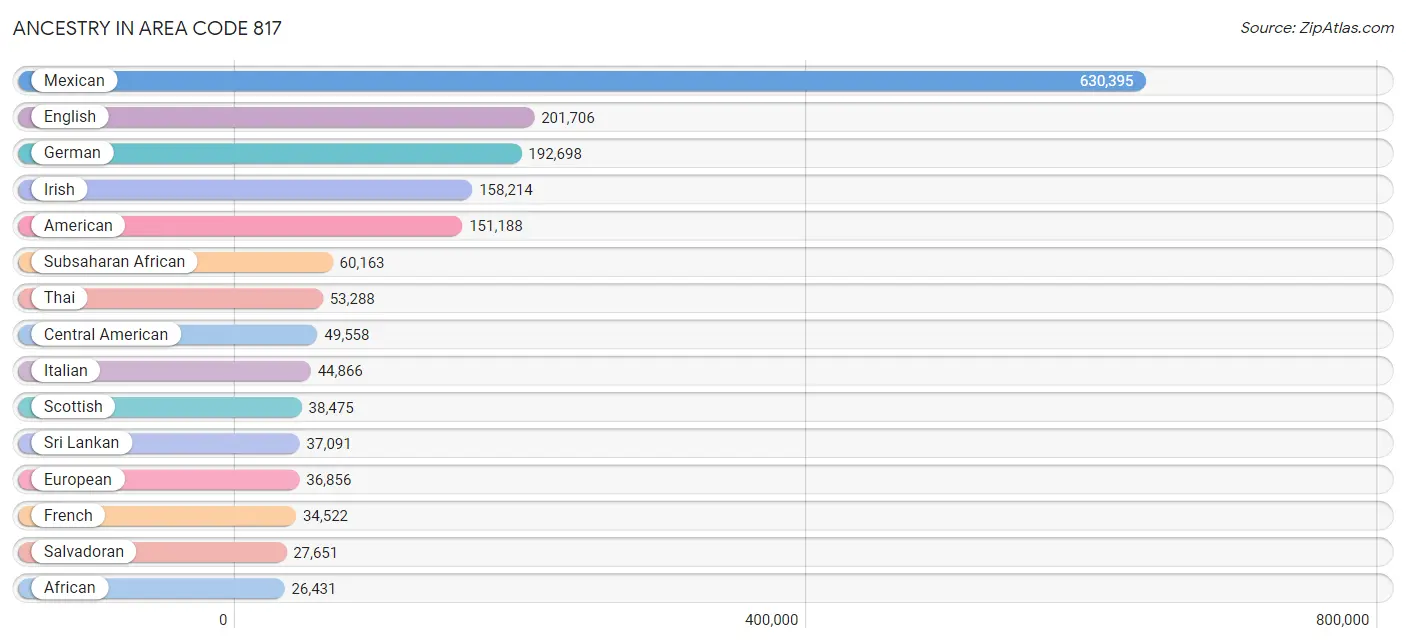
Ancestry in Area Code 817
The most populous ancestries reported in Area Code 817 are Mexican (630,395 | 25.6%), English (201,706 | 8.2%), German (192,698 | 7.8%), Irish (158,214 | 6.4%), and American (151,188 | 6.1%), together accounting for 54.1% of all Area Code 817 residents.
| Ancestry | # Population | % Population |
| Afghan | 1,359 | 0.1% |
| African | 26,431 | 1.1% |
| Alaska Native | 59 | 0.0% |
| Alaskan Athabascan | 48 | 0.0% |
| Albanian | 1,112 | 0.1% |
| Aleut | 127 | 0.0% |
| Alsatian | 50 | 0.0% |
| American | 151,188 | 6.1% |
| Apache | 1,459 | 0.1% |
| Arab | 17,228 | 0.7% |
| Arapaho | 211 | 0.0% |
| Argentinean | 1,274 | 0.1% |
| Armenian | 331 | 0.0% |
| Assyrian / Chaldean / Syriac | 16 | 0.0% |
| Australian | 390 | 0.0% |
| Austrian | 1,948 | 0.1% |
| Bahamian | 346 | 0.0% |
| Bangladeshi | 827 | 0.0% |
| Barbadian | 135 | 0.0% |
| Basque | 225 | 0.0% |
| Belgian | 1,264 | 0.1% |
| Belizean | 283 | 0.0% |
| Bermudan | 32 | 0.0% |
| Bhutanese | 5,815 | 0.2% |
| Blackfeet | 1,475 | 0.1% |
| Bolivian | 374 | 0.0% |
| Brazilian | 1,782 | 0.1% |
| British | 12,449 | 0.5% |
| British West Indian | 256 | 0.0% |
| Bulgarian | 220 | 0.0% |
| Burmese | 10,292 | 0.4% |
| Cajun | 485 | 0.0% |
| Cambodian | 68 | 0.0% |
| Canadian | 3,034 | 0.1% |
| Cape Verdean | 47 | 0.0% |
| Celtic | 240 | 0.0% |
| Central American | 49,558 | 2.0% |
| Central American Indian | 2,534 | 0.1% |
| Cherokee | 8,087 | 0.3% |
| Cheyenne | 81 | 0.0% |
| Chickasaw | 770 | 0.0% |
| Chilean | 708 | 0.0% |
| Chinese | 13 | 0.0% |
| Chippewa | 111 | 0.0% |
| Choctaw | 3,775 | 0.2% |
| Colombian | 6,364 | 0.3% |
| Colville | 14 | 0.0% |
| Comanche | 587 | 0.0% |
| Costa Rican | 1,011 | 0.0% |
| Cree | 40 | 0.0% |
| Creek | 515 | 0.0% |
| Croatian | 1,078 | 0.0% |
| Crow | 102 | 0.0% |
| Cuban | 8,421 | 0.3% |
| Cypriot | 51 | 0.0% |
| Czech | 9,728 | 0.4% |
| Czechoslovakian | 1,516 | 0.1% |
| Danish | 3,674 | 0.2% |
| Delaware | 173 | 0.0% |
| Dominican | 2,209 | 0.1% |
| Dutch | 15,596 | 0.6% |
| Dutch West Indian | 687 | 0.0% |
| Eastern European | 2,097 | 0.1% |
| Ecuadorian | 2,064 | 0.1% |
| Egyptian | 2,781 | 0.1% |
| English | 201,706 | 8.2% |
| Estonian | 214 | 0.0% |
| Ethiopian | 2,573 | 0.1% |
| European | 36,856 | 1.5% |
| Fijian | 777 | 0.0% |
| Filipino | 1,392 | 0.1% |
| Finnish | 2,446 | 0.1% |
| French | 34,522 | 1.4% |
| French American Indian | 330 | 0.0% |
| French Canadian | 5,586 | 0.2% |
| German | 192,698 | 7.8% |
| German Russian | 376 | 0.0% |
| Ghanaian | 1,551 | 0.1% |
| Greek | 3,851 | 0.2% |
| Guamanian / Chamorro | 816 | 0.0% |
| Guatemalan | 7,718 | 0.3% |
| Guyanese | 174 | 0.0% |
| Haitian | 1,561 | 0.1% |
| Honduran | 9,889 | 0.4% |
| Hopi | 43 | 0.0% |
| Houma | 40 | 0.0% |
| Hungarian | 3,143 | 0.1% |
| Icelander | 89 | 0.0% |
| Indian (Asian) | 16,577 | 0.7% |
| Indonesian | 1,468 | 0.1% |
| Inupiat | 246 | 0.0% |
| Iranian | 2,579 | 0.1% |
| Iraqi | 2,114 | 0.1% |
| Irish | 158,214 | 6.4% |
| Iroquois | 355 | 0.0% |
| Israeli | 1,083 | 0.0% |
| Italian | 44,866 | 1.8% |
| Jamaican | 2,668 | 0.1% |
| Japanese | 1,581 | 0.1% |
| Jordanian | 1,055 | 0.0% |
| Kenyan | 3,265 | 0.1% |
| Kiowa | 211 | 0.0% |
| Korean | 15,710 | 0.6% |
| Laotian | 842 | 0.0% |
| Latvian | 276 | 0.0% |
| Lebanese | 3,613 | 0.2% |
| Liberian | 1,237 | 0.1% |
| Lithuanian | 1,102 | 0.0% |
| Lumbee | 82 | 0.0% |
| Luxembourger | 70 | 0.0% |
| Macedonian | 133 | 0.0% |
| Malaysian | 5,712 | 0.2% |
| Maltese | 239 | 0.0% |
| Menominee | 145 | 0.0% |
| Mexican | 630,395 | 25.6% |
| Mexican American Indian | 5,231 | 0.2% |
| Mongolian | 536 | 0.0% |
| Moroccan | 600 | 0.0% |
| Native Hawaiian | 2,133 | 0.1% |
| Navajo | 1,178 | 0.1% |
| New Zealander | 103 | 0.0% |
| Nicaraguan | 1,888 | 0.1% |
| Nigerian | 13,012 | 0.5% |
| Northern European | 2,369 | 0.1% |
| Norwegian | 13,844 | 0.6% |
| Okinawan | 41 | 0.0% |
| Osage | 200 | 0.0% |
| Ottawa | 124 | 0.0% |
| Paiute | 6 | 0.0% |
| Pakistani | 2,167 | 0.1% |
| Palestinian | 1,454 | 0.1% |
| Panamanian | 1,395 | 0.1% |
| Pennsylvania German | 222 | 0.0% |
| Peruvian | 3,719 | 0.2% |
| Pima | 2 | 0.0% |
| Polish | 21,814 | 0.9% |
| Portuguese | 2,935 | 0.1% |
| Potawatomi | 65 | 0.0% |
| Pueblo | 369 | 0.0% |
| Puerto Rican | 24,217 | 1.0% |
| Puget Sound Salish | 37 | 0.0% |
| Romanian | 1,040 | 0.0% |
| Russian | 5,380 | 0.2% |
| Salvadoran | 27,651 | 1.1% |
| Samoan | 1,242 | 0.1% |
| Scandinavian | 4,993 | 0.2% |
| Scotch-Irish | 20,216 | 0.8% |
| Scottish | 38,475 | 1.6% |
| Seminole | 175 | 0.0% |
| Senegalese | 213 | 0.0% |
| Serbian | 459 | 0.0% |
| Sioux | 601 | 0.0% |
| Slavic | 529 | 0.0% |
| Slovak | 1,219 | 0.1% |
| Slovene | 241 | 0.0% |
| Somali | 1,360 | 0.1% |
| South African | 676 | 0.0% |
| South American | 18,278 | 0.7% |
| South American Indian | 213 | 0.0% |
| Spaniard | 8,620 | 0.4% |
| Spanish | 5,272 | 0.2% |
| Spanish American | 154 | 0.0% |
| Spanish American Indian | 57 | 0.0% |
| Sri Lankan | 37,091 | 1.5% |
| Subsaharan African | 60,163 | 2.4% |
| Sudanese | 1,664 | 0.1% |
| Swedish | 11,426 | 0.5% |
| Swiss | 2,263 | 0.1% |
| Syrian | 466 | 0.0% |
| Taiwanese | 81 | 0.0% |
| Thai | 53,288 | 2.2% |
| Tlingit-Haida | 49 | 0.0% |
| Tohono O'Odham | 9 | 0.0% |
| Tongan | 1,241 | 0.1% |
| Trinidadian and Tobagonian | 1,485 | 0.1% |
| Turkish | 606 | 0.0% |
| U.S. Virgin Islander | 146 | 0.0% |
| Ugandan | 380 | 0.0% |
| Ukrainian | 2,108 | 0.1% |
| Uruguayan | 100 | 0.0% |
| Ute | 33 | 0.0% |
| Venezuelan | 3,590 | 0.2% |
| Vietnamese | 1,221 | 0.1% |
| Welsh | 9,923 | 0.4% |
| West Indian | 609 | 0.0% |
| Yakama | 7 | 0.0% |
| Yaqui | 302 | 0.0% |
| Yugoslavian | 639 | 0.0% |
| Yup'ik | 123 | 0.0% |
| Zimbabwean | 574 | 0.0% | View All 190 Rows |
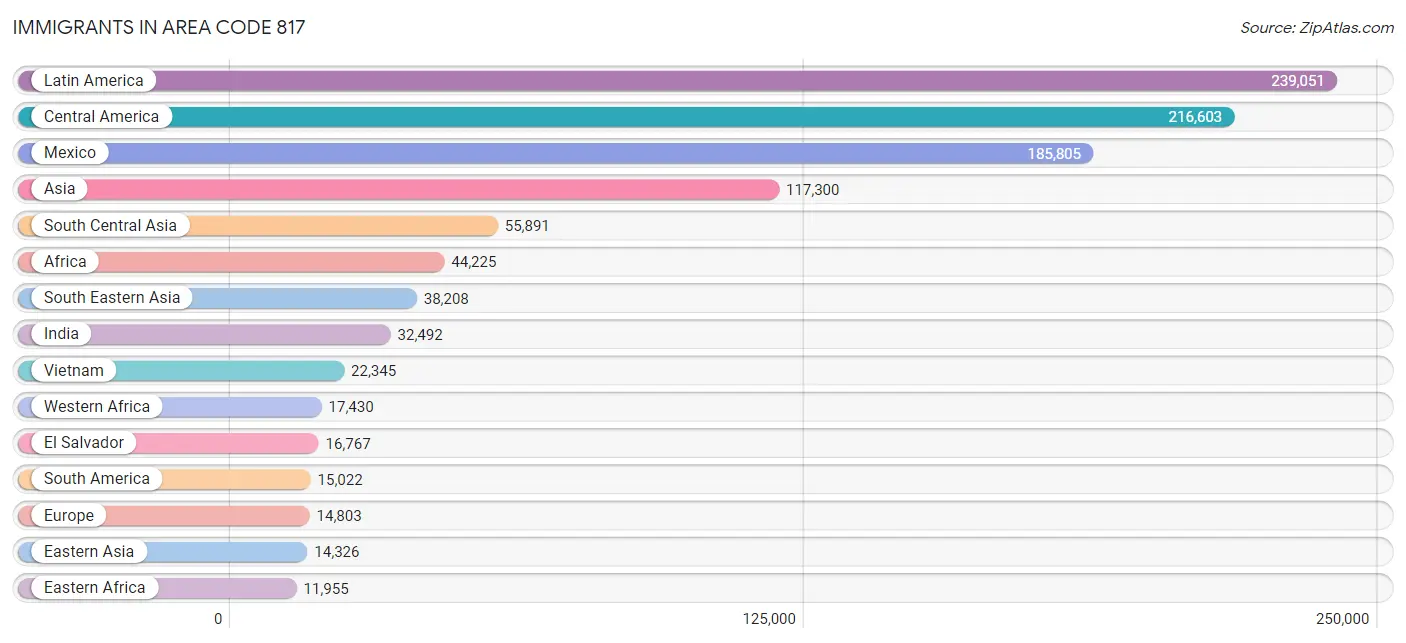
Immigrants in Area Code 817
The most numerous immigrant groups reported in Area Code 817 came from Latin America (239,051 | 9.7%), Central America (216,603 | 8.8%), Mexico (185,805 | 7.5%), Asia (117,300 | 4.8%), and South Central Asia (55,891 | 2.3%), together accounting for 33.1% of all Area Code 817 residents.
| Immigration Origin | # Population | % Population |
| Afghanistan | 1,817 | 0.1% |
| Africa | 44,225 | 1.8% |
| Albania | 222 | 0.0% |
| Argentina | 1,116 | 0.1% |
| Armenia | 13 | 0.0% |
| Asia | 117,300 | 4.8% |
| Australia | 350 | 0.0% |
| Austria | 124 | 0.0% |
| Bahamas | 171 | 0.0% |
| Bangladesh | 2,642 | 0.1% |
| Barbados | 87 | 0.0% |
| Belarus | 31 | 0.0% |
| Belgium | 149 | 0.0% |
| Belize | 155 | 0.0% |
| Bolivia | 316 | 0.0% |
| Bosnia and Herzegovina | 612 | 0.0% |
| Brazil | 1,898 | 0.1% |
| Bulgaria | 61 | 0.0% |
| Cambodia | 700 | 0.0% |
| Cameroon | 1,933 | 0.1% |
| Canada | 3,594 | 0.2% |
| Caribbean | 7,426 | 0.3% |
| Central America | 216,603 | 8.8% |
| Chile | 325 | 0.0% |
| China | 7,169 | 0.3% |
| Colombia | 4,104 | 0.2% |
| Congo | 2,855 | 0.1% |
| Costa Rica | 320 | 0.0% |
| Croatia | 123 | 0.0% |
| Cuba | 4,127 | 0.2% |
| Czechoslovakia | 193 | 0.0% |
| Denmark | 156 | 0.0% |
| Dominica | 87 | 0.0% |
| Dominican Republic | 858 | 0.0% |
| Eastern Africa | 11,955 | 0.5% |
| Eastern Asia | 14,326 | 0.6% |
| Eastern Europe | 3,842 | 0.2% |
| Ecuador | 1,287 | 0.1% |
| Egypt | 2,683 | 0.1% |
| El Salvador | 16,767 | 0.7% |
| England | 1,768 | 0.1% |
| Eritrea | 227 | 0.0% |
| Ethiopia | 2,009 | 0.1% |
| Europe | 14,803 | 0.6% |
| Fiji | 9 | 0.0% |
| France | 997 | 0.0% |
| Germany | 2,341 | 0.1% |
| Ghana | 3,176 | 0.1% |
| Greece | 224 | 0.0% |
| Grenada | 74 | 0.0% |
| Guatemala | 4,830 | 0.2% |
| Guyana | 212 | 0.0% |
| Haiti | 368 | 0.0% |
| Honduras | 7,250 | 0.3% |
| Hong Kong | 553 | 0.0% |
| Hungary | 71 | 0.0% |
| India | 32,492 | 1.3% |
| Indonesia | 598 | 0.0% |
| Iran | 1,562 | 0.1% |
| Iraq | 3,207 | 0.1% |
| Ireland | 591 | 0.0% |
| Israel | 502 | 0.0% |
| Italy | 762 | 0.0% |
| Jamaica | 958 | 0.0% |
| Japan | 1,337 | 0.1% |
| Jordan | 954 | 0.0% |
| Kazakhstan | 34 | 0.0% |
| Kenya | 4,509 | 0.2% |
| Korea | 5,820 | 0.2% |
| Kuwait | 798 | 0.0% |
| Laos | 3,495 | 0.1% |
| Latin America | 239,051 | 9.7% |
| Latvia | 91 | 0.0% |
| Lebanon | 725 | 0.0% |
| Liberia | 1,213 | 0.1% |
| Lithuania | 31 | 0.0% |
| Malaysia | 796 | 0.0% |
| Mexico | 185,805 | 7.5% |
| Micronesia | 406 | 0.0% |
| Middle Africa | 7,164 | 0.3% |
| Moldova | 10 | 0.0% |
| Morocco | 354 | 0.0% |
| Nepal | 10,298 | 0.4% |
| Netherlands | 392 | 0.0% |
| Nicaragua | 794 | 0.0% |
| Nigeria | 11,611 | 0.5% |
| North Macedonia | 108 | 0.0% |
| Northern Africa | 5,045 | 0.2% |
| Northern Europe | 5,074 | 0.2% |
| Norway | 36 | 0.0% |
| Oceania | 1,333 | 0.1% |
| Pakistan | 6,213 | 0.3% |
| Panama | 658 | 0.0% |
| Peru | 2,273 | 0.1% |
| Philippines | 7,565 | 0.3% |
| Poland | 385 | 0.0% |
| Portugal | 121 | 0.0% |
| Romania | 290 | 0.0% |
| Russia | 840 | 0.0% |
| Saudi Arabia | 421 | 0.0% |
| Scotland | 384 | 0.0% |
| Senegal | 230 | 0.0% |
| Serbia | 103 | 0.0% |
| Sierra Leone | 91 | 0.0% |
| Singapore | 277 | 0.0% |
| Somalia | 1,408 | 0.1% |
| South Africa | 800 | 0.0% |
| South America | 15,022 | 0.6% |
| South Central Asia | 55,891 | 2.3% |
| South Eastern Asia | 38,208 | 1.5% |
| Southern Europe | 1,720 | 0.1% |
| Spain | 613 | 0.0% |
| Sri Lanka | 478 | 0.0% |
| St. Vincent and the Grenadines | 40 | 0.0% |
| Sudan | 1,176 | 0.1% |
| Sweden | 102 | 0.0% |
| Switzerland | 104 | 0.0% |
| Syria | 643 | 0.0% |
| Taiwan | 1,823 | 0.1% |
| Thailand | 1,335 | 0.1% |
| Trinidad and Tobago | 520 | 0.0% |
| Turkey | 361 | 0.0% |
| Uganda | 440 | 0.0% |
| Ukraine | 365 | 0.0% |
| Uruguay | 100 | 0.0% |
| Uzbekistan | 16 | 0.0% |
| Venezuela | 3,356 | 0.1% |
| Vietnam | 22,345 | 0.9% |
| West Indies | 21 | 0.0% |
| Western Africa | 17,430 | 0.7% |
| Western Asia | 8,202 | 0.3% |
| Western Europe | 4,126 | 0.2% |
| Yemen | 25 | 0.0% |
| Zaire | 2,255 | 0.1% |
| Zimbabwe | 433 | 0.0% | View All 135 Rows |
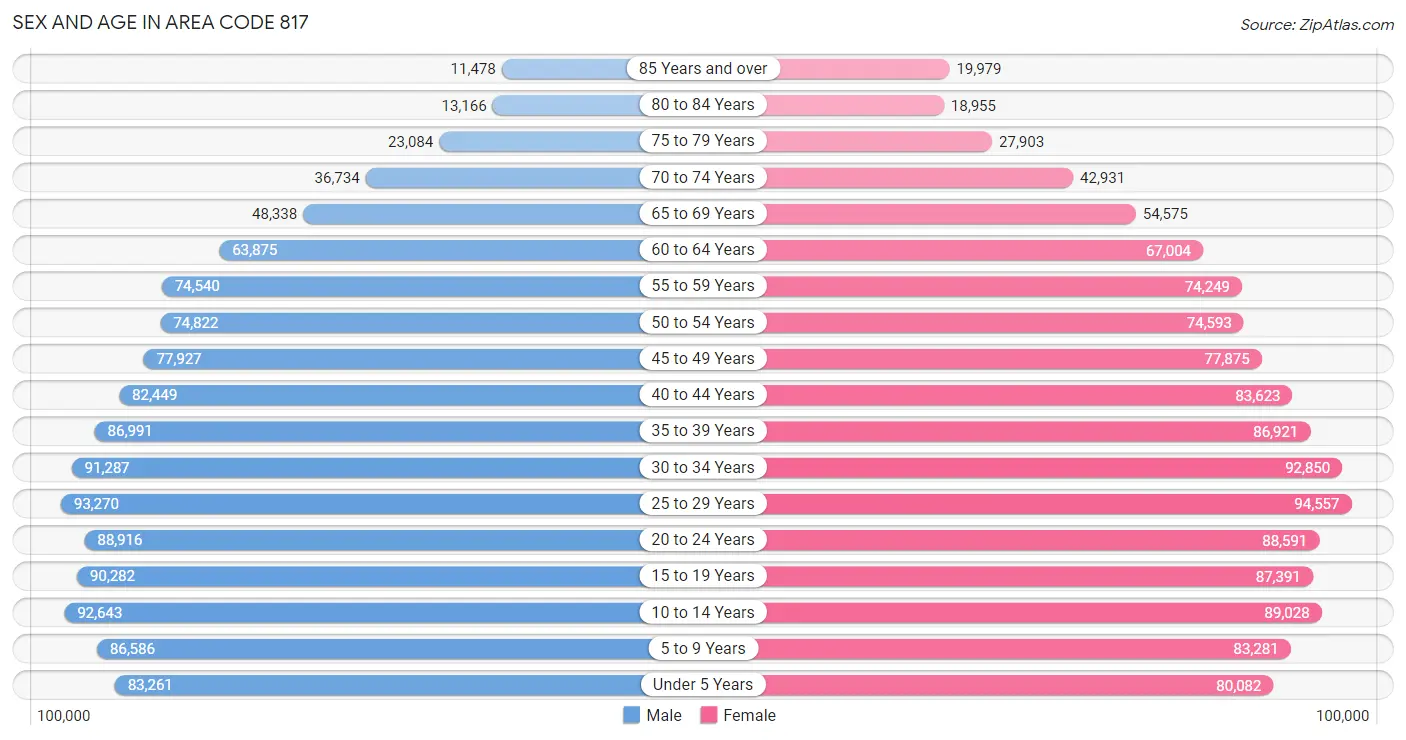
Sex and Age in Area Code 817
Sex and Age in Area Code 817
The most populous age groups in Area Code 817 are 25 to 29 Years (93,270 | 7.6%) for men and 25 to 29 Years (94,557 | 7.6%) for women.
| Age Bracket | Male | Female |
| Under 5 Years | 83,261 (6.8%) | 80,082 (6.4%) |
| 5 to 9 Years | 86,586 (7.1%) | 83,281 (6.7%) |
| 10 to 14 Years | 92,643 (7.6%) | 89,028 (7.1%) |
| 15 to 19 Years | 90,282 (7.4%) | 87,391 (7.0%) |
| 20 to 24 Years | 88,916 (7.3%) | 88,591 (7.1%) |
| 25 to 29 Years | 93,270 (7.6%) | 94,557 (7.6%) |
| 30 to 34 Years | 91,287 (7.5%) | 92,850 (7.5%) |
| 35 to 39 Years | 86,991 (7.1%) | 86,921 (7.0%) |
| 40 to 44 Years | 82,449 (6.8%) | 83,623 (6.7%) |
| 45 to 49 Years | 77,927 (6.4%) | 77,875 (6.3%) |
| 50 to 54 Years | 74,822 (6.1%) | 74,593 (6.0%) |
| 55 to 59 Years | 74,540 (6.1%) | 74,249 (6.0%) |
| 60 to 64 Years | 63,875 (5.2%) | 67,004 (5.4%) |
| 65 to 69 Years | 48,338 (4.0%) | 54,575 (4.4%) |
| 70 to 74 Years | 36,734 (3.0%) | 42,931 (3.5%) |
| 75 to 79 Years | 23,084 (1.9%) | 27,903 (2.2%) |
| 80 to 84 Years | 13,166 (1.1%) | 18,955 (1.5%) |
| 85 Years and over | 11,478 (0.9%) | 19,979 (1.6%) |
| Total | 1,219,649 (100.0%) | 1,244,388 (100.0%) |
Families and Households in Area Code 817
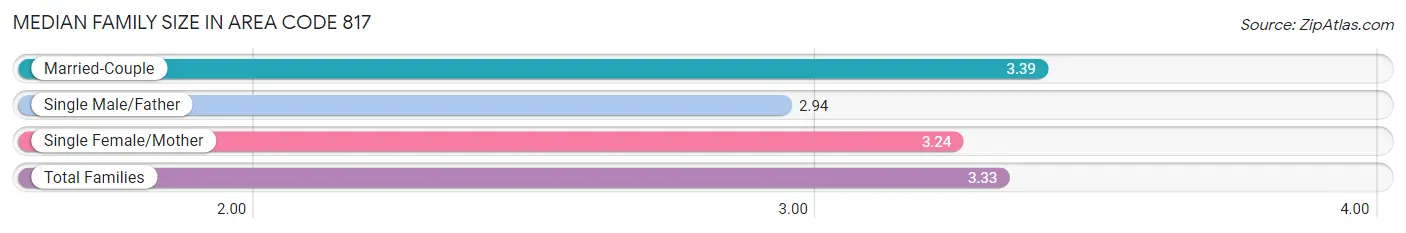
Median Family Size in Area Code 817
The median family size in Area Code 817 is 3.33 persons per family, with married-couple families (440,332 | 73.3%) accounting for the largest median family size of 3.39481 persons per family. On the other hand, single male/father families (46,855 | 7.8%) represent the smallest median family size with 2.94 persons per family.
| Family Type | # Families | Family Size |
| Married-Couple | 440,332 (73.3%) | 3.39 |
| Single Male/Father | 46,855 (7.8%) | 2.94 |
| Single Female/Mother | 113,708 (18.9%) | 3.24 |
| Total Families | 600,895 (100.0%) | 3.33 |
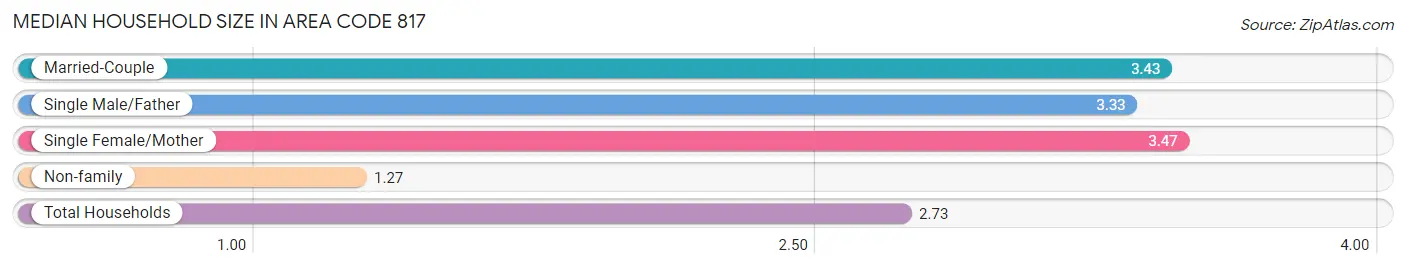
Median Household Size in Area Code 817
The median household size in Area Code 817 is 2.73 persons per household, with single female/mother households (113,708 | 12.8%) accounting for the largest median household size of 3.472 persons per household. non-family households (288,408 | 32.4%) represent the smallest median household size with 1.27 persons per household.
| Household Type | # Households | Household Size |
| Married-Couple | 440,332 (49.5%) | 3.43 |
| Single Male/Father | 46,855 (5.3%) | 3.33 |
| Single Female/Mother | 113,708 (12.8%) | 3.47 |
| Non-family | 288,408 (32.4%) | 1.27 |
| Total Households | 889,303 (100.0%) | 2.73 |
Household Size by Marriage Status in Area Code 817
Out of a total of 889,303 households in Area Code 817, 600,895 (67.6%) are family households, while 288,408 (32.4%) are nonfamily households. The most numerous type of family households are 2-person households, comprising 234,500, and the most common type of nonfamily households are 1-person households, comprising 234,241.
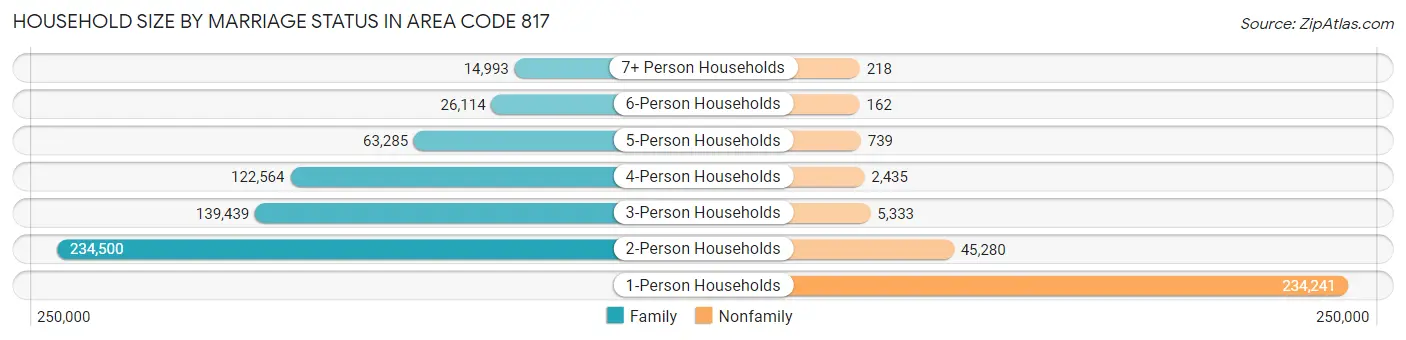
| Household Size | Family Households | Nonfamily Households |
| 1-Person Households | - | 234,241 (26.3%) |
| 2-Person Households | 234,500 (26.4%) | 45,280 (5.1%) |
| 3-Person Households | 139,439 (15.7%) | 5,333 (0.6%) |
| 4-Person Households | 122,564 (13.8%) | 2,435 (0.3%) |
| 5-Person Households | 63,285 (7.1%) | 739 (0.1%) |
| 6-Person Households | 26,114 (2.9%) | 162 (0.0%) |
| 7+ Person Households | 14,993 (1.7%) | 218 (0.0%) |
| Total | 600,895 (67.6%) | 288,408 (32.4%) |
Female Fertility in Area Code 817
Fertility by Age in Area Code 817
Average fertility rate in Area Code 817 is 56.3 births per 1,000 women. Women in the age bracket of 20 to 34 years have the highest fertility rate with 94.2 births per 1,000 women. Women in the age bracket of 20 to 34 years acount for 71.0% of all women with births.
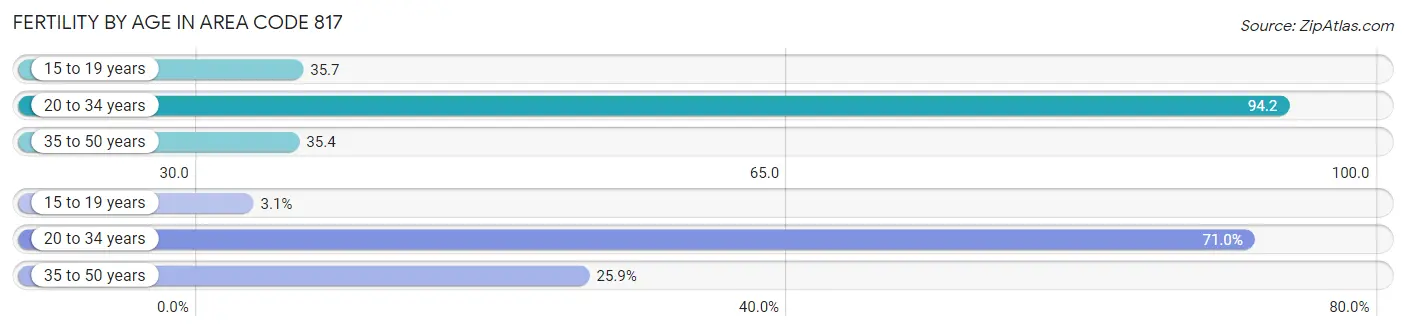
| Age Bracket | Women with Births | Births / 1,000 Women |
| 15 to 19 years | 1,092 (3.1%) | 35.7 |
| 20 to 34 years | 25,089 (71.0%) | 94.2 |
| 35 to 50 years | 9,148 (25.9%) | 35.4 |
| Total | 35,329 (100.0%) | 56.3 |
Fertility by Age by Marriage Status in Area Code 817
68.0% of women with births (35,329) in Area Code 817 are married. The highest percentage of unmarried women with births falls into 15 to 19 years age bracket with 94.7% of them unmarried at the time of birth, while the lowest percentage of unmarried women with births belong to 20 to 34 years age bracket with 32.9% of them unmarried.
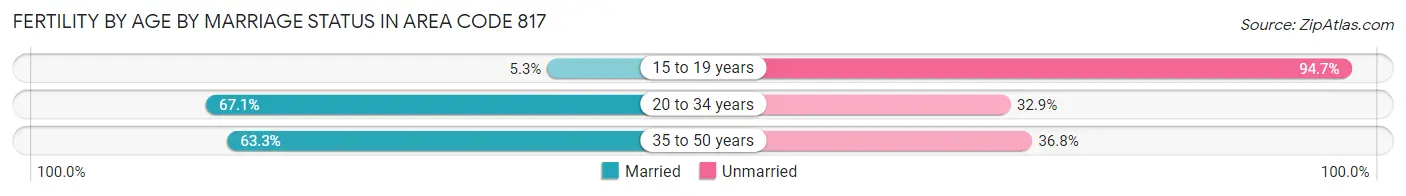
| Age Bracket | Married | Unmarried |
| 15 to 19 years | 58 (5.3%) | 1,034 (94.7%) |
| 20 to 34 years | 16,839 (67.1%) | 8,250 (32.9%) |
| 35 to 50 years | 5,786 (63.2%) | 3,362 (36.7%) |
| Total | 24,012 (68.0%) | 11,317 (32.0%) |
Fertility by Education in Area Code 817
Average fertility rate in Area Code 817 is 56.3 births per 1,000 women. Women with the education attainment of graduate degree have the highest fertility rate of 82.3 births per 1,000 women, while women with the education attainment of less than high school have the lowest fertility at 46.4 births per 1,000 women. Women with the education attainment of college or associate's degree represent 28.4% of all women with births.
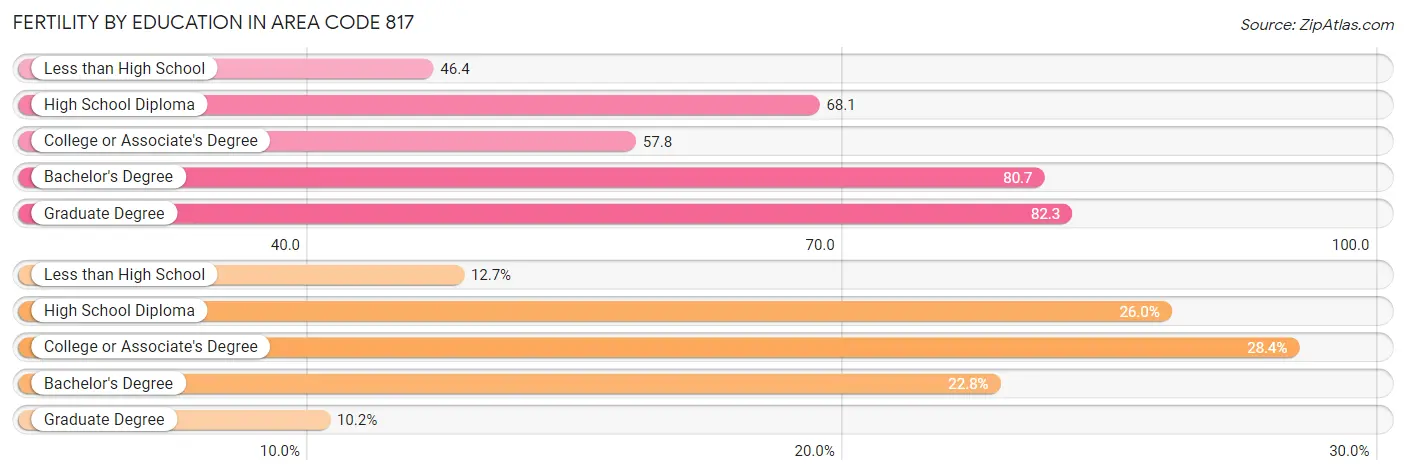
| Educational Attainment | Women with Births | Births / 1,000 Women |
| Less than High School | 4,490 (12.7%) | 46.4 |
| High School Diploma | 9,176 (26.0%) | 68.1 |
| College or Associate's Degree | 10,019 (28.4%) | 57.8 |
| Bachelor's Degree | 8,041 (22.8%) | 80.7 |
| Graduate Degree | 3,603 (10.2%) | 82.3 |
| Total | 35,329 (100.0%) | 56.3 |
Fertility by Education by Marriage Status in Area Code 817
32.0% of women with births in Area Code 817 are unmarried. Women with the educational attainment of bachelor's degree are most likely to be married with 68.7% of them married at childbirth, while women with the educational attainment of less than high school are least likely to be married with 59.2% of them unmarried at childbirth.
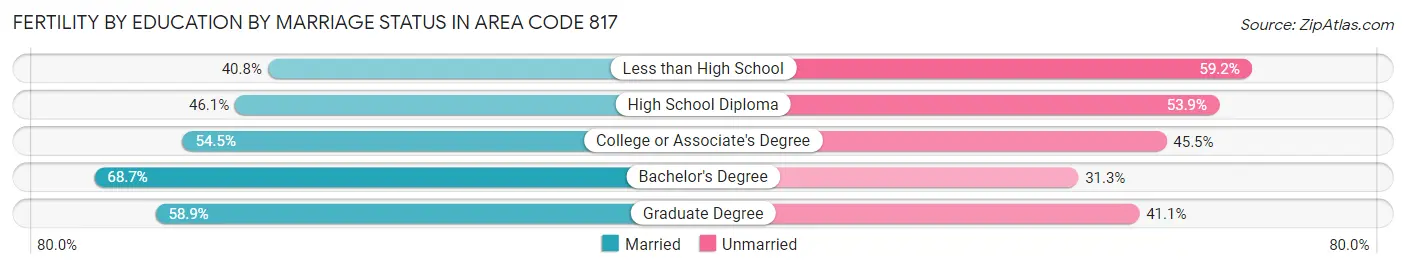
| Educational Attainment | Married | Unmarried |
| Less than High School | 1,832 (40.8%) | 2,658 (59.2%) |
| High School Diploma | 4,227 (46.1%) | 4,949 (53.9%) |
| College or Associate's Degree | 5,463 (54.5%) | 4,556 (45.5%) |
| Bachelor's Degree | 5,527 (68.7%) | 2,514 (31.3%) |
| Graduate Degree | 2,122 (58.9%) | 1,481 (41.1%) |
| Total | 24,012 (68.0%) | 11,317 (32.0%) |
Employment Characteristics in Area Code 817
Employment by Class of Employer in Area Code 817
Among the 1,218,506 employed individuals in Area Code 817, private company employees (886,146 | 72.7%), local government employees (81,987 | 6.7%), and self-employed (not incorporated) (79,627 | 6.5%) make up the most common classes of employment.
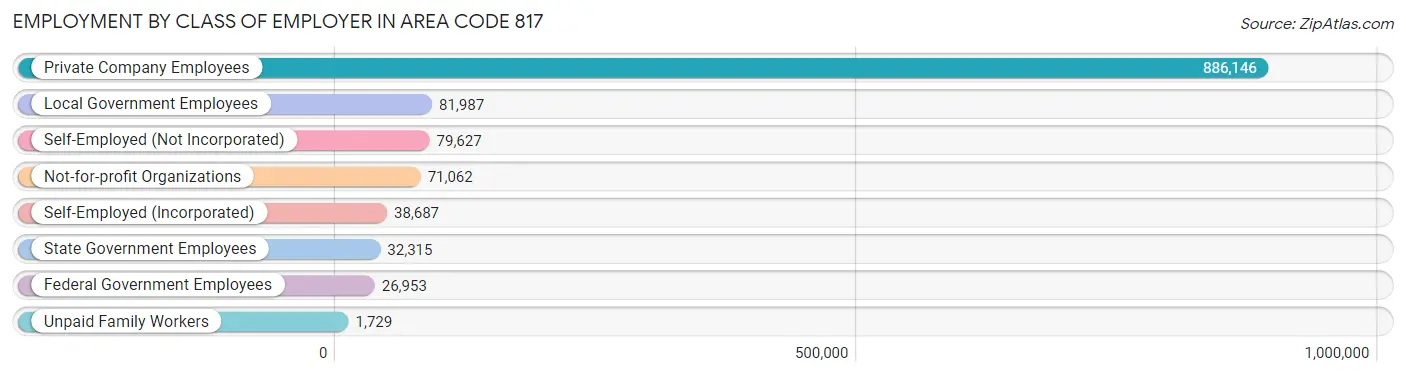
| Employer Class | # Employees | % Employees |
| Private Company Employees | 886,146 | 72.7% |
| Self-Employed (Incorporated) | 38,687 | 3.2% |
| Self-Employed (Not Incorporated) | 79,627 | 6.5% |
| Not-for-profit Organizations | 71,062 | 5.8% |
| Local Government Employees | 81,987 | 6.7% |
| State Government Employees | 32,315 | 2.6% |
| Federal Government Employees | 26,953 | 2.2% |
| Unpaid Family Workers | 1,729 | 0.1% |
| Total | 1,218,506 | 100.0% |
Employment Status by Age in Area Code 817
According to the labor force statistics for Area Code 817, out of the total population over 16 years of age (1,914,762), 66.4% or 1,271,593 individuals are in the labor force, with 5.2% or 66,504 of them unemployed. The age group with the highest labor force participation rate is 30 to 34 years, with 82.6% or 152,134 individuals in the labor force. Within the labor force, the 16 to 19 years age range has the highest percentage of unemployed individuals, with 1,002.3% or 555,044 of them being unemployed.
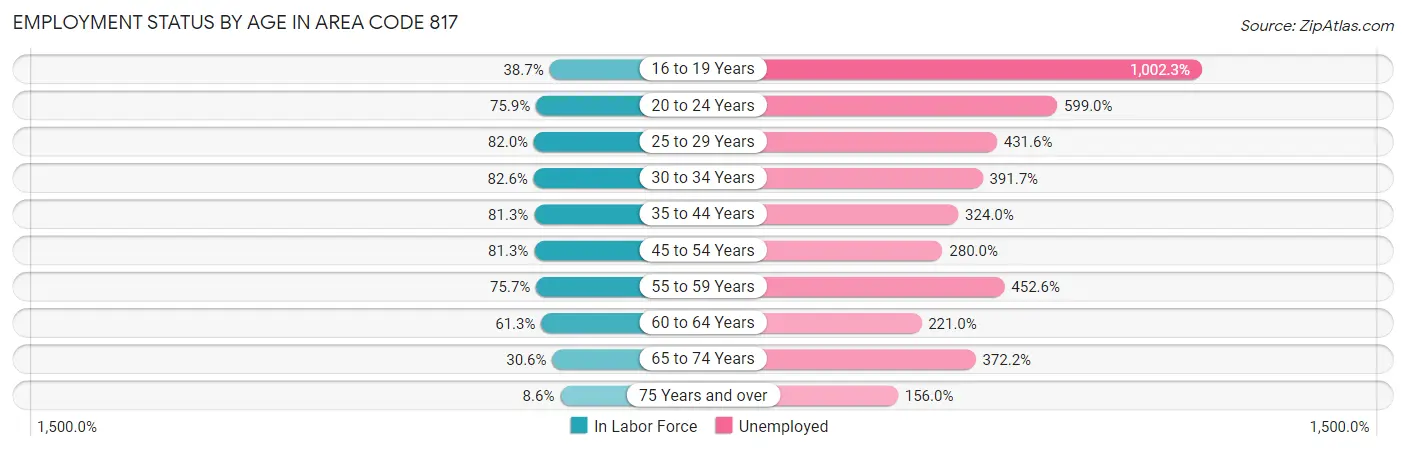
| Age Bracket | In Labor Force | Unemployed |
| 16 to 19 Years | 55,380 (38.7%) | 555,044 (1,002.3%) |
| 20 to 24 Years | 134,758 (75.9%) | 807,230 (599.0%) |
| 25 to 29 Years | 154,048 (82.0%) | 664,906 (431.6%) |
| 30 to 34 Years | 152,133 (82.6%) | 595,909 (391.7%) |
| 35 to 44 Years | 276,424 (81.3%) | 895,559 (324.0%) |
| 45 to 54 Years | 248,108 (81.3%) | 694,711 (280.0%) |
| 55 to 59 Years | 112,573 (75.7%) | 509,510 (452.6%) |
| 60 to 64 Years | 80,245 (61.3%) | 177,335 (221.0%) |
| 65 to 74 Years | 55,776 (30.5%) | 207,606 (372.2%) |
| 75 Years and over | 9,897 (8.6%) | 15,441 (156.0%) |
| Total | 1,271,519 (66.4%) | 66,468 (5.2%) |
Employment Status by Educational Attainment in Area Code 817
According to labor force statistics for Area Code 817, 78.6% of individuals (1,019,570) out of the total population between 25 and 64 years of age (1,296,833) are in the labor force, with 366.2% or 3,733,665 of them being unemployed. The group with the highest labor force participation rate are those with the educational attainment of bachelor's degree or higher, with 86.2% or 365,600 individuals in the labor force. Within the labor force, individuals with college / associate degree education have the highest percentage of unemployment, with 482.4% or 1,449,771 of them being unemployed.
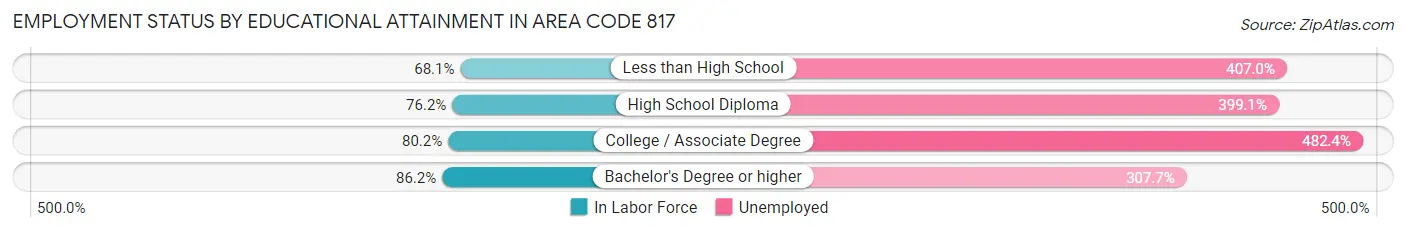
| Educational Attainment | In Labor Force | Unemployed |
| Less than High School | 121,336 (68.0%) | 725,746 (407.0%) |
| High School Diploma | 243,378 (76.2%) | 1,275,340 (399.1%) |
| College / Associate Degree | 300,549 (80.2%) | 1,807,244 (482.4%) |
| Bachelor's Degree or higher | 365,584 (86.2%) | 1,305,654 (307.7%) |
| Total | 1,019,532 (78.6%) | 4,749,002 (366.2%) |
Employment Occupations by Sex in Area Code 817
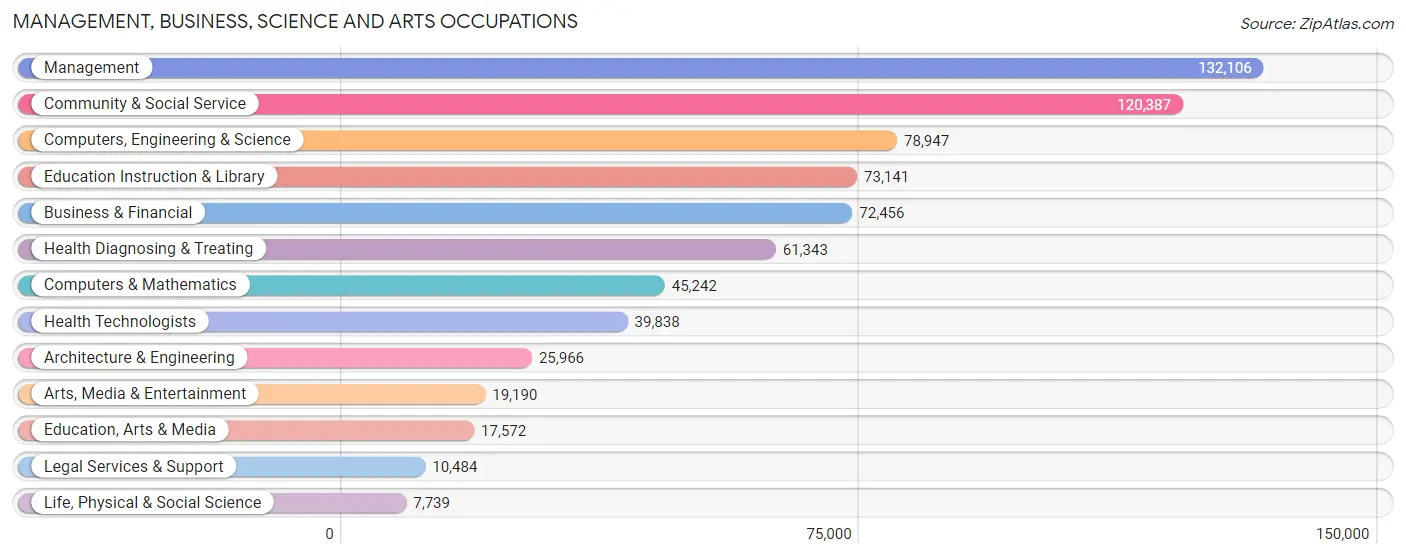
Management, Business, Science and Arts Occupations
The most common Management, Business, Science and Arts occupations in Area Code 817 are Management (132,106 | 10.7%), Community & Social Service (120,387 | 9.7%), Computers, Engineering & Science (78,947 | 6.4%), Education Instruction & Library (73,141 | 5.9%), and Business & Financial (72,456 | 5.9%).
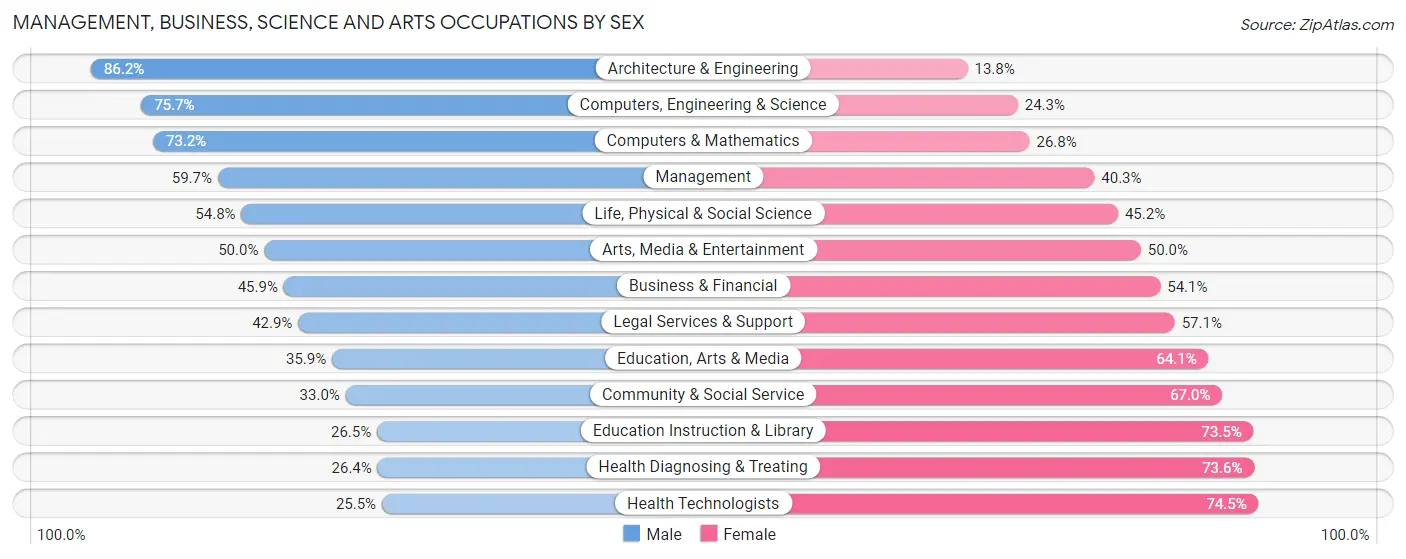
Management, Business, Science and Arts Occupations by Sex
Within the Management, Business, Science and Arts occupations in Area Code 817, the most male-oriented occupations are Architecture & Engineering (86.2%), Computers, Engineering & Science (75.7%), and Computers & Mathematics (73.2%), while the most female-oriented occupations are Health Technologists (74.5%), Health Diagnosing & Treating (73.6%), and Education Instruction & Library (73.5%).
| Occupation | Male | Female |
| Management | 78,871 (59.7%) | 53,235 (40.3%) |
| Business & Financial | 33,284 (45.9%) | 39,172 (54.1%) |
| Computers, Engineering & Science | 59,736 (75.7%) | 19,211 (24.3%) |
| Computers & Mathematics | 33,124 (73.2%) | 12,118 (26.8%) |
| Architecture & Engineering | 22,373 (86.2%) | 3,593 (13.8%) |
| Life, Physical & Social Science | 4,239 (54.8%) | 3,500 (45.2%) |
| Community & Social Service | 39,768 (33.0%) | 80,619 (67.0%) |
| Education, Arts & Media | 6,303 (35.9%) | 11,269 (64.1%) |
| Legal Services & Support | 4,501 (42.9%) | 5,983 (57.1%) |
| Education Instruction & Library | 19,367 (26.5%) | 53,774 (73.5%) |
| Arts, Media & Entertainment | 9,597 (50.0%) | 9,593 (50.0%) |
| Health Diagnosing & Treating | 16,169 (26.4%) | 45,174 (73.6%) |
| Health Technologists | 10,143 (25.5%) | 29,695 (74.5%) |
| Total (Category) | 227,828 (49.0%) | 237,411 (51.0%) |
| Total (Overall) | 674,697 (54.5%) | 562,953 (45.5%) |
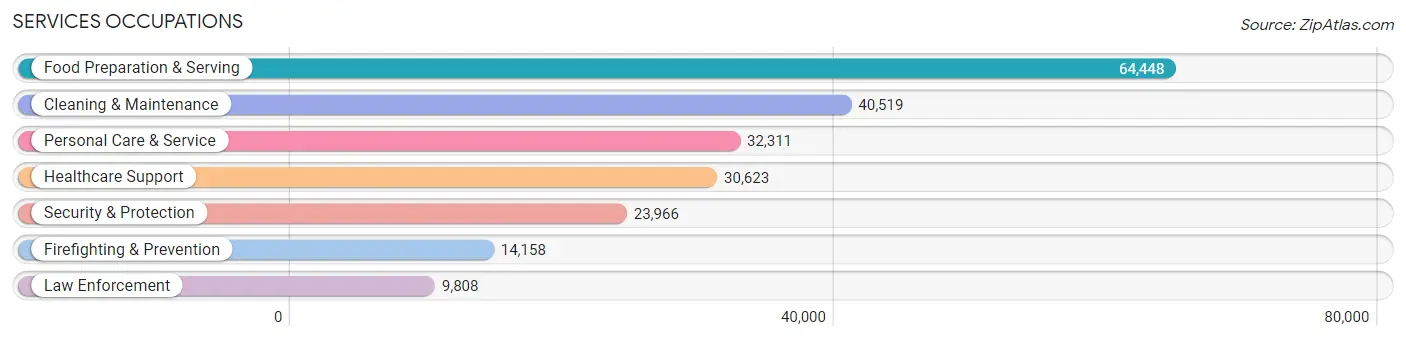
Services Occupations
The most common Services occupations in Area Code 817 are Food Preparation & Serving (64,448 | 5.2%), Cleaning & Maintenance (40,519 | 3.3%), Personal Care & Service (32,311 | 2.6%), Healthcare Support (30,623 | 2.5%), and Security & Protection (23,966 | 1.9%).
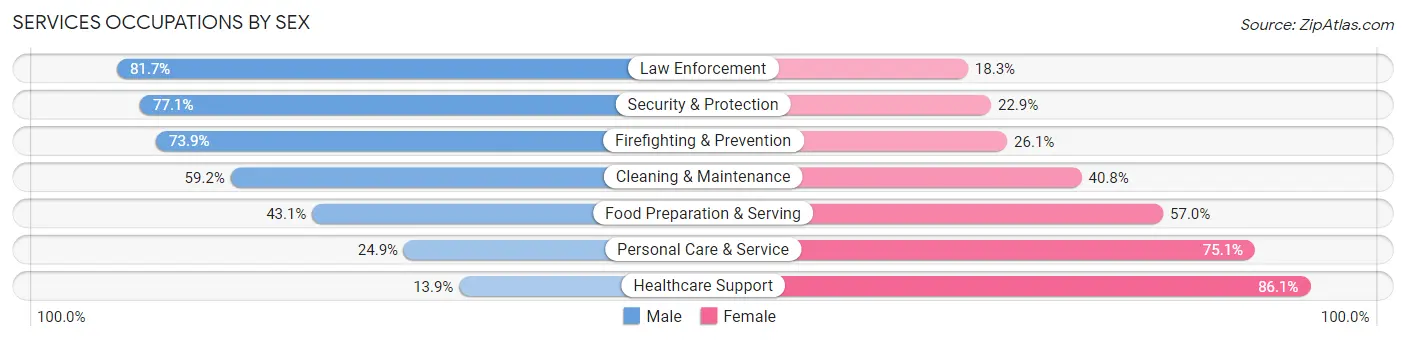
Services Occupations by Sex
Within the Services occupations in Area Code 817, the most male-oriented occupations are Law Enforcement (81.7%), Security & Protection (77.1%), and Firefighting & Prevention (73.9%), while the most female-oriented occupations are Healthcare Support (86.1%), Personal Care & Service (75.1%), and Food Preparation & Serving (57.0%).
| Occupation | Male | Female |
| Healthcare Support | 4,268 (13.9%) | 26,355 (86.1%) |
| Security & Protection | 18,482 (77.1%) | 5,484 (22.9%) |
| Firefighting & Prevention | 10,468 (73.9%) | 3,690 (26.1%) |
| Law Enforcement | 8,014 (81.7%) | 1,794 (18.3%) |
| Food Preparation & Serving | 27,745 (43.0%) | 36,703 (57.0%) |
| Cleaning & Maintenance | 23,986 (59.2%) | 16,533 (40.8%) |
| Personal Care & Service | 8,042 (24.9%) | 24,269 (75.1%) |
| Total (Category) | 82,523 (43.0%) | 109,344 (57.0%) |
| Total (Overall) | 674,697 (54.5%) | 562,953 (45.5%) |
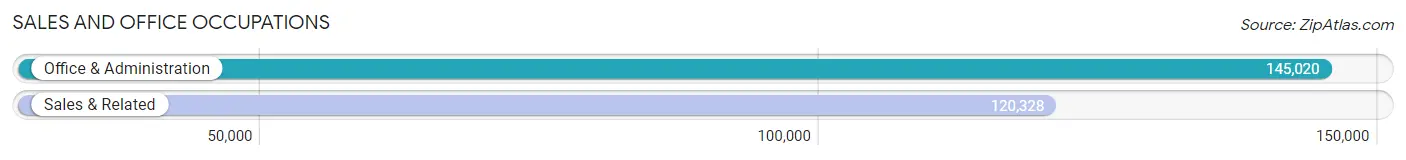
Sales and Office Occupations
The most common Sales and Office occupations in Area Code 817 are Office & Administration (145,020 | 11.7%), and Sales & Related (120,328 | 9.7%).
Sales and Office Occupations by Sex
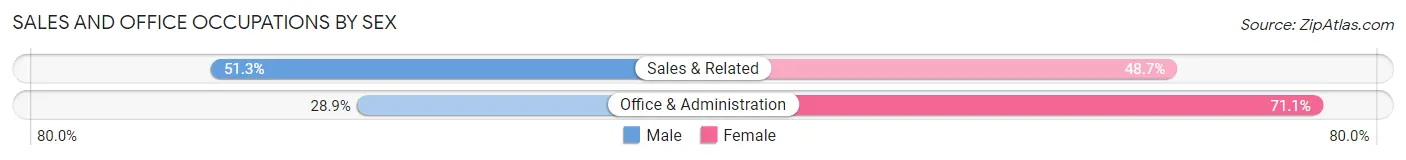
| Occupation | Male | Female |
| Sales & Related | 61,747 (51.3%) | 58,581 (48.7%) |
| Office & Administration | 41,933 (28.9%) | 103,087 (71.1%) |
| Total (Category) | 103,680 (39.1%) | 161,668 (60.9%) |
| Total (Overall) | 674,697 (54.5%) | 562,953 (45.5%) |
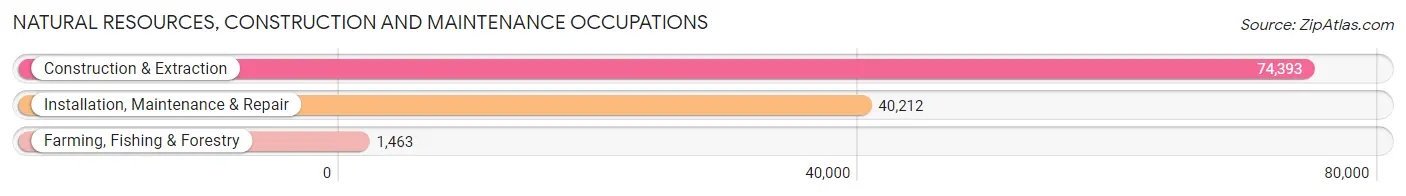
Natural Resources, Construction and Maintenance Occupations
The most common Natural Resources, Construction and Maintenance occupations in Area Code 817 are Construction & Extraction (74,393 | 6.0%), Installation, Maintenance & Repair (40,212 | 3.3%), and Farming, Fishing & Forestry (1,463 | 0.1%).
Natural Resources, Construction and Maintenance Occupations by Sex
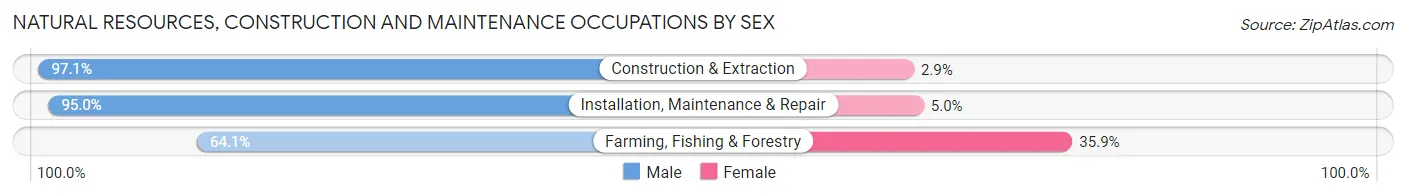
| Occupation | Male | Female |
| Farming, Fishing & Forestry | 938 (64.1%) | 525 (35.9%) |
| Construction & Extraction | 72,220 (97.1%) | 2,173 (2.9%) |
| Installation, Maintenance & Repair | 38,213 (95.0%) | 1,999 (5.0%) |
| Total (Category) | 111,371 (96.0%) | 4,697 (4.1%) |
| Total (Overall) | 674,697 (54.5%) | 562,953 (45.5%) |
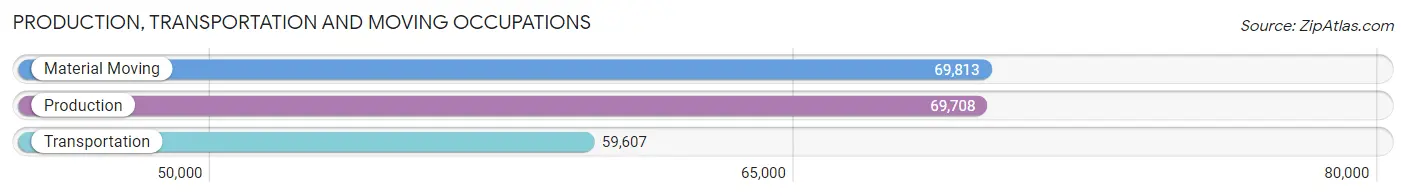
Production, Transportation and Moving Occupations
The most common Production, Transportation and Moving occupations in Area Code 817 are Material Moving (69,813 | 5.6%), Production (69,708 | 5.6%), and Transportation (59,607 | 4.8%).
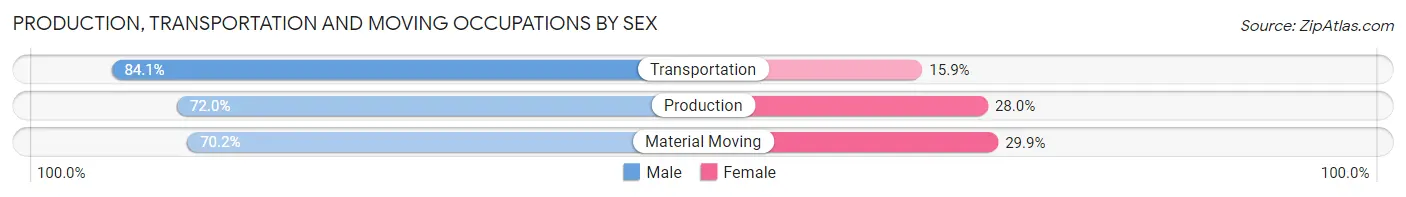
Production, Transportation and Moving Occupations by Sex
| Occupation | Male | Female |
| Production | 50,212 (72.0%) | 19,496 (28.0%) |
| Transportation | 50,108 (84.1%) | 9,499 (15.9%) |
| Material Moving | 48,975 (70.2%) | 20,838 (29.8%) |
| Total (Category) | 149,295 (75.0%) | 49,833 (25.0%) |
| Total (Overall) | 674,697 (54.5%) | 562,953 (45.5%) |
Employment Industries by Sex in Area Code 817
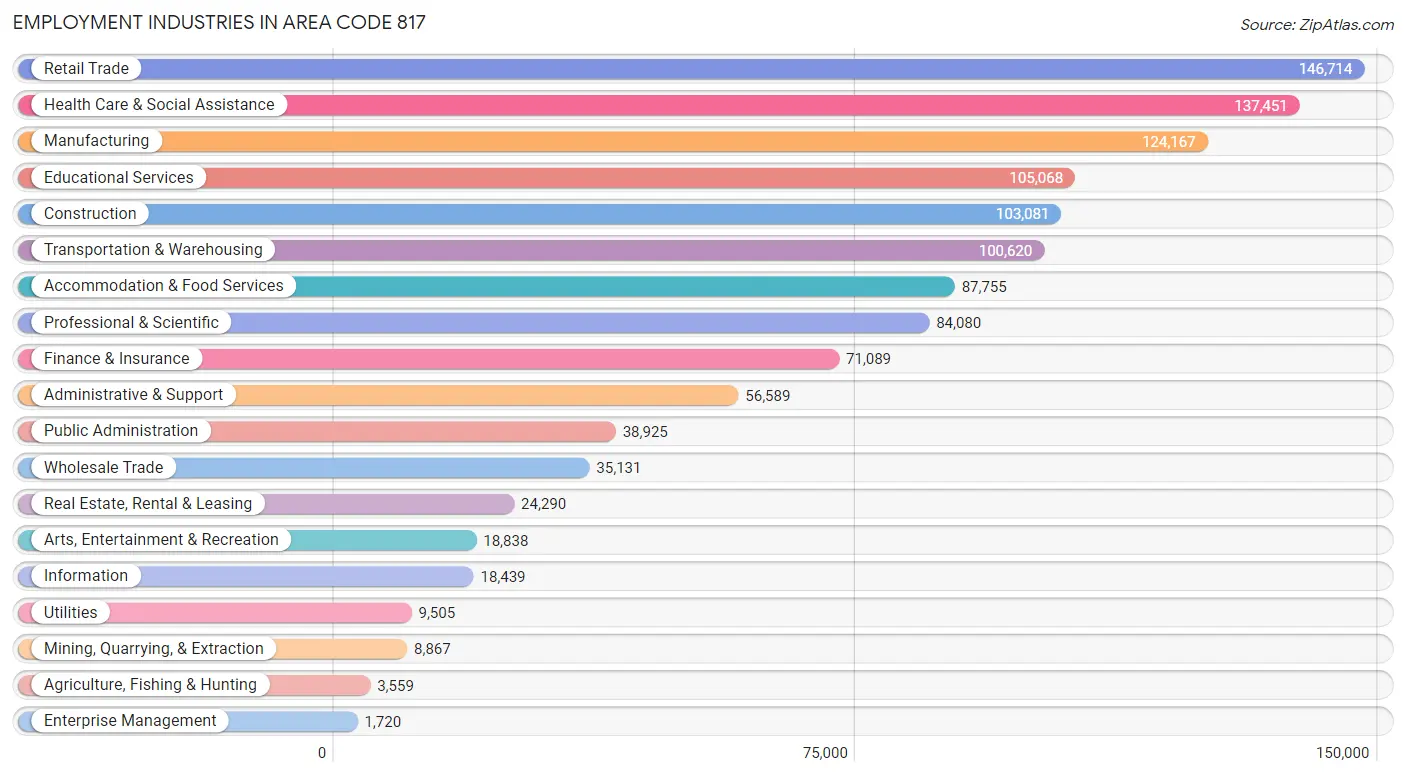
Employment Industries in Area Code 817
The major employment industries in Area Code 817 include Retail Trade (146,714 | 11.8%), Health Care & Social Assistance (137,451 | 11.1%), Manufacturing (124,167 | 10.0%), Educational Services (105,068 | 8.5%), and Construction (103,081 | 8.3%).
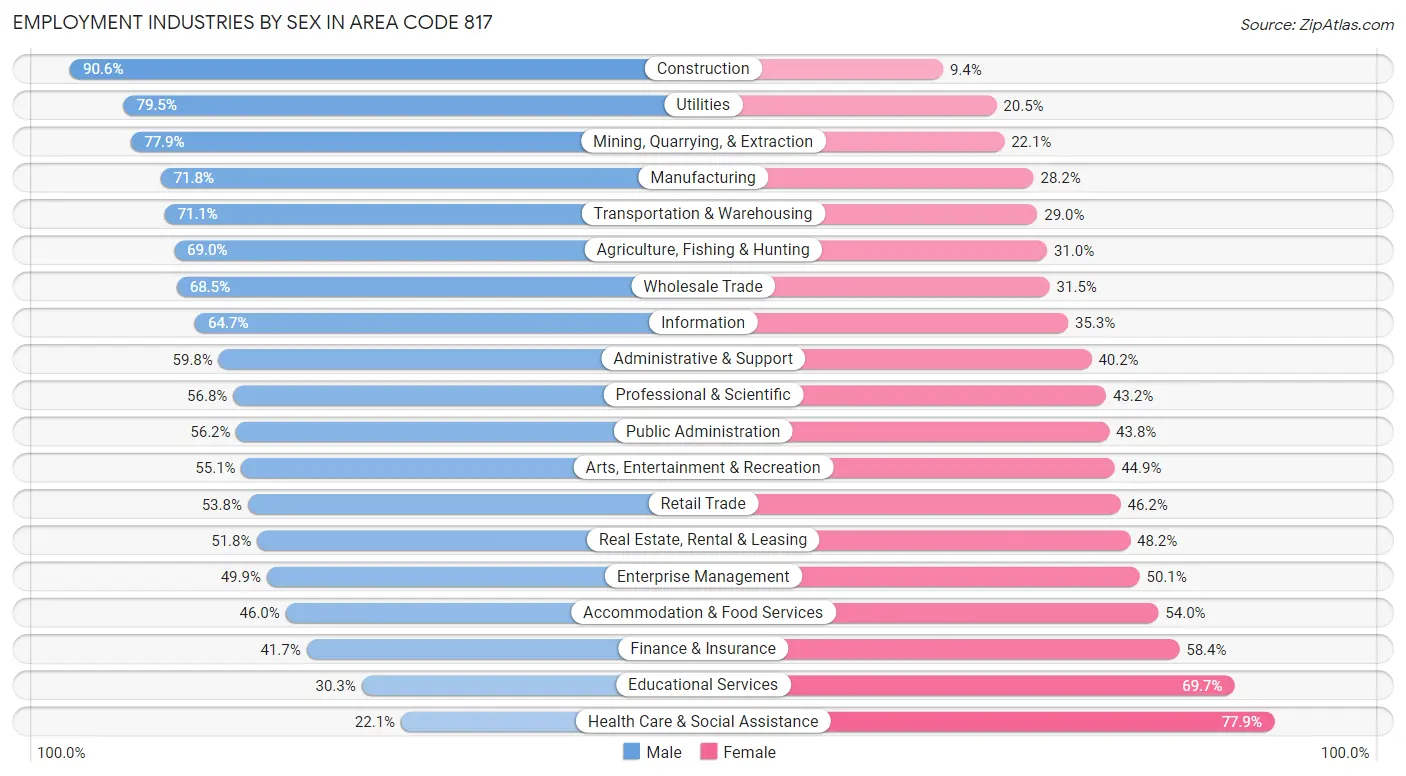
Employment Industries by Sex in Area Code 817
The Area Code 817 industries that see more men than women are Construction (90.6%), Utilities (79.5%), and Mining, Quarrying, & Extraction (77.9%), whereas the industries that tend to have a higher number of women are Health Care & Social Assistance (77.9%), Educational Services (69.7%), and Finance & Insurance (58.4%).
| Industry | Male | Female |
| Agriculture, Fishing & Hunting | 2,457 (69.0%) | 1,102 (31.0%) |
| Mining, Quarrying, & Extraction | 6,907 (77.9%) | 1,960 (22.1%) |
| Construction | 93,375 (90.6%) | 9,706 (9.4%) |
| Manufacturing | 89,171 (71.8%) | 34,996 (28.2%) |
| Wholesale Trade | 24,060 (68.5%) | 11,071 (31.5%) |
| Retail Trade | 78,965 (53.8%) | 67,749 (46.2%) |
| Transportation & Warehousing | 71,495 (71.1%) | 29,125 (28.9%) |
| Utilities | 7,557 (79.5%) | 1,948 (20.5%) |
| Information | 11,928 (64.7%) | 6,511 (35.3%) |
| Finance & Insurance | 29,610 (41.6%) | 41,479 (58.4%) |
| Real Estate, Rental & Leasing | 12,593 (51.8%) | 11,697 (48.2%) |
| Professional & Scientific | 47,780 (56.8%) | 36,300 (43.2%) |
| Enterprise Management | 858 (49.9%) | 862 (50.1%) |
| Administrative & Support | 33,863 (59.8%) | 22,726 (40.2%) |
| Educational Services | 31,797 (30.3%) | 73,271 (69.7%) |
| Health Care & Social Assistance | 30,396 (22.1%) | 107,055 (77.9%) |
| Arts, Entertainment & Recreation | 10,383 (55.1%) | 8,455 (44.9%) |
| Accommodation & Food Services | 40,352 (46.0%) | 47,403 (54.0%) |
| Public Administration | 21,863 (56.2%) | 17,062 (43.8%) |
| Total | 674,697 (54.5%) | 562,953 (45.5%) |
Education in Area Code 817
School Enrollment in Area Code 817
The most common levels of schooling among the 650,732 students in Area Code 817 are high school (143,071 | 22.0%), middle school (140,640 | 21.6%), and elementary school (132,251 | 20.3%).
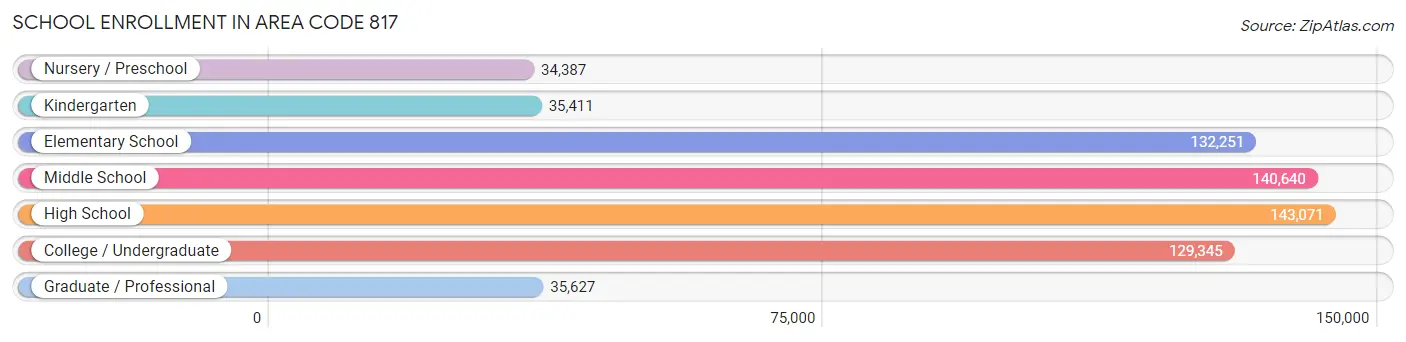
| School Level | # Students | % Students |
| Nursery / Preschool | 34,387 | 5.3% |
| Kindergarten | 35,411 | 5.4% |
| Elementary School | 132,251 | 20.3% |
| Middle School | 140,640 | 21.6% |
| High School | 143,071 | 22.0% |
| College / Undergraduate | 129,345 | 19.9% |
| Graduate / Professional | 35,627 | 5.5% |
| Total | 650,732 | 100.0% |
School Enrollment by Age by Funding Source in Area Code 817
Out of a total of 650,732 students who are enrolled in schools in Area Code 817, 86,467 (13.3%) attend a private institution, while the remaining 564,265 (86.7%) are enrolled in public schools. The age group of 3 to 4 year olds has the highest likelihood of being enrolled in private schools, with 10,003 (37.5% in the age bracket) enrolled. Conversely, the age group of 15 to 17 year olds has the lowest likelihood of being enrolled in a private school, with 94,733 (92.1% in the age bracket) attending a public institution.
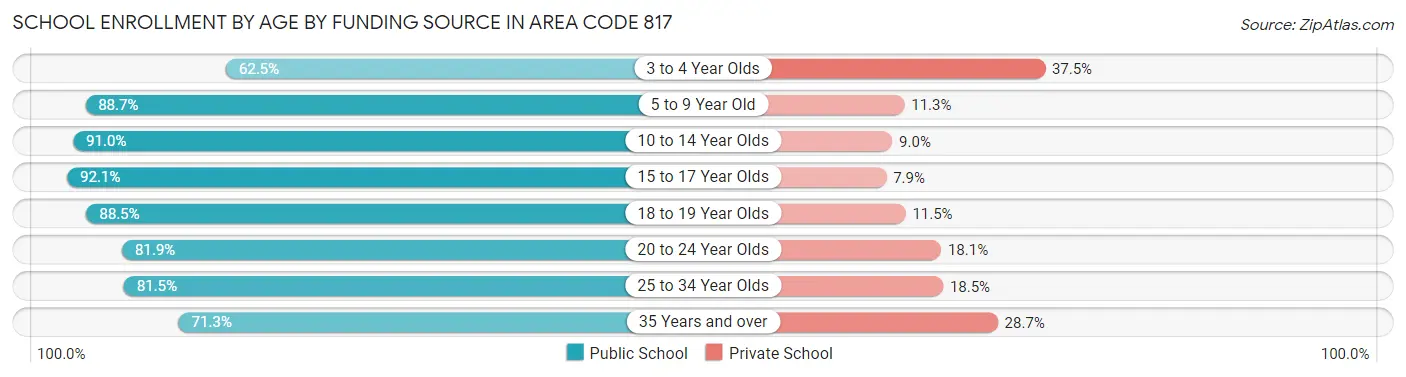
| Age Bracket | Public School | Private School |
| 3 to 4 Year Olds | 16,677 (62.5%) | 10,003 (37.5%) |
| 5 to 9 Year Old | 140,126 (88.7%) | 17,835 (11.3%) |
| 10 to 14 Year Olds | 159,192 (91.0%) | 15,800 (9.0%) |
| 15 to 17 Year Olds | 94,733 (92.1%) | 8,160 (7.9%) |
| 18 to 19 Year Olds | 42,331 (88.5%) | 5,508 (11.5%) |
| 20 to 24 Year Olds | 53,438 (81.9%) | 11,835 (18.1%) |
| 25 to 34 Year Olds | 34,051 (81.5%) | 7,725 (18.5%) |
| 35 Years and over | 23,762 (71.3%) | 9,556 (28.7%) |
| Total | 564,265 (86.7%) | 86,467 (13.3%) |
Educational Attainment by Field of Study in Area Code 817
Business (134,250 | 24.6%), education (56,857 | 10.4%), science & technology (51,522 | 9.4%), engineering (45,749 | 8.4%), and arts & humanities (35,587 | 6.5%) are the most common fields of study among 545,523 individuals in Area Code 817 who have obtained a bachelor's degree or higher.
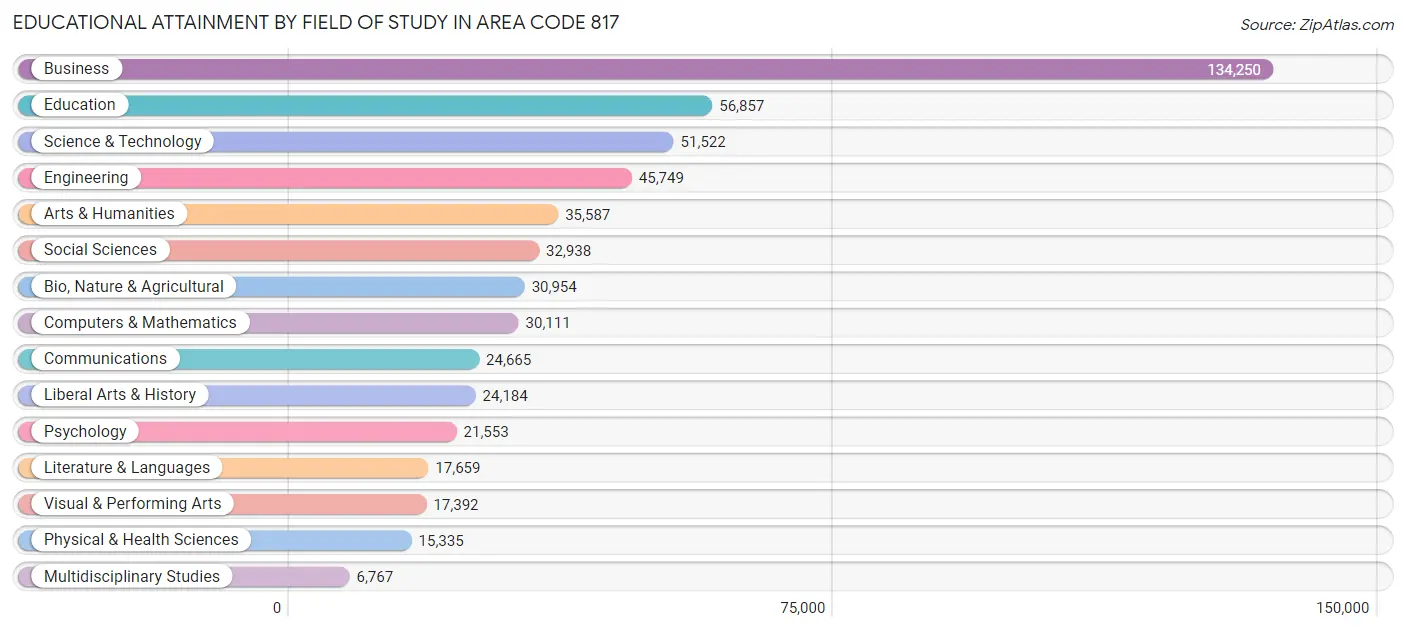
| Field of Study | # Graduates | % Graduates |
| Computers & Mathematics | 30,111 | 5.5% |
| Bio, Nature & Agricultural | 30,954 | 5.7% |
| Physical & Health Sciences | 15,335 | 2.8% |
| Psychology | 21,553 | 4.0% |
| Social Sciences | 32,938 | 6.0% |
| Engineering | 45,749 | 8.4% |
| Multidisciplinary Studies | 6,767 | 1.2% |
| Science & Technology | 51,522 | 9.4% |
| Business | 134,250 | 24.6% |
| Education | 56,857 | 10.4% |
| Literature & Languages | 17,659 | 3.2% |
| Liberal Arts & History | 24,184 | 4.4% |
| Visual & Performing Arts | 17,392 | 3.2% |
| Communications | 24,665 | 4.5% |
| Arts & Humanities | 35,587 | 6.5% |
| Total | 545,523 | 100.0% |
Transportation & Commute in Area Code 817
Vehicle Availability by Sex in Area Code 817
The most prevalent vehicle ownership categories in Area Code 817 are males with 2 vehicles (293,858, accounting for 44.2%) and females with 2 vehicles (230,826, making up 53.7%).
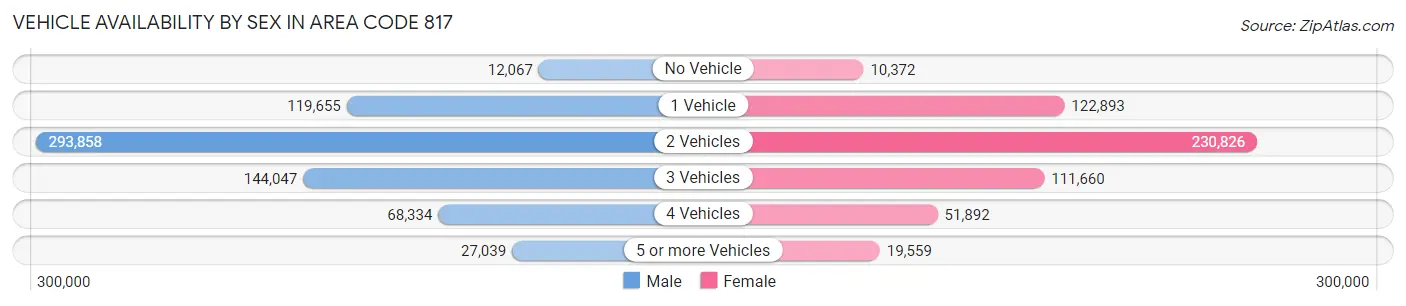
| Vehicles Available | Male | Female |
| No Vehicle | 12,067 (1.8%) | 10,372 (1.9%) |
| 1 Vehicle | 119,655 (18.0%) | 122,893 (22.5%) |
| 2 Vehicles | 293,858 (44.2%) | 230,826 (42.2%) |
| 3 Vehicles | 144,047 (21.7%) | 111,660 (20.4%) |
| 4 Vehicles | 68,334 (10.3%) | 51,892 (9.5%) |
| 5 or more Vehicles | 27,039 (4.1%) | 19,559 (3.6%) |
| Total | 665,000 (100.0%) | 547,202 (100.0%) |
Commute Time in Area Code 817
The most frequently occuring commute durations in Area Code 817 are 30 to 34 minutes (176,749 commuters, 16.3%), 20 to 24 minutes (166,796 commuters, 15.4%), and 15 to 19 minutes (160,454 commuters, 14.8%).
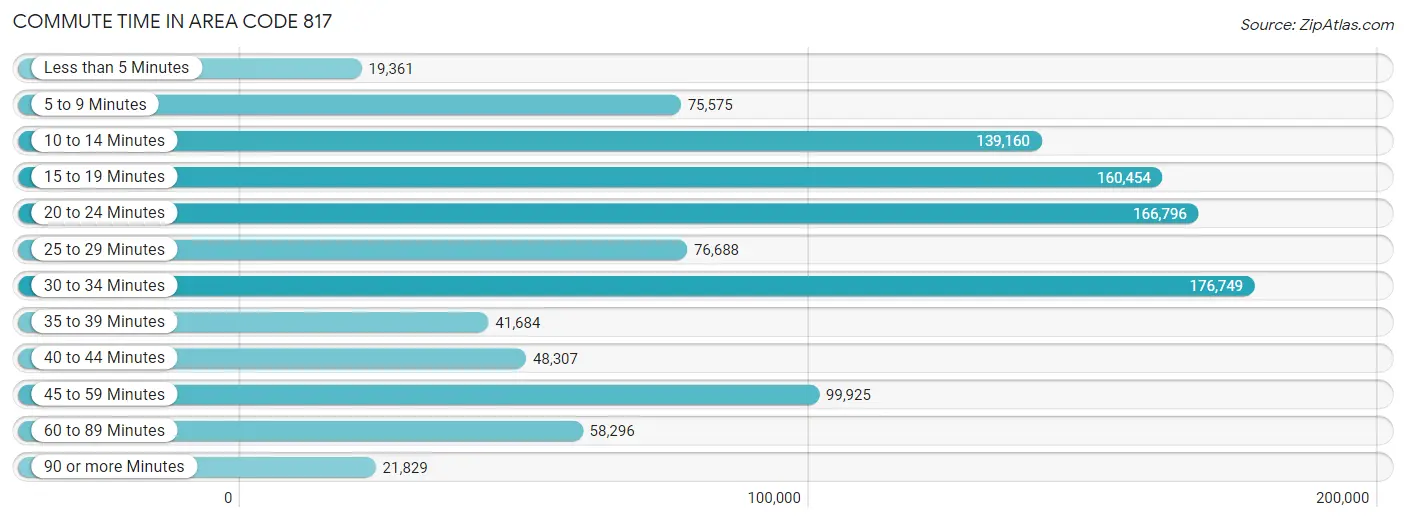
| Commute Time | # Commuters | % Commuters |
| Less than 5 Minutes | 19,361 | 1.8% |
| 5 to 9 Minutes | 75,575 | 7.0% |
| 10 to 14 Minutes | 139,160 | 12.8% |
| 15 to 19 Minutes | 160,454 | 14.8% |
| 20 to 24 Minutes | 166,796 | 15.4% |
| 25 to 29 Minutes | 76,688 | 7.1% |
| 30 to 34 Minutes | 176,749 | 16.3% |
| 35 to 39 Minutes | 41,684 | 3.8% |
| 40 to 44 Minutes | 48,307 | 4.4% |
| 45 to 59 Minutes | 99,925 | 9.2% |
| 60 to 89 Minutes | 58,296 | 5.4% |
| 90 or more Minutes | 21,829 | 2.0% |
Commute Time by Sex in Area Code 817
The most common commute times in Area Code 817 are 30 to 34 minutes (104,937 commuters, 17.4%) for males and 15 to 19 minutes (77,737 commuters, 16.2%) for females.
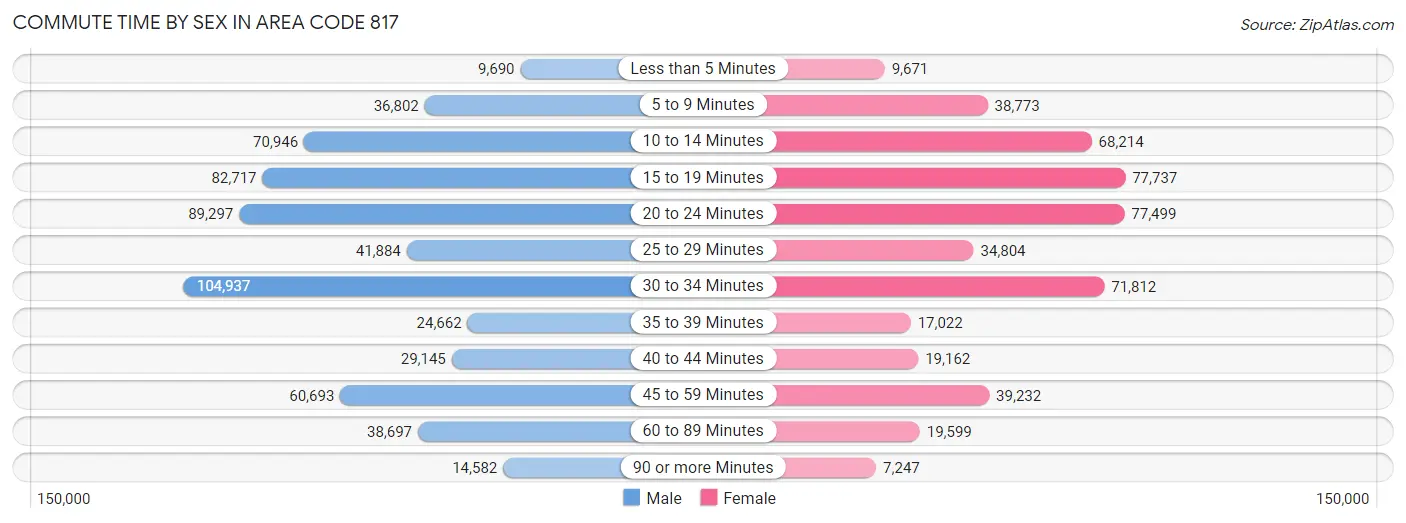
| Commute Time | Male | Female |
| Less than 5 Minutes | 9,690 (1.6%) | 9,671 (2.0%) |
| 5 to 9 Minutes | 36,802 (6.1%) | 38,773 (8.1%) |
| 10 to 14 Minutes | 70,946 (11.7%) | 68,214 (14.2%) |
| 15 to 19 Minutes | 82,717 (13.7%) | 77,737 (16.2%) |
| 20 to 24 Minutes | 89,297 (14.8%) | 77,499 (16.1%) |
| 25 to 29 Minutes | 41,884 (6.9%) | 34,804 (7.2%) |
| 30 to 34 Minutes | 104,937 (17.4%) | 71,812 (14.9%) |
| 35 to 39 Minutes | 24,662 (4.1%) | 17,022 (3.5%) |
| 40 to 44 Minutes | 29,145 (4.8%) | 19,162 (4.0%) |
| 45 to 59 Minutes | 60,693 (10.1%) | 39,232 (8.2%) |
| 60 to 89 Minutes | 38,697 (6.4%) | 19,599 (4.1%) |
| 90 or more Minutes | 14,582 (2.4%) | 7,247 (1.5%) |
Time of Departure to Work by Sex in Area Code 817
The most frequent times of departure to work in Area Code 817 are 7:00 AM to 7:29 AM (90,504, 15.0%) for males and 7:00 AM to 7:29 AM (79,707, 16.6%) for females.
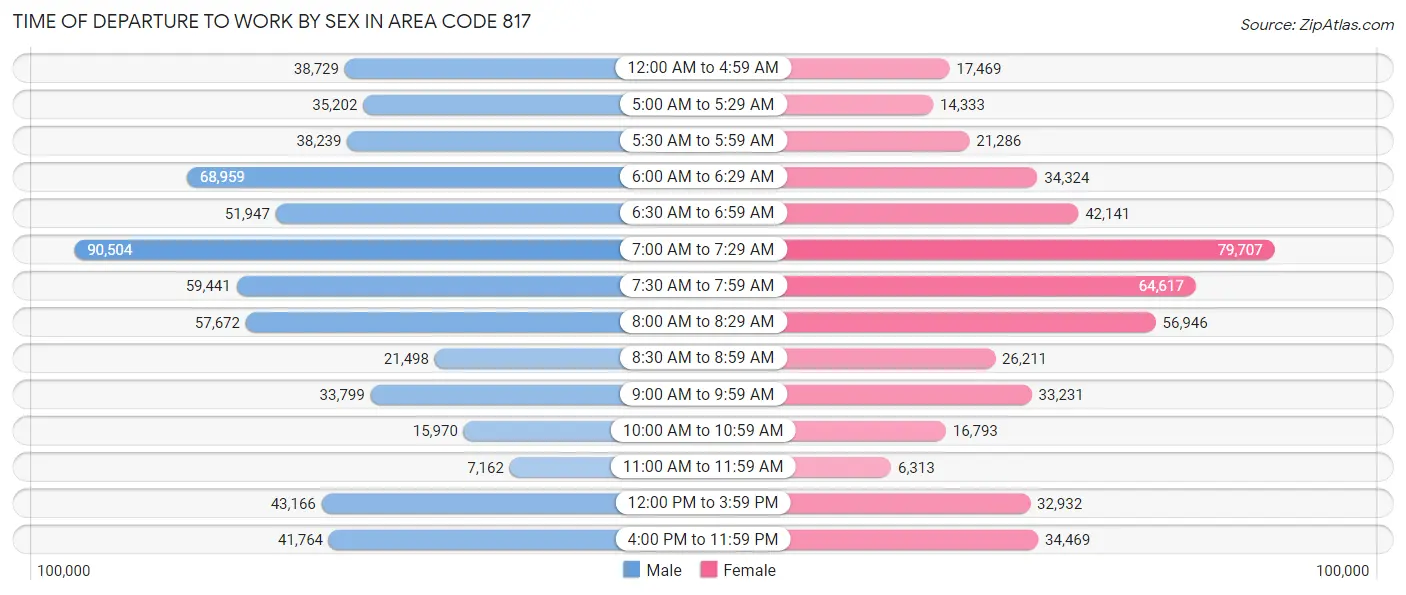
| Time of Departure | Male | Female |
| 12:00 AM to 4:59 AM | 38,729 (6.4%) | 17,469 (3.6%) |
| 5:00 AM to 5:29 AM | 35,202 (5.8%) | 14,333 (3.0%) |
| 5:30 AM to 5:59 AM | 38,239 (6.3%) | 21,286 (4.4%) |
| 6:00 AM to 6:29 AM | 68,959 (11.4%) | 34,324 (7.1%) |
| 6:30 AM to 6:59 AM | 51,947 (8.6%) | 42,141 (8.8%) |
| 7:00 AM to 7:29 AM | 90,504 (15.0%) | 79,707 (16.6%) |
| 7:30 AM to 7:59 AM | 59,441 (9.8%) | 64,617 (13.4%) |
| 8:00 AM to 8:29 AM | 57,672 (9.6%) | 56,946 (11.8%) |
| 8:30 AM to 8:59 AM | 21,498 (3.6%) | 26,211 (5.4%) |
| 9:00 AM to 9:59 AM | 33,799 (5.6%) | 33,231 (6.9%) |
| 10:00 AM to 10:59 AM | 15,970 (2.6%) | 16,793 (3.5%) |
| 11:00 AM to 11:59 AM | 7,162 (1.2%) | 6,313 (1.3%) |
| 12:00 PM to 3:59 PM | 43,166 (7.1%) | 32,932 (6.9%) |
| 4:00 PM to 11:59 PM | 41,764 (6.9%) | 34,469 (7.2%) |
| Total | 604,052 (100.0%) | 480,772 (100.0%) |
Housing Occupancy in Area Code 817
Occupancy by Ownership in Area Code 817
Of the total 889,303 dwellings in Area Code 817, owner-occupied units account for 518,013 (58.3%), while renter-occupied units make up 371,290 (41.7%).
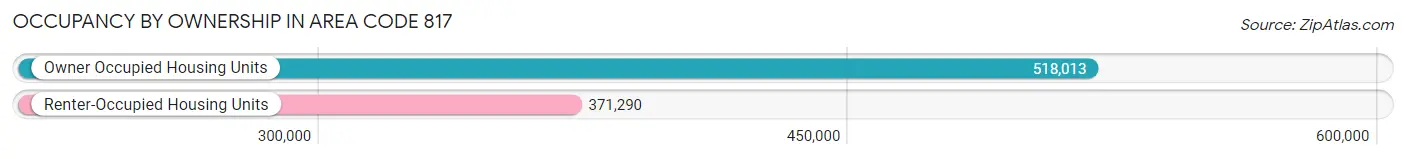
| Occupancy | # Housing Units | % Housing Units |
| Owner Occupied Housing Units | 518,013 | 58.3% |
| Renter-Occupied Housing Units | 371,290 | 41.7% |
| Total Occupied Housing Units | 889,303 | 100.0% |
Occupancy by Household Size in Area Code 817
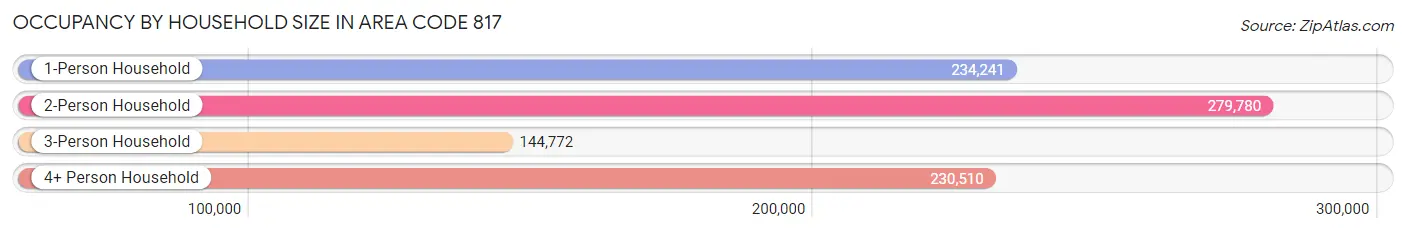
| Household Size | # Housing Units | % Housing Units |
| 1-Person Household | 234,241 | 26.3% |
| 2-Person Household | 279,780 | 31.5% |
| 3-Person Household | 144,772 | 16.3% |
| 4+ Person Household | 230,510 | 25.9% |
| Total Housing Units | 889,303 | 100.0% |
Occupancy by Ownership by Household Size in Area Code 817
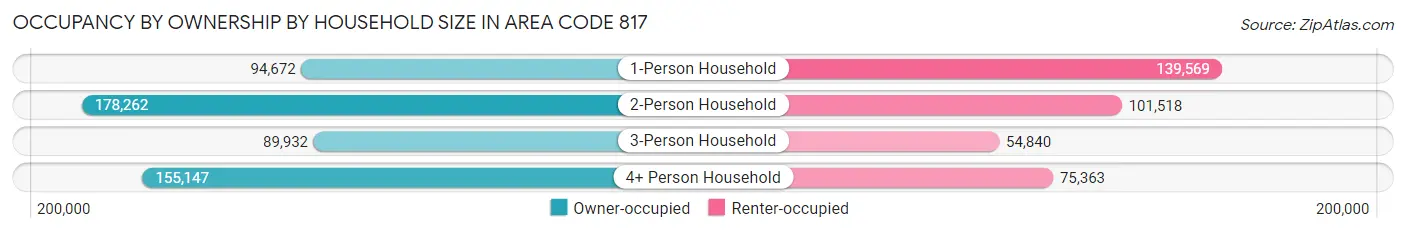
| Household Size | Owner-occupied | Renter-occupied |
| 1-Person Household | 94,672 (40.4%) | 139,569 (59.6%) |
| 2-Person Household | 178,262 (63.7%) | 101,518 (36.3%) |
| 3-Person Household | 89,932 (62.1%) | 54,840 (37.9%) |
| 4+ Person Household | 155,147 (67.3%) | 75,363 (32.7%) |
| Total Housing Units | 518,013 (58.3%) | 371,290 (41.7%) |
Occupancy by Educational Attainment in Area Code 817
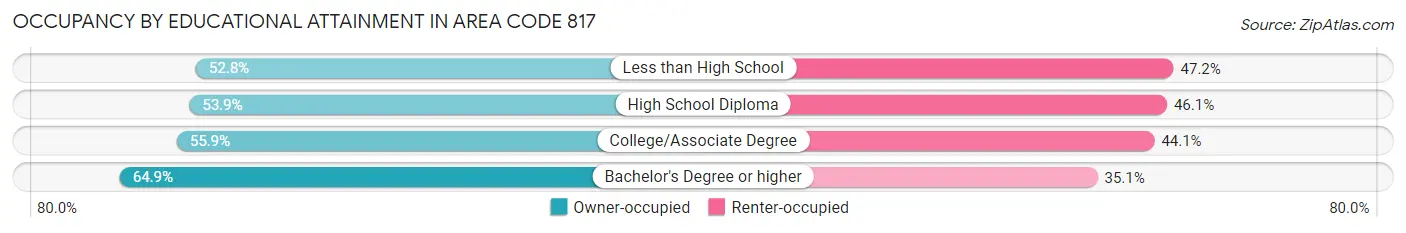
| Household Size | Owner-occupied | Renter-occupied |
| Less than High School | 54,456 (52.8%) | 48,637 (47.2%) |
| High School Diploma | 106,215 (53.9%) | 90,955 (46.1%) |
| College/Associate Degree | 153,974 (55.9%) | 121,679 (44.1%) |
| Bachelor's Degree or higher | 203,368 (64.9%) | 110,019 (35.1%) |
Occupancy by Age of Householder in Area Code 817
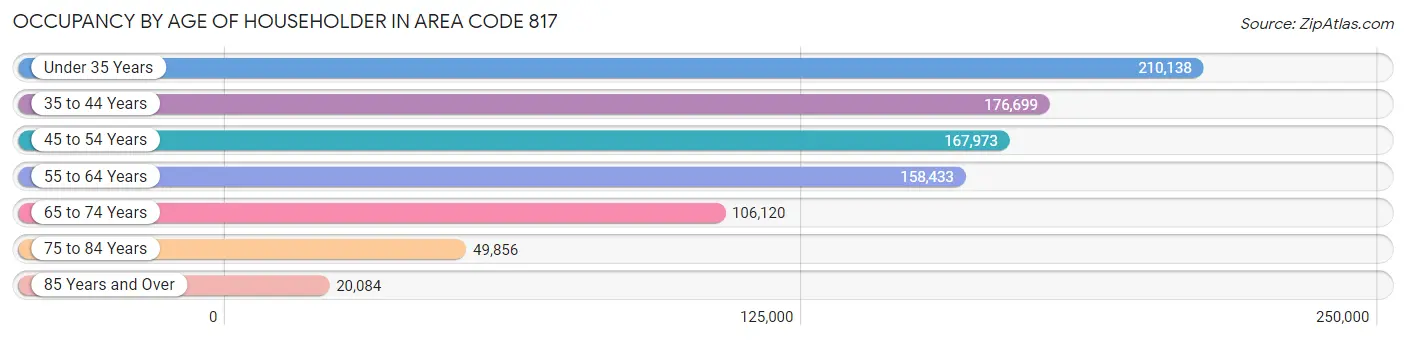
| Age Bracket | # Households | % Households |
| Under 35 Years | 210,138 | 23.6% |
| 35 to 44 Years | 176,699 | 19.9% |
| 45 to 54 Years | 167,973 | 18.9% |
| 55 to 64 Years | 158,433 | 17.8% |
| 65 to 74 Years | 106,120 | 11.9% |
| 75 to 84 Years | 49,856 | 5.6% |
| 85 Years and Over | 20,084 | 2.3% |
| Total | 889,303 | 100.0% |
Housing Finances in Area Code 817
Median Income by Occupancy in Area Code 817
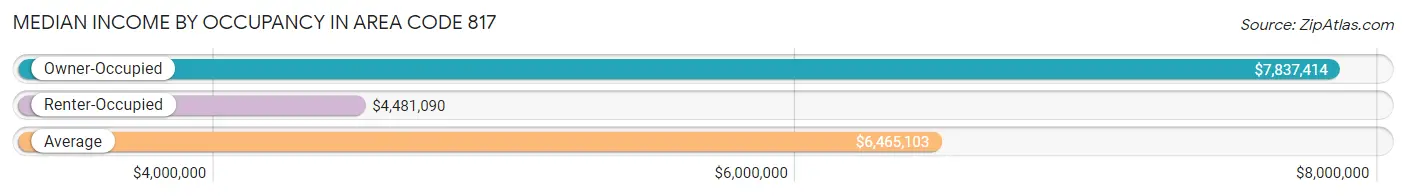
| Occupancy Type | # Households | Median Income |
| Owner-Occupied | 518,013 (58.3%) | $7,837,414 |
| Renter-Occupied | 371,290 (41.7%) | $4,481,090 |
| Average | 889,303 (100.0%) | $6,465,103 |
Occupancy by Householder Income Bracket in Area Code 817
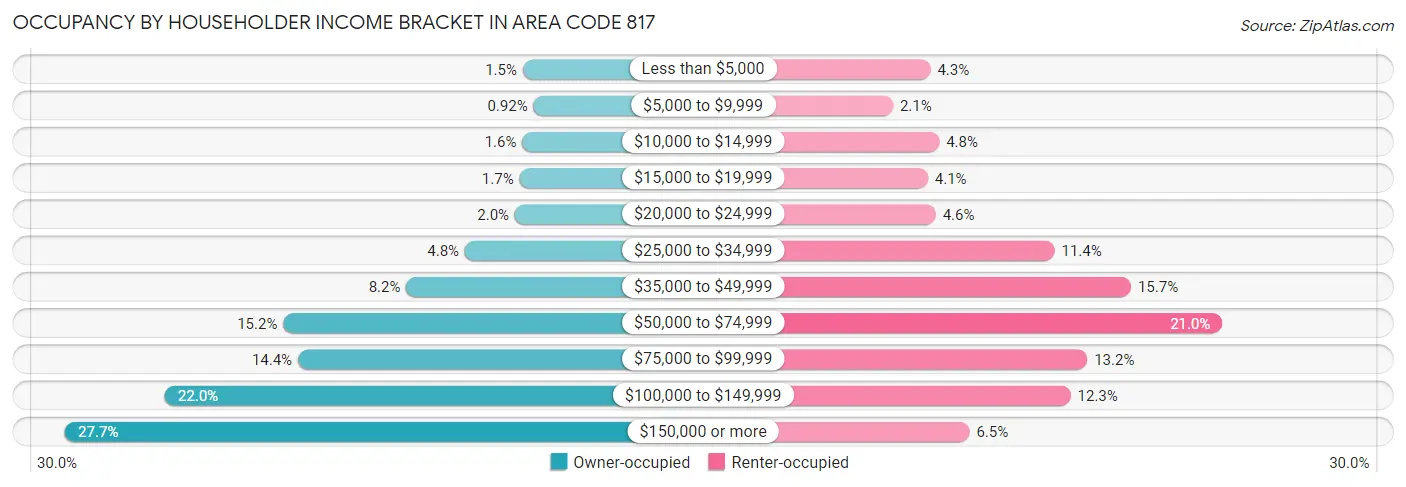
| Income Bracket | Owner-occupied | Renter-occupied |
| Less than $5,000 | 7,910 (1.5%) | 15,889 (4.3%) |
| $5,000 to $9,999 | 4,761 (0.9%) | 7,943 (2.1%) |
| $10,000 to $14,999 | 8,078 (1.6%) | 17,731 (4.8%) |
| $15,000 to $19,999 | 8,912 (1.7%) | 15,336 (4.1%) |
| $20,000 to $24,999 | 10,252 (2.0%) | 17,004 (4.6%) |
| $25,000 to $34,999 | 25,082 (4.8%) | 42,201 (11.4%) |
| $35,000 to $49,999 | 42,434 (8.2%) | 58,453 (15.7%) |
| $50,000 to $74,999 | 78,834 (15.2%) | 77,769 (20.9%) |
| $75,000 to $99,999 | 74,516 (14.4%) | 49,160 (13.2%) |
| $100,000 to $149,999 | 113,850 (22.0%) | 45,633 (12.3%) |
| $150,000 or more | 143,384 (27.7%) | 24,171 (6.5%) |
| Total | 518,013 (100.0%) | 371,290 (100.0%) |
Monthly Housing Cost Tiers in Area Code 817
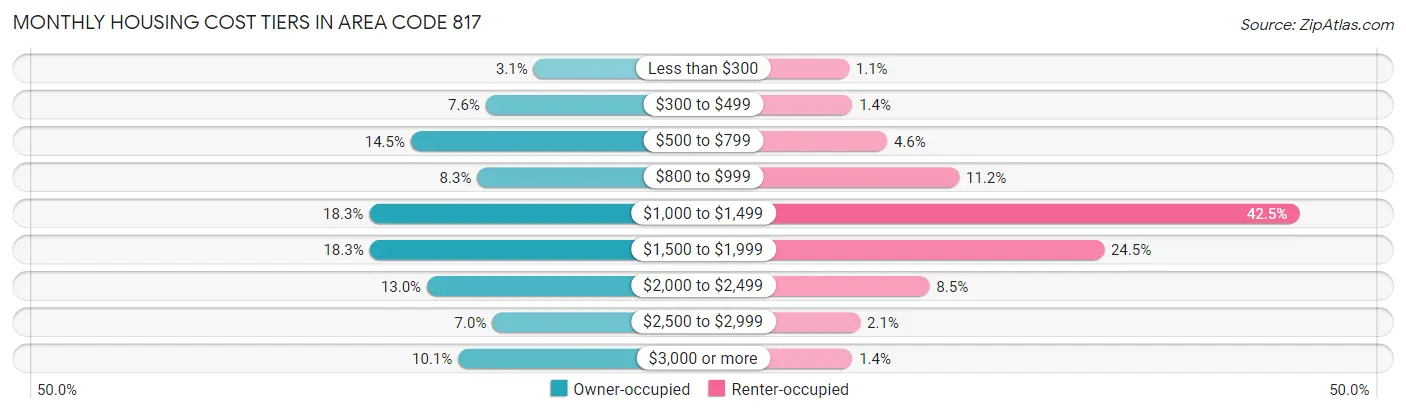
| Monthly Cost | Owner-occupied | Renter-occupied |
| Less than $300 | 16,274 (3.1%) | 3,917 (1.1%) |
| $300 to $499 | 39,091 (7.5%) | 5,032 (1.4%) |
| $500 to $799 | 74,875 (14.4%) | 16,916 (4.6%) |
| $800 to $999 | 43,158 (8.3%) | 41,567 (11.2%) |
| $1,000 to $1,499 | 94,685 (18.3%) | 157,768 (42.5%) |
| $1,500 to $1,999 | 94,515 (18.2%) | 91,106 (24.5%) |
| $2,000 to $2,499 | 67,153 (13.0%) | 31,432 (8.5%) |
| $2,500 to $2,999 | 36,016 (7.0%) | 7,761 (2.1%) |
| $3,000 or more | 52,246 (10.1%) | 5,046 (1.4%) |
| Total | 518,013 (100.0%) | 371,290 (100.0%) |
Physical Housing Characteristics in Area Code 817
Housing Structures in Area Code 817
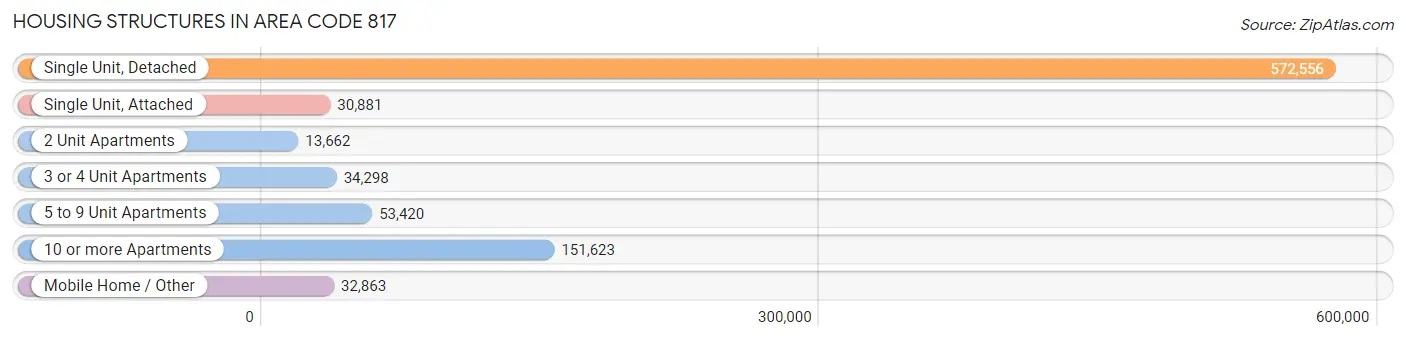
| Structure Type | # Housing Units | % Housing Units |
| Single Unit, Detached | 572,556 | 64.4% |
| Single Unit, Attached | 30,881 | 3.5% |
| 2 Unit Apartments | 13,662 | 1.5% |
| 3 or 4 Unit Apartments | 34,298 | 3.9% |
| 5 to 9 Unit Apartments | 53,420 | 6.0% |
| 10 or more Apartments | 151,623 | 17.1% |
| Mobile Home / Other | 32,863 | 3.7% |
| Total | 889,303 | 100.0% |
Housing Structures by Occupancy in Area Code 817
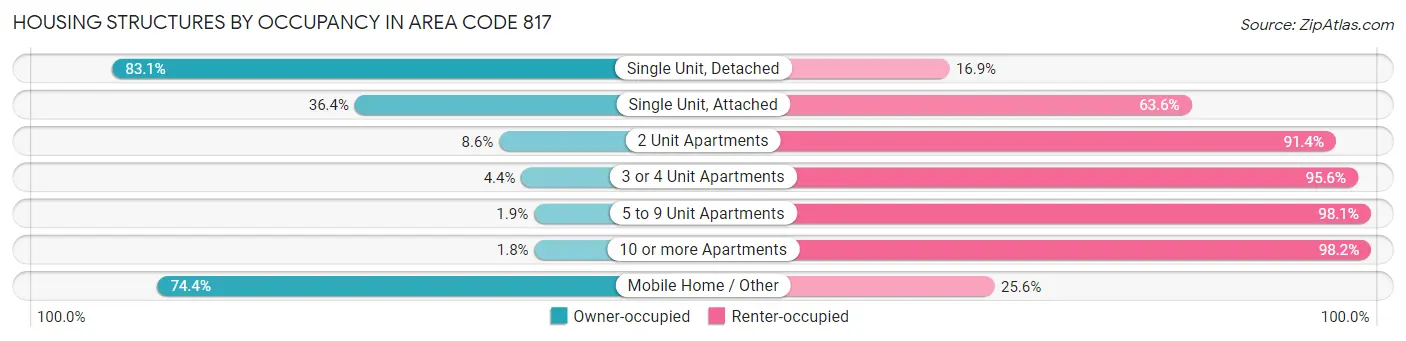
| Structure Type | Owner-occupied | Renter-occupied |
| Single Unit, Detached | 475,811 (83.1%) | 96,745 (16.9%) |
| Single Unit, Attached | 11,247 (36.4%) | 19,634 (63.6%) |
| 2 Unit Apartments | 1,178 (8.6%) | 12,484 (91.4%) |
| 3 or 4 Unit Apartments | 1,499 (4.4%) | 32,799 (95.6%) |
| 5 to 9 Unit Apartments | 1,028 (1.9%) | 52,392 (98.1%) |
| 10 or more Apartments | 2,796 (1.8%) | 148,827 (98.2%) |
| Mobile Home / Other | 24,454 (74.4%) | 8,409 (25.6%) |
| Total | 518,013 (58.3%) | 371,290 (41.7%) |
Housing Structures by Number of Rooms in Area Code 817
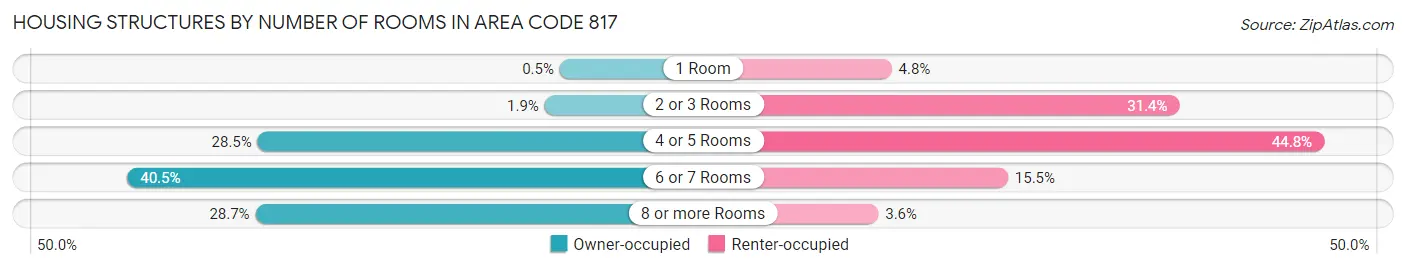
| Number of Rooms | Owner-occupied | Renter-occupied |
| 1 Room | 2,579 (0.5%) | 17,735 (4.8%) |
| 2 or 3 Rooms | 9,838 (1.9%) | 116,542 (31.4%) |
| 4 or 5 Rooms | 147,377 (28.4%) | 166,172 (44.8%) |
| 6 or 7 Rooms | 209,795 (40.5%) | 57,674 (15.5%) |
| 8 or more Rooms | 148,424 (28.6%) | 13,167 (3.5%) |
| Total | 518,013 (100.0%) | 371,290 (100.0%) |
Housing Structure by Heating Type in Area Code 817
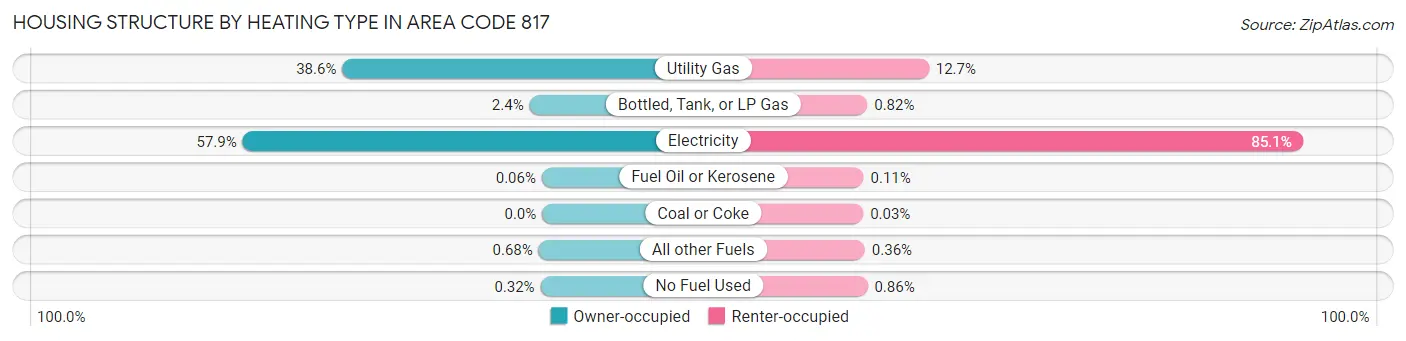
| Heating Type | Owner-occupied | Renter-occupied |
| Utility Gas | 200,064 (38.6%) | 47,139 (12.7%) |
| Bottled, Tank, or LP Gas | 12,641 (2.4%) | 3,033 (0.8%) |
| Electricity | 299,843 (57.9%) | 316,056 (85.1%) |
| Fuel Oil or Kerosene | 309 (0.1%) | 401 (0.1%) |
| Coal or Coke | 0 (0.0%) | 114 (0.0%) |
| All other Fuels | 3,504 (0.7%) | 1,348 (0.4%) |
| No Fuel Used | 1,652 (0.3%) | 3,199 (0.9%) |
| Total | 518,013 (100.0%) | 371,290 (100.0%) |
Household Vehicle Usage in Area Code 817
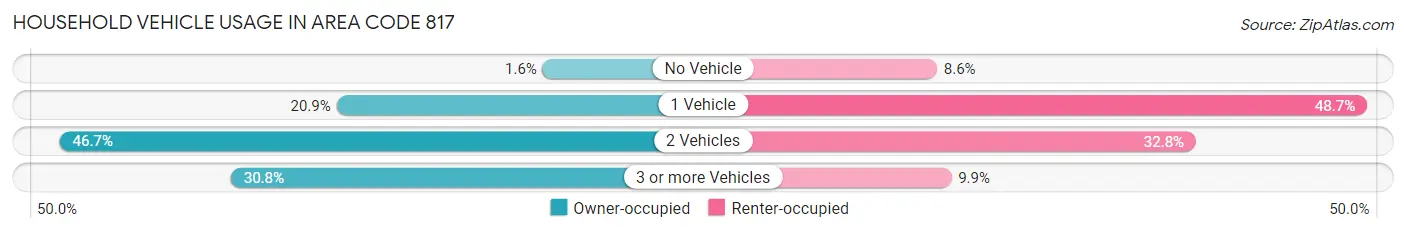
| Vehicles per Household | Owner-occupied | Renter-occupied |
| No Vehicle | 8,472 (1.6%) | 31,866 (8.6%) |
| 1 Vehicle | 108,142 (20.9%) | 180,967 (48.7%) |
| 2 Vehicles | 242,088 (46.7%) | 121,627 (32.8%) |
| 3 or more Vehicles | 159,311 (30.7%) | 36,830 (9.9%) |
| Total | 518,013 (100.0%) | 371,290 (100.0%) |
Real Estate & Mortgages in Area Code 817
Real Estate and Mortgage Overview in Area Code 817
| Characteristic | Without Mortgage | With Mortgage |
| Housing Units | 199,834 | 318,179 |
| Median Property Value | $18,672,700 | $22,234,800 |
| Median Household Income | $6,354,025 | $105,839 |
| Monthly Housing Costs | $56,711 | $50,060 |
| Real Estate Taxes | $278,680 | $9,323 |
Property Value by Mortgage Status in Area Code 817
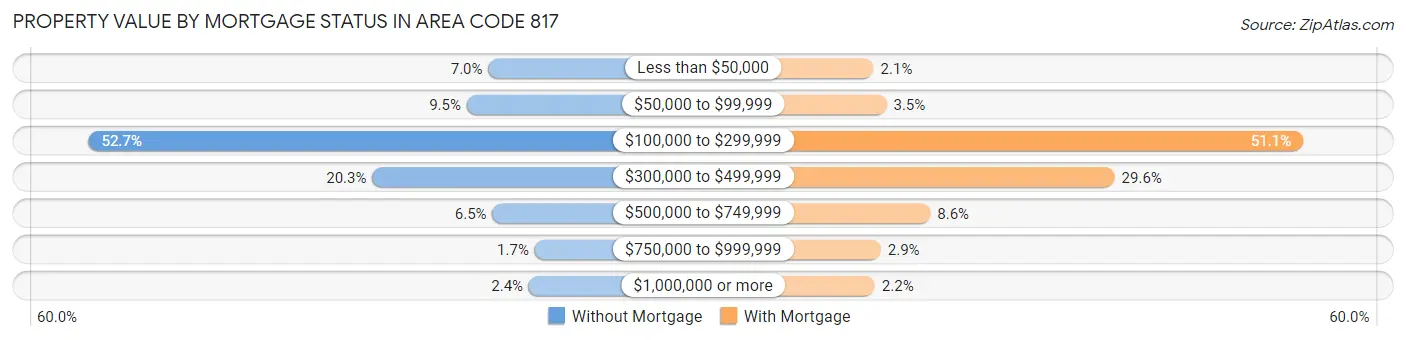
| Property Value | Without Mortgage | With Mortgage |
| Less than $50,000 | 13,987 (7.0%) | 6,600 (2.1%) |
| $50,000 to $99,999 | 18,908 (9.5%) | 11,265 (3.5%) |
| $100,000 to $299,999 | 105,287 (52.7%) | 162,712 (51.1%) |
| $300,000 to $499,999 | 40,490 (20.3%) | 94,209 (29.6%) |
| $500,000 to $749,999 | 13,052 (6.5%) | 27,189 (8.6%) |
| $750,000 to $999,999 | 3,402 (1.7%) | 9,181 (2.9%) |
| $1,000,000 or more | 4,708 (2.4%) | 7,023 (2.2%) |
| Total | 199,834 (100.0%) | 318,179 (100.0%) |
Household Income by Mortgage Status in Area Code 817
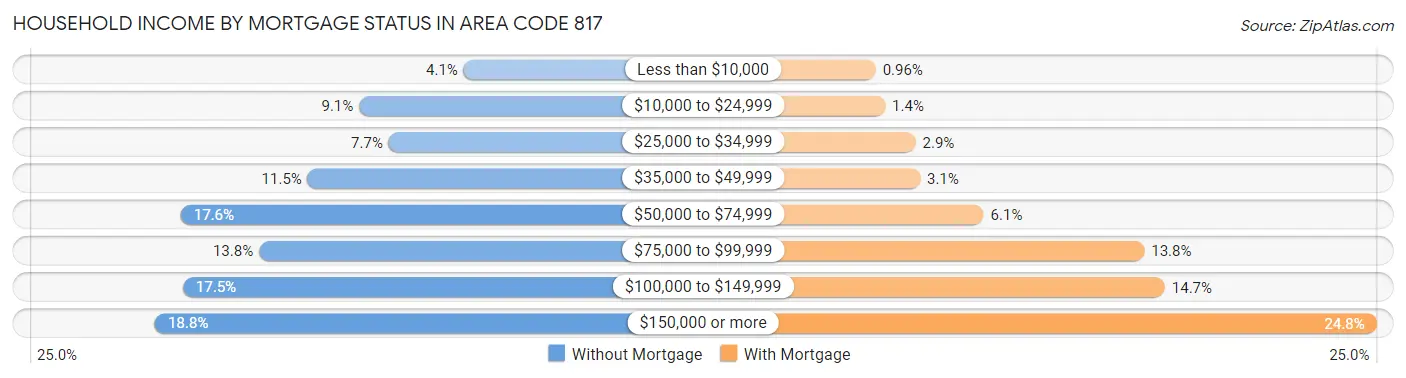
| Household Income | Without Mortgage | With Mortgage |
| Less than $10,000 | 8,175 (4.1%) | 3,070 (1.0%) |
| $10,000 to $24,999 | 18,133 (9.1%) | 4,496 (1.4%) |
| $25,000 to $34,999 | 15,316 (7.7%) | 9,109 (2.9%) |
| $35,000 to $49,999 | 23,023 (11.5%) | 9,766 (3.1%) |
| $50,000 to $74,999 | 35,088 (17.6%) | 19,411 (6.1%) |
| $75,000 to $99,999 | 27,657 (13.8%) | 43,746 (13.8%) |
| $100,000 to $149,999 | 34,897 (17.5%) | 46,859 (14.7%) |
| $150,000 or more | 37,545 (18.8%) | 78,953 (24.8%) |
| Total | 199,834 (100.0%) | 318,179 (100.0%) |
Property Value to Household Income Ratio in Area Code 817
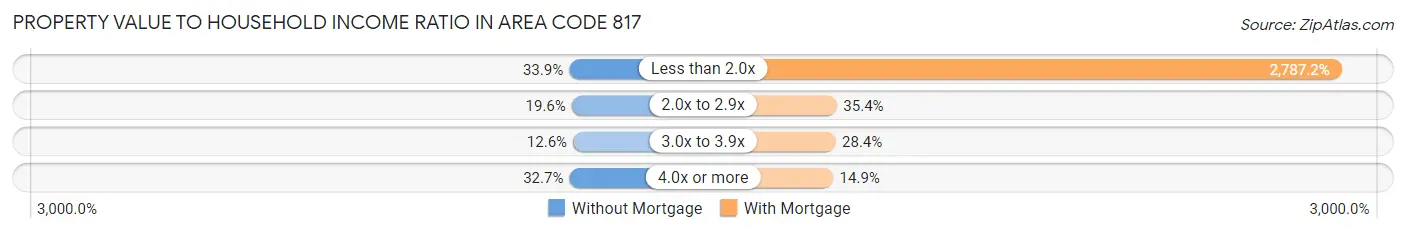
| Value-to-Income Ratio | Without Mortgage | With Mortgage |
| Less than 2.0x | 67,812 (33.9%) | 8,868,418 (2,787.2%) |
| 2.0x to 2.9x | 39,170 (19.6%) | 112,670 (35.4%) |
| 3.0x to 3.9x | 25,217 (12.6%) | 90,283 (28.4%) |
| 4.0x or more | 65,338 (32.7%) | 47,373 (14.9%) |
| Total | 199,834 (100.0%) | 318,179 (100.0%) |
Real Estate Taxes by Mortgage Status in Area Code 817
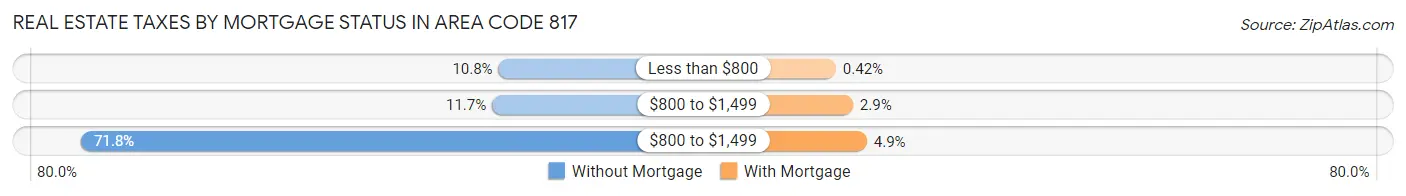
| Property Taxes | Without Mortgage | With Mortgage |
| Less than $800 | 21,502 (10.8%) | 1,346 (0.4%) |
| $800 to $1,499 | 23,389 (11.7%) | 9,221 (2.9%) |
| $800 to $1,499 | 143,397 (71.8%) | 15,717 (4.9%) |
| Total | 199,834 (100.0%) | 318,179 (100.0%) |
Health & Disability in Area Code 817
Health Insurance Coverage by Age in Area Code 817

| Age Bracket | With Coverage | Without Coverage |
| Under 6 Years | 178,735 (90.8%) | 18,025 (9.2%) |
| 6 to 18 Years | 400,315 (86.6%) | 62,144 (13.4%) |
| 19 to 25 Years | 180,530 (72.8%) | 67,501 (27.2%) |
| 26 to 34 Years | 242,976 (74.0%) | 85,371 (26.0%) |
| 35 to 44 Years | 252,686 (75.0%) | 84,049 (25.0%) |
| 45 to 54 Years | 241,749 (79.7%) | 61,394 (20.3%) |
| 55 to 64 Years | 234,095 (84.3%) | 43,584 (15.7%) |
| 65 to 74 Years | 177,083 (98.0%) | 3,585 (2.0%) |
| 75 Years and older | 108,248 (99.0%) | 1,081 (1.0%) |
| Total | 2,016,417 (82.5%) | 426,734 (17.5%) |
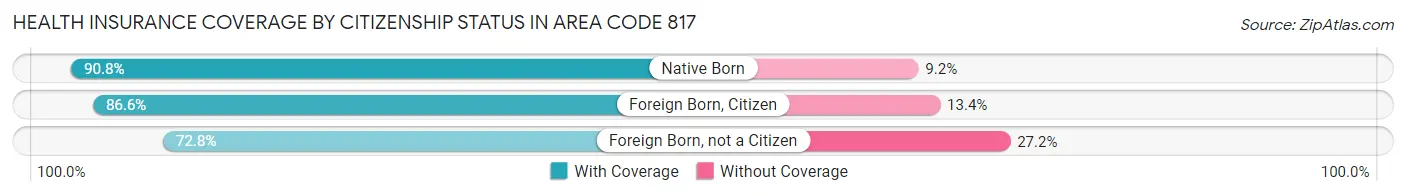
Health Insurance Coverage by Citizenship Status in Area Code 817
| Citizenship Status | With Coverage | Without Coverage |
| Native Born | 178,735 (90.8%) | 18,025 (9.2%) |
| Foreign Born, Citizen | 400,315 (86.6%) | 62,144 (13.4%) |
| Foreign Born, not a Citizen | 180,530 (72.8%) | 67,501 (27.2%) |
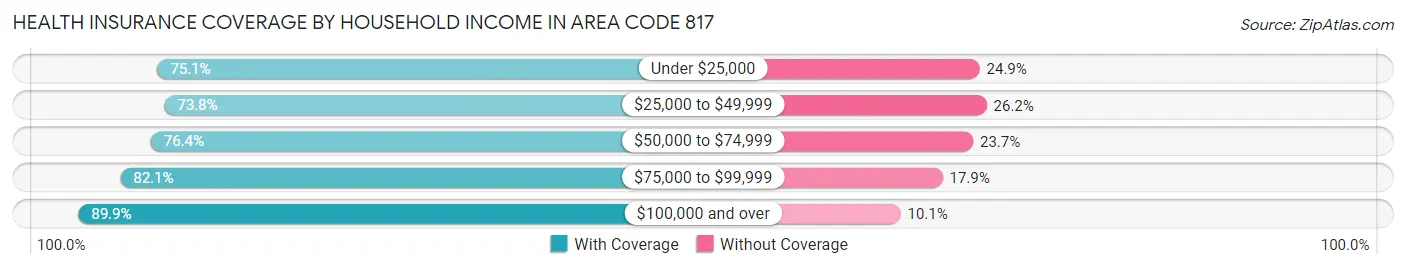
Health Insurance Coverage by Household Income in Area Code 817
| Household Income | With Coverage | Without Coverage |
| Under $25,000 | 163,065 (75.1%) | 54,018 (24.9%) |
| $25,000 to $49,999 | 290,070 (73.8%) | 102,927 (26.2%) |
| $50,000 to $74,999 | 315,355 (76.3%) | 97,681 (23.6%) |
| $75,000 to $99,999 | 287,110 (82.1%) | 62,754 (17.9%) |
| $100,000 and over | 947,676 (89.9%) | 106,102 (10.1%) |
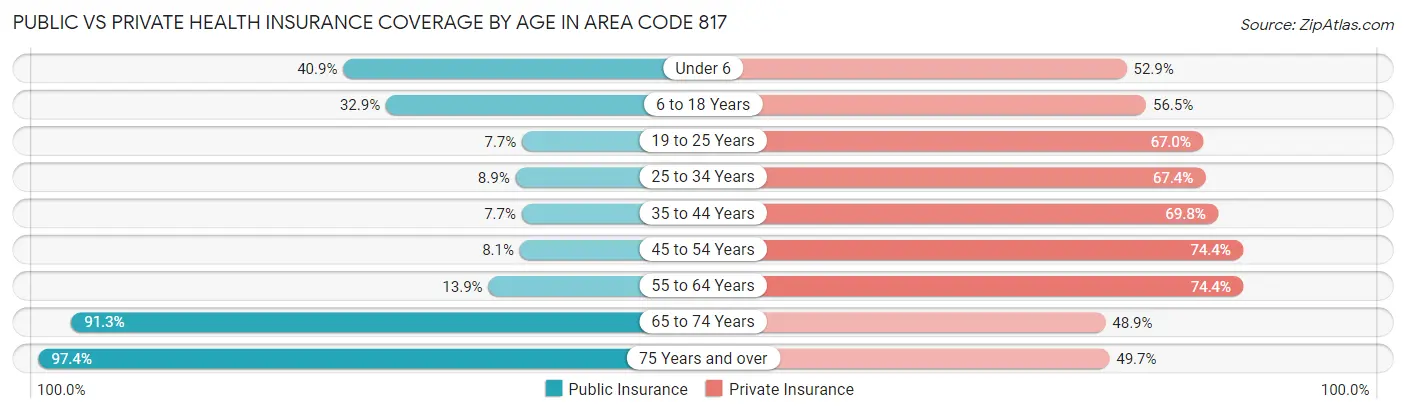
Public vs Private Health Insurance Coverage by Age in Area Code 817
| Age Bracket | Public Insurance | Private Insurance |
| Under 6 | 80,396 (40.9%) | 103,979 (52.8%) |
| 6 to 18 Years | 152,252 (32.9%) | 261,176 (56.5%) |
| 19 to 25 Years | 18,963 (7.6%) | 166,193 (67.0%) |
| 25 to 34 Years | 29,155 (8.9%) | 221,401 (67.4%) |
| 35 to 44 Years | 25,962 (7.7%) | 234,910 (69.8%) |
| 45 to 54 Years | 24,525 (8.1%) | 225,526 (74.4%) |
| 55 to 64 Years | 38,637 (13.9%) | 206,706 (74.4%) |
| 65 to 74 Years | 164,977 (91.3%) | 88,379 (48.9%) |
| 75 Years and over | 106,498 (97.4%) | 54,282 (49.6%) |
| Total | 641,365 (26.3%) | 1,562,552 (64.0%) |
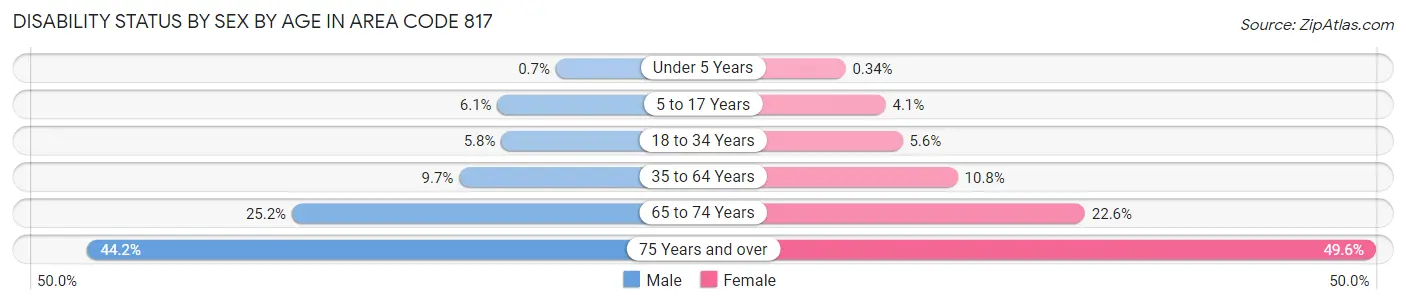
Disability Status by Sex by Age in Area Code 817
| Age Bracket | Male | Female |
| Under 5 Years | 584 (0.7%) | 270 (0.3%) |
| 5 to 17 Years | 14,311 (6.1%) | 9,124 (4.1%) |
| 18 to 34 Years | 17,526 (5.8%) | 17,410 (5.6%) |
| 35 to 64 Years | 44,096 (9.7%) | 49,590 (10.7%) |
| 65 to 74 Years | 21,199 (25.2%) | 21,773 (22.6%) |
| 75 Years and over | 20,428 (44.2%) | 31,247 (49.5%) |
Disability Class by Sex by Age in Area Code 817
Disability Class: Hearing Difficulty
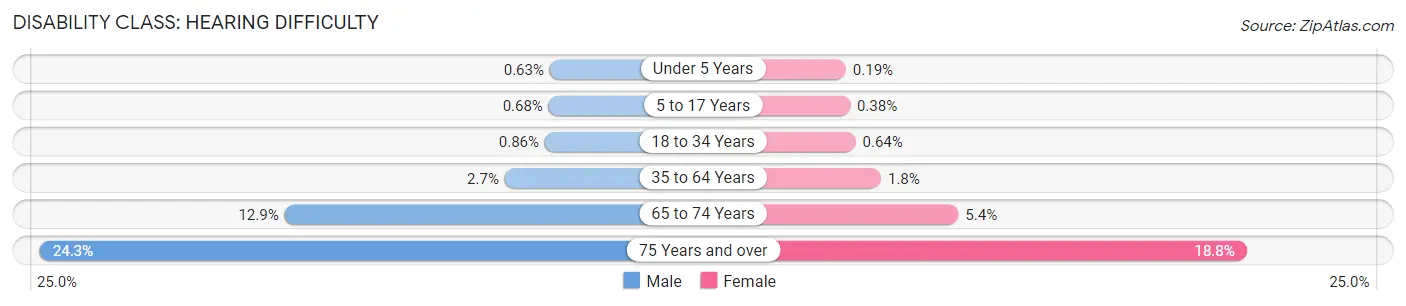
| Age Bracket | Male | Female |
| Under 5 Years | 523 (0.6%) | 152 (0.2%) |
| 5 to 17 Years | 1,586 (0.7%) | 847 (0.4%) |
| 18 to 34 Years | 2,630 (0.9%) | 1,970 (0.6%) |
| 35 to 64 Years | 12,427 (2.7%) | 8,386 (1.8%) |
| 65 to 74 Years | 10,893 (12.9%) | 5,225 (5.4%) |
| 75 Years and over | 11,237 (24.3%) | 11,844 (18.8%) |
Disability Class: Vision Difficulty
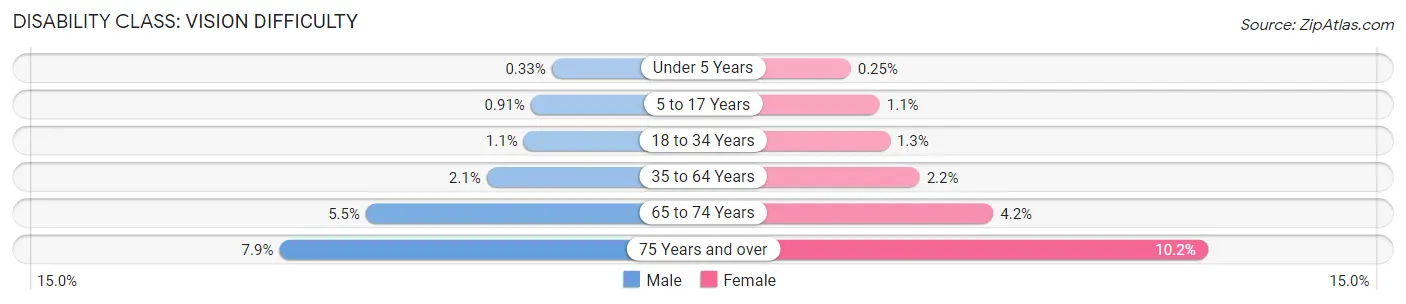
| Age Bracket | Male | Female |
| Under 5 Years | 273 (0.3%) | 203 (0.3%) |
| 5 to 17 Years | 2,138 (0.9%) | 2,389 (1.1%) |
| 18 to 34 Years | 3,365 (1.1%) | 4,138 (1.3%) |
| 35 to 64 Years | 9,748 (2.1%) | 9,996 (2.2%) |
| 65 to 74 Years | 4,625 (5.5%) | 4,069 (4.2%) |
| 75 Years and over | 3,662 (7.9%) | 6,419 (10.2%) |
Disability Class: Cognitive Difficulty
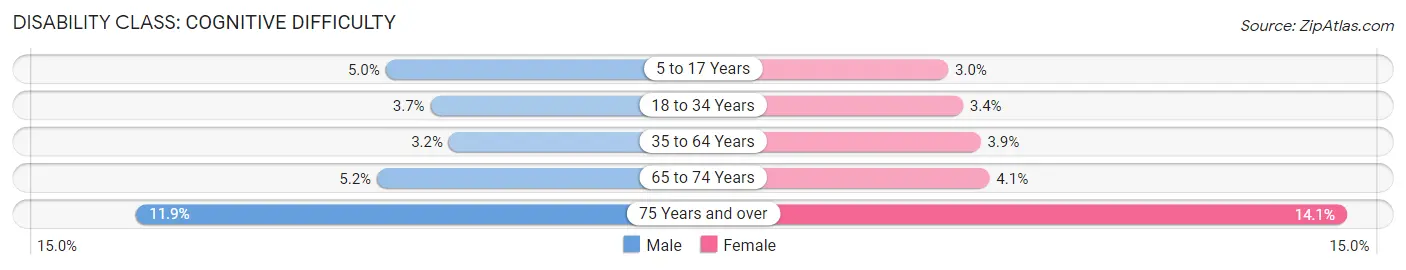
| Age Bracket | Male | Female |
| 5 to 17 Years | 11,580 (5.0%) | 6,649 (3.0%) |
| 18 to 34 Years | 11,264 (3.7%) | 10,410 (3.4%) |
| 35 to 64 Years | 14,560 (3.2%) | 17,819 (3.9%) |
| 65 to 74 Years | 4,367 (5.2%) | 3,965 (4.1%) |
| 75 Years and over | 5,502 (11.9%) | 8,864 (14.1%) |
Disability Class: Ambulatory Difficulty
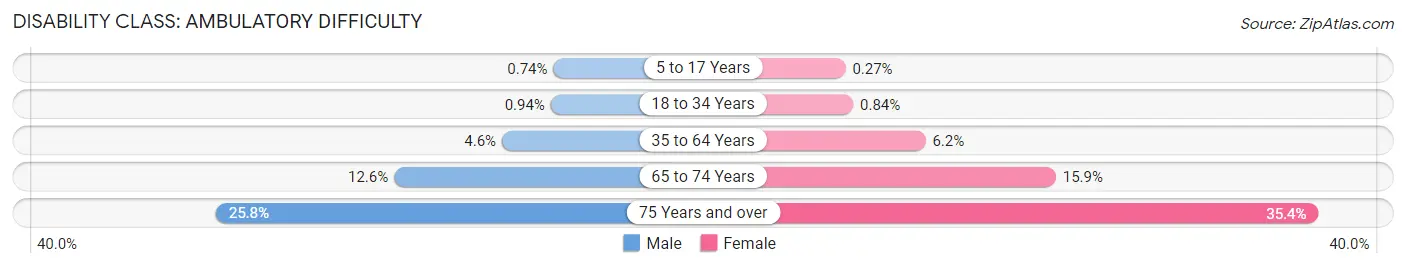
| Age Bracket | Male | Female |
| 5 to 17 Years | 1,733 (0.7%) | 612 (0.3%) |
| 18 to 34 Years | 2,859 (0.9%) | 2,600 (0.8%) |
| 35 to 64 Years | 20,781 (4.6%) | 28,635 (6.2%) |
| 65 to 74 Years | 10,581 (12.6%) | 15,332 (15.9%) |
| 75 Years and over | 11,940 (25.8%) | 22,311 (35.4%) |
Disability Class: Self-Care Difficulty
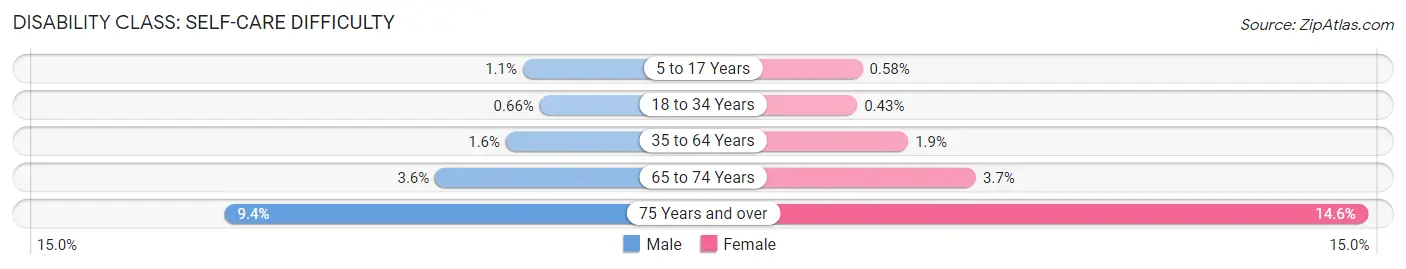
| Age Bracket | Male | Female |
| 5 to 17 Years | 2,644 (1.1%) | 1,312 (0.6%) |
| 18 to 34 Years | 2,015 (0.7%) | 1,321 (0.4%) |
| 35 to 64 Years | 7,319 (1.6%) | 8,515 (1.8%) |
| 65 to 74 Years | 3,002 (3.6%) | 3,605 (3.7%) |
| 75 Years and over | 4,363 (9.4%) | 9,231 (14.6%) |
Technology Access in Area Code 817
Computing Device Access in Area Code 817
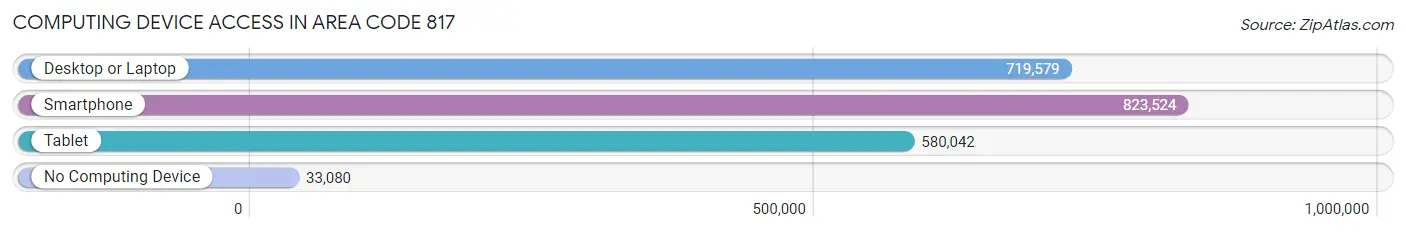
| Device Type | # Households | % Households |
| Desktop or Laptop | 719,579 | 80.9% |
| Smartphone | 823,524 | 92.6% |
| Tablet | 580,042 | 65.2% |
| No Computing Device | 33,080 | 3.7% |
| Total | 889,303 | 100.0% |
Internet Access in Area Code 817
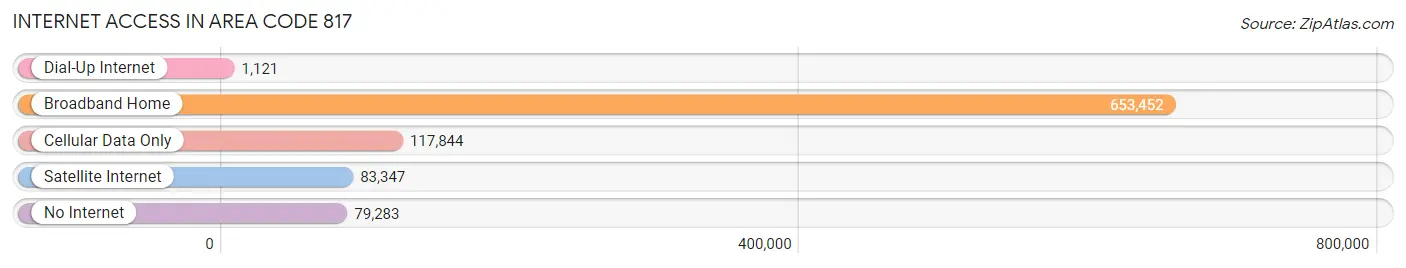
| Internet Type | # Households | % Households |
| Dial-Up Internet | 1,121 | 0.1% |
| Broadband Home | 653,452 | 73.5% |
| Cellular Data Only | 117,844 | 13.3% |
| Satellite Internet | 83,347 | 9.4% |
| No Internet | 79,283 | 8.9% |
| Total | 889,303 | 100.0% |
Area Code 817 Summary
Geography
Area code 817 is located in the state of Texas and covers the cities of Fort Worth, Arlington, and parts of Dallas. It is bordered by area codes 254, 682, and 940.
Social
Area code 817 is home to many cultural attractions, including the Fort Worth Stockyards, the Fort Worth Zoo, and the Kimbell Art Museum. The area is also home to several professional sports teams, including the Dallas Cowboys, Texas Rangers, and Dallas Mavericks.
Economics
Area code 817 is a major economic hub in the state of Texas. It is home to several Fortune 500 companies, including American Airlines, Lockheed Martin, and RadioShack. The area is also home to several universities, including the University of Texas at Arlington and Texas Christian University.
Demographics
Area code 817 is home to a diverse population. According to the 2010 census, the population of the area was 1,845,622. The population is made up of a variety of ethnicities, including White (63.2%), Hispanic or Latino (25.7%), African American (8.2%), and Asian (2.7%). The median household income in the area is $50,867.
Common Questions
What is Per Capita Income in Area Code 817?
Per Capita income in Area Code 817 is $36,831.
What is the Median Family Income in Area Code 817?
Median Family Income in Area Code 817 is $91,340.
What is the Median Household income in Area Code 817?
Median Household Income in Area Code 817 is $78,843.
What is Income or Wage Gap in Area Code 817?
Income or Wage Gap in Area Code 817 is 29.8%.
Women in Area Code 817 earn 70.2 cents for every dollar earned by a man.
What is Family Income Deficit in Area Code 817?
Family Income Deficit in Area Code 817 is $10,547.
Families that are below poverty line in Area Code 817 earn $10,547 less on average than the poverty threshold level.
What is Inequality or Gini Index in Area Code 817?
Inequality or Gini Index in Area Code 817 is 33.81.
What is the Total Population of Area Code 817?
Total Population of Area Code 817 is 2,464,037.
What is the Total Male Population of Area Code 817?
Total Male Population of Area Code 817 is 1,219,649.
What is the Total Female Population of Area Code 817?
Total Female Population of Area Code 817 is 1,244,388.
What is the Ratio of Males per 100 Females in Area Code 817?
There are 98.01 Males per 100 Females in Area Code 817.
What is the Ratio of Females per 100 Males in Area Code 817?
There are 102.03 Females per 100 Males in Area Code 817.
What is the Median Population Age in Area Code 817?
Median Population Age in Area Code 817 is 35.8 Years.
What is the Average Family Size in Area Code 817
Average Family Size in Area Code 817 is 3.3 People.
What is the Average Household Size in Area Code 817
Average Household Size in Area Code 817 is 2.7 People.
How Large is the Labor Force in Area Code 817?
There are 1,271,519 People in the Labor Forcein in Area Code 817.
What is the Percentage of People in the Labor Force in Area Code 817?
66.4% of People are in the Labor Force in Area Code 817.
What is the Unemployment Rate in Area Code 817?
Unemployment Rate in Area Code 817 is 5.2%.