Lubbock County, TX Map & Demographics
Lubbock County Map
Lubbock County Overview
$33,700
PER CAPITA INCOME
$81,054
AVG FAMILY INCOME
$61,911
AVG HOUSEHOLD INCOME
32.4%
WAGE / INCOME GAP [ % ]
67.6¢/ $1
WAGE / INCOME GAP [ $ ]
$11,199
FAMILY INCOME DEFICIT
0.48
INEQUALITY / GINI INDEX
311,509
TOTAL POPULATION
154,200
MALE POPULATION
157,309
FEMALE POPULATION
98.02
MALES / 100 FEMALES
102.02
FEMALES / 100 MALES
31.2
MEDIAN AGE
3.1
AVG FAMILY SIZE
2.5
AVG HOUSEHOLD SIZE
161,675
LABOR FORCE [ PEOPLE ]
65.6%
PERCENT IN LABOR FORCE
4.6%
UNEMPLOYMENT RATE
Lubbock County Area Codes
Income in Lubbock County
Income Overview in Lubbock County
Per Capita Income in Lubbock County is $33,700, while median incomes of families and households are $81,054 and $61,911 respectively.
| Characteristic | Number | Measure |
| Per Capita Income | 311,509 | $33,700 |
| Median Family Income | 72,648 | $81,054 |
| Mean Family Income | 72,648 | $105,376 |
| Median Household Income | 121,685 | $61,911 |
| Mean Household Income | 121,685 | $85,341 |
| Income Deficit | 72,648 | $11,199 |
| Wage / Income Gap (%) | 311,509 | 32.42% |
| Wage / Income Gap ($) | 311,509 | 67.58¢ per $1 |
| Gini / Inequality Index | 311,509 | 0.48 |
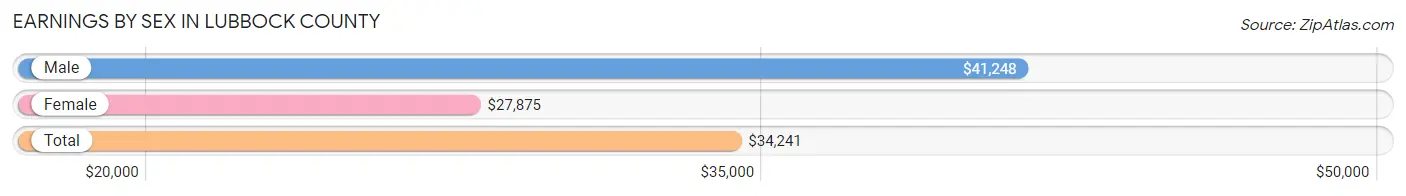
Earnings by Sex in Lubbock County
Average Earnings in Lubbock County are $34,241, $41,248 for men and $27,875 for women, a difference of 32.4%.
| Sex | Number | Average Earnings |
| Male | 90,303 (52.3%) | $41,248 |
| Female | 82,354 (47.7%) | $27,875 |
| Total | 172,657 (100.0%) | $34,241 |
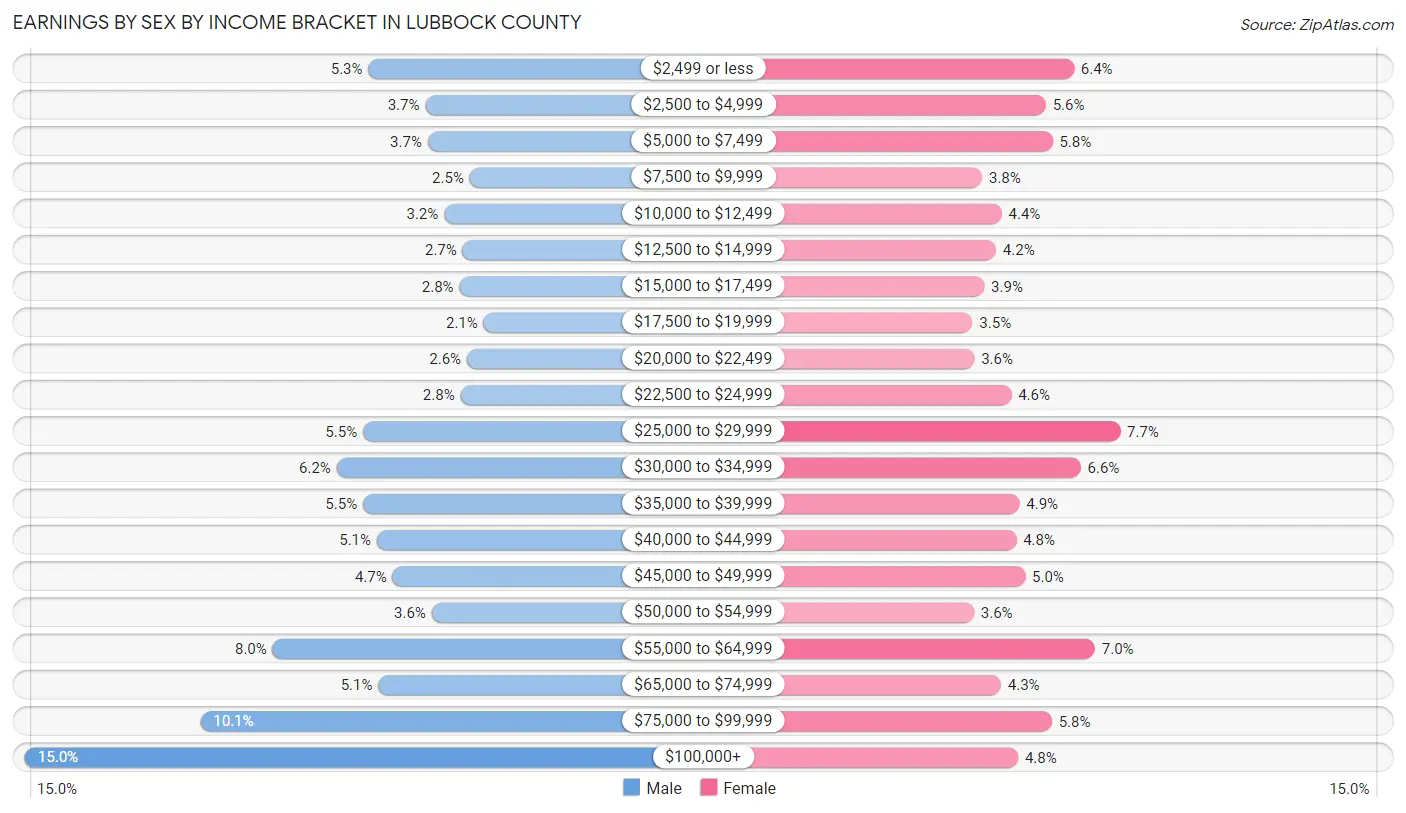
Earnings by Sex by Income Bracket in Lubbock County
The most common earnings brackets in Lubbock County are $100,000+ for men (13,540 | 15.0%) and $25,000 to $29,999 for women (6,326 | 7.7%).
| Income | Male | Female |
| $2,499 or less | 4,821 (5.3%) | 5,252 (6.4%) |
| $2,500 to $4,999 | 3,373 (3.7%) | 4,605 (5.6%) |
| $5,000 to $7,499 | 3,313 (3.7%) | 4,764 (5.8%) |
| $7,500 to $9,999 | 2,251 (2.5%) | 3,127 (3.8%) |
| $10,000 to $12,499 | 2,901 (3.2%) | 3,583 (4.3%) |
| $12,500 to $14,999 | 2,430 (2.7%) | 3,450 (4.2%) |
| $15,000 to $17,499 | 2,512 (2.8%) | 3,181 (3.9%) |
| $17,500 to $19,999 | 1,900 (2.1%) | 2,910 (3.5%) |
| $20,000 to $22,499 | 2,320 (2.6%) | 2,952 (3.6%) |
| $22,500 to $24,999 | 2,480 (2.8%) | 3,805 (4.6%) |
| $25,000 to $29,999 | 4,954 (5.5%) | 6,326 (7.7%) |
| $30,000 to $34,999 | 5,627 (6.2%) | 5,409 (6.6%) |
| $35,000 to $39,999 | 4,958 (5.5%) | 3,992 (4.9%) |
| $40,000 to $44,999 | 4,601 (5.1%) | 3,922 (4.8%) |
| $45,000 to $49,999 | 4,211 (4.7%) | 4,123 (5.0%) |
| $50,000 to $54,999 | 3,214 (3.6%) | 2,941 (3.6%) |
| $55,000 to $64,999 | 7,250 (8.0%) | 5,740 (7.0%) |
| $65,000 to $74,999 | 4,565 (5.1%) | 3,569 (4.3%) |
| $75,000 to $99,999 | 9,082 (10.1%) | 4,744 (5.8%) |
| $100,000+ | 13,540 (15.0%) | 3,959 (4.8%) |
| Total | 90,303 (100.0%) | 82,354 (100.0%) |
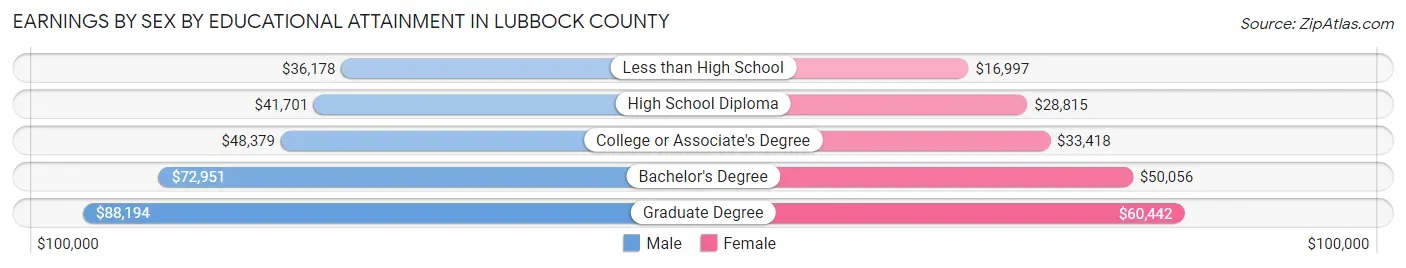
Earnings by Sex by Educational Attainment in Lubbock County
Average earnings in Lubbock County are $53,450 for men and $35,701 for women, a difference of 33.2%. Men with an educational attainment of graduate degree enjoy the highest average annual earnings of $88,194, while those with less than high school education earn the least with $36,178. Women with an educational attainment of graduate degree earn the most with the average annual earnings of $60,442, while those with less than high school education have the smallest earnings of $16,997.
| Educational Attainment | Male Income | Female Income |
| Less than High School | $36,178 | $16,997 |
| High School Diploma | $41,701 | $28,815 |
| College or Associate's Degree | $48,379 | $33,418 |
| Bachelor's Degree | $72,951 | $50,056 |
| Graduate Degree | $88,194 | $60,442 |
| Total | $53,450 | $35,701 |
Family Income in Lubbock County
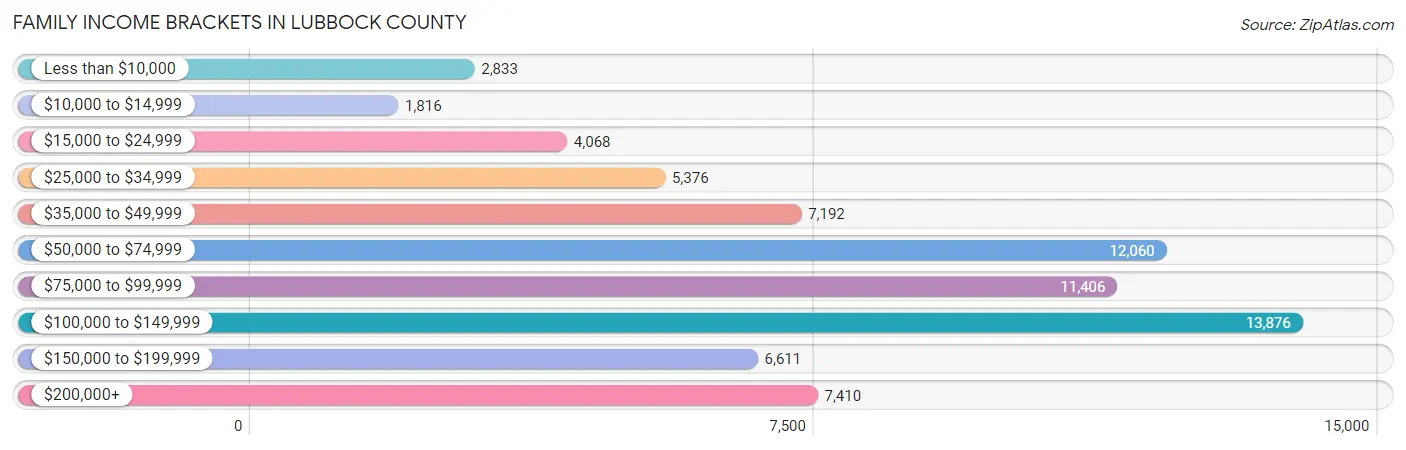
Family Income Brackets in Lubbock County
According to the Lubbock County family income data, there are 13,876 families falling into the $100,000 to $149,999 income range, which is the most common income bracket and makes up 19.1% of all families. Conversely, the $10,000 to $14,999 income bracket is the least frequent group with only 1,816 families (2.5%) belonging to this category.
| Income Bracket | # Families | % Families |
| Less than $10,000 | 2,833 | 3.9% |
| $10,000 to $14,999 | 1,816 | 2.5% |
| $15,000 to $24,999 | 4,068 | 5.6% |
| $25,000 to $34,999 | 5,376 | 7.4% |
| $35,000 to $49,999 | 7,192 | 9.9% |
| $50,000 to $74,999 | 12,060 | 16.6% |
| $75,000 to $99,999 | 11,406 | 15.7% |
| $100,000 to $149,999 | 13,876 | 19.1% |
| $150,000 to $199,999 | 6,611 | 9.1% |
| $200,000+ | 7,410 | 10.2% |
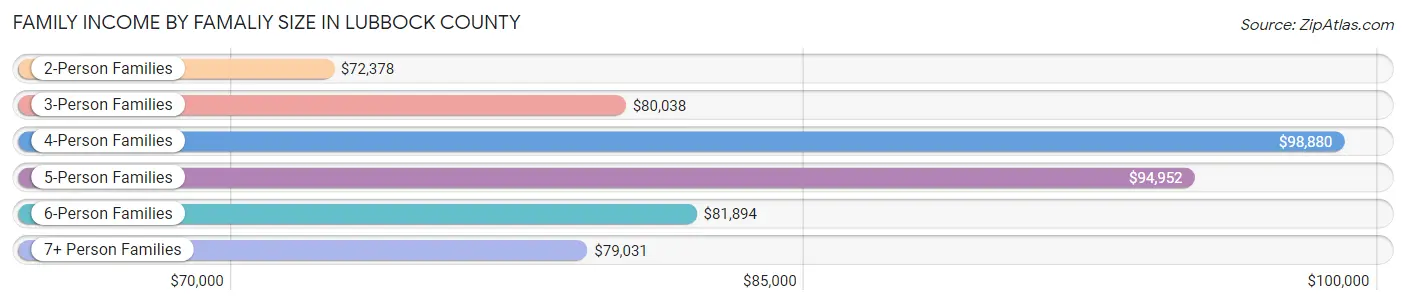
Family Income by Famaliy Size in Lubbock County
4-person families (13,441 | 18.5%) account for the highest median family income in Lubbock County with $98,880 per family, while 2-person families (34,011 | 46.8%) have the highest median income of $36,189 per family member.
| Income Bracket | # Families | Median Income |
| 2-Person Families | 34,011 (46.8%) | $72,378 |
| 3-Person Families | 15,630 (21.5%) | $80,038 |
| 4-Person Families | 13,441 (18.5%) | $98,880 |
| 5-Person Families | 6,255 (8.6%) | $94,952 |
| 6-Person Families | 2,248 (3.1%) | $81,894 |
| 7+ Person Families | 1,063 (1.5%) | $79,031 |
| Total | 72,648 (100.0%) | $81,054 |
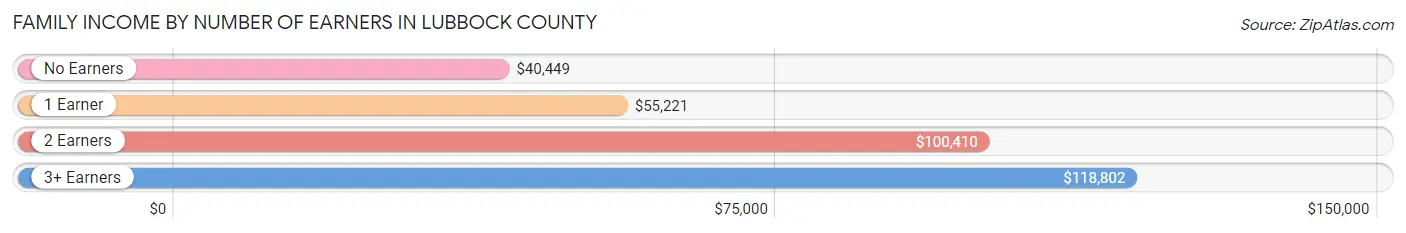
Family Income by Number of Earners in Lubbock County
The median family income in Lubbock County is $81,054, with families comprising 3+ earners (7,581) having the highest median family income of $118,802, while families with no earners (9,173) have the lowest median family income of $40,449, accounting for 10.4% and 12.6% of families, respectively.
| Number of Earners | # Families | Median Income |
| No Earners | 9,173 (12.6%) | $40,449 |
| 1 Earner | 23,047 (31.7%) | $55,221 |
| 2 Earners | 32,847 (45.2%) | $100,410 |
| 3+ Earners | 7,581 (10.4%) | $118,802 |
| Total | 72,648 (100.0%) | $81,054 |
Household Income in Lubbock County
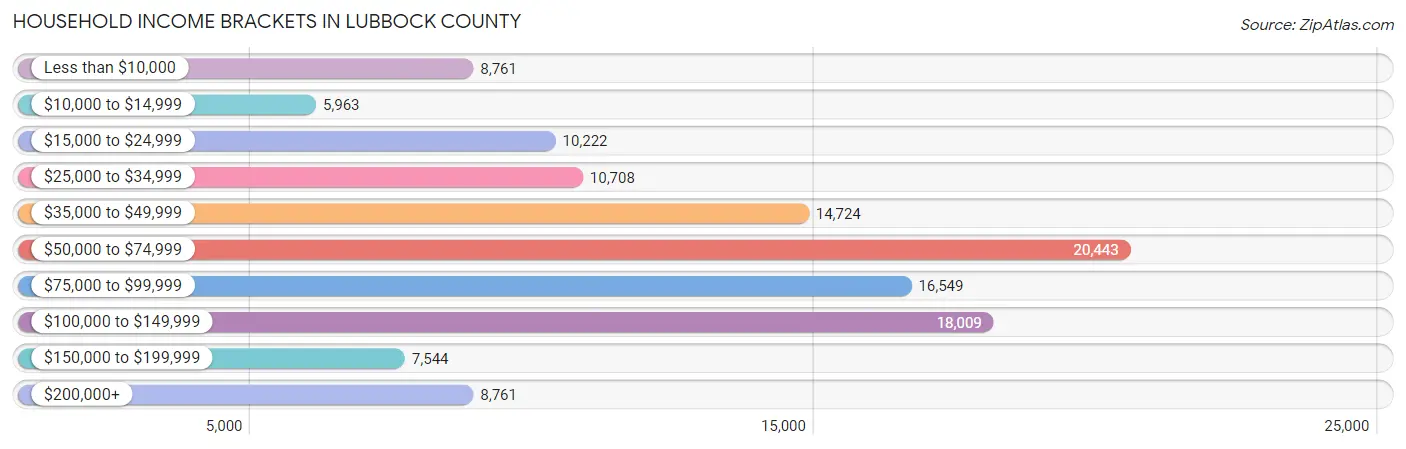
Household Income Brackets in Lubbock County
With 20,443 households falling in the category, the $50,000 to $74,999 income range is the most frequent in Lubbock County, accounting for 16.8% of all households. In contrast, only 5,963 households (4.9%) fall into the $10,000 to $14,999 income bracket, making it the least populous group.
| Income Bracket | # Households | % Households |
| Less than $10,000 | 8,761 | 7.2% |
| $10,000 to $14,999 | 5,963 | 4.9% |
| $15,000 to $24,999 | 10,222 | 8.4% |
| $25,000 to $34,999 | 10,708 | 8.8% |
| $35,000 to $49,999 | 14,724 | 12.1% |
| $50,000 to $74,999 | 20,443 | 16.8% |
| $75,000 to $99,999 | 16,549 | 13.6% |
| $100,000 to $149,999 | 18,009 | 14.8% |
| $150,000 to $199,999 | 7,544 | 6.2% |
| $200,000+ | 8,761 | 7.2% |
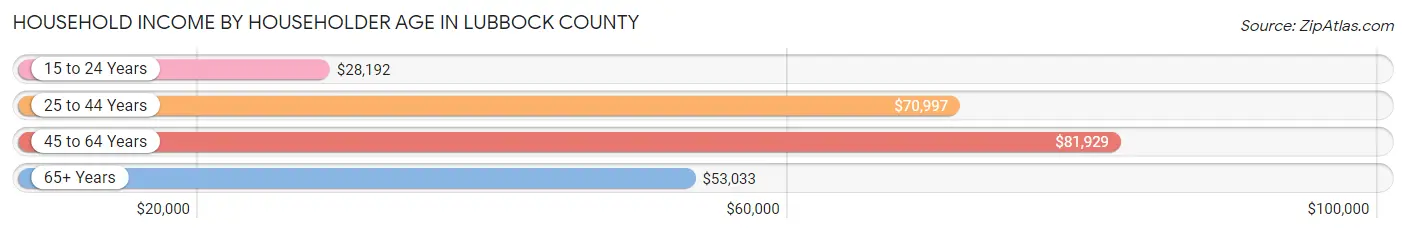
Household Income by Householder Age in Lubbock County
The median household income in Lubbock County is $61,911, with the highest median household income of $81,929 found in the 45 to 64 years age bracket for the primary householder. A total of 35,813 households (29.4%) fall into this category. Meanwhile, the 15 to 24 years age bracket for the primary householder has the lowest median household income of $28,192, with 16,113 households (13.2%) in this group.
| Income Bracket | # Households | Median Income |
| 15 to 24 Years | 16,113 (13.2%) | $28,192 |
| 25 to 44 Years | 44,070 (36.2%) | $70,997 |
| 45 to 64 Years | 35,813 (29.4%) | $81,929 |
| 65+ Years | 25,689 (21.1%) | $53,033 |
| Total | 121,685 (100.0%) | $61,911 |
Poverty in Lubbock County
Income Below Poverty by Sex and Age in Lubbock County
With 16.5% poverty level for males and 17.9% for females among the residents of Lubbock County, 18 to 24 year old males and 18 to 24 year old females are the most vulnerable to poverty, with 9,348 males (40.8%) and 9,187 females (42.4%) in their respective age groups living below the poverty level.
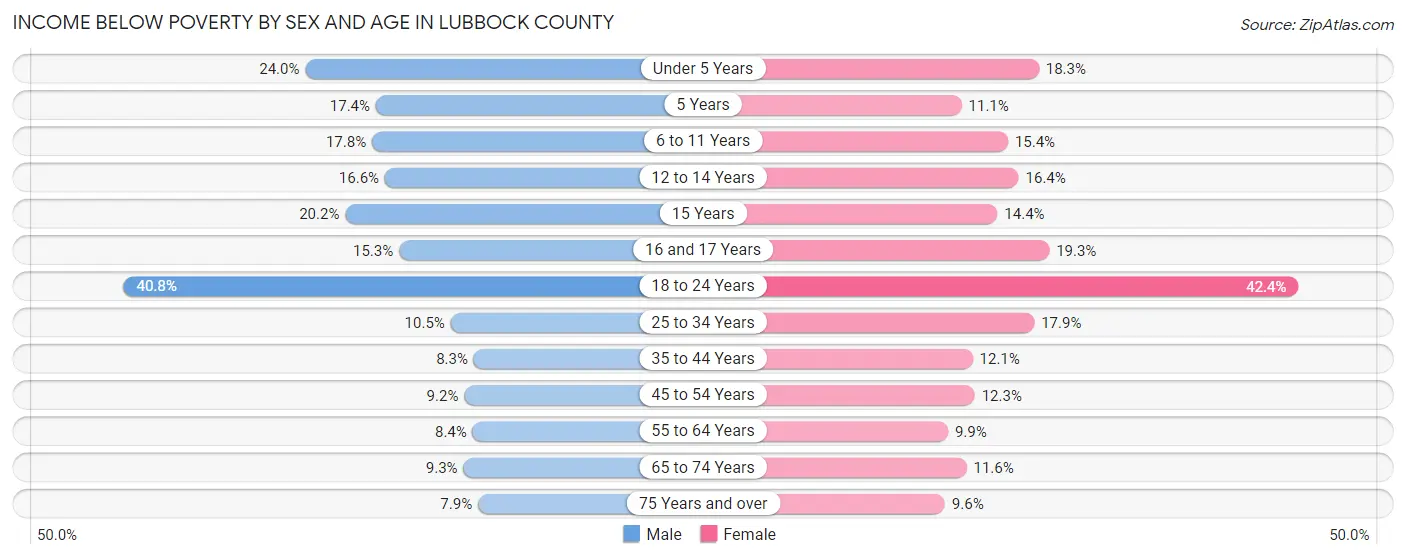
| Age Bracket | Male | Female |
| Under 5 Years | 2,347 (23.9%) | 1,756 (18.3%) |
| 5 Years | 353 (17.4%) | 246 (11.1%) |
| 6 to 11 Years | 2,304 (17.8%) | 1,773 (15.4%) |
| 12 to 14 Years | 1,014 (16.6%) | 1,066 (16.4%) |
| 15 Years | 369 (20.2%) | 288 (14.4%) |
| 16 and 17 Years | 649 (15.2%) | 783 (19.3%) |
| 18 to 24 Years | 9,348 (40.8%) | 9,187 (42.4%) |
| 25 to 34 Years | 2,287 (10.5%) | 3,898 (17.9%) |
| 35 to 44 Years | 1,570 (8.3%) | 2,288 (12.1%) |
| 45 to 54 Years | 1,357 (9.2%) | 1,929 (12.3%) |
| 55 to 64 Years | 1,254 (8.4%) | 1,598 (9.9%) |
| 65 to 74 Years | 983 (9.3%) | 1,443 (11.6%) |
| 75 Years and over | 493 (7.9%) | 889 (9.6%) |
| Total | 24,328 (16.5%) | 27,144 (17.9%) |
Income Above Poverty by Sex and Age in Lubbock County
According to the poverty statistics in Lubbock County, males aged 75 years and over and females aged 75 years and over are the age groups that are most secure financially, with 92.1% of males and 90.4% of females in these age groups living above the poverty line.
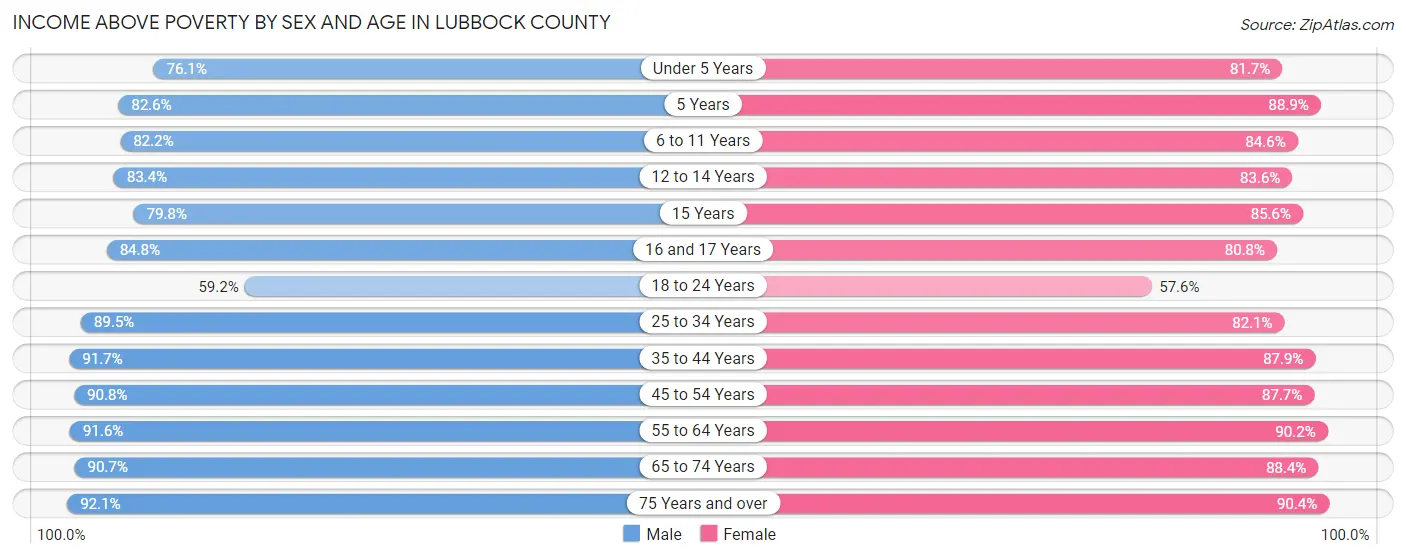
| Age Bracket | Male | Female |
| Under 5 Years | 7,452 (76.0%) | 7,850 (81.7%) |
| 5 Years | 1,676 (82.6%) | 1,966 (88.9%) |
| 6 to 11 Years | 10,667 (82.2%) | 9,723 (84.6%) |
| 12 to 14 Years | 5,109 (83.4%) | 5,429 (83.6%) |
| 15 Years | 1,454 (79.8%) | 1,707 (85.6%) |
| 16 and 17 Years | 3,608 (84.8%) | 3,284 (80.7%) |
| 18 to 24 Years | 13,559 (59.2%) | 12,497 (57.6%) |
| 25 to 34 Years | 19,577 (89.5%) | 17,929 (82.1%) |
| 35 to 44 Years | 17,323 (91.7%) | 16,557 (87.9%) |
| 45 to 54 Years | 13,391 (90.8%) | 13,700 (87.7%) |
| 55 to 64 Years | 13,641 (91.6%) | 14,633 (90.1%) |
| 65 to 74 Years | 9,624 (90.7%) | 11,014 (88.4%) |
| 75 Years and over | 5,732 (92.1%) | 8,405 (90.4%) |
| Total | 122,813 (83.5%) | 124,694 (82.1%) |
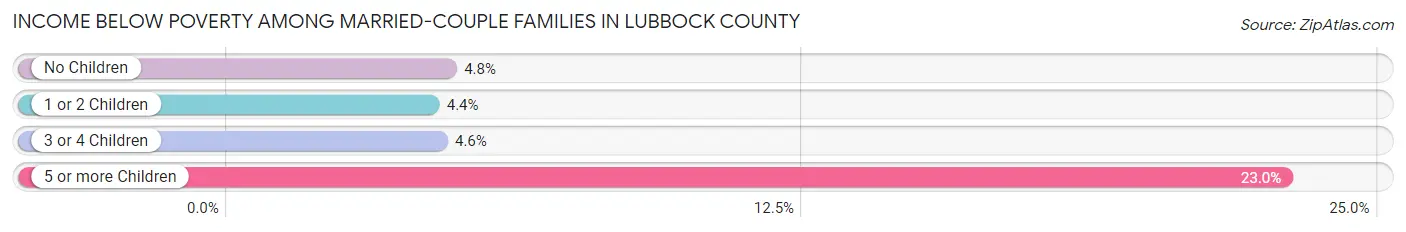
Income Below Poverty Among Married-Couple Families in Lubbock County
The poverty statistics for married-couple families in Lubbock County show that 4.8% or 2,458 of the total 51,316 families live below the poverty line. Families with 5 or more children have the highest poverty rate of 23.0%, comprising of 107 families. On the other hand, families with 1 or 2 children have the lowest poverty rate of 4.4%, which includes 756 families.
| Children | Above Poverty | Below Poverty |
| No Children | 27,183 (95.2%) | 1,363 (4.8%) |
| 1 or 2 Children | 16,475 (95.6%) | 756 (4.4%) |
| 3 or 4 Children | 4,841 (95.4%) | 232 (4.6%) |
| 5 or more Children | 359 (77.0%) | 107 (23.0%) |
| Total | 48,858 (95.2%) | 2,458 (4.8%) |
Income Below Poverty Among Single-Parent Households in Lubbock County
According to the poverty data in Lubbock County, 16.0% or 890 single-father households and 30.1% or 4,741 single-mother households are living below the poverty line. Among single-father households, those with 5 or more children have the highest poverty rate, with 8 households (22.9%) experiencing poverty. Likewise, among single-mother households, those with 5 or more children have the highest poverty rate, with 179 households (74.6%) falling below the poverty line.
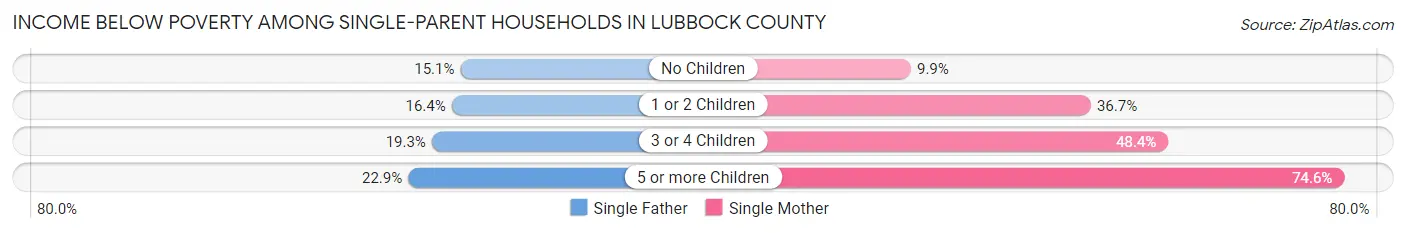
| Children | Single Father | Single Mother |
| No Children | 398 (15.1%) | 513 (9.9%) |
| 1 or 2 Children | 431 (16.4%) | 2,967 (36.7%) |
| 3 or 4 Children | 53 (19.3%) | 1,082 (48.3%) |
| 5 or more Children | 8 (22.9%) | 179 (74.6%) |
| Total | 890 (16.0%) | 4,741 (30.1%) |
Income Below Poverty Among Married-Couple vs Single-Parent Households in Lubbock County
The poverty data for Lubbock County shows that 2,458 of the married-couple family households (4.8%) and 5,631 of the single-parent households (26.4%) are living below the poverty level. Within the married-couple family households, those with 5 or more children have the highest poverty rate, with 107 households (23.0%) falling below the poverty line. Among the single-parent households, those with 5 or more children have the highest poverty rate, with 187 household (68.0%) living below poverty.
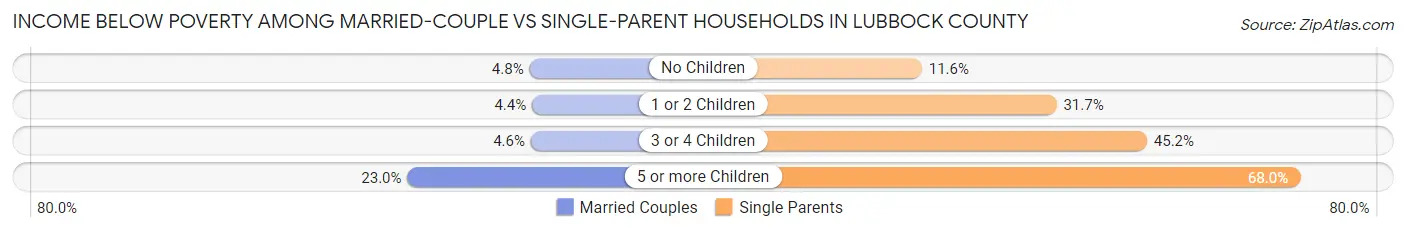
| Children | Married-Couple Families | Single-Parent Households |
| No Children | 1,363 (4.8%) | 911 (11.6%) |
| 1 or 2 Children | 756 (4.4%) | 3,398 (31.7%) |
| 3 or 4 Children | 232 (4.6%) | 1,135 (45.2%) |
| 5 or more Children | 107 (23.0%) | 187 (68.0%) |
| Total | 2,458 (4.8%) | 5,631 (26.4%) |
Race in Lubbock County
The most populous races in Lubbock County are White / Caucasian (216,279 | 69.4%), Hispanic or Latino (114,767 | 36.8%), and Two or more Races (41,268 | 13.3%).
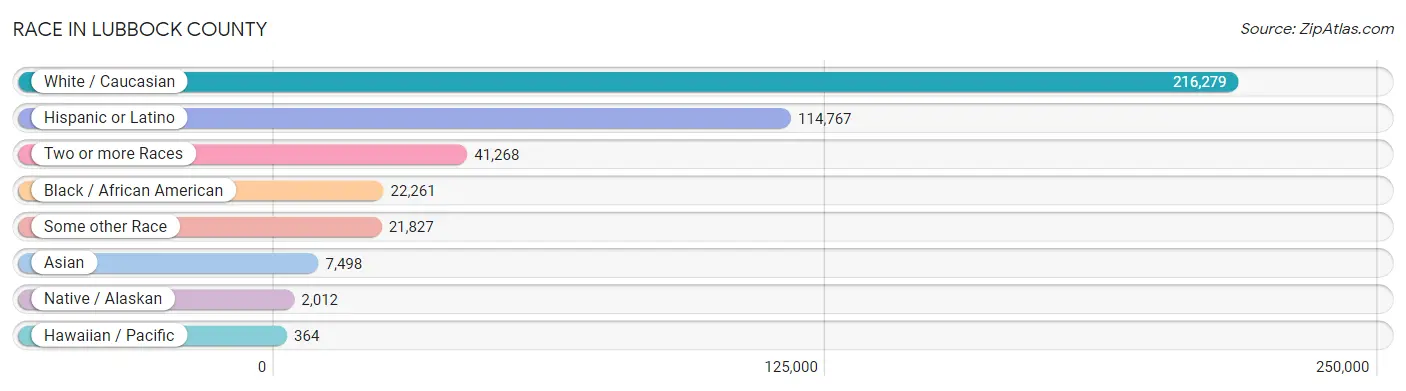
| Race | # Population | % Population |
| Asian | 7,498 | 2.4% |
| Black / African American | 22,261 | 7.1% |
| Hawaiian / Pacific | 364 | 0.1% |
| Hispanic or Latino | 114,767 | 36.8% |
| Native / Alaskan | 2,012 | 0.6% |
| White / Caucasian | 216,279 | 69.4% |
| Two or more Races | 41,268 | 13.3% |
| Some other Race | 21,827 | 7.0% |
| Total | 311,509 | 100.0% |
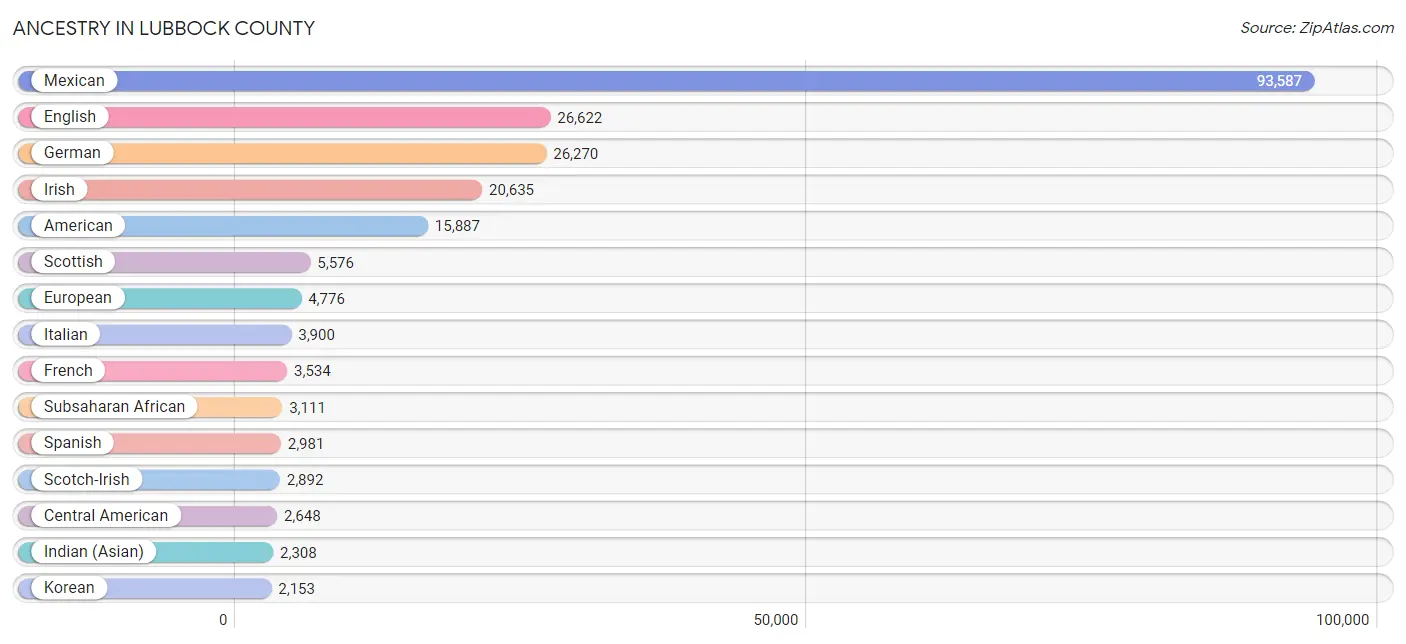
Ancestry in Lubbock County
The most populous ancestries reported in Lubbock County are Mexican (93,587 | 30.0%), English (26,622 | 8.6%), German (26,270 | 8.4%), Irish (20,635 | 6.6%), and American (15,887 | 5.1%), together accounting for 58.7% of all Lubbock County residents.
| Ancestry | # Population | % Population |
| African | 934 | 0.3% |
| Alaska Native | 5 | 0.0% |
| Albanian | 11 | 0.0% |
| Alsatian | 14 | 0.0% |
| American | 15,887 | 5.1% |
| Apache | 336 | 0.1% |
| Arab | 1,049 | 0.3% |
| Argentinean | 41 | 0.0% |
| Armenian | 33 | 0.0% |
| Australian | 22 | 0.0% |
| Austrian | 298 | 0.1% |
| Bahamian | 7 | 0.0% |
| Barbadian | 9 | 0.0% |
| Basque | 8 | 0.0% |
| Belgian | 34 | 0.0% |
| Bhutanese | 432 | 0.1% |
| Blackfeet | 224 | 0.1% |
| Bolivian | 54 | 0.0% |
| Brazilian | 208 | 0.1% |
| British | 1,992 | 0.6% |
| Bulgarian | 14 | 0.0% |
| Burmese | 838 | 0.3% |
| Cajun | 61 | 0.0% |
| Cambodian | 9 | 0.0% |
| Canadian | 474 | 0.2% |
| Cape Verdean | 17 | 0.0% |
| Celtic | 48 | 0.0% |
| Central American | 2,648 | 0.9% |
| Central American Indian | 187 | 0.1% |
| Cherokee | 1,133 | 0.4% |
| Cheyenne | 48 | 0.0% |
| Chickasaw | 114 | 0.0% |
| Chilean | 72 | 0.0% |
| Chippewa | 24 | 0.0% |
| Choctaw | 441 | 0.1% |
| Colombian | 482 | 0.2% |
| Comanche | 284 | 0.1% |
| Costa Rican | 34 | 0.0% |
| Creek | 54 | 0.0% |
| Croatian | 18 | 0.0% |
| Crow | 3 | 0.0% |
| Cuban | 303 | 0.1% |
| Czech | 990 | 0.3% |
| Czechoslovakian | 186 | 0.1% |
| Danish | 584 | 0.2% |
| Dominican | 49 | 0.0% |
| Dutch | 1,454 | 0.5% |
| Dutch West Indian | 299 | 0.1% |
| Eastern European | 240 | 0.1% |
| Ecuadorian | 156 | 0.1% |
| Egyptian | 135 | 0.0% |
| English | 26,622 | 8.6% |
| Ethiopian | 744 | 0.2% |
| European | 4,776 | 1.5% |
| Fijian | 34 | 0.0% |
| Filipino | 50 | 0.0% |
| Finnish | 71 | 0.0% |
| French | 3,534 | 1.1% |
| French American Indian | 17 | 0.0% |
| French Canadian | 382 | 0.1% |
| German | 26,270 | 8.4% |
| German Russian | 76 | 0.0% |
| Ghanaian | 147 | 0.1% |
| Greek | 225 | 0.1% |
| Guamanian / Chamorro | 126 | 0.0% |
| Guatemalan | 572 | 0.2% |
| Guyanese | 3 | 0.0% |
| Haitian | 244 | 0.1% |
| Honduran | 558 | 0.2% |
| Hungarian | 182 | 0.1% |
| Icelander | 24 | 0.0% |
| Indian (Asian) | 2,308 | 0.7% |
| Indonesian | 8 | 0.0% |
| Iranian | 142 | 0.1% |
| Iraqi | 7 | 0.0% |
| Irish | 20,635 | 6.6% |
| Iroquois | 4 | 0.0% |
| Israeli | 59 | 0.0% |
| Italian | 3,900 | 1.3% |
| Jamaican | 156 | 0.1% |
| Japanese | 244 | 0.1% |
| Jordanian | 50 | 0.0% |
| Kenyan | 129 | 0.0% |
| Korean | 2,153 | 0.7% |
| Laotian | 116 | 0.0% |
| Latvian | 12 | 0.0% |
| Lebanese | 342 | 0.1% |
| Lithuanian | 94 | 0.0% |
| Luxembourger | 20 | 0.0% |
| Malaysian | 38 | 0.0% |
| Menominee | 31 | 0.0% |
| Mexican | 93,587 | 30.0% |
| Mexican American Indian | 240 | 0.1% |
| Moroccan | 12 | 0.0% |
| Native Hawaiian | 221 | 0.1% |
| Navajo | 49 | 0.0% |
| Nicaraguan | 12 | 0.0% |
| Nigerian | 526 | 0.2% |
| Northern European | 347 | 0.1% |
| Norwegian | 1,639 | 0.5% |
| Osage | 7 | 0.0% |
| Pakistani | 213 | 0.1% |
| Panamanian | 86 | 0.0% |
| Paraguayan | 27 | 0.0% |
| Pennsylvania German | 210 | 0.1% |
| Peruvian | 551 | 0.2% |
| Polish | 1,371 | 0.4% |
| Portuguese | 246 | 0.1% |
| Potawatomi | 32 | 0.0% |
| Pueblo | 5 | 0.0% |
| Puerto Rican | 1,526 | 0.5% |
| Romanian | 25 | 0.0% |
| Russian | 484 | 0.2% |
| Salvadoran | 1,386 | 0.4% |
| Samoan | 268 | 0.1% |
| Scandinavian | 816 | 0.3% |
| Scotch-Irish | 2,892 | 0.9% |
| Scottish | 5,576 | 1.8% |
| Seminole | 45 | 0.0% |
| Serbian | 11 | 0.0% |
| Shoshone | 8 | 0.0% |
| Sierra Leonean | 54 | 0.0% |
| Slavic | 10 | 0.0% |
| Slovak | 80 | 0.0% |
| Slovene | 153 | 0.1% |
| Somali | 43 | 0.0% |
| South African | 17 | 0.0% |
| South American | 1,567 | 0.5% |
| South American Indian | 36 | 0.0% |
| Spaniard | 1,991 | 0.6% |
| Spanish | 2,981 | 1.0% |
| Spanish American | 364 | 0.1% |
| Spanish American Indian | 6 | 0.0% |
| Sri Lankan | 793 | 0.3% |
| Subsaharan African | 3,111 | 1.0% |
| Swedish | 1,648 | 0.5% |
| Swiss | 550 | 0.2% |
| Syrian | 7 | 0.0% |
| Thai | 1,305 | 0.4% |
| Tlingit-Haida | 8 | 0.0% |
| Tohono O'Odham | 6 | 0.0% |
| Trinidadian and Tobagonian | 46 | 0.0% |
| Turkish | 209 | 0.1% |
| U.S. Virgin Islander | 16 | 0.0% |
| Ugandan | 25 | 0.0% |
| Ukrainian | 270 | 0.1% |
| Uruguayan | 44 | 0.0% |
| Venezuelan | 140 | 0.0% |
| Vietnamese | 89 | 0.0% |
| Welsh | 2,047 | 0.7% |
| Yaqui | 79 | 0.0% |
| Yup'ik | 9 | 0.0% | View All 152 Rows |
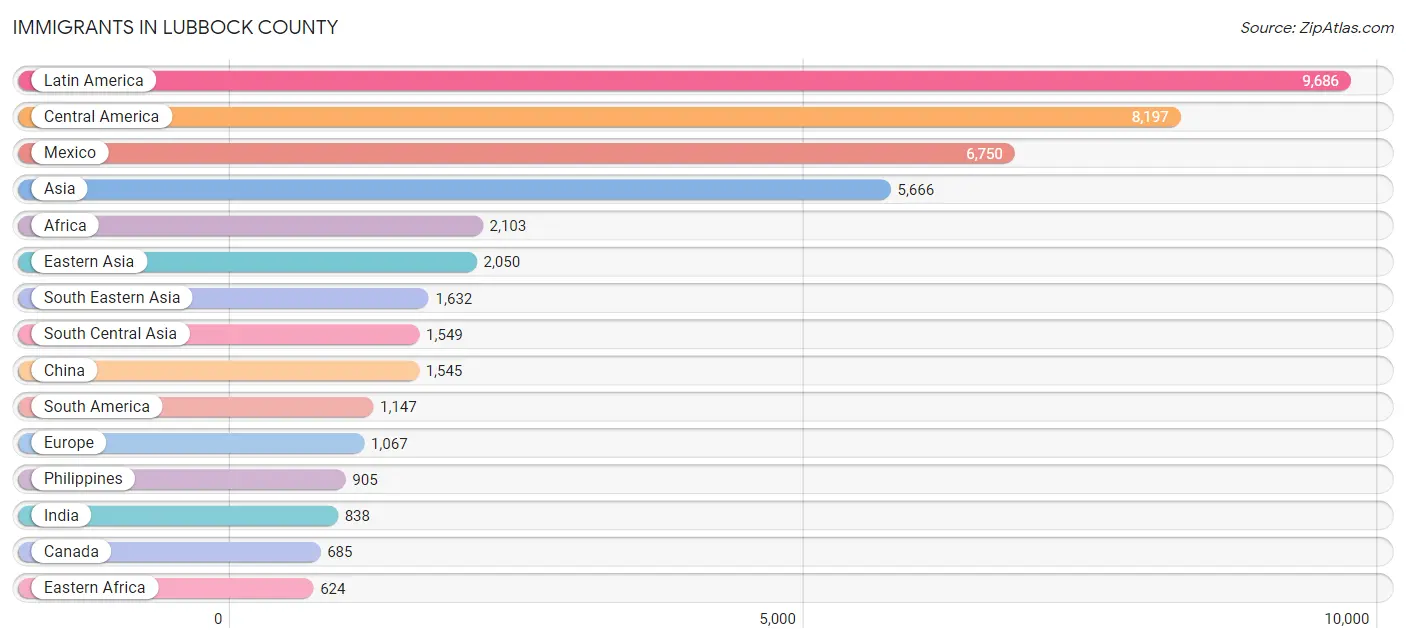
Immigrants in Lubbock County
The most numerous immigrant groups reported in Lubbock County came from Latin America (9,686 | 3.1%), Central America (8,197 | 2.6%), Mexico (6,750 | 2.2%), Asia (5,666 | 1.8%), and Africa (2,103 | 0.7%), together accounting for 10.4% of all Lubbock County residents.
| Immigration Origin | # Population | % Population |
| Afghanistan | 5 | 0.0% |
| Africa | 2,103 | 0.7% |
| Argentina | 11 | 0.0% |
| Asia | 5,666 | 1.8% |
| Australia | 22 | 0.0% |
| Bahamas | 7 | 0.0% |
| Bangladesh | 92 | 0.0% |
| Belarus | 78 | 0.0% |
| Belgium | 7 | 0.0% |
| Bolivia | 49 | 0.0% |
| Brazil | 139 | 0.0% |
| Bulgaria | 15 | 0.0% |
| Cambodia | 22 | 0.0% |
| Cameroon | 397 | 0.1% |
| Canada | 685 | 0.2% |
| Caribbean | 342 | 0.1% |
| Central America | 8,197 | 2.6% |
| Chile | 16 | 0.0% |
| China | 1,545 | 0.5% |
| Colombia | 169 | 0.1% |
| Cuba | 120 | 0.0% |
| Dominica | 26 | 0.0% |
| Eastern Africa | 624 | 0.2% |
| Eastern Asia | 2,050 | 0.7% |
| Eastern Europe | 454 | 0.2% |
| Ecuador | 26 | 0.0% |
| Egypt | 181 | 0.1% |
| El Salvador | 621 | 0.2% |
| England | 161 | 0.1% |
| Ethiopia | 360 | 0.1% |
| Europe | 1,067 | 0.3% |
| Fiji | 9 | 0.0% |
| France | 34 | 0.0% |
| Germany | 137 | 0.0% |
| Ghana | 49 | 0.0% |
| Greece | 3 | 0.0% |
| Guatemala | 215 | 0.1% |
| Guyana | 3 | 0.0% |
| Honduras | 479 | 0.2% |
| Hong Kong | 40 | 0.0% |
| Hungary | 23 | 0.0% |
| India | 838 | 0.3% |
| Indonesia | 66 | 0.0% |
| Iran | 198 | 0.1% |
| Iraq | 14 | 0.0% |
| Ireland | 11 | 0.0% |
| Israel | 36 | 0.0% |
| Italy | 15 | 0.0% |
| Jamaica | 74 | 0.0% |
| Japan | 130 | 0.0% |
| Jordan | 63 | 0.0% |
| Kenya | 142 | 0.1% |
| Korea | 375 | 0.1% |
| Kuwait | 42 | 0.0% |
| Latin America | 9,686 | 3.1% |
| Lebanon | 78 | 0.0% |
| Liberia | 9 | 0.0% |
| Lithuania | 13 | 0.0% |
| Malaysia | 12 | 0.0% |
| Mexico | 6,750 | 2.2% |
| Micronesia | 8 | 0.0% |
| Middle Africa | 414 | 0.1% |
| Morocco | 10 | 0.0% |
| Nepal | 203 | 0.1% |
| Netherlands | 12 | 0.0% |
| Nicaragua | 34 | 0.0% |
| Nigeria | 401 | 0.1% |
| Northern Africa | 367 | 0.1% |
| Northern Europe | 356 | 0.1% |
| Norway | 21 | 0.0% |
| Oceania | 137 | 0.0% |
| Pakistan | 86 | 0.0% |
| Panama | 98 | 0.0% |
| Peru | 334 | 0.1% |
| Philippines | 905 | 0.3% |
| Poland | 39 | 0.0% |
| Romania | 8 | 0.0% |
| Russia | 249 | 0.1% |
| Saudi Arabia | 45 | 0.0% |
| Singapore | 6 | 0.0% |
| South Africa | 67 | 0.0% |
| South America | 1,147 | 0.4% |
| South Central Asia | 1,549 | 0.5% |
| South Eastern Asia | 1,632 | 0.5% |
| Southern Europe | 67 | 0.0% |
| Spain | 49 | 0.0% |
| Sri Lanka | 127 | 0.0% |
| Sudan | 41 | 0.0% |
| Sweden | 62 | 0.0% |
| Syria | 7 | 0.0% |
| Taiwan | 114 | 0.0% |
| Thailand | 135 | 0.0% |
| Trinidad and Tobago | 115 | 0.0% |
| Turkey | 117 | 0.0% |
| Uganda | 25 | 0.0% |
| Ukraine | 18 | 0.0% |
| Uruguay | 11 | 0.0% |
| Venezuela | 389 | 0.1% |
| Vietnam | 478 | 0.2% |
| Western Africa | 459 | 0.2% |
| Western Asia | 426 | 0.1% |
| Western Europe | 190 | 0.1% |
| Yemen | 15 | 0.0% |
| Zimbabwe | 35 | 0.0% | View All 104 Rows |
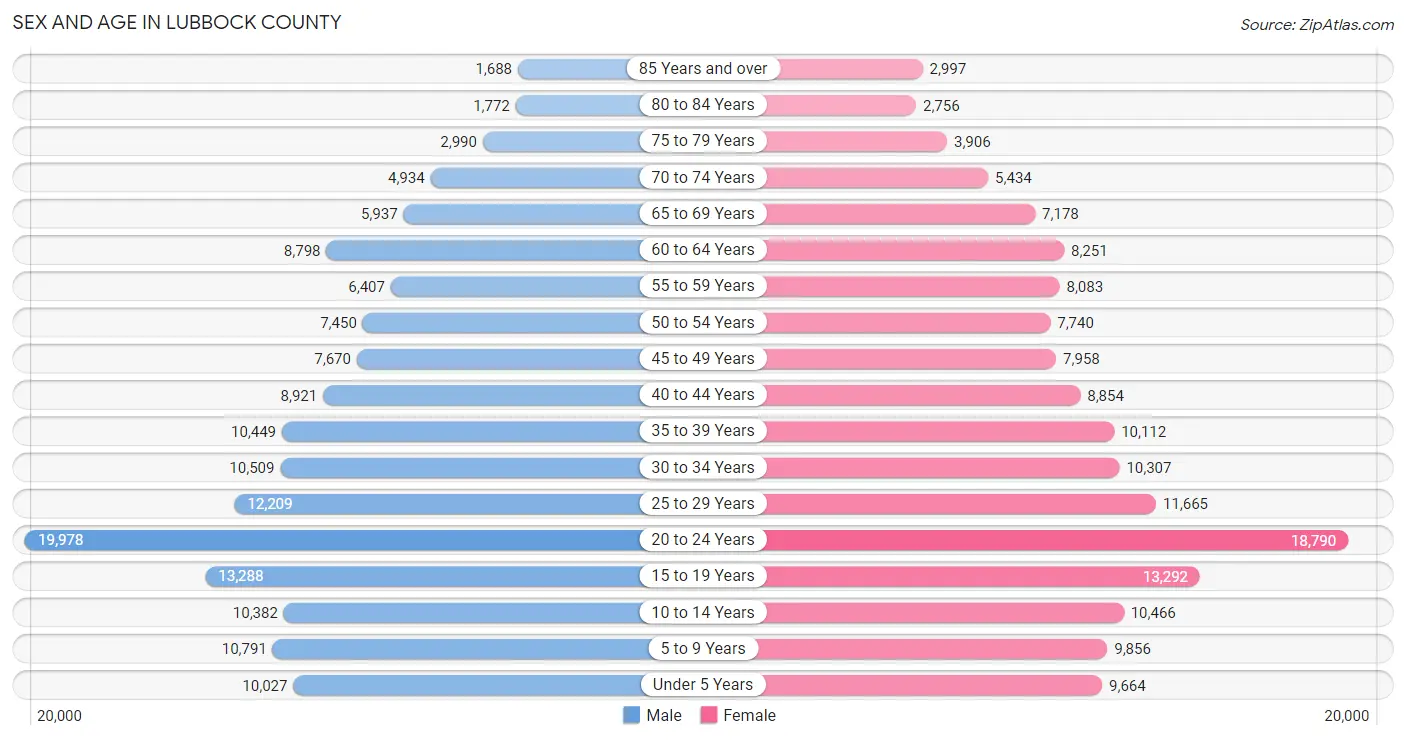
Sex and Age in Lubbock County
Sex and Age in Lubbock County
The most populous age groups in Lubbock County are 20 to 24 Years (19,978 | 13.0%) for men and 20 to 24 Years (18,790 | 11.9%) for women.
| Age Bracket | Male | Female |
| Under 5 Years | 10,027 (6.5%) | 9,664 (6.1%) |
| 5 to 9 Years | 10,791 (7.0%) | 9,856 (6.3%) |
| 10 to 14 Years | 10,382 (6.7%) | 10,466 (6.7%) |
| 15 to 19 Years | 13,288 (8.6%) | 13,292 (8.5%) |
| 20 to 24 Years | 19,978 (13.0%) | 18,790 (11.9%) |
| 25 to 29 Years | 12,209 (7.9%) | 11,665 (7.4%) |
| 30 to 34 Years | 10,509 (6.8%) | 10,307 (6.6%) |
| 35 to 39 Years | 10,449 (6.8%) | 10,112 (6.4%) |
| 40 to 44 Years | 8,921 (5.8%) | 8,854 (5.6%) |
| 45 to 49 Years | 7,670 (5.0%) | 7,958 (5.1%) |
| 50 to 54 Years | 7,450 (4.8%) | 7,740 (4.9%) |
| 55 to 59 Years | 6,407 (4.2%) | 8,083 (5.1%) |
| 60 to 64 Years | 8,798 (5.7%) | 8,251 (5.2%) |
| 65 to 69 Years | 5,937 (3.8%) | 7,178 (4.6%) |
| 70 to 74 Years | 4,934 (3.2%) | 5,434 (3.5%) |
| 75 to 79 Years | 2,990 (1.9%) | 3,906 (2.5%) |
| 80 to 84 Years | 1,772 (1.1%) | 2,756 (1.8%) |
| 85 Years and over | 1,688 (1.1%) | 2,997 (1.9%) |
| Total | 154,200 (100.0%) | 157,309 (100.0%) |
Families and Households in Lubbock County
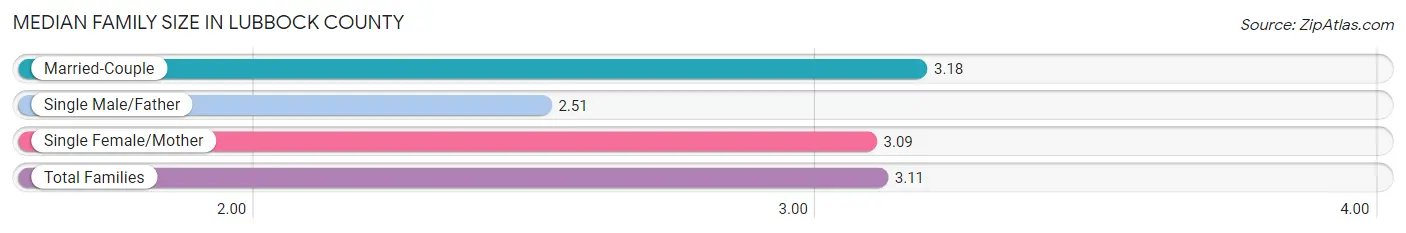
Median Family Size in Lubbock County
The median family size in Lubbock County is 3.11 persons per family, with married-couple families (51,316 | 70.6%) accounting for the largest median family size of 3.18 persons per family. On the other hand, single male/father families (5,580 | 7.7%) represent the smallest median family size with 2.51 persons per family.
| Family Type | # Families | Family Size |
| Married-Couple | 51,316 (70.6%) | 3.18 |
| Single Male/Father | 5,580 (7.7%) | 2.51 |
| Single Female/Mother | 15,752 (21.7%) | 3.09 |
| Total Families | 72,648 (100.0%) | 3.11 |
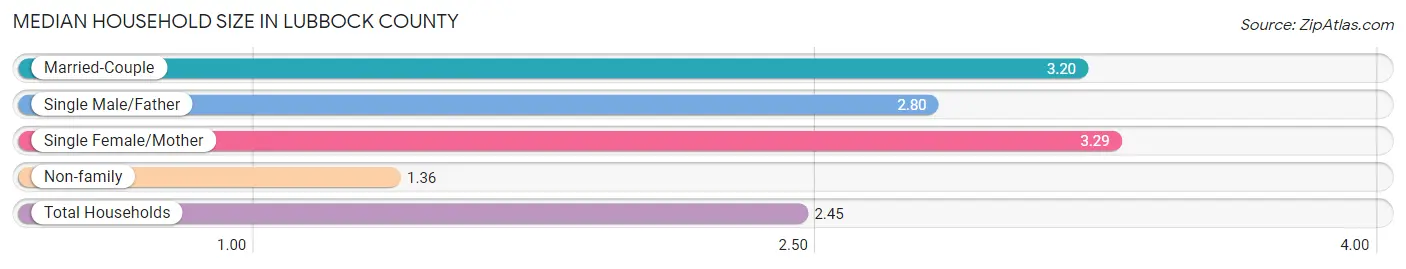
Median Household Size in Lubbock County
The median household size in Lubbock County is 2.45 persons per household, with single female/mother households (15,752 | 12.9%) accounting for the largest median household size of 3.29 persons per household. non-family households (49,037 | 40.3%) represent the smallest median household size with 1.36 persons per household.
| Household Type | # Households | Household Size |
| Married-Couple | 51,316 (42.2%) | 3.20 |
| Single Male/Father | 5,580 (4.6%) | 2.80 |
| Single Female/Mother | 15,752 (12.9%) | 3.29 |
| Non-family | 49,037 (40.3%) | 1.36 |
| Total Households | 121,685 (100.0%) | 2.45 |
Household Size by Marriage Status in Lubbock County
Out of a total of 121,685 households in Lubbock County, 72,648 (59.7%) are family households, while 49,037 (40.3%) are nonfamily households. The most numerous type of family households are 2-person households, comprising 31,642, and the most common type of nonfamily households are 1-person households, comprising 35,583.
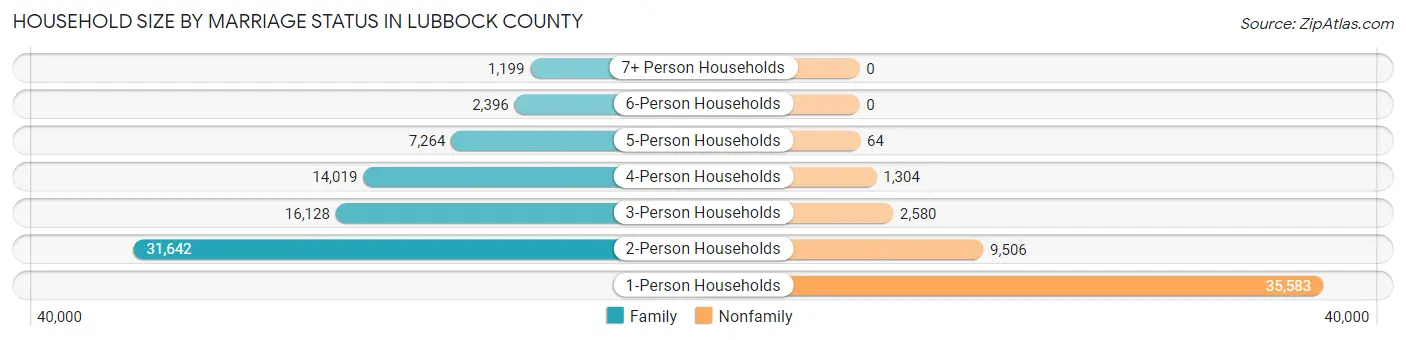
| Household Size | Family Households | Nonfamily Households |
| 1-Person Households | - | 35,583 (29.2%) |
| 2-Person Households | 31,642 (26.0%) | 9,506 (7.8%) |
| 3-Person Households | 16,128 (13.3%) | 2,580 (2.1%) |
| 4-Person Households | 14,019 (11.5%) | 1,304 (1.1%) |
| 5-Person Households | 7,264 (6.0%) | 64 (0.1%) |
| 6-Person Households | 2,396 (2.0%) | 0 (0.0%) |
| 7+ Person Households | 1,199 (1.0%) | 0 (0.0%) |
| Total | 72,648 (59.7%) | 49,037 (40.3%) |
Female Fertility in Lubbock County
Fertility by Age in Lubbock County
Average fertility rate in Lubbock County is 53.0 births per 1,000 women. Women in the age bracket of 20 to 34 years have the highest fertility rate with 86.0 births per 1,000 women. Women in the age bracket of 20 to 34 years acount for 80.0% of all women with births.
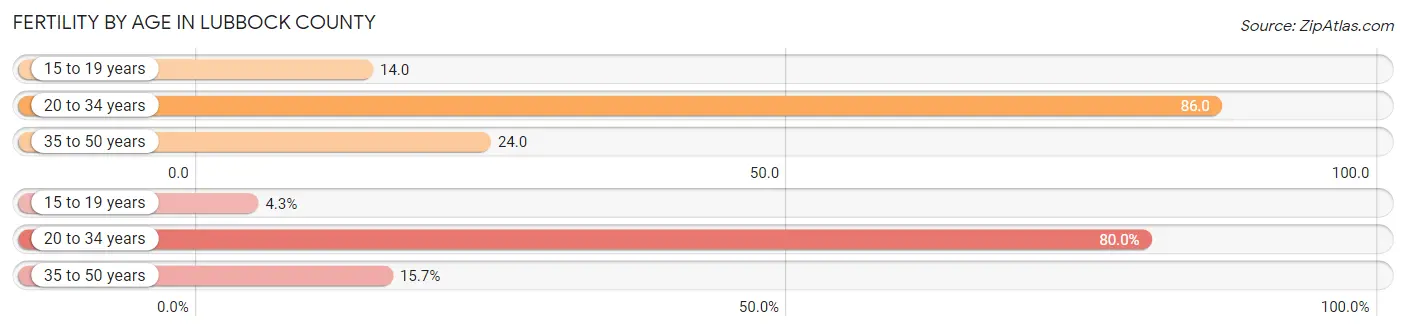
| Age Bracket | Women with Births | Births / 1,000 Women |
| 15 to 19 years | 187 (4.3%) | 14.0 |
| 20 to 34 years | 3,499 (80.0%) | 86.0 |
| 35 to 50 years | 686 (15.7%) | 24.0 |
| Total | 4,372 (100.0%) | 53.0 |
Fertility by Age by Marriage Status in Lubbock County
59.9% of women with births (4,372) in Lubbock County are married. The highest percentage of unmarried women with births falls into 15 to 19 years age bracket with 57.2% of them unmarried at the time of birth, while the lowest percentage of unmarried women with births belong to 35 to 50 years age bracket with 32.2% of them unmarried.
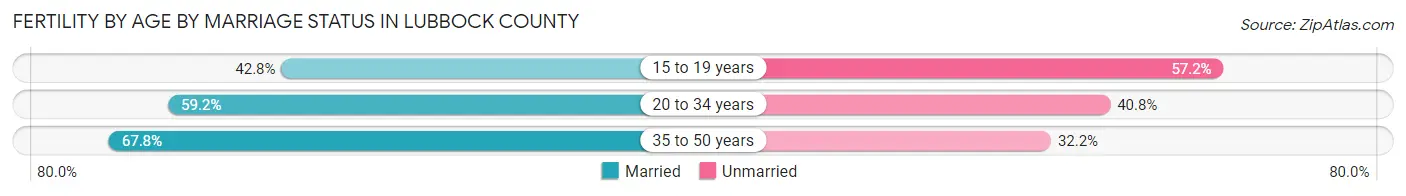
| Age Bracket | Married | Unmarried |
| 15 to 19 years | 80 (42.8%) | 107 (57.2%) |
| 20 to 34 years | 2,071 (59.2%) | 1,428 (40.8%) |
| 35 to 50 years | 465 (67.8%) | 221 (32.2%) |
| Total | 2,619 (59.9%) | 1,753 (40.1%) |
Fertility by Education in Lubbock County
Average fertility rate in Lubbock County is 53.0 births per 1,000 women. Women with the education attainment of graduate degree have the highest fertility rate of 67.0 births per 1,000 women, while women with the education attainment of college or associate's degree have the lowest fertility at 48.0 births per 1,000 women. Women with the education attainment of college or associate's degree represent 32.7% of all women with births.
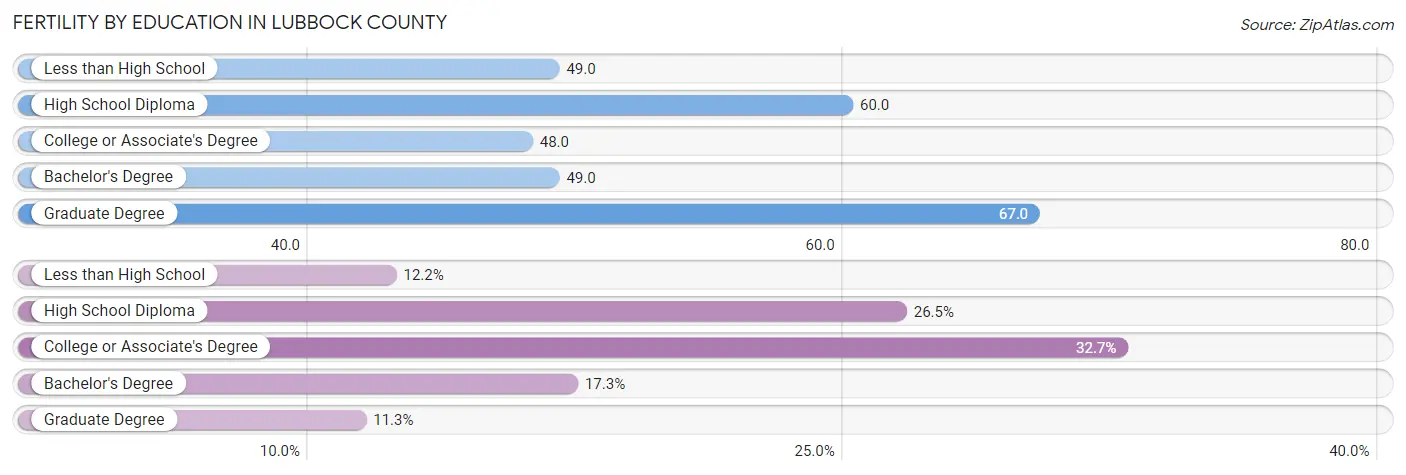
| Educational Attainment | Women with Births | Births / 1,000 Women |
| Less than High School | 532 (12.2%) | 49.0 |
| High School Diploma | 1,159 (26.5%) | 60.0 |
| College or Associate's Degree | 1,431 (32.7%) | 48.0 |
| Bachelor's Degree | 755 (17.3%) | 49.0 |
| Graduate Degree | 495 (11.3%) | 67.0 |
| Total | 4,372 (100.0%) | 53.0 |
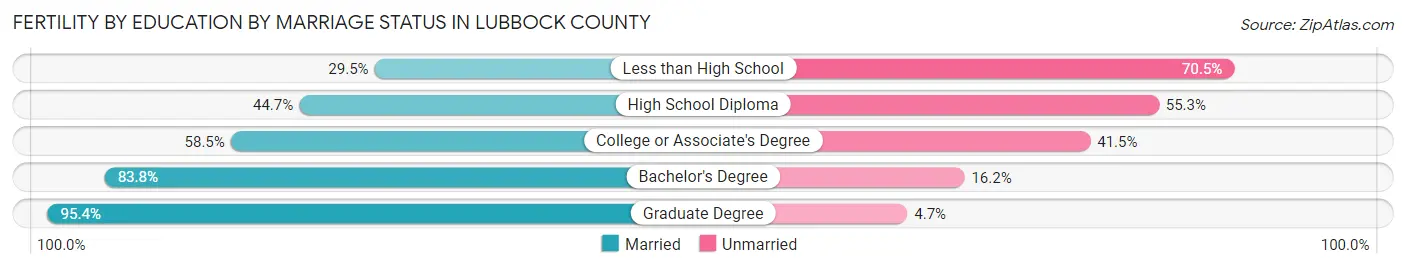
Fertility by Education by Marriage Status in Lubbock County
40.1% of women with births in Lubbock County are unmarried. Women with the educational attainment of graduate degree are most likely to be married with 95.4% of them married at childbirth, while women with the educational attainment of less than high school are least likely to be married with 70.5% of them unmarried at childbirth.
| Educational Attainment | Married | Unmarried |
| Less than High School | 157 (29.5%) | 375 (70.5%) |
| High School Diploma | 518 (44.7%) | 641 (55.3%) |
| College or Associate's Degree | 837 (58.5%) | 594 (41.5%) |
| Bachelor's Degree | 633 (83.8%) | 122 (16.2%) |
| Graduate Degree | 472 (95.4%) | 23 (4.6%) |
| Total | 2,619 (59.9%) | 1,753 (40.1%) |
Employment Characteristics in Lubbock County
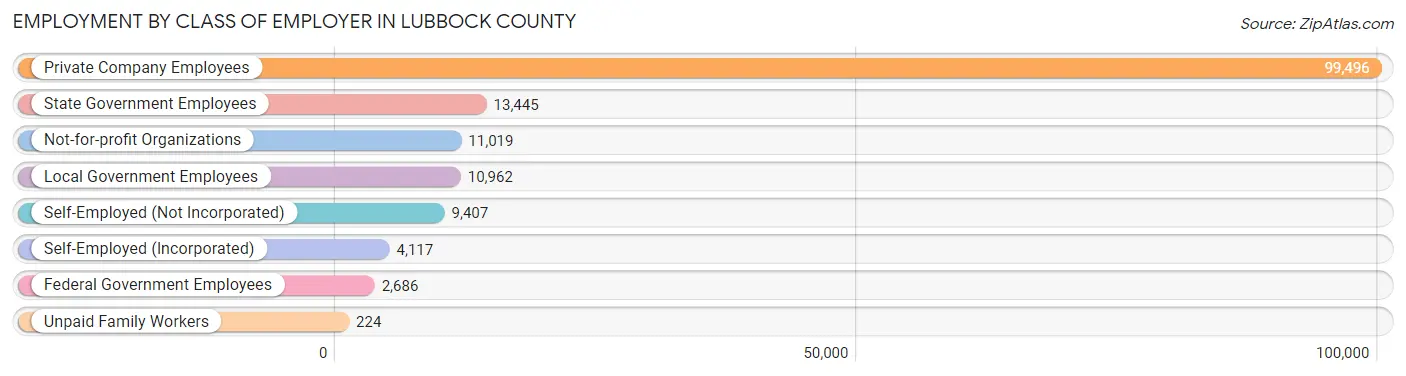
Employment by Class of Employer in Lubbock County
Among the 151,356 employed individuals in Lubbock County, private company employees (99,496 | 65.7%), state government employees (13,445 | 8.9%), and not-for-profit organizations (11,019 | 7.3%) make up the most common classes of employment.
| Employer Class | # Employees | % Employees |
| Private Company Employees | 99,496 | 65.7% |
| Self-Employed (Incorporated) | 4,117 | 2.7% |
| Self-Employed (Not Incorporated) | 9,407 | 6.2% |
| Not-for-profit Organizations | 11,019 | 7.3% |
| Local Government Employees | 10,962 | 7.2% |
| State Government Employees | 13,445 | 8.9% |
| Federal Government Employees | 2,686 | 1.8% |
| Unpaid Family Workers | 224 | 0.2% |
| Total | 151,356 | 100.0% |
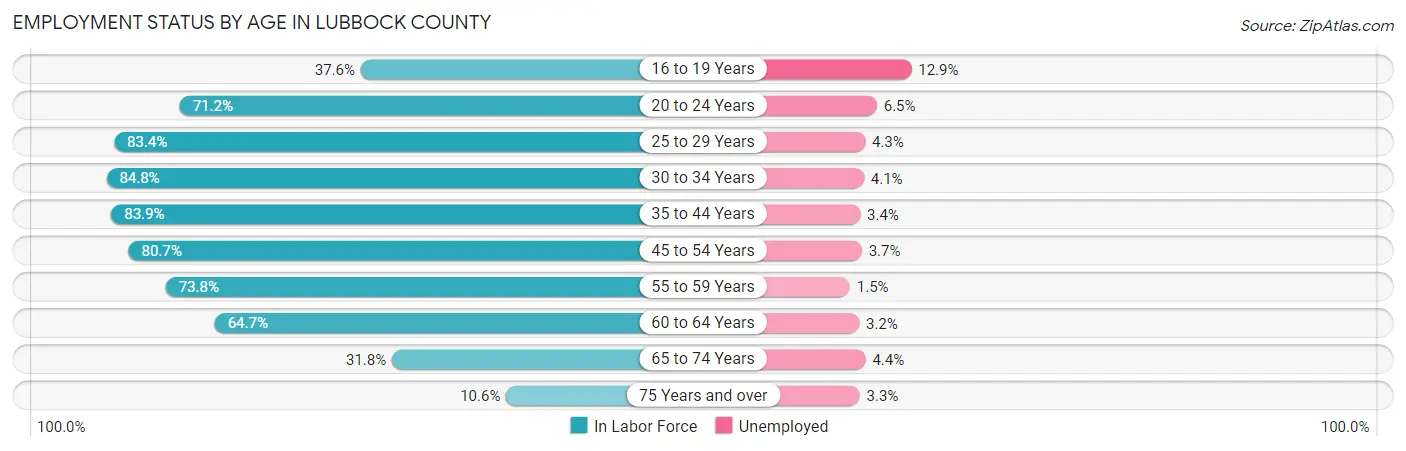
Employment Status by Age in Lubbock County
According to the labor force statistics for Lubbock County, out of the total population over 16 years of age (246,456), 65.6% or 161,675 individuals are in the labor force, with 4.6% or 7,437 of them unemployed. The age group with the highest labor force participation rate is 30 to 34 years, with 84.8% or 17,652 individuals in the labor force. Within the labor force, the 16 to 19 years age range has the highest percentage of unemployed individuals, with 12.9% or 1,102 of them being unemployed.
| Age Bracket | In Labor Force | Unemployed |
| 16 to 19 Years | 8,540 (37.6%) | 1,102 (12.9%) |
| 20 to 24 Years | 27,603 (71.2%) | 1,794 (6.5%) |
| 25 to 29 Years | 19,911 (83.4%) | 856 (4.3%) |
| 30 to 34 Years | 17,652 (84.8%) | 724 (4.1%) |
| 35 to 44 Years | 32,164 (83.9%) | 1,094 (3.4%) |
| 45 to 54 Years | 24,870 (80.7%) | 920 (3.7%) |
| 55 to 59 Years | 10,694 (73.8%) | 160 (1.5%) |
| 60 to 64 Years | 11,031 (64.7%) | 353 (3.2%) |
| 65 to 74 Years | 7,468 (31.8%) | 329 (4.4%) |
| 75 Years and over | 1,708 (10.6%) | 56 (3.3%) |
| Total | 161,675 (65.6%) | 7,437 (4.6%) |
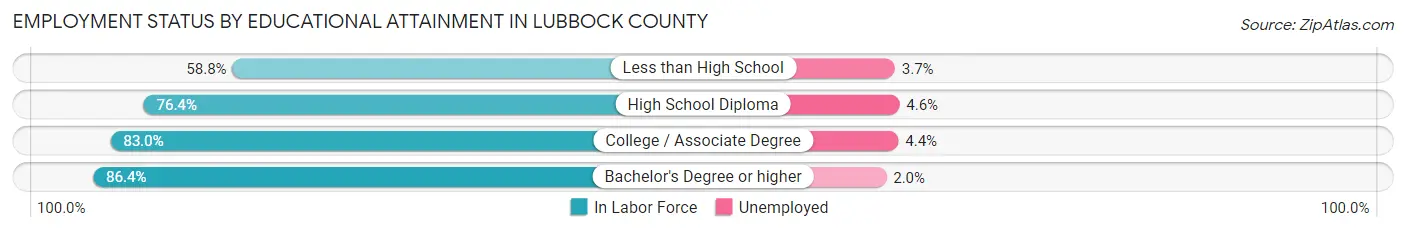
Employment Status by Educational Attainment in Lubbock County
According to labor force statistics for Lubbock County, 80.0% of individuals (116,306) out of the total population between 25 and 64 years of age (145,383) are in the labor force, with 3.5% or 4,071 of them being unemployed. The group with the highest labor force participation rate are those with the educational attainment of bachelor's degree or higher, with 86.4% or 41,323 individuals in the labor force. Within the labor force, individuals with high school diploma education have the highest percentage of unemployment, with 4.6% or 1,309 of them being unemployed.
| Educational Attainment | In Labor Force | Unemployed |
| Less than High School | 8,531 (58.8%) | 537 (3.7%) |
| High School Diploma | 28,462 (76.4%) | 1,714 (4.6%) |
| College / Associate Degree | 38,007 (83.0%) | 2,015 (4.4%) |
| Bachelor's Degree or higher | 41,323 (86.4%) | 957 (2.0%) |
| Total | 116,306 (80.0%) | 5,088 (3.5%) |
Employment Occupations by Sex in Lubbock County
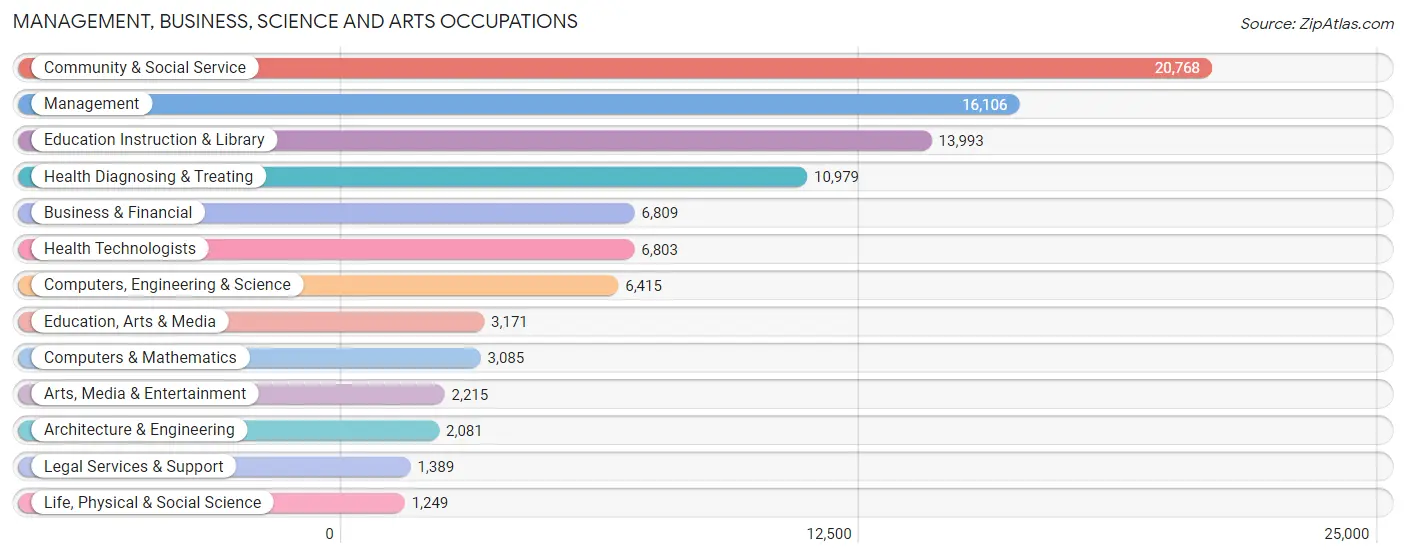
Management, Business, Science and Arts Occupations
The most common Management, Business, Science and Arts occupations in Lubbock County are Community & Social Service (20,768 | 13.5%), Management (16,106 | 10.5%), Education Instruction & Library (13,993 | 9.1%), Health Diagnosing & Treating (10,979 | 7.1%), and Business & Financial (6,809 | 4.4%).
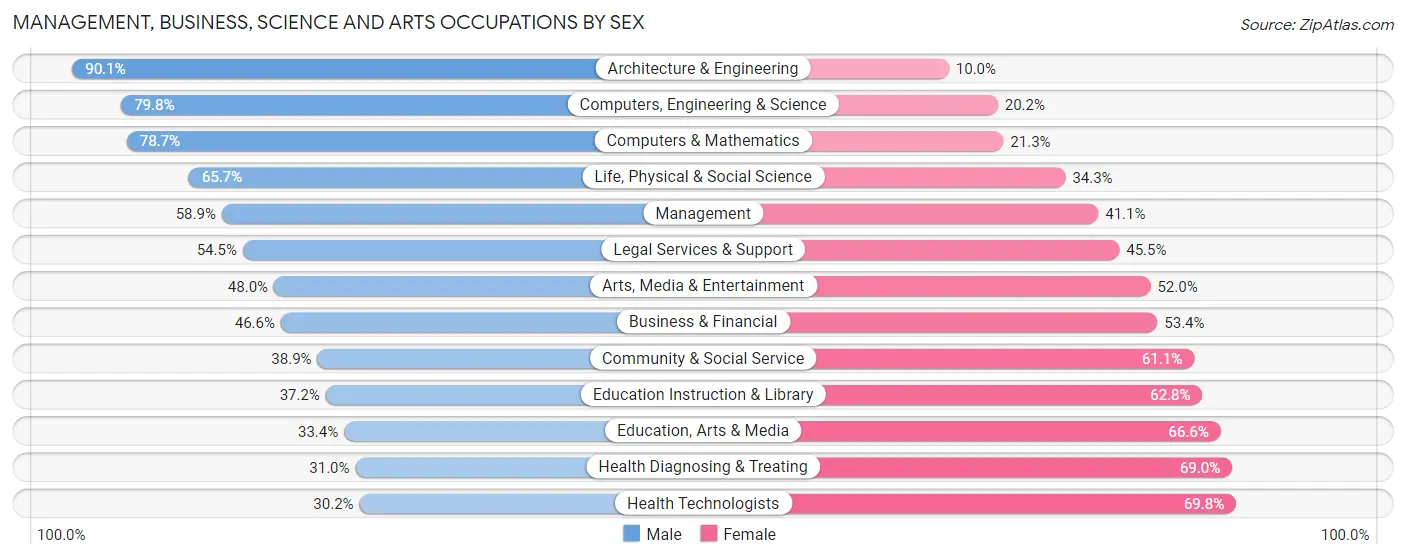
Management, Business, Science and Arts Occupations by Sex
Within the Management, Business, Science and Arts occupations in Lubbock County, the most male-oriented occupations are Architecture & Engineering (90.0%), Computers, Engineering & Science (79.8%), and Computers & Mathematics (78.7%), while the most female-oriented occupations are Health Technologists (69.8%), Health Diagnosing & Treating (69.0%), and Education, Arts & Media (66.6%).
| Occupation | Male | Female |
| Management | 9,483 (58.9%) | 6,623 (41.1%) |
| Business & Financial | 3,170 (46.6%) | 3,639 (53.4%) |
| Computers, Engineering & Science | 5,122 (79.8%) | 1,293 (20.2%) |
| Computers & Mathematics | 2,427 (78.7%) | 658 (21.3%) |
| Architecture & Engineering | 1,874 (90.0%) | 207 (10.0%) |
| Life, Physical & Social Science | 821 (65.7%) | 428 (34.3%) |
| Community & Social Service | 8,082 (38.9%) | 12,686 (61.1%) |
| Education, Arts & Media | 1,058 (33.4%) | 2,113 (66.6%) |
| Legal Services & Support | 757 (54.5%) | 632 (45.5%) |
| Education Instruction & Library | 5,204 (37.2%) | 8,789 (62.8%) |
| Arts, Media & Entertainment | 1,063 (48.0%) | 1,152 (52.0%) |
| Health Diagnosing & Treating | 3,404 (31.0%) | 7,575 (69.0%) |
| Health Technologists | 2,052 (30.2%) | 4,751 (69.8%) |
| Total (Category) | 29,261 (47.9%) | 31,816 (52.1%) |
| Total (Overall) | 80,794 (52.5%) | 73,013 (47.5%) |
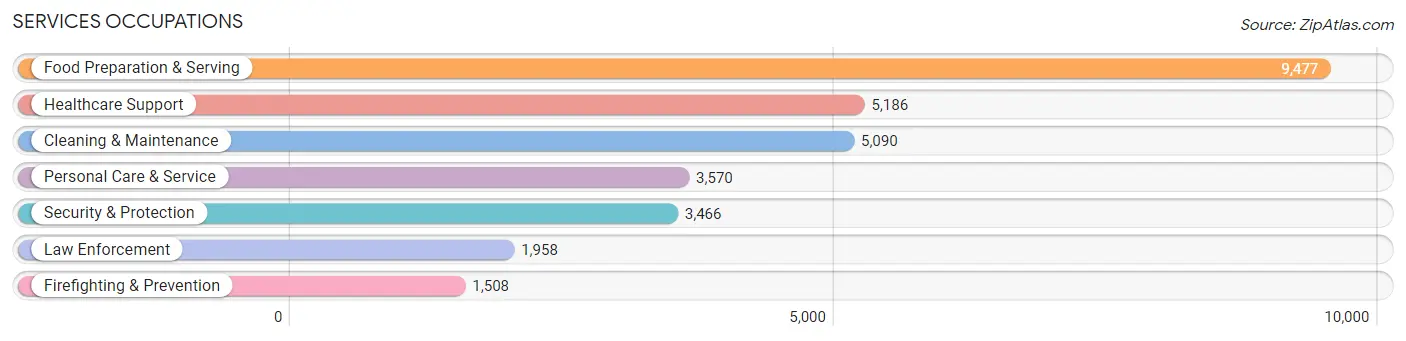
Services Occupations
The most common Services occupations in Lubbock County are Food Preparation & Serving (9,477 | 6.2%), Healthcare Support (5,186 | 3.4%), Cleaning & Maintenance (5,090 | 3.3%), Personal Care & Service (3,570 | 2.3%), and Security & Protection (3,466 | 2.2%).
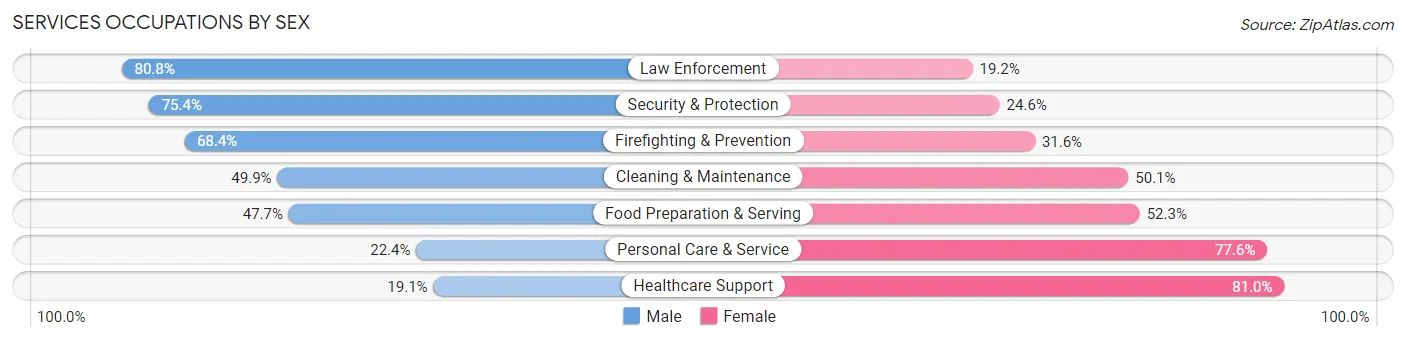
Services Occupations by Sex
Within the Services occupations in Lubbock County, the most male-oriented occupations are Law Enforcement (80.8%), Security & Protection (75.4%), and Firefighting & Prevention (68.4%), while the most female-oriented occupations are Healthcare Support (80.9%), Personal Care & Service (77.6%), and Food Preparation & Serving (52.3%).
| Occupation | Male | Female |
| Healthcare Support | 988 (19.1%) | 4,198 (80.9%) |
| Security & Protection | 2,614 (75.4%) | 852 (24.6%) |
| Firefighting & Prevention | 1,032 (68.4%) | 476 (31.6%) |
| Law Enforcement | 1,582 (80.8%) | 376 (19.2%) |
| Food Preparation & Serving | 4,520 (47.7%) | 4,957 (52.3%) |
| Cleaning & Maintenance | 2,542 (49.9%) | 2,548 (50.1%) |
| Personal Care & Service | 801 (22.4%) | 2,769 (77.6%) |
| Total (Category) | 11,465 (42.8%) | 15,324 (57.2%) |
| Total (Overall) | 80,794 (52.5%) | 73,013 (47.5%) |
Sales and Office Occupations
The most common Sales and Office occupations in Lubbock County are Office & Administration (17,794 | 11.6%), and Sales & Related (17,130 | 11.1%).
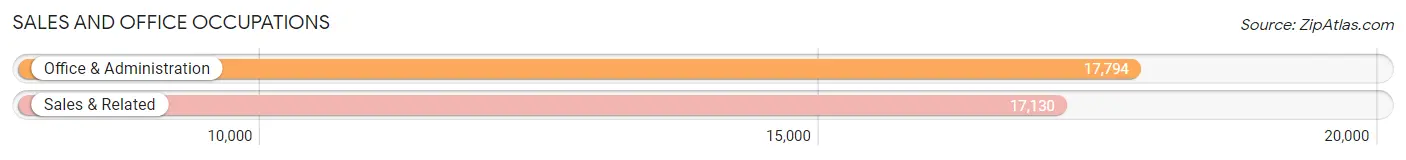
Sales and Office Occupations by Sex
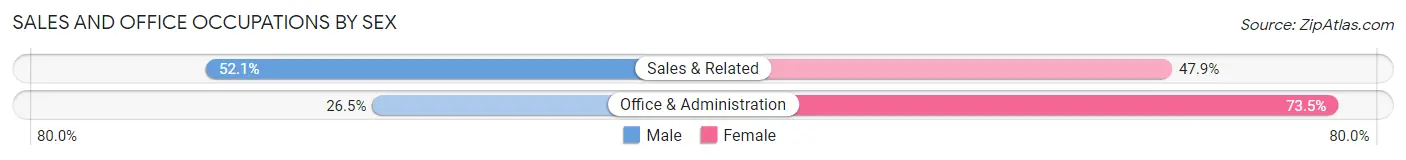
| Occupation | Male | Female |
| Sales & Related | 8,922 (52.1%) | 8,208 (47.9%) |
| Office & Administration | 4,719 (26.5%) | 13,075 (73.5%) |
| Total (Category) | 13,641 (39.1%) | 21,283 (60.9%) |
| Total (Overall) | 80,794 (52.5%) | 73,013 (47.5%) |
Natural Resources, Construction and Maintenance Occupations
The most common Natural Resources, Construction and Maintenance occupations in Lubbock County are Construction & Extraction (8,196 | 5.3%), Installation, Maintenance & Repair (4,973 | 3.2%), and Farming, Fishing & Forestry (284 | 0.2%).
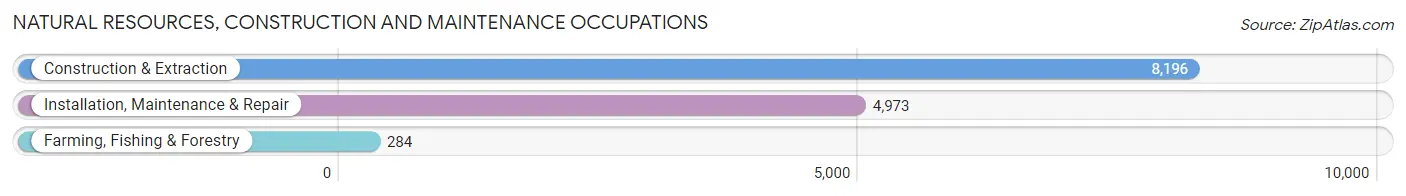
Natural Resources, Construction and Maintenance Occupations by Sex
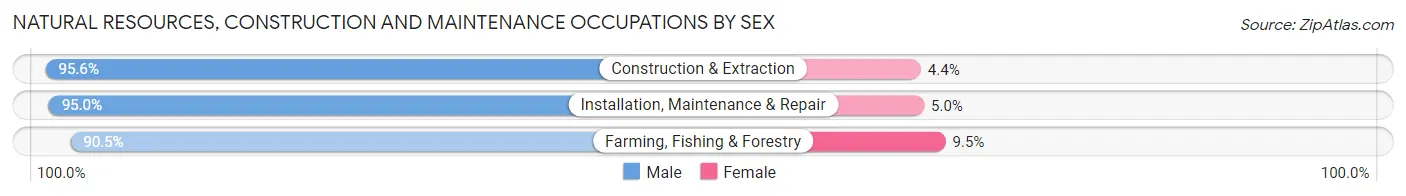
| Occupation | Male | Female |
| Farming, Fishing & Forestry | 257 (90.5%) | 27 (9.5%) |
| Construction & Extraction | 7,838 (95.6%) | 358 (4.4%) |
| Installation, Maintenance & Repair | 4,723 (95.0%) | 250 (5.0%) |
| Total (Category) | 12,818 (95.3%) | 635 (4.7%) |
| Total (Overall) | 80,794 (52.5%) | 73,013 (47.5%) |
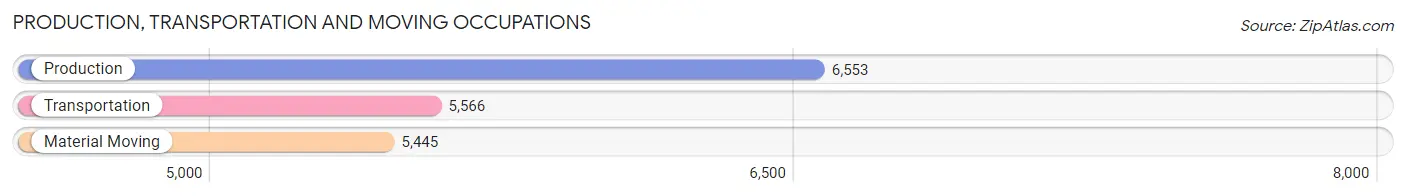
Production, Transportation and Moving Occupations
The most common Production, Transportation and Moving occupations in Lubbock County are Production (6,553 | 4.3%), Transportation (5,566 | 3.6%), and Material Moving (5,445 | 3.5%).
Production, Transportation and Moving Occupations by Sex
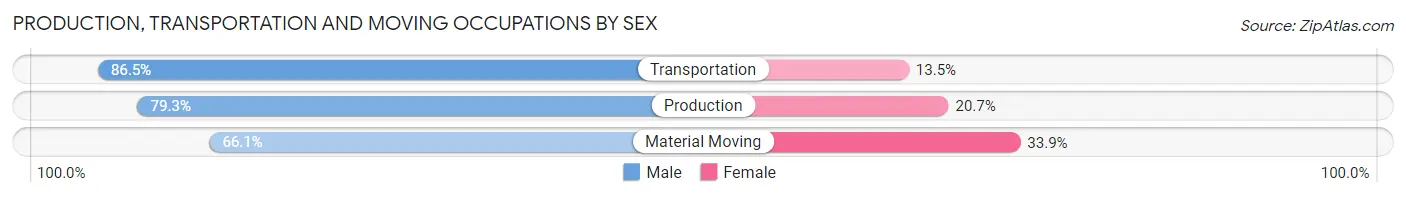
| Occupation | Male | Female |
| Production | 5,194 (79.3%) | 1,359 (20.7%) |
| Transportation | 4,817 (86.5%) | 749 (13.5%) |
| Material Moving | 3,598 (66.1%) | 1,847 (33.9%) |
| Total (Category) | 13,609 (77.5%) | 3,955 (22.5%) |
| Total (Overall) | 80,794 (52.5%) | 73,013 (47.5%) |
Employment Industries by Sex in Lubbock County
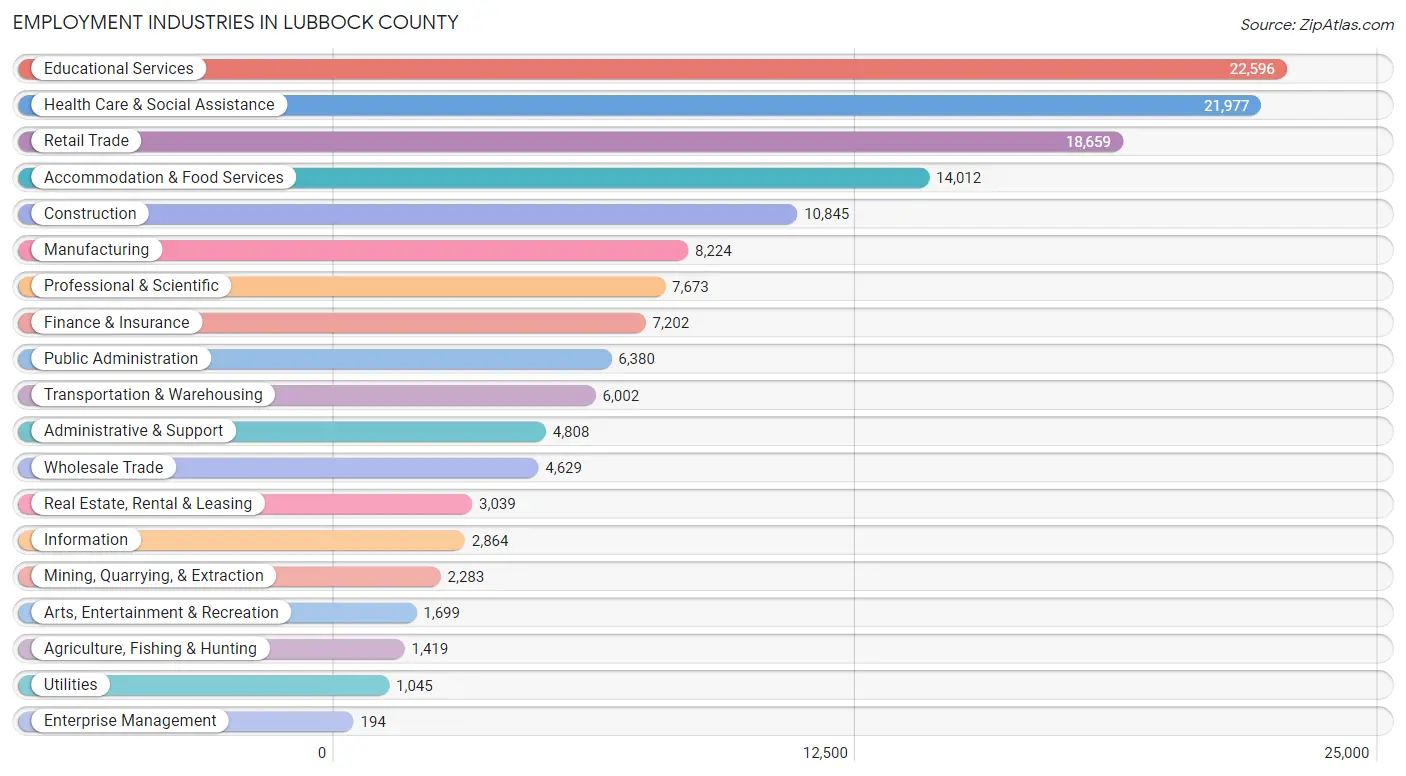
Employment Industries in Lubbock County
The major employment industries in Lubbock County include Educational Services (22,596 | 14.7%), Health Care & Social Assistance (21,977 | 14.3%), Retail Trade (18,659 | 12.1%), Accommodation & Food Services (14,012 | 9.1%), and Construction (10,845 | 7.0%).
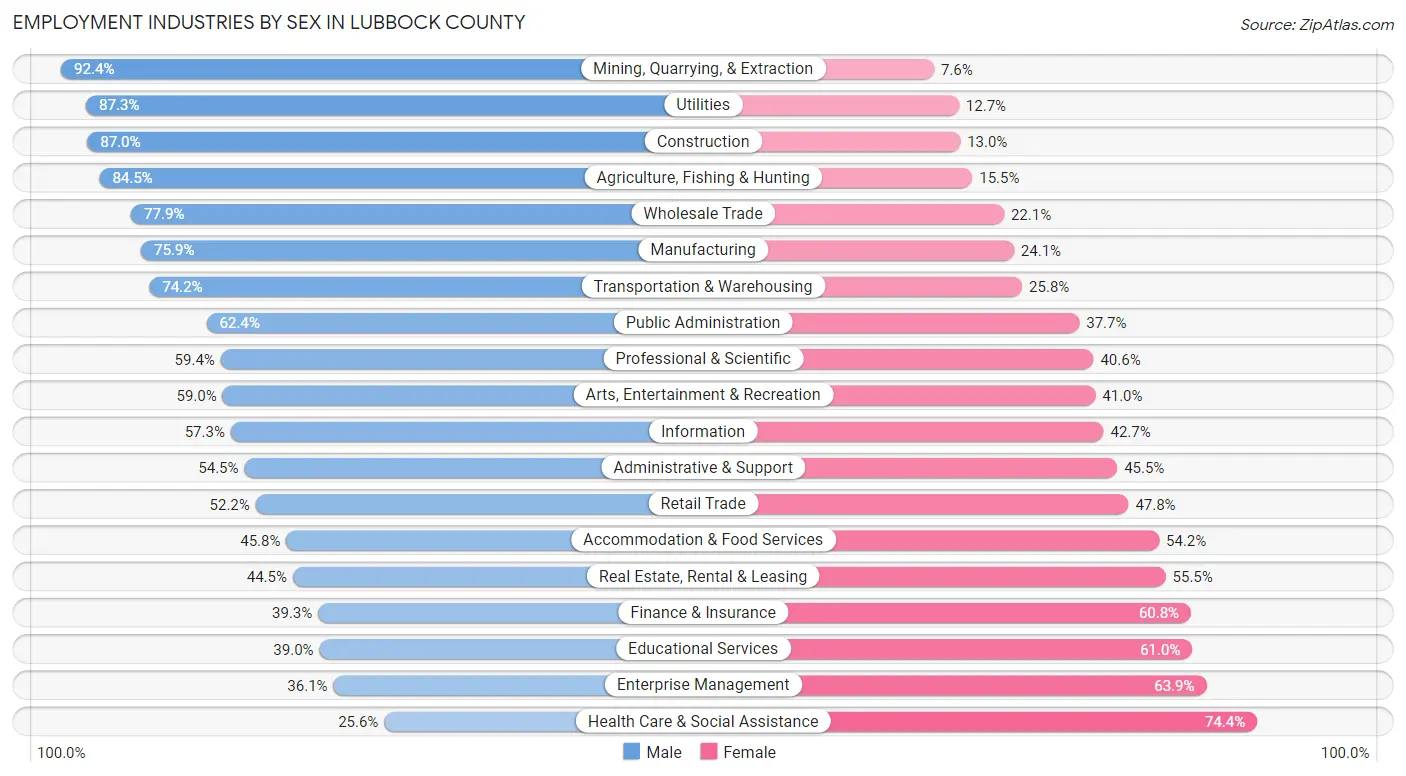
Employment Industries by Sex in Lubbock County
The Lubbock County industries that see more men than women are Mining, Quarrying, & Extraction (92.4%), Utilities (87.3%), and Construction (87.0%), whereas the industries that tend to have a higher number of women are Health Care & Social Assistance (74.4%), Enterprise Management (63.9%), and Educational Services (61.0%).
| Industry | Male | Female |
| Agriculture, Fishing & Hunting | 1,199 (84.5%) | 220 (15.5%) |
| Mining, Quarrying, & Extraction | 2,110 (92.4%) | 173 (7.6%) |
| Construction | 9,436 (87.0%) | 1,409 (13.0%) |
| Manufacturing | 6,241 (75.9%) | 1,983 (24.1%) |
| Wholesale Trade | 3,608 (77.9%) | 1,021 (22.1%) |
| Retail Trade | 9,737 (52.2%) | 8,922 (47.8%) |
| Transportation & Warehousing | 4,452 (74.2%) | 1,550 (25.8%) |
| Utilities | 912 (87.3%) | 133 (12.7%) |
| Information | 1,642 (57.3%) | 1,222 (42.7%) |
| Finance & Insurance | 2,827 (39.3%) | 4,375 (60.8%) |
| Real Estate, Rental & Leasing | 1,352 (44.5%) | 1,687 (55.5%) |
| Professional & Scientific | 4,559 (59.4%) | 3,114 (40.6%) |
| Enterprise Management | 70 (36.1%) | 124 (63.9%) |
| Administrative & Support | 2,621 (54.5%) | 2,187 (45.5%) |
| Educational Services | 8,808 (39.0%) | 13,788 (61.0%) |
| Health Care & Social Assistance | 5,620 (25.6%) | 16,357 (74.4%) |
| Arts, Entertainment & Recreation | 1,003 (59.0%) | 696 (41.0%) |
| Accommodation & Food Services | 6,423 (45.8%) | 7,589 (54.2%) |
| Public Administration | 3,978 (62.4%) | 2,402 (37.7%) |
| Total | 80,794 (52.5%) | 73,013 (47.5%) |
Education in Lubbock County
School Enrollment in Lubbock County
The most common levels of schooling among the 99,440 students in Lubbock County are college / undergraduate (34,002 | 34.2%), elementary school (16,304 | 16.4%), and high school (16,276 | 16.4%).
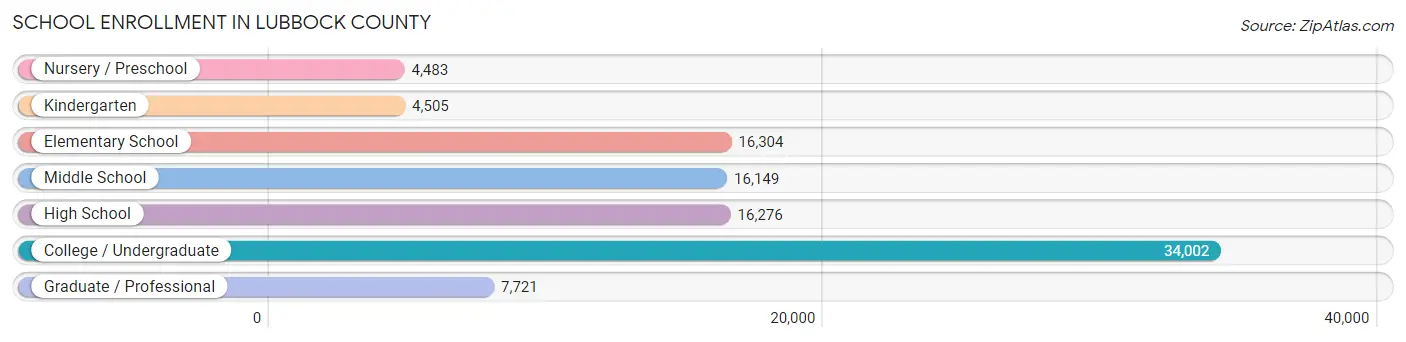
| School Level | # Students | % Students |
| Nursery / Preschool | 4,483 | 4.5% |
| Kindergarten | 4,505 | 4.5% |
| Elementary School | 16,304 | 16.4% |
| Middle School | 16,149 | 16.2% |
| High School | 16,276 | 16.4% |
| College / Undergraduate | 34,002 | 34.2% |
| Graduate / Professional | 7,721 | 7.8% |
| Total | 99,440 | 100.0% |
School Enrollment by Age by Funding Source in Lubbock County
Out of a total of 99,440 students who are enrolled in schools in Lubbock County, 11,436 (11.5%) attend a private institution, while the remaining 88,004 (88.5%) are enrolled in public schools. The age group of 3 to 4 year olds has the highest likelihood of being enrolled in private schools, with 1,447 (40.5% in the age bracket) enrolled. Conversely, the age group of 25 to 34 year olds has the lowest likelihood of being enrolled in a private school, with 6,437 (92.0% in the age bracket) attending a public institution.
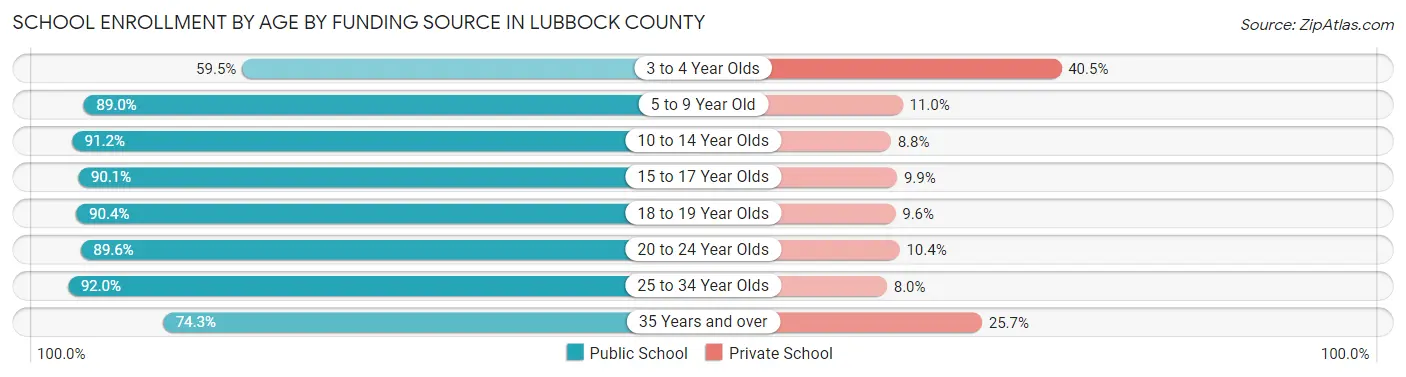
| Age Bracket | Public School | Private School |
| 3 to 4 Year Olds | 2,124 (59.5%) | 1,447 (40.5%) |
| 5 to 9 Year Old | 17,228 (89.0%) | 2,120 (11.0%) |
| 10 to 14 Year Olds | 18,563 (91.2%) | 1,785 (8.8%) |
| 15 to 17 Year Olds | 10,811 (90.1%) | 1,192 (9.9%) |
| 18 to 19 Year Olds | 10,406 (90.4%) | 1,106 (9.6%) |
| 20 to 24 Year Olds | 19,832 (89.6%) | 2,302 (10.4%) |
| 25 to 34 Year Olds | 6,437 (92.0%) | 562 (8.0%) |
| 35 Years and over | 2,618 (74.3%) | 907 (25.7%) |
| Total | 88,004 (88.5%) | 11,436 (11.5%) |
Educational Attainment by Field of Study in Lubbock County
Business (12,186 | 18.8%), education (9,643 | 14.9%), science & technology (7,261 | 11.2%), bio, nature & agricultural (6,853 | 10.6%), and arts & humanities (5,396 | 8.3%) are the most common fields of study among 64,859 individuals in Lubbock County who have obtained a bachelor's degree or higher.
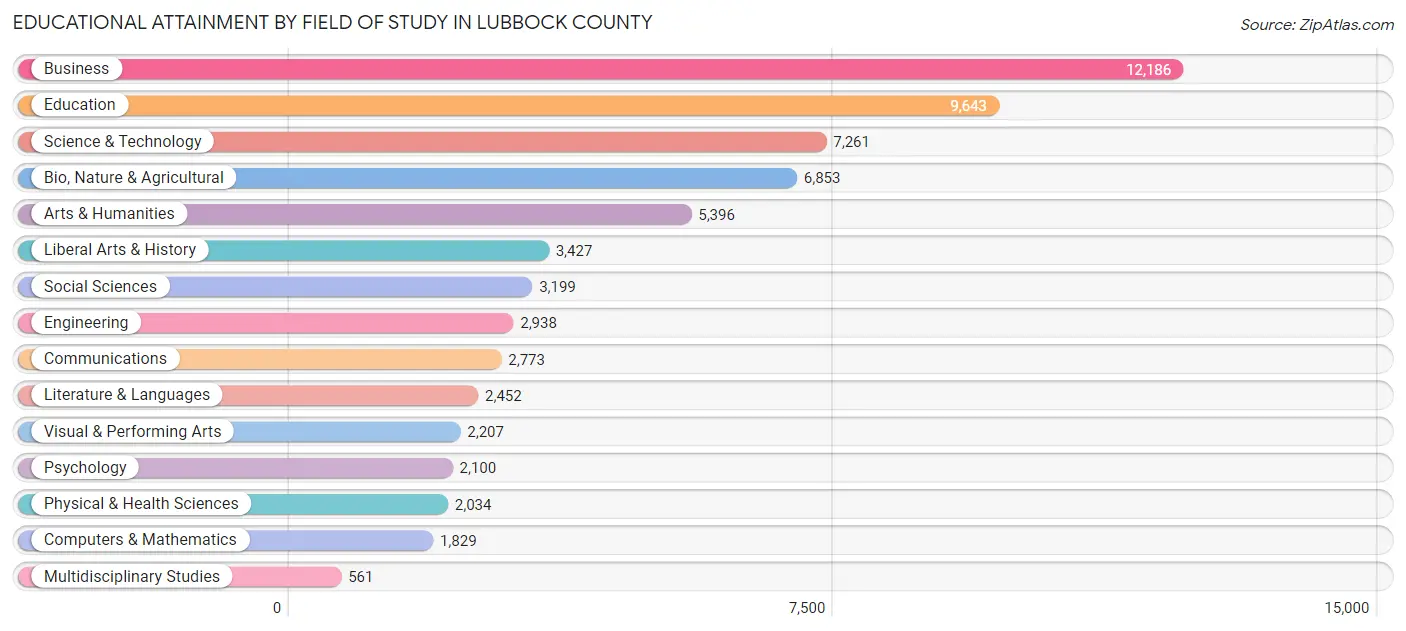
| Field of Study | # Graduates | % Graduates |
| Computers & Mathematics | 1,829 | 2.8% |
| Bio, Nature & Agricultural | 6,853 | 10.6% |
| Physical & Health Sciences | 2,034 | 3.1% |
| Psychology | 2,100 | 3.2% |
| Social Sciences | 3,199 | 4.9% |
| Engineering | 2,938 | 4.5% |
| Multidisciplinary Studies | 561 | 0.9% |
| Science & Technology | 7,261 | 11.2% |
| Business | 12,186 | 18.8% |
| Education | 9,643 | 14.9% |
| Literature & Languages | 2,452 | 3.8% |
| Liberal Arts & History | 3,427 | 5.3% |
| Visual & Performing Arts | 2,207 | 3.4% |
| Communications | 2,773 | 4.3% |
| Arts & Humanities | 5,396 | 8.3% |
| Total | 64,859 | 100.0% |
Transportation & Commute in Lubbock County
Vehicle Availability by Sex in Lubbock County
The most prevalent vehicle ownership categories in Lubbock County are males with 2 vehicles (34,528, accounting for 43.6%) and females with 2 vehicles (30,012, making up 49.3%).
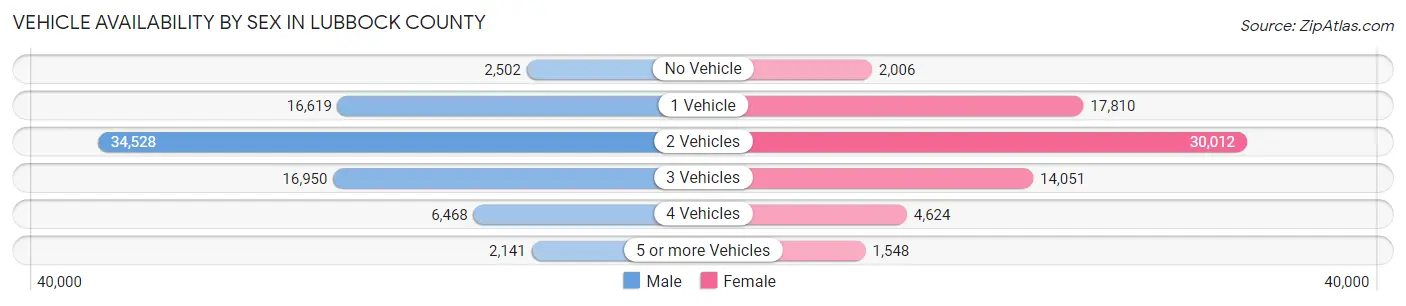
| Vehicles Available | Male | Female |
| No Vehicle | 2,502 (3.2%) | 2,006 (2.9%) |
| 1 Vehicle | 16,619 (21.0%) | 17,810 (25.4%) |
| 2 Vehicles | 34,528 (43.6%) | 30,012 (42.8%) |
| 3 Vehicles | 16,950 (21.4%) | 14,051 (20.1%) |
| 4 Vehicles | 6,468 (8.2%) | 4,624 (6.6%) |
| 5 or more Vehicles | 2,141 (2.7%) | 1,548 (2.2%) |
| Total | 79,208 (100.0%) | 70,051 (100.0%) |
Commute Time in Lubbock County
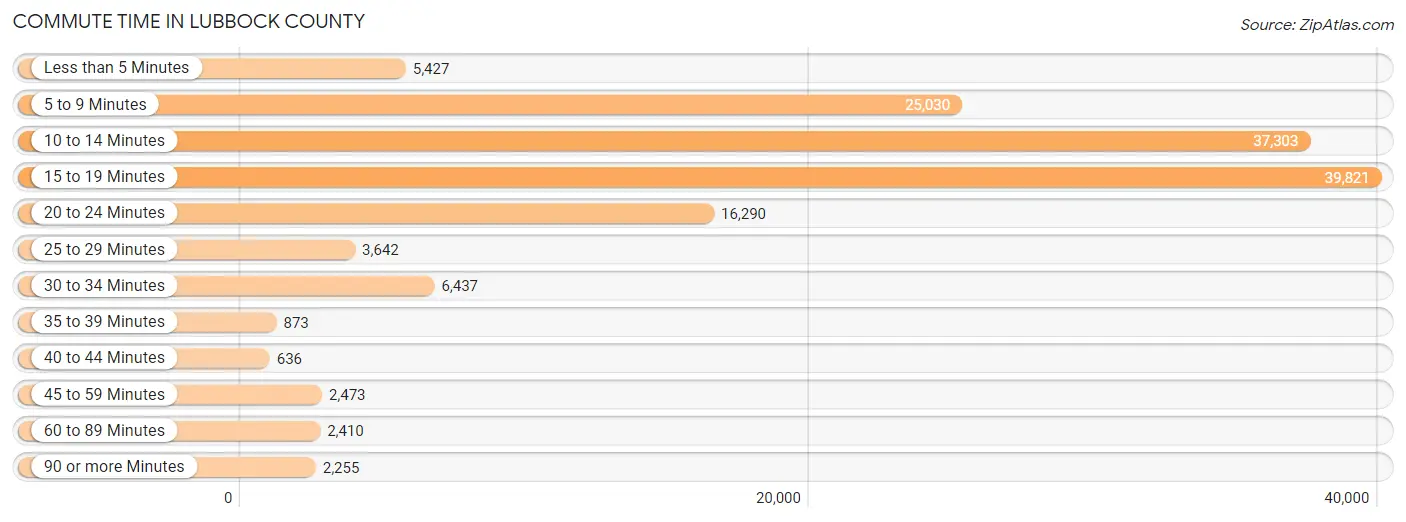
The most frequently occuring commute durations in Lubbock County are 15 to 19 minutes (39,821 commuters, 27.9%), 10 to 14 minutes (37,303 commuters, 26.2%), and 5 to 9 minutes (25,030 commuters, 17.5%).
| Commute Time | # Commuters | % Commuters |
| Less than 5 Minutes | 5,427 | 3.8% |
| 5 to 9 Minutes | 25,030 | 17.5% |
| 10 to 14 Minutes | 37,303 | 26.2% |
| 15 to 19 Minutes | 39,821 | 27.9% |
| 20 to 24 Minutes | 16,290 | 11.4% |
| 25 to 29 Minutes | 3,642 | 2.5% |
| 30 to 34 Minutes | 6,437 | 4.5% |
| 35 to 39 Minutes | 873 | 0.6% |
| 40 to 44 Minutes | 636 | 0.4% |
| 45 to 59 Minutes | 2,473 | 1.7% |
| 60 to 89 Minutes | 2,410 | 1.7% |
| 90 or more Minutes | 2,255 | 1.6% |
Commute Time by Sex in Lubbock County
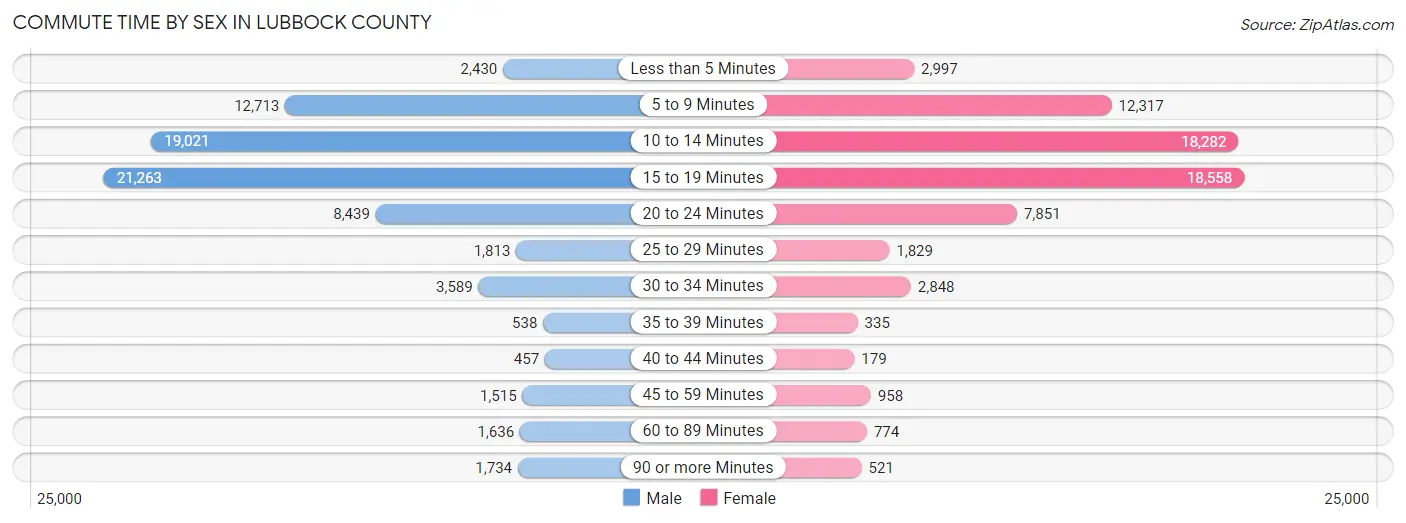
The most common commute times in Lubbock County are 15 to 19 minutes (21,263 commuters, 28.3%) for males and 15 to 19 minutes (18,558 commuters, 27.5%) for females.
| Commute Time | Male | Female |
| Less than 5 Minutes | 2,430 (3.2%) | 2,997 (4.4%) |
| 5 to 9 Minutes | 12,713 (16.9%) | 12,317 (18.3%) |
| 10 to 14 Minutes | 19,021 (25.3%) | 18,282 (27.1%) |
| 15 to 19 Minutes | 21,263 (28.3%) | 18,558 (27.5%) |
| 20 to 24 Minutes | 8,439 (11.2%) | 7,851 (11.6%) |
| 25 to 29 Minutes | 1,813 (2.4%) | 1,829 (2.7%) |
| 30 to 34 Minutes | 3,589 (4.8%) | 2,848 (4.2%) |
| 35 to 39 Minutes | 538 (0.7%) | 335 (0.5%) |
| 40 to 44 Minutes | 457 (0.6%) | 179 (0.3%) |
| 45 to 59 Minutes | 1,515 (2.0%) | 958 (1.4%) |
| 60 to 89 Minutes | 1,636 (2.2%) | 774 (1.1%) |
| 90 or more Minutes | 1,734 (2.3%) | 521 (0.8%) |
Time of Departure to Work by Sex in Lubbock County
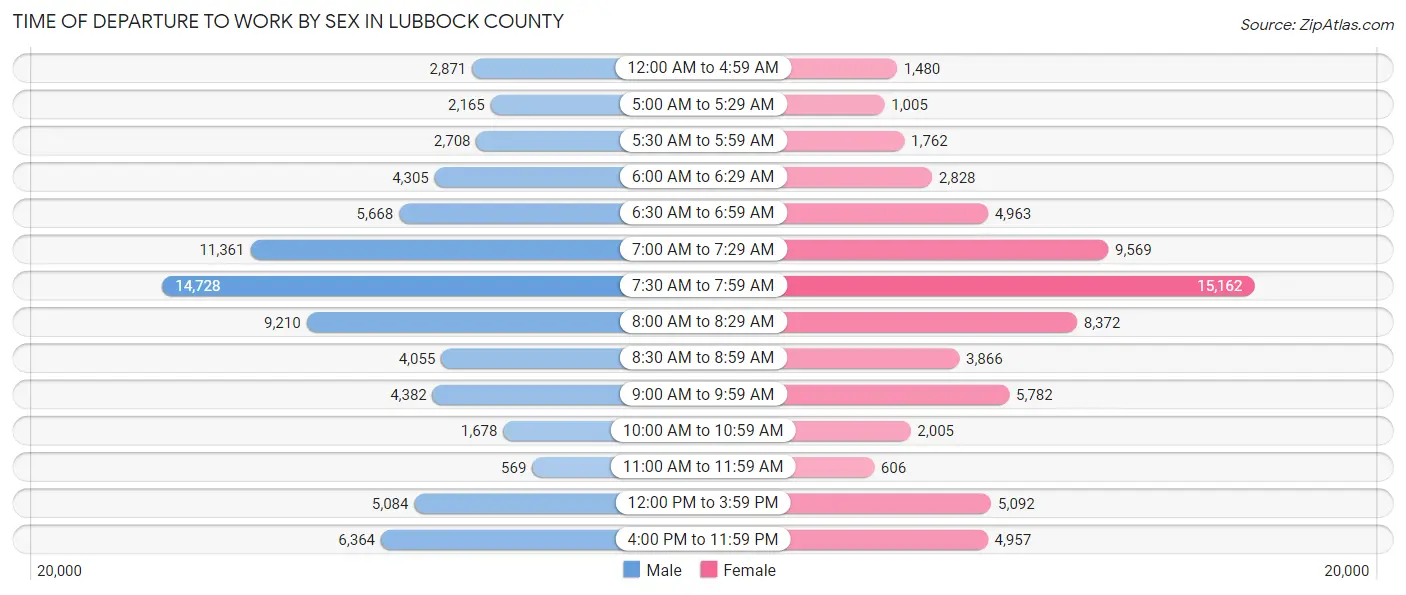
The most frequent times of departure to work in Lubbock County are 7:30 AM to 7:59 AM (14,728, 19.6%) for males and 7:30 AM to 7:59 AM (15,162, 22.5%) for females.
| Time of Departure | Male | Female |
| 12:00 AM to 4:59 AM | 2,871 (3.8%) | 1,480 (2.2%) |
| 5:00 AM to 5:29 AM | 2,165 (2.9%) | 1,005 (1.5%) |
| 5:30 AM to 5:59 AM | 2,708 (3.6%) | 1,762 (2.6%) |
| 6:00 AM to 6:29 AM | 4,305 (5.7%) | 2,828 (4.2%) |
| 6:30 AM to 6:59 AM | 5,668 (7.5%) | 4,963 (7.4%) |
| 7:00 AM to 7:29 AM | 11,361 (15.1%) | 9,569 (14.2%) |
| 7:30 AM to 7:59 AM | 14,728 (19.6%) | 15,162 (22.5%) |
| 8:00 AM to 8:29 AM | 9,210 (12.3%) | 8,372 (12.4%) |
| 8:30 AM to 8:59 AM | 4,055 (5.4%) | 3,866 (5.7%) |
| 9:00 AM to 9:59 AM | 4,382 (5.8%) | 5,782 (8.6%) |
| 10:00 AM to 10:59 AM | 1,678 (2.2%) | 2,005 (3.0%) |
| 11:00 AM to 11:59 AM | 569 (0.8%) | 606 (0.9%) |
| 12:00 PM to 3:59 PM | 5,084 (6.8%) | 5,092 (7.5%) |
| 4:00 PM to 11:59 PM | 6,364 (8.5%) | 4,957 (7.3%) |
| Total | 75,148 (100.0%) | 67,449 (100.0%) |
Housing Occupancy in Lubbock County
Occupancy by Ownership in Lubbock County
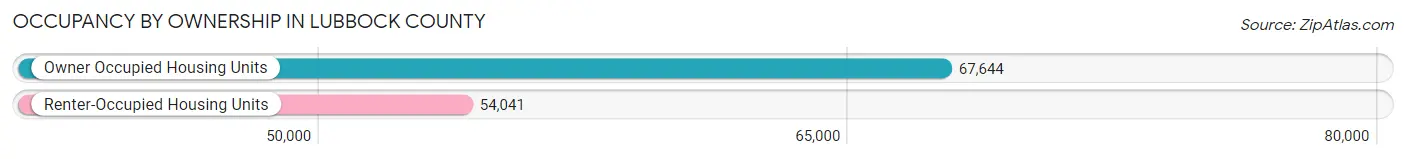
Of the total 121,685 dwellings in Lubbock County, owner-occupied units account for 67,644 (55.6%), while renter-occupied units make up 54,041 (44.4%).
| Occupancy | # Housing Units | % Housing Units |
| Owner Occupied Housing Units | 67,644 | 55.6% |
| Renter-Occupied Housing Units | 54,041 | 44.4% |
| Total Occupied Housing Units | 121,685 | 100.0% |
Occupancy by Household Size in Lubbock County
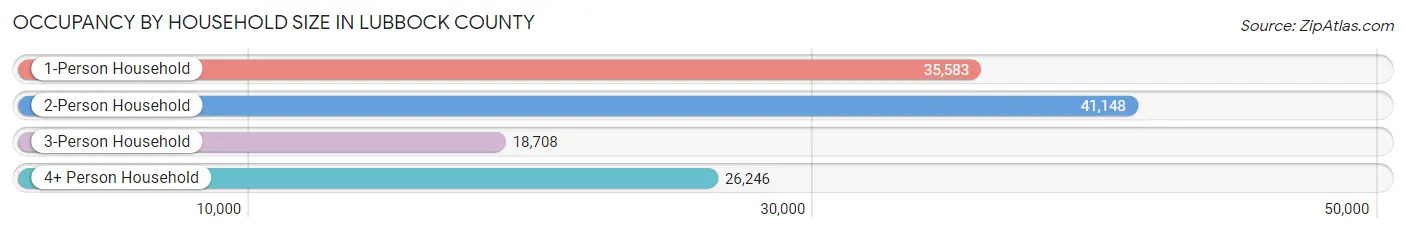
| Household Size | # Housing Units | % Housing Units |
| 1-Person Household | 35,583 | 29.2% |
| 2-Person Household | 41,148 | 33.8% |
| 3-Person Household | 18,708 | 15.4% |
| 4+ Person Household | 26,246 | 21.6% |
| Total Housing Units | 121,685 | 100.0% |
Occupancy by Ownership by Household Size in Lubbock County
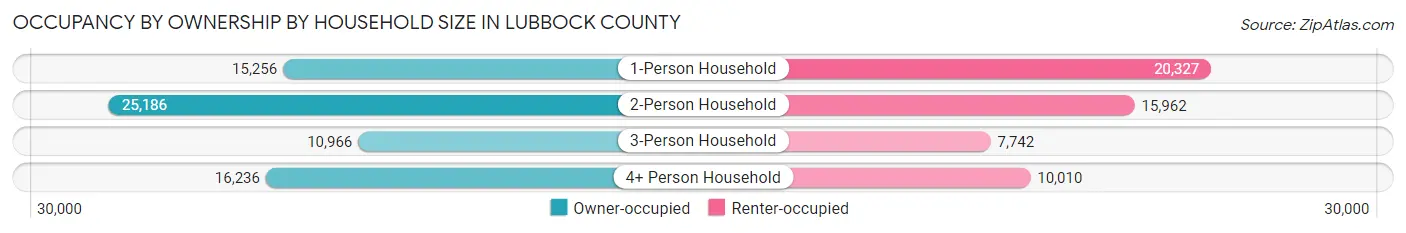
| Household Size | Owner-occupied | Renter-occupied |
| 1-Person Household | 15,256 (42.9%) | 20,327 (57.1%) |
| 2-Person Household | 25,186 (61.2%) | 15,962 (38.8%) |
| 3-Person Household | 10,966 (58.6%) | 7,742 (41.4%) |
| 4+ Person Household | 16,236 (61.9%) | 10,010 (38.1%) |
| Total Housing Units | 67,644 (55.6%) | 54,041 (44.4%) |
Occupancy by Educational Attainment in Lubbock County
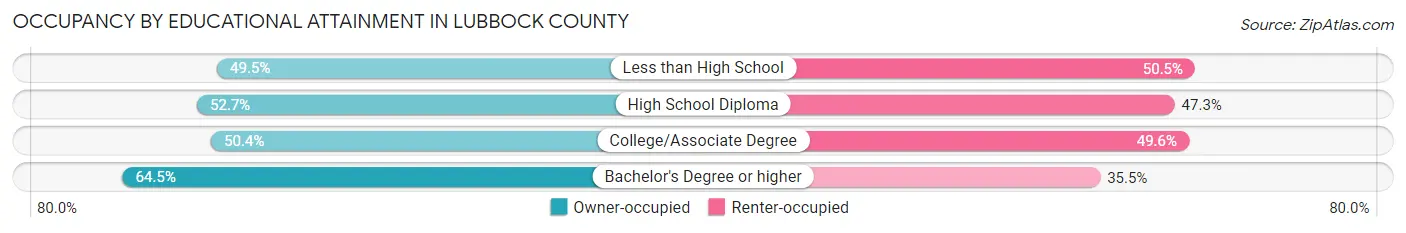
| Household Size | Owner-occupied | Renter-occupied |
| Less than High School | 5,822 (49.5%) | 5,950 (50.5%) |
| High School Diploma | 14,669 (52.7%) | 13,186 (47.3%) |
| College/Associate Degree | 20,632 (50.4%) | 20,291 (49.6%) |
| Bachelor's Degree or higher | 26,521 (64.5%) | 14,614 (35.5%) |
Occupancy by Age of Householder in Lubbock County
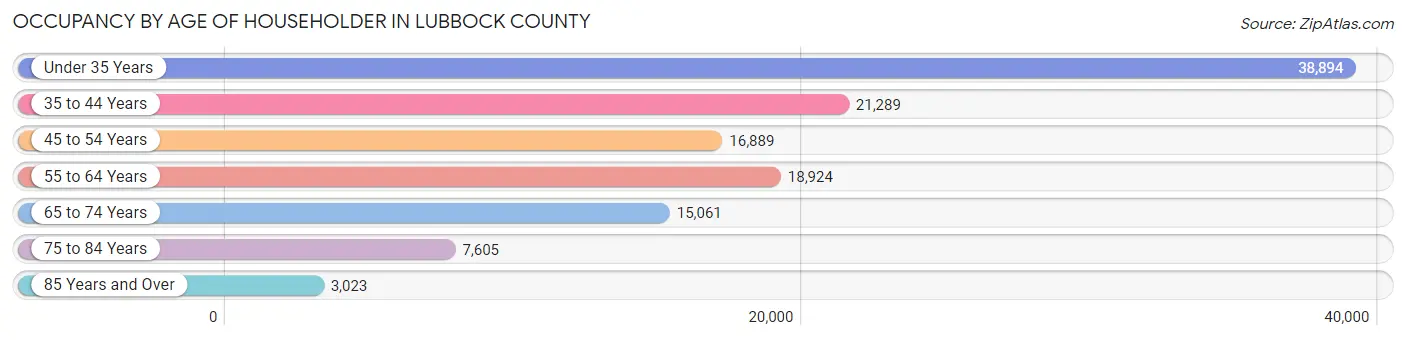
| Age Bracket | # Households | % Households |
| Under 35 Years | 38,894 | 32.0% |
| 35 to 44 Years | 21,289 | 17.5% |
| 45 to 54 Years | 16,889 | 13.9% |
| 55 to 64 Years | 18,924 | 15.5% |
| 65 to 74 Years | 15,061 | 12.4% |
| 75 to 84 Years | 7,605 | 6.2% |
| 85 Years and Over | 3,023 | 2.5% |
| Total | 121,685 | 100.0% |
Housing Finances in Lubbock County
Median Income by Occupancy in Lubbock County
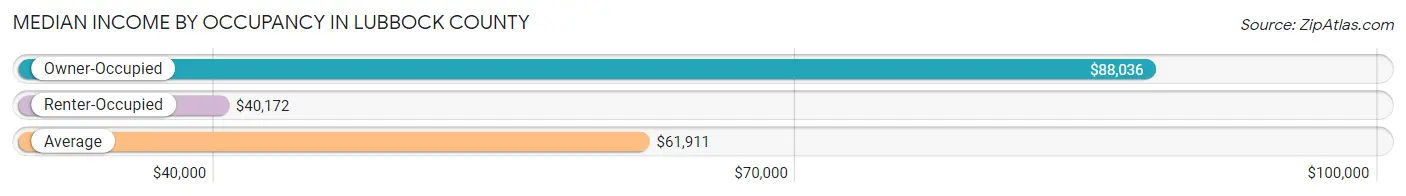
| Occupancy Type | # Households | Median Income |
| Owner-Occupied | 67,644 (55.6%) | $88,036 |
| Renter-Occupied | 54,041 (44.4%) | $40,172 |
| Average | 121,685 (100.0%) | $61,911 |
Occupancy by Householder Income Bracket in Lubbock County
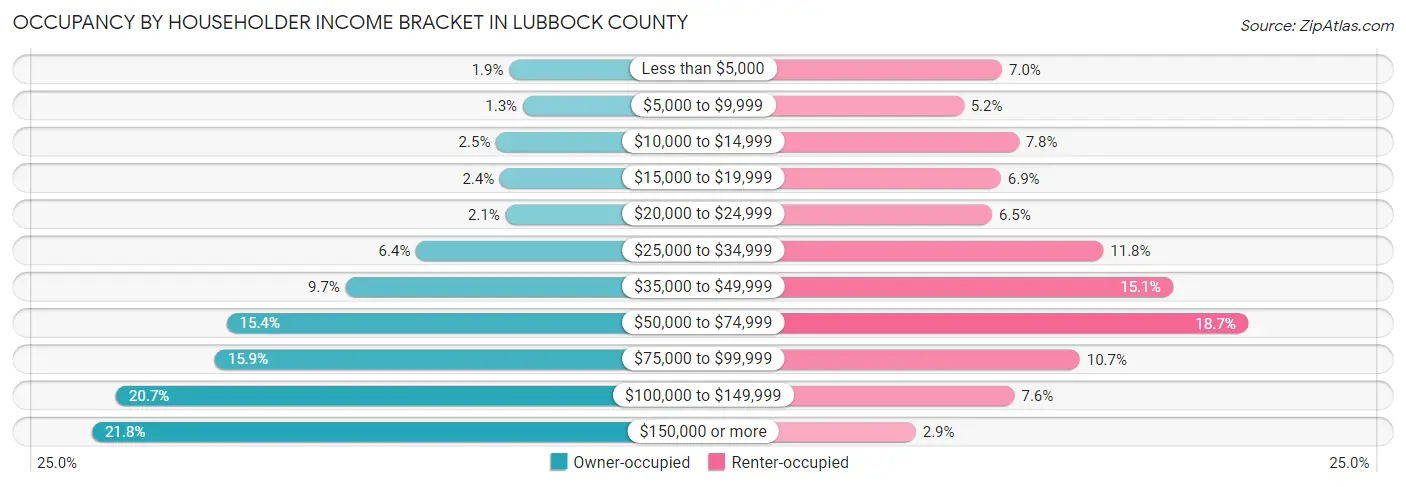
| Income Bracket | Owner-occupied | Renter-occupied |
| Less than $5,000 | 1,300 (1.9%) | 3,774 (7.0%) |
| $5,000 to $9,999 | 857 (1.3%) | 2,785 (5.1%) |
| $10,000 to $14,999 | 1,719 (2.5%) | 4,197 (7.8%) |
| $15,000 to $19,999 | 1,597 (2.4%) | 3,740 (6.9%) |
| $20,000 to $24,999 | 1,415 (2.1%) | 3,513 (6.5%) |
| $25,000 to $34,999 | 4,297 (6.4%) | 6,376 (11.8%) |
| $35,000 to $49,999 | 6,571 (9.7%) | 8,154 (15.1%) |
| $50,000 to $74,999 | 10,405 (15.4%) | 10,090 (18.7%) |
| $75,000 to $99,999 | 10,780 (15.9%) | 5,772 (10.7%) |
| $100,000 to $149,999 | 13,966 (20.6%) | 4,091 (7.6%) |
| $150,000 or more | 14,737 (21.8%) | 1,549 (2.9%) |
| Total | 67,644 (100.0%) | 54,041 (100.0%) |
Monthly Housing Cost Tiers in Lubbock County
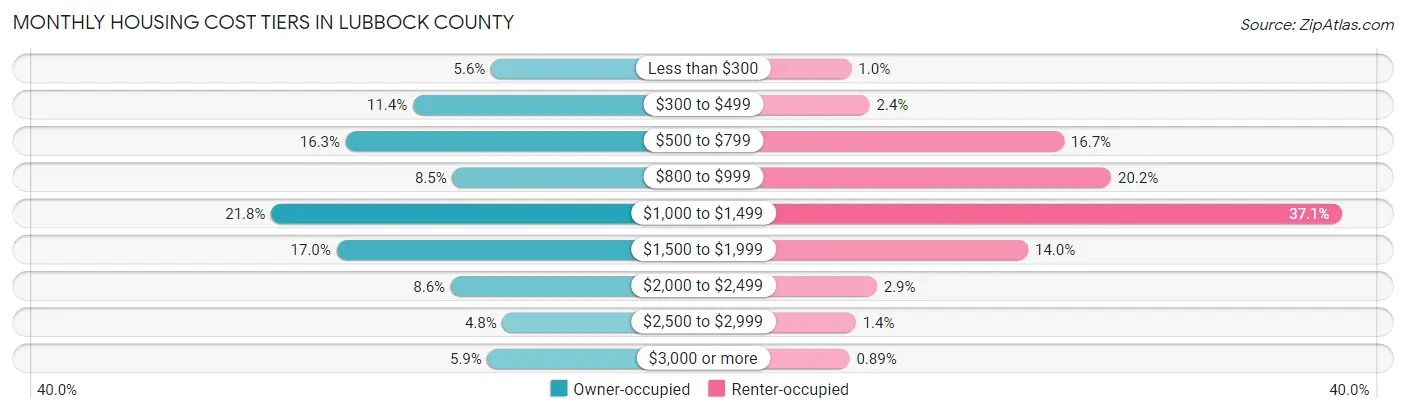
| Monthly Cost | Owner-occupied | Renter-occupied |
| Less than $300 | 3,815 (5.6%) | 558 (1.0%) |
| $300 to $499 | 7,702 (11.4%) | 1,282 (2.4%) |
| $500 to $799 | 11,052 (16.3%) | 9,014 (16.7%) |
| $800 to $999 | 5,737 (8.5%) | 10,888 (20.2%) |
| $1,000 to $1,499 | 14,769 (21.8%) | 20,053 (37.1%) |
| $1,500 to $1,999 | 11,514 (17.0%) | 7,588 (14.0%) |
| $2,000 to $2,499 | 5,818 (8.6%) | 1,566 (2.9%) |
| $2,500 to $2,999 | 3,249 (4.8%) | 729 (1.3%) |
| $3,000 or more | 3,988 (5.9%) | 481 (0.9%) |
| Total | 67,644 (100.0%) | 54,041 (100.0%) |
Physical Housing Characteristics in Lubbock County
Housing Structures in Lubbock County
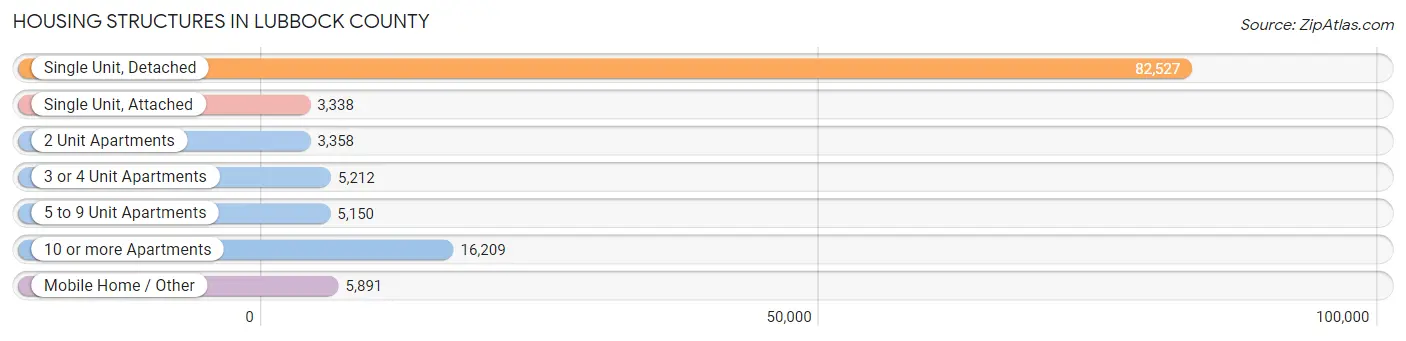
| Structure Type | # Housing Units | % Housing Units |
| Single Unit, Detached | 82,527 | 67.8% |
| Single Unit, Attached | 3,338 | 2.7% |
| 2 Unit Apartments | 3,358 | 2.8% |
| 3 or 4 Unit Apartments | 5,212 | 4.3% |
| 5 to 9 Unit Apartments | 5,150 | 4.2% |
| 10 or more Apartments | 16,209 | 13.3% |
| Mobile Home / Other | 5,891 | 4.8% |
| Total | 121,685 | 100.0% |
Housing Structures by Occupancy in Lubbock County
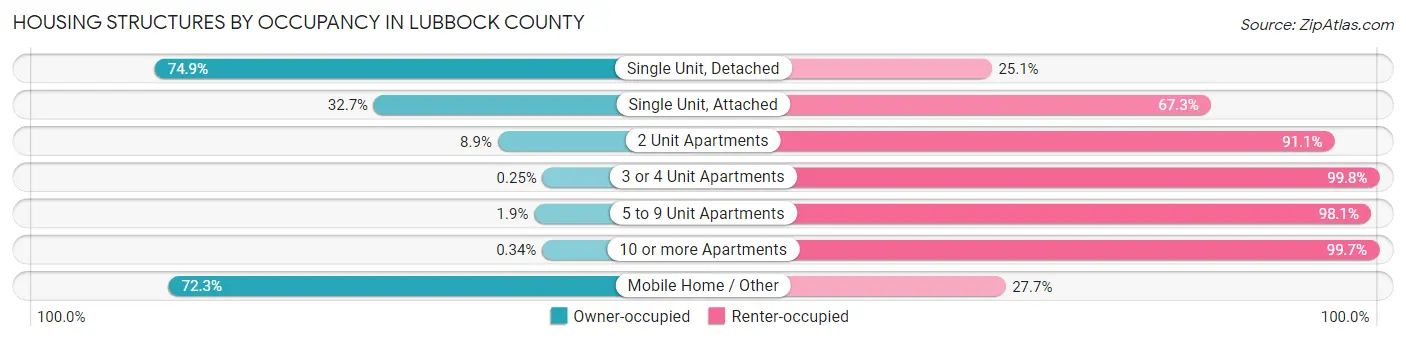
| Structure Type | Owner-occupied | Renter-occupied |
| Single Unit, Detached | 61,830 (74.9%) | 20,697 (25.1%) |
| Single Unit, Attached | 1,093 (32.7%) | 2,245 (67.3%) |
| 2 Unit Apartments | 299 (8.9%) | 3,059 (91.1%) |
| 3 or 4 Unit Apartments | 13 (0.3%) | 5,199 (99.8%) |
| 5 to 9 Unit Apartments | 97 (1.9%) | 5,053 (98.1%) |
| 10 or more Apartments | 55 (0.3%) | 16,154 (99.7%) |
| Mobile Home / Other | 4,257 (72.3%) | 1,634 (27.7%) |
| Total | 67,644 (55.6%) | 54,041 (44.4%) |
Housing Structures by Number of Rooms in Lubbock County
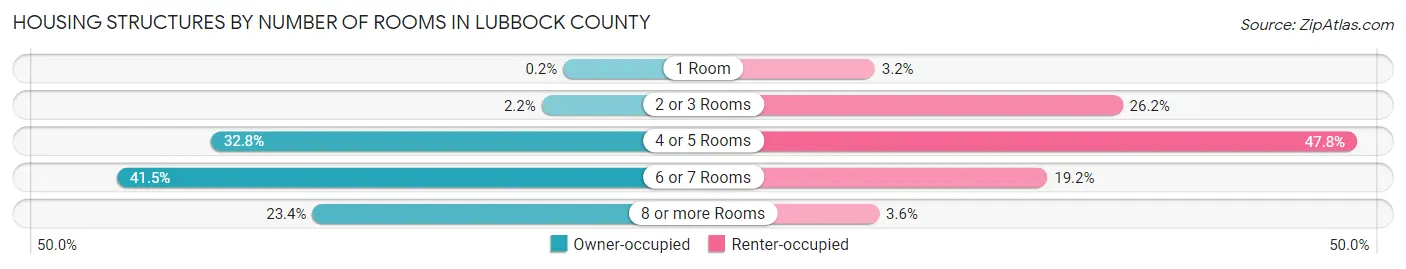
| Number of Rooms | Owner-occupied | Renter-occupied |
| 1 Room | 135 (0.2%) | 1,745 (3.2%) |
| 2 or 3 Rooms | 1,482 (2.2%) | 14,131 (26.2%) |
| 4 or 5 Rooms | 22,164 (32.8%) | 25,835 (47.8%) |
| 6 or 7 Rooms | 28,044 (41.5%) | 10,366 (19.2%) |
| 8 or more Rooms | 15,819 (23.4%) | 1,964 (3.6%) |
| Total | 67,644 (100.0%) | 54,041 (100.0%) |
Housing Structure by Heating Type in Lubbock County
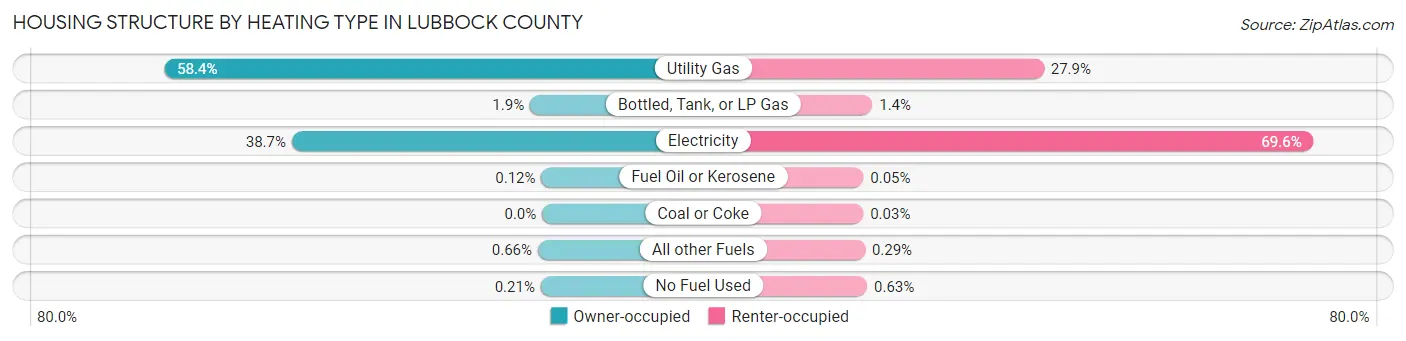
| Heating Type | Owner-occupied | Renter-occupied |
| Utility Gas | 39,528 (58.4%) | 15,097 (27.9%) |
| Bottled, Tank, or LP Gas | 1,263 (1.9%) | 771 (1.4%) |
| Electricity | 26,180 (38.7%) | 37,630 (69.6%) |
| Fuel Oil or Kerosene | 82 (0.1%) | 26 (0.1%) |
| Coal or Coke | 0 (0.0%) | 16 (0.0%) |
| All other Fuels | 448 (0.7%) | 158 (0.3%) |
| No Fuel Used | 143 (0.2%) | 343 (0.6%) |
| Total | 67,644 (100.0%) | 54,041 (100.0%) |
Household Vehicle Usage in Lubbock County
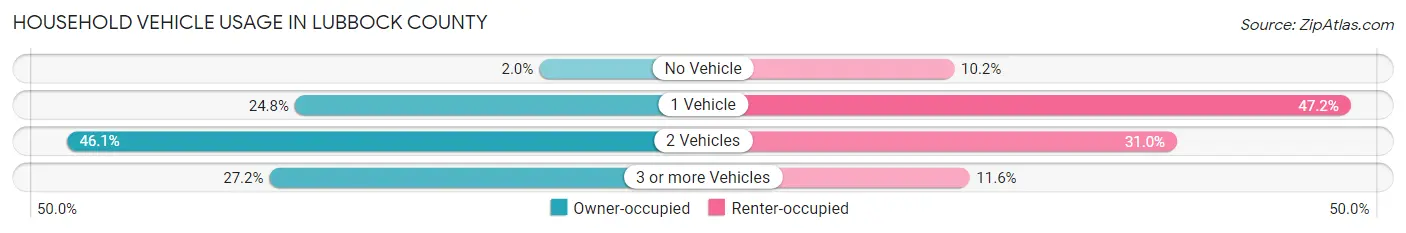
| Vehicles per Household | Owner-occupied | Renter-occupied |
| No Vehicle | 1,334 (2.0%) | 5,509 (10.2%) |
| 1 Vehicle | 16,764 (24.8%) | 25,508 (47.2%) |
| 2 Vehicles | 31,176 (46.1%) | 16,747 (31.0%) |
| 3 or more Vehicles | 18,370 (27.2%) | 6,277 (11.6%) |
| Total | 67,644 (100.0%) | 54,041 (100.0%) |
Real Estate & Mortgages in Lubbock County
Real Estate and Mortgage Overview in Lubbock County
| Characteristic | Without Mortgage | With Mortgage |
| Housing Units | 29,633 | 38,011 |
| Median Property Value | $154,500 | $207,300 |
| Median Household Income | $65,436 | $10,496 |
| Monthly Housing Costs | $612 | $3,893 |
| Real Estate Taxes | $2,129 | $973 |
Property Value by Mortgage Status in Lubbock County
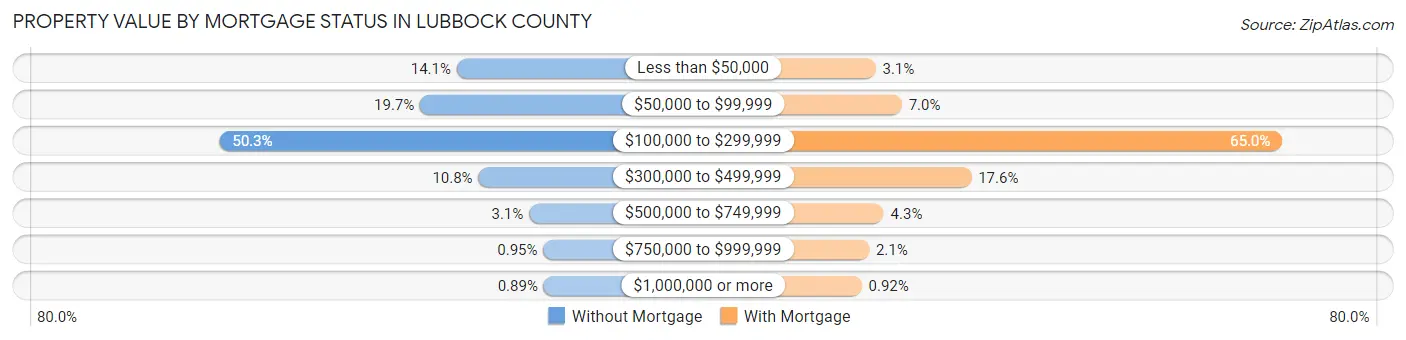
| Property Value | Without Mortgage | With Mortgage |
| Less than $50,000 | 4,190 (14.1%) | 1,161 (3.0%) |
| $50,000 to $99,999 | 5,848 (19.7%) | 2,677 (7.0%) |
| $100,000 to $299,999 | 14,913 (50.3%) | 24,718 (65.0%) |
| $300,000 to $499,999 | 3,212 (10.8%) | 6,700 (17.6%) |
| $500,000 to $749,999 | 924 (3.1%) | 1,627 (4.3%) |
| $750,000 to $999,999 | 282 (0.9%) | 780 (2.1%) |
| $1,000,000 or more | 264 (0.9%) | 348 (0.9%) |
| Total | 29,633 (100.0%) | 38,011 (100.0%) |
Household Income by Mortgage Status in Lubbock County
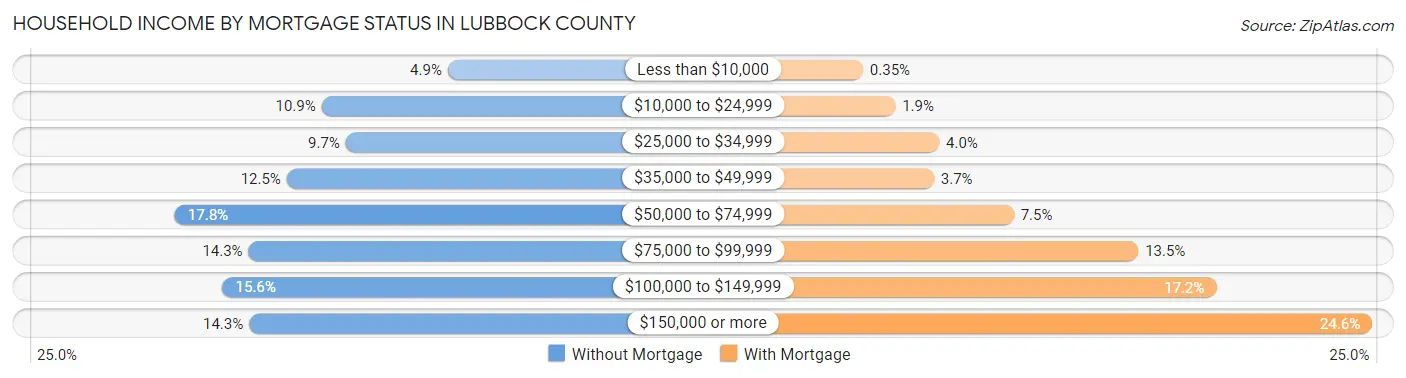
| Household Income | Without Mortgage | With Mortgage |
| Less than $10,000 | 1,438 (4.9%) | 133 (0.4%) |
| $10,000 to $24,999 | 3,217 (10.9%) | 719 (1.9%) |
| $25,000 to $34,999 | 2,878 (9.7%) | 1,514 (4.0%) |
| $35,000 to $49,999 | 3,710 (12.5%) | 1,419 (3.7%) |
| $50,000 to $74,999 | 5,287 (17.8%) | 2,861 (7.5%) |
| $75,000 to $99,999 | 4,248 (14.3%) | 5,118 (13.5%) |
| $100,000 to $149,999 | 4,614 (15.6%) | 6,532 (17.2%) |
| $150,000 or more | 4,241 (14.3%) | 9,352 (24.6%) |
| Total | 29,633 (100.0%) | 38,011 (100.0%) |
Property Value to Household Income Ratio in Lubbock County
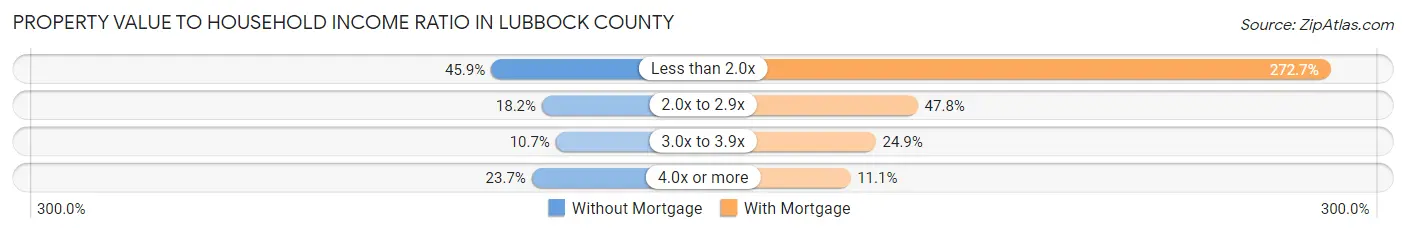
| Value-to-Income Ratio | Without Mortgage | With Mortgage |
| Less than 2.0x | 13,589 (45.9%) | 103,661 (272.7%) |
| 2.0x to 2.9x | 5,391 (18.2%) | 18,171 (47.8%) |
| 3.0x to 3.9x | 3,156 (10.6%) | 9,456 (24.9%) |
| 4.0x or more | 7,035 (23.7%) | 4,209 (11.1%) |
| Total | 29,633 (100.0%) | 38,011 (100.0%) |
Real Estate Taxes by Mortgage Status in Lubbock County
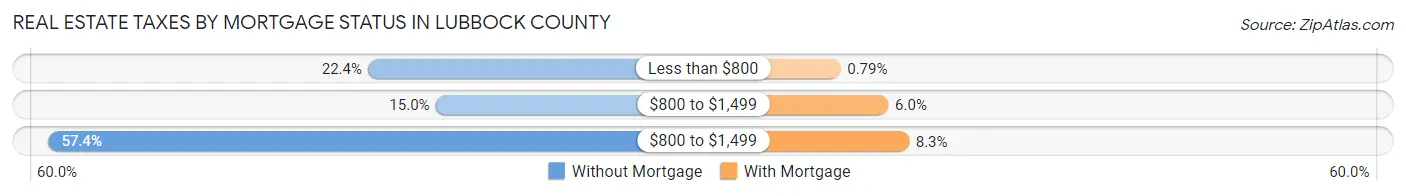
| Property Taxes | Without Mortgage | With Mortgage |
| Less than $800 | 6,635 (22.4%) | 299 (0.8%) |
| $800 to $1,499 | 4,438 (15.0%) | 2,297 (6.0%) |
| $800 to $1,499 | 17,000 (57.4%) | 3,156 (8.3%) |
| Total | 29,633 (100.0%) | 38,011 (100.0%) |
Health & Disability in Lubbock County
Health Insurance Coverage by Age in Lubbock County
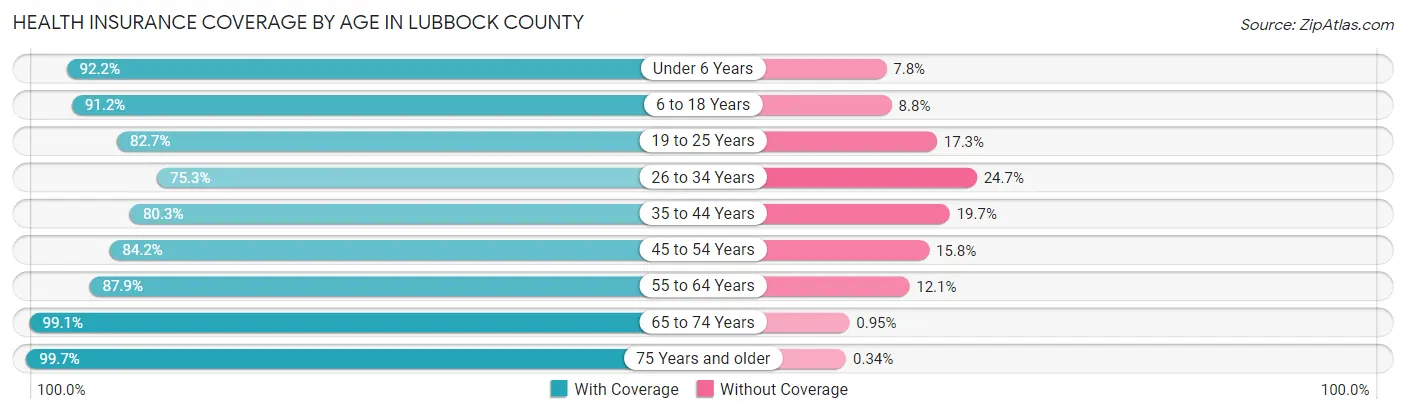
| Age Bracket | With Coverage | Without Coverage |
| Under 6 Years | 22,056 (92.2%) | 1,876 (7.8%) |
| 6 to 18 Years | 50,975 (91.2%) | 4,936 (8.8%) |
| 19 to 25 Years | 41,228 (82.7%) | 8,602 (17.3%) |
| 26 to 34 Years | 29,987 (75.3%) | 9,837 (24.7%) |
| 35 to 44 Years | 30,161 (80.3%) | 7,382 (19.7%) |
| 45 to 54 Years | 25,570 (84.2%) | 4,807 (15.8%) |
| 55 to 64 Years | 27,355 (87.9%) | 3,771 (12.1%) |
| 65 to 74 Years | 22,846 (99.1%) | 218 (0.9%) |
| 75 Years and older | 15,467 (99.7%) | 52 (0.3%) |
| Total | 265,645 (86.5%) | 41,481 (13.5%) |
Health Insurance Coverage by Citizenship Status in Lubbock County
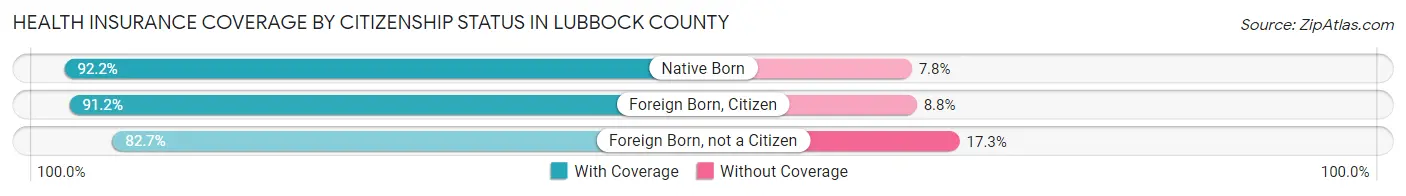
| Citizenship Status | With Coverage | Without Coverage |
| Native Born | 22,056 (92.2%) | 1,876 (7.8%) |
| Foreign Born, Citizen | 50,975 (91.2%) | 4,936 (8.8%) |
| Foreign Born, not a Citizen | 41,228 (82.7%) | 8,602 (17.3%) |
Health Insurance Coverage by Household Income in Lubbock County
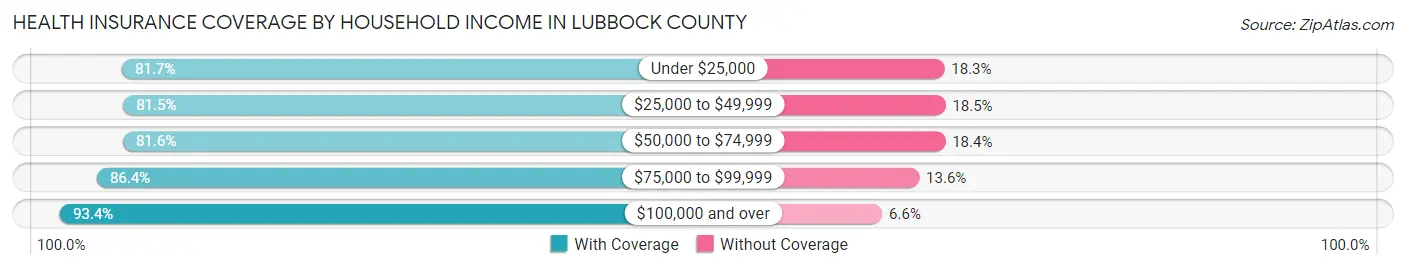
| Household Income | With Coverage | Without Coverage |
| Under $25,000 | 37,078 (81.7%) | 8,294 (18.3%) |
| $25,000 to $49,999 | 41,731 (81.5%) | 9,458 (18.5%) |
| $50,000 to $74,999 | 42,862 (81.6%) | 9,692 (18.4%) |
| $75,000 to $99,999 | 40,244 (86.4%) | 6,313 (13.6%) |
| $100,000 and over | 95,667 (93.4%) | 6,790 (6.6%) |
Public vs Private Health Insurance Coverage by Age in Lubbock County
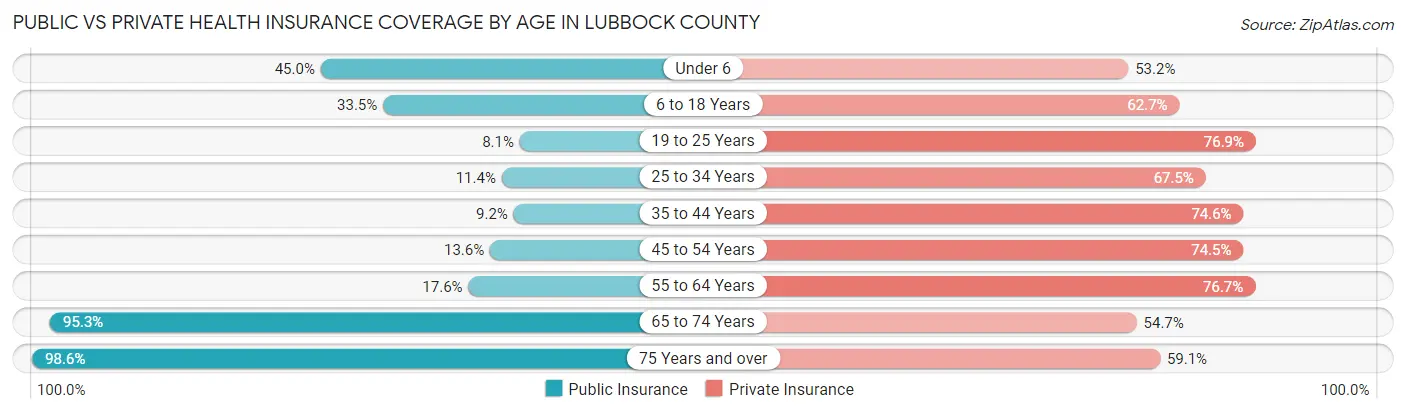
| Age Bracket | Public Insurance | Private Insurance |
| Under 6 | 10,777 (45.0%) | 12,724 (53.2%) |
| 6 to 18 Years | 18,708 (33.5%) | 35,040 (62.7%) |
| 19 to 25 Years | 4,029 (8.1%) | 38,295 (76.8%) |
| 25 to 34 Years | 4,557 (11.4%) | 26,898 (67.5%) |
| 35 to 44 Years | 3,461 (9.2%) | 27,990 (74.6%) |
| 45 to 54 Years | 4,134 (13.6%) | 22,636 (74.5%) |
| 55 to 64 Years | 5,485 (17.6%) | 23,876 (76.7%) |
| 65 to 74 Years | 21,981 (95.3%) | 12,620 (54.7%) |
| 75 Years and over | 15,305 (98.6%) | 9,164 (59.1%) |
| Total | 88,437 (28.8%) | 209,243 (68.1%) |
Disability Status by Sex by Age in Lubbock County
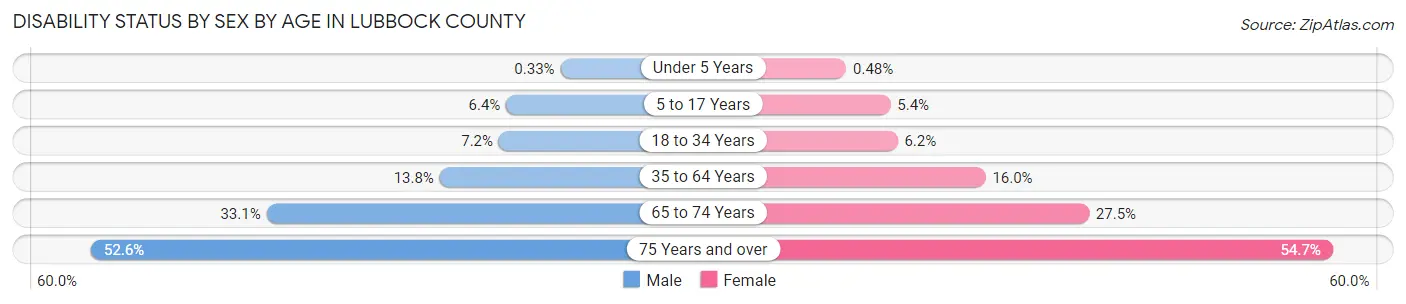
| Age Bracket | Male | Female |
| Under 5 Years | 33 (0.3%) | 46 (0.5%) |
| 5 to 17 Years | 1,735 (6.4%) | 1,430 (5.4%) |
| 18 to 34 Years | 3,480 (7.2%) | 2,955 (6.2%) |
| 35 to 64 Years | 6,664 (13.8%) | 8,103 (16.0%) |
| 65 to 74 Years | 3,507 (33.1%) | 3,428 (27.5%) |
| 75 Years and over | 3,275 (52.6%) | 5,080 (54.7%) |
Disability Class by Sex by Age in Lubbock County
Disability Class: Hearing Difficulty
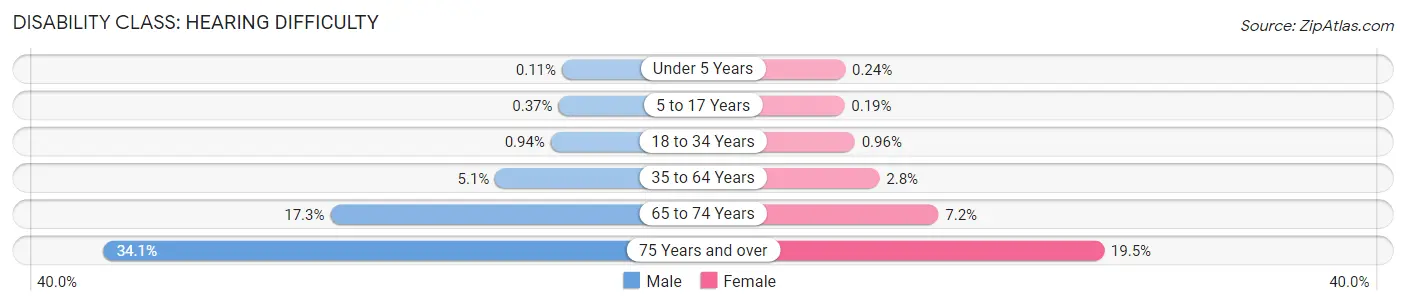
| Age Bracket | Male | Female |
| Under 5 Years | 11 (0.1%) | 23 (0.2%) |
| 5 to 17 Years | 100 (0.4%) | 51 (0.2%) |
| 18 to 34 Years | 456 (0.9%) | 457 (1.0%) |
| 35 to 64 Years | 2,448 (5.1%) | 1,415 (2.8%) |
| 65 to 74 Years | 1,835 (17.3%) | 893 (7.2%) |
| 75 Years and over | 2,124 (34.1%) | 1,809 (19.5%) |
Disability Class: Vision Difficulty
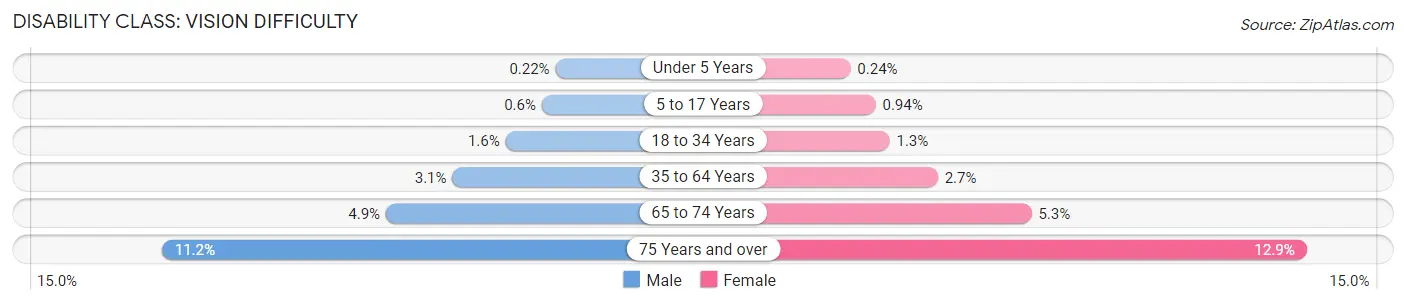
| Age Bracket | Male | Female |
| Under 5 Years | 22 (0.2%) | 23 (0.2%) |
| 5 to 17 Years | 164 (0.6%) | 248 (0.9%) |
| 18 to 34 Years | 782 (1.6%) | 636 (1.3%) |
| 35 to 64 Years | 1,497 (3.1%) | 1,354 (2.7%) |
| 65 to 74 Years | 524 (4.9%) | 658 (5.3%) |
| 75 Years and over | 696 (11.2%) | 1,203 (12.9%) |
Disability Class: Cognitive Difficulty
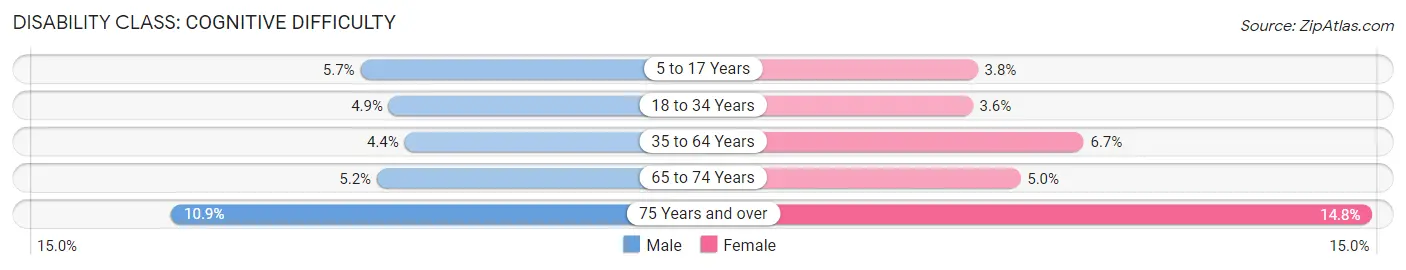
| Age Bracket | Male | Female |
| 5 to 17 Years | 1,538 (5.7%) | 999 (3.8%) |
| 18 to 34 Years | 2,358 (4.9%) | 1,734 (3.6%) |
| 35 to 64 Years | 2,138 (4.4%) | 3,408 (6.7%) |
| 65 to 74 Years | 550 (5.2%) | 619 (5.0%) |
| 75 Years and over | 680 (10.9%) | 1,373 (14.8%) |
Disability Class: Ambulatory Difficulty
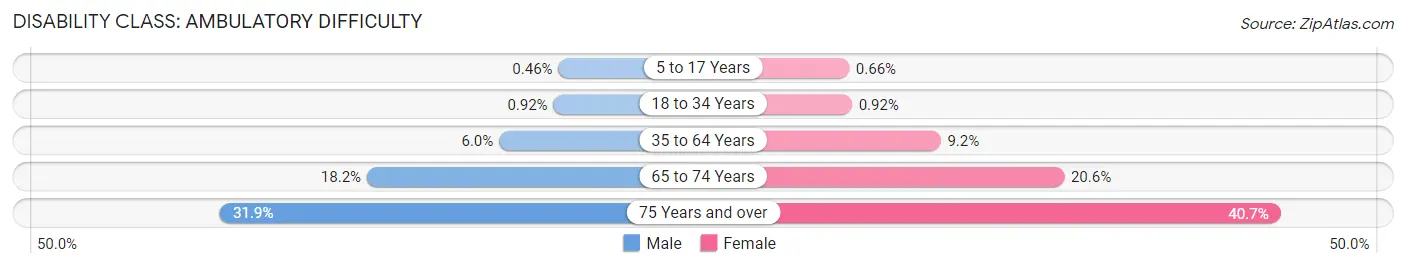
| Age Bracket | Male | Female |
| 5 to 17 Years | 125 (0.5%) | 174 (0.7%) |
| 18 to 34 Years | 446 (0.9%) | 440 (0.9%) |
| 35 to 64 Years | 2,883 (6.0%) | 4,639 (9.2%) |
| 65 to 74 Years | 1,934 (18.2%) | 2,569 (20.6%) |
| 75 Years and over | 1,983 (31.9%) | 3,784 (40.7%) |
Disability Class: Self-Care Difficulty
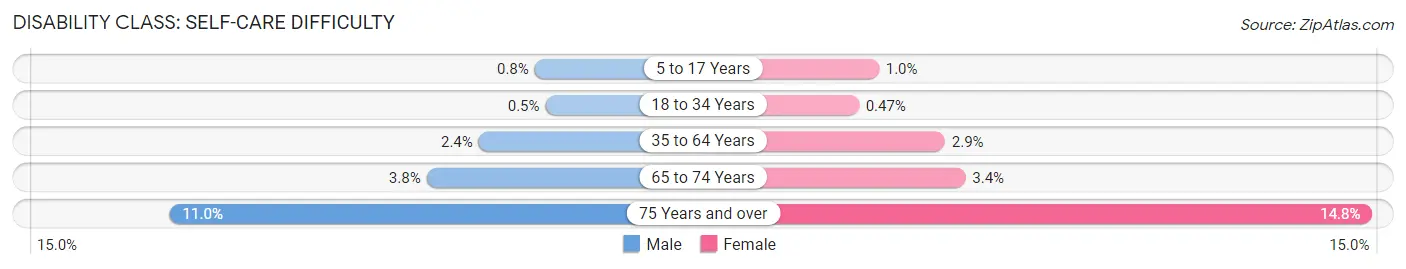
| Age Bracket | Male | Female |
| 5 to 17 Years | 217 (0.8%) | 273 (1.0%) |
| 18 to 34 Years | 241 (0.5%) | 222 (0.5%) |
| 35 to 64 Years | 1,142 (2.4%) | 1,455 (2.9%) |
| 65 to 74 Years | 404 (3.8%) | 428 (3.4%) |
| 75 Years and over | 682 (11.0%) | 1,373 (14.8%) |
Technology Access in Lubbock County
Computing Device Access in Lubbock County
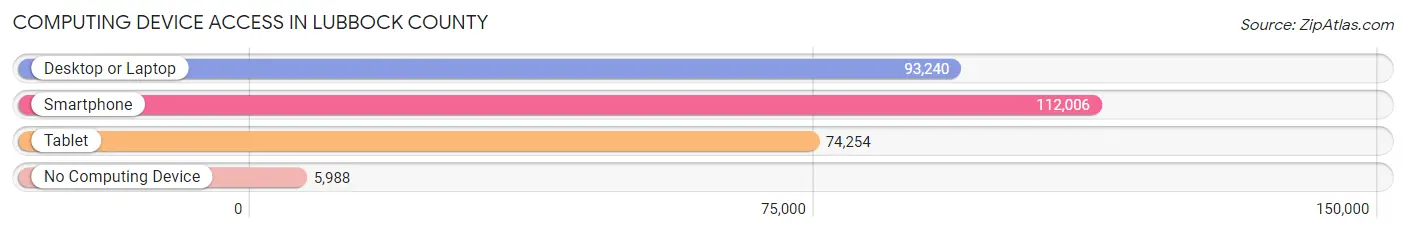
| Device Type | # Households | % Households |
| Desktop or Laptop | 93,240 | 76.6% |
| Smartphone | 112,006 | 92.0% |
| Tablet | 74,254 | 61.0% |
| No Computing Device | 5,988 | 4.9% |
| Total | 121,685 | 100.0% |
Internet Access in Lubbock County
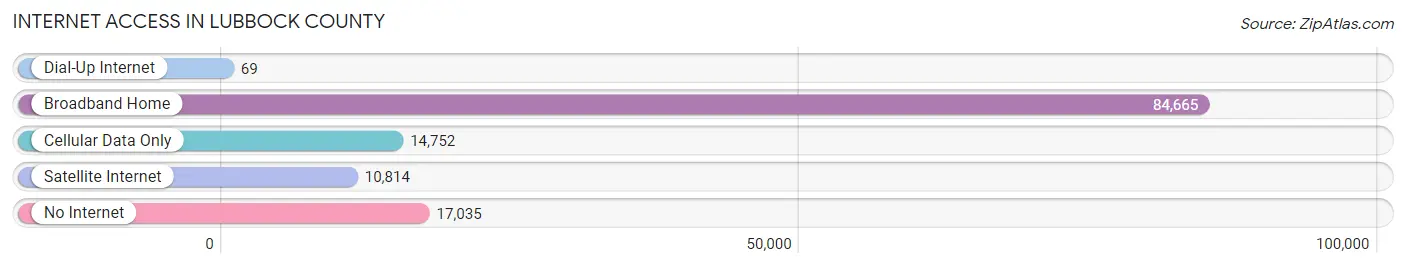
| Internet Type | # Households | % Households |
| Dial-Up Internet | 69 | 0.1% |
| Broadband Home | 84,665 | 69.6% |
| Cellular Data Only | 14,752 | 12.1% |
| Satellite Internet | 10,814 | 8.9% |
| No Internet | 17,035 | 14.0% |
| Total | 121,685 | 100.0% |
Lubbock County Summary
Lubbock County, Texas is located in the northwestern part of the state and is part of the South Plains region. It is bordered by Bailey County to the north, Lamb County to the east, Crosby County to the southeast, and Hale County to the south. The county seat is Lubbock, which is also the largest city in the county. The county was established in 1876 and is named after Thomas Saltus Lubbock, a Confederate colonel and Texas Ranger.
History
The area that is now Lubbock County was originally inhabited by the Comanche and Kiowa tribes. The first European settlers arrived in the area in the late 19th century, and the county was officially established in 1876. The county was named after Thomas Saltus Lubbock, a Confederate colonel and Texas Ranger.
In the early 20th century, the county experienced a period of rapid growth due to the discovery of oil and natural gas in the area. This led to the establishment of several oil and gas companies, as well as the development of the city of Lubbock. The city quickly became the economic and cultural center of the county, and it remains so today.
Geography
Lubbock County covers an area of 902 square miles and is located in the northwestern part of the state. It is bordered by Bailey County to the north, Lamb County to the east, Crosby County to the southeast, and Hale County to the south. The county is part of the South Plains region and is mostly flat, with some rolling hills in the eastern part of the county. The county is home to several lakes, including Buffalo Springs Lake, Mackenzie State Park, and Lake Alan Henry.
The county is home to several state parks, including Buffalo Springs Lake State Park, Mackenzie State Park, and Lake Alan Henry State Park. The county is also home to several wildlife management areas, including the Lubbock County Wildlife Management Area, the Buffalo Springs Wildlife Management Area, and the Mackenzie Wildlife Management Area.
Economy
Lubbock County has a diverse economy that is driven by agriculture, manufacturing, and services. Agriculture is the largest sector of the economy, accounting for about 25% of the county’s total economic output. The county is home to several large farms and ranches, and the main crops grown in the area include cotton, wheat, sorghum, and hay.
Manufacturing is the second-largest sector of the economy, accounting for about 20% of the county’s total economic output. The county is home to several large manufacturing companies, including Texas Tech University, which produces a variety of products, including electronics, medical equipment, and aerospace components.
The services sector is the third-largest sector of the economy, accounting for about 15% of the county’s total economic output. The county is home to several large hospitals, including University Medical Center and Covenant Medical Center. The county is also home to several large retail stores, including Walmart, Target, and Lowe’s.
Demographics
As of the 2010 census, the population of Lubbock County was 278,831. The population is fairly evenly split between men and women, with 50.3% of the population being male and 49.7% being female. The median age of the population is 32.7 years, and the median household income is $45,945.
The racial makeup of the county is predominantly white, with 73.2% of the population being white, 19.2% being Hispanic or Latino, 4.2% being African American, and 2.3% being Asian. The county is also home to a large number of Native Americans, with 1.2% of the population being Native American.
Conclusion
Lubbock County, Texas is located in the northwestern part of the state and is part of the South Plains region. It is bordered by Bailey County to the north, Lamb County to the east, Crosby County to the southeast, and Hale County to the south. The county was established in 1876 and is named after Thomas Saltus Lubbock, a Confederate colonel and Texas Ranger. The county has a diverse economy that is driven by agriculture, manufacturing, and services. The population of the county is predominantly white, with 73.2% of the population being white, 19.2% being Hispanic or Latino, 4.2% being African American, and 2.3% being Asian. The median age of the population is 32.7 years, and the median household income is $45,945.
Common Questions
What is Per Capita Income in Lubbock County?
Per Capita income in Lubbock County is $33,700.
What is the Median Family Income in Lubbock County?
Median Family Income in Lubbock County is $81,054.
What is the Median Household income in Lubbock County?
Median Household Income in Lubbock County is $61,911.
What is Income or Wage Gap in Lubbock County?
Income or Wage Gap in Lubbock County is 32.4%.
Women in Lubbock County earn 67.6 cents for every dollar earned by a man.
What is Family Income Deficit in Lubbock County?
Family Income Deficit in Lubbock County is $11,199.
Families that are below poverty line in Lubbock County earn $11,199 less on average than the poverty threshold level.
What is Inequality or Gini Index in Lubbock County?
Inequality or Gini Index in Lubbock County is 0.48.
What is the Total Population of Lubbock County?
Total Population of Lubbock County is 311,509.
What is the Total Male Population of Lubbock County?
Total Male Population of Lubbock County is 154,200.
What is the Total Female Population of Lubbock County?
Total Female Population of Lubbock County is 157,309.
What is the Ratio of Males per 100 Females in Lubbock County?
There are 98.02 Males per 100 Females in Lubbock County.
What is the Ratio of Females per 100 Males in Lubbock County?
There are 102.02 Females per 100 Males in Lubbock County.
What is the Median Population Age in Lubbock County?
Median Population Age in Lubbock County is 31.2 Years.
What is the Average Family Size in Lubbock County
Average Family Size in Lubbock County is 3.1 People.
What is the Average Household Size in Lubbock County
Average Household Size in Lubbock County is 2.5 People.
How Large is the Labor Force in Lubbock County?
There are 161,675 People in the Labor Forcein in Lubbock County.
What is the Percentage of People in the Labor Force in Lubbock County?
65.6% of People are in the Labor Force in Lubbock County.
What is the Unemployment Rate in Lubbock County?
Unemployment Rate in Lubbock County is 4.6%.