Pasadena, TX Map & Demographics
Pasadena Map
Pasadena Overview
$27,913
PER CAPITA INCOME
$71,610
AVG FAMILY INCOME
$64,698
AVG HOUSEHOLD INCOME
38.6%
WAGE / INCOME GAP [ % ]
61.4¢/ $1
WAGE / INCOME GAP [ $ ]
$10,187
FAMILY INCOME DEFICIT
0.43
INEQUALITY / GINI INDEX
150,620
TOTAL POPULATION
74,626
MALE POPULATION
75,994
FEMALE POPULATION
98.20
MALES / 100 FEMALES
101.83
FEMALES / 100 MALES
32.6
MEDIAN AGE
3.5
AVG FAMILY SIZE
3.0
AVG HOUSEHOLD SIZE
73,304
LABOR FORCE [ PEOPLE ]
65.2%
PERCENT IN LABOR FORCE
8.9%
UNEMPLOYMENT RATE
Income in Pasadena
Income Overview in Pasadena
Per Capita Income in Pasadena is $27,913, while median incomes of families and households are $71,610 and $64,698 respectively.
| Characteristic | Number | Measure |
| Per Capita Income | 150,620 | $27,913 |
| Median Family Income | 37,188 | $71,610 |
| Mean Family Income | 37,188 | $90,039 |
| Median Household Income | 49,541 | $64,698 |
| Mean Household Income | 49,541 | $83,919 |
| Income Deficit | 37,188 | $10,187 |
| Wage / Income Gap (%) | 150,620 | 38.60% |
| Wage / Income Gap ($) | 150,620 | 61.40¢ per $1 |
| Gini / Inequality Index | 150,620 | 0.43 |
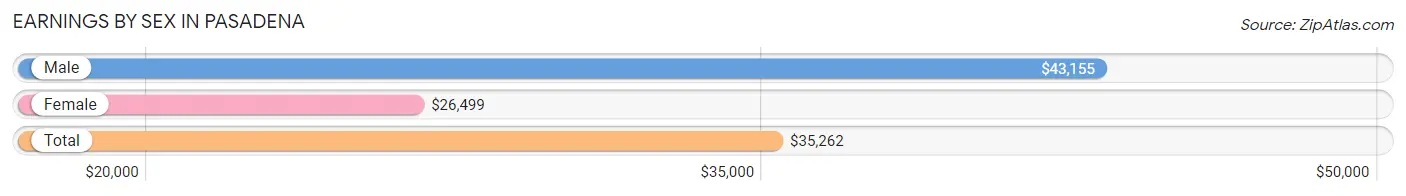
Earnings by Sex in Pasadena
Average Earnings in Pasadena are $35,262, $43,155 for men and $26,499 for women, a difference of 38.6%.
| Sex | Number | Average Earnings |
| Male | 42,897 (57.1%) | $43,155 |
| Female | 32,256 (42.9%) | $26,499 |
| Total | 75,153 (100.0%) | $35,262 |
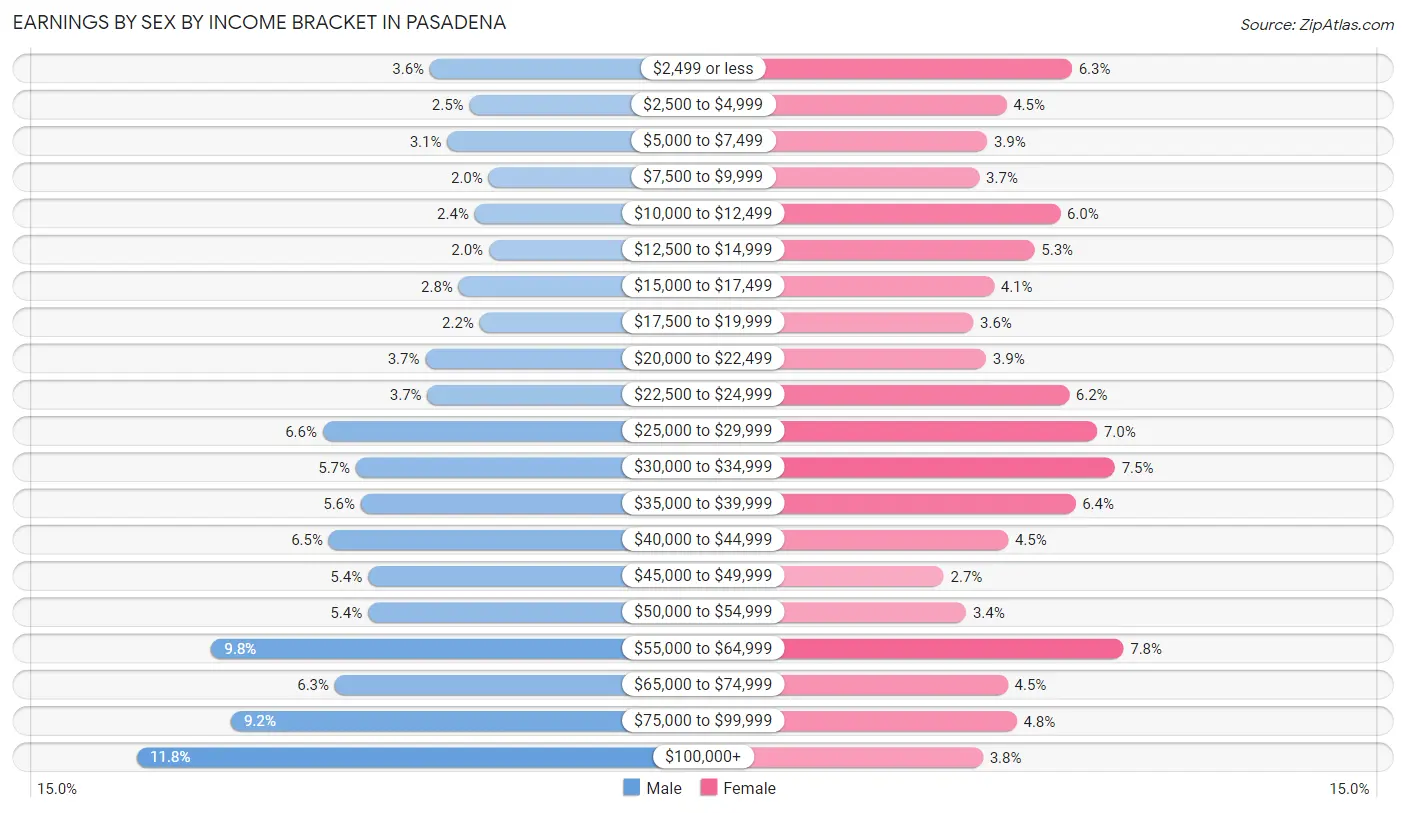
Earnings by Sex by Income Bracket in Pasadena
The most common earnings brackets in Pasadena are $100,000+ for men (5,078 | 11.8%) and $55,000 to $64,999 for women (2,507 | 7.8%).
| Income | Male | Female |
| $2,499 or less | 1,550 (3.6%) | 2,040 (6.3%) |
| $2,500 to $4,999 | 1,073 (2.5%) | 1,446 (4.5%) |
| $5,000 to $7,499 | 1,339 (3.1%) | 1,272 (3.9%) |
| $7,500 to $9,999 | 841 (2.0%) | 1,201 (3.7%) |
| $10,000 to $12,499 | 1,007 (2.4%) | 1,931 (6.0%) |
| $12,500 to $14,999 | 838 (1.9%) | 1,700 (5.3%) |
| $15,000 to $17,499 | 1,201 (2.8%) | 1,332 (4.1%) |
| $17,500 to $19,999 | 947 (2.2%) | 1,144 (3.5%) |
| $20,000 to $22,499 | 1,606 (3.7%) | 1,260 (3.9%) |
| $22,500 to $24,999 | 1,580 (3.7%) | 2,013 (6.2%) |
| $25,000 to $29,999 | 2,839 (6.6%) | 2,269 (7.0%) |
| $30,000 to $34,999 | 2,441 (5.7%) | 2,429 (7.5%) |
| $35,000 to $39,999 | 2,380 (5.6%) | 2,070 (6.4%) |
| $40,000 to $44,999 | 2,765 (6.5%) | 1,460 (4.5%) |
| $45,000 to $49,999 | 2,296 (5.3%) | 876 (2.7%) |
| $50,000 to $54,999 | 2,293 (5.3%) | 1,080 (3.4%) |
| $55,000 to $64,999 | 4,182 (9.8%) | 2,507 (7.8%) |
| $65,000 to $74,999 | 2,694 (6.3%) | 1,457 (4.5%) |
| $75,000 to $99,999 | 3,947 (9.2%) | 1,537 (4.8%) |
| $100,000+ | 5,078 (11.8%) | 1,232 (3.8%) |
| Total | 42,897 (100.0%) | 32,256 (100.0%) |
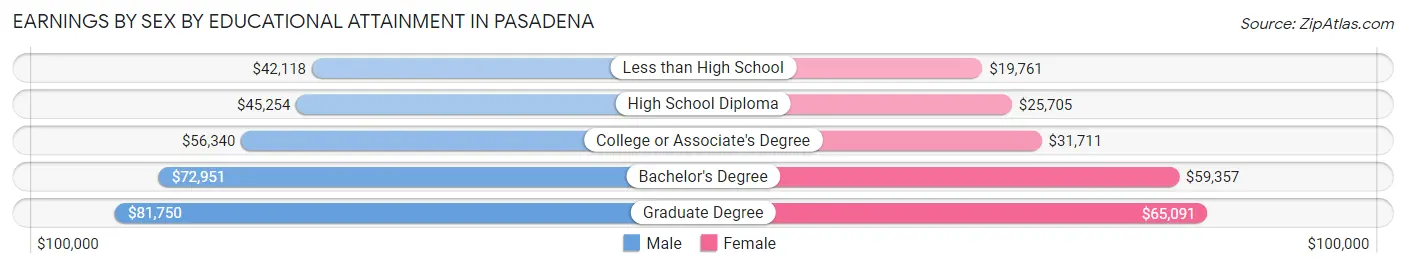
Earnings by Sex by Educational Attainment in Pasadena
Average earnings in Pasadena are $49,282 for men and $30,830 for women, a difference of 37.4%. Men with an educational attainment of graduate degree enjoy the highest average annual earnings of $81,750, while those with less than high school education earn the least with $42,118. Women with an educational attainment of graduate degree earn the most with the average annual earnings of $65,091, while those with less than high school education have the smallest earnings of $19,761.
| Educational Attainment | Male Income | Female Income |
| Less than High School | $42,118 | $19,761 |
| High School Diploma | $45,254 | $25,705 |
| College or Associate's Degree | $56,340 | $31,711 |
| Bachelor's Degree | $72,951 | $59,357 |
| Graduate Degree | $81,750 | $65,091 |
| Total | $49,282 | $30,830 |
Family Income in Pasadena
Family Income Brackets in Pasadena
According to the Pasadena family income data, there are 6,471 families falling into the $50,000 to $74,999 income range, which is the most common income bracket and makes up 17.4% of all families. Conversely, the $10,000 to $14,999 income bracket is the least frequent group with only 855 families (2.3%) belonging to this category.
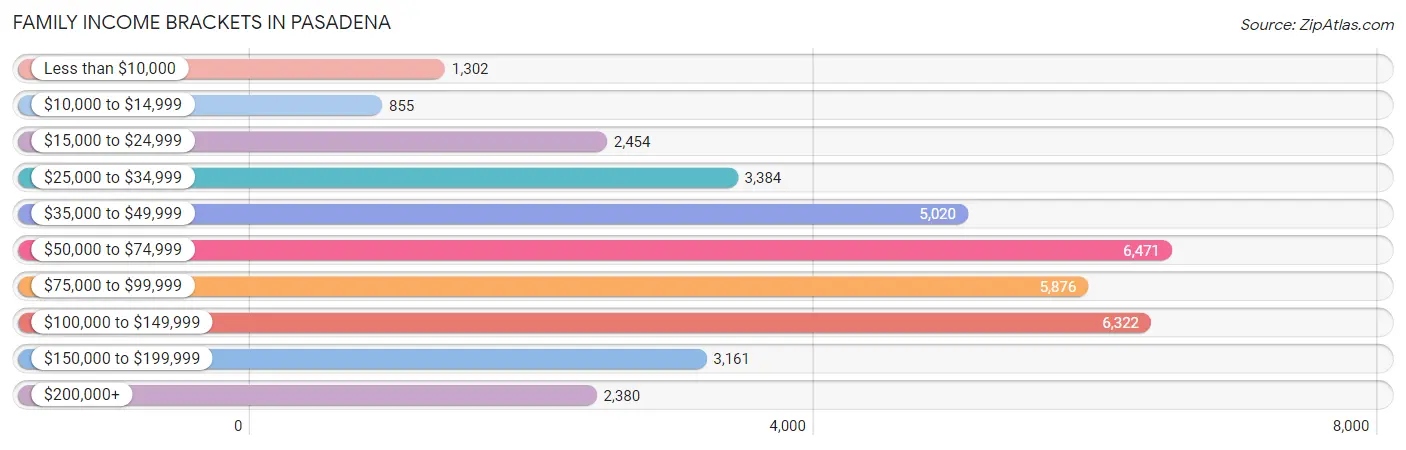
| Income Bracket | # Families | % Families |
| Less than $10,000 | 1,302 | 3.5% |
| $10,000 to $14,999 | 855 | 2.3% |
| $15,000 to $24,999 | 2,454 | 6.6% |
| $25,000 to $34,999 | 3,384 | 9.1% |
| $35,000 to $49,999 | 5,020 | 13.5% |
| $50,000 to $74,999 | 6,471 | 17.4% |
| $75,000 to $99,999 | 5,876 | 15.8% |
| $100,000 to $149,999 | 6,322 | 17.0% |
| $150,000 to $199,999 | 3,161 | 8.5% |
| $200,000+ | 2,380 | 6.4% |
Family Income by Famaliy Size in Pasadena
5-person families (4,785 | 12.9%) account for the highest median family income in Pasadena with $80,442 per family, while 2-person families (12,716 | 34.2%) have the highest median income of $33,254 per family member.
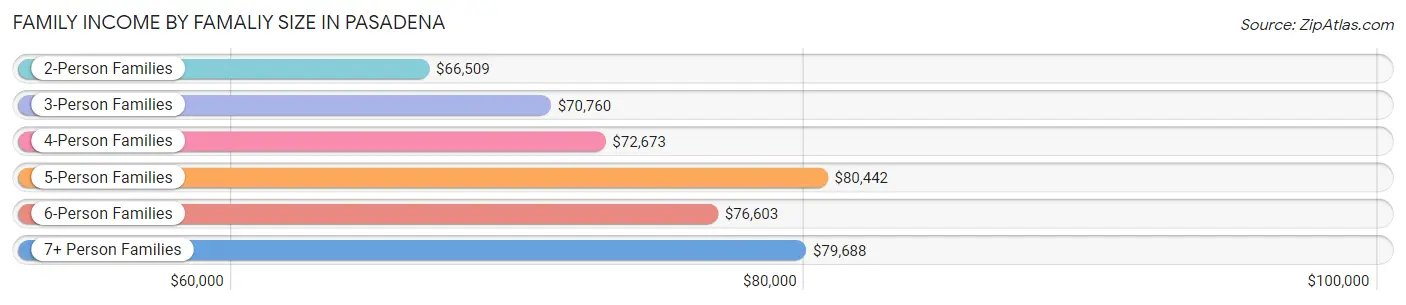
| Income Bracket | # Families | Median Income |
| 2-Person Families | 12,716 (34.2%) | $66,509 |
| 3-Person Families | 9,290 (25.0%) | $70,760 |
| 4-Person Families | 7,521 (20.2%) | $72,673 |
| 5-Person Families | 4,785 (12.9%) | $80,442 |
| 6-Person Families | 1,760 (4.7%) | $76,603 |
| 7+ Person Families | 1,116 (3.0%) | $79,688 |
| Total | 37,188 (100.0%) | $71,610 |
Family Income by Number of Earners in Pasadena
The median family income in Pasadena is $71,610, with families comprising 3+ earners (5,801) having the highest median family income of $114,315, while families with no earners (3,215) have the lowest median family income of $39,478, accounting for 15.6% and 8.6% of families, respectively.
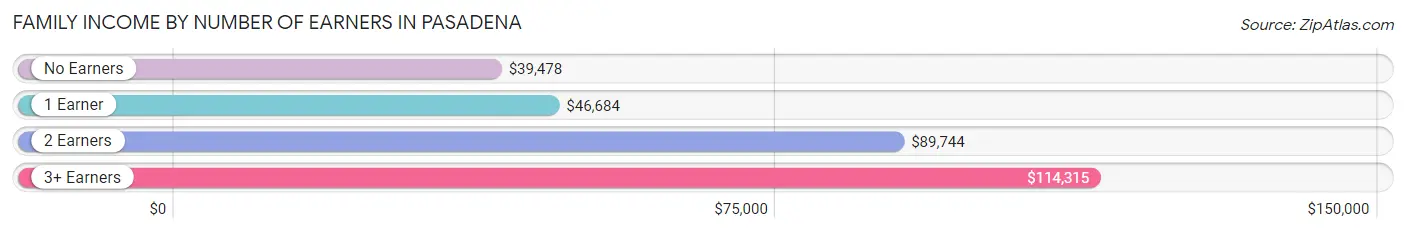
| Number of Earners | # Families | Median Income |
| No Earners | 3,215 (8.6%) | $39,478 |
| 1 Earner | 14,813 (39.8%) | $46,684 |
| 2 Earners | 13,359 (35.9%) | $89,744 |
| 3+ Earners | 5,801 (15.6%) | $114,315 |
| Total | 37,188 (100.0%) | $71,610 |
Household Income in Pasadena
Household Income Brackets in Pasadena
With 9,215 households falling in the category, the $50,000 to $74,999 income range is the most frequent in Pasadena, accounting for 18.6% of all households. In contrast, only 1,585 households (3.2%) fall into the $10,000 to $14,999 income bracket, making it the least populous group.
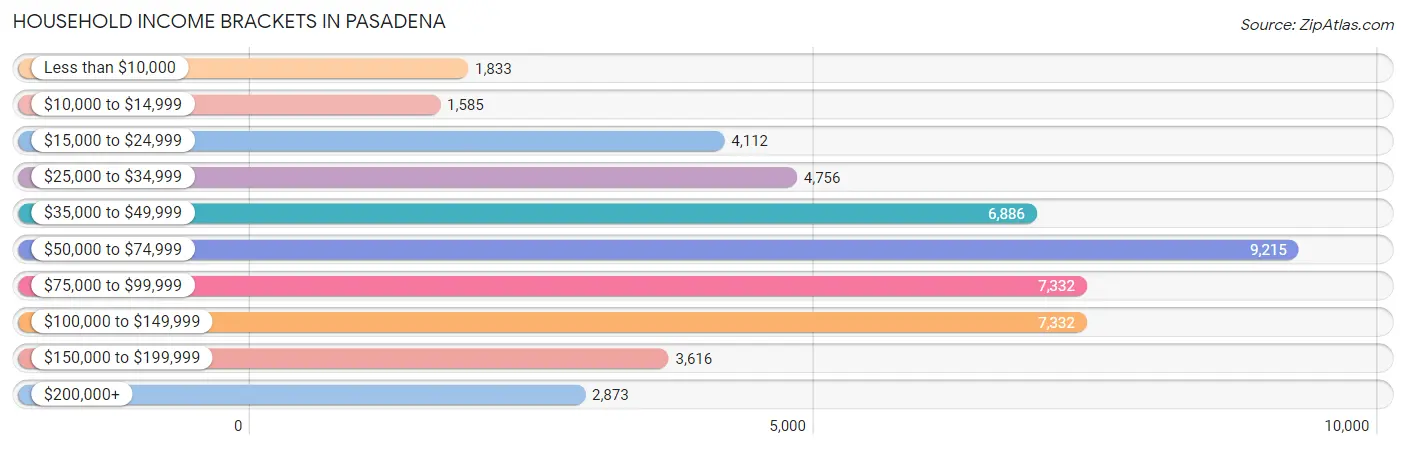
| Income Bracket | # Households | % Households |
| Less than $10,000 | 1,833 | 3.7% |
| $10,000 to $14,999 | 1,585 | 3.2% |
| $15,000 to $24,999 | 4,112 | 8.3% |
| $25,000 to $34,999 | 4,756 | 9.6% |
| $35,000 to $49,999 | 6,886 | 13.9% |
| $50,000 to $74,999 | 9,215 | 18.6% |
| $75,000 to $99,999 | 7,332 | 14.8% |
| $100,000 to $149,999 | 7,332 | 14.8% |
| $150,000 to $199,999 | 3,616 | 7.3% |
| $200,000+ | 2,873 | 5.8% |
Household Income by Householder Age in Pasadena
The median household income in Pasadena is $64,698, with the highest median household income of $78,912 found in the 45 to 64 years age bracket for the primary householder. A total of 18,509 households (37.4%) fall into this category. Meanwhile, the 15 to 24 years age bracket for the primary householder has the lowest median household income of $46,374, with 2,785 households (5.6%) in this group.
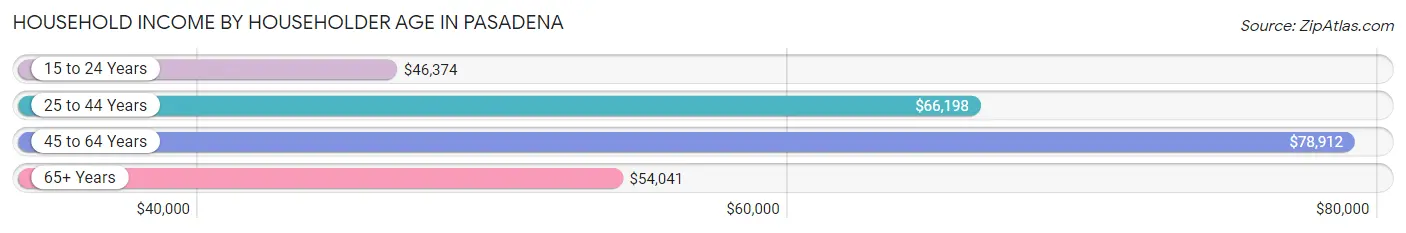
| Income Bracket | # Households | Median Income |
| 15 to 24 Years | 2,785 (5.6%) | $46,374 |
| 25 to 44 Years | 18,138 (36.6%) | $66,198 |
| 45 to 64 Years | 18,509 (37.4%) | $78,912 |
| 65+ Years | 10,109 (20.4%) | $54,041 |
| Total | 49,541 (100.0%) | $64,698 |
Poverty in Pasadena
Income Below Poverty by Sex and Age in Pasadena
With 16.4% poverty level for males and 19.6% for females among the residents of Pasadena, 5 year old males and 15 year old females are the most vulnerable to poverty, with 513 males (51.6%) and 342 females (35.7%) in their respective age groups living below the poverty level.
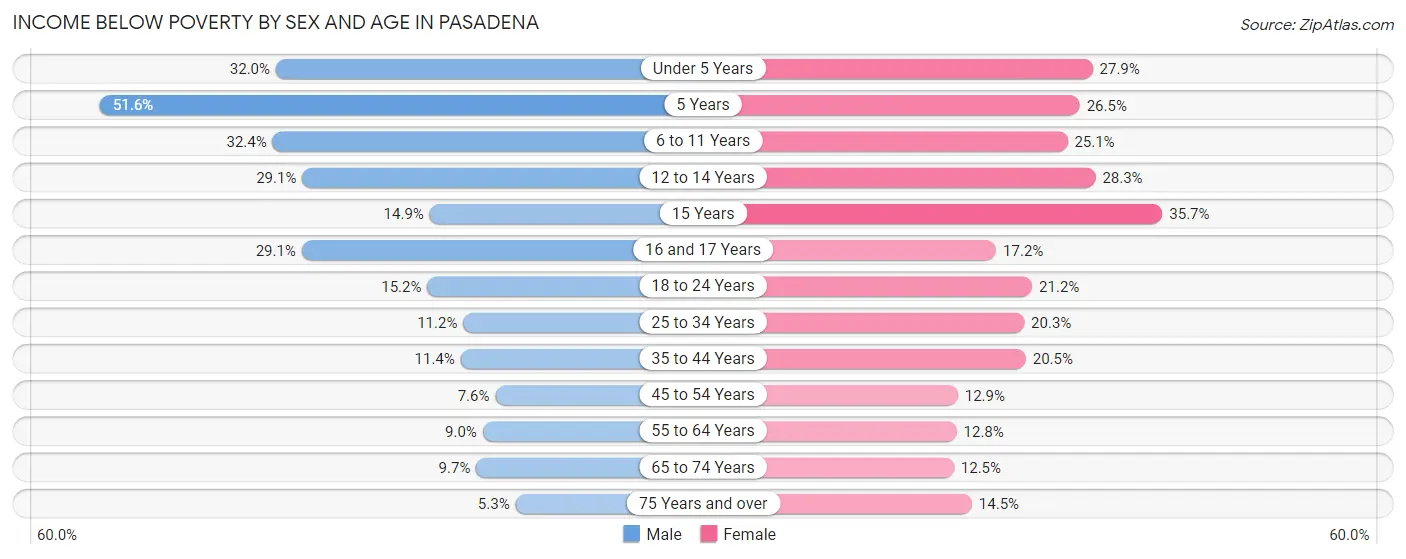
| Age Bracket | Male | Female |
| Under 5 Years | 1,792 (32.0%) | 1,649 (27.9%) |
| 5 Years | 513 (51.6%) | 363 (26.5%) |
| 6 to 11 Years | 2,227 (32.4%) | 1,801 (25.1%) |
| 12 to 14 Years | 1,100 (29.1%) | 1,095 (28.2%) |
| 15 Years | 202 (14.9%) | 342 (35.7%) |
| 16 and 17 Years | 698 (29.1%) | 407 (17.2%) |
| 18 to 24 Years | 1,267 (15.1%) | 1,633 (21.2%) |
| 25 to 34 Years | 1,181 (11.2%) | 2,169 (20.3%) |
| 35 to 44 Years | 1,132 (11.4%) | 1,932 (20.5%) |
| 45 to 54 Years | 643 (7.6%) | 1,195 (12.9%) |
| 55 to 64 Years | 762 (9.0%) | 987 (12.8%) |
| 65 to 74 Years | 455 (9.7%) | 694 (12.5%) |
| 75 Years and over | 136 (5.3%) | 496 (14.5%) |
| Total | 12,108 (16.4%) | 14,763 (19.6%) |
Income Above Poverty by Sex and Age in Pasadena
According to the poverty statistics in Pasadena, males aged 75 years and over and females aged 65 to 74 years are the age groups that are most secure financially, with 94.7% of males and 87.5% of females in these age groups living above the poverty line.
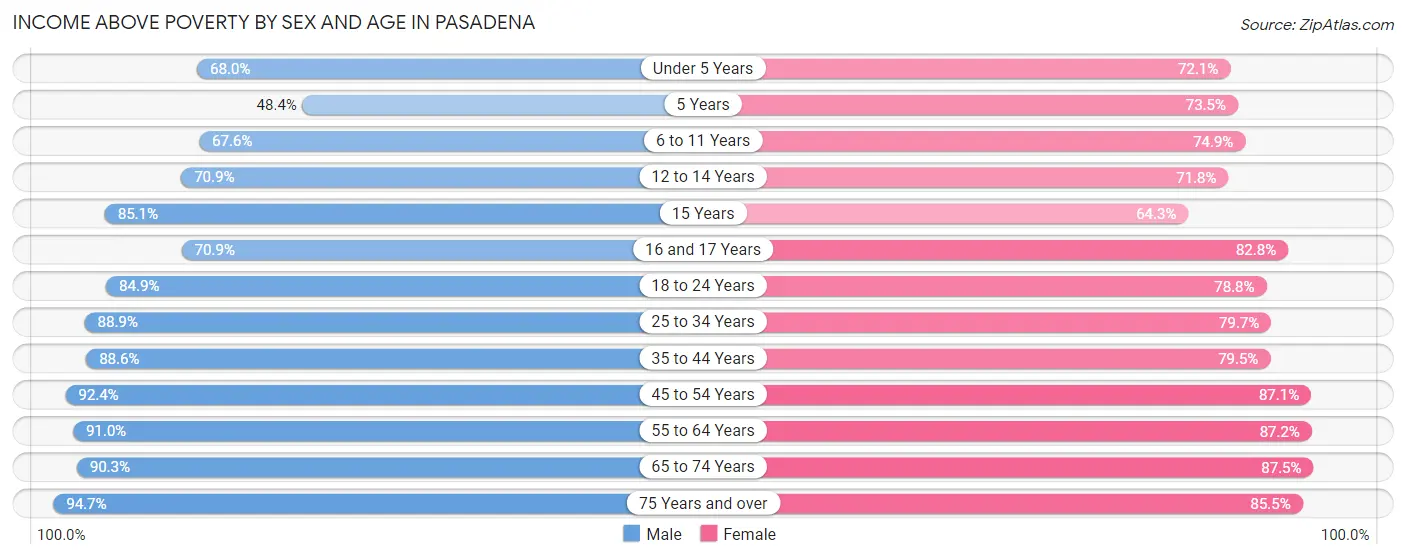
| Age Bracket | Male | Female |
| Under 5 Years | 3,805 (68.0%) | 4,256 (72.1%) |
| 5 Years | 481 (48.4%) | 1,007 (73.5%) |
| 6 to 11 Years | 4,648 (67.6%) | 5,367 (74.9%) |
| 12 to 14 Years | 2,683 (70.9%) | 2,781 (71.8%) |
| 15 Years | 1,155 (85.1%) | 616 (64.3%) |
| 16 and 17 Years | 1,697 (70.9%) | 1,960 (82.8%) |
| 18 to 24 Years | 7,095 (84.9%) | 6,070 (78.8%) |
| 25 to 34 Years | 9,414 (88.8%) | 8,513 (79.7%) |
| 35 to 44 Years | 8,763 (88.6%) | 7,499 (79.5%) |
| 45 to 54 Years | 7,837 (92.4%) | 8,054 (87.1%) |
| 55 to 64 Years | 7,722 (91.0%) | 6,730 (87.2%) |
| 65 to 74 Years | 4,237 (90.3%) | 4,867 (87.5%) |
| 75 Years and over | 2,415 (94.7%) | 2,927 (85.5%) |
| Total | 61,952 (83.7%) | 60,647 (80.4%) |
Income Below Poverty Among Married-Couple Families in Pasadena
The poverty statistics for married-couple families in Pasadena show that 7.2% or 1,813 of the total 25,008 families live below the poverty line. Families with 5 or more children have the highest poverty rate of 73.8%, comprising of 104 families. On the other hand, families with no children have the lowest poverty rate of 3.8%, which includes 481 families.
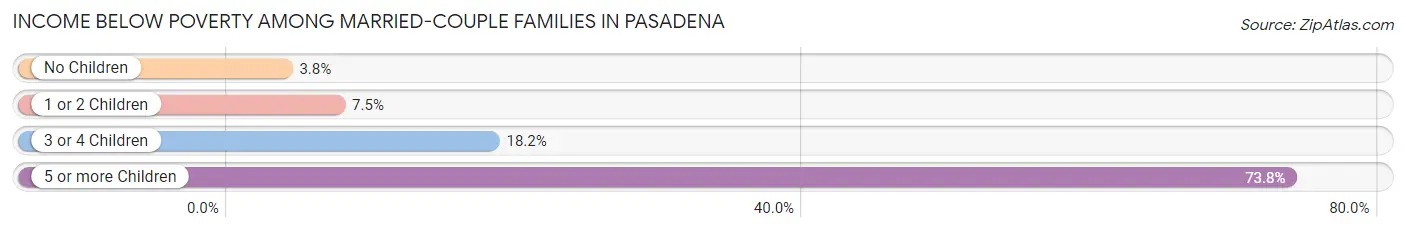
| Children | Above Poverty | Below Poverty |
| No Children | 12,212 (96.2%) | 481 (3.8%) |
| 1 or 2 Children | 8,516 (92.5%) | 687 (7.5%) |
| 3 or 4 Children | 2,430 (81.8%) | 541 (18.2%) |
| 5 or more Children | 37 (26.2%) | 104 (73.8%) |
| Total | 23,195 (92.7%) | 1,813 (7.2%) |
Income Below Poverty Among Single-Parent Households in Pasadena
According to the poverty data in Pasadena, 17.2% or 652 single-father households and 33.3% or 2,795 single-mother households are living below the poverty line. Among single-father households, those with 5 or more children have the highest poverty rate, with 24 households (82.8%) experiencing poverty. Likewise, among single-mother households, those with 5 or more children have the highest poverty rate, with 164 households (81.2%) falling below the poverty line.
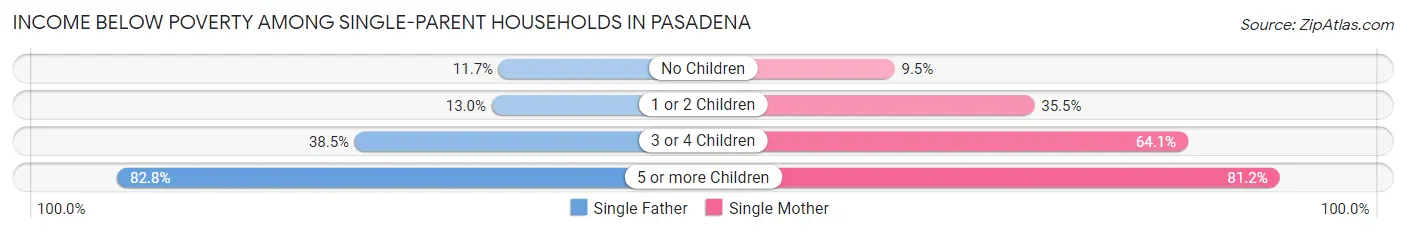
| Children | Single Father | Single Mother |
| No Children | 205 (11.7%) | 243 (9.5%) |
| 1 or 2 Children | 176 (13.0%) | 1,514 (35.5%) |
| 3 or 4 Children | 247 (38.5%) | 874 (64.1%) |
| 5 or more Children | 24 (82.8%) | 164 (81.2%) |
| Total | 652 (17.2%) | 2,795 (33.3%) |
Income Below Poverty Among Married-Couple vs Single-Parent Households in Pasadena
The poverty data for Pasadena shows that 1,813 of the married-couple family households (7.2%) and 3,447 of the single-parent households (28.3%) are living below the poverty level. Within the married-couple family households, those with 5 or more children have the highest poverty rate, with 104 households (73.8%) falling below the poverty line. Among the single-parent households, those with 5 or more children have the highest poverty rate, with 188 household (81.4%) living below poverty.
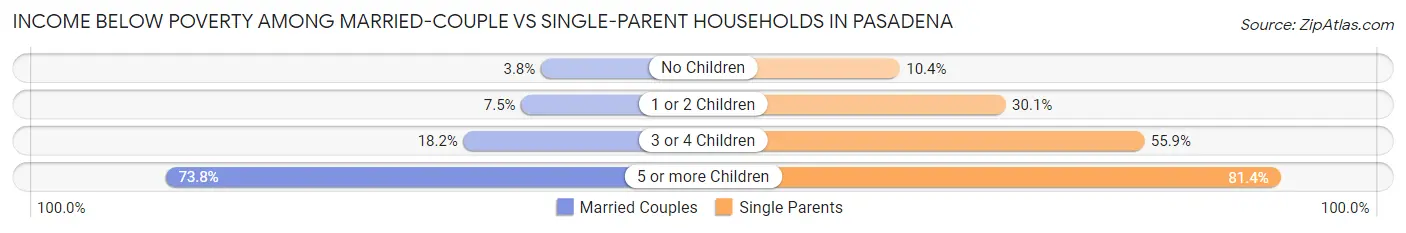
| Children | Married-Couple Families | Single-Parent Households |
| No Children | 481 (3.8%) | 448 (10.4%) |
| 1 or 2 Children | 687 (7.5%) | 1,690 (30.1%) |
| 3 or 4 Children | 541 (18.2%) | 1,121 (55.9%) |
| 5 or more Children | 104 (73.8%) | 188 (81.4%) |
| Total | 1,813 (7.2%) | 3,447 (28.3%) |
Race in Pasadena
The most populous races in Pasadena are Hispanic or Latino (106,001 | 70.4%), White / Caucasian (94,536 | 62.8%), and Two or more Races (34,285 | 22.8%).
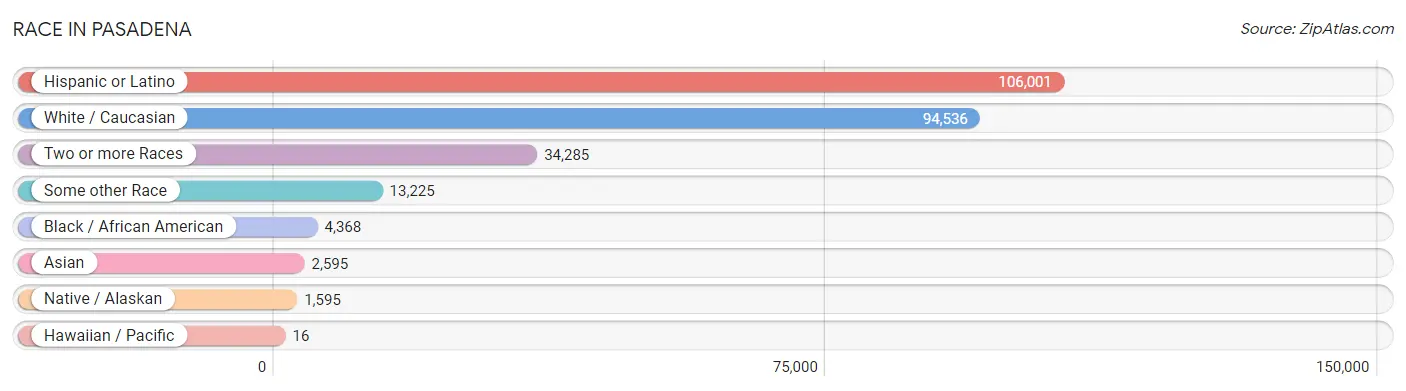
| Race | # Population | % Population |
| Asian | 2,595 | 1.7% |
| Black / African American | 4,368 | 2.9% |
| Hawaiian / Pacific | 16 | 0.0% |
| Hispanic or Latino | 106,001 | 70.4% |
| Native / Alaskan | 1,595 | 1.1% |
| White / Caucasian | 94,536 | 62.8% |
| Two or more Races | 34,285 | 22.8% |
| Some other Race | 13,225 | 8.8% |
| Total | 150,620 | 100.0% |
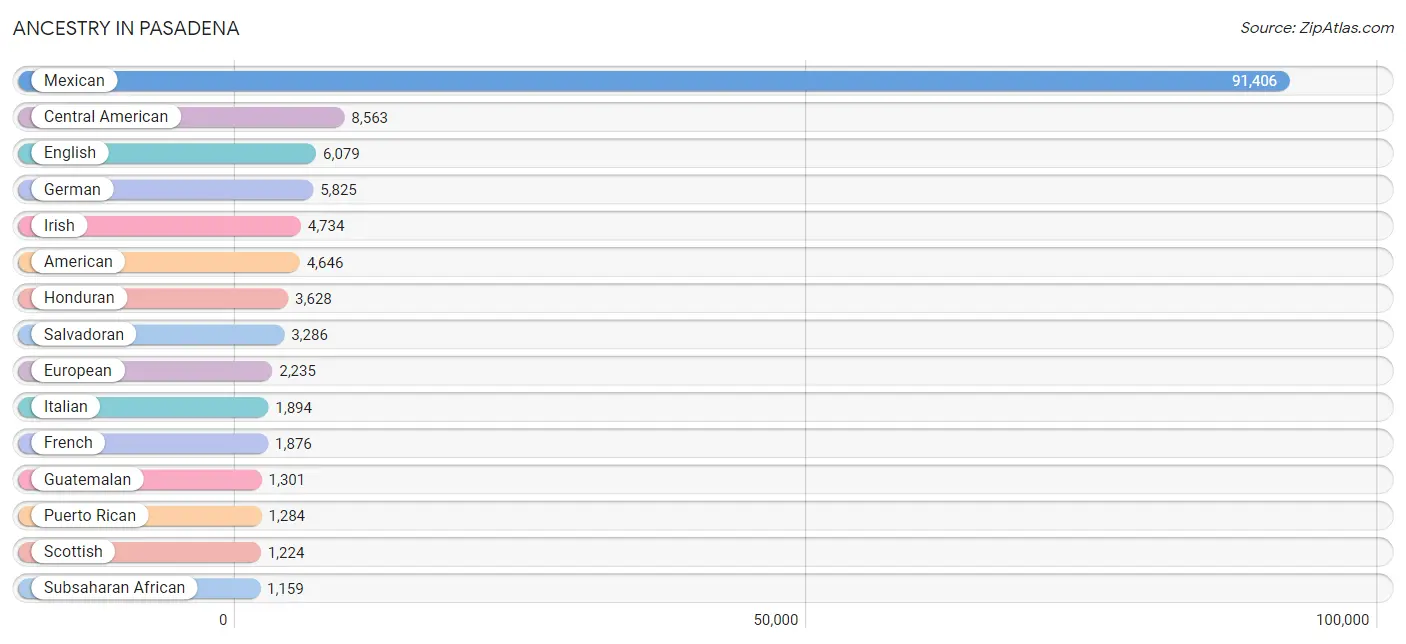
Ancestry in Pasadena
The most populous ancestries reported in Pasadena are Mexican (91,406 | 60.7%), Central American (8,563 | 5.7%), English (6,079 | 4.0%), German (5,825 | 3.9%), and Irish (4,734 | 3.1%), together accounting for 77.4% of all Pasadena residents.
| Ancestry | # Population | % Population |
| African | 1,146 | 0.8% |
| Alsatian | 21 | 0.0% |
| American | 4,646 | 3.1% |
| Apache | 158 | 0.1% |
| Arab | 316 | 0.2% |
| Argentinean | 43 | 0.0% |
| Austrian | 144 | 0.1% |
| Belgian | 46 | 0.0% |
| Bhutanese | 180 | 0.1% |
| Blackfeet | 90 | 0.1% |
| Bolivian | 35 | 0.0% |
| Brazilian | 24 | 0.0% |
| British | 504 | 0.3% |
| British West Indian | 21 | 0.0% |
| Bulgarian | 12 | 0.0% |
| Burmese | 60 | 0.0% |
| Cajun | 45 | 0.0% |
| Canadian | 175 | 0.1% |
| Celtic | 12 | 0.0% |
| Central American | 8,563 | 5.7% |
| Central American Indian | 110 | 0.1% |
| Cherokee | 288 | 0.2% |
| Cheyenne | 5 | 0.0% |
| Chilean | 96 | 0.1% |
| Choctaw | 92 | 0.1% |
| Colombian | 456 | 0.3% |
| Costa Rican | 47 | 0.0% |
| Creek | 89 | 0.1% |
| Croatian | 13 | 0.0% |
| Crow | 40 | 0.0% |
| Cuban | 814 | 0.5% |
| Czech | 524 | 0.4% |
| Czechoslovakian | 16 | 0.0% |
| Danish | 119 | 0.1% |
| Dominican | 56 | 0.0% |
| Dutch | 726 | 0.5% |
| Eastern European | 43 | 0.0% |
| Ecuadorian | 211 | 0.1% |
| Egyptian | 85 | 0.1% |
| English | 6,079 | 4.0% |
| European | 2,235 | 1.5% |
| Finnish | 31 | 0.0% |
| French | 1,876 | 1.3% |
| French Canadian | 223 | 0.2% |
| German | 5,825 | 3.9% |
| Greek | 172 | 0.1% |
| Guatemalan | 1,301 | 0.9% |
| Guyanese | 29 | 0.0% |
| Honduran | 3,628 | 2.4% |
| Hungarian | 81 | 0.1% |
| Indian (Asian) | 606 | 0.4% |
| Iranian | 69 | 0.1% |
| Iraqi | 58 | 0.0% |
| Irish | 4,734 | 3.1% |
| Israeli | 51 | 0.0% |
| Italian | 1,894 | 1.3% |
| Jamaican | 40 | 0.0% |
| Japanese | 35 | 0.0% |
| Jordanian | 9 | 0.0% |
| Korean | 447 | 0.3% |
| Lebanese | 66 | 0.0% |
| Lithuanian | 71 | 0.1% |
| Lumbee | 32 | 0.0% |
| Malaysian | 2 | 0.0% |
| Mexican | 91,406 | 60.7% |
| Mexican American Indian | 260 | 0.2% |
| Native Hawaiian | 95 | 0.1% |
| Nicaraguan | 237 | 0.2% |
| Nigerian | 38 | 0.0% |
| Northern European | 66 | 0.0% |
| Norwegian | 209 | 0.1% |
| Palestinian | 11 | 0.0% |
| Panamanian | 64 | 0.0% |
| Pennsylvania German | 16 | 0.0% |
| Peruvian | 58 | 0.0% |
| Polish | 892 | 0.6% |
| Portuguese | 66 | 0.0% |
| Puerto Rican | 1,284 | 0.9% |
| Romanian | 16 | 0.0% |
| Russian | 234 | 0.2% |
| Salvadoran | 3,286 | 2.2% |
| Samoan | 16 | 0.0% |
| Scandinavian | 71 | 0.1% |
| Scotch-Irish | 861 | 0.6% |
| Scottish | 1,224 | 0.8% |
| Slavic | 5 | 0.0% |
| South American | 1,090 | 0.7% |
| Spaniard | 267 | 0.2% |
| Spanish | 207 | 0.1% |
| Sri Lankan | 846 | 0.6% |
| Subsaharan African | 1,159 | 0.8% |
| Swedish | 459 | 0.3% |
| Swiss | 67 | 0.0% |
| Syrian | 18 | 0.0% |
| Thai | 869 | 0.6% |
| Trinidadian and Tobagonian | 144 | 0.1% |
| Ukrainian | 98 | 0.1% |
| Venezuelan | 160 | 0.1% |
| Welsh | 336 | 0.2% |
| West Indian | 59 | 0.0% |
| Yaqui | 31 | 0.0% |
| Yugoslavian | 11 | 0.0% |
| Yuman | 24 | 0.0% | View All 103 Rows |
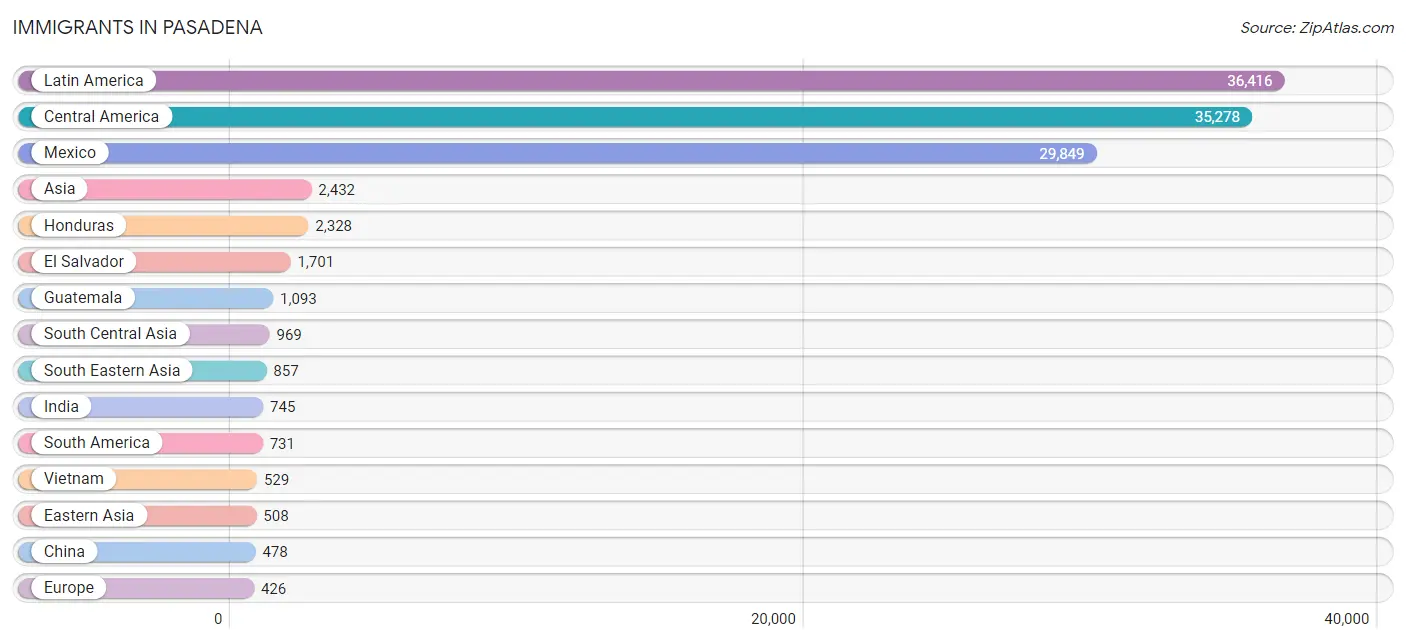
Immigrants in Pasadena
The most numerous immigrant groups reported in Pasadena came from Latin America (36,416 | 24.2%), Central America (35,278 | 23.4%), Mexico (29,849 | 19.8%), Asia (2,432 | 1.6%), and Honduras (2,328 | 1.5%), together accounting for 70.6% of all Pasadena residents.
| Immigration Origin | # Population | % Population |
| Africa | 121 | 0.1% |
| Argentina | 20 | 0.0% |
| Asia | 2,432 | 1.6% |
| Belarus | 13 | 0.0% |
| Belize | 16 | 0.0% |
| Brazil | 33 | 0.0% |
| Bulgaria | 6 | 0.0% |
| Cambodia | 29 | 0.0% |
| Canada | 55 | 0.0% |
| Caribbean | 407 | 0.3% |
| Central America | 35,278 | 23.4% |
| Chile | 136 | 0.1% |
| China | 478 | 0.3% |
| Colombia | 331 | 0.2% |
| Costa Rica | 35 | 0.0% |
| Cuba | 262 | 0.2% |
| Denmark | 15 | 0.0% |
| Dominican Republic | 12 | 0.0% |
| Eastern Africa | 39 | 0.0% |
| Eastern Asia | 508 | 0.3% |
| Eastern Europe | 77 | 0.1% |
| Ecuador | 4 | 0.0% |
| Egypt | 40 | 0.0% |
| El Salvador | 1,701 | 1.1% |
| England | 26 | 0.0% |
| Europe | 426 | 0.3% |
| France | 34 | 0.0% |
| Germany | 111 | 0.1% |
| Greece | 6 | 0.0% |
| Guatemala | 1,093 | 0.7% |
| Guyana | 46 | 0.0% |
| Honduras | 2,328 | 1.5% |
| Hong Kong | 9 | 0.0% |
| Hungary | 9 | 0.0% |
| India | 745 | 0.5% |
| Iran | 54 | 0.0% |
| Iraq | 18 | 0.0% |
| Jamaica | 36 | 0.0% |
| Japan | 30 | 0.0% |
| Kuwait | 20 | 0.0% |
| Laos | 2 | 0.0% |
| Latin America | 36,416 | 24.2% |
| Lebanon | 2 | 0.0% |
| Mexico | 29,849 | 19.8% |
| Netherlands | 45 | 0.0% |
| Nicaragua | 179 | 0.1% |
| Nigeria | 17 | 0.0% |
| Northern Africa | 40 | 0.0% |
| Northern Europe | 153 | 0.1% |
| Norway | 4 | 0.0% |
| Pakistan | 159 | 0.1% |
| Panama | 77 | 0.1% |
| Peru | 27 | 0.0% |
| Philippines | 281 | 0.2% |
| Poland | 10 | 0.0% |
| Romania | 11 | 0.0% |
| Russia | 28 | 0.0% |
| Scotland | 10 | 0.0% |
| South Africa | 14 | 0.0% |
| South America | 731 | 0.5% |
| South Central Asia | 969 | 0.6% |
| South Eastern Asia | 857 | 0.6% |
| Southern Europe | 6 | 0.0% |
| Sweden | 70 | 0.1% |
| Syria | 18 | 0.0% |
| Taiwan | 70 | 0.1% |
| Trinidad and Tobago | 52 | 0.0% |
| Uzbekistan | 11 | 0.0% |
| Venezuela | 134 | 0.1% |
| Vietnam | 529 | 0.4% |
| Western Africa | 25 | 0.0% |
| Western Asia | 98 | 0.1% |
| Western Europe | 190 | 0.1% | View All 73 Rows |
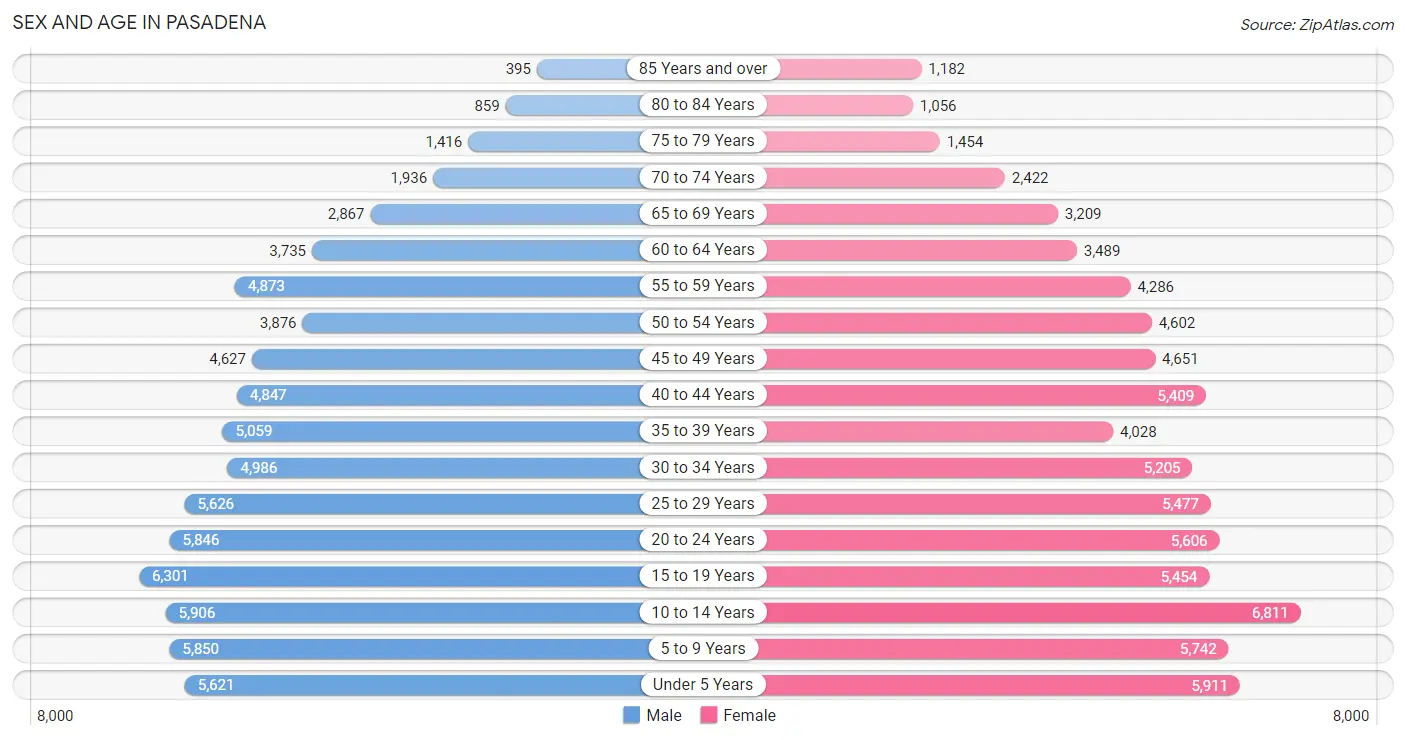
Sex and Age in Pasadena
Sex and Age in Pasadena
The most populous age groups in Pasadena are 15 to 19 Years (6,301 | 8.4%) for men and 10 to 14 Years (6,811 | 9.0%) for women.
| Age Bracket | Male | Female |
| Under 5 Years | 5,621 (7.5%) | 5,911 (7.8%) |
| 5 to 9 Years | 5,850 (7.8%) | 5,742 (7.6%) |
| 10 to 14 Years | 5,906 (7.9%) | 6,811 (9.0%) |
| 15 to 19 Years | 6,301 (8.4%) | 5,454 (7.2%) |
| 20 to 24 Years | 5,846 (7.8%) | 5,606 (7.4%) |
| 25 to 29 Years | 5,626 (7.5%) | 5,477 (7.2%) |
| 30 to 34 Years | 4,986 (6.7%) | 5,205 (6.9%) |
| 35 to 39 Years | 5,059 (6.8%) | 4,028 (5.3%) |
| 40 to 44 Years | 4,847 (6.5%) | 5,409 (7.1%) |
| 45 to 49 Years | 4,627 (6.2%) | 4,651 (6.1%) |
| 50 to 54 Years | 3,876 (5.2%) | 4,602 (6.1%) |
| 55 to 59 Years | 4,873 (6.5%) | 4,286 (5.6%) |
| 60 to 64 Years | 3,735 (5.0%) | 3,489 (4.6%) |
| 65 to 69 Years | 2,867 (3.8%) | 3,209 (4.2%) |
| 70 to 74 Years | 1,936 (2.6%) | 2,422 (3.2%) |
| 75 to 79 Years | 1,416 (1.9%) | 1,454 (1.9%) |
| 80 to 84 Years | 859 (1.1%) | 1,056 (1.4%) |
| 85 Years and over | 395 (0.5%) | 1,182 (1.6%) |
| Total | 74,626 (100.0%) | 75,994 (100.0%) |
Families and Households in Pasadena
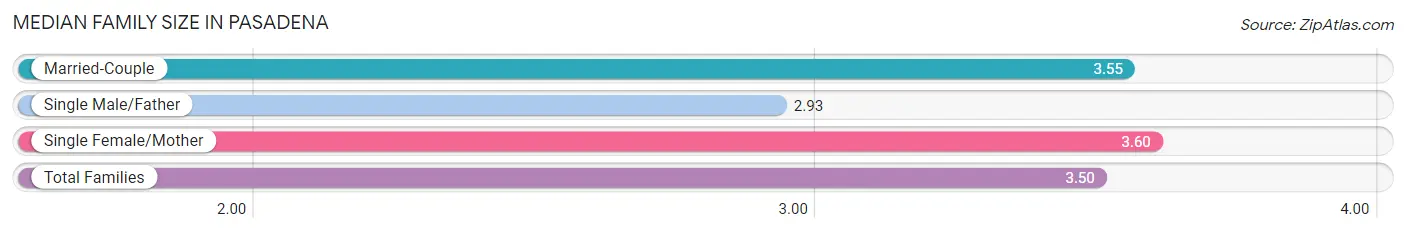
Median Family Size in Pasadena
The median family size in Pasadena is 3.50 persons per family, with single female/mother families (8,393 | 22.6%) accounting for the largest median family size of 3.6 persons per family. On the other hand, single male/father families (3,787 | 10.2%) represent the smallest median family size with 2.93 persons per family.
| Family Type | # Families | Family Size |
| Married-Couple | 25,008 (67.2%) | 3.55 |
| Single Male/Father | 3,787 (10.2%) | 2.93 |
| Single Female/Mother | 8,393 (22.6%) | 3.60 |
| Total Families | 37,188 (100.0%) | 3.50 |
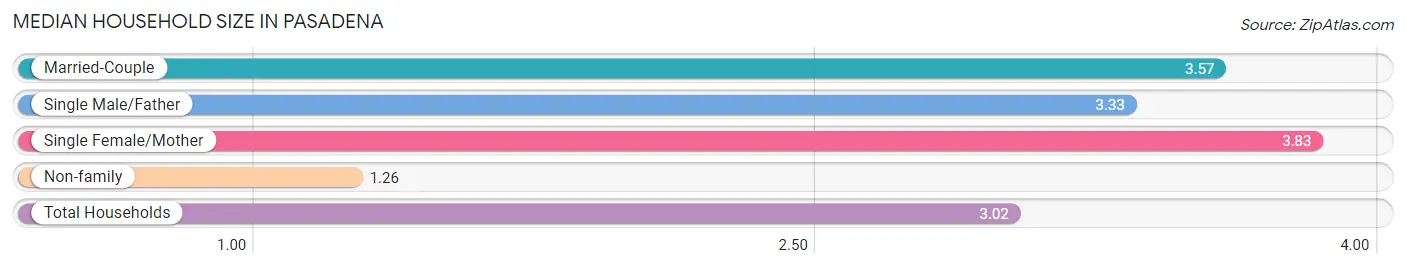
Median Household Size in Pasadena
The median household size in Pasadena is 3.02 persons per household, with single female/mother households (8,393 | 16.9%) accounting for the largest median household size of 3.83 persons per household. non-family households (12,353 | 24.9%) represent the smallest median household size with 1.26 persons per household.
| Household Type | # Households | Household Size |
| Married-Couple | 25,008 (50.5%) | 3.57 |
| Single Male/Father | 3,787 (7.6%) | 3.33 |
| Single Female/Mother | 8,393 (16.9%) | 3.83 |
| Non-family | 12,353 (24.9%) | 1.26 |
| Total Households | 49,541 (100.0%) | 3.02 |
Household Size by Marriage Status in Pasadena
Out of a total of 49,541 households in Pasadena, 37,188 (75.1%) are family households, while 12,353 (24.9%) are nonfamily households. The most numerous type of family households are 2-person households, comprising 11,420, and the most common type of nonfamily households are 1-person households, comprising 9,603.
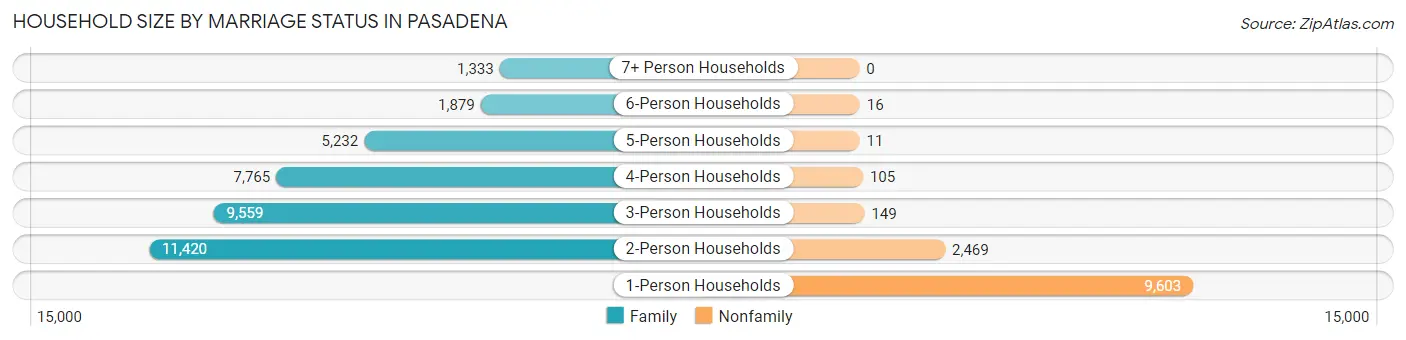
| Household Size | Family Households | Nonfamily Households |
| 1-Person Households | - | 9,603 (19.4%) |
| 2-Person Households | 11,420 (23.1%) | 2,469 (5.0%) |
| 3-Person Households | 9,559 (19.3%) | 149 (0.3%) |
| 4-Person Households | 7,765 (15.7%) | 105 (0.2%) |
| 5-Person Households | 5,232 (10.6%) | 11 (0.0%) |
| 6-Person Households | 1,879 (3.8%) | 16 (0.0%) |
| 7+ Person Households | 1,333 (2.7%) | 0 (0.0%) |
| Total | 37,188 (75.1%) | 12,353 (24.9%) |
Female Fertility in Pasadena
Fertility by Age in Pasadena
Average fertility rate in Pasadena is 54.0 births per 1,000 women. Women in the age bracket of 20 to 34 years have the highest fertility rate with 94.0 births per 1,000 women. Women in the age bracket of 20 to 34 years acount for 76.5% of all women with births.
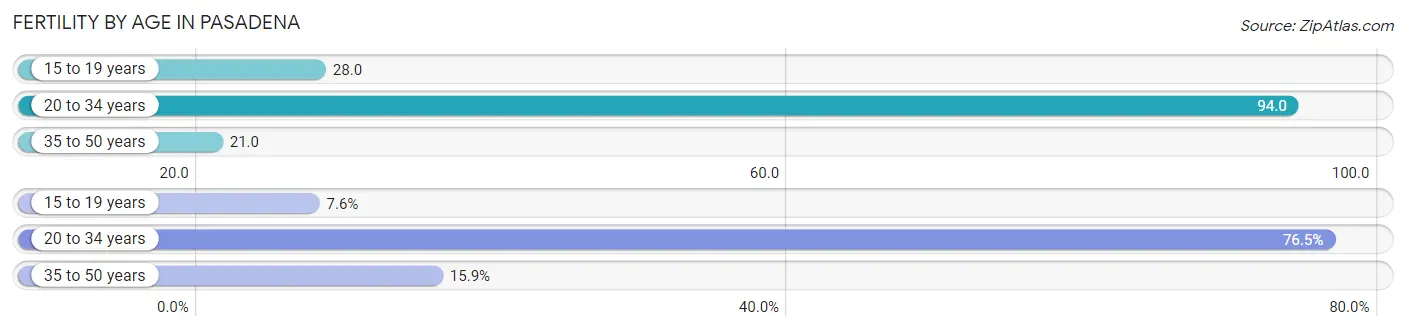
| Age Bracket | Women with Births | Births / 1,000 Women |
| 15 to 19 years | 152 (7.6%) | 28.0 |
| 20 to 34 years | 1,535 (76.5%) | 94.0 |
| 35 to 50 years | 320 (15.9%) | 21.0 |
| Total | 2,007 (100.0%) | 54.0 |
Fertility by Age by Marriage Status in Pasadena
62.1% of women with births (2,007) in Pasadena are married. The highest percentage of unmarried women with births falls into 15 to 19 years age bracket with 100.0% of them unmarried at the time of birth, while the lowest percentage of unmarried women with births belong to 20 to 34 years age bracket with 31.9% of them unmarried.
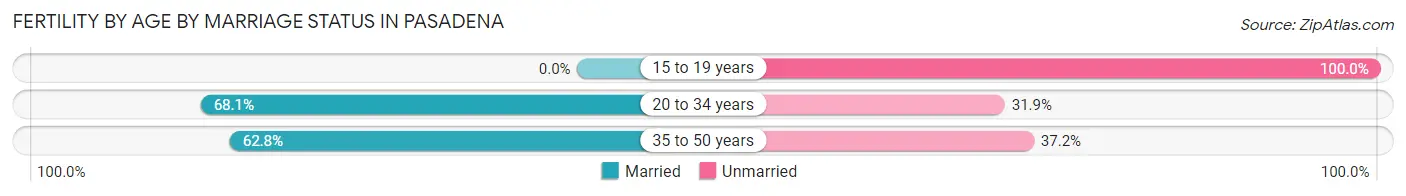
| Age Bracket | Married | Unmarried |
| 15 to 19 years | 0 (0.0%) | 152 (100.0%) |
| 20 to 34 years | 1,045 (68.1%) | 490 (31.9%) |
| 35 to 50 years | 201 (62.8%) | 119 (37.2%) |
| Total | 1,246 (62.1%) | 761 (37.9%) |
Fertility by Education in Pasadena
Average fertility rate in Pasadena is 54.0 births per 1,000 women. Women with the education attainment of high school diploma have the highest fertility rate of 69.0 births per 1,000 women, while women with the education attainment of graduate degree have the lowest fertility at 14.0 births per 1,000 women. Women with the education attainment of high school diploma represent 38.2% of all women with births.
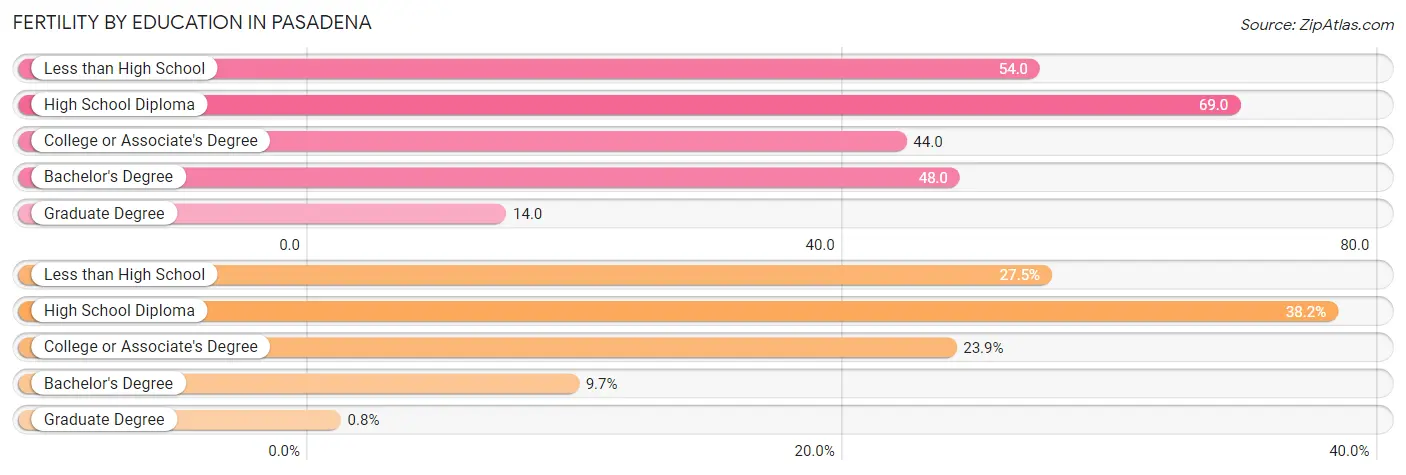
| Educational Attainment | Women with Births | Births / 1,000 Women |
| Less than High School | 551 (27.5%) | 54.0 |
| High School Diploma | 766 (38.2%) | 69.0 |
| College or Associate's Degree | 479 (23.9%) | 44.0 |
| Bachelor's Degree | 195 (9.7%) | 48.0 |
| Graduate Degree | 16 (0.8%) | 14.0 |
| Total | 2,007 (100.0%) | 54.0 |
Fertility by Education by Marriage Status in Pasadena
37.9% of women with births in Pasadena are unmarried. Women with the educational attainment of graduate degree are most likely to be married with 100.0% of them married at childbirth, while women with the educational attainment of college or associate's degree are least likely to be married with 55.3% of them unmarried at childbirth.
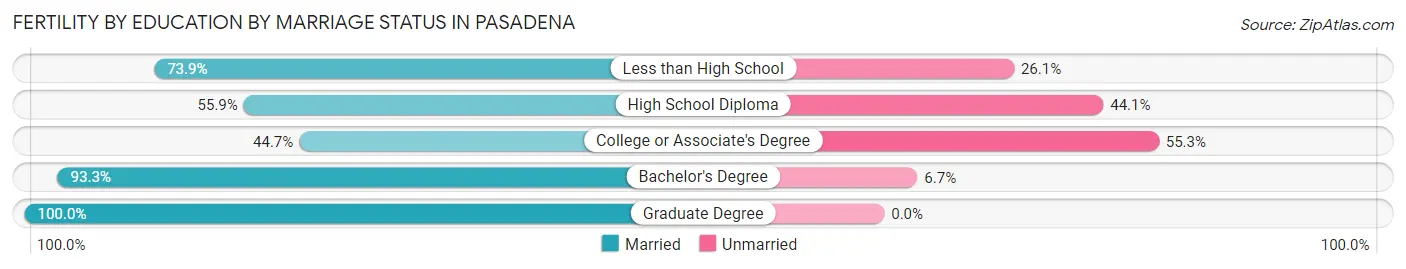
| Educational Attainment | Married | Unmarried |
| Less than High School | 407 (73.9%) | 144 (26.1%) |
| High School Diploma | 428 (55.9%) | 338 (44.1%) |
| College or Associate's Degree | 214 (44.7%) | 265 (55.3%) |
| Bachelor's Degree | 182 (93.3%) | 13 (6.7%) |
| Graduate Degree | 16 (100.0%) | 0 (0.0%) |
| Total | 1,246 (62.1%) | 761 (37.9%) |
Employment Characteristics in Pasadena
Employment by Class of Employer in Pasadena
Among the 65,081 employed individuals in Pasadena, private company employees (48,952 | 75.2%), local government employees (5,792 | 8.9%), and self-employed (not incorporated) (4,159 | 6.4%) make up the most common classes of employment.
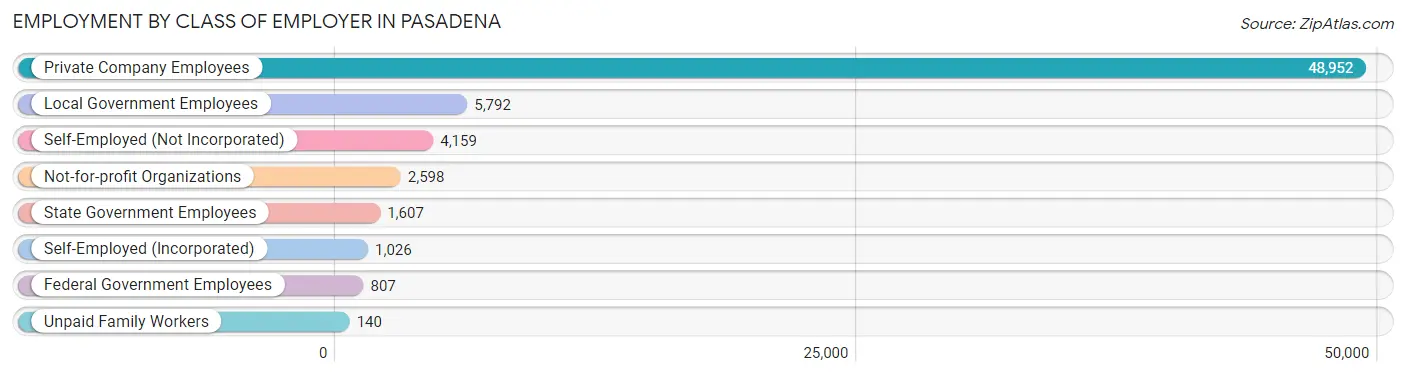
| Employer Class | # Employees | % Employees |
| Private Company Employees | 48,952 | 75.2% |
| Self-Employed (Incorporated) | 1,026 | 1.6% |
| Self-Employed (Not Incorporated) | 4,159 | 6.4% |
| Not-for-profit Organizations | 2,598 | 4.0% |
| Local Government Employees | 5,792 | 8.9% |
| State Government Employees | 1,607 | 2.5% |
| Federal Government Employees | 807 | 1.2% |
| Unpaid Family Workers | 140 | 0.2% |
| Total | 65,081 | 100.0% |
Employment Status by Age in Pasadena
According to the labor force statistics for Pasadena, out of the total population over 16 years of age (112,430), 65.2% or 73,304 individuals are in the labor force, with 8.9% or 6,524 of them unemployed. The age group with the highest labor force participation rate is 30 to 34 years, with 83.5% or 8,509 individuals in the labor force. Within the labor force, the 16 to 19 years age range has the highest percentage of unemployed individuals, with 25.7% or 853 of them being unemployed.
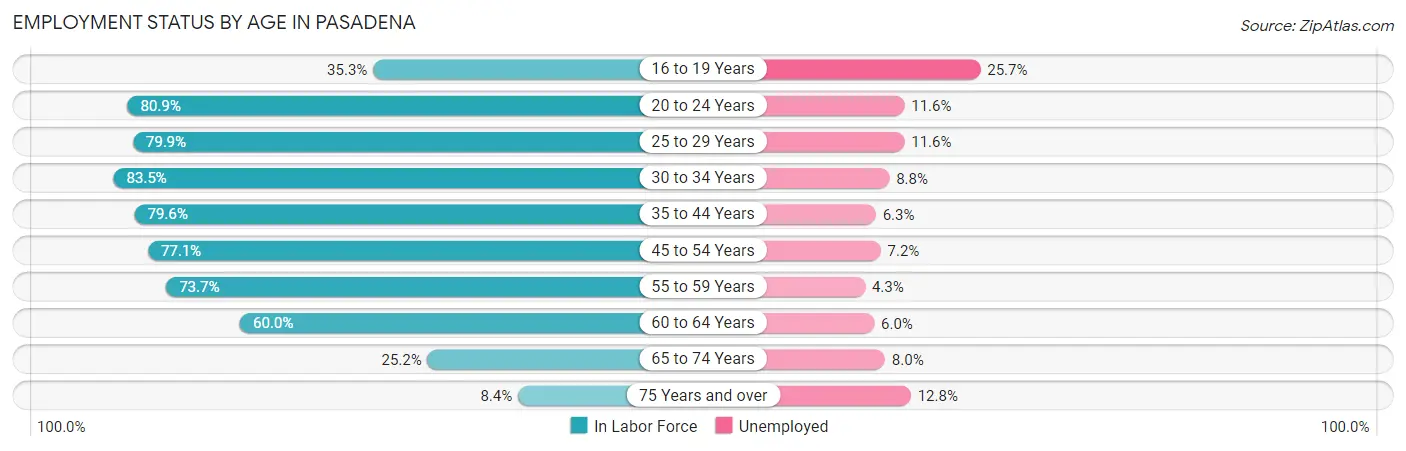
| Age Bracket | In Labor Force | Unemployed |
| 16 to 19 Years | 3,320 (35.3%) | 853 (25.7%) |
| 20 to 24 Years | 9,265 (80.9%) | 1,075 (11.6%) |
| 25 to 29 Years | 8,871 (79.9%) | 1,029 (11.6%) |
| 30 to 34 Years | 8,509 (83.5%) | 749 (8.8%) |
| 35 to 44 Years | 15,397 (79.6%) | 970 (6.3%) |
| 45 to 54 Years | 13,690 (77.1%) | 986 (7.2%) |
| 55 to 59 Years | 6,750 (73.7%) | 290 (4.3%) |
| 60 to 64 Years | 4,334 (60.0%) | 260 (6.0%) |
| 65 to 74 Years | 2,629 (25.2%) | 210 (8.0%) |
| 75 Years and over | 534 (8.4%) | 68 (12.8%) |
| Total | 73,304 (65.2%) | 6,524 (8.9%) |
Employment Status by Educational Attainment in Pasadena
According to labor force statistics for Pasadena, 77.0% of individuals (57,578) out of the total population between 25 and 64 years of age (74,776) are in the labor force, with 7.4% or 4,261 of them being unemployed. The group with the highest labor force participation rate are those with the educational attainment of bachelor's degree or higher, with 84.2% or 9,778 individuals in the labor force. Within the labor force, individuals with less than high school education have the highest percentage of unemployment, with 11.9% or 1,659 of them being unemployed.
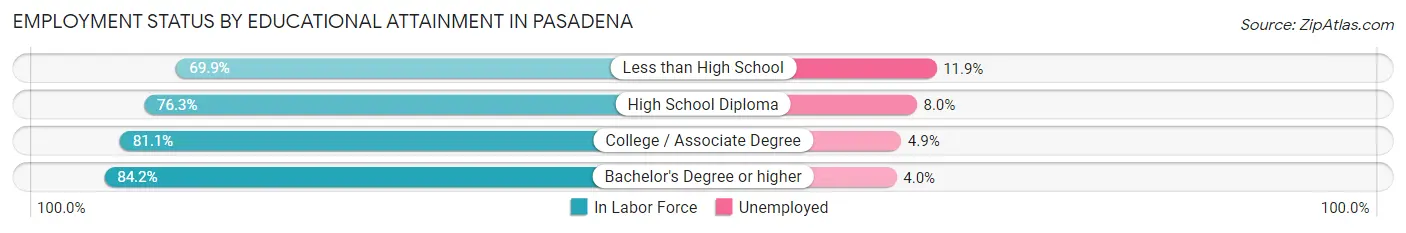
| Educational Attainment | In Labor Force | Unemployed |
| Less than High School | 13,939 (69.9%) | 2,373 (11.9%) |
| High School Diploma | 18,803 (76.3%) | 1,972 (8.0%) |
| College / Associate Degree | 15,066 (81.1%) | 910 (4.9%) |
| Bachelor's Degree or higher | 9,778 (84.2%) | 465 (4.0%) |
| Total | 57,578 (77.0%) | 5,533 (7.4%) |
Employment Occupations by Sex in Pasadena
Management, Business, Science and Arts Occupations
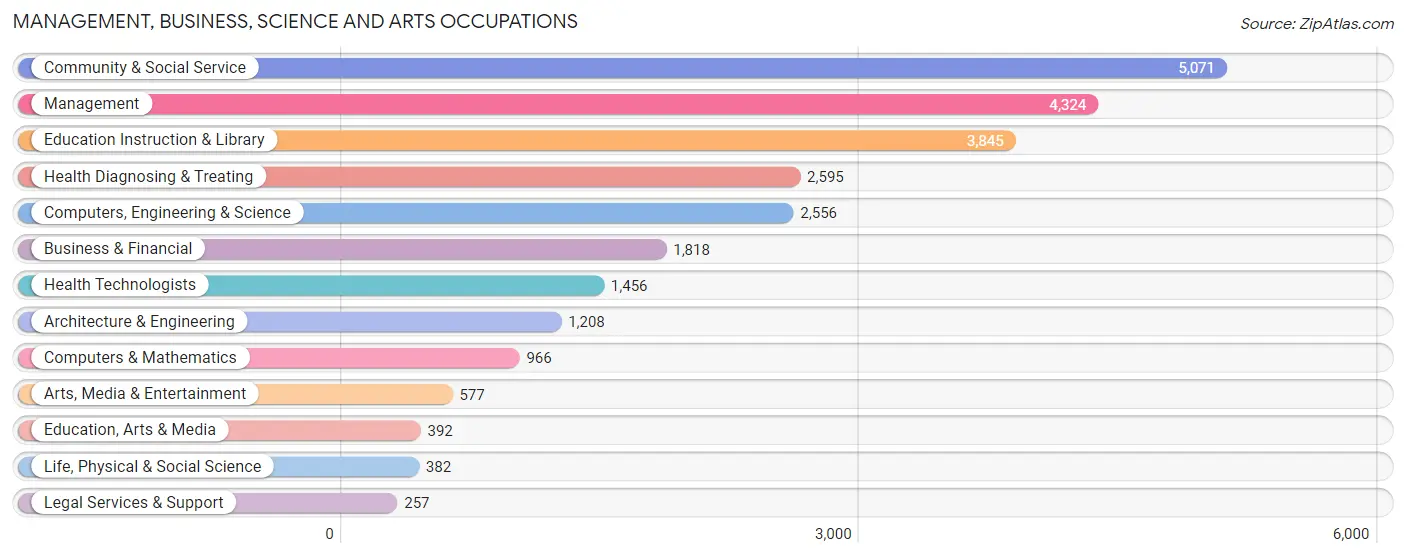
The most common Management, Business, Science and Arts occupations in Pasadena are Community & Social Service (5,071 | 7.6%), Management (4,324 | 6.5%), Education Instruction & Library (3,845 | 5.8%), Health Diagnosing & Treating (2,595 | 3.9%), and Computers, Engineering & Science (2,556 | 3.8%).
Management, Business, Science and Arts Occupations by Sex
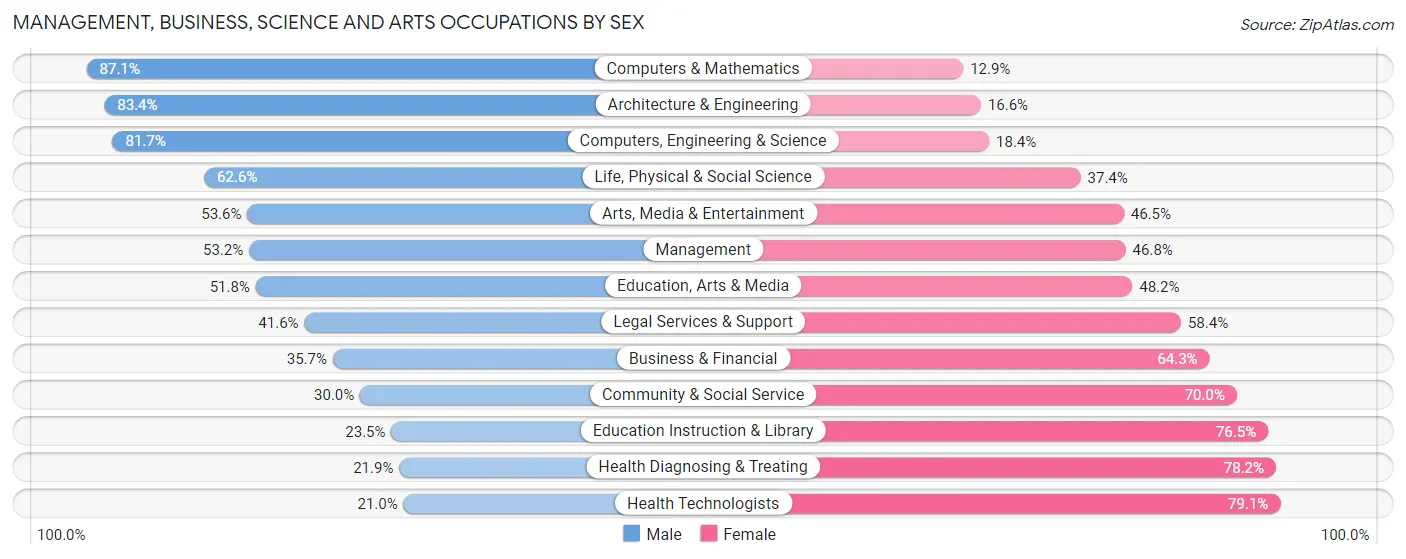
Within the Management, Business, Science and Arts occupations in Pasadena, the most male-oriented occupations are Computers & Mathematics (87.1%), Architecture & Engineering (83.4%), and Computers, Engineering & Science (81.7%), while the most female-oriented occupations are Health Technologists (79.0%), Health Diagnosing & Treating (78.1%), and Education Instruction & Library (76.5%).
| Occupation | Male | Female |
| Management | 2,299 (53.2%) | 2,025 (46.8%) |
| Business & Financial | 649 (35.7%) | 1,169 (64.3%) |
| Computers, Engineering & Science | 2,087 (81.7%) | 469 (18.3%) |
| Computers & Mathematics | 841 (87.1%) | 125 (12.9%) |
| Architecture & Engineering | 1,007 (83.4%) | 201 (16.6%) |
| Life, Physical & Social Science | 239 (62.6%) | 143 (37.4%) |
| Community & Social Service | 1,522 (30.0%) | 3,549 (70.0%) |
| Education, Arts & Media | 203 (51.8%) | 189 (48.2%) |
| Legal Services & Support | 107 (41.6%) | 150 (58.4%) |
| Education Instruction & Library | 903 (23.5%) | 2,942 (76.5%) |
| Arts, Media & Entertainment | 309 (53.5%) | 268 (46.5%) |
| Health Diagnosing & Treating | 567 (21.8%) | 2,028 (78.1%) |
| Health Technologists | 305 (20.9%) | 1,151 (79.0%) |
| Total (Category) | 7,124 (43.5%) | 9,240 (56.5%) |
| Total (Overall) | 38,980 (58.4%) | 27,799 (41.6%) |
Services Occupations
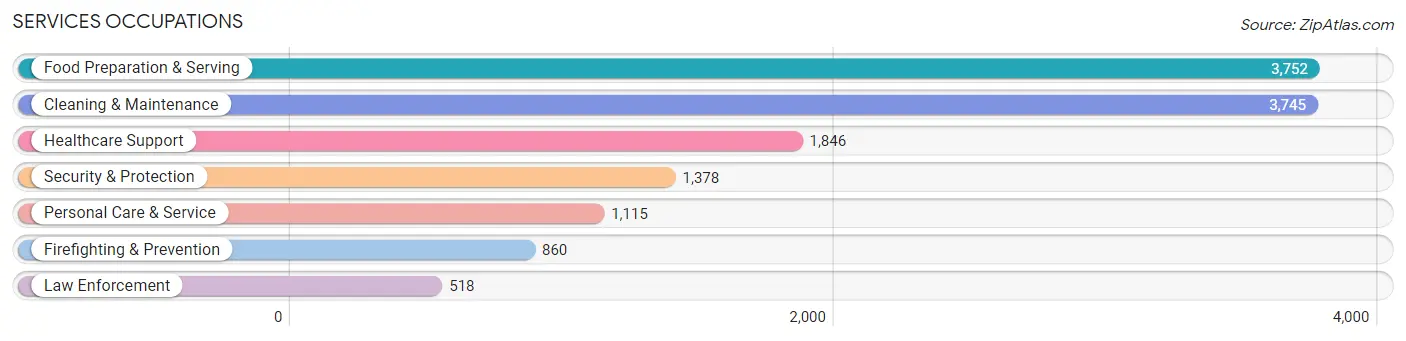
The most common Services occupations in Pasadena are Food Preparation & Serving (3,752 | 5.6%), Cleaning & Maintenance (3,745 | 5.6%), Healthcare Support (1,846 | 2.8%), Security & Protection (1,378 | 2.1%), and Personal Care & Service (1,115 | 1.7%).
Services Occupations by Sex
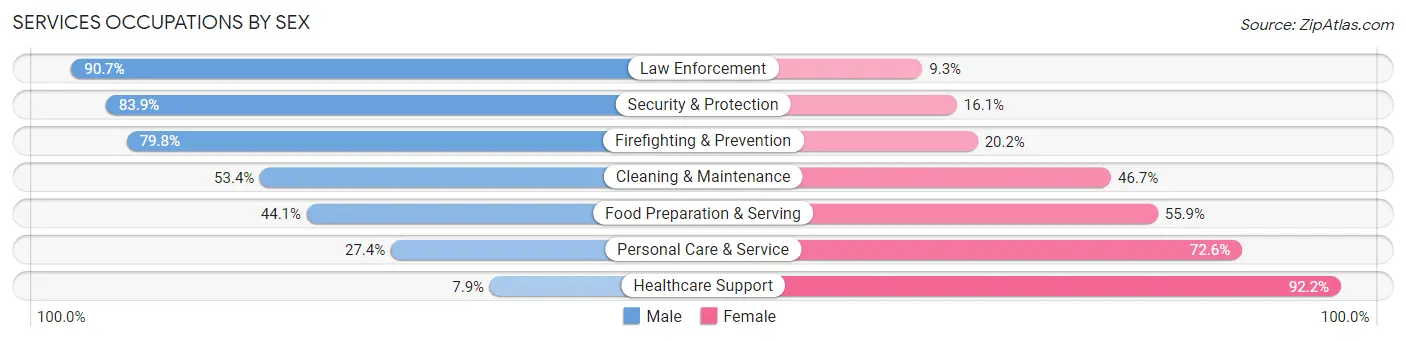
Within the Services occupations in Pasadena, the most male-oriented occupations are Law Enforcement (90.7%), Security & Protection (83.9%), and Firefighting & Prevention (79.8%), while the most female-oriented occupations are Healthcare Support (92.1%), Personal Care & Service (72.6%), and Food Preparation & Serving (55.9%).
| Occupation | Male | Female |
| Healthcare Support | 145 (7.9%) | 1,701 (92.1%) |
| Security & Protection | 1,156 (83.9%) | 222 (16.1%) |
| Firefighting & Prevention | 686 (79.8%) | 174 (20.2%) |
| Law Enforcement | 470 (90.7%) | 48 (9.3%) |
| Food Preparation & Serving | 1,655 (44.1%) | 2,097 (55.9%) |
| Cleaning & Maintenance | 1,998 (53.3%) | 1,747 (46.7%) |
| Personal Care & Service | 306 (27.4%) | 809 (72.6%) |
| Total (Category) | 5,260 (44.4%) | 6,576 (55.6%) |
| Total (Overall) | 38,980 (58.4%) | 27,799 (41.6%) |
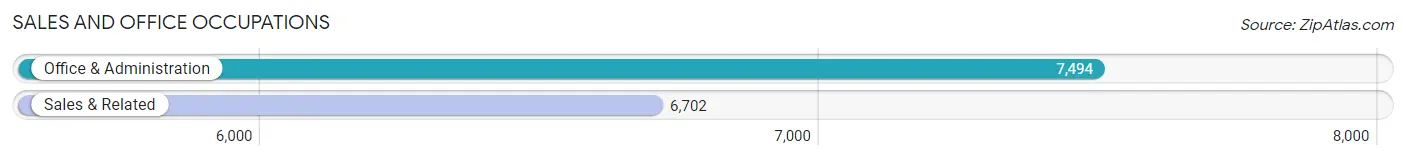
Sales and Office Occupations
The most common Sales and Office occupations in Pasadena are Office & Administration (7,494 | 11.2%), and Sales & Related (6,702 | 10.0%).
Sales and Office Occupations by Sex
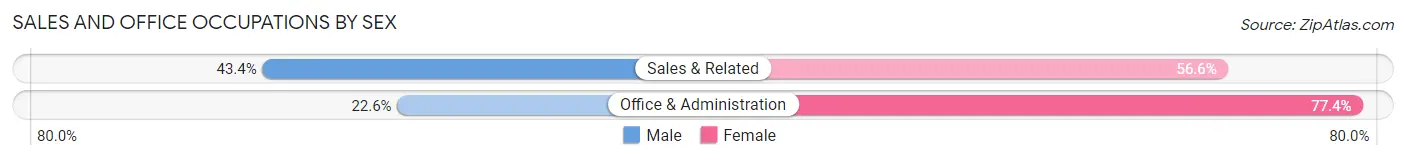
| Occupation | Male | Female |
| Sales & Related | 2,908 (43.4%) | 3,794 (56.6%) |
| Office & Administration | 1,697 (22.6%) | 5,797 (77.4%) |
| Total (Category) | 4,605 (32.4%) | 9,591 (67.6%) |
| Total (Overall) | 38,980 (58.4%) | 27,799 (41.6%) |
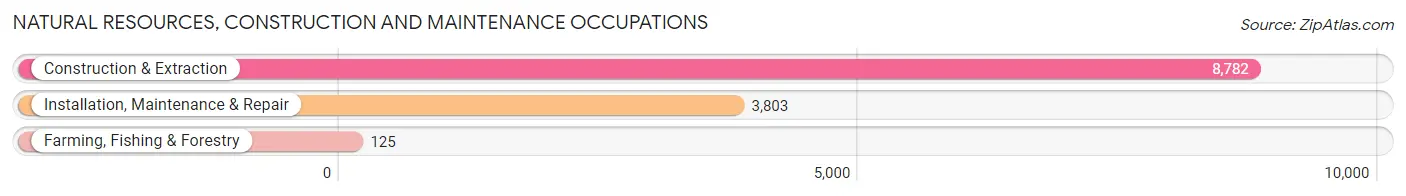
Natural Resources, Construction and Maintenance Occupations
The most common Natural Resources, Construction and Maintenance occupations in Pasadena are Construction & Extraction (8,782 | 13.2%), Installation, Maintenance & Repair (3,803 | 5.7%), and Farming, Fishing & Forestry (125 | 0.2%).
Natural Resources, Construction and Maintenance Occupations by Sex
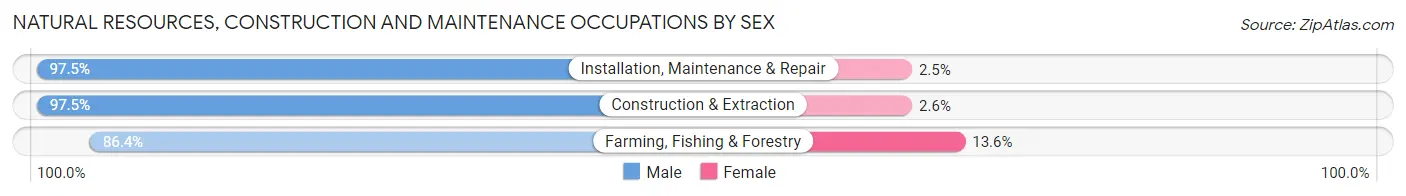
| Occupation | Male | Female |
| Farming, Fishing & Forestry | 108 (86.4%) | 17 (13.6%) |
| Construction & Extraction | 8,558 (97.5%) | 224 (2.5%) |
| Installation, Maintenance & Repair | 3,708 (97.5%) | 95 (2.5%) |
| Total (Category) | 12,374 (97.4%) | 336 (2.6%) |
| Total (Overall) | 38,980 (58.4%) | 27,799 (41.6%) |
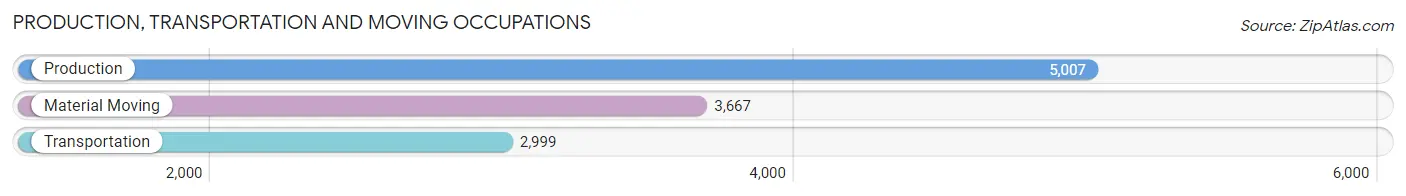
Production, Transportation and Moving Occupations
The most common Production, Transportation and Moving occupations in Pasadena are Production (5,007 | 7.5%), Material Moving (3,667 | 5.5%), and Transportation (2,999 | 4.5%).
Production, Transportation and Moving Occupations by Sex
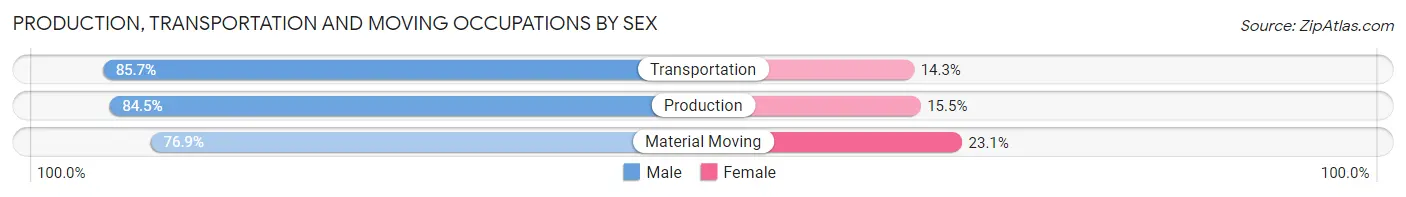
| Occupation | Male | Female |
| Production | 4,229 (84.5%) | 778 (15.5%) |
| Transportation | 2,569 (85.7%) | 430 (14.3%) |
| Material Moving | 2,819 (76.9%) | 848 (23.1%) |
| Total (Category) | 9,617 (82.4%) | 2,056 (17.6%) |
| Total (Overall) | 38,980 (58.4%) | 27,799 (41.6%) |
Employment Industries by Sex in Pasadena
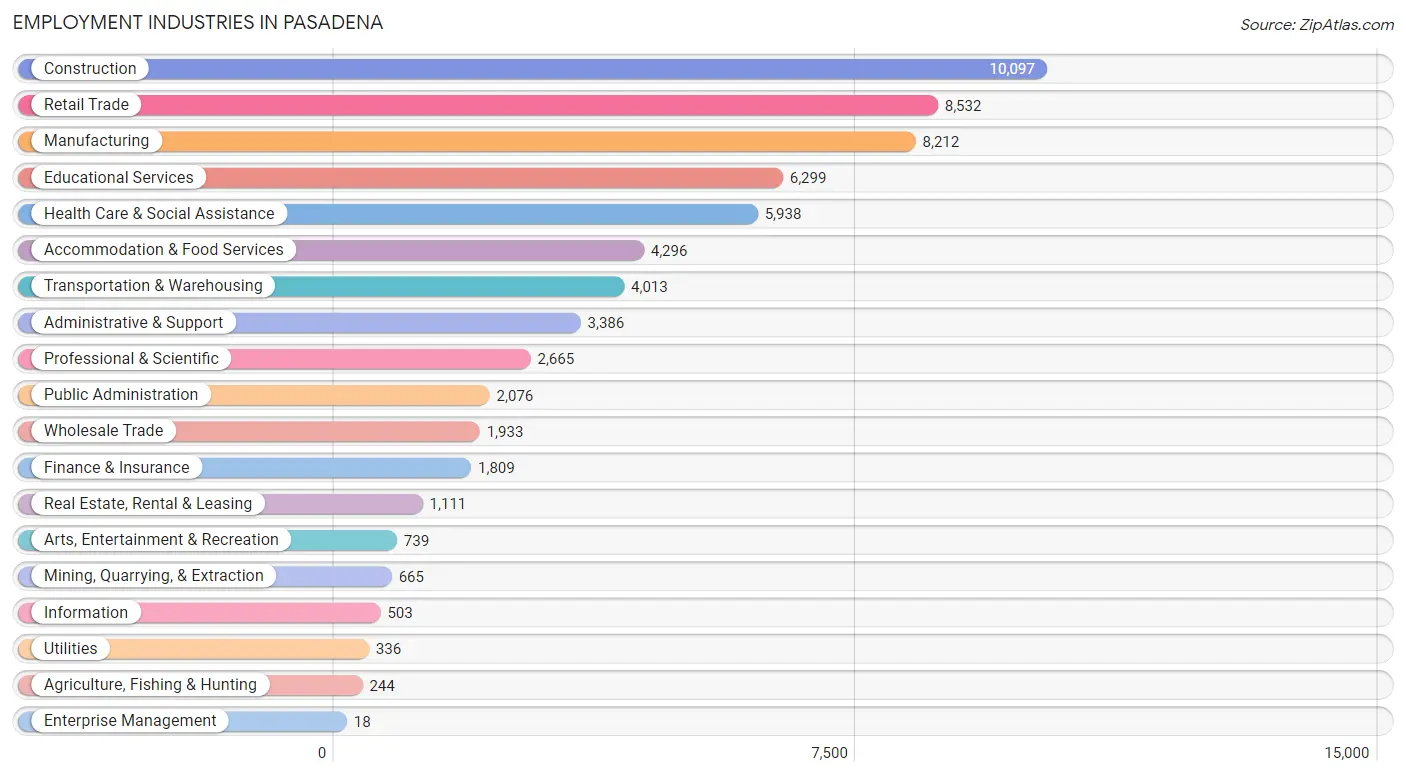
Employment Industries in Pasadena
The major employment industries in Pasadena include Construction (10,097 | 15.1%), Retail Trade (8,532 | 12.8%), Manufacturing (8,212 | 12.3%), Educational Services (6,299 | 9.4%), and Health Care & Social Assistance (5,938 | 8.9%).
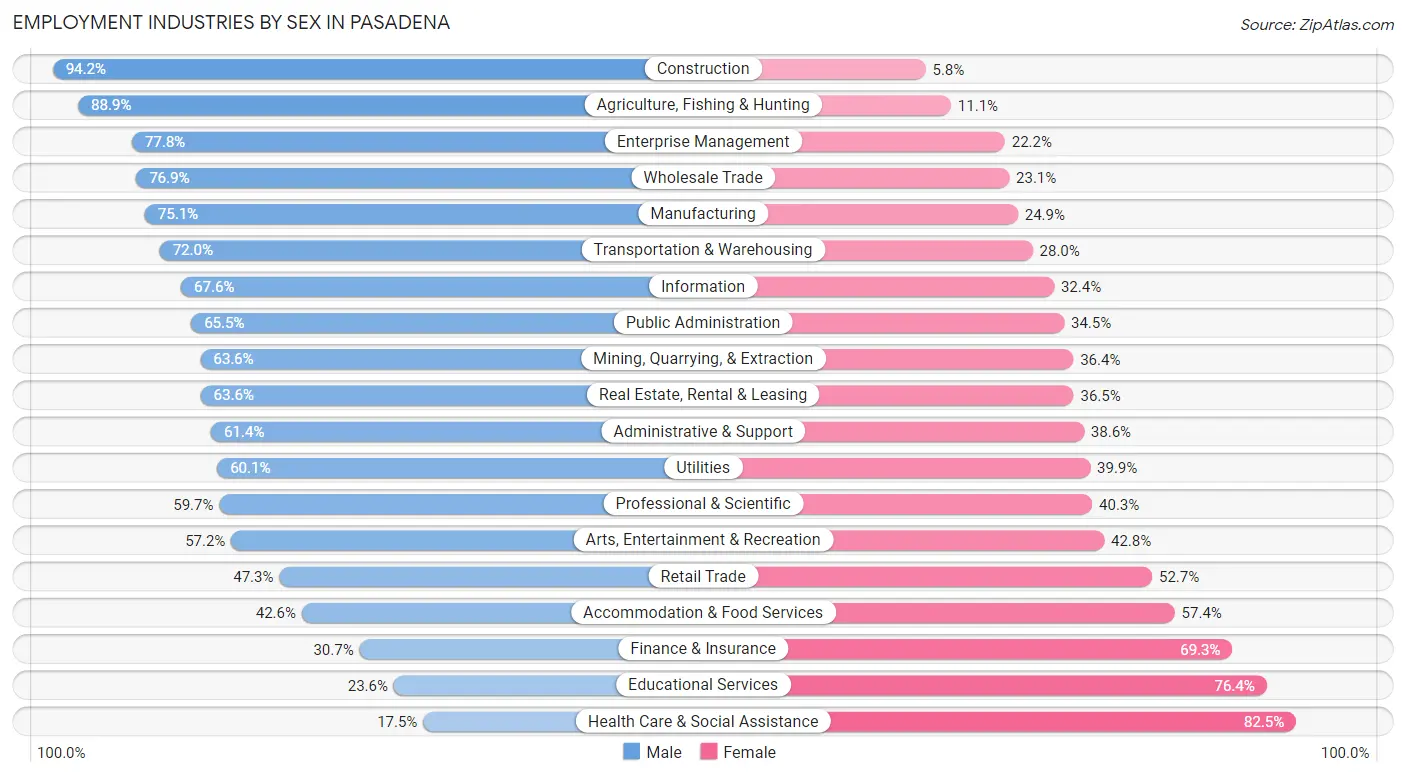
Employment Industries by Sex in Pasadena
The Pasadena industries that see more men than women are Construction (94.2%), Agriculture, Fishing & Hunting (88.9%), and Enterprise Management (77.8%), whereas the industries that tend to have a higher number of women are Health Care & Social Assistance (82.5%), Educational Services (76.4%), and Finance & Insurance (69.3%).
| Industry | Male | Female |
| Agriculture, Fishing & Hunting | 217 (88.9%) | 27 (11.1%) |
| Mining, Quarrying, & Extraction | 423 (63.6%) | 242 (36.4%) |
| Construction | 9,509 (94.2%) | 588 (5.8%) |
| Manufacturing | 6,166 (75.1%) | 2,046 (24.9%) |
| Wholesale Trade | 1,486 (76.9%) | 447 (23.1%) |
| Retail Trade | 4,035 (47.3%) | 4,497 (52.7%) |
| Transportation & Warehousing | 2,890 (72.0%) | 1,123 (28.0%) |
| Utilities | 202 (60.1%) | 134 (39.9%) |
| Information | 340 (67.6%) | 163 (32.4%) |
| Finance & Insurance | 555 (30.7%) | 1,254 (69.3%) |
| Real Estate, Rental & Leasing | 706 (63.5%) | 405 (36.4%) |
| Professional & Scientific | 1,591 (59.7%) | 1,074 (40.3%) |
| Enterprise Management | 14 (77.8%) | 4 (22.2%) |
| Administrative & Support | 2,079 (61.4%) | 1,307 (38.6%) |
| Educational Services | 1,485 (23.6%) | 4,814 (76.4%) |
| Health Care & Social Assistance | 1,039 (17.5%) | 4,899 (82.5%) |
| Arts, Entertainment & Recreation | 423 (57.2%) | 316 (42.8%) |
| Accommodation & Food Services | 1,831 (42.6%) | 2,465 (57.4%) |
| Public Administration | 1,360 (65.5%) | 716 (34.5%) |
| Total | 38,980 (58.4%) | 27,799 (41.6%) |
Education in Pasadena
School Enrollment in Pasadena
The most common levels of schooling among the 42,170 students in Pasadena are middle school (10,271 | 24.4%), high school (9,783 | 23.2%), and elementary school (9,105 | 21.6%).
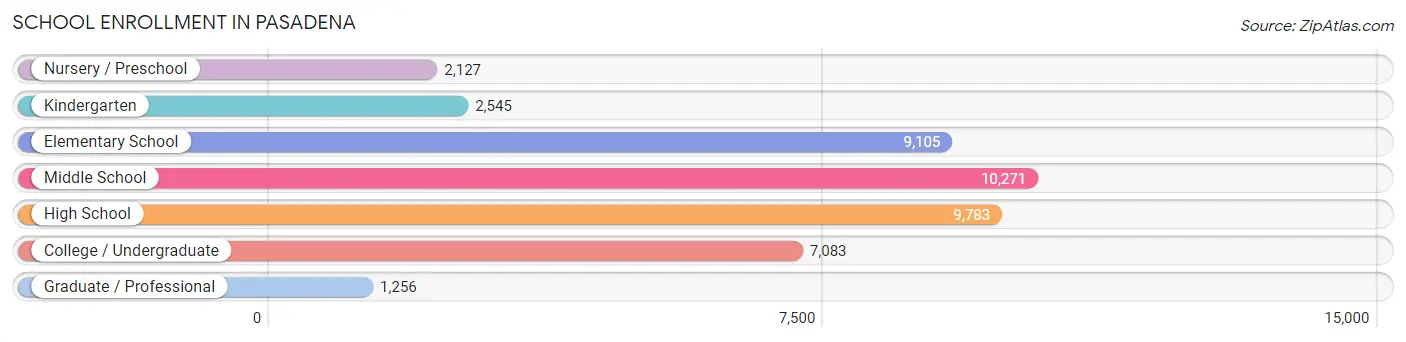
| School Level | # Students | % Students |
| Nursery / Preschool | 2,127 | 5.0% |
| Kindergarten | 2,545 | 6.0% |
| Elementary School | 9,105 | 21.6% |
| Middle School | 10,271 | 24.4% |
| High School | 9,783 | 23.2% |
| College / Undergraduate | 7,083 | 16.8% |
| Graduate / Professional | 1,256 | 3.0% |
| Total | 42,170 | 100.0% |
School Enrollment by Age by Funding Source in Pasadena
Out of a total of 42,170 students who are enrolled in schools in Pasadena, 1,813 (4.3%) attend a private institution, while the remaining 40,357 (95.7%) are enrolled in public schools. The age group of 35 years and over has the highest likelihood of being enrolled in private schools, with 248 (21.5% in the age bracket) enrolled. Conversely, the age group of 15 to 17 year olds has the lowest likelihood of being enrolled in a private school, with 6,916 (98.6% in the age bracket) attending a public institution.
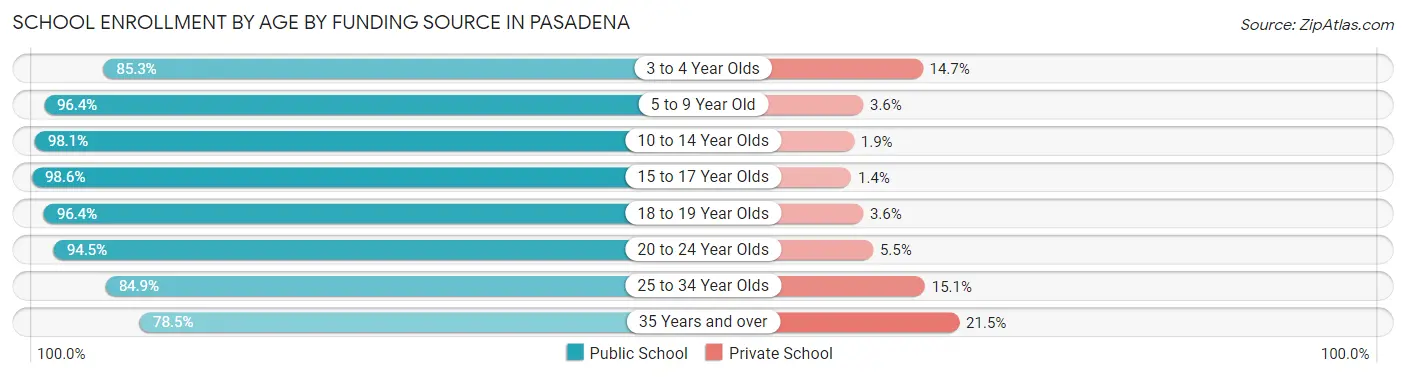
| Age Bracket | Public School | Private School |
| 3 to 4 Year Olds | 1,254 (85.3%) | 216 (14.7%) |
| 5 to 9 Year Old | 10,552 (96.4%) | 395 (3.6%) |
| 10 to 14 Year Olds | 12,139 (98.1%) | 235 (1.9%) |
| 15 to 17 Year Olds | 6,916 (98.6%) | 97 (1.4%) |
| 18 to 19 Year Olds | 3,092 (96.4%) | 115 (3.6%) |
| 20 to 24 Year Olds | 3,932 (94.5%) | 227 (5.5%) |
| 25 to 34 Year Olds | 1,568 (84.9%) | 279 (15.1%) |
| 35 Years and over | 905 (78.5%) | 248 (21.5%) |
| Total | 40,357 (95.7%) | 1,813 (4.3%) |
Educational Attainment by Field of Study in Pasadena
Education (2,948 | 18.9%), business (2,716 | 17.4%), engineering (1,537 | 9.9%), science & technology (1,492 | 9.6%), and computers & mathematics (952 | 6.1%) are the most common fields of study among 15,576 individuals in Pasadena who have obtained a bachelor's degree or higher.
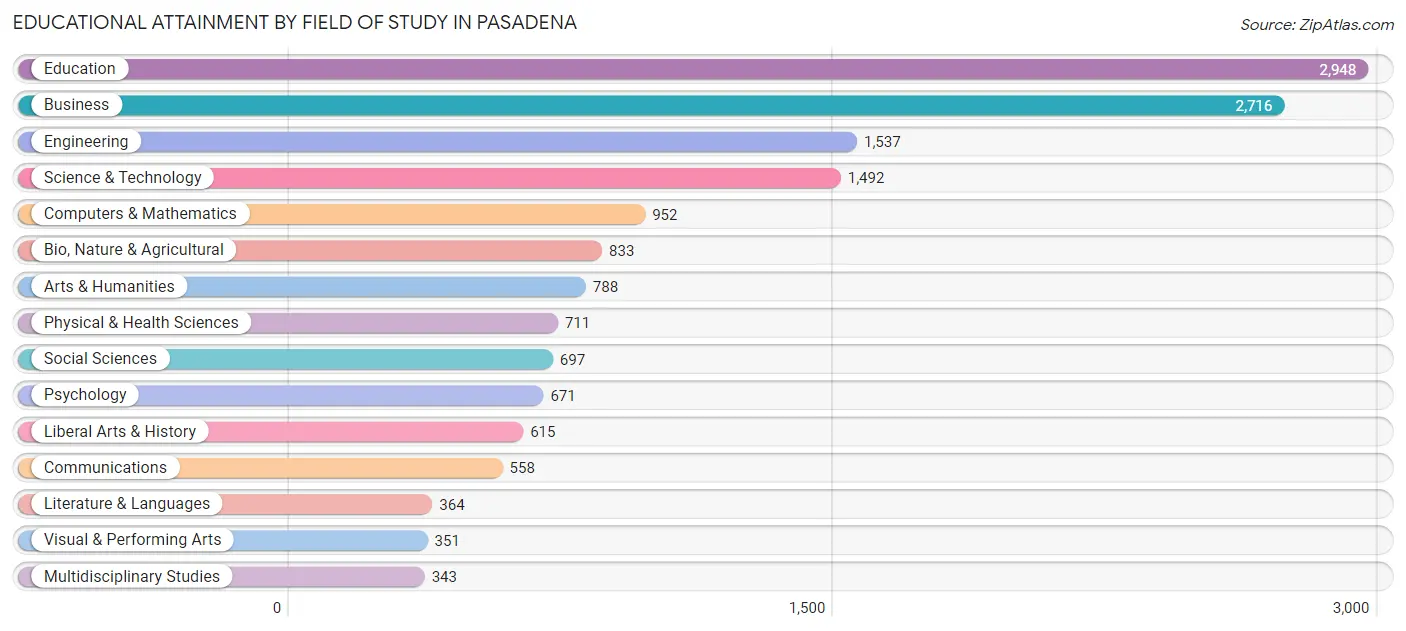
| Field of Study | # Graduates | % Graduates |
| Computers & Mathematics | 952 | 6.1% |
| Bio, Nature & Agricultural | 833 | 5.3% |
| Physical & Health Sciences | 711 | 4.6% |
| Psychology | 671 | 4.3% |
| Social Sciences | 697 | 4.5% |
| Engineering | 1,537 | 9.9% |
| Multidisciplinary Studies | 343 | 2.2% |
| Science & Technology | 1,492 | 9.6% |
| Business | 2,716 | 17.4% |
| Education | 2,948 | 18.9% |
| Literature & Languages | 364 | 2.3% |
| Liberal Arts & History | 615 | 4.0% |
| Visual & Performing Arts | 351 | 2.2% |
| Communications | 558 | 3.6% |
| Arts & Humanities | 788 | 5.1% |
| Total | 15,576 | 100.0% |
Transportation & Commute in Pasadena
Vehicle Availability by Sex in Pasadena
The most prevalent vehicle ownership categories in Pasadena are males with 2 vehicles (16,017, accounting for 42.2%) and females with 2 vehicles (10,342, making up 59.1%).
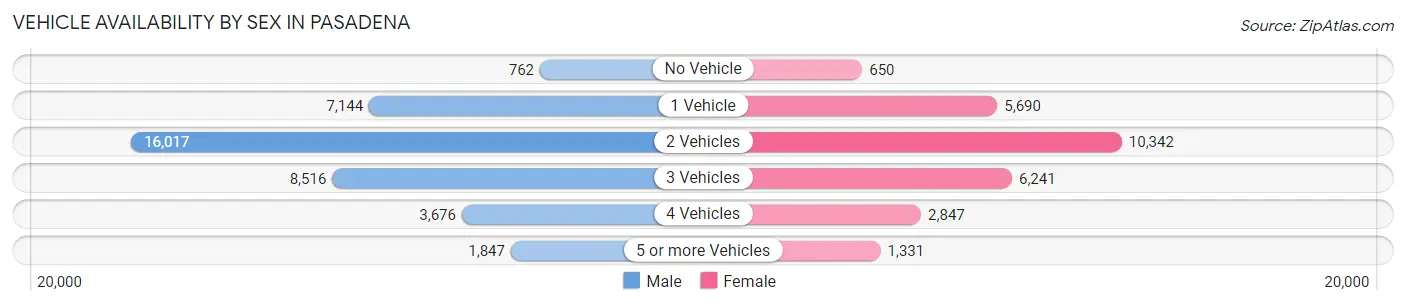
| Vehicles Available | Male | Female |
| No Vehicle | 762 (2.0%) | 650 (2.4%) |
| 1 Vehicle | 7,144 (18.8%) | 5,690 (21.0%) |
| 2 Vehicles | 16,017 (42.2%) | 10,342 (38.2%) |
| 3 Vehicles | 8,516 (22.4%) | 6,241 (23.0%) |
| 4 Vehicles | 3,676 (9.7%) | 2,847 (10.5%) |
| 5 or more Vehicles | 1,847 (4.9%) | 1,331 (4.9%) |
| Total | 37,962 (100.0%) | 27,101 (100.0%) |
Commute Time in Pasadena
The most frequently occuring commute durations in Pasadena are 15 to 19 minutes (9,348 commuters, 15.7%), 10 to 14 minutes (8,687 commuters, 14.6%), and 30 to 34 minutes (8,031 commuters, 13.5%).
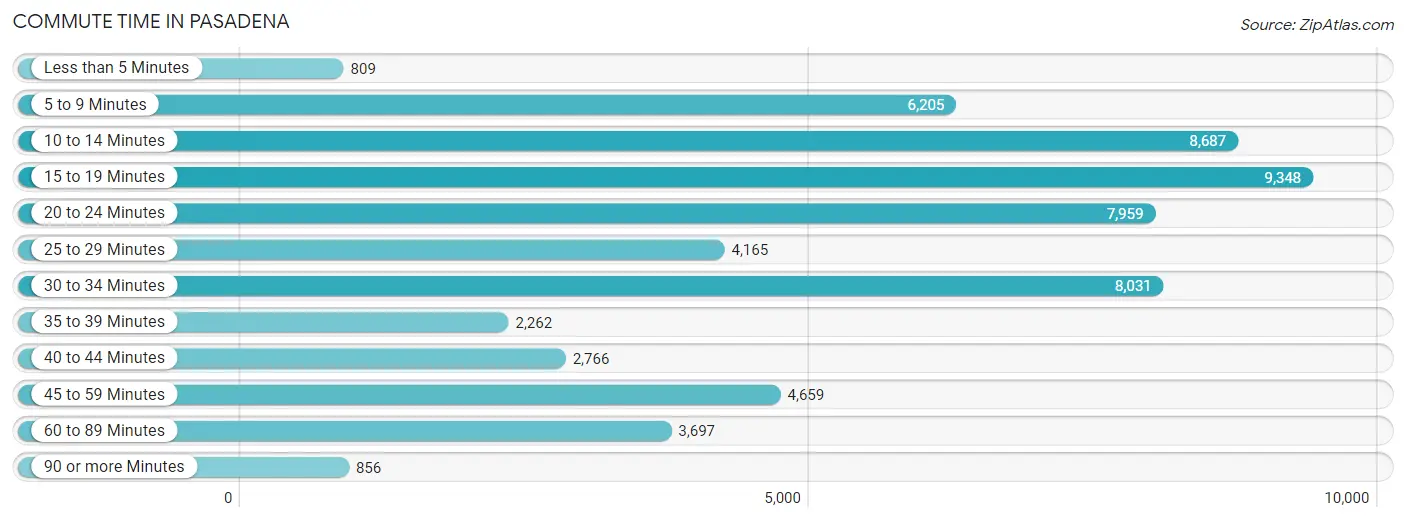
| Commute Time | # Commuters | % Commuters |
| Less than 5 Minutes | 809 | 1.4% |
| 5 to 9 Minutes | 6,205 | 10.4% |
| 10 to 14 Minutes | 8,687 | 14.6% |
| 15 to 19 Minutes | 9,348 | 15.7% |
| 20 to 24 Minutes | 7,959 | 13.4% |
| 25 to 29 Minutes | 4,165 | 7.0% |
| 30 to 34 Minutes | 8,031 | 13.5% |
| 35 to 39 Minutes | 2,262 | 3.8% |
| 40 to 44 Minutes | 2,766 | 4.6% |
| 45 to 59 Minutes | 4,659 | 7.8% |
| 60 to 89 Minutes | 3,697 | 6.2% |
| 90 or more Minutes | 856 | 1.4% |
Commute Time by Sex in Pasadena
The most common commute times in Pasadena are 10 to 14 minutes (5,170 commuters, 15.0%) for males and 15 to 19 minutes (4,535 commuters, 18.1%) for females.
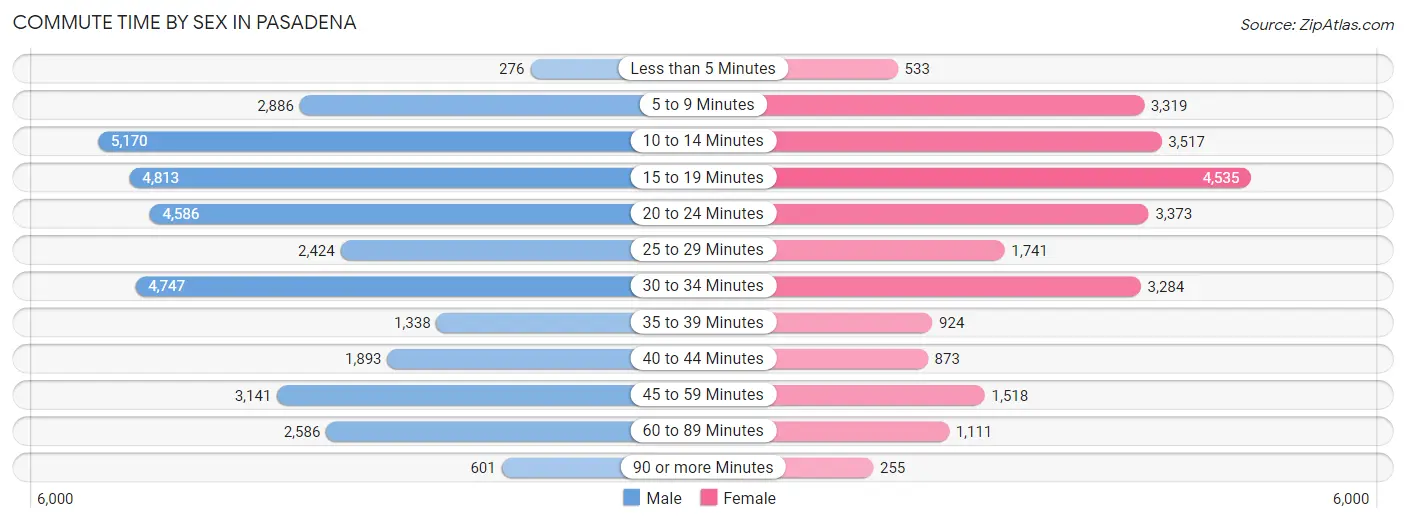
| Commute Time | Male | Female |
| Less than 5 Minutes | 276 (0.8%) | 533 (2.1%) |
| 5 to 9 Minutes | 2,886 (8.4%) | 3,319 (13.3%) |
| 10 to 14 Minutes | 5,170 (15.0%) | 3,517 (14.1%) |
| 15 to 19 Minutes | 4,813 (14.0%) | 4,535 (18.1%) |
| 20 to 24 Minutes | 4,586 (13.3%) | 3,373 (13.5%) |
| 25 to 29 Minutes | 2,424 (7.0%) | 1,741 (7.0%) |
| 30 to 34 Minutes | 4,747 (13.8%) | 3,284 (13.1%) |
| 35 to 39 Minutes | 1,338 (3.9%) | 924 (3.7%) |
| 40 to 44 Minutes | 1,893 (5.5%) | 873 (3.5%) |
| 45 to 59 Minutes | 3,141 (9.1%) | 1,518 (6.1%) |
| 60 to 89 Minutes | 2,586 (7.5%) | 1,111 (4.4%) |
| 90 or more Minutes | 601 (1.7%) | 255 (1.0%) |
Time of Departure to Work by Sex in Pasadena
The most frequent times of departure to work in Pasadena are 7:00 AM to 7:29 AM (5,039, 14.6%) for males and 7:00 AM to 7:29 AM (3,551, 14.2%) for females.
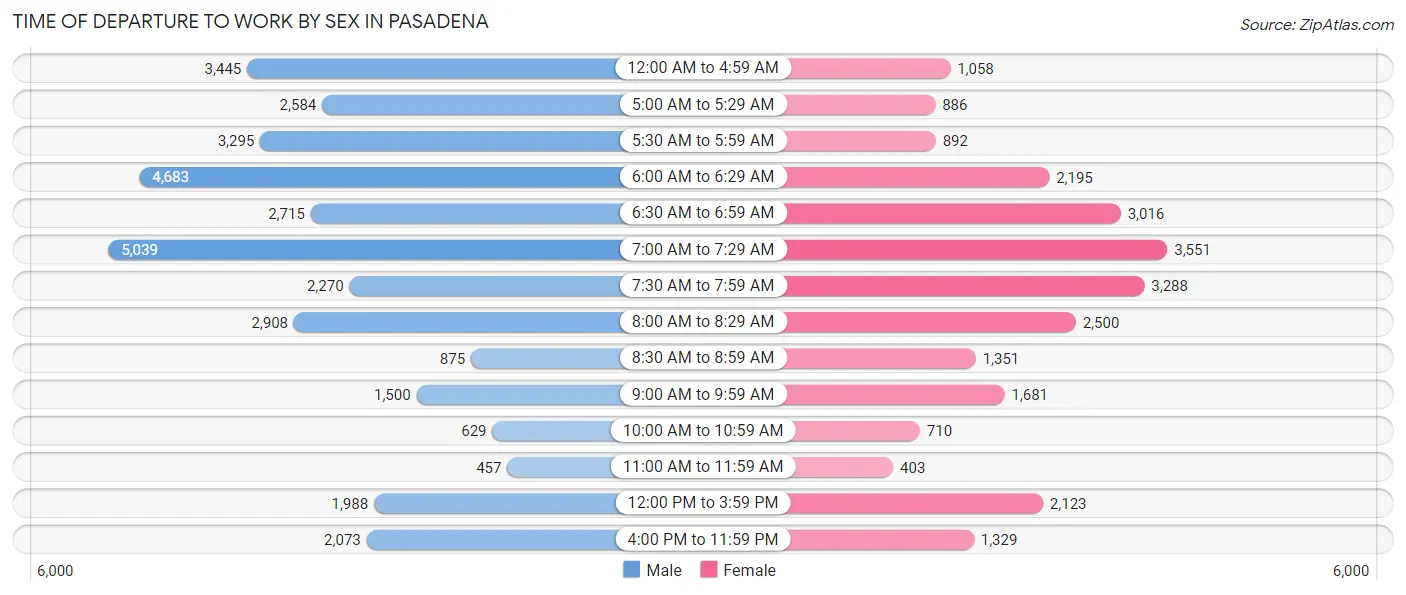
| Time of Departure | Male | Female |
| 12:00 AM to 4:59 AM | 3,445 (10.0%) | 1,058 (4.2%) |
| 5:00 AM to 5:29 AM | 2,584 (7.5%) | 886 (3.5%) |
| 5:30 AM to 5:59 AM | 3,295 (9.6%) | 892 (3.6%) |
| 6:00 AM to 6:29 AM | 4,683 (13.6%) | 2,195 (8.8%) |
| 6:30 AM to 6:59 AM | 2,715 (7.9%) | 3,016 (12.1%) |
| 7:00 AM to 7:29 AM | 5,039 (14.6%) | 3,551 (14.2%) |
| 7:30 AM to 7:59 AM | 2,270 (6.6%) | 3,288 (13.2%) |
| 8:00 AM to 8:29 AM | 2,908 (8.4%) | 2,500 (10.0%) |
| 8:30 AM to 8:59 AM | 875 (2.5%) | 1,351 (5.4%) |
| 9:00 AM to 9:59 AM | 1,500 (4.3%) | 1,681 (6.7%) |
| 10:00 AM to 10:59 AM | 629 (1.8%) | 710 (2.8%) |
| 11:00 AM to 11:59 AM | 457 (1.3%) | 403 (1.6%) |
| 12:00 PM to 3:59 PM | 1,988 (5.8%) | 2,123 (8.5%) |
| 4:00 PM to 11:59 PM | 2,073 (6.0%) | 1,329 (5.3%) |
| Total | 34,461 (100.0%) | 24,983 (100.0%) |
Housing Occupancy in Pasadena
Occupancy by Ownership in Pasadena
Of the total 49,541 dwellings in Pasadena, owner-occupied units account for 26,651 (53.8%), while renter-occupied units make up 22,890 (46.2%).
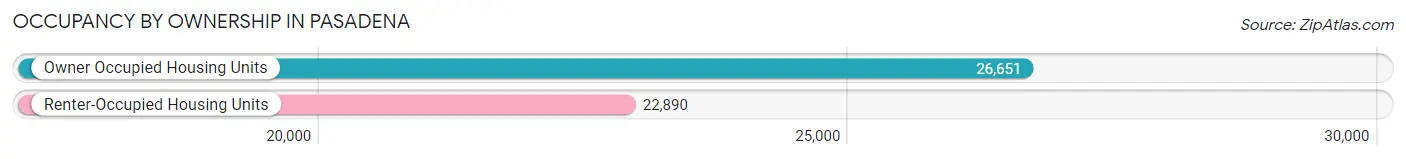
| Occupancy | # Housing Units | % Housing Units |
| Owner Occupied Housing Units | 26,651 | 53.8% |
| Renter-Occupied Housing Units | 22,890 | 46.2% |
| Total Occupied Housing Units | 49,541 | 100.0% |
Occupancy by Household Size in Pasadena
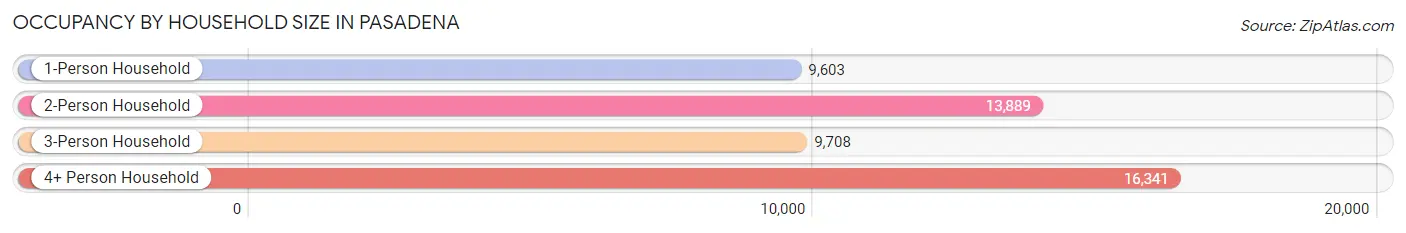
| Household Size | # Housing Units | % Housing Units |
| 1-Person Household | 9,603 | 19.4% |
| 2-Person Household | 13,889 | 28.0% |
| 3-Person Household | 9,708 | 19.6% |
| 4+ Person Household | 16,341 | 33.0% |
| Total Housing Units | 49,541 | 100.0% |
Occupancy by Ownership by Household Size in Pasadena
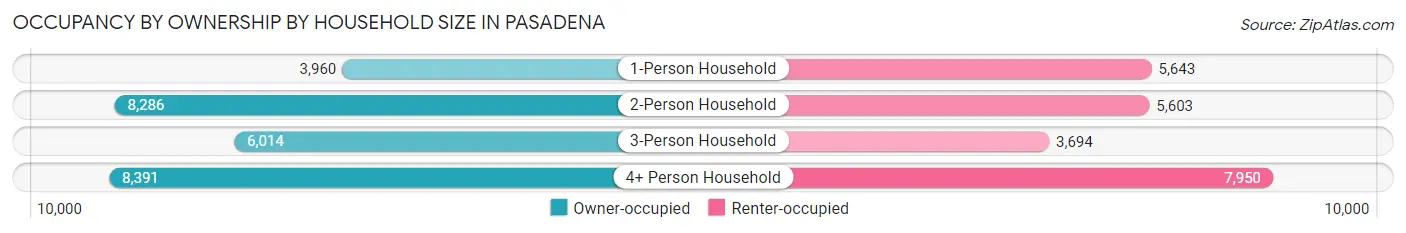
| Household Size | Owner-occupied | Renter-occupied |
| 1-Person Household | 3,960 (41.2%) | 5,643 (58.8%) |
| 2-Person Household | 8,286 (59.7%) | 5,603 (40.3%) |
| 3-Person Household | 6,014 (62.0%) | 3,694 (38.1%) |
| 4+ Person Household | 8,391 (51.3%) | 7,950 (48.6%) |
| Total Housing Units | 26,651 (53.8%) | 22,890 (46.2%) |
Occupancy by Educational Attainment in Pasadena
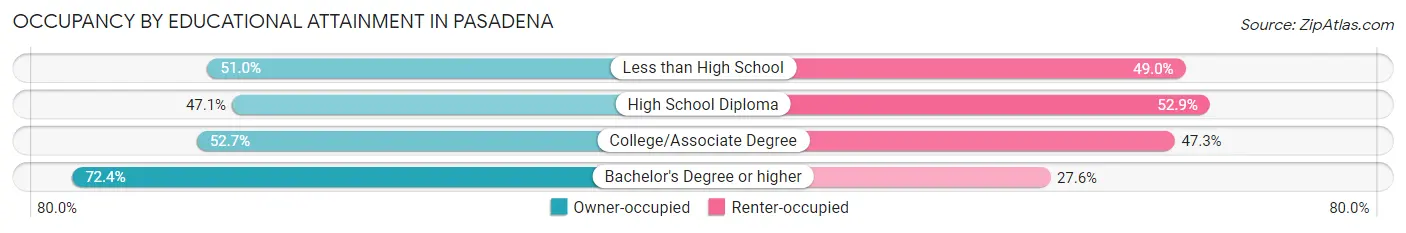
| Household Size | Owner-occupied | Renter-occupied |
| Less than High School | 6,212 (51.0%) | 5,978 (49.0%) |
| High School Diploma | 7,198 (47.1%) | 8,080 (52.9%) |
| College/Associate Degree | 7,333 (52.7%) | 6,584 (47.3%) |
| Bachelor's Degree or higher | 5,908 (72.4%) | 2,248 (27.6%) |
Occupancy by Age of Householder in Pasadena
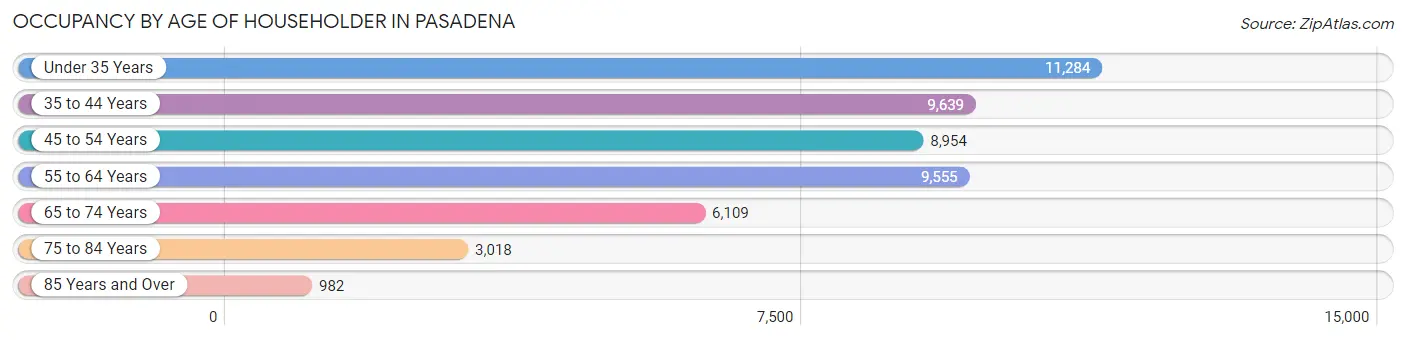
| Age Bracket | # Households | % Households |
| Under 35 Years | 11,284 | 22.8% |
| 35 to 44 Years | 9,639 | 19.5% |
| 45 to 54 Years | 8,954 | 18.1% |
| 55 to 64 Years | 9,555 | 19.3% |
| 65 to 74 Years | 6,109 | 12.3% |
| 75 to 84 Years | 3,018 | 6.1% |
| 85 Years and Over | 982 | 2.0% |
| Total | 49,541 | 100.0% |
Housing Finances in Pasadena
Median Income by Occupancy in Pasadena
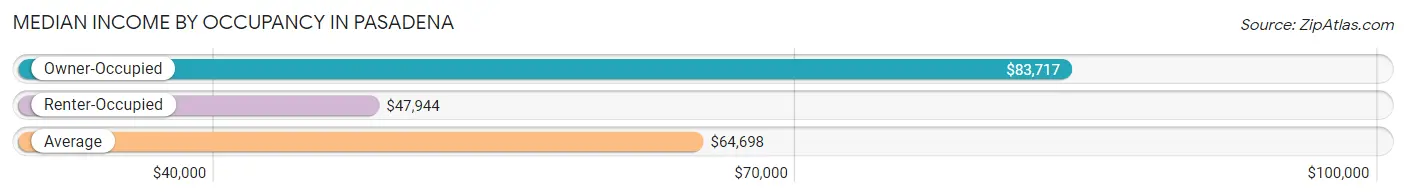
| Occupancy Type | # Households | Median Income |
| Owner-Occupied | 26,651 (53.8%) | $83,717 |
| Renter-Occupied | 22,890 (46.2%) | $47,944 |
| Average | 49,541 (100.0%) | $64,698 |
Occupancy by Householder Income Bracket in Pasadena
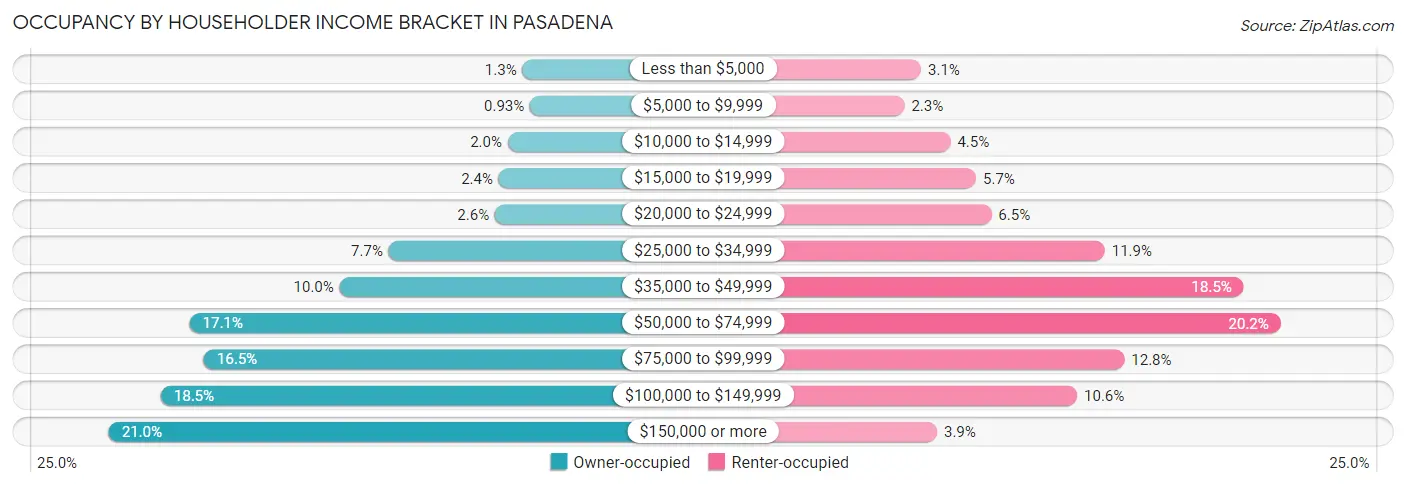
| Income Bracket | Owner-occupied | Renter-occupied |
| Less than $5,000 | 345 (1.3%) | 714 (3.1%) |
| $5,000 to $9,999 | 248 (0.9%) | 533 (2.3%) |
| $10,000 to $14,999 | 530 (2.0%) | 1,034 (4.5%) |
| $15,000 to $19,999 | 644 (2.4%) | 1,314 (5.7%) |
| $20,000 to $24,999 | 694 (2.6%) | 1,480 (6.5%) |
| $25,000 to $34,999 | 2,041 (7.7%) | 2,718 (11.9%) |
| $35,000 to $49,999 | 2,665 (10.0%) | 4,231 (18.5%) |
| $50,000 to $74,999 | 4,569 (17.1%) | 4,633 (20.2%) |
| $75,000 to $99,999 | 4,387 (16.5%) | 2,931 (12.8%) |
| $100,000 to $149,999 | 4,934 (18.5%) | 2,415 (10.5%) |
| $150,000 or more | 5,594 (21.0%) | 887 (3.9%) |
| Total | 26,651 (100.0%) | 22,890 (100.0%) |
Monthly Housing Cost Tiers in Pasadena
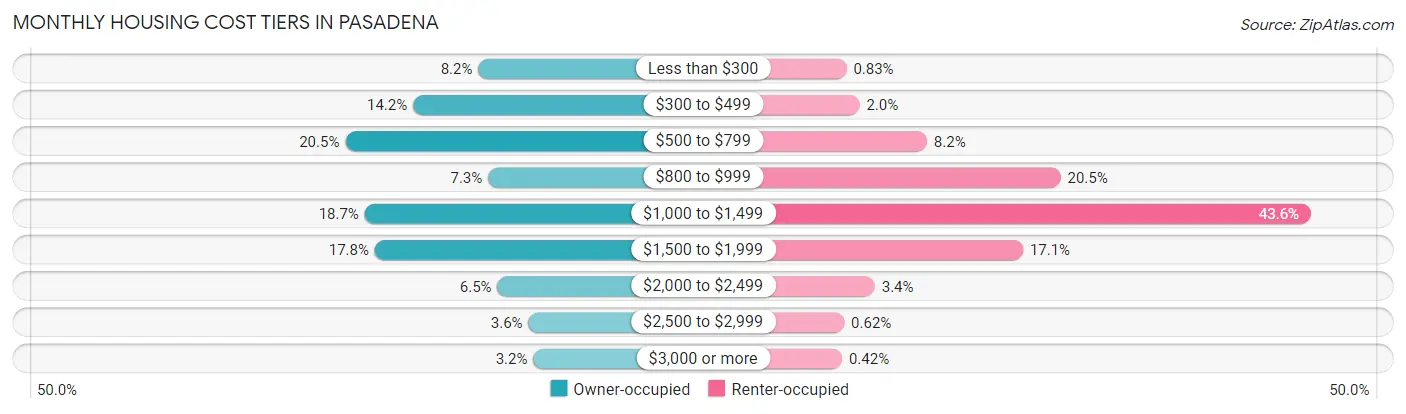
| Monthly Cost | Owner-occupied | Renter-occupied |
| Less than $300 | 2,194 (8.2%) | 191 (0.8%) |
| $300 to $499 | 3,796 (14.2%) | 464 (2.0%) |
| $500 to $799 | 5,458 (20.5%) | 1,887 (8.2%) |
| $800 to $999 | 1,954 (7.3%) | 4,702 (20.5%) |
| $1,000 to $1,499 | 4,982 (18.7%) | 9,978 (43.6%) |
| $1,500 to $1,999 | 4,732 (17.8%) | 3,910 (17.1%) |
| $2,000 to $2,499 | 1,723 (6.5%) | 788 (3.4%) |
| $2,500 to $2,999 | 966 (3.6%) | 143 (0.6%) |
| $3,000 or more | 846 (3.2%) | 96 (0.4%) |
| Total | 26,651 (100.0%) | 22,890 (100.0%) |
Physical Housing Characteristics in Pasadena
Housing Structures in Pasadena
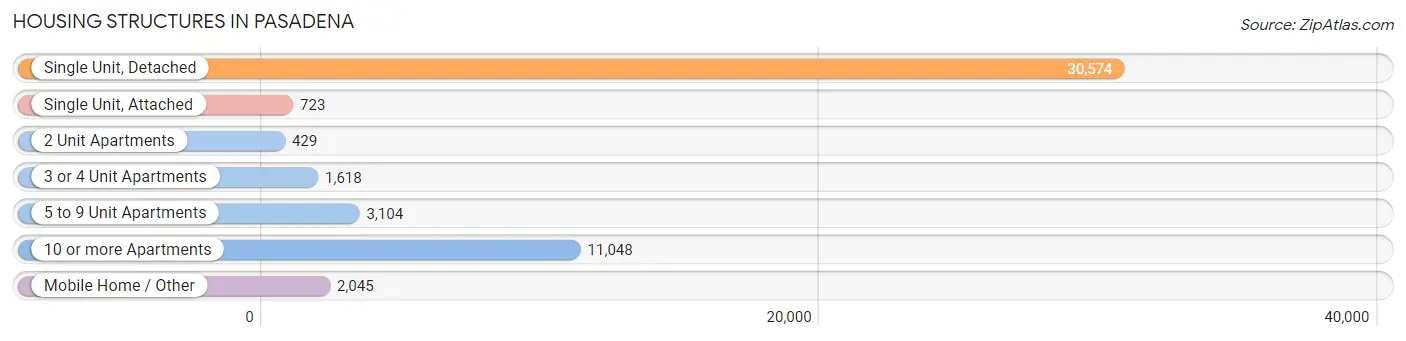
| Structure Type | # Housing Units | % Housing Units |
| Single Unit, Detached | 30,574 | 61.7% |
| Single Unit, Attached | 723 | 1.5% |
| 2 Unit Apartments | 429 | 0.9% |
| 3 or 4 Unit Apartments | 1,618 | 3.3% |
| 5 to 9 Unit Apartments | 3,104 | 6.3% |
| 10 or more Apartments | 11,048 | 22.3% |
| Mobile Home / Other | 2,045 | 4.1% |
| Total | 49,541 | 100.0% |
Housing Structures by Occupancy in Pasadena
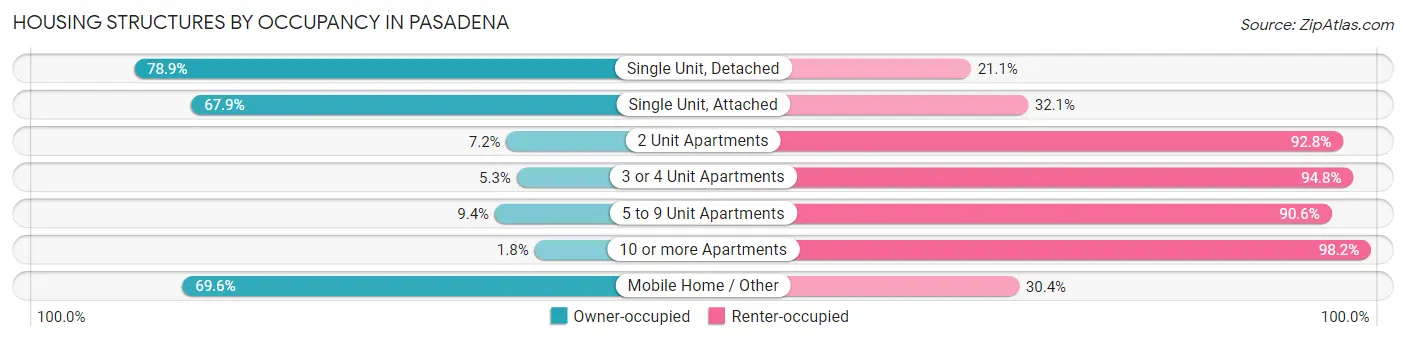
| Structure Type | Owner-occupied | Renter-occupied |
| Single Unit, Detached | 24,125 (78.9%) | 6,449 (21.1%) |
| Single Unit, Attached | 491 (67.9%) | 232 (32.1%) |
| 2 Unit Apartments | 31 (7.2%) | 398 (92.8%) |
| 3 or 4 Unit Apartments | 85 (5.2%) | 1,533 (94.8%) |
| 5 to 9 Unit Apartments | 293 (9.4%) | 2,811 (90.6%) |
| 10 or more Apartments | 202 (1.8%) | 10,846 (98.2%) |
| Mobile Home / Other | 1,424 (69.6%) | 621 (30.4%) |
| Total | 26,651 (53.8%) | 22,890 (46.2%) |
Housing Structures by Number of Rooms in Pasadena
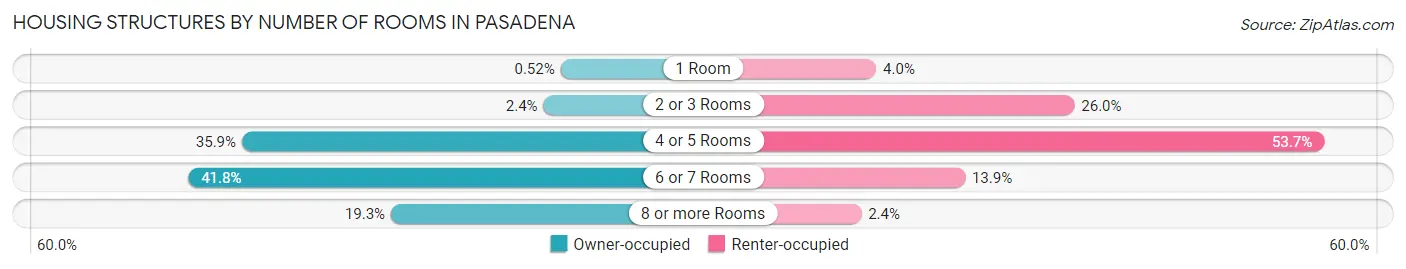
| Number of Rooms | Owner-occupied | Renter-occupied |
| 1 Room | 138 (0.5%) | 921 (4.0%) |
| 2 or 3 Rooms | 644 (2.4%) | 5,955 (26.0%) |
| 4 or 5 Rooms | 9,564 (35.9%) | 12,296 (53.7%) |
| 6 or 7 Rooms | 11,150 (41.8%) | 3,177 (13.9%) |
| 8 or more Rooms | 5,155 (19.3%) | 541 (2.4%) |
| Total | 26,651 (100.0%) | 22,890 (100.0%) |
Housing Structure by Heating Type in Pasadena
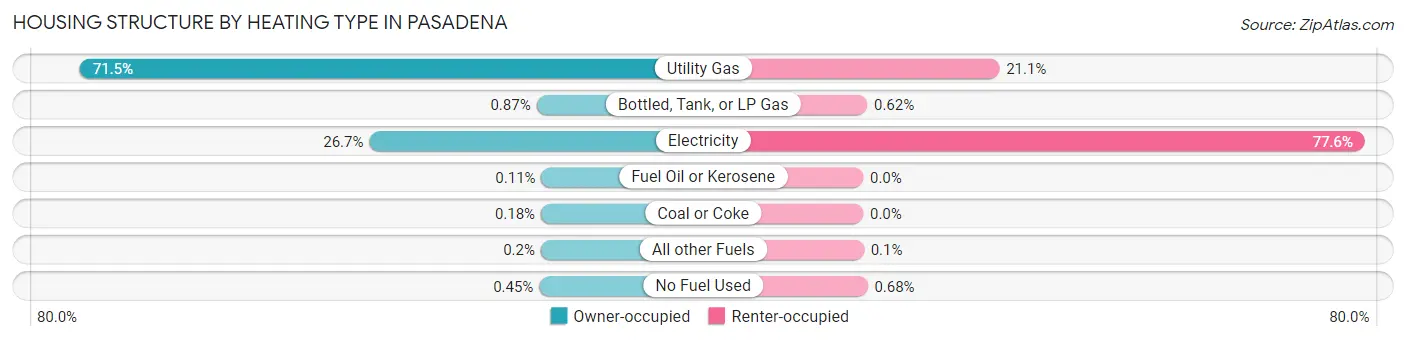
| Heating Type | Owner-occupied | Renter-occupied |
| Utility Gas | 19,046 (71.5%) | 4,818 (21.0%) |
| Bottled, Tank, or LP Gas | 231 (0.9%) | 141 (0.6%) |
| Electricity | 7,122 (26.7%) | 17,753 (77.6%) |
| Fuel Oil or Kerosene | 28 (0.1%) | 0 (0.0%) |
| Coal or Coke | 49 (0.2%) | 0 (0.0%) |
| All other Fuels | 54 (0.2%) | 23 (0.1%) |
| No Fuel Used | 121 (0.4%) | 155 (0.7%) |
| Total | 26,651 (100.0%) | 22,890 (100.0%) |
Household Vehicle Usage in Pasadena
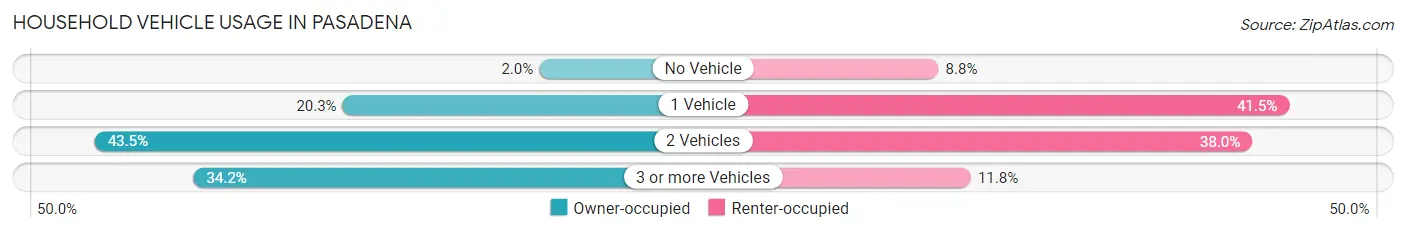
| Vehicles per Household | Owner-occupied | Renter-occupied |
| No Vehicle | 529 (2.0%) | 2,002 (8.7%) |
| 1 Vehicle | 5,418 (20.3%) | 9,492 (41.5%) |
| 2 Vehicles | 11,579 (43.4%) | 8,701 (38.0%) |
| 3 or more Vehicles | 9,125 (34.2%) | 2,695 (11.8%) |
| Total | 26,651 (100.0%) | 22,890 (100.0%) |
Real Estate & Mortgages in Pasadena
Real Estate and Mortgage Overview in Pasadena
| Characteristic | Without Mortgage | With Mortgage |
| Housing Units | 13,580 | 13,071 |
| Median Property Value | $149,500 | $195,100 |
| Median Household Income | $69,799 | $3,243 |
| Monthly Housing Costs | $544 | $786 |
| Real Estate Taxes | $1,965 | $611 |
Property Value by Mortgage Status in Pasadena
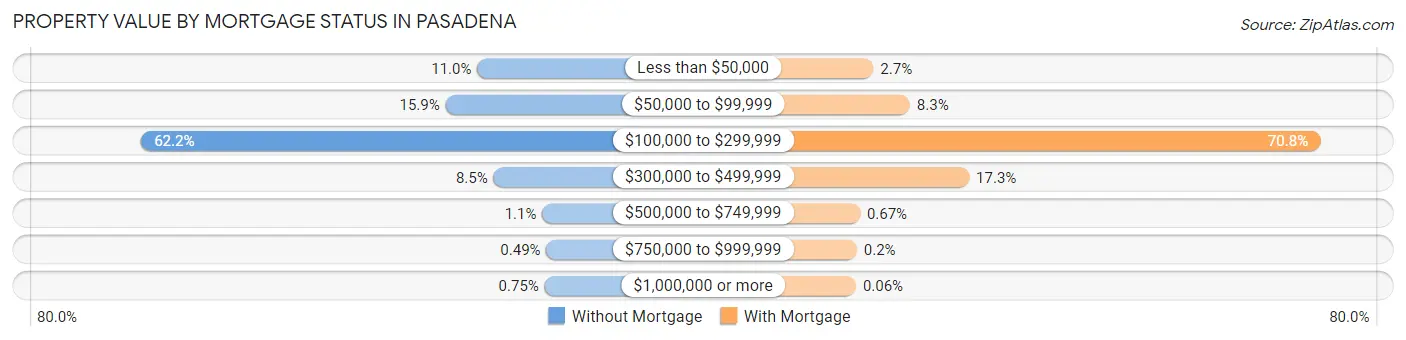
| Property Value | Without Mortgage | With Mortgage |
| Less than $50,000 | 1,496 (11.0%) | 356 (2.7%) |
| $50,000 to $99,999 | 2,154 (15.9%) | 1,082 (8.3%) |
| $100,000 to $299,999 | 8,450 (62.2%) | 9,250 (70.8%) |
| $300,000 to $499,999 | 1,160 (8.5%) | 2,262 (17.3%) |
| $500,000 to $749,999 | 151 (1.1%) | 87 (0.7%) |
| $750,000 to $999,999 | 67 (0.5%) | 26 (0.2%) |
| $1,000,000 or more | 102 (0.7%) | 8 (0.1%) |
| Total | 13,580 (100.0%) | 13,071 (100.0%) |
Household Income by Mortgage Status in Pasadena
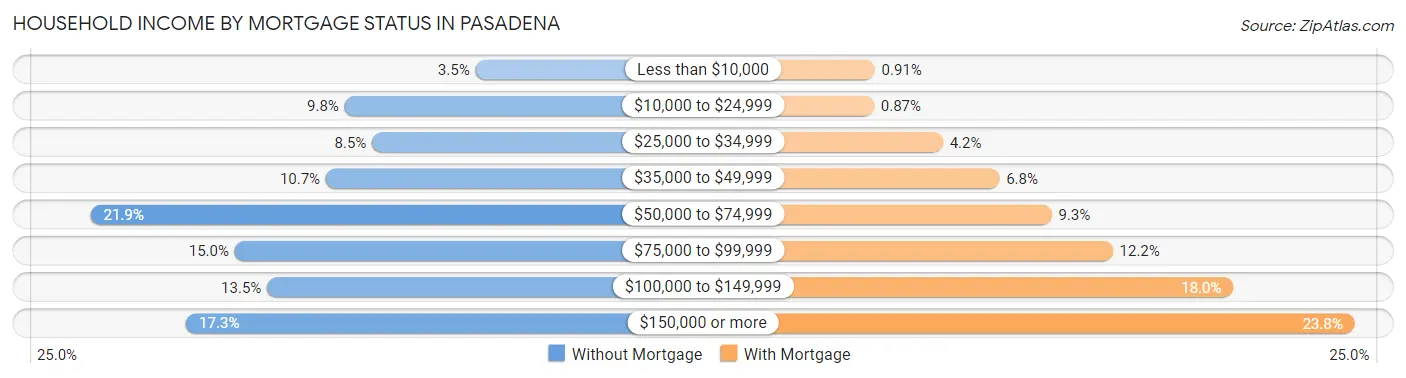
| Household Income | Without Mortgage | With Mortgage |
| Less than $10,000 | 479 (3.5%) | 119 (0.9%) |
| $10,000 to $24,999 | 1,325 (9.8%) | 114 (0.9%) |
| $25,000 to $34,999 | 1,147 (8.5%) | 543 (4.2%) |
| $35,000 to $49,999 | 1,446 (10.6%) | 894 (6.8%) |
| $50,000 to $74,999 | 2,969 (21.9%) | 1,219 (9.3%) |
| $75,000 to $99,999 | 2,036 (15.0%) | 1,600 (12.2%) |
| $100,000 to $149,999 | 1,827 (13.5%) | 2,351 (18.0%) |
| $150,000 or more | 2,351 (17.3%) | 3,107 (23.8%) |
| Total | 13,580 (100.0%) | 13,071 (100.0%) |
Property Value to Household Income Ratio in Pasadena
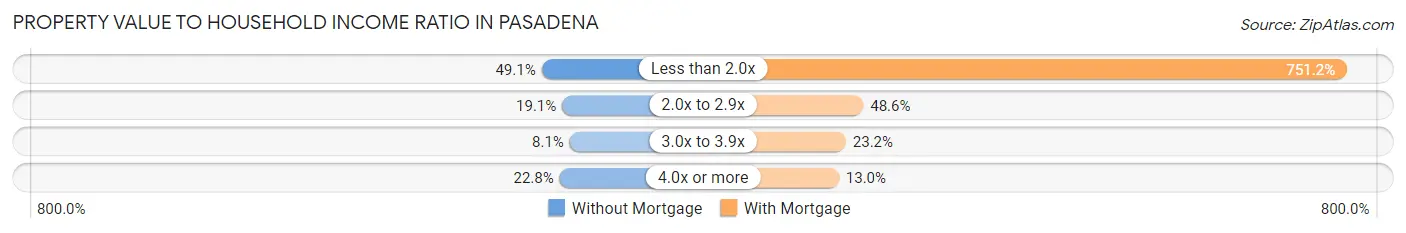
| Value-to-Income Ratio | Without Mortgage | With Mortgage |
| Less than 2.0x | 6,661 (49.0%) | 98,188 (751.2%) |
| 2.0x to 2.9x | 2,591 (19.1%) | 6,346 (48.5%) |
| 3.0x to 3.9x | 1,099 (8.1%) | 3,030 (23.2%) |
| 4.0x or more | 3,090 (22.8%) | 1,701 (13.0%) |
| Total | 13,580 (100.0%) | 13,071 (100.0%) |
Real Estate Taxes by Mortgage Status in Pasadena
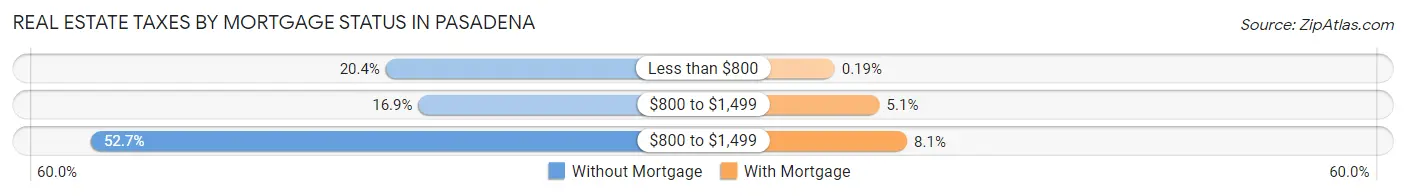
| Property Taxes | Without Mortgage | With Mortgage |
| Less than $800 | 2,774 (20.4%) | 25 (0.2%) |
| $800 to $1,499 | 2,290 (16.9%) | 668 (5.1%) |
| $800 to $1,499 | 7,159 (52.7%) | 1,061 (8.1%) |
| Total | 13,580 (100.0%) | 13,071 (100.0%) |
Health & Disability in Pasadena
Health Insurance Coverage by Age in Pasadena
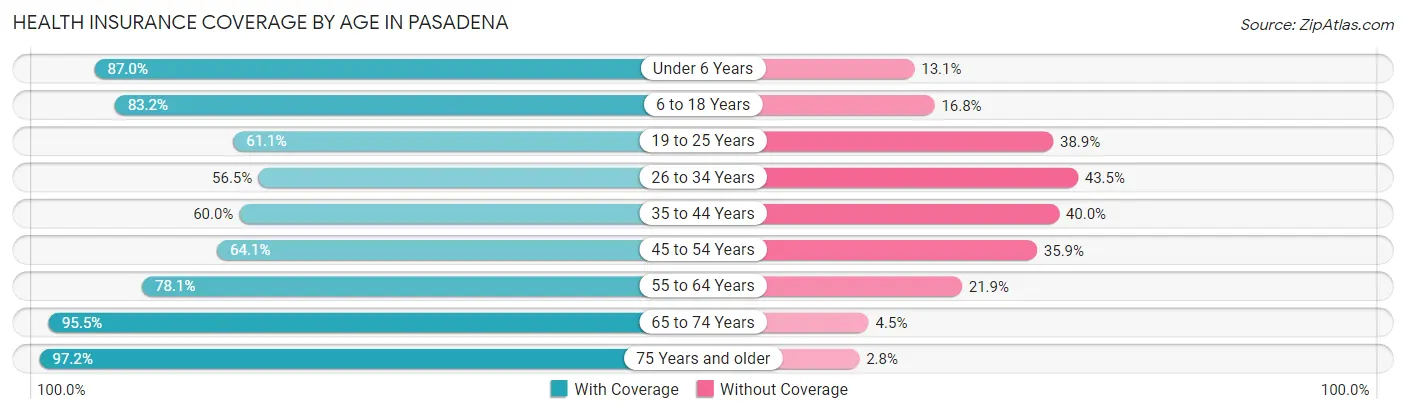
| Age Bracket | With Coverage | Without Coverage |
| Under 6 Years | 12,089 (87.0%) | 1,815 (13.1%) |
| 6 to 18 Years | 25,866 (83.2%) | 5,226 (16.8%) |
| 19 to 25 Years | 10,090 (61.1%) | 6,433 (38.9%) |
| 26 to 34 Years | 10,560 (56.5%) | 8,144 (43.5%) |
| 35 to 44 Years | 11,575 (60.0%) | 7,722 (40.0%) |
| 45 to 54 Years | 11,363 (64.1%) | 6,366 (35.9%) |
| 55 to 64 Years | 12,651 (78.1%) | 3,550 (21.9%) |
| 65 to 74 Years | 9,788 (95.5%) | 465 (4.5%) |
| 75 Years and older | 5,808 (97.2%) | 166 (2.8%) |
| Total | 109,790 (73.4%) | 39,887 (26.7%) |
Health Insurance Coverage by Citizenship Status in Pasadena
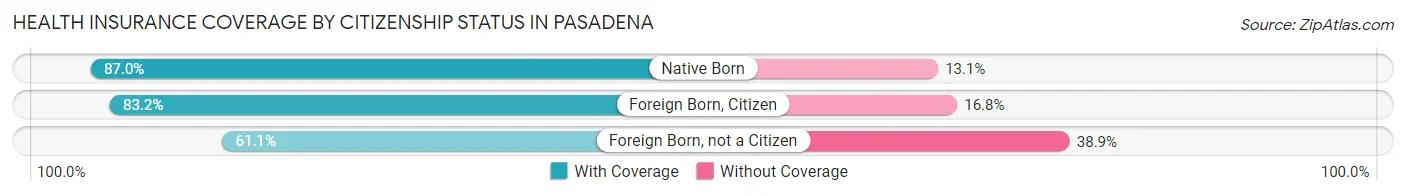
| Citizenship Status | With Coverage | Without Coverage |
| Native Born | 12,089 (87.0%) | 1,815 (13.1%) |
| Foreign Born, Citizen | 25,866 (83.2%) | 5,226 (16.8%) |
| Foreign Born, not a Citizen | 10,090 (61.1%) | 6,433 (38.9%) |
Health Insurance Coverage by Household Income in Pasadena
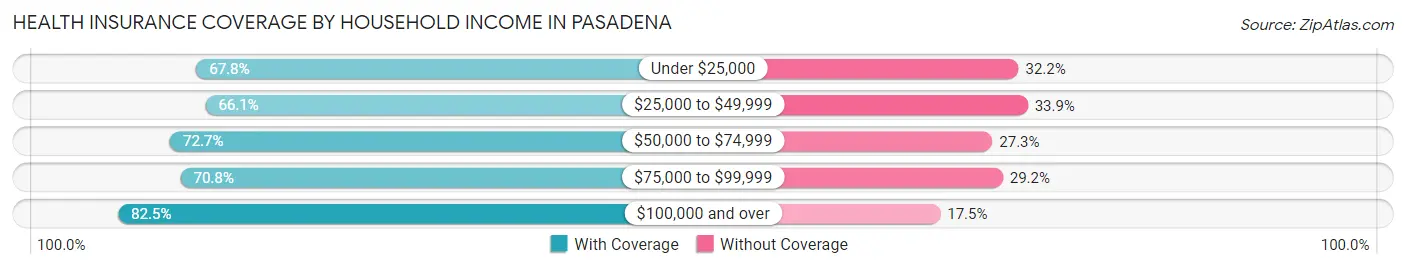
| Household Income | With Coverage | Without Coverage |
| Under $25,000 | 12,384 (67.8%) | 5,877 (32.2%) |
| $25,000 to $49,999 | 22,268 (66.1%) | 11,414 (33.9%) |
| $50,000 to $74,999 | 19,196 (72.7%) | 7,198 (27.3%) |
| $75,000 to $99,999 | 17,247 (70.8%) | 7,123 (29.2%) |
| $100,000 and over | 38,590 (82.5%) | 8,193 (17.5%) |
Public vs Private Health Insurance Coverage by Age in Pasadena
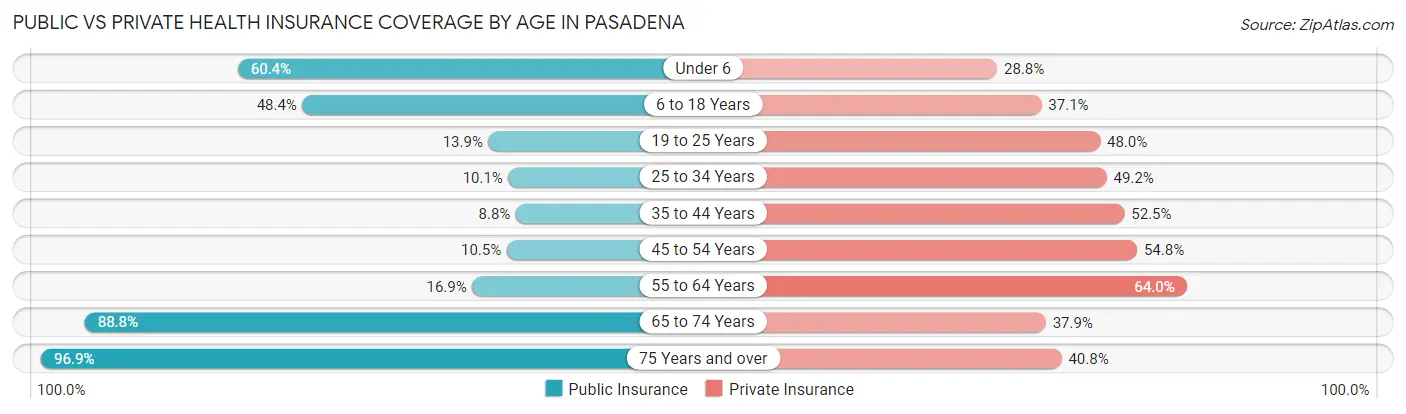
| Age Bracket | Public Insurance | Private Insurance |
| Under 6 | 8,399 (60.4%) | 4,007 (28.8%) |
| 6 to 18 Years | 15,042 (48.4%) | 11,520 (37.0%) |
| 19 to 25 Years | 2,289 (13.9%) | 7,922 (47.9%) |
| 25 to 34 Years | 1,896 (10.1%) | 9,195 (49.2%) |
| 35 to 44 Years | 1,688 (8.7%) | 10,122 (52.4%) |
| 45 to 54 Years | 1,852 (10.4%) | 9,714 (54.8%) |
| 55 to 64 Years | 2,731 (16.9%) | 10,369 (64.0%) |
| 65 to 74 Years | 9,107 (88.8%) | 3,881 (37.9%) |
| 75 Years and over | 5,790 (96.9%) | 2,436 (40.8%) |
| Total | 48,794 (32.6%) | 69,166 (46.2%) |
Disability Status by Sex by Age in Pasadena
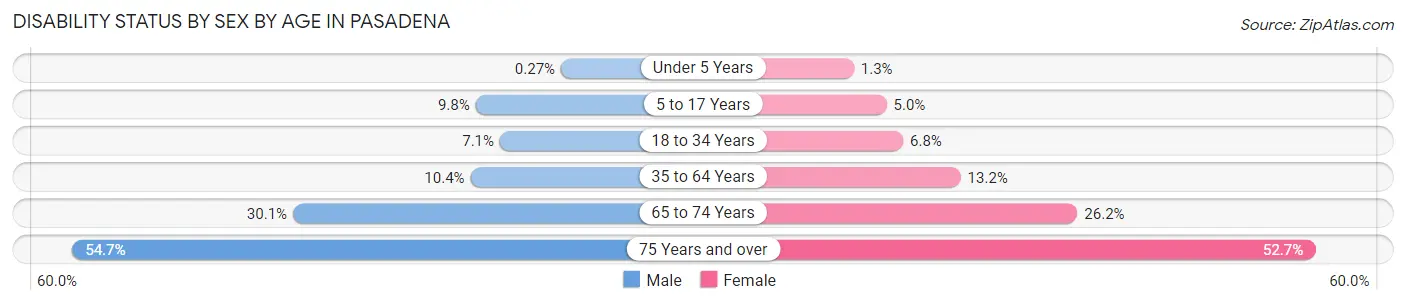
| Age Bracket | Male | Female |
| Under 5 Years | 15 (0.3%) | 79 (1.3%) |
| 5 to 17 Years | 1,516 (9.8%) | 792 (5.0%) |
| 18 to 34 Years | 1,340 (7.1%) | 1,256 (6.8%) |
| 35 to 64 Years | 2,776 (10.3%) | 3,496 (13.2%) |
| 65 to 74 Years | 1,413 (30.1%) | 1,459 (26.2%) |
| 75 Years and over | 1,395 (54.7%) | 1,804 (52.7%) |
Disability Class by Sex by Age in Pasadena
Disability Class: Hearing Difficulty
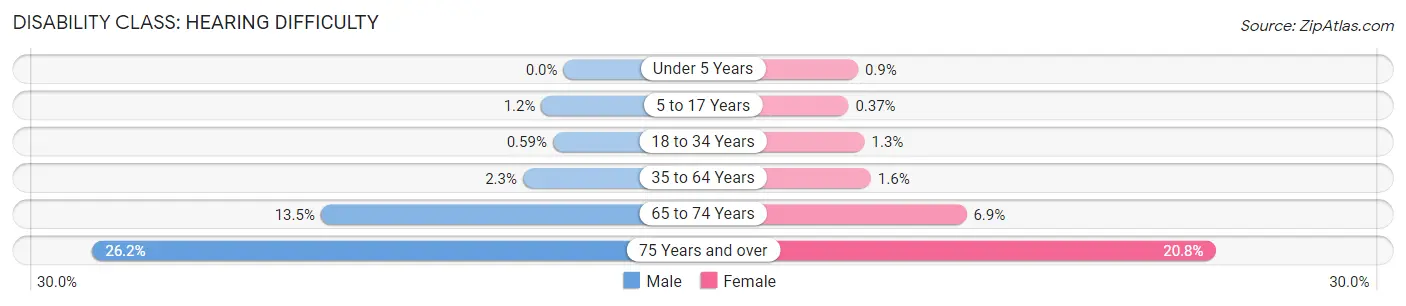
| Age Bracket | Male | Female |
| Under 5 Years | 0 (0.0%) | 53 (0.9%) |
| 5 to 17 Years | 190 (1.2%) | 58 (0.4%) |
| 18 to 34 Years | 111 (0.6%) | 234 (1.3%) |
| 35 to 64 Years | 607 (2.3%) | 427 (1.6%) |
| 65 to 74 Years | 634 (13.5%) | 386 (6.9%) |
| 75 Years and over | 669 (26.2%) | 712 (20.8%) |
Disability Class: Vision Difficulty
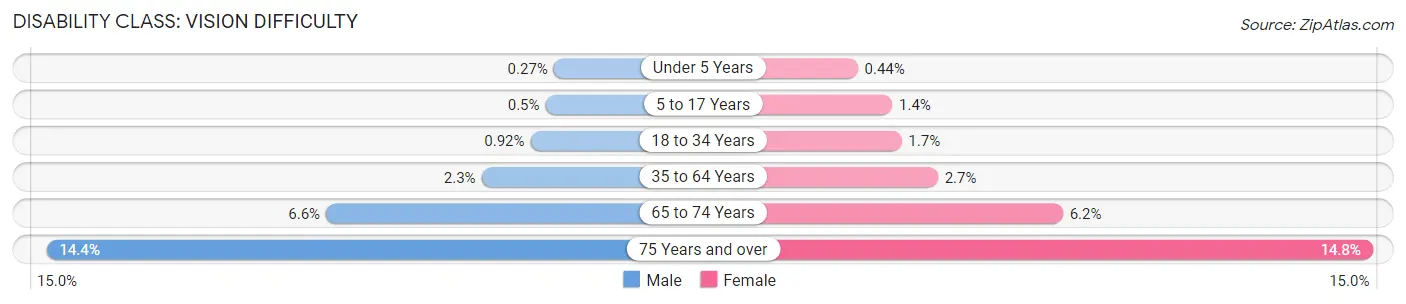
| Age Bracket | Male | Female |
| Under 5 Years | 15 (0.3%) | 26 (0.4%) |
| 5 to 17 Years | 78 (0.5%) | 222 (1.4%) |
| 18 to 34 Years | 174 (0.9%) | 305 (1.7%) |
| 35 to 64 Years | 613 (2.3%) | 706 (2.7%) |
| 65 to 74 Years | 310 (6.6%) | 342 (6.1%) |
| 75 Years and over | 367 (14.4%) | 506 (14.8%) |
Disability Class: Cognitive Difficulty
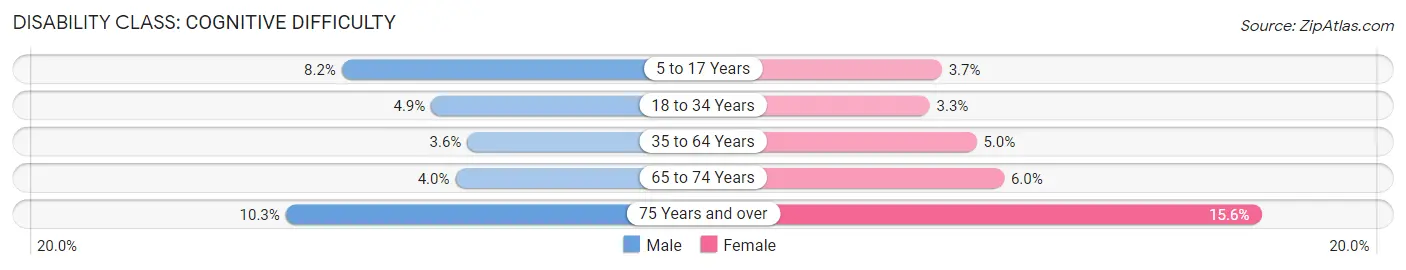
| Age Bracket | Male | Female |
| 5 to 17 Years | 1,276 (8.2%) | 588 (3.7%) |
| 18 to 34 Years | 930 (4.9%) | 600 (3.3%) |
| 35 to 64 Years | 957 (3.6%) | 1,321 (5.0%) |
| 65 to 74 Years | 188 (4.0%) | 335 (6.0%) |
| 75 Years and over | 263 (10.3%) | 533 (15.6%) |
Disability Class: Ambulatory Difficulty
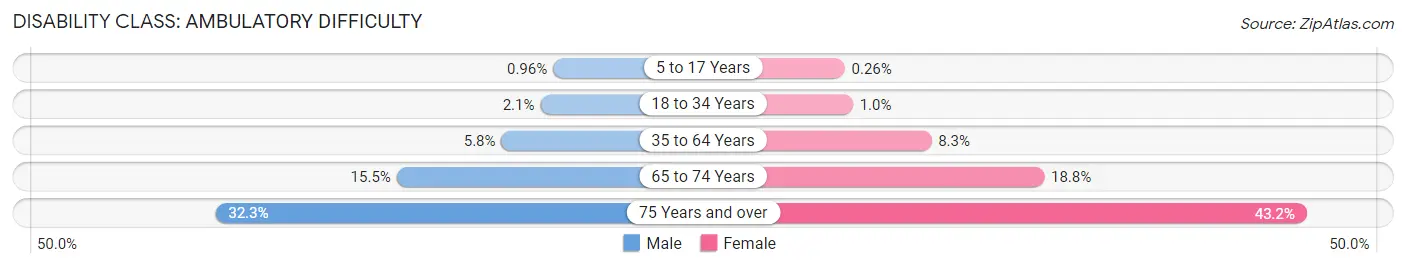
| Age Bracket | Male | Female |
| 5 to 17 Years | 148 (1.0%) | 41 (0.3%) |
| 18 to 34 Years | 406 (2.1%) | 186 (1.0%) |
| 35 to 64 Years | 1,544 (5.8%) | 2,192 (8.3%) |
| 65 to 74 Years | 726 (15.5%) | 1,044 (18.8%) |
| 75 Years and over | 824 (32.3%) | 1,477 (43.1%) |
Disability Class: Self-Care Difficulty
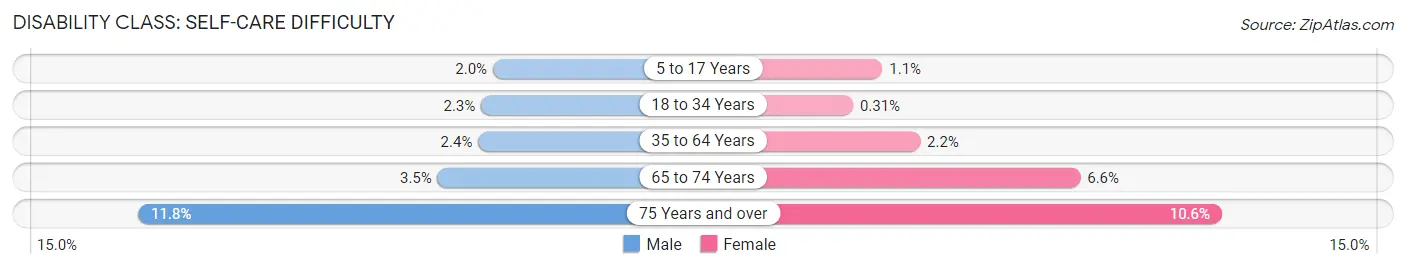
| Age Bracket | Male | Female |
| 5 to 17 Years | 304 (2.0%) | 180 (1.1%) |
| 18 to 34 Years | 433 (2.3%) | 57 (0.3%) |
| 35 to 64 Years | 637 (2.4%) | 576 (2.2%) |
| 65 to 74 Years | 164 (3.5%) | 369 (6.6%) |
| 75 Years and over | 302 (11.8%) | 362 (10.6%) |
Technology Access in Pasadena
Computing Device Access in Pasadena
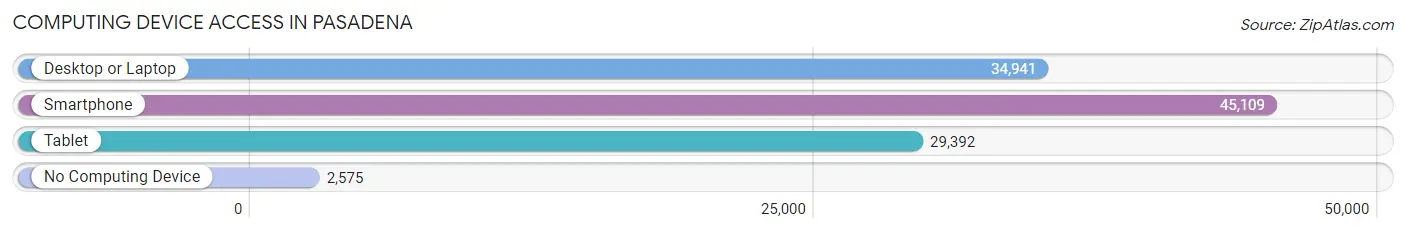
| Device Type | # Households | % Households |
| Desktop or Laptop | 34,941 | 70.5% |
| Smartphone | 45,109 | 91.0% |
| Tablet | 29,392 | 59.3% |
| No Computing Device | 2,575 | 5.2% |
| Total | 49,541 | 100.0% |
Internet Access in Pasadena
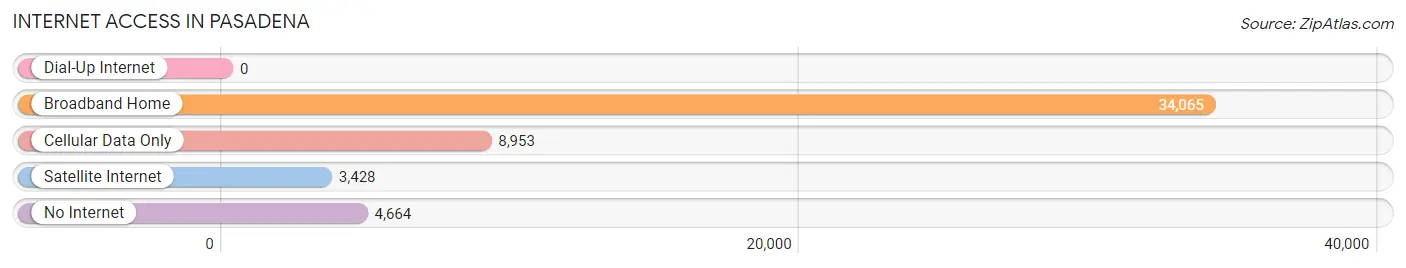
| Internet Type | # Households | % Households |
| Dial-Up Internet | 0 | 0.0% |
| Broadband Home | 34,065 | 68.8% |
| Cellular Data Only | 8,953 | 18.1% |
| Satellite Internet | 3,428 | 6.9% |
| No Internet | 4,664 | 9.4% |
| Total | 49,541 | 100.0% |
Pasadena Summary
Pasadena, Texas is a city located in the southeastern part of Harris County, Texas, United States. It is within the Houston–The Woodlands–Sugar Land metropolitan area. The population was estimated to be 153,520 in 2019, making it the second-largest city in Harris County and the 17th-largest city in Texas. Pasadena is the second-largest city in the Houston metropolitan area, behind Houston.
History
Pasadena was founded in 1893 by John H. Burnett of Galveston. The city was named after Pasadena, California, because of the perceived lush vegetation. The first settlers were mostly farmers from the Southern United States. The city was incorporated in 1928.
In the early 20th century, Pasadena was a major center for the oil industry. The city was home to many refineries, including the Pasadena Refining Company, which was the largest in the world at the time. The city was also home to many chemical plants, including the Monsanto Chemical Company.
Geography
Pasadena is located in southeastern Harris County, Texas, at the intersection of State Highway 225 and State Highway 35. The city is bordered by Houston to the north, Deer Park to the east, La Porte to the south, and Pearland to the west.
The city has a total area of 44.3 square miles, of which 43.7 square miles is land and 0.6 square miles is water. The city is located on the Gulf Coastal Plain, and is characterized by flat terrain and low elevation.
Economy
Pasadena is a major industrial center in the Houston metropolitan area. The city is home to many oil refineries, chemical plants, and other industrial facilities. The city is also home to many corporate headquarters, including the headquarters of the Pasadena Refining Company, the largest oil refinery in the United States.
The city is also home to many retail stores, restaurants, and other businesses. The city is served by the Port of Houston, which is the largest port in the United States.
Demographics
As of the 2019 census, the population of Pasadena was estimated to be 153,520. The racial makeup of the city was 63.2% White, 16.2% African American, 0.7% Native American, 5.3% Asian, 0.1% Pacific Islander, 11.7% from other races, and 3.0% from two or more races. Hispanic or Latino of any race were 33.2% of the population.
The median household income in Pasadena was $50,945 in 2019. The median home value was $164,400. The city has a poverty rate of 16.2%.
Conclusion
Pasadena, Texas is a city located in the southeastern part of Harris County, Texas, United States. It is within the Houston–The Woodlands–Sugar Land metropolitan area. The population was estimated to be 153,520 in 2019, making it the second-largest city in Harris County and the 17th-largest city in Texas. Pasadena is the second-largest city in the Houston metropolitan area, behind Houston. The city is a major industrial center in the Houston metropolitan area, and is home to many oil refineries, chemical plants, and other industrial facilities. The city is also home to many corporate headquarters, retail stores, restaurants, and other businesses. The population of Pasadena is diverse, with 63.2% White, 16.2% African American, 0.7% Native American, 5.3% Asian, 0.1% Pacific Islander, 11.7% from other races, and 3.0% from two or more races. The median household income in Pasadena was $50,945 in 2019, and the median home value was $164,400. The city has a poverty rate of 16.2%.
Common Questions
What is Per Capita Income in Pasadena?
Per Capita income in Pasadena is $27,913.
What is the Median Family Income in Pasadena?
Median Family Income in Pasadena is $71,610.
What is the Median Household income in Pasadena?
Median Household Income in Pasadena is $64,698.
What is Income or Wage Gap in Pasadena?
Income or Wage Gap in Pasadena is 38.6%.
Women in Pasadena earn 61.4 cents for every dollar earned by a man.
What is Family Income Deficit in Pasadena?
Family Income Deficit in Pasadena is $10,187.
Families that are below poverty line in Pasadena earn $10,187 less on average than the poverty threshold level.
What is Inequality or Gini Index in Pasadena?
Inequality or Gini Index in Pasadena is 0.43.
What is the Total Population of Pasadena?
Total Population of Pasadena is 150,620.
What is the Total Male Population of Pasadena?
Total Male Population of Pasadena is 74,626.
What is the Total Female Population of Pasadena?
Total Female Population of Pasadena is 75,994.
What is the Ratio of Males per 100 Females in Pasadena?
There are 98.20 Males per 100 Females in Pasadena.
What is the Ratio of Females per 100 Males in Pasadena?
There are 101.83 Females per 100 Males in Pasadena.
What is the Median Population Age in Pasadena?
Median Population Age in Pasadena is 32.6 Years.
What is the Average Family Size in Pasadena
Average Family Size in Pasadena is 3.5 People.
What is the Average Household Size in Pasadena
Average Household Size in Pasadena is 3.0 People.
How Large is the Labor Force in Pasadena?
There are 73,304 People in the Labor Forcein in Pasadena.
What is the Percentage of People in the Labor Force in Pasadena?
65.2% of People are in the Labor Force in Pasadena.
What is the Unemployment Rate in Pasadena?
Unemployment Rate in Pasadena is 8.9%.