Area Code 737 Map & Demographics
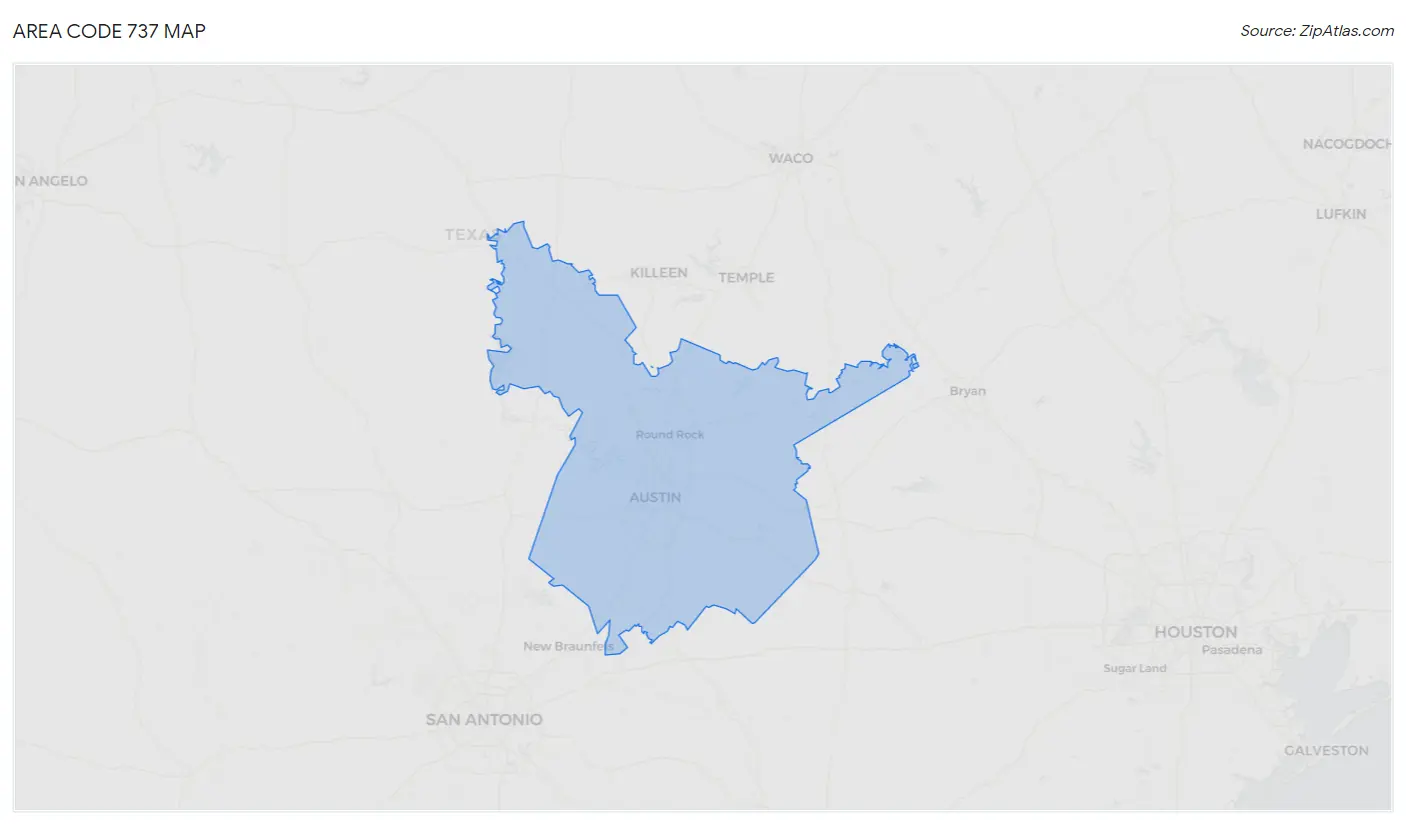
Area Code 737 Map
Area Code 737 Overview
$51,116
PER CAPITA INCOME
$117,929
AVG FAMILY INCOME
$92,656
AVG HOUSEHOLD INCOME
31.7%
WAGE / INCOME GAP [ % ]
68.3¢/ $1
WAGE / INCOME GAP [ $ ]
$12,172
FAMILY INCOME DEFICIT
6.81
INEQUALITY / GINI INDEX
529,483
TOTAL POPULATION
264,127
MALE POPULATION
265,356
FEMALE POPULATION
99.54
MALES / 100 FEMALES
100.47
FEMALES / 100 MALES
37.5
MEDIAN AGE
2.9
AVG FAMILY SIZE
2.3
AVG HOUSEHOLD SIZE
279,835
LABOR FORCE [ PEOPLE ]
64.3%
PERCENT IN LABOR FORCE
4.5%
UNEMPLOYMENT RATE
Income in Area Code 737
Income Overview in Area Code 737
Per Capita Income in Area Code 737 is $51,116, while median incomes of families and households are $117,929 and $92,656 respectively.
| Characteristic | Number | Measure |
| Per Capita Income | 529,483 | $51,116 |
| Median Family Income | 124,935 | $117,929 |
| Mean Family Income | 124,935 | $2,239,200 |
| Median Household Income | 217,700 | $92,656 |
| Mean Household Income | 217,700 | $1,815,858 |
| Income Deficit | 124,935 | $12,172 |
| Wage / Income Gap (%) | 529,483 | 31.66% |
| Wage / Income Gap ($) | 529,483 | 68.34¢ per $1 |
| Gini / Inequality Index | 529,483 | 6.81 |
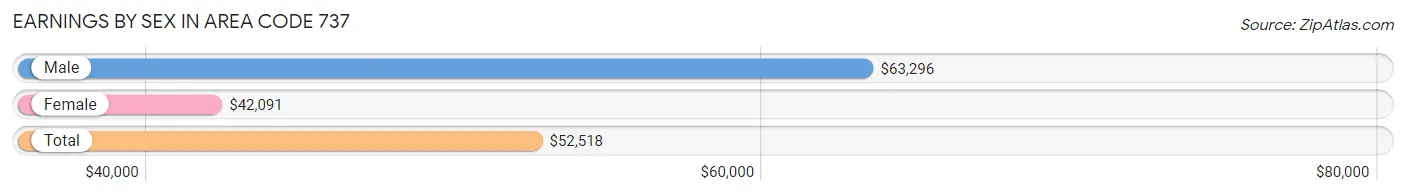
Earnings by Sex in Area Code 737
Average Earnings in Area Code 737 are $52,518, $63,296 for men and $42,091 for women, a difference of 33.5%.
| Sex | Number | Average Earnings |
| Male | 167,739 (53.2%) | $63,296 |
| Female | 147,716 (46.8%) | $42,091 |
| Total | 315,455 (100.0%) | $52,518 |
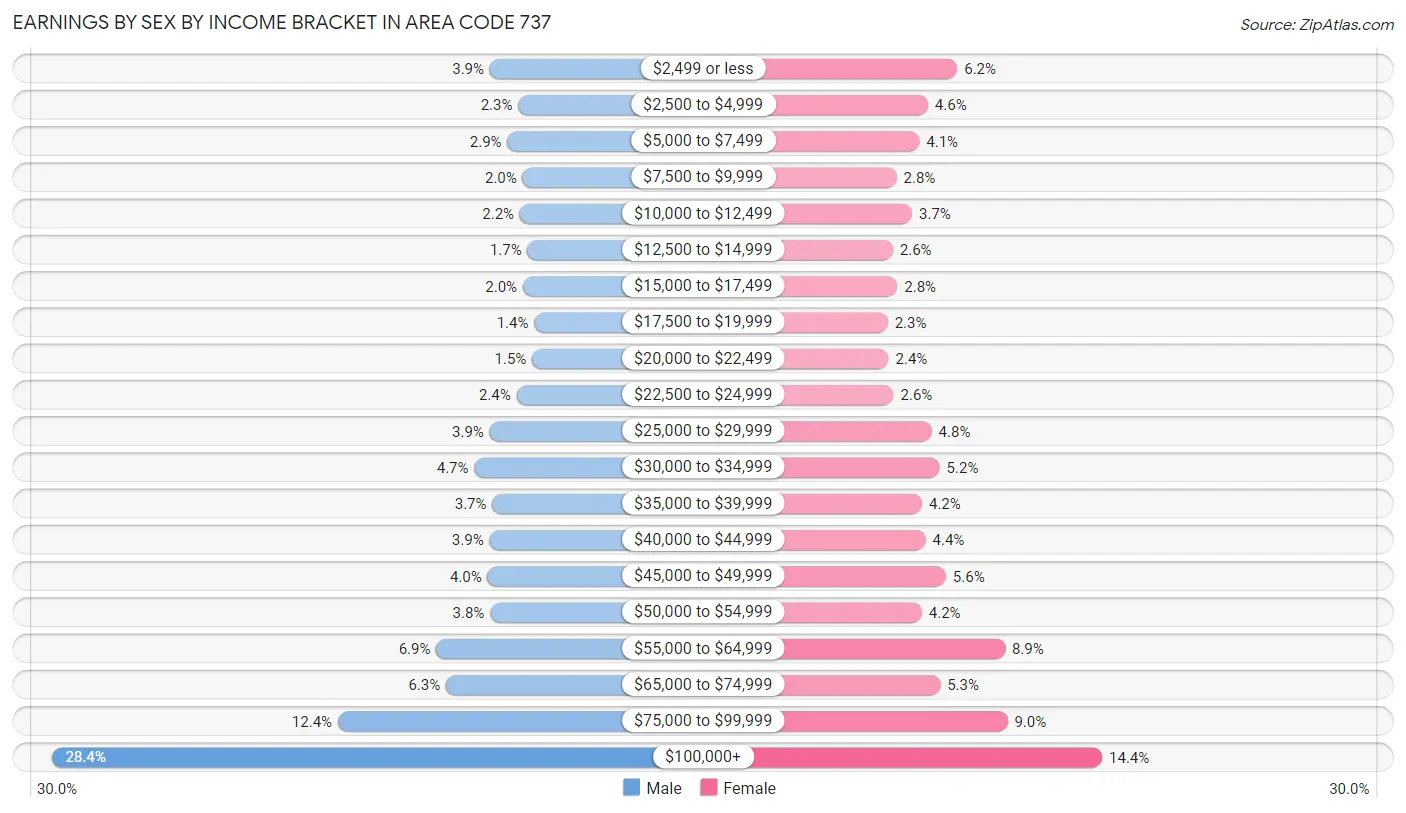
Earnings by Sex by Income Bracket in Area Code 737
The most common earnings brackets in Area Code 737 are $100,000+ for men (47,693 | 28.4%) and $100,000+ for women (21,202 | 14.3%).
| Income | Male | Female |
| $2,499 or less | 6,460 (3.8%) | 9,176 (6.2%) |
| $2,500 to $4,999 | 3,771 (2.2%) | 6,742 (4.6%) |
| $5,000 to $7,499 | 4,794 (2.9%) | 6,023 (4.1%) |
| $7,500 to $9,999 | 3,371 (2.0%) | 4,133 (2.8%) |
| $10,000 to $12,499 | 3,622 (2.2%) | 5,421 (3.7%) |
| $12,500 to $14,999 | 2,909 (1.7%) | 3,821 (2.6%) |
| $15,000 to $17,499 | 3,332 (2.0%) | 4,196 (2.8%) |
| $17,500 to $19,999 | 2,271 (1.3%) | 3,403 (2.3%) |
| $20,000 to $22,499 | 2,470 (1.5%) | 3,466 (2.4%) |
| $22,500 to $24,999 | 3,945 (2.4%) | 3,880 (2.6%) |
| $25,000 to $29,999 | 6,482 (3.9%) | 7,053 (4.8%) |
| $30,000 to $34,999 | 7,922 (4.7%) | 7,715 (5.2%) |
| $35,000 to $39,999 | 6,217 (3.7%) | 6,246 (4.2%) |
| $40,000 to $44,999 | 6,496 (3.9%) | 6,547 (4.4%) |
| $45,000 to $49,999 | 6,678 (4.0%) | 8,221 (5.6%) |
| $50,000 to $54,999 | 6,425 (3.8%) | 6,234 (4.2%) |
| $55,000 to $64,999 | 11,509 (6.9%) | 13,132 (8.9%) |
| $65,000 to $74,999 | 10,590 (6.3%) | 7,760 (5.2%) |
| $75,000 to $99,999 | 20,782 (12.4%) | 13,345 (9.0%) |
| $100,000+ | 47,693 (28.4%) | 21,202 (14.3%) |
| Total | 167,739 (100.0%) | 147,716 (100.0%) |
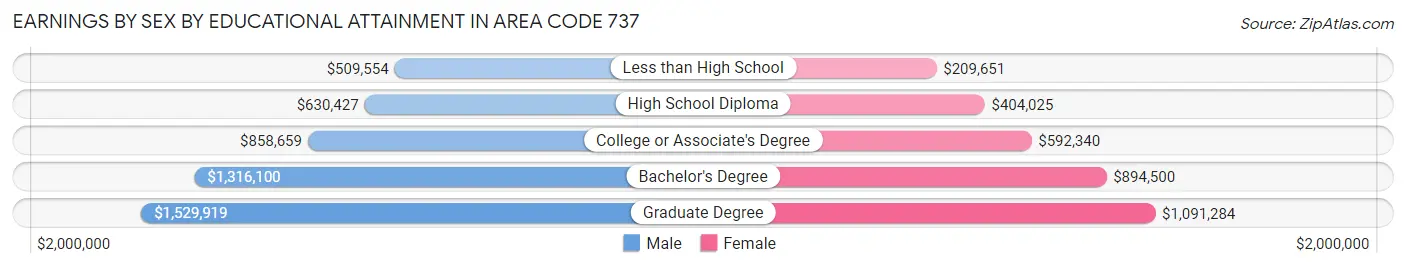
Earnings by Sex by Educational Attainment in Area Code 737
Average earnings in Area Code 737 are $1,089,591 for men and $735,177 for women, a difference of 32.5%. Men with an educational attainment of graduate degree enjoy the highest average annual earnings of $1,529,919, while those with less than high school education earn the least with $509,554. Women with an educational attainment of graduate degree earn the most with the average annual earnings of $1,091,284, while those with less than high school education have the smallest earnings of $209,651.
| Educational Attainment | Male Income | Female Income |
| Less than High School | $509,554 | $209,651 |
| High School Diploma | $630,427 | $404,025 |
| College or Associate's Degree | $858,659 | $592,340 |
| Bachelor's Degree | $1,316,100 | $894,500 |
| Graduate Degree | $1,529,919 | $1,091,284 |
| Total | $1,089,591 | $735,177 |
Family Income in Area Code 737
Family Income Brackets in Area Code 737
According to the Area Code 737 family income data, there are 406,414 families falling into the $100,000 to $149,999 income range, which is the most common income bracket and makes up 325.3% of all families. Conversely, the $10,000 to $14,999 income bracket is the least frequent group with only 29,984 families (24.0%) belonging to this category.
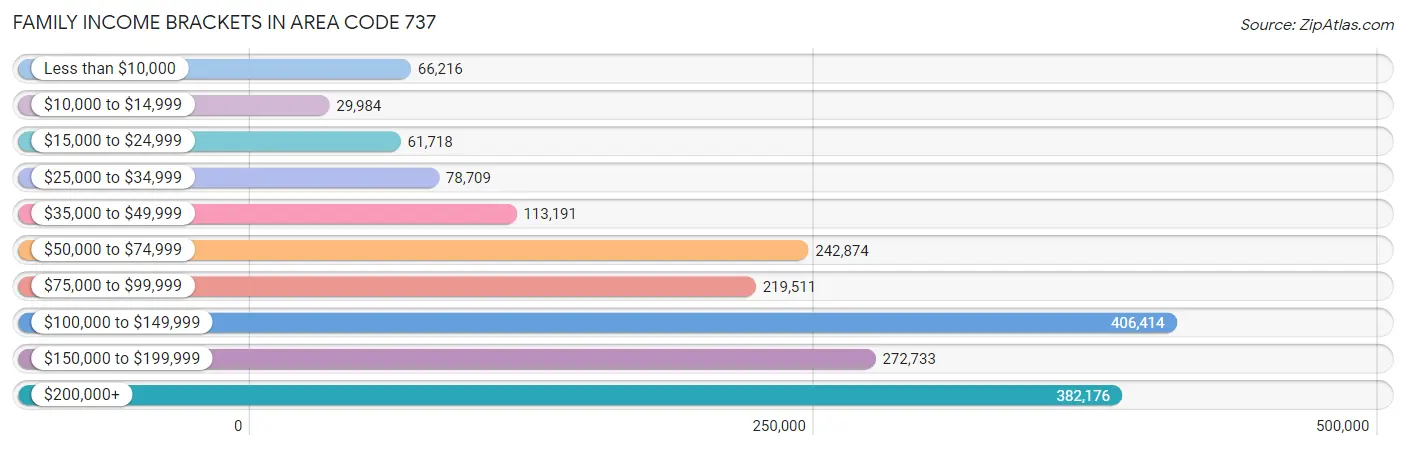
| Income Bracket | # Families | % Families |
| Less than $10,000 | 66,216 | 53.0% |
| $10,000 to $14,999 | 29,984 | 24.0% |
| $15,000 to $24,999 | 61,718 | 49.4% |
| $25,000 to $34,999 | 78,709 | 63.0% |
| $35,000 to $49,999 | 113,191 | 90.6% |
| $50,000 to $74,999 | 242,874 | 194.4% |
| $75,000 to $99,999 | 219,511 | 175.7% |
| $100,000 to $149,999 | 406,414 | 325.3% |
| $150,000 to $199,999 | 272,733 | 218.3% |
| $200,000+ | 382,176 | 305.9% |
Family Income by Famaliy Size in Area Code 737
7+ person families (1,380 | 1.1%) account for the highest median family income in Area Code 737 with $151,466 per family, while 2-person families (60,085 | 48.1%) have the highest median income of $53,872 per family member.
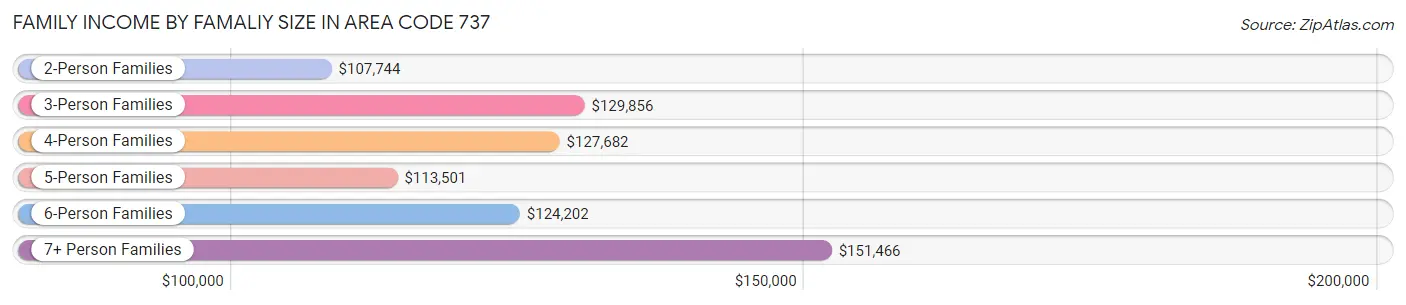
| Income Bracket | # Families | Median Income |
| 2-Person Families | 60,085 (48.1%) | $107,744 |
| 3-Person Families | 27,674 (22.2%) | $129,856 |
| 4-Person Families | 22,903 (18.3%) | $127,682 |
| 5-Person Families | 9,546 (7.6%) | $113,500 |
| 6-Person Families | 3,347 (2.7%) | $124,202 |
| 7+ Person Families | 1,380 (1.1%) | $151,466 |
| Total | 124,935 (100.0%) | $117,929 |
Family Income by Number of Earners in Area Code 737
The median family income in Area Code 737 is $117,929, with families comprising 3+ earners (12,119) having the highest median family income of $157,895, while families with no earners (15,499) have the lowest median family income of $61,482, accounting for 9.7% and 12.4% of families, respectively.
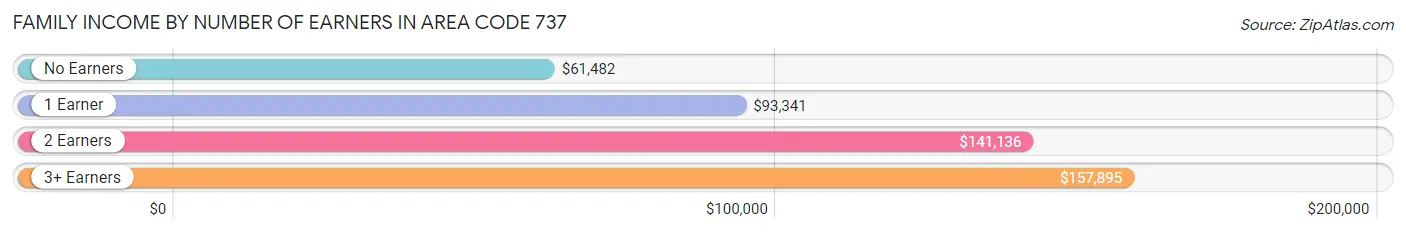
| Number of Earners | # Families | Median Income |
| No Earners | 15,499 (12.4%) | $61,482 |
| 1 Earner | 38,090 (30.5%) | $93,341 |
| 2 Earners | 59,227 (47.4%) | $141,136 |
| 3+ Earners | 12,119 (9.7%) | $157,895 |
| Total | 124,935 (100.0%) | $117,929 |
Household Income in Area Code 737
Household Income Brackets in Area Code 737
With 638,296 households falling in the category, the $100,000 to $149,999 income range is the most frequent in Area Code 737, accounting for 293.2% of all households. In contrast, only 104,496 households (48.0%) fall into the $10,000 to $14,999 income bracket, making it the least populous group.
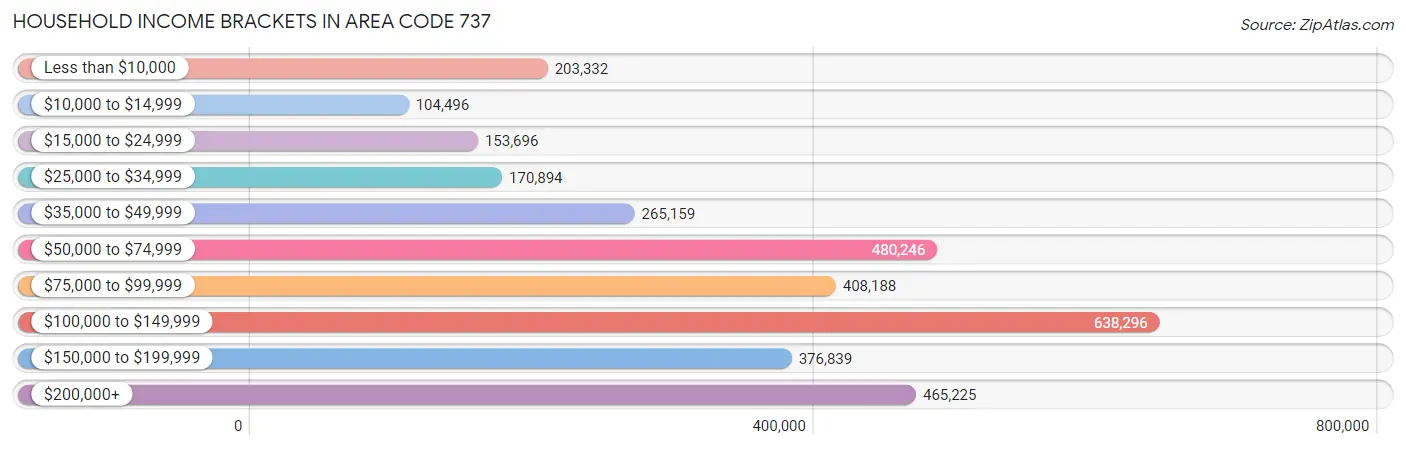
| Income Bracket | # Households | % Households |
| Less than $10,000 | 203,332 | 93.4% |
| $10,000 to $14,999 | 104,496 | 48.0% |
| $15,000 to $24,999 | 153,696 | 70.6% |
| $25,000 to $34,999 | 170,894 | 78.5% |
| $35,000 to $49,999 | 265,159 | 121.8% |
| $50,000 to $74,999 | 480,246 | 220.6% |
| $75,000 to $99,999 | 408,188 | 187.5% |
| $100,000 to $149,999 | 638,296 | 293.2% |
| $150,000 to $199,999 | 376,839 | 173.1% |
| $200,000+ | 465,225 | 213.7% |
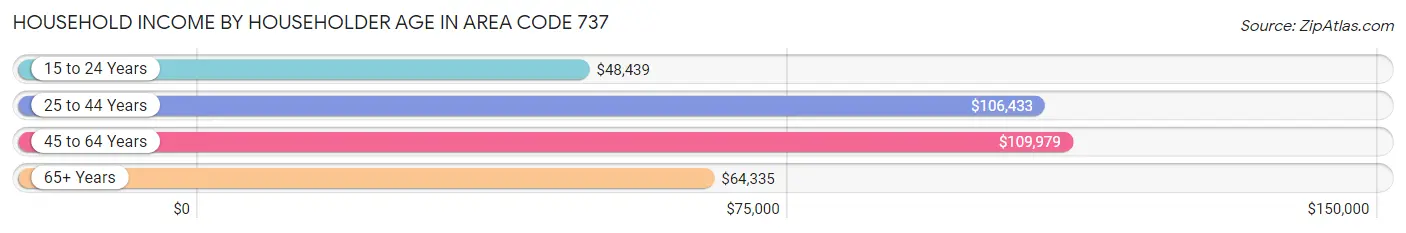
Household Income by Householder Age in Area Code 737
The median household income in Area Code 737 is $92,656, with the highest median household income of $109,979 found in the 45 to 64 years age bracket for the primary householder. A total of 68,683 households (31.6%) fall into this category. Meanwhile, the 15 to 24 years age bracket for the primary householder has the lowest median household income of $48,439, with 15,449 households (7.1%) in this group.
| Income Bracket | # Households | Median Income |
| 15 to 24 Years | 15,449 (7.1%) | $48,439 |
| 25 to 44 Years | 92,606 (42.5%) | $106,433 |
| 45 to 64 Years | 68,683 (31.6%) | $109,979 |
| 65+ Years | 40,962 (18.8%) | $64,335 |
| Total | 217,700 (100.0%) | $92,656 |
Poverty in Area Code 737
Income Below Poverty by Sex and Age in Area Code 737
With 11.1% poverty level for males and 12.5% for females among the residents of Area Code 737, 18 to 24 year old males and 18 to 24 year old females are the most vulnerable to poverty, with 7,566 males (31.6%) and 9,341 females (37.9%) in their respective age groups living below the poverty level.
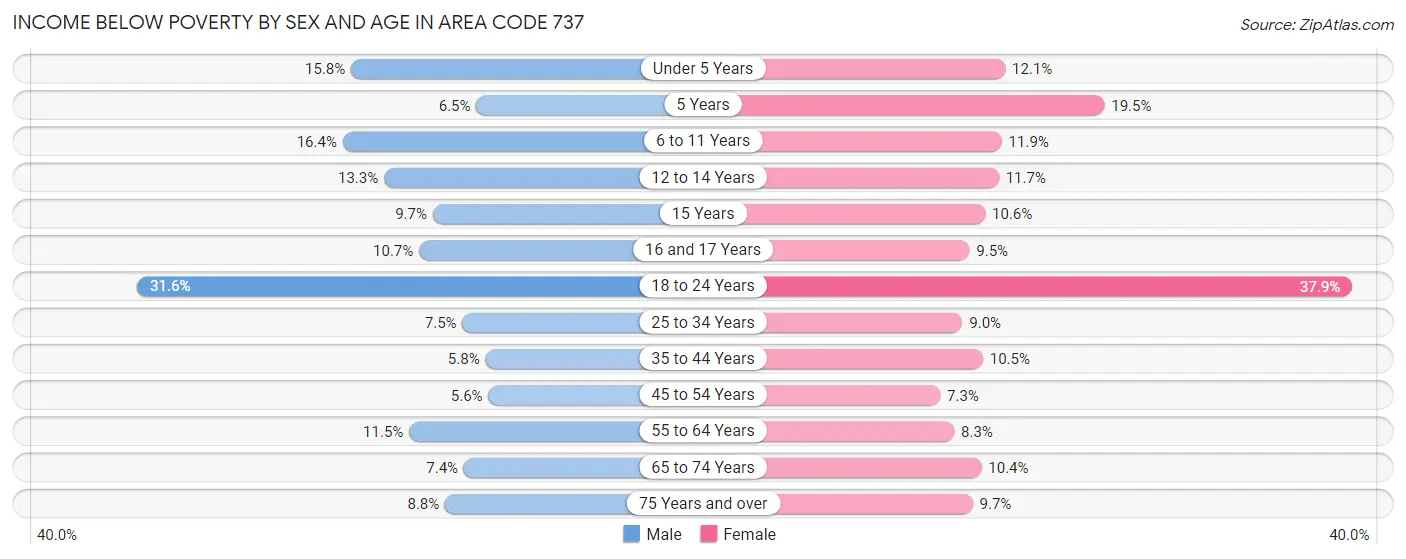
| Age Bracket | Male | Female |
| Under 5 Years | 2,471 (15.8%) | 1,593 (12.1%) |
| 5 Years | 189 (6.5%) | 538 (19.5%) |
| 6 to 11 Years | 2,828 (16.4%) | 2,214 (11.9%) |
| 12 to 14 Years | 1,128 (13.3%) | 915 (11.7%) |
| 15 Years | 284 (9.7%) | 330 (10.6%) |
| 16 and 17 Years | 589 (10.7%) | 434 (9.5%) |
| 18 to 24 Years | 7,566 (31.6%) | 9,341 (37.9%) |
| 25 to 34 Years | 3,469 (7.5%) | 4,118 (8.9%) |
| 35 to 44 Years | 2,429 (5.8%) | 4,137 (10.5%) |
| 45 to 54 Years | 1,839 (5.6%) | 2,101 (7.3%) |
| 55 to 64 Years | 3,113 (11.5%) | 2,392 (8.3%) |
| 65 to 74 Years | 1,423 (7.4%) | 2,323 (10.4%) |
| 75 Years and over | 995 (8.8%) | 1,339 (9.7%) |
| Total | 28,323 (11.1%) | 31,775 (12.5%) |
Income Above Poverty by Sex and Age in Area Code 737
According to the poverty statistics in Area Code 737, males aged 45 to 54 years and females aged 45 to 54 years are the age groups that are most secure financially, with 94.4% of males and 92.7% of females in these age groups living above the poverty line.
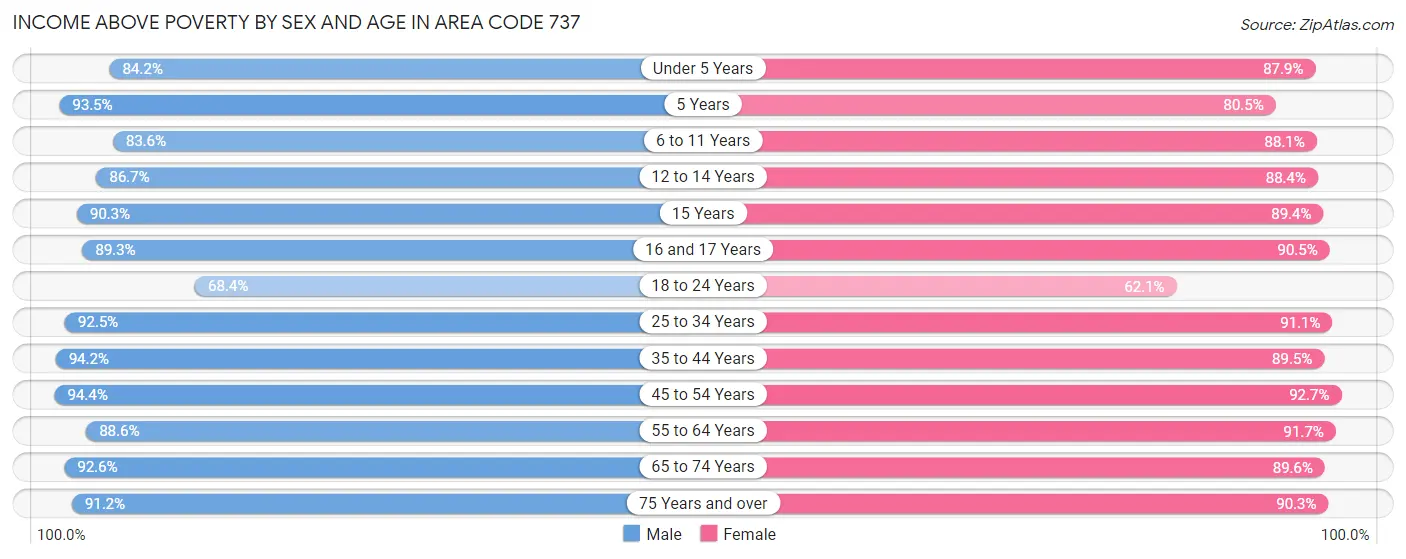
| Age Bracket | Male | Female |
| Under 5 Years | 13,205 (84.2%) | 11,544 (87.9%) |
| 5 Years | 2,738 (93.5%) | 2,223 (80.5%) |
| 6 to 11 Years | 14,434 (83.6%) | 16,437 (88.1%) |
| 12 to 14 Years | 7,345 (86.7%) | 6,942 (88.3%) |
| 15 Years | 2,647 (90.3%) | 2,772 (89.4%) |
| 16 and 17 Years | 4,910 (89.3%) | 4,147 (90.5%) |
| 18 to 24 Years | 16,346 (68.4%) | 15,312 (62.1%) |
| 25 to 34 Years | 42,853 (92.5%) | 41,908 (91.0%) |
| 35 to 44 Years | 39,606 (94.2%) | 35,367 (89.5%) |
| 45 to 54 Years | 31,255 (94.4%) | 26,695 (92.7%) |
| 55 to 64 Years | 24,084 (88.5%) | 26,296 (91.7%) |
| 65 to 74 Years | 17,854 (92.6%) | 20,094 (89.6%) |
| 75 Years and over | 10,341 (91.2%) | 12,447 (90.3%) |
| Total | 227,618 (88.9%) | 222,184 (87.5%) |
Income Below Poverty Among Married-Couple Families in Area Code 737
The poverty statistics for married-couple families in Area Code 737 show that 3.8% or 3,732 of the total 98,506 families live below the poverty line. Families with 5 or more children have the highest poverty rate of 19.2%, comprising of 69 families. On the other hand, families with no children have the lowest poverty rate of 2.8%, which includes 1,573 families.
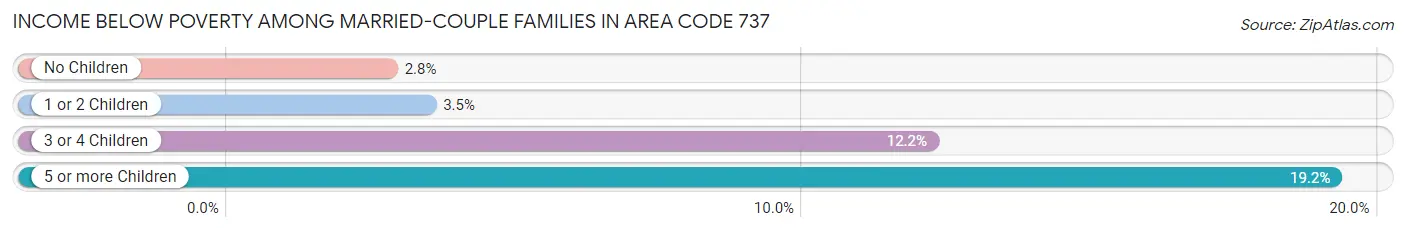
| Children | Above Poverty | Below Poverty |
| No Children | 55,011 (97.2%) | 1,573 (2.8%) |
| 1 or 2 Children | 32,890 (96.6%) | 1,175 (3.5%) |
| 3 or 4 Children | 6,583 (87.8%) | 915 (12.2%) |
| 5 or more Children | 290 (80.8%) | 69 (19.2%) |
| Total | 94,774 (96.2%) | 3,732 (3.8%) |
Income Below Poverty Among Single-Parent Households in Area Code 737
According to the poverty data in Area Code 737, 15.5% or 1,231 single-father households and 23.1% or 4,259 single-mother households are living below the poverty line. Among single-father households, those with 1 or 2 children have the highest poverty rate, with 908 households (25.4%) experiencing poverty. Likewise, among single-mother households, those with 5 or more children have the highest poverty rate, with 66 households (55.5%) falling below the poverty line.
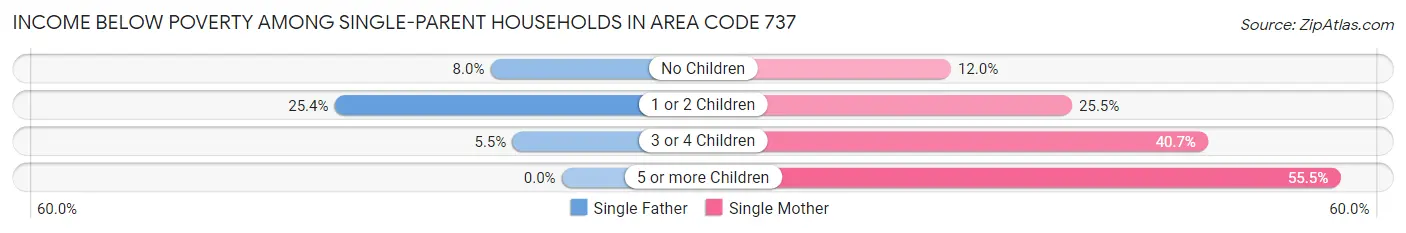
| Children | Single Father | Single Mother |
| No Children | 276 (8.0%) | 794 (12.0%) |
| 1 or 2 Children | 908 (25.4%) | 2,308 (25.5%) |
| 3 or 4 Children | 47 (5.5%) | 1,091 (40.7%) |
| 5 or more Children | 0 (0.0%) | 66 (55.5%) |
| Total | 1,231 (15.5%) | 4,259 (23.1%) |
Income Below Poverty Among Married-Couple vs Single-Parent Households in Area Code 737
The poverty data for Area Code 737 shows that 3,732 of the married-couple family households (3.8%) and 5,490 of the single-parent households (20.8%) are living below the poverty level. Within the married-couple family households, those with 5 or more children have the highest poverty rate, with 69 households (19.2%) falling below the poverty line. Among the single-parent households, those with 5 or more children have the highest poverty rate, with 66 household (35.3%) living below poverty.
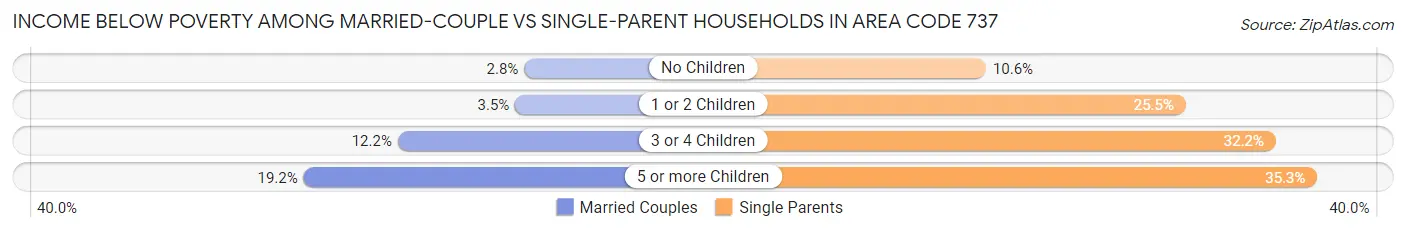
| Children | Married-Couple Families | Single-Parent Households |
| No Children | 1,573 (2.8%) | 1,070 (10.6%) |
| 1 or 2 Children | 1,175 (3.5%) | 3,216 (25.5%) |
| 3 or 4 Children | 915 (12.2%) | 1,138 (32.2%) |
| 5 or more Children | 69 (19.2%) | 66 (35.3%) |
| Total | 3,732 (3.8%) | 5,490 (20.8%) |
Race in Area Code 737
The most populous races in Area Code 737 are White / Caucasian (364,819 | 68.9%), Hispanic or Latino (152,926 | 28.9%), and Two or more Races (64,075 | 12.1%).
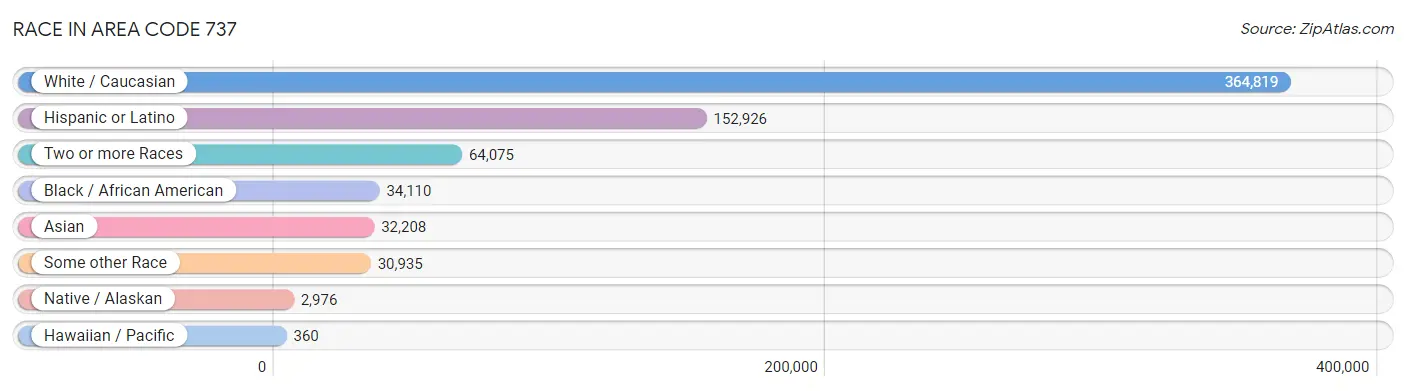
| Race | # Population | % Population |
| Asian | 32,208 | 6.1% |
| Black / African American | 34,110 | 6.4% |
| Hawaiian / Pacific | 360 | 0.1% |
| Hispanic or Latino | 152,926 | 28.9% |
| Native / Alaskan | 2,976 | 0.6% |
| White / Caucasian | 364,819 | 68.9% |
| Two or more Races | 64,075 | 12.1% |
| Some other Race | 30,935 | 5.8% |
| Total | 529,483 | 100.0% |
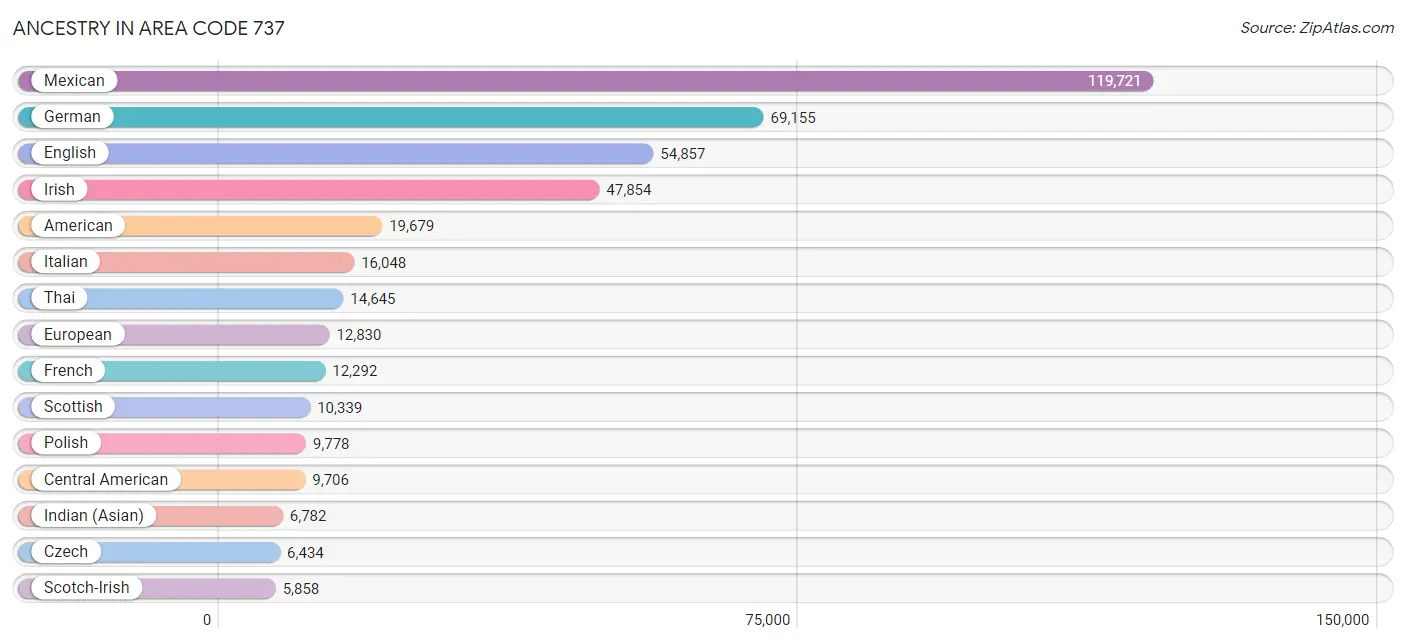
Ancestry in Area Code 737
The most populous ancestries reported in Area Code 737 are Mexican (119,721 | 22.6%), German (69,155 | 13.1%), English (54,857 | 10.4%), Irish (47,854 | 9.0%), and American (19,679 | 3.7%), together accounting for 58.8% of all Area Code 737 residents.
| Ancestry | # Population | % Population |
| Afghan | 175 | 0.0% |
| African | 2,276 | 0.4% |
| Albanian | 17 | 0.0% |
| Alsatian | 95 | 0.0% |
| American | 19,679 | 3.7% |
| Apache | 483 | 0.1% |
| Arab | 4,390 | 0.8% |
| Argentinean | 448 | 0.1% |
| Armenian | 243 | 0.1% |
| Assyrian / Chaldean / Syriac | 20 | 0.0% |
| Australian | 128 | 0.0% |
| Austrian | 1,260 | 0.2% |
| Bahamian | 18 | 0.0% |
| Bangladeshi | 236 | 0.0% |
| Barbadian | 239 | 0.1% |
| Basque | 39 | 0.0% |
| Belgian | 274 | 0.1% |
| Belizean | 75 | 0.0% |
| Bhutanese | 1,668 | 0.3% |
| Blackfeet | 122 | 0.0% |
| Bolivian | 184 | 0.0% |
| Brazilian | 621 | 0.1% |
| British | 4,371 | 0.8% |
| Bulgarian | 124 | 0.0% |
| Burmese | 3,821 | 0.7% |
| Cajun | 313 | 0.1% |
| Cambodian | 148 | 0.0% |
| Canadian | 896 | 0.2% |
| Celtic | 222 | 0.0% |
| Central American | 9,706 | 1.8% |
| Central American Indian | 648 | 0.1% |
| Cherokee | 1,541 | 0.3% |
| Chickasaw | 168 | 0.0% |
| Chilean | 268 | 0.1% |
| Chinese | 3 | 0.0% |
| Chippewa | 13 | 0.0% |
| Choctaw | 544 | 0.1% |
| Colombian | 1,471 | 0.3% |
| Comanche | 68 | 0.0% |
| Costa Rican | 446 | 0.1% |
| Creek | 88 | 0.0% |
| Croatian | 248 | 0.1% |
| Cuban | 2,978 | 0.6% |
| Cypriot | 50 | 0.0% |
| Czech | 6,434 | 1.2% |
| Czechoslovakian | 706 | 0.1% |
| Danish | 2,558 | 0.5% |
| Delaware | 25 | 0.0% |
| Dominican | 588 | 0.1% |
| Dutch | 4,429 | 0.8% |
| Dutch West Indian | 51 | 0.0% |
| Eastern European | 1,379 | 0.3% |
| Ecuadorian | 814 | 0.2% |
| Egyptian | 264 | 0.1% |
| English | 54,857 | 10.4% |
| Estonian | 57 | 0.0% |
| Ethiopian | 382 | 0.1% |
| European | 12,830 | 2.4% |
| Filipino | 575 | 0.1% |
| Finnish | 666 | 0.1% |
| French | 12,292 | 2.3% |
| French American Indian | 10 | 0.0% |
| French Canadian | 1,857 | 0.4% |
| German | 69,155 | 13.1% |
| German Russian | 78 | 0.0% |
| Ghanaian | 10 | 0.0% |
| Greek | 2,220 | 0.4% |
| Guamanian / Chamorro | 239 | 0.1% |
| Guatemalan | 1,382 | 0.3% |
| Guyanese | 8 | 0.0% |
| Haitian | 41 | 0.0% |
| Hmong | 11 | 0.0% |
| Honduran | 3,626 | 0.7% |
| Hopi | 8 | 0.0% |
| Hungarian | 1,359 | 0.3% |
| Icelander | 25 | 0.0% |
| Indian (Asian) | 6,782 | 1.3% |
| Indonesian | 133 | 0.0% |
| Inupiat | 36 | 0.0% |
| Iranian | 922 | 0.2% |
| Iraqi | 910 | 0.2% |
| Irish | 47,854 | 9.0% |
| Iroquois | 25 | 0.0% |
| Israeli | 70 | 0.0% |
| Italian | 16,048 | 3.0% |
| Jamaican | 488 | 0.1% |
| Japanese | 371 | 0.1% |
| Jordanian | 14 | 0.0% |
| Kenyan | 59 | 0.0% |
| Kiowa | 8 | 0.0% |
| Korean | 4,551 | 0.9% |
| Laotian | 301 | 0.1% |
| Latvian | 148 | 0.0% |
| Lebanese | 1,125 | 0.2% |
| Liberian | 77 | 0.0% |
| Lithuanian | 748 | 0.1% |
| Luxembourger | 54 | 0.0% |
| Macedonian | 62 | 0.0% |
| Malaysian | 97 | 0.0% |
| Maltese | 48 | 0.0% |
| Menominee | 17 | 0.0% |
| Mexican | 119,721 | 22.6% |
| Mexican American Indian | 1,535 | 0.3% |
| Mongolian | 242 | 0.1% |
| Moroccan | 69 | 0.0% |
| Native Hawaiian | 477 | 0.1% |
| Navajo | 152 | 0.0% |
| New Zealander | 16 | 0.0% |
| Nicaraguan | 444 | 0.1% |
| Nigerian | 1,313 | 0.3% |
| Northern European | 1,238 | 0.2% |
| Norwegian | 4,985 | 0.9% |
| Okinawan | 4 | 0.0% |
| Osage | 18 | 0.0% |
| Ottawa | 8 | 0.0% |
| Paiute | 10 | 0.0% |
| Pakistani | 477 | 0.1% |
| Palestinian | 118 | 0.0% |
| Panamanian | 529 | 0.1% |
| Paraguayan | 105 | 0.0% |
| Pennsylvania German | 92 | 0.0% |
| Peruvian | 695 | 0.1% |
| Polish | 9,778 | 1.8% |
| Portuguese | 1,667 | 0.3% |
| Potawatomi | 9 | 0.0% |
| Pueblo | 145 | 0.0% |
| Puerto Rican | 3,911 | 0.7% |
| Romanian | 524 | 0.1% |
| Russian | 3,374 | 0.6% |
| Salvadoran | 3,279 | 0.6% |
| Samoan | 419 | 0.1% |
| Scandinavian | 1,670 | 0.3% |
| Scotch-Irish | 5,858 | 1.1% |
| Scottish | 10,339 | 1.9% |
| Seminole | 31 | 0.0% |
| Senegalese | 1 | 0.0% |
| Serbian | 230 | 0.0% |
| Sioux | 30 | 0.0% |
| Slavic | 110 | 0.0% |
| Slovak | 280 | 0.1% |
| Slovene | 330 | 0.1% |
| Somali | 10 | 0.0% |
| South African | 230 | 0.0% |
| South American | 5,222 | 1.0% |
| South American Indian | 67 | 0.0% |
| Soviet Union | 11 | 0.0% |
| Spaniard | 2,487 | 0.5% |
| Spanish | 2,321 | 0.4% |
| Spanish American Indian | 26 | 0.0% |
| Sri Lankan | 3,513 | 0.7% |
| Subsaharan African | 5,299 | 1.0% |
| Sudanese | 14 | 0.0% |
| Swedish | 5,735 | 1.1% |
| Swiss | 1,585 | 0.3% |
| Syrian | 313 | 0.1% |
| Taiwanese | 7 | 0.0% |
| Thai | 14,645 | 2.8% |
| Tlingit-Haida | 27 | 0.0% |
| Tongan | 30 | 0.0% |
| Trinidadian and Tobagonian | 101 | 0.0% |
| Turkish | 823 | 0.2% |
| Ukrainian | 1,322 | 0.3% |
| Uruguayan | 45 | 0.0% |
| Venezuelan | 1,188 | 0.2% |
| Vietnamese | 228 | 0.0% |
| Welsh | 3,467 | 0.6% |
| West Indian | 153 | 0.0% |
| Yaqui | 16 | 0.0% |
| Yugoslavian | 372 | 0.1% | View All 169 Rows |
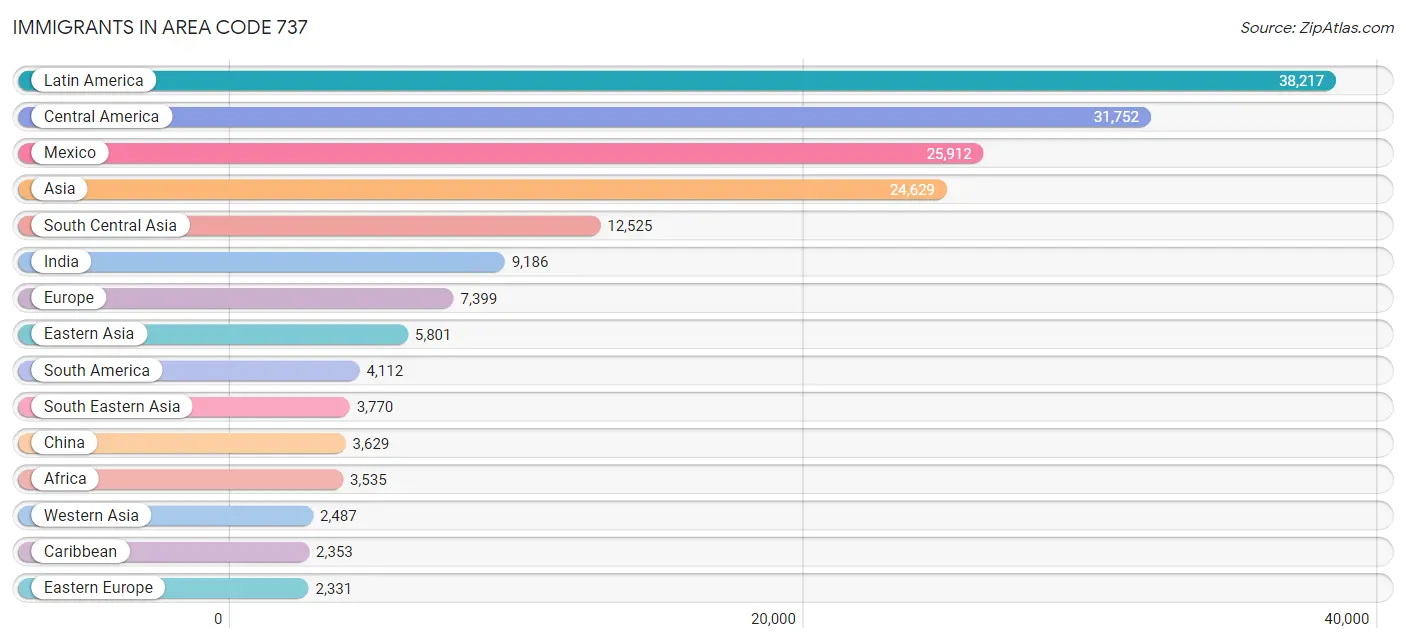
Immigrants in Area Code 737
The most numerous immigrant groups reported in Area Code 737 came from Latin America (38,217 | 7.2%), Central America (31,752 | 6.0%), Mexico (25,912 | 4.9%), Asia (24,629 | 4.6%), and South Central Asia (12,525 | 2.4%), together accounting for 25.1% of all Area Code 737 residents.
| Immigration Origin | # Population | % Population |
| Afghanistan | 250 | 0.1% |
| Africa | 3,535 | 0.7% |
| Albania | 104 | 0.0% |
| Argentina | 175 | 0.0% |
| Asia | 24,629 | 4.6% |
| Australia | 233 | 0.0% |
| Austria | 50 | 0.0% |
| Bahamas | 5 | 0.0% |
| Bangladesh | 383 | 0.1% |
| Barbados | 24 | 0.0% |
| Belarus | 80 | 0.0% |
| Belgium | 23 | 0.0% |
| Belize | 224 | 0.0% |
| Bolivia | 116 | 0.0% |
| Bosnia and Herzegovina | 169 | 0.0% |
| Brazil | 808 | 0.2% |
| Bulgaria | 48 | 0.0% |
| Cambodia | 221 | 0.0% |
| Cameroon | 298 | 0.1% |
| Canada | 1,856 | 0.4% |
| Caribbean | 2,353 | 0.4% |
| Central America | 31,752 | 6.0% |
| Chile | 192 | 0.0% |
| China | 3,629 | 0.7% |
| Colombia | 958 | 0.2% |
| Costa Rica | 286 | 0.1% |
| Cuba | 1,908 | 0.4% |
| Czechoslovakia | 81 | 0.0% |
| Denmark | 25 | 0.0% |
| Dominica | 16 | 0.0% |
| Dominican Republic | 123 | 0.0% |
| Eastern Africa | 995 | 0.2% |
| Eastern Asia | 5,801 | 1.1% |
| Eastern Europe | 2,331 | 0.4% |
| Ecuador | 357 | 0.1% |
| Egypt | 45 | 0.0% |
| El Salvador | 1,741 | 0.3% |
| England | 581 | 0.1% |
| Eritrea | 192 | 0.0% |
| Ethiopia | 125 | 0.0% |
| Europe | 7,399 | 1.4% |
| France | 329 | 0.1% |
| Germany | 1,305 | 0.3% |
| Greece | 73 | 0.0% |
| Grenada | 9 | 0.0% |
| Guatemala | 743 | 0.1% |
| Guyana | 18 | 0.0% |
| Haiti | 5 | 0.0% |
| Honduras | 2,325 | 0.4% |
| Hong Kong | 408 | 0.1% |
| Hungary | 131 | 0.0% |
| India | 9,186 | 1.7% |
| Indonesia | 210 | 0.0% |
| Iran | 781 | 0.2% |
| Iraq | 1,259 | 0.2% |
| Ireland | 222 | 0.0% |
| Israel | 75 | 0.0% |
| Italy | 124 | 0.0% |
| Jamaica | 205 | 0.0% |
| Japan | 284 | 0.1% |
| Jordan | 40 | 0.0% |
| Kazakhstan | 20 | 0.0% |
| Kenya | 240 | 0.1% |
| Korea | 1,888 | 0.4% |
| Kuwait | 118 | 0.0% |
| Laos | 41 | 0.0% |
| Latin America | 38,217 | 7.2% |
| Lebanon | 121 | 0.0% |
| Liberia | 69 | 0.0% |
| Lithuania | 39 | 0.0% |
| Malaysia | 197 | 0.0% |
| Mexico | 25,912 | 4.9% |
| Middle Africa | 384 | 0.1% |
| Moldova | 42 | 0.0% |
| Morocco | 173 | 0.0% |
| Nepal | 1,395 | 0.3% |
| Netherlands | 107 | 0.0% |
| Nicaragua | 254 | 0.1% |
| Nigeria | 799 | 0.2% |
| Northern Africa | 539 | 0.1% |
| Northern Europe | 2,123 | 0.4% |
| Norway | 31 | 0.0% |
| Oceania | 533 | 0.1% |
| Pakistan | 360 | 0.1% |
| Panama | 178 | 0.0% |
| Peru | 506 | 0.1% |
| Philippines | 1,370 | 0.3% |
| Poland | 498 | 0.1% |
| Portugal | 132 | 0.0% |
| Romania | 170 | 0.0% |
| Russia | 474 | 0.1% |
| Saudi Arabia | 111 | 0.0% |
| Scotland | 161 | 0.0% |
| Senegal | 60 | 0.0% |
| Serbia | 24 | 0.0% |
| Singapore | 32 | 0.0% |
| South Africa | 315 | 0.1% |
| South America | 4,112 | 0.8% |
| South Central Asia | 12,525 | 2.4% |
| South Eastern Asia | 3,770 | 0.7% |
| Southern Europe | 969 | 0.2% |
| Spain | 573 | 0.1% |
| Sri Lanka | 125 | 0.0% |
| Sudan | 51 | 0.0% |
| Sweden | 218 | 0.0% |
| Switzerland | 132 | 0.0% |
| Syria | 37 | 0.0% |
| Taiwan | 395 | 0.1% |
| Thailand | 121 | 0.0% |
| Trinidad and Tobago | 58 | 0.0% |
| Turkey | 572 | 0.1% |
| Uganda | 199 | 0.0% |
| Ukraine | 421 | 0.1% |
| Uruguay | 91 | 0.0% |
| Uzbekistan | 25 | 0.0% |
| Venezuela | 845 | 0.2% |
| Vietnam | 1,422 | 0.3% |
| Western Africa | 1,036 | 0.2% |
| Western Asia | 2,487 | 0.5% |
| Western Europe | 1,946 | 0.4% |
| Yemen | 93 | 0.0% |
| Zaire | 86 | 0.0% |
| Zimbabwe | 17 | 0.0% | View All 123 Rows |
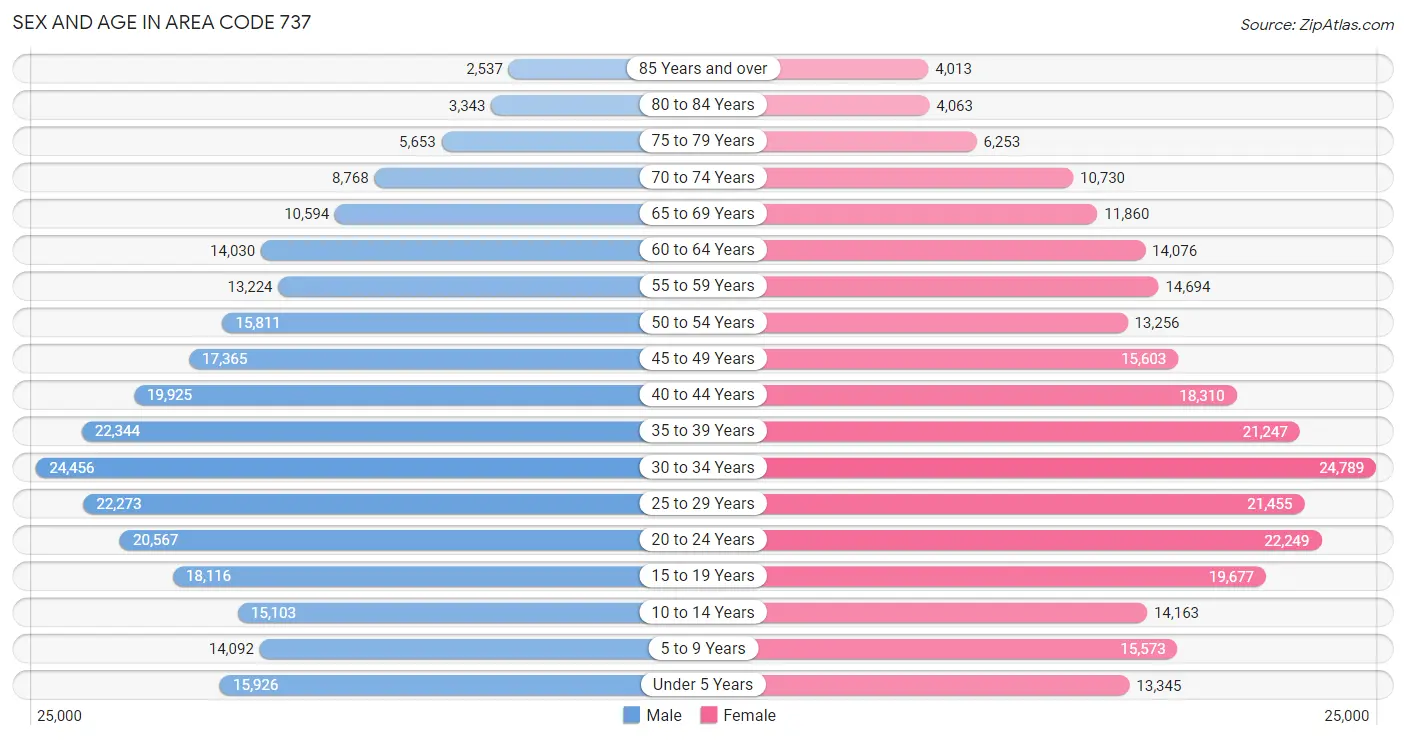
Sex and Age in Area Code 737
Sex and Age in Area Code 737
The most populous age groups in Area Code 737 are 30 to 34 Years (24,456 | 9.3%) for men and 30 to 34 Years (24,789 | 9.3%) for women.
| Age Bracket | Male | Female |
| Under 5 Years | 15,926 (6.0%) | 13,345 (5.0%) |
| 5 to 9 Years | 14,092 (5.3%) | 15,573 (5.9%) |
| 10 to 14 Years | 15,103 (5.7%) | 14,163 (5.3%) |
| 15 to 19 Years | 18,116 (6.9%) | 19,677 (7.4%) |
| 20 to 24 Years | 20,567 (7.8%) | 22,249 (8.4%) |
| 25 to 29 Years | 22,273 (8.4%) | 21,455 (8.1%) |
| 30 to 34 Years | 24,456 (9.3%) | 24,789 (9.3%) |
| 35 to 39 Years | 22,344 (8.5%) | 21,247 (8.0%) |
| 40 to 44 Years | 19,925 (7.5%) | 18,310 (6.9%) |
| 45 to 49 Years | 17,365 (6.6%) | 15,603 (5.9%) |
| 50 to 54 Years | 15,811 (6.0%) | 13,256 (5.0%) |
| 55 to 59 Years | 13,224 (5.0%) | 14,694 (5.5%) |
| 60 to 64 Years | 14,030 (5.3%) | 14,076 (5.3%) |
| 65 to 69 Years | 10,594 (4.0%) | 11,860 (4.5%) |
| 70 to 74 Years | 8,768 (3.3%) | 10,730 (4.0%) |
| 75 to 79 Years | 5,653 (2.1%) | 6,253 (2.4%) |
| 80 to 84 Years | 3,343 (1.3%) | 4,063 (1.5%) |
| 85 Years and over | 2,537 (1.0%) | 4,013 (1.5%) |
| Total | 264,127 (100.0%) | 265,356 (100.0%) |
Families and Households in Area Code 737
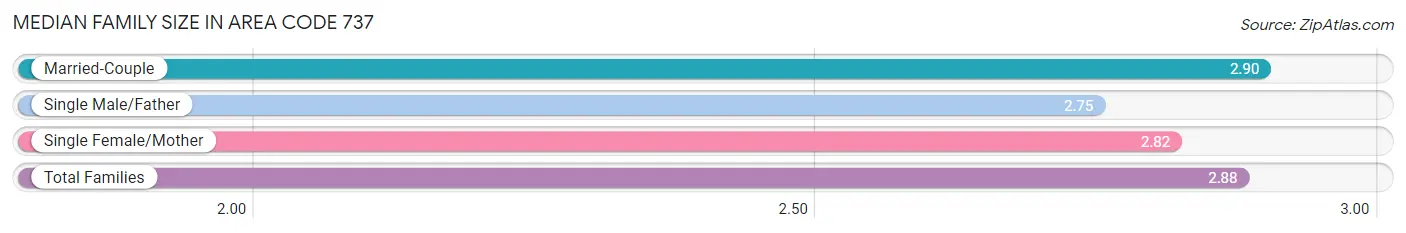
Median Family Size in Area Code 737
The median family size in Area Code 737 is 2.88 persons per family, with married-couple families (98,506 | 78.8%) accounting for the largest median family size of 2.89666 persons per family. On the other hand, single male/father families (7,965 | 6.4%) represent the smallest median family size with 2.75 persons per family.
| Family Type | # Families | Family Size |
| Married-Couple | 98,506 (78.8%) | 2.90 |
| Single Male/Father | 7,965 (6.4%) | 2.75 |
| Single Female/Mother | 18,464 (14.8%) | 2.82 |
| Total Families | 124,935 (100.0%) | 2.88 |
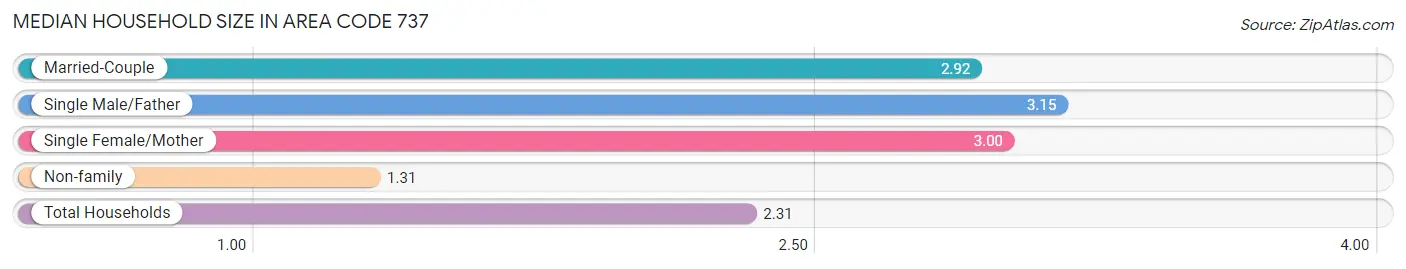
Median Household Size in Area Code 737
The median household size in Area Code 737 is 2.31 persons per household, with single male/father households (7,965 | 3.7%) accounting for the largest median household size of 3.14666 persons per household. non-family households (92,765 | 42.6%) represent the smallest median household size with 1.31 persons per household.
| Household Type | # Households | Household Size |
| Married-Couple | 98,506 (45.3%) | 2.92 |
| Single Male/Father | 7,965 (3.7%) | 3.15 |
| Single Female/Mother | 18,464 (8.5%) | 3.00 |
| Non-family | 92,765 (42.6%) | 1.31 |
| Total Households | 217,700 (100.0%) | 2.31 |
Household Size by Marriage Status in Area Code 737
Out of a total of 217,700 households in Area Code 737, 124,935 (57.4%) are family households, while 92,765 (42.6%) are nonfamily households. The most numerous type of family households are 2-person households, comprising 56,692, and the most common type of nonfamily households are 1-person households, comprising 69,049.
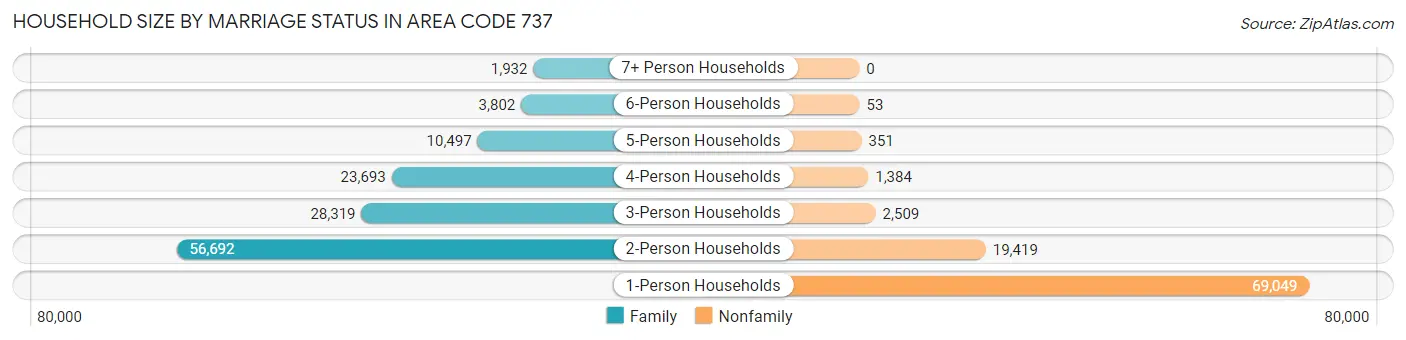
| Household Size | Family Households | Nonfamily Households |
| 1-Person Households | - | 69,049 (31.7%) |
| 2-Person Households | 56,692 (26.0%) | 19,419 (8.9%) |
| 3-Person Households | 28,319 (13.0%) | 2,509 (1.1%) |
| 4-Person Households | 23,693 (10.9%) | 1,384 (0.6%) |
| 5-Person Households | 10,497 (4.8%) | 351 (0.2%) |
| 6-Person Households | 3,802 (1.8%) | 53 (0.0%) |
| 7+ Person Households | 1,932 (0.9%) | 0 (0.0%) |
| Total | 124,935 (57.4%) | 92,765 (42.6%) |
Female Fertility in Area Code 737
Fertility by Age in Area Code 737
Average fertility rate in Area Code 737 is 45.7 births per 1,000 women. Women in the age bracket of 20 to 34 years have the highest fertility rate with 77.2 births per 1,000 women. Women in the age bracket of 20 to 34 years acount for 70.5% of all women with births.
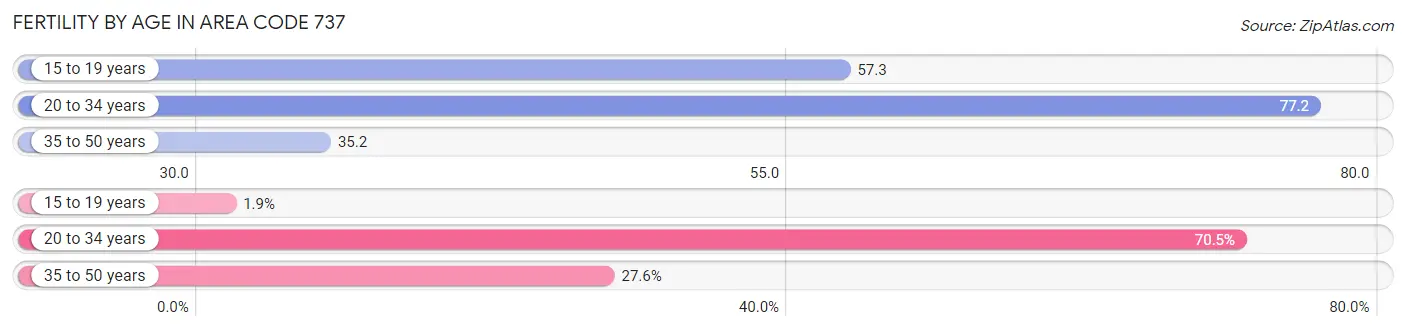
| Age Bracket | Women with Births | Births / 1,000 Women |
| 15 to 19 years | 127 (1.9%) | 57.2 |
| 20 to 34 years | 4,676 (70.5%) | 77.2 |
| 35 to 50 years | 1,830 (27.6%) | 35.2 |
| Total | 6,633 (100.0%) | 45.7 |
Fertility by Age by Marriage Status in Area Code 737
69.5% of women with births (6,633) in Area Code 737 are married. The highest percentage of unmarried women with births falls into 15 to 19 years age bracket with 74.8% of them unmarried at the time of birth, while the lowest percentage of unmarried women with births belong to 35 to 50 years age bracket with 32.8% of them unmarried.
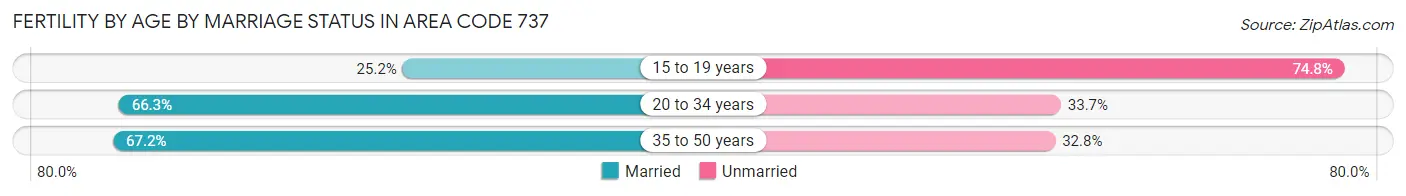
| Age Bracket | Married | Unmarried |
| 15 to 19 years | 32 (25.2%) | 95 (74.8%) |
| 20 to 34 years | 3,102 (66.3%) | 1,574 (33.7%) |
| 35 to 50 years | 1,229 (67.2%) | 601 (32.8%) |
| Total | 4,610 (69.5%) | 2,023 (30.5%) |
Fertility by Education in Area Code 737
Average fertility rate in Area Code 737 is 45.7 births per 1,000 women. Women with the education attainment of graduate degree have the highest fertility rate of 83.0 births per 1,000 women, while women with the education attainment of less than high school have the lowest fertility at 41.1 births per 1,000 women. Women with the education attainment of bachelor's degree represent 30.1% of all women with births.
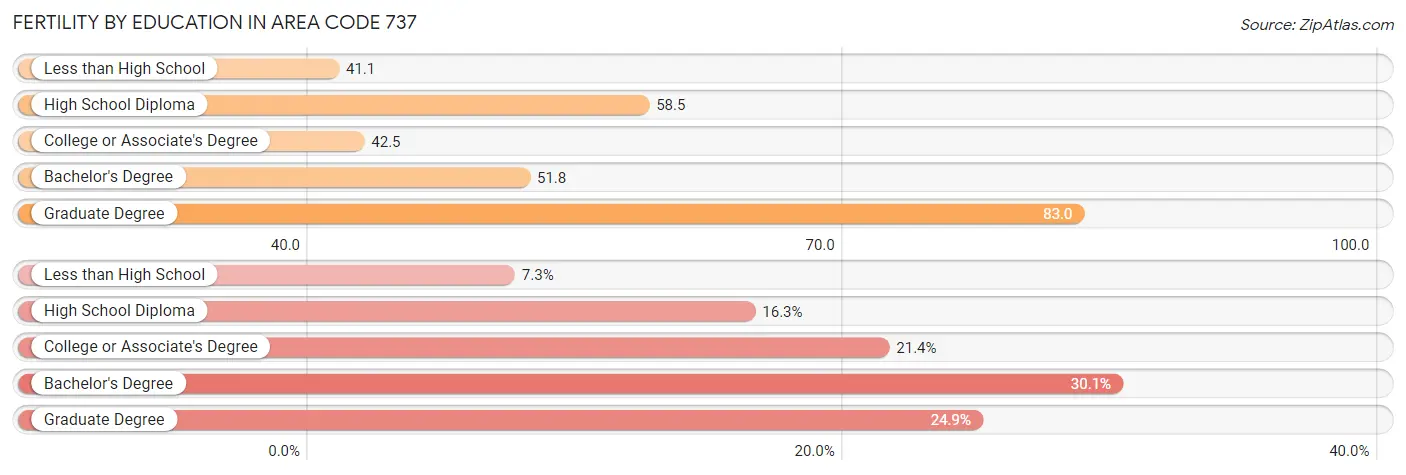
| Educational Attainment | Women with Births | Births / 1,000 Women |
| Less than High School | 486 (7.3%) | 41.1 |
| High School Diploma | 1,084 (16.3%) | 58.5 |
| College or Associate's Degree | 1,417 (21.4%) | 42.5 |
| Bachelor's Degree | 1,997 (30.1%) | 51.8 |
| Graduate Degree | 1,649 (24.9%) | 83.0 |
| Total | 6,633 (100.0%) | 45.7 |
Fertility by Education by Marriage Status in Area Code 737
30.5% of women with births in Area Code 737 are unmarried. Women with the educational attainment of graduate degree are most likely to be married with 90.7% of them married at childbirth, while women with the educational attainment of less than high school are least likely to be married with 83.3% of them unmarried at childbirth.
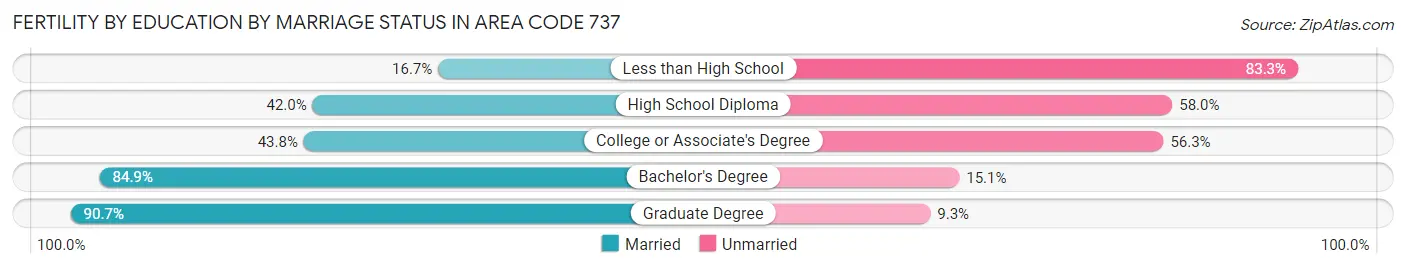
| Educational Attainment | Married | Unmarried |
| Less than High School | 81 (16.7%) | 405 (83.3%) |
| High School Diploma | 455 (42.0%) | 629 (58.0%) |
| College or Associate's Degree | 620 (43.8%) | 797 (56.2%) |
| Bachelor's Degree | 1,695 (84.9%) | 302 (15.1%) |
| Graduate Degree | 1,496 (90.7%) | 153 (9.3%) |
| Total | 4,610 (69.5%) | 2,023 (30.5%) |
Employment Characteristics in Area Code 737
Employment by Class of Employer in Area Code 737
Among the 281,997 employed individuals in Area Code 737, private company employees (193,952 | 68.8%), state government employees (18,949 | 6.7%), and self-employed (not incorporated) (18,188 | 6.5%) make up the most common classes of employment.
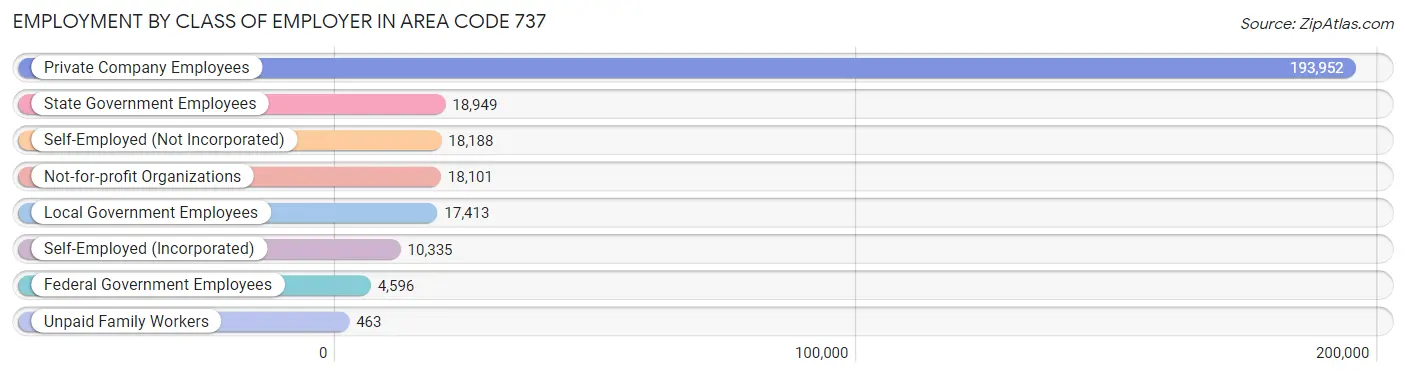
| Employer Class | # Employees | % Employees |
| Private Company Employees | 193,952 | 68.8% |
| Self-Employed (Incorporated) | 10,335 | 3.7% |
| Self-Employed (Not Incorporated) | 18,188 | 6.5% |
| Not-for-profit Organizations | 18,101 | 6.4% |
| Local Government Employees | 17,413 | 6.2% |
| State Government Employees | 18,949 | 6.7% |
| Federal Government Employees | 4,596 | 1.6% |
| Unpaid Family Workers | 463 | 0.2% |
| Total | 281,997 | 100.0% |
Employment Status by Age in Area Code 737
According to the labor force statistics for Area Code 737, out of the total population over 16 years of age (435,244), 64.3% or 279,818 individuals are in the labor force, with 4.5% or 12,676 of them unemployed. The age group with the highest labor force participation rate is 25 to 29 years, with 88.4% or 38,656 individuals in the labor force. Within the labor force, the 16 to 19 years age range has the highest percentage of unemployed individuals, with 258.5% or 34,518 of them being unemployed.
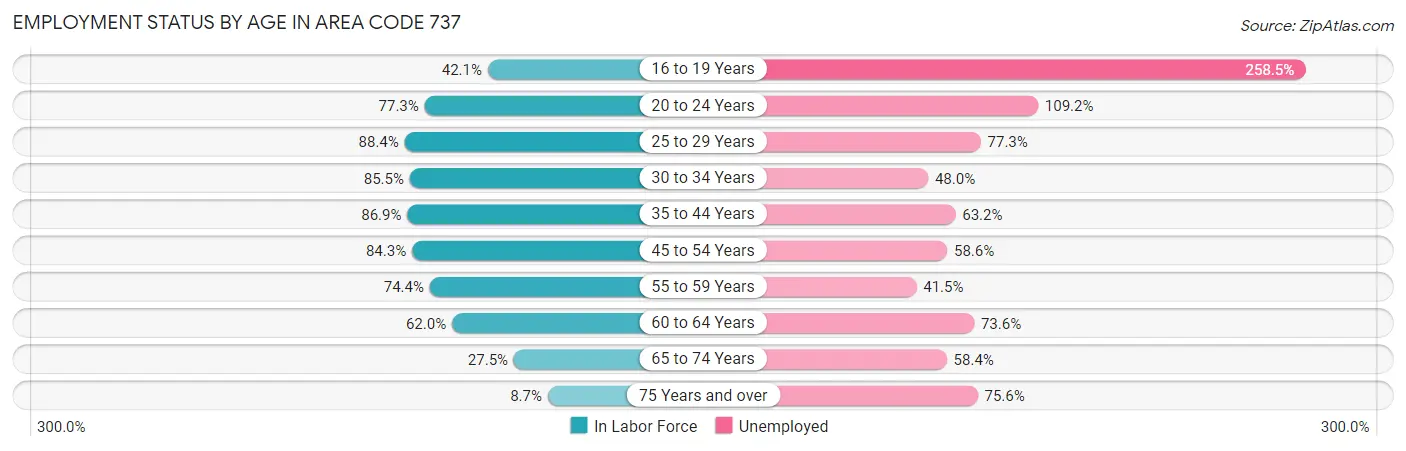
| Age Bracket | In Labor Force | Unemployed |
| 16 to 19 Years | 13,353 (42.0%) | 34,518 (258.5%) |
| 20 to 24 Years | 33,085 (77.3%) | 36,128 (109.2%) |
| 25 to 29 Years | 38,656 (88.4%) | 29,881 (77.3%) |
| 30 to 34 Years | 42,108 (85.5%) | 20,212 (48.0%) |
| 35 to 44 Years | 71,096 (86.9%) | 44,935 (63.2%) |
| 45 to 54 Years | 52,283 (84.3%) | 30,638 (58.6%) |
| 55 to 59 Years | 20,762 (74.4%) | 8,617 (41.5%) |
| 60 to 64 Years | 17,431 (62.0%) | 12,829 (73.6%) |
| 65 to 74 Years | 11,554 (27.5%) | 6,748 (58.4%) |
| 75 Years and over | 2,241 (8.7%) | 1,695 (75.6%) |
| Total | 279,835 (64.3%) | 12,666 (4.5%) |
Employment Status by Educational Attainment in Area Code 737
According to labor force statistics for Area Code 737, 83.4% of individuals (244,273) out of the total population between 25 and 64 years of age (292,858) are in the labor force, with 55.5% or 135,572 of them being unemployed. The group with the highest labor force participation rate are those with the educational attainment of bachelor's degree or higher, with 88.4% or 131,490 individuals in the labor force. Within the labor force, individuals with less than high school education have the highest percentage of unemployment, with 143.4% or 17,624 of them being unemployed.
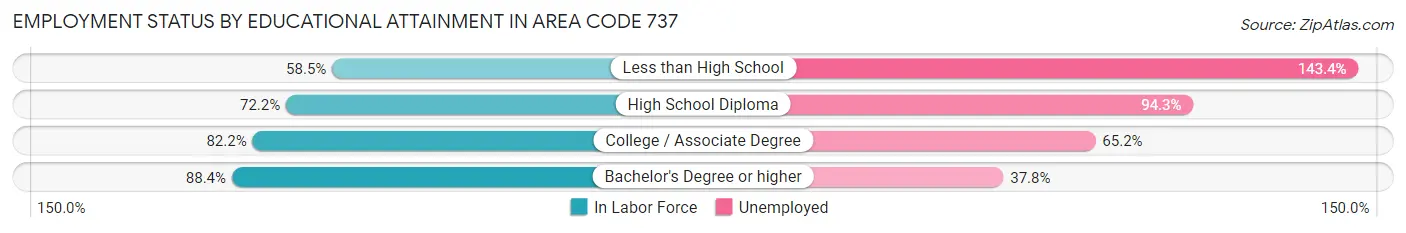
| Educational Attainment | In Labor Force | Unemployed |
| Less than High School | 12,289 (58.5%) | 30,110 (143.4%) |
| High School Diploma | 36,854 (72.2%) | 48,108 (94.3%) |
| College / Associate Degree | 59,249 (82.2%) | 46,977 (65.2%) |
| Bachelor's Degree or higher | 131,488 (88.4%) | 56,245 (37.8%) |
| Total | 244,280 (83.4%) | 162,536 (55.5%) |
Employment Occupations by Sex in Area Code 737
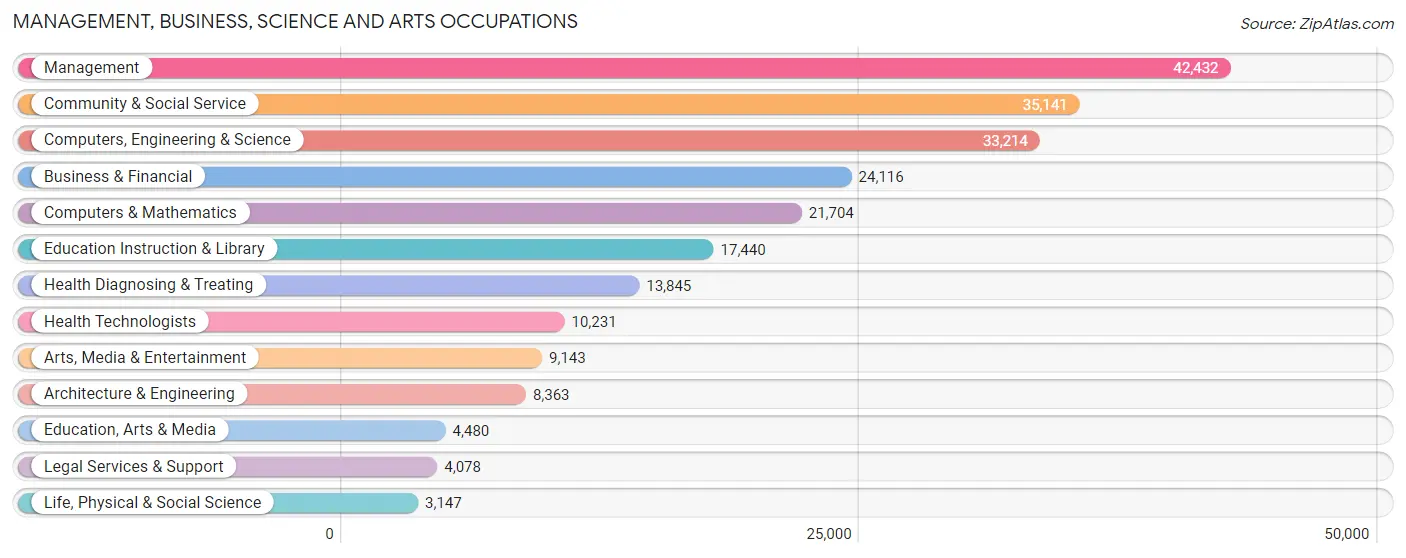
Management, Business, Science and Arts Occupations
The most common Management, Business, Science and Arts occupations in Area Code 737 are Management (42,432 | 14.9%), Community & Social Service (35,141 | 12.3%), Computers, Engineering & Science (33,214 | 11.7%), Business & Financial (24,116 | 8.5%), and Computers & Mathematics (21,704 | 7.6%).
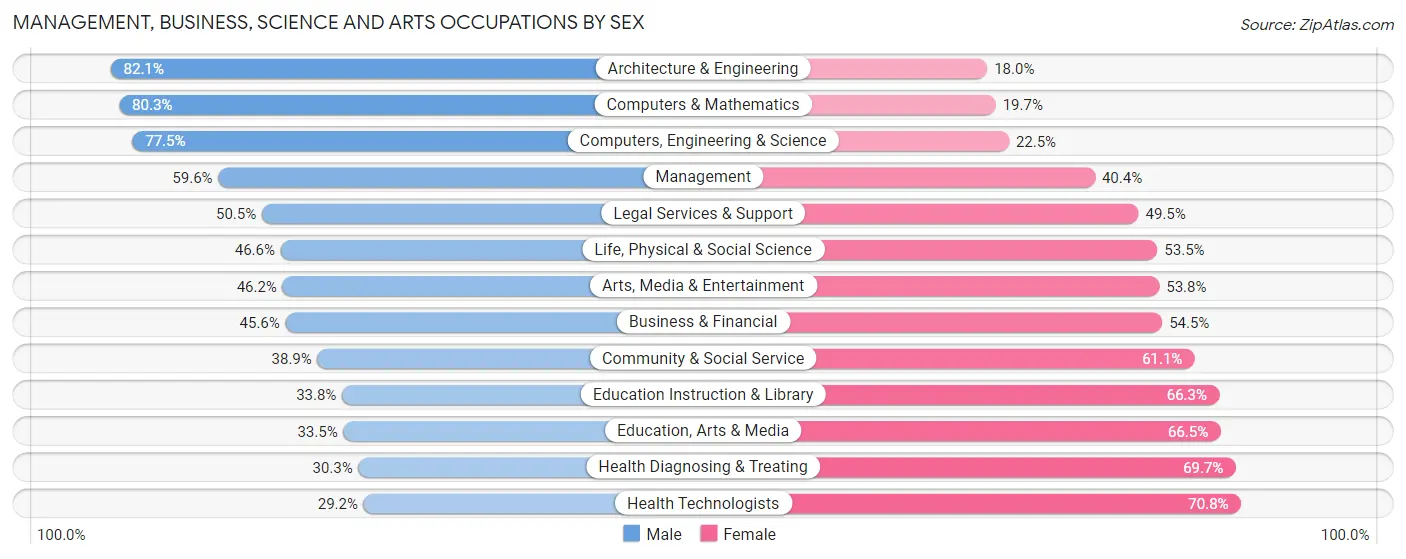
Management, Business, Science and Arts Occupations by Sex
Within the Management, Business, Science and Arts occupations in Area Code 737, the most male-oriented occupations are Architecture & Engineering (82.1%), Computers & Mathematics (80.3%), and Computers, Engineering & Science (77.5%), while the most female-oriented occupations are Health Technologists (70.8%), Health Diagnosing & Treating (69.7%), and Education, Arts & Media (66.5%).
| Occupation | Male | Female |
| Management | 25,275 (59.6%) | 17,157 (40.4%) |
| Business & Financial | 10,985 (45.6%) | 13,131 (54.4%) |
| Computers, Engineering & Science | 25,748 (77.5%) | 7,466 (22.5%) |
| Computers & Mathematics | 17,421 (80.3%) | 4,283 (19.7%) |
| Architecture & Engineering | 6,862 (82.1%) | 1,501 (17.9%) |
| Life, Physical & Social Science | 1,465 (46.6%) | 1,682 (53.4%) |
| Community & Social Service | 13,664 (38.9%) | 21,477 (61.1%) |
| Education, Arts & Media | 1,500 (33.5%) | 2,980 (66.5%) |
| Legal Services & Support | 2,058 (50.5%) | 2,020 (49.5%) |
| Education Instruction & Library | 5,886 (33.8%) | 11,554 (66.2%) |
| Arts, Media & Entertainment | 4,220 (46.2%) | 4,923 (53.8%) |
| Health Diagnosing & Treating | 4,199 (30.3%) | 9,646 (69.7%) |
| Health Technologists | 2,992 (29.2%) | 7,239 (70.8%) |
| Total (Category) | 79,871 (53.7%) | 68,877 (46.3%) |
| Total (Overall) | 153,042 (53.7%) | 131,995 (46.3%) |
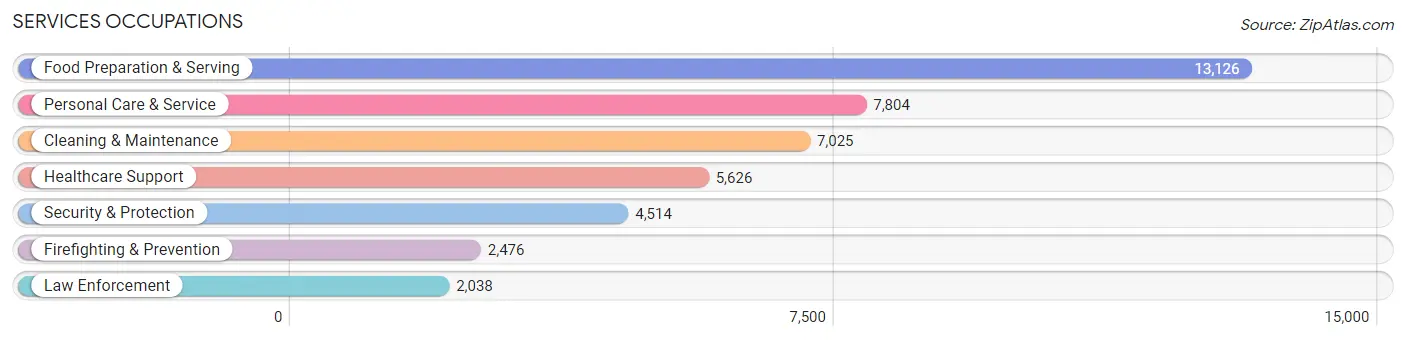
Services Occupations
The most common Services occupations in Area Code 737 are Food Preparation & Serving (13,126 | 4.6%), Personal Care & Service (7,804 | 2.7%), Cleaning & Maintenance (7,025 | 2.5%), Healthcare Support (5,626 | 2.0%), and Security & Protection (4,514 | 1.6%).
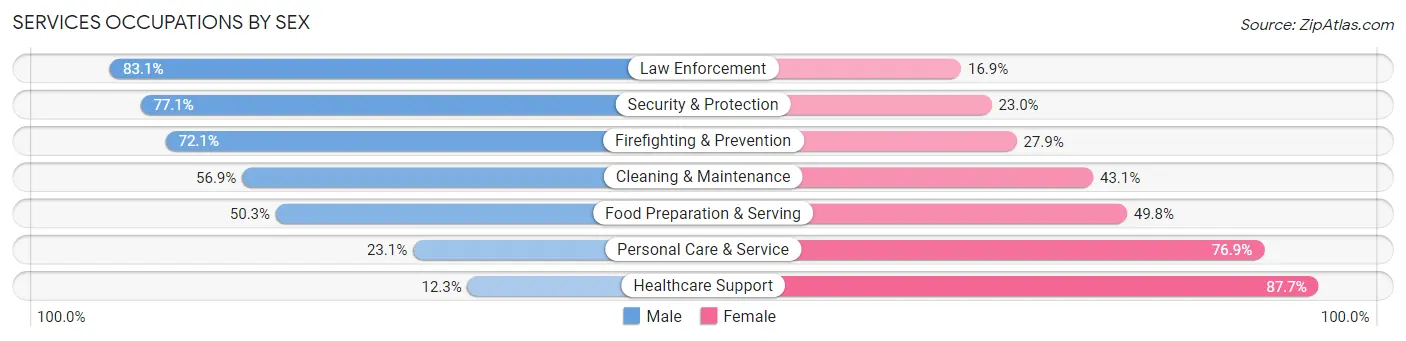
Services Occupations by Sex
Within the Services occupations in Area Code 737, the most male-oriented occupations are Law Enforcement (83.1%), Security & Protection (77.0%), and Firefighting & Prevention (72.1%), while the most female-oriented occupations are Healthcare Support (87.7%), Personal Care & Service (76.9%), and Food Preparation & Serving (49.7%).
| Occupation | Male | Female |
| Healthcare Support | 691 (12.3%) | 4,935 (87.7%) |
| Security & Protection | 3,478 (77.0%) | 1,036 (23.0%) |
| Firefighting & Prevention | 1,785 (72.1%) | 691 (27.9%) |
| Law Enforcement | 1,693 (83.1%) | 345 (16.9%) |
| Food Preparation & Serving | 6,596 (50.2%) | 6,530 (49.7%) |
| Cleaning & Maintenance | 3,999 (56.9%) | 3,026 (43.1%) |
| Personal Care & Service | 1,802 (23.1%) | 6,002 (76.9%) |
| Total (Category) | 16,566 (43.5%) | 21,529 (56.5%) |
| Total (Overall) | 153,042 (53.7%) | 131,995 (46.3%) |
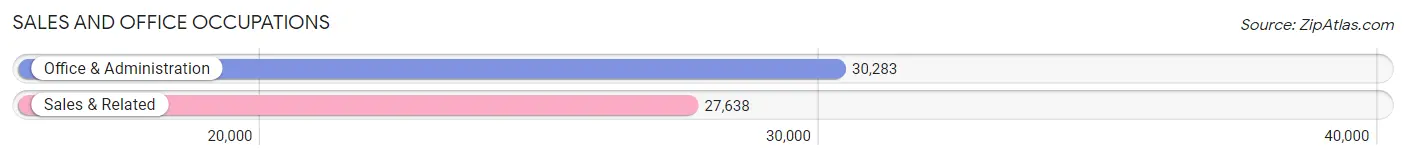
Sales and Office Occupations
The most common Sales and Office occupations in Area Code 737 are Office & Administration (30,283 | 10.6%), and Sales & Related (27,638 | 9.7%).
Sales and Office Occupations by Sex
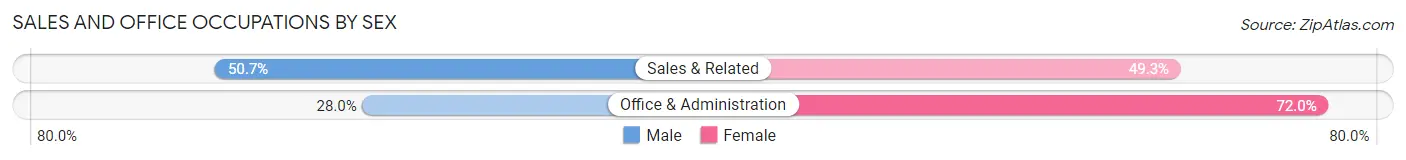
| Occupation | Male | Female |
| Sales & Related | 14,016 (50.7%) | 13,622 (49.3%) |
| Office & Administration | 8,481 (28.0%) | 21,802 (72.0%) |
| Total (Category) | 22,497 (38.8%) | 35,424 (61.2%) |
| Total (Overall) | 153,042 (53.7%) | 131,995 (46.3%) |
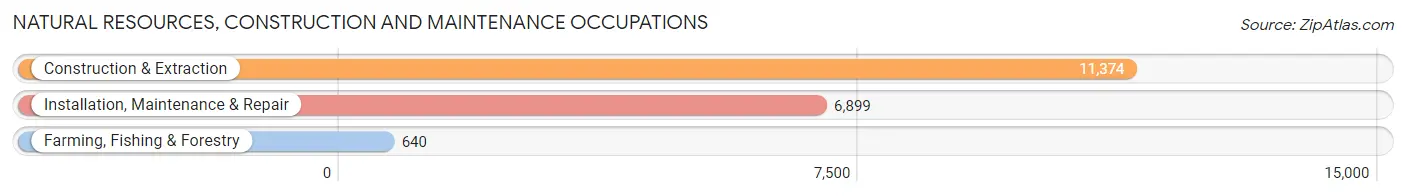
Natural Resources, Construction and Maintenance Occupations
The most common Natural Resources, Construction and Maintenance occupations in Area Code 737 are Construction & Extraction (11,374 | 4.0%), Installation, Maintenance & Repair (6,899 | 2.4%), and Farming, Fishing & Forestry (640 | 0.2%).
Natural Resources, Construction and Maintenance Occupations by Sex
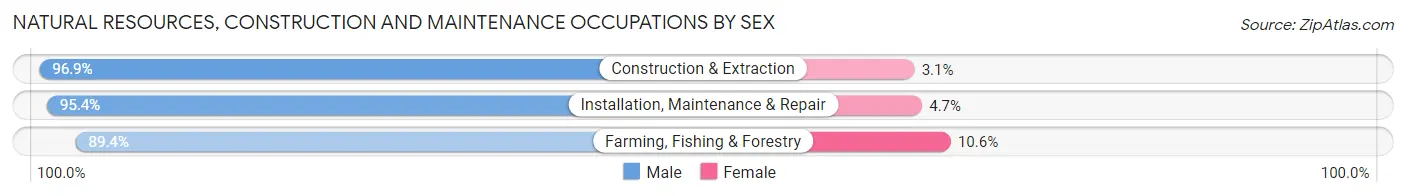
| Occupation | Male | Female |
| Farming, Fishing & Forestry | 572 (89.4%) | 68 (10.6%) |
| Construction & Extraction | 11,024 (96.9%) | 350 (3.1%) |
| Installation, Maintenance & Repair | 6,578 (95.4%) | 321 (4.6%) |
| Total (Category) | 18,174 (96.1%) | 739 (3.9%) |
| Total (Overall) | 153,042 (53.7%) | 131,995 (46.3%) |
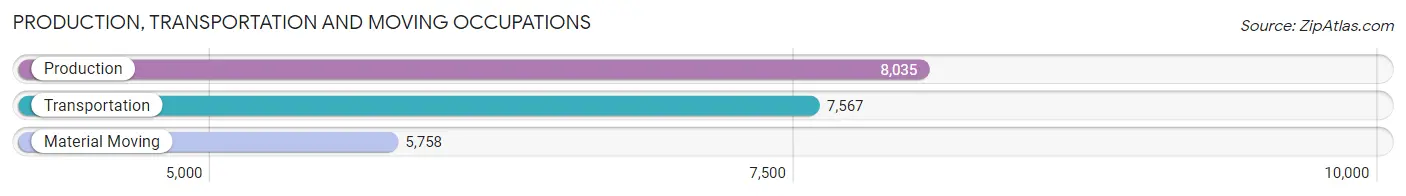
Production, Transportation and Moving Occupations
The most common Production, Transportation and Moving occupations in Area Code 737 are Production (8,035 | 2.8%), Transportation (7,567 | 2.6%), and Material Moving (5,758 | 2.0%).
Production, Transportation and Moving Occupations by Sex
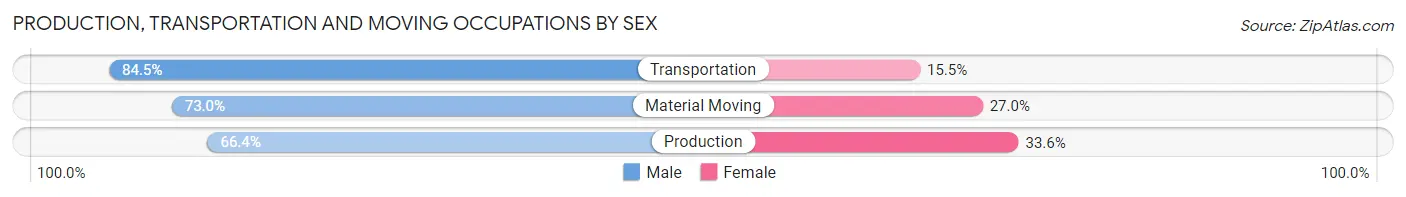
| Occupation | Male | Female |
| Production | 5,337 (66.4%) | 2,698 (33.6%) |
| Transportation | 6,394 (84.5%) | 1,173 (15.5%) |
| Material Moving | 4,203 (73.0%) | 1,555 (27.0%) |
| Total (Category) | 15,934 (74.6%) | 5,426 (25.4%) |
| Total (Overall) | 153,042 (53.7%) | 131,995 (46.3%) |
Employment Industries by Sex in Area Code 737
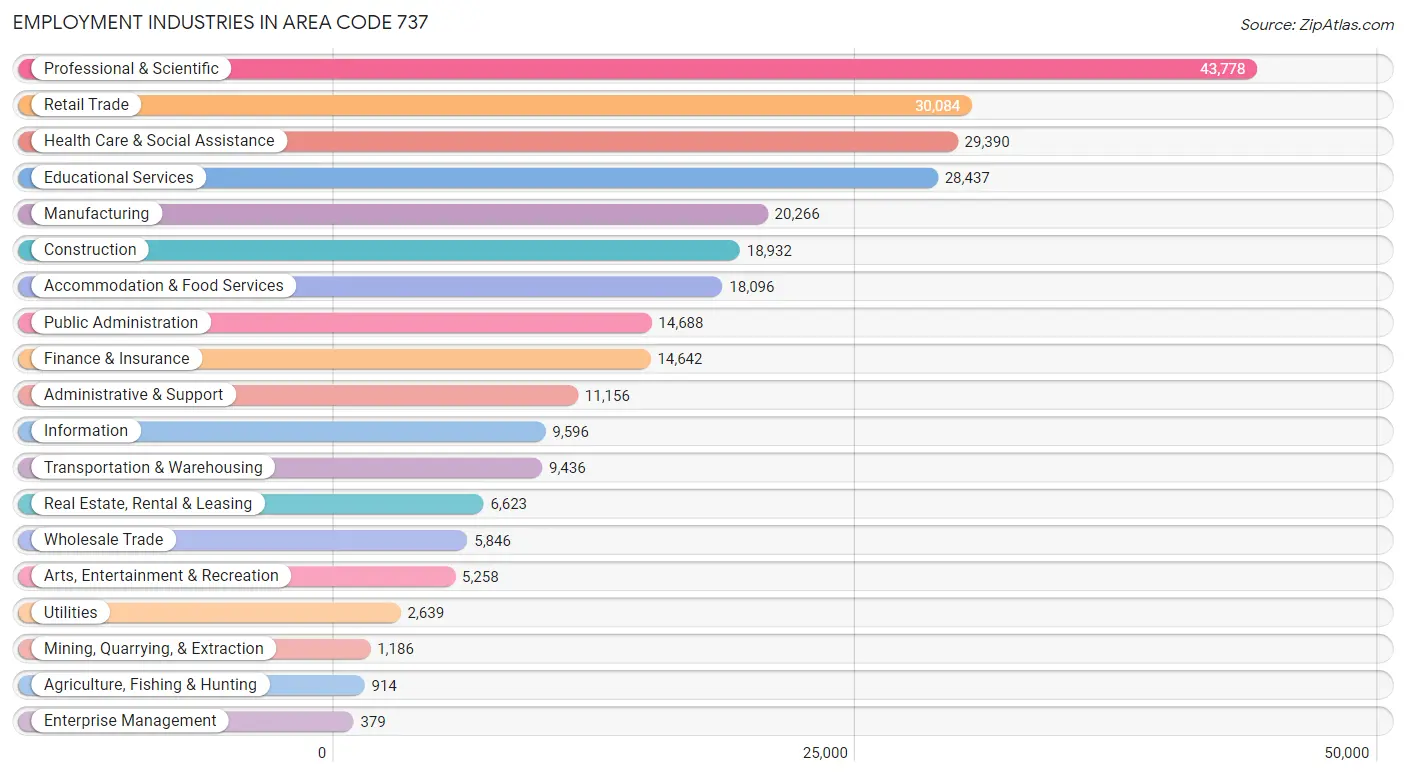
Employment Industries in Area Code 737
The major employment industries in Area Code 737 include Professional & Scientific (43,778 | 15.4%), Retail Trade (30,084 | 10.5%), Health Care & Social Assistance (29,390 | 10.3%), Educational Services (28,437 | 10.0%), and Manufacturing (20,266 | 7.1%).
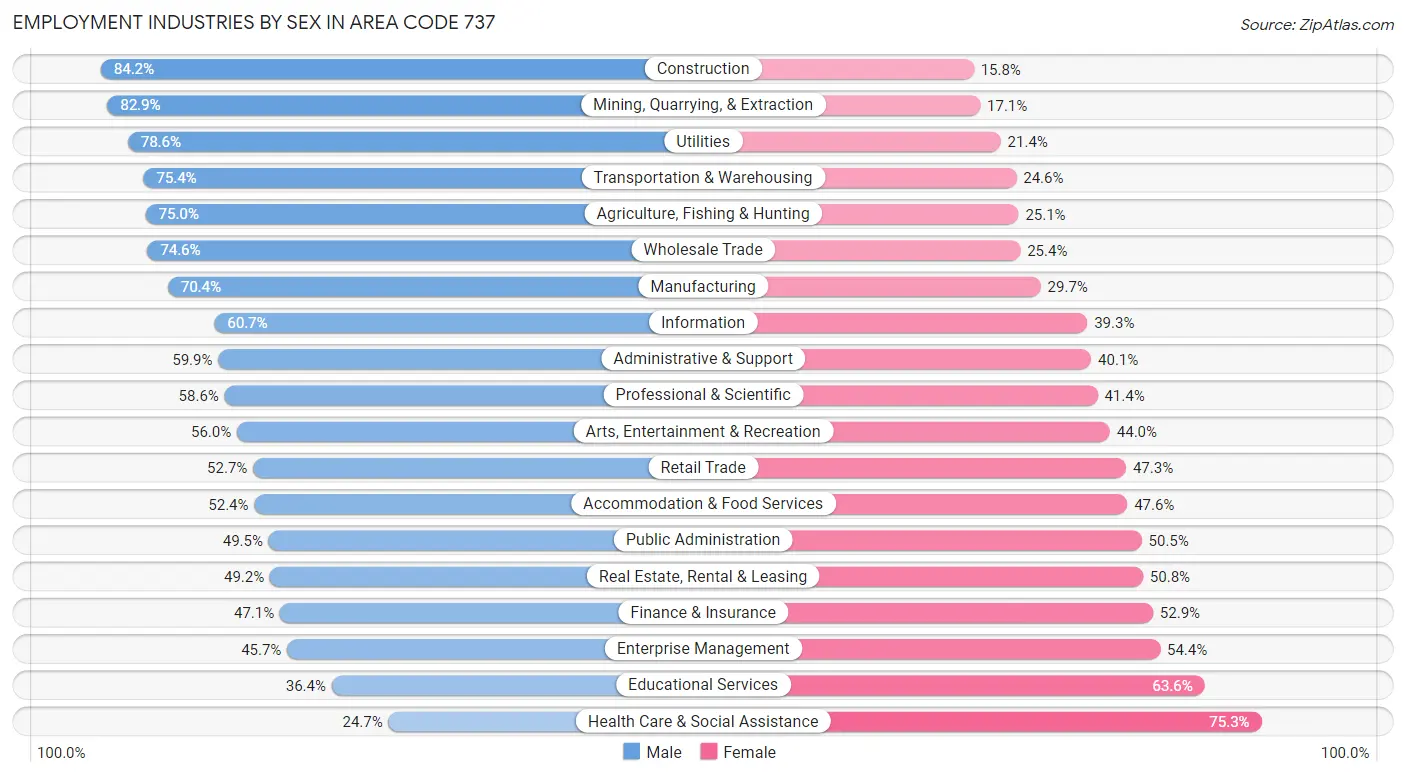
Employment Industries by Sex in Area Code 737
The Area Code 737 industries that see more men than women are Construction (84.2%), Mining, Quarrying, & Extraction (82.9%), and Utilities (78.6%), whereas the industries that tend to have a higher number of women are Health Care & Social Assistance (75.3%), Educational Services (63.6%), and Enterprise Management (54.3%).
| Industry | Male | Female |
| Agriculture, Fishing & Hunting | 685 (75.0%) | 229 (25.1%) |
| Mining, Quarrying, & Extraction | 983 (82.9%) | 203 (17.1%) |
| Construction | 15,943 (84.2%) | 2,989 (15.8%) |
| Manufacturing | 14,258 (70.4%) | 6,008 (29.6%) |
| Wholesale Trade | 4,360 (74.6%) | 1,486 (25.4%) |
| Retail Trade | 15,851 (52.7%) | 14,233 (47.3%) |
| Transportation & Warehousing | 7,115 (75.4%) | 2,321 (24.6%) |
| Utilities | 2,075 (78.6%) | 564 (21.4%) |
| Information | 5,826 (60.7%) | 3,770 (39.3%) |
| Finance & Insurance | 6,899 (47.1%) | 7,743 (52.9%) |
| Real Estate, Rental & Leasing | 3,258 (49.2%) | 3,365 (50.8%) |
| Professional & Scientific | 25,648 (58.6%) | 18,130 (41.4%) |
| Enterprise Management | 173 (45.7%) | 206 (54.3%) |
| Administrative & Support | 6,684 (59.9%) | 4,472 (40.1%) |
| Educational Services | 10,357 (36.4%) | 18,080 (63.6%) |
| Health Care & Social Assistance | 7,251 (24.7%) | 22,139 (75.3%) |
| Arts, Entertainment & Recreation | 2,946 (56.0%) | 2,312 (44.0%) |
| Accommodation & Food Services | 9,489 (52.4%) | 8,607 (47.6%) |
| Public Administration | 7,264 (49.5%) | 7,424 (50.5%) |
| Total | 153,042 (53.7%) | 131,995 (46.3%) |
Education in Area Code 737
School Enrollment in Area Code 737
The most common levels of schooling among the 135,002 students in Area Code 737 are college / undergraduate (44,799 | 33.2%), middle school (23,392 | 17.3%), and elementary school (23,262 | 17.2%).
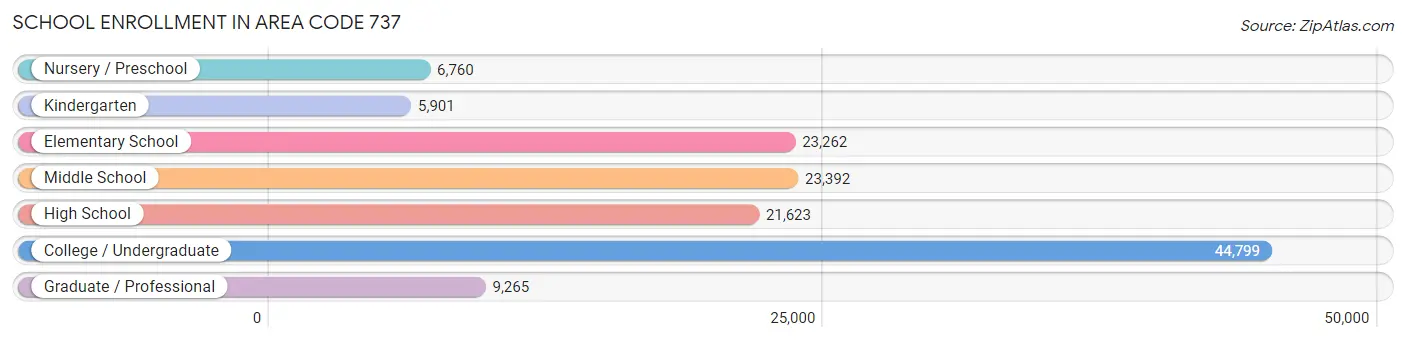
| School Level | # Students | % Students |
| Nursery / Preschool | 6,760 | 5.0% |
| Kindergarten | 5,901 | 4.4% |
| Elementary School | 23,262 | 17.2% |
| Middle School | 23,392 | 17.3% |
| High School | 21,623 | 16.0% |
| College / Undergraduate | 44,799 | 33.2% |
| Graduate / Professional | 9,265 | 6.9% |
| Total | 135,002 | 100.0% |
School Enrollment by Age by Funding Source in Area Code 737
Out of a total of 135,002 students who are enrolled in schools in Area Code 737, 20,734 (15.4%) attend a private institution, while the remaining 114,268 (84.6%) are enrolled in public schools. The age group of 3 to 4 year olds has the highest likelihood of being enrolled in private schools, with 2,220 (41.0% in the age bracket) enrolled. Conversely, the age group of 15 to 17 year olds has the lowest likelihood of being enrolled in a private school, with 14,335 (90.4% in the age bracket) attending a public institution.
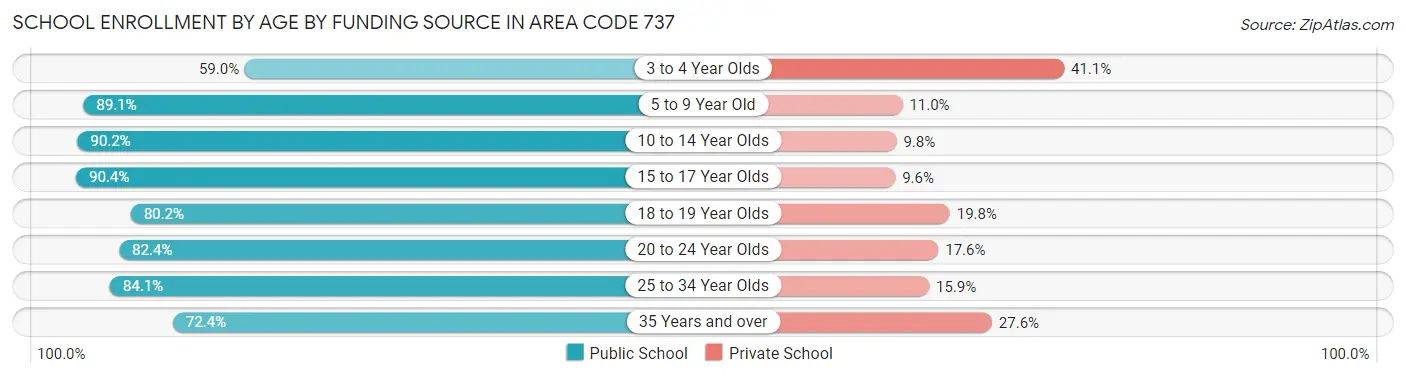
| Age Bracket | Public School | Private School |
| 3 to 4 Year Olds | 3,188 (59.0%) | 2,220 (41.0%) |
| 5 to 9 Year Old | 24,462 (89.0%) | 3,009 (11.0%) |
| 10 to 14 Year Olds | 25,670 (90.2%) | 2,802 (9.8%) |
| 15 to 17 Year Olds | 14,335 (90.4%) | 1,523 (9.6%) |
| 18 to 19 Year Olds | 14,534 (80.2%) | 3,582 (19.8%) |
| 20 to 24 Year Olds | 18,633 (82.4%) | 3,985 (17.6%) |
| 25 to 34 Year Olds | 7,737 (84.1%) | 1,463 (15.9%) |
| 35 Years and over | 5,689 (72.4%) | 2,170 (27.6%) |
| Total | 114,268 (84.6%) | 20,734 (15.4%) |
Educational Attainment by Field of Study in Area Code 737
Business (36,609 | 18.9%), engineering (18,415 | 9.5%), social sciences (15,960 | 8.2%), science & technology (14,852 | 7.7%), and education (14,776 | 7.6%) are the most common fields of study among 193,854 individuals in Area Code 737 who have obtained a bachelor's degree or higher.
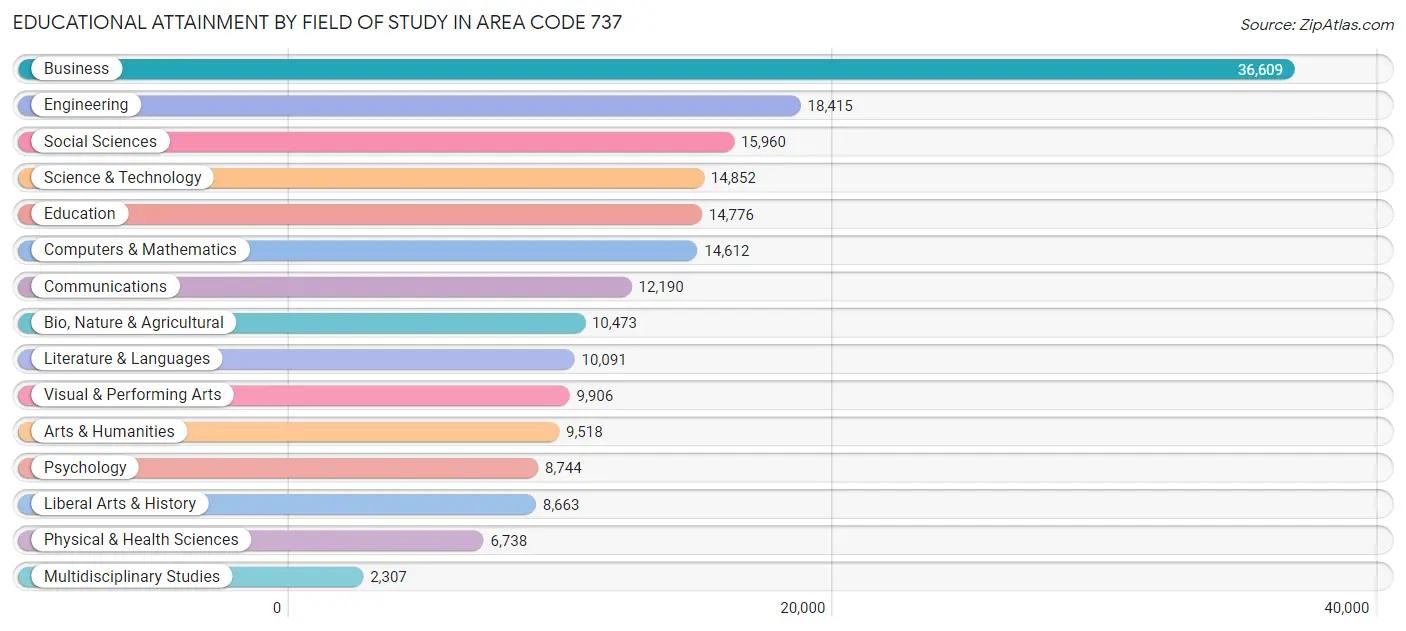
| Field of Study | # Graduates | % Graduates |
| Computers & Mathematics | 14,612 | 7.5% |
| Bio, Nature & Agricultural | 10,473 | 5.4% |
| Physical & Health Sciences | 6,738 | 3.5% |
| Psychology | 8,744 | 4.5% |
| Social Sciences | 15,960 | 8.2% |
| Engineering | 18,415 | 9.5% |
| Multidisciplinary Studies | 2,307 | 1.2% |
| Science & Technology | 14,852 | 7.7% |
| Business | 36,609 | 18.9% |
| Education | 14,776 | 7.6% |
| Literature & Languages | 10,091 | 5.2% |
| Liberal Arts & History | 8,663 | 4.5% |
| Visual & Performing Arts | 9,906 | 5.1% |
| Communications | 12,190 | 6.3% |
| Arts & Humanities | 9,518 | 4.9% |
| Total | 193,854 | 100.0% |
Transportation & Commute in Area Code 737
Vehicle Availability by Sex in Area Code 737
The most prevalent vehicle ownership categories in Area Code 737 are males with 2 vehicles (68,090, accounting for 45.5%) and females with 2 vehicles (56,489, making up 53.7%).
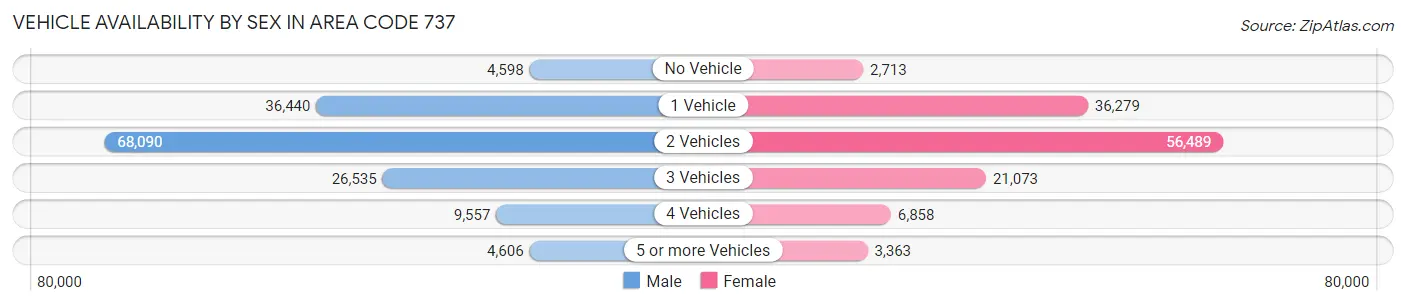
| Vehicles Available | Male | Female |
| No Vehicle | 4,598 (3.1%) | 2,713 (2.1%) |
| 1 Vehicle | 36,440 (24.3%) | 36,279 (28.6%) |
| 2 Vehicles | 68,090 (45.5%) | 56,489 (44.6%) |
| 3 Vehicles | 26,535 (17.7%) | 21,073 (16.6%) |
| 4 Vehicles | 9,557 (6.4%) | 6,858 (5.4%) |
| 5 or more Vehicles | 4,606 (3.1%) | 3,363 (2.6%) |
| Total | 149,826 (100.0%) | 126,775 (100.0%) |
Commute Time in Area Code 737
The most frequently occuring commute durations in Area Code 737 are 15 to 19 minutes (34,224 commuters, 15.5%), 30 to 34 minutes (31,614 commuters, 14.4%), and 20 to 24 minutes (29,885 commuters, 13.6%).
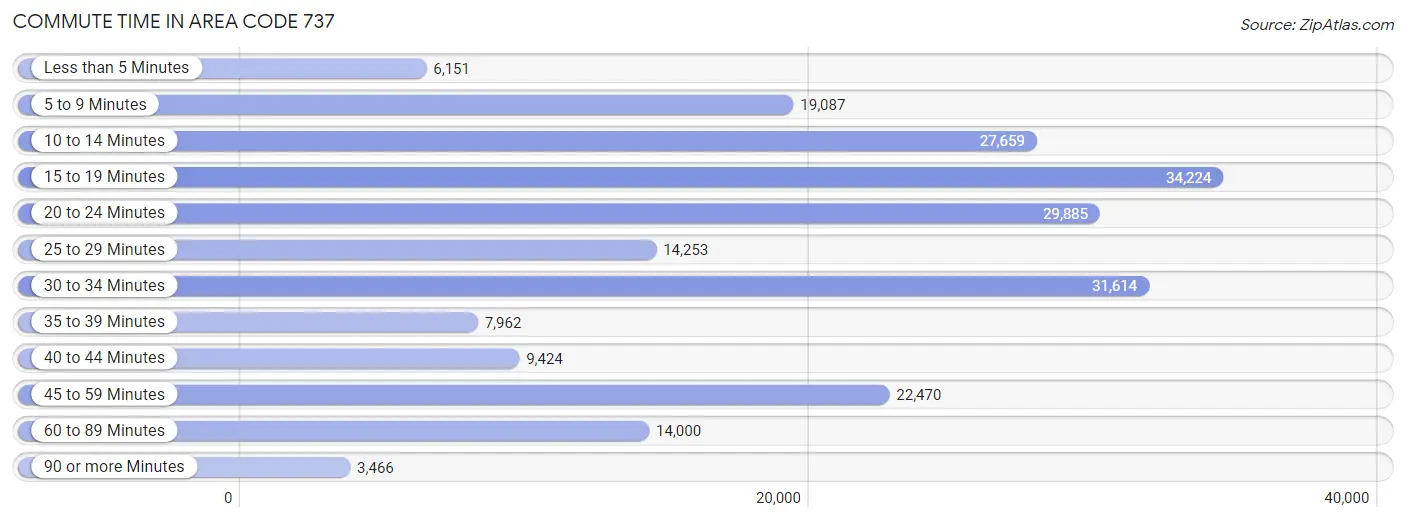
| Commute Time | # Commuters | % Commuters |
| Less than 5 Minutes | 6,151 | 2.8% |
| 5 to 9 Minutes | 19,087 | 8.7% |
| 10 to 14 Minutes | 27,659 | 12.6% |
| 15 to 19 Minutes | 34,224 | 15.5% |
| 20 to 24 Minutes | 29,885 | 13.6% |
| 25 to 29 Minutes | 14,253 | 6.5% |
| 30 to 34 Minutes | 31,614 | 14.4% |
| 35 to 39 Minutes | 7,962 | 3.6% |
| 40 to 44 Minutes | 9,424 | 4.3% |
| 45 to 59 Minutes | 22,470 | 10.2% |
| 60 to 89 Minutes | 14,000 | 6.4% |
| 90 or more Minutes | 3,466 | 1.6% |
Commute Time by Sex in Area Code 737
The most common commute times in Area Code 737 are 30 to 34 minutes (19,165 commuters, 16.0%) for males and 15 to 19 minutes (16,317 commuters, 16.3%) for females.
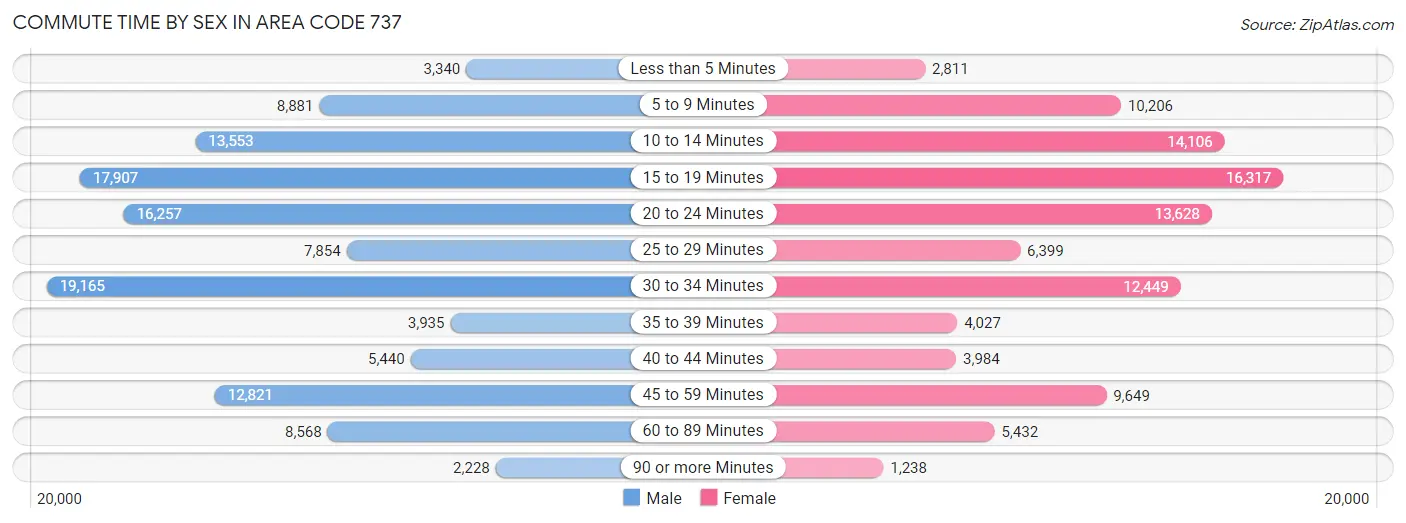
| Commute Time | Male | Female |
| Less than 5 Minutes | 3,340 (2.8%) | 2,811 (2.8%) |
| 5 to 9 Minutes | 8,881 (7.4%) | 10,206 (10.2%) |
| 10 to 14 Minutes | 13,553 (11.3%) | 14,106 (14.1%) |
| 15 to 19 Minutes | 17,907 (14.9%) | 16,317 (16.3%) |
| 20 to 24 Minutes | 16,257 (13.6%) | 13,628 (13.6%) |
| 25 to 29 Minutes | 7,854 (6.6%) | 6,399 (6.4%) |
| 30 to 34 Minutes | 19,165 (16.0%) | 12,449 (12.4%) |
| 35 to 39 Minutes | 3,935 (3.3%) | 4,027 (4.0%) |
| 40 to 44 Minutes | 5,440 (4.5%) | 3,984 (4.0%) |
| 45 to 59 Minutes | 12,821 (10.7%) | 9,649 (9.6%) |
| 60 to 89 Minutes | 8,568 (7.1%) | 5,432 (5.4%) |
| 90 or more Minutes | 2,228 (1.9%) | 1,238 (1.2%) |
Time of Departure to Work by Sex in Area Code 737
The most frequent times of departure to work in Area Code 737 are 7:00 AM to 7:29 AM (17,595, 14.7%) for males and 7:00 AM to 7:29 AM (15,268, 15.2%) for females.
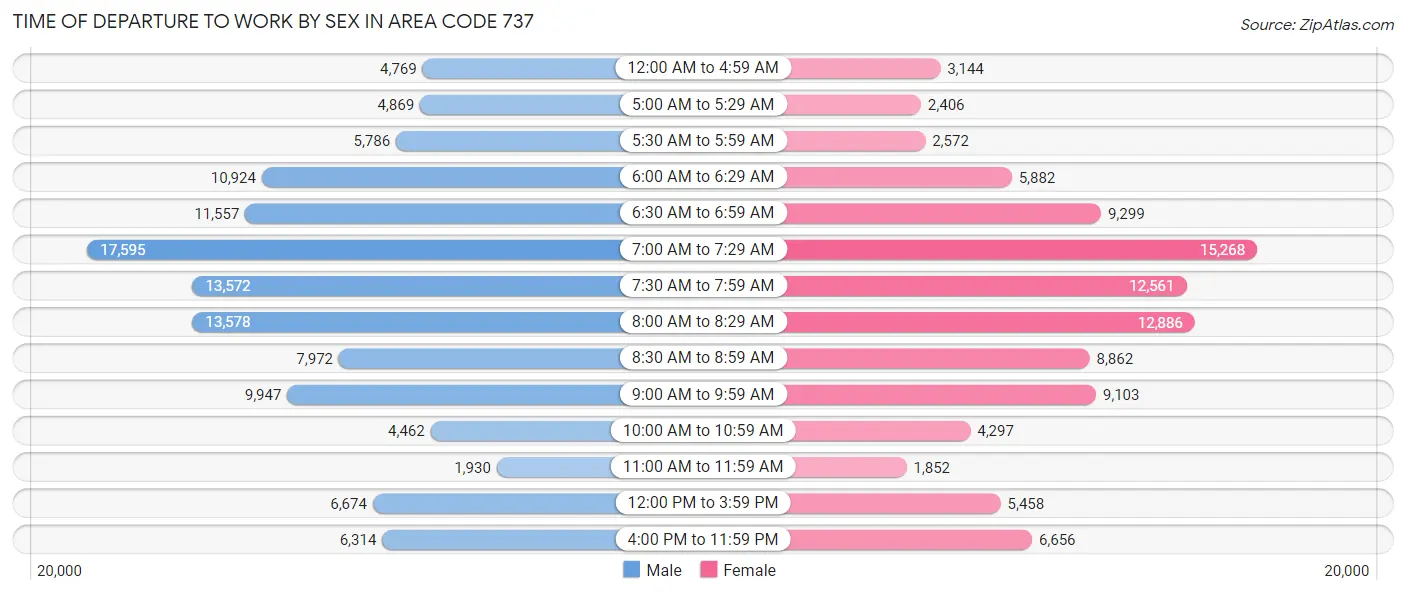
| Time of Departure | Male | Female |
| 12:00 AM to 4:59 AM | 4,769 (4.0%) | 3,144 (3.1%) |
| 5:00 AM to 5:29 AM | 4,869 (4.1%) | 2,406 (2.4%) |
| 5:30 AM to 5:59 AM | 5,786 (4.8%) | 2,572 (2.6%) |
| 6:00 AM to 6:29 AM | 10,924 (9.1%) | 5,882 (5.9%) |
| 6:30 AM to 6:59 AM | 11,557 (9.6%) | 9,299 (9.3%) |
| 7:00 AM to 7:29 AM | 17,595 (14.7%) | 15,268 (15.2%) |
| 7:30 AM to 7:59 AM | 13,572 (11.3%) | 12,561 (12.5%) |
| 8:00 AM to 8:29 AM | 13,578 (11.3%) | 12,886 (12.9%) |
| 8:30 AM to 8:59 AM | 7,972 (6.7%) | 8,862 (8.8%) |
| 9:00 AM to 9:59 AM | 9,947 (8.3%) | 9,103 (9.1%) |
| 10:00 AM to 10:59 AM | 4,462 (3.7%) | 4,297 (4.3%) |
| 11:00 AM to 11:59 AM | 1,930 (1.6%) | 1,852 (1.8%) |
| 12:00 PM to 3:59 PM | 6,674 (5.6%) | 5,458 (5.4%) |
| 4:00 PM to 11:59 PM | 6,314 (5.3%) | 6,656 (6.6%) |
| Total | 119,949 (100.0%) | 100,246 (100.0%) |
Housing Occupancy in Area Code 737
Occupancy by Ownership in Area Code 737
Of the total 217,700 dwellings in Area Code 737, owner-occupied units account for 122,155 (56.1%), while renter-occupied units make up 95,545 (43.9%).
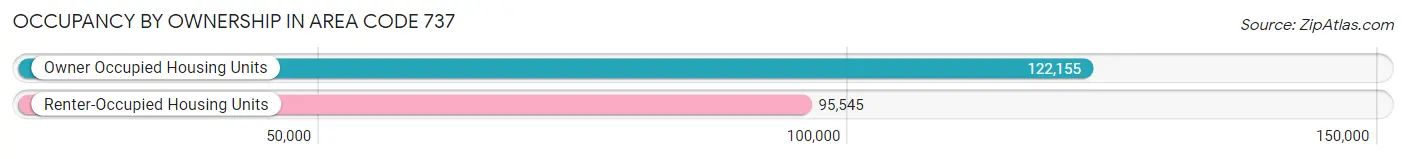
| Occupancy | # Housing Units | % Housing Units |
| Owner Occupied Housing Units | 122,155 | 56.1% |
| Renter-Occupied Housing Units | 95,545 | 43.9% |
| Total Occupied Housing Units | 217,700 | 100.0% |
Occupancy by Household Size in Area Code 737
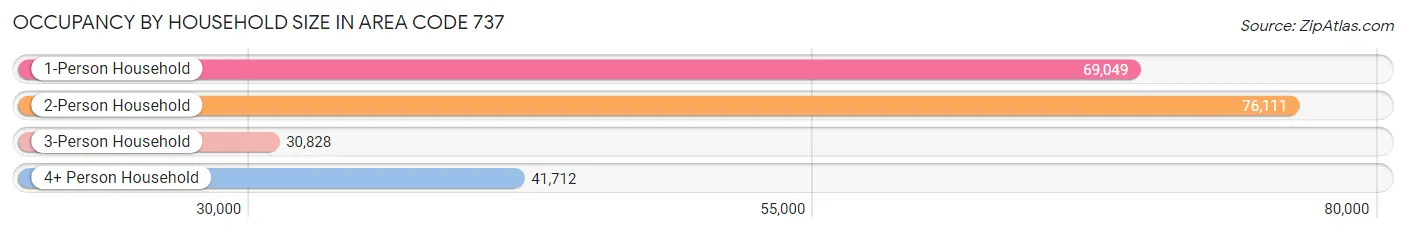
| Household Size | # Housing Units | % Housing Units |
| 1-Person Household | 69,049 | 31.7% |
| 2-Person Household | 76,111 | 35.0% |
| 3-Person Household | 30,828 | 14.2% |
| 4+ Person Household | 41,712 | 19.2% |
| Total Housing Units | 217,700 | 100.0% |
Occupancy by Ownership by Household Size in Area Code 737
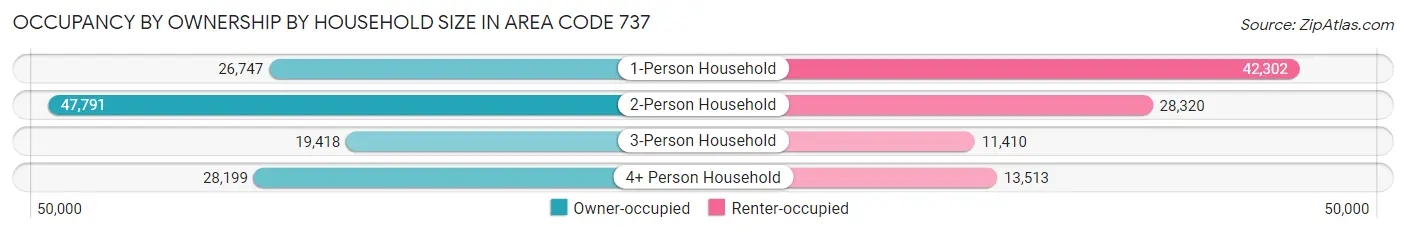
| Household Size | Owner-occupied | Renter-occupied |
| 1-Person Household | 26,747 (38.7%) | 42,302 (61.3%) |
| 2-Person Household | 47,791 (62.8%) | 28,320 (37.2%) |
| 3-Person Household | 19,418 (63.0%) | 11,410 (37.0%) |
| 4+ Person Household | 28,199 (67.6%) | 13,513 (32.4%) |
| Total Housing Units | 122,155 (56.1%) | 95,545 (43.9%) |
Occupancy by Educational Attainment in Area Code 737
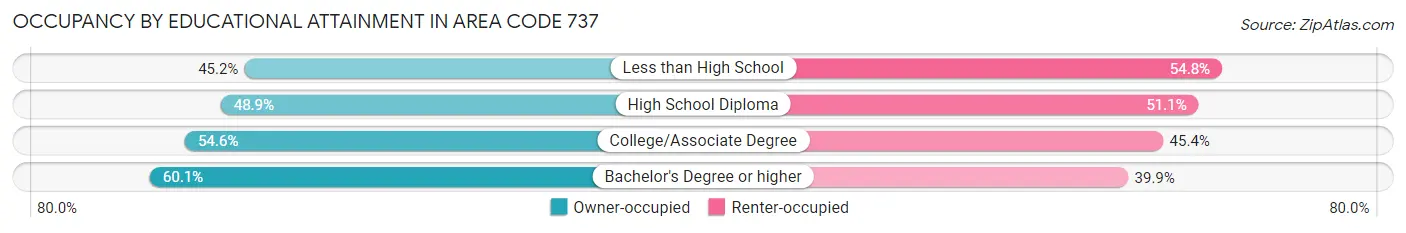
| Household Size | Owner-occupied | Renter-occupied |
| Less than High School | 5,877 (45.2%) | 7,135 (54.8%) |
| High School Diploma | 15,553 (48.9%) | 16,265 (51.1%) |
| College/Associate Degree | 31,453 (54.6%) | 26,194 (45.4%) |
| Bachelor's Degree or higher | 69,272 (60.1%) | 45,951 (39.9%) |
Occupancy by Age of Householder in Area Code 737
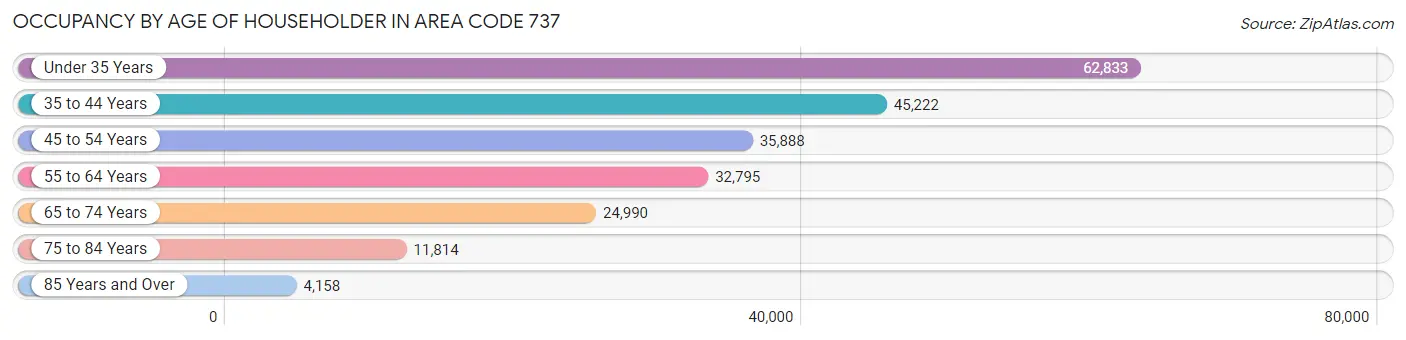
| Age Bracket | # Households | % Households |
| Under 35 Years | 62,833 | 28.9% |
| 35 to 44 Years | 45,222 | 20.8% |
| 45 to 54 Years | 35,888 | 16.5% |
| 55 to 64 Years | 32,795 | 15.1% |
| 65 to 74 Years | 24,990 | 11.5% |
| 75 to 84 Years | 11,814 | 5.4% |
| 85 Years and Over | 4,158 | 1.9% |
| Total | 217,700 | 100.0% |
Housing Finances in Area Code 737
Median Income by Occupancy in Area Code 737
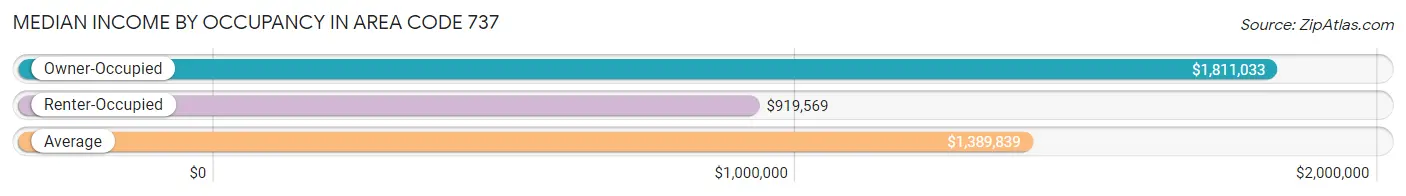
| Occupancy Type | # Households | Median Income |
| Owner-Occupied | 122,155 (56.1%) | $1,811,033 |
| Renter-Occupied | 95,545 (43.9%) | $919,569 |
| Average | 217,700 (100.0%) | $1,389,839 |
Occupancy by Householder Income Bracket in Area Code 737
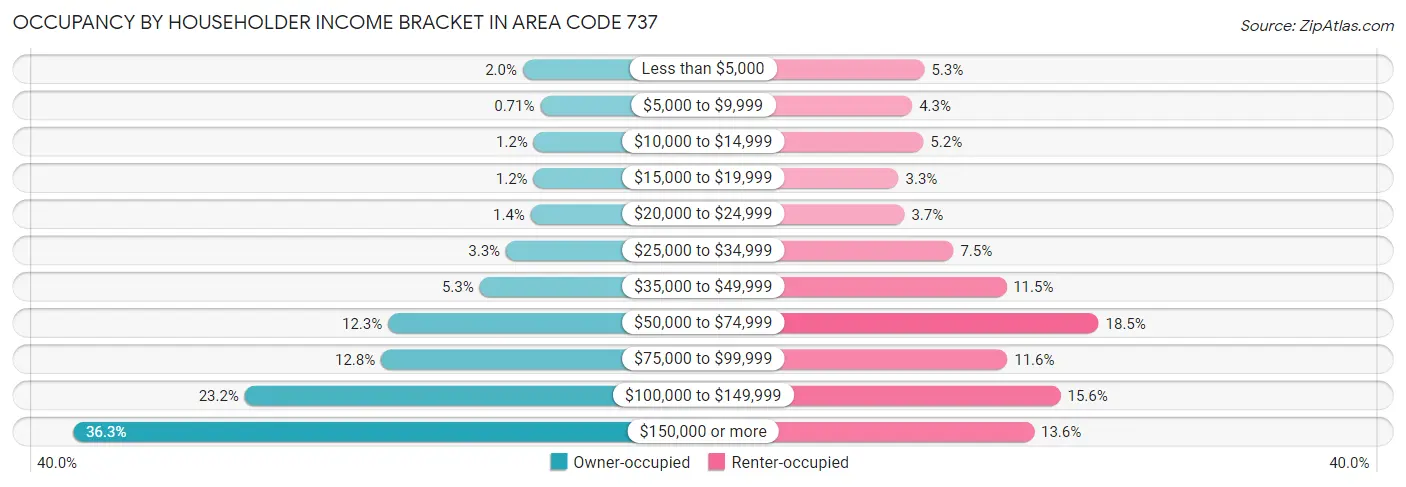
| Income Bracket | Owner-occupied | Renter-occupied |
| Less than $5,000 | 2,496 (2.0%) | 5,014 (5.2%) |
| $5,000 to $9,999 | 870 (0.7%) | 4,128 (4.3%) |
| $10,000 to $14,999 | 1,476 (1.2%) | 4,942 (5.2%) |
| $15,000 to $19,999 | 1,505 (1.2%) | 3,133 (3.3%) |
| $20,000 to $24,999 | 1,757 (1.4%) | 3,563 (3.7%) |
| $25,000 to $34,999 | 4,068 (3.3%) | 7,126 (7.5%) |
| $35,000 to $49,999 | 6,523 (5.3%) | 10,973 (11.5%) |
| $50,000 to $74,999 | 15,042 (12.3%) | 17,694 (18.5%) |
| $75,000 to $99,999 | 15,688 (12.8%) | 11,049 (11.6%) |
| $100,000 to $149,999 | 28,381 (23.2%) | 14,925 (15.6%) |
| $150,000 or more | 44,349 (36.3%) | 12,998 (13.6%) |
| Total | 122,155 (100.0%) | 95,545 (100.0%) |
Monthly Housing Cost Tiers in Area Code 737
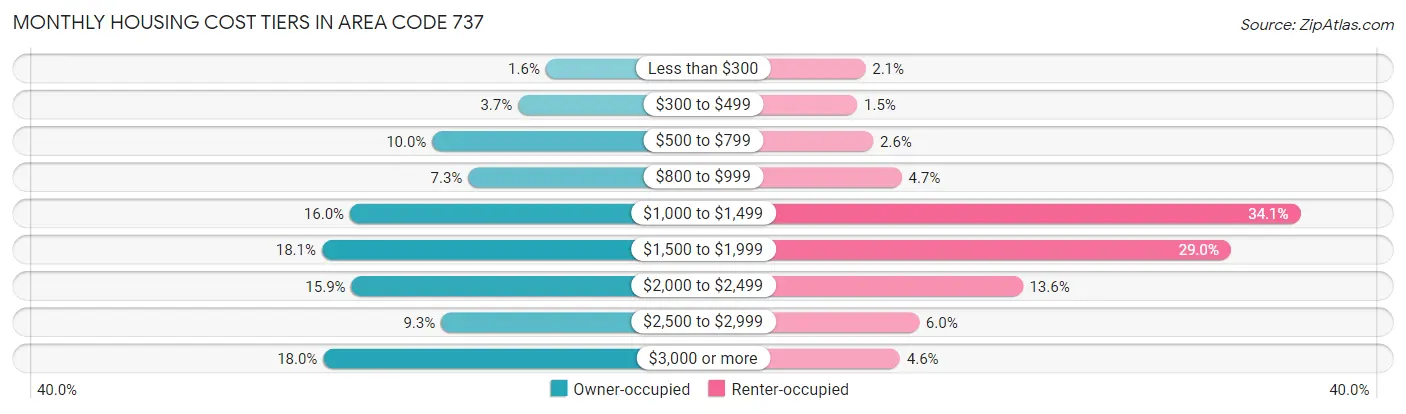
| Monthly Cost | Owner-occupied | Renter-occupied |
| Less than $300 | 1,981 (1.6%) | 1,963 (2.1%) |
| $300 to $499 | 4,468 (3.7%) | 1,388 (1.5%) |
| $500 to $799 | 12,188 (10.0%) | 2,516 (2.6%) |
| $800 to $999 | 8,956 (7.3%) | 4,514 (4.7%) |
| $1,000 to $1,499 | 19,589 (16.0%) | 32,575 (34.1%) |
| $1,500 to $1,999 | 22,118 (18.1%) | 27,682 (29.0%) |
| $2,000 to $2,499 | 19,456 (15.9%) | 13,021 (13.6%) |
| $2,500 to $2,999 | 11,399 (9.3%) | 5,731 (6.0%) |
| $3,000 or more | 22,000 (18.0%) | 4,398 (4.6%) |
| Total | 122,155 (100.0%) | 95,545 (100.0%) |
Physical Housing Characteristics in Area Code 737
Housing Structures in Area Code 737
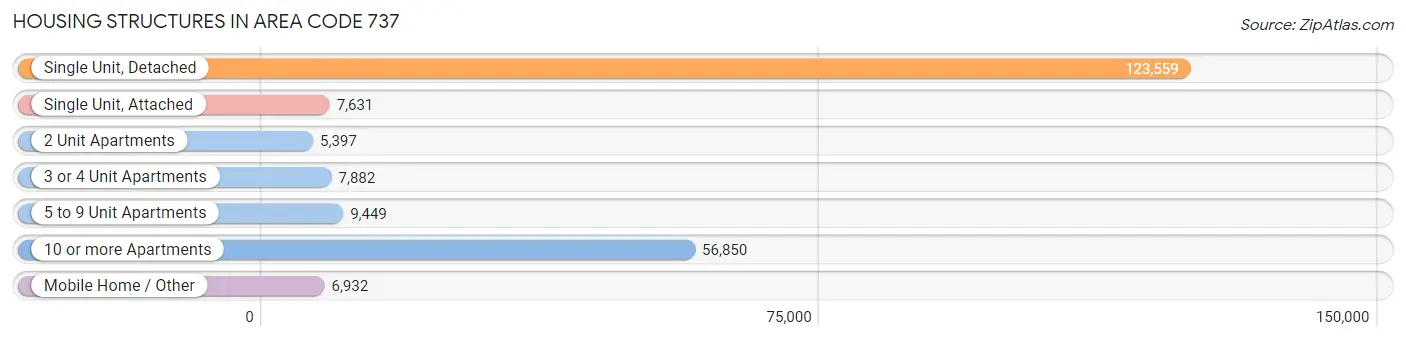
| Structure Type | # Housing Units | % Housing Units |
| Single Unit, Detached | 123,559 | 56.8% |
| Single Unit, Attached | 7,631 | 3.5% |
| 2 Unit Apartments | 5,397 | 2.5% |
| 3 or 4 Unit Apartments | 7,882 | 3.6% |
| 5 to 9 Unit Apartments | 9,449 | 4.3% |
| 10 or more Apartments | 56,850 | 26.1% |
| Mobile Home / Other | 6,932 | 3.2% |
| Total | 217,700 | 100.0% |
Housing Structures by Occupancy in Area Code 737
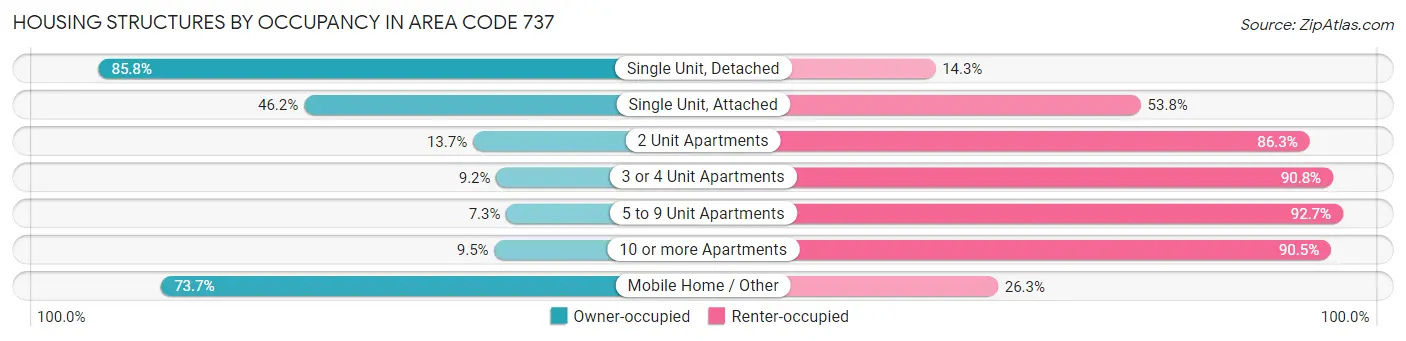
| Structure Type | Owner-occupied | Renter-occupied |
| Single Unit, Detached | 105,951 (85.8%) | 17,608 (14.2%) |
| Single Unit, Attached | 3,525 (46.2%) | 4,106 (53.8%) |
| 2 Unit Apartments | 738 (13.7%) | 4,659 (86.3%) |
| 3 or 4 Unit Apartments | 723 (9.2%) | 7,159 (90.8%) |
| 5 to 9 Unit Apartments | 686 (7.3%) | 8,763 (92.7%) |
| 10 or more Apartments | 5,424 (9.5%) | 51,426 (90.5%) |
| Mobile Home / Other | 5,108 (73.7%) | 1,824 (26.3%) |
| Total | 122,155 (56.1%) | 95,545 (43.9%) |
Housing Structures by Number of Rooms in Area Code 737
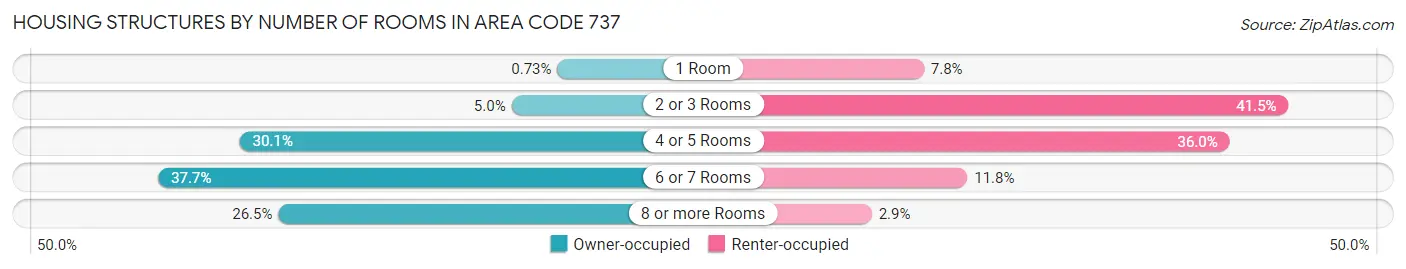
| Number of Rooms | Owner-occupied | Renter-occupied |
| 1 Room | 887 (0.7%) | 7,418 (7.8%) |
| 2 or 3 Rooms | 6,065 (5.0%) | 39,631 (41.5%) |
| 4 or 5 Rooms | 36,789 (30.1%) | 34,437 (36.0%) |
| 6 or 7 Rooms | 45,998 (37.7%) | 11,251 (11.8%) |
| 8 or more Rooms | 32,416 (26.5%) | 2,808 (2.9%) |
| Total | 122,155 (100.0%) | 95,545 (100.0%) |
Housing Structure by Heating Type in Area Code 737
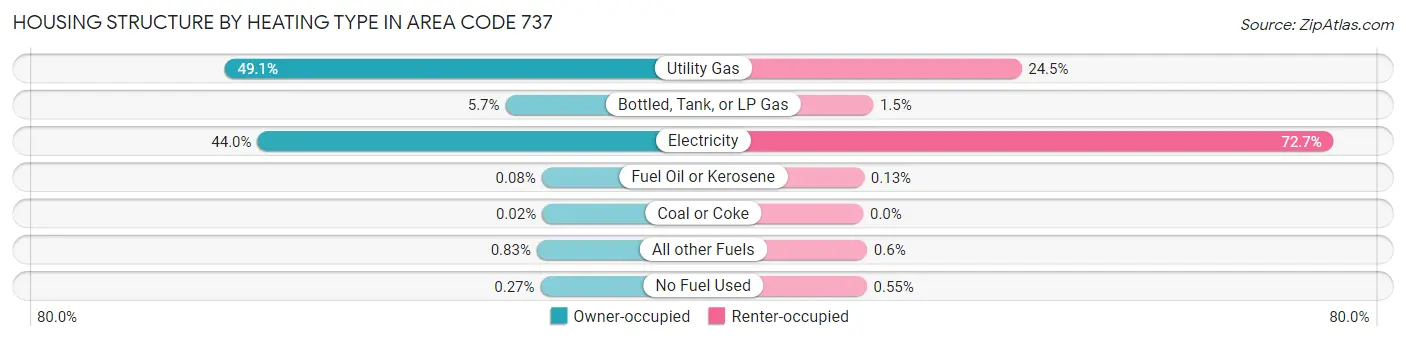
| Heating Type | Owner-occupied | Renter-occupied |
| Utility Gas | 59,971 (49.1%) | 23,371 (24.5%) |
| Bottled, Tank, or LP Gas | 6,937 (5.7%) | 1,462 (1.5%) |
| Electricity | 53,777 (44.0%) | 69,486 (72.7%) |
| Fuel Oil or Kerosene | 102 (0.1%) | 126 (0.1%) |
| Coal or Coke | 25 (0.0%) | 0 (0.0%) |
| All other Fuels | 1,013 (0.8%) | 575 (0.6%) |
| No Fuel Used | 330 (0.3%) | 525 (0.5%) |
| Total | 122,155 (100.0%) | 95,545 (100.0%) |
Household Vehicle Usage in Area Code 737
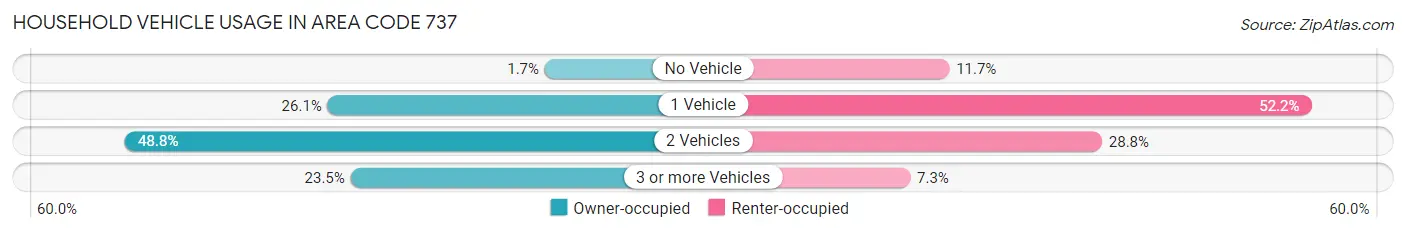
| Vehicles per Household | Owner-occupied | Renter-occupied |
| No Vehicle | 2,098 (1.7%) | 11,159 (11.7%) |
| 1 Vehicle | 31,826 (26.1%) | 49,917 (52.2%) |
| 2 Vehicles | 59,550 (48.7%) | 27,494 (28.8%) |
| 3 or more Vehicles | 28,681 (23.5%) | 6,975 (7.3%) |
| Total | 122,155 (100.0%) | 95,545 (100.0%) |
Real Estate & Mortgages in Area Code 737
Real Estate and Mortgage Overview in Area Code 737
| Characteristic | Without Mortgage | With Mortgage |
| Housing Units | 41,595 | 80,560 |
| Median Property Value | $6,583,700 | $6,176,800 |
| Median Household Income | $1,461,831 | $33,597 |
| Monthly Housing Costs | $13,906 | $20,874 |
| Real Estate Taxes | $93,873 | $2,116 |
Property Value by Mortgage Status in Area Code 737
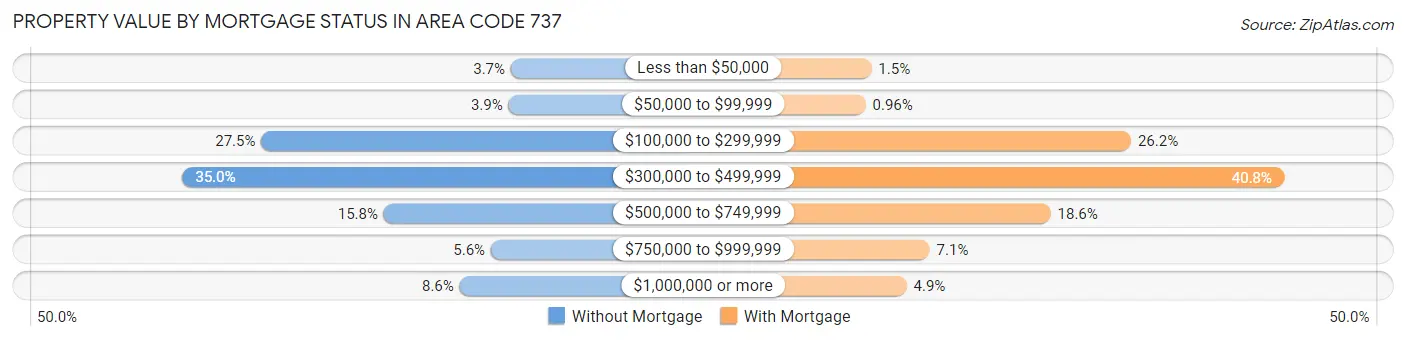
| Property Value | Without Mortgage | With Mortgage |
| Less than $50,000 | 1,536 (3.7%) | 1,216 (1.5%) |
| $50,000 to $99,999 | 1,627 (3.9%) | 777 (1.0%) |
| $100,000 to $299,999 | 11,424 (27.5%) | 21,129 (26.2%) |
| $300,000 to $499,999 | 14,549 (35.0%) | 32,864 (40.8%) |
| $500,000 to $749,999 | 6,566 (15.8%) | 14,967 (18.6%) |
| $750,000 to $999,999 | 2,327 (5.6%) | 5,690 (7.1%) |
| $1,000,000 or more | 3,566 (8.6%) | 3,917 (4.9%) |
| Total | 41,595 (100.0%) | 80,560 (100.0%) |
Household Income by Mortgage Status in Area Code 737
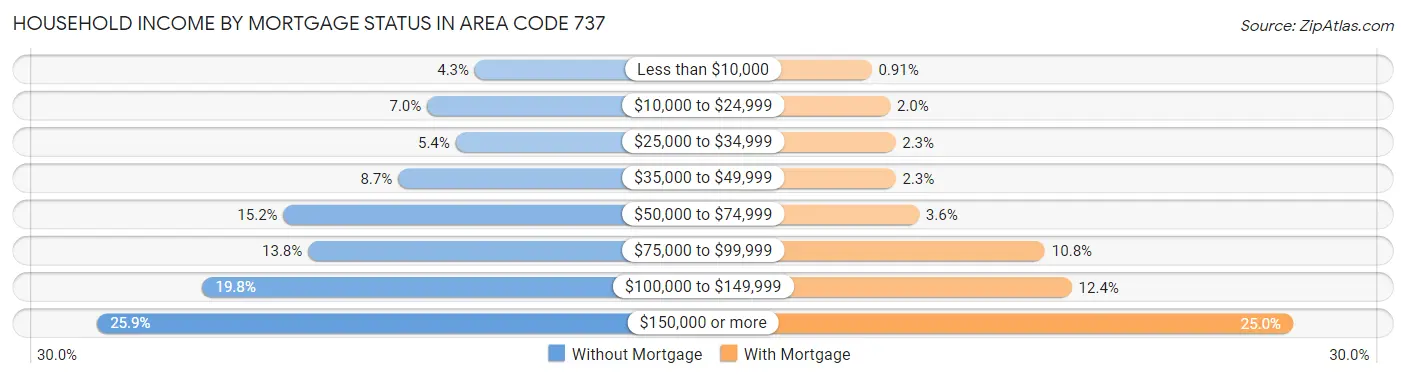
| Household Income | Without Mortgage | With Mortgage |
| Less than $10,000 | 1,775 (4.3%) | 732 (0.9%) |
| $10,000 to $24,999 | 2,912 (7.0%) | 1,591 (2.0%) |
| $25,000 to $34,999 | 2,233 (5.4%) | 1,826 (2.3%) |
| $35,000 to $49,999 | 3,603 (8.7%) | 1,835 (2.3%) |
| $50,000 to $74,999 | 6,328 (15.2%) | 2,920 (3.6%) |
| $75,000 to $99,999 | 5,742 (13.8%) | 8,714 (10.8%) |
| $100,000 to $149,999 | 8,250 (19.8%) | 9,946 (12.3%) |
| $150,000 or more | 10,752 (25.9%) | 20,131 (25.0%) |
| Total | 41,595 (100.0%) | 80,560 (100.0%) |
Property Value to Household Income Ratio in Area Code 737
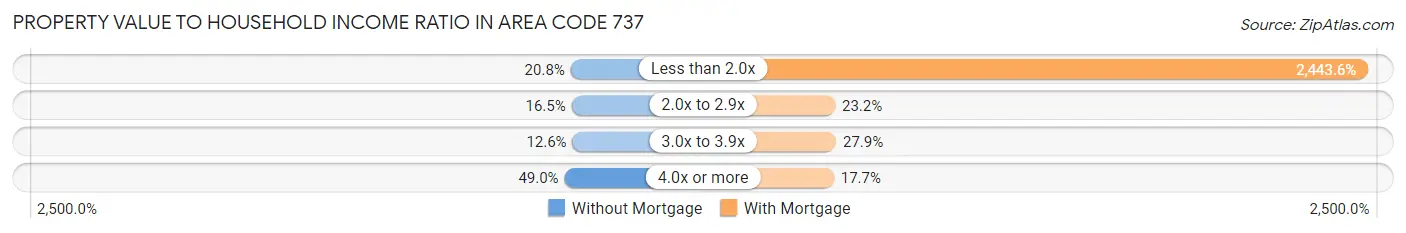
| Value-to-Income Ratio | Without Mortgage | With Mortgage |
| Less than 2.0x | 8,638 (20.8%) | 1,968,597 (2,443.6%) |
| 2.0x to 2.9x | 6,878 (16.5%) | 18,686 (23.2%) |
| 3.0x to 3.9x | 5,249 (12.6%) | 22,467 (27.9%) |
| 4.0x or more | 20,394 (49.0%) | 14,262 (17.7%) |
| Total | 41,595 (100.0%) | 80,560 (100.0%) |
Real Estate Taxes by Mortgage Status in Area Code 737
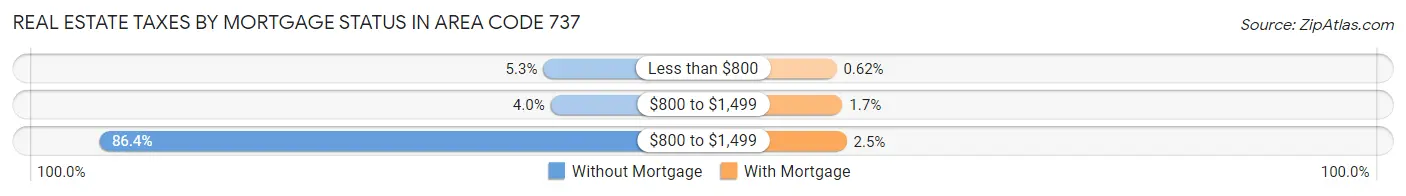
| Property Taxes | Without Mortgage | With Mortgage |
| Less than $800 | 2,194 (5.3%) | 499 (0.6%) |
| $800 to $1,499 | 1,641 (4.0%) | 1,377 (1.7%) |
| $800 to $1,499 | 35,942 (86.4%) | 1,994 (2.5%) |
| Total | 41,595 (100.0%) | 80,560 (100.0%) |
Health & Disability in Area Code 737
Health Insurance Coverage by Age in Area Code 737
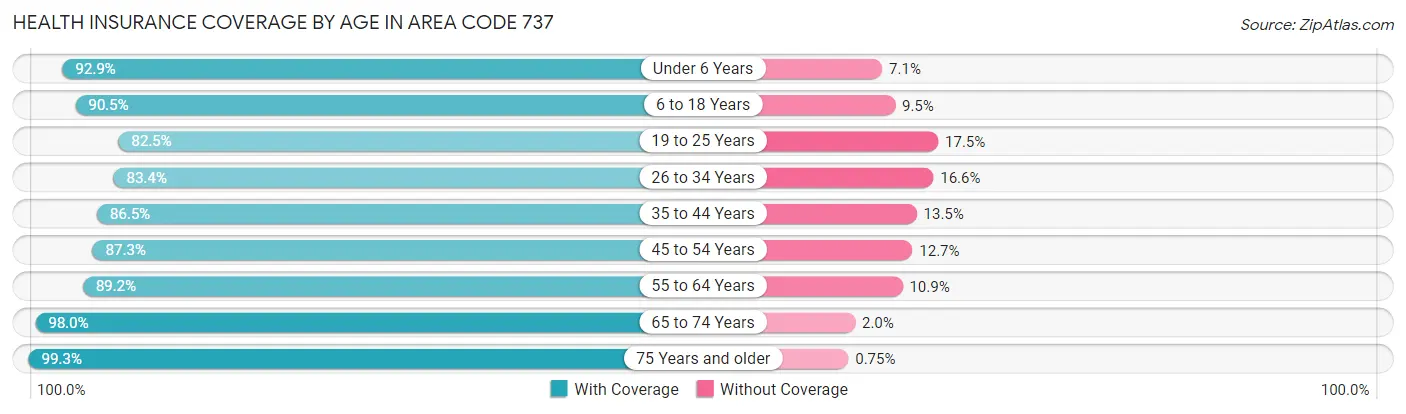
| Age Bracket | With Coverage | Without Coverage |
| Under 6 Years | 32,551 (92.9%) | 2,472 (7.1%) |
| 6 to 18 Years | 70,715 (90.5%) | 7,389 (9.5%) |
| 19 to 25 Years | 52,674 (82.5%) | 11,162 (17.5%) |
| 26 to 34 Years | 69,844 (83.4%) | 13,902 (16.6%) |
| 35 to 44 Years | 70,265 (86.5%) | 10,954 (13.5%) |
| 45 to 54 Years | 53,920 (87.3%) | 7,837 (12.7%) |
| 55 to 64 Years | 49,822 (89.1%) | 6,063 (10.8%) |
| 65 to 74 Years | 40,862 (98.0%) | 832 (2.0%) |
| 75 Years and older | 24,933 (99.3%) | 189 (0.7%) |
| Total | 465,586 (88.4%) | 60,800 (11.6%) |
Health Insurance Coverage by Citizenship Status in Area Code 737
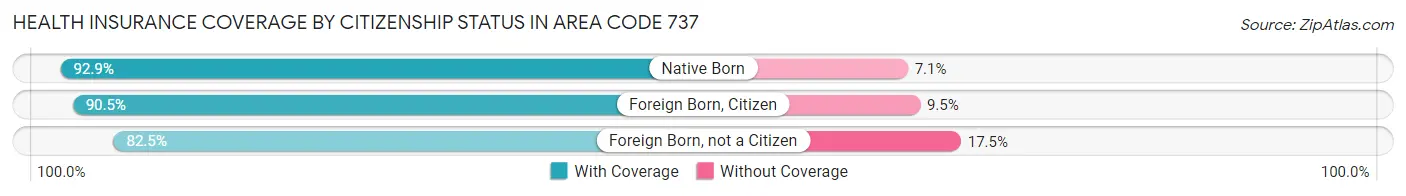
| Citizenship Status | With Coverage | Without Coverage |
| Native Born | 32,551 (92.9%) | 2,472 (7.1%) |
| Foreign Born, Citizen | 70,715 (90.5%) | 7,389 (9.5%) |
| Foreign Born, not a Citizen | 52,674 (82.5%) | 11,162 (17.5%) |
Health Insurance Coverage by Household Income in Area Code 737
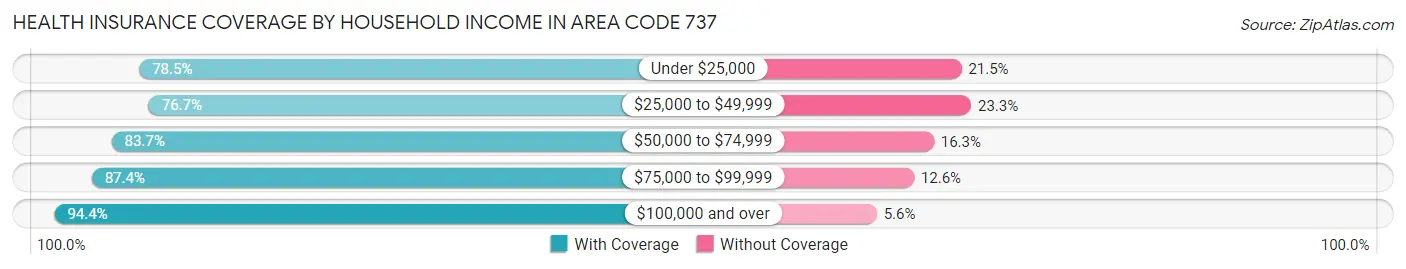
| Household Income | With Coverage | Without Coverage |
| Under $25,000 | 39,278 (78.5%) | 10,743 (21.5%) |
| $25,000 to $49,999 | 43,931 (76.7%) | 13,329 (23.3%) |
| $50,000 to $74,999 | 55,881 (83.7%) | 10,881 (16.3%) |
| $75,000 to $99,999 | 56,779 (87.4%) | 8,169 (12.6%) |
| $100,000 and over | 254,442 (94.4%) | 15,084 (5.6%) |
Public vs Private Health Insurance Coverage by Age in Area Code 737
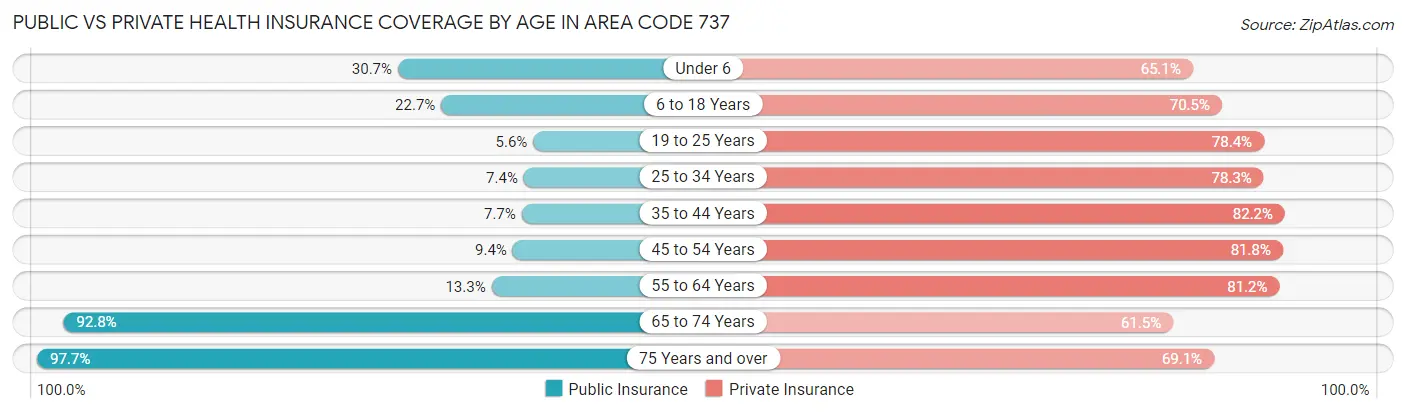
| Age Bracket | Public Insurance | Private Insurance |
| Under 6 | 10,758 (30.7%) | 22,815 (65.1%) |
| 6 to 18 Years | 17,717 (22.7%) | 55,086 (70.5%) |
| 19 to 25 Years | 3,574 (5.6%) | 50,017 (78.3%) |
| 25 to 34 Years | 6,152 (7.3%) | 65,576 (78.3%) |
| 35 to 44 Years | 6,286 (7.7%) | 66,790 (82.2%) |
| 45 to 54 Years | 5,814 (9.4%) | 50,543 (81.8%) |
| 55 to 64 Years | 7,456 (13.3%) | 45,381 (81.2%) |
| 65 to 74 Years | 38,686 (92.8%) | 25,638 (61.5%) |
| 75 Years and over | 24,539 (97.7%) | 17,353 (69.1%) |
| Total | 120,982 (23.0%) | 399,199 (75.8%) |
Disability Status by Sex by Age in Area Code 737
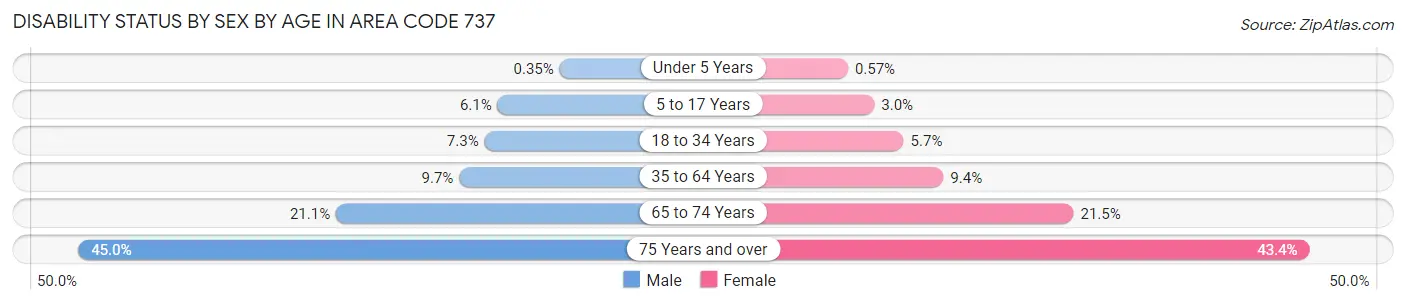
| Age Bracket | Male | Female |
| Under 5 Years | 55 (0.4%) | 76 (0.6%) |
| 5 to 17 Years | 2,297 (6.1%) | 1,134 (3.0%) |
| 18 to 34 Years | 5,574 (7.3%) | 4,603 (5.7%) |
| 35 to 64 Years | 9,855 (9.7%) | 9,139 (9.4%) |
| 65 to 74 Years | 4,068 (21.1%) | 4,822 (21.5%) |
| 75 Years and over | 5,104 (45.0%) | 5,983 (43.4%) |
Disability Class by Sex by Age in Area Code 737
Disability Class: Hearing Difficulty
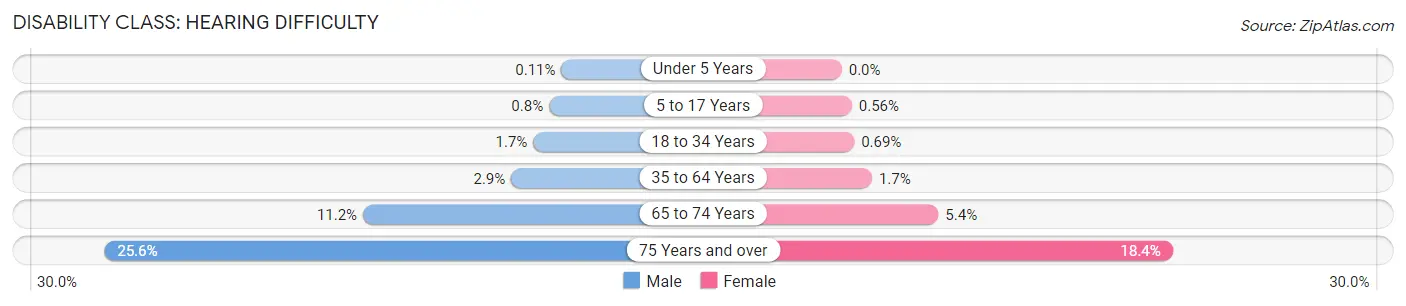
| Age Bracket | Male | Female |
| Under 5 Years | 18 (0.1%) | 0 (0.0%) |
| 5 to 17 Years | 299 (0.8%) | 211 (0.6%) |
| 18 to 34 Years | 1,277 (1.7%) | 553 (0.7%) |
| 35 to 64 Years | 2,965 (2.9%) | 1,628 (1.7%) |
| 65 to 74 Years | 2,151 (11.2%) | 1,206 (5.4%) |
| 75 Years and over | 2,897 (25.6%) | 2,539 (18.4%) |
Disability Class: Vision Difficulty
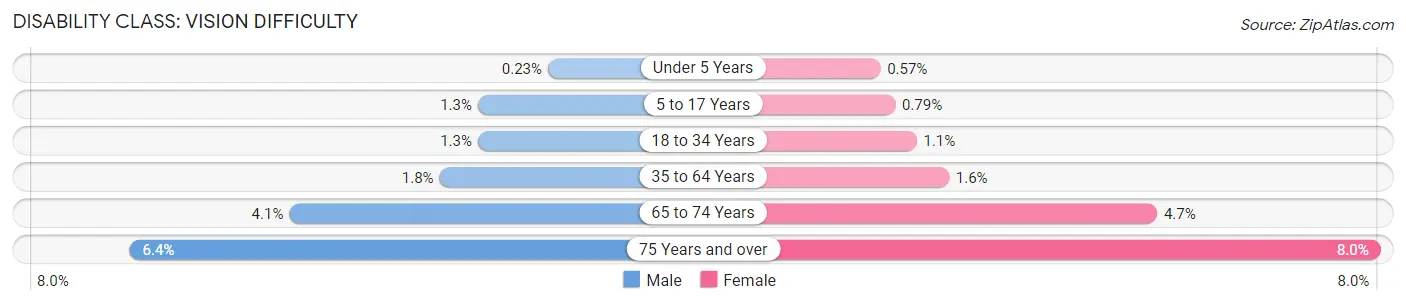
| Age Bracket | Male | Female |
| Under 5 Years | 37 (0.2%) | 76 (0.6%) |
| 5 to 17 Years | 476 (1.3%) | 298 (0.8%) |
| 18 to 34 Years | 965 (1.3%) | 893 (1.1%) |
| 35 to 64 Years | 1,876 (1.8%) | 1,537 (1.6%) |
| 65 to 74 Years | 784 (4.1%) | 1,050 (4.7%) |
| 75 Years and over | 730 (6.4%) | 1,103 (8.0%) |
Disability Class: Cognitive Difficulty
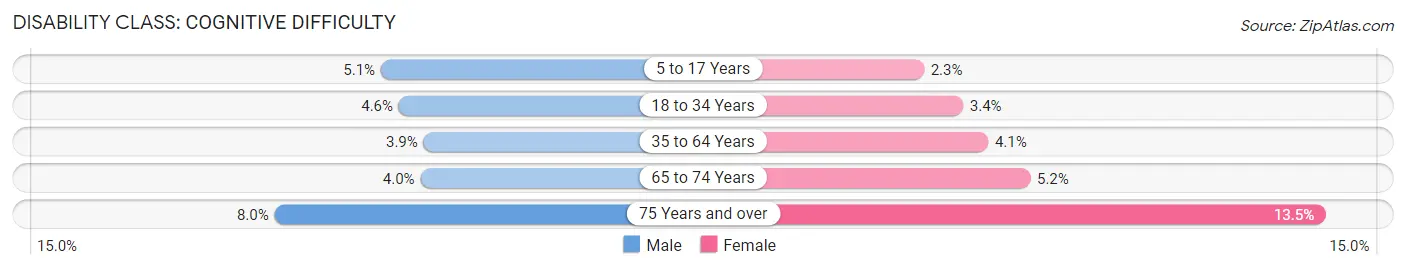
| Age Bracket | Male | Female |
| 5 to 17 Years | 1,910 (5.1%) | 856 (2.3%) |
| 18 to 34 Years | 3,491 (4.6%) | 2,701 (3.4%) |
| 35 to 64 Years | 3,962 (3.9%) | 3,942 (4.1%) |
| 65 to 74 Years | 767 (4.0%) | 1,174 (5.2%) |
| 75 Years and over | 911 (8.0%) | 1,858 (13.5%) |
Disability Class: Ambulatory Difficulty
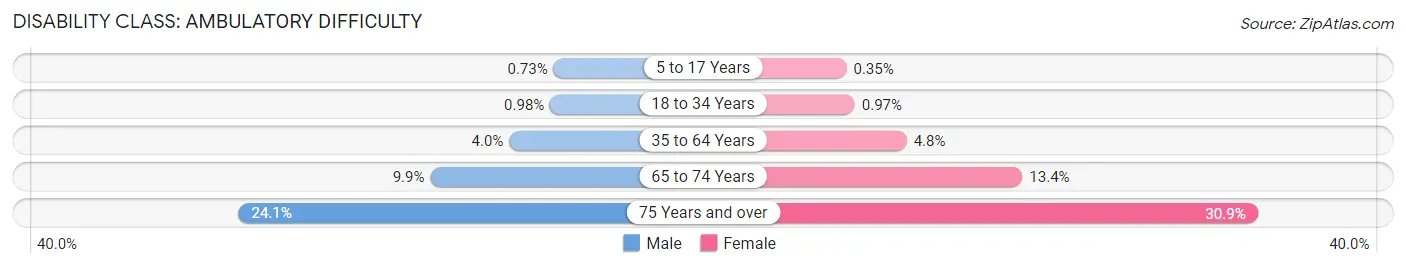
| Age Bracket | Male | Female |
| 5 to 17 Years | 276 (0.7%) | 133 (0.4%) |
| 18 to 34 Years | 743 (1.0%) | 780 (1.0%) |
| 35 to 64 Years | 4,095 (4.0%) | 4,675 (4.8%) |
| 65 to 74 Years | 1,904 (9.9%) | 3,007 (13.4%) |
| 75 Years and over | 2,733 (24.1%) | 4,254 (30.9%) |
Disability Class: Self-Care Difficulty
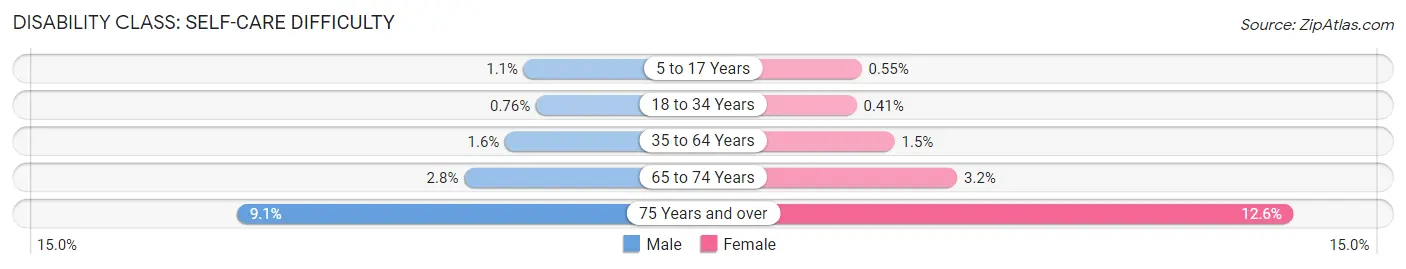
| Age Bracket | Male | Female |
| 5 to 17 Years | 413 (1.1%) | 207 (0.5%) |
| 18 to 34 Years | 579 (0.8%) | 326 (0.4%) |
| 35 to 64 Years | 1,652 (1.6%) | 1,421 (1.5%) |
| 65 to 74 Years | 532 (2.8%) | 720 (3.2%) |
| 75 Years and over | 1,031 (9.1%) | 1,734 (12.6%) |
Technology Access in Area Code 737
Computing Device Access in Area Code 737
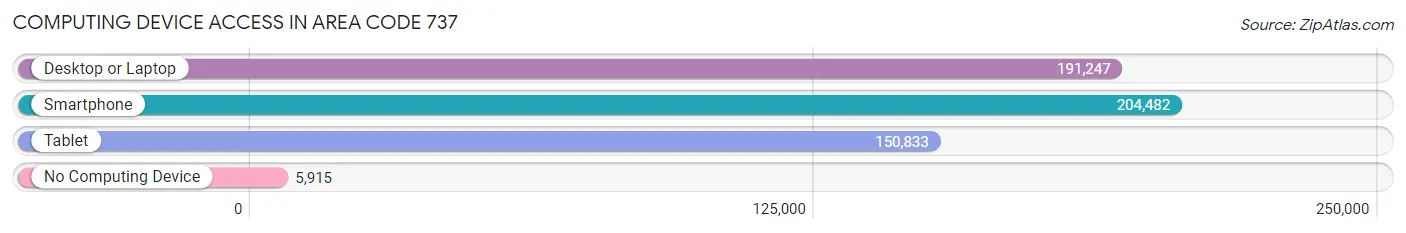
| Device Type | # Households | % Households |
| Desktop or Laptop | 191,247 | 87.8% |
| Smartphone | 204,482 | 93.9% |
| Tablet | 150,833 | 69.3% |
| No Computing Device | 5,915 | 2.7% |
| Total | 217,700 | 100.0% |
Internet Access in Area Code 737
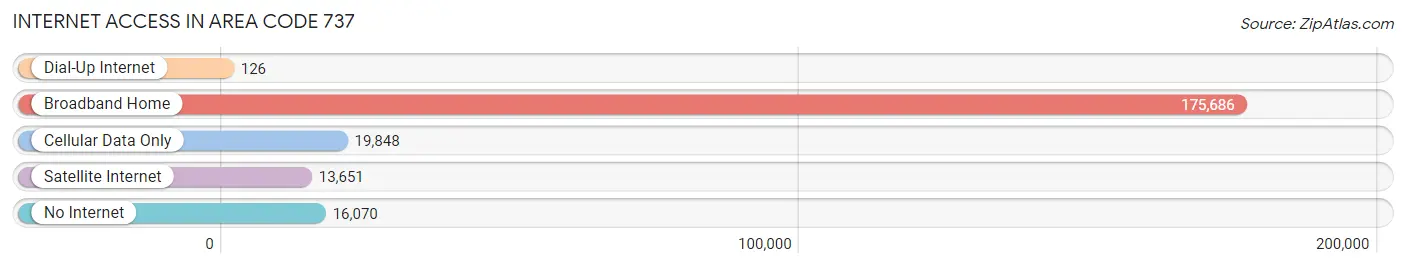
| Internet Type | # Households | % Households |
| Dial-Up Internet | 126 | 0.1% |
| Broadband Home | 175,686 | 80.7% |
| Cellular Data Only | 19,848 | 9.1% |
| Satellite Internet | 13,651 | 6.3% |
| No Internet | 16,070 | 7.4% |
| Total | 217,700 | 100.0% |
Area Code 737 Summary
Geography
Area code 737 is an overlay area code that serves the Austin, Texas metropolitan area. It was created in 2013 to provide additional telephone numbers to the existing 512 area code. The 737 area code covers the same geographic area as the 512 area code, which includes Travis, Williamson, Hays, Bastrop, and Caldwell counties.
Social
The 737 area code is a source of pride for many Austinites, as it is a sign of the city's growth and development. It is also a symbol of the city's vibrant culture and its diverse population. The area code is often used in marketing campaigns and on merchandise, such as t-shirts and hats.
Economics
The 737 area code is an important part of the Austin economy. It is used by businesses to reach customers in the area, and it is also used by residents to make local and long-distance calls. The area code is also used by the city's tech industry, which is one of the fastest-growing sectors in the city.
Demographics
The 737 area code is home to a diverse population. According to the U.S. Census Bureau, the population of the area code is approximately 1.2 million people. The population is made up of a variety of ethnicities, including White, African American, Hispanic, and Asian. The median household income in the area code is $63,000, and the median age is 33.
Common Questions
What is Per Capita Income in Area Code 737?
Per Capita income in Area Code 737 is $51,116.
What is the Median Family Income in Area Code 737?
Median Family Income in Area Code 737 is $117,929.
What is the Median Household income in Area Code 737?
Median Household Income in Area Code 737 is $92,656.
What is Income or Wage Gap in Area Code 737?
Income or Wage Gap in Area Code 737 is 31.7%.
Women in Area Code 737 earn 68.3 cents for every dollar earned by a man.
What is Family Income Deficit in Area Code 737?
Family Income Deficit in Area Code 737 is $12,172.
Families that are below poverty line in Area Code 737 earn $12,172 less on average than the poverty threshold level.
What is Inequality or Gini Index in Area Code 737?
Inequality or Gini Index in Area Code 737 is 6.81.
What is the Total Population of Area Code 737?
Total Population of Area Code 737 is 529,483.
What is the Total Male Population of Area Code 737?
Total Male Population of Area Code 737 is 264,127.
What is the Total Female Population of Area Code 737?
Total Female Population of Area Code 737 is 265,356.
What is the Ratio of Males per 100 Females in Area Code 737?
There are 99.54 Males per 100 Females in Area Code 737.
What is the Ratio of Females per 100 Males in Area Code 737?
There are 100.47 Females per 100 Males in Area Code 737.
What is the Median Population Age in Area Code 737?
Median Population Age in Area Code 737 is 37.5 Years.
What is the Average Family Size in Area Code 737
Average Family Size in Area Code 737 is 2.9 People.
What is the Average Household Size in Area Code 737
Average Household Size in Area Code 737 is 2.3 People.
How Large is the Labor Force in Area Code 737?
There are 279,835 People in the Labor Forcein in Area Code 737.
What is the Percentage of People in the Labor Force in Area Code 737?
64.3% of People are in the Labor Force in Area Code 737.
What is the Unemployment Rate in Area Code 737?
Unemployment Rate in Area Code 737 is 4.5%.