Cameron County, TX Map & Demographics
Cameron County Overview
$21,440
PER CAPITA INCOME
$54,380
AVG FAMILY INCOME
$47,435
AVG HOUSEHOLD INCOME
28.1%
WAGE / INCOME GAP [ % ]
71.9¢/ $1
WAGE / INCOME GAP [ $ ]
$10,966
FAMILY INCOME DEFICIT
0.47
INEQUALITY / GINI INDEX
421,854
TOTAL POPULATION
208,182
MALE POPULATION
213,672
FEMALE POPULATION
97.43
MALES / 100 FEMALES
102.64
FEMALES / 100 MALES
32.0
MEDIAN AGE
3.7
AVG FAMILY SIZE
3.2
AVG HOUSEHOLD SIZE
178,974
LABOR FORCE [ PEOPLE ]
57.2%
PERCENT IN LABOR FORCE
5.7%
UNEMPLOYMENT RATE
Cameron County Area Codes
Income in Cameron County
Income Overview in Cameron County
Per Capita Income in Cameron County is $21,440, while median incomes of families and households are $54,380 and $47,435 respectively.
| Characteristic | Number | Measure |
| Per Capita Income | 421,854 | $21,440 |
| Median Family Income | 101,544 | $54,380 |
| Mean Family Income | 101,544 | $71,245 |
| Median Household Income | 132,538 | $47,435 |
| Mean Household Income | 132,538 | $65,655 |
| Income Deficit | 101,544 | $10,966 |
| Wage / Income Gap (%) | 421,854 | 28.09% |
| Wage / Income Gap ($) | 421,854 | 71.91¢ per $1 |
| Gini / Inequality Index | 421,854 | 0.47 |
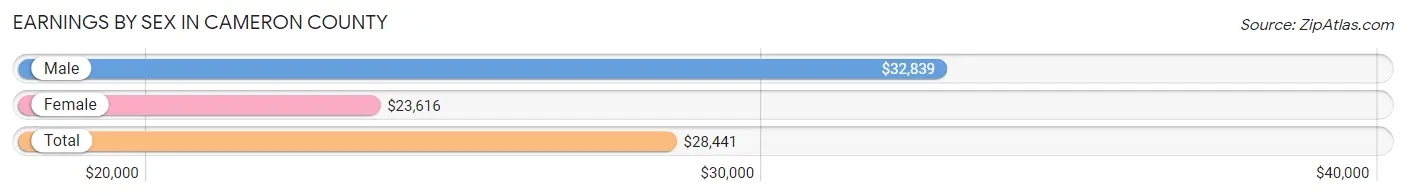
Earnings by Sex in Cameron County
Average Earnings in Cameron County are $28,441, $32,839 for men and $23,616 for women, a difference of 28.1%.
| Sex | Number | Average Earnings |
| Male | 99,224 (54.0%) | $32,839 |
| Female | 84,487 (46.0%) | $23,616 |
| Total | 183,711 (100.0%) | $28,441 |
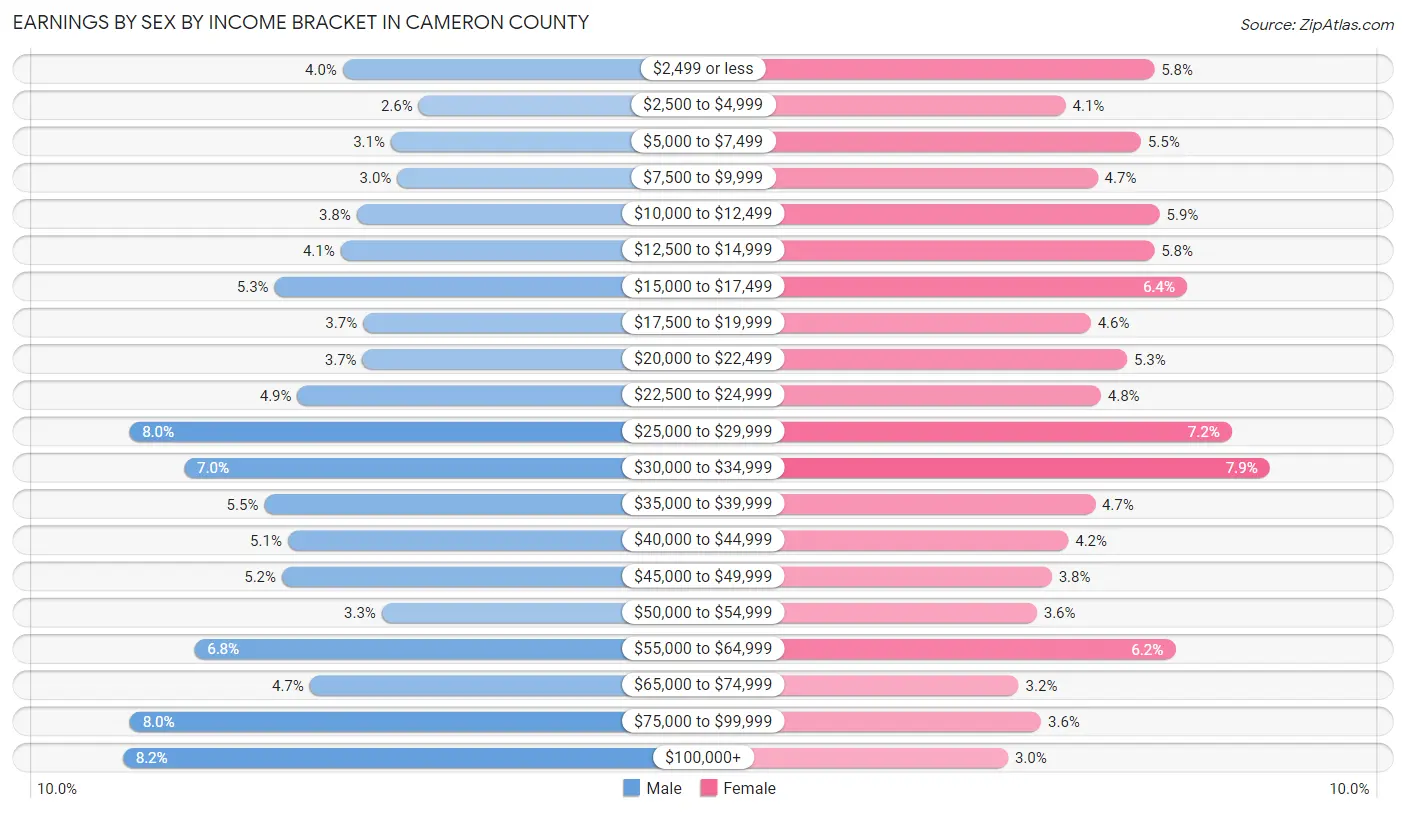
Earnings by Sex by Income Bracket in Cameron County
The most common earnings brackets in Cameron County are $100,000+ for men (8,101 | 8.2%) and $30,000 to $34,999 for women (6,694 | 7.9%).
| Income | Male | Female |
| $2,499 or less | 4,010 (4.0%) | 4,865 (5.8%) |
| $2,500 to $4,999 | 2,598 (2.6%) | 3,460 (4.1%) |
| $5,000 to $7,499 | 3,111 (3.1%) | 4,657 (5.5%) |
| $7,500 to $9,999 | 2,996 (3.0%) | 3,971 (4.7%) |
| $10,000 to $12,499 | 3,751 (3.8%) | 4,953 (5.9%) |
| $12,500 to $14,999 | 4,050 (4.1%) | 4,863 (5.8%) |
| $15,000 to $17,499 | 5,275 (5.3%) | 5,382 (6.4%) |
| $17,500 to $19,999 | 3,635 (3.7%) | 3,865 (4.6%) |
| $20,000 to $22,499 | 3,638 (3.7%) | 4,433 (5.2%) |
| $22,500 to $24,999 | 4,852 (4.9%) | 4,021 (4.8%) |
| $25,000 to $29,999 | 7,975 (8.0%) | 6,093 (7.2%) |
| $30,000 to $34,999 | 6,957 (7.0%) | 6,694 (7.9%) |
| $35,000 to $39,999 | 5,471 (5.5%) | 3,929 (4.6%) |
| $40,000 to $44,999 | 5,027 (5.1%) | 3,507 (4.2%) |
| $45,000 to $49,999 | 5,138 (5.2%) | 3,245 (3.8%) |
| $50,000 to $54,999 | 3,285 (3.3%) | 3,009 (3.6%) |
| $55,000 to $64,999 | 6,770 (6.8%) | 5,193 (6.1%) |
| $65,000 to $74,999 | 4,621 (4.7%) | 2,720 (3.2%) |
| $75,000 to $99,999 | 7,963 (8.0%) | 3,075 (3.6%) |
| $100,000+ | 8,101 (8.2%) | 2,552 (3.0%) |
| Total | 99,224 (100.0%) | 84,487 (100.0%) |
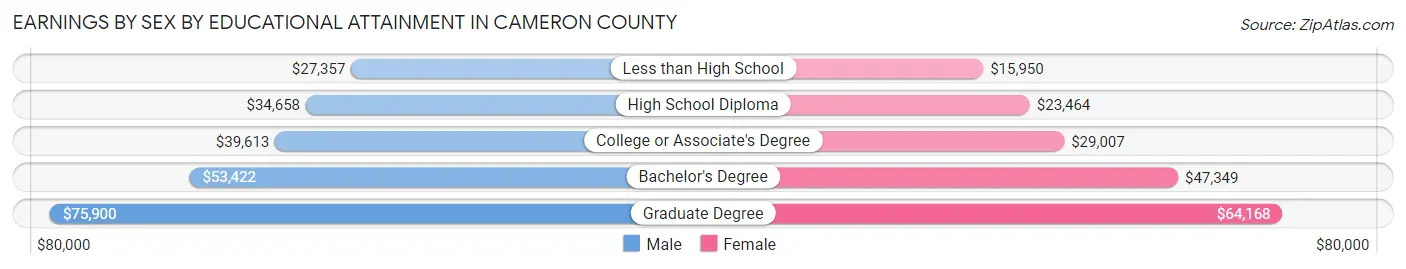
Earnings by Sex by Educational Attainment in Cameron County
Average earnings in Cameron County are $37,721 for men and $27,160 for women, a difference of 28.0%. Men with an educational attainment of graduate degree enjoy the highest average annual earnings of $75,900, while those with less than high school education earn the least with $27,357. Women with an educational attainment of graduate degree earn the most with the average annual earnings of $64,168, while those with less than high school education have the smallest earnings of $15,950.
| Educational Attainment | Male Income | Female Income |
| Less than High School | $27,357 | $15,950 |
| High School Diploma | $34,658 | $23,464 |
| College or Associate's Degree | $39,613 | $29,007 |
| Bachelor's Degree | $53,422 | $47,349 |
| Graduate Degree | $75,900 | $64,168 |
| Total | $37,721 | $27,160 |
Family Income in Cameron County
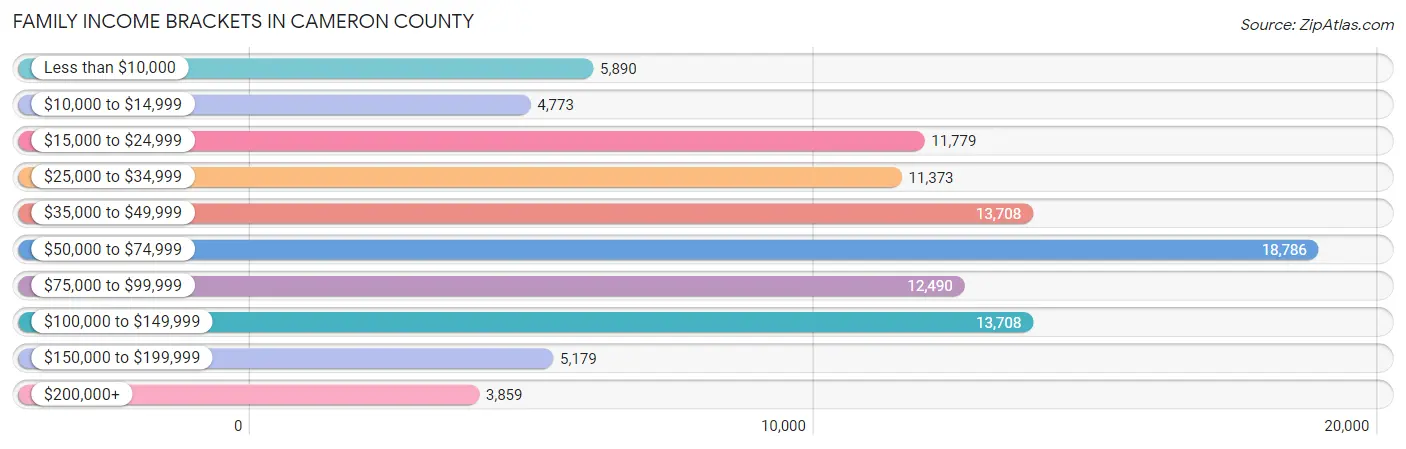
Family Income Brackets in Cameron County
According to the Cameron County family income data, there are 18,786 families falling into the $50,000 to $74,999 income range, which is the most common income bracket and makes up 18.5% of all families. Conversely, the $200,000+ income bracket is the least frequent group with only 3,859 families (3.8%) belonging to this category.
| Income Bracket | # Families | % Families |
| Less than $10,000 | 5,890 | 5.8% |
| $10,000 to $14,999 | 4,773 | 4.7% |
| $15,000 to $24,999 | 11,779 | 11.6% |
| $25,000 to $34,999 | 11,373 | 11.2% |
| $35,000 to $49,999 | 13,708 | 13.5% |
| $50,000 to $74,999 | 18,786 | 18.5% |
| $75,000 to $99,999 | 12,490 | 12.3% |
| $100,000 to $149,999 | 13,708 | 13.5% |
| $150,000 to $199,999 | 5,179 | 5.1% |
| $200,000+ | 3,859 | 3.8% |
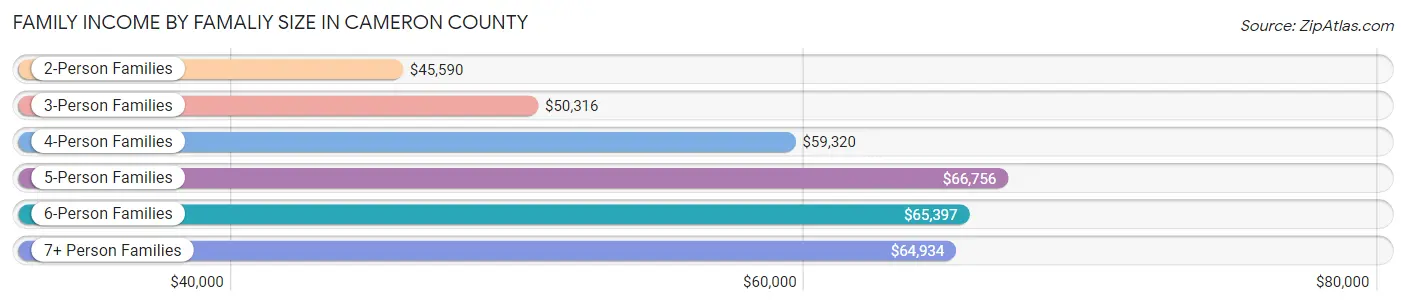
Family Income by Famaliy Size in Cameron County
5-person families (12,144 | 12.0%) account for the highest median family income in Cameron County with $66,756 per family, while 2-person families (34,983 | 34.4%) have the highest median income of $22,795 per family member.
| Income Bracket | # Families | Median Income |
| 2-Person Families | 34,983 (34.4%) | $45,590 |
| 3-Person Families | 22,348 (22.0%) | $50,316 |
| 4-Person Families | 22,223 (21.9%) | $59,320 |
| 5-Person Families | 12,144 (12.0%) | $66,756 |
| 6-Person Families | 6,159 (6.1%) | $65,397 |
| 7+ Person Families | 3,687 (3.6%) | $64,934 |
| Total | 101,544 (100.0%) | $54,380 |
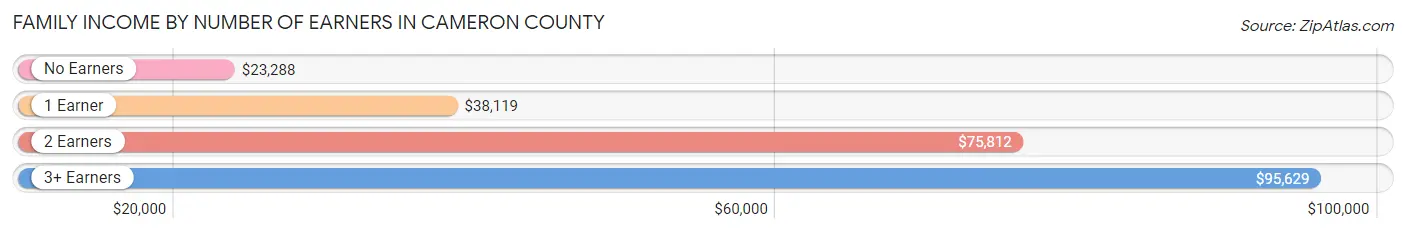
Family Income by Number of Earners in Cameron County
The median family income in Cameron County is $54,380, with families comprising 3+ earners (11,245) having the highest median family income of $95,629, while families with no earners (16,168) have the lowest median family income of $23,288, accounting for 11.1% and 15.9% of families, respectively.
| Number of Earners | # Families | Median Income |
| No Earners | 16,168 (15.9%) | $23,288 |
| 1 Earner | 37,384 (36.8%) | $38,119 |
| 2 Earners | 36,747 (36.2%) | $75,812 |
| 3+ Earners | 11,245 (11.1%) | $95,629 |
| Total | 101,544 (100.0%) | $54,380 |
Household Income in Cameron County
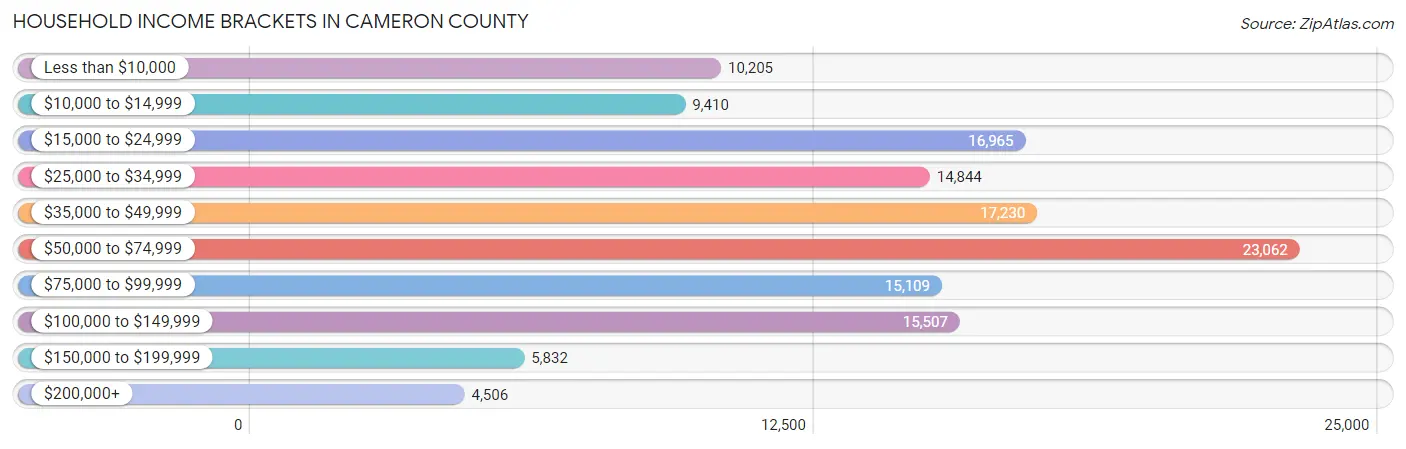
Household Income Brackets in Cameron County
With 23,062 households falling in the category, the $50,000 to $74,999 income range is the most frequent in Cameron County, accounting for 17.4% of all households. In contrast, only 4,506 households (3.4%) fall into the $200,000+ income bracket, making it the least populous group.
| Income Bracket | # Households | % Households |
| Less than $10,000 | 10,205 | 7.7% |
| $10,000 to $14,999 | 9,410 | 7.1% |
| $15,000 to $24,999 | 16,965 | 12.8% |
| $25,000 to $34,999 | 14,844 | 11.2% |
| $35,000 to $49,999 | 17,230 | 13.0% |
| $50,000 to $74,999 | 23,062 | 17.4% |
| $75,000 to $99,999 | 15,109 | 11.4% |
| $100,000 to $149,999 | 15,507 | 11.7% |
| $150,000 to $199,999 | 5,832 | 4.4% |
| $200,000+ | 4,506 | 3.4% |
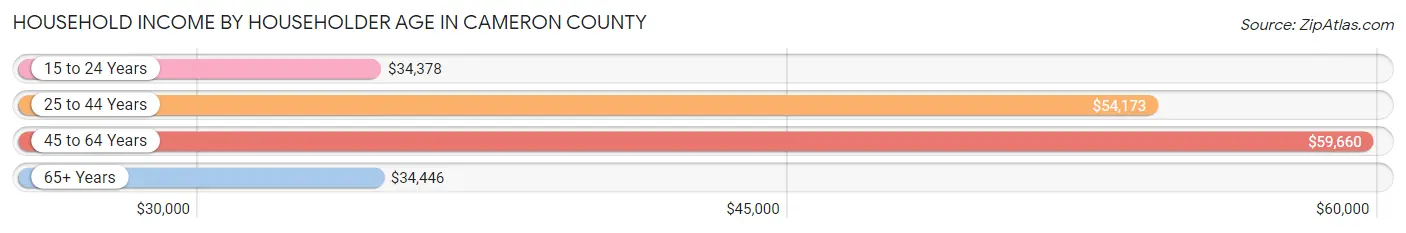
Household Income by Householder Age in Cameron County
The median household income in Cameron County is $47,435, with the highest median household income of $59,660 found in the 45 to 64 years age bracket for the primary householder. A total of 47,808 households (36.1%) fall into this category. Meanwhile, the 15 to 24 years age bracket for the primary householder has the lowest median household income of $34,378, with 5,222 households (3.9%) in this group.
| Income Bracket | # Households | Median Income |
| 15 to 24 Years | 5,222 (3.9%) | $34,378 |
| 25 to 44 Years | 44,175 (33.3%) | $54,173 |
| 45 to 64 Years | 47,808 (36.1%) | $59,660 |
| 65+ Years | 35,333 (26.7%) | $34,446 |
| Total | 132,538 (100.0%) | $47,435 |
Poverty in Cameron County
Income Below Poverty by Sex and Age in Cameron County
With 23.3% poverty level for males and 27.4% for females among the residents of Cameron County, 16 and 17 year old males and under 5 year old females are the most vulnerable to poverty, with 3,057 males (38.8%) and 6,471 females (42.8%) in their respective age groups living below the poverty level.
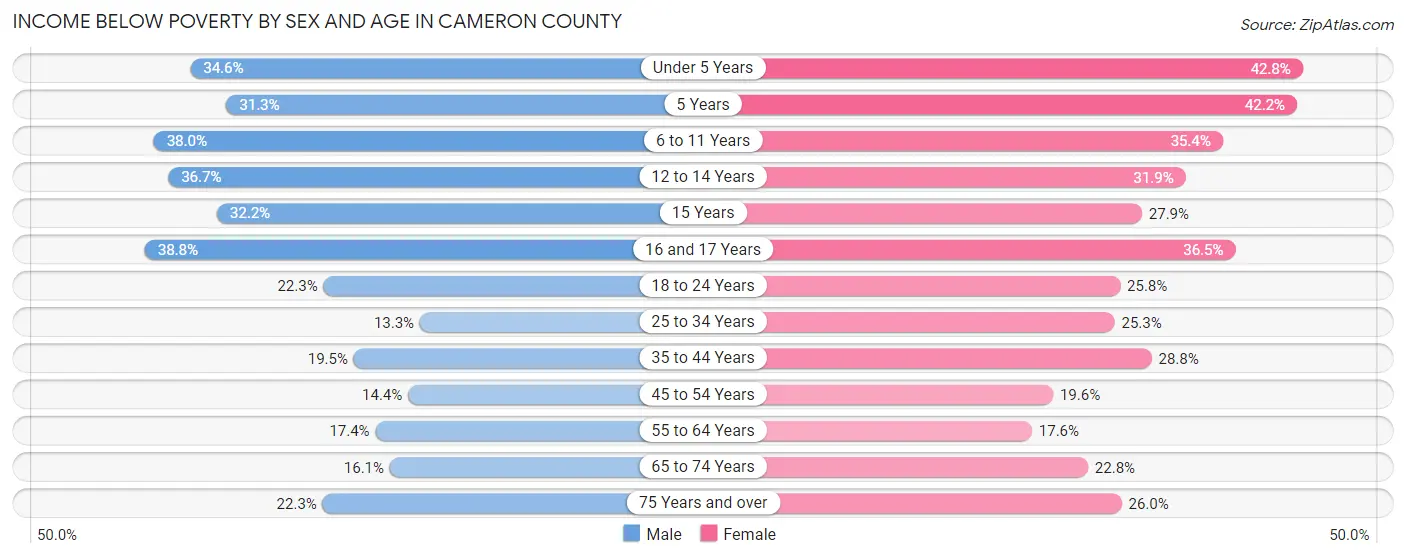
| Age Bracket | Male | Female |
| Under 5 Years | 5,500 (34.6%) | 6,471 (42.8%) |
| 5 Years | 1,131 (31.3%) | 1,353 (42.2%) |
| 6 to 11 Years | 8,270 (38.0%) | 7,062 (35.3%) |
| 12 to 14 Years | 3,754 (36.7%) | 3,495 (31.9%) |
| 15 Years | 1,144 (32.2%) | 1,020 (27.9%) |
| 16 and 17 Years | 3,057 (38.8%) | 2,688 (36.5%) |
| 18 to 24 Years | 5,475 (22.3%) | 5,800 (25.8%) |
| 25 to 34 Years | 3,624 (13.3%) | 6,556 (25.3%) |
| 35 to 44 Years | 4,865 (19.5%) | 7,200 (28.7%) |
| 45 to 54 Years | 3,296 (14.4%) | 4,941 (19.6%) |
| 55 to 64 Years | 3,283 (17.4%) | 3,845 (17.6%) |
| 65 to 74 Years | 2,405 (16.1%) | 4,025 (22.8%) |
| 75 Years and over | 2,296 (22.3%) | 3,626 (26.0%) |
| Total | 48,100 (23.3%) | 58,082 (27.4%) |
Income Above Poverty by Sex and Age in Cameron County
According to the poverty statistics in Cameron County, males aged 25 to 34 years and females aged 55 to 64 years are the age groups that are most secure financially, with 86.7% of males and 82.4% of females in these age groups living above the poverty line.
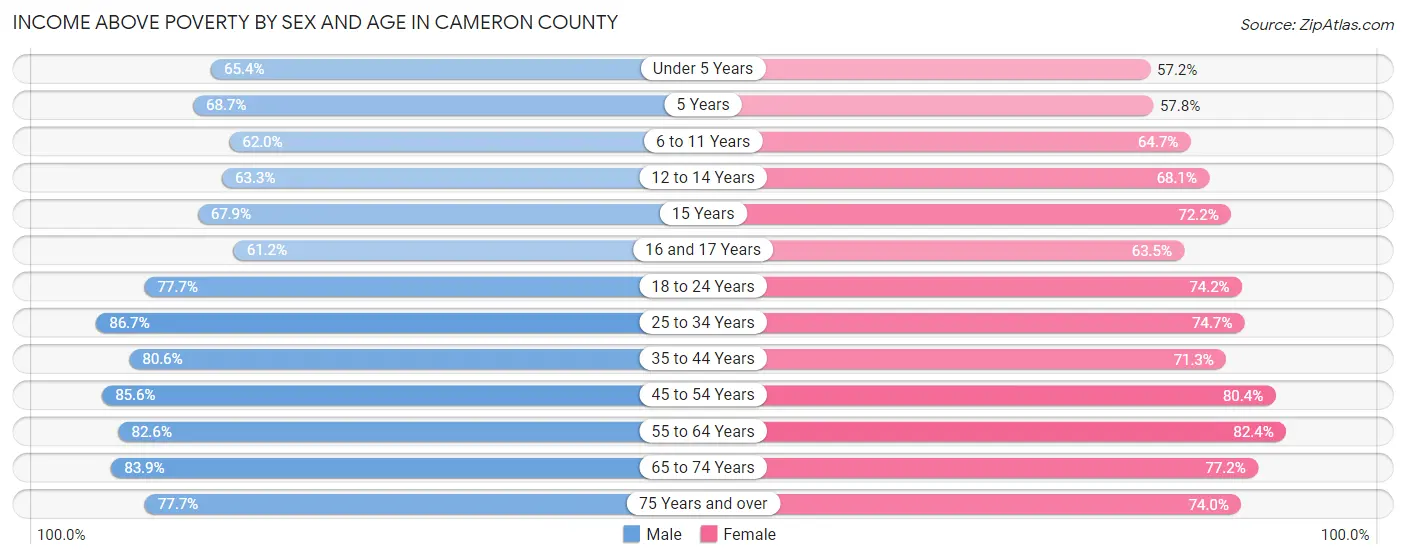
| Age Bracket | Male | Female |
| Under 5 Years | 10,387 (65.4%) | 8,660 (57.2%) |
| 5 Years | 2,486 (68.7%) | 1,850 (57.8%) |
| 6 to 11 Years | 13,486 (62.0%) | 12,916 (64.6%) |
| 12 to 14 Years | 6,483 (63.3%) | 7,461 (68.1%) |
| 15 Years | 2,414 (67.8%) | 2,642 (72.2%) |
| 16 and 17 Years | 4,814 (61.2%) | 4,672 (63.5%) |
| 18 to 24 Years | 19,119 (77.7%) | 16,655 (74.2%) |
| 25 to 34 Years | 23,600 (86.7%) | 19,351 (74.7%) |
| 35 to 44 Years | 20,146 (80.5%) | 17,847 (71.3%) |
| 45 to 54 Years | 19,584 (85.6%) | 20,266 (80.4%) |
| 55 to 64 Years | 15,539 (82.6%) | 17,947 (82.4%) |
| 65 to 74 Years | 12,530 (83.9%) | 13,594 (77.2%) |
| 75 Years and over | 7,983 (77.7%) | 10,341 (74.0%) |
| Total | 158,571 (76.7%) | 154,202 (72.6%) |
Income Below Poverty Among Married-Couple Families in Cameron County
The poverty statistics for married-couple families in Cameron County show that 15.4% or 9,880 of the total 64,192 families live below the poverty line. Families with 5 or more children have the highest poverty rate of 65.5%, comprising of 808 families. On the other hand, families with no children have the lowest poverty rate of 11.0%, which includes 3,527 families.
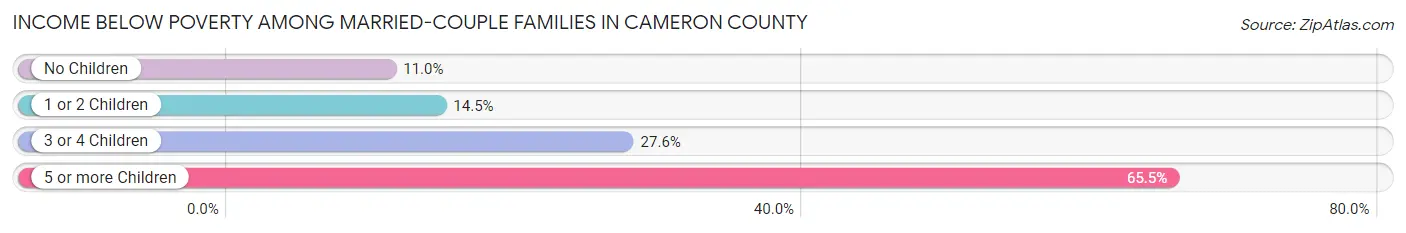
| Children | Above Poverty | Below Poverty |
| No Children | 28,477 (89.0%) | 3,527 (11.0%) |
| 1 or 2 Children | 19,558 (85.5%) | 3,320 (14.5%) |
| 3 or 4 Children | 5,852 (72.5%) | 2,225 (27.6%) |
| 5 or more Children | 425 (34.5%) | 808 (65.5%) |
| Total | 54,312 (84.6%) | 9,880 (15.4%) |
Income Below Poverty Among Single-Parent Households in Cameron County
According to the poverty data in Cameron County, 23.9% or 2,449 single-father households and 38.6% or 10,474 single-mother households are living below the poverty line. Among single-father households, those with 5 or more children have the highest poverty rate, with 136 households (58.6%) experiencing poverty. Likewise, among single-mother households, those with 5 or more children have the highest poverty rate, with 620 households (95.8%) falling below the poverty line.
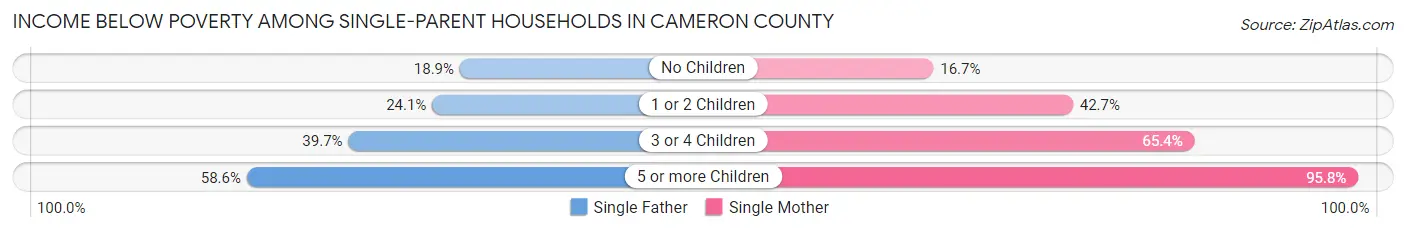
| Children | Single Father | Single Mother |
| No Children | 878 (18.9%) | 1,492 (16.7%) |
| 1 or 2 Children | 1,077 (24.1%) | 5,804 (42.7%) |
| 3 or 4 Children | 358 (39.7%) | 2,558 (65.4%) |
| 5 or more Children | 136 (58.6%) | 620 (95.8%) |
| Total | 2,449 (23.9%) | 10,474 (38.6%) |
Income Below Poverty Among Married-Couple vs Single-Parent Households in Cameron County
The poverty data for Cameron County shows that 9,880 of the married-couple family households (15.4%) and 12,923 of the single-parent households (34.6%) are living below the poverty level. Within the married-couple family households, those with 5 or more children have the highest poverty rate, with 808 households (65.5%) falling below the poverty line. Among the single-parent households, those with 5 or more children have the highest poverty rate, with 756 household (86.0%) living below poverty.
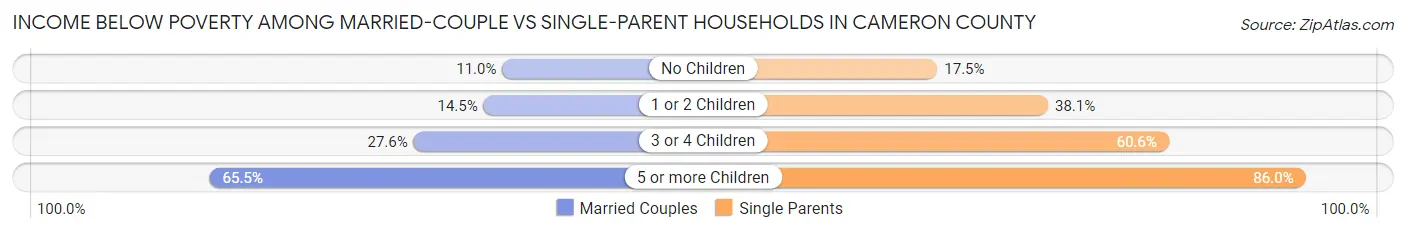
| Children | Married-Couple Families | Single-Parent Households |
| No Children | 3,527 (11.0%) | 2,370 (17.4%) |
| 1 or 2 Children | 3,320 (14.5%) | 6,881 (38.1%) |
| 3 or 4 Children | 2,225 (27.6%) | 2,916 (60.6%) |
| 5 or more Children | 808 (65.5%) | 756 (86.0%) |
| Total | 9,880 (15.4%) | 12,923 (34.6%) |
Race in Cameron County
The most populous races in Cameron County are Hispanic or Latino (379,591 | 90.0%), White / Caucasian (264,726 | 62.7%), and Two or more Races (121,758 | 28.9%).
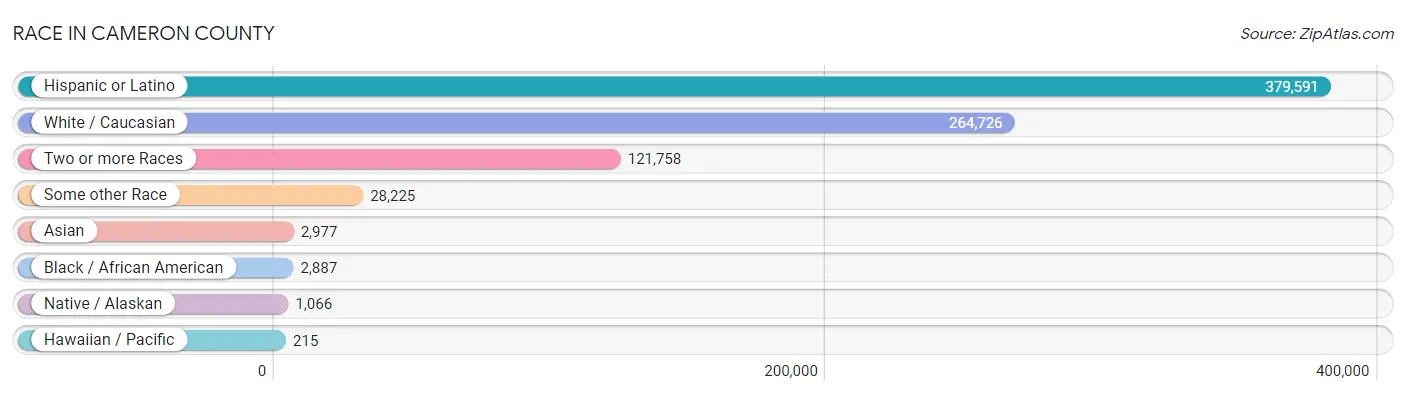
| Race | # Population | % Population |
| Asian | 2,977 | 0.7% |
| Black / African American | 2,887 | 0.7% |
| Hawaiian / Pacific | 215 | 0.1% |
| Hispanic or Latino | 379,591 | 90.0% |
| Native / Alaskan | 1,066 | 0.3% |
| White / Caucasian | 264,726 | 62.7% |
| Two or more Races | 121,758 | 28.9% |
| Some other Race | 28,225 | 6.7% |
| Total | 421,854 | 100.0% |
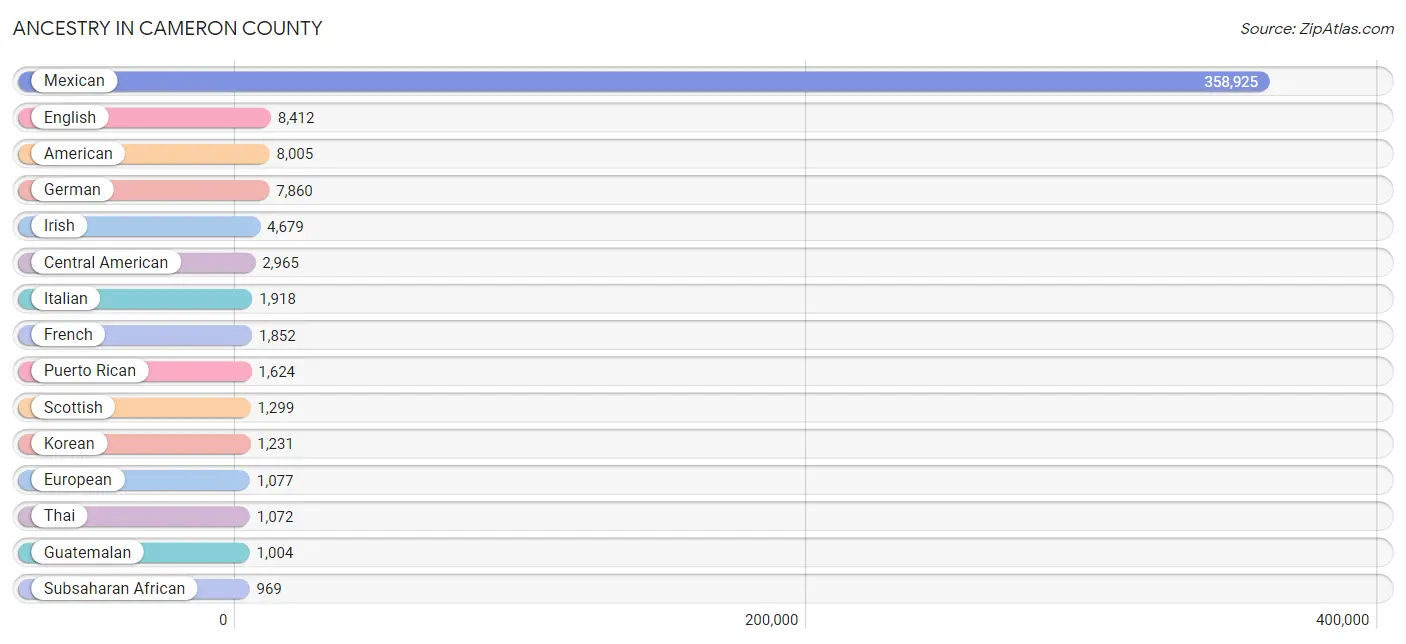
Ancestry in Cameron County
The most populous ancestries reported in Cameron County are Mexican (358,925 | 85.1%), English (8,412 | 2.0%), American (8,005 | 1.9%), German (7,860 | 1.9%), and Irish (4,679 | 1.1%), together accounting for 91.9% of all Cameron County residents.
| Ancestry | # Population | % Population |
| African | 843 | 0.2% |
| Albanian | 56 | 0.0% |
| American | 8,005 | 1.9% |
| Apache | 83 | 0.0% |
| Arab | 223 | 0.1% |
| Argentinean | 86 | 0.0% |
| Armenian | 41 | 0.0% |
| Assyrian / Chaldean / Syriac | 2 | 0.0% |
| Austrian | 55 | 0.0% |
| Basque | 8 | 0.0% |
| Belgian | 27 | 0.0% |
| Belizean | 29 | 0.0% |
| Bhutanese | 205 | 0.1% |
| Blackfeet | 60 | 0.0% |
| Bolivian | 32 | 0.0% |
| Brazilian | 17 | 0.0% |
| British | 486 | 0.1% |
| Bulgarian | 93 | 0.0% |
| Burmese | 93 | 0.0% |
| Cajun | 30 | 0.0% |
| Canadian | 281 | 0.1% |
| Central American | 2,965 | 0.7% |
| Central American Indian | 261 | 0.1% |
| Cherokee | 242 | 0.1% |
| Chickasaw | 102 | 0.0% |
| Chilean | 48 | 0.0% |
| Choctaw | 120 | 0.0% |
| Colombian | 138 | 0.0% |
| Comanche | 22 | 0.0% |
| Costa Rican | 19 | 0.0% |
| Creek | 6 | 0.0% |
| Croatian | 5 | 0.0% |
| Cuban | 630 | 0.2% |
| Czech | 406 | 0.1% |
| Czechoslovakian | 57 | 0.0% |
| Danish | 95 | 0.0% |
| Dominican | 383 | 0.1% |
| Dutch | 556 | 0.1% |
| Eastern European | 231 | 0.1% |
| Ecuadorian | 106 | 0.0% |
| Egyptian | 17 | 0.0% |
| English | 8,412 | 2.0% |
| European | 1,077 | 0.3% |
| Filipino | 1 | 0.0% |
| Finnish | 89 | 0.0% |
| French | 1,852 | 0.4% |
| French Canadian | 366 | 0.1% |
| German | 7,860 | 1.9% |
| Ghanaian | 14 | 0.0% |
| Guamanian / Chamorro | 252 | 0.1% |
| Guatemalan | 1,004 | 0.2% |
| Honduran | 761 | 0.2% |
| Hungarian | 236 | 0.1% |
| Icelander | 4 | 0.0% |
| Indian (Asian) | 403 | 0.1% |
| Iranian | 24 | 0.0% |
| Irish | 4,679 | 1.1% |
| Iroquois | 44 | 0.0% |
| Israeli | 55 | 0.0% |
| Italian | 1,918 | 0.4% |
| Jamaican | 27 | 0.0% |
| Korean | 1,231 | 0.3% |
| Laotian | 5 | 0.0% |
| Latvian | 10 | 0.0% |
| Lebanese | 92 | 0.0% |
| Lithuanian | 59 | 0.0% |
| Mexican | 358,925 | 85.1% |
| Mexican American Indian | 847 | 0.2% |
| Native Hawaiian | 221 | 0.1% |
| Navajo | 116 | 0.0% |
| Nicaraguan | 337 | 0.1% |
| Nigerian | 16 | 0.0% |
| Northern European | 234 | 0.1% |
| Norwegian | 568 | 0.1% |
| Osage | 48 | 0.0% |
| Pakistani | 23 | 0.0% |
| Panamanian | 22 | 0.0% |
| Paraguayan | 8 | 0.0% |
| Pennsylvania German | 19 | 0.0% |
| Peruvian | 41 | 0.0% |
| Polish | 867 | 0.2% |
| Portuguese | 280 | 0.1% |
| Potawatomi | 13 | 0.0% |
| Pueblo | 16 | 0.0% |
| Puerto Rican | 1,624 | 0.4% |
| Romanian | 87 | 0.0% |
| Russian | 340 | 0.1% |
| Salvadoran | 822 | 0.2% |
| Samoan | 100 | 0.0% |
| Scandinavian | 234 | 0.1% |
| Scotch-Irish | 701 | 0.2% |
| Scottish | 1,299 | 0.3% |
| Serbian | 8 | 0.0% |
| Sioux | 11 | 0.0% |
| Slavic | 81 | 0.0% |
| Slovak | 57 | 0.0% |
| Slovene | 1 | 0.0% |
| South African | 5 | 0.0% |
| South American | 748 | 0.2% |
| Spaniard | 741 | 0.2% |
| Spanish | 302 | 0.1% |
| Spanish American | 21 | 0.0% |
| Sri Lankan | 773 | 0.2% |
| Subsaharan African | 969 | 0.2% |
| Sudanese | 91 | 0.0% |
| Swedish | 739 | 0.2% |
| Swiss | 180 | 0.0% |
| Syrian | 30 | 0.0% |
| Thai | 1,072 | 0.3% |
| Turkish | 1 | 0.0% |
| Ukrainian | 104 | 0.0% |
| Uruguayan | 12 | 0.0% |
| Venezuelan | 277 | 0.1% |
| Vietnamese | 17 | 0.0% |
| Welsh | 329 | 0.1% |
| Yakama | 11 | 0.0% |
| Yugoslavian | 20 | 0.0% | View All 117 Rows |
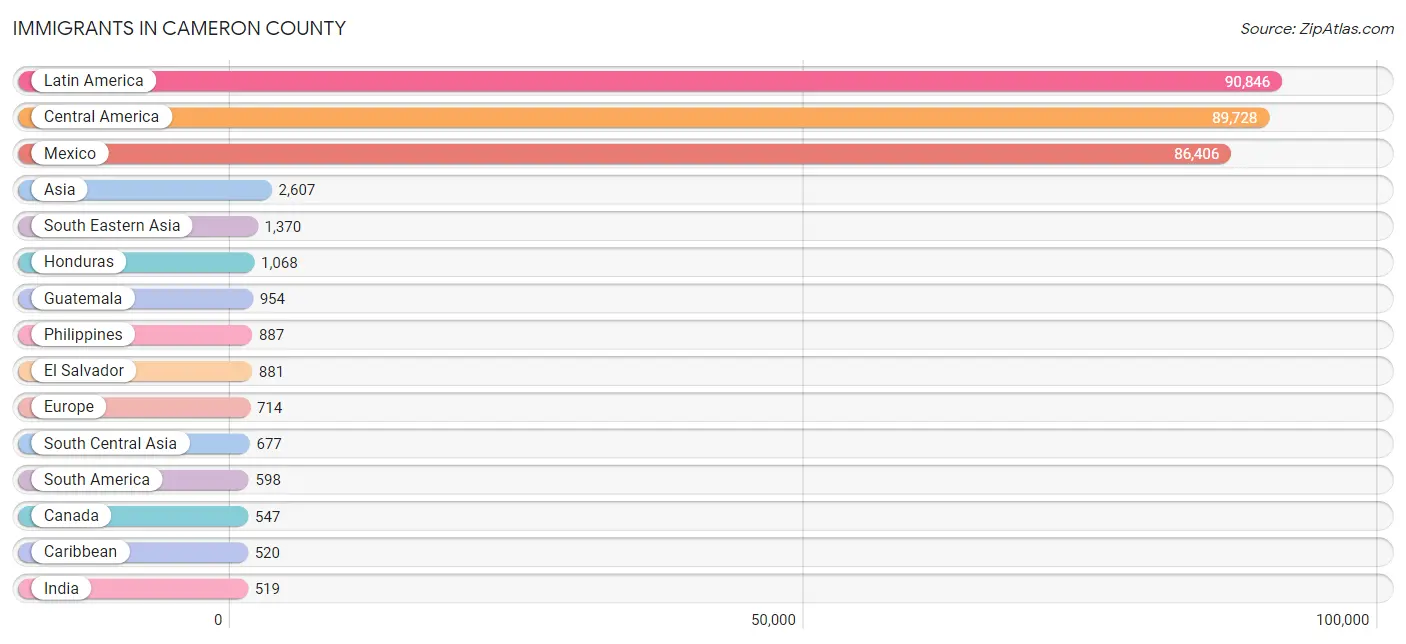
Immigrants in Cameron County
The most numerous immigrant groups reported in Cameron County came from Latin America (90,846 | 21.5%), Central America (89,728 | 21.3%), Mexico (86,406 | 20.5%), Asia (2,607 | 0.6%), and South Eastern Asia (1,370 | 0.3%), together accounting for 64.2% of all Cameron County residents.
| Immigration Origin | # Population | % Population |
| Africa | 159 | 0.0% |
| Albania | 46 | 0.0% |
| Argentina | 134 | 0.0% |
| Armenia | 30 | 0.0% |
| Asia | 2,607 | 0.6% |
| Australia | 54 | 0.0% |
| Bangladesh | 17 | 0.0% |
| Belize | 34 | 0.0% |
| Bolivia | 8 | 0.0% |
| Brazil | 10 | 0.0% |
| Bulgaria | 85 | 0.0% |
| Canada | 547 | 0.1% |
| Caribbean | 520 | 0.1% |
| Central America | 89,728 | 21.3% |
| Chile | 24 | 0.0% |
| China | 225 | 0.1% |
| Colombia | 116 | 0.0% |
| Costa Rica | 40 | 0.0% |
| Croatia | 2 | 0.0% |
| Cuba | 373 | 0.1% |
| Dominican Republic | 147 | 0.0% |
| Eastern Africa | 11 | 0.0% |
| Eastern Asia | 332 | 0.1% |
| Eastern Europe | 285 | 0.1% |
| Ecuador | 78 | 0.0% |
| Egypt | 8 | 0.0% |
| El Salvador | 881 | 0.2% |
| England | 45 | 0.0% |
| Ethiopia | 11 | 0.0% |
| Europe | 714 | 0.2% |
| France | 49 | 0.0% |
| Germany | 129 | 0.0% |
| Guatemala | 954 | 0.2% |
| Honduras | 1,068 | 0.3% |
| Hong Kong | 32 | 0.0% |
| Hungary | 9 | 0.0% |
| India | 519 | 0.1% |
| Iran | 20 | 0.0% |
| Iraq | 10 | 0.0% |
| Ireland | 1 | 0.0% |
| Israel | 55 | 0.0% |
| Italy | 48 | 0.0% |
| Japan | 68 | 0.0% |
| Korea | 39 | 0.0% |
| Latin America | 90,846 | 21.5% |
| Malaysia | 5 | 0.0% |
| Mexico | 86,406 | 20.5% |
| Nepal | 7 | 0.0% |
| Netherlands | 5 | 0.0% |
| Nicaragua | 323 | 0.1% |
| Nigeria | 16 | 0.0% |
| Northern Africa | 99 | 0.0% |
| Northern Europe | 129 | 0.0% |
| Oceania | 54 | 0.0% |
| Pakistan | 48 | 0.0% |
| Panama | 22 | 0.0% |
| Peru | 41 | 0.0% |
| Philippines | 887 | 0.2% |
| Poland | 30 | 0.0% |
| Portugal | 9 | 0.0% |
| Romania | 7 | 0.0% |
| Russia | 93 | 0.0% |
| Serbia | 12 | 0.0% |
| Singapore | 31 | 0.0% |
| South Africa | 5 | 0.0% |
| South America | 598 | 0.1% |
| South Central Asia | 677 | 0.2% |
| South Eastern Asia | 1,370 | 0.3% |
| Southern Europe | 98 | 0.0% |
| Spain | 41 | 0.0% |
| Sudan | 91 | 0.0% |
| Sweden | 8 | 0.0% |
| Switzerland | 19 | 0.0% |
| Syria | 17 | 0.0% |
| Taiwan | 81 | 0.0% |
| Turkey | 1 | 0.0% |
| Uruguay | 12 | 0.0% |
| Venezuela | 167 | 0.0% |
| Vietnam | 447 | 0.1% |
| Western Africa | 44 | 0.0% |
| Western Asia | 160 | 0.0% |
| Western Europe | 202 | 0.1% | View All 82 Rows |
Sex and Age in Cameron County
Sex and Age in Cameron County
The most populous age groups in Cameron County are 15 to 19 Years (19,038 | 9.1%) for men and 10 to 14 Years (18,044 | 8.4%) for women.
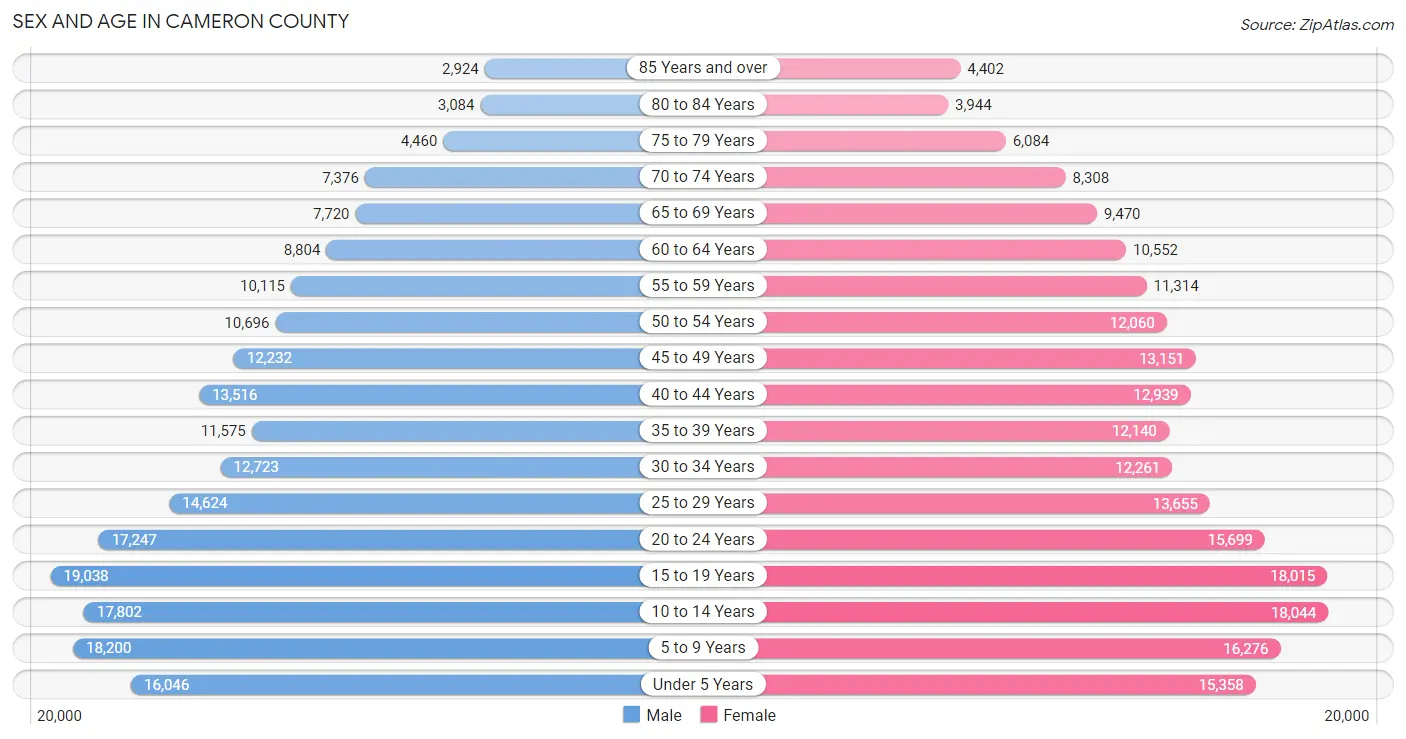
| Age Bracket | Male | Female |
| Under 5 Years | 16,046 (7.7%) | 15,358 (7.2%) |
| 5 to 9 Years | 18,200 (8.7%) | 16,276 (7.6%) |
| 10 to 14 Years | 17,802 (8.6%) | 18,044 (8.4%) |
| 15 to 19 Years | 19,038 (9.1%) | 18,015 (8.4%) |
| 20 to 24 Years | 17,247 (8.3%) | 15,699 (7.3%) |
| 25 to 29 Years | 14,624 (7.0%) | 13,655 (6.4%) |
| 30 to 34 Years | 12,723 (6.1%) | 12,261 (5.7%) |
| 35 to 39 Years | 11,575 (5.6%) | 12,140 (5.7%) |
| 40 to 44 Years | 13,516 (6.5%) | 12,939 (6.1%) |
| 45 to 49 Years | 12,232 (5.9%) | 13,151 (6.1%) |
| 50 to 54 Years | 10,696 (5.1%) | 12,060 (5.6%) |
| 55 to 59 Years | 10,115 (4.9%) | 11,314 (5.3%) |
| 60 to 64 Years | 8,804 (4.2%) | 10,552 (4.9%) |
| 65 to 69 Years | 7,720 (3.7%) | 9,470 (4.4%) |
| 70 to 74 Years | 7,376 (3.5%) | 8,308 (3.9%) |
| 75 to 79 Years | 4,460 (2.1%) | 6,084 (2.9%) |
| 80 to 84 Years | 3,084 (1.5%) | 3,944 (1.8%) |
| 85 Years and over | 2,924 (1.4%) | 4,402 (2.1%) |
| Total | 208,182 (100.0%) | 213,672 (100.0%) |
Families and Households in Cameron County
Median Family Size in Cameron County
The median family size in Cameron County is 3.70 persons per family, with married-couple families (64,192 | 63.2%) accounting for the largest median family size of 3.79 persons per family. On the other hand, single male/father families (10,246 | 10.1%) represent the smallest median family size with 3.17 persons per family.
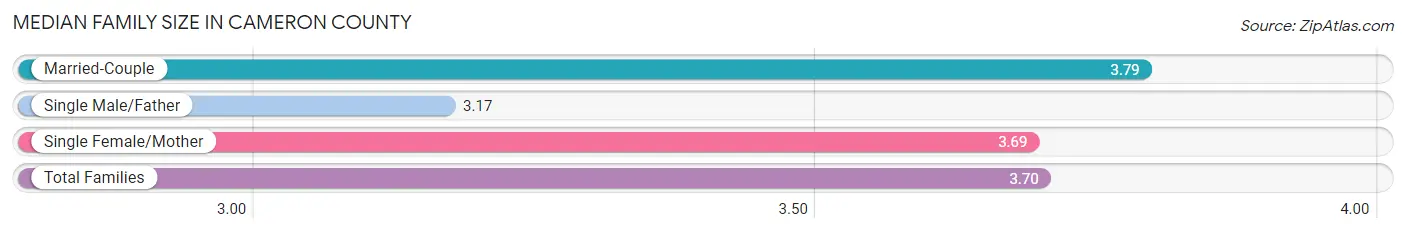
| Family Type | # Families | Family Size |
| Married-Couple | 64,192 (63.2%) | 3.79 |
| Single Male/Father | 10,246 (10.1%) | 3.17 |
| Single Female/Mother | 27,106 (26.7%) | 3.69 |
| Total Families | 101,544 (100.0%) | 3.70 |
Median Household Size in Cameron County
The median household size in Cameron County is 3.16 persons per household, with single female/mother households (27,106 | 20.4%) accounting for the largest median household size of 3.83 persons per household. non-family households (30,994 | 23.4%) represent the smallest median household size with 1.14 persons per household.
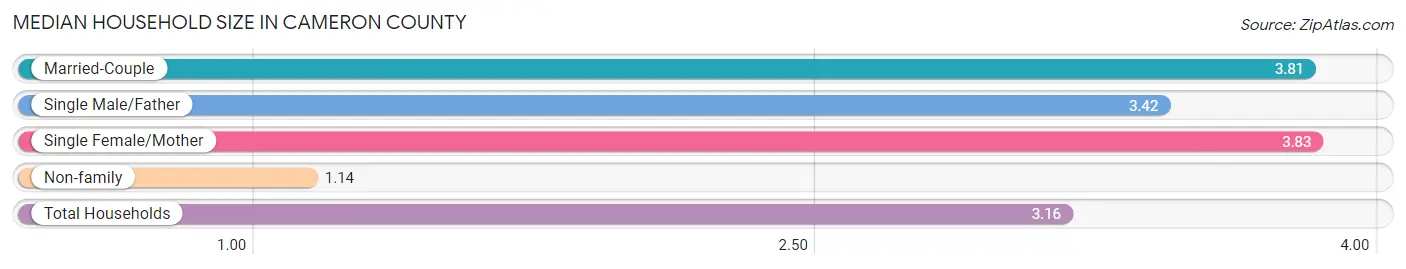
| Household Type | # Households | Household Size |
| Married-Couple | 64,192 (48.4%) | 3.81 |
| Single Male/Father | 10,246 (7.7%) | 3.42 |
| Single Female/Mother | 27,106 (20.4%) | 3.83 |
| Non-family | 30,994 (23.4%) | 1.14 |
| Total Households | 132,538 (100.0%) | 3.16 |
Household Size by Marriage Status in Cameron County
Out of a total of 132,538 households in Cameron County, 101,544 (76.6%) are family households, while 30,994 (23.4%) are nonfamily households. The most numerous type of family households are 2-person households, comprising 33,053, and the most common type of nonfamily households are 1-person households, comprising 27,435.
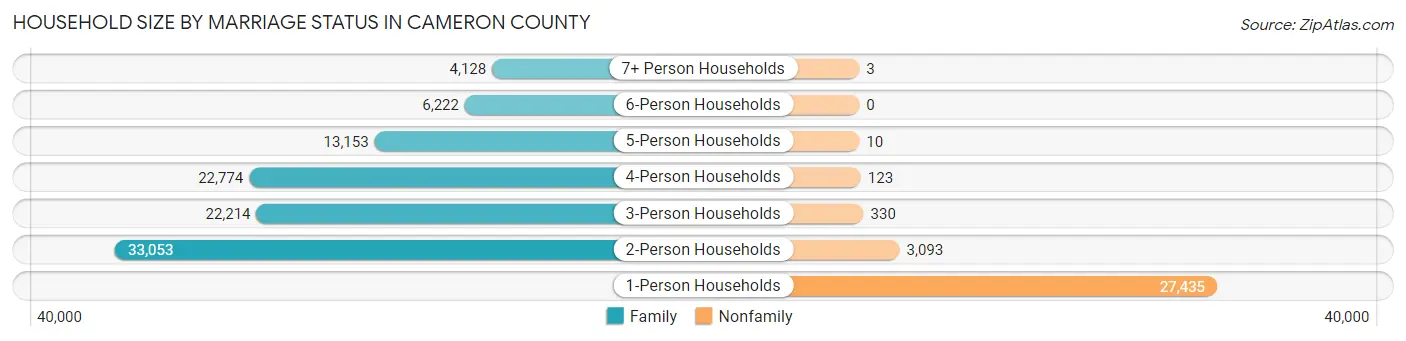
| Household Size | Family Households | Nonfamily Households |
| 1-Person Households | - | 27,435 (20.7%) |
| 2-Person Households | 33,053 (24.9%) | 3,093 (2.3%) |
| 3-Person Households | 22,214 (16.8%) | 330 (0.3%) |
| 4-Person Households | 22,774 (17.2%) | 123 (0.1%) |
| 5-Person Households | 13,153 (9.9%) | 10 (0.0%) |
| 6-Person Households | 6,222 (4.7%) | 0 (0.0%) |
| 7+ Person Households | 4,128 (3.1%) | 3 (0.0%) |
| Total | 101,544 (76.6%) | 30,994 (23.4%) |
Female Fertility in Cameron County
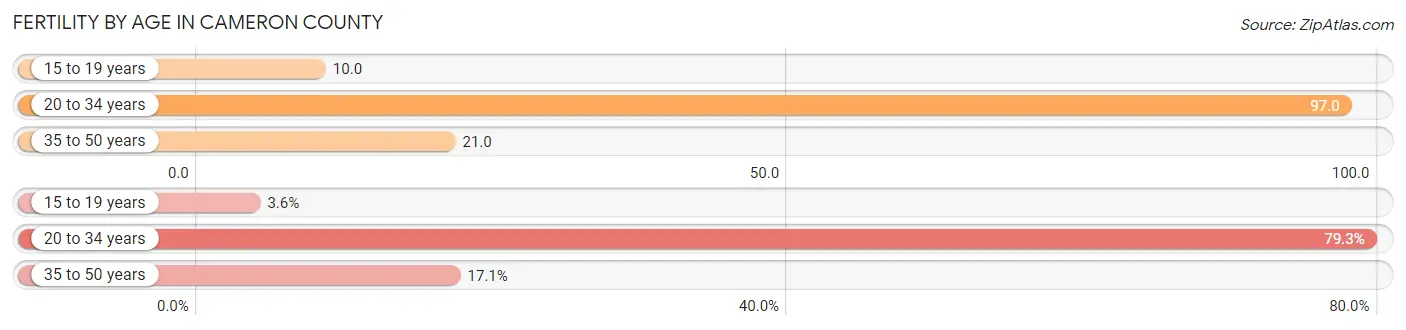
Fertility by Age in Cameron County
Average fertility rate in Cameron County is 51.0 births per 1,000 women. Women in the age bracket of 20 to 34 years have the highest fertility rate with 97.0 births per 1,000 women. Women in the age bracket of 20 to 34 years acount for 79.3% of all women with births.
| Age Bracket | Women with Births | Births / 1,000 Women |
| 15 to 19 years | 182 (3.6%) | 10.0 |
| 20 to 34 years | 4,052 (79.3%) | 97.0 |
| 35 to 50 years | 876 (17.1%) | 21.0 |
| Total | 5,110 (100.0%) | 51.0 |
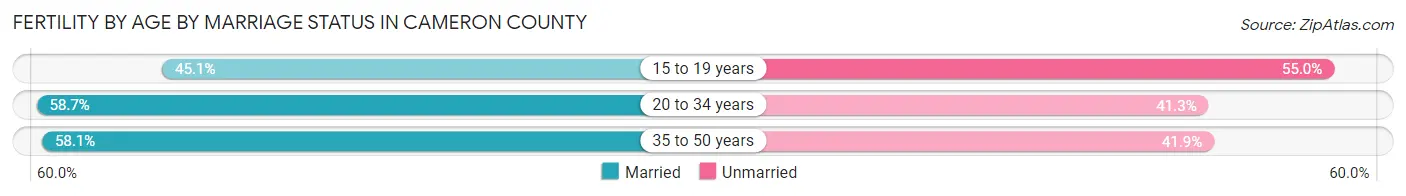
Fertility by Age by Marriage Status in Cameron County
58.1% of women with births (5,110) in Cameron County are married. The highest percentage of unmarried women with births falls into 15 to 19 years age bracket with 54.9% of them unmarried at the time of birth, while the lowest percentage of unmarried women with births belong to 20 to 34 years age bracket with 41.3% of them unmarried.
| Age Bracket | Married | Unmarried |
| 15 to 19 years | 82 (45.1%) | 100 (54.9%) |
| 20 to 34 years | 2,379 (58.7%) | 1,673 (41.3%) |
| 35 to 50 years | 509 (58.1%) | 367 (41.9%) |
| Total | 2,969 (58.1%) | 2,141 (41.9%) |
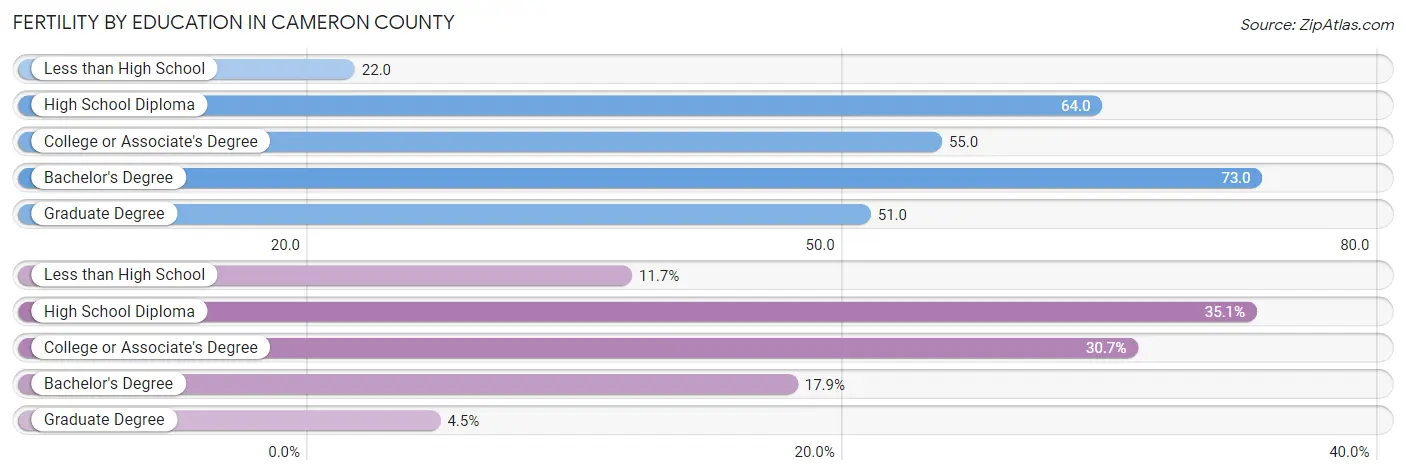
Fertility by Education in Cameron County
Average fertility rate in Cameron County is 51.0 births per 1,000 women. Women with the education attainment of bachelor's degree have the highest fertility rate of 73.0 births per 1,000 women, while women with the education attainment of less than high school have the lowest fertility at 22.0 births per 1,000 women. Women with the education attainment of high school diploma represent 35.1% of all women with births.
| Educational Attainment | Women with Births | Births / 1,000 Women |
| Less than High School | 599 (11.7%) | 22.0 |
| High School Diploma | 1,795 (35.1%) | 64.0 |
| College or Associate's Degree | 1,568 (30.7%) | 55.0 |
| Bachelor's Degree | 916 (17.9%) | 73.0 |
| Graduate Degree | 232 (4.5%) | 51.0 |
| Total | 5,110 (100.0%) | 51.0 |
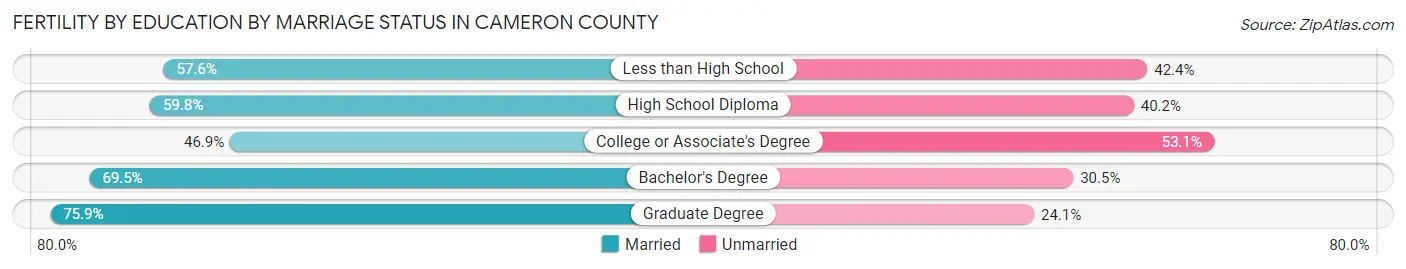
Fertility by Education by Marriage Status in Cameron County
41.9% of women with births in Cameron County are unmarried. Women with the educational attainment of graduate degree are most likely to be married with 75.9% of them married at childbirth, while women with the educational attainment of college or associate's degree are least likely to be married with 53.1% of them unmarried at childbirth.
| Educational Attainment | Married | Unmarried |
| Less than High School | 345 (57.6%) | 254 (42.4%) |
| High School Diploma | 1,073 (59.8%) | 722 (40.2%) |
| College or Associate's Degree | 735 (46.9%) | 833 (53.1%) |
| Bachelor's Degree | 637 (69.5%) | 279 (30.5%) |
| Graduate Degree | 176 (75.9%) | 56 (24.1%) |
| Total | 2,969 (58.1%) | 2,141 (41.9%) |
Employment Characteristics in Cameron County
Employment by Class of Employer in Cameron County
Among the 166,691 employed individuals in Cameron County, private company employees (108,250 | 64.9%), local government employees (19,087 | 11.5%), and self-employed (not incorporated) (14,412 | 8.6%) make up the most common classes of employment.
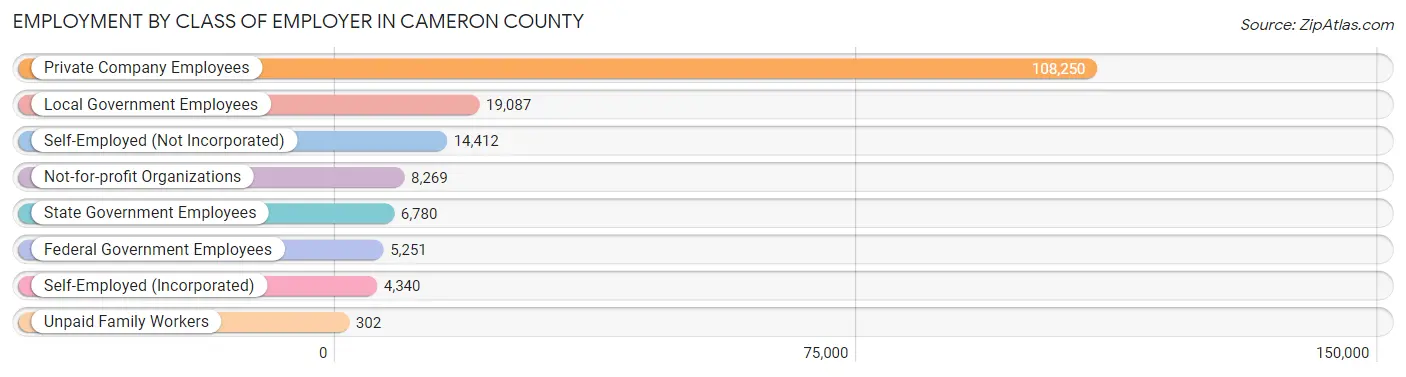
| Employer Class | # Employees | % Employees |
| Private Company Employees | 108,250 | 64.9% |
| Self-Employed (Incorporated) | 4,340 | 2.6% |
| Self-Employed (Not Incorporated) | 14,412 | 8.6% |
| Not-for-profit Organizations | 8,269 | 5.0% |
| Local Government Employees | 19,087 | 11.5% |
| State Government Employees | 6,780 | 4.1% |
| Federal Government Employees | 5,251 | 3.2% |
| Unpaid Family Workers | 302 | 0.2% |
| Total | 166,691 | 100.0% |
Employment Status by Age in Cameron County
According to the labor force statistics for Cameron County, out of the total population over 16 years of age (312,892), 57.2% or 178,974 individuals are in the labor force, with 5.7% or 10,202 of them unemployed. The age group with the highest labor force participation rate is 30 to 34 years, with 78.8% or 19,687 individuals in the labor force. Within the labor force, the 16 to 19 years age range has the highest percentage of unemployed individuals, with 19.8% or 1,204 of them being unemployed.
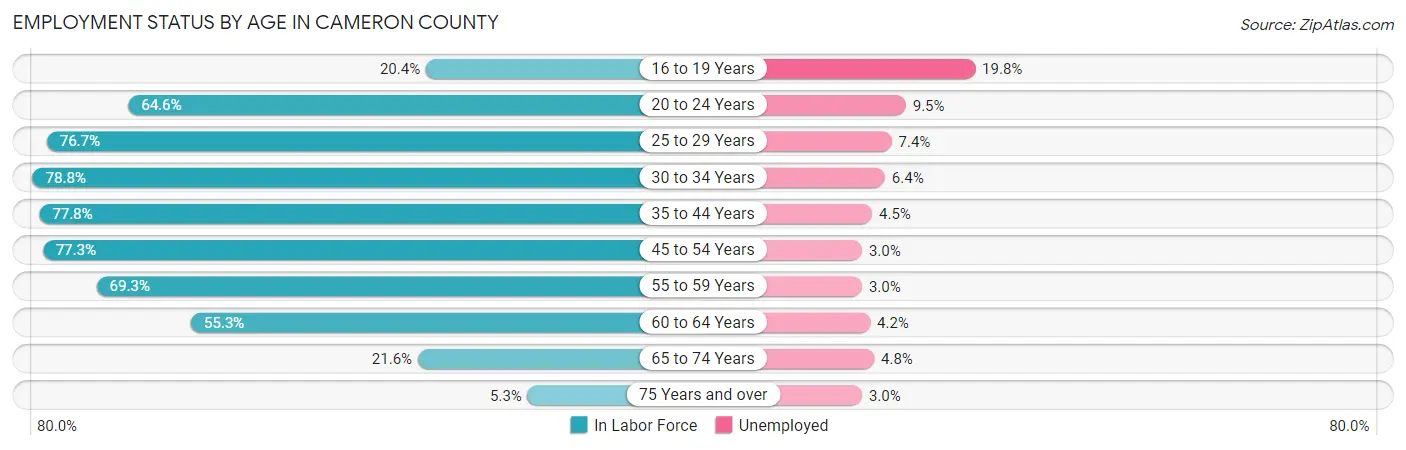
| Age Bracket | In Labor Force | Unemployed |
| 16 to 19 Years | 6,083 (20.4%) | 1,204 (19.8%) |
| 20 to 24 Years | 21,283 (64.6%) | 2,022 (9.5%) |
| 25 to 29 Years | 21,690 (76.7%) | 1,605 (7.4%) |
| 30 to 34 Years | 19,687 (78.8%) | 1,260 (6.4%) |
| 35 to 44 Years | 39,032 (77.8%) | 1,756 (4.5%) |
| 45 to 54 Years | 37,211 (77.3%) | 1,116 (3.0%) |
| 55 to 59 Years | 14,850 (69.3%) | 446 (3.0%) |
| 60 to 64 Years | 10,704 (55.3%) | 450 (4.2%) |
| 65 to 74 Years | 7,101 (21.6%) | 341 (4.8%) |
| 75 Years and over | 1,320 (5.3%) | 40 (3.0%) |
| Total | 178,974 (57.2%) | 10,202 (5.7%) |
Employment Status by Educational Attainment in Cameron County
According to labor force statistics for Cameron County, 74.4% of individuals (143,114) out of the total population between 25 and 64 years of age (192,357) are in the labor force, with 4.6% or 6,583 of them being unemployed. The group with the highest labor force participation rate are those with the educational attainment of bachelor's degree or higher, with 85.0% or 34,082 individuals in the labor force. Within the labor force, individuals with high school diploma education have the highest percentage of unemployment, with 6.0% or 2,255 of them being unemployed.
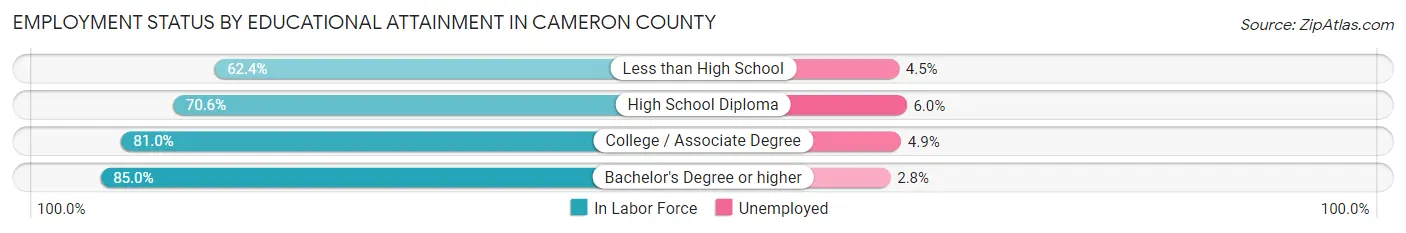
| Educational Attainment | In Labor Force | Unemployed |
| Less than High School | 29,146 (62.4%) | 2,102 (4.5%) |
| High School Diploma | 37,583 (70.6%) | 3,194 (6.0%) |
| College / Associate Degree | 42,378 (81.0%) | 2,564 (4.9%) |
| Bachelor's Degree or higher | 34,082 (85.0%) | 1,123 (2.8%) |
| Total | 143,114 (74.4%) | 8,848 (4.6%) |
Employment Occupations by Sex in Cameron County
Management, Business, Science and Arts Occupations
The most common Management, Business, Science and Arts occupations in Cameron County are Community & Social Service (20,216 | 12.0%), Education Instruction & Library (13,922 | 8.3%), Management (11,543 | 6.9%), Health Diagnosing & Treating (8,327 | 4.9%), and Business & Financial (5,553 | 3.3%).
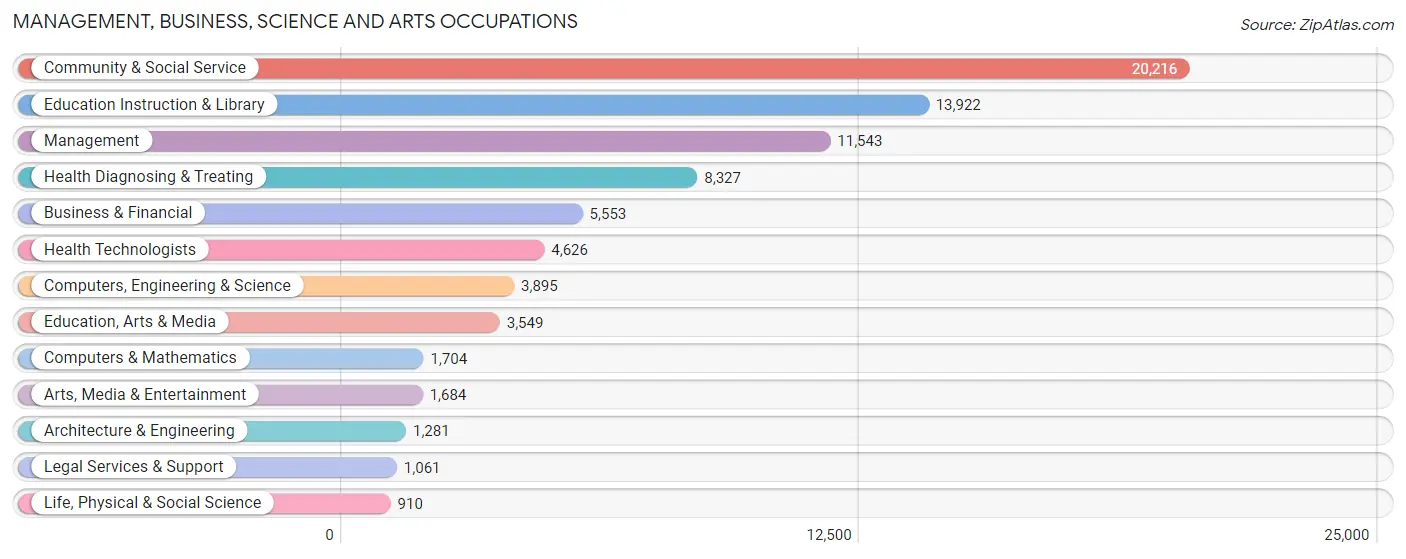
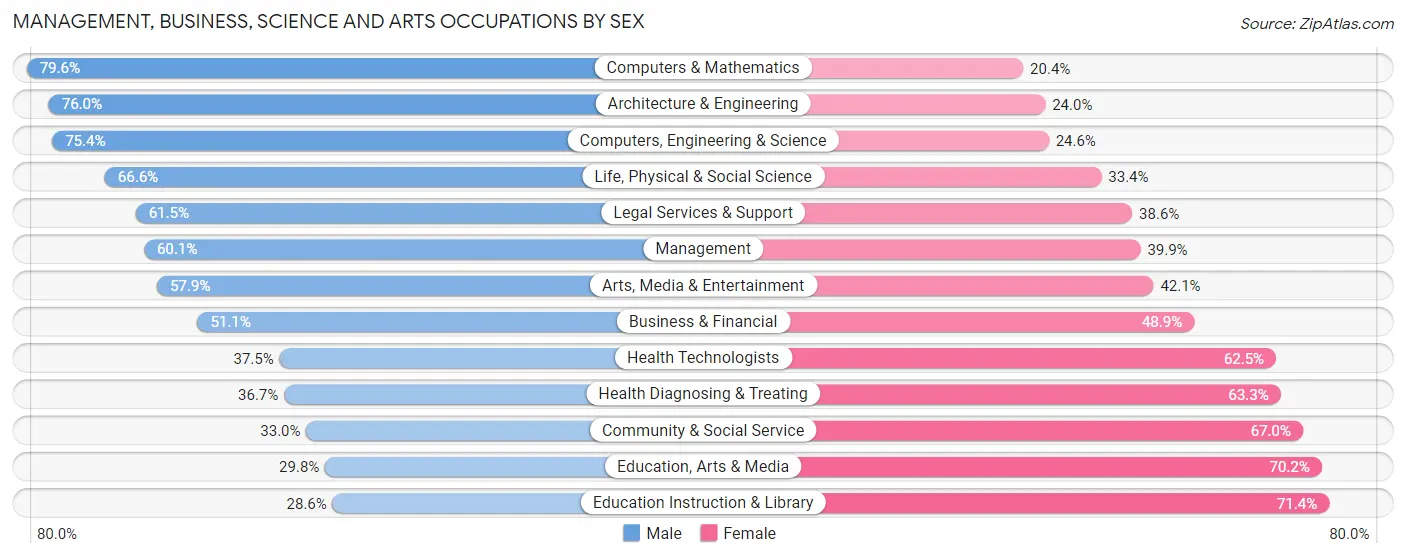
Management, Business, Science and Arts Occupations by Sex
Within the Management, Business, Science and Arts occupations in Cameron County, the most male-oriented occupations are Computers & Mathematics (79.6%), Architecture & Engineering (76.0%), and Computers, Engineering & Science (75.4%), while the most female-oriented occupations are Education Instruction & Library (71.4%), Education, Arts & Media (70.2%), and Community & Social Service (67.0%).
| Occupation | Male | Female |
| Management | 6,934 (60.1%) | 4,609 (39.9%) |
| Business & Financial | 2,840 (51.1%) | 2,713 (48.9%) |
| Computers, Engineering & Science | 2,936 (75.4%) | 959 (24.6%) |
| Computers & Mathematics | 1,357 (79.6%) | 347 (20.4%) |
| Architecture & Engineering | 973 (76.0%) | 308 (24.0%) |
| Life, Physical & Social Science | 606 (66.6%) | 304 (33.4%) |
| Community & Social Service | 6,667 (33.0%) | 13,549 (67.0%) |
| Education, Arts & Media | 1,059 (29.8%) | 2,490 (70.2%) |
| Legal Services & Support | 652 (61.5%) | 409 (38.6%) |
| Education Instruction & Library | 3,981 (28.6%) | 9,941 (71.4%) |
| Arts, Media & Entertainment | 975 (57.9%) | 709 (42.1%) |
| Health Diagnosing & Treating | 3,055 (36.7%) | 5,272 (63.3%) |
| Health Technologists | 1,733 (37.5%) | 2,893 (62.5%) |
| Total (Category) | 22,432 (45.3%) | 27,102 (54.7%) |
| Total (Overall) | 91,366 (54.2%) | 77,184 (45.8%) |
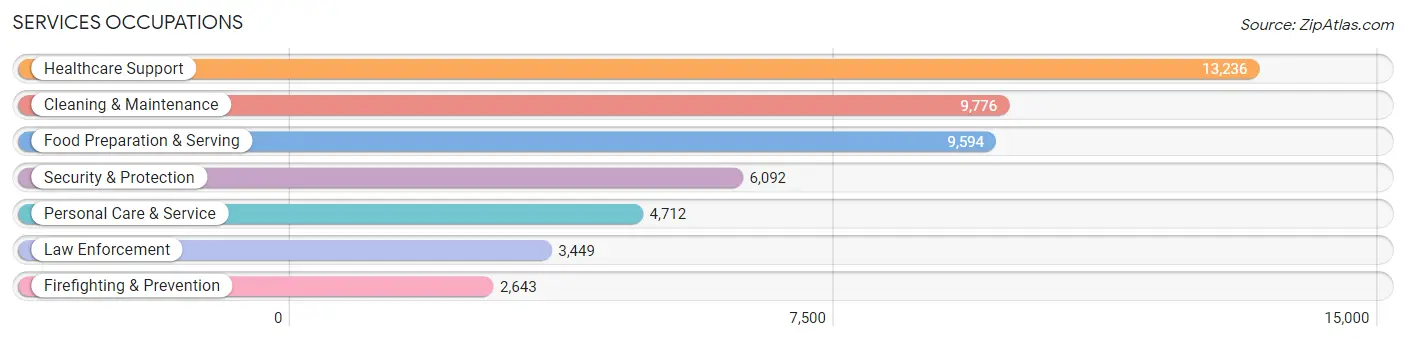
Services Occupations
The most common Services occupations in Cameron County are Healthcare Support (13,236 | 7.9%), Cleaning & Maintenance (9,776 | 5.8%), Food Preparation & Serving (9,594 | 5.7%), Security & Protection (6,092 | 3.6%), and Personal Care & Service (4,712 | 2.8%).
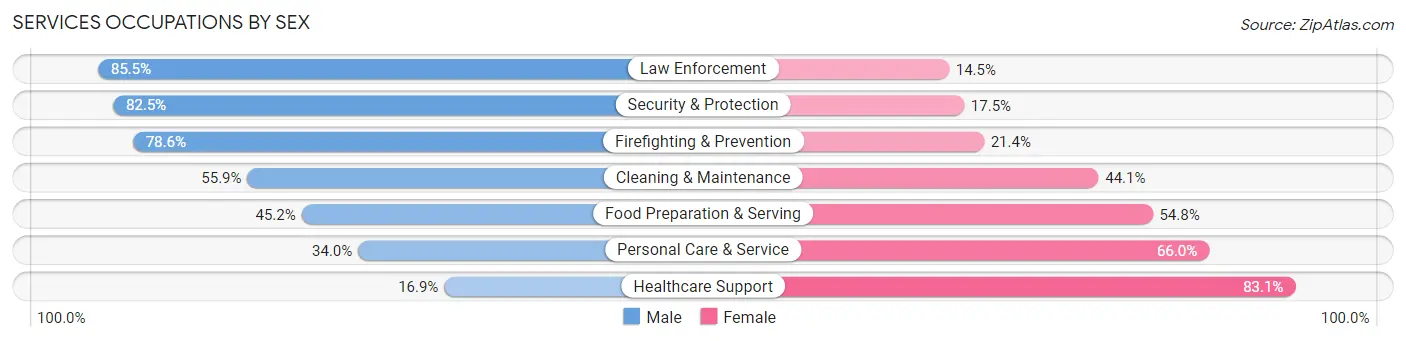
Services Occupations by Sex
Within the Services occupations in Cameron County, the most male-oriented occupations are Law Enforcement (85.5%), Security & Protection (82.5%), and Firefighting & Prevention (78.6%), while the most female-oriented occupations are Healthcare Support (83.1%), Personal Care & Service (66.0%), and Food Preparation & Serving (54.8%).
| Occupation | Male | Female |
| Healthcare Support | 2,238 (16.9%) | 10,998 (83.1%) |
| Security & Protection | 5,026 (82.5%) | 1,066 (17.5%) |
| Firefighting & Prevention | 2,077 (78.6%) | 566 (21.4%) |
| Law Enforcement | 2,949 (85.5%) | 500 (14.5%) |
| Food Preparation & Serving | 4,333 (45.2%) | 5,261 (54.8%) |
| Cleaning & Maintenance | 5,464 (55.9%) | 4,312 (44.1%) |
| Personal Care & Service | 1,600 (34.0%) | 3,112 (66.0%) |
| Total (Category) | 18,661 (43.0%) | 24,749 (57.0%) |
| Total (Overall) | 91,366 (54.2%) | 77,184 (45.8%) |
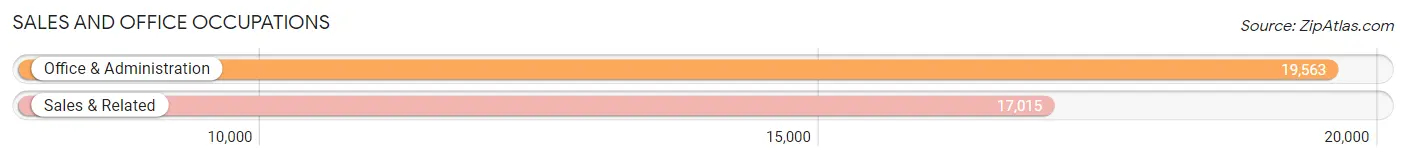
Sales and Office Occupations
The most common Sales and Office occupations in Cameron County are Office & Administration (19,563 | 11.6%), and Sales & Related (17,015 | 10.1%).
Sales and Office Occupations by Sex
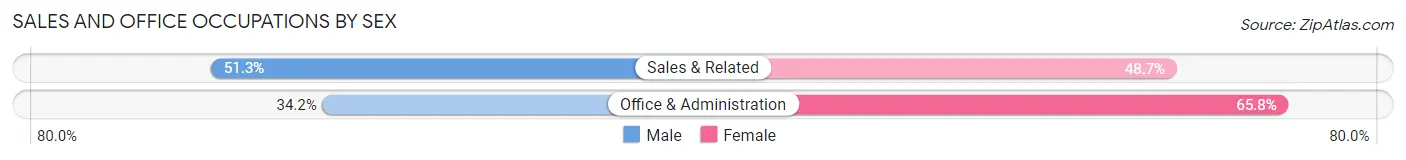
| Occupation | Male | Female |
| Sales & Related | 8,734 (51.3%) | 8,281 (48.7%) |
| Office & Administration | 6,683 (34.2%) | 12,880 (65.8%) |
| Total (Category) | 15,417 (42.1%) | 21,161 (57.9%) |
| Total (Overall) | 91,366 (54.2%) | 77,184 (45.8%) |
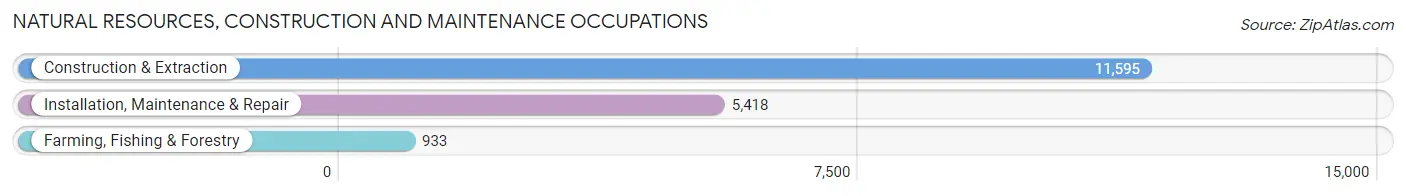
Natural Resources, Construction and Maintenance Occupations
The most common Natural Resources, Construction and Maintenance occupations in Cameron County are Construction & Extraction (11,595 | 6.9%), Installation, Maintenance & Repair (5,418 | 3.2%), and Farming, Fishing & Forestry (933 | 0.5%).
Natural Resources, Construction and Maintenance Occupations by Sex
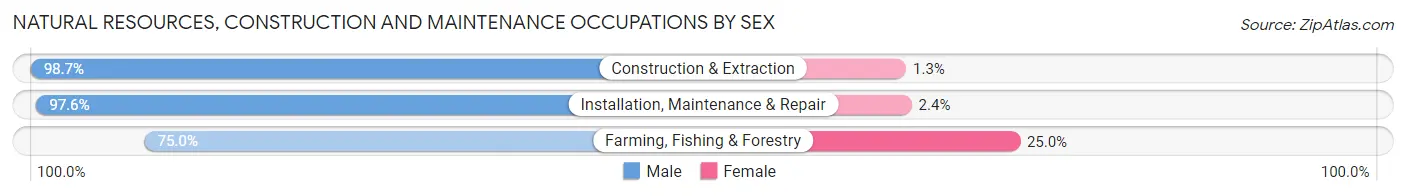
| Occupation | Male | Female |
| Farming, Fishing & Forestry | 700 (75.0%) | 233 (25.0%) |
| Construction & Extraction | 11,447 (98.7%) | 148 (1.3%) |
| Installation, Maintenance & Repair | 5,286 (97.6%) | 132 (2.4%) |
| Total (Category) | 17,433 (97.1%) | 513 (2.9%) |
| Total (Overall) | 91,366 (54.2%) | 77,184 (45.8%) |
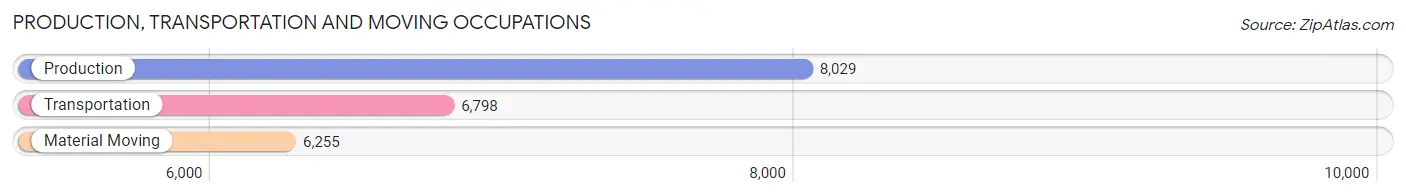
Production, Transportation and Moving Occupations
The most common Production, Transportation and Moving occupations in Cameron County are Production (8,029 | 4.8%), Transportation (6,798 | 4.0%), and Material Moving (6,255 | 3.7%).
Production, Transportation and Moving Occupations by Sex
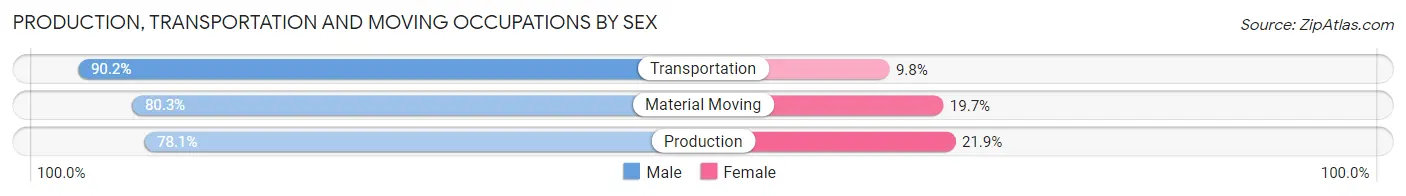
| Occupation | Male | Female |
| Production | 6,268 (78.1%) | 1,761 (21.9%) |
| Transportation | 6,132 (90.2%) | 666 (9.8%) |
| Material Moving | 5,023 (80.3%) | 1,232 (19.7%) |
| Total (Category) | 17,423 (82.6%) | 3,659 (17.4%) |
| Total (Overall) | 91,366 (54.2%) | 77,184 (45.8%) |
Employment Industries by Sex in Cameron County
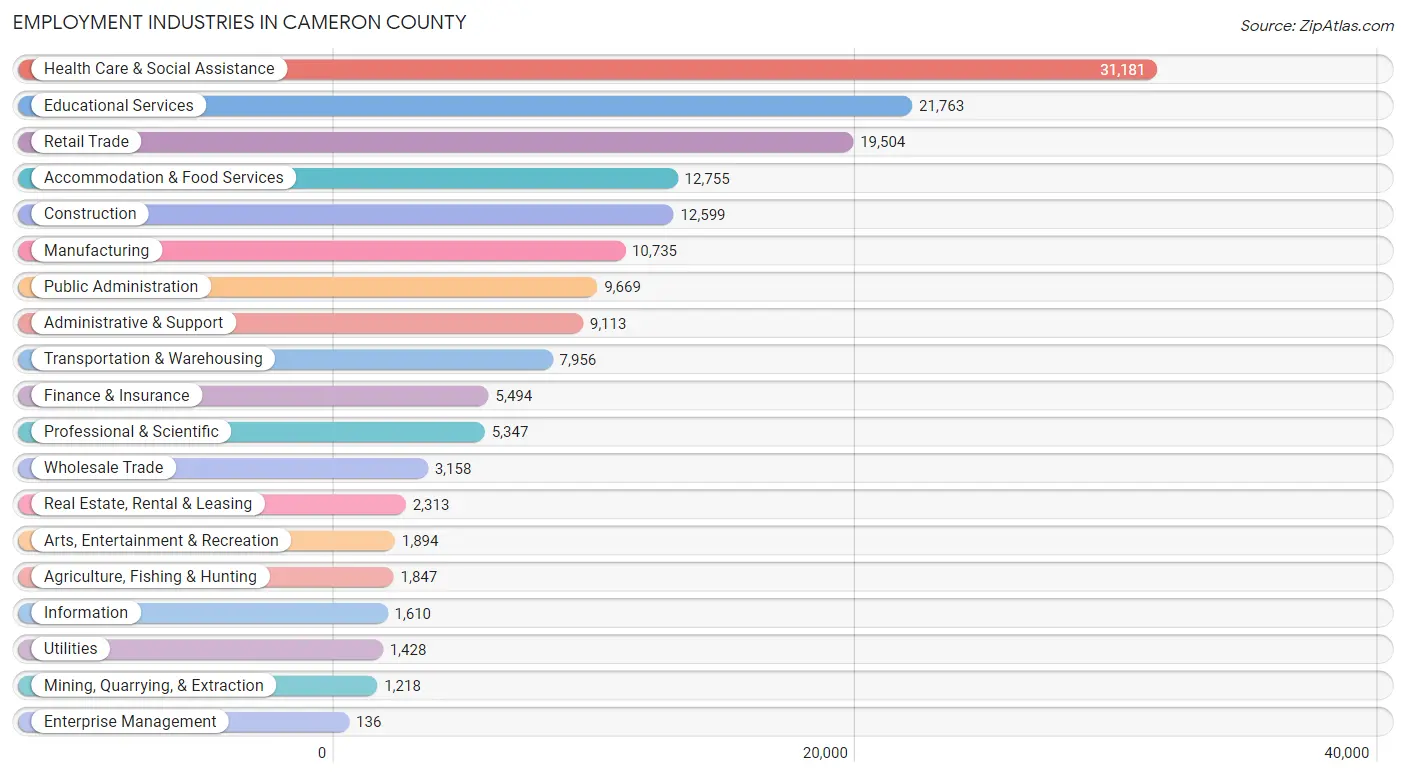
Employment Industries in Cameron County
The major employment industries in Cameron County include Health Care & Social Assistance (31,181 | 18.5%), Educational Services (21,763 | 12.9%), Retail Trade (19,504 | 11.6%), Accommodation & Food Services (12,755 | 7.6%), and Construction (12,599 | 7.5%).
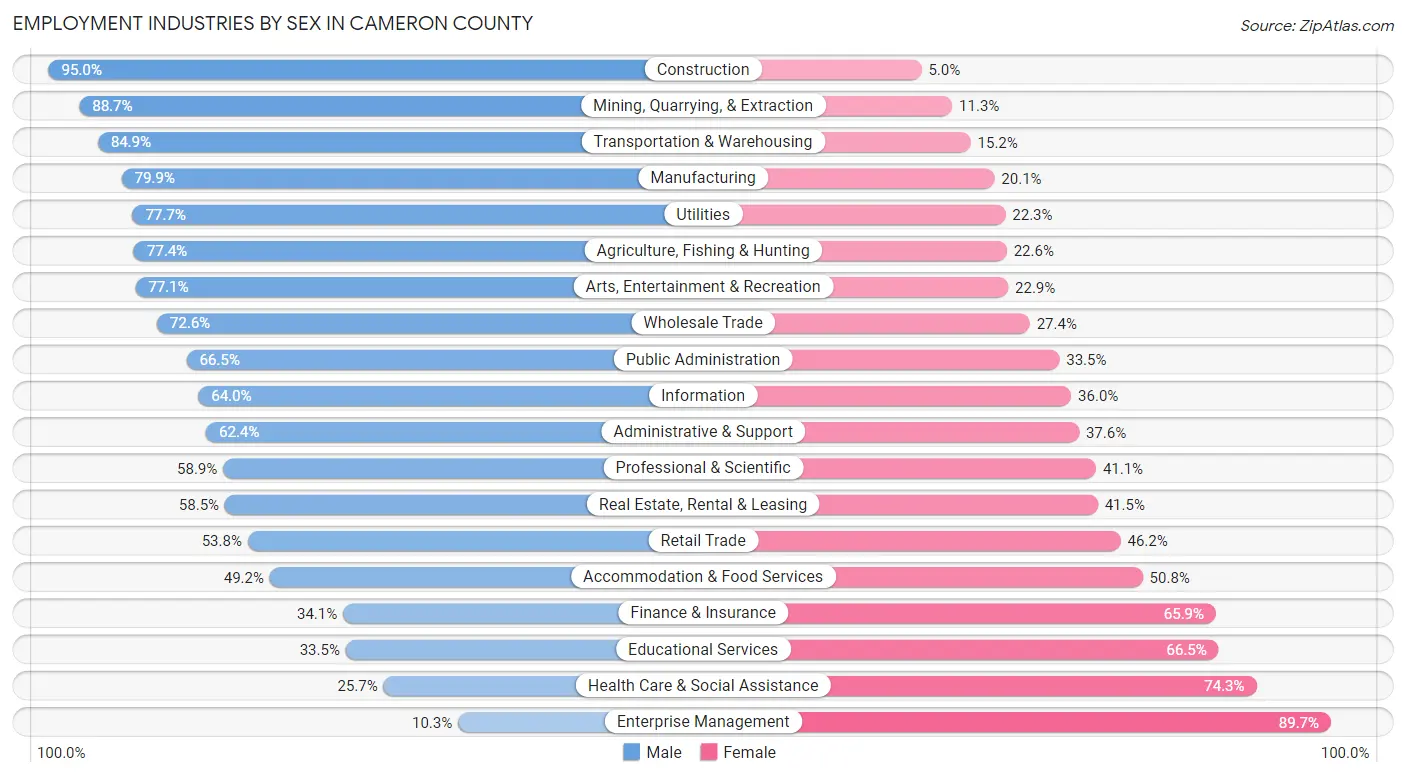
Employment Industries by Sex in Cameron County
The Cameron County industries that see more men than women are Construction (95.0%), Mining, Quarrying, & Extraction (88.7%), and Transportation & Warehousing (84.9%), whereas the industries that tend to have a higher number of women are Enterprise Management (89.7%), Health Care & Social Assistance (74.3%), and Educational Services (66.5%).
| Industry | Male | Female |
| Agriculture, Fishing & Hunting | 1,429 (77.4%) | 418 (22.6%) |
| Mining, Quarrying, & Extraction | 1,080 (88.7%) | 138 (11.3%) |
| Construction | 11,973 (95.0%) | 626 (5.0%) |
| Manufacturing | 8,579 (79.9%) | 2,156 (20.1%) |
| Wholesale Trade | 2,293 (72.6%) | 865 (27.4%) |
| Retail Trade | 10,495 (53.8%) | 9,009 (46.2%) |
| Transportation & Warehousing | 6,751 (84.9%) | 1,205 (15.1%) |
| Utilities | 1,109 (77.7%) | 319 (22.3%) |
| Information | 1,031 (64.0%) | 579 (36.0%) |
| Finance & Insurance | 1,873 (34.1%) | 3,621 (65.9%) |
| Real Estate, Rental & Leasing | 1,354 (58.5%) | 959 (41.5%) |
| Professional & Scientific | 3,150 (58.9%) | 2,197 (41.1%) |
| Enterprise Management | 14 (10.3%) | 122 (89.7%) |
| Administrative & Support | 5,688 (62.4%) | 3,425 (37.6%) |
| Educational Services | 7,298 (33.5%) | 14,465 (66.5%) |
| Health Care & Social Assistance | 8,016 (25.7%) | 23,165 (74.3%) |
| Arts, Entertainment & Recreation | 1,460 (77.1%) | 434 (22.9%) |
| Accommodation & Food Services | 6,280 (49.2%) | 6,475 (50.8%) |
| Public Administration | 6,429 (66.5%) | 3,240 (33.5%) |
| Total | 91,366 (54.2%) | 77,184 (45.8%) |
Education in Cameron County
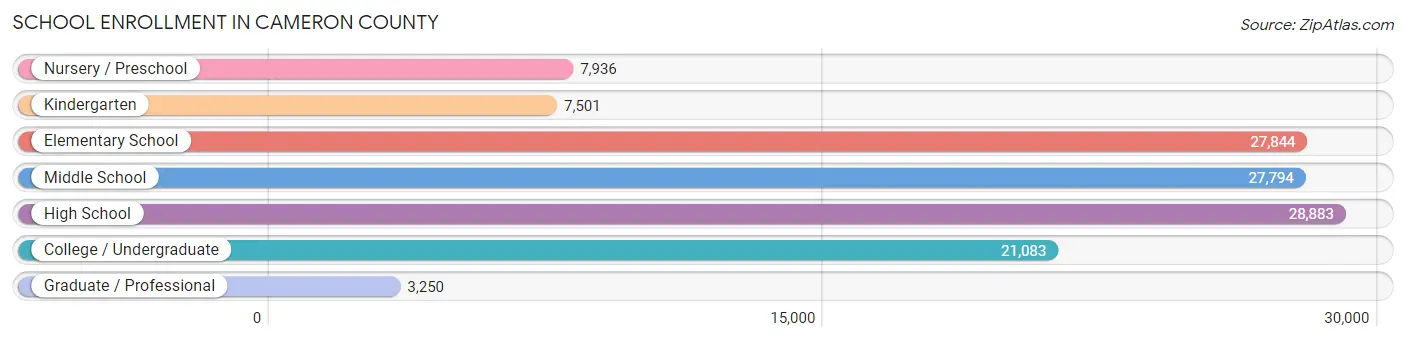
School Enrollment in Cameron County
The most common levels of schooling among the 124,291 students in Cameron County are high school (28,883 | 23.2%), elementary school (27,844 | 22.4%), and middle school (27,794 | 22.4%).
| School Level | # Students | % Students |
| Nursery / Preschool | 7,936 | 6.4% |
| Kindergarten | 7,501 | 6.0% |
| Elementary School | 27,844 | 22.4% |
| Middle School | 27,794 | 22.4% |
| High School | 28,883 | 23.2% |
| College / Undergraduate | 21,083 | 17.0% |
| Graduate / Professional | 3,250 | 2.6% |
| Total | 124,291 | 100.0% |
School Enrollment by Age by Funding Source in Cameron County
Out of a total of 124,291 students who are enrolled in schools in Cameron County, 5,966 (4.8%) attend a private institution, while the remaining 118,325 (95.2%) are enrolled in public schools. The age group of 35 years and over has the highest likelihood of being enrolled in private schools, with 474 (13.0% in the age bracket) enrolled. Conversely, the age group of 5 to 9 year old has the lowest likelihood of being enrolled in a private school, with 31,901 (96.9% in the age bracket) attending a public institution.
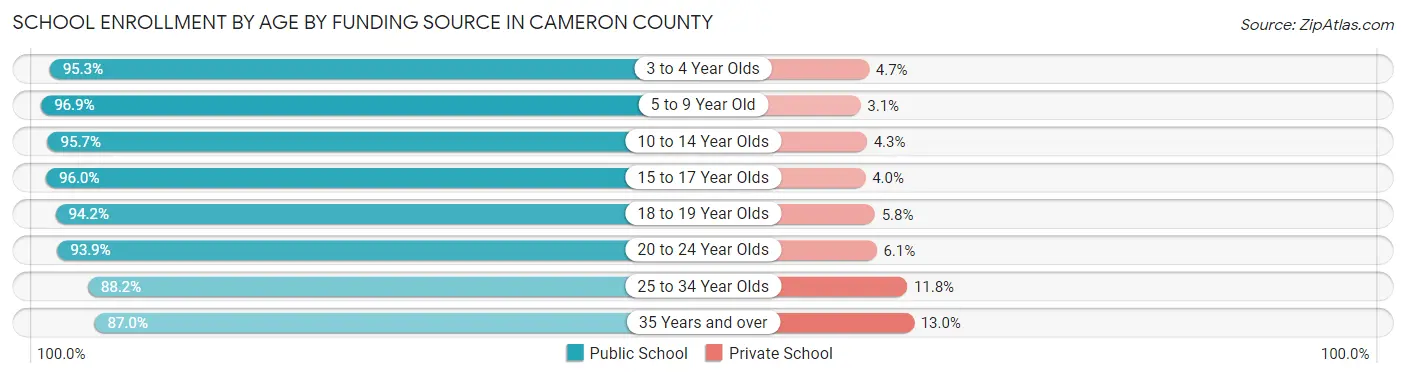
| Age Bracket | Public School | Private School |
| 3 to 4 Year Olds | 6,405 (95.3%) | 315 (4.7%) |
| 5 to 9 Year Old | 31,901 (96.9%) | 1,022 (3.1%) |
| 10 to 14 Year Olds | 32,983 (95.7%) | 1,479 (4.3%) |
| 15 to 17 Year Olds | 20,132 (96.0%) | 840 (4.0%) |
| 18 to 19 Year Olds | 9,006 (94.2%) | 552 (5.8%) |
| 20 to 24 Year Olds | 10,357 (93.9%) | 674 (6.1%) |
| 25 to 34 Year Olds | 4,401 (88.2%) | 588 (11.8%) |
| 35 Years and over | 3,162 (87.0%) | 474 (13.0%) |
| Total | 118,325 (95.2%) | 5,966 (4.8%) |
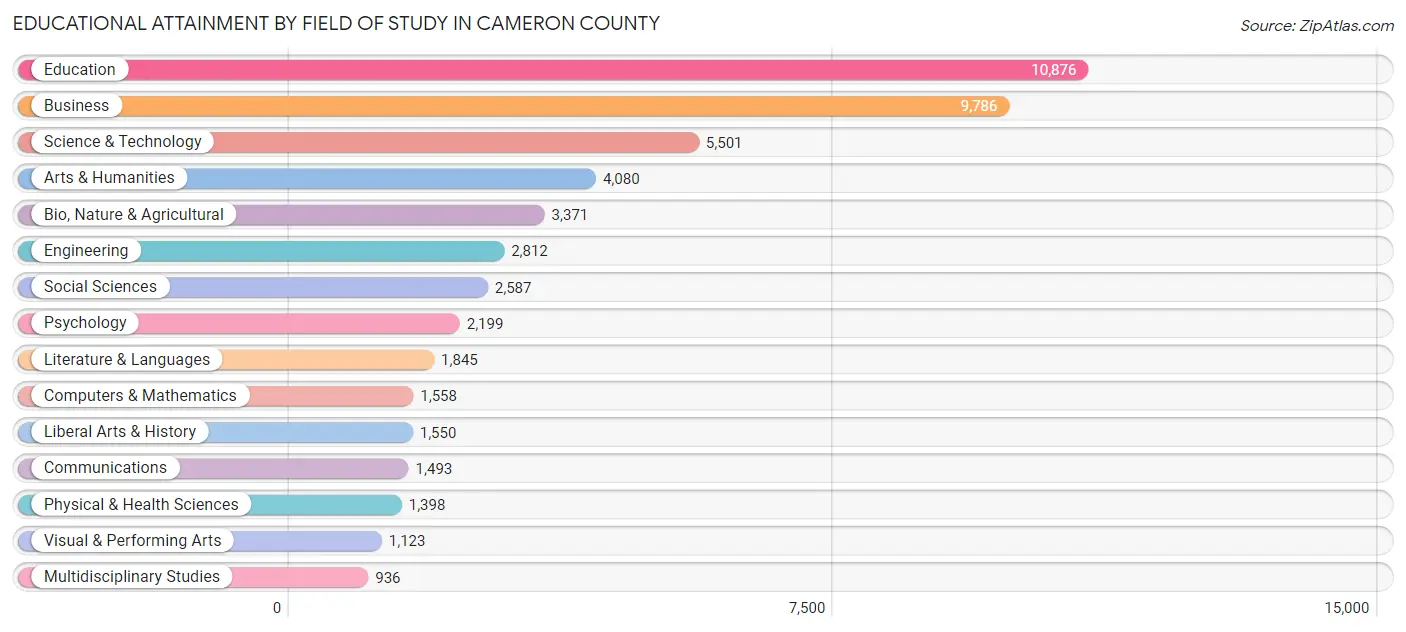
Educational Attainment by Field of Study in Cameron County
Education (10,876 | 21.3%), business (9,786 | 19.2%), science & technology (5,501 | 10.8%), arts & humanities (4,080 | 8.0%), and bio, nature & agricultural (3,371 | 6.6%) are the most common fields of study among 51,115 individuals in Cameron County who have obtained a bachelor's degree or higher.
| Field of Study | # Graduates | % Graduates |
| Computers & Mathematics | 1,558 | 3.0% |
| Bio, Nature & Agricultural | 3,371 | 6.6% |
| Physical & Health Sciences | 1,398 | 2.7% |
| Psychology | 2,199 | 4.3% |
| Social Sciences | 2,587 | 5.1% |
| Engineering | 2,812 | 5.5% |
| Multidisciplinary Studies | 936 | 1.8% |
| Science & Technology | 5,501 | 10.8% |
| Business | 9,786 | 19.2% |
| Education | 10,876 | 21.3% |
| Literature & Languages | 1,845 | 3.6% |
| Liberal Arts & History | 1,550 | 3.0% |
| Visual & Performing Arts | 1,123 | 2.2% |
| Communications | 1,493 | 2.9% |
| Arts & Humanities | 4,080 | 8.0% |
| Total | 51,115 | 100.0% |
Transportation & Commute in Cameron County
Vehicle Availability by Sex in Cameron County
The most prevalent vehicle ownership categories in Cameron County are males with 2 vehicles (36,542, accounting for 40.4%) and females with 2 vehicles (27,909, making up 48.0%).
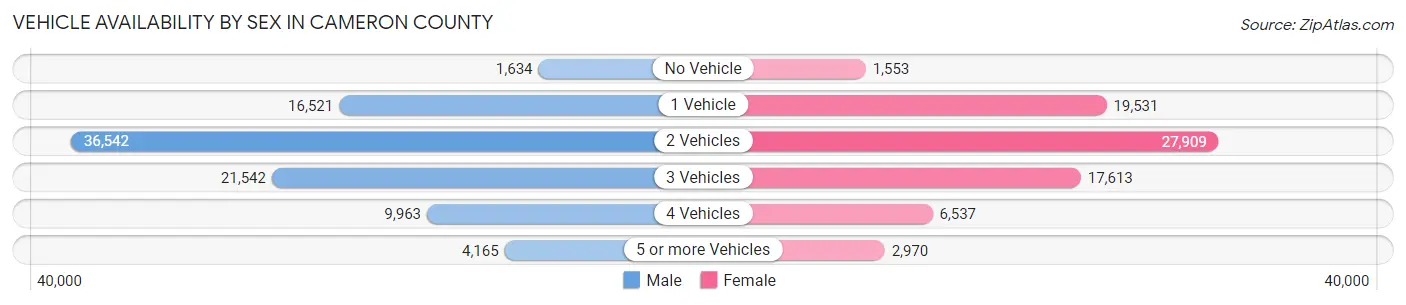
| Vehicles Available | Male | Female |
| No Vehicle | 1,634 (1.8%) | 1,553 (2.0%) |
| 1 Vehicle | 16,521 (18.3%) | 19,531 (25.7%) |
| 2 Vehicles | 36,542 (40.4%) | 27,909 (36.7%) |
| 3 Vehicles | 21,542 (23.8%) | 17,613 (23.1%) |
| 4 Vehicles | 9,963 (11.0%) | 6,537 (8.6%) |
| 5 or more Vehicles | 4,165 (4.6%) | 2,970 (3.9%) |
| Total | 90,367 (100.0%) | 76,113 (100.0%) |
Commute Time in Cameron County
The most frequently occuring commute durations in Cameron County are 10 to 14 minutes (31,457 commuters, 20.3%), 15 to 19 minutes (31,265 commuters, 20.2%), and 20 to 24 minutes (30,488 commuters, 19.7%).
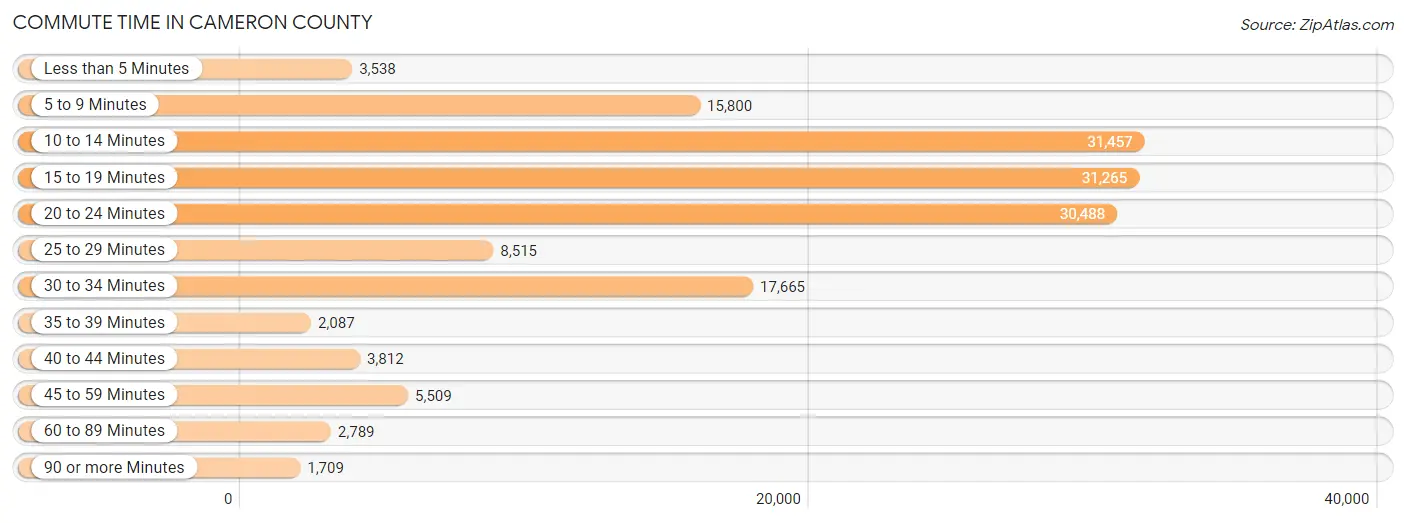
| Commute Time | # Commuters | % Commuters |
| Less than 5 Minutes | 3,538 | 2.3% |
| 5 to 9 Minutes | 15,800 | 10.2% |
| 10 to 14 Minutes | 31,457 | 20.3% |
| 15 to 19 Minutes | 31,265 | 20.2% |
| 20 to 24 Minutes | 30,488 | 19.7% |
| 25 to 29 Minutes | 8,515 | 5.5% |
| 30 to 34 Minutes | 17,665 | 11.4% |
| 35 to 39 Minutes | 2,087 | 1.3% |
| 40 to 44 Minutes | 3,812 | 2.5% |
| 45 to 59 Minutes | 5,509 | 3.6% |
| 60 to 89 Minutes | 2,789 | 1.8% |
| 90 or more Minutes | 1,709 | 1.1% |
Commute Time by Sex in Cameron County
The most common commute times in Cameron County are 20 to 24 minutes (16,845 commuters, 19.9%) for males and 10 to 14 minutes (15,533 commuters, 22.2%) for females.
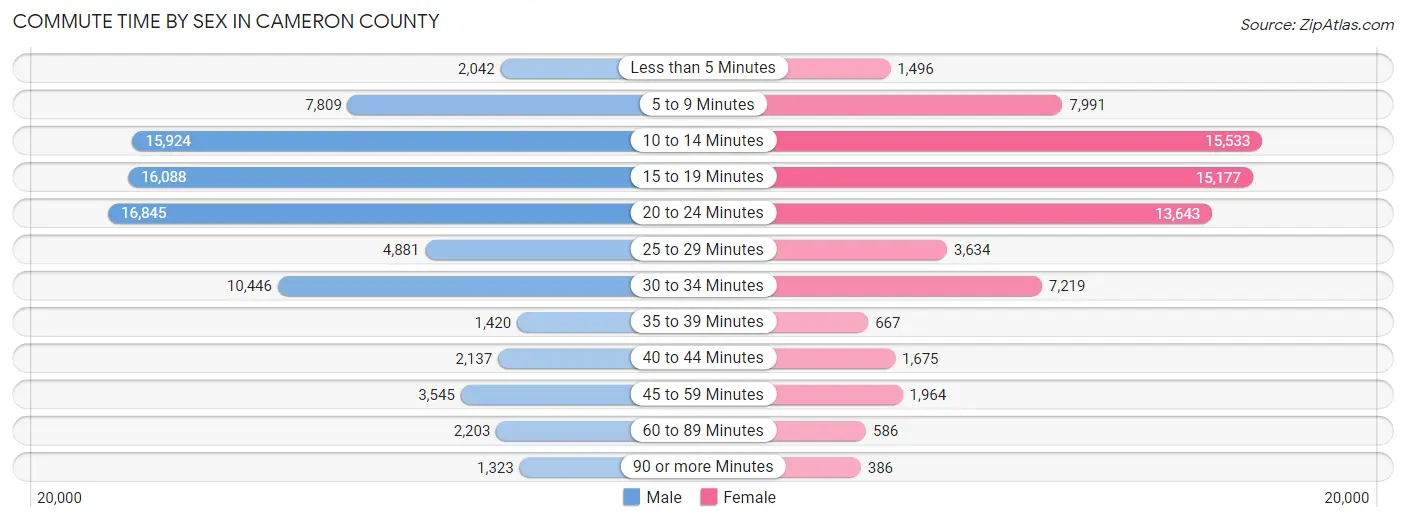
| Commute Time | Male | Female |
| Less than 5 Minutes | 2,042 (2.4%) | 1,496 (2.1%) |
| 5 to 9 Minutes | 7,809 (9.2%) | 7,991 (11.4%) |
| 10 to 14 Minutes | 15,924 (18.8%) | 15,533 (22.2%) |
| 15 to 19 Minutes | 16,088 (19.0%) | 15,177 (21.7%) |
| 20 to 24 Minutes | 16,845 (19.9%) | 13,643 (19.5%) |
| 25 to 29 Minutes | 4,881 (5.8%) | 3,634 (5.2%) |
| 30 to 34 Minutes | 10,446 (12.3%) | 7,219 (10.3%) |
| 35 to 39 Minutes | 1,420 (1.7%) | 667 (0.9%) |
| 40 to 44 Minutes | 2,137 (2.5%) | 1,675 (2.4%) |
| 45 to 59 Minutes | 3,545 (4.2%) | 1,964 (2.8%) |
| 60 to 89 Minutes | 2,203 (2.6%) | 586 (0.8%) |
| 90 or more Minutes | 1,323 (1.6%) | 386 (0.5%) |
Time of Departure to Work by Sex in Cameron County
The most frequent times of departure to work in Cameron County are 8:00 AM to 8:29 AM (12,639, 14.9%) for males and 7:30 AM to 7:59 AM (13,317, 19.0%) for females.
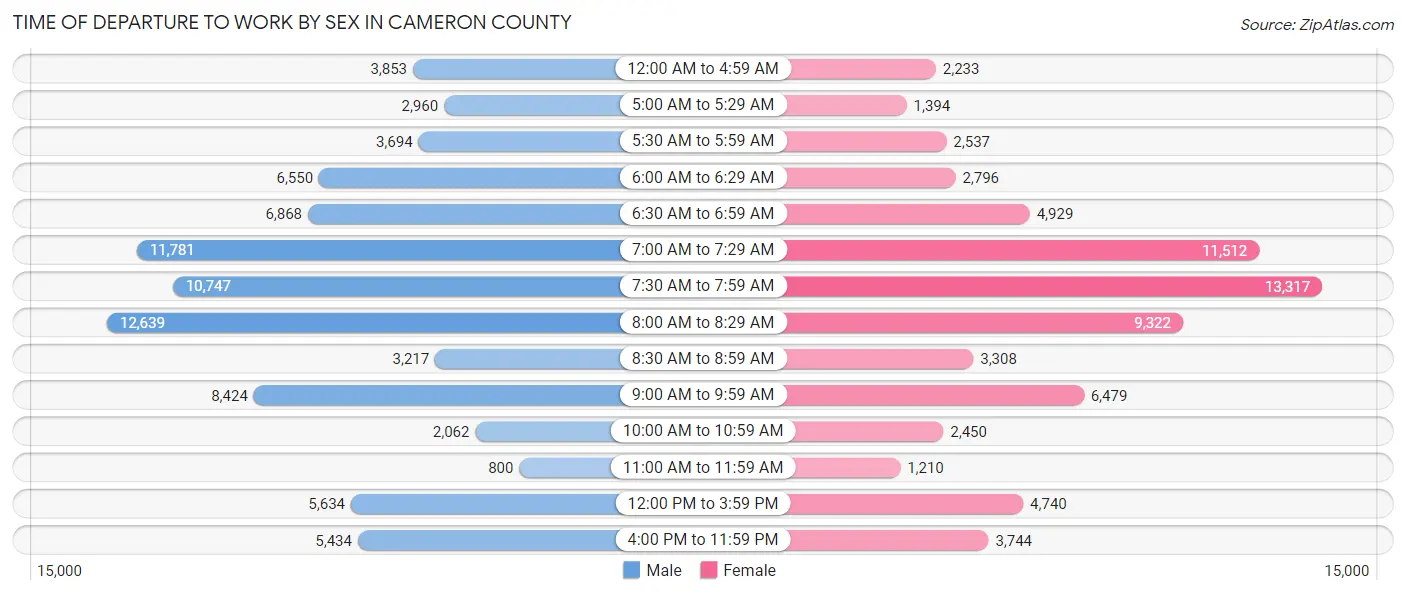
| Time of Departure | Male | Female |
| 12:00 AM to 4:59 AM | 3,853 (4.5%) | 2,233 (3.2%) |
| 5:00 AM to 5:29 AM | 2,960 (3.5%) | 1,394 (2.0%) |
| 5:30 AM to 5:59 AM | 3,694 (4.4%) | 2,537 (3.6%) |
| 6:00 AM to 6:29 AM | 6,550 (7.7%) | 2,796 (4.0%) |
| 6:30 AM to 6:59 AM | 6,868 (8.1%) | 4,929 (7.0%) |
| 7:00 AM to 7:29 AM | 11,781 (13.9%) | 11,512 (16.5%) |
| 7:30 AM to 7:59 AM | 10,747 (12.7%) | 13,317 (19.0%) |
| 8:00 AM to 8:29 AM | 12,639 (14.9%) | 9,322 (13.3%) |
| 8:30 AM to 8:59 AM | 3,217 (3.8%) | 3,308 (4.7%) |
| 9:00 AM to 9:59 AM | 8,424 (10.0%) | 6,479 (9.3%) |
| 10:00 AM to 10:59 AM | 2,062 (2.4%) | 2,450 (3.5%) |
| 11:00 AM to 11:59 AM | 800 (0.9%) | 1,210 (1.7%) |
| 12:00 PM to 3:59 PM | 5,634 (6.7%) | 4,740 (6.8%) |
| 4:00 PM to 11:59 PM | 5,434 (6.4%) | 3,744 (5.3%) |
| Total | 84,663 (100.0%) | 69,971 (100.0%) |
Housing Occupancy in Cameron County
Occupancy by Ownership in Cameron County
Of the total 132,538 dwellings in Cameron County, owner-occupied units account for 86,523 (65.3%), while renter-occupied units make up 46,015 (34.7%).
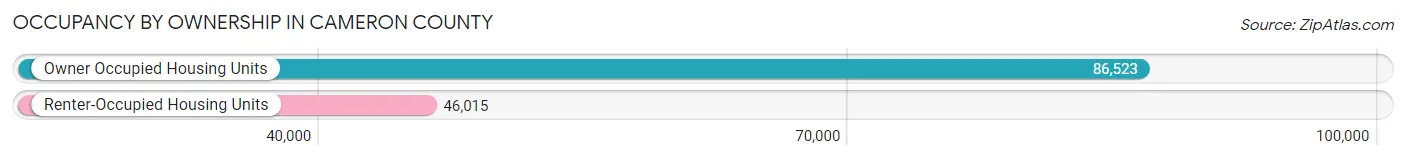
| Occupancy | # Housing Units | % Housing Units |
| Owner Occupied Housing Units | 86,523 | 65.3% |
| Renter-Occupied Housing Units | 46,015 | 34.7% |
| Total Occupied Housing Units | 132,538 | 100.0% |
Occupancy by Household Size in Cameron County
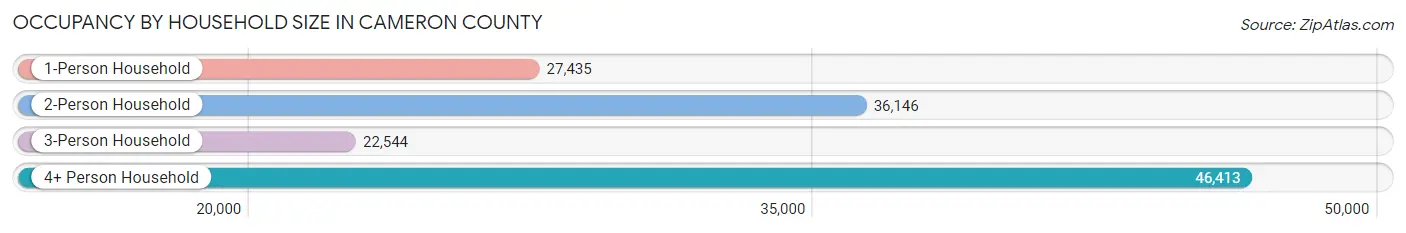
| Household Size | # Housing Units | % Housing Units |
| 1-Person Household | 27,435 | 20.7% |
| 2-Person Household | 36,146 | 27.3% |
| 3-Person Household | 22,544 | 17.0% |
| 4+ Person Household | 46,413 | 35.0% |
| Total Housing Units | 132,538 | 100.0% |
Occupancy by Ownership by Household Size in Cameron County
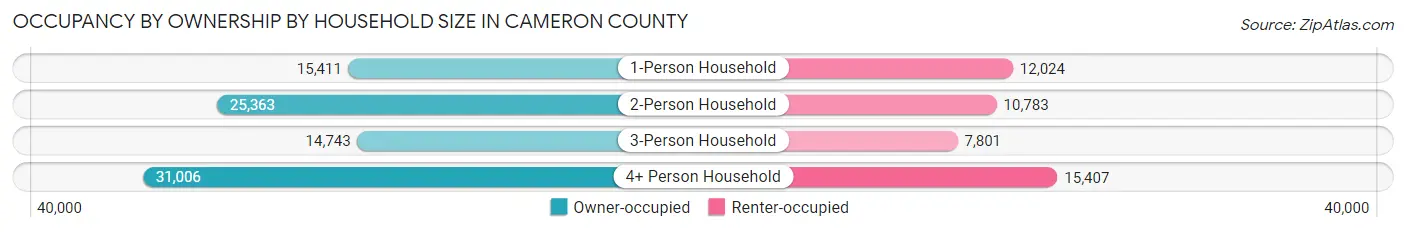
| Household Size | Owner-occupied | Renter-occupied |
| 1-Person Household | 15,411 (56.2%) | 12,024 (43.8%) |
| 2-Person Household | 25,363 (70.2%) | 10,783 (29.8%) |
| 3-Person Household | 14,743 (65.4%) | 7,801 (34.6%) |
| 4+ Person Household | 31,006 (66.8%) | 15,407 (33.2%) |
| Total Housing Units | 86,523 (65.3%) | 46,015 (34.7%) |
Occupancy by Educational Attainment in Cameron County
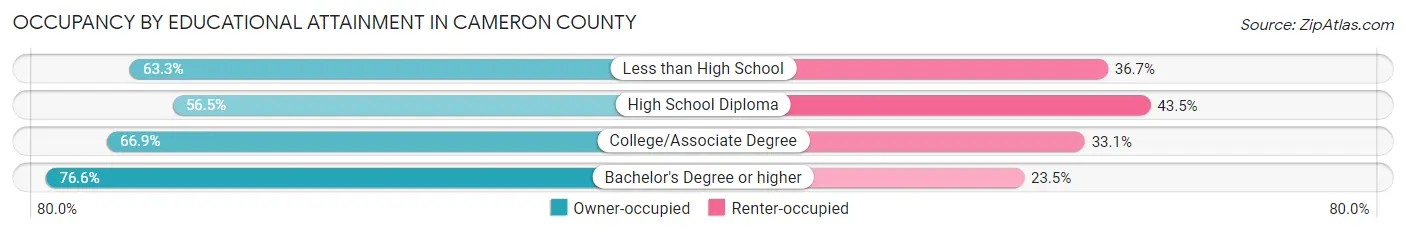
| Household Size | Owner-occupied | Renter-occupied |
| Less than High School | 23,947 (63.3%) | 13,906 (36.7%) |
| High School Diploma | 18,710 (56.5%) | 14,406 (43.5%) |
| College/Associate Degree | 22,696 (66.9%) | 11,217 (33.1%) |
| Bachelor's Degree or higher | 21,170 (76.5%) | 6,486 (23.4%) |
Occupancy by Age of Householder in Cameron County
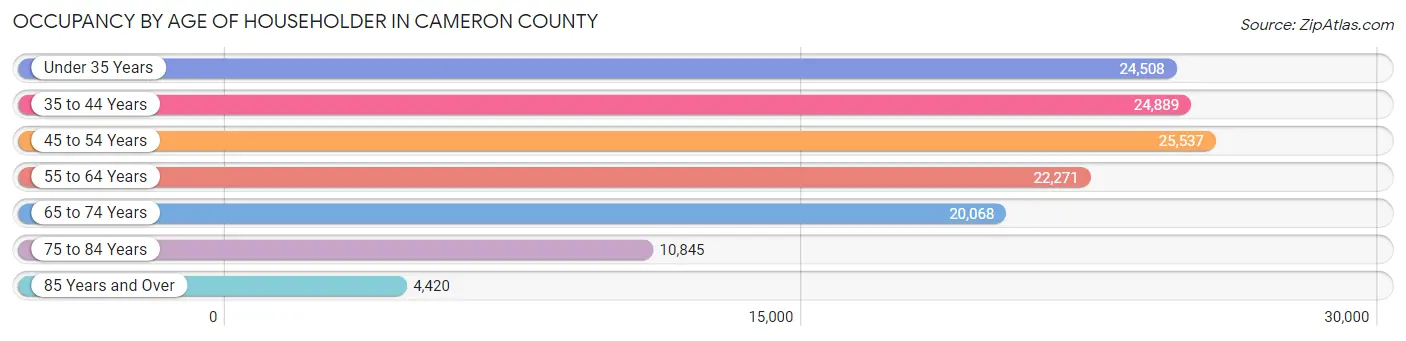
| Age Bracket | # Households | % Households |
| Under 35 Years | 24,508 | 18.5% |
| 35 to 44 Years | 24,889 | 18.8% |
| 45 to 54 Years | 25,537 | 19.3% |
| 55 to 64 Years | 22,271 | 16.8% |
| 65 to 74 Years | 20,068 | 15.1% |
| 75 to 84 Years | 10,845 | 8.2% |
| 85 Years and Over | 4,420 | 3.3% |
| Total | 132,538 | 100.0% |
Housing Finances in Cameron County
Median Income by Occupancy in Cameron County
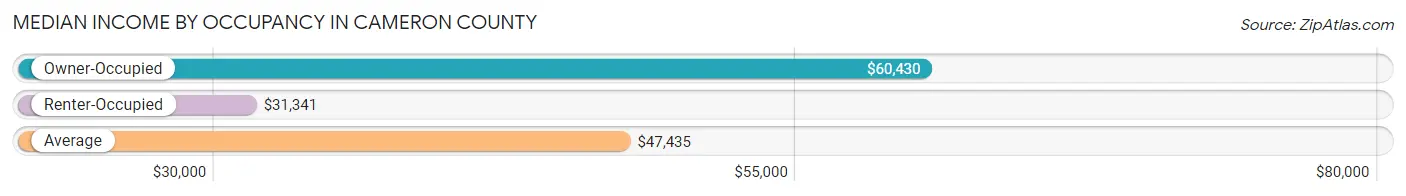
| Occupancy Type | # Households | Median Income |
| Owner-Occupied | 86,523 (65.3%) | $60,430 |
| Renter-Occupied | 46,015 (34.7%) | $31,341 |
| Average | 132,538 (100.0%) | $47,435 |
Occupancy by Householder Income Bracket in Cameron County
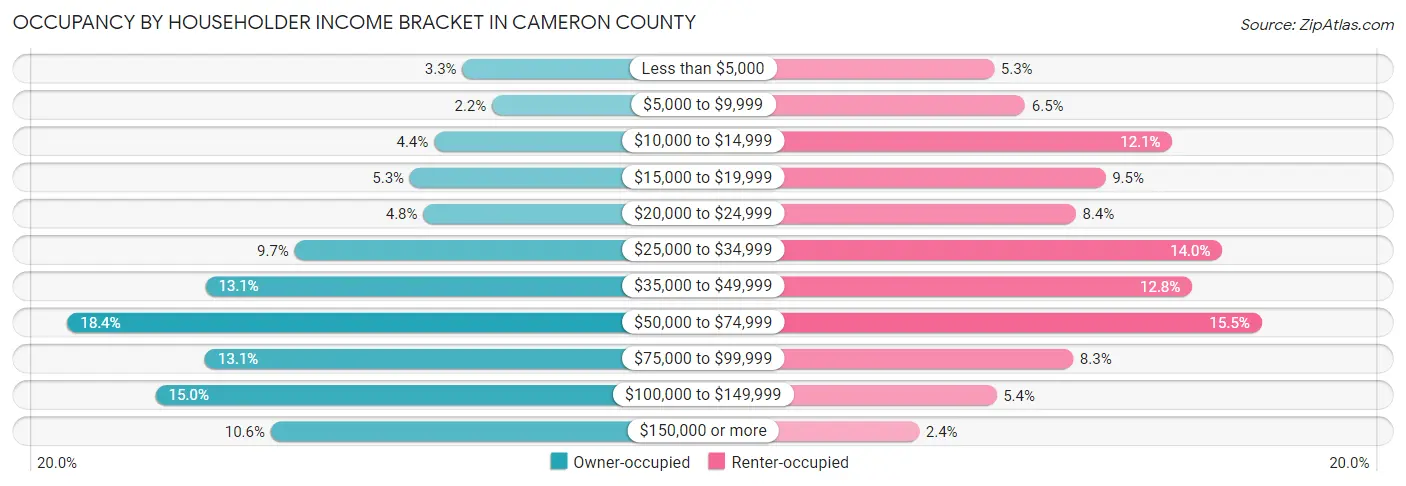
| Income Bracket | Owner-occupied | Renter-occupied |
| Less than $5,000 | 2,873 (3.3%) | 2,427 (5.3%) |
| $5,000 to $9,999 | 1,891 (2.2%) | 2,969 (6.5%) |
| $10,000 to $14,999 | 3,805 (4.4%) | 5,554 (12.1%) |
| $15,000 to $19,999 | 4,607 (5.3%) | 4,375 (9.5%) |
| $20,000 to $24,999 | 4,165 (4.8%) | 3,857 (8.4%) |
| $25,000 to $34,999 | 8,401 (9.7%) | 6,428 (14.0%) |
| $35,000 to $49,999 | 11,342 (13.1%) | 5,900 (12.8%) |
| $50,000 to $74,999 | 15,898 (18.4%) | 7,120 (15.5%) |
| $75,000 to $99,999 | 11,361 (13.1%) | 3,812 (8.3%) |
| $100,000 to $149,999 | 12,989 (15.0%) | 2,465 (5.4%) |
| $150,000 or more | 9,191 (10.6%) | 1,108 (2.4%) |
| Total | 86,523 (100.0%) | 46,015 (100.0%) |
Monthly Housing Cost Tiers in Cameron County
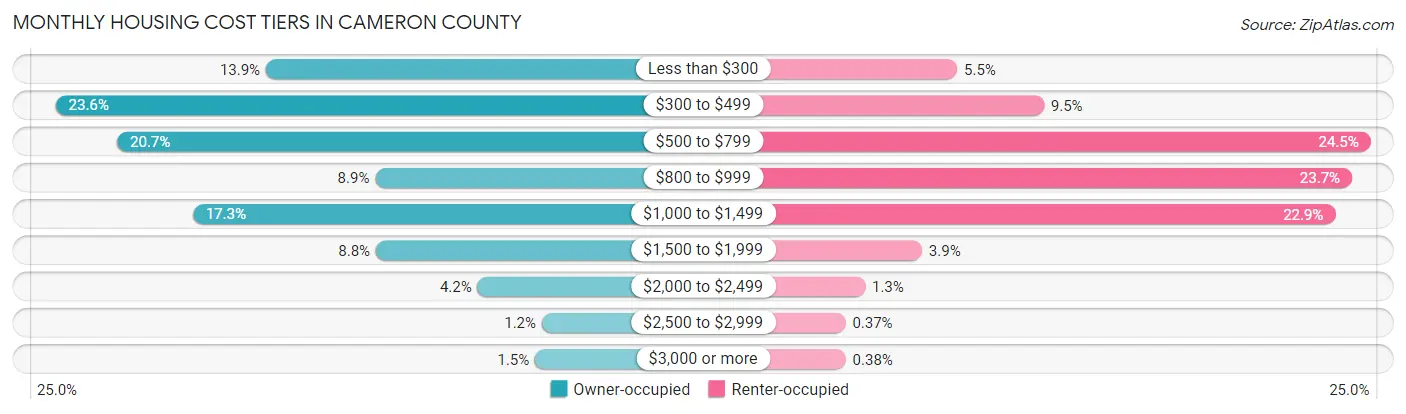
| Monthly Cost | Owner-occupied | Renter-occupied |
| Less than $300 | 12,018 (13.9%) | 2,536 (5.5%) |
| $300 to $499 | 20,397 (23.6%) | 4,370 (9.5%) |
| $500 to $799 | 17,945 (20.7%) | 11,294 (24.5%) |
| $800 to $999 | 7,666 (8.9%) | 10,895 (23.7%) |
| $1,000 to $1,499 | 14,934 (17.3%) | 10,541 (22.9%) |
| $1,500 to $1,999 | 7,640 (8.8%) | 1,790 (3.9%) |
| $2,000 to $2,499 | 3,590 (4.2%) | 583 (1.3%) |
| $2,500 to $2,999 | 1,031 (1.2%) | 169 (0.4%) |
| $3,000 or more | 1,302 (1.5%) | 177 (0.4%) |
| Total | 86,523 (100.0%) | 46,015 (100.0%) |
Physical Housing Characteristics in Cameron County
Housing Structures in Cameron County
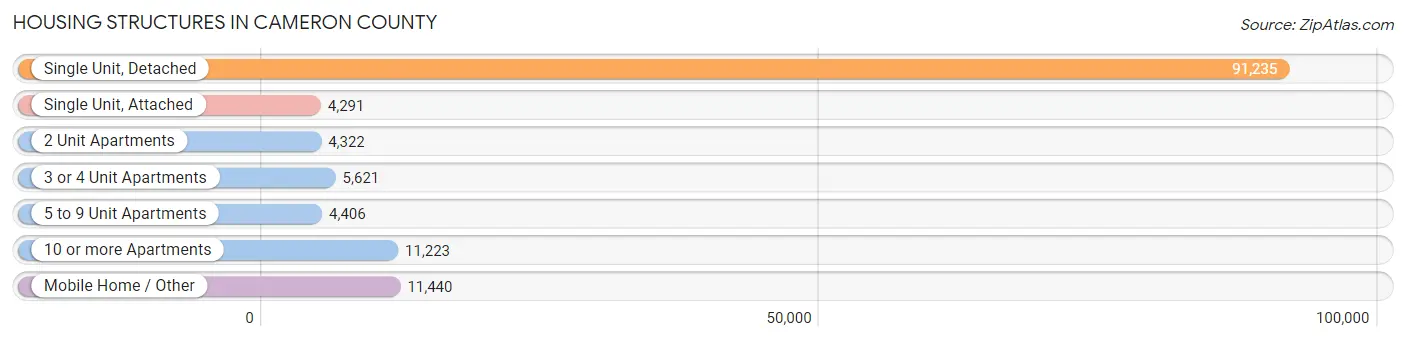
| Structure Type | # Housing Units | % Housing Units |
| Single Unit, Detached | 91,235 | 68.8% |
| Single Unit, Attached | 4,291 | 3.2% |
| 2 Unit Apartments | 4,322 | 3.3% |
| 3 or 4 Unit Apartments | 5,621 | 4.2% |
| 5 to 9 Unit Apartments | 4,406 | 3.3% |
| 10 or more Apartments | 11,223 | 8.5% |
| Mobile Home / Other | 11,440 | 8.6% |
| Total | 132,538 | 100.0% |
Housing Structures by Occupancy in Cameron County
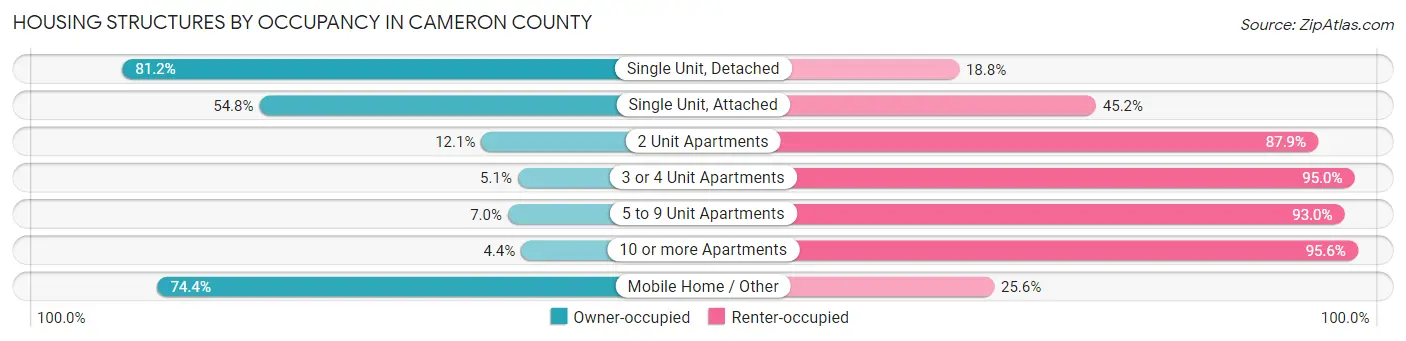
| Structure Type | Owner-occupied | Renter-occupied |
| Single Unit, Detached | 74,051 (81.2%) | 17,184 (18.8%) |
| Single Unit, Attached | 2,352 (54.8%) | 1,939 (45.2%) |
| 2 Unit Apartments | 522 (12.1%) | 3,800 (87.9%) |
| 3 or 4 Unit Apartments | 284 (5.1%) | 5,337 (95.0%) |
| 5 to 9 Unit Apartments | 307 (7.0%) | 4,099 (93.0%) |
| 10 or more Apartments | 495 (4.4%) | 10,728 (95.6%) |
| Mobile Home / Other | 8,512 (74.4%) | 2,928 (25.6%) |
| Total | 86,523 (65.3%) | 46,015 (34.7%) |
Housing Structures by Number of Rooms in Cameron County
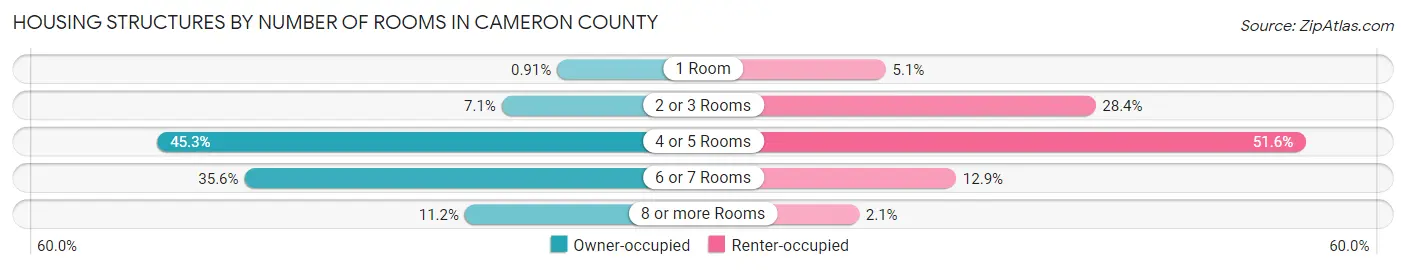
| Number of Rooms | Owner-occupied | Renter-occupied |
| 1 Room | 790 (0.9%) | 2,331 (5.1%) |
| 2 or 3 Rooms | 6,101 (7.0%) | 13,047 (28.3%) |
| 4 or 5 Rooms | 39,175 (45.3%) | 23,750 (51.6%) |
| 6 or 7 Rooms | 30,812 (35.6%) | 5,921 (12.9%) |
| 8 or more Rooms | 9,645 (11.2%) | 966 (2.1%) |
| Total | 86,523 (100.0%) | 46,015 (100.0%) |
Housing Structure by Heating Type in Cameron County
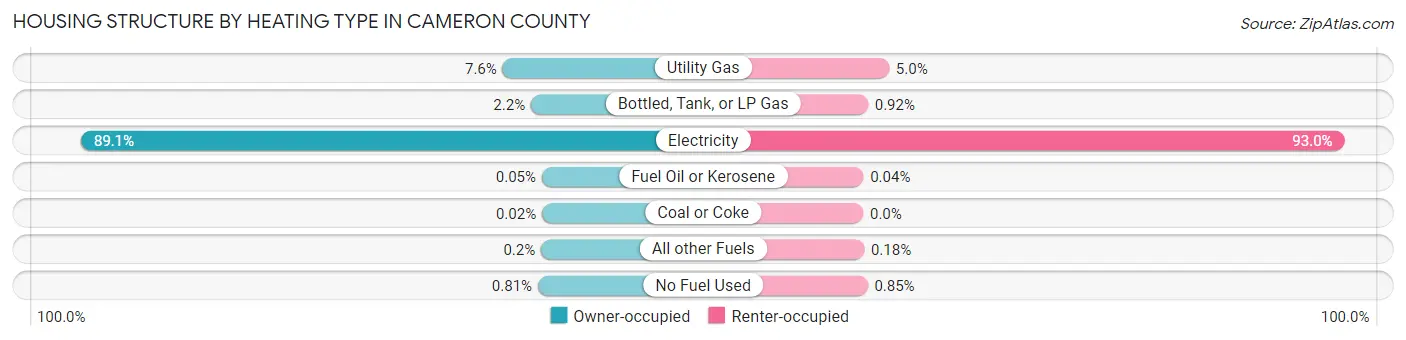
| Heating Type | Owner-occupied | Renter-occupied |
| Utility Gas | 6,601 (7.6%) | 2,302 (5.0%) |
| Bottled, Tank, or LP Gas | 1,857 (2.1%) | 424 (0.9%) |
| Electricity | 77,124 (89.1%) | 42,797 (93.0%) |
| Fuel Oil or Kerosene | 47 (0.1%) | 18 (0.0%) |
| Coal or Coke | 16 (0.0%) | 0 (0.0%) |
| All other Fuels | 174 (0.2%) | 85 (0.2%) |
| No Fuel Used | 704 (0.8%) | 389 (0.9%) |
| Total | 86,523 (100.0%) | 46,015 (100.0%) |
Household Vehicle Usage in Cameron County
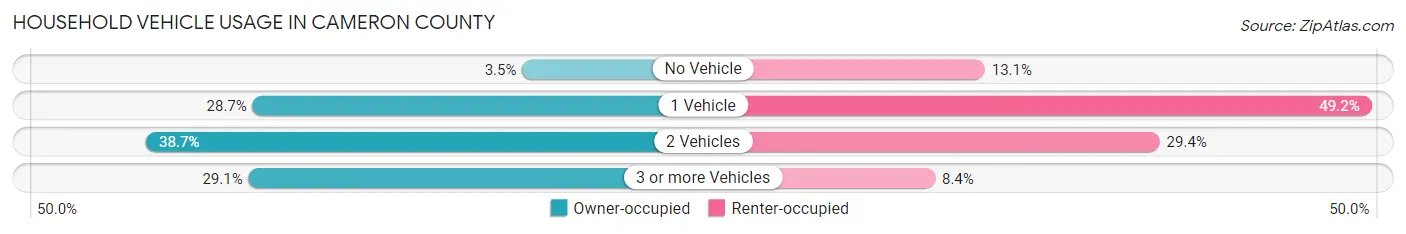
| Vehicles per Household | Owner-occupied | Renter-occupied |
| No Vehicle | 3,061 (3.5%) | 6,008 (13.1%) |
| 1 Vehicle | 24,837 (28.7%) | 22,616 (49.1%) |
| 2 Vehicles | 33,444 (38.7%) | 13,519 (29.4%) |
| 3 or more Vehicles | 25,181 (29.1%) | 3,872 (8.4%) |
| Total | 86,523 (100.0%) | 46,015 (100.0%) |
Real Estate & Mortgages in Cameron County
Real Estate and Mortgage Overview in Cameron County
| Characteristic | Without Mortgage | With Mortgage |
| Housing Units | 52,443 | 34,080 |
| Median Property Value | $87,100 | $147,200 |
| Median Household Income | $48,367 | $5,568 |
| Monthly Housing Costs | $438 | $1,237 |
| Real Estate Taxes | $1,359 | $1,288 |
Property Value by Mortgage Status in Cameron County
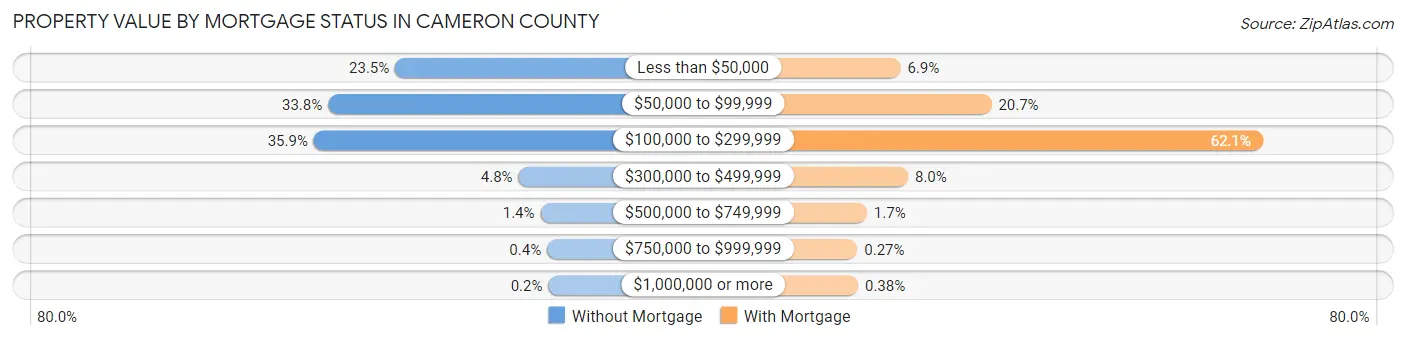
| Property Value | Without Mortgage | With Mortgage |
| Less than $50,000 | 12,345 (23.5%) | 2,335 (6.9%) |
| $50,000 to $99,999 | 17,705 (33.8%) | 7,059 (20.7%) |
| $100,000 to $299,999 | 18,846 (35.9%) | 21,148 (62.1%) |
| $300,000 to $499,999 | 2,490 (4.8%) | 2,727 (8.0%) |
| $500,000 to $749,999 | 739 (1.4%) | 589 (1.7%) |
| $750,000 to $999,999 | 212 (0.4%) | 92 (0.3%) |
| $1,000,000 or more | 106 (0.2%) | 130 (0.4%) |
| Total | 52,443 (100.0%) | 34,080 (100.0%) |
Household Income by Mortgage Status in Cameron County
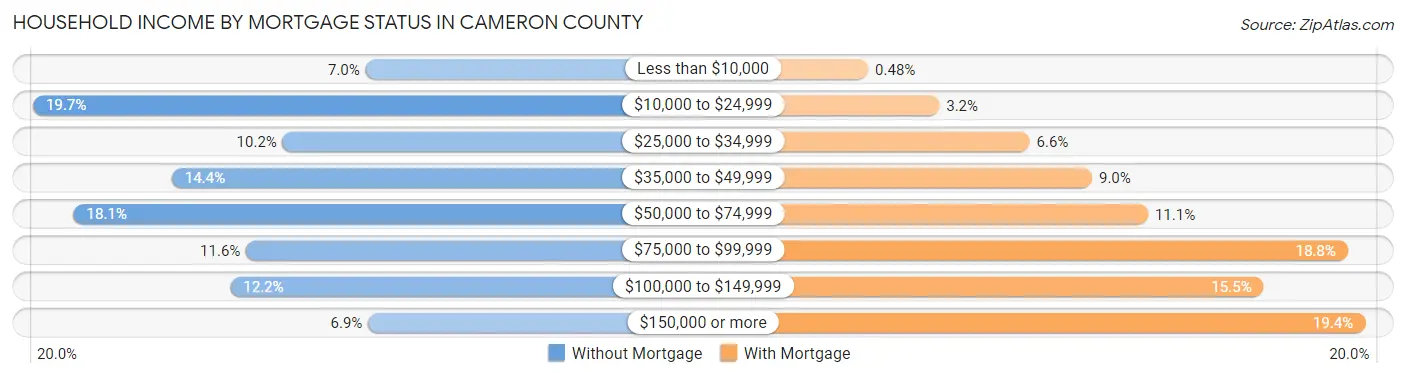
| Household Income | Without Mortgage | With Mortgage |
| Less than $10,000 | 3,677 (7.0%) | 164 (0.5%) |
| $10,000 to $24,999 | 10,319 (19.7%) | 1,087 (3.2%) |
| $25,000 to $34,999 | 5,331 (10.2%) | 2,258 (6.6%) |
| $35,000 to $49,999 | 7,545 (14.4%) | 3,070 (9.0%) |
| $50,000 to $74,999 | 9,508 (18.1%) | 3,797 (11.1%) |
| $75,000 to $99,999 | 6,065 (11.6%) | 6,390 (18.8%) |
| $100,000 to $149,999 | 6,375 (12.2%) | 5,296 (15.5%) |
| $150,000 or more | 3,623 (6.9%) | 6,614 (19.4%) |
| Total | 52,443 (100.0%) | 34,080 (100.0%) |
Property Value to Household Income Ratio in Cameron County
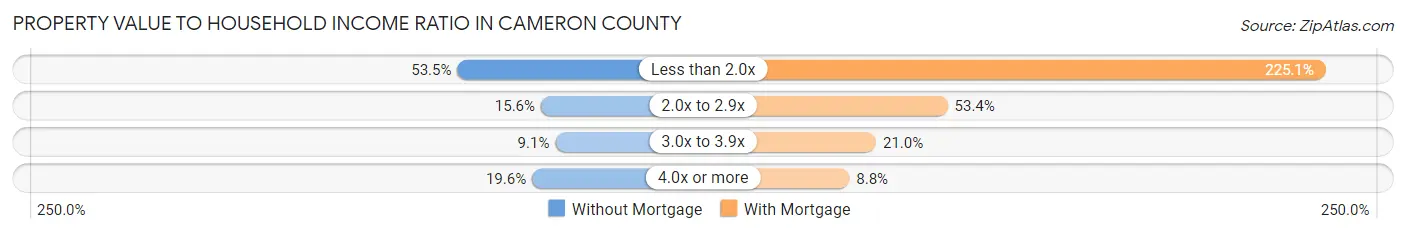
| Value-to-Income Ratio | Without Mortgage | With Mortgage |
| Less than 2.0x | 28,071 (53.5%) | 76,716 (225.1%) |
| 2.0x to 2.9x | 8,178 (15.6%) | 18,210 (53.4%) |
| 3.0x to 3.9x | 4,764 (9.1%) | 7,140 (20.9%) |
| 4.0x or more | 10,300 (19.6%) | 3,012 (8.8%) |
| Total | 52,443 (100.0%) | 34,080 (100.0%) |
Real Estate Taxes by Mortgage Status in Cameron County
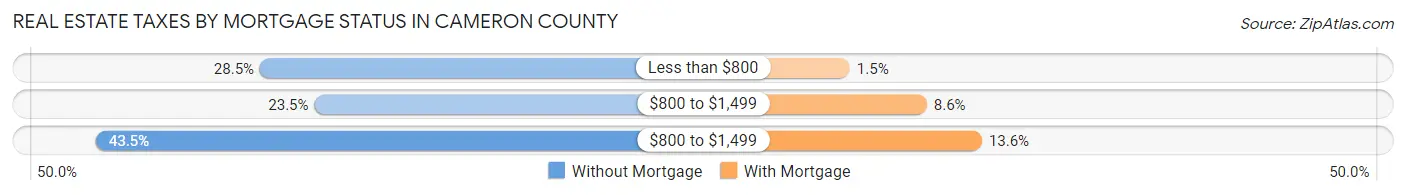
| Property Taxes | Without Mortgage | With Mortgage |
| Less than $800 | 14,949 (28.5%) | 526 (1.5%) |
| $800 to $1,499 | 12,347 (23.5%) | 2,922 (8.6%) |
| $800 to $1,499 | 22,807 (43.5%) | 4,636 (13.6%) |
| Total | 52,443 (100.0%) | 34,080 (100.0%) |
Health & Disability in Cameron County
Health Insurance Coverage by Age in Cameron County
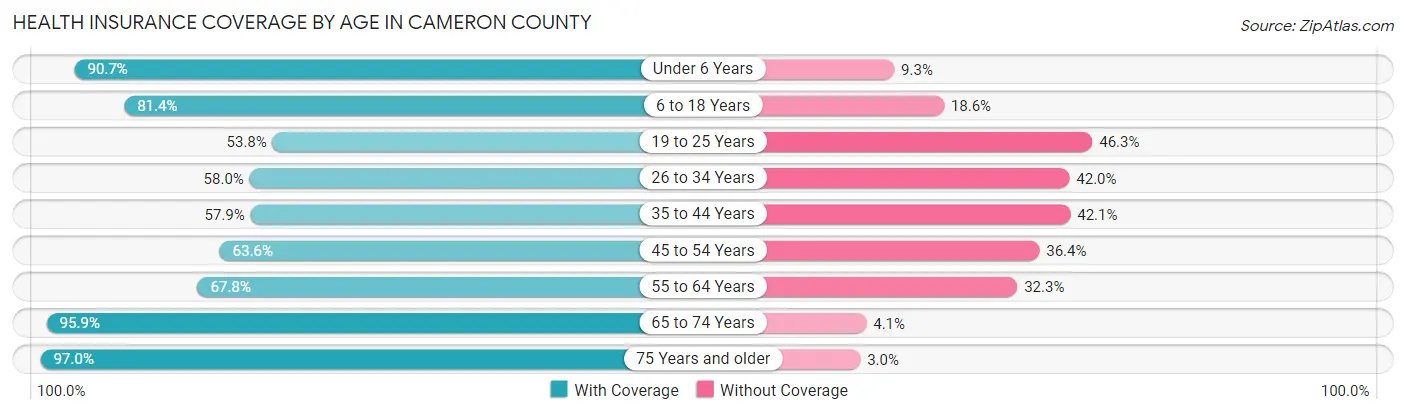
| Age Bracket | With Coverage | Without Coverage |
| Under 6 Years | 34,753 (90.7%) | 3,563 (9.3%) |
| 6 to 18 Years | 76,065 (81.4%) | 17,356 (18.6%) |
| 19 to 25 Years | 24,467 (53.7%) | 21,053 (46.3%) |
| 26 to 34 Years | 27,406 (58.0%) | 19,818 (42.0%) |
| 35 to 44 Years | 28,946 (57.9%) | 21,078 (42.1%) |
| 45 to 54 Years | 30,592 (63.6%) | 17,486 (36.4%) |
| 55 to 64 Years | 27,516 (67.7%) | 13,098 (32.3%) |
| 65 to 74 Years | 31,218 (95.9%) | 1,336 (4.1%) |
| 75 Years and older | 23,525 (97.0%) | 721 (3.0%) |
| Total | 304,488 (72.5%) | 115,509 (27.5%) |
Health Insurance Coverage by Citizenship Status in Cameron County
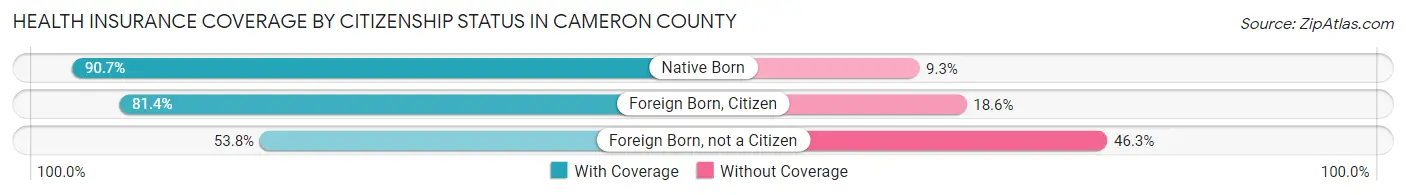
| Citizenship Status | With Coverage | Without Coverage |
| Native Born | 34,753 (90.7%) | 3,563 (9.3%) |
| Foreign Born, Citizen | 76,065 (81.4%) | 17,356 (18.6%) |
| Foreign Born, not a Citizen | 24,467 (53.7%) | 21,053 (46.3%) |
Health Insurance Coverage by Household Income in Cameron County
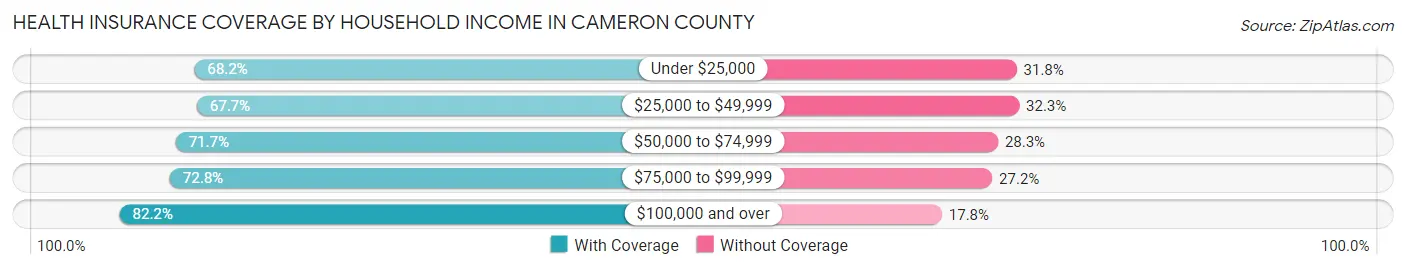
| Household Income | With Coverage | Without Coverage |
| Under $25,000 | 60,912 (68.2%) | 28,425 (31.8%) |
| $25,000 to $49,999 | 66,673 (67.7%) | 31,778 (32.3%) |
| $50,000 to $74,999 | 54,015 (71.7%) | 21,337 (28.3%) |
| $75,000 to $99,999 | 40,388 (72.8%) | 15,110 (27.2%) |
| $100,000 and over | 81,995 (82.2%) | 17,772 (17.8%) |
Public vs Private Health Insurance Coverage by Age in Cameron County
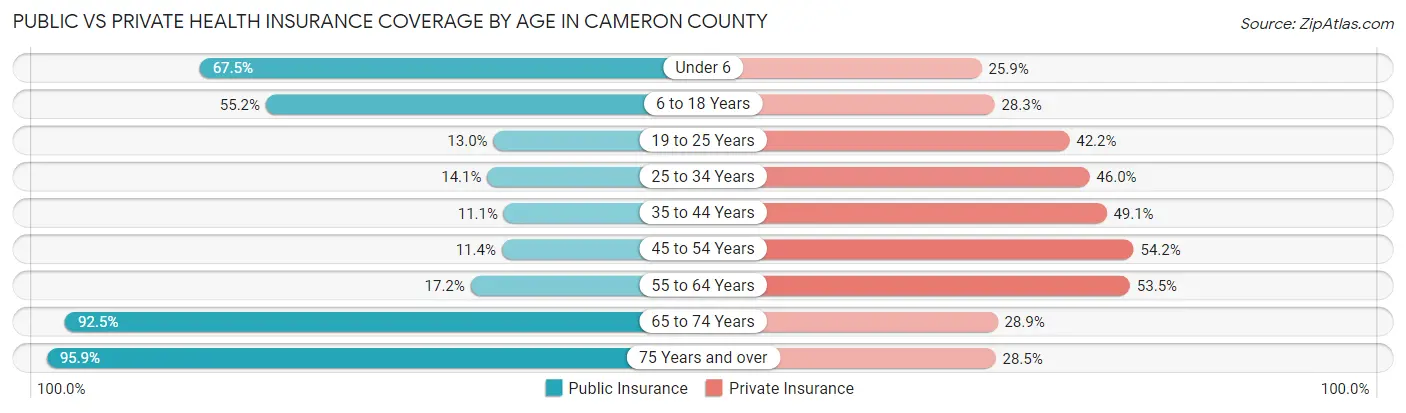
| Age Bracket | Public Insurance | Private Insurance |
| Under 6 | 25,860 (67.5%) | 9,937 (25.9%) |
| 6 to 18 Years | 51,587 (55.2%) | 26,476 (28.3%) |
| 19 to 25 Years | 5,907 (13.0%) | 19,224 (42.2%) |
| 25 to 34 Years | 6,669 (14.1%) | 21,705 (46.0%) |
| 35 to 44 Years | 5,535 (11.1%) | 24,572 (49.1%) |
| 45 to 54 Years | 5,501 (11.4%) | 26,035 (54.1%) |
| 55 to 64 Years | 6,993 (17.2%) | 21,722 (53.5%) |
| 65 to 74 Years | 30,113 (92.5%) | 9,409 (28.9%) |
| 75 Years and over | 23,249 (95.9%) | 6,919 (28.5%) |
| Total | 161,414 (38.4%) | 165,999 (39.5%) |
Disability Status by Sex by Age in Cameron County
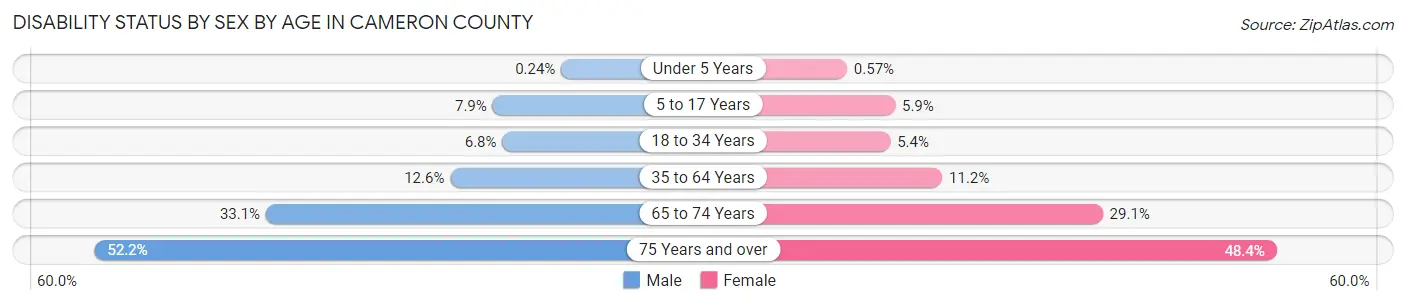
| Age Bracket | Male | Female |
| Under 5 Years | 39 (0.2%) | 87 (0.6%) |
| 5 to 17 Years | 3,734 (7.9%) | 2,689 (5.9%) |
| 18 to 34 Years | 3,518 (6.8%) | 2,620 (5.4%) |
| 35 to 64 Years | 8,403 (12.6%) | 8,048 (11.2%) |
| 65 to 74 Years | 4,947 (33.1%) | 5,118 (29.0%) |
| 75 Years and over | 5,369 (52.2%) | 6,764 (48.4%) |
Disability Class by Sex by Age in Cameron County
Disability Class: Hearing Difficulty
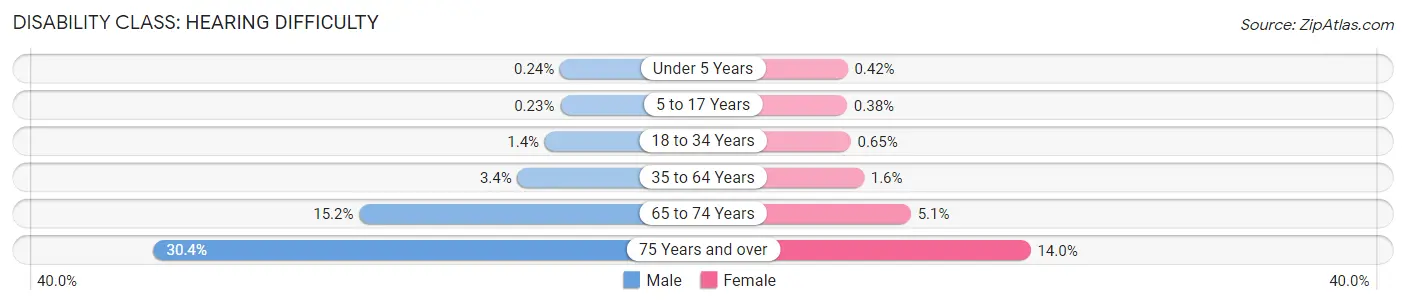
| Age Bracket | Male | Female |
| Under 5 Years | 39 (0.2%) | 64 (0.4%) |
| 5 to 17 Years | 111 (0.2%) | 174 (0.4%) |
| 18 to 34 Years | 711 (1.4%) | 317 (0.6%) |
| 35 to 64 Years | 2,269 (3.4%) | 1,172 (1.6%) |
| 65 to 74 Years | 2,262 (15.1%) | 902 (5.1%) |
| 75 Years and over | 3,127 (30.4%) | 1,957 (14.0%) |
Disability Class: Vision Difficulty
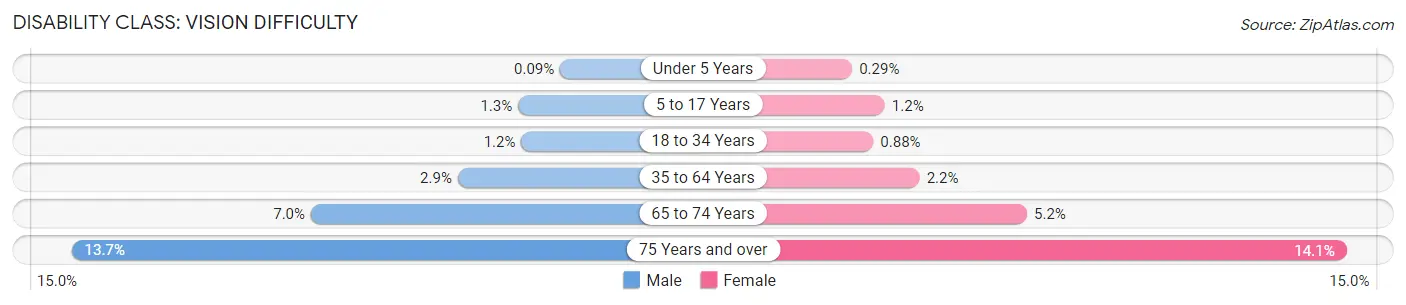
| Age Bracket | Male | Female |
| Under 5 Years | 14 (0.1%) | 44 (0.3%) |
| 5 to 17 Years | 595 (1.3%) | 542 (1.2%) |
| 18 to 34 Years | 607 (1.2%) | 426 (0.9%) |
| 35 to 64 Years | 1,960 (2.9%) | 1,566 (2.2%) |
| 65 to 74 Years | 1,050 (7.0%) | 909 (5.2%) |
| 75 Years and over | 1,407 (13.7%) | 1,963 (14.1%) |
Disability Class: Cognitive Difficulty
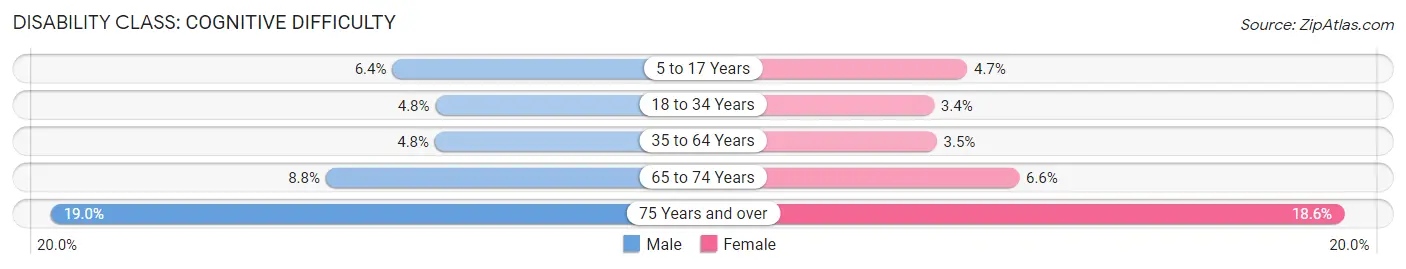
| Age Bracket | Male | Female |
| 5 to 17 Years | 3,011 (6.4%) | 2,108 (4.6%) |
| 18 to 34 Years | 2,459 (4.8%) | 1,663 (3.4%) |
| 35 to 64 Years | 3,182 (4.8%) | 2,536 (3.5%) |
| 65 to 74 Years | 1,317 (8.8%) | 1,159 (6.6%) |
| 75 Years and over | 1,956 (19.0%) | 2,604 (18.6%) |
Disability Class: Ambulatory Difficulty
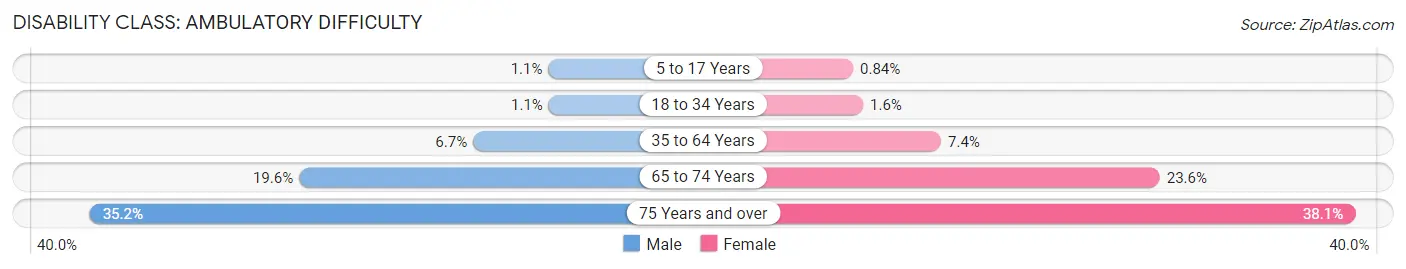
| Age Bracket | Male | Female |
| 5 to 17 Years | 531 (1.1%) | 380 (0.8%) |
| 18 to 34 Years | 564 (1.1%) | 769 (1.6%) |
| 35 to 64 Years | 4,474 (6.7%) | 5,308 (7.4%) |
| 65 to 74 Years | 2,932 (19.6%) | 4,160 (23.6%) |
| 75 Years and over | 3,614 (35.2%) | 5,322 (38.1%) |
Disability Class: Self-Care Difficulty
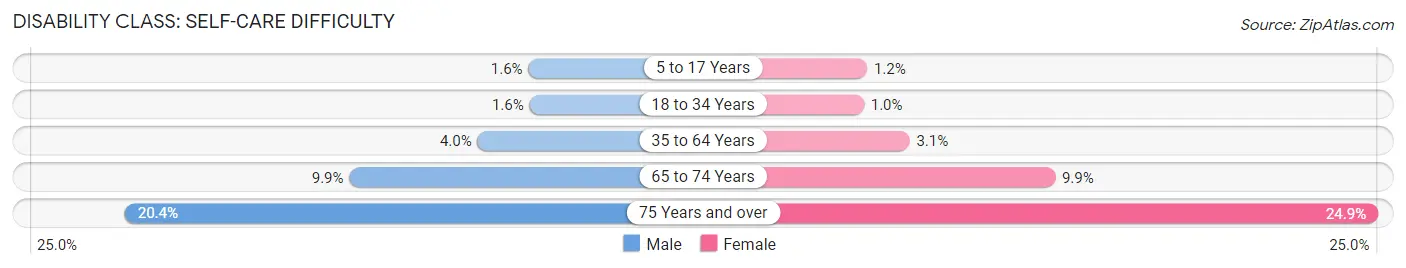
| Age Bracket | Male | Female |
| 5 to 17 Years | 769 (1.6%) | 531 (1.2%) |
| 18 to 34 Years | 813 (1.6%) | 493 (1.0%) |
| 35 to 64 Years | 2,654 (4.0%) | 2,260 (3.1%) |
| 65 to 74 Years | 1,483 (9.9%) | 1,742 (9.9%) |
| 75 Years and over | 2,092 (20.3%) | 3,475 (24.9%) |
Technology Access in Cameron County
Computing Device Access in Cameron County
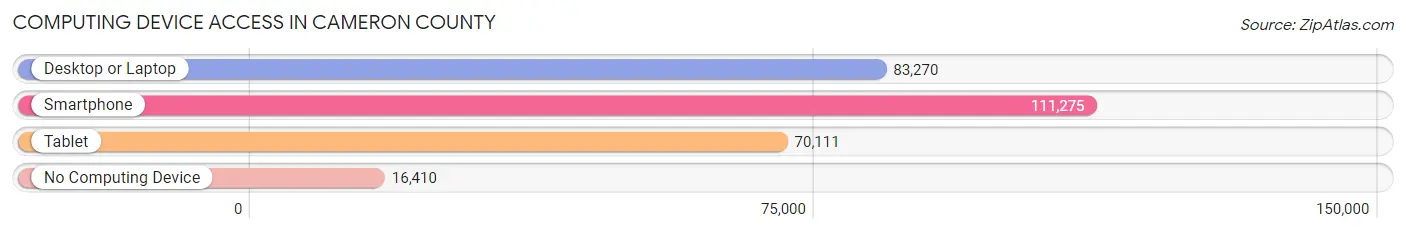
| Device Type | # Households | % Households |
| Desktop or Laptop | 83,270 | 62.8% |
| Smartphone | 111,275 | 84.0% |
| Tablet | 70,111 | 52.9% |
| No Computing Device | 16,410 | 12.4% |
| Total | 132,538 | 100.0% |
Internet Access in Cameron County
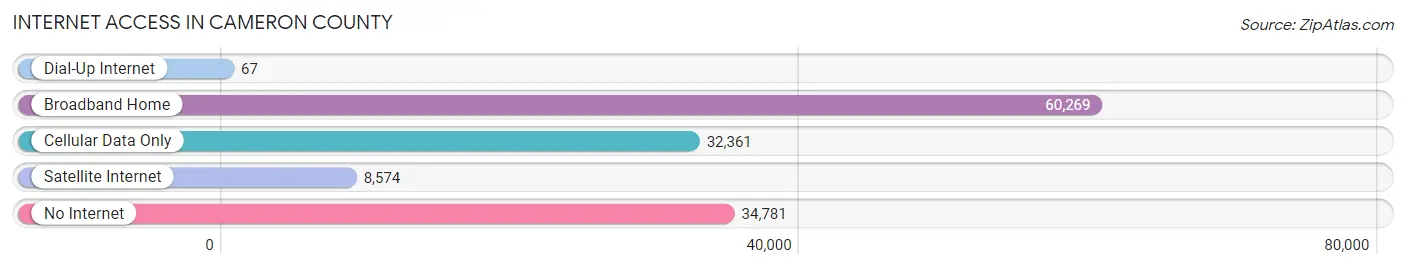
| Internet Type | # Households | % Households |
| Dial-Up Internet | 67 | 0.1% |
| Broadband Home | 60,269 | 45.5% |
| Cellular Data Only | 32,361 | 24.4% |
| Satellite Internet | 8,574 | 6.5% |
| No Internet | 34,781 | 26.2% |
| Total | 132,538 | 100.0% |
Cameron County Summary
Cameron County is located in the southernmost tip of Texas, along the Gulf of Mexico. It is bordered by the Mexican states of Tamaulipas and Nuevo Leon to the south, and by the counties of Willacy and Hidalgo to the west and north, respectively. The county seat is Brownsville, and the county has a population of approximately 437,000 people.
Cameron County has a rich history that dates back to the early 1800s. The area was originally inhabited by the Karankawa and Coahuiltecan Native American tribes. In 1828, the Mexican government granted land to the settlers of the area, and the county was officially established in 1848. During the Mexican-American War, the county was the site of several battles, including the Battle of Palo Alto and the Battle of Resaca de la Palma.
In the late 1800s, the county experienced a period of rapid growth due to the development of the railroad and the discovery of oil. This period of growth was followed by a period of decline in the early 1900s, as the oil industry declined and the railroad was replaced by highways.
The economy of Cameron County is largely based on agriculture, tourism, and oil and gas production. The county is home to several large agricultural operations, including citrus and vegetable farms, as well as cattle and dairy farms. The county is also home to several tourist attractions, including the Padre Island National Seashore, the South Padre Island Birding and Nature Center, and the Gladys Porter Zoo.
The oil and gas industry is a major contributor to the economy of Cameron County. The county is home to several oil and gas production facilities, as well as several refineries. The county is also home to several offshore oil and gas production platforms.
The demographics of Cameron County are diverse. The population is predominantly Hispanic, with a large percentage of Mexican-Americans. The county also has a significant African-American population, as well as a small Asian-American population. The median household income in the county is approximately $37,000, and the poverty rate is approximately 20%.
Cameron County is a vibrant and diverse county with a rich history and a bright future. The county is home to a variety of industries, attractions, and people, and is an important part of the Texas economy.
Common Questions
What is Per Capita Income in Cameron County?
Per Capita income in Cameron County is $21,440.
What is the Median Family Income in Cameron County?
Median Family Income in Cameron County is $54,380.
What is the Median Household income in Cameron County?
Median Household Income in Cameron County is $47,435.
What is Income or Wage Gap in Cameron County?
Income or Wage Gap in Cameron County is 28.1%.
Women in Cameron County earn 71.9 cents for every dollar earned by a man.
What is Family Income Deficit in Cameron County?
Family Income Deficit in Cameron County is $10,966.
Families that are below poverty line in Cameron County earn $10,966 less on average than the poverty threshold level.
What is Inequality or Gini Index in Cameron County?
Inequality or Gini Index in Cameron County is 0.47.
What is the Total Population of Cameron County?
Total Population of Cameron County is 421,854.
What is the Total Male Population of Cameron County?
Total Male Population of Cameron County is 208,182.
What is the Total Female Population of Cameron County?
Total Female Population of Cameron County is 213,672.
What is the Ratio of Males per 100 Females in Cameron County?
There are 97.43 Males per 100 Females in Cameron County.
What is the Ratio of Females per 100 Males in Cameron County?
There are 102.64 Females per 100 Males in Cameron County.
What is the Median Population Age in Cameron County?
Median Population Age in Cameron County is 32.0 Years.
What is the Average Family Size in Cameron County
Average Family Size in Cameron County is 3.7 People.
What is the Average Household Size in Cameron County
Average Household Size in Cameron County is 3.2 People.
How Large is the Labor Force in Cameron County?
There are 178,974 People in the Labor Forcein in Cameron County.
What is the Percentage of People in the Labor Force in Cameron County?
57.2% of People are in the Labor Force in Cameron County.
What is the Unemployment Rate in Cameron County?
Unemployment Rate in Cameron County is 5.7%.