Ellis County, TX Map & Demographics
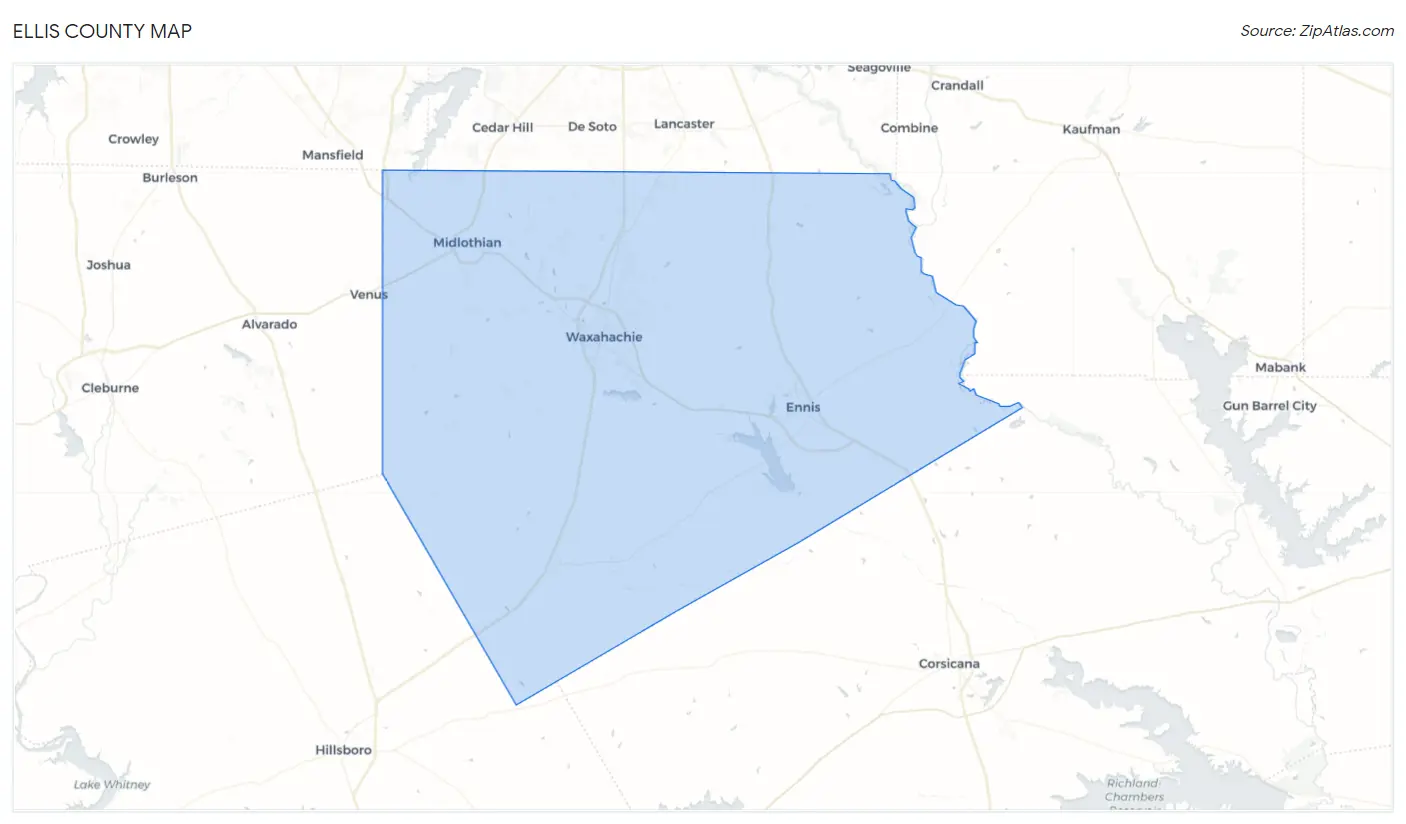
Ellis County Map
Ellis County Overview
$38,628
PER CAPITA INCOME
$103,817
AVG FAMILY INCOME
$93,248
AVG HOUSEHOLD INCOME
31.2%
WAGE / INCOME GAP [ % ]
68.8¢/ $1
WAGE / INCOME GAP [ $ ]
$10,611
FAMILY INCOME DEFICIT
0.40
INEQUALITY / GINI INDEX
195,509
TOTAL POPULATION
97,264
MALE POPULATION
98,245
FEMALE POPULATION
99.00
MALES / 100 FEMALES
101.01
FEMALES / 100 MALES
36.2
MEDIAN AGE
3.3
AVG FAMILY SIZE
3.0
AVG HOUSEHOLD SIZE
103,628
LABOR FORCE [ PEOPLE ]
69.0%
PERCENT IN LABOR FORCE
3.9%
UNEMPLOYMENT RATE
Income in Ellis County
Income Overview in Ellis County
Per Capita Income in Ellis County is $38,628, while median incomes of families and households are $103,817 and $93,248 respectively.
| Characteristic | Number | Measure |
| Per Capita Income | 195,509 | $38,628 |
| Median Family Income | 52,183 | $103,817 |
| Mean Family Income | 52,183 | $122,420 |
| Median Household Income | 65,686 | $93,248 |
| Mean Household Income | 65,686 | $111,815 |
| Income Deficit | 52,183 | $10,611 |
| Wage / Income Gap (%) | 195,509 | 31.19% |
| Wage / Income Gap ($) | 195,509 | 68.81¢ per $1 |
| Gini / Inequality Index | 195,509 | 0.40 |
Earnings by Sex in Ellis County
Average Earnings in Ellis County are $45,259, $53,108 for men and $36,543 for women, a difference of 31.2%.
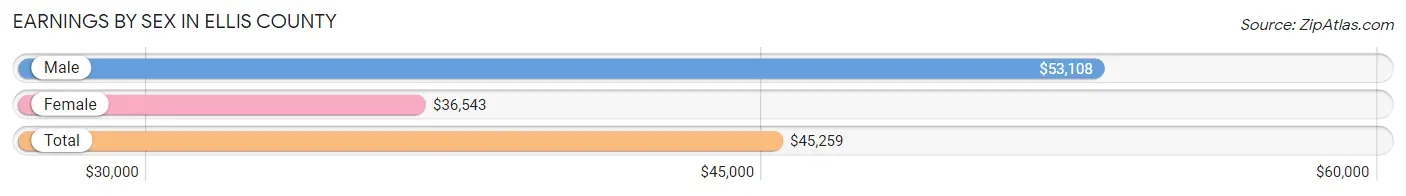
| Sex | Number | Average Earnings |
| Male | 57,442 (53.0%) | $53,108 |
| Female | 50,838 (46.9%) | $36,543 |
| Total | 108,280 (100.0%) | $45,259 |
Earnings by Sex by Income Bracket in Ellis County
The most common earnings brackets in Ellis County are $100,000+ for men (10,866 | 18.9%) and $55,000 to $64,999 for women (4,566 | 9.0%).
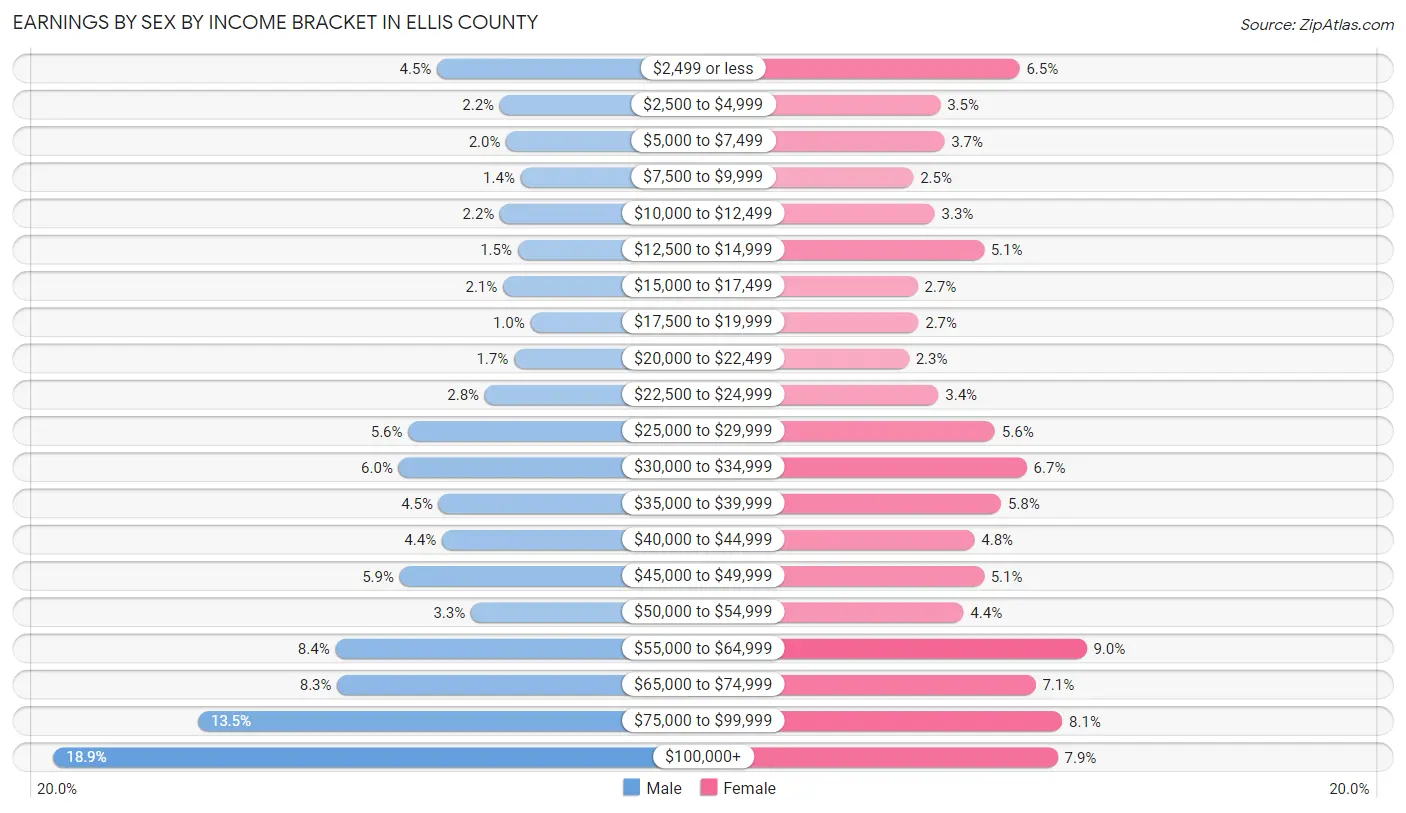
| Income | Male | Female |
| $2,499 or less | 2,606 (4.5%) | 3,289 (6.5%) |
| $2,500 to $4,999 | 1,258 (2.2%) | 1,780 (3.5%) |
| $5,000 to $7,499 | 1,118 (1.9%) | 1,858 (3.6%) |
| $7,500 to $9,999 | 808 (1.4%) | 1,268 (2.5%) |
| $10,000 to $12,499 | 1,252 (2.2%) | 1,674 (3.3%) |
| $12,500 to $14,999 | 872 (1.5%) | 2,610 (5.1%) |
| $15,000 to $17,499 | 1,189 (2.1%) | 1,348 (2.6%) |
| $17,500 to $19,999 | 597 (1.0%) | 1,362 (2.7%) |
| $20,000 to $22,499 | 952 (1.7%) | 1,181 (2.3%) |
| $22,500 to $24,999 | 1,582 (2.8%) | 1,746 (3.4%) |
| $25,000 to $29,999 | 3,227 (5.6%) | 2,821 (5.6%) |
| $30,000 to $34,999 | 3,435 (6.0%) | 3,426 (6.7%) |
| $35,000 to $39,999 | 2,572 (4.5%) | 2,938 (5.8%) |
| $40,000 to $44,999 | 2,502 (4.4%) | 2,428 (4.8%) |
| $45,000 to $49,999 | 3,414 (5.9%) | 2,610 (5.1%) |
| $50,000 to $54,999 | 1,879 (3.3%) | 2,222 (4.4%) |
| $55,000 to $64,999 | 4,794 (8.4%) | 4,566 (9.0%) |
| $65,000 to $74,999 | 4,757 (8.3%) | 3,592 (7.1%) |
| $75,000 to $99,999 | 7,762 (13.5%) | 4,105 (8.1%) |
| $100,000+ | 10,866 (18.9%) | 4,014 (7.9%) |
| Total | 57,442 (100.0%) | 50,838 (100.0%) |
Earnings by Sex by Educational Attainment in Ellis County
Average earnings in Ellis County are $62,157 for men and $43,411 for women, a difference of 30.2%. Men with an educational attainment of graduate degree enjoy the highest average annual earnings of $82,843, while those with less than high school education earn the least with $36,032. Women with an educational attainment of graduate degree earn the most with the average annual earnings of $69,498, while those with less than high school education have the smallest earnings of $21,728.
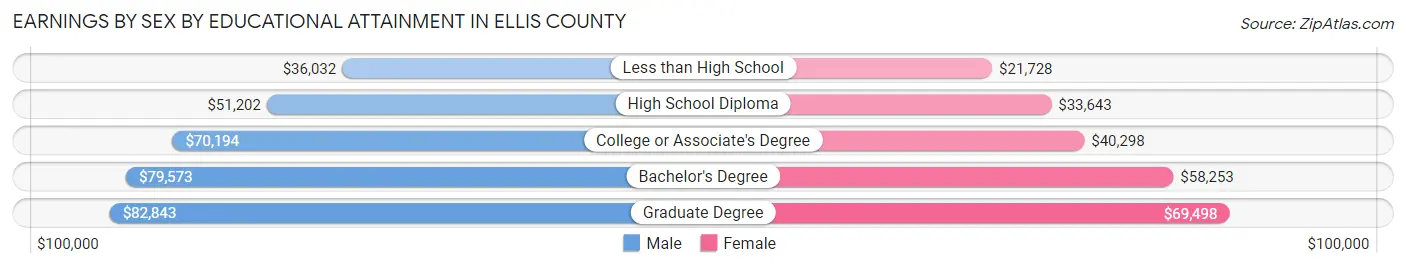
| Educational Attainment | Male Income | Female Income |
| Less than High School | $36,032 | $21,728 |
| High School Diploma | $51,202 | $33,643 |
| College or Associate's Degree | $70,194 | $40,298 |
| Bachelor's Degree | $79,573 | $58,253 |
| Graduate Degree | $82,843 | $69,498 |
| Total | $62,157 | $43,411 |
Family Income in Ellis County
Family Income Brackets in Ellis County
According to the Ellis County family income data, there are 13,463 families falling into the $100,000 to $149,999 income range, which is the most common income bracket and makes up 25.8% of all families. Conversely, the $10,000 to $14,999 income bracket is the least frequent group with only 522 families (1.0%) belonging to this category.
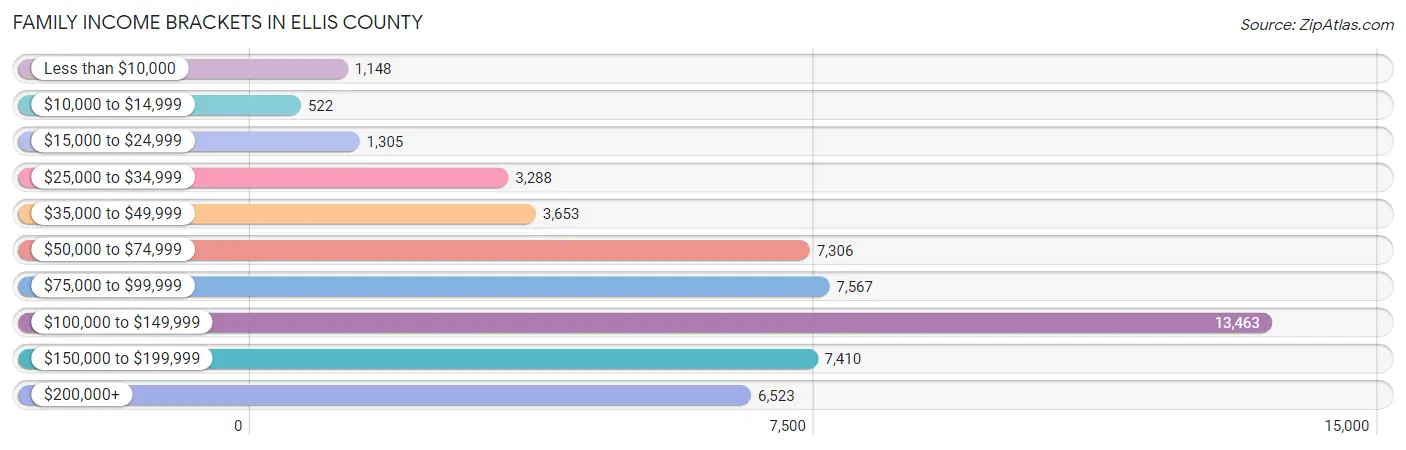
| Income Bracket | # Families | % Families |
| Less than $10,000 | 1,148 | 2.2% |
| $10,000 to $14,999 | 522 | 1.0% |
| $15,000 to $24,999 | 1,305 | 2.5% |
| $25,000 to $34,999 | 3,288 | 6.3% |
| $35,000 to $49,999 | 3,653 | 7.0% |
| $50,000 to $74,999 | 7,306 | 14.0% |
| $75,000 to $99,999 | 7,567 | 14.5% |
| $100,000 to $149,999 | 13,463 | 25.8% |
| $150,000 to $199,999 | 7,410 | 14.2% |
| $200,000+ | 6,523 | 12.5% |
Family Income by Famaliy Size in Ellis County
7+ person families (1,214 | 2.3%) account for the highest median family income in Ellis County with $138,095 per family, while 2-person families (21,117 | 40.5%) have the highest median income of $46,440 per family member.
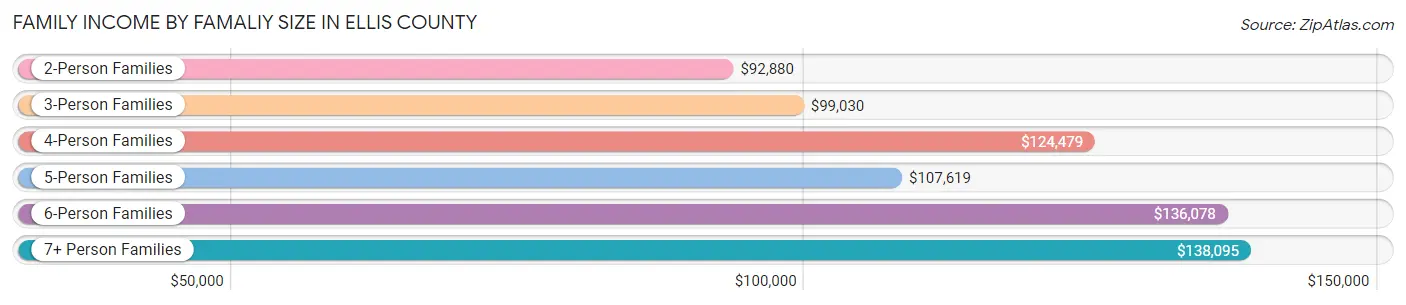
| Income Bracket | # Families | Median Income |
| 2-Person Families | 21,117 (40.5%) | $92,880 |
| 3-Person Families | 12,246 (23.5%) | $99,030 |
| 4-Person Families | 10,574 (20.3%) | $124,479 |
| 5-Person Families | 4,908 (9.4%) | $107,619 |
| 6-Person Families | 2,124 (4.1%) | $136,078 |
| 7+ Person Families | 1,214 (2.3%) | $138,095 |
| Total | 52,183 (100.0%) | $103,817 |
Family Income by Number of Earners in Ellis County
The median family income in Ellis County is $103,817, with families comprising 3+ earners (8,594) having the highest median family income of $147,298, while families with no earners (5,392) have the lowest median family income of $55,970, accounting for 16.5% and 10.3% of families, respectively.
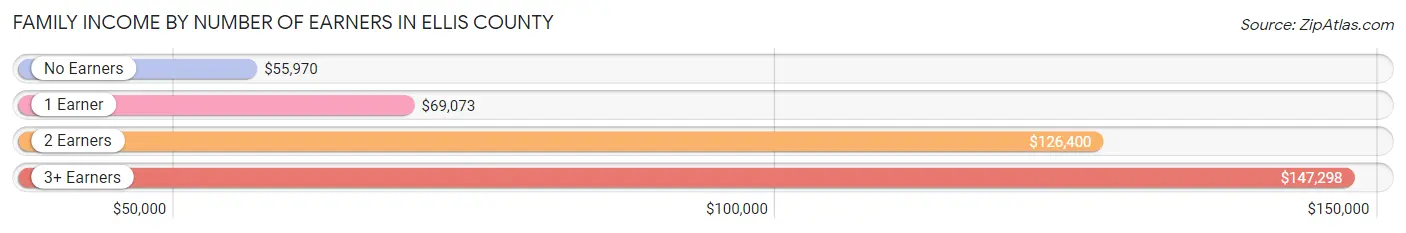
| Number of Earners | # Families | Median Income |
| No Earners | 5,392 (10.3%) | $55,970 |
| 1 Earner | 14,816 (28.4%) | $69,073 |
| 2 Earners | 23,381 (44.8%) | $126,400 |
| 3+ Earners | 8,594 (16.5%) | $147,298 |
| Total | 52,183 (100.0%) | $103,817 |
Household Income in Ellis County
Household Income Brackets in Ellis County
With 15,239 households falling in the category, the $100,000 to $149,999 income range is the most frequent in Ellis County, accounting for 23.2% of all households. In contrast, only 1,511 households (2.3%) fall into the $10,000 to $14,999 income bracket, making it the least populous group.
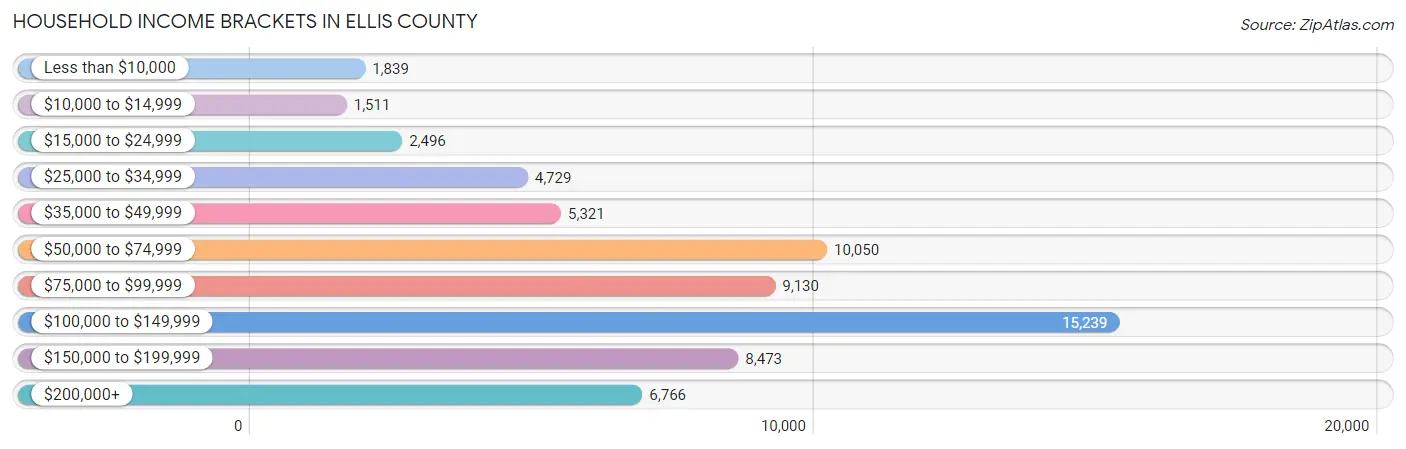
| Income Bracket | # Households | % Households |
| Less than $10,000 | 1,839 | 2.8% |
| $10,000 to $14,999 | 1,511 | 2.3% |
| $15,000 to $24,999 | 2,496 | 3.8% |
| $25,000 to $34,999 | 4,729 | 7.2% |
| $35,000 to $49,999 | 5,321 | 8.1% |
| $50,000 to $74,999 | 10,050 | 15.3% |
| $75,000 to $99,999 | 9,130 | 13.9% |
| $100,000 to $149,999 | 15,239 | 23.2% |
| $150,000 to $199,999 | 8,473 | 12.9% |
| $200,000+ | 6,766 | 10.3% |
Household Income by Householder Age in Ellis County
The median household income in Ellis County is $93,248, with the highest median household income of $115,312 found in the 45 to 64 years age bracket for the primary householder. A total of 25,552 households (38.9%) fall into this category. Meanwhile, the 15 to 24 years age bracket for the primary householder has the lowest median household income of $49,348, with 1,749 households (2.7%) in this group.
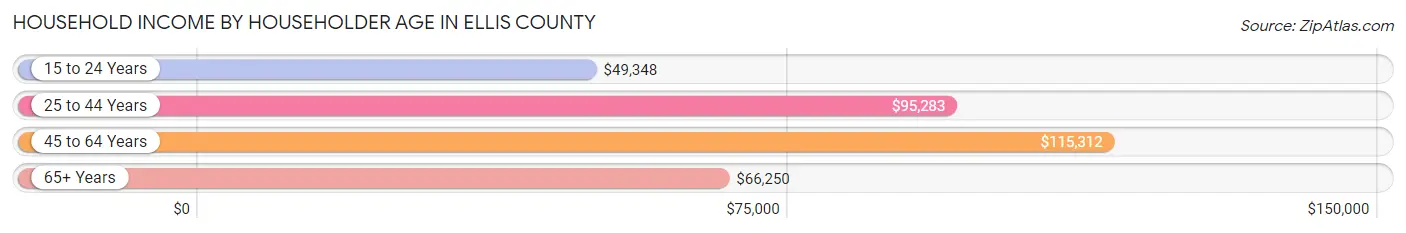
| Income Bracket | # Households | Median Income |
| 15 to 24 Years | 1,749 (2.7%) | $49,348 |
| 25 to 44 Years | 23,665 (36.0%) | $95,283 |
| 45 to 64 Years | 25,552 (38.9%) | $115,312 |
| 65+ Years | 14,720 (22.4%) | $66,250 |
| Total | 65,686 (100.0%) | $93,248 |
Poverty in Ellis County
Income Below Poverty by Sex and Age in Ellis County
With 7.5% poverty level for males and 8.9% for females among the residents of Ellis County, 5 year old males and 25 to 34 year old females are the most vulnerable to poverty, with 269 males (22.9%) and 1,841 females (14.5%) in their respective age groups living below the poverty level.
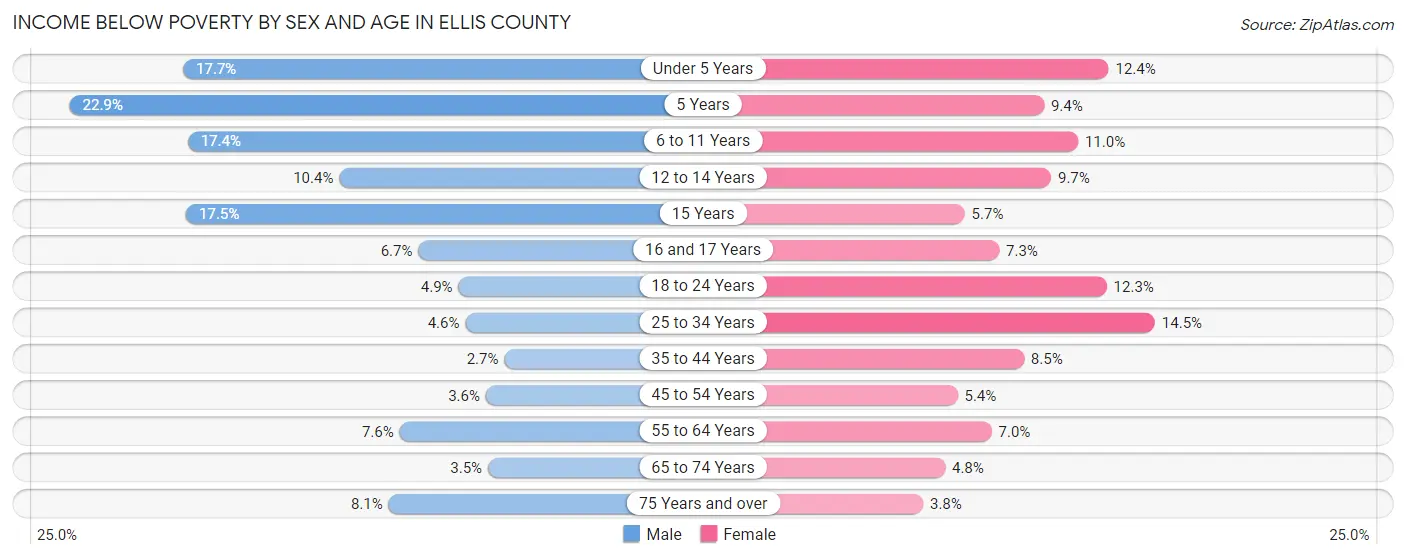
| Age Bracket | Male | Female |
| Under 5 Years | 1,139 (17.6%) | 749 (12.4%) |
| 5 Years | 269 (22.9%) | 135 (9.4%) |
| 6 to 11 Years | 1,510 (17.4%) | 907 (11.0%) |
| 12 to 14 Years | 538 (10.4%) | 432 (9.7%) |
| 15 Years | 291 (17.5%) | 85 (5.7%) |
| 16 and 17 Years | 207 (6.7%) | 225 (7.3%) |
| 18 to 24 Years | 443 (4.9%) | 1,029 (12.3%) |
| 25 to 34 Years | 555 (4.5%) | 1,841 (14.5%) |
| 35 to 44 Years | 361 (2.7%) | 1,145 (8.5%) |
| 45 to 54 Years | 456 (3.6%) | 677 (5.4%) |
| 55 to 64 Years | 883 (7.6%) | 820 (7.0%) |
| 65 to 74 Years | 261 (3.5%) | 398 (4.8%) |
| 75 Years and over | 299 (8.1%) | 195 (3.8%) |
| Total | 7,212 (7.5%) | 8,638 (8.9%) |
Income Above Poverty by Sex and Age in Ellis County
According to the poverty statistics in Ellis County, males aged 35 to 44 years and females aged 75 years and over are the age groups that are most secure financially, with 97.3% of males and 96.2% of females in these age groups living above the poverty line.
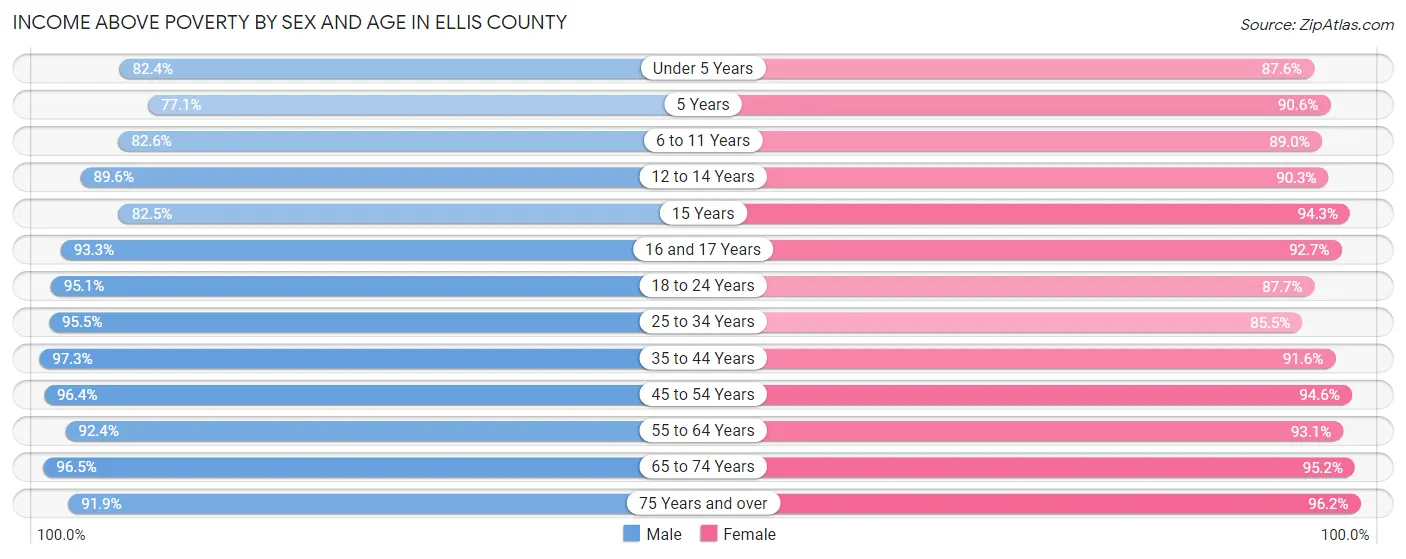
| Age Bracket | Male | Female |
| Under 5 Years | 5,316 (82.4%) | 5,300 (87.6%) |
| 5 Years | 905 (77.1%) | 1,305 (90.6%) |
| 6 to 11 Years | 7,152 (82.6%) | 7,366 (89.0%) |
| 12 to 14 Years | 4,636 (89.6%) | 4,015 (90.3%) |
| 15 Years | 1,371 (82.5%) | 1,406 (94.3%) |
| 16 and 17 Years | 2,868 (93.3%) | 2,859 (92.7%) |
| 18 to 24 Years | 8,649 (95.1%) | 7,342 (87.7%) |
| 25 to 34 Years | 11,654 (95.5%) | 10,830 (85.5%) |
| 35 to 44 Years | 12,821 (97.3%) | 12,406 (91.5%) |
| 45 to 54 Years | 12,222 (96.4%) | 11,940 (94.6%) |
| 55 to 64 Years | 10,740 (92.4%) | 10,985 (93.0%) |
| 65 to 74 Years | 7,192 (96.5%) | 7,918 (95.2%) |
| 75 Years and over | 3,390 (91.9%) | 4,971 (96.2%) |
| Total | 88,916 (92.5%) | 88,643 (91.1%) |
Income Below Poverty Among Married-Couple Families in Ellis County
The poverty statistics for married-couple families in Ellis County show that 2.8% or 1,136 of the total 39,953 families live below the poverty line. Families with 5 or more children have the highest poverty rate of 22.1%, comprising of 61 families. On the other hand, families with 1 or 2 children have the lowest poverty rate of 2.1%, which includes 291 families.
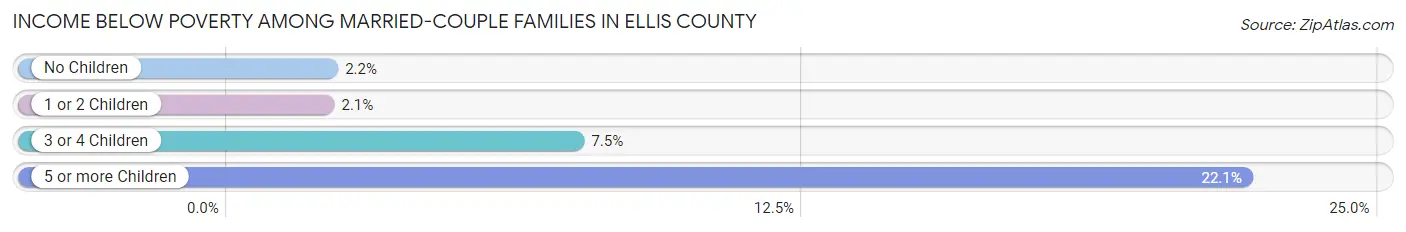
| Children | Above Poverty | Below Poverty |
| No Children | 21,222 (97.8%) | 472 (2.2%) |
| 1 or 2 Children | 13,553 (97.9%) | 291 (2.1%) |
| 3 or 4 Children | 3,827 (92.5%) | 312 (7.5%) |
| 5 or more Children | 215 (77.9%) | 61 (22.1%) |
| Total | 38,817 (97.2%) | 1,136 (2.8%) |
Income Below Poverty Among Single-Parent Households in Ellis County
According to the poverty data in Ellis County, 6.9% or 248 single-father households and 23.2% or 2,003 single-mother households are living below the poverty line. Among single-father households, those with 5 or more children have the highest poverty rate, with 16 households (44.4%) experiencing poverty. Likewise, among single-mother households, those with 5 or more children have the highest poverty rate, with 106 households (81.5%) falling below the poverty line.
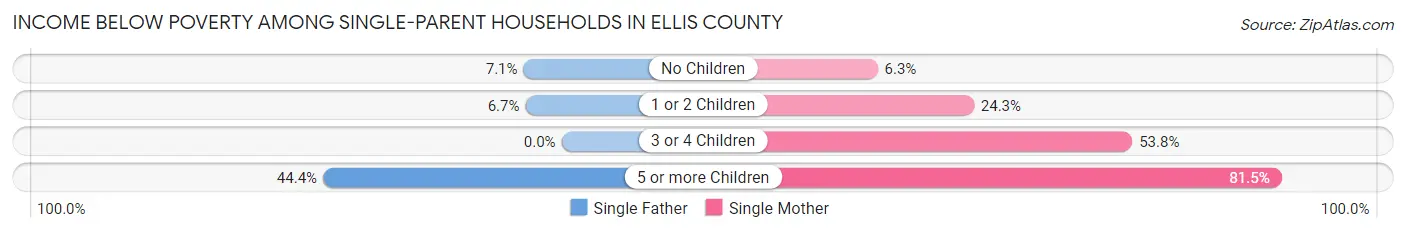
| Children | Single Father | Single Mother |
| No Children | 114 (7.1%) | 175 (6.3%) |
| 1 or 2 Children | 118 (6.7%) | 1,113 (24.2%) |
| 3 or 4 Children | 0 (0.0%) | 609 (53.7%) |
| 5 or more Children | 16 (44.4%) | 106 (81.5%) |
| Total | 248 (6.9%) | 2,003 (23.2%) |
Income Below Poverty Among Married-Couple vs Single-Parent Households in Ellis County
The poverty data for Ellis County shows that 1,136 of the married-couple family households (2.8%) and 2,251 of the single-parent households (18.4%) are living below the poverty level. Within the married-couple family households, those with 5 or more children have the highest poverty rate, with 61 households (22.1%) falling below the poverty line. Among the single-parent households, those with 5 or more children have the highest poverty rate, with 122 household (73.5%) living below poverty.
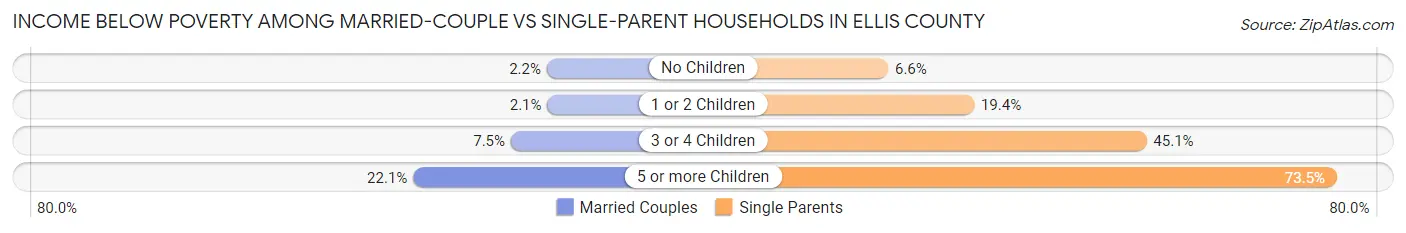
| Children | Married-Couple Families | Single-Parent Households |
| No Children | 472 (2.2%) | 289 (6.6%) |
| 1 or 2 Children | 291 (2.1%) | 1,231 (19.4%) |
| 3 or 4 Children | 312 (7.5%) | 609 (45.1%) |
| 5 or more Children | 61 (22.1%) | 122 (73.5%) |
| Total | 1,136 (2.8%) | 2,251 (18.4%) |
Race in Ellis County
The most populous races in Ellis County are White / Caucasian (135,604 | 69.4%), Hispanic or Latino (53,807 | 27.5%), and Black / African American (24,584 | 12.6%).
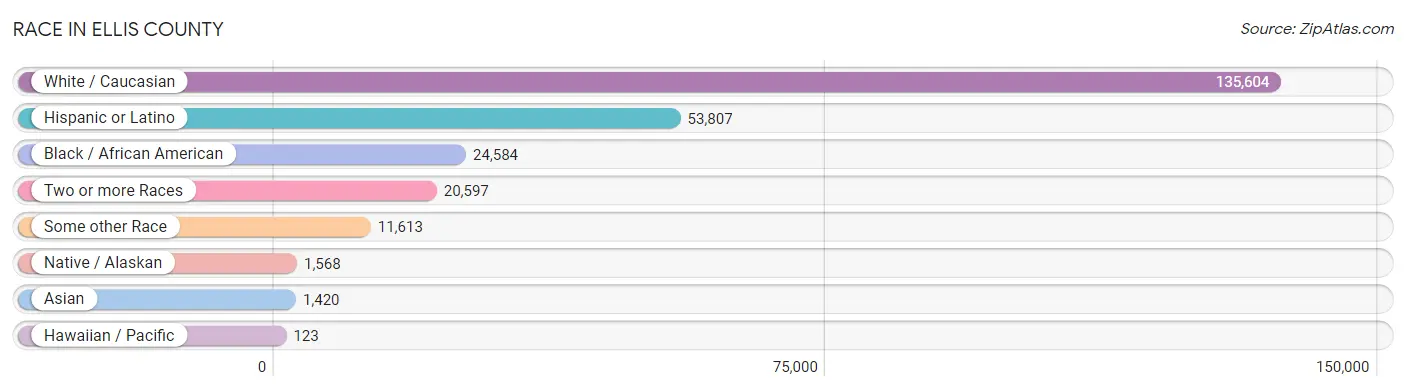
| Race | # Population | % Population |
| Asian | 1,420 | 0.7% |
| Black / African American | 24,584 | 12.6% |
| Hawaiian / Pacific | 123 | 0.1% |
| Hispanic or Latino | 53,807 | 27.5% |
| Native / Alaskan | 1,568 | 0.8% |
| White / Caucasian | 135,604 | 69.4% |
| Two or more Races | 20,597 | 10.5% |
| Some other Race | 11,613 | 5.9% |
| Total | 195,509 | 100.0% |
Ancestry in Ellis County
The most populous ancestries reported in Ellis County are Mexican (47,439 | 24.3%), German (17,652 | 9.0%), English (17,344 | 8.9%), Irish (14,943 | 7.6%), and American (14,848 | 7.6%), together accounting for 57.4% of all Ellis County residents.
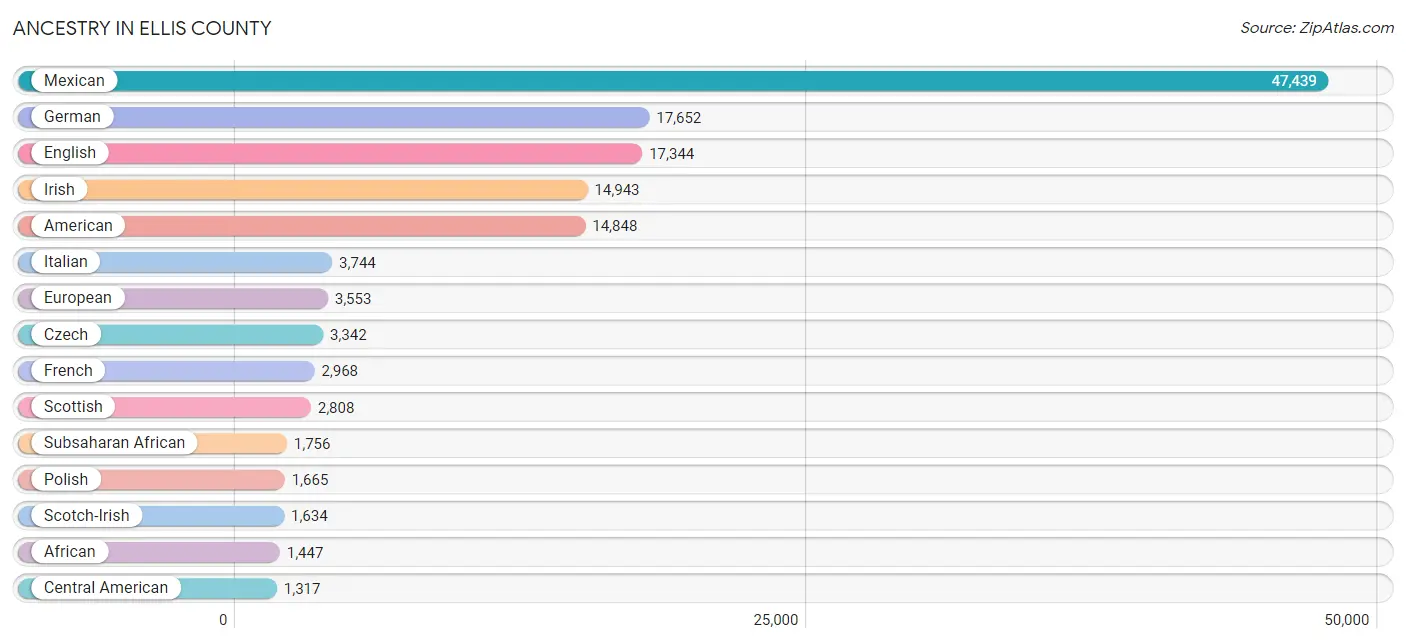
| Ancestry | # Population | % Population |
| Afghan | 5 | 0.0% |
| African | 1,447 | 0.7% |
| American | 14,848 | 7.6% |
| Apache | 60 | 0.0% |
| Arab | 678 | 0.4% |
| Argentinean | 37 | 0.0% |
| Armenian | 9 | 0.0% |
| Australian | 66 | 0.0% |
| Austrian | 93 | 0.1% |
| Bangladeshi | 125 | 0.1% |
| Belgian | 110 | 0.1% |
| Belizean | 39 | 0.0% |
| Bhutanese | 229 | 0.1% |
| Blackfeet | 164 | 0.1% |
| Brazilian | 231 | 0.1% |
| British | 1,125 | 0.6% |
| British West Indian | 37 | 0.0% |
| Burmese | 118 | 0.1% |
| Cajun | 47 | 0.0% |
| Canadian | 118 | 0.1% |
| Central American | 1,317 | 0.7% |
| Central American Indian | 587 | 0.3% |
| Cherokee | 820 | 0.4% |
| Chickasaw | 35 | 0.0% |
| Chippewa | 3 | 0.0% |
| Choctaw | 350 | 0.2% |
| Colombian | 425 | 0.2% |
| Comanche | 44 | 0.0% |
| Costa Rican | 76 | 0.0% |
| Cree | 28 | 0.0% |
| Creek | 59 | 0.0% |
| Croatian | 96 | 0.1% |
| Cuban | 400 | 0.2% |
| Czech | 3,342 | 1.7% |
| Czechoslovakian | 463 | 0.2% |
| Danish | 188 | 0.1% |
| Dominican | 49 | 0.0% |
| Dutch | 1,172 | 0.6% |
| Dutch West Indian | 70 | 0.0% |
| Eastern European | 152 | 0.1% |
| Ecuadorian | 278 | 0.1% |
| Egyptian | 31 | 0.0% |
| English | 17,344 | 8.9% |
| European | 3,553 | 1.8% |
| Filipino | 60 | 0.0% |
| Finnish | 21 | 0.0% |
| French | 2,968 | 1.5% |
| French American Indian | 6 | 0.0% |
| French Canadian | 382 | 0.2% |
| German | 17,652 | 9.0% |
| German Russian | 19 | 0.0% |
| Greek | 398 | 0.2% |
| Guatemalan | 268 | 0.1% |
| Haitian | 21 | 0.0% |
| Honduran | 91 | 0.1% |
| Hungarian | 255 | 0.1% |
| Indian (Asian) | 99 | 0.1% |
| Inupiat | 287 | 0.2% |
| Iranian | 123 | 0.1% |
| Irish | 14,943 | 7.6% |
| Iroquois | 5 | 0.0% |
| Italian | 3,744 | 1.9% |
| Jamaican | 354 | 0.2% |
| Japanese | 217 | 0.1% |
| Korean | 610 | 0.3% |
| Laotian | 80 | 0.0% |
| Lebanese | 116 | 0.1% |
| Lithuanian | 5 | 0.0% |
| Luxembourger | 9 | 0.0% |
| Malaysian | 37 | 0.0% |
| Maltese | 35 | 0.0% |
| Marshallese | 6 | 0.0% |
| Mexican | 47,439 | 24.3% |
| Mexican American Indian | 403 | 0.2% |
| Moroccan | 23 | 0.0% |
| Native Hawaiian | 111 | 0.1% |
| Nigerian | 8 | 0.0% |
| Northern European | 149 | 0.1% |
| Norwegian | 1,007 | 0.5% |
| Pakistani | 81 | 0.0% |
| Panamanian | 20 | 0.0% |
| Paraguayan | 42 | 0.0% |
| Pennsylvania German | 26 | 0.0% |
| Peruvian | 7 | 0.0% |
| Polish | 1,665 | 0.9% |
| Portuguese | 205 | 0.1% |
| Pueblo | 242 | 0.1% |
| Puerto Rican | 884 | 0.4% |
| Russian | 290 | 0.2% |
| Salvadoran | 862 | 0.4% |
| Samoan | 31 | 0.0% |
| Scandinavian | 455 | 0.2% |
| Scotch-Irish | 1,634 | 0.8% |
| Scottish | 2,808 | 1.4% |
| Seminole | 18 | 0.0% |
| Serbian | 12 | 0.0% |
| Sioux | 23 | 0.0% |
| Slavic | 25 | 0.0% |
| Slovak | 85 | 0.0% |
| Slovene | 15 | 0.0% |
| South African | 14 | 0.0% |
| South American | 968 | 0.5% |
| Spaniard | 827 | 0.4% |
| Spanish | 265 | 0.1% |
| Spanish American | 37 | 0.0% |
| Sri Lankan | 156 | 0.1% |
| Subsaharan African | 1,756 | 0.9% |
| Swedish | 1,046 | 0.5% |
| Swiss | 152 | 0.1% |
| Syrian | 300 | 0.2% |
| Thai | 422 | 0.2% |
| Trinidadian and Tobagonian | 10 | 0.0% |
| Turkish | 24 | 0.0% |
| Ukrainian | 101 | 0.1% |
| Uruguayan | 102 | 0.1% |
| Venezuelan | 77 | 0.0% |
| Vietnamese | 28 | 0.0% |
| Welsh | 819 | 0.4% |
| West Indian | 166 | 0.1% |
| Yugoslavian | 121 | 0.1% | View All 120 Rows |
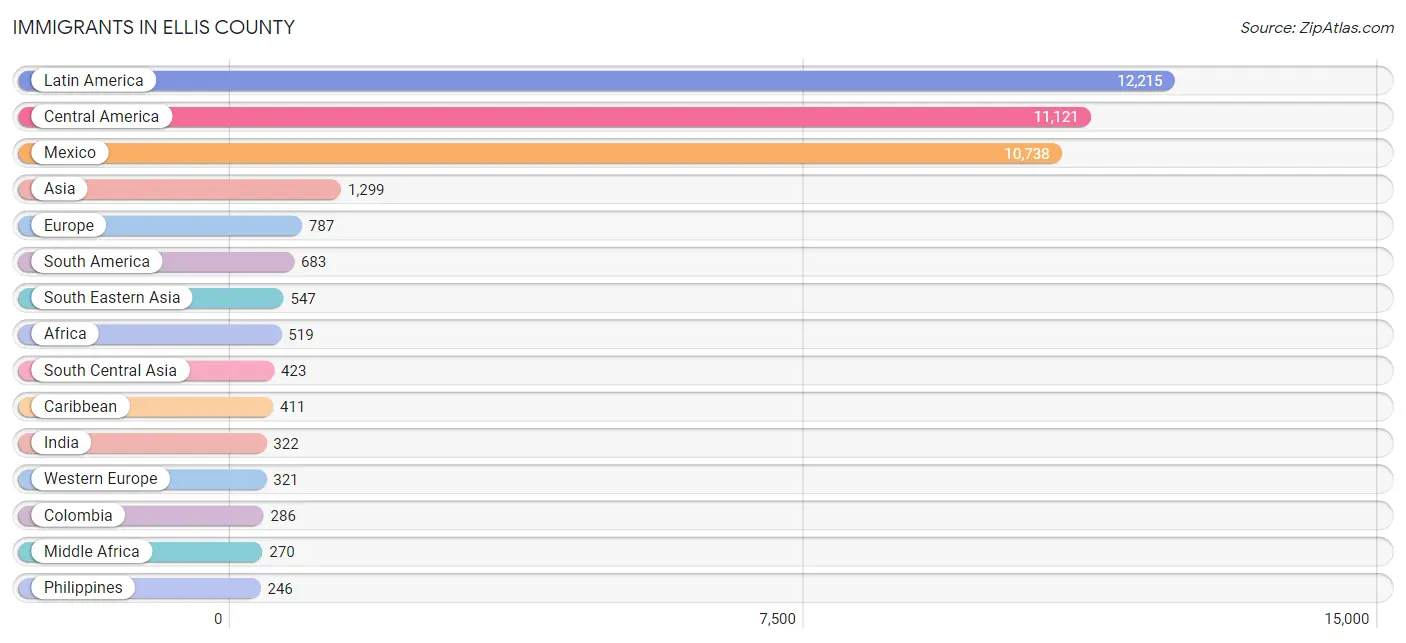
Immigrants in Ellis County
The most numerous immigrant groups reported in Ellis County came from Latin America (12,215 | 6.2%), Central America (11,121 | 5.7%), Mexico (10,738 | 5.5%), Asia (1,299 | 0.7%), and Europe (787 | 0.4%), together accounting for 18.5% of all Ellis County residents.
| Immigration Origin | # Population | % Population |
| Afghanistan | 5 | 0.0% |
| Africa | 519 | 0.3% |
| Argentina | 37 | 0.0% |
| Asia | 1,299 | 0.7% |
| Australia | 81 | 0.0% |
| Bangladesh | 23 | 0.0% |
| Belize | 39 | 0.0% |
| Brazil | 144 | 0.1% |
| Cambodia | 88 | 0.1% |
| Cameroon | 209 | 0.1% |
| Canada | 137 | 0.1% |
| Caribbean | 411 | 0.2% |
| Central America | 11,121 | 5.7% |
| Chile | 18 | 0.0% |
| China | 43 | 0.0% |
| Colombia | 286 | 0.2% |
| Costa Rica | 2 | 0.0% |
| Cuba | 80 | 0.0% |
| Czechoslovakia | 32 | 0.0% |
| Denmark | 6 | 0.0% |
| Dominican Republic | 17 | 0.0% |
| Eastern Africa | 57 | 0.0% |
| Eastern Asia | 83 | 0.0% |
| Eastern Europe | 114 | 0.1% |
| Ecuador | 104 | 0.1% |
| Egypt | 16 | 0.0% |
| El Salvador | 198 | 0.1% |
| England | 143 | 0.1% |
| Europe | 787 | 0.4% |
| France | 53 | 0.0% |
| Germany | 223 | 0.1% |
| Greece | 53 | 0.0% |
| Guatemala | 92 | 0.1% |
| Haiti | 21 | 0.0% |
| Honduras | 24 | 0.0% |
| India | 322 | 0.2% |
| Indonesia | 16 | 0.0% |
| Iran | 25 | 0.0% |
| Italy | 27 | 0.0% |
| Jamaica | 145 | 0.1% |
| Japan | 12 | 0.0% |
| Jordan | 27 | 0.0% |
| Kenya | 8 | 0.0% |
| Korea | 28 | 0.0% |
| Kuwait | 10 | 0.0% |
| Laos | 61 | 0.0% |
| Latin America | 12,215 | 6.2% |
| Lebanon | 70 | 0.0% |
| Malaysia | 12 | 0.0% |
| Mexico | 10,738 | 5.5% |
| Micronesia | 6 | 0.0% |
| Middle Africa | 270 | 0.1% |
| Netherlands | 45 | 0.0% |
| Nicaragua | 16 | 0.0% |
| Nigeria | 8 | 0.0% |
| Northern Africa | 62 | 0.0% |
| Northern Europe | 178 | 0.1% |
| Oceania | 120 | 0.1% |
| Pakistan | 41 | 0.0% |
| Panama | 12 | 0.0% |
| Philippines | 246 | 0.1% |
| Poland | 6 | 0.0% |
| Portugal | 13 | 0.0% |
| Romania | 29 | 0.0% |
| Russia | 18 | 0.0% |
| Scotland | 10 | 0.0% |
| Senegal | 91 | 0.1% |
| South Africa | 31 | 0.0% |
| South America | 683 | 0.4% |
| South Central Asia | 423 | 0.2% |
| South Eastern Asia | 547 | 0.3% |
| Southern Europe | 174 | 0.1% |
| Spain | 58 | 0.0% |
| Sri Lanka | 7 | 0.0% |
| Syria | 131 | 0.1% |
| Taiwan | 36 | 0.0% |
| Thailand | 85 | 0.0% |
| Trinidad and Tobago | 103 | 0.1% |
| Ukraine | 29 | 0.0% |
| Venezuela | 94 | 0.1% |
| Vietnam | 39 | 0.0% |
| Western Africa | 99 | 0.1% |
| Western Asia | 246 | 0.1% |
| Western Europe | 321 | 0.2% |
| Zaire | 61 | 0.0% | View All 85 Rows |
Sex and Age in Ellis County
Sex and Age in Ellis County
The most populous age groups in Ellis County are 10 to 14 Years (8,394 | 8.6%) for men and 10 to 14 Years (7,623 | 7.8%) for women.
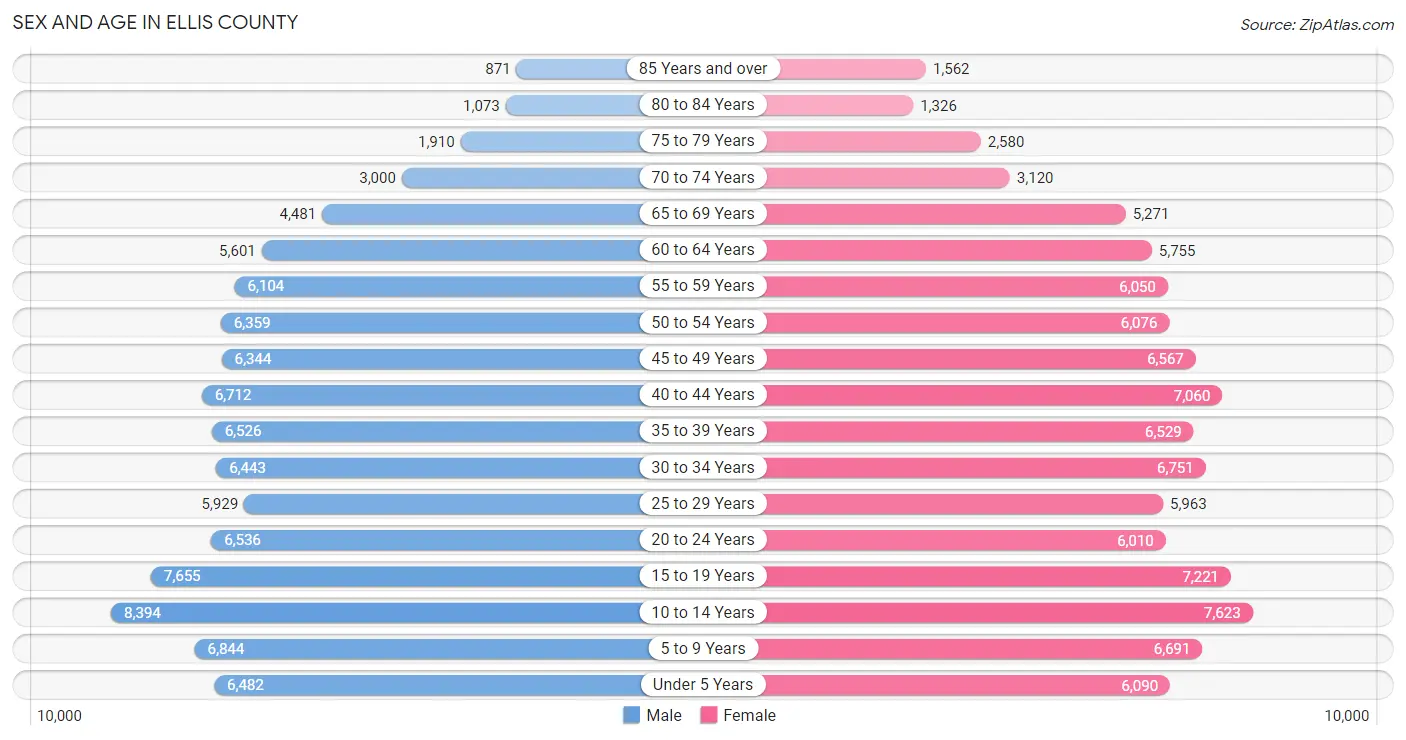
| Age Bracket | Male | Female |
| Under 5 Years | 6,482 (6.7%) | 6,090 (6.2%) |
| 5 to 9 Years | 6,844 (7.0%) | 6,691 (6.8%) |
| 10 to 14 Years | 8,394 (8.6%) | 7,623 (7.8%) |
| 15 to 19 Years | 7,655 (7.9%) | 7,221 (7.3%) |
| 20 to 24 Years | 6,536 (6.7%) | 6,010 (6.1%) |
| 25 to 29 Years | 5,929 (6.1%) | 5,963 (6.1%) |
| 30 to 34 Years | 6,443 (6.6%) | 6,751 (6.9%) |
| 35 to 39 Years | 6,526 (6.7%) | 6,529 (6.7%) |
| 40 to 44 Years | 6,712 (6.9%) | 7,060 (7.2%) |
| 45 to 49 Years | 6,344 (6.5%) | 6,567 (6.7%) |
| 50 to 54 Years | 6,359 (6.5%) | 6,076 (6.2%) |
| 55 to 59 Years | 6,104 (6.3%) | 6,050 (6.2%) |
| 60 to 64 Years | 5,601 (5.8%) | 5,755 (5.9%) |
| 65 to 69 Years | 4,481 (4.6%) | 5,271 (5.4%) |
| 70 to 74 Years | 3,000 (3.1%) | 3,120 (3.2%) |
| 75 to 79 Years | 1,910 (2.0%) | 2,580 (2.6%) |
| 80 to 84 Years | 1,073 (1.1%) | 1,326 (1.3%) |
| 85 Years and over | 871 (0.9%) | 1,562 (1.6%) |
| Total | 97,264 (100.0%) | 98,245 (100.0%) |
Families and Households in Ellis County
Median Family Size in Ellis County
The median family size in Ellis County is 3.33 persons per family, with married-couple families (39,953 | 76.6%) accounting for the largest median family size of 3.37 persons per family. On the other hand, single male/father families (3,609 | 6.9%) represent the smallest median family size with 2.95 persons per family.
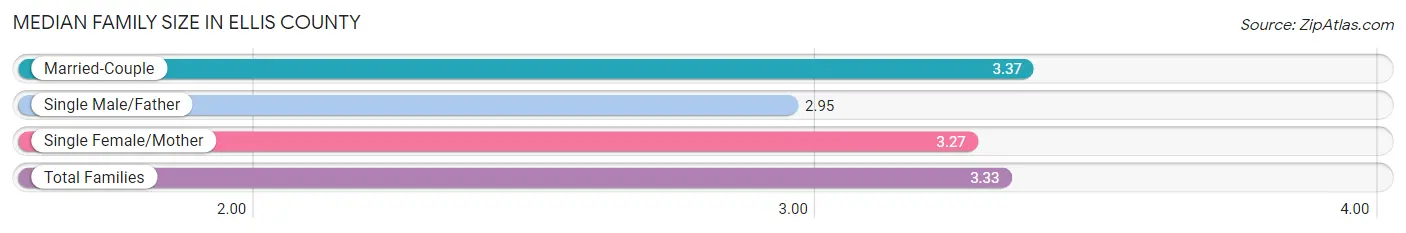
| Family Type | # Families | Family Size |
| Married-Couple | 39,953 (76.6%) | 3.37 |
| Single Male/Father | 3,609 (6.9%) | 2.95 |
| Single Female/Mother | 8,621 (16.5%) | 3.27 |
| Total Families | 52,183 (100.0%) | 3.33 |
Median Household Size in Ellis County
The median household size in Ellis County is 2.95 persons per household, with single female/mother households (8,621 | 13.1%) accounting for the largest median household size of 3.48 persons per household. non-family households (13,503 | 20.6%) represent the smallest median household size with 1.17 persons per household.
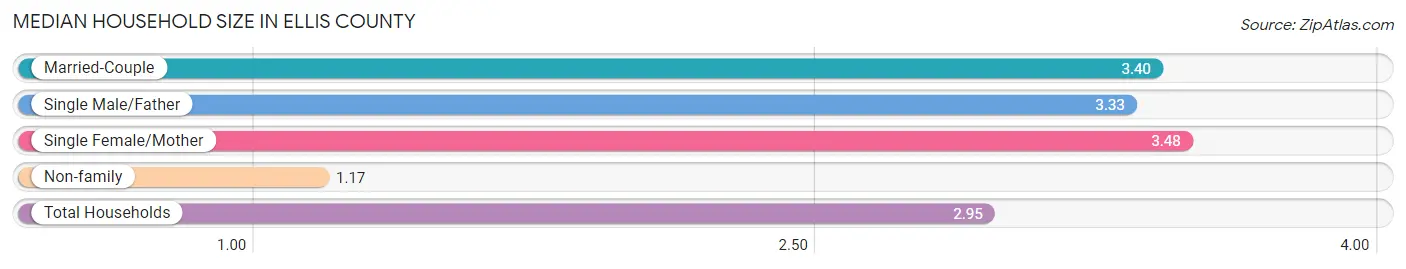
| Household Type | # Households | Household Size |
| Married-Couple | 39,953 (60.8%) | 3.40 |
| Single Male/Father | 3,609 (5.5%) | 3.33 |
| Single Female/Mother | 8,621 (13.1%) | 3.48 |
| Non-family | 13,503 (20.6%) | 1.17 |
| Total Households | 65,686 (100.0%) | 2.95 |
Household Size by Marriage Status in Ellis County
Out of a total of 65,686 households in Ellis County, 52,183 (79.4%) are family households, while 13,503 (20.6%) are nonfamily households. The most numerous type of family households are 2-person households, comprising 19,971, and the most common type of nonfamily households are 1-person households, comprising 11,699.
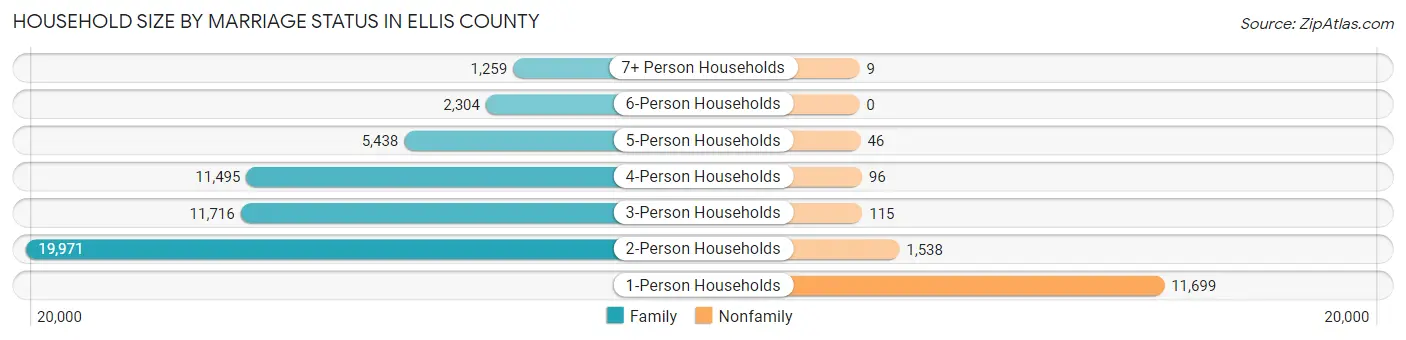
| Household Size | Family Households | Nonfamily Households |
| 1-Person Households | - | 11,699 (17.8%) |
| 2-Person Households | 19,971 (30.4%) | 1,538 (2.3%) |
| 3-Person Households | 11,716 (17.8%) | 115 (0.2%) |
| 4-Person Households | 11,495 (17.5%) | 96 (0.2%) |
| 5-Person Households | 5,438 (8.3%) | 46 (0.1%) |
| 6-Person Households | 2,304 (3.5%) | 0 (0.0%) |
| 7+ Person Households | 1,259 (1.9%) | 9 (0.0%) |
| Total | 52,183 (79.4%) | 13,503 (20.6%) |
Female Fertility in Ellis County
Fertility by Age in Ellis County
Average fertility rate in Ellis County is 58.0 births per 1,000 women. Women in the age bracket of 20 to 34 years have the highest fertility rate with 121.0 births per 1,000 women. Women in the age bracket of 20 to 34 years acount for 82.8% of all women with births.
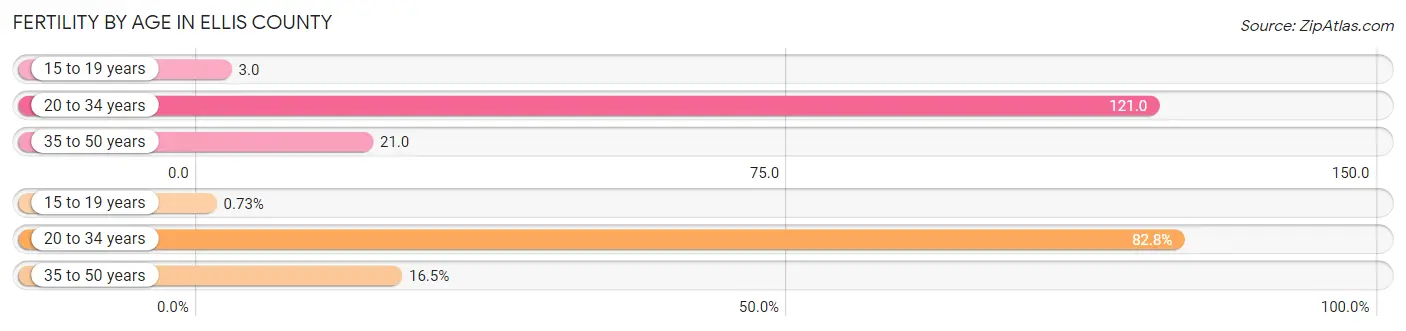
| Age Bracket | Women with Births | Births / 1,000 Women |
| 15 to 19 years | 20 (0.7%) | 3.0 |
| 20 to 34 years | 2,259 (82.8%) | 121.0 |
| 35 to 50 years | 449 (16.5%) | 21.0 |
| Total | 2,728 (100.0%) | 58.0 |
Fertility by Age by Marriage Status in Ellis County
72.7% of women with births (2,728) in Ellis County are married. The highest percentage of unmarried women with births falls into 15 to 19 years age bracket with 65.0% of them unmarried at the time of birth, while the lowest percentage of unmarried women with births belong to 35 to 50 years age bracket with 17.1% of them unmarried.
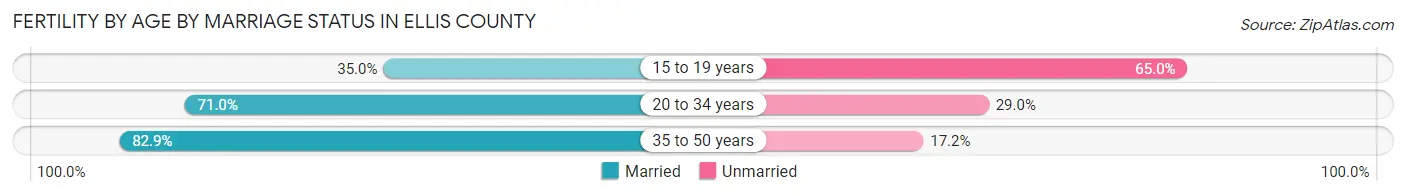
| Age Bracket | Married | Unmarried |
| 15 to 19 years | 7 (35.0%) | 13 (65.0%) |
| 20 to 34 years | 1,604 (71.0%) | 655 (29.0%) |
| 35 to 50 years | 372 (82.9%) | 77 (17.2%) |
| Total | 1,983 (72.7%) | 745 (27.3%) |
Fertility by Education in Ellis County
Average fertility rate in Ellis County is 58.0 births per 1,000 women. Women with the education attainment of bachelor's degree have the highest fertility rate of 95.0 births per 1,000 women, while women with the education attainment of less than high school have the lowest fertility at 19.0 births per 1,000 women. Women with the education attainment of bachelor's degree represent 30.9% of all women with births.
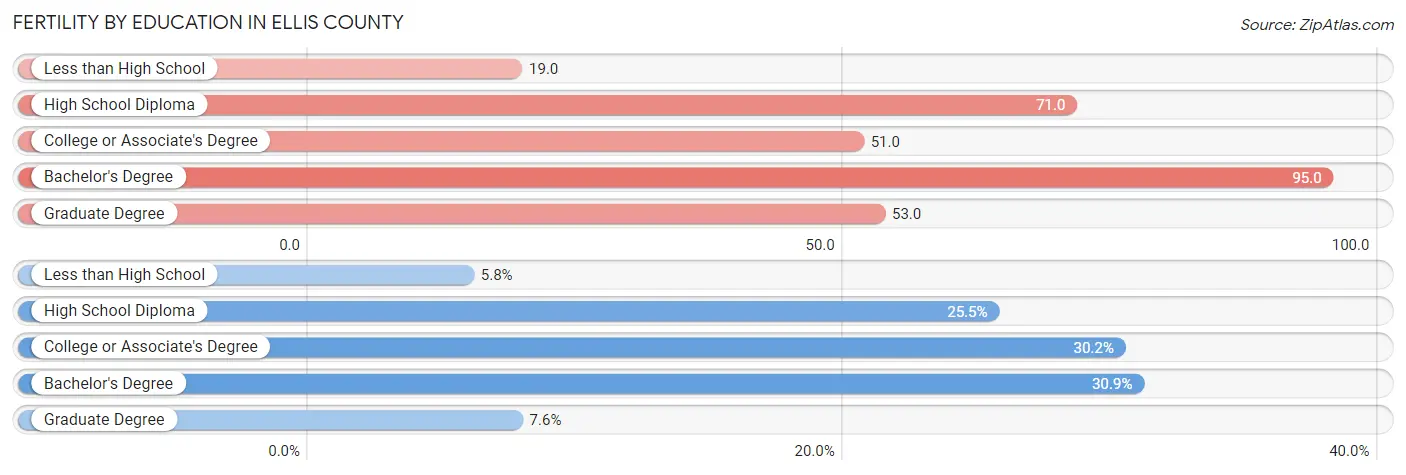
| Educational Attainment | Women with Births | Births / 1,000 Women |
| Less than High School | 158 (5.8%) | 19.0 |
| High School Diploma | 695 (25.5%) | 71.0 |
| College or Associate's Degree | 824 (30.2%) | 51.0 |
| Bachelor's Degree | 843 (30.9%) | 95.0 |
| Graduate Degree | 208 (7.6%) | 53.0 |
| Total | 2,728 (100.0%) | 58.0 |
Fertility by Education by Marriage Status in Ellis County
27.3% of women with births in Ellis County are unmarried. Women with the educational attainment of graduate degree are most likely to be married with 88.9% of them married at childbirth, while women with the educational attainment of less than high school are least likely to be married with 66.5% of them unmarried at childbirth.
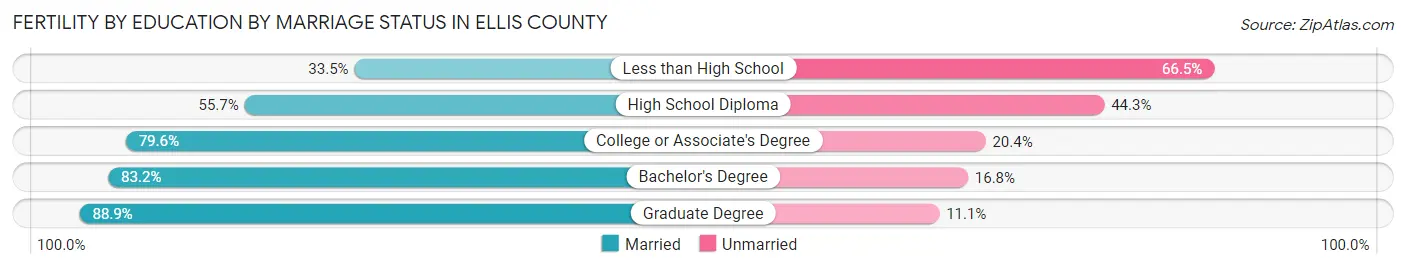
| Educational Attainment | Married | Unmarried |
| Less than High School | 53 (33.5%) | 105 (66.5%) |
| High School Diploma | 387 (55.7%) | 308 (44.3%) |
| College or Associate's Degree | 656 (79.6%) | 168 (20.4%) |
| Bachelor's Degree | 701 (83.2%) | 142 (16.8%) |
| Graduate Degree | 185 (88.9%) | 23 (11.1%) |
| Total | 1,983 (72.7%) | 745 (27.3%) |
Employment Characteristics in Ellis County
Employment by Class of Employer in Ellis County
Among the 97,761 employed individuals in Ellis County, private company employees (67,583 | 69.1%), local government employees (9,795 | 10.0%), and not-for-profit organizations (6,375 | 6.5%) make up the most common classes of employment.
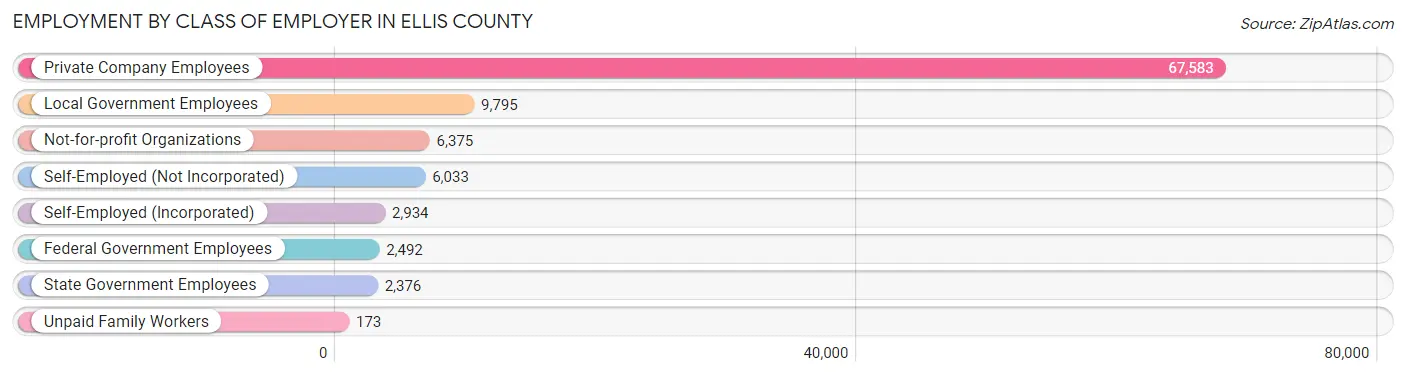
| Employer Class | # Employees | % Employees |
| Private Company Employees | 67,583 | 69.1% |
| Self-Employed (Incorporated) | 2,934 | 3.0% |
| Self-Employed (Not Incorporated) | 6,033 | 6.2% |
| Not-for-profit Organizations | 6,375 | 6.5% |
| Local Government Employees | 9,795 | 10.0% |
| State Government Employees | 2,376 | 2.4% |
| Federal Government Employees | 2,492 | 2.5% |
| Unpaid Family Workers | 173 | 0.2% |
| Total | 97,761 | 100.0% |
Employment Status by Age in Ellis County
According to the labor force statistics for Ellis County, out of the total population over 16 years of age (150,185), 69.0% or 103,628 individuals are in the labor force, with 3.9% or 4,041 of them unemployed. The age group with the highest labor force participation rate is 35 to 44 years, with 87.7% or 23,527 individuals in the labor force. Within the labor force, the 16 to 19 years age range has the highest percentage of unemployed individuals, with 14.3% or 745 of them being unemployed.
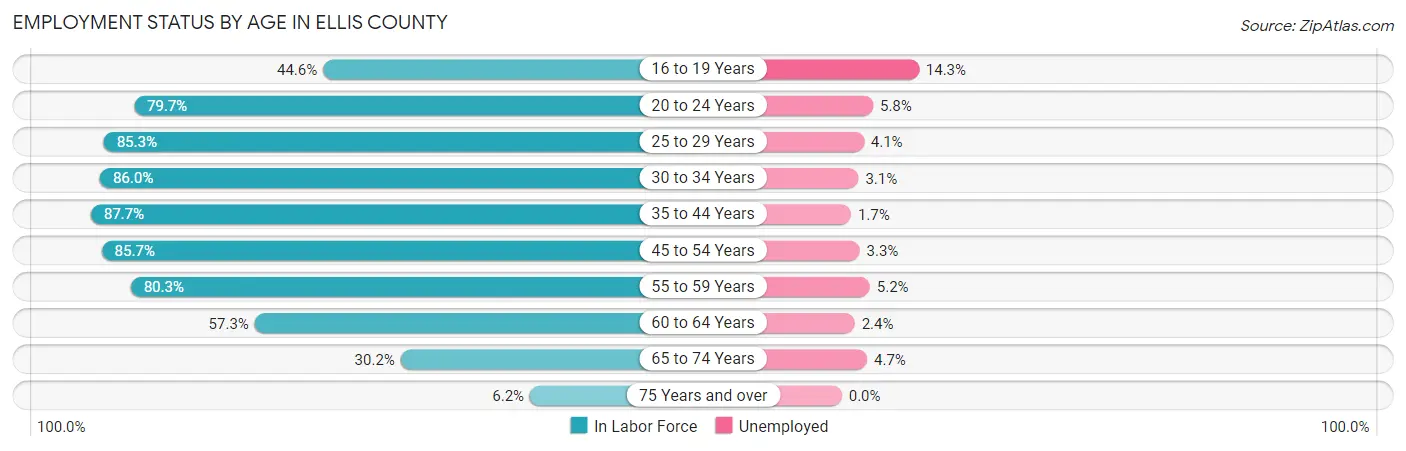
| Age Bracket | In Labor Force | Unemployed |
| 16 to 19 Years | 5,207 (44.6%) | 745 (14.3%) |
| 20 to 24 Years | 9,999 (79.7%) | 580 (5.8%) |
| 25 to 29 Years | 10,144 (85.3%) | 416 (4.1%) |
| 30 to 34 Years | 11,347 (86.0%) | 352 (3.1%) |
| 35 to 44 Years | 23,527 (87.7%) | 400 (1.7%) |
| 45 to 54 Years | 21,722 (85.7%) | 717 (3.3%) |
| 55 to 59 Years | 9,760 (80.3%) | 508 (5.2%) |
| 60 to 64 Years | 6,507 (57.3%) | 156 (2.4%) |
| 65 to 74 Years | 4,793 (30.2%) | 225 (4.7%) |
| 75 Years and over | 578 (6.2%) | 0 (0.0%) |
| Total | 103,628 (69.0%) | 4,041 (3.9%) |
Employment Status by Educational Attainment in Ellis County
According to labor force statistics for Ellis County, 82.4% of individuals (83,034) out of the total population between 25 and 64 years of age (100,769) are in the labor force, with 3.1% or 2,574 of them being unemployed. The group with the highest labor force participation rate are those with the educational attainment of bachelor's degree or higher, with 88.0% or 25,221 individuals in the labor force. Within the labor force, individuals with high school diploma education have the highest percentage of unemployment, with 4.4% or 917 of them being unemployed.
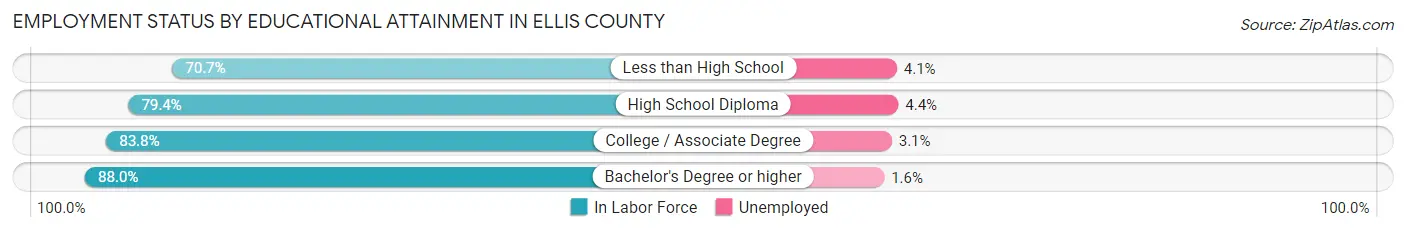
| Educational Attainment | In Labor Force | Unemployed |
| Less than High School | 8,161 (70.7%) | 473 (4.1%) |
| High School Diploma | 20,848 (79.4%) | 1,155 (4.4%) |
| College / Associate Degree | 28,751 (83.8%) | 1,064 (3.1%) |
| Bachelor's Degree or higher | 25,221 (88.0%) | 459 (1.6%) |
| Total | 83,034 (82.4%) | 3,124 (3.1%) |
Employment Occupations by Sex in Ellis County
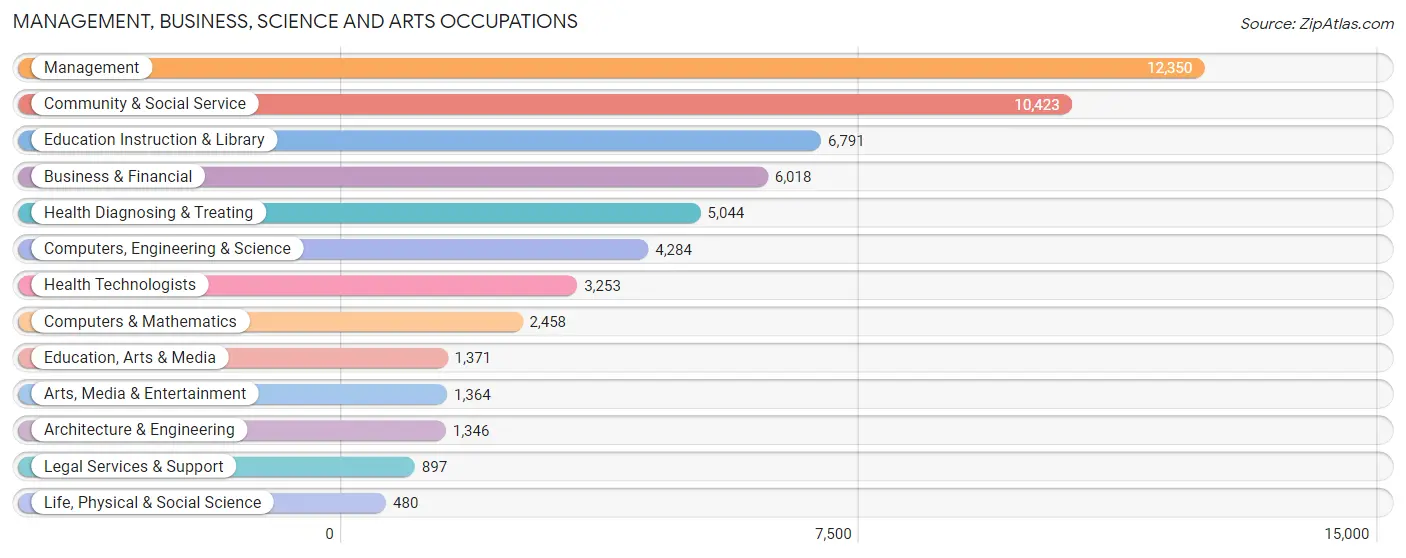
Management, Business, Science and Arts Occupations
The most common Management, Business, Science and Arts occupations in Ellis County are Management (12,350 | 12.4%), Community & Social Service (10,423 | 10.5%), Education Instruction & Library (6,791 | 6.8%), Business & Financial (6,018 | 6.1%), and Health Diagnosing & Treating (5,044 | 5.1%).
Management, Business, Science and Arts Occupations by Sex
Within the Management, Business, Science and Arts occupations in Ellis County, the most male-oriented occupations are Architecture & Engineering (82.2%), Computers & Mathematics (78.8%), and Computers, Engineering & Science (77.9%), while the most female-oriented occupations are Health Diagnosing & Treating (80.7%), Health Technologists (78.0%), and Education Instruction & Library (74.8%).
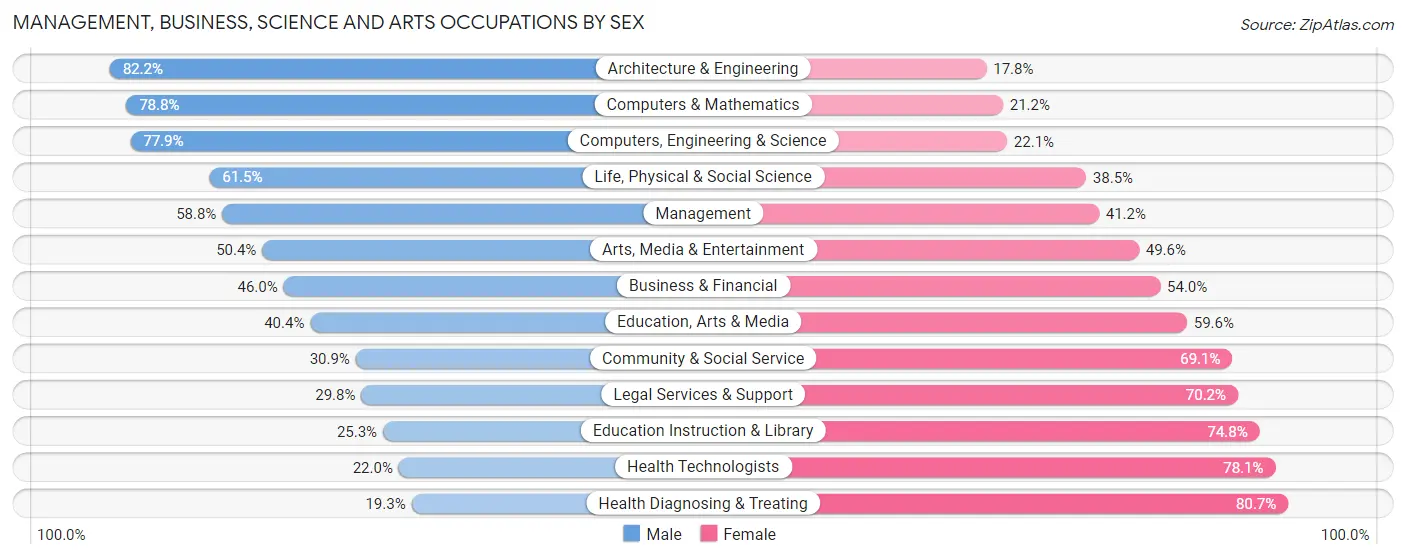
| Occupation | Male | Female |
| Management | 7,259 (58.8%) | 5,091 (41.2%) |
| Business & Financial | 2,767 (46.0%) | 3,251 (54.0%) |
| Computers, Engineering & Science | 3,339 (77.9%) | 945 (22.1%) |
| Computers & Mathematics | 1,937 (78.8%) | 521 (21.2%) |
| Architecture & Engineering | 1,107 (82.2%) | 239 (17.8%) |
| Life, Physical & Social Science | 295 (61.5%) | 185 (38.5%) |
| Community & Social Service | 3,224 (30.9%) | 7,199 (69.1%) |
| Education, Arts & Media | 554 (40.4%) | 817 (59.6%) |
| Legal Services & Support | 267 (29.8%) | 630 (70.2%) |
| Education Instruction & Library | 1,715 (25.3%) | 5,076 (74.8%) |
| Arts, Media & Entertainment | 688 (50.4%) | 676 (49.6%) |
| Health Diagnosing & Treating | 973 (19.3%) | 4,071 (80.7%) |
| Health Technologists | 714 (22.0%) | 2,539 (78.0%) |
| Total (Category) | 17,562 (46.1%) | 20,557 (53.9%) |
| Total (Overall) | 53,494 (53.8%) | 45,875 (46.2%) |
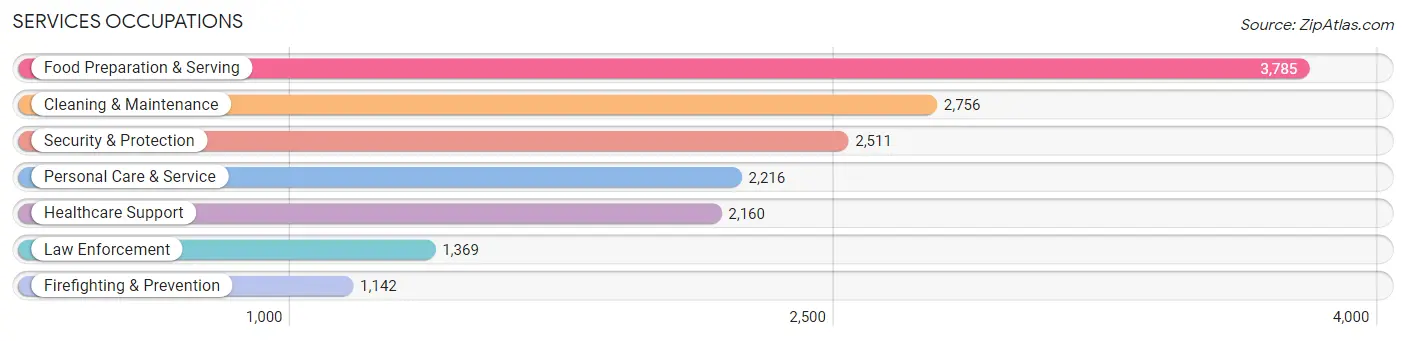
Services Occupations
The most common Services occupations in Ellis County are Food Preparation & Serving (3,785 | 3.8%), Cleaning & Maintenance (2,756 | 2.8%), Security & Protection (2,511 | 2.5%), Personal Care & Service (2,216 | 2.2%), and Healthcare Support (2,160 | 2.2%).
Services Occupations by Sex
Within the Services occupations in Ellis County, the most male-oriented occupations are Firefighting & Prevention (81.6%), Security & Protection (78.9%), and Law Enforcement (76.7%), while the most female-oriented occupations are Healthcare Support (93.2%), Personal Care & Service (82.1%), and Food Preparation & Serving (59.4%).
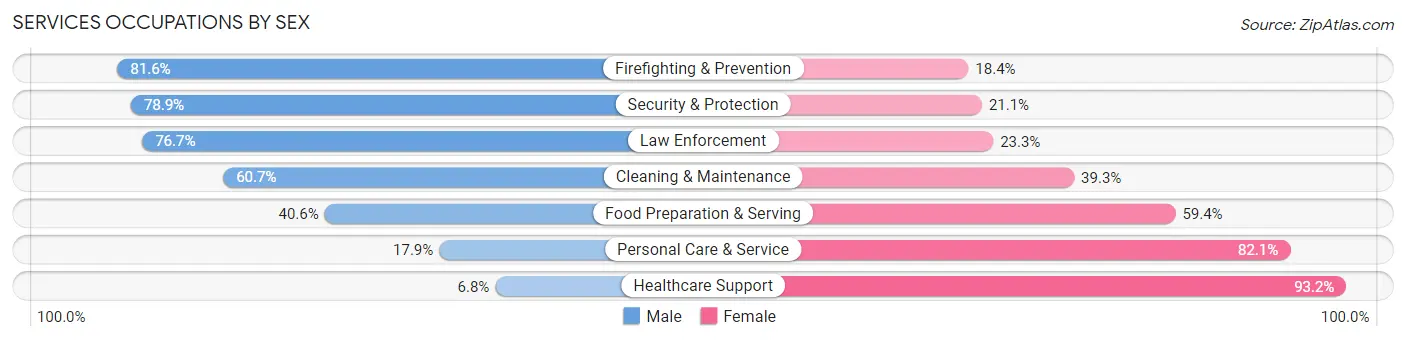
| Occupation | Male | Female |
| Healthcare Support | 147 (6.8%) | 2,013 (93.2%) |
| Security & Protection | 1,982 (78.9%) | 529 (21.1%) |
| Firefighting & Prevention | 932 (81.6%) | 210 (18.4%) |
| Law Enforcement | 1,050 (76.7%) | 319 (23.3%) |
| Food Preparation & Serving | 1,537 (40.6%) | 2,248 (59.4%) |
| Cleaning & Maintenance | 1,672 (60.7%) | 1,084 (39.3%) |
| Personal Care & Service | 397 (17.9%) | 1,819 (82.1%) |
| Total (Category) | 5,735 (42.7%) | 7,693 (57.3%) |
| Total (Overall) | 53,494 (53.8%) | 45,875 (46.2%) |
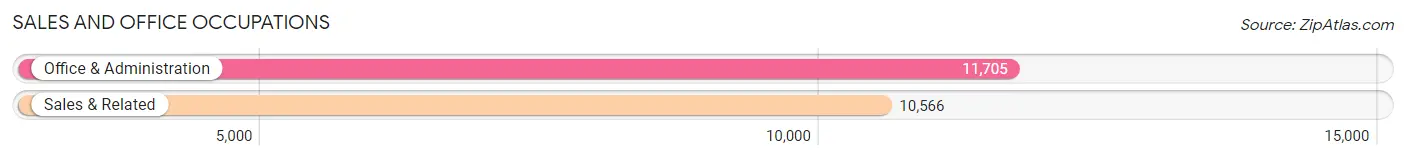
Sales and Office Occupations
The most common Sales and Office occupations in Ellis County are Office & Administration (11,705 | 11.8%), and Sales & Related (10,566 | 10.6%).
Sales and Office Occupations by Sex
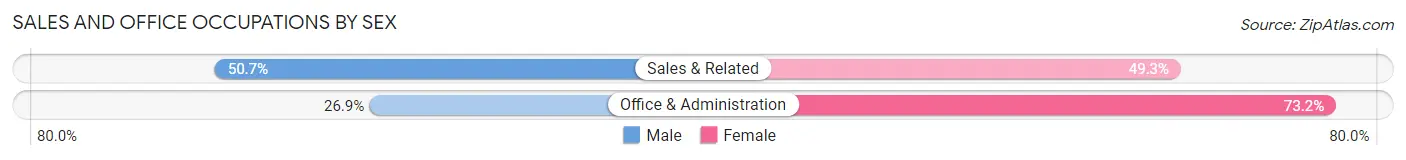
| Occupation | Male | Female |
| Sales & Related | 5,360 (50.7%) | 5,206 (49.3%) |
| Office & Administration | 3,143 (26.9%) | 8,562 (73.2%) |
| Total (Category) | 8,503 (38.2%) | 13,768 (61.8%) |
| Total (Overall) | 53,494 (53.8%) | 45,875 (46.2%) |
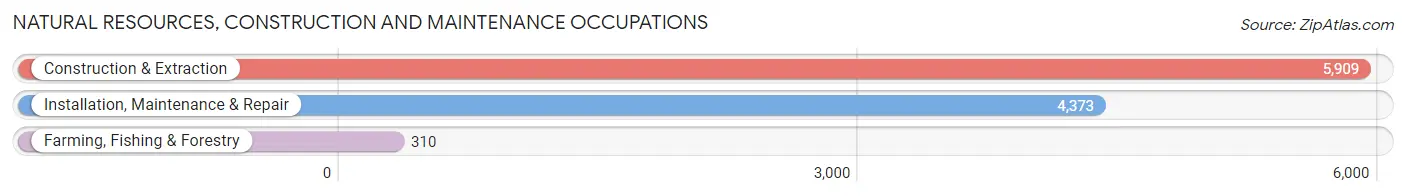
Natural Resources, Construction and Maintenance Occupations
The most common Natural Resources, Construction and Maintenance occupations in Ellis County are Construction & Extraction (5,909 | 5.9%), Installation, Maintenance & Repair (4,373 | 4.4%), and Farming, Fishing & Forestry (310 | 0.3%).
Natural Resources, Construction and Maintenance Occupations by Sex
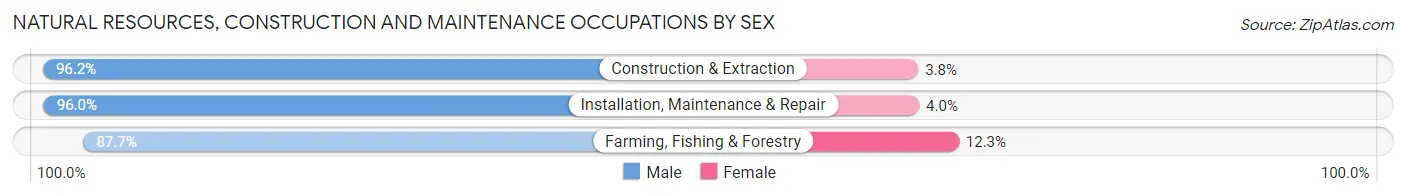
| Occupation | Male | Female |
| Farming, Fishing & Forestry | 272 (87.7%) | 38 (12.3%) |
| Construction & Extraction | 5,683 (96.2%) | 226 (3.8%) |
| Installation, Maintenance & Repair | 4,198 (96.0%) | 175 (4.0%) |
| Total (Category) | 10,153 (95.9%) | 439 (4.1%) |
| Total (Overall) | 53,494 (53.8%) | 45,875 (46.2%) |
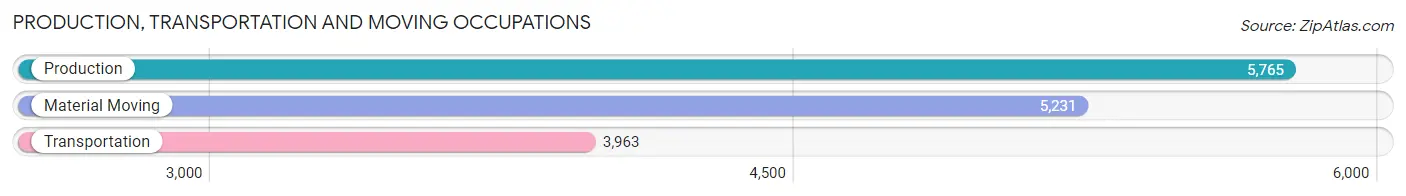
Production, Transportation and Moving Occupations
The most common Production, Transportation and Moving occupations in Ellis County are Production (5,765 | 5.8%), Material Moving (5,231 | 5.3%), and Transportation (3,963 | 4.0%).
Production, Transportation and Moving Occupations by Sex
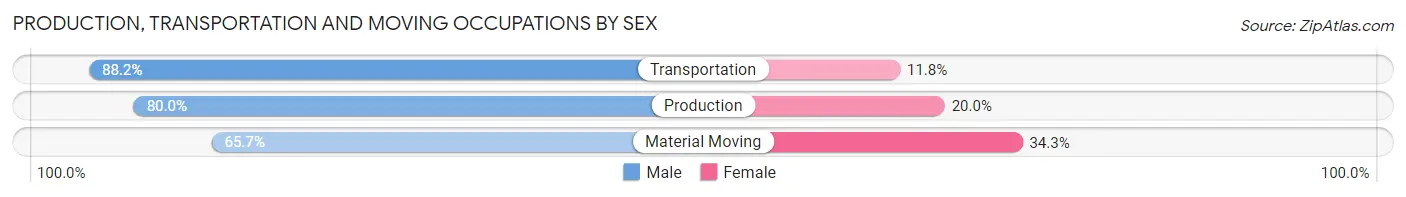
| Occupation | Male | Female |
| Production | 4,610 (80.0%) | 1,155 (20.0%) |
| Transportation | 3,494 (88.2%) | 469 (11.8%) |
| Material Moving | 3,437 (65.7%) | 1,794 (34.3%) |
| Total (Category) | 11,541 (77.1%) | 3,418 (22.9%) |
| Total (Overall) | 53,494 (53.8%) | 45,875 (46.2%) |
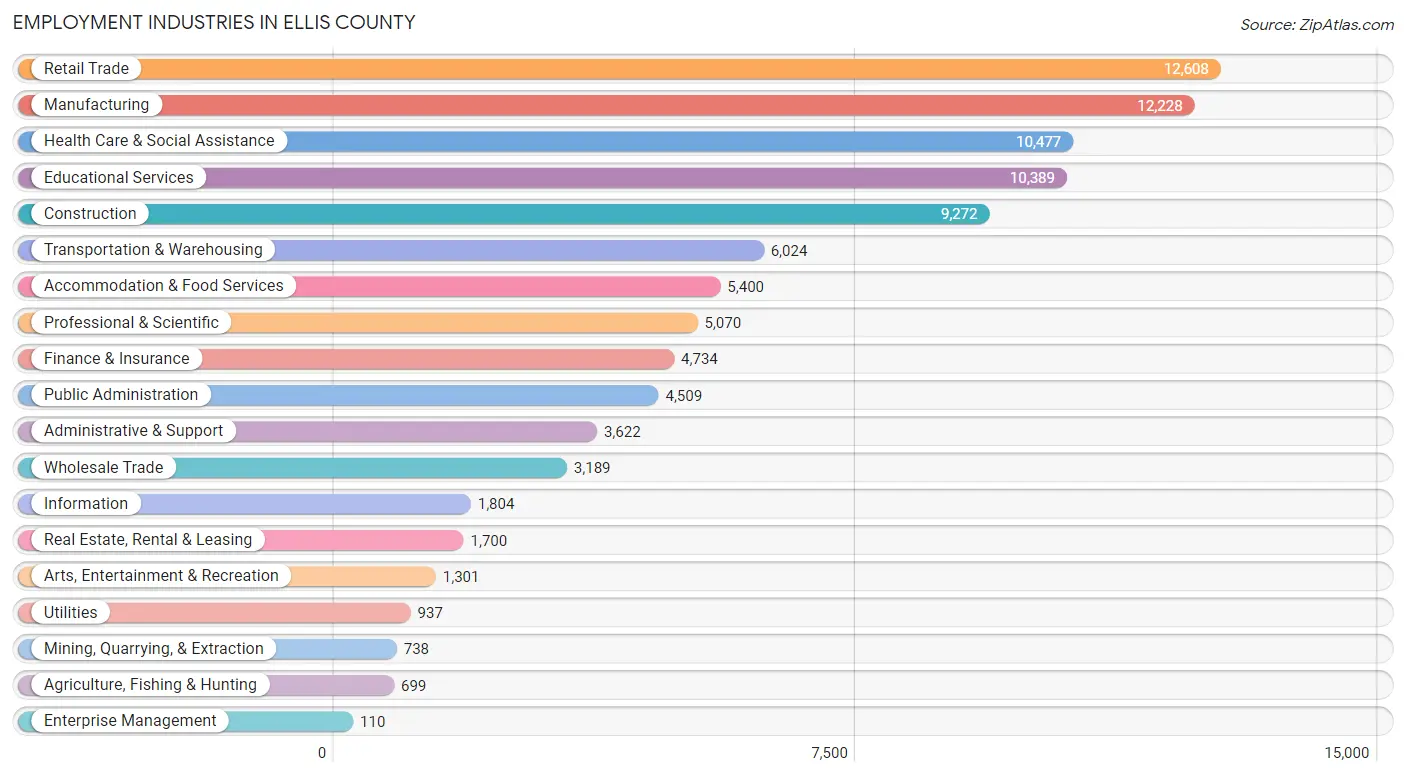
Employment Industries by Sex in Ellis County
Employment Industries in Ellis County
The major employment industries in Ellis County include Retail Trade (12,608 | 12.7%), Manufacturing (12,228 | 12.3%), Health Care & Social Assistance (10,477 | 10.5%), Educational Services (10,389 | 10.4%), and Construction (9,272 | 9.3%).
Employment Industries by Sex in Ellis County
The Ellis County industries that see more men than women are Utilities (92.2%), Mining, Quarrying, & Extraction (87.4%), and Construction (85.7%), whereas the industries that tend to have a higher number of women are Health Care & Social Assistance (83.2%), Educational Services (72.5%), and Finance & Insurance (61.3%).
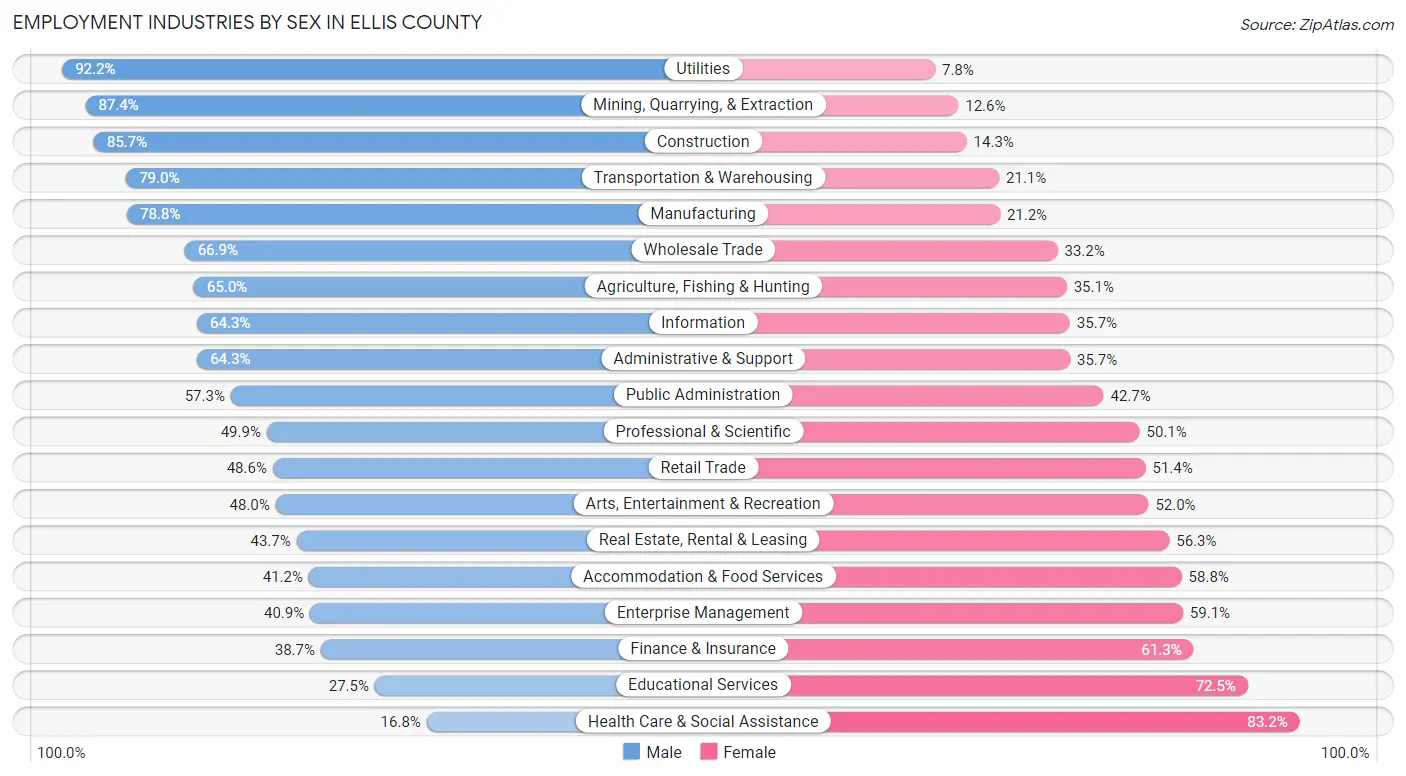
| Industry | Male | Female |
| Agriculture, Fishing & Hunting | 454 (64.9%) | 245 (35.0%) |
| Mining, Quarrying, & Extraction | 645 (87.4%) | 93 (12.6%) |
| Construction | 7,943 (85.7%) | 1,329 (14.3%) |
| Manufacturing | 9,633 (78.8%) | 2,595 (21.2%) |
| Wholesale Trade | 2,132 (66.8%) | 1,057 (33.2%) |
| Retail Trade | 6,133 (48.6%) | 6,475 (51.4%) |
| Transportation & Warehousing | 4,756 (78.9%) | 1,268 (21.0%) |
| Utilities | 864 (92.2%) | 73 (7.8%) |
| Information | 1,160 (64.3%) | 644 (35.7%) |
| Finance & Insurance | 1,832 (38.7%) | 2,902 (61.3%) |
| Real Estate, Rental & Leasing | 743 (43.7%) | 957 (56.3%) |
| Professional & Scientific | 2,529 (49.9%) | 2,541 (50.1%) |
| Enterprise Management | 45 (40.9%) | 65 (59.1%) |
| Administrative & Support | 2,328 (64.3%) | 1,294 (35.7%) |
| Educational Services | 2,858 (27.5%) | 7,531 (72.5%) |
| Health Care & Social Assistance | 1,758 (16.8%) | 8,719 (83.2%) |
| Arts, Entertainment & Recreation | 625 (48.0%) | 676 (52.0%) |
| Accommodation & Food Services | 2,223 (41.2%) | 3,177 (58.8%) |
| Public Administration | 2,585 (57.3%) | 1,924 (42.7%) |
| Total | 53,494 (53.8%) | 45,875 (46.2%) |
Education in Ellis County
School Enrollment in Ellis County
The most common levels of schooling among the 52,423 students in Ellis County are middle school (12,901 | 24.6%), high school (12,690 | 24.2%), and elementary school (10,764 | 20.5%).
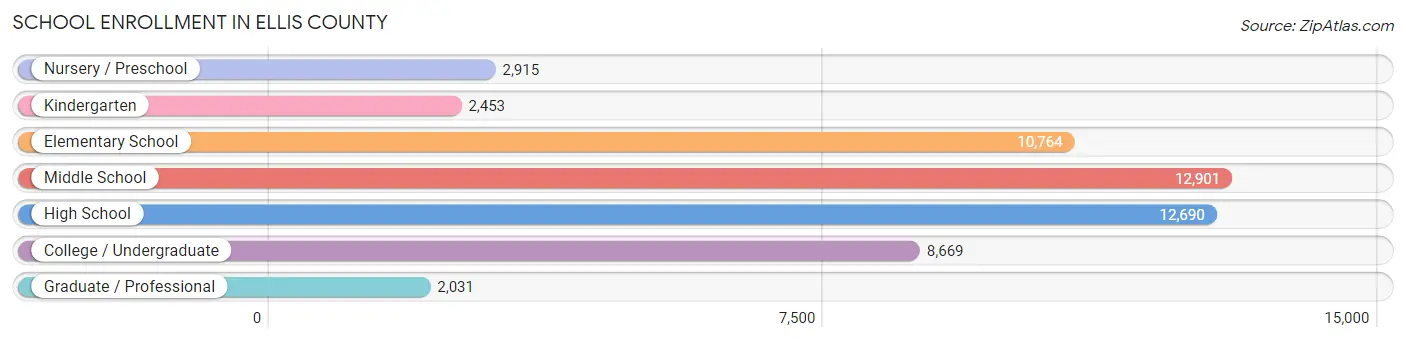
| School Level | # Students | % Students |
| Nursery / Preschool | 2,915 | 5.6% |
| Kindergarten | 2,453 | 4.7% |
| Elementary School | 10,764 | 20.5% |
| Middle School | 12,901 | 24.6% |
| High School | 12,690 | 24.2% |
| College / Undergraduate | 8,669 | 16.5% |
| Graduate / Professional | 2,031 | 3.9% |
| Total | 52,423 | 100.0% |
School Enrollment by Age by Funding Source in Ellis County
Out of a total of 52,423 students who are enrolled in schools in Ellis County, 5,767 (11.0%) attend a private institution, while the remaining 46,656 (89.0%) are enrolled in public schools. The age group of 3 to 4 year olds has the highest likelihood of being enrolled in private schools, with 689 (35.2% in the age bracket) enrolled. Conversely, the age group of 10 to 14 year olds has the lowest likelihood of being enrolled in a private school, with 15,127 (95.8% in the age bracket) attending a public institution.
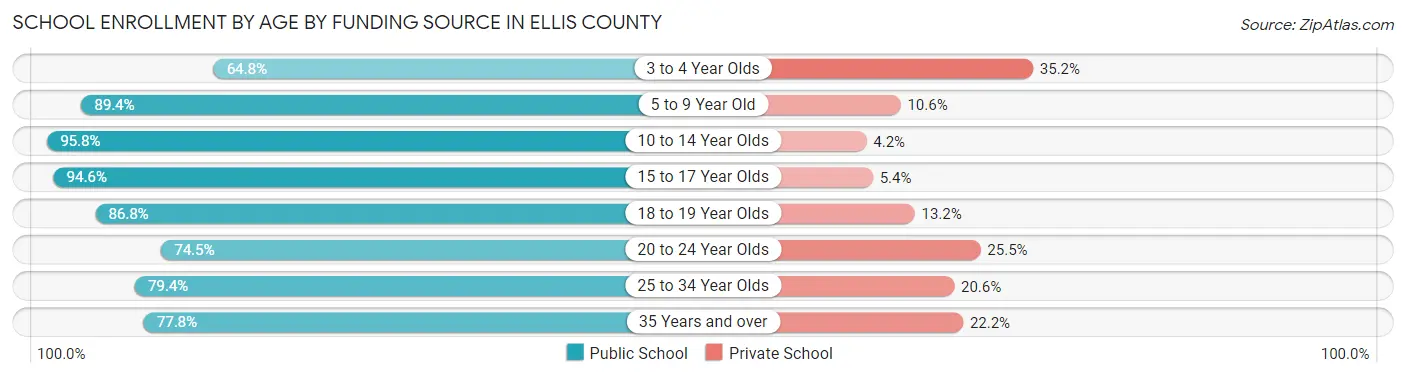
| Age Bracket | Public School | Private School |
| 3 to 4 Year Olds | 1,266 (64.8%) | 689 (35.2%) |
| 5 to 9 Year Old | 11,255 (89.4%) | 1,331 (10.6%) |
| 10 to 14 Year Olds | 15,127 (95.8%) | 667 (4.2%) |
| 15 to 17 Year Olds | 8,650 (94.6%) | 495 (5.4%) |
| 18 to 19 Year Olds | 3,190 (86.8%) | 485 (13.2%) |
| 20 to 24 Year Olds | 2,554 (74.5%) | 873 (25.5%) |
| 25 to 34 Year Olds | 2,341 (79.4%) | 606 (20.6%) |
| 35 Years and over | 2,251 (77.8%) | 643 (22.2%) |
| Total | 46,656 (89.0%) | 5,767 (11.0%) |
Educational Attainment by Field of Study in Ellis County
Business (8,684 | 23.1%), education (6,246 | 16.6%), science & technology (3,712 | 9.9%), arts & humanities (3,284 | 8.7%), and liberal arts & history (2,382 | 6.3%) are the most common fields of study among 37,579 individuals in Ellis County who have obtained a bachelor's degree or higher.
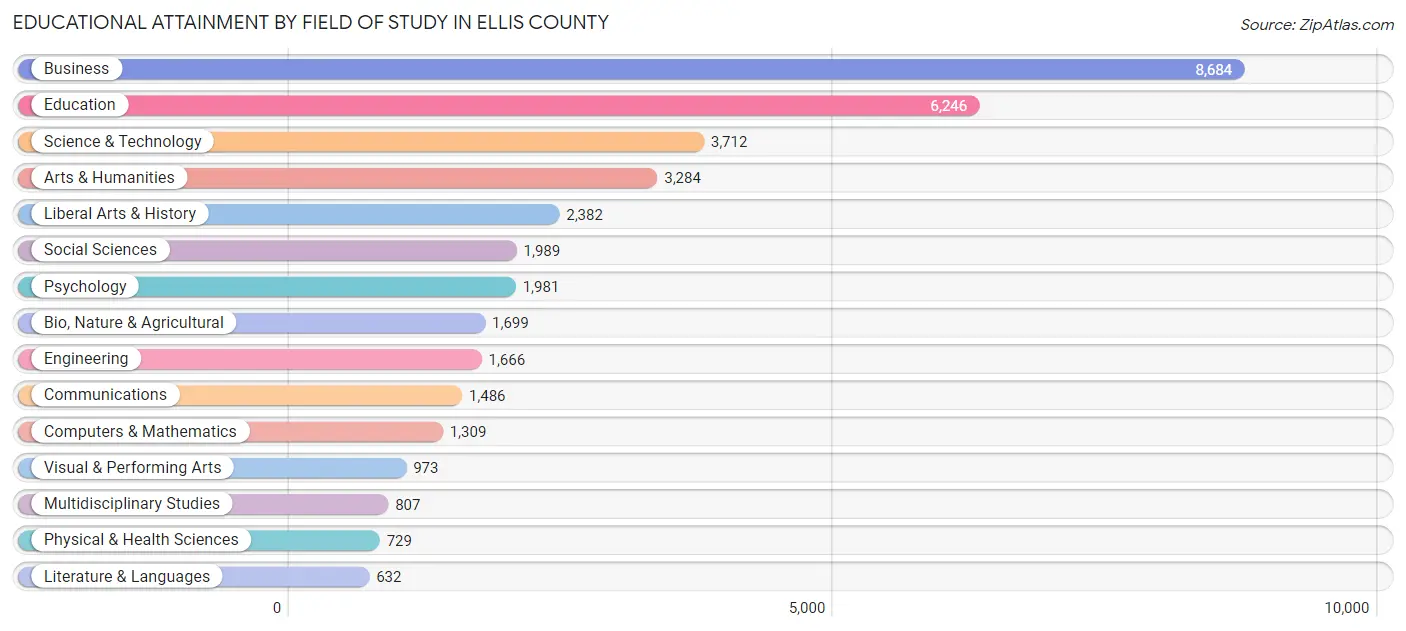
| Field of Study | # Graduates | % Graduates |
| Computers & Mathematics | 1,309 | 3.5% |
| Bio, Nature & Agricultural | 1,699 | 4.5% |
| Physical & Health Sciences | 729 | 1.9% |
| Psychology | 1,981 | 5.3% |
| Social Sciences | 1,989 | 5.3% |
| Engineering | 1,666 | 4.4% |
| Multidisciplinary Studies | 807 | 2.1% |
| Science & Technology | 3,712 | 9.9% |
| Business | 8,684 | 23.1% |
| Education | 6,246 | 16.6% |
| Literature & Languages | 632 | 1.7% |
| Liberal Arts & History | 2,382 | 6.3% |
| Visual & Performing Arts | 973 | 2.6% |
| Communications | 1,486 | 4.0% |
| Arts & Humanities | 3,284 | 8.7% |
| Total | 37,579 | 100.0% |
Transportation & Commute in Ellis County
Vehicle Availability by Sex in Ellis County
The most prevalent vehicle ownership categories in Ellis County are males with 2 vehicles (21,576, accounting for 40.9%) and females with 2 vehicles (17,558, making up 48.3%).
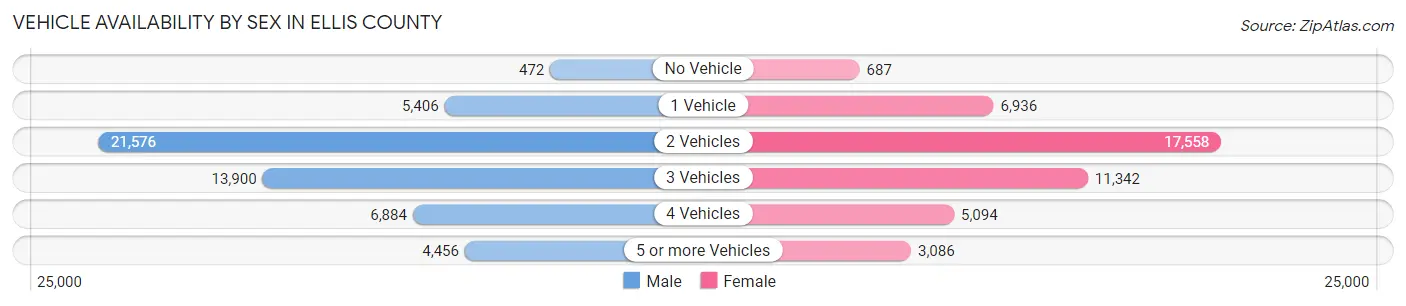
| Vehicles Available | Male | Female |
| No Vehicle | 472 (0.9%) | 687 (1.5%) |
| 1 Vehicle | 5,406 (10.3%) | 6,936 (15.5%) |
| 2 Vehicles | 21,576 (40.9%) | 17,558 (39.3%) |
| 3 Vehicles | 13,900 (26.4%) | 11,342 (25.4%) |
| 4 Vehicles | 6,884 (13.1%) | 5,094 (11.4%) |
| 5 or more Vehicles | 4,456 (8.5%) | 3,086 (6.9%) |
| Total | 52,694 (100.0%) | 44,703 (100.0%) |
Commute Time in Ellis County
The most frequently occuring commute durations in Ellis County are 45 to 59 minutes (12,260 commuters, 13.8%), 30 to 34 minutes (12,194 commuters, 13.7%), and 15 to 19 minutes (10,476 commuters, 11.8%).
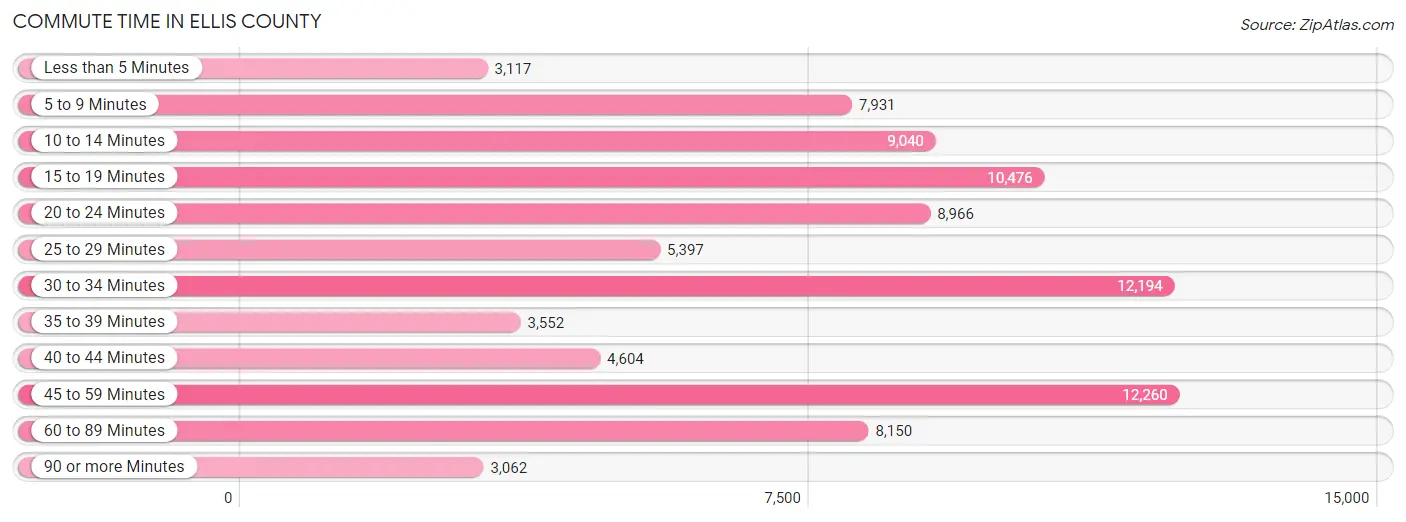
| Commute Time | # Commuters | % Commuters |
| Less than 5 Minutes | 3,117 | 3.5% |
| 5 to 9 Minutes | 7,931 | 8.9% |
| 10 to 14 Minutes | 9,040 | 10.2% |
| 15 to 19 Minutes | 10,476 | 11.8% |
| 20 to 24 Minutes | 8,966 | 10.1% |
| 25 to 29 Minutes | 5,397 | 6.1% |
| 30 to 34 Minutes | 12,194 | 13.7% |
| 35 to 39 Minutes | 3,552 | 4.0% |
| 40 to 44 Minutes | 4,604 | 5.2% |
| 45 to 59 Minutes | 12,260 | 13.8% |
| 60 to 89 Minutes | 8,150 | 9.2% |
| 90 or more Minutes | 3,062 | 3.5% |
Commute Time by Sex in Ellis County
The most common commute times in Ellis County are 45 to 59 minutes (7,201 commuters, 14.8%) for males and 15 to 19 minutes (5,130 commuters, 12.8%) for females.
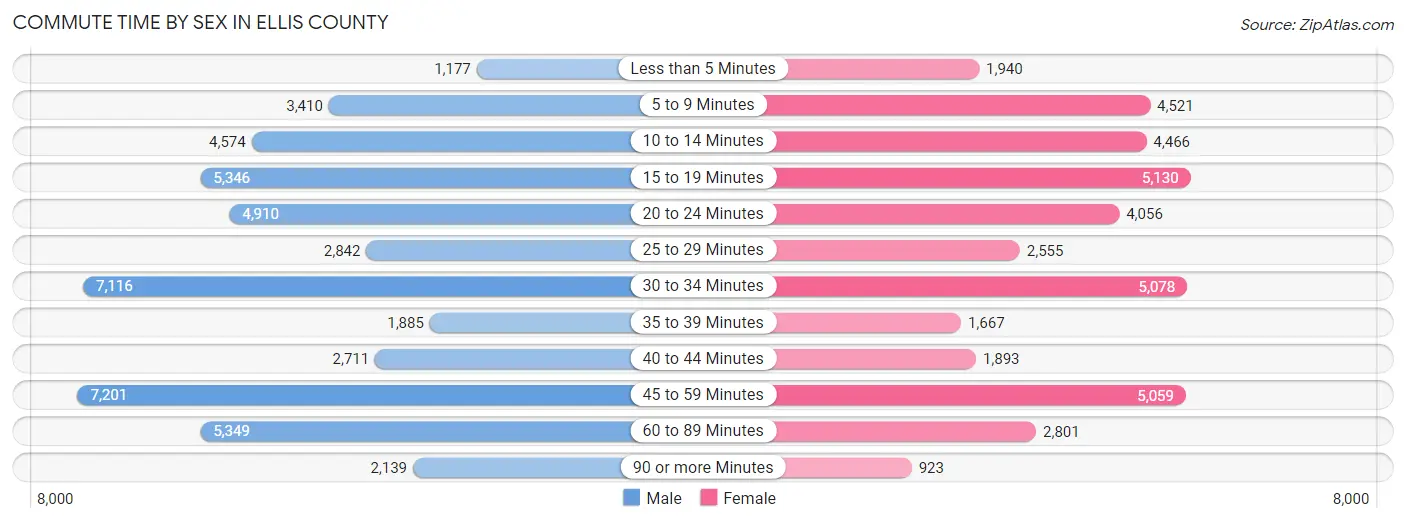
| Commute Time | Male | Female |
| Less than 5 Minutes | 1,177 (2.4%) | 1,940 (4.8%) |
| 5 to 9 Minutes | 3,410 (7.0%) | 4,521 (11.3%) |
| 10 to 14 Minutes | 4,574 (9.4%) | 4,466 (11.1%) |
| 15 to 19 Minutes | 5,346 (11.0%) | 5,130 (12.8%) |
| 20 to 24 Minutes | 4,910 (10.1%) | 4,056 (10.1%) |
| 25 to 29 Minutes | 2,842 (5.8%) | 2,555 (6.4%) |
| 30 to 34 Minutes | 7,116 (14.6%) | 5,078 (12.7%) |
| 35 to 39 Minutes | 1,885 (3.9%) | 1,667 (4.2%) |
| 40 to 44 Minutes | 2,711 (5.6%) | 1,893 (4.7%) |
| 45 to 59 Minutes | 7,201 (14.8%) | 5,059 (12.6%) |
| 60 to 89 Minutes | 5,349 (11.0%) | 2,801 (7.0%) |
| 90 or more Minutes | 2,139 (4.4%) | 923 (2.3%) |
Time of Departure to Work by Sex in Ellis County
The most frequent times of departure to work in Ellis County are 7:00 AM to 7:29 AM (7,718, 15.9%) for males and 7:00 AM to 7:29 AM (7,090, 17.7%) for females.
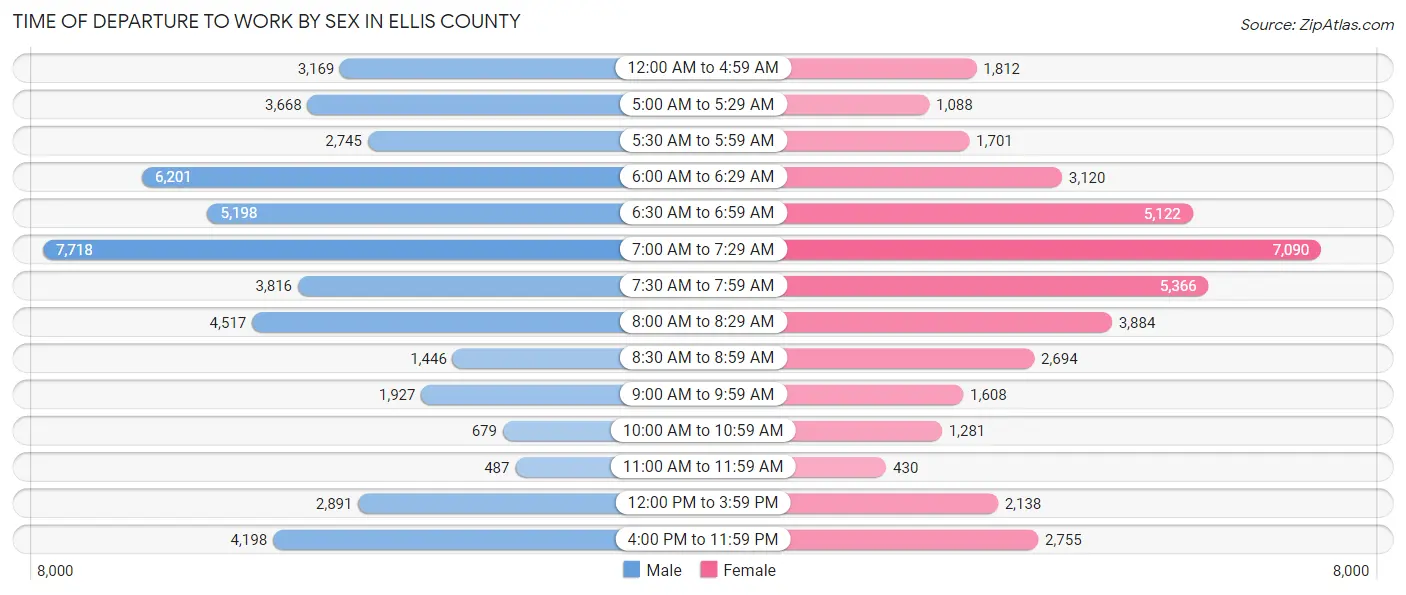
| Time of Departure | Male | Female |
| 12:00 AM to 4:59 AM | 3,169 (6.5%) | 1,812 (4.5%) |
| 5:00 AM to 5:29 AM | 3,668 (7.5%) | 1,088 (2.7%) |
| 5:30 AM to 5:59 AM | 2,745 (5.6%) | 1,701 (4.2%) |
| 6:00 AM to 6:29 AM | 6,201 (12.7%) | 3,120 (7.8%) |
| 6:30 AM to 6:59 AM | 5,198 (10.7%) | 5,122 (12.8%) |
| 7:00 AM to 7:29 AM | 7,718 (15.9%) | 7,090 (17.7%) |
| 7:30 AM to 7:59 AM | 3,816 (7.8%) | 5,366 (13.4%) |
| 8:00 AM to 8:29 AM | 4,517 (9.3%) | 3,884 (9.7%) |
| 8:30 AM to 8:59 AM | 1,446 (3.0%) | 2,694 (6.7%) |
| 9:00 AM to 9:59 AM | 1,927 (4.0%) | 1,608 (4.0%) |
| 10:00 AM to 10:59 AM | 679 (1.4%) | 1,281 (3.2%) |
| 11:00 AM to 11:59 AM | 487 (1.0%) | 430 (1.1%) |
| 12:00 PM to 3:59 PM | 2,891 (5.9%) | 2,138 (5.3%) |
| 4:00 PM to 11:59 PM | 4,198 (8.6%) | 2,755 (6.9%) |
| Total | 48,660 (100.0%) | 40,089 (100.0%) |
Housing Occupancy in Ellis County
Occupancy by Ownership in Ellis County
Of the total 65,686 dwellings in Ellis County, owner-occupied units account for 49,846 (75.9%), while renter-occupied units make up 15,840 (24.1%).
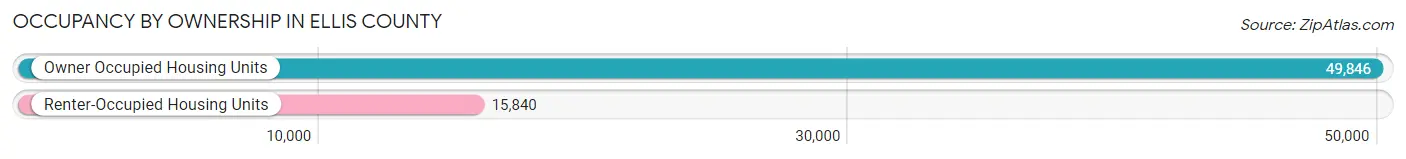
| Occupancy | # Housing Units | % Housing Units |
| Owner Occupied Housing Units | 49,846 | 75.9% |
| Renter-Occupied Housing Units | 15,840 | 24.1% |
| Total Occupied Housing Units | 65,686 | 100.0% |
Occupancy by Household Size in Ellis County
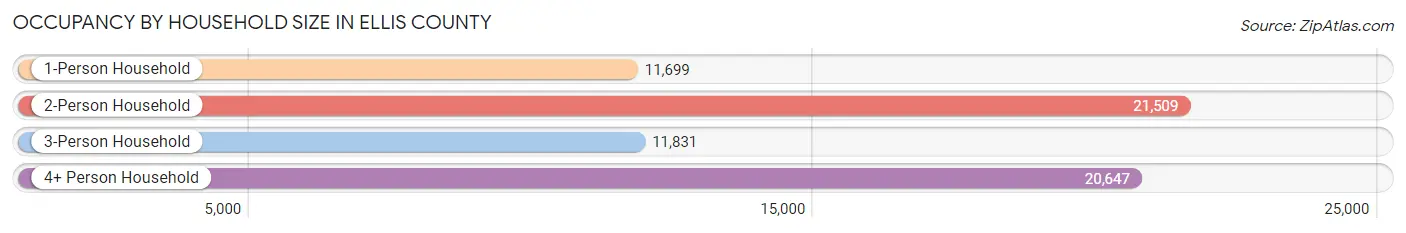
| Household Size | # Housing Units | % Housing Units |
| 1-Person Household | 11,699 | 17.8% |
| 2-Person Household | 21,509 | 32.8% |
| 3-Person Household | 11,831 | 18.0% |
| 4+ Person Household | 20,647 | 31.4% |
| Total Housing Units | 65,686 | 100.0% |
Occupancy by Ownership by Household Size in Ellis County
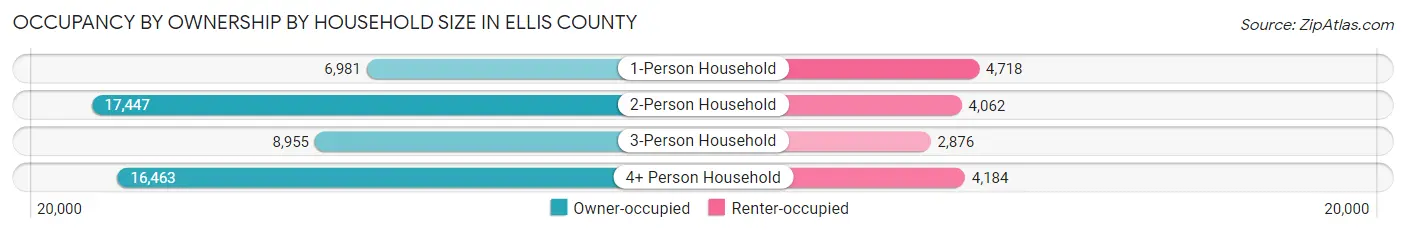
| Household Size | Owner-occupied | Renter-occupied |
| 1-Person Household | 6,981 (59.7%) | 4,718 (40.3%) |
| 2-Person Household | 17,447 (81.1%) | 4,062 (18.9%) |
| 3-Person Household | 8,955 (75.7%) | 2,876 (24.3%) |
| 4+ Person Household | 16,463 (79.7%) | 4,184 (20.3%) |
| Total Housing Units | 49,846 (75.9%) | 15,840 (24.1%) |
Occupancy by Educational Attainment in Ellis County
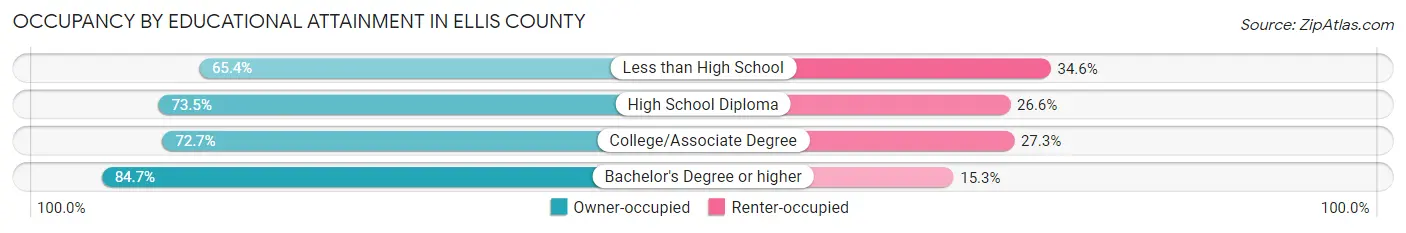
| Household Size | Owner-occupied | Renter-occupied |
| Less than High School | 4,134 (65.4%) | 2,184 (34.6%) |
| High School Diploma | 11,879 (73.5%) | 4,295 (26.6%) |
| College/Associate Degree | 16,651 (72.7%) | 6,259 (27.3%) |
| Bachelor's Degree or higher | 17,182 (84.7%) | 3,102 (15.3%) |
Occupancy by Age of Householder in Ellis County
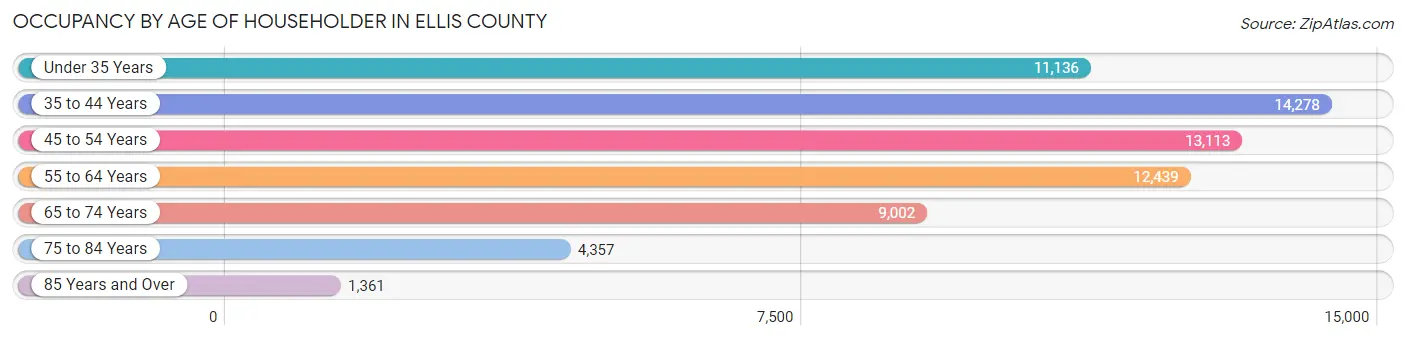
| Age Bracket | # Households | % Households |
| Under 35 Years | 11,136 | 17.0% |
| 35 to 44 Years | 14,278 | 21.7% |
| 45 to 54 Years | 13,113 | 20.0% |
| 55 to 64 Years | 12,439 | 18.9% |
| 65 to 74 Years | 9,002 | 13.7% |
| 75 to 84 Years | 4,357 | 6.6% |
| 85 Years and Over | 1,361 | 2.1% |
| Total | 65,686 | 100.0% |
Housing Finances in Ellis County
Median Income by Occupancy in Ellis County
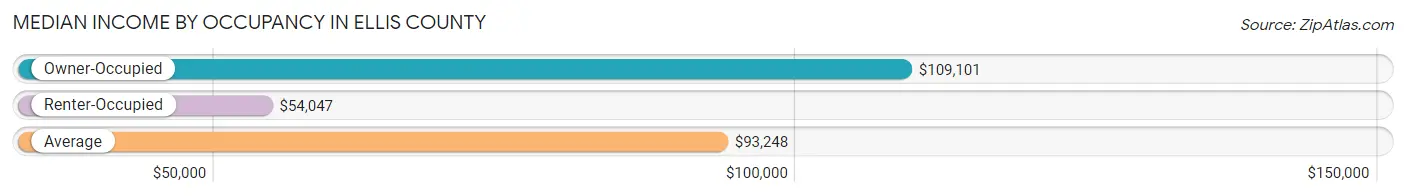
| Occupancy Type | # Households | Median Income |
| Owner-Occupied | 49,846 (75.9%) | $109,101 |
| Renter-Occupied | 15,840 (24.1%) | $54,047 |
| Average | 65,686 (100.0%) | $93,248 |
Occupancy by Householder Income Bracket in Ellis County
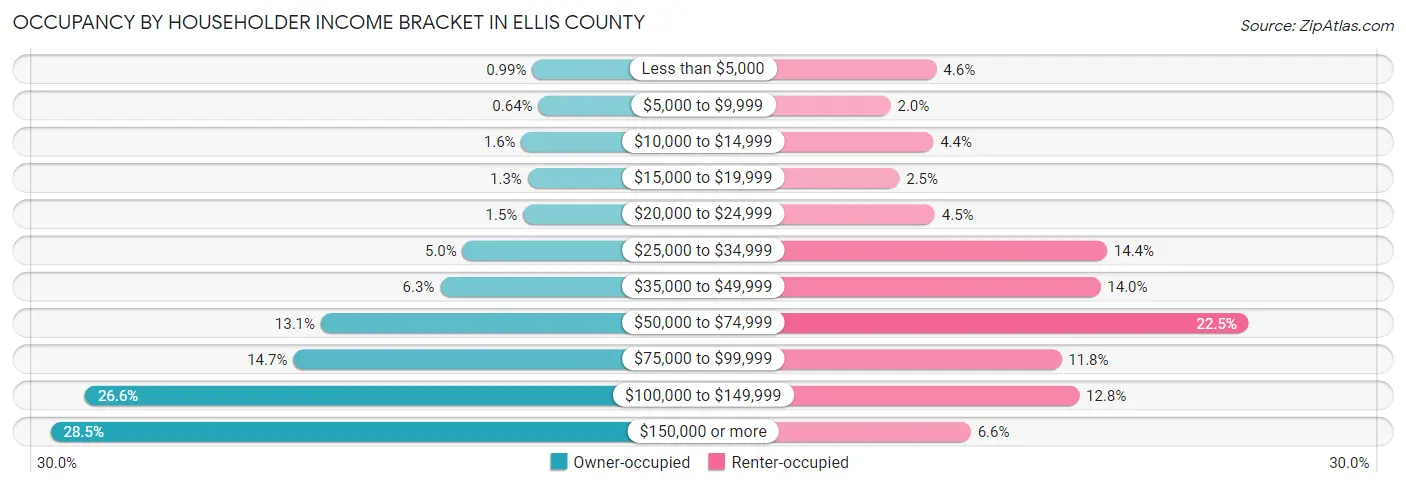
| Income Bracket | Owner-occupied | Renter-occupied |
| Less than $5,000 | 491 (1.0%) | 732 (4.6%) |
| $5,000 to $9,999 | 319 (0.6%) | 317 (2.0%) |
| $10,000 to $14,999 | 804 (1.6%) | 703 (4.4%) |
| $15,000 to $19,999 | 622 (1.3%) | 396 (2.5%) |
| $20,000 to $24,999 | 752 (1.5%) | 717 (4.5%) |
| $25,000 to $34,999 | 2,479 (5.0%) | 2,274 (14.4%) |
| $35,000 to $49,999 | 3,116 (6.2%) | 2,216 (14.0%) |
| $50,000 to $74,999 | 6,513 (13.1%) | 3,557 (22.5%) |
| $75,000 to $99,999 | 7,300 (14.6%) | 1,862 (11.8%) |
| $100,000 to $149,999 | 13,235 (26.6%) | 2,023 (12.8%) |
| $150,000 or more | 14,215 (28.5%) | 1,043 (6.6%) |
| Total | 49,846 (100.0%) | 15,840 (100.0%) |
Monthly Housing Cost Tiers in Ellis County
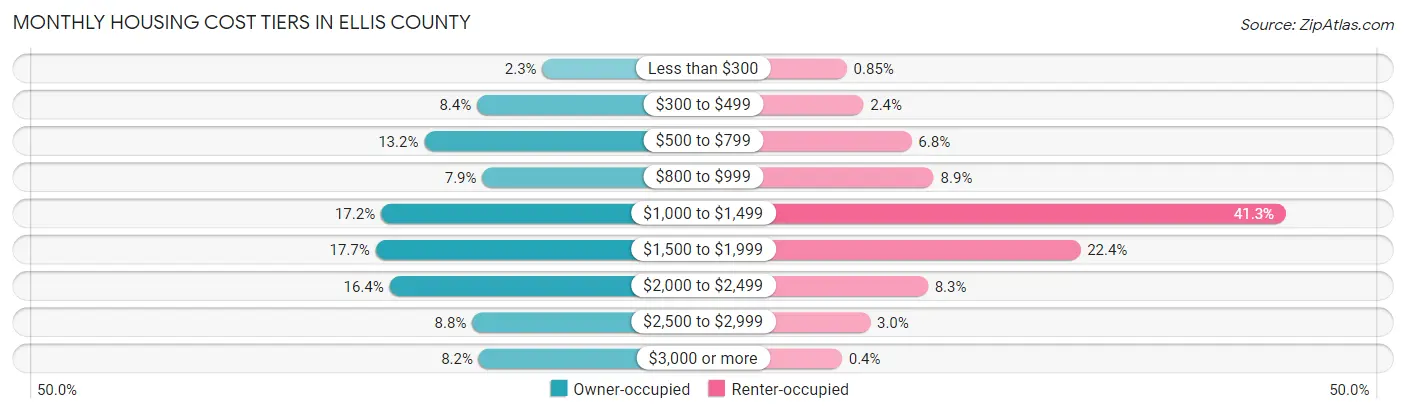
| Monthly Cost | Owner-occupied | Renter-occupied |
| Less than $300 | 1,159 (2.3%) | 134 (0.9%) |
| $300 to $499 | 4,160 (8.4%) | 377 (2.4%) |
| $500 to $799 | 6,587 (13.2%) | 1,079 (6.8%) |
| $800 to $999 | 3,917 (7.9%) | 1,404 (8.9%) |
| $1,000 to $1,499 | 8,569 (17.2%) | 6,540 (41.3%) |
| $1,500 to $1,999 | 8,816 (17.7%) | 3,540 (22.4%) |
| $2,000 to $2,499 | 8,175 (16.4%) | 1,317 (8.3%) |
| $2,500 to $2,999 | 4,380 (8.8%) | 475 (3.0%) |
| $3,000 or more | 4,083 (8.2%) | 63 (0.4%) |
| Total | 49,846 (100.0%) | 15,840 (100.0%) |
Physical Housing Characteristics in Ellis County
Housing Structures in Ellis County
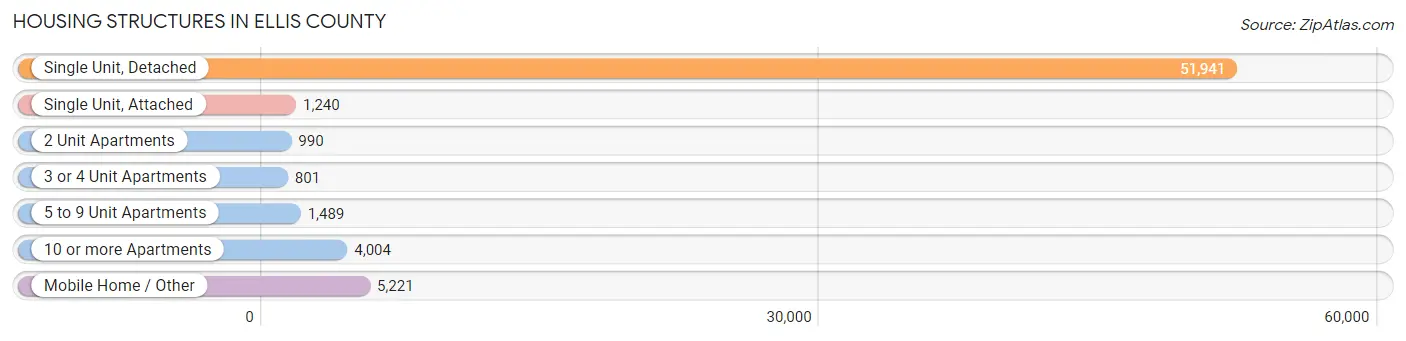
| Structure Type | # Housing Units | % Housing Units |
| Single Unit, Detached | 51,941 | 79.1% |
| Single Unit, Attached | 1,240 | 1.9% |
| 2 Unit Apartments | 990 | 1.5% |
| 3 or 4 Unit Apartments | 801 | 1.2% |
| 5 to 9 Unit Apartments | 1,489 | 2.3% |
| 10 or more Apartments | 4,004 | 6.1% |
| Mobile Home / Other | 5,221 | 8.0% |
| Total | 65,686 | 100.0% |
Housing Structures by Occupancy in Ellis County
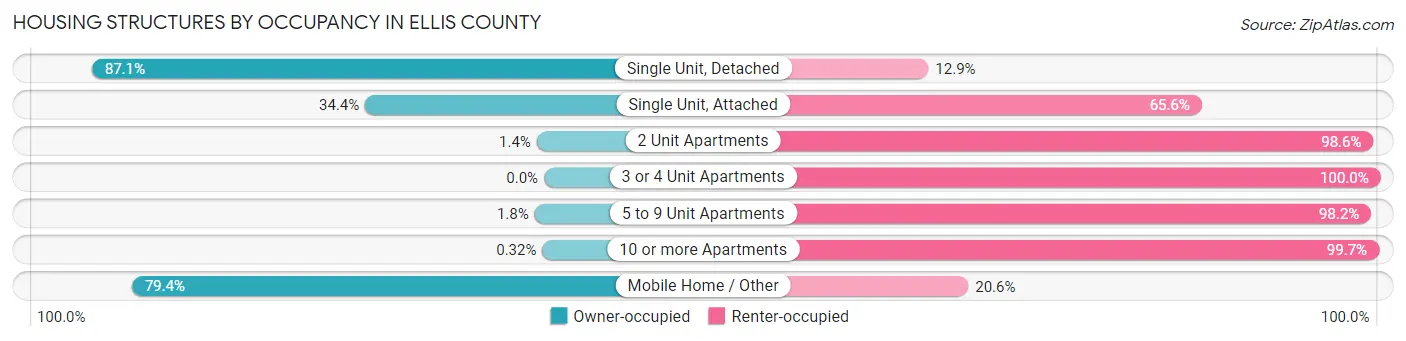
| Structure Type | Owner-occupied | Renter-occupied |
| Single Unit, Detached | 45,221 (87.1%) | 6,720 (12.9%) |
| Single Unit, Attached | 427 (34.4%) | 813 (65.6%) |
| 2 Unit Apartments | 14 (1.4%) | 976 (98.6%) |
| 3 or 4 Unit Apartments | 0 (0.0%) | 801 (100.0%) |
| 5 to 9 Unit Apartments | 27 (1.8%) | 1,462 (98.2%) |
| 10 or more Apartments | 13 (0.3%) | 3,991 (99.7%) |
| Mobile Home / Other | 4,144 (79.4%) | 1,077 (20.6%) |
| Total | 49,846 (75.9%) | 15,840 (24.1%) |
Housing Structures by Number of Rooms in Ellis County
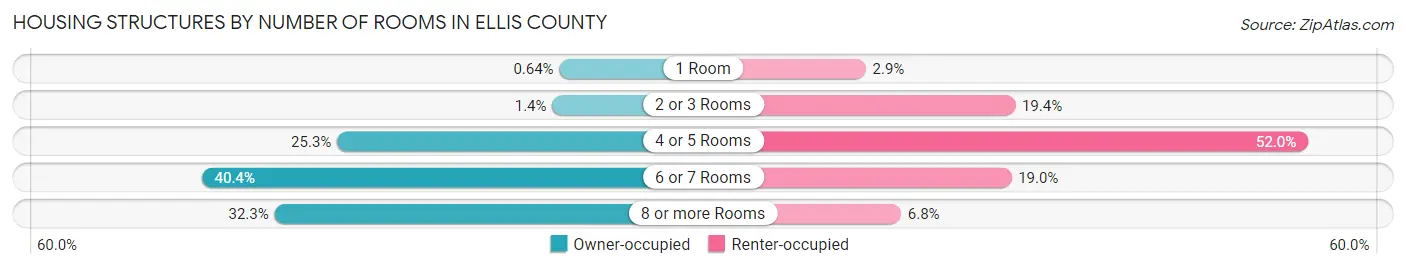
| Number of Rooms | Owner-occupied | Renter-occupied |
| 1 Room | 320 (0.6%) | 451 (2.9%) |
| 2 or 3 Rooms | 714 (1.4%) | 3,078 (19.4%) |
| 4 or 5 Rooms | 12,618 (25.3%) | 8,230 (52.0%) |
| 6 or 7 Rooms | 20,112 (40.4%) | 3,011 (19.0%) |
| 8 or more Rooms | 16,082 (32.3%) | 1,070 (6.8%) |
| Total | 49,846 (100.0%) | 15,840 (100.0%) |
Housing Structure by Heating Type in Ellis County
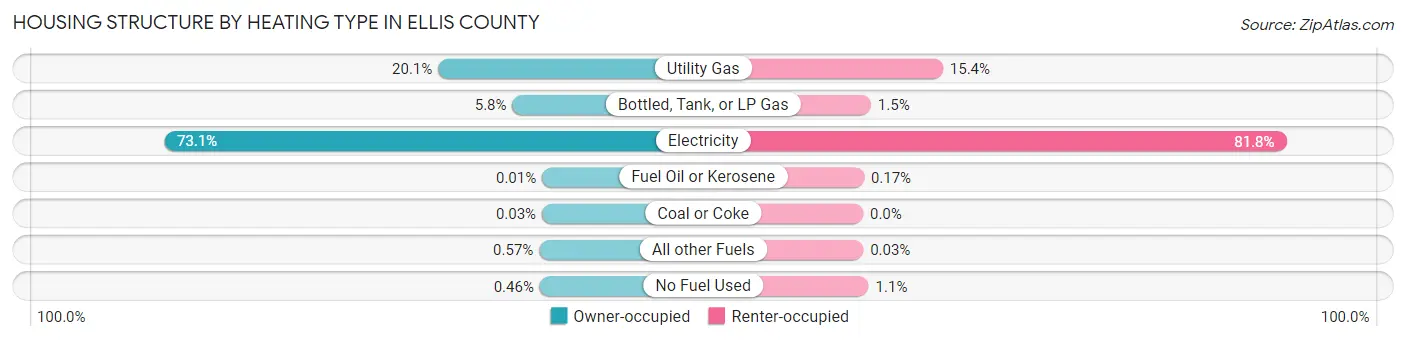
| Heating Type | Owner-occupied | Renter-occupied |
| Utility Gas | 10,020 (20.1%) | 2,442 (15.4%) |
| Bottled, Tank, or LP Gas | 2,866 (5.8%) | 241 (1.5%) |
| Electricity | 36,422 (73.1%) | 12,955 (81.8%) |
| Fuel Oil or Kerosene | 7 (0.0%) | 27 (0.2%) |
| Coal or Coke | 16 (0.0%) | 0 (0.0%) |
| All other Fuels | 286 (0.6%) | 4 (0.0%) |
| No Fuel Used | 229 (0.5%) | 171 (1.1%) |
| Total | 49,846 (100.0%) | 15,840 (100.0%) |
Household Vehicle Usage in Ellis County
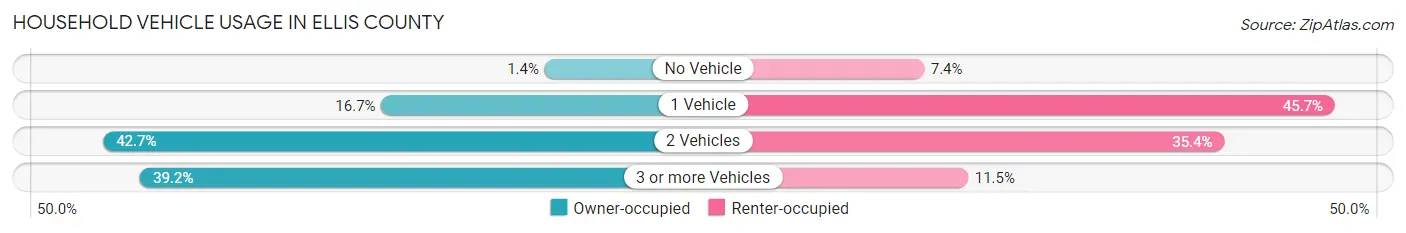
| Vehicles per Household | Owner-occupied | Renter-occupied |
| No Vehicle | 719 (1.4%) | 1,166 (7.4%) |
| 1 Vehicle | 8,317 (16.7%) | 7,246 (45.7%) |
| 2 Vehicles | 21,262 (42.7%) | 5,611 (35.4%) |
| 3 or more Vehicles | 19,548 (39.2%) | 1,817 (11.5%) |
| Total | 49,846 (100.0%) | 15,840 (100.0%) |
Real Estate & Mortgages in Ellis County
Real Estate and Mortgage Overview in Ellis County
| Characteristic | Without Mortgage | With Mortgage |
| Housing Units | 17,949 | 31,897 |
| Median Property Value | $229,300 | $296,400 |
| Median Household Income | $85,421 | $10,358 |
| Monthly Housing Costs | $672 | $4,038 |
| Real Estate Taxes | $2,862 | $922 |
Property Value by Mortgage Status in Ellis County
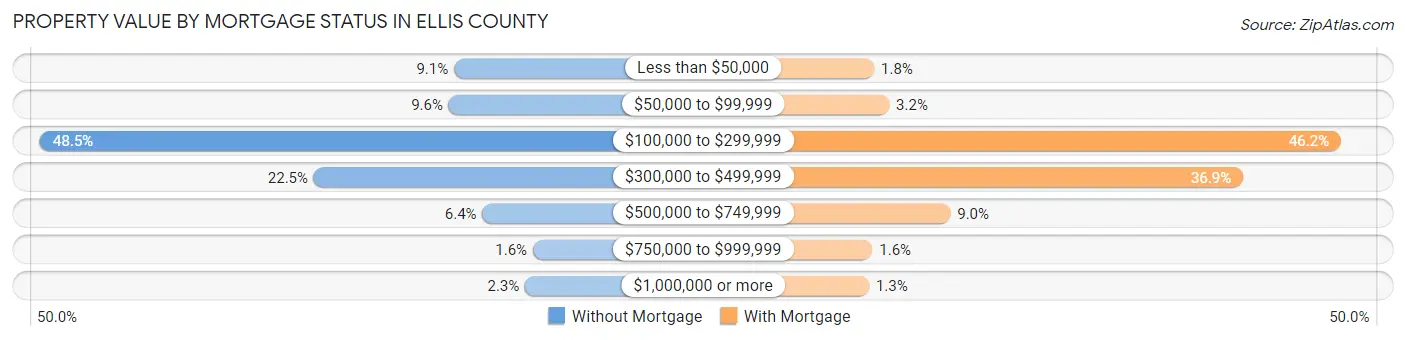
| Property Value | Without Mortgage | With Mortgage |
| Less than $50,000 | 1,633 (9.1%) | 563 (1.8%) |
| $50,000 to $99,999 | 1,723 (9.6%) | 1,020 (3.2%) |
| $100,000 to $299,999 | 8,712 (48.5%) | 14,747 (46.2%) |
| $300,000 to $499,999 | 4,029 (22.5%) | 11,773 (36.9%) |
| $500,000 to $749,999 | 1,148 (6.4%) | 2,878 (9.0%) |
| $750,000 to $999,999 | 285 (1.6%) | 509 (1.6%) |
| $1,000,000 or more | 419 (2.3%) | 407 (1.3%) |
| Total | 17,949 (100.0%) | 31,897 (100.0%) |
Household Income by Mortgage Status in Ellis County
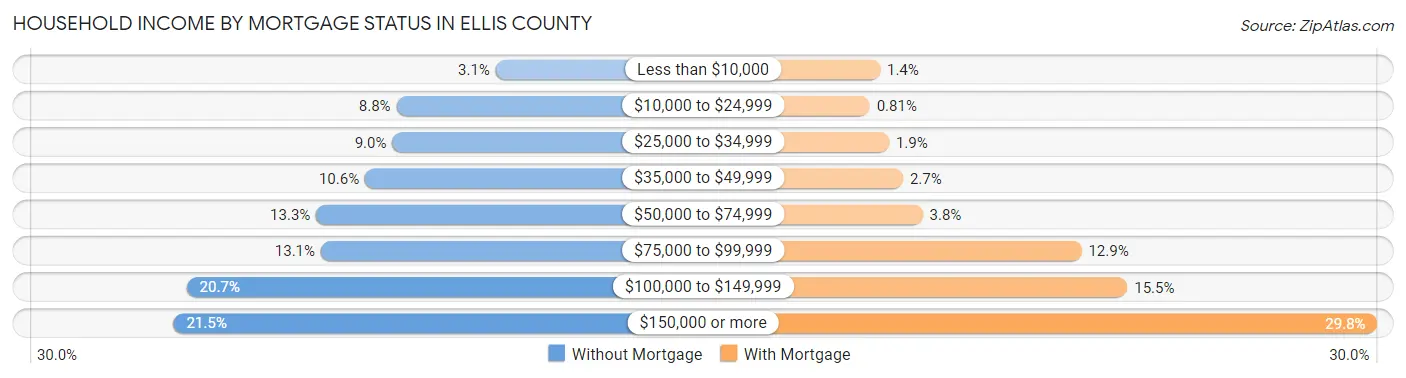
| Household Income | Without Mortgage | With Mortgage |
| Less than $10,000 | 552 (3.1%) | 447 (1.4%) |
| $10,000 to $24,999 | 1,570 (8.7%) | 258 (0.8%) |
| $25,000 to $34,999 | 1,613 (9.0%) | 608 (1.9%) |
| $35,000 to $49,999 | 1,893 (10.5%) | 866 (2.7%) |
| $50,000 to $74,999 | 2,395 (13.3%) | 1,223 (3.8%) |
| $75,000 to $99,999 | 2,346 (13.1%) | 4,118 (12.9%) |
| $100,000 to $149,999 | 3,723 (20.7%) | 4,954 (15.5%) |
| $150,000 or more | 3,857 (21.5%) | 9,512 (29.8%) |
| Total | 17,949 (100.0%) | 31,897 (100.0%) |
Property Value to Household Income Ratio in Ellis County
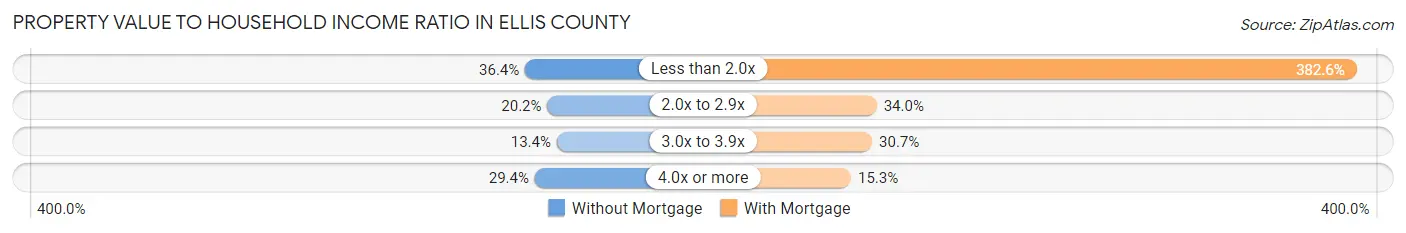
| Value-to-Income Ratio | Without Mortgage | With Mortgage |
| Less than 2.0x | 6,536 (36.4%) | 122,044 (382.6%) |
| 2.0x to 2.9x | 3,632 (20.2%) | 10,848 (34.0%) |
| 3.0x to 3.9x | 2,400 (13.4%) | 9,777 (30.6%) |
| 4.0x or more | 5,271 (29.4%) | 4,894 (15.3%) |
| Total | 17,949 (100.0%) | 31,897 (100.0%) |
Real Estate Taxes by Mortgage Status in Ellis County
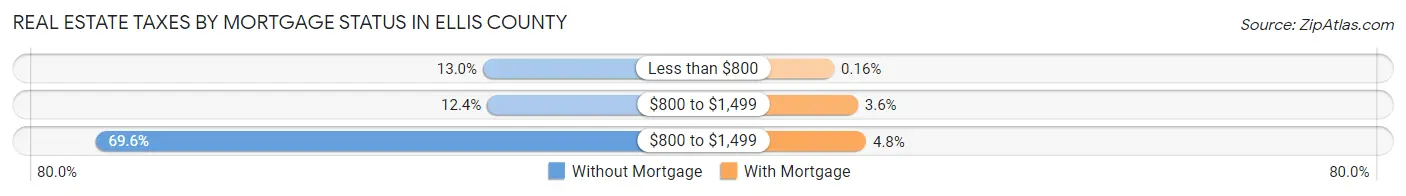
| Property Taxes | Without Mortgage | With Mortgage |
| Less than $800 | 2,341 (13.0%) | 52 (0.2%) |
| $800 to $1,499 | 2,230 (12.4%) | 1,156 (3.6%) |
| $800 to $1,499 | 12,495 (69.6%) | 1,537 (4.8%) |
| Total | 17,949 (100.0%) | 31,897 (100.0%) |
Health & Disability in Ellis County
Health Insurance Coverage by Age in Ellis County
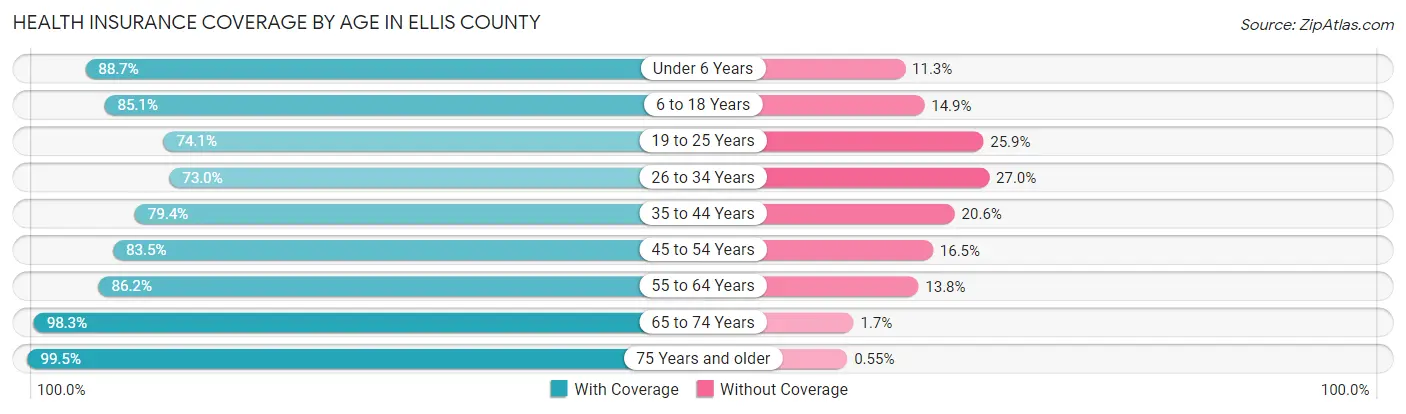
| Age Bracket | With Coverage | Without Coverage |
| Under 6 Years | 13,525 (88.7%) | 1,730 (11.3%) |
| 6 to 18 Years | 33,317 (85.1%) | 5,842 (14.9%) |
| 19 to 25 Years | 12,640 (74.1%) | 4,423 (25.9%) |
| 26 to 34 Years | 16,579 (73.0%) | 6,132 (27.0%) |
| 35 to 44 Years | 21,215 (79.4%) | 5,498 (20.6%) |
| 45 to 54 Years | 21,077 (83.5%) | 4,172 (16.5%) |
| 55 to 64 Years | 20,193 (86.2%) | 3,235 (13.8%) |
| 65 to 74 Years | 15,498 (98.3%) | 271 (1.7%) |
| 75 Years and older | 8,806 (99.5%) | 49 (0.5%) |
| Total | 162,850 (83.9%) | 31,352 (16.1%) |
Health Insurance Coverage by Citizenship Status in Ellis County
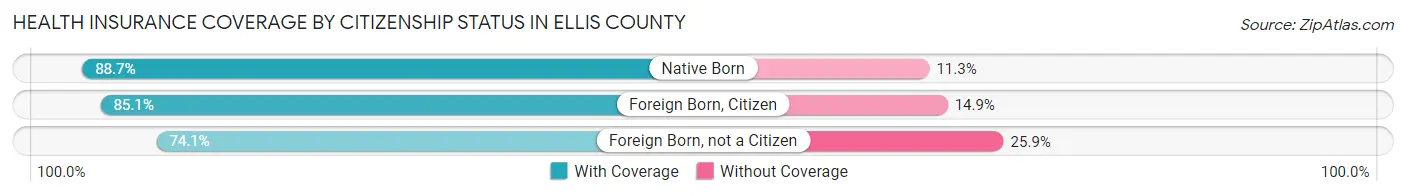
| Citizenship Status | With Coverage | Without Coverage |
| Native Born | 13,525 (88.7%) | 1,730 (11.3%) |
| Foreign Born, Citizen | 33,317 (85.1%) | 5,842 (14.9%) |
| Foreign Born, not a Citizen | 12,640 (74.1%) | 4,423 (25.9%) |
Health Insurance Coverage by Household Income in Ellis County
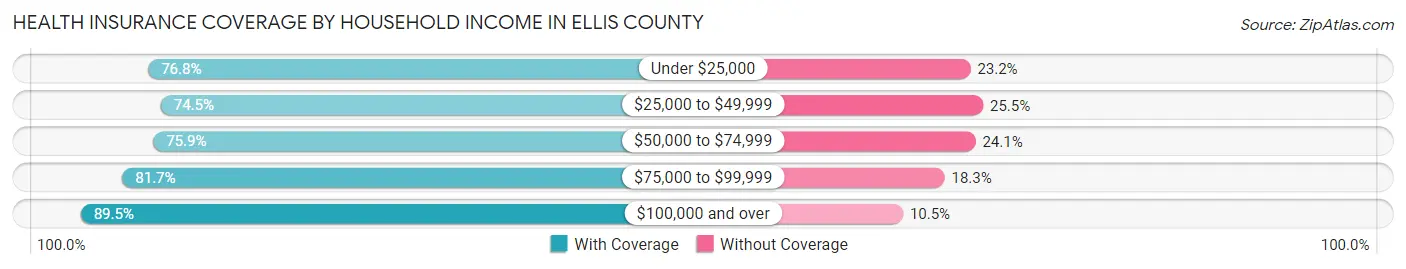
| Household Income | With Coverage | Without Coverage |
| Under $25,000 | 8,876 (76.8%) | 2,677 (23.2%) |
| $25,000 to $49,999 | 17,838 (74.5%) | 6,114 (25.5%) |
| $50,000 to $74,999 | 20,359 (75.9%) | 6,467 (24.1%) |
| $75,000 to $99,999 | 22,657 (81.7%) | 5,081 (18.3%) |
| $100,000 and over | 92,617 (89.5%) | 10,886 (10.5%) |
Public vs Private Health Insurance Coverage by Age in Ellis County
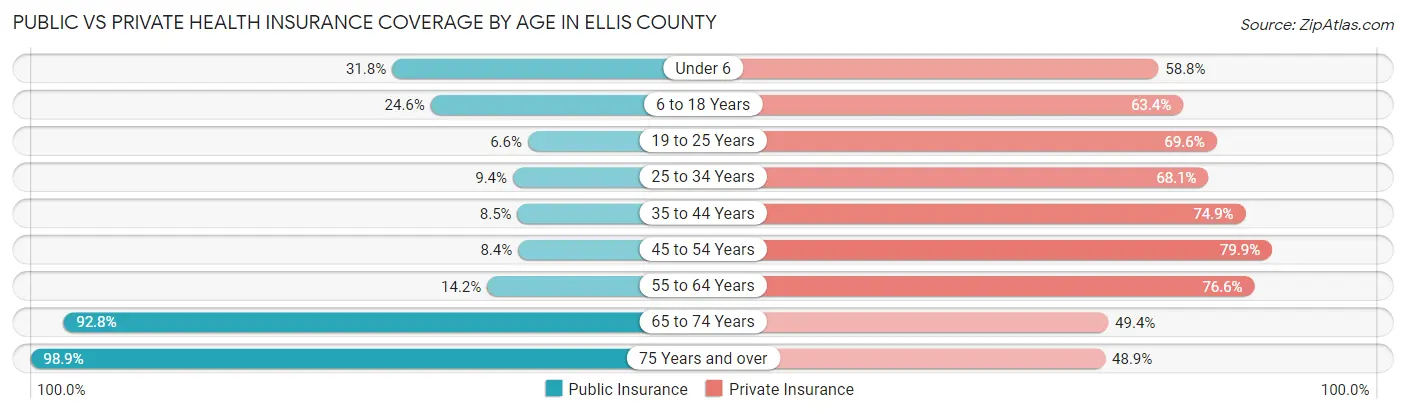
| Age Bracket | Public Insurance | Private Insurance |
| Under 6 | 4,853 (31.8%) | 8,964 (58.8%) |
| 6 to 18 Years | 9,650 (24.6%) | 24,812 (63.4%) |
| 19 to 25 Years | 1,127 (6.6%) | 11,867 (69.6%) |
| 25 to 34 Years | 2,127 (9.4%) | 15,455 (68.0%) |
| 35 to 44 Years | 2,276 (8.5%) | 20,013 (74.9%) |
| 45 to 54 Years | 2,120 (8.4%) | 20,161 (79.8%) |
| 55 to 64 Years | 3,315 (14.1%) | 17,943 (76.6%) |
| 65 to 74 Years | 14,635 (92.8%) | 7,796 (49.4%) |
| 75 Years and over | 8,759 (98.9%) | 4,327 (48.9%) |
| Total | 48,862 (25.2%) | 131,338 (67.6%) |
Disability Status by Sex by Age in Ellis County
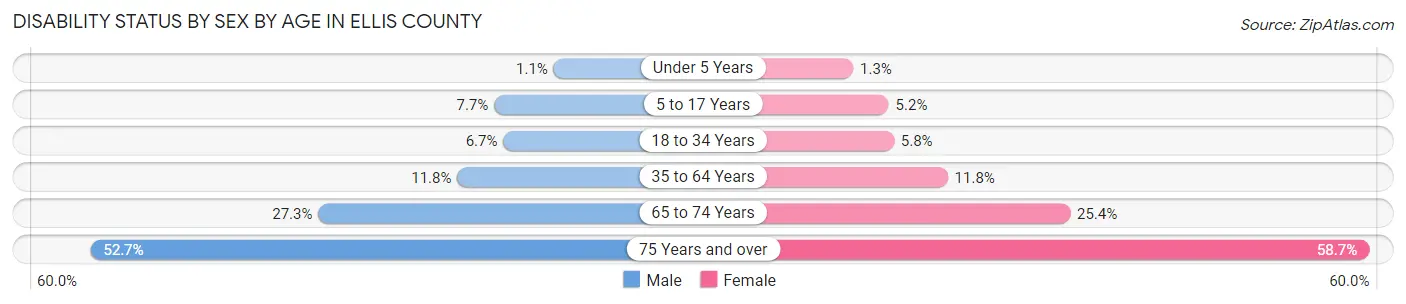
| Age Bracket | Male | Female |
| Under 5 Years | 70 (1.1%) | 77 (1.3%) |
| 5 to 17 Years | 1,540 (7.7%) | 984 (5.2%) |
| 18 to 34 Years | 1,438 (6.7%) | 1,236 (5.8%) |
| 35 to 64 Years | 4,418 (11.8%) | 4,477 (11.8%) |
| 65 to 74 Years | 2,034 (27.3%) | 2,114 (25.4%) |
| 75 Years and over | 1,943 (52.7%) | 3,033 (58.7%) |
Disability Class by Sex by Age in Ellis County
Disability Class: Hearing Difficulty
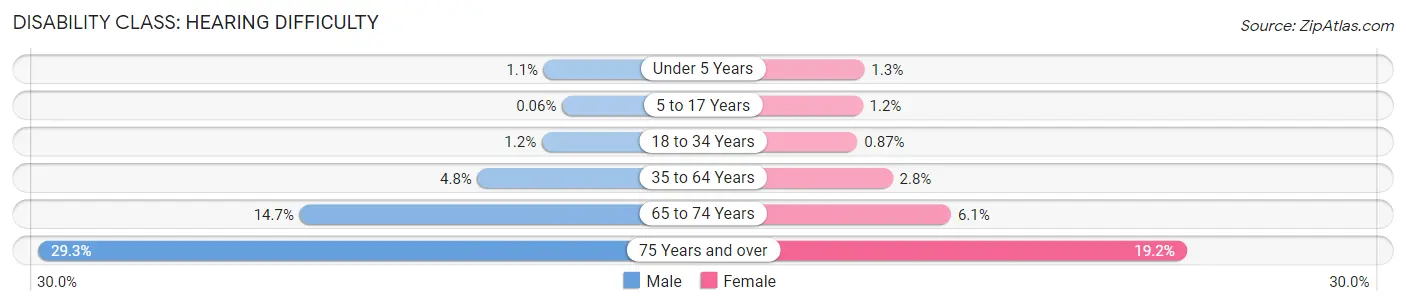
| Age Bracket | Male | Female |
| Under 5 Years | 70 (1.1%) | 77 (1.3%) |
| 5 to 17 Years | 11 (0.1%) | 219 (1.2%) |
| 18 to 34 Years | 255 (1.2%) | 186 (0.9%) |
| 35 to 64 Years | 1,784 (4.8%) | 1,075 (2.8%) |
| 65 to 74 Years | 1,094 (14.7%) | 506 (6.1%) |
| 75 Years and over | 1,079 (29.2%) | 992 (19.2%) |
Disability Class: Vision Difficulty
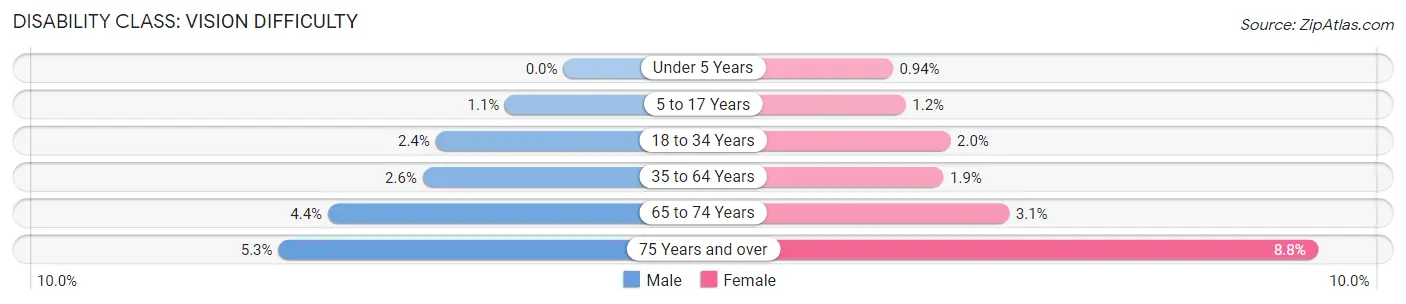
| Age Bracket | Male | Female |
| Under 5 Years | 0 (0.0%) | 57 (0.9%) |
| 5 to 17 Years | 215 (1.1%) | 223 (1.2%) |
| 18 to 34 Years | 510 (2.4%) | 428 (2.0%) |
| 35 to 64 Years | 978 (2.6%) | 712 (1.9%) |
| 65 to 74 Years | 326 (4.4%) | 258 (3.1%) |
| 75 Years and over | 195 (5.3%) | 456 (8.8%) |
Disability Class: Cognitive Difficulty
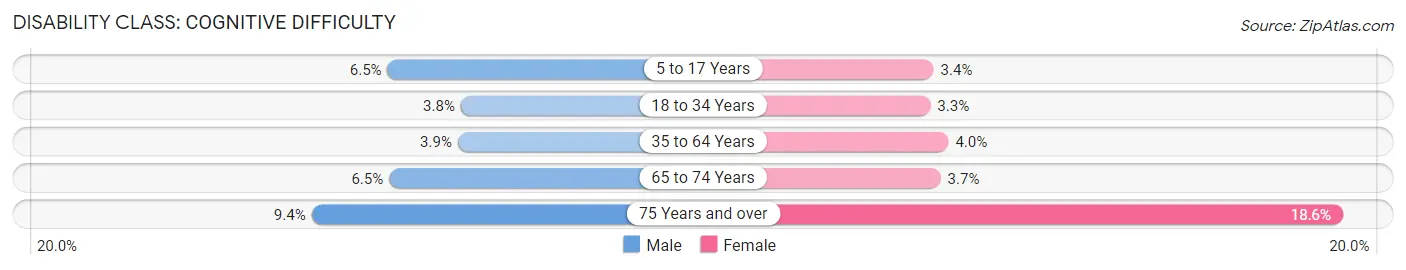
| Age Bracket | Male | Female |
| 5 to 17 Years | 1,303 (6.5%) | 643 (3.4%) |
| 18 to 34 Years | 819 (3.8%) | 700 (3.3%) |
| 35 to 64 Years | 1,465 (3.9%) | 1,505 (4.0%) |
| 65 to 74 Years | 482 (6.5%) | 305 (3.7%) |
| 75 Years and over | 345 (9.3%) | 961 (18.6%) |
Disability Class: Ambulatory Difficulty
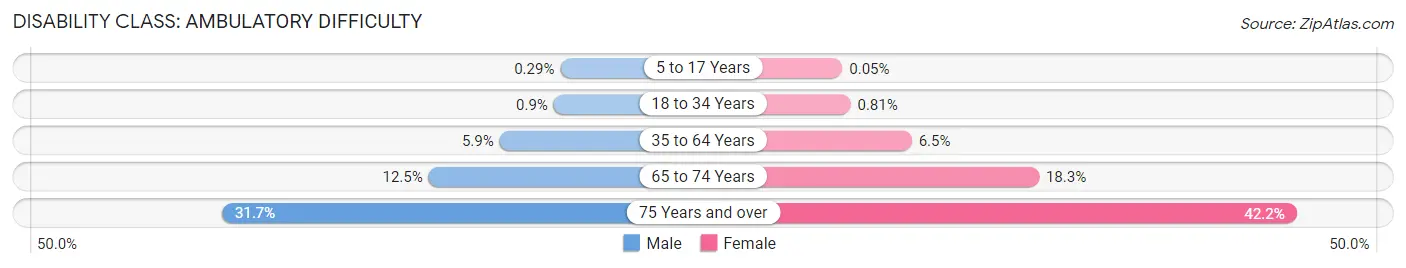
| Age Bracket | Male | Female |
| 5 to 17 Years | 58 (0.3%) | 10 (0.1%) |
| 18 to 34 Years | 193 (0.9%) | 172 (0.8%) |
| 35 to 64 Years | 2,216 (5.9%) | 2,463 (6.5%) |
| 65 to 74 Years | 932 (12.5%) | 1,522 (18.3%) |
| 75 Years and over | 1,169 (31.7%) | 2,180 (42.2%) |
Disability Class: Self-Care Difficulty
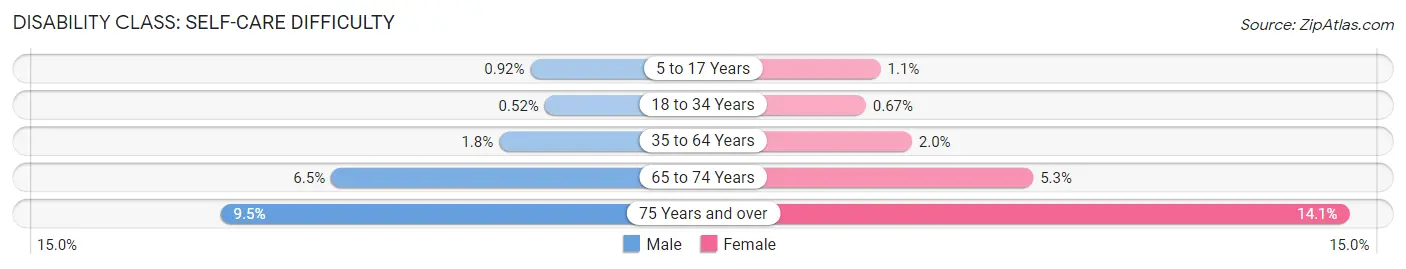
| Age Bracket | Male | Female |
| 5 to 17 Years | 184 (0.9%) | 203 (1.1%) |
| 18 to 34 Years | 111 (0.5%) | 143 (0.7%) |
| 35 to 64 Years | 669 (1.8%) | 740 (1.9%) |
| 65 to 74 Years | 482 (6.5%) | 443 (5.3%) |
| 75 Years and over | 352 (9.5%) | 730 (14.1%) |
Technology Access in Ellis County
Computing Device Access in Ellis County
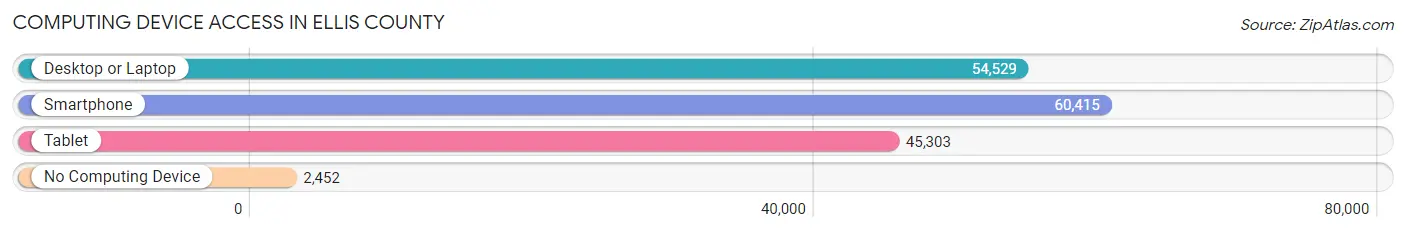
| Device Type | # Households | % Households |
| Desktop or Laptop | 54,529 | 83.0% |
| Smartphone | 60,415 | 92.0% |
| Tablet | 45,303 | 69.0% |
| No Computing Device | 2,452 | 3.7% |
| Total | 65,686 | 100.0% |
Internet Access in Ellis County
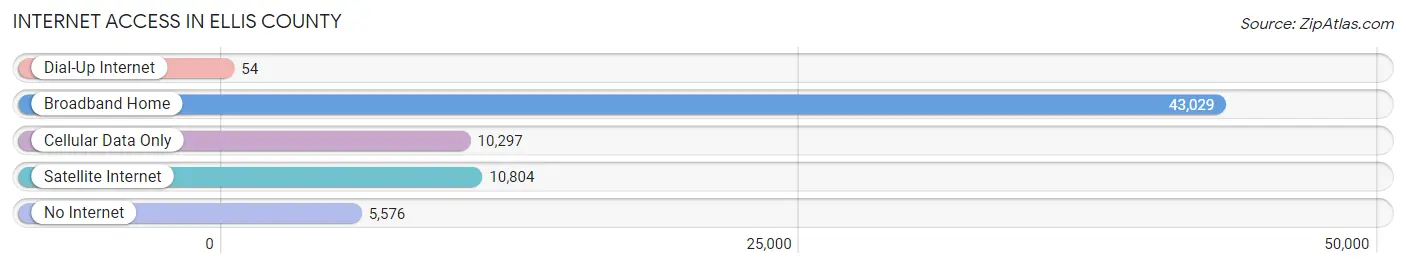
| Internet Type | # Households | % Households |
| Dial-Up Internet | 54 | 0.1% |
| Broadband Home | 43,029 | 65.5% |
| Cellular Data Only | 10,297 | 15.7% |
| Satellite Internet | 10,804 | 16.5% |
| No Internet | 5,576 | 8.5% |
| Total | 65,686 | 100.0% |
Ellis County Summary
Ellis County, Texas is located in the north-central part of the state, just south of Dallas and Fort Worth. It is bordered by Johnson County to the north, Dallas County to the east, Kaufman County to the south, and Hill County to the west. The county seat is Waxahachie, and the county is named for Richard Ellis, a signer of the Texas Declaration of Independence.
Geography
Ellis County covers an area of 919 square miles, making it the 33rd largest county in Texas. The terrain is mostly flat, with some rolling hills in the western part of the county. The Trinity River forms the eastern border of the county, and the Brazos River forms the western border. The county is part of the Blackland Prairie region of Texas, and is home to several state parks, including Lake Waxahachie, Lake Bardwell, and Lake Tawakoni.
Demographics
As of the 2010 census, Ellis County had a population of 149,610. The racial makeup of the county was 79.2% White, 13.7% Hispanic or Latino, 9.2% African American, 1.2% Asian, and 0.3% Native American. The median household income was $60,845, and the median family income was $71,845.
Economy
Ellis County is home to a diverse economy, with a mix of manufacturing, retail, and service industries. The county is home to several large employers, including Navistar, Texas Instruments, and the University of Texas at Dallas. The county is also home to several smaller businesses, including a number of wineries and craft breweries.
Agriculture is also an important part of the county's economy. The county is home to several large farms, and is a major producer of cotton, corn, and hay. The county is also home to several horse farms, and is a popular destination for horse shows and rodeos.
History
The area that is now Ellis County was first settled by Native Americans, including the Caddo, Comanche, and Wichita tribes. The first European settlers arrived in the area in the 1830s, and the county was officially established in 1849.
The county was named for Richard Ellis, a signer of the Texas Declaration of Independence. The county seat was originally located in the town of Warren, but was moved to Waxahachie in 1871.
The county experienced rapid growth in the late 19th and early 20th centuries, as the railroads and cotton industry brought new settlers to the area. The county was also home to several large oil fields, and the discovery of oil in the 1920s led to a boom in the county's economy.
Today, Ellis County is a thriving community, with a diverse economy and a strong sense of community. The county is home to several large employers, and is a popular destination for tourists and outdoor enthusiasts.
Common Questions
What is Per Capita Income in Ellis County?
Per Capita income in Ellis County is $38,628.
What is the Median Family Income in Ellis County?
Median Family Income in Ellis County is $103,817.
What is the Median Household income in Ellis County?
Median Household Income in Ellis County is $93,248.
What is Income or Wage Gap in Ellis County?
Income or Wage Gap in Ellis County is 31.2%.
Women in Ellis County earn 68.8 cents for every dollar earned by a man.
What is Family Income Deficit in Ellis County?
Family Income Deficit in Ellis County is $10,611.
Families that are below poverty line in Ellis County earn $10,611 less on average than the poverty threshold level.
What is Inequality or Gini Index in Ellis County?
Inequality or Gini Index in Ellis County is 0.40.
What is the Total Population of Ellis County?
Total Population of Ellis County is 195,509.
What is the Total Male Population of Ellis County?
Total Male Population of Ellis County is 97,264.
What is the Total Female Population of Ellis County?
Total Female Population of Ellis County is 98,245.
What is the Ratio of Males per 100 Females in Ellis County?
There are 99.00 Males per 100 Females in Ellis County.
What is the Ratio of Females per 100 Males in Ellis County?
There are 101.01 Females per 100 Males in Ellis County.
What is the Median Population Age in Ellis County?
Median Population Age in Ellis County is 36.2 Years.
What is the Average Family Size in Ellis County
Average Family Size in Ellis County is 3.3 People.
What is the Average Household Size in Ellis County
Average Household Size in Ellis County is 3.0 People.
How Large is the Labor Force in Ellis County?
There are 103,628 People in the Labor Forcein in Ellis County.
What is the Percentage of People in the Labor Force in Ellis County?
69.0% of People are in the Labor Force in Ellis County.
What is the Unemployment Rate in Ellis County?
Unemployment Rate in Ellis County is 3.9%.